
MARKET UPDATE
You can scroll to read the usual update as well. As the written version is the exact same as the video.
Timestamps for video:
Overview: 0:00min
Funds: 2:30min
Corn: 5:15min
Corn Charts: 9:00min
Beans: 12:00min
Bean Charts: 14:00min
Wheat Charts: 15:55min
Cattle Charts: 17:50min
Want to talk?
Office: (806)484-1214
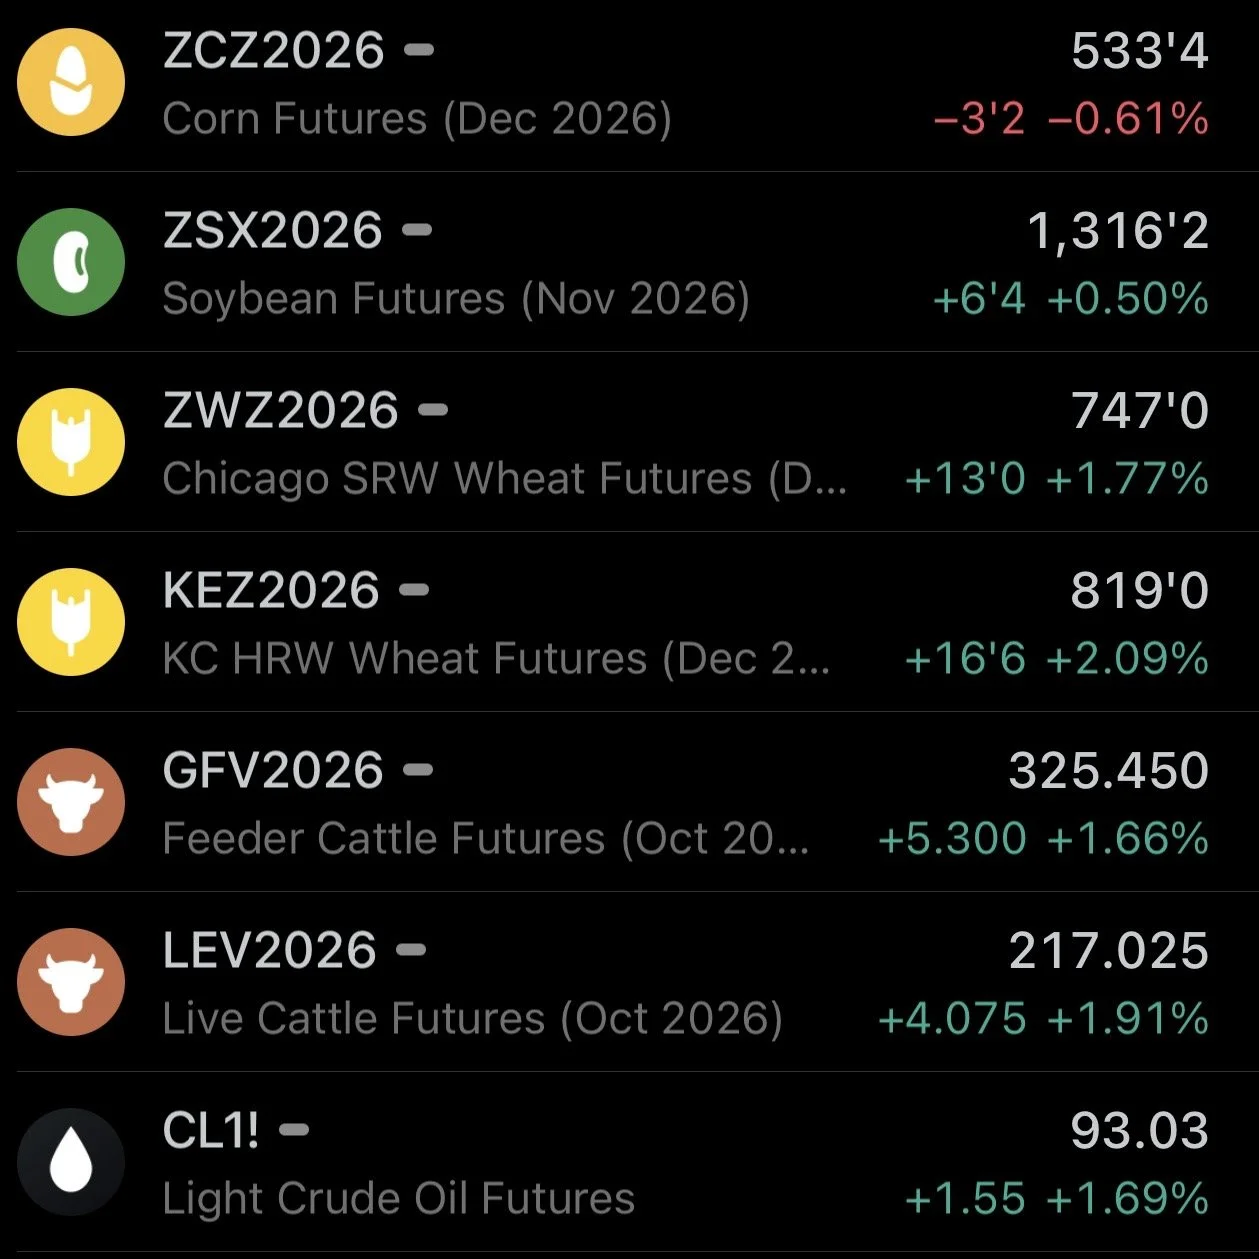
Futures Prices Close
Overview
Grains mixed with wheat leading the way higher and corn leading the way lower. Meanwhile the cattle market caught a nice bid today as well.
It's looking like those peace talks out in the Black Sea that pressured wheat last week have essentially paused as we haven’t seen any real progress. Just back and forth headllines as usual.
All eyes are on Friday's USDA report.
What are they going to do with corn yield? Everyone expects a lower yield, but by how much?
If they lower yield, how are they going to change demand?
Will they continue to raise our old crop corn exports? As many including myself think they should.
It's going to be a pretty important report. We'll be diving into more USDA stuff later this week ahead of the report.
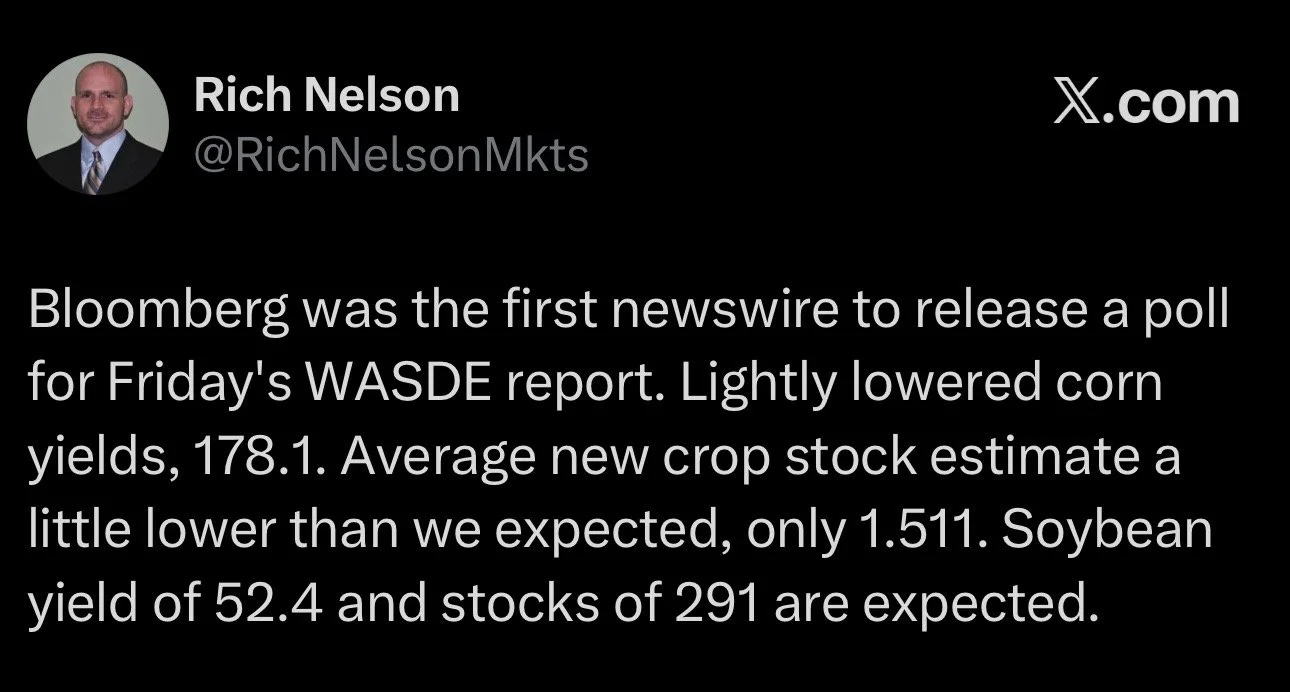
Bloomberg was the first to release their estimates for the report. They had a 178.1 bpa corn yield and 52.4 bpa soybean yield.
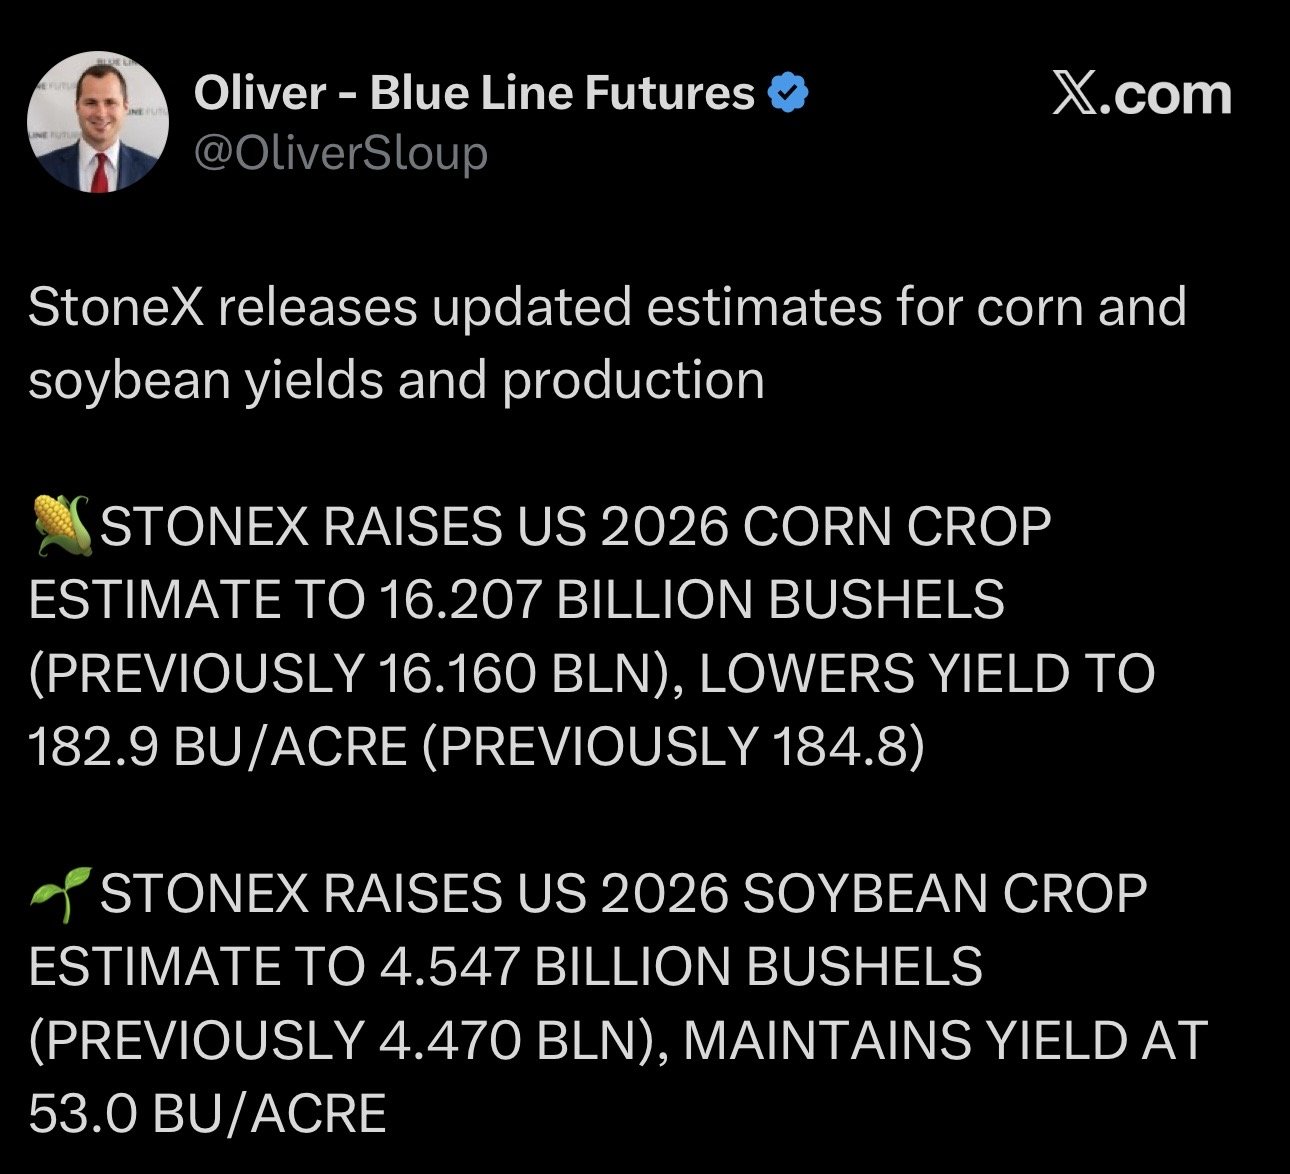
StoneX also released their estimates.
They had 182.9 for corn, down from their previous 184.8 bpa guess.
For soybeans they left theirs unchanged at 53 bpa.
The biggest risk for corn in this report has to be if they left yield unchanged. If that happened, this market would have a very bloody reaction.
This market has obviously priced in lower yields for corn and everyone is expecting lower yields.
Crop Ratings
Nothing too major out of the crop ratings today.
The trade was expecting both corn and soybean ratings to be down -1% today.
Corn came down -1% to 56% G/E as expected.
Soybeans came in unchanged at 58% G/E.
Here is an update on how these ratings stack up.
Corn:
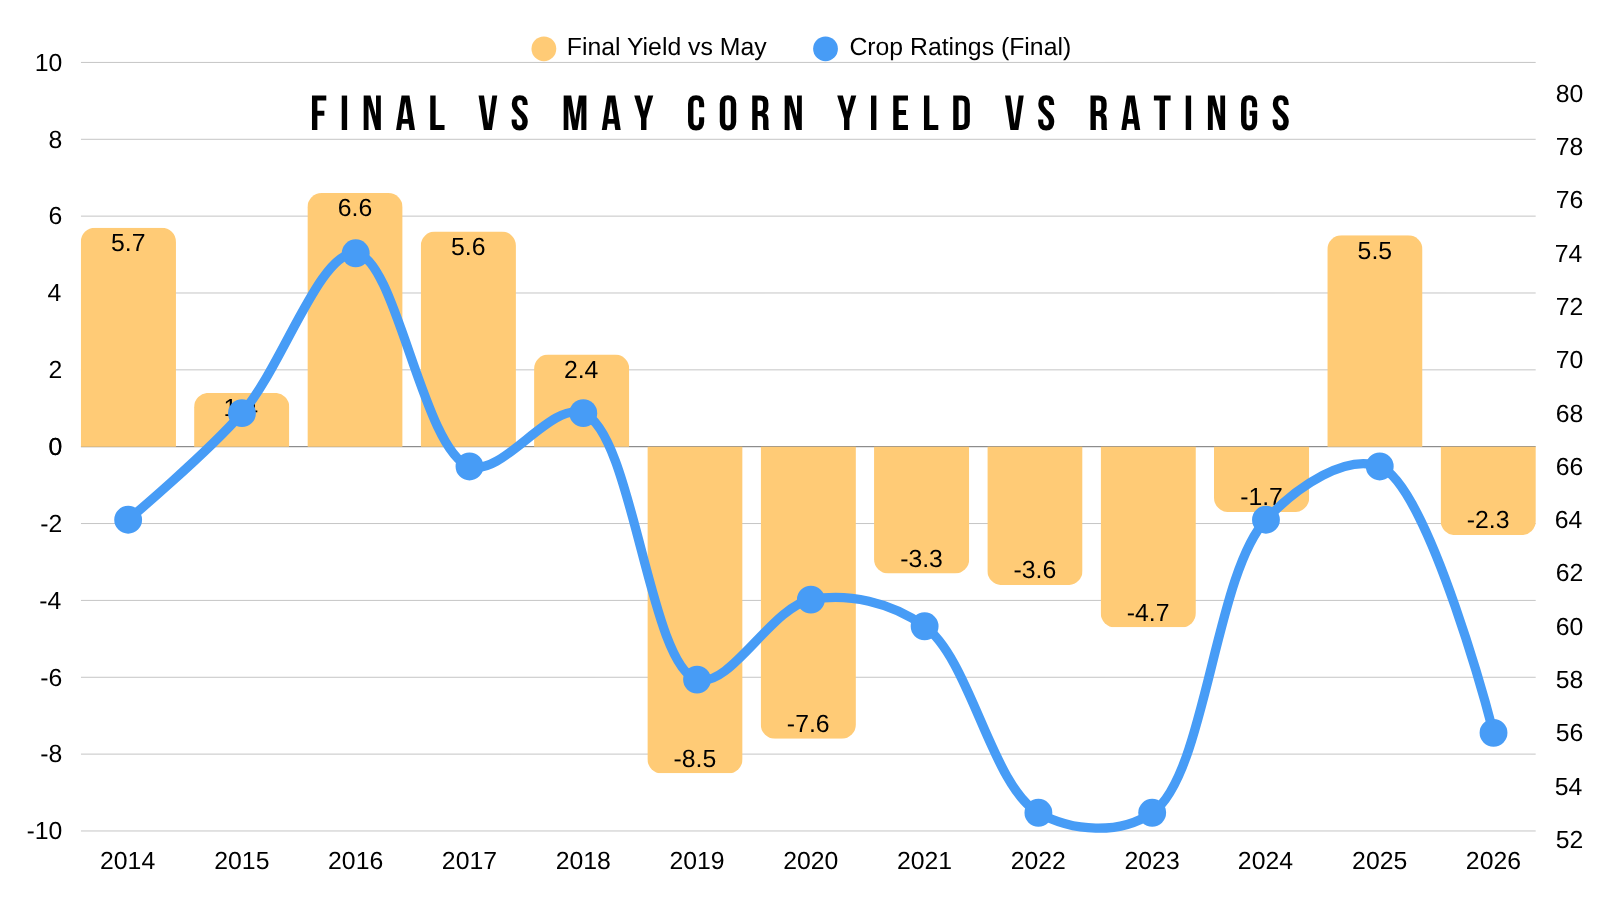
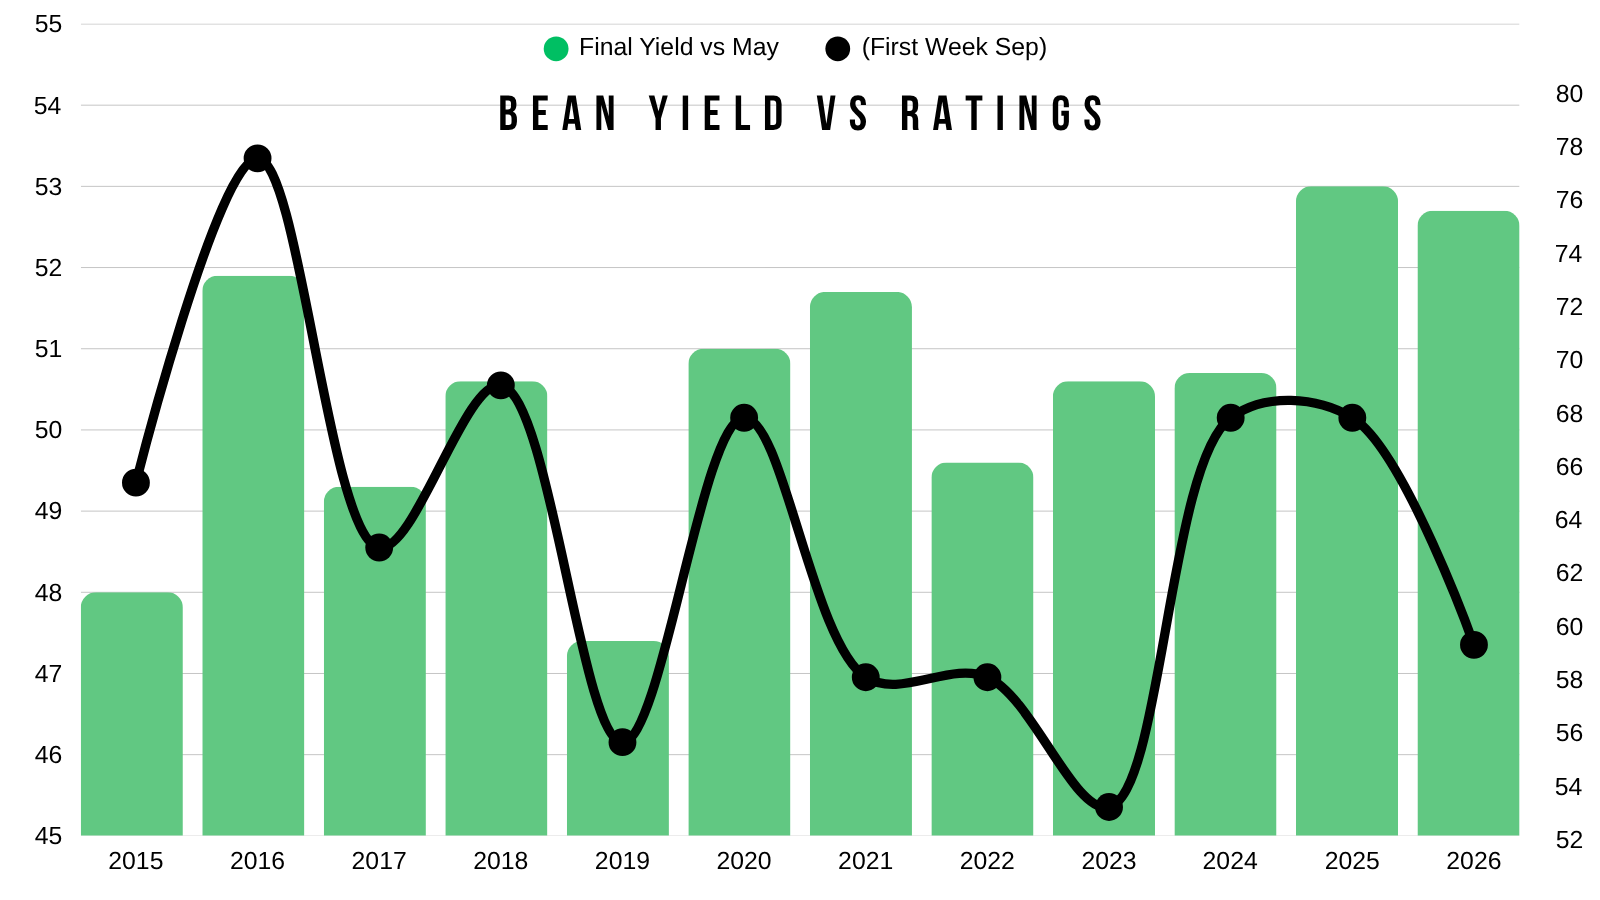
Here are final ratings vs yield's deviation from trend.
If this was the final rating, in recent memory the only years that had a worse rating were 2022 and 2023.
The USDA currently has a yield that is -2.3 bpa below trend.
Every time crop ratings have been this poor, we have seen a larger deviation from trend than they currently have.
Favoring yield to continue lower from here like we've talked about for a long time.
Soybeans:
The 58% G/E would be drastically worse than the last two years, but still better than 2019, 2021, 2022, and 2023.
As we've mentioned before, there is not as major of a correlation between ratings and yield like there is in corn.
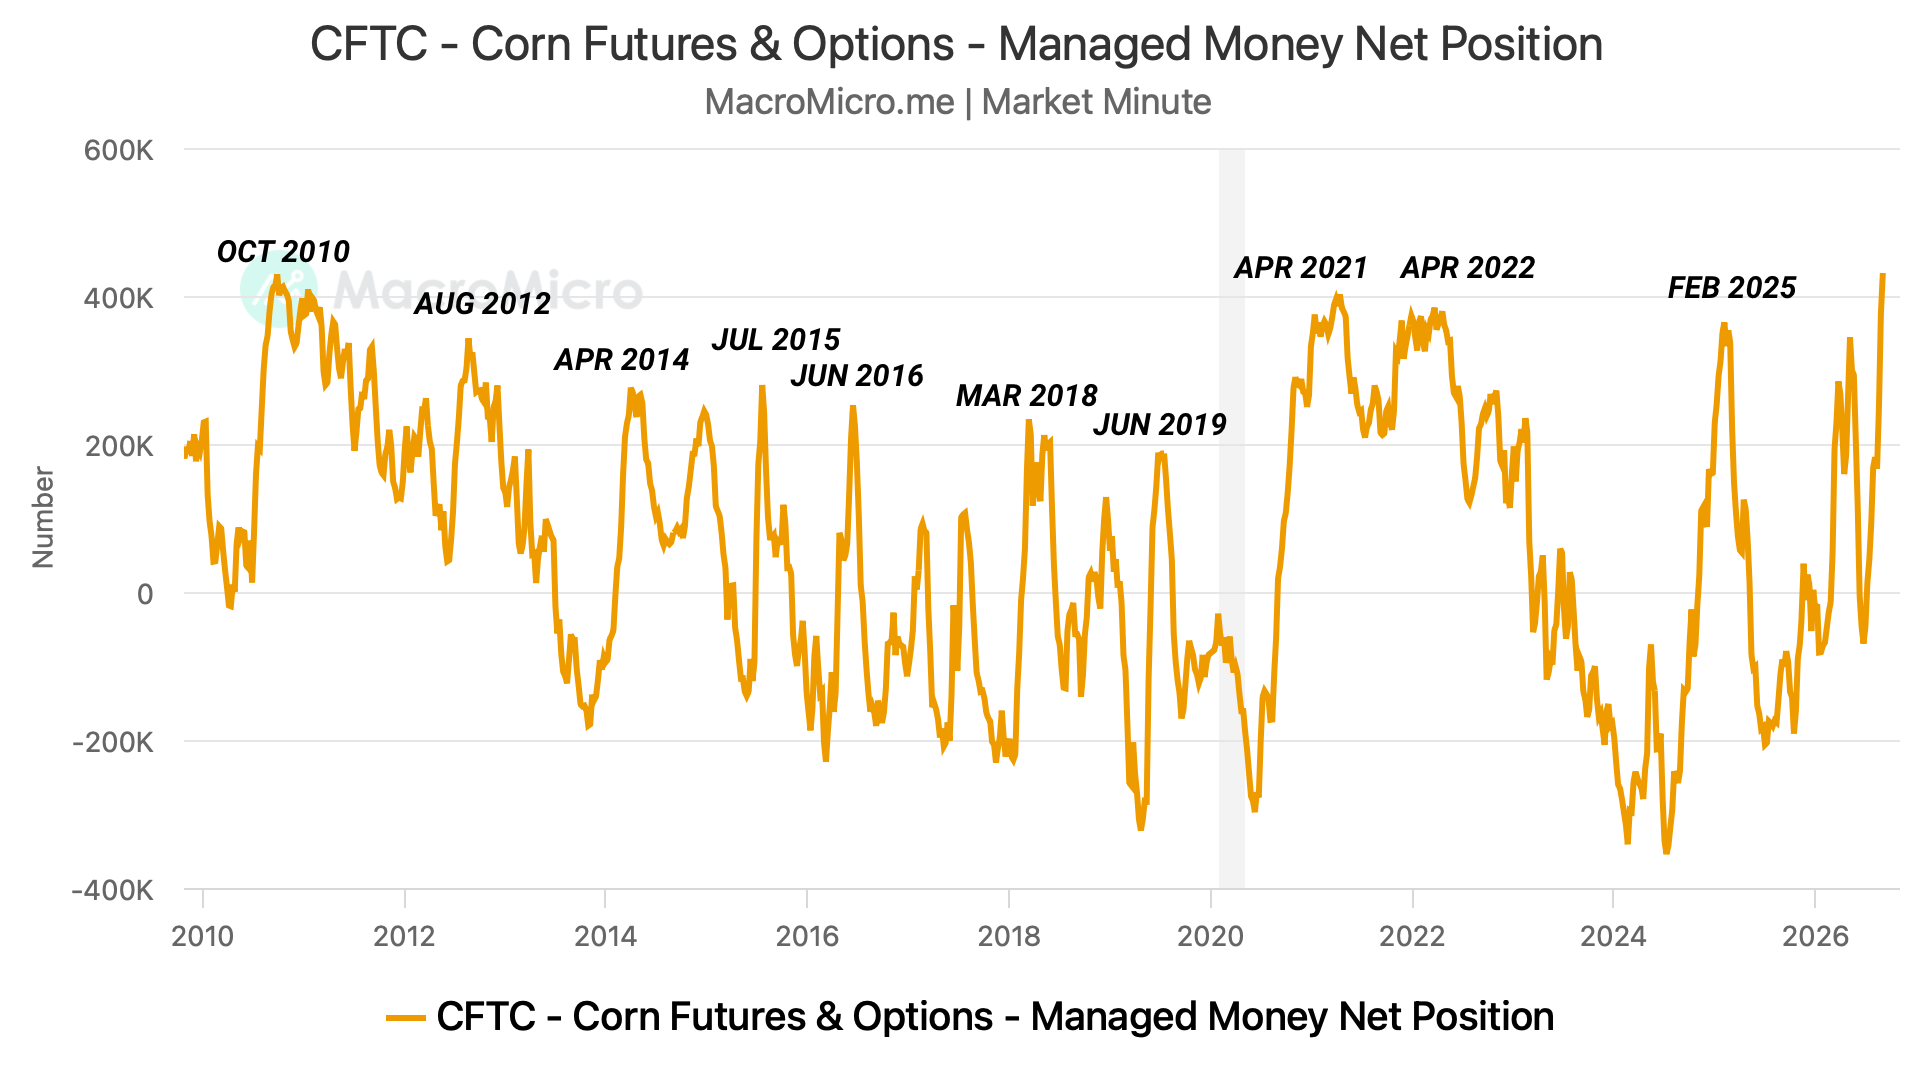
Funds Record Long Corn
The funds are now record long corn.
Long over 400k contracts for just the 3rd time ever.
The last two times they were this long corn?
2010 and 2021.
But what actually happened the last two times the funds were this long?
Let's take a look..
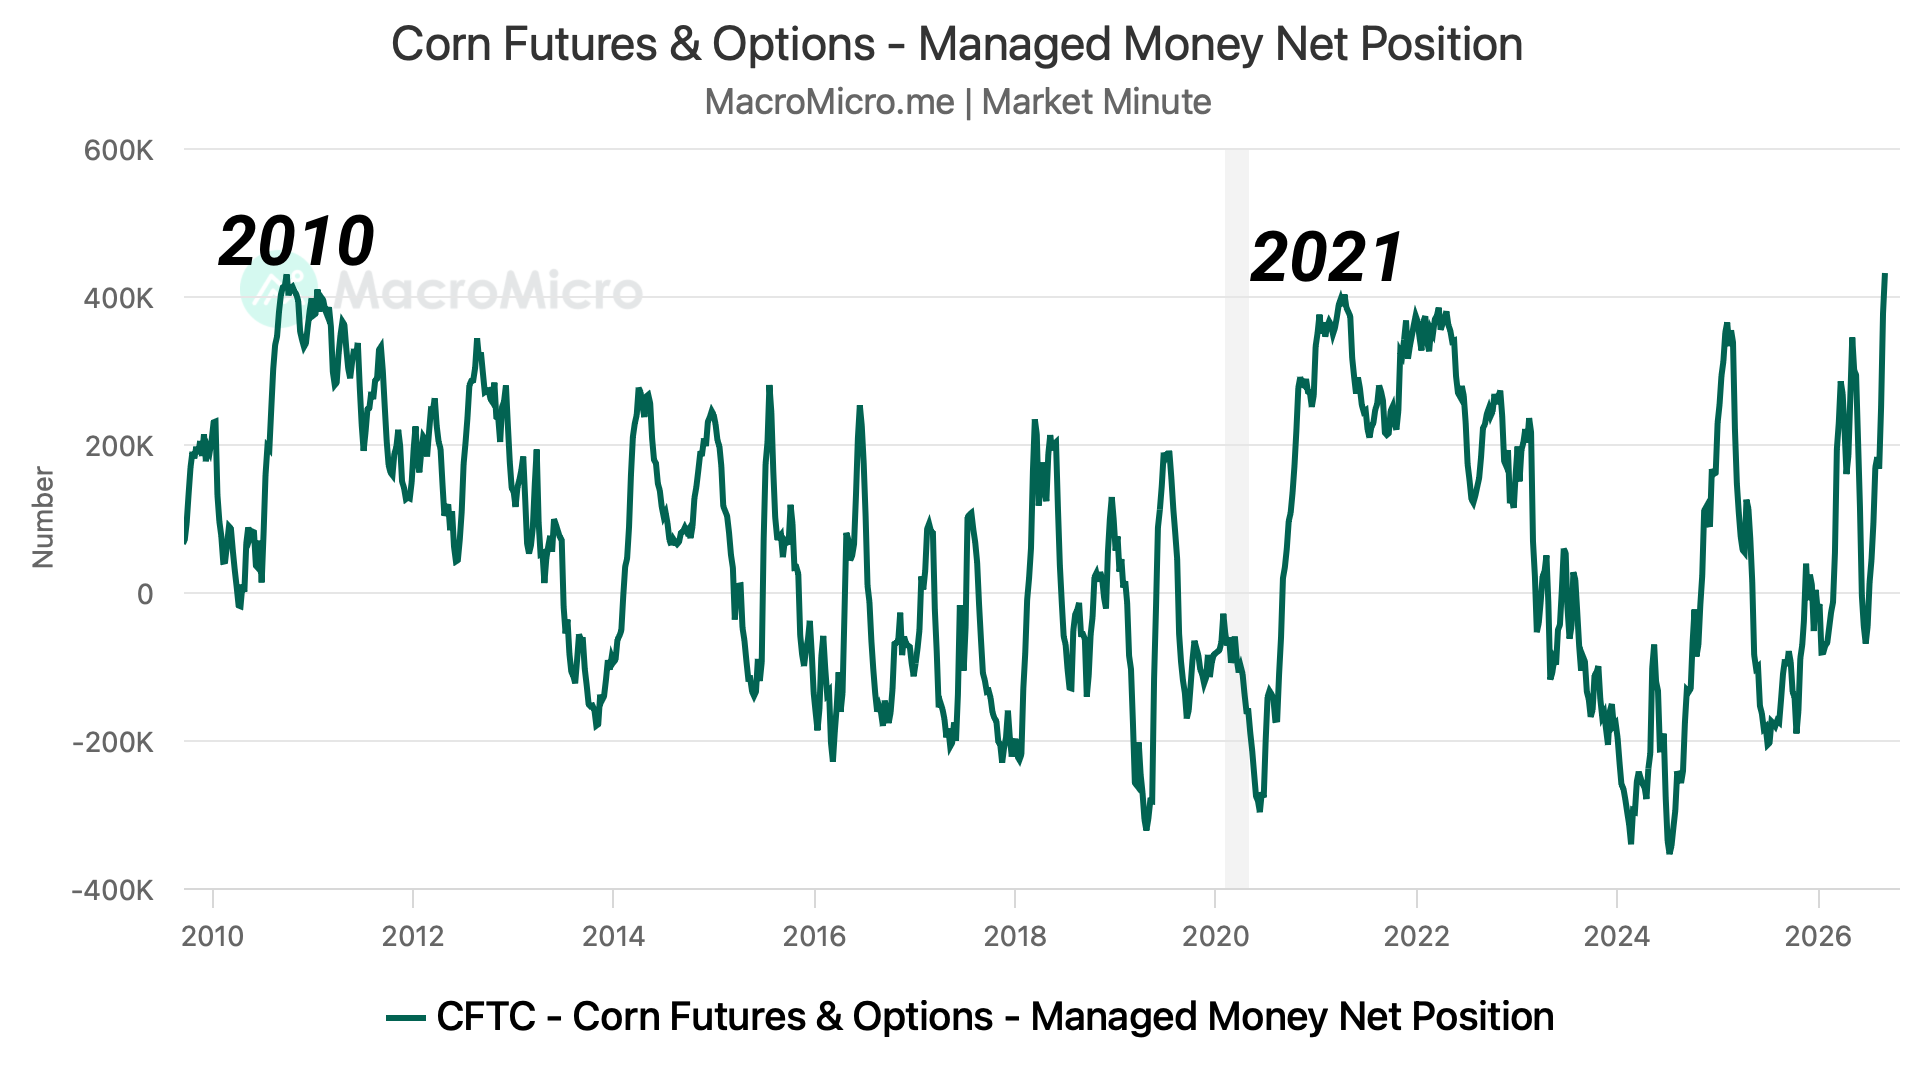
First let's look at 2010.
I added the funds position along with the prices from the exact time frame.
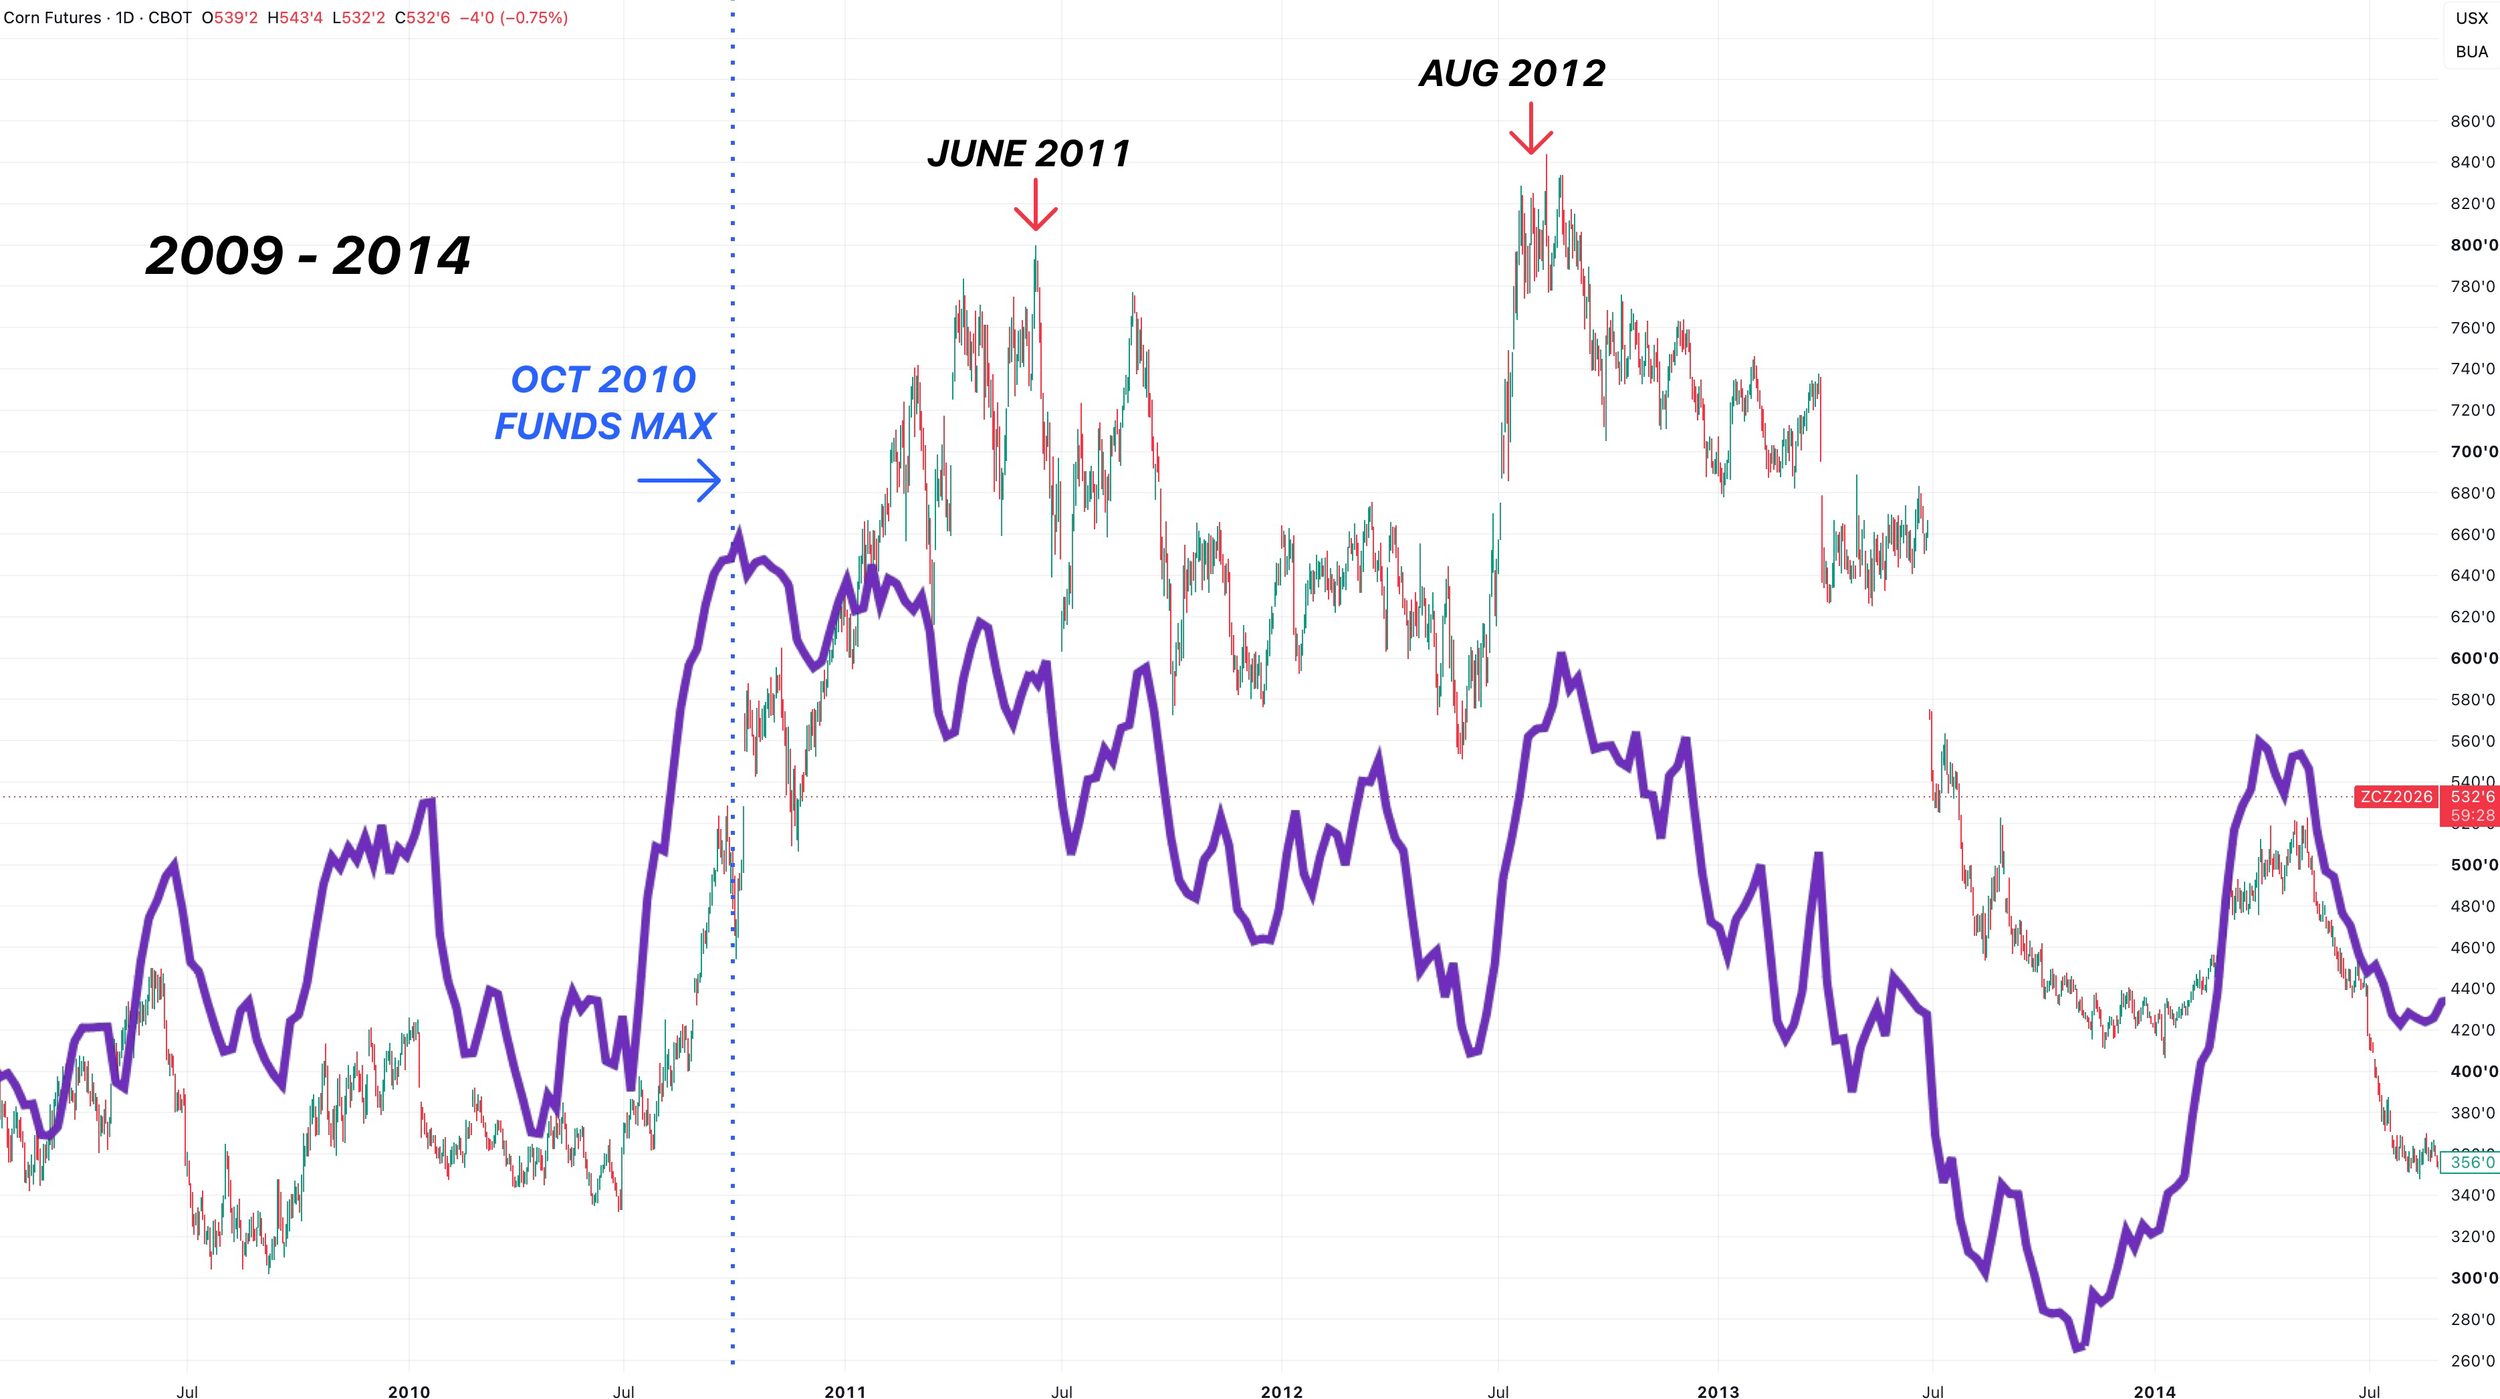
The funds actually maxed out their position in October 2010.
Prices continued higher into 2011.
The funds then stayed long until mid-2013.
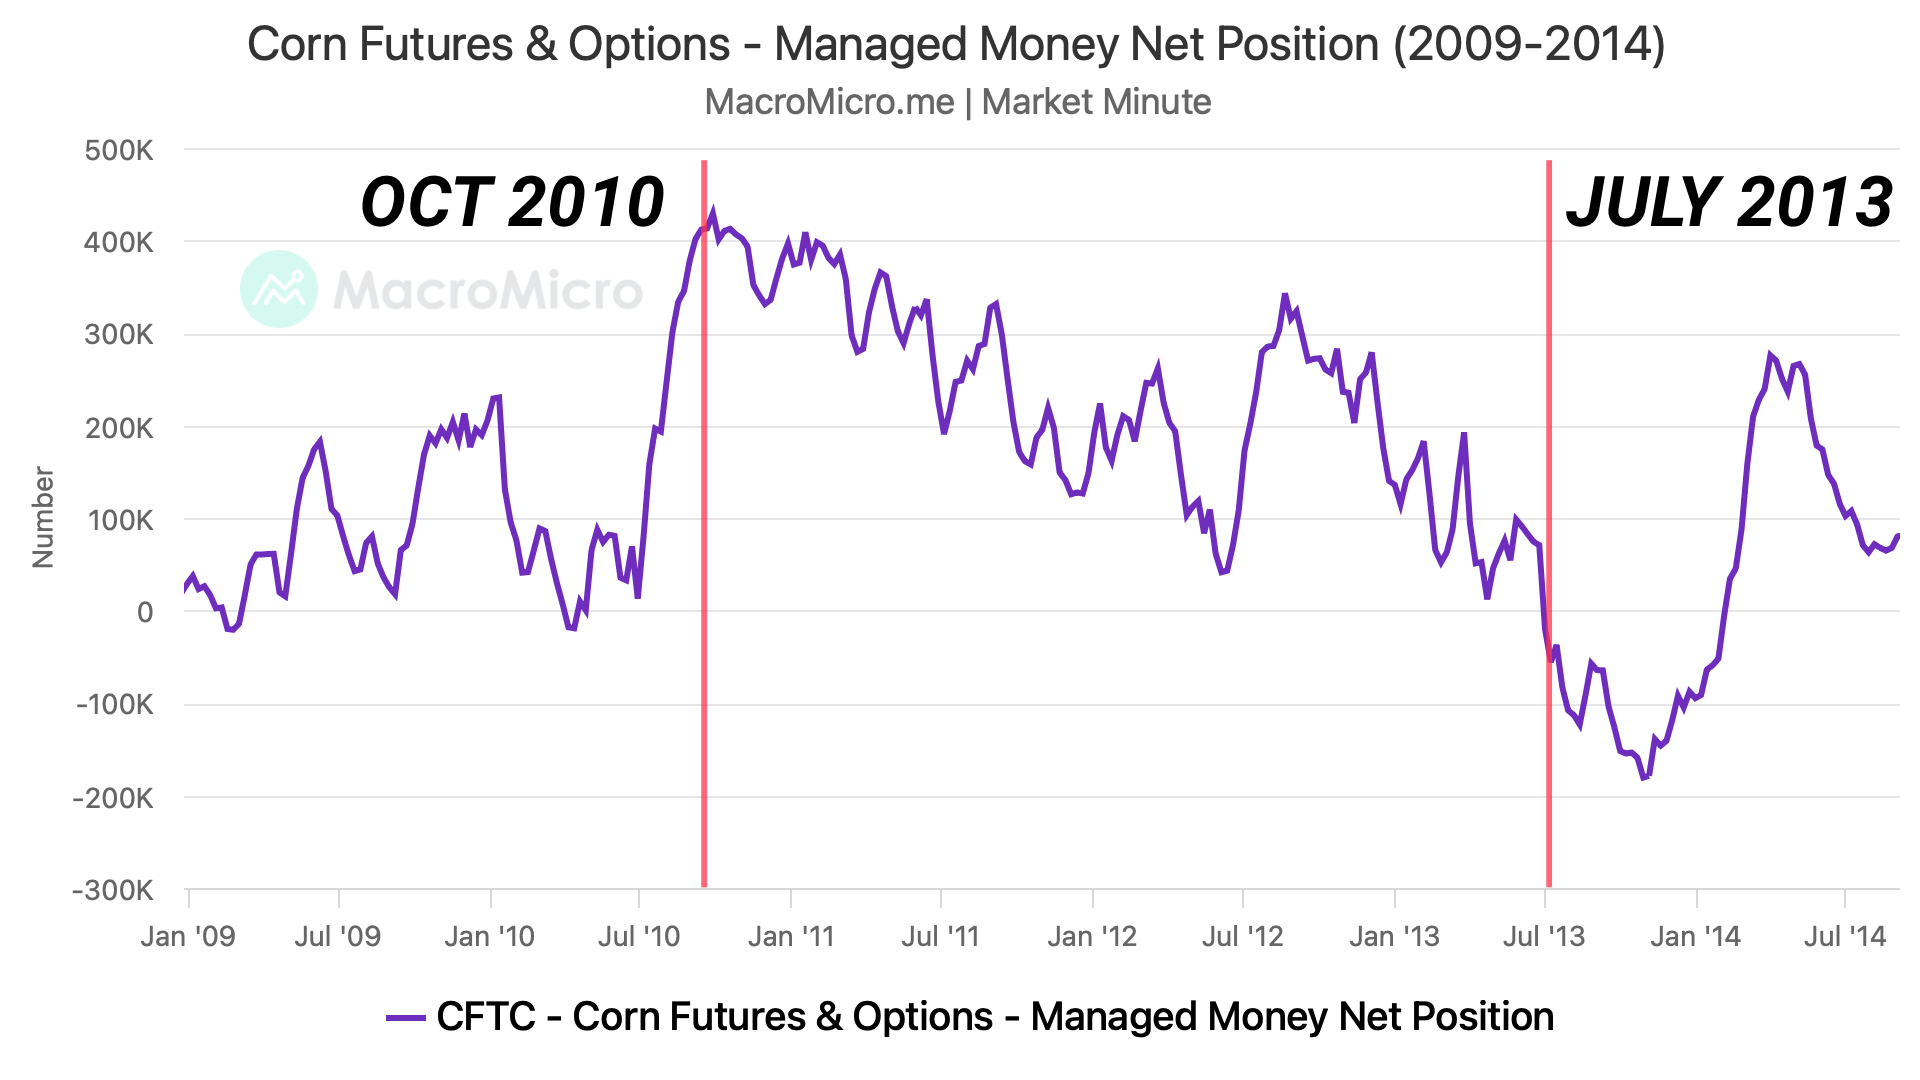
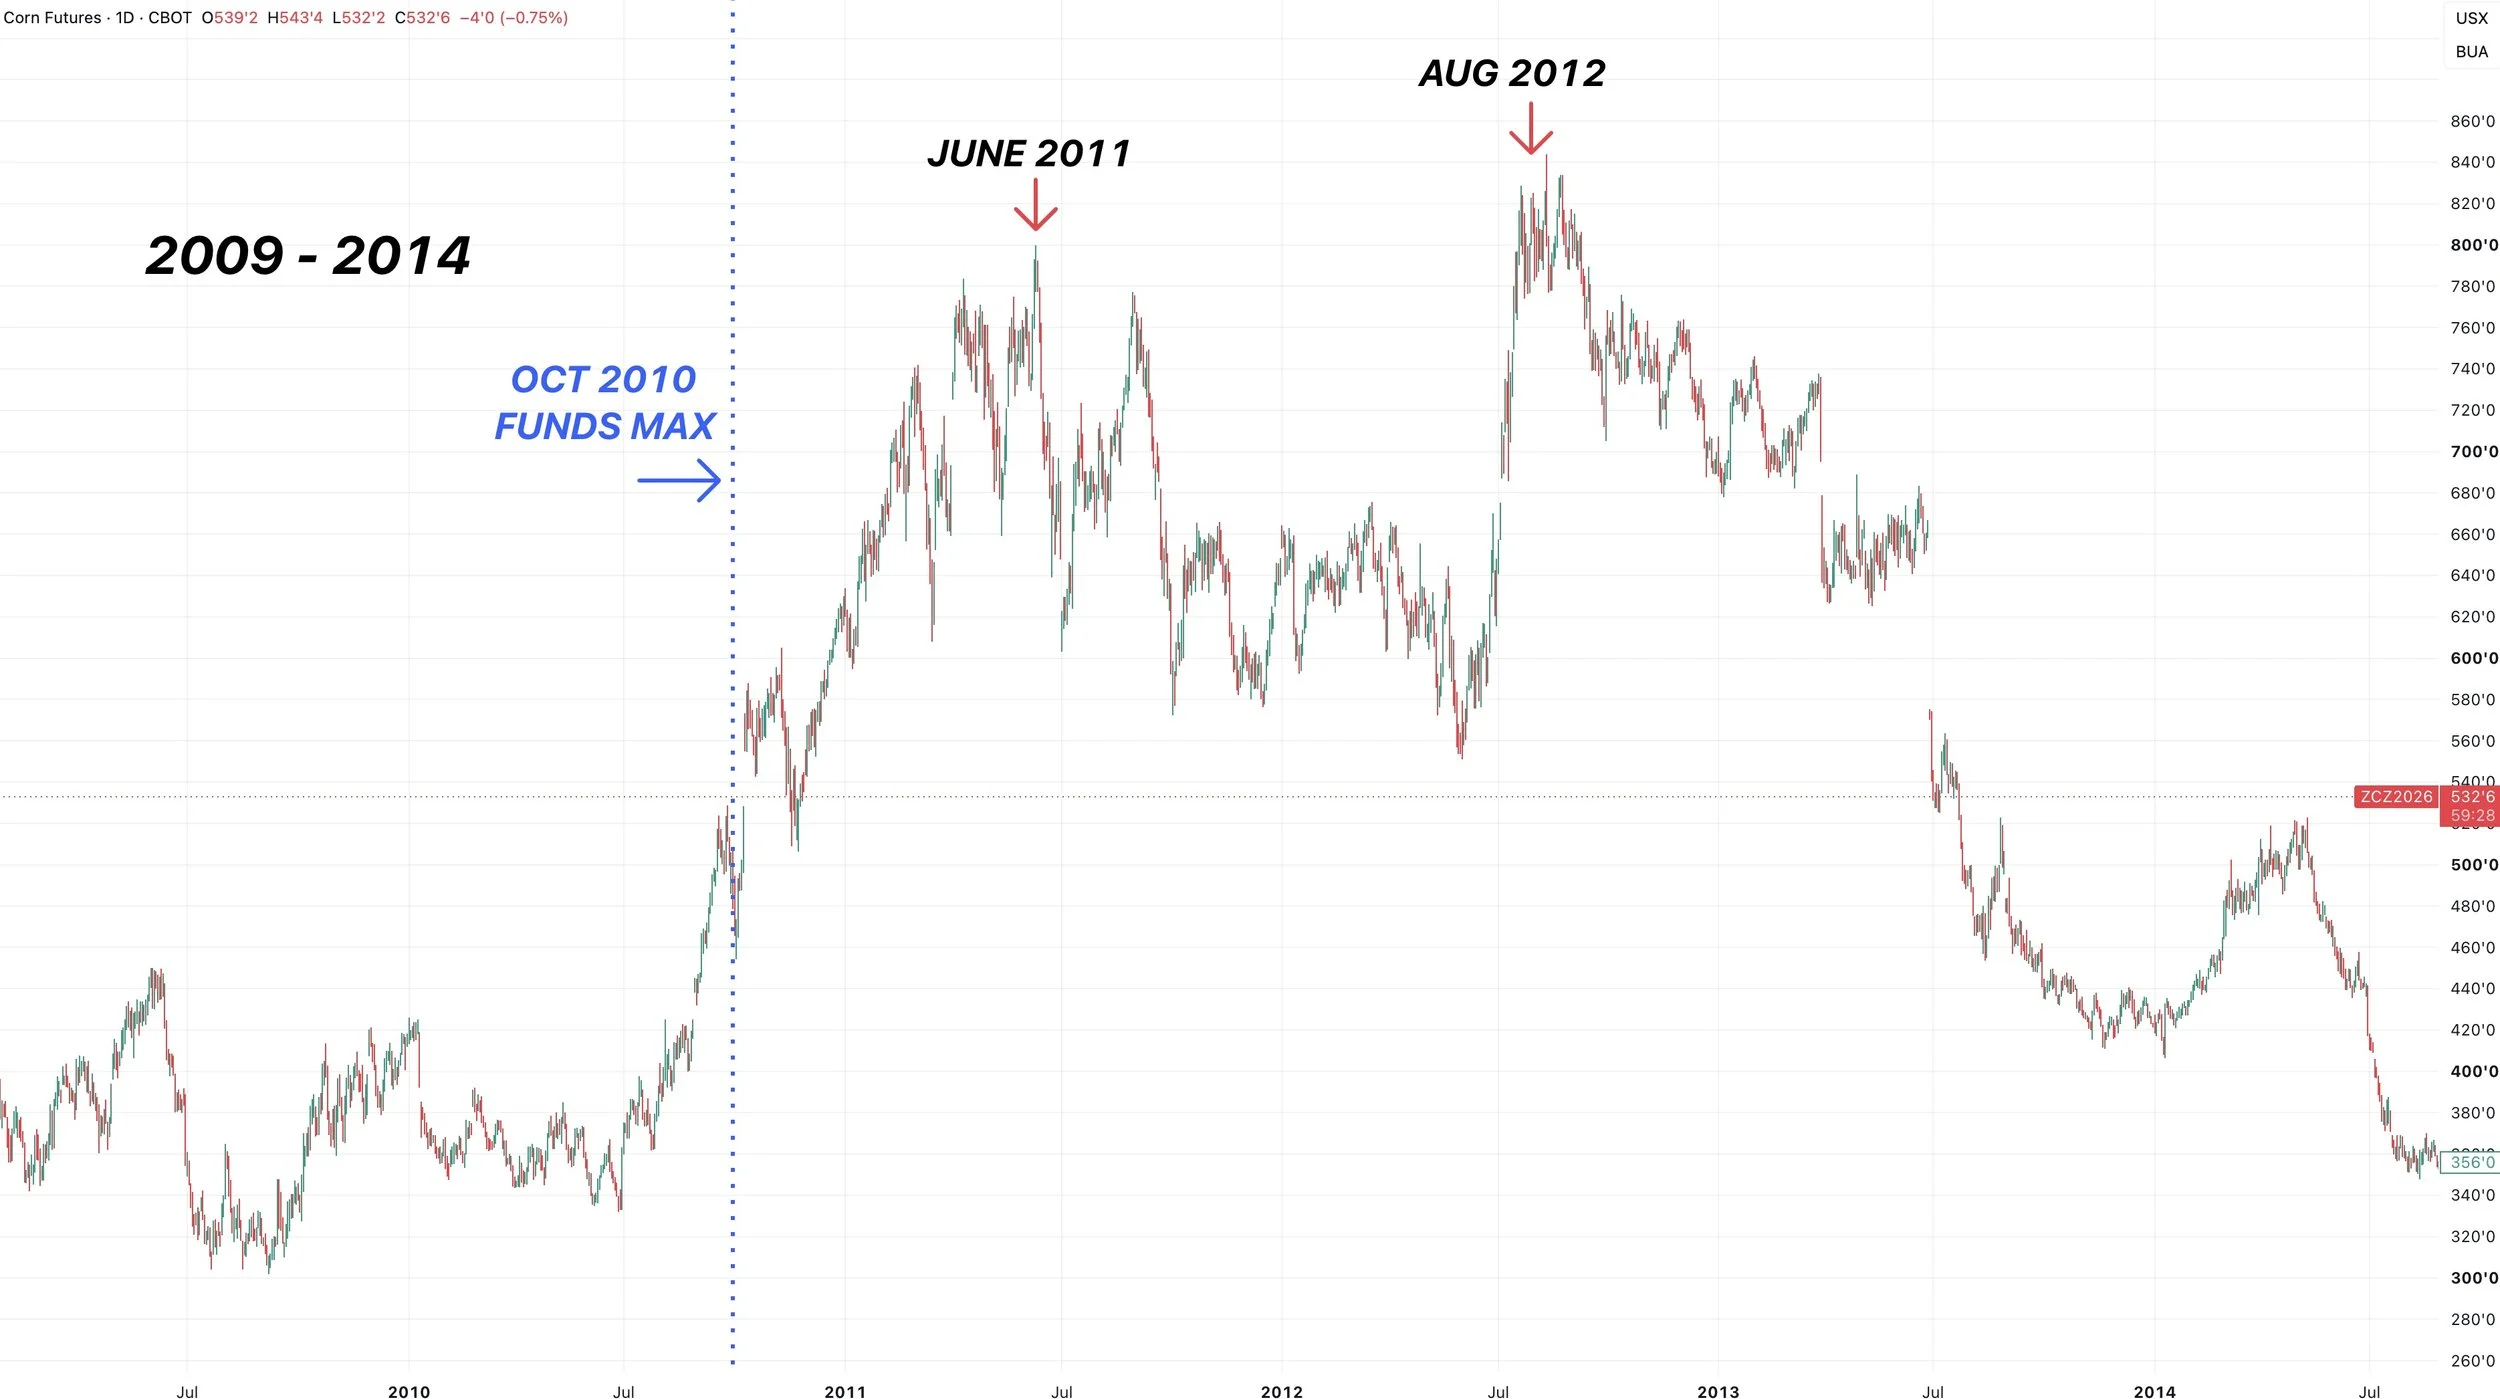
Here is another way to look at it.
This time I overlayed the funds positions on top of the price action.
In a bull market, the funds can stay long for a while.
In this case, they were long from late 2010 into mid-2013 before we then entered the bear market.
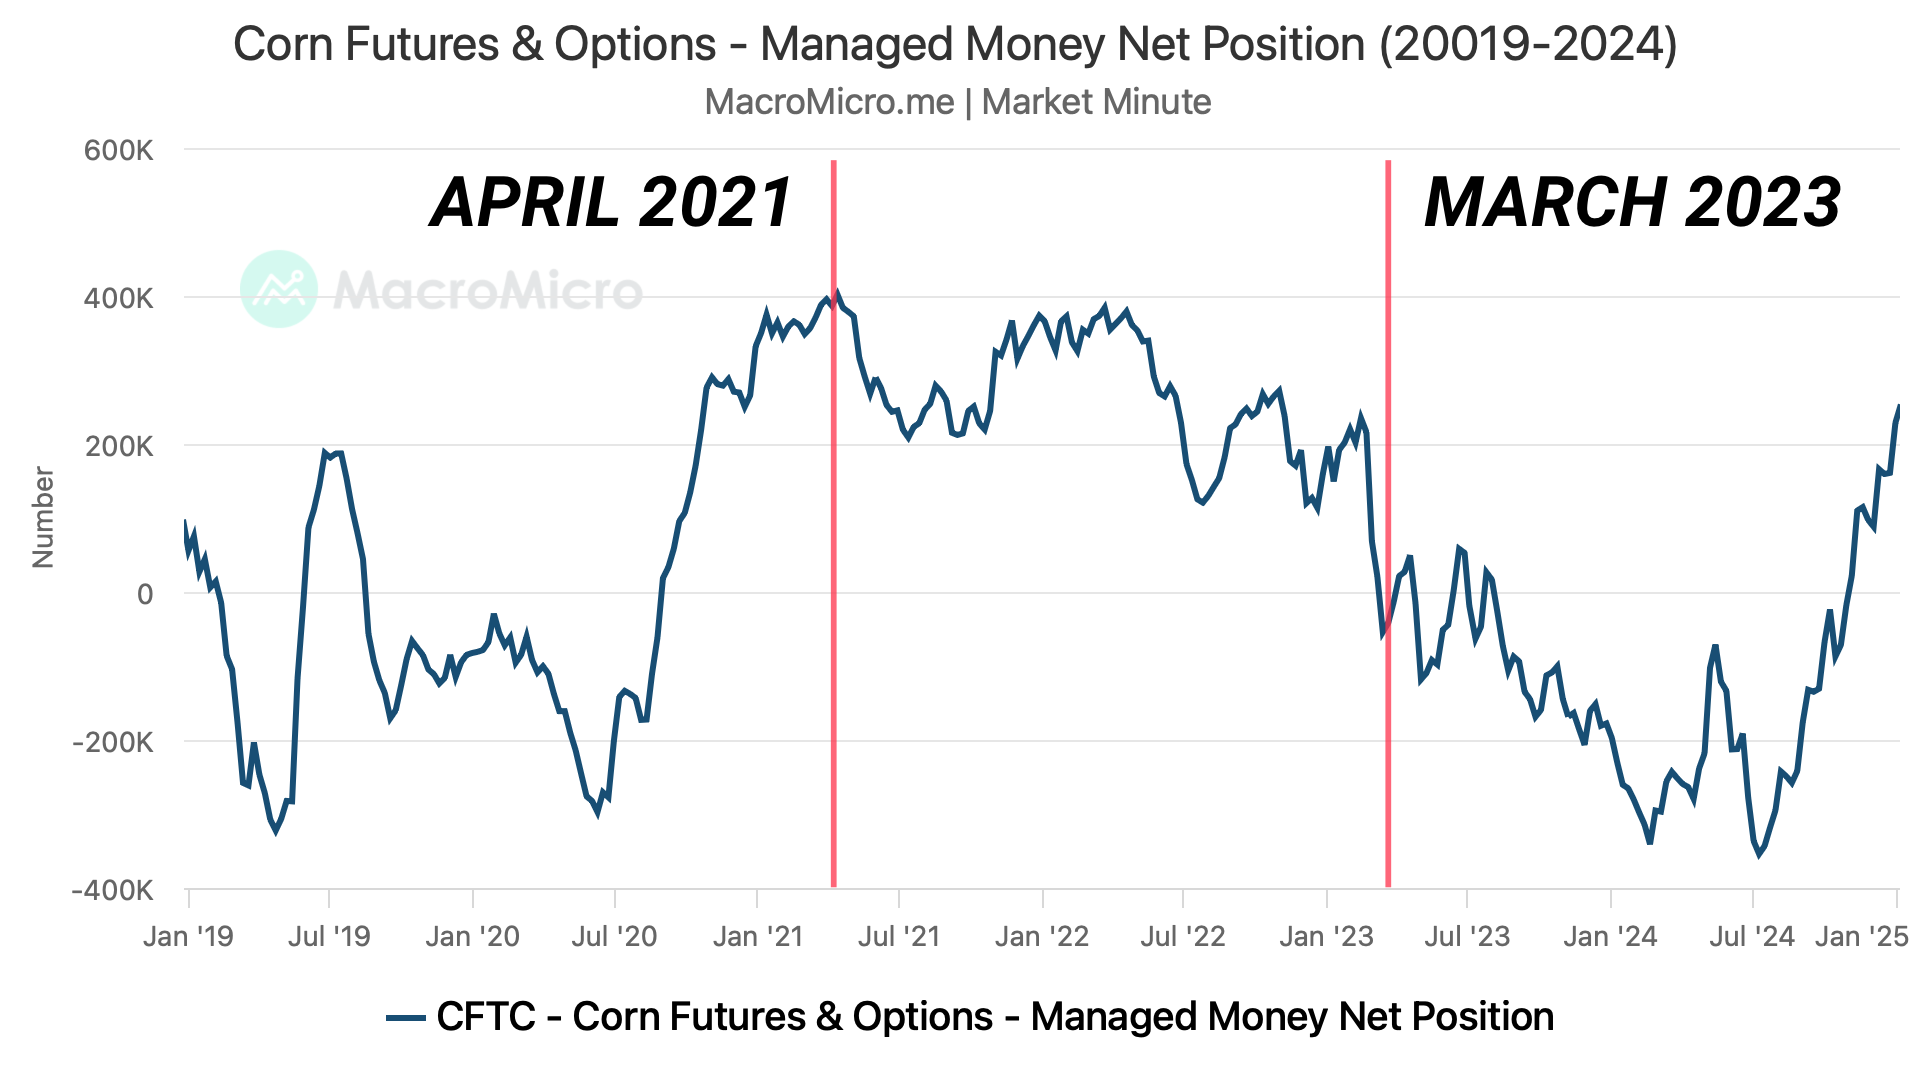
Next lets look at that 2020 to 2022 time frame.
I again included the funds positions and the prices from that time frame.
The funds position maxed out in April 2021, before they eventually went short in March 2023.
So the funds stayed long for quiet some time.
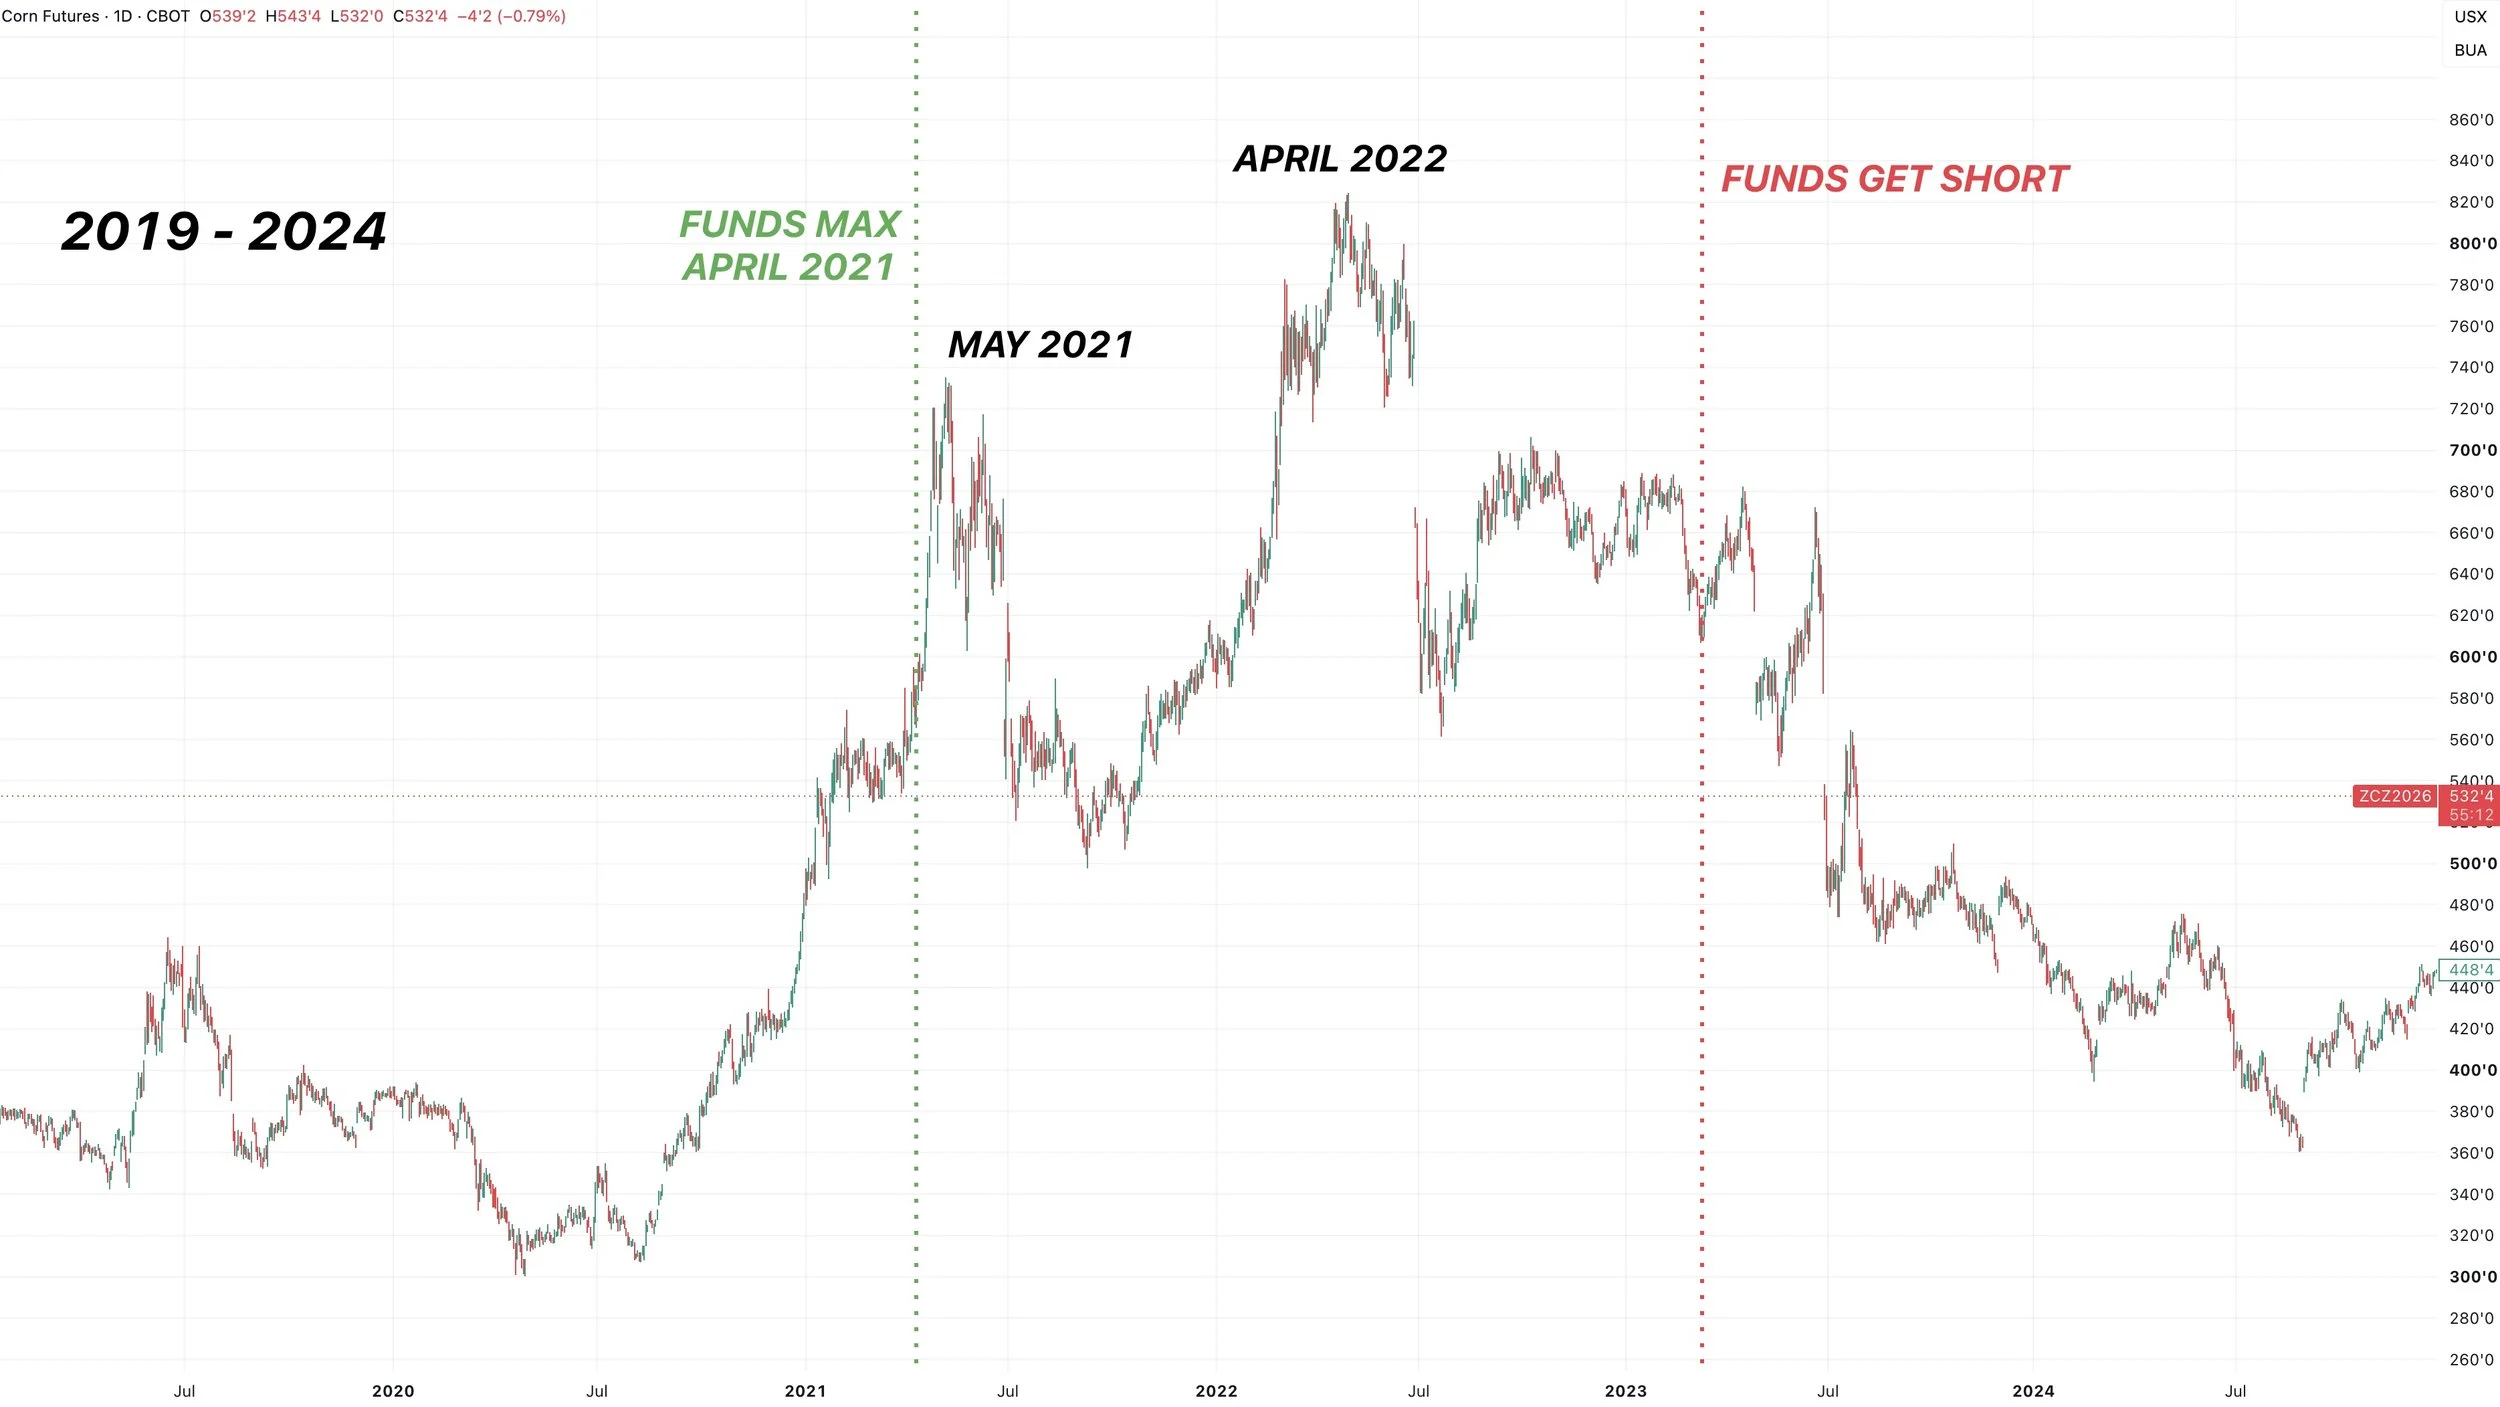
Here is another visual with the positions overlayed on top of the price action.
The point is that the funds being record long can indeed be a risk, as they are often times longest at the top.
However, just because they are long does not mean they have to full on puke out of that position.
I think it's pretty likely they hang on to that long position in some sort of manner.
As the last two times they were this long, they did not give up on that position anytime relatively soon.
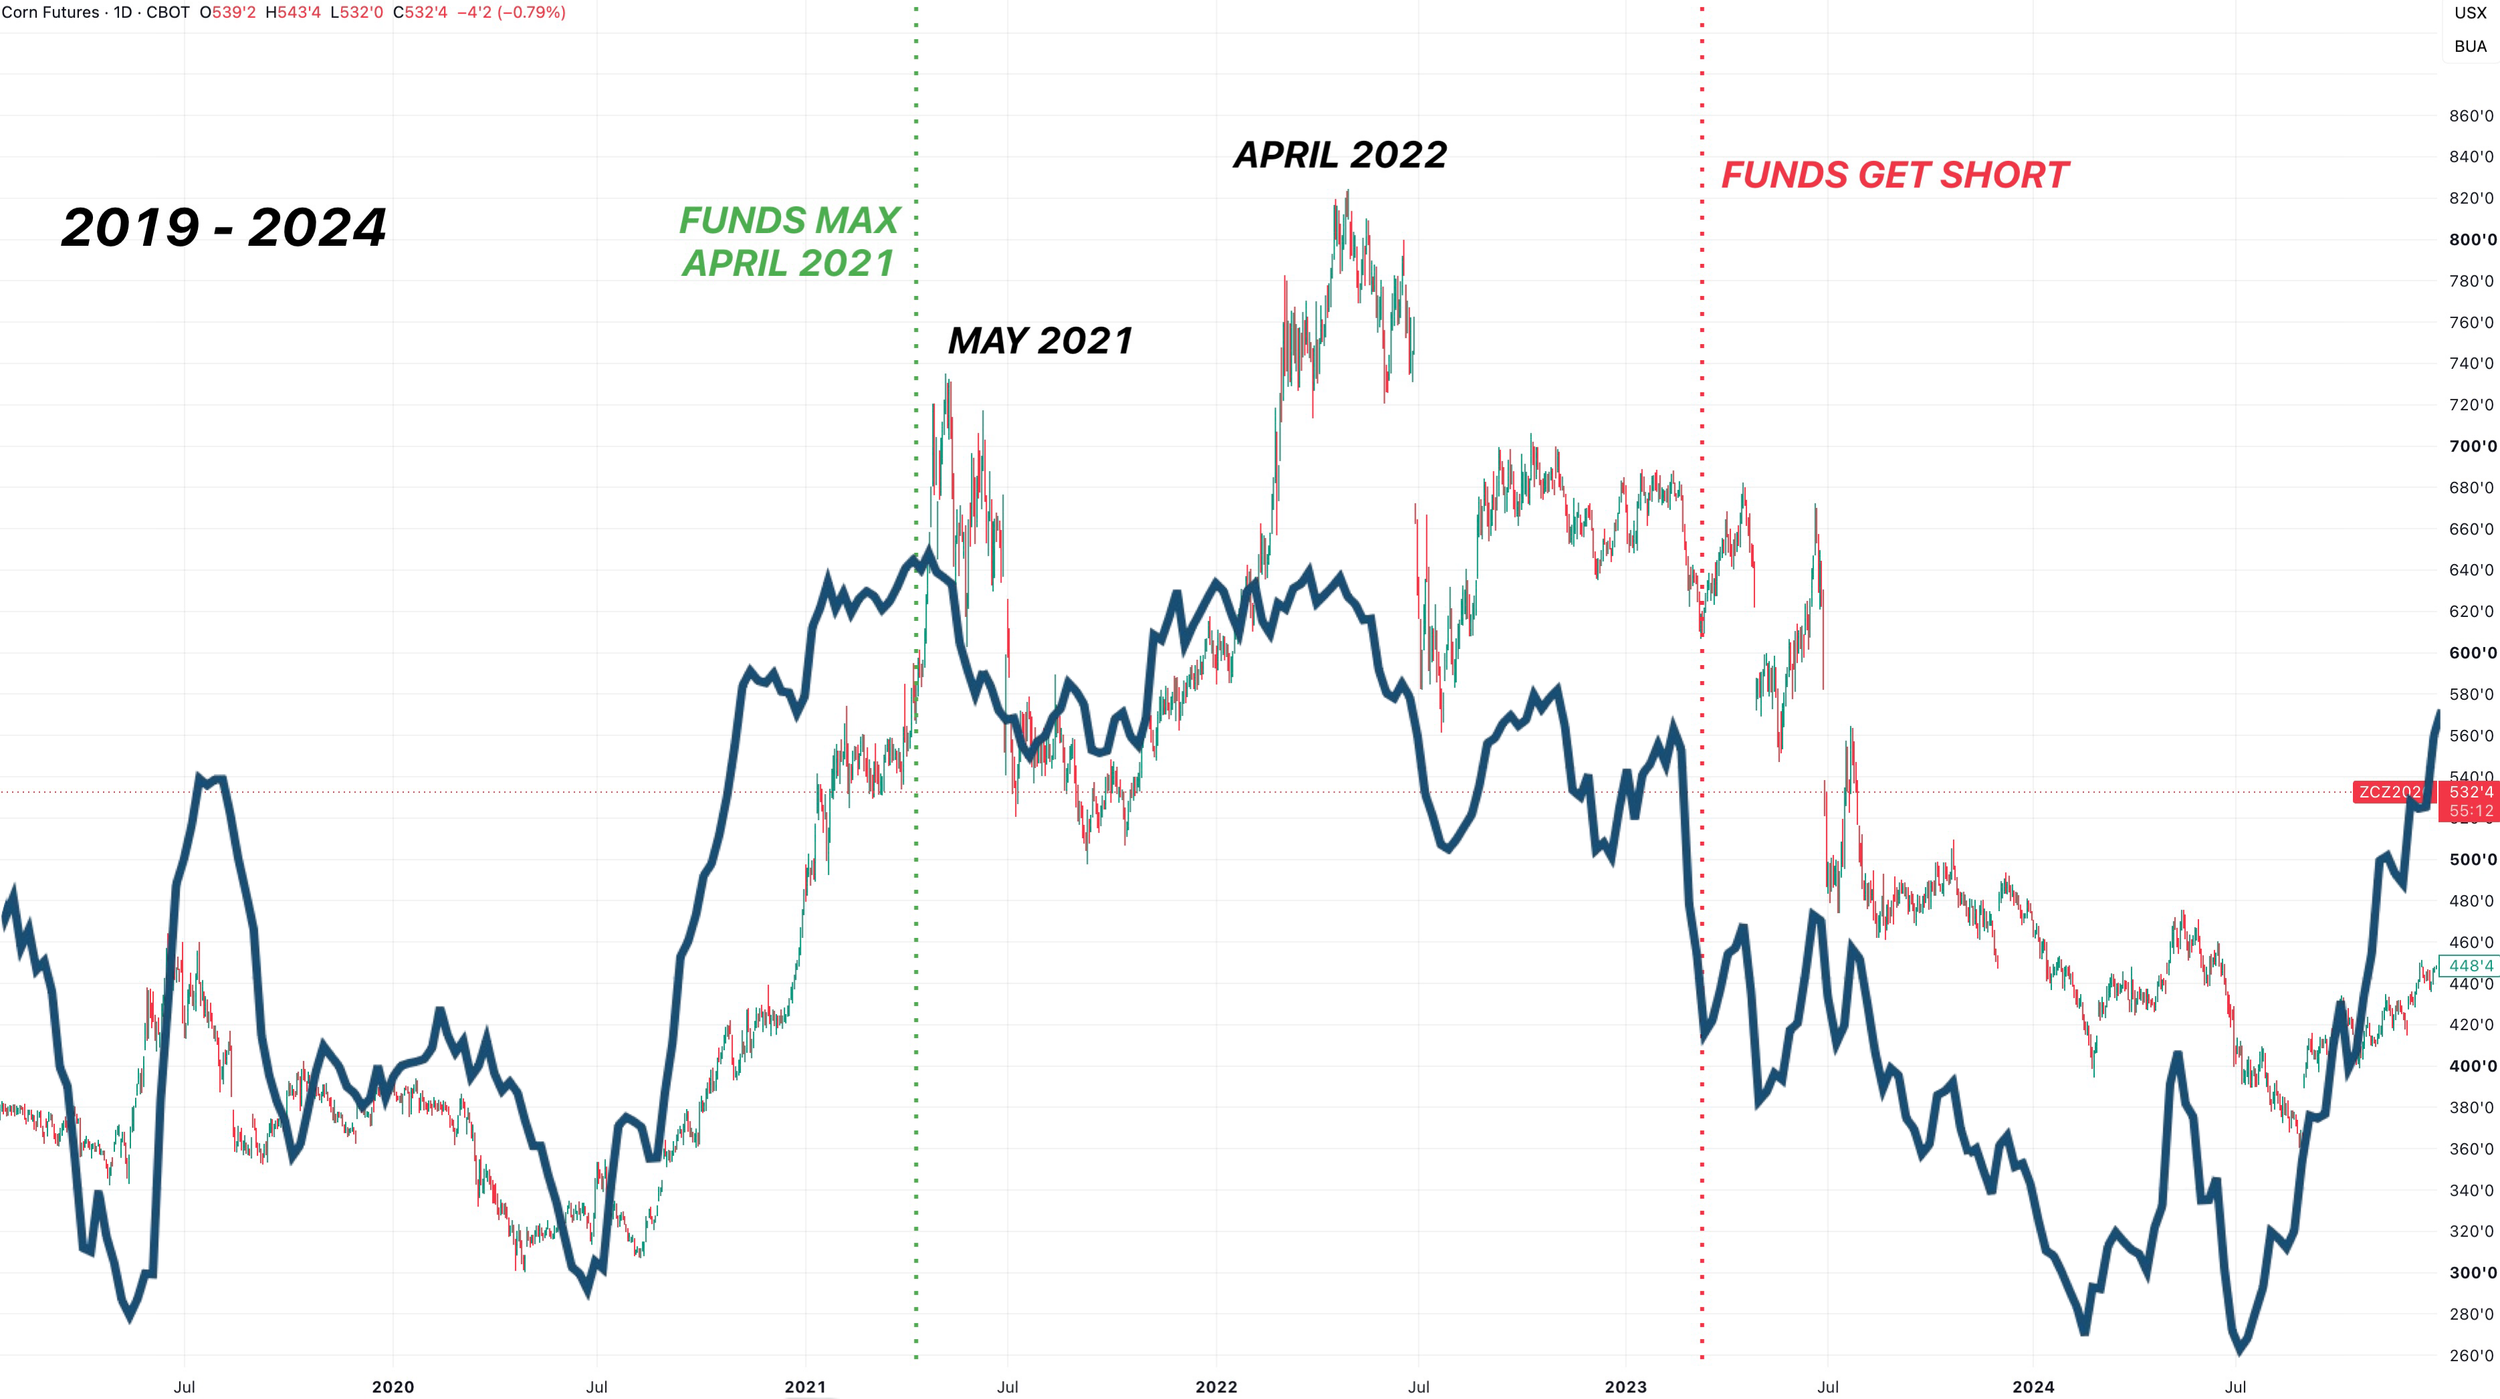
On this next chart I labled the date of the top of the funds positions.
Interestingly enough, most of the spikes that did not last occurred during the spring to summer.
Where as the two spikes that happened late in the year led to the funds holding on to that long position. I'm talking about 2010 and 2020.
I think the funds will likely need a real fundamental reason to puke out of that position. Until then, I'd like to think they defend it. They are longest at the top, but long for a reason.
Today's Main Takeaways
Corn
Balance Sheet:
Who knows what the UDSDA is going to do on Friday.
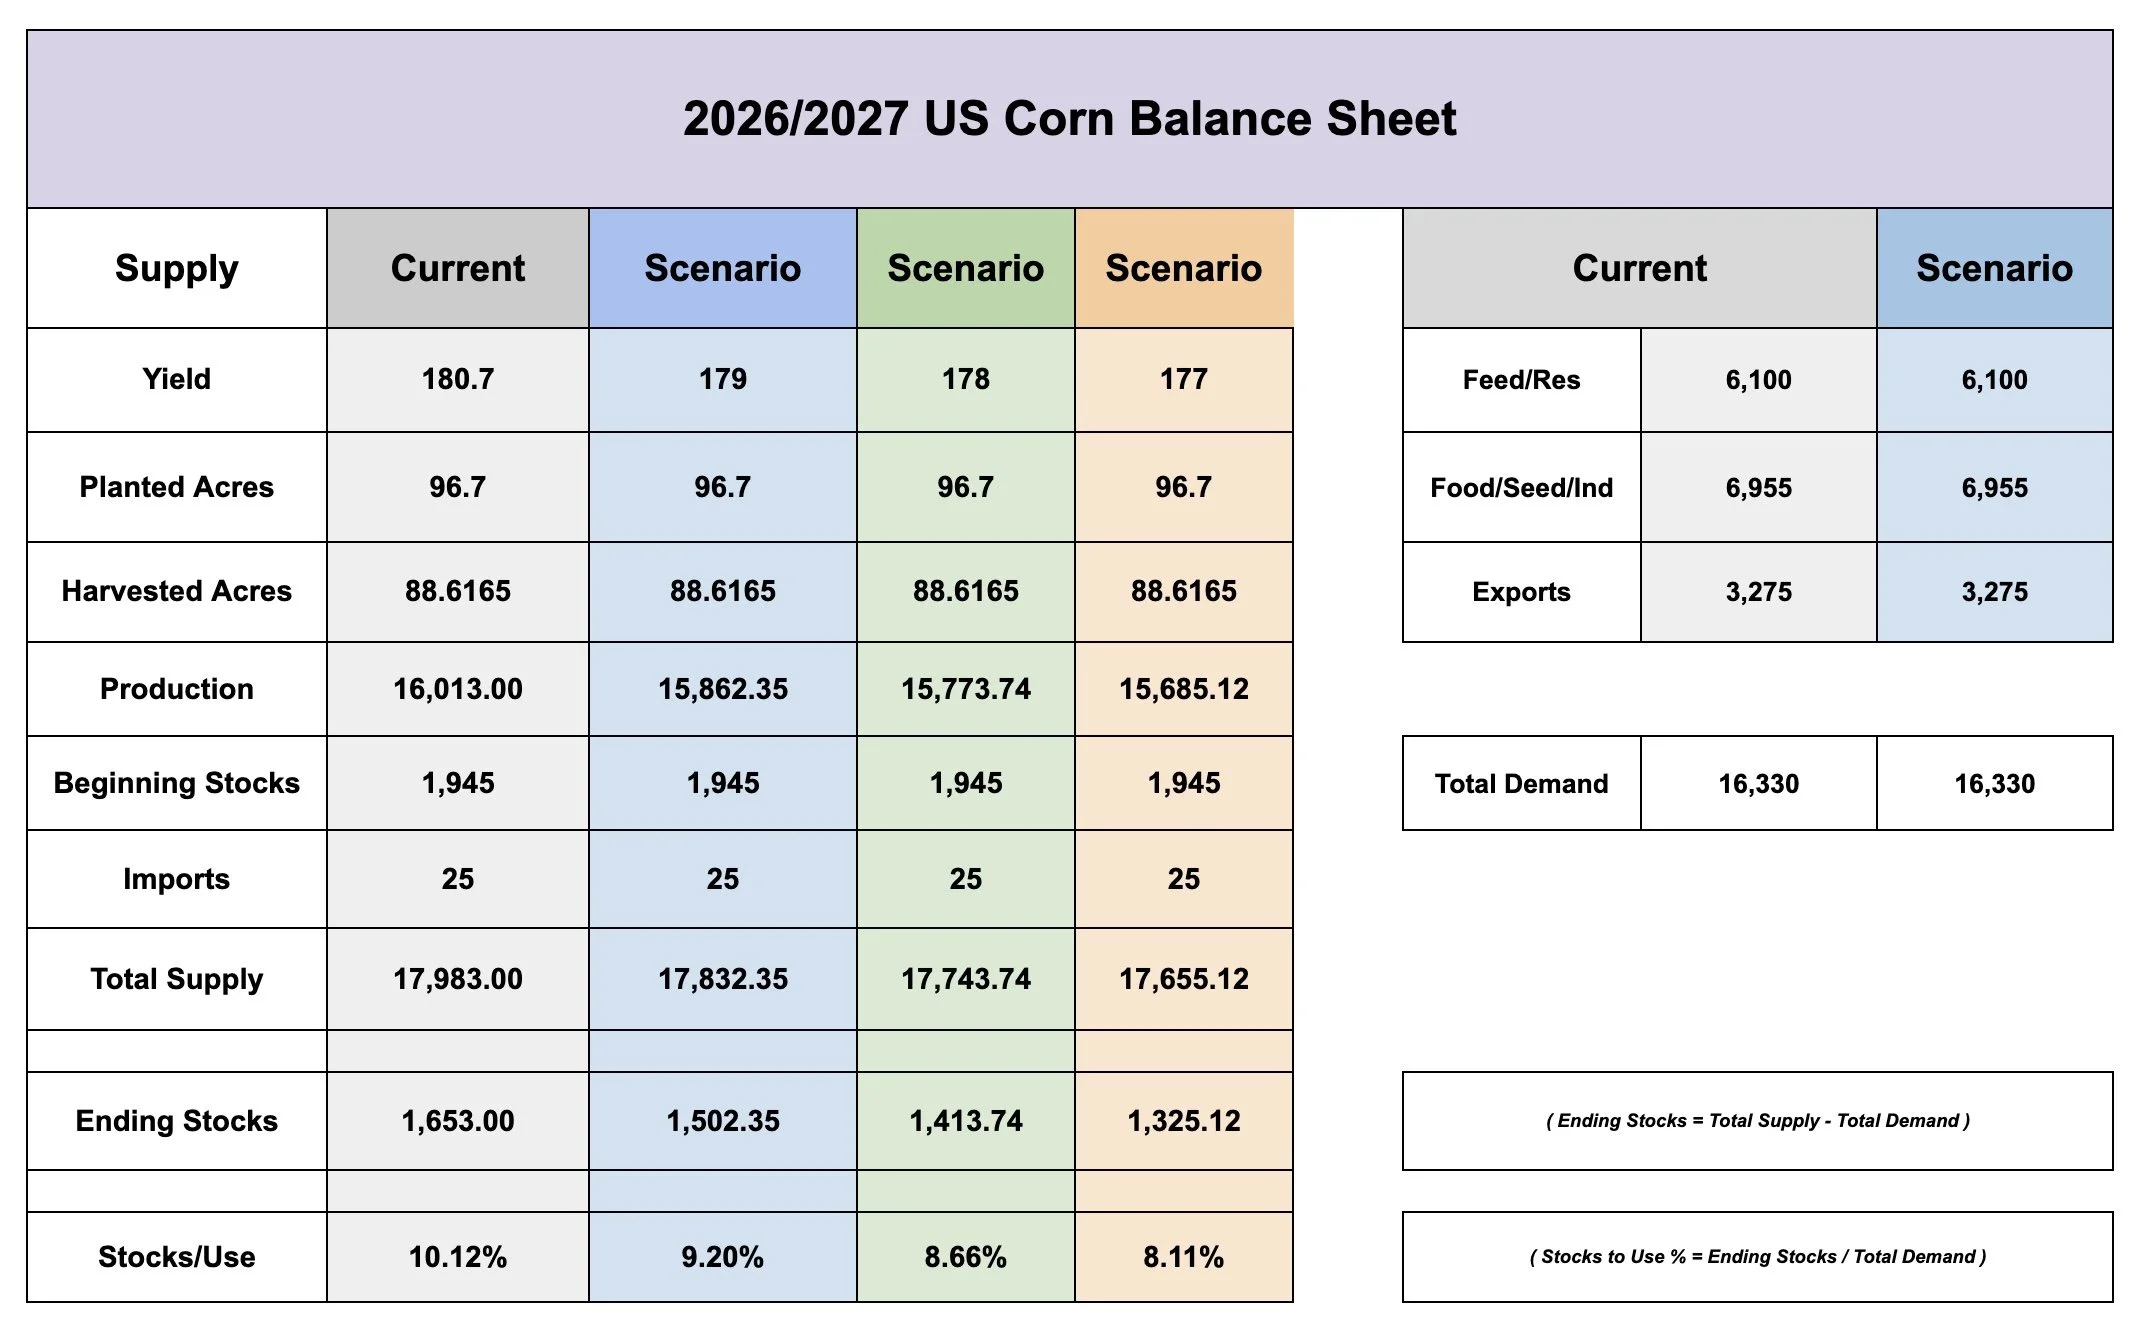
What we do know is that anything below a 180 yield does start to make that balance sheet pretty snug.
We already have a 10% stocks to use with a 180.7 bpa yield.
Here are some scenarios on how yield changes the balance sheet before touching demand.
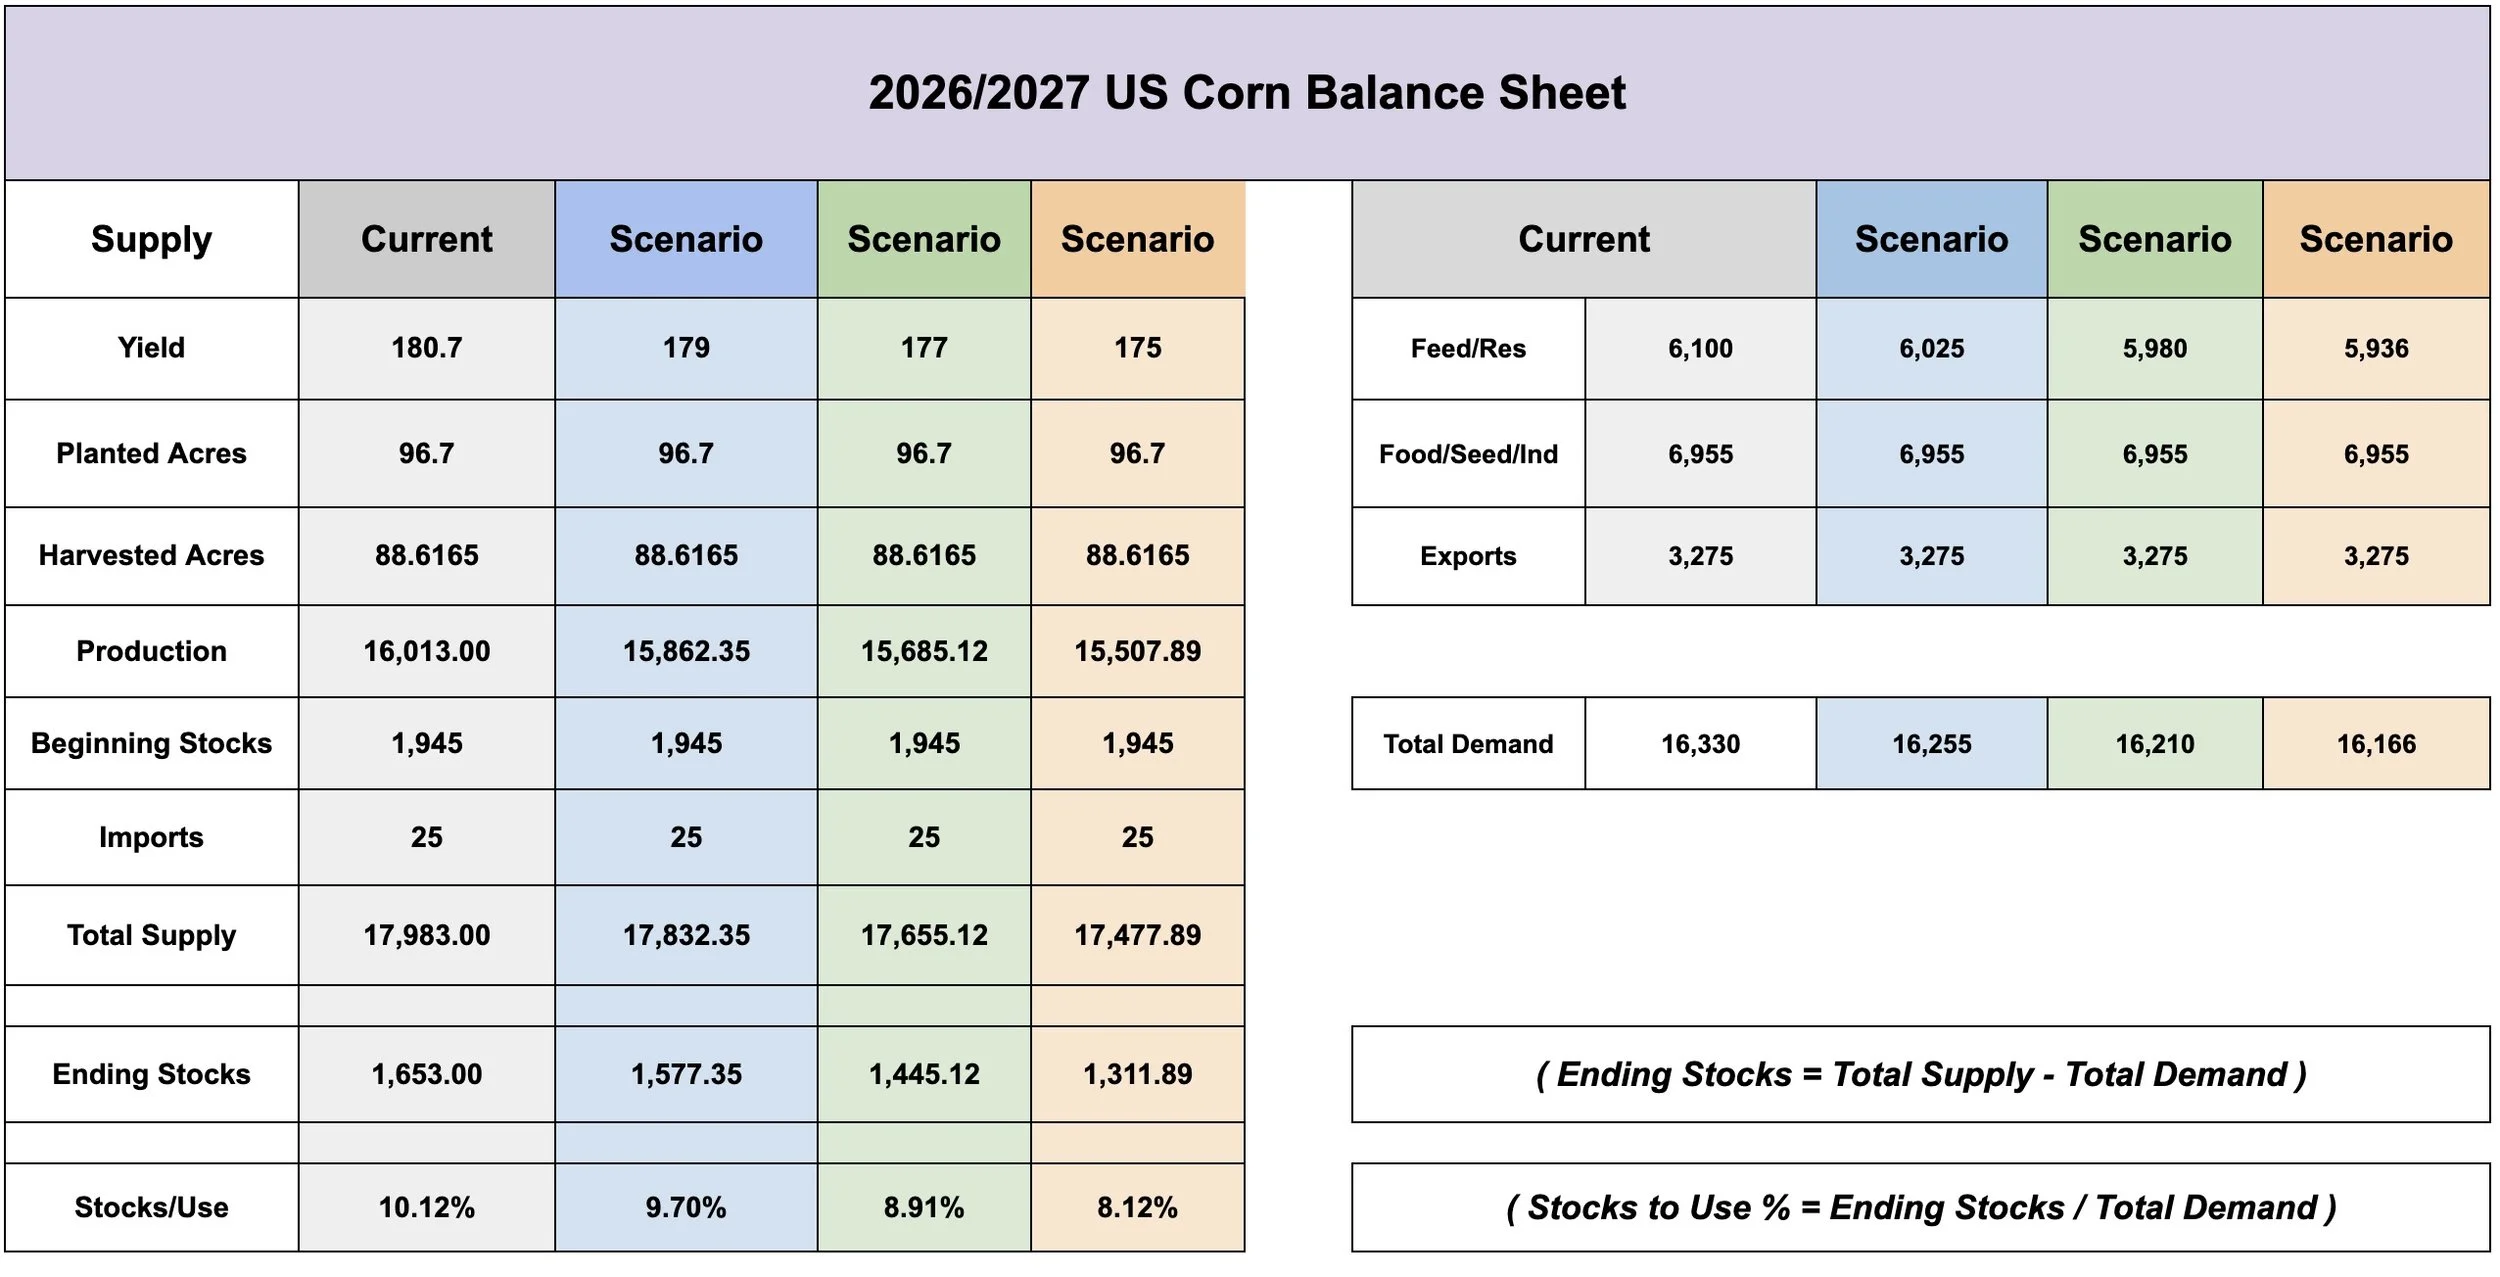
Now if we see a cut to yield, the USDA will likely balance the balance sheet and trim some demand to prevent things from getting too tight too fast.
So in these scenarios, let's ration some demand.
In these scenarios, I rationed half of the supply we lost with decreases to demand.
In all of these scenarios, a sub 180 yield still results in a stocks to use ratio that is below 10%. Which would be considered bullish.
I also think there is a good chance the USDA raises our old crop exports further.
If this happens, it makes the new crop balance sheet tighter in the form of beginning stocks.
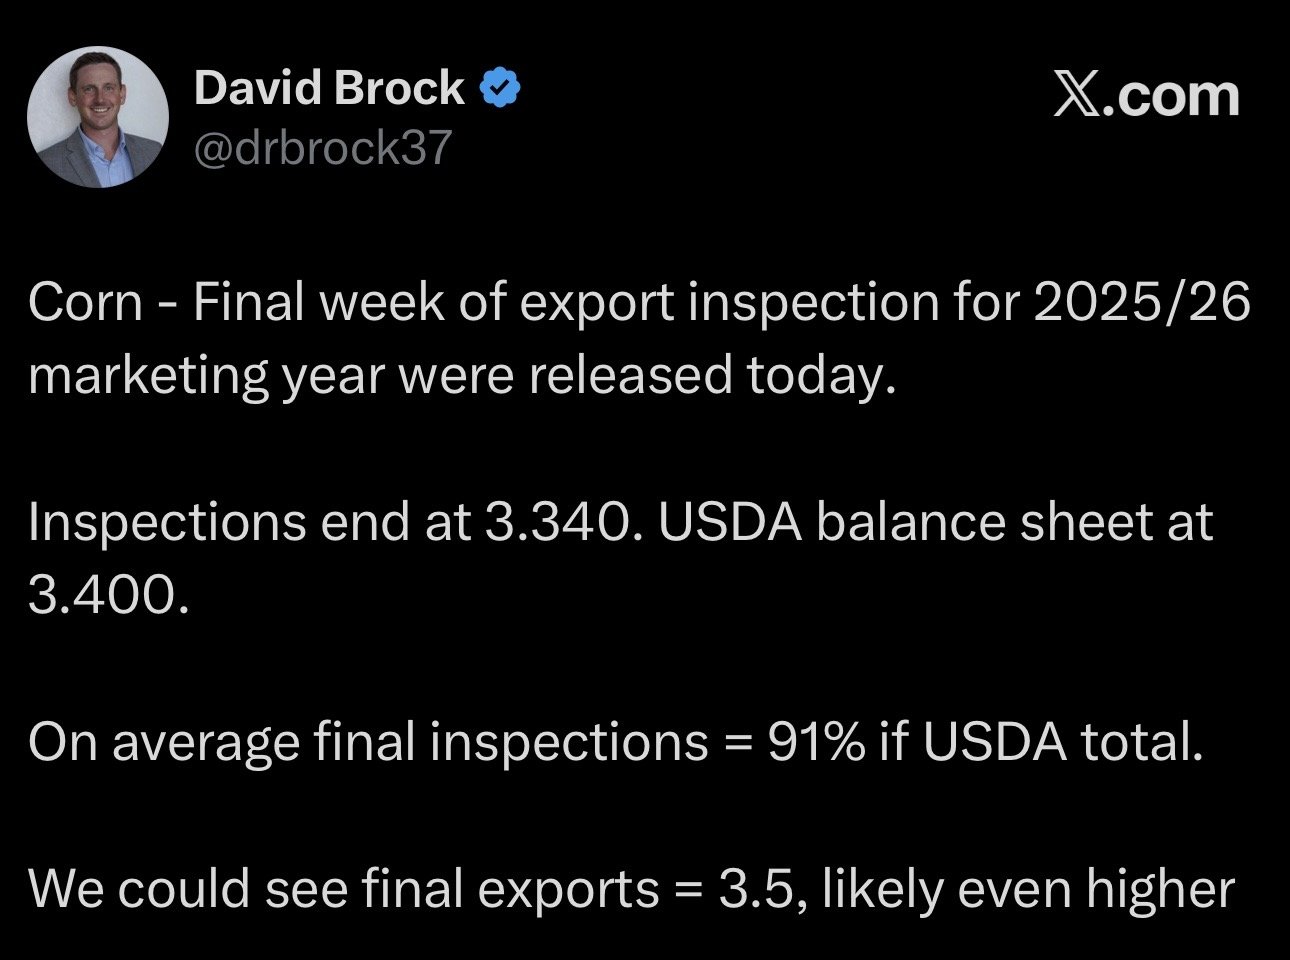
Here is a nice post from Dave Brock of the Brock Report (@drbrock37 on X).
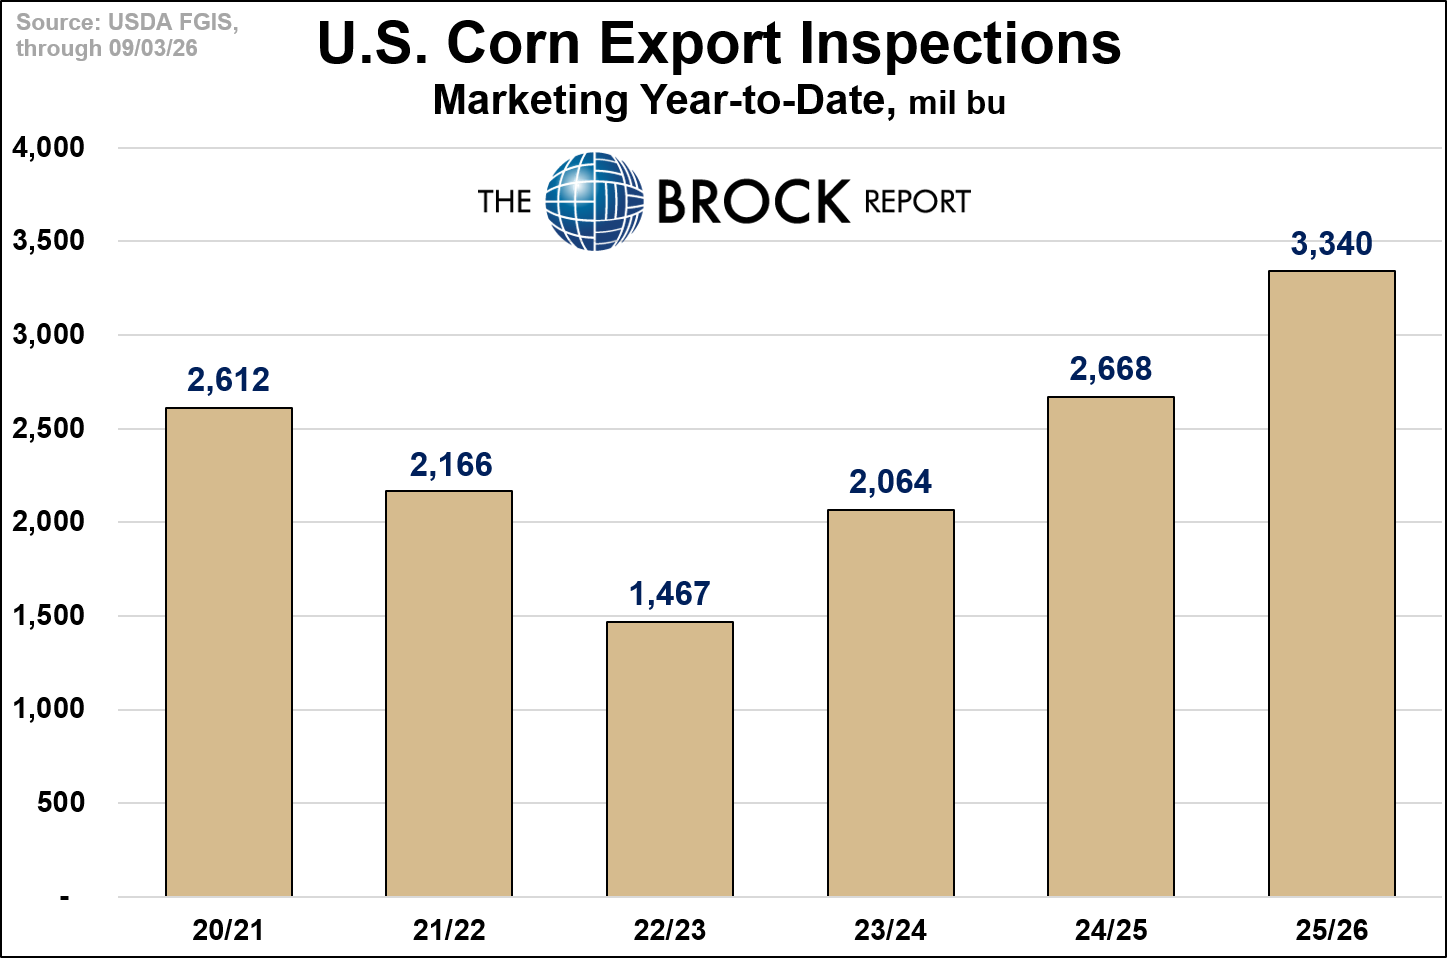
We got our final export inspections for old crop today.
They ended at 3.34 billion.
The USDA has our old crop exports at 3.40 billion.
Historically, the average final inspection (grain shipped) = 91% of the USDA's total export number.
Meaning, the USDA's number should go up.
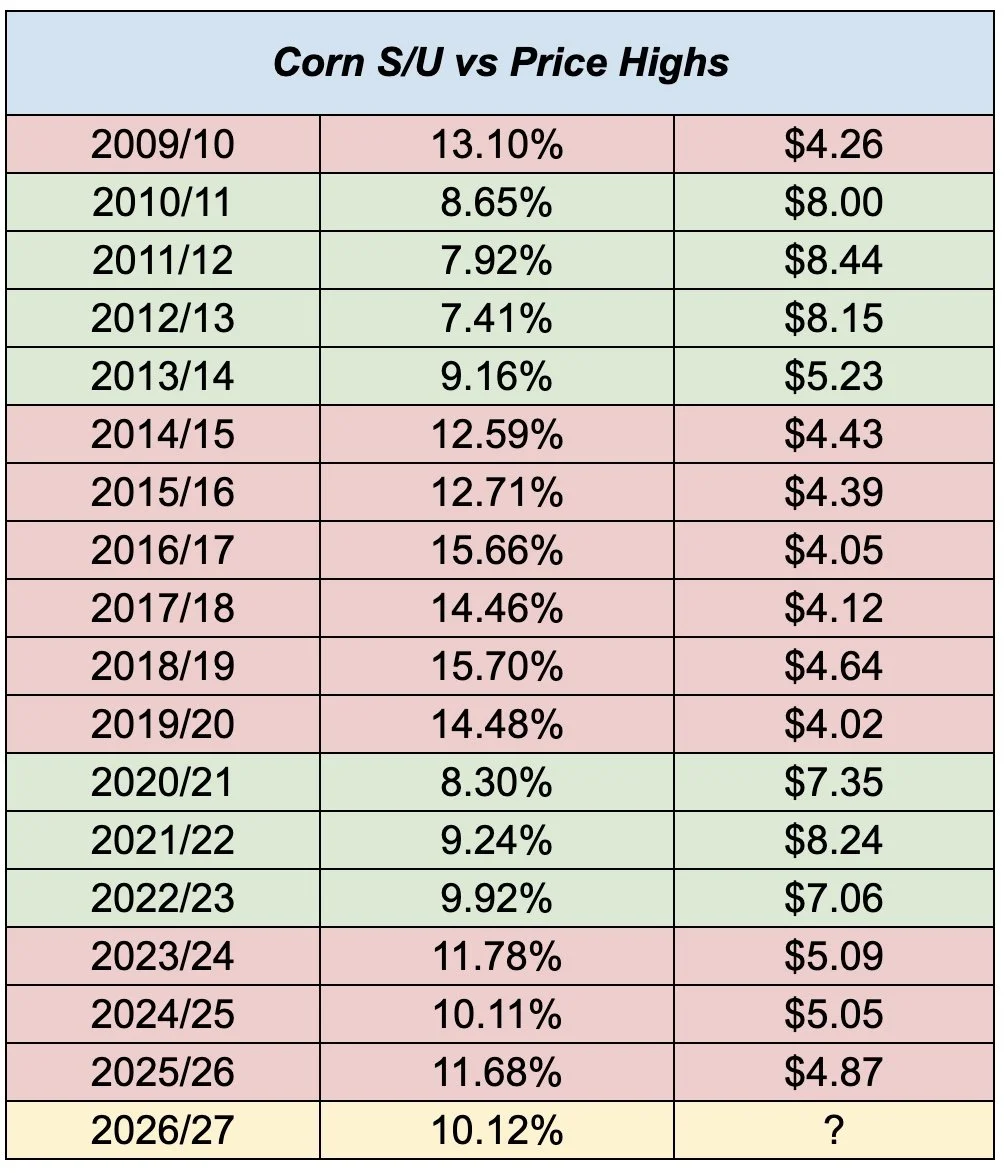
As we have talked about a thousand times, if that stocks to use starts to creep into that 8-9% range. It is usually associated with a lot higher prices.
The current 10% is friendly, but not yet in full blown bull market territory just yet.
Essentially knocking on the door of that threshold right now.
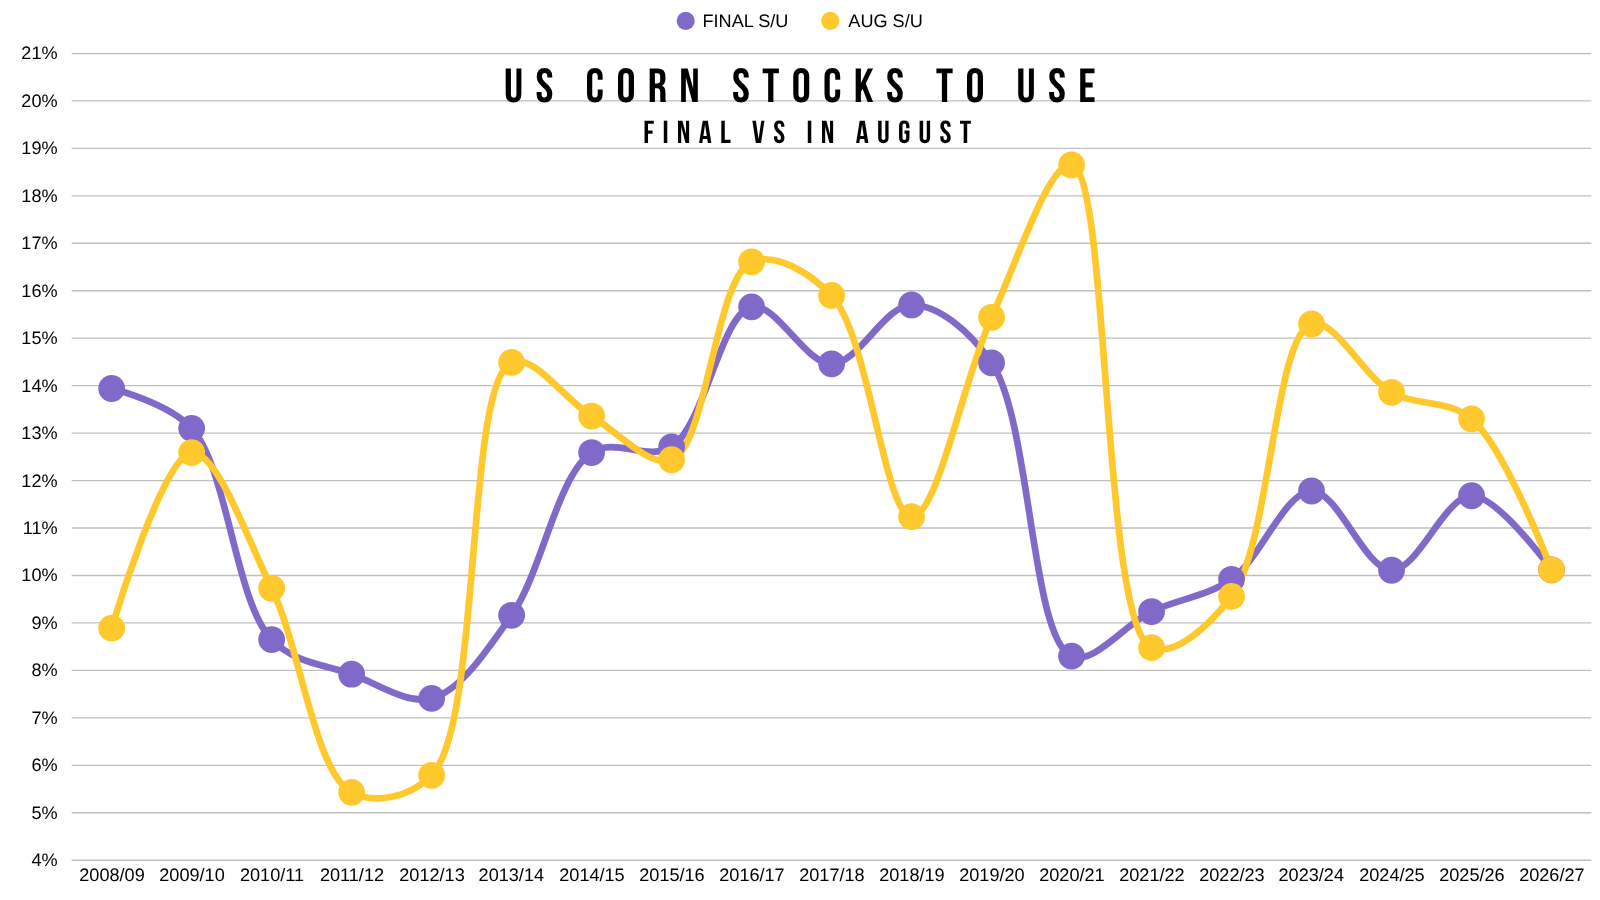
I have talked about this several times before as well, but the most interesting part is just how tight our situation is for this time of year.
We have the tightest situation for August since 2022.
The last several years, the situation has gotten tighter as the marketing year has progressed.
I'll be sharing an updated September version after the report as well as a bunch of updated numbers and data once we get the fresh set of data.
Similarities to 2010 and 2020:
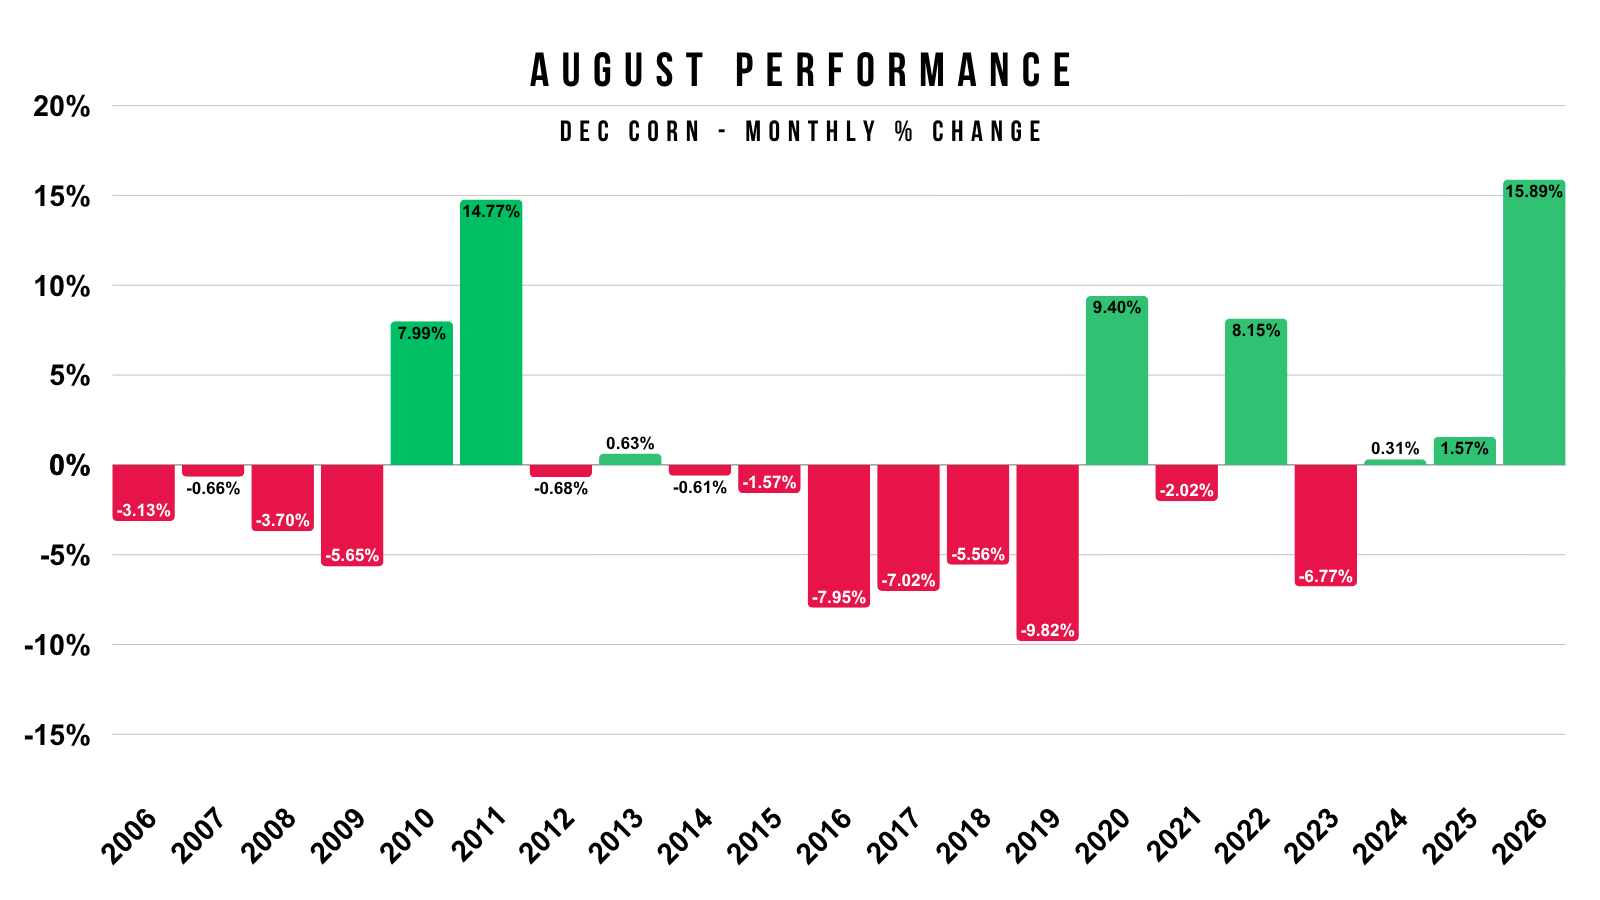
Corn just had it's strongest August of all-time. Corn jumped nearly +16%.
That is not something you see in a bear market.
The only other years with even a remotely similar August were either during bull market years, or came right before a bull market.
2010: Started bull market
2011: Bull market
2020: Started bull market
2022: Bull market
I still think there is a chance we see somewhat of a 2010 or 2020 situation play out over the next year or two.
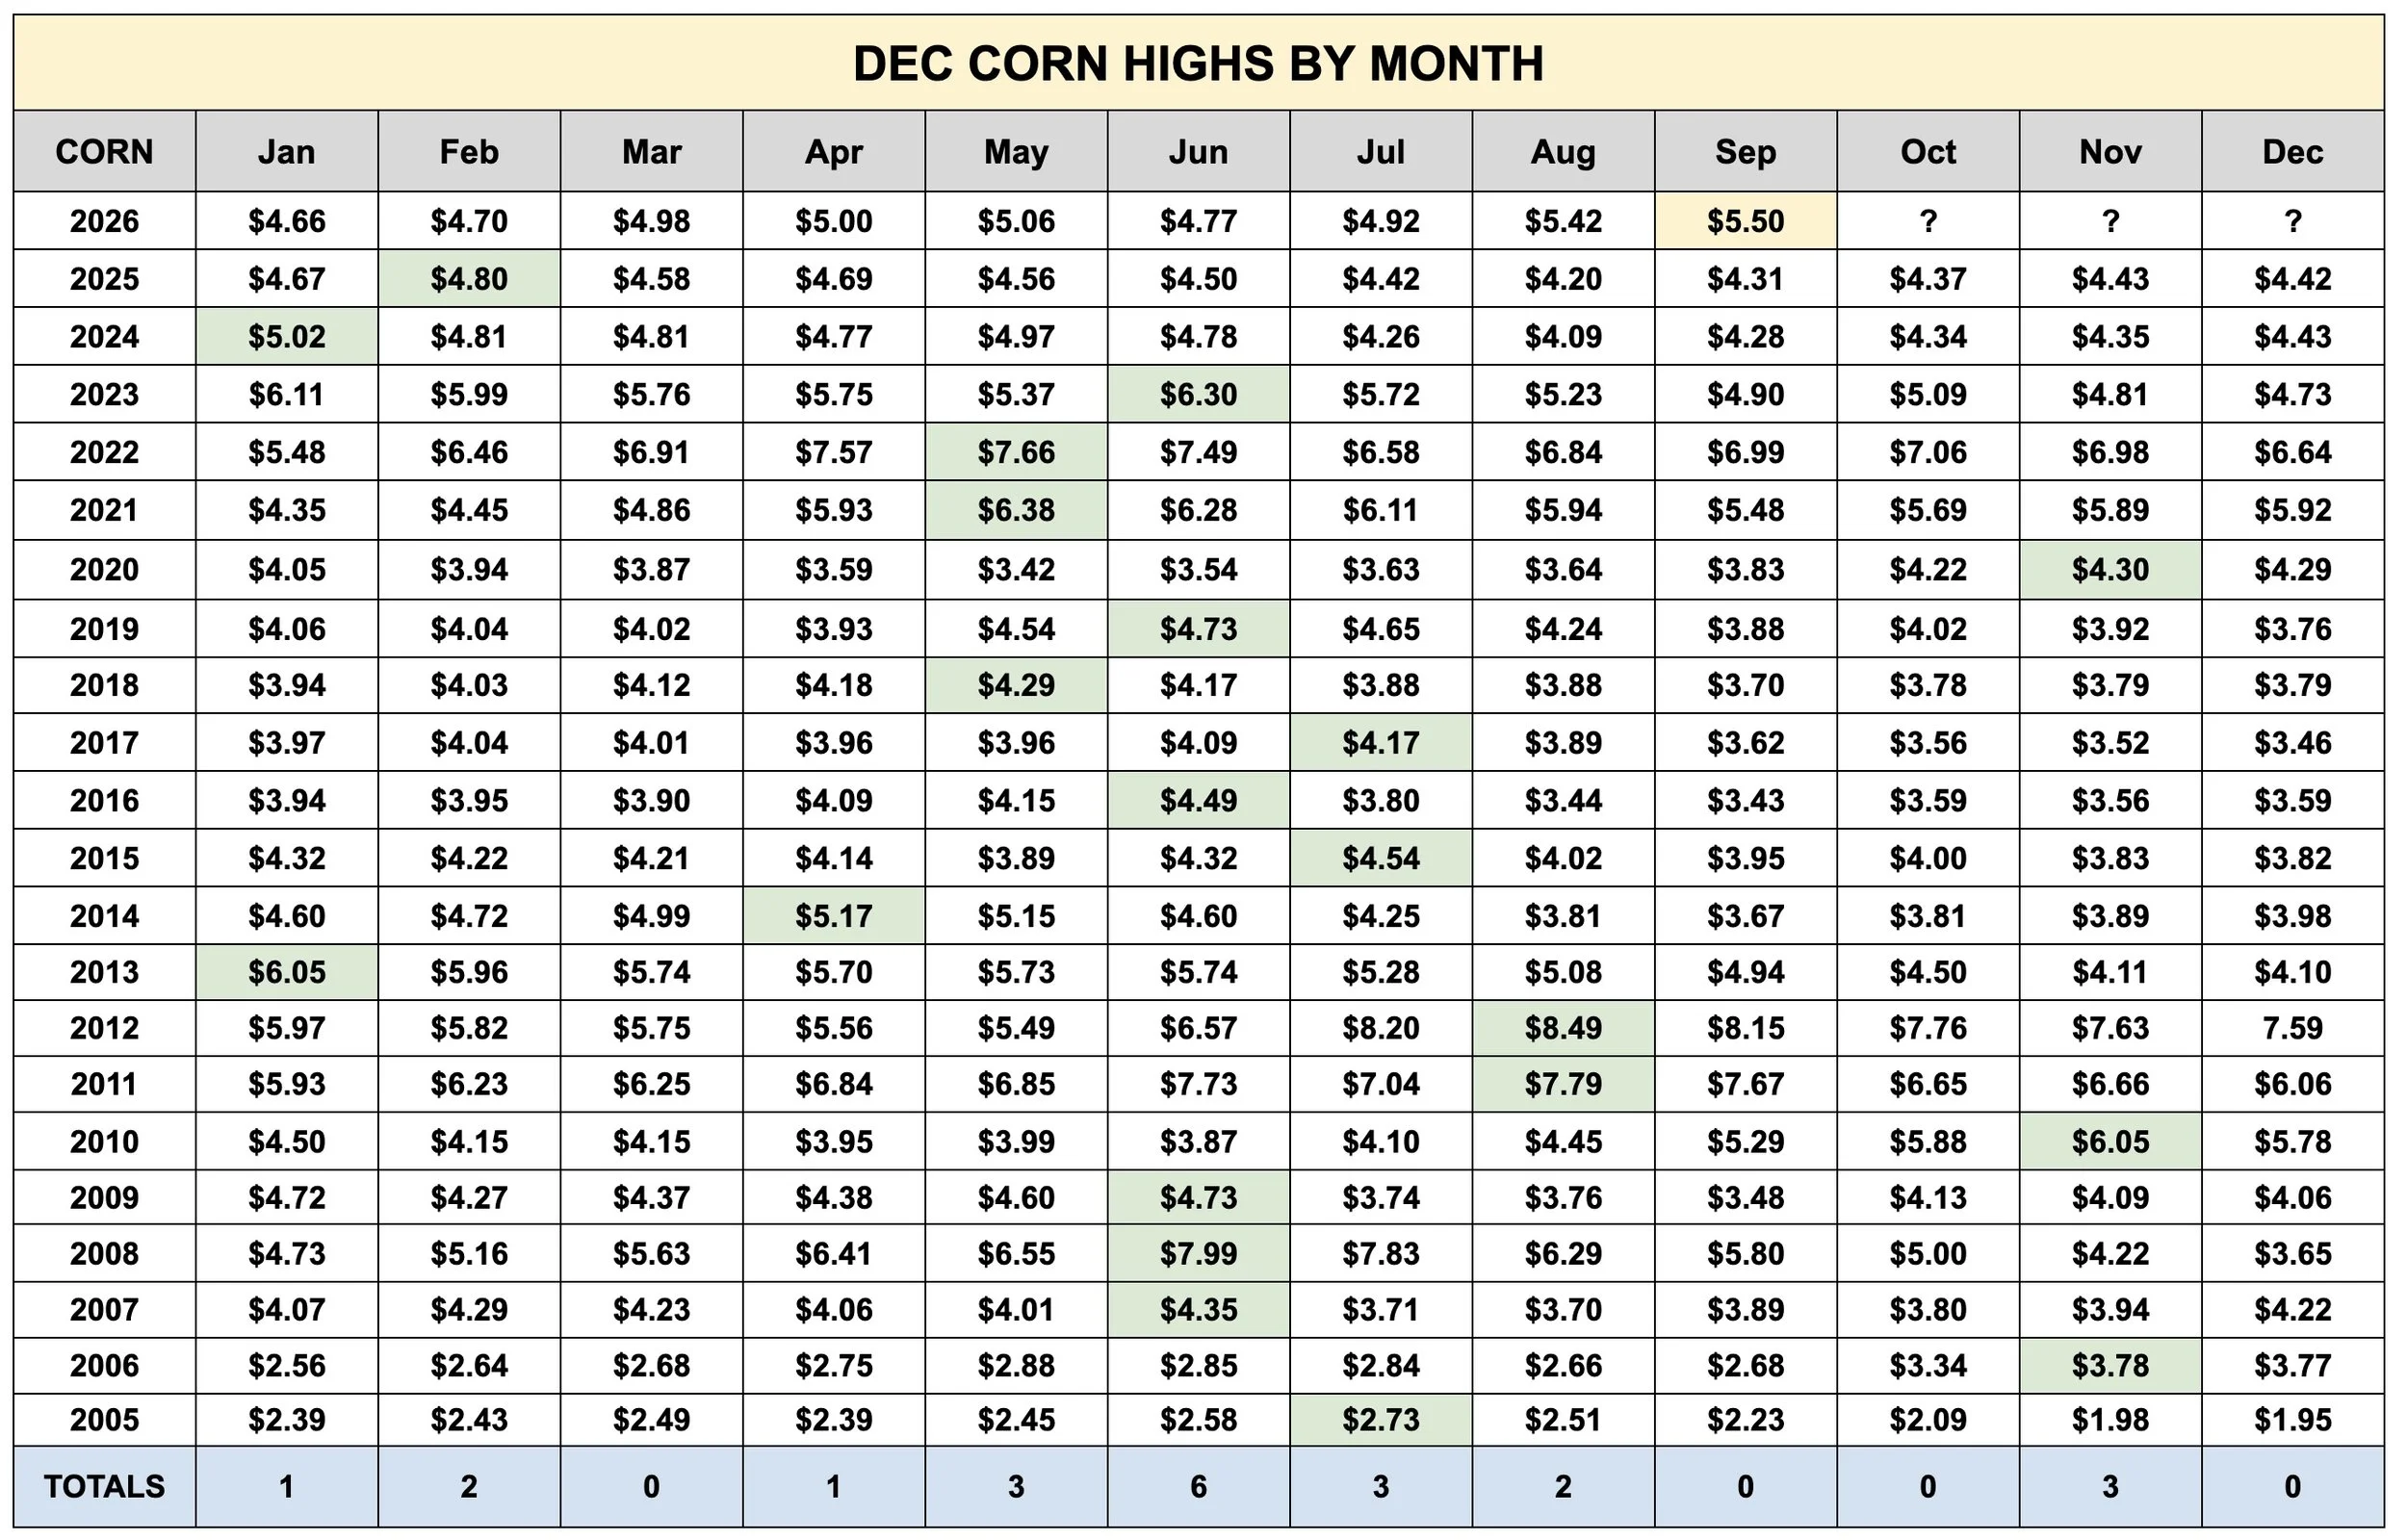
Those are the last two years we posted our highs at the end of the year.
In the last 20 years, we have never posted our high in Sep or Oct.
Could it happen this time? Sure it's always possible. Take a look at the unconventional Jan & Feb tops in 2024 and 2025.
But history favors higher.
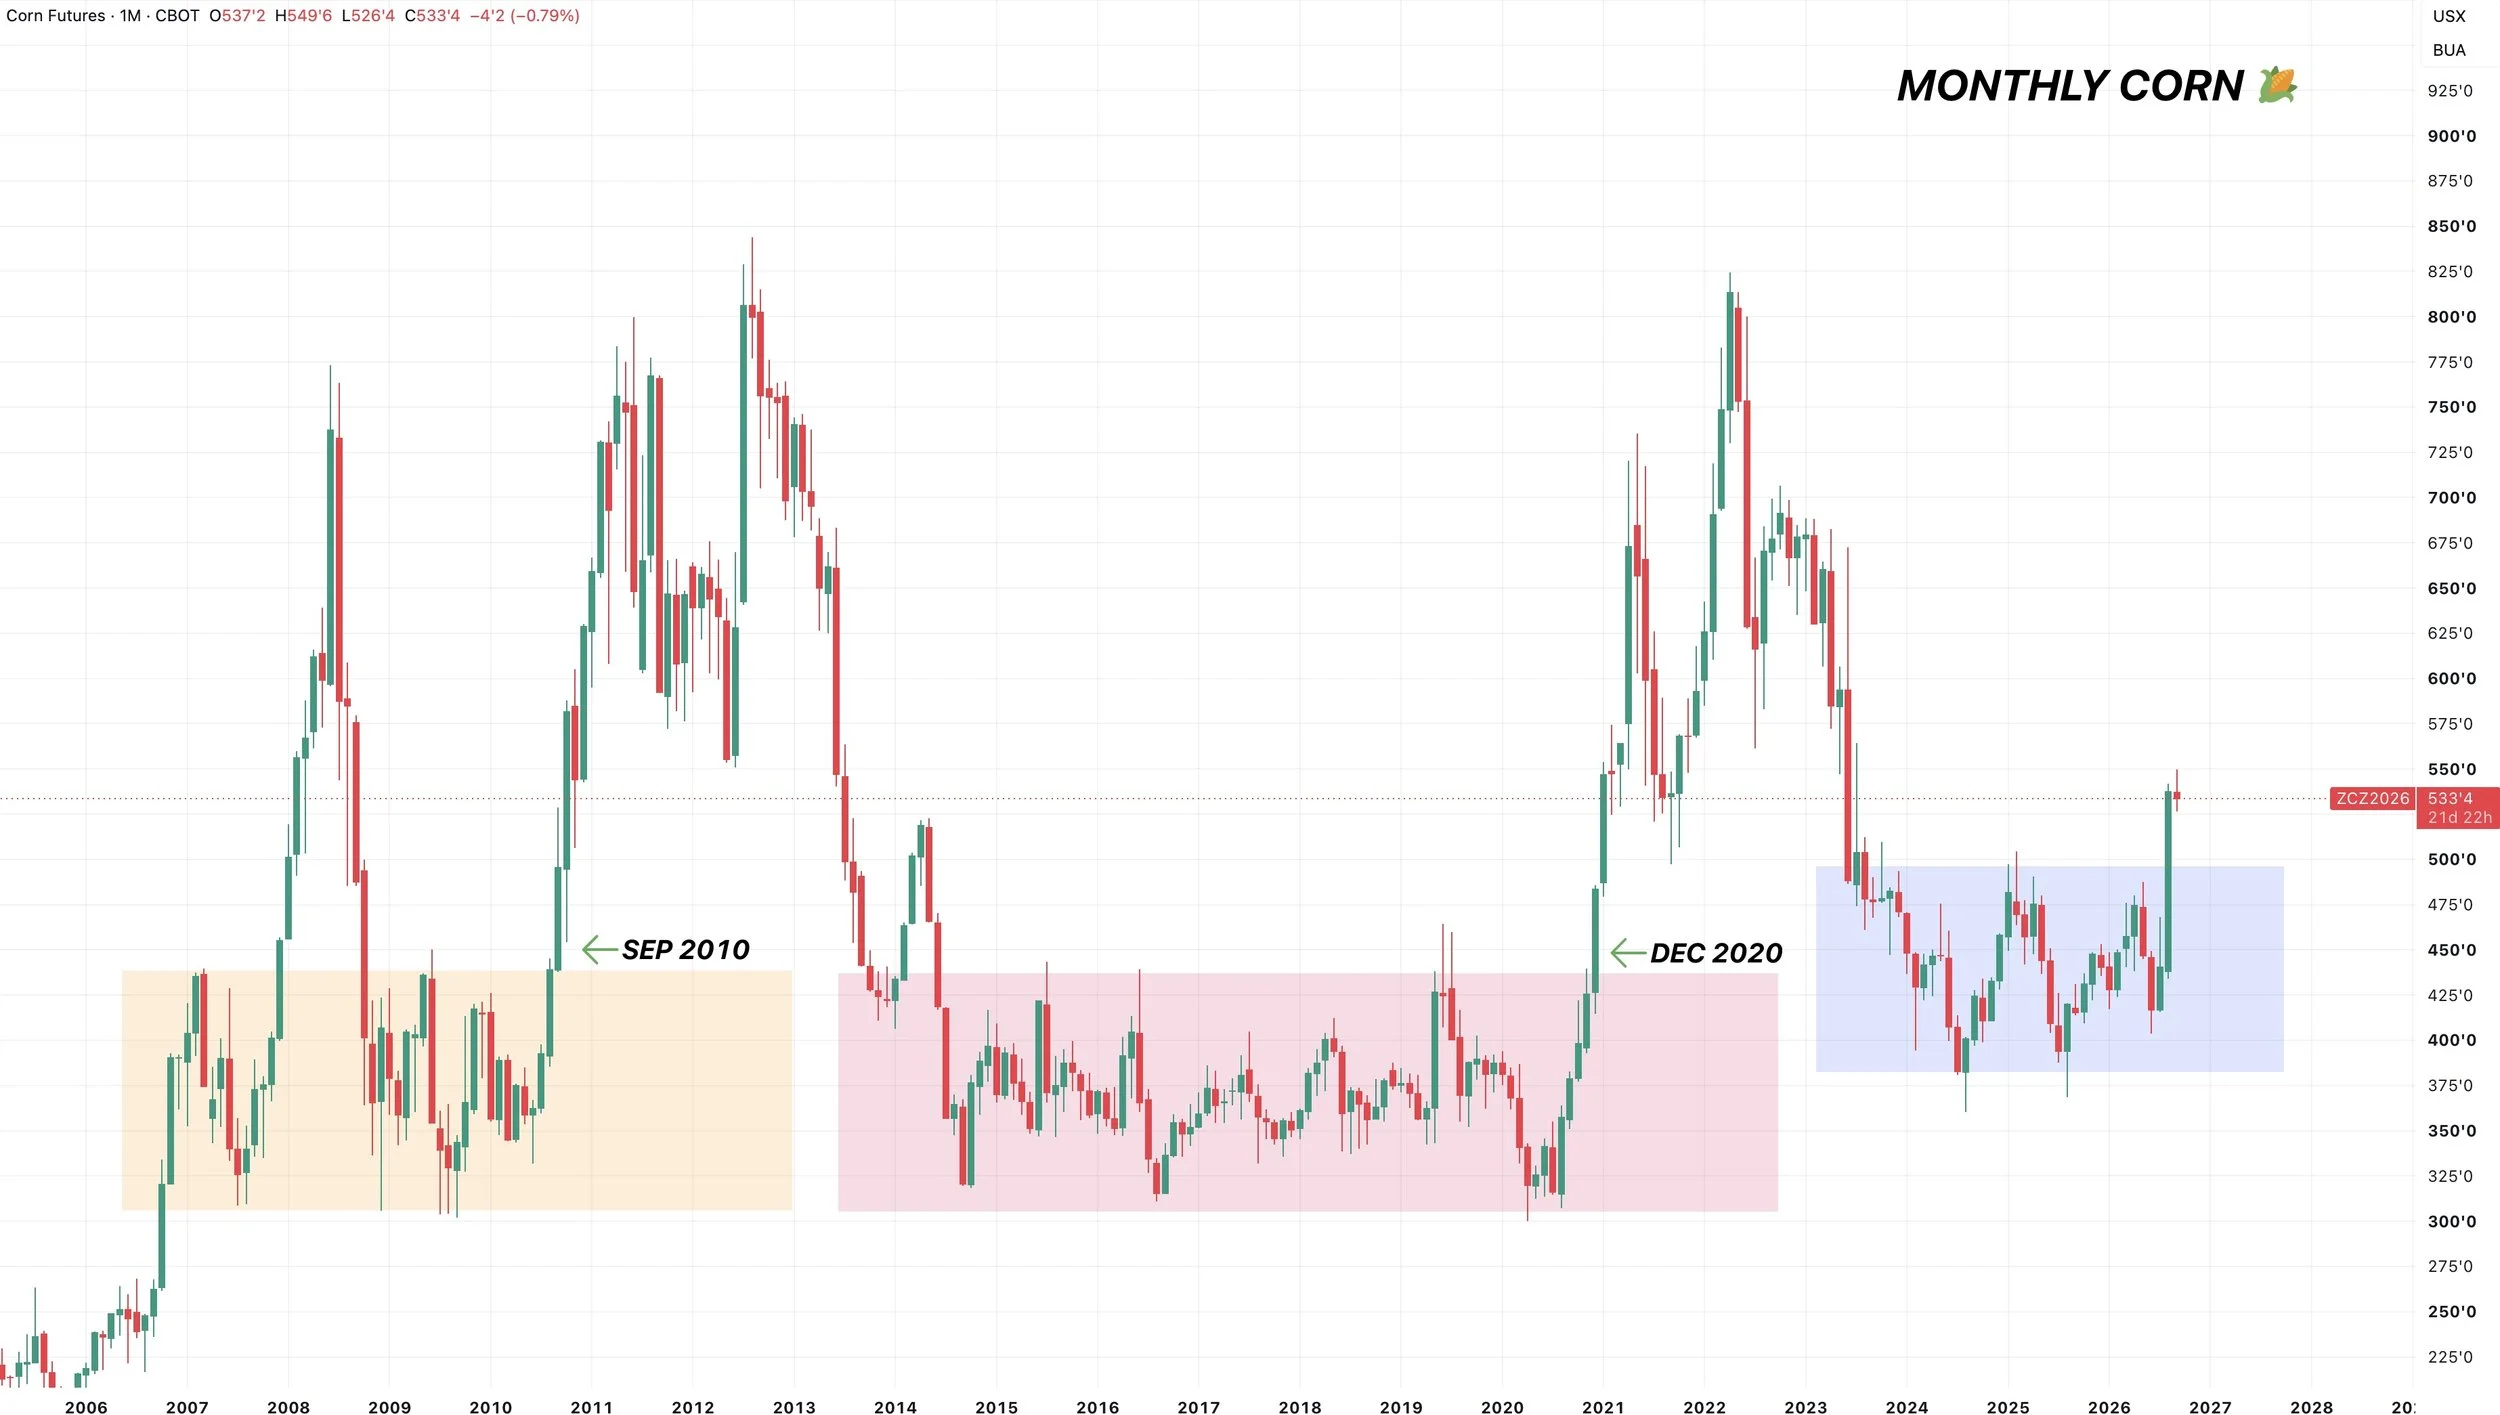
We just broke out of a multi year range.
The last two times we broke out of a multi year range?
2010 and 2020.
Both occurred at the end of the year, very similar to this year.
Seems like a big deal to me.
The long term trend has likely shifted higher in my opinion.
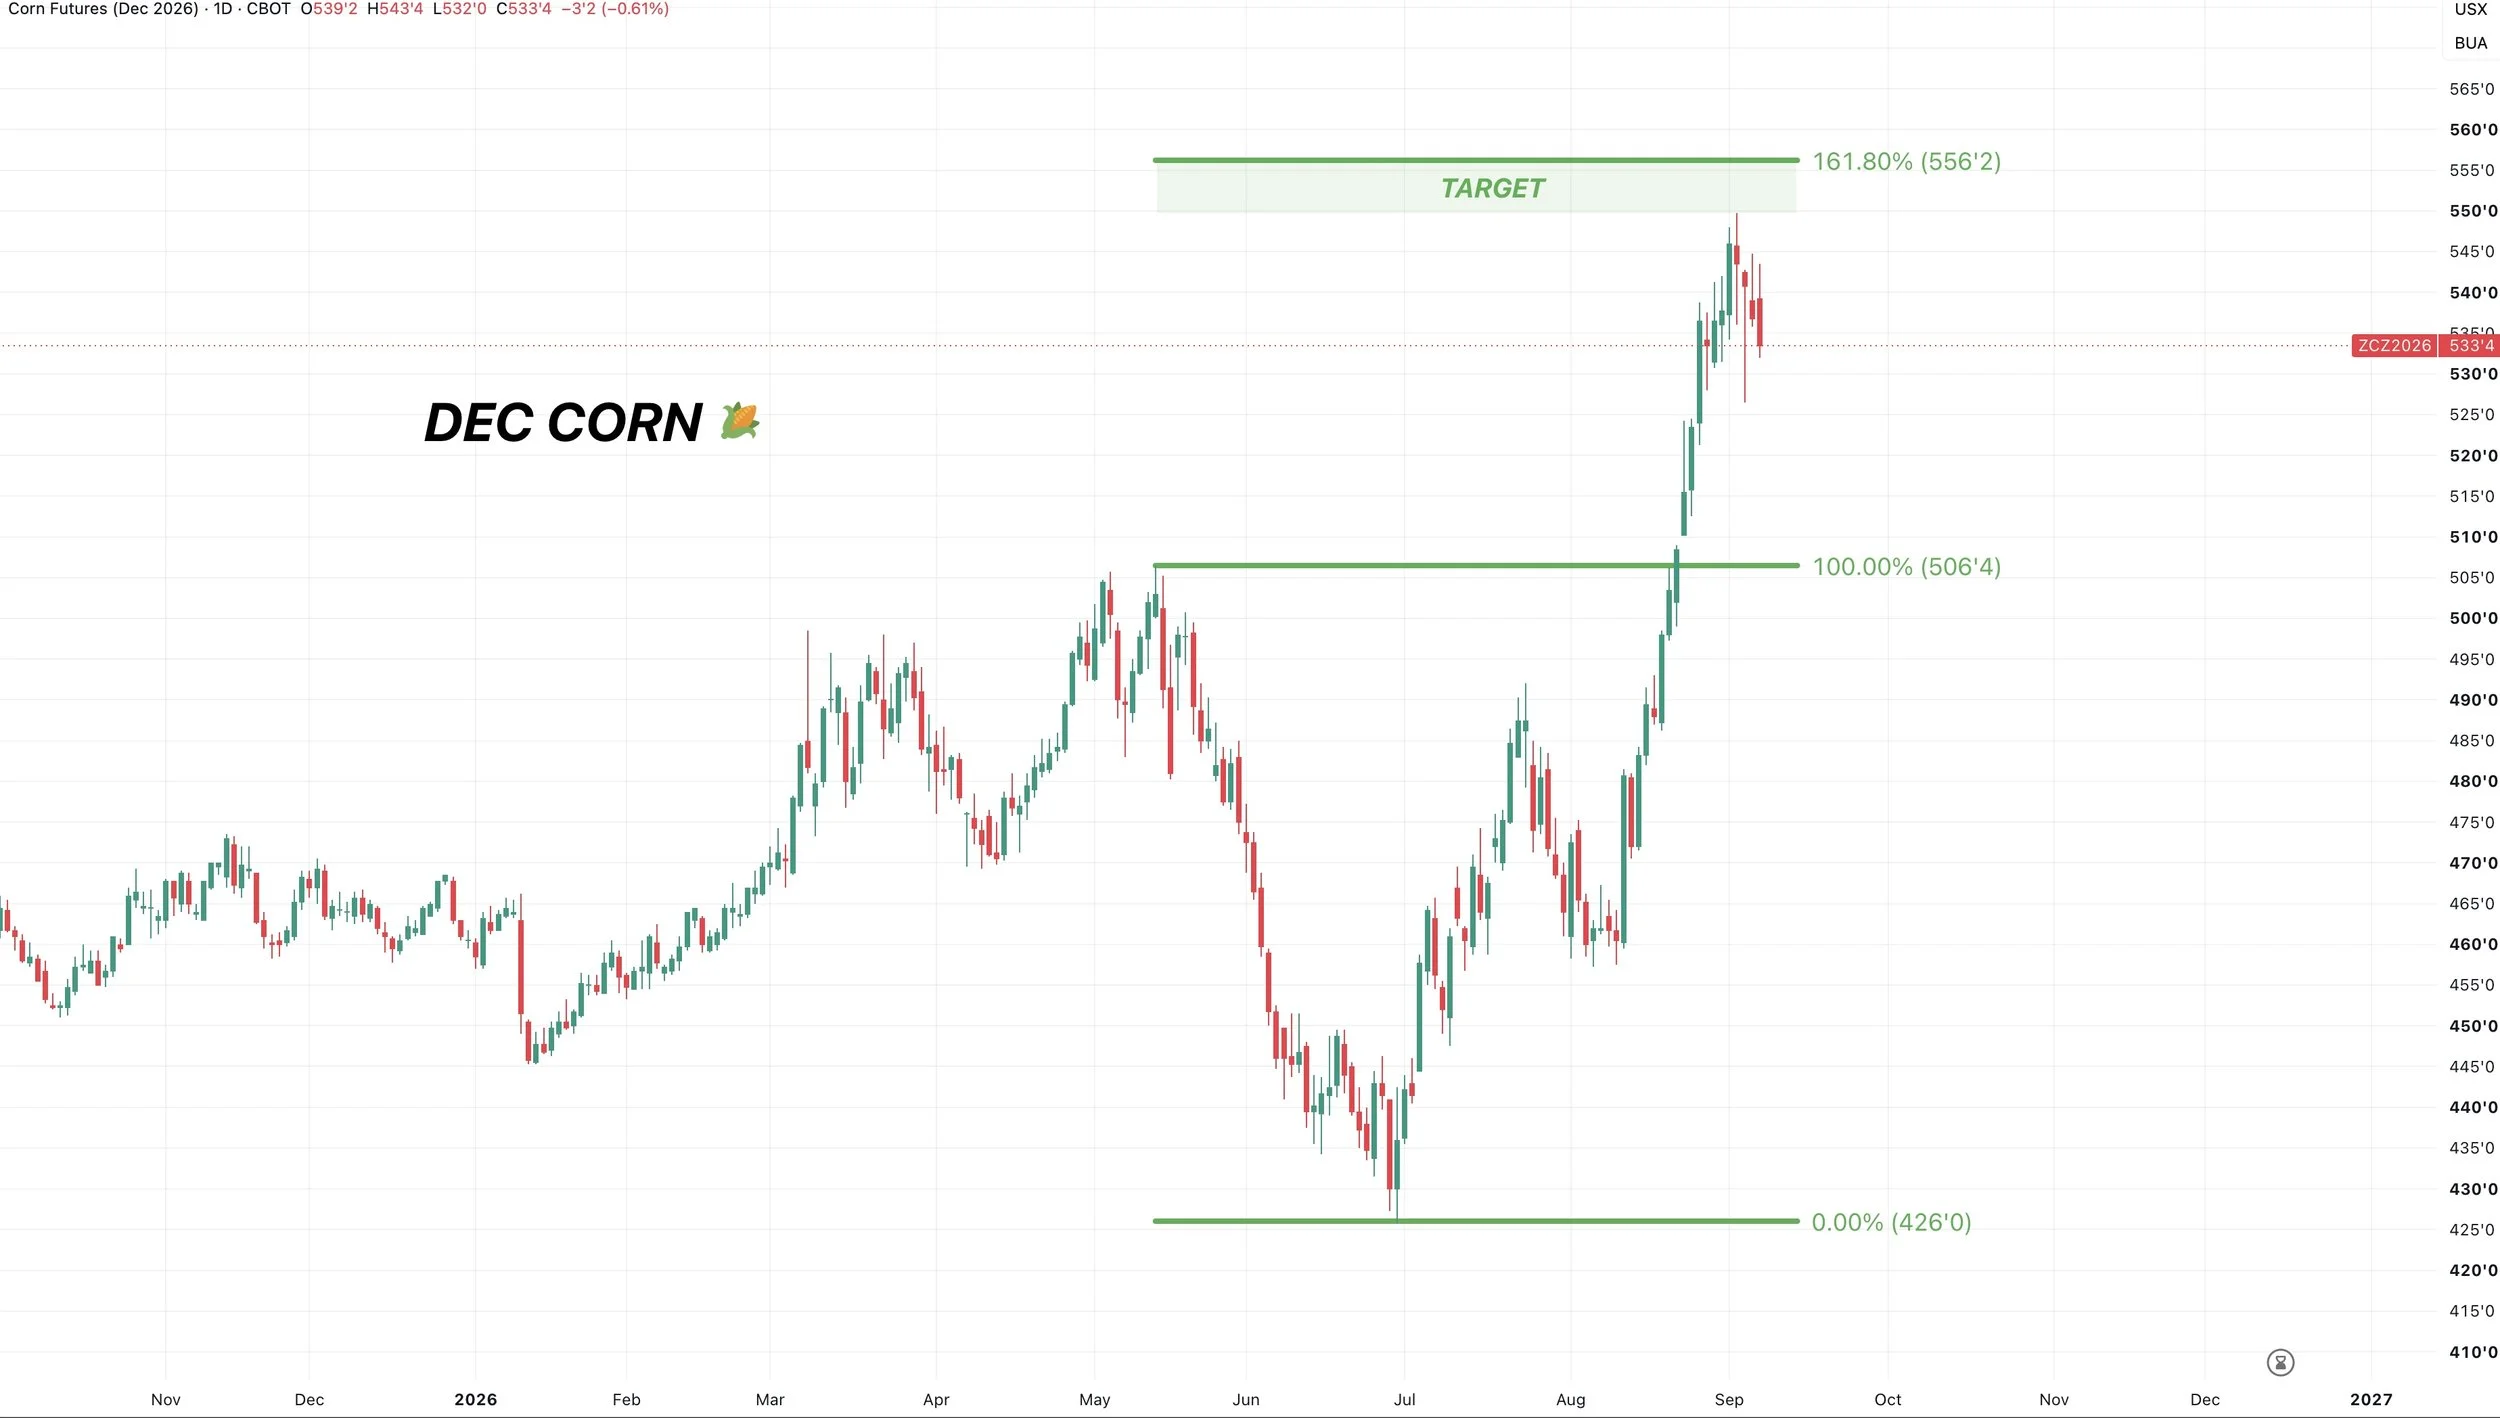
Dec Corn Chart: Long Term Bullish, Short Term Cautious
With that being said, we did send out that sell signal and hedge alert last week.
This was for those who lack storage or time. Those with the ability to stay patient, we like keeping a lot of dry powder.
Long term I am bullish. Short term I am cautious.
If you missed it: Click Here to View
Why did we have this alert?
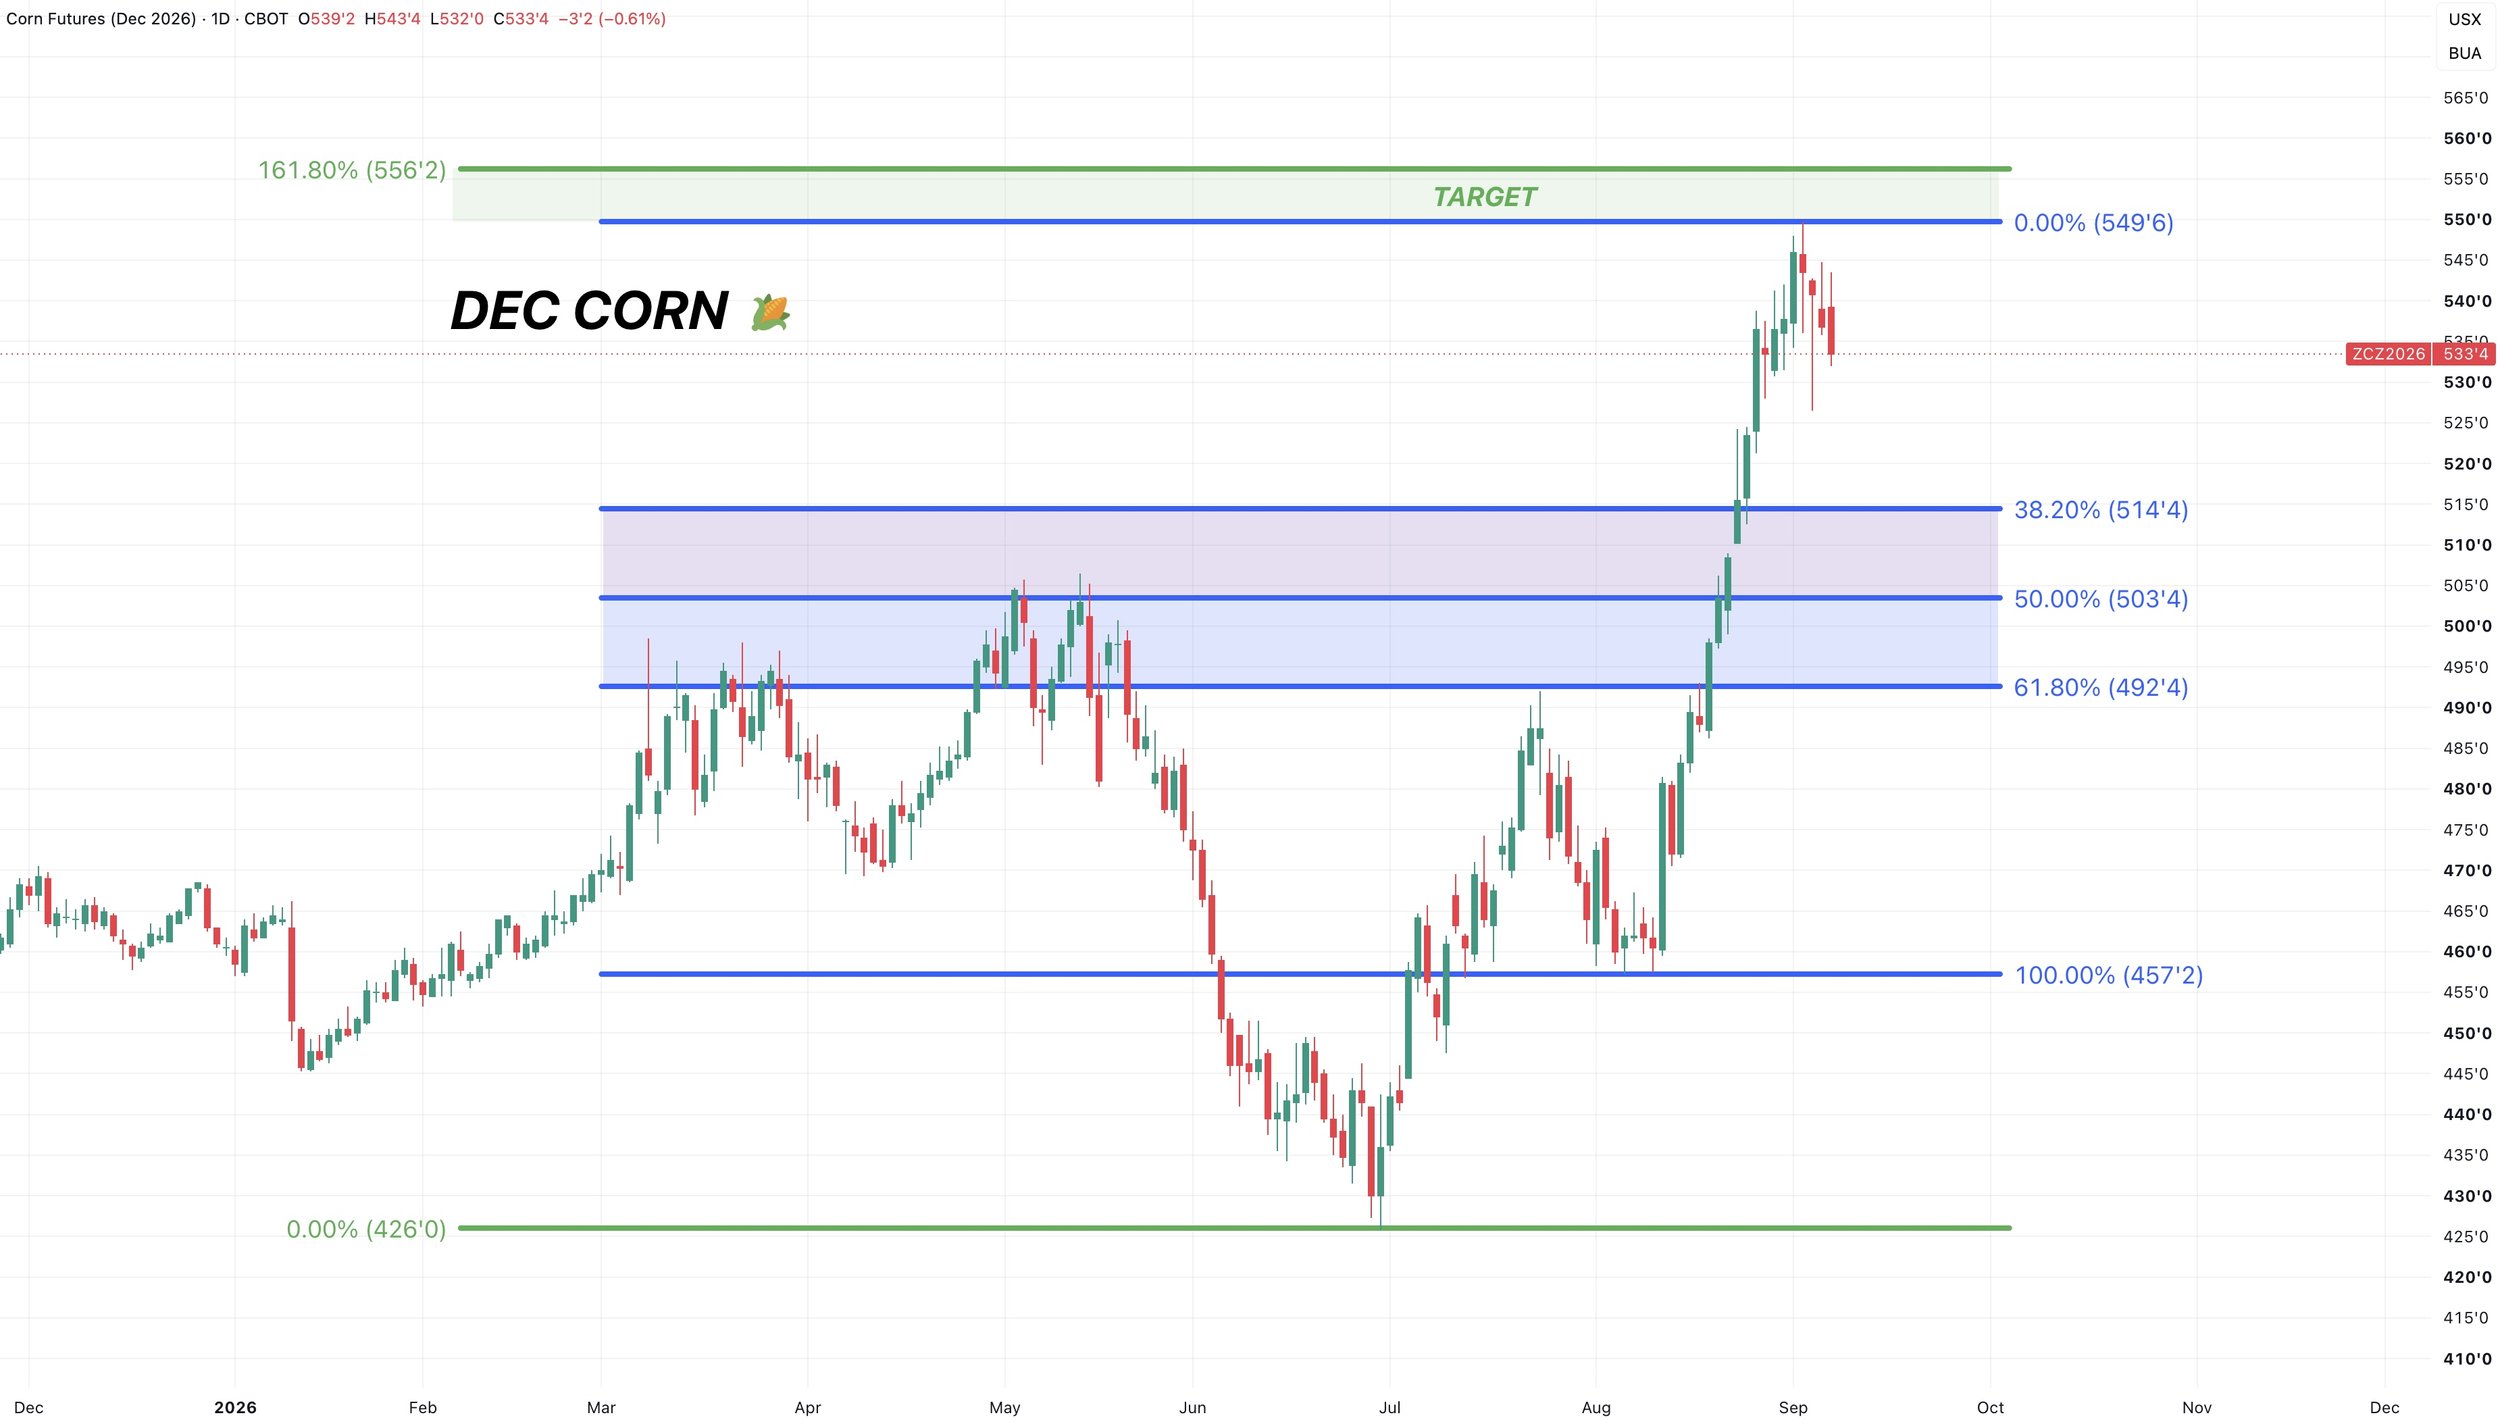
We came right up to that target box we had been talking about. We are now seeing our very first sign of possible weakness this entire run.
I think corn could very well be due for a short term pullback and breather from this rally.
There is a chance we have seen the short term top until we get closer to getting through harvest. Unless the USDA really feeds the bull later this week of course.
I am not bearish corn at all, I am just short term cautious. And I think that those with limited time and storage heading into harvest should be proactive here.
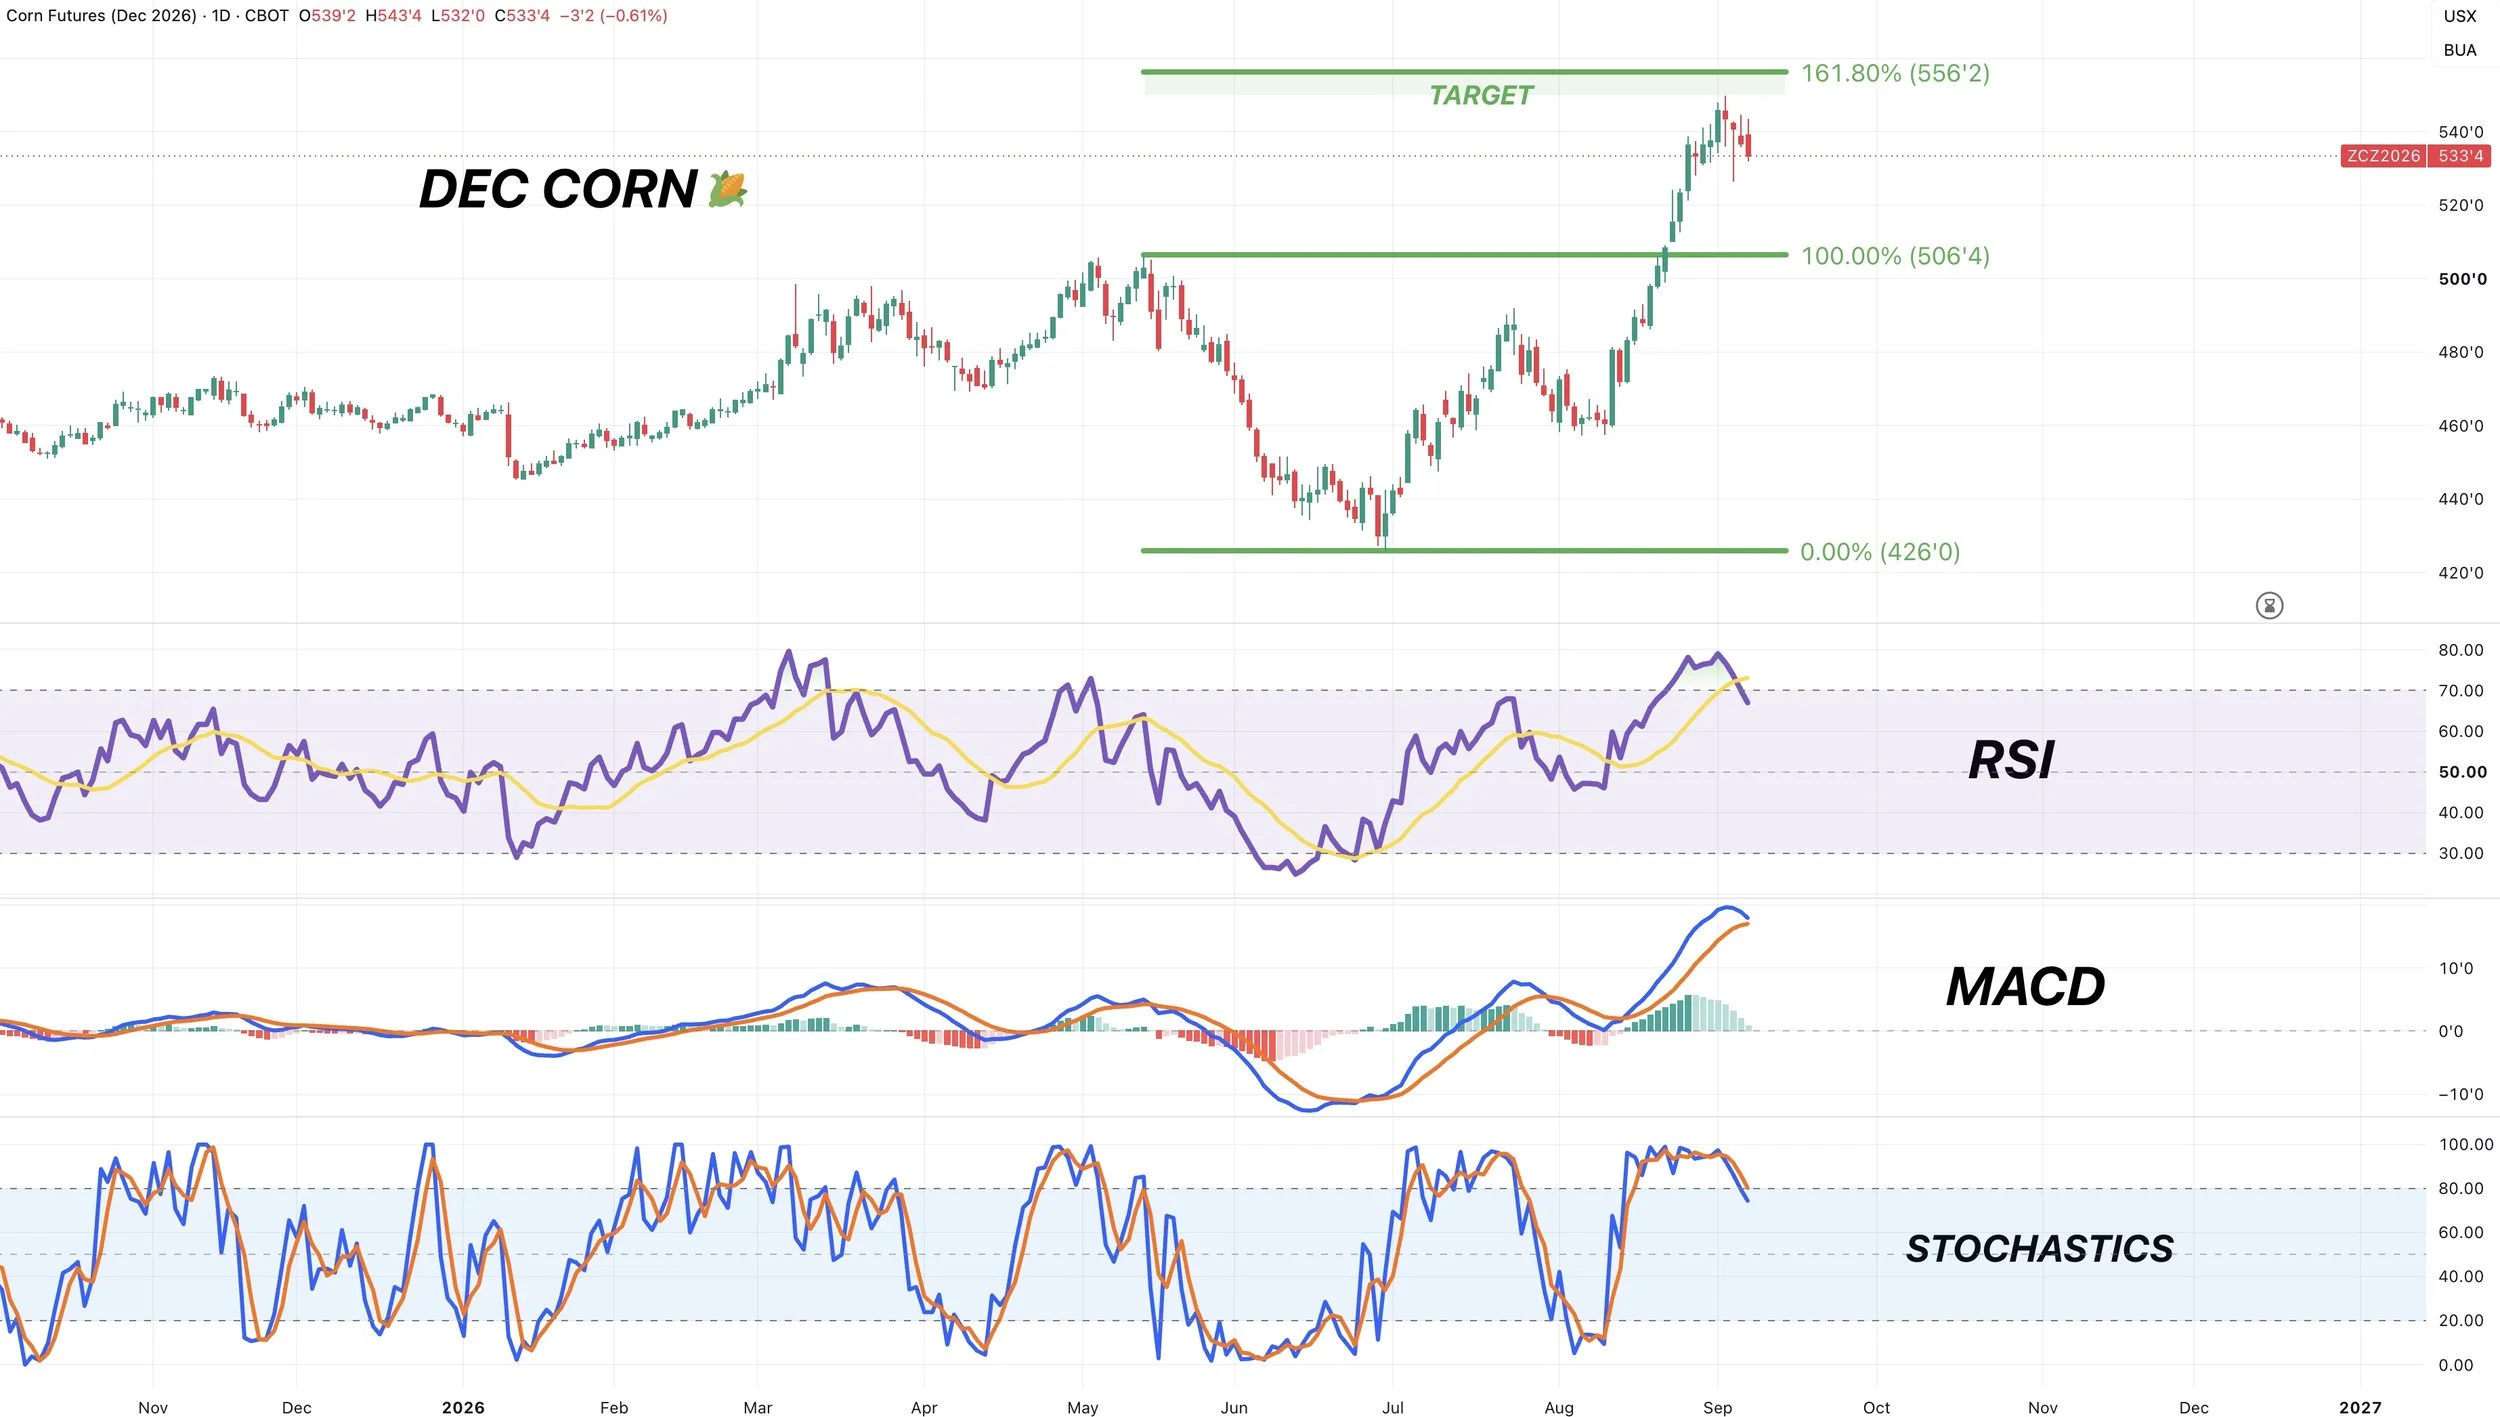
Indicators: Suggest Pullback?
Some other things to note are the indicators.
The RSI was very overbought. It's starting to cool off.
The MACD is curling lower, about to cross bearish. Suggesting the momentum could shift lower.
The stochastics are turning lower. Every big bottom in corn has almost always come with the stochastics being bottomed out.
None of these definitively mean corn has to go lower from here. Just a reason to be cautious here short term.
A pullback and to see this market cool down short term would actually be pretty healthy for this market moving forward.
Here is another indicator I have never shown before.
This is a bullish and bearish indicator.
Red candle = Bullish trend (buy signal)
Dark blue candle = Bullish continues
Yellow candle = Bearish trend (sell signal)
Light blue = Bearish continues
Like every indicator, it is not perfect.
However, today we saw our first bearish yellow candle since right before that early August pullback.
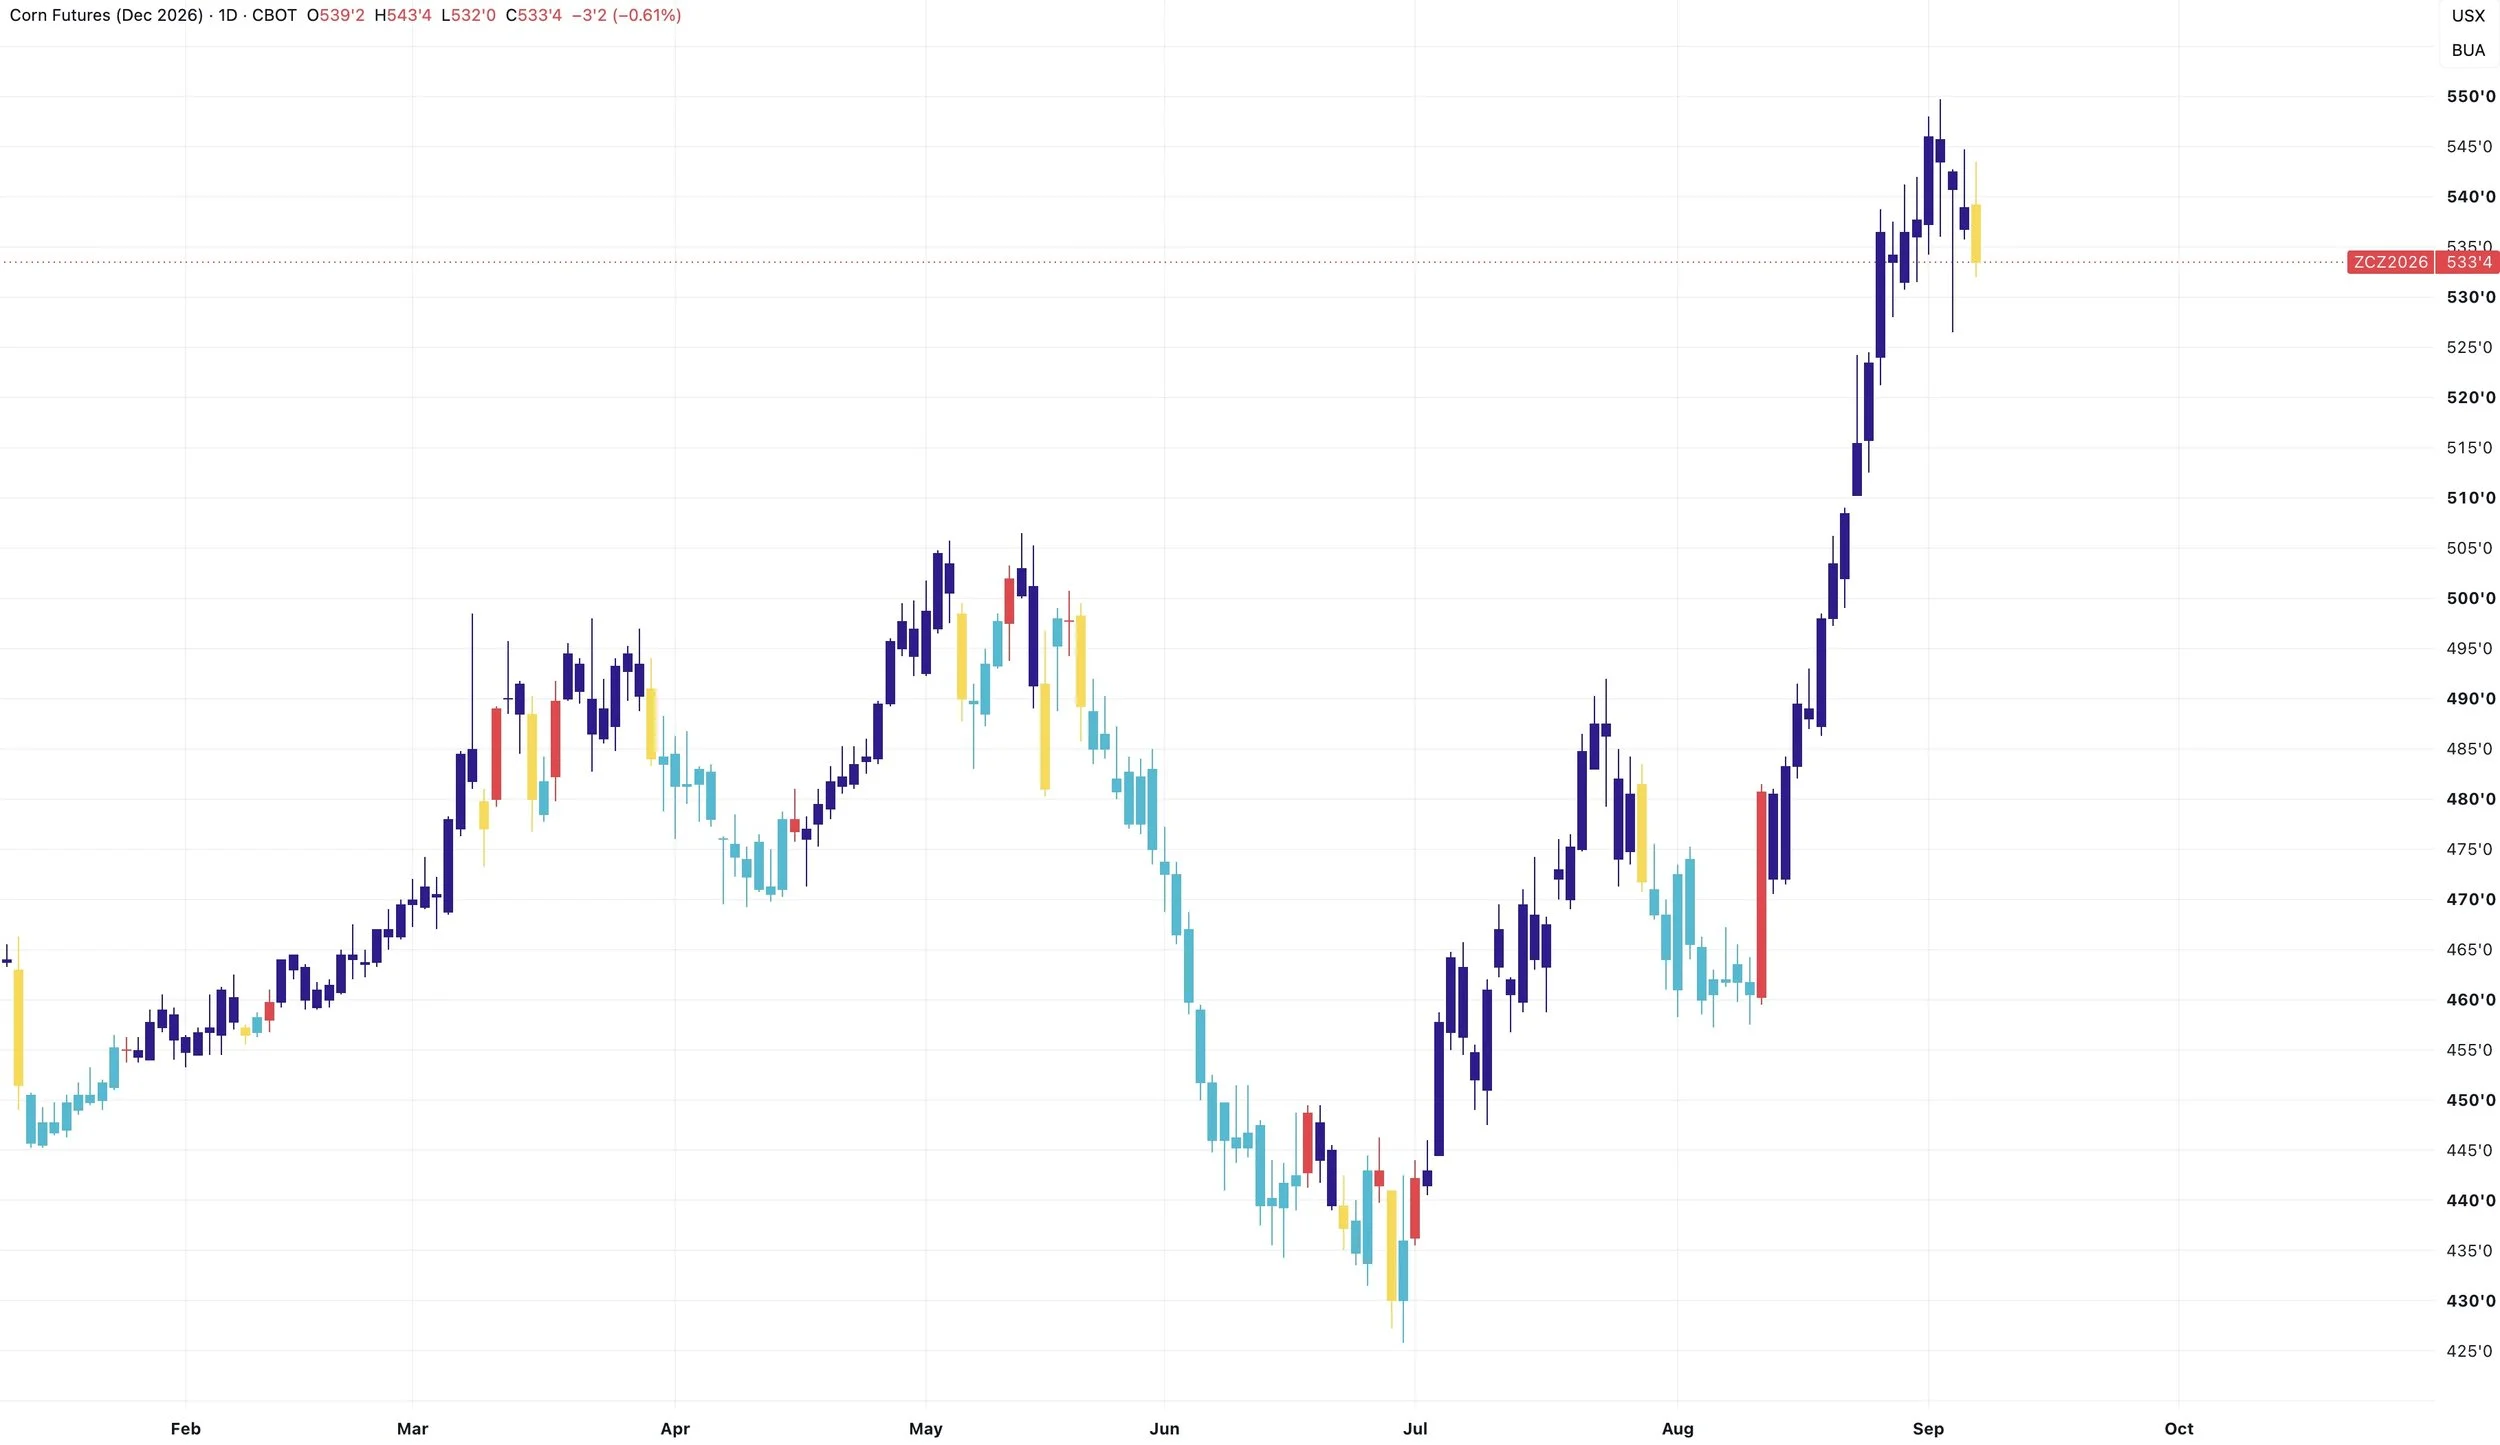
The biggest thing to watch short term is last Thursday's lows. If we break that, we could get a leg lower.
If we break that, I am looking at a bottom potentially around the 50% retracement at the $5.04 range.
That would also give us a re-test of those old May highs. Turning the prior ceiling into a new floor.
We of course do not "have" to pull back that far. But if we do, that is the area I am watching. As that area would offer a good opportunity for upside exposure into the later part of the year.
A lot will ride on the USDA Friday as well.
Weekly Chart:
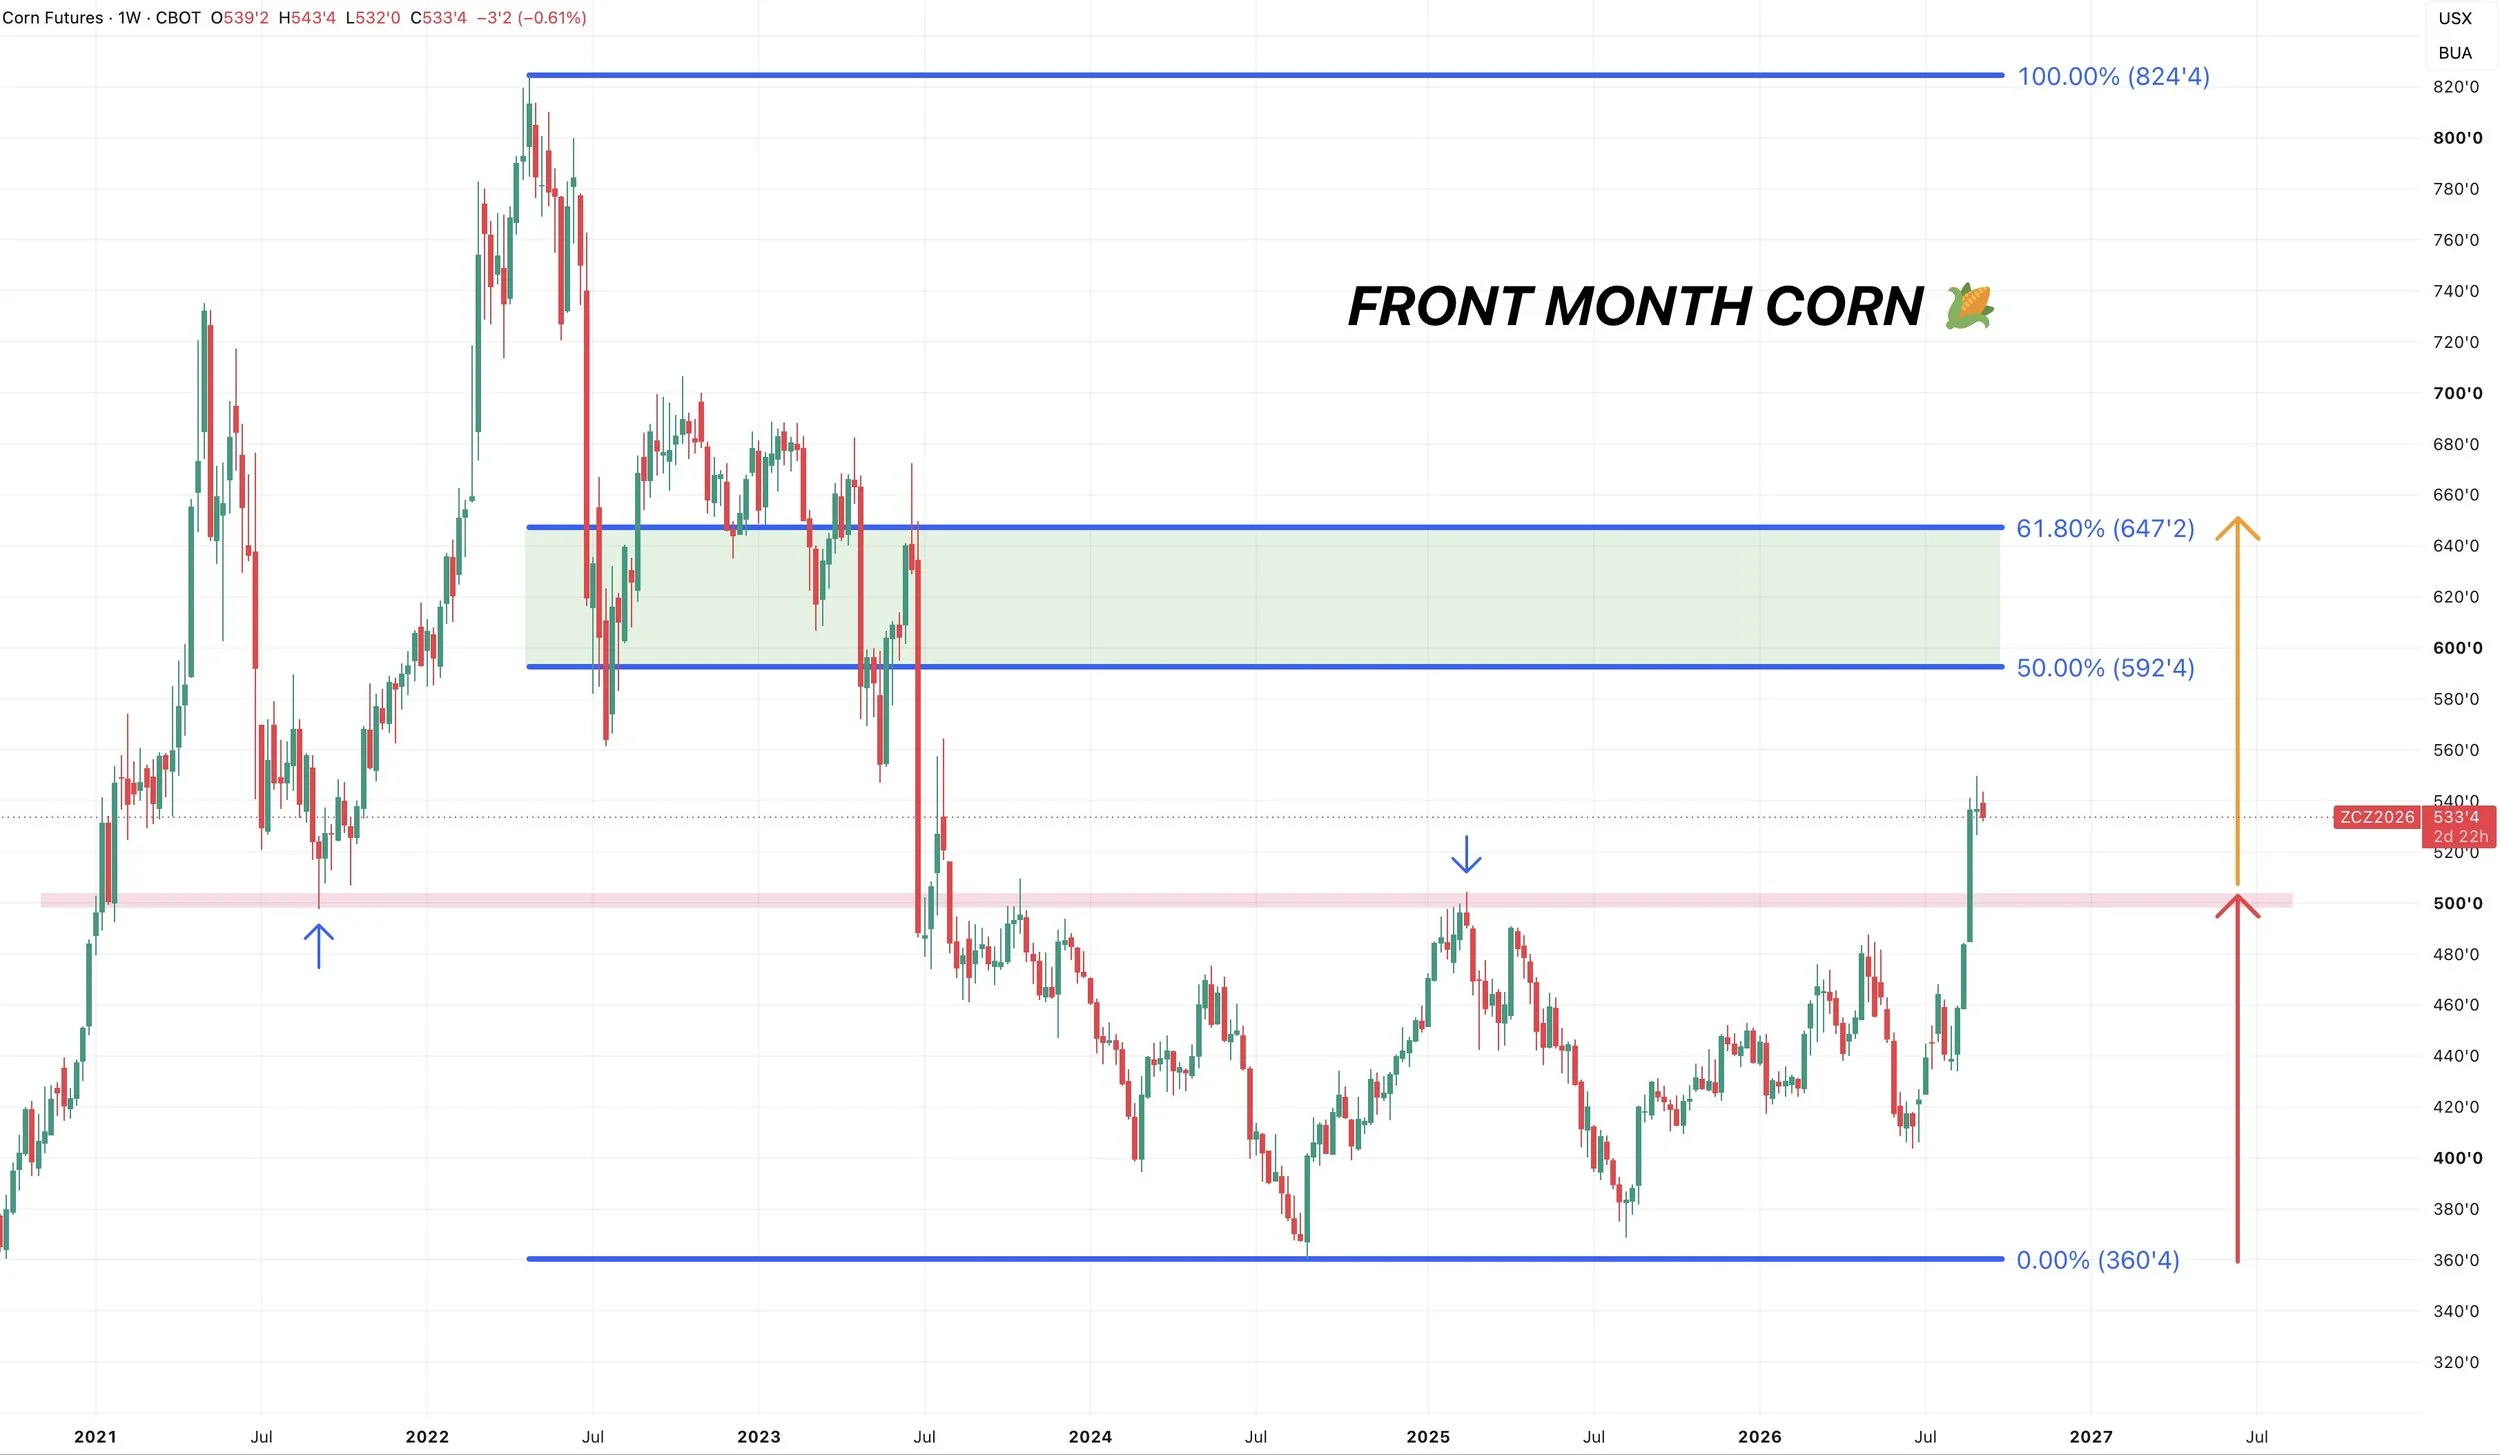
The weekly chart is still very bullish.
Whether we go lower from here first or not, I ultimately think there is a good chance we go a lot higher long term.
A long term target I have my eyes on is that $6.50 range.
Not only would that claw back 61.8% of the 2022 highs.
But we've been trapped in a $1.44 range for the last 3 years. We finally broke out of that range.
If you add that $1.44 range on top of the point of breakout, you also get $6.50
Soybeans
China Keeps Buying:
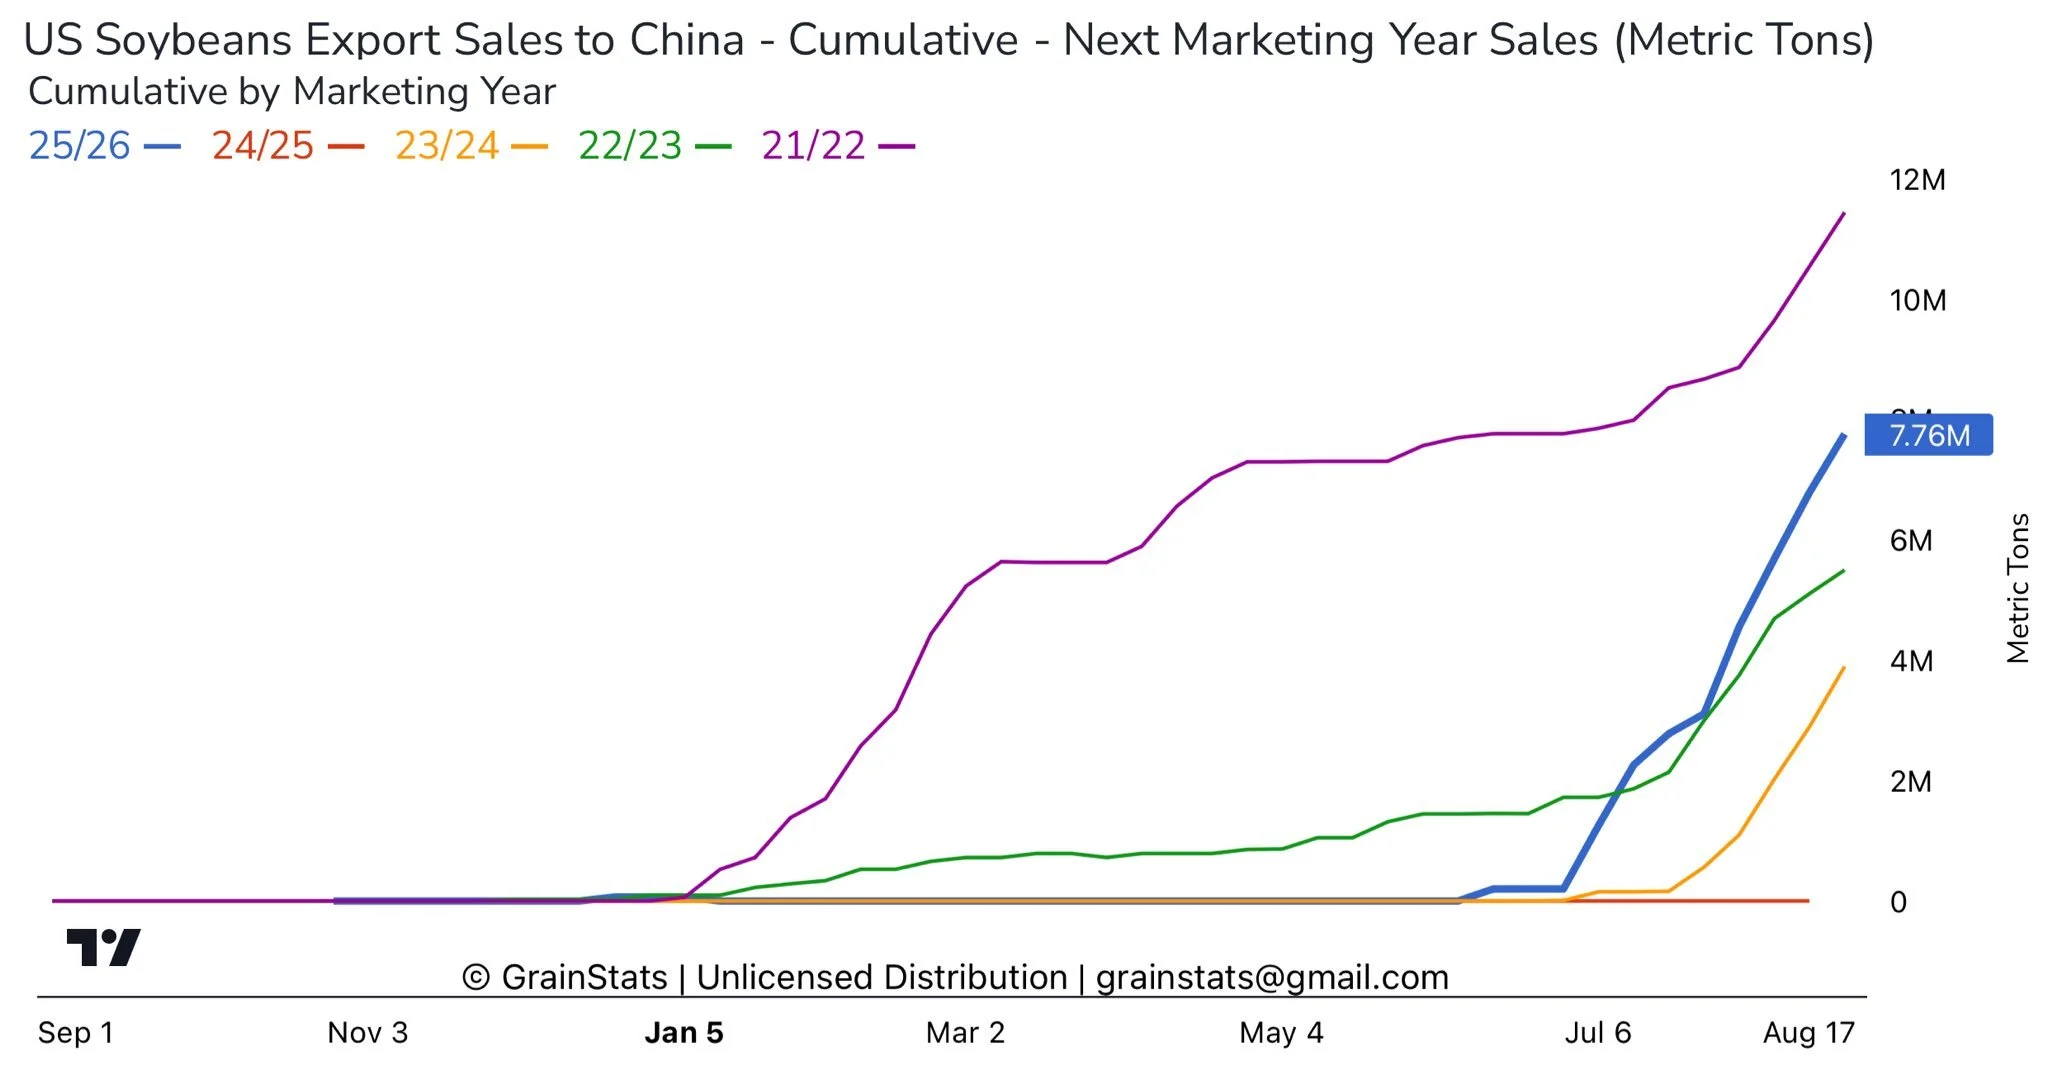
Our soybean export pace is currently double what it was last year.
We continue to see China step in almost daily to buy soybeans.
They've already a large chunk of what they agreed to buy.
They are buying at their fastest pace in 4 years and I see no reason for them to stop.
(Chart Credit: @GrainStats on X)
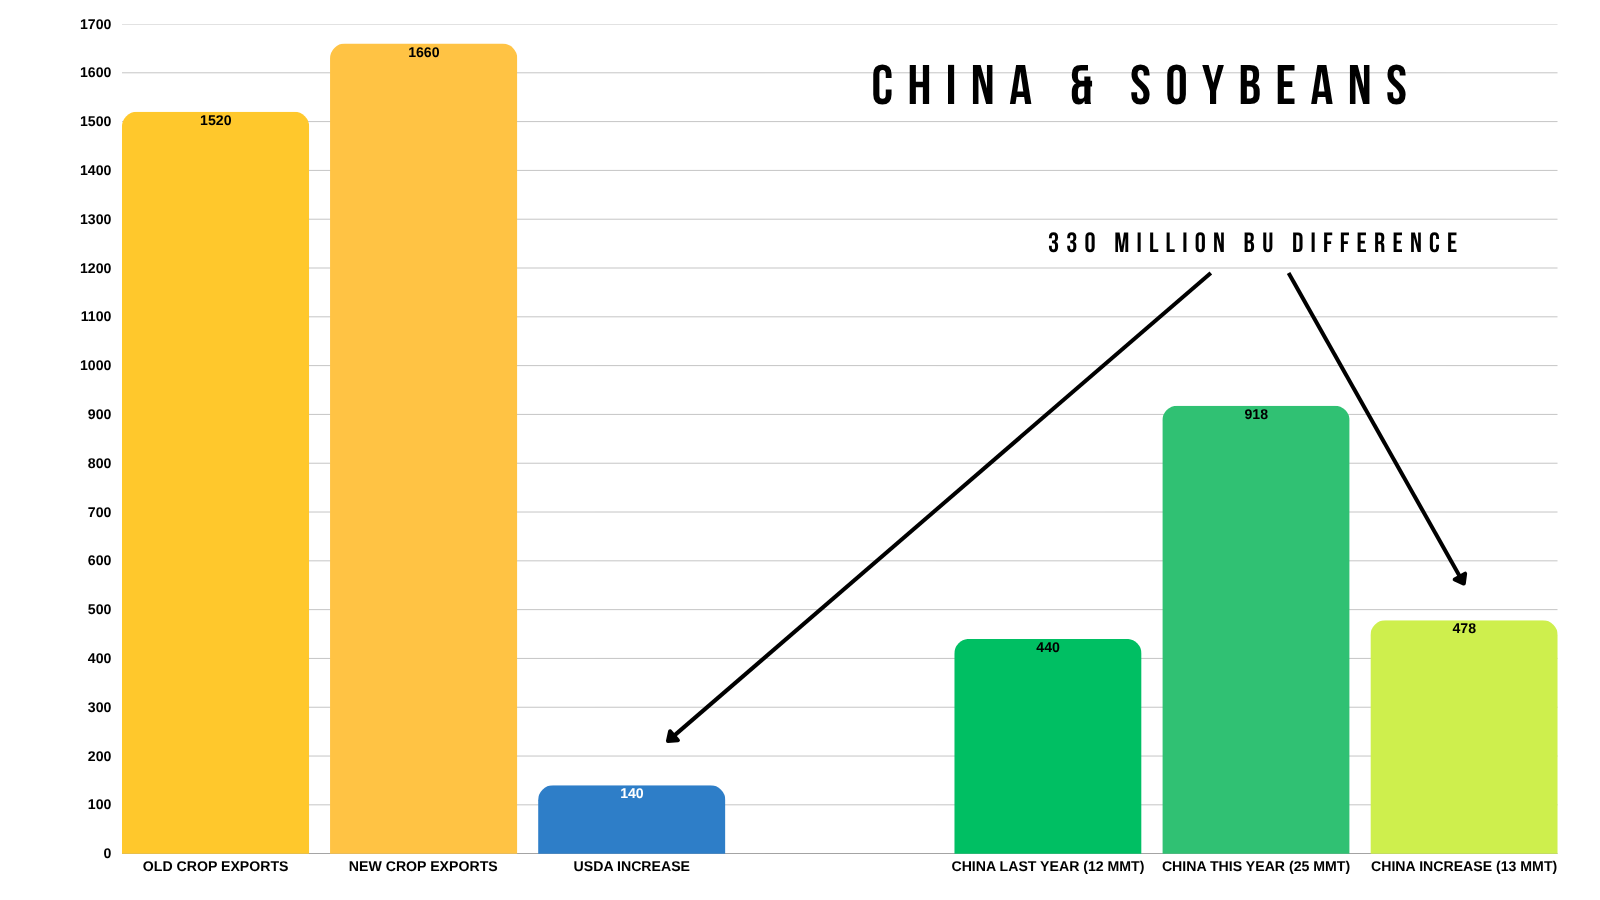
We talked about this quiet often in the past.. but what happens if they buy what they agreed to buy?
We simply do not have the supply to give them unless we ration demand to non-China destinations.
The USDA only expects exports to be up 140 million vs last year.
China agreed to buy 480 million more.
How do you ration demand? Usually higher prices.
This is one of the biggest bullish factors for soybeans.
One thing to note is that Trump is scheduled to meet with China later this month on September 24th. So we will have to see what that brings if anything.
I do not foresee it being a big negative factor. But the market could be disappointed if the meeting doesn’t provide any fresh things for bulls to chew on.
Brazil & World Story:
There really isn’t anything new in the soybean market until we get that USDA report.
We've got Brazil weather season right around the corner. So that is going to have a big impact on things the next few months.
Along with a Super El Niño that historically leads to some dryness in Brazil
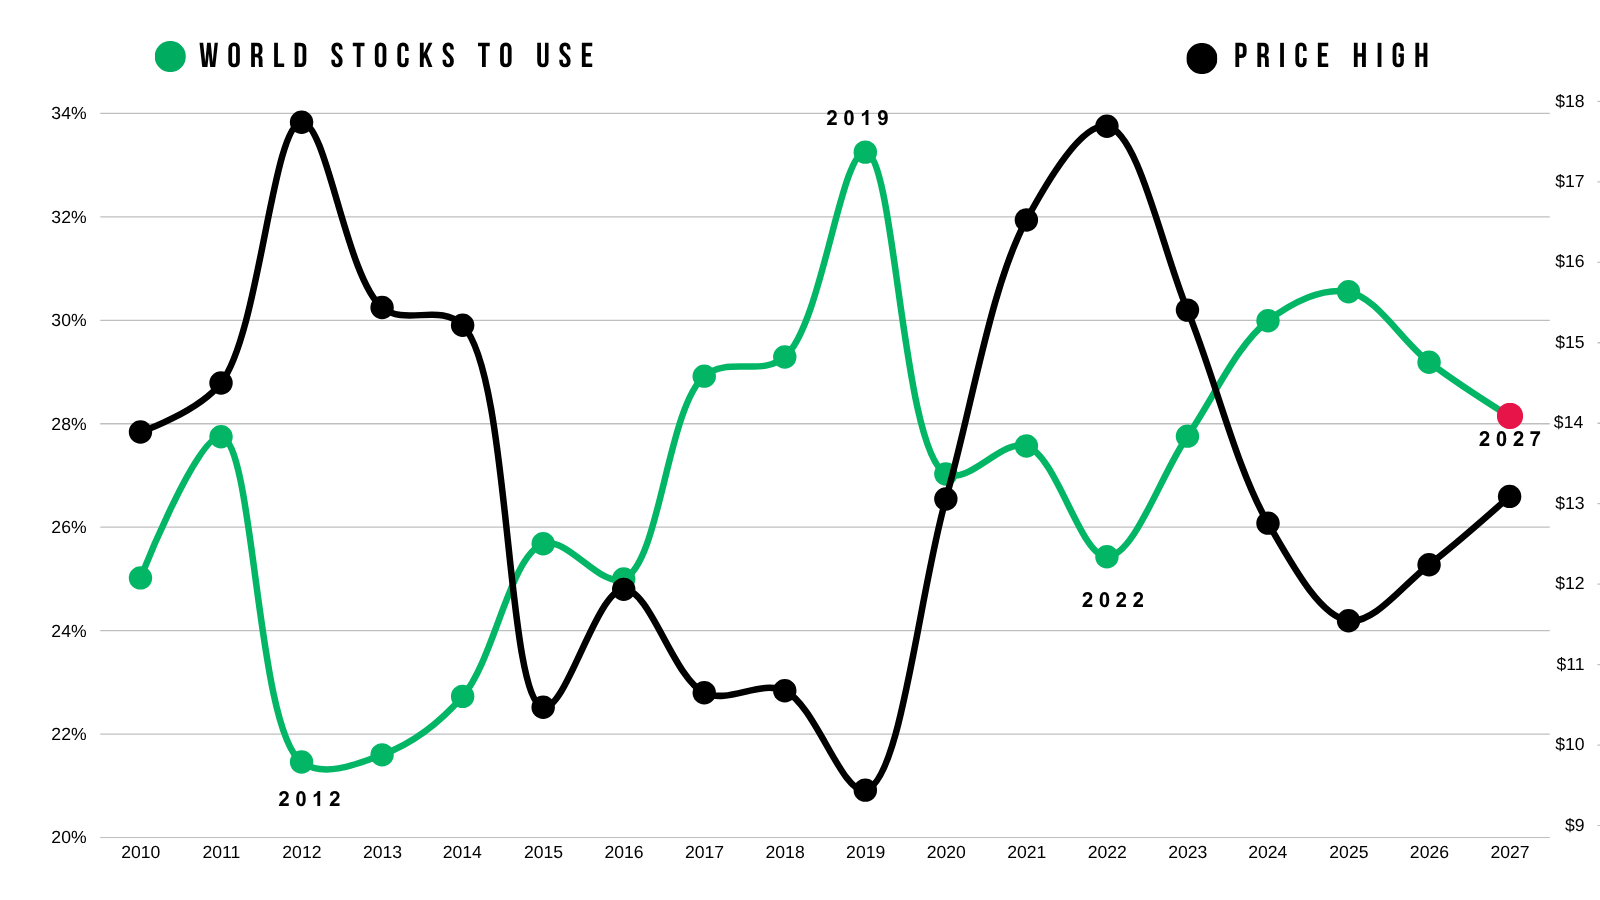
Even with record crops out of both the US and Brazil the last several years.. the world situation has continued to get tighter and tighter.
What do you think happens if the world's biggest producer runs into an issue with the Super El Niño?
The world situation has a very high correlation to soybean prices.
It's already at multi-year lows. Hence, prices are at multi-year highs.
The US soybean yield isn’t as hot of a topic as the corn debate.
Even if we have a great soybean crop here in the US, the story in soybeans isn’t about a slip in US production.
It's about the record crush.
The improvements in exports.
China buying at their fasted pace in 4 years.
The world situation is getting tighter despite more supply globally. Because demand is that solid.
This is a demand led market. Which is why I think soybeans have plenty of potential long term.
Nov Beans Chart:
Despite the long term potential, like in corn we sent out a sell signal and hedge alert last week.
For those who lack storage or need to do something, this is the area we'd like to consider doing something. If you have plenty of time on your hands, the last thing we want to do is get oversold.
If you missed it: Click Here to View Alert
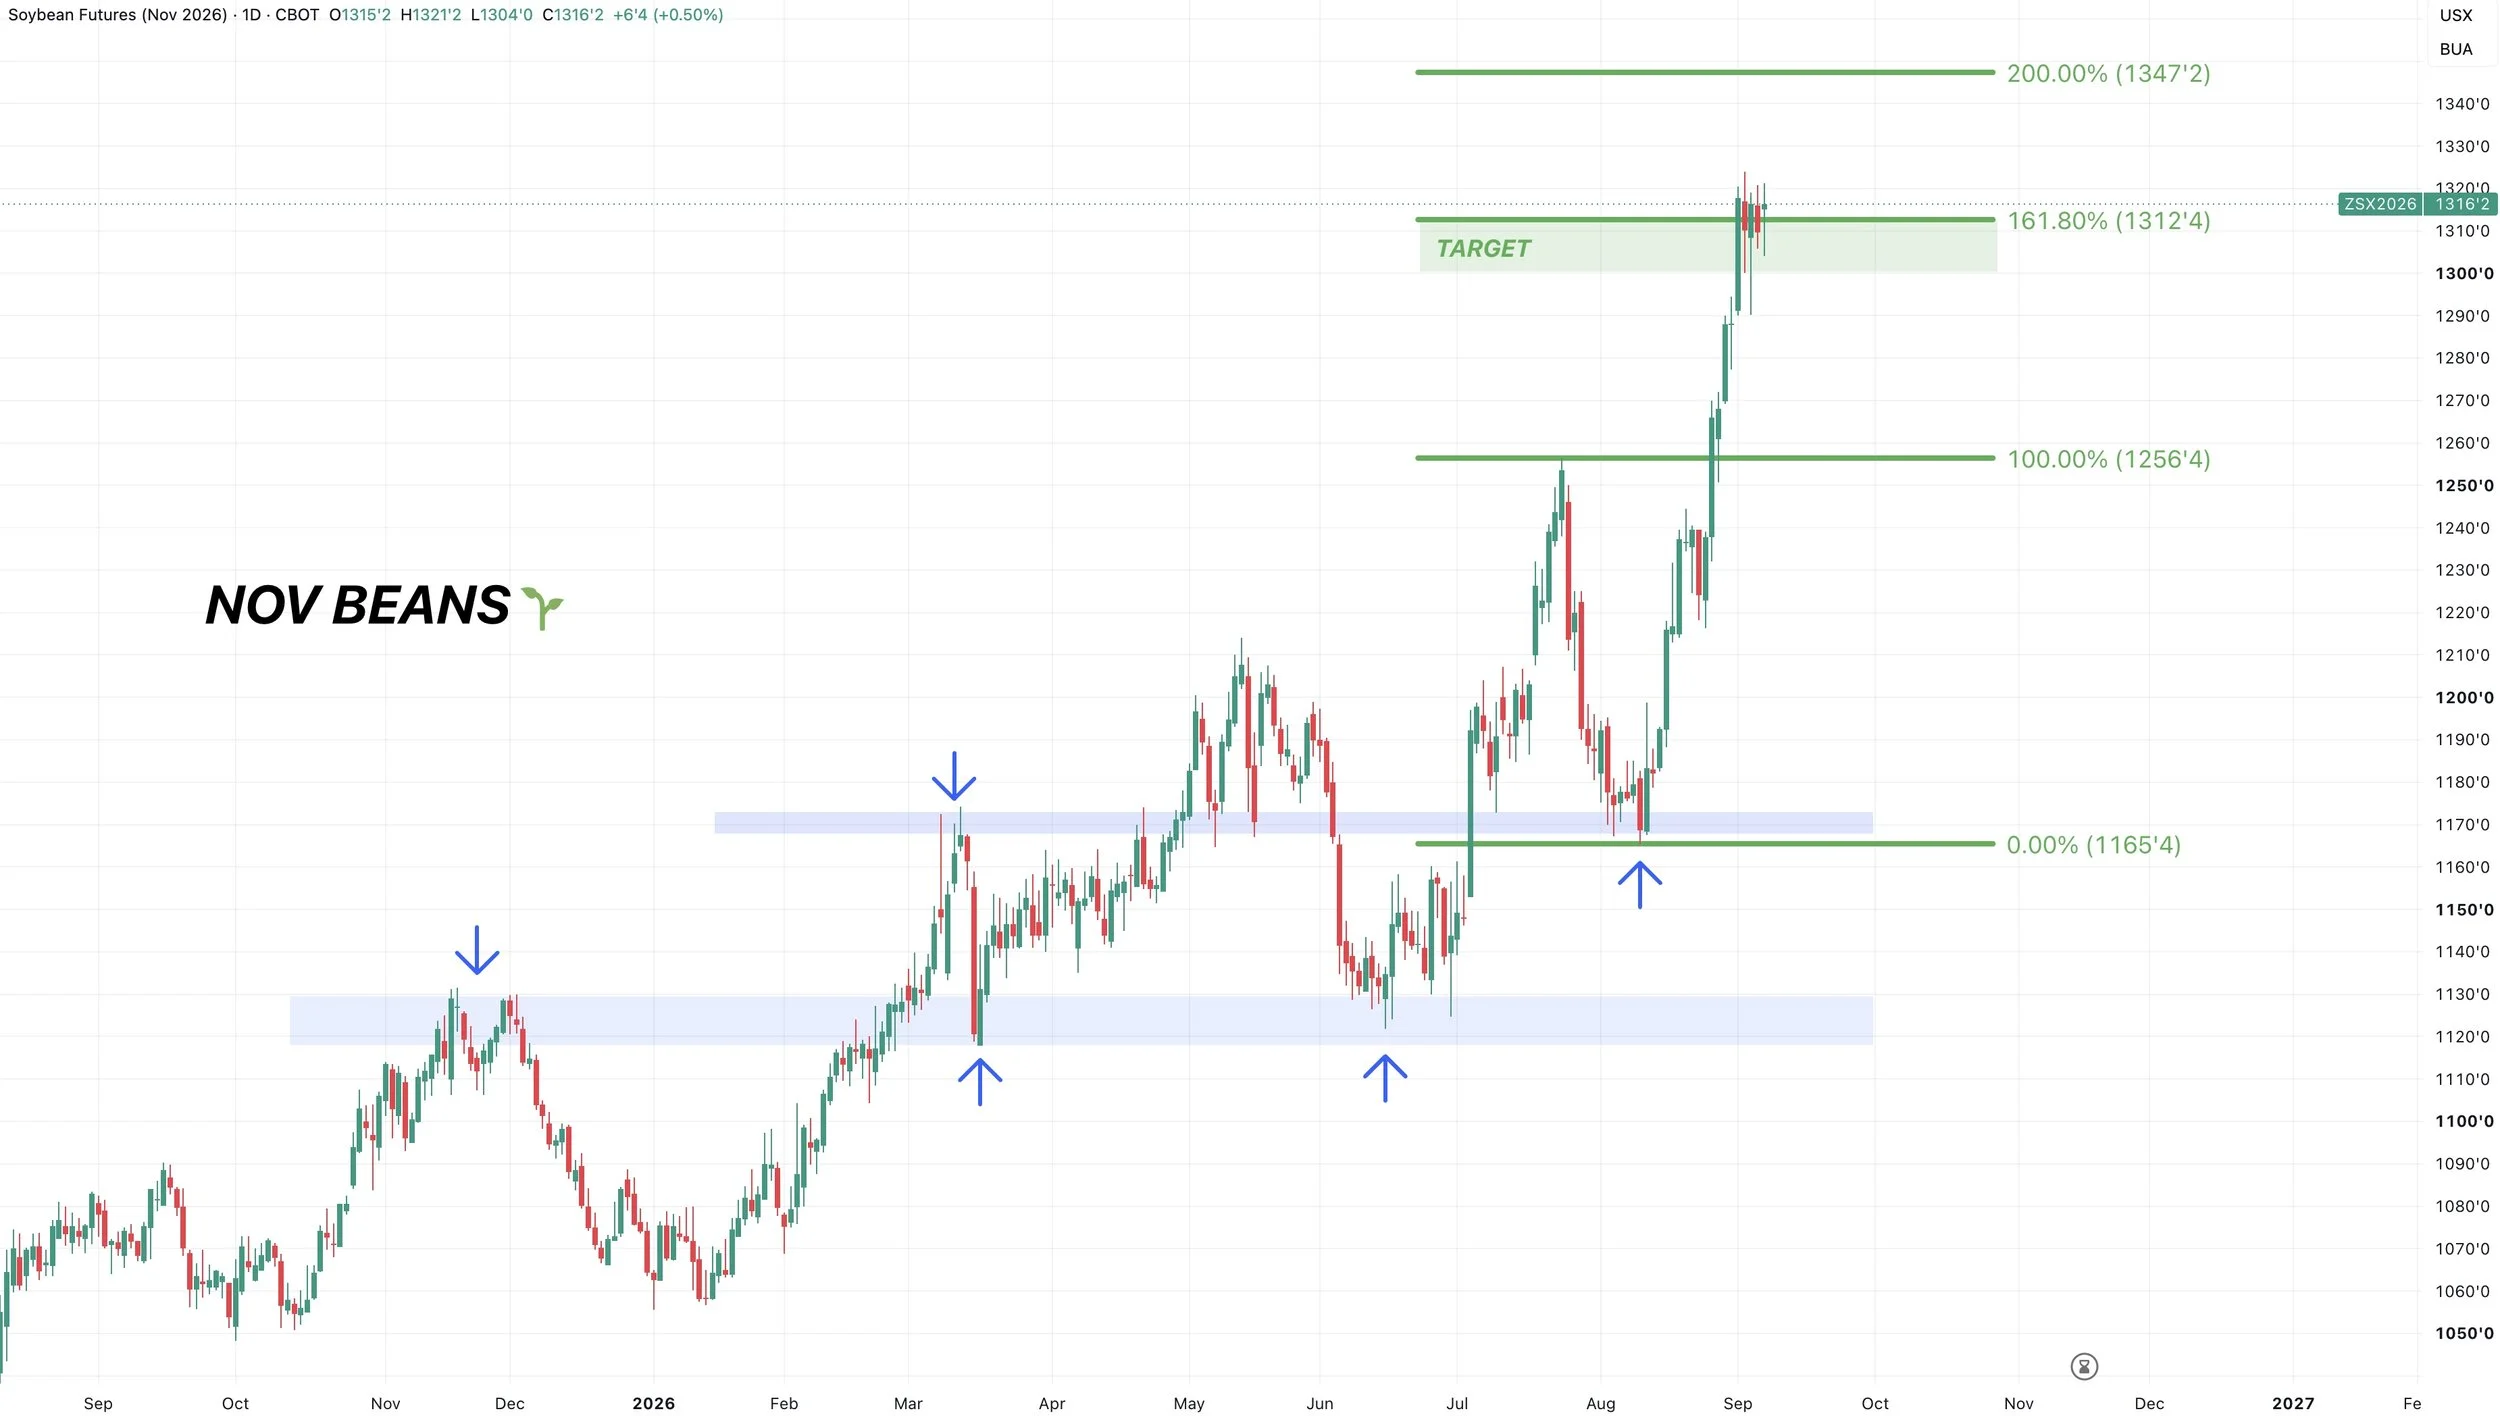
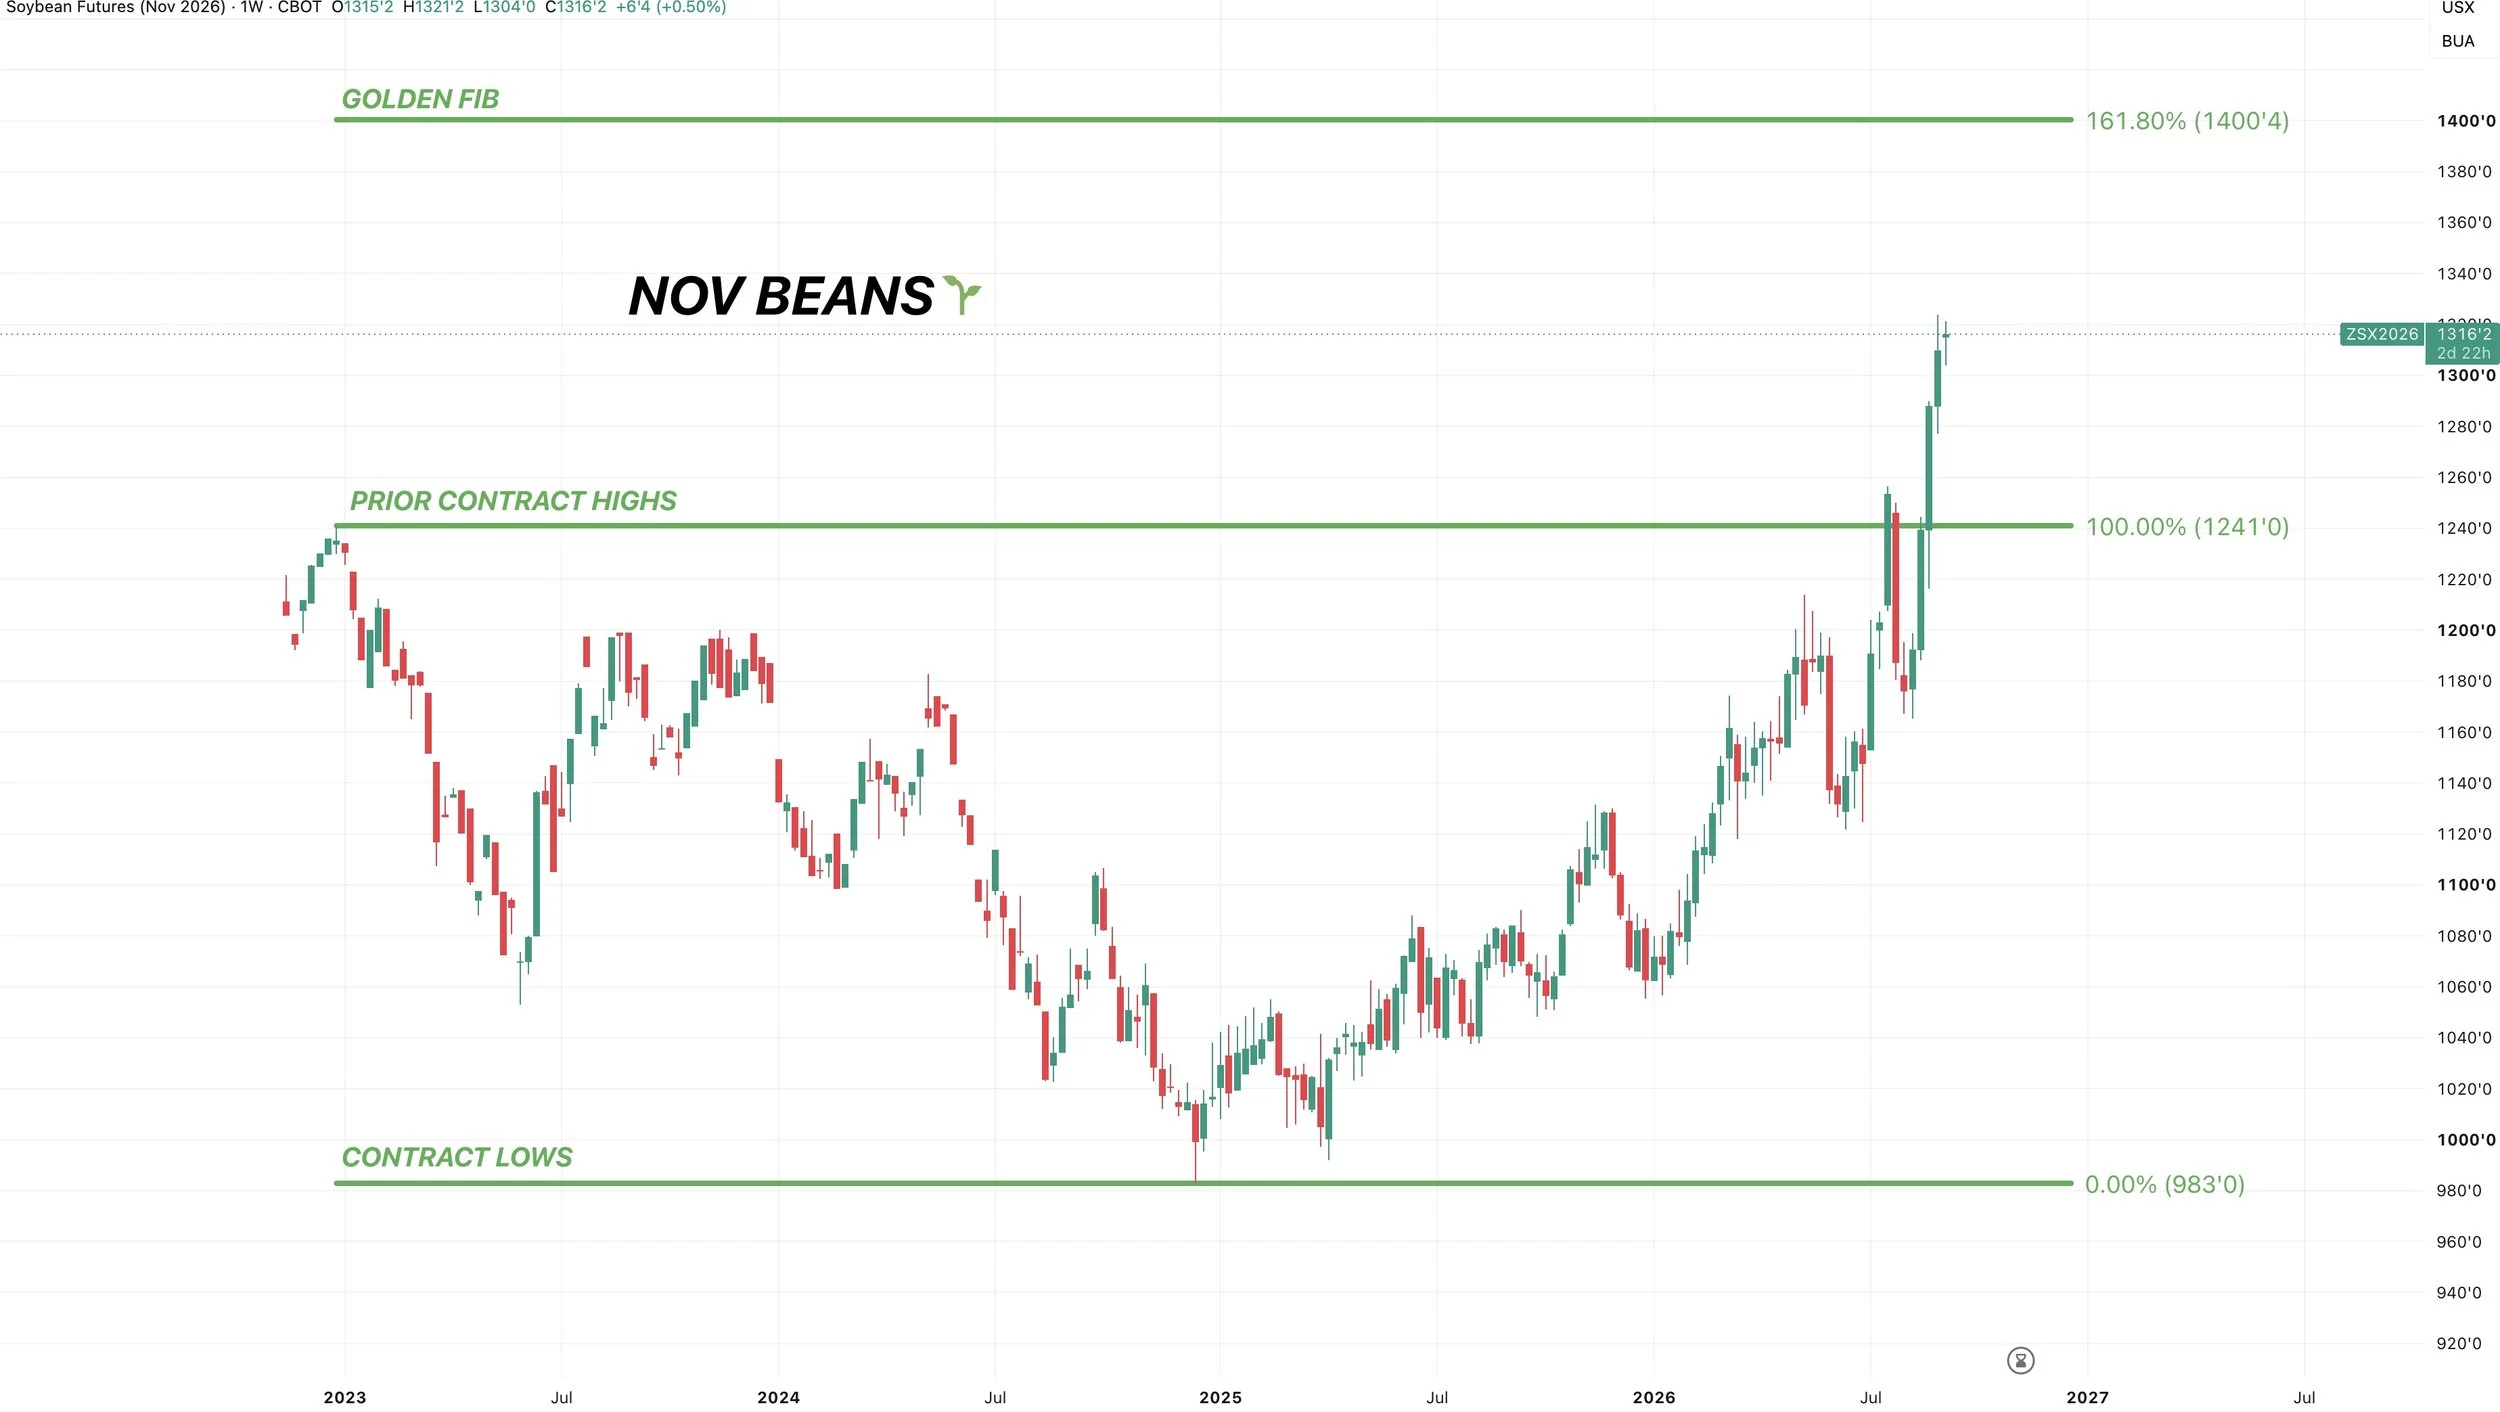
The reason for the alert was that we hit our next target.
The 161.8% retracement from the August lows up to the July highs. Aka the golden fib.
It does not mean this market has to sell off here, but if we are going to see some resistance, this would be a very common area for a bullish market to stall out short term.
If we are able to bust out out of this recent range, the next point of interest would be the 200% retracement at $13.47. But for now currently struggling right at this golden fib target.
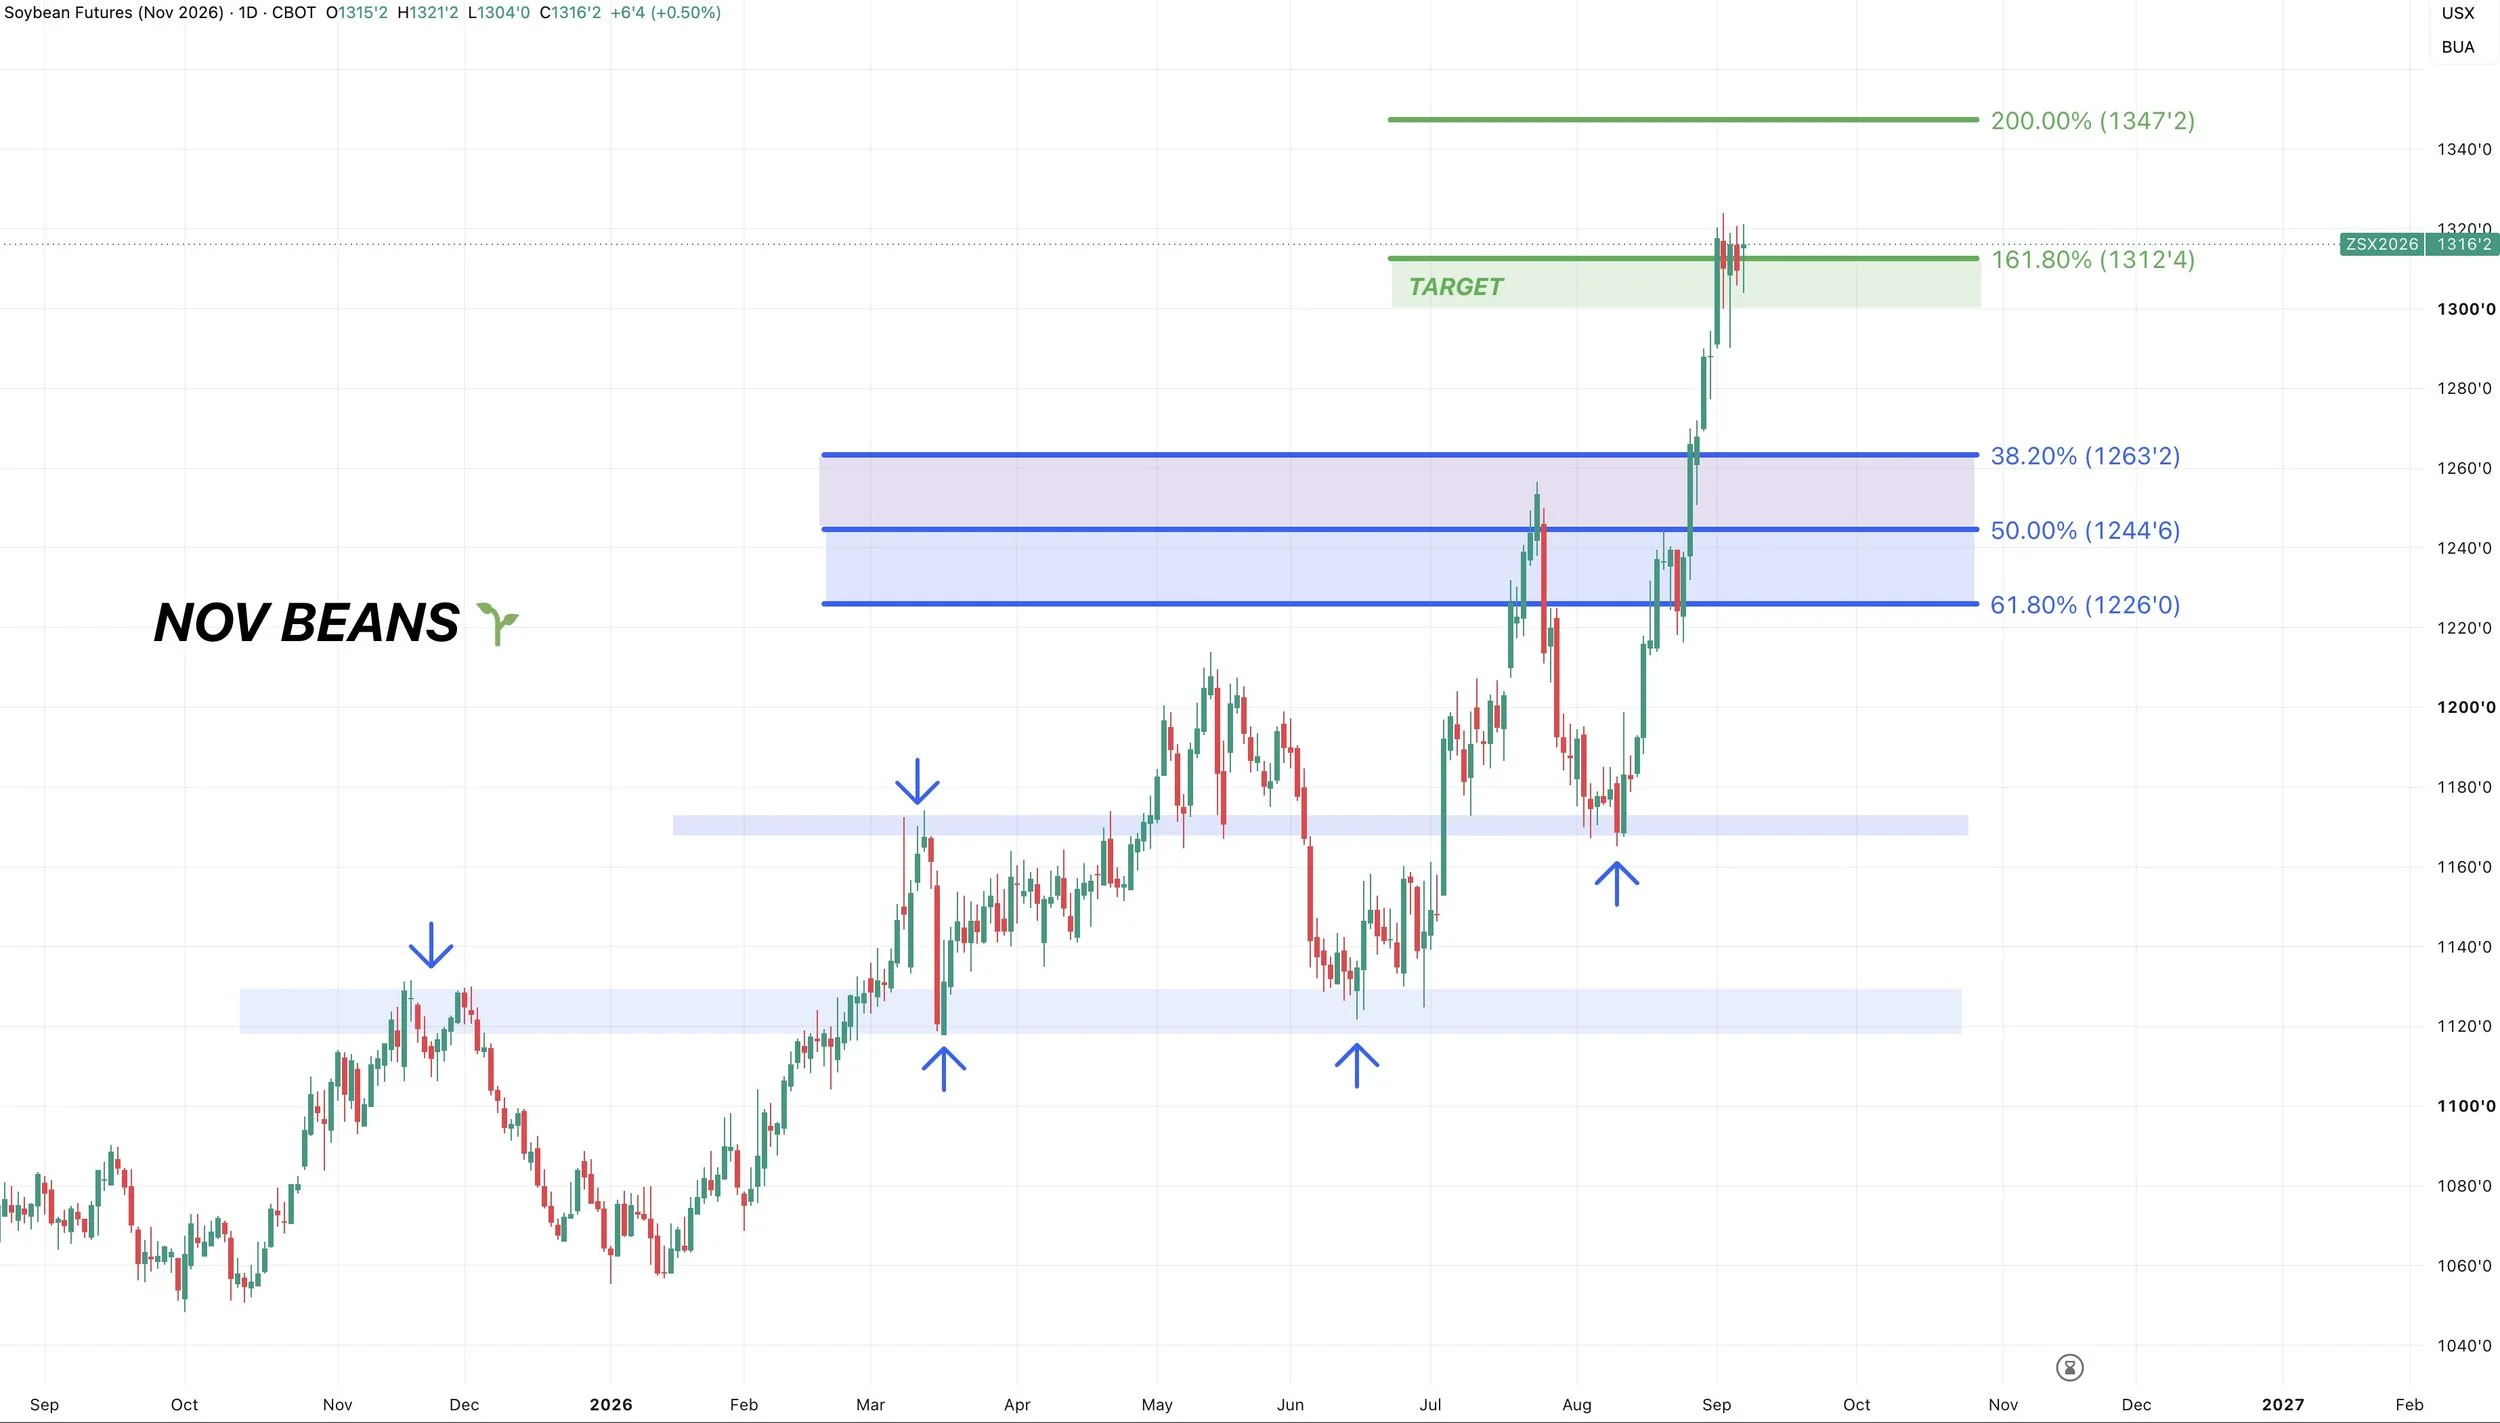
If we get a pull back, a reasonable spot to find a bottom would be around that 38.2% to 50% retracement. Which would also give us a re-test of those highs from July.
Again, doesn’t have to happen.
But if it does, that's the level I am watching for now.
Next Possible Target:
Like in corn, I am cautious short term. Bullish long term.
I think there is a solid chance we could see $14.00 soybeans at some point down the road.
The golden fib, 161.8% retracement of the contract lows up to the previous contract highs comes in right at $14.00
Monthly Chart:
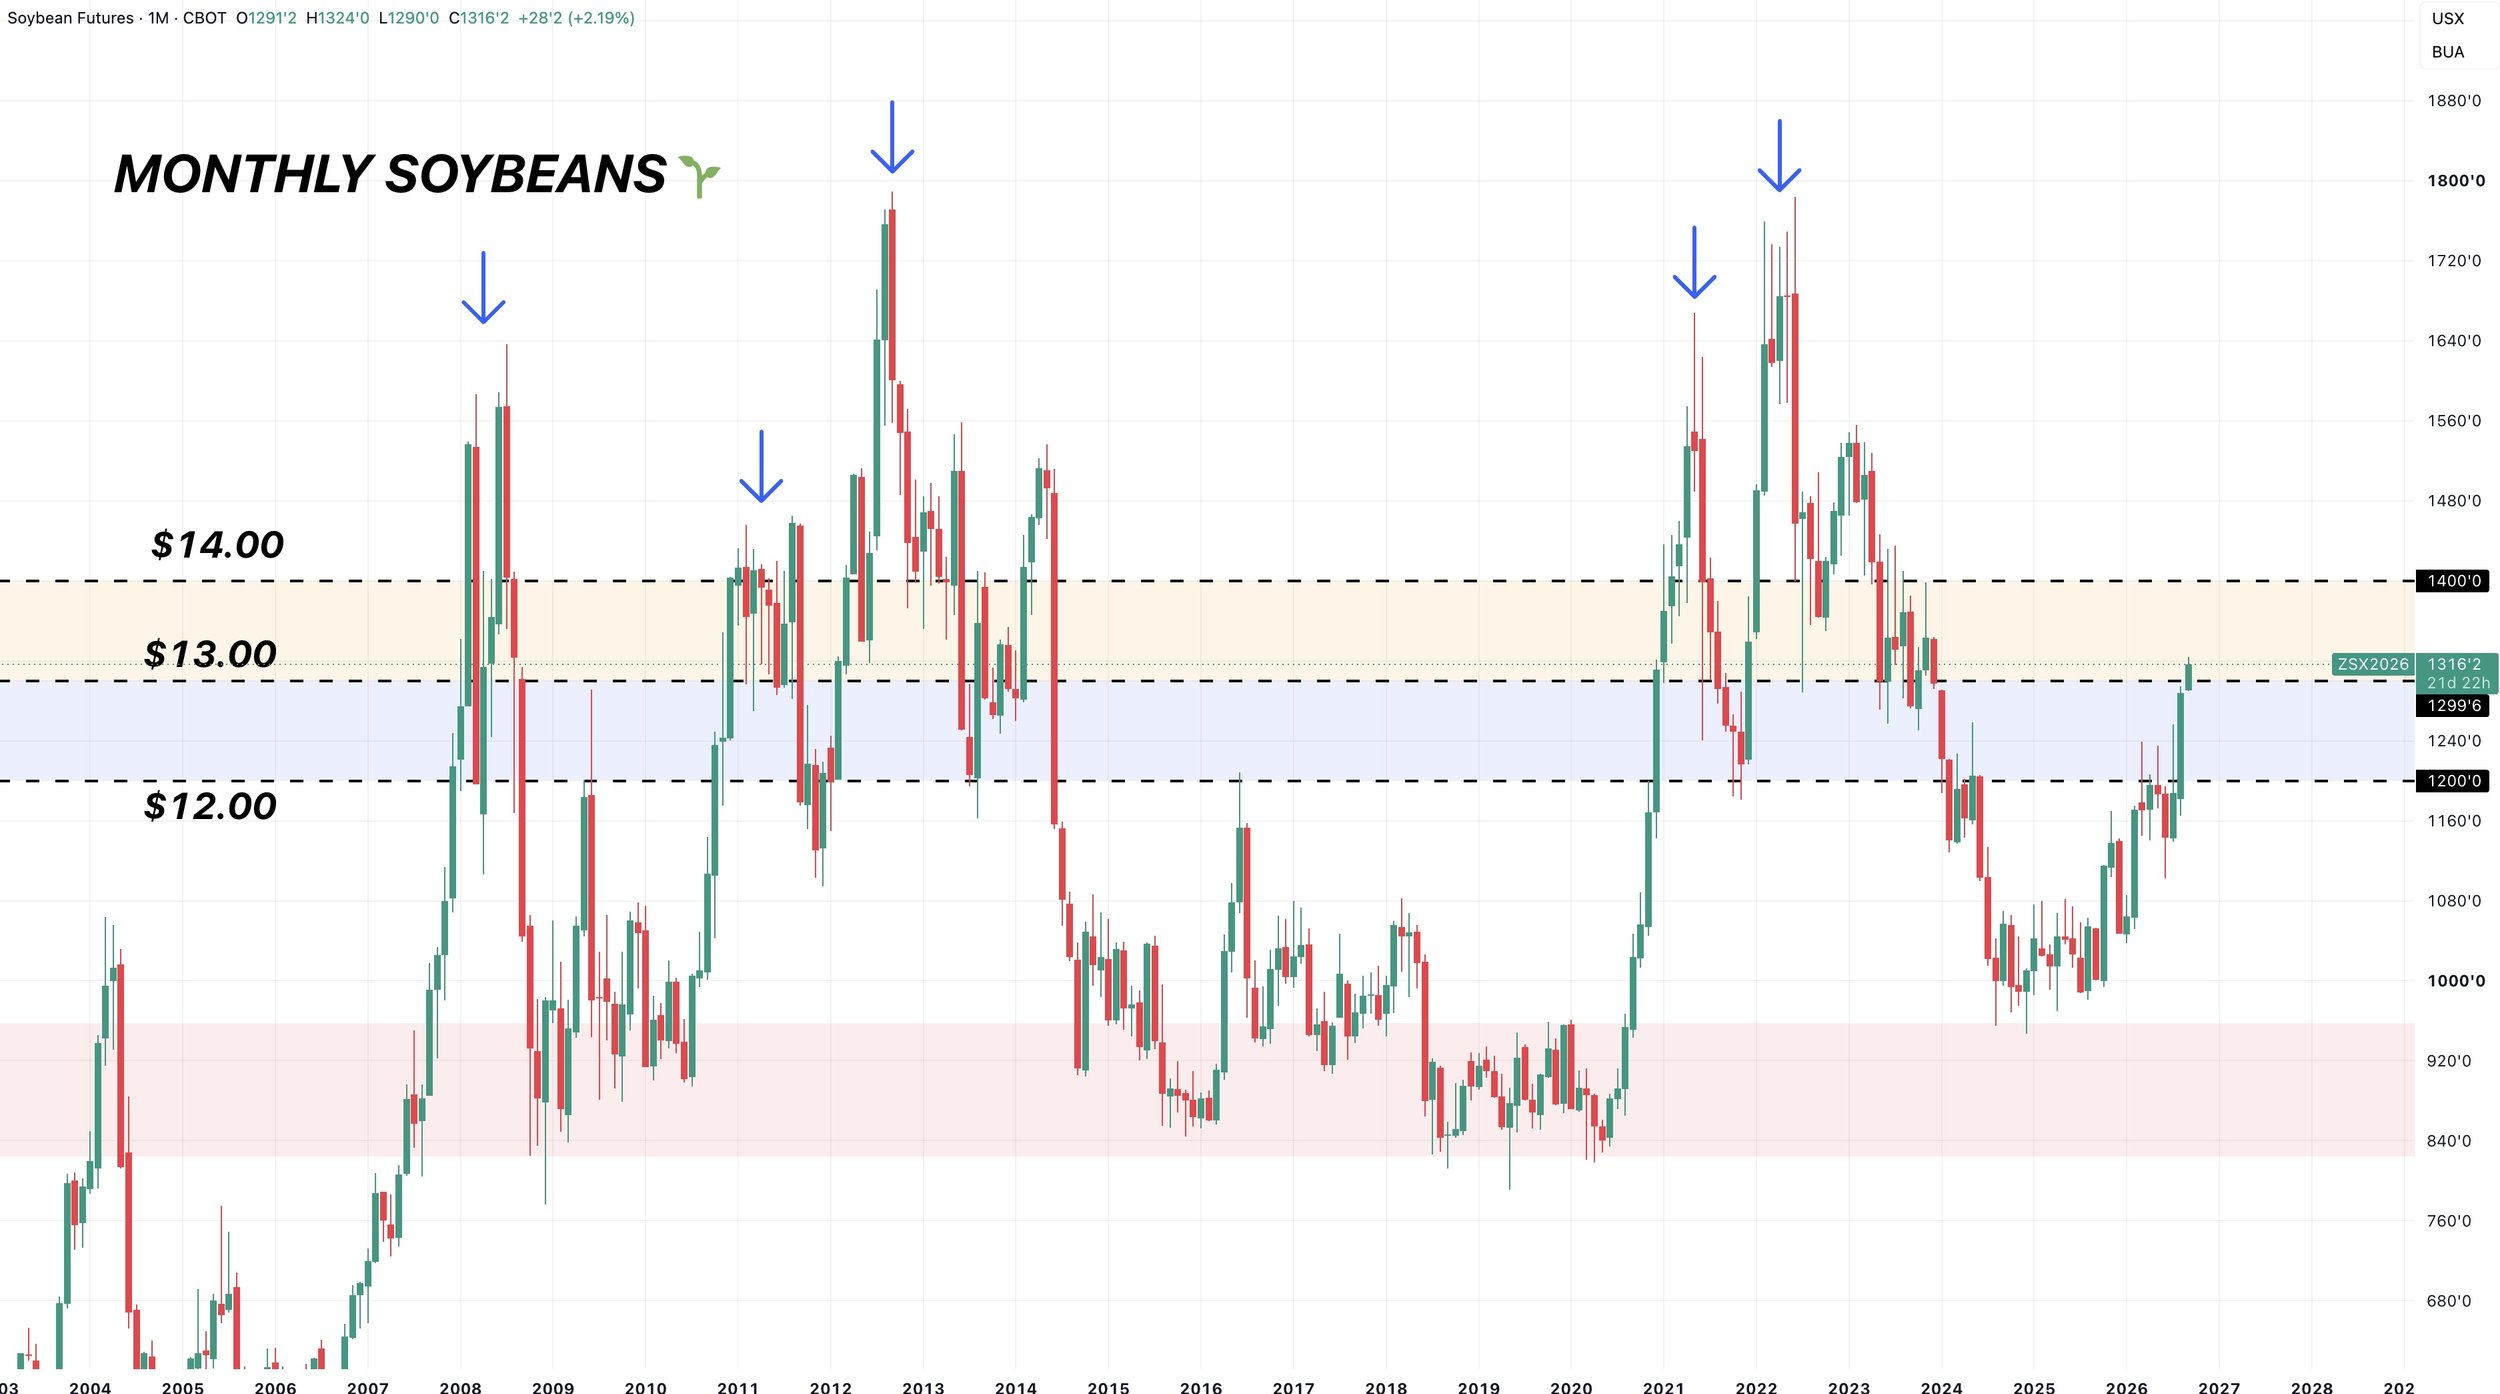
At the same time.. every single time we have seen a monthly close above $12.00.. the market has eventually ran to $14.00 or higher.
In most cases, it was actually higher.
We have never seen a monthly close above $12.00 that did not eventually result in at least $14.00 soybeans.
Another reason to believe there is a good chance for at least $14.00 soybeans at some point.
Again, this is talking long term.
If you are short on time and have to move stuff off the combine, we are currently at an area where we think it makes sense to manage some risk short term.
Wheat
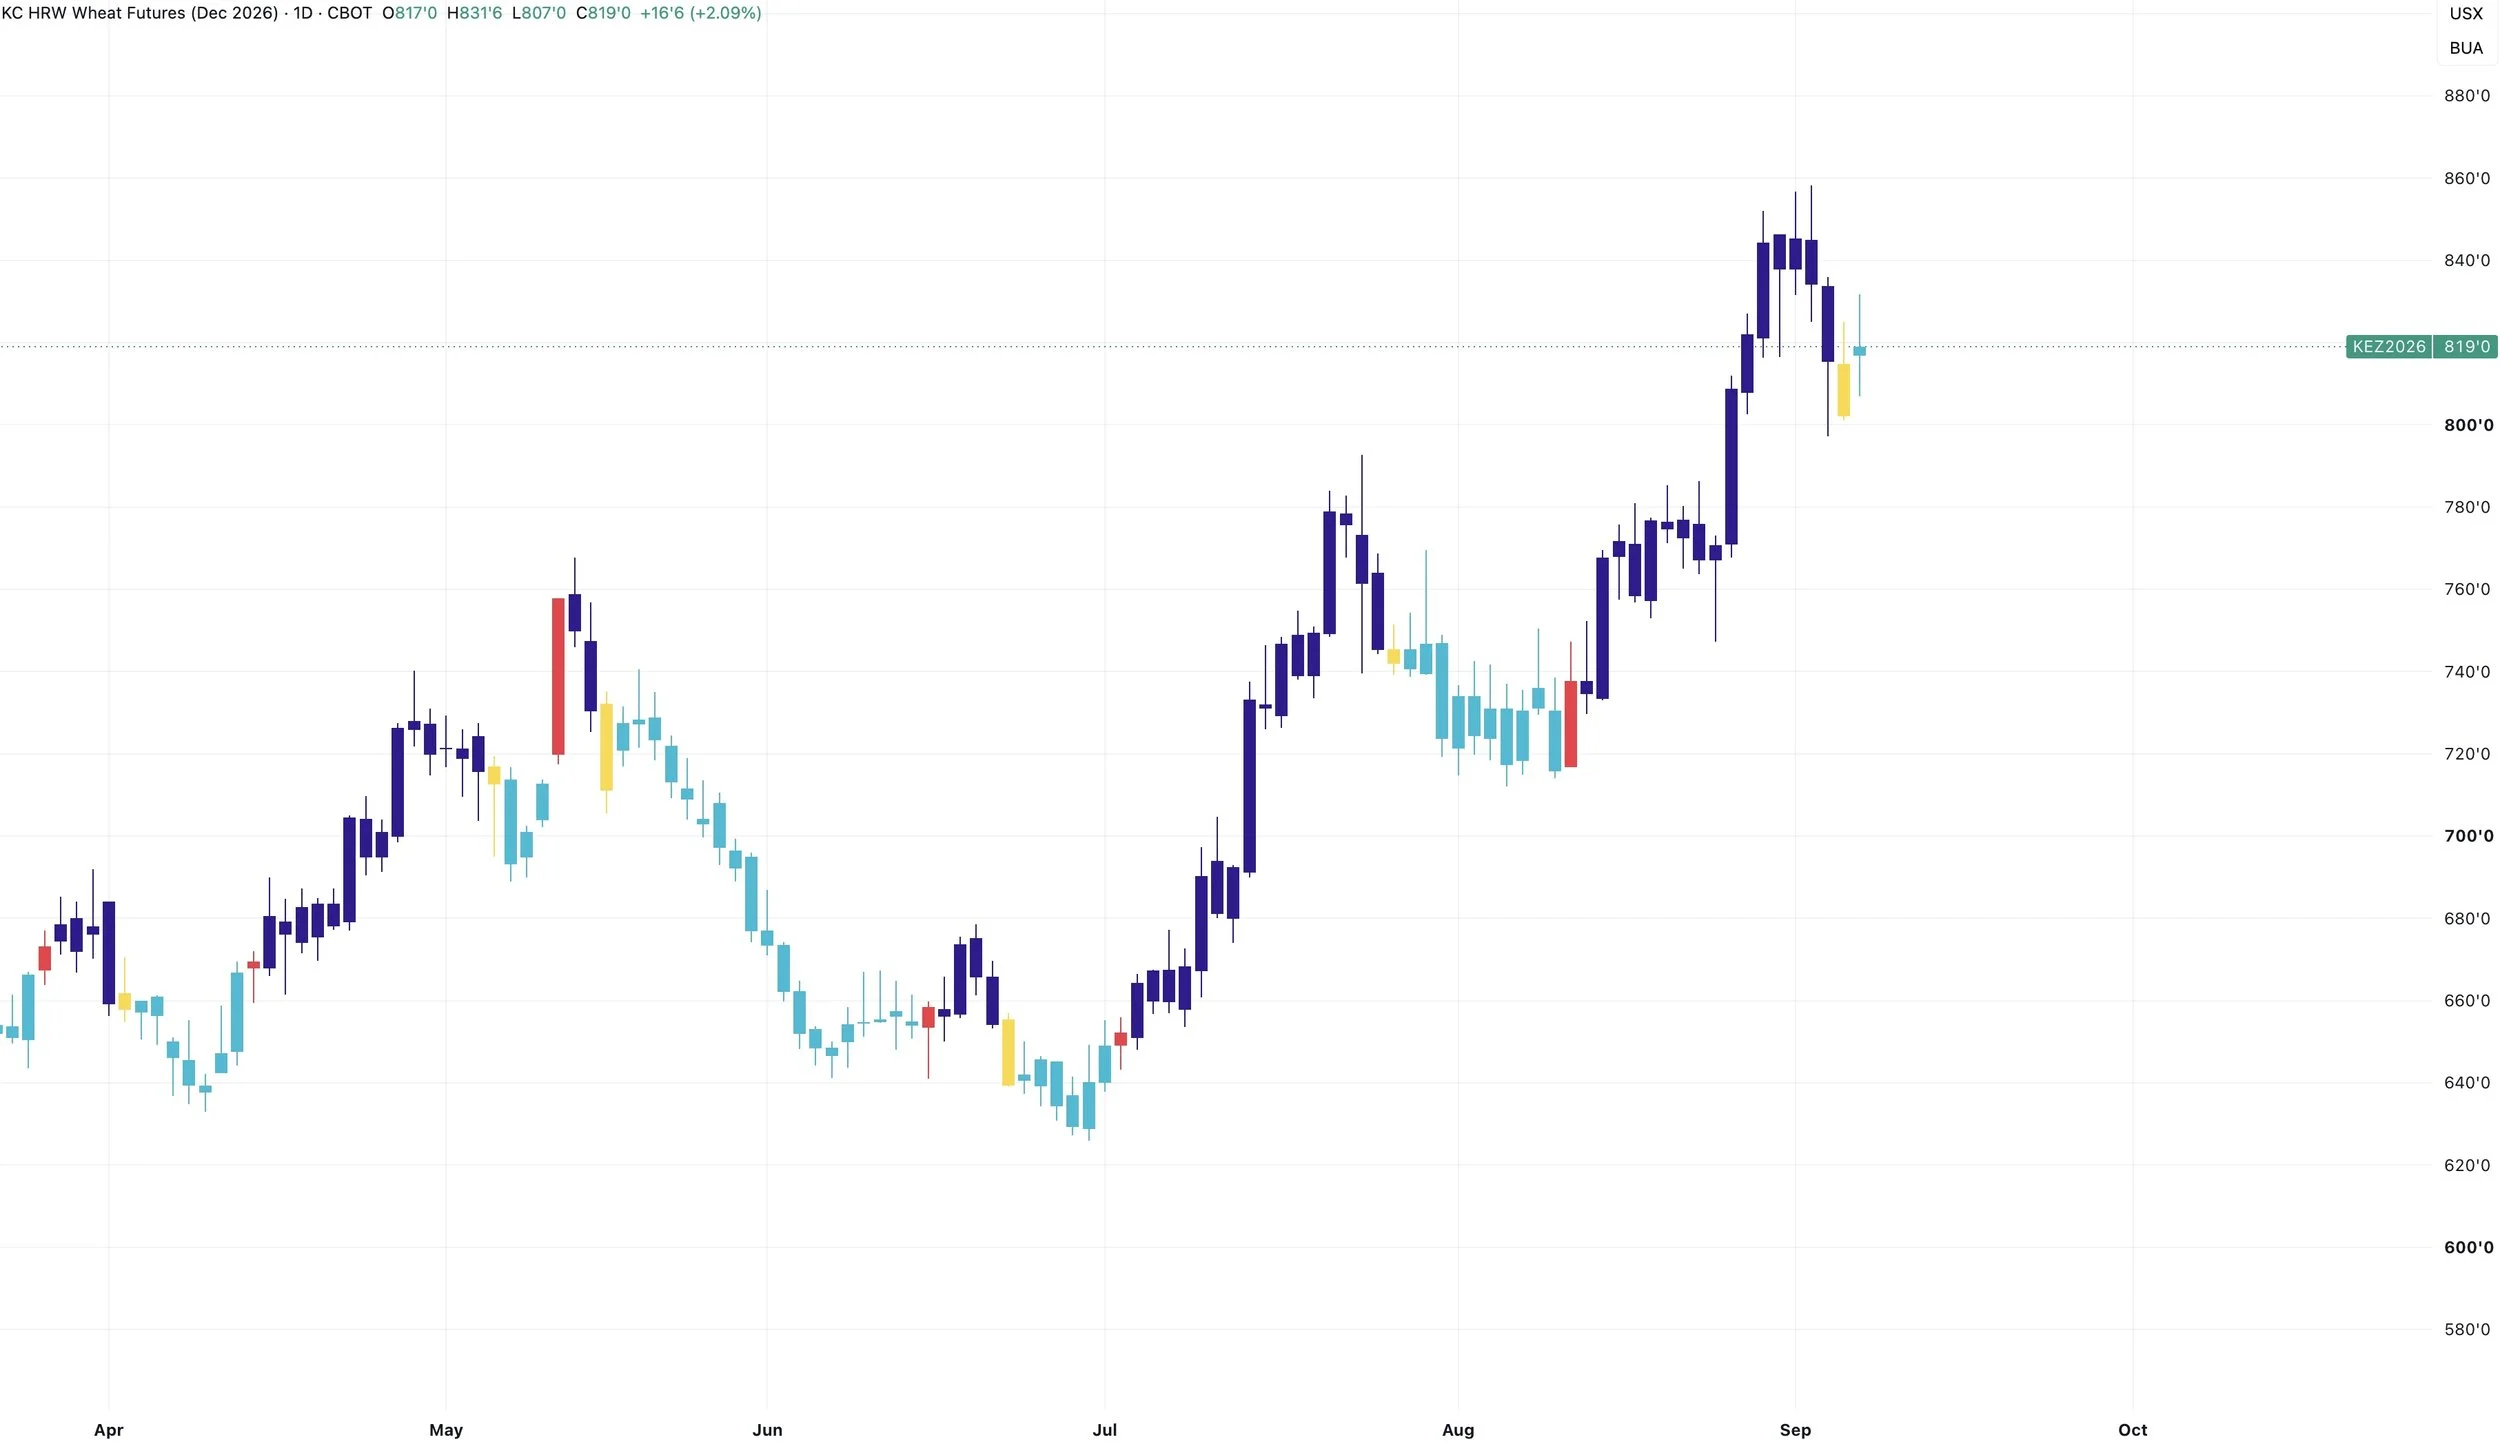
Dec KC Chart:
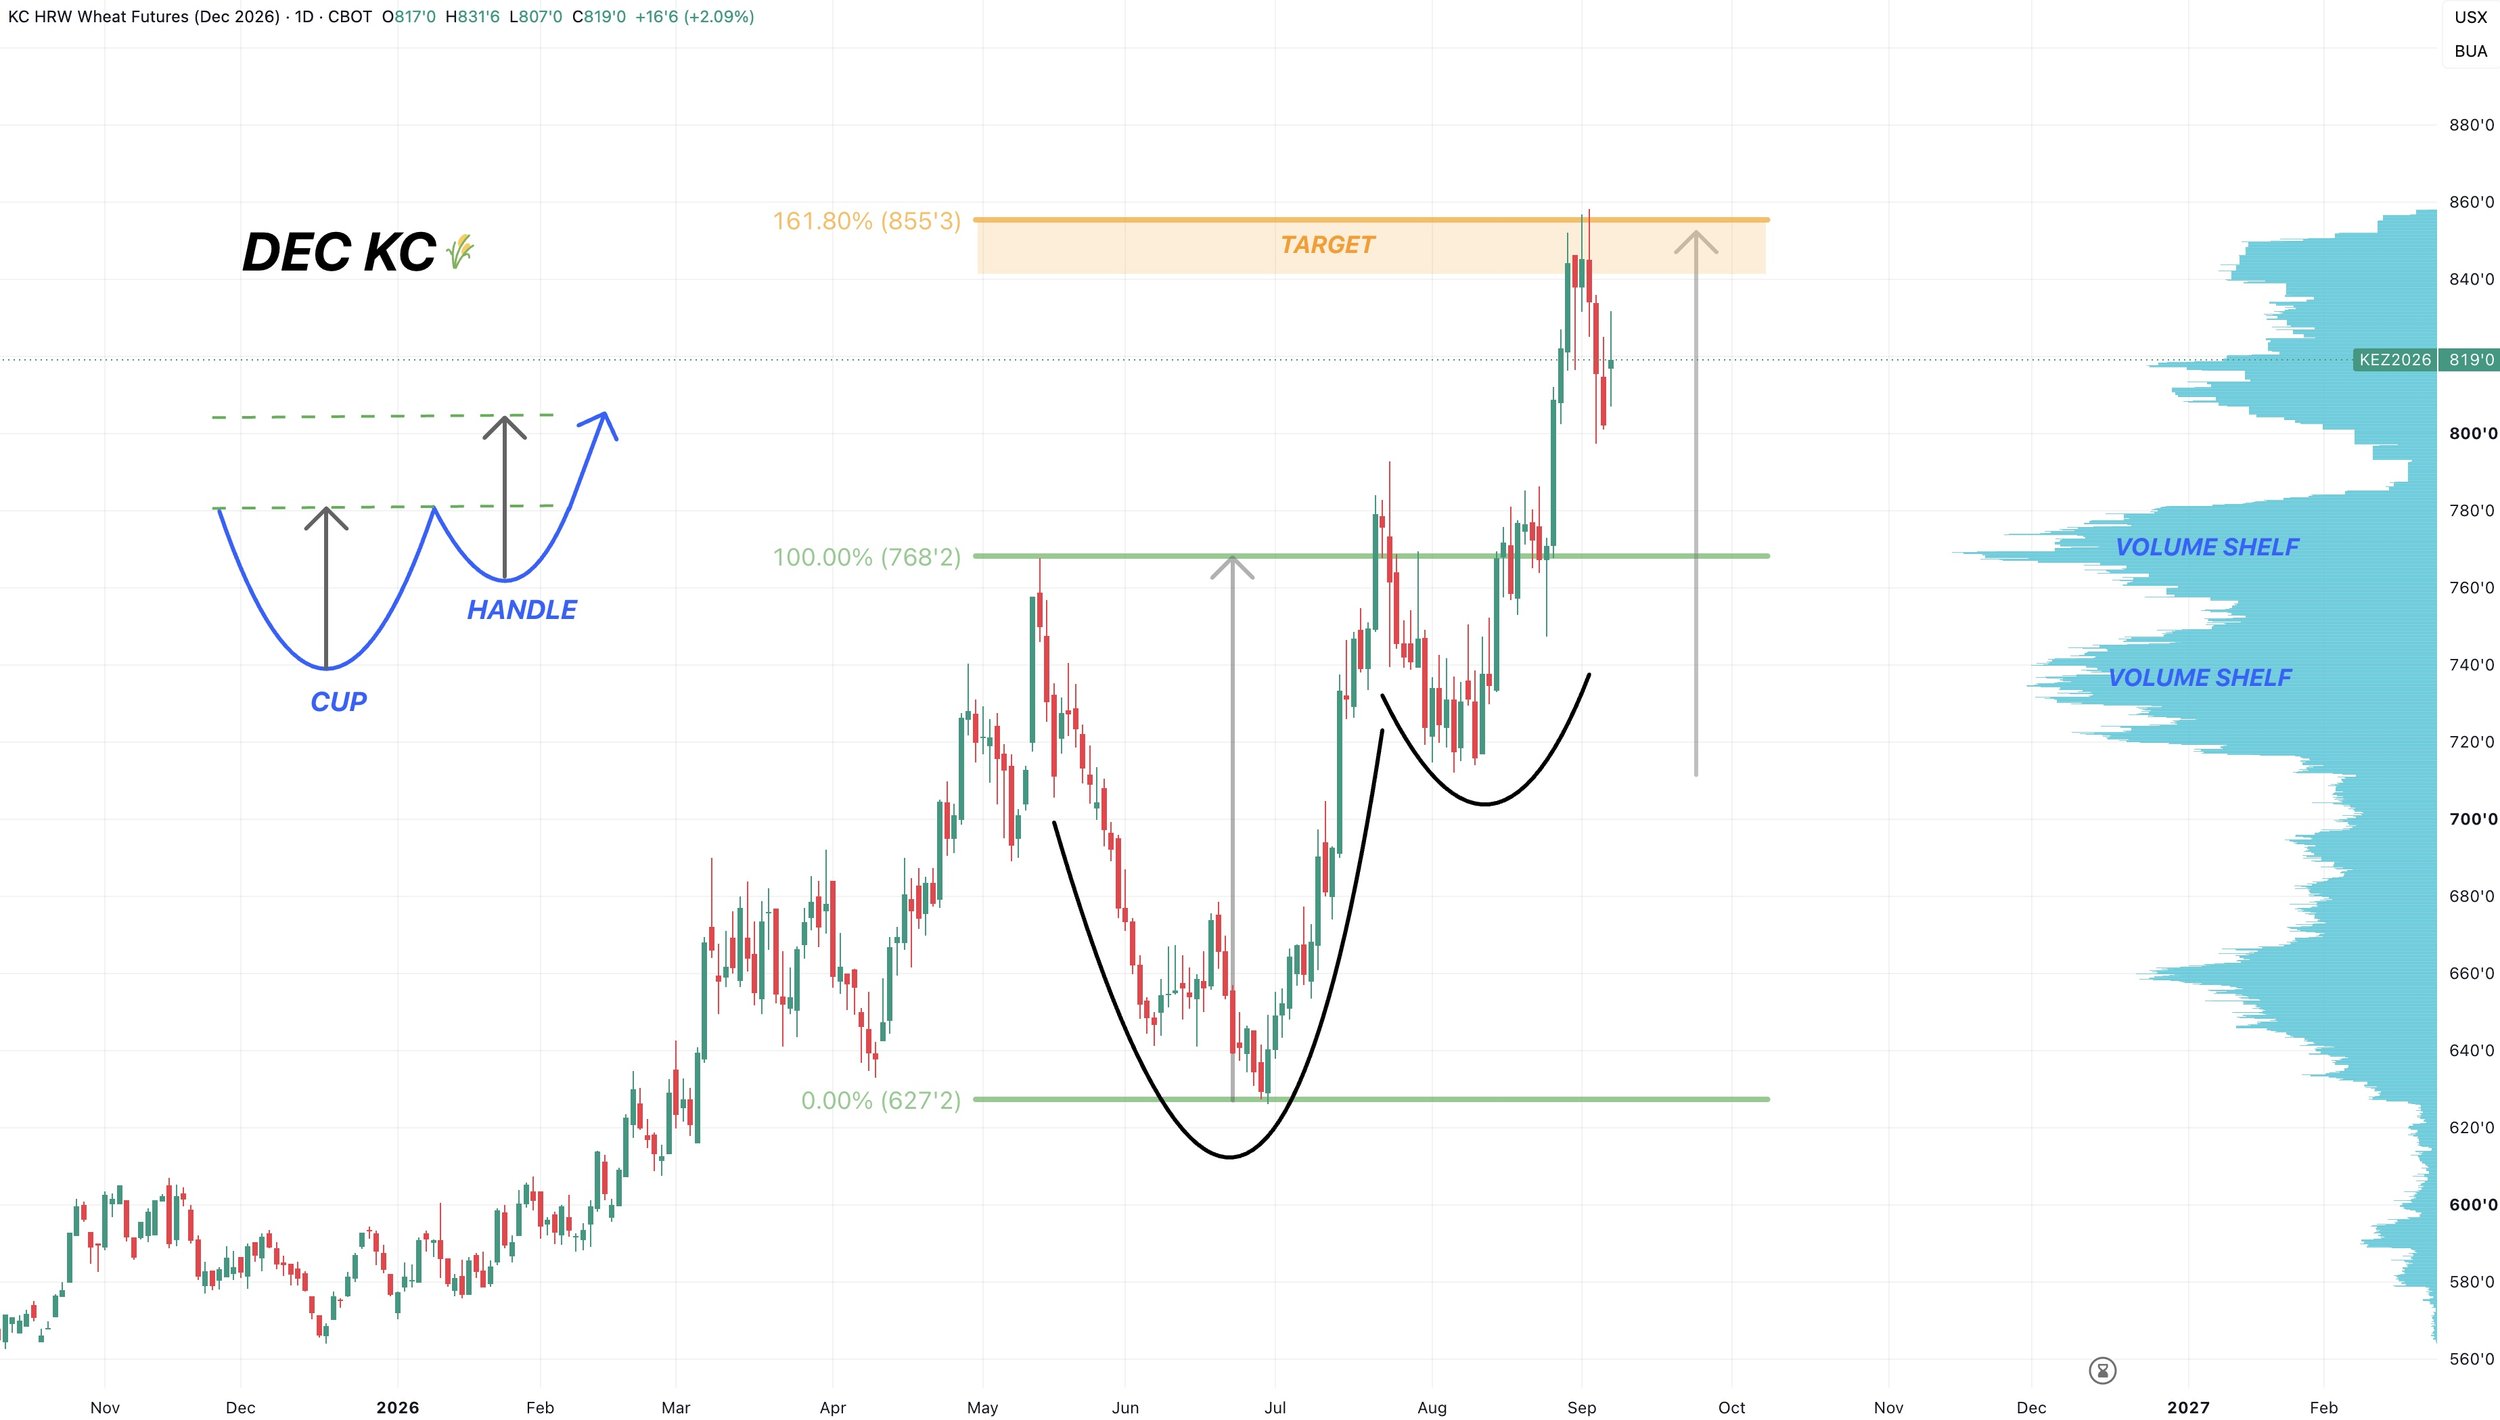
We rejected right off that target and where we issued that sell signal and hedge alert.
If you missed the alert: Click Here
That target was the golden fib. 161.8% of the June lows up to the May highs. A very common continuation target in a bullish market.
That same level was the exact implied move from the cup and handle pattern we broke out of.
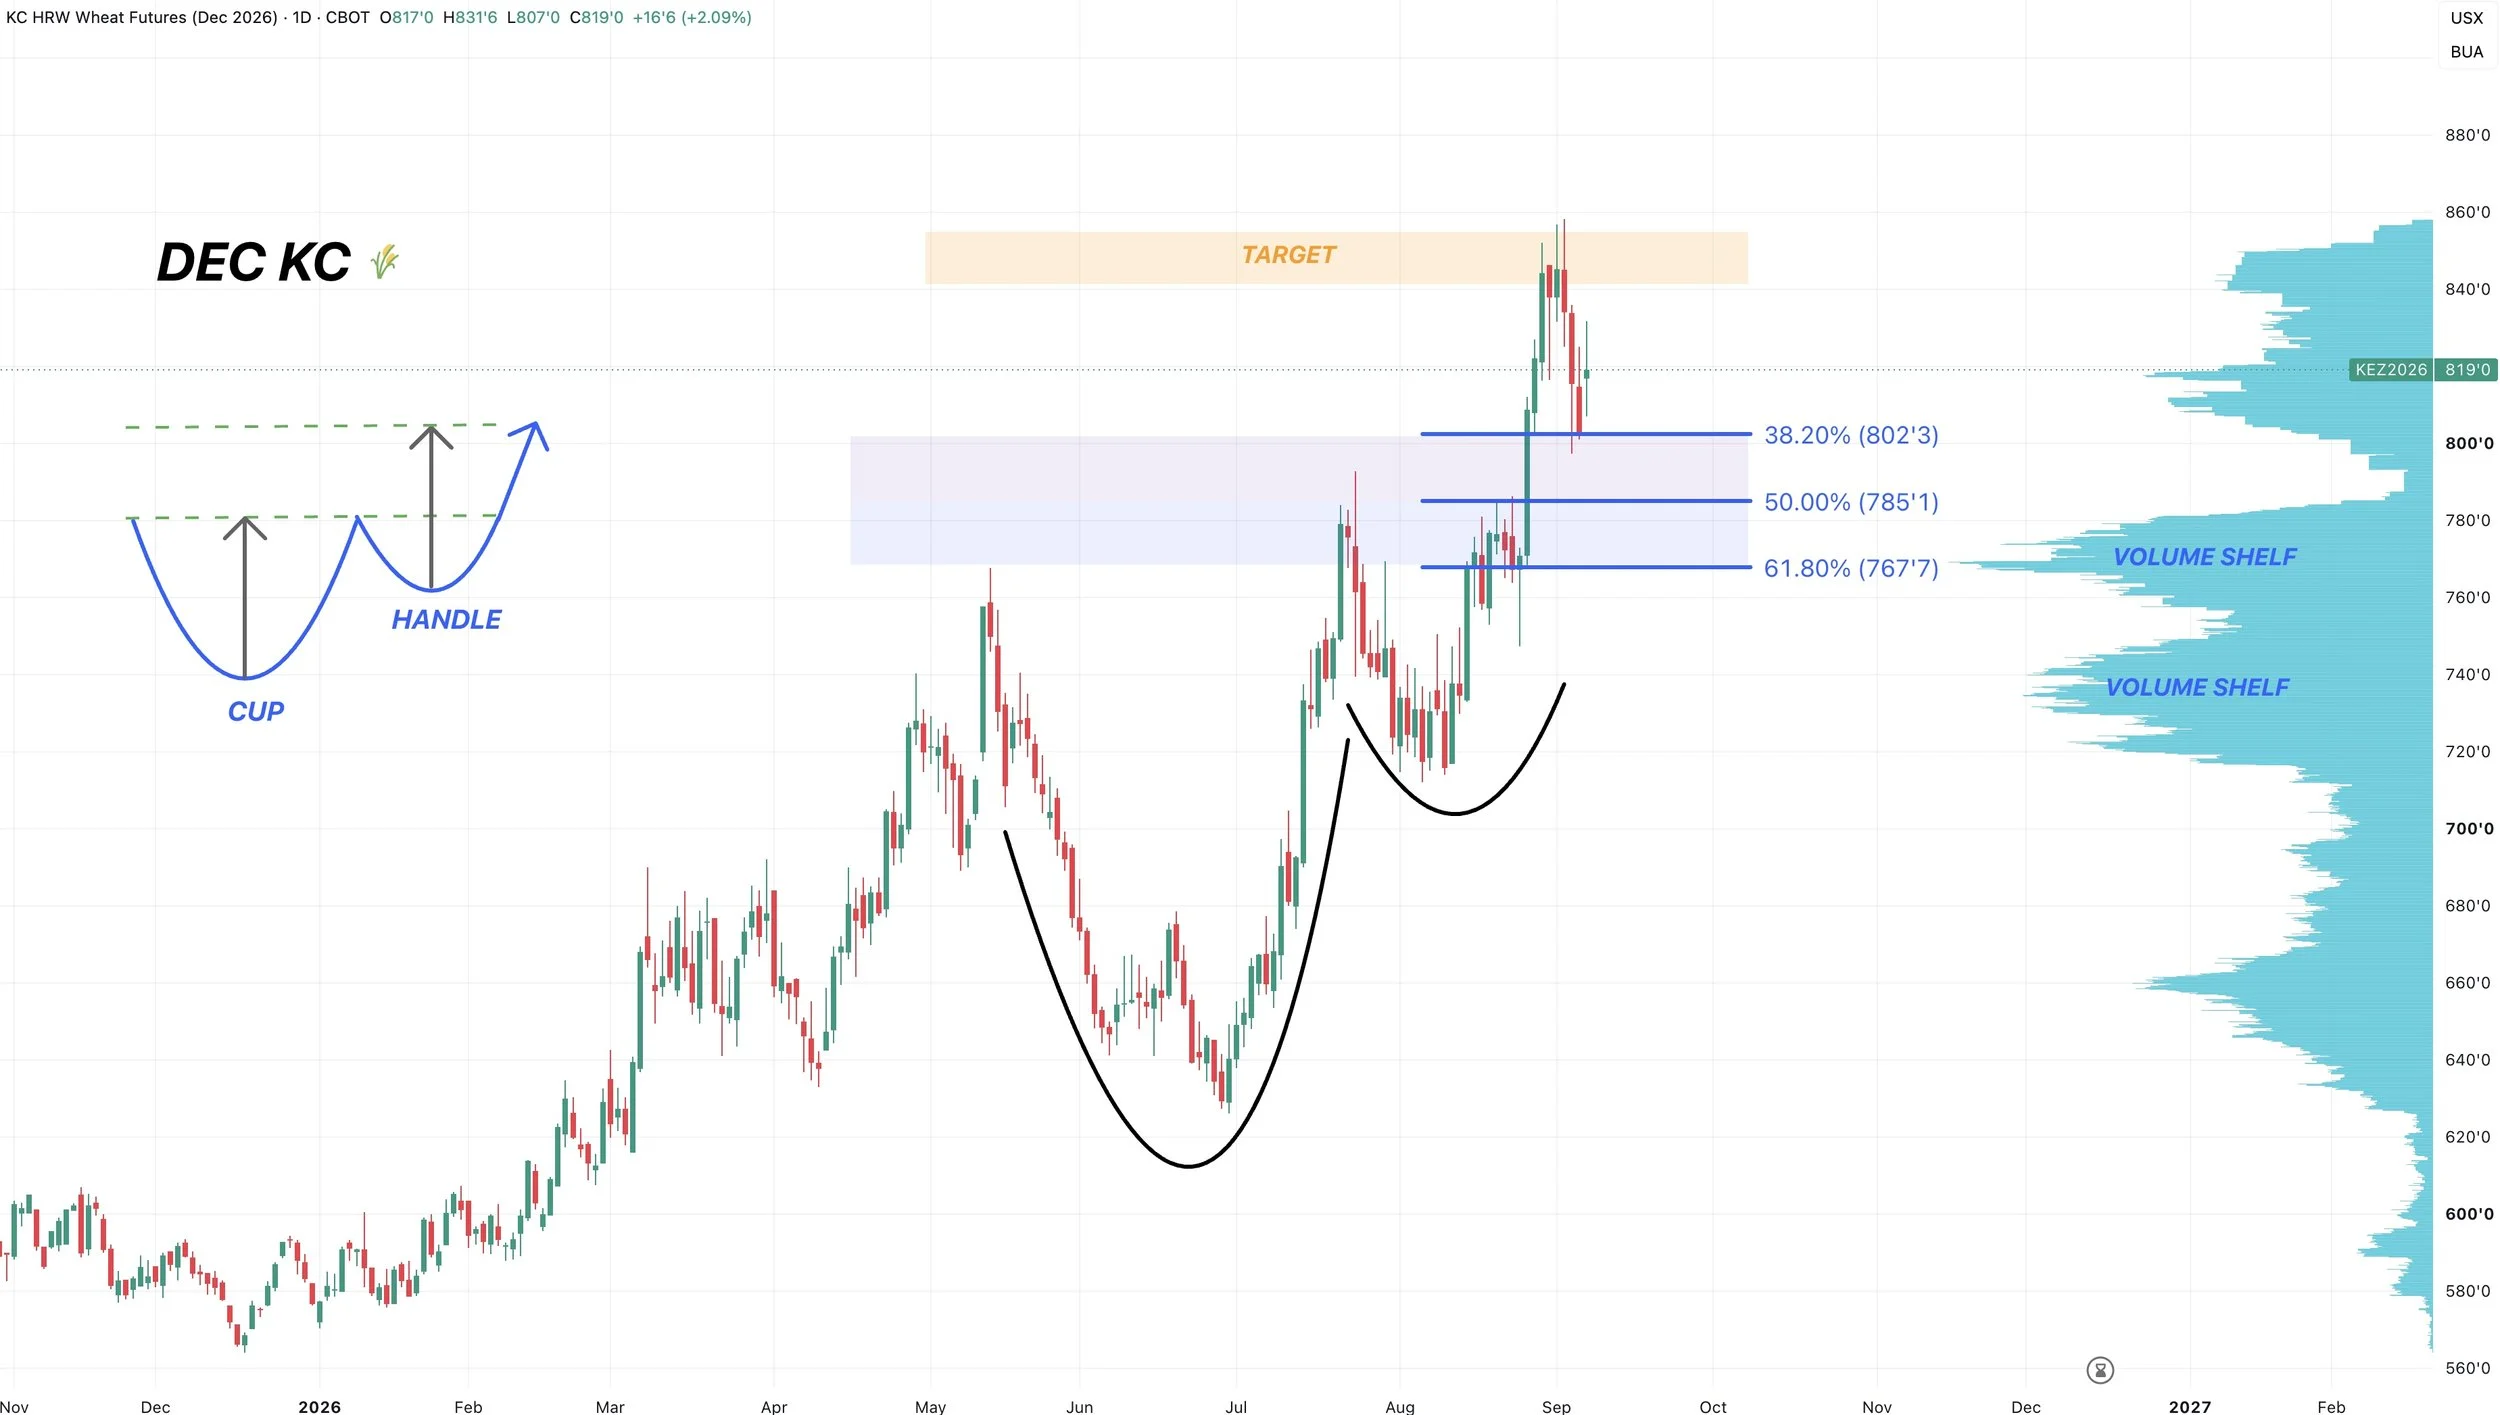
Now, we are currently bouncing at the 38.2% retracement, which is technically deep enough for a correction.
However, I would not be surprised at all to see us get one last leg lower towards the 50% to 61.8% levels.
That golden zone would also perfectly align with a re-test of the previous highs.
We also have a massive shelf of volume that sits right there as well.
So if we get into that zone, that is where I would expect to find a floor.
I will have the next upside target once we've found a floor.
Here is that same indicator I talked about in corn.
Again, yellow candles are bearish.
Red candles are bullish.
We just got our first yellow candle since July.
The last few have led to a little further correction.
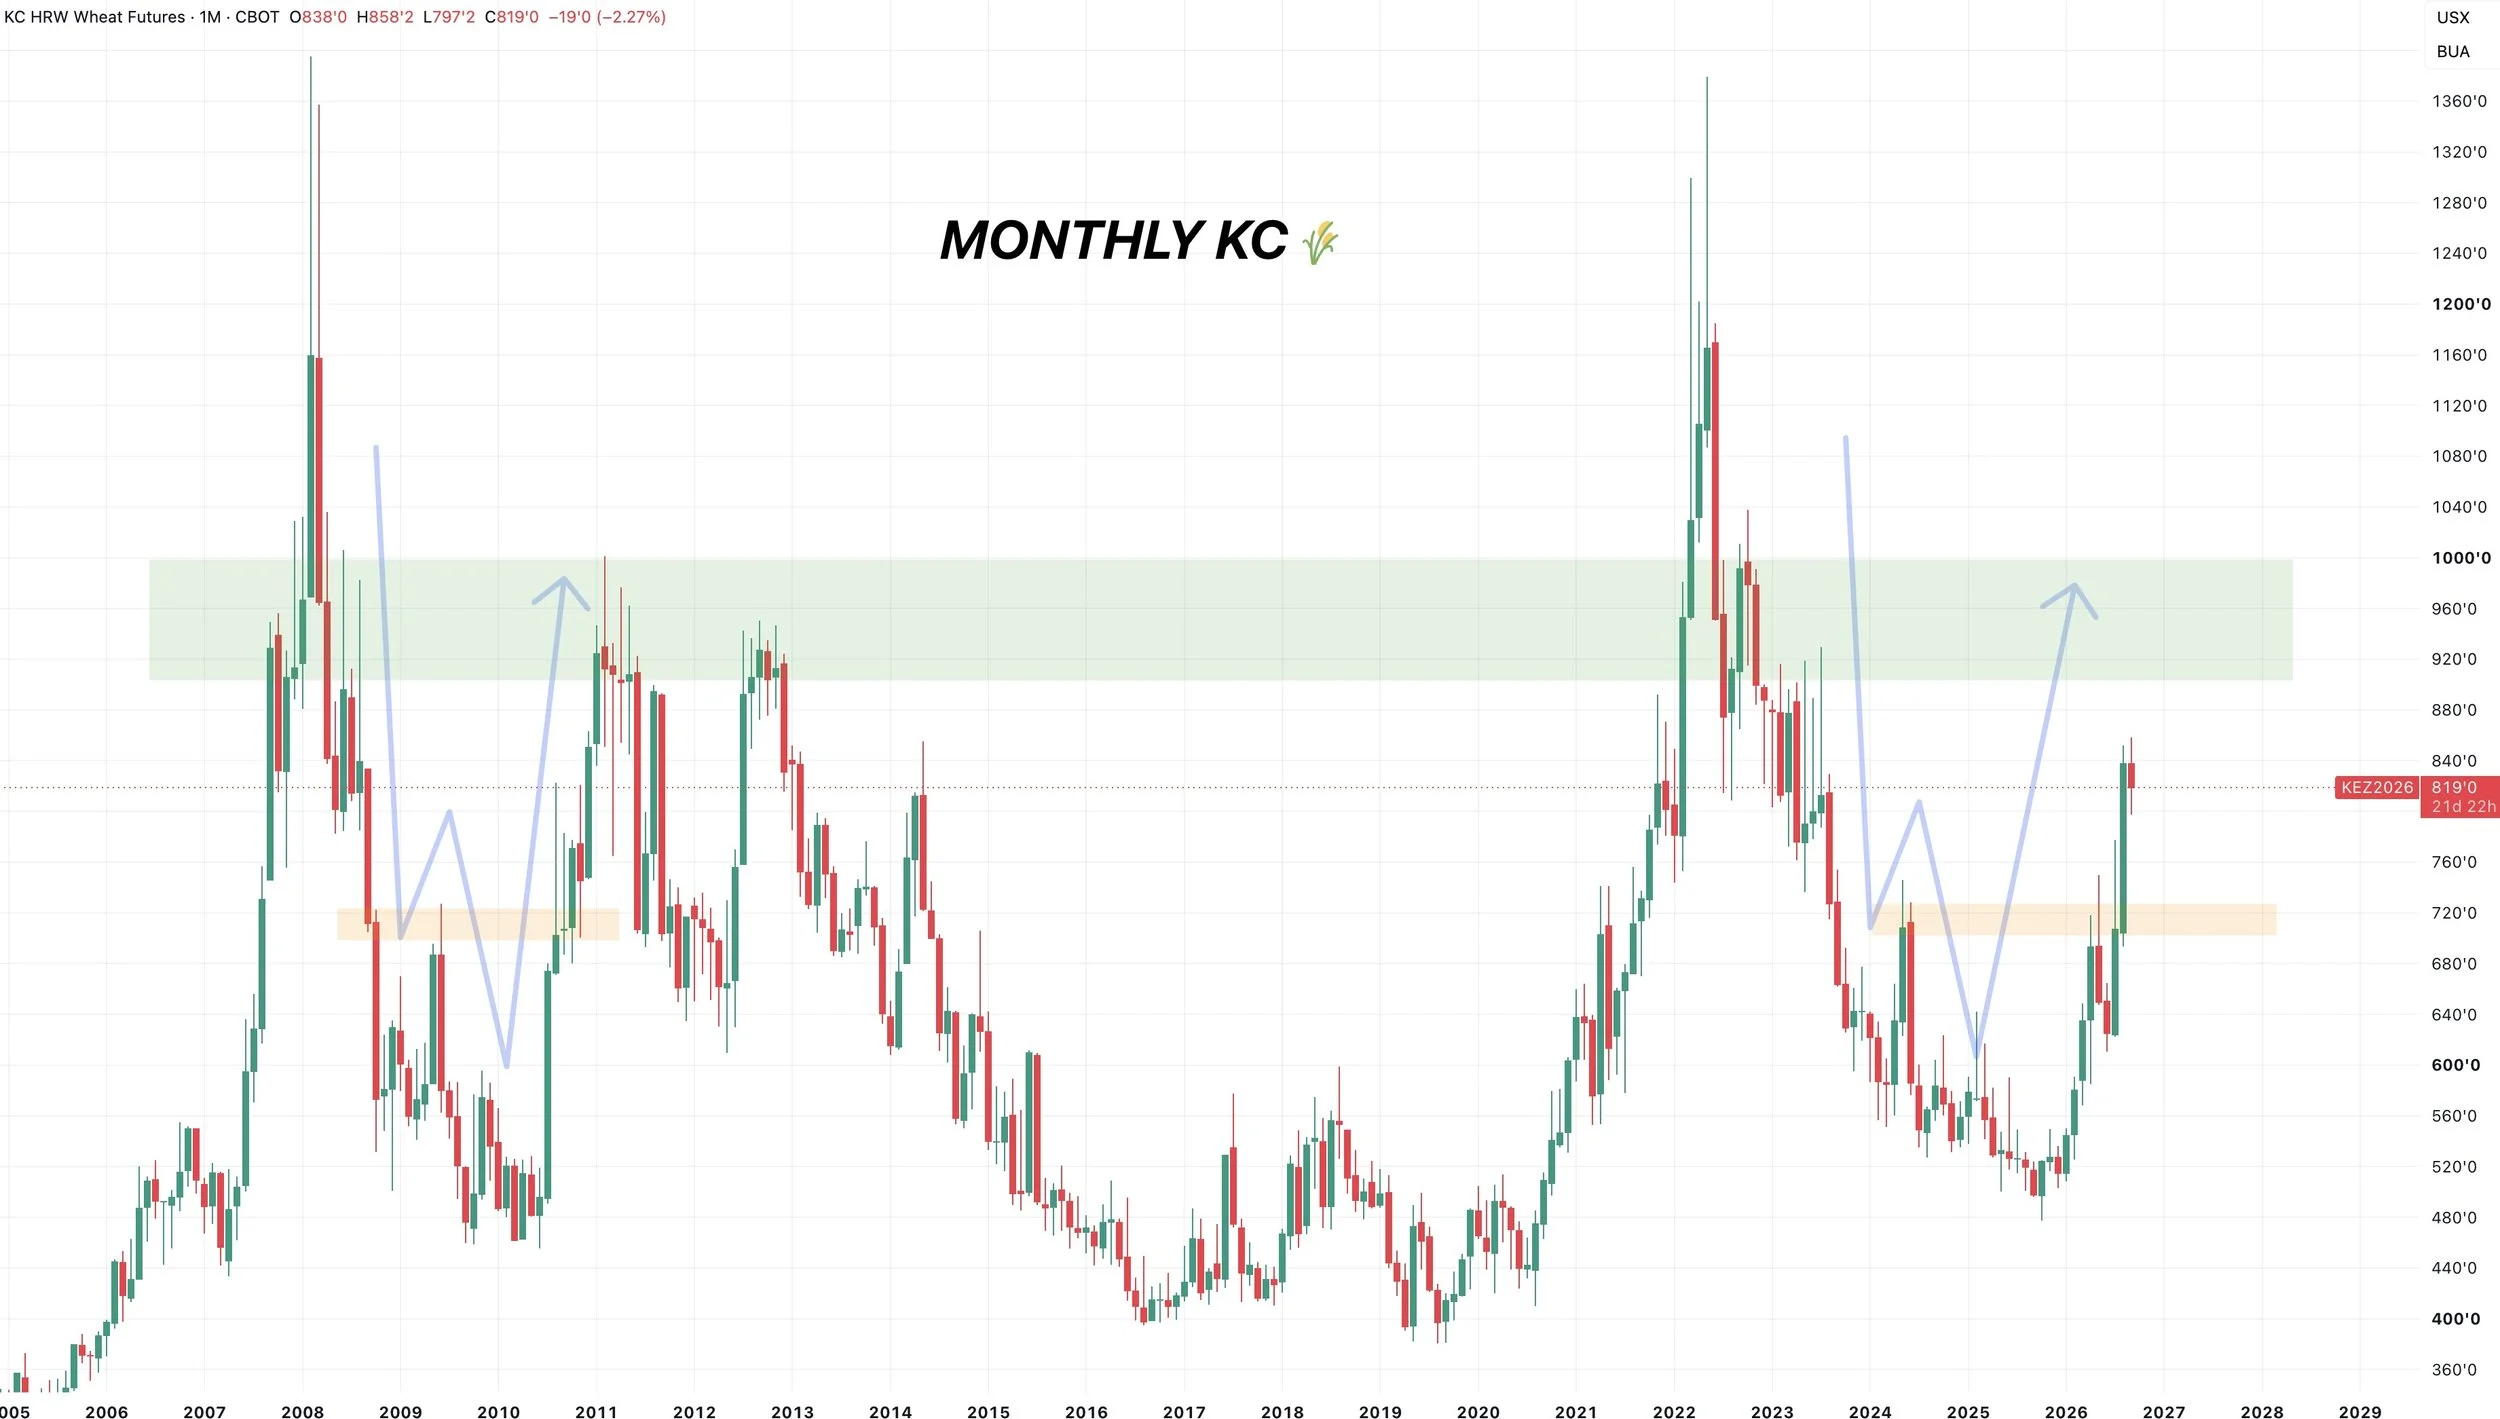
Monthly KC Chart:
If wheat gets into that $9 to $10 range (green box). That is where I would look to be very aggressive.
As there are only a handful months in the entire history of the wheat market where we have traded higher than that.
However, every major rally in wheat has led to at least $9.00
So that's something to note.
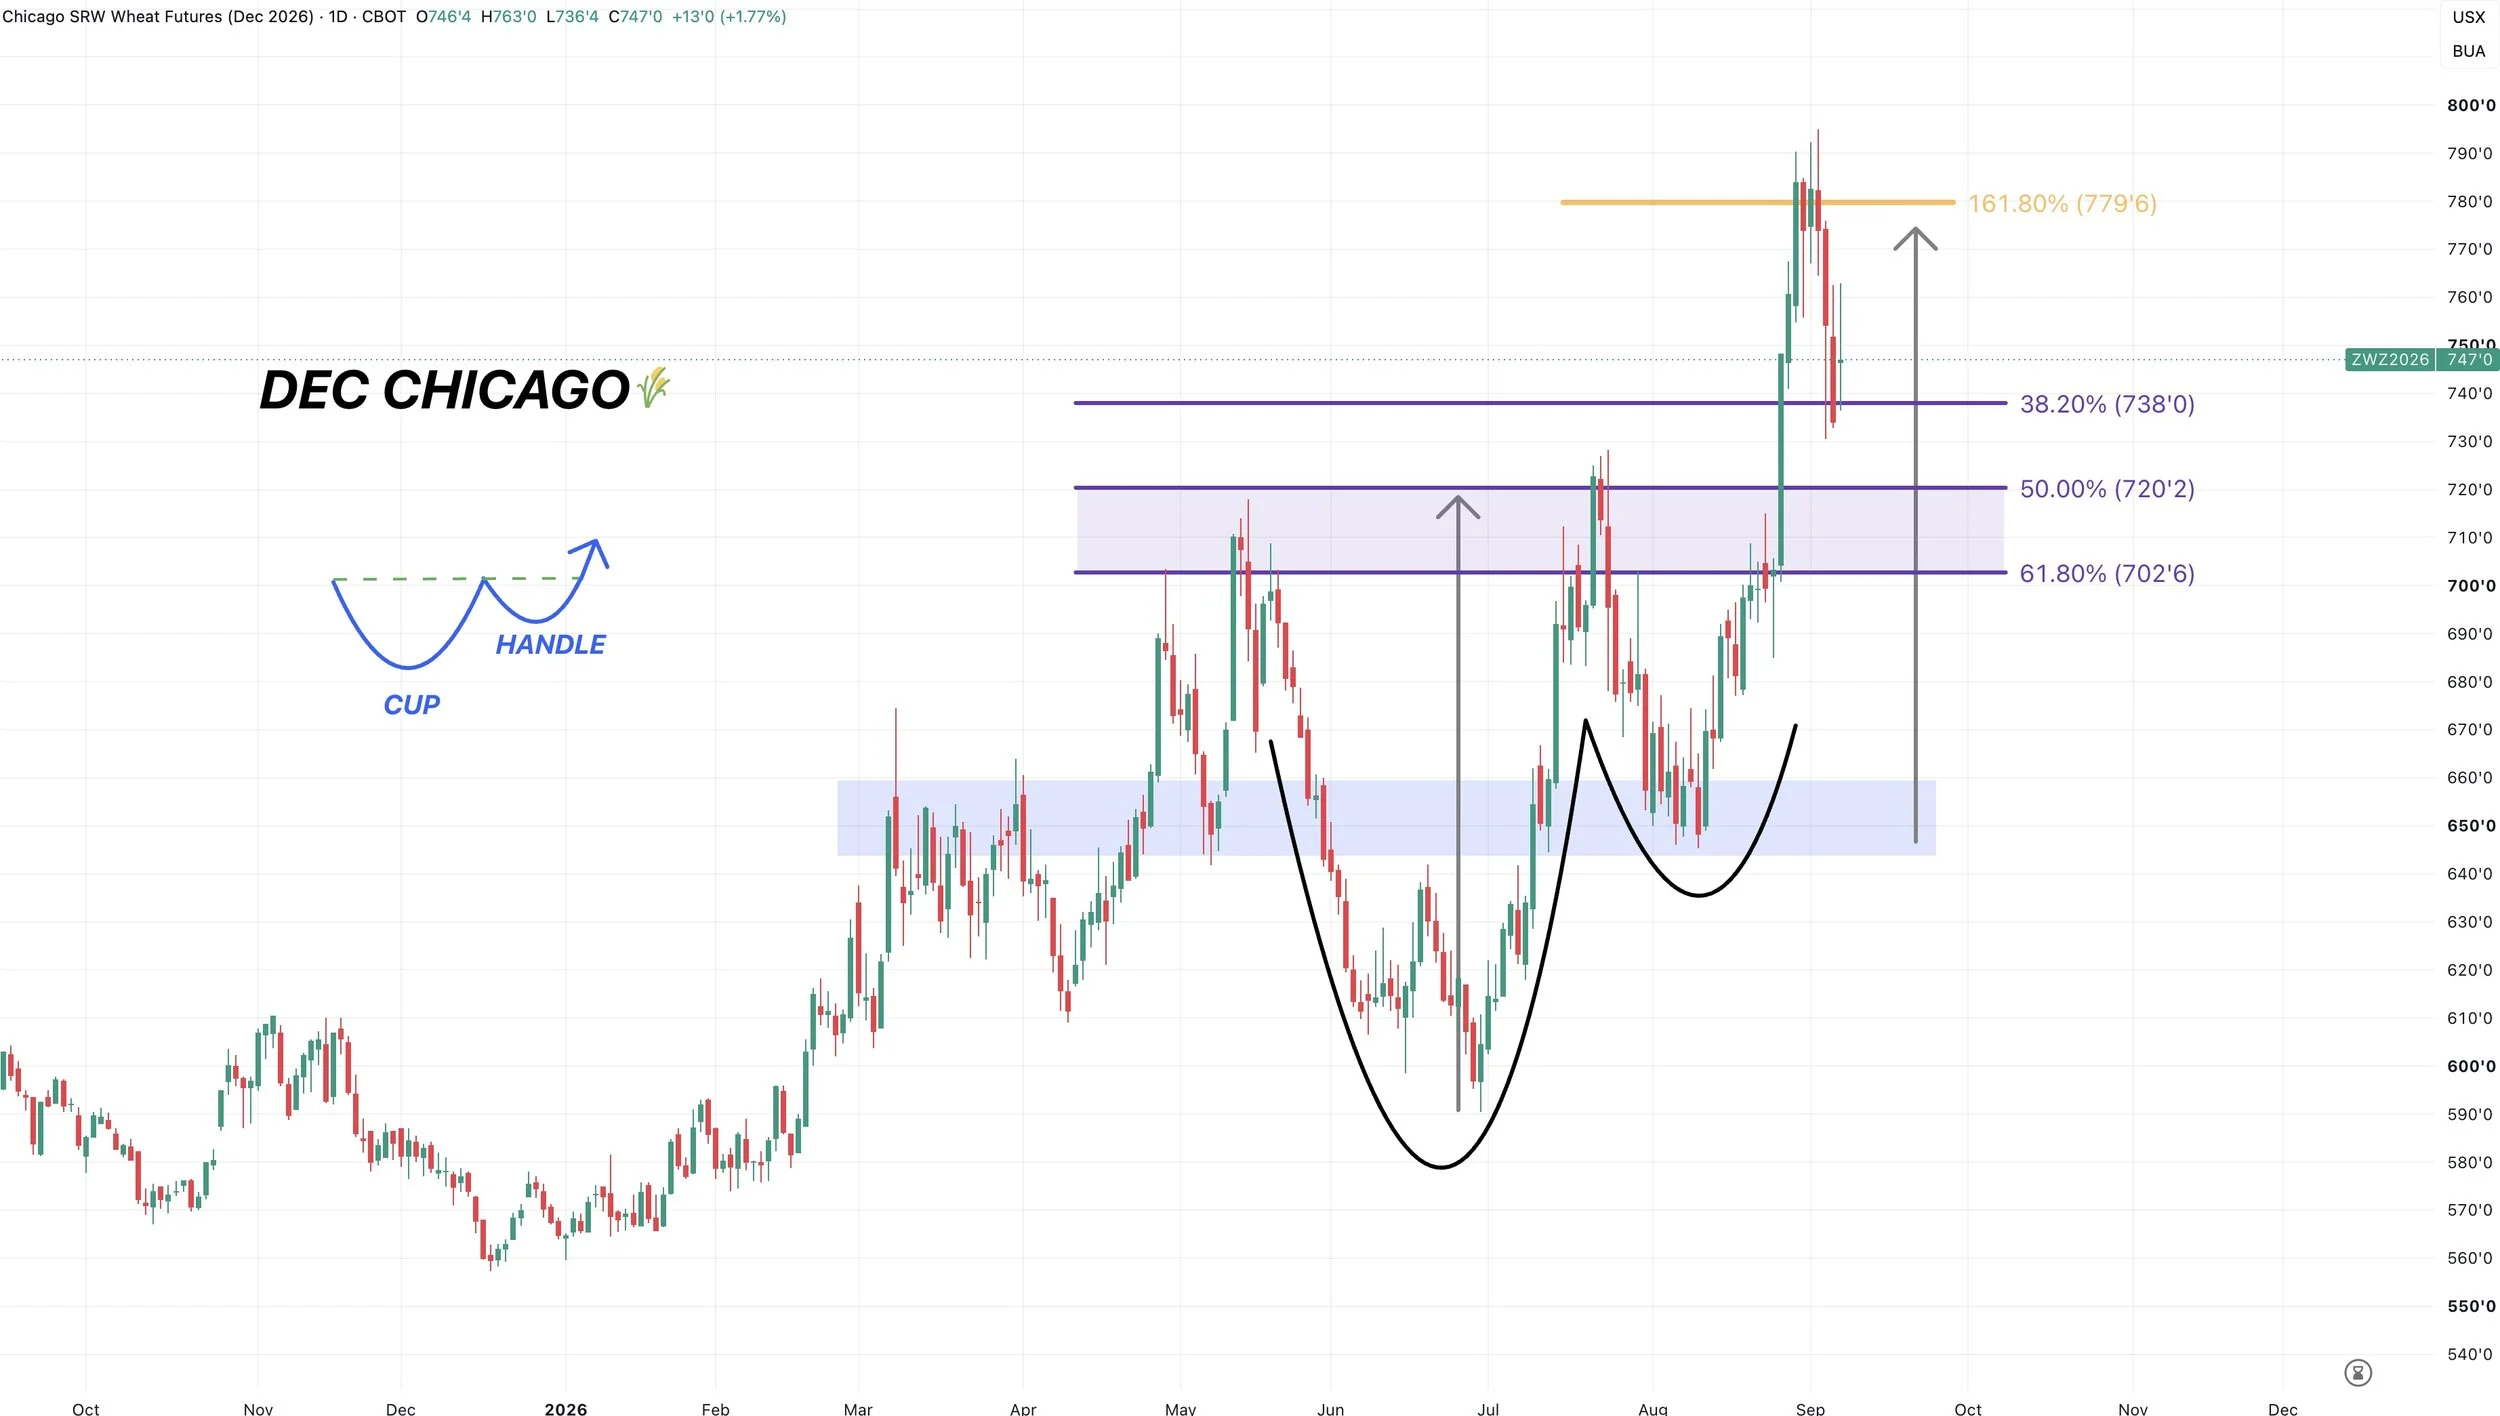
Dec Chicago Wheat:
Rejected right off that target we had talkled about.
So far we are holding the 38.2% retracement.
However, I think we could easily drop down into that golden zone (50-61.8%).
That zone also perfectly lines up with those highs.
Cattle
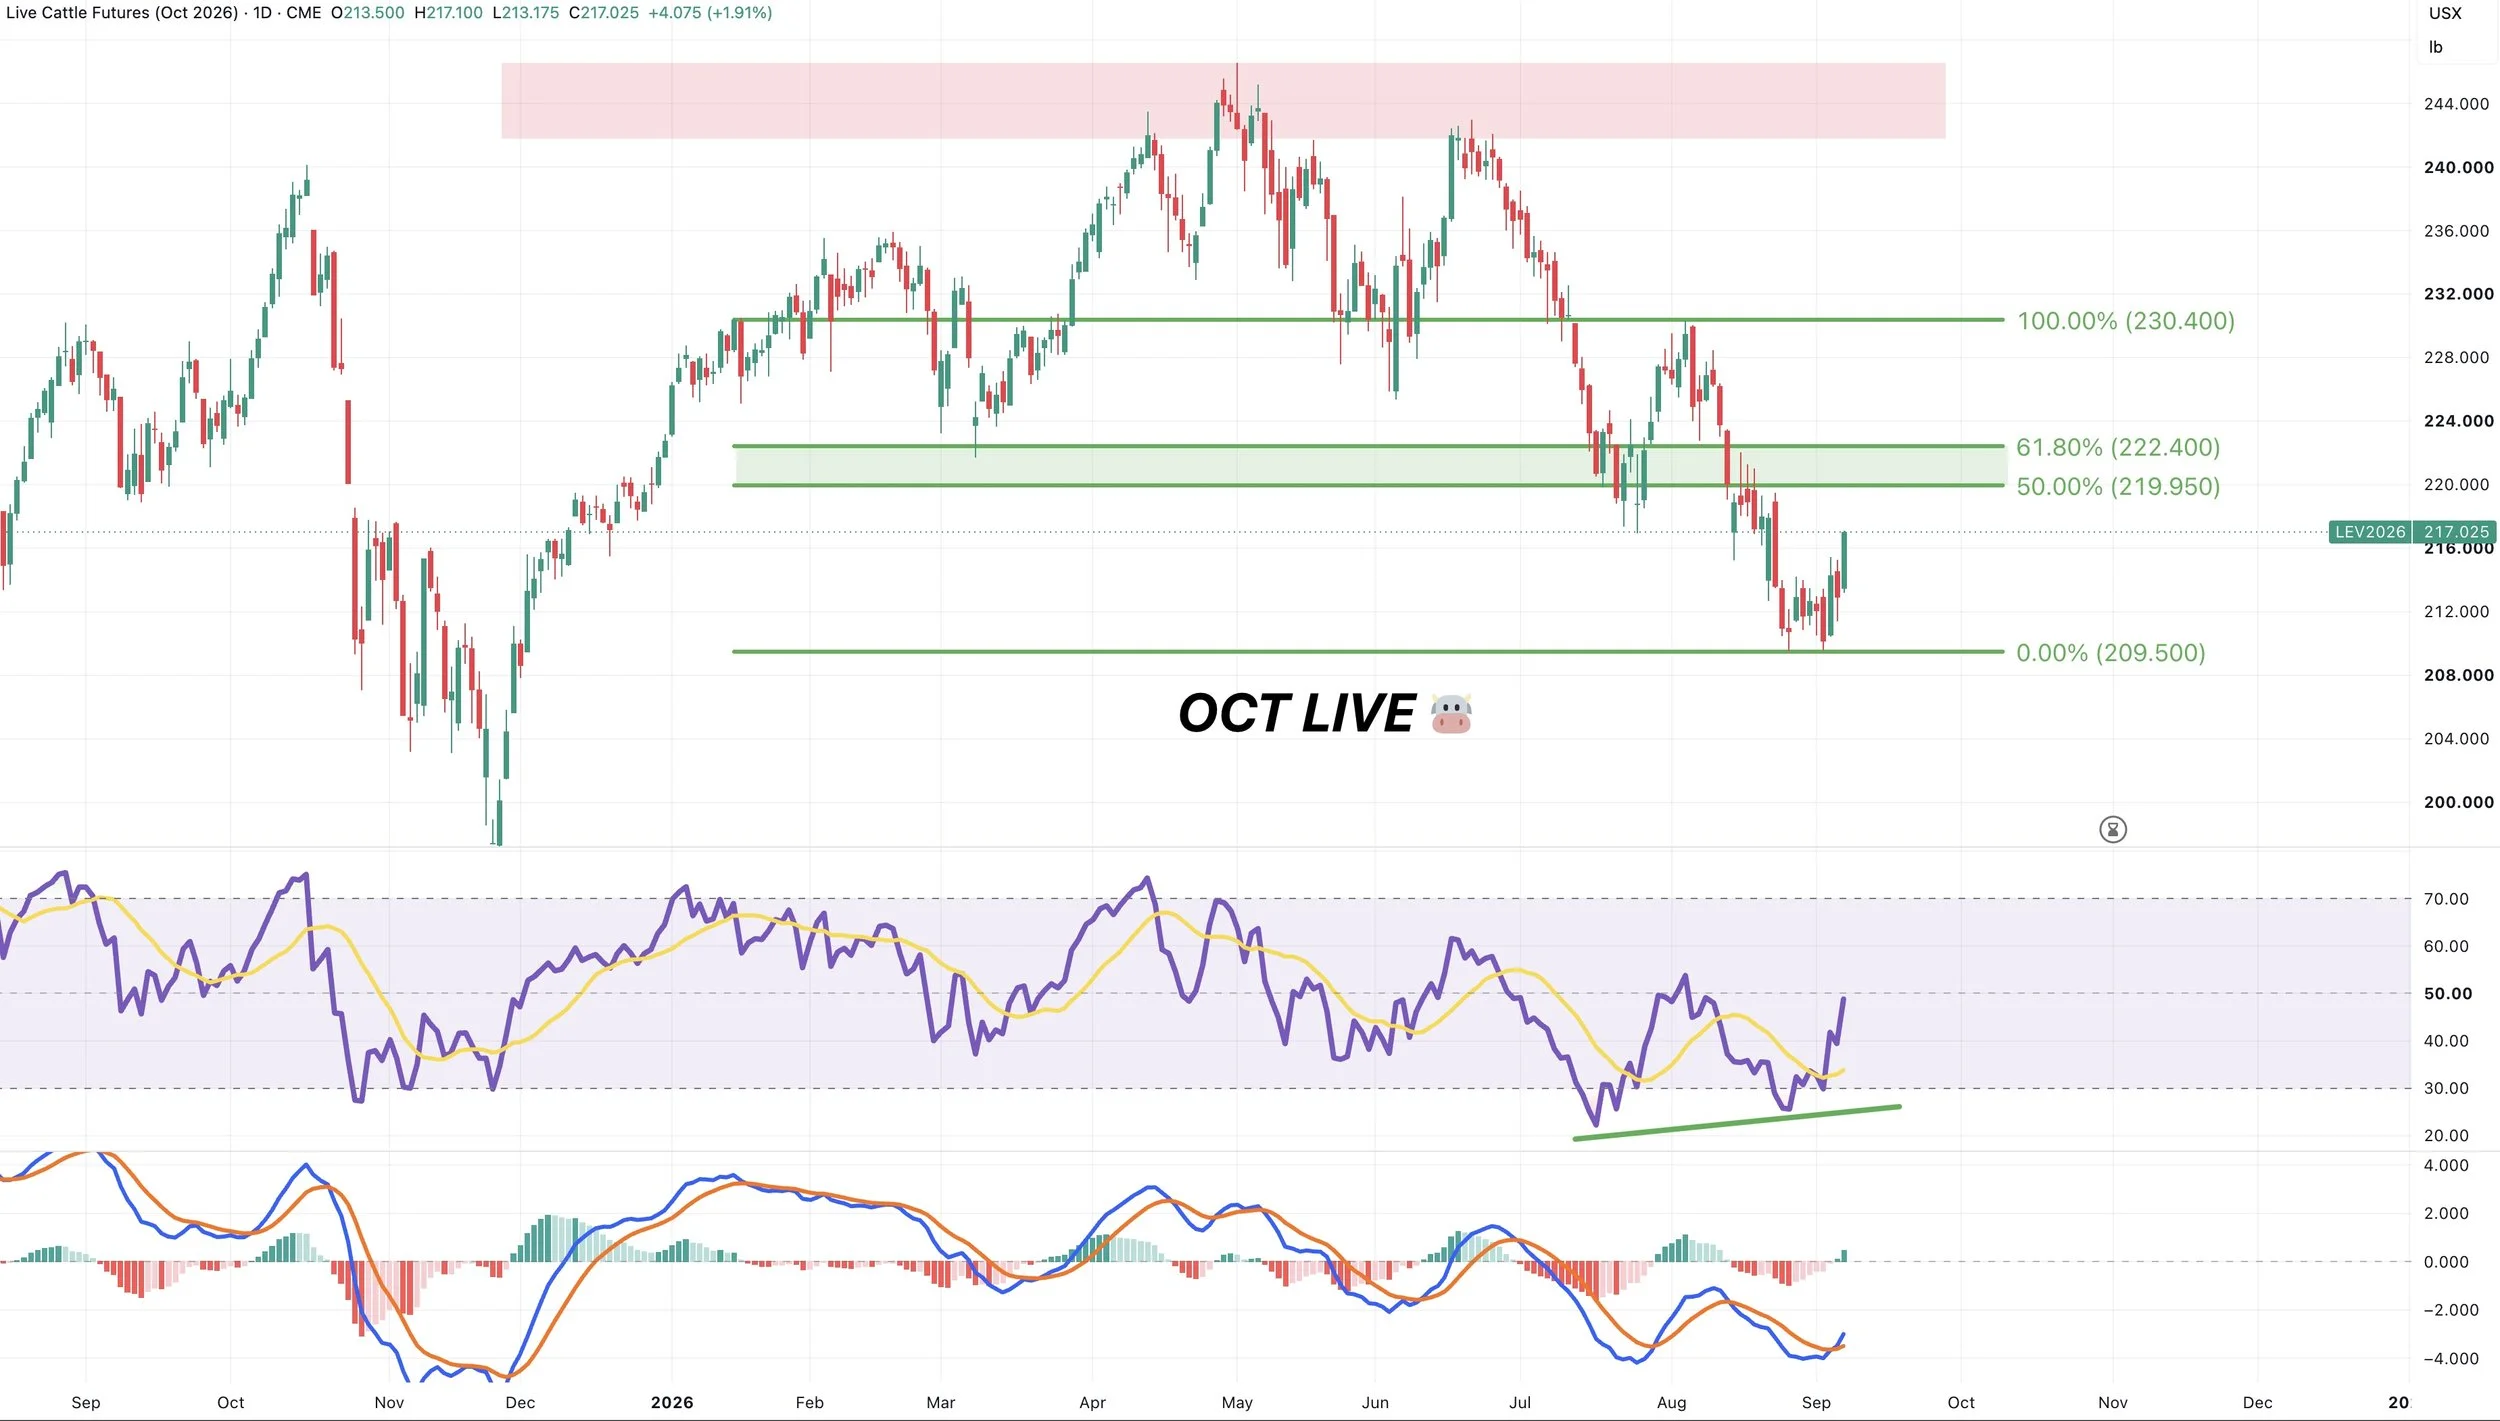
Oct Live Chart:
Cattle putting together a nice potential bottom here.
We have that bullish divergence on the RSI we had been talking about. The MACD also crossed bullish.
The first big resistance is going to be around 220 to 222.
That is the golden zone up to those recent August highs. It's also prior key support.
I think that could be an area to look to get some hedges. As for now, I still believe the trend is lower until proven otherwise.
But short term, I think we could continue to put together a relief bounce.
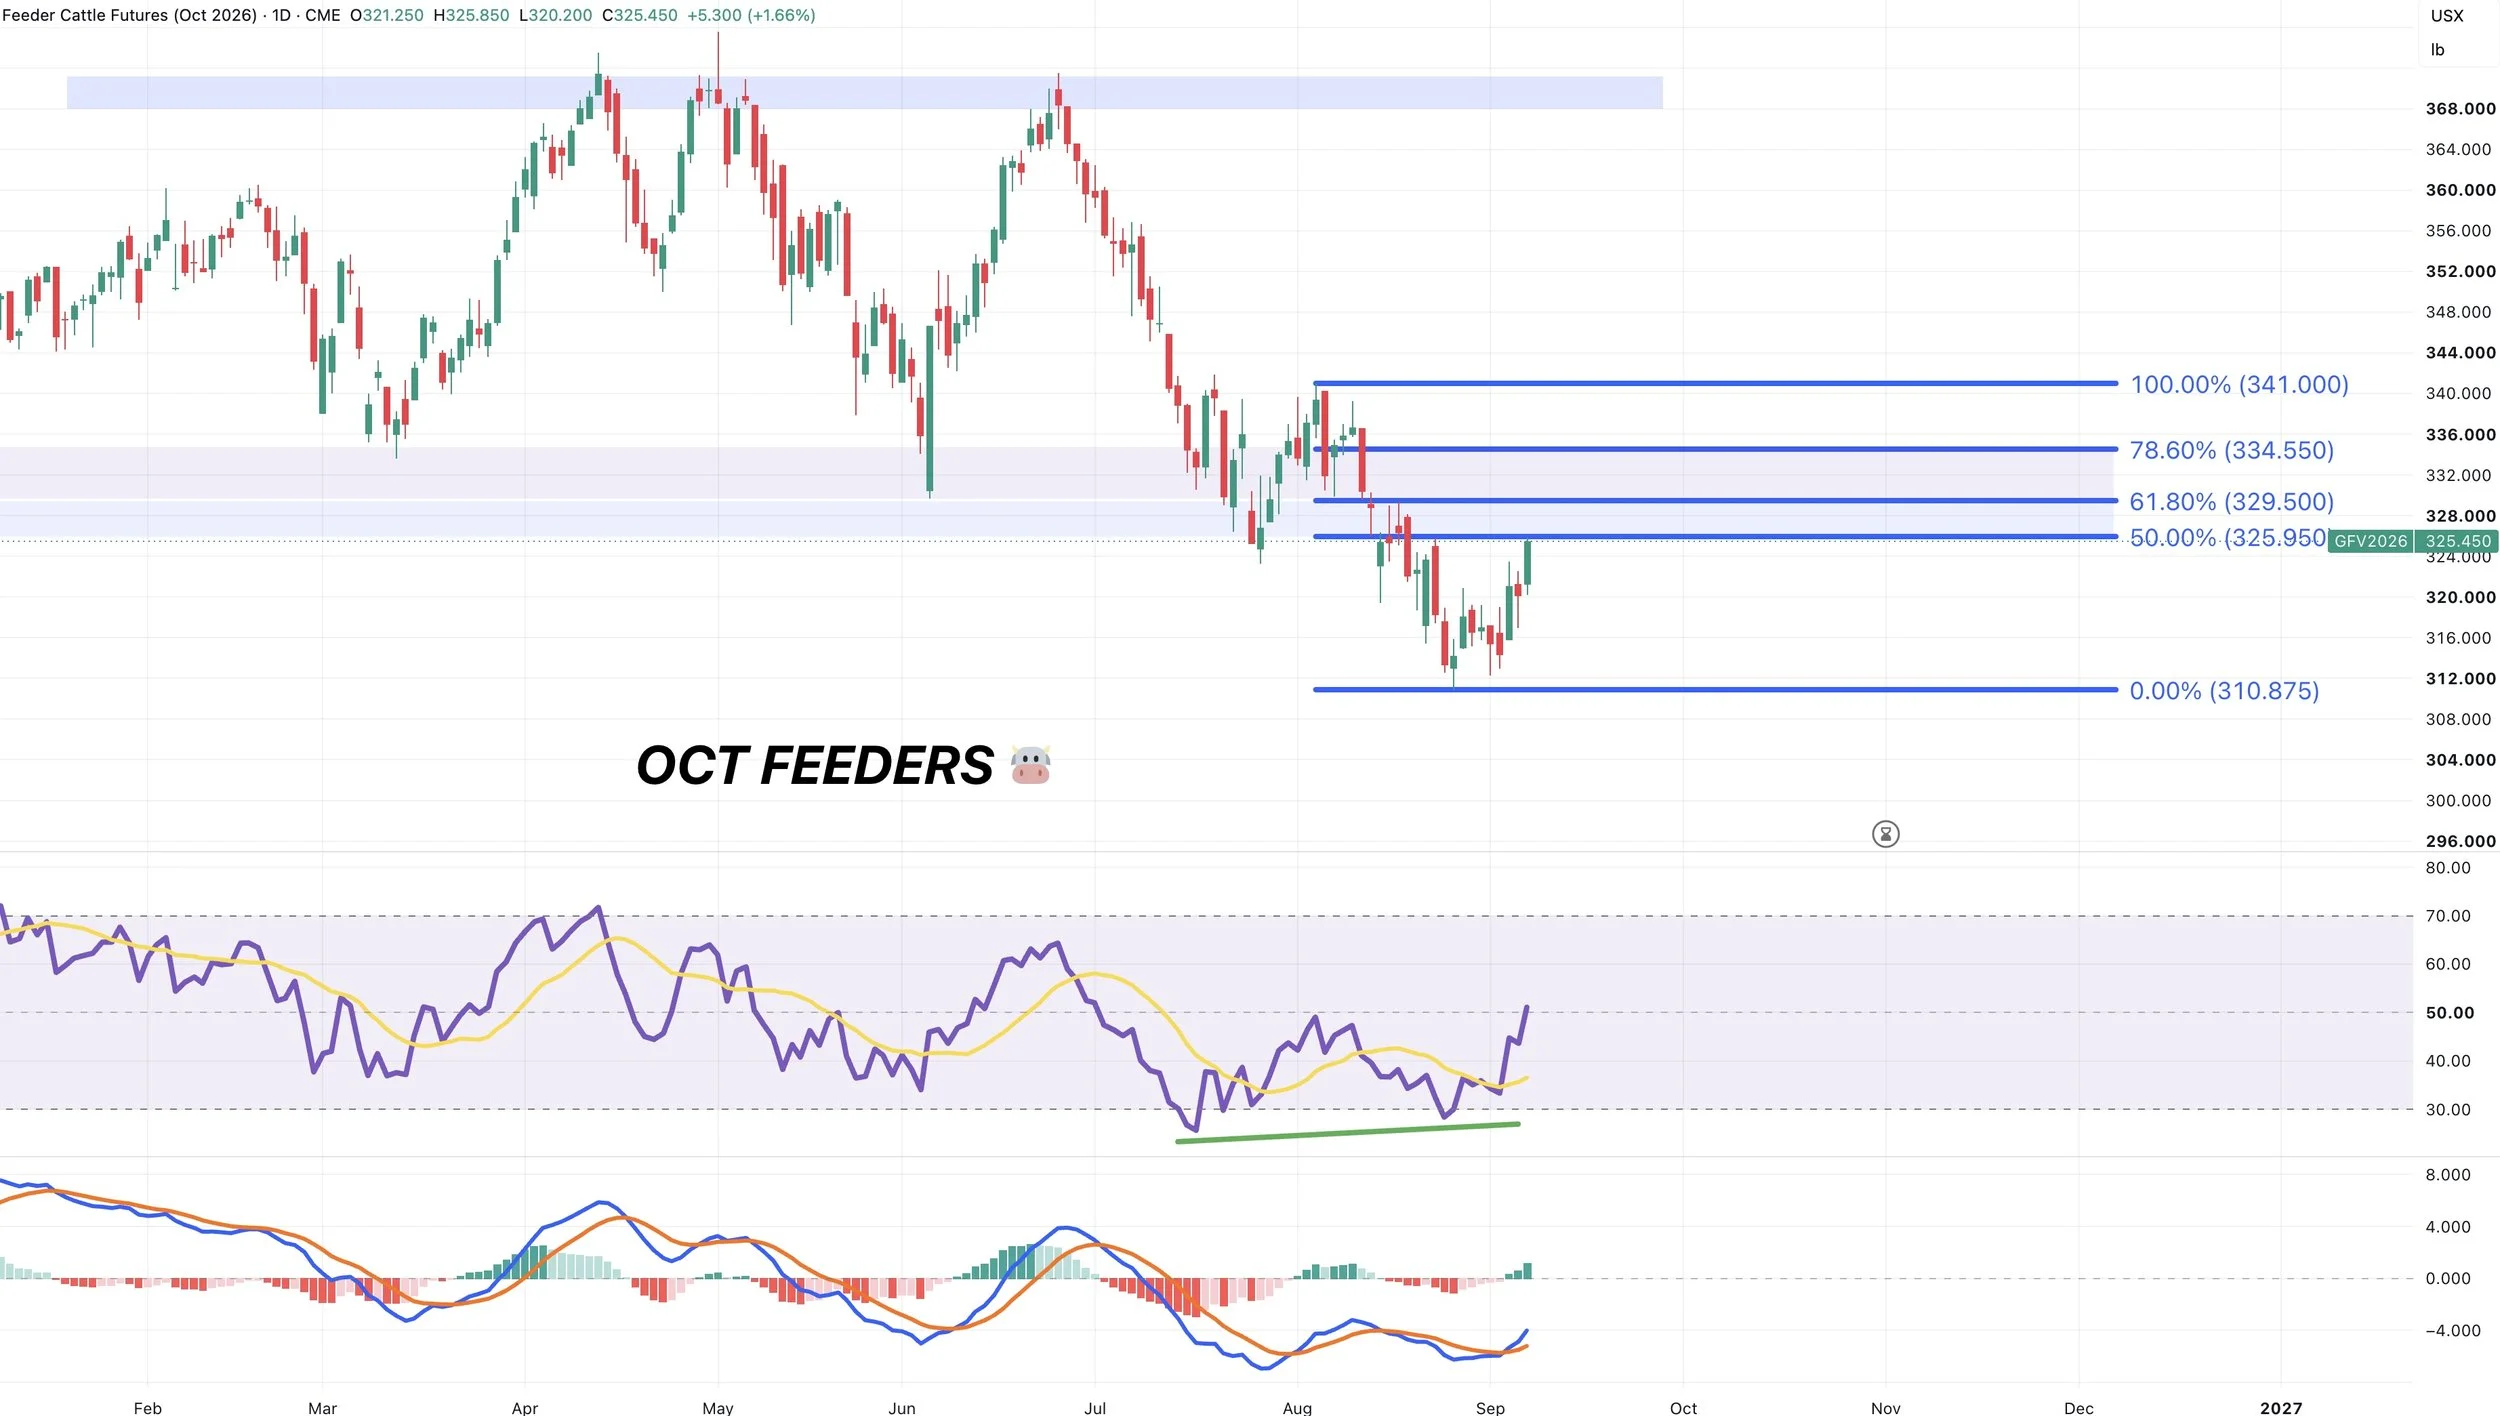
Oct Feeders Chart:
Similar set up here in feeders.
We are seeing that relief bounce we had been talking about with the bullish divergence and friendly indicators.
The overall trend is still lower for now. So I am still treating this as a simple relief bounce.
So far we have clawed back half of those August highs. Could find resistance around the 61.8% to 78.6% retracements and that prior support.
Want to Talk?
Our phones are open 24/7 for you guys if you ever need anything or want to discuss your operation.
Jeremey & Office: (806)484-1214
Sebastian: (605)280-1186
Email: sfrost@dailymarketminute.com
Hedge Account
Interested in a hedge account? Use the link below to set up an account or give us a call.