
MARKET UPDATE
You can scroll to read the usual update as well. As the written version is the exact same as the video.
Timestamps for video:
Overview: 0:00min
Corn Charts: 1:00min
Bean Charts: 7:00min
Wheat Charts: 10:30min
Grain Complex Charts: 13:30min
Cattle Charts: 14:10min
Want to talk?
Office: (806)484-1214
Futures Prices Close
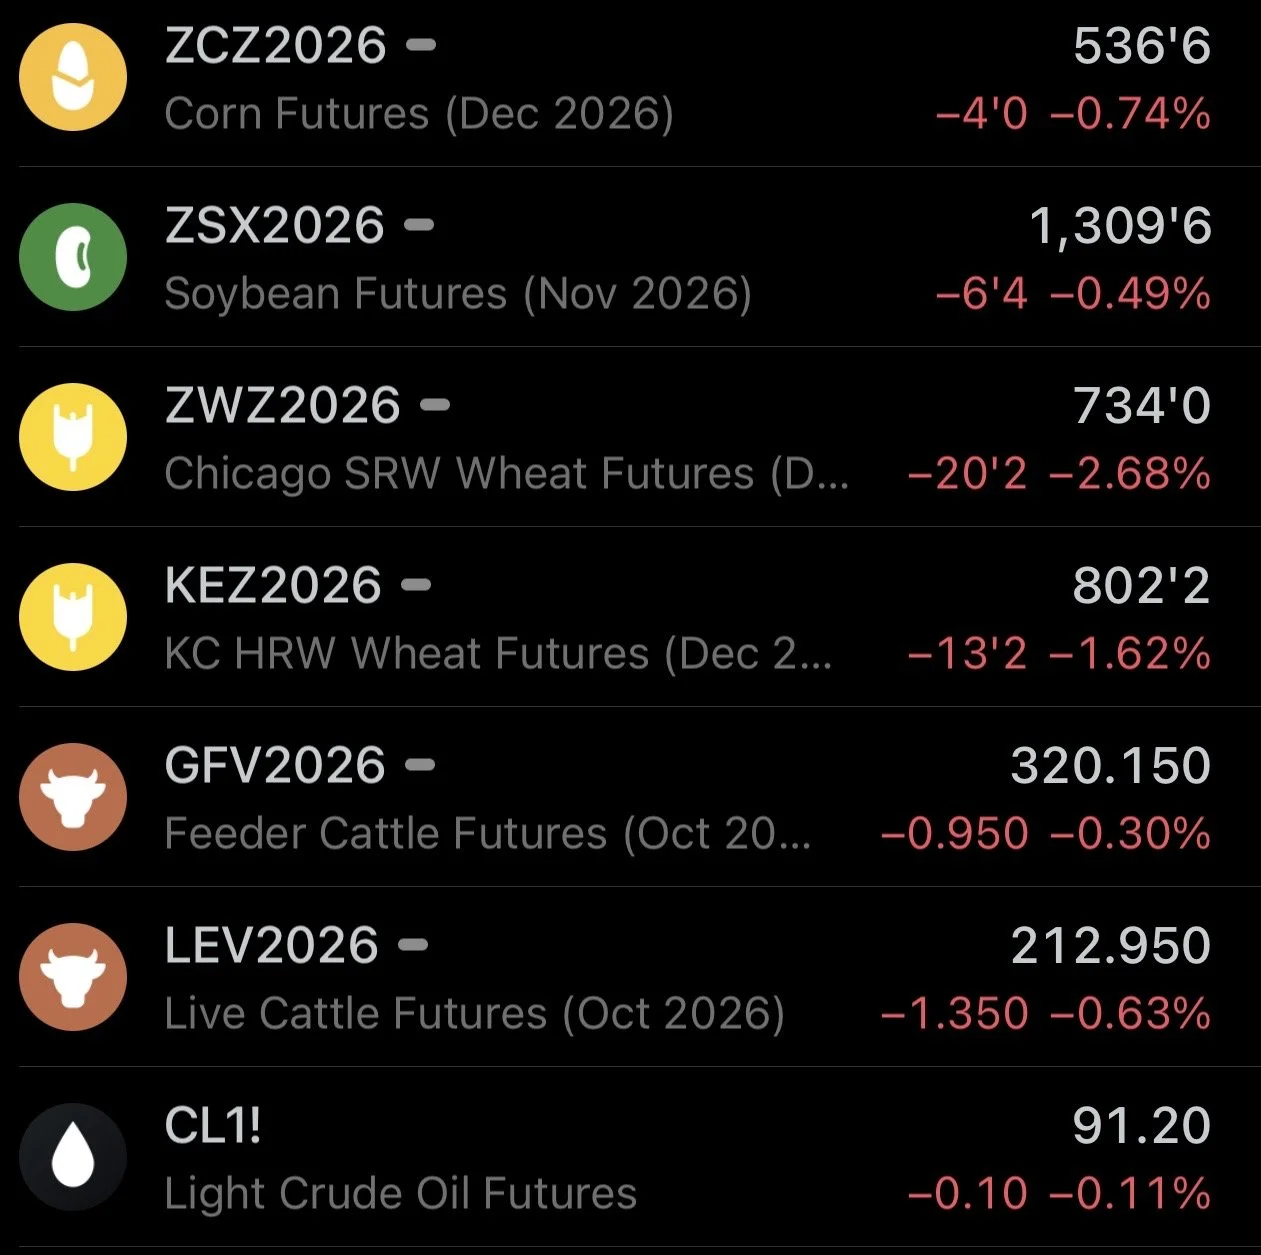
Overview
Grains and cattle all lower across the board.
Corn and wheat have been lower for 3 days in a row. This 3-day stretch is actually our longest red streak since July.
Yesterday we saw some wild movement, with wheat down hard. As Putin came out and said that there was a chance of a Ukraine Peace Deal.
If a deal was made, it would of course be negative for the wheat and corn market.

Today we're just going to be diving into a bunch of charts and things I'm watching on them.
We won't be covering any fundamentals as we've covered most of the fundamentals already, and the next big market mover is going to be that USDA report that is out on next Friday.
So all eyes are going to be on Friday as it's an important one.
I will also be going over some simple ways you can protect yourself ahead of that report.
The markets will be closed on Monday for Labor Day, so enjoy your long weekend.
Let's get right into the charts..
Today's Main Takeaways
Corn
Wednesday's Sell & Hedge Alert:
On Wednesday we issued is a corn sell signal and hedge alert.
If you missed it: Click Here
This signal was mostly for those who have to move stuff off the combine, if you lack storage, if you're short on time, or just behind in your marketing.
Those in a comfortable spot, we like staying plenty patient with the long term potential in these markets. We do not want to get ourselves oversold given the possible potential upside.
I think we have a ton of upside potential long term, but short term there are risks, and we hit some target levels and an area where some of you should be considering doing something.
Inside the alert we went over some strategies you could consider as well. Such as if you'd like to keep your upside open.
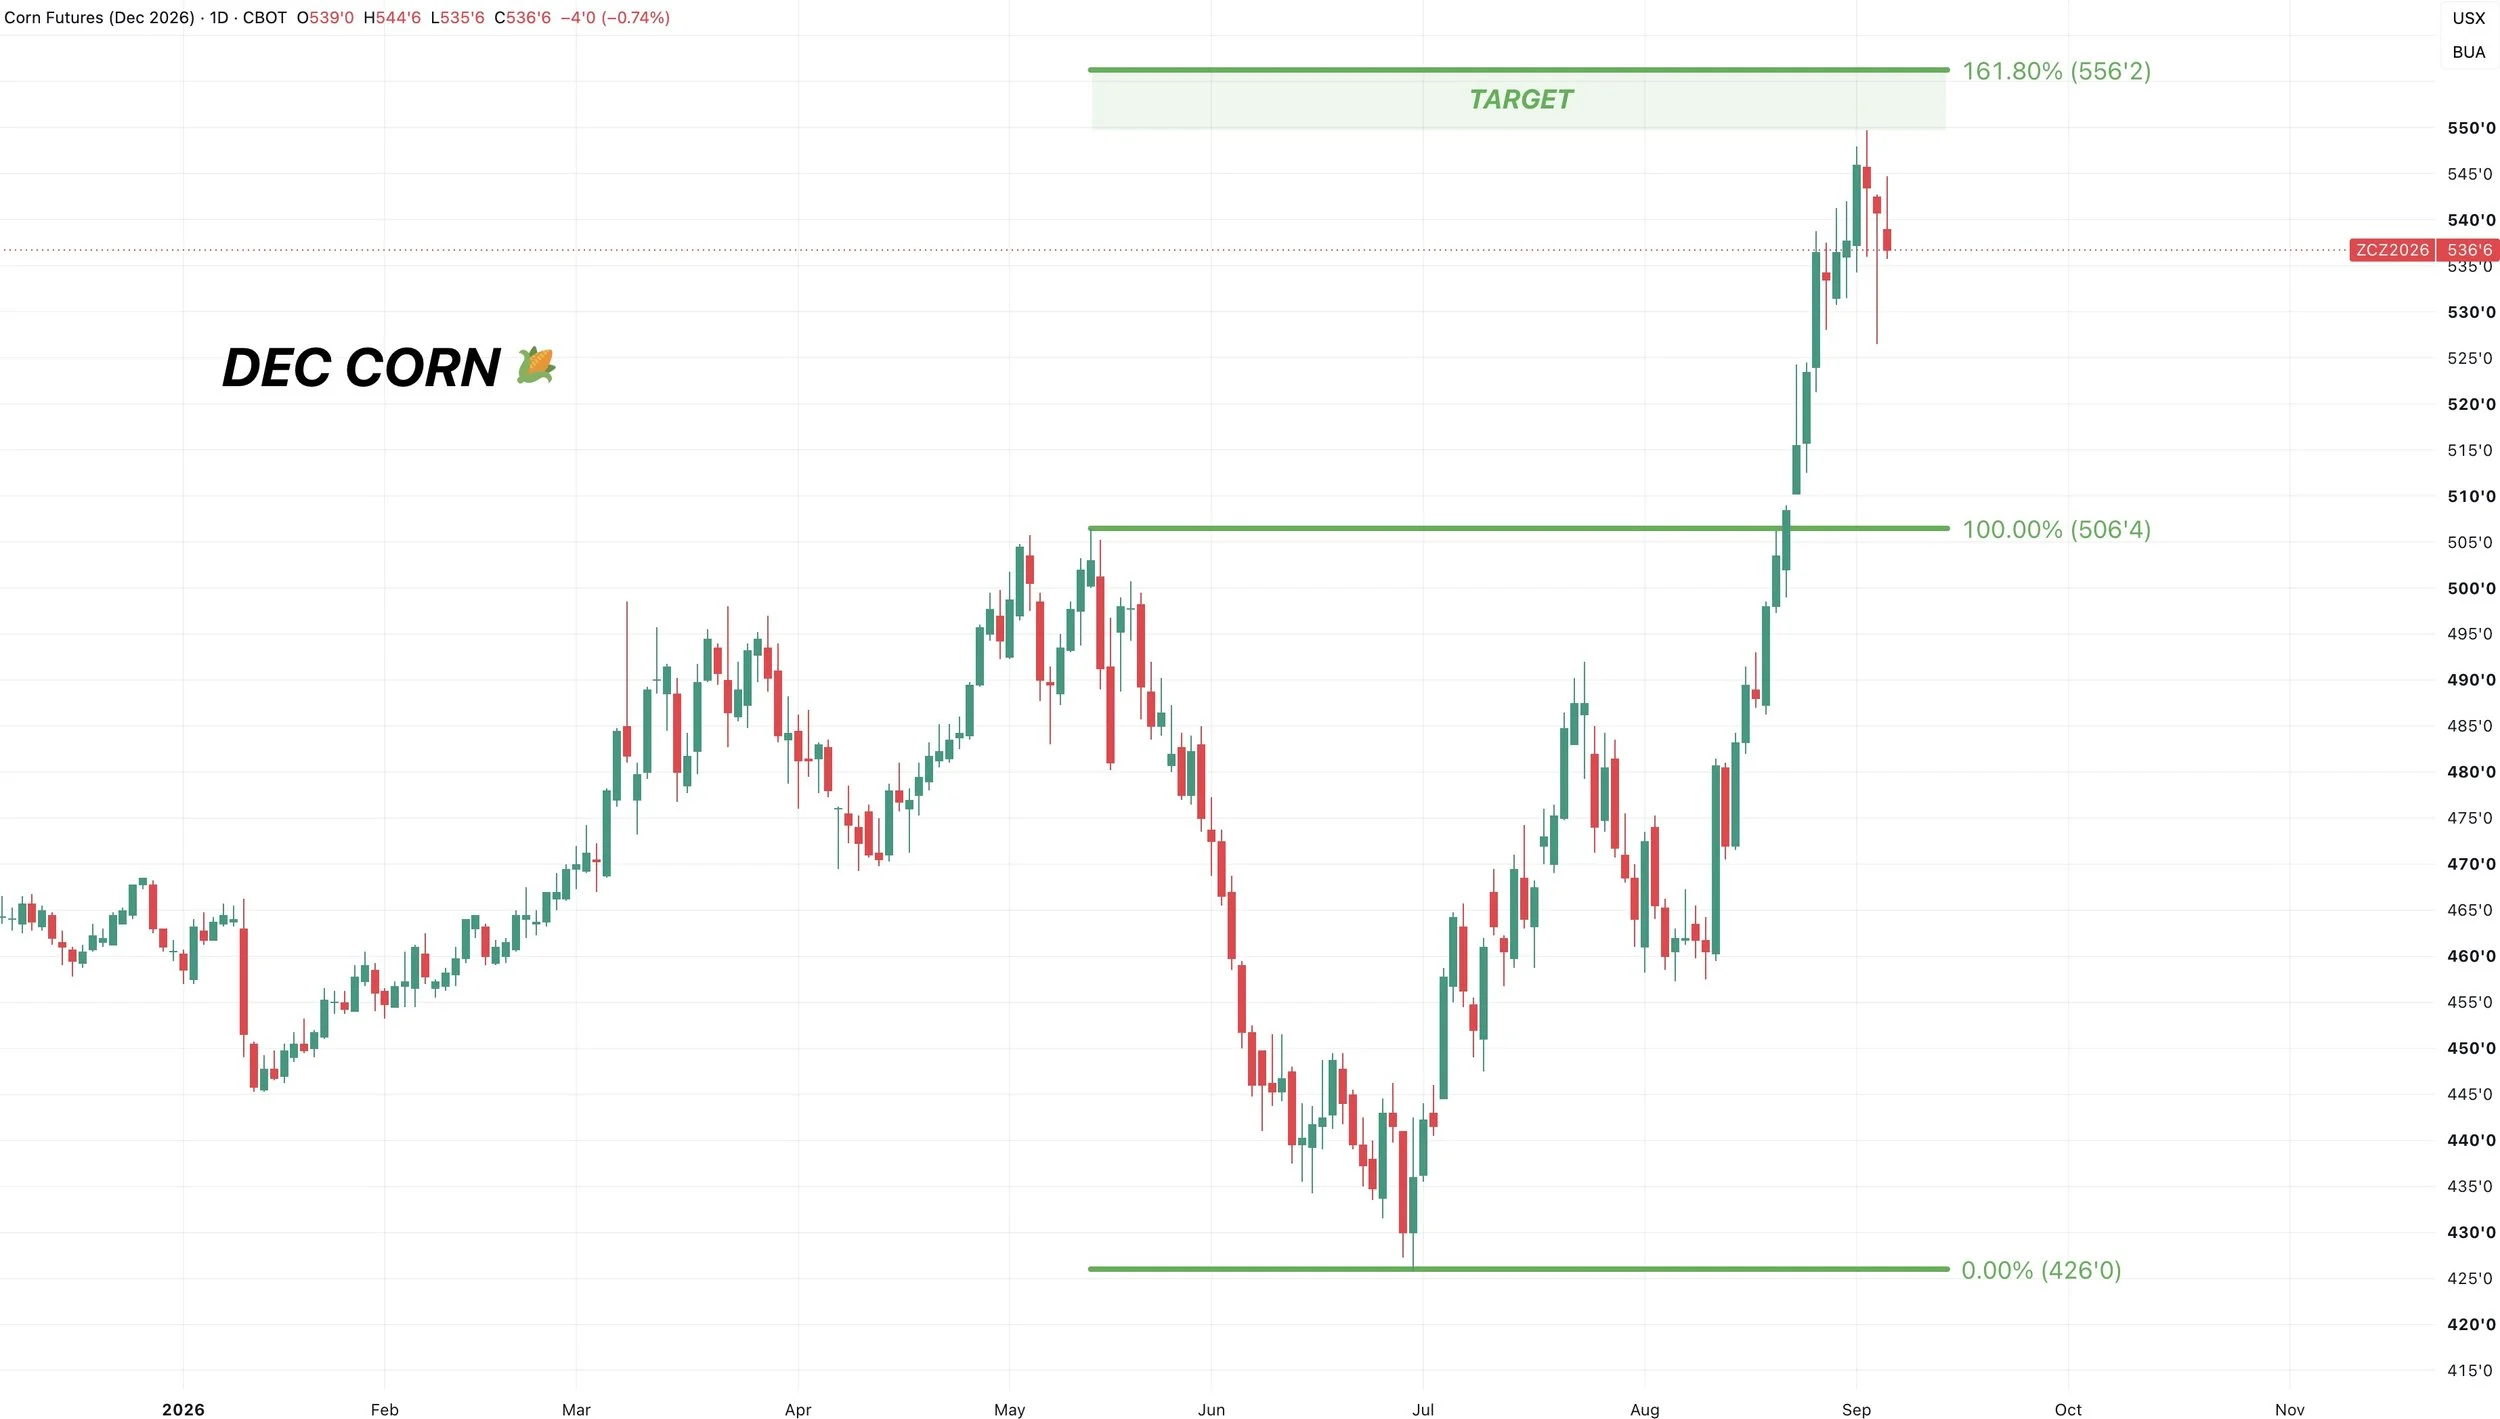
Dec Corn Chart:
This was the reason for the signal.
We ran right up near that target of $5.50 to $5.55
We're now seeing some pressure for the first time this entire rally. Corn has been lower for 3 straight days in a row.
Before this, we had only seen 3 red days the last entire month.
This is really the very first sign of possible weakness we have seen.
We've seen some crazy wicks the last two days.
Yesterday corn was +14 cents off the lows. Wednesday it was almost +8 cents off the lows. Today we saw the opposite and closed well off the highs.
Yesterday's lows will be a key spot. If we break below, it could very well spark a decent leg lower.
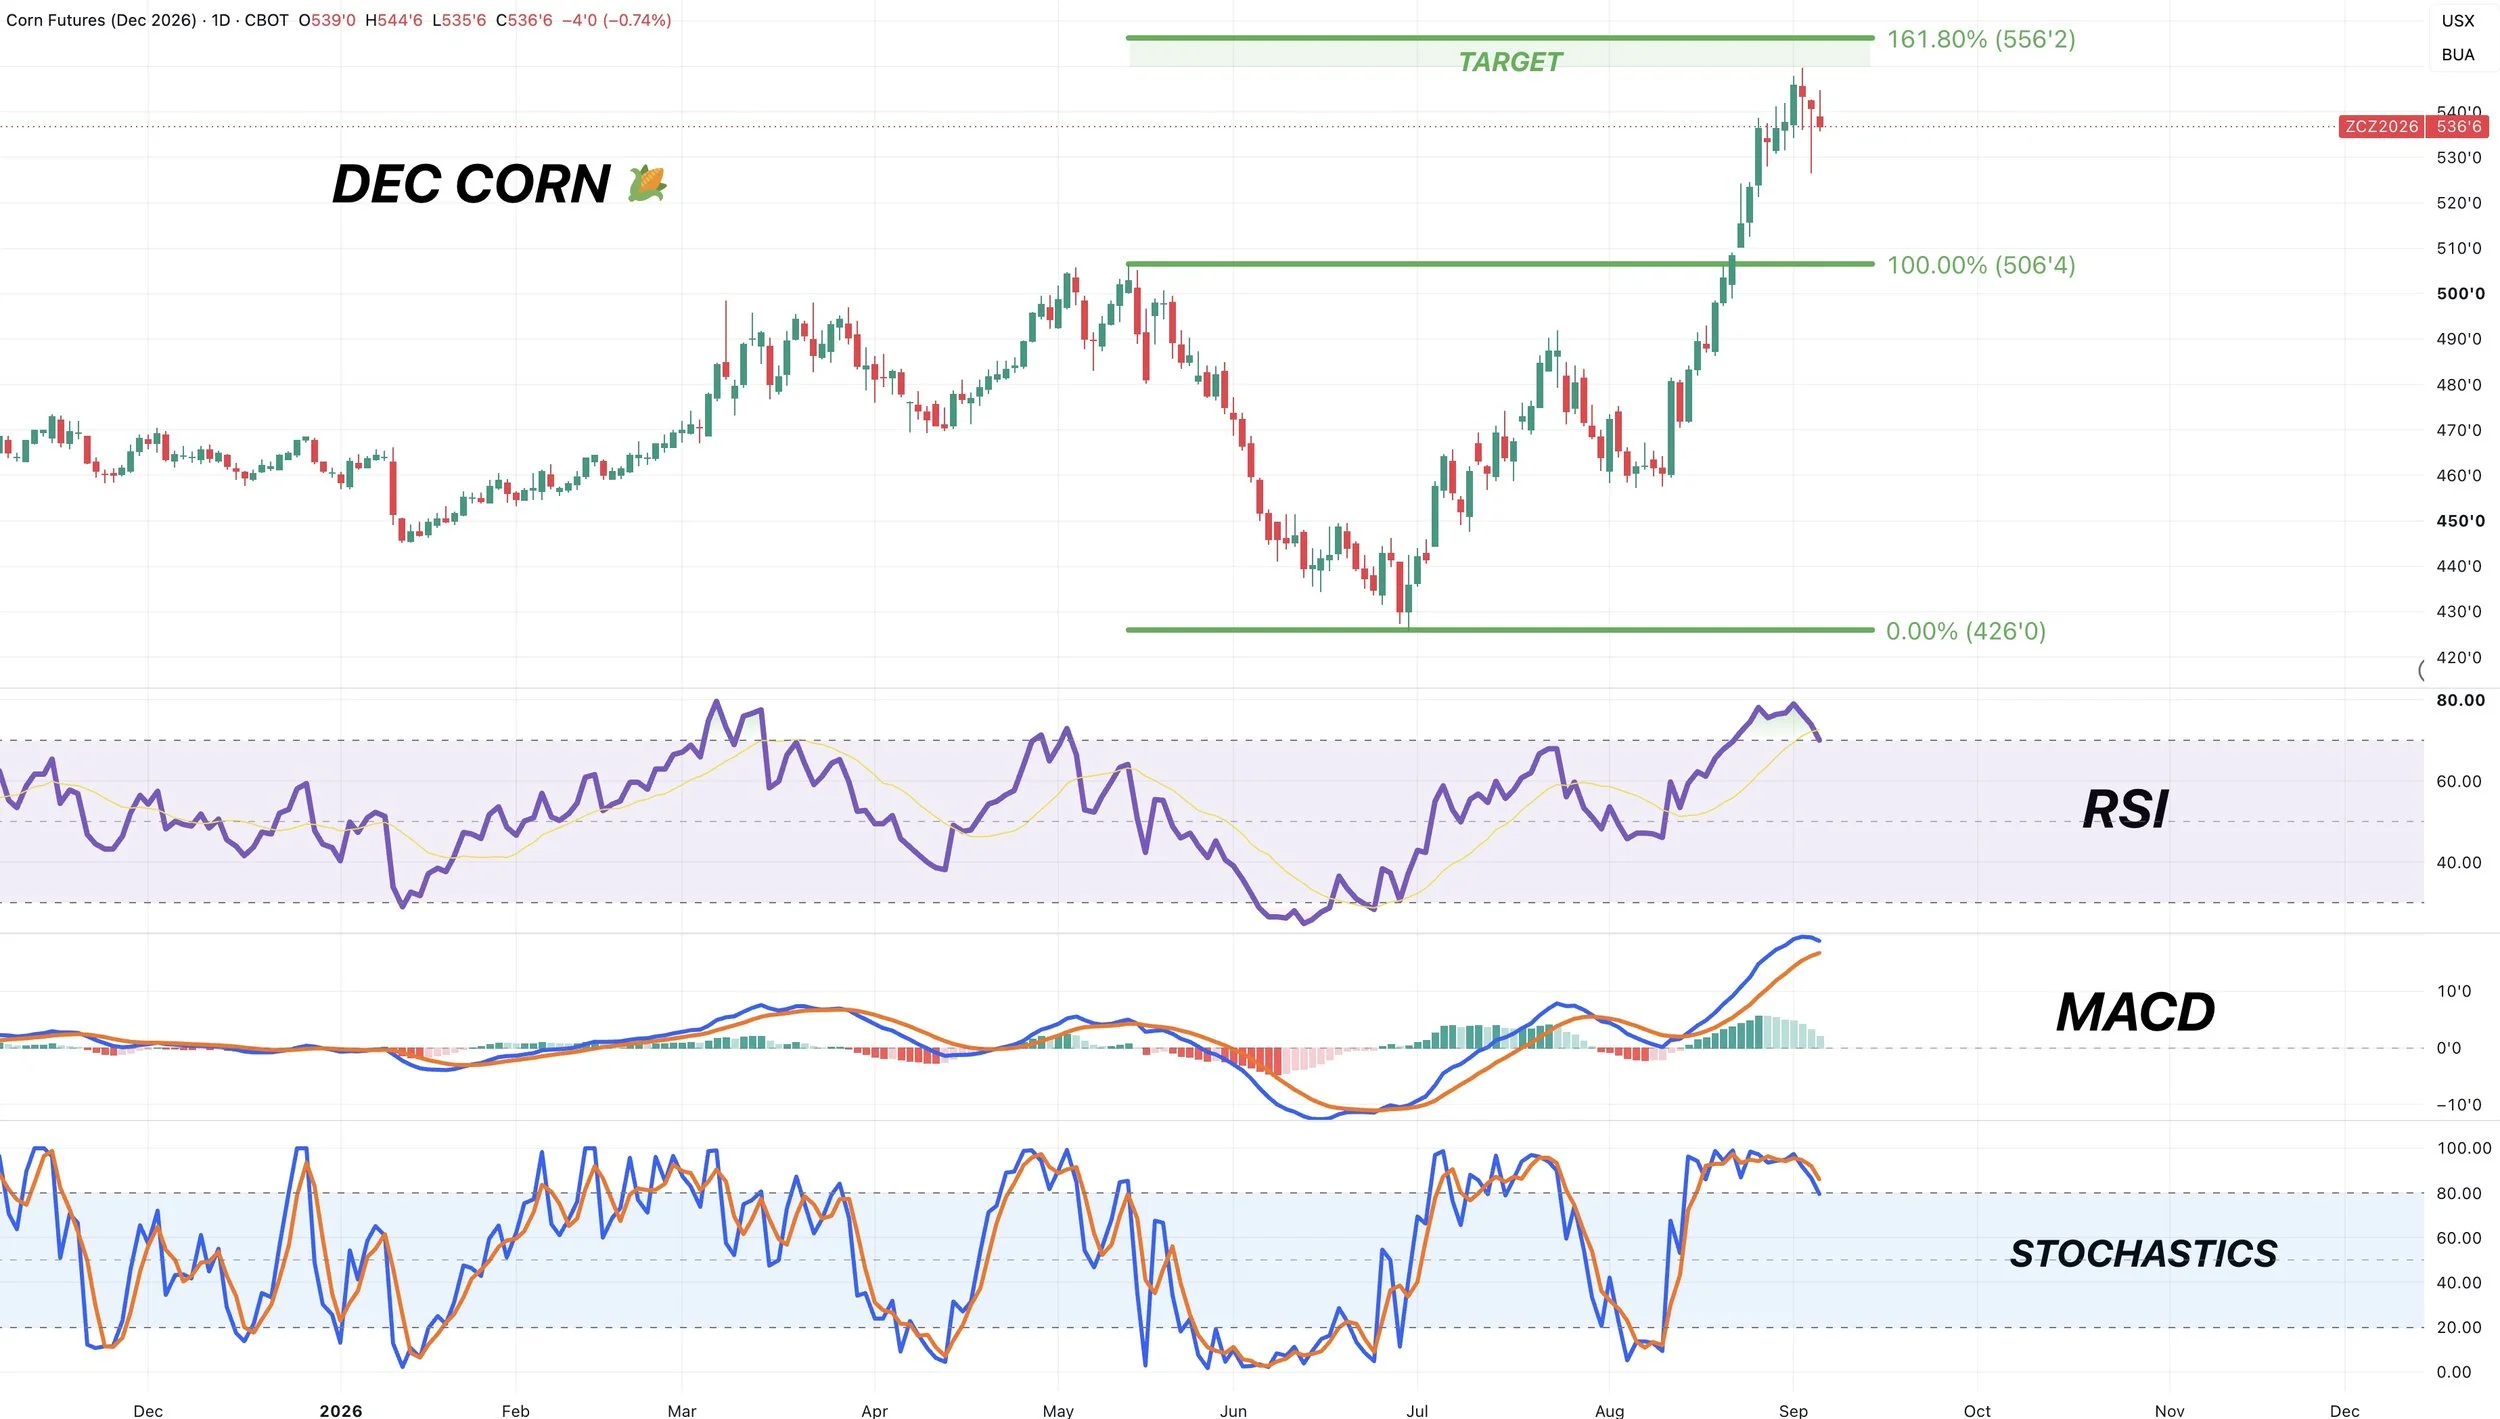
The other reason for the alert two days ago was that we were simply getting very overbought.
Look at how over extended the RSI was.
Sometimes a market needs to catch it's breath.
The stochastics can stay overbought for a while, but often times they need to cool down for a bottom. As the last several bottoms have came with oversold stocastics. So that'll be something to watch if we pullback.
If we look at the MACD, it is also starting to curl lower and getting close to crossing bearish. It has not happened yet, but this would be another reason why a pullback would not be surprising here.
A pullback in this market would be completely healthy after a near $1.00 run the last few weeks without stopping.
And it would not take much for us to see a decent pullback given the size of the recent run.
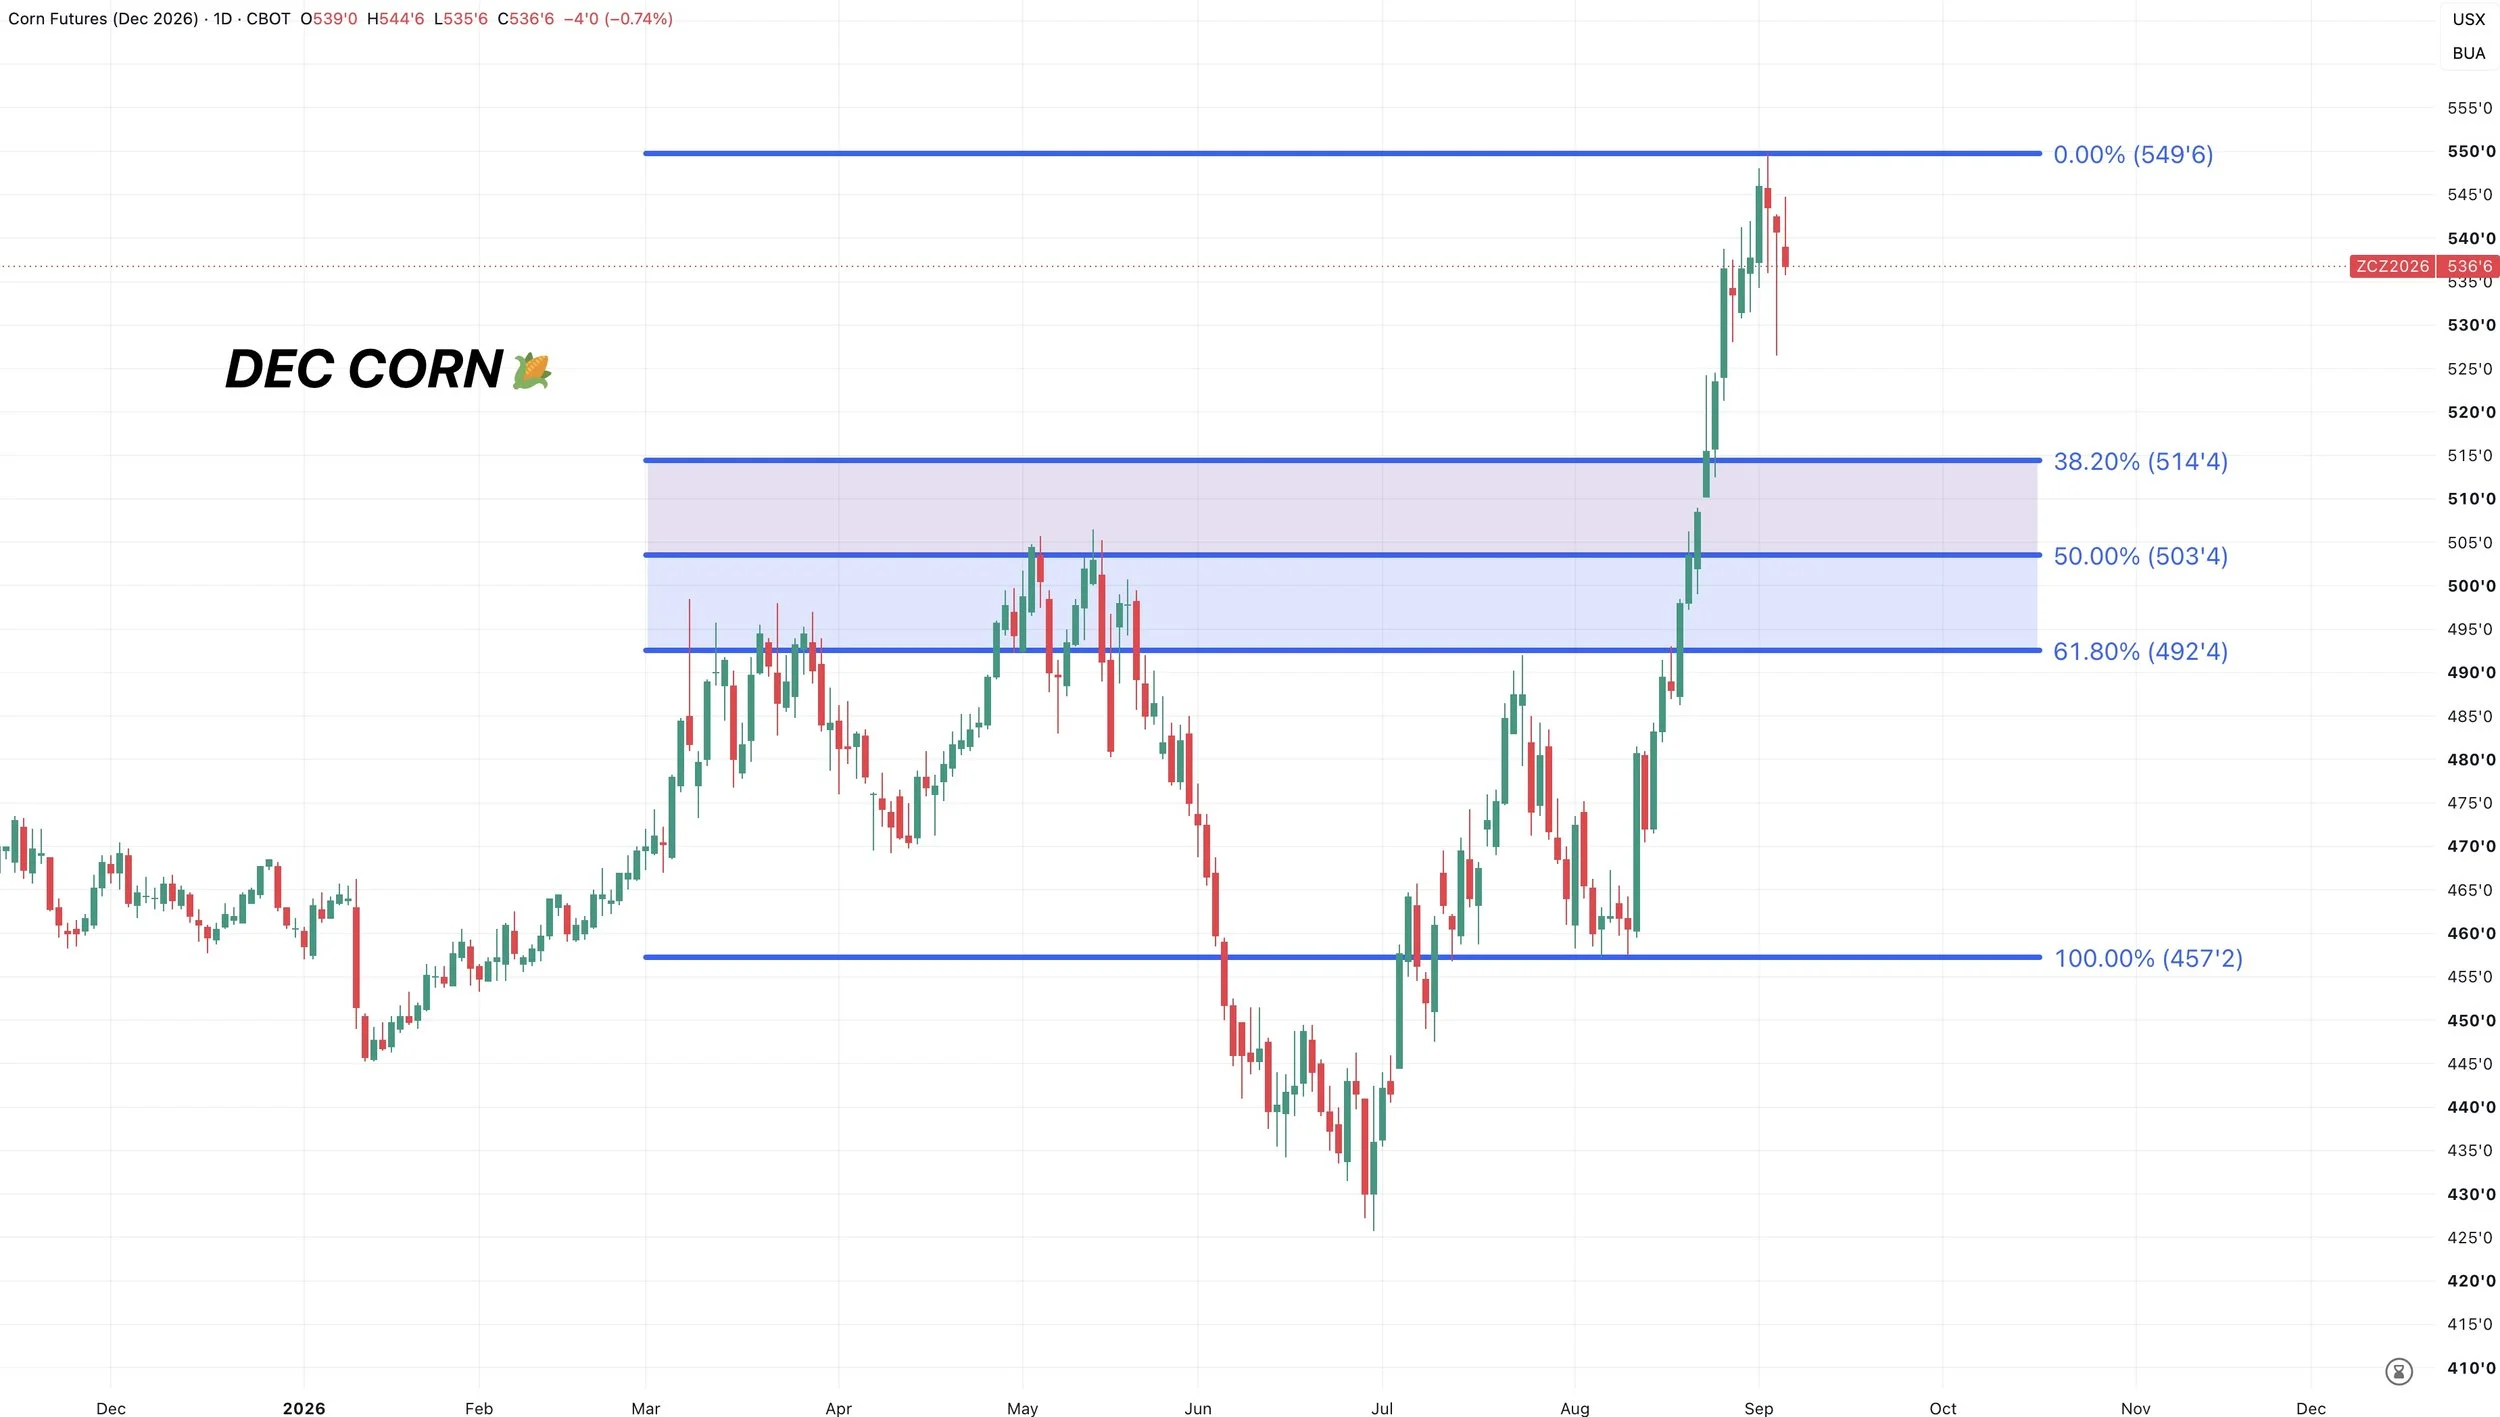
If we get a pullback, how far could we pullback?
I am eyeing that 50% retracement if we get a real pullback and break below yesterday’s lows.
Which would give back half of the rally since August.
That comes in at $5.04
That level would also be a perfect a re-test of the May highs.
If the market gave us that, I would view it as an opportunity to re-own.
We obviously don’t have to get that low, but if the USDA ruins the party or we fall out of bed for whatever reason. Finding a bottom in that range would make sense and still be perfectly healthy.
Long term I am bullish. Short term I am cautious.
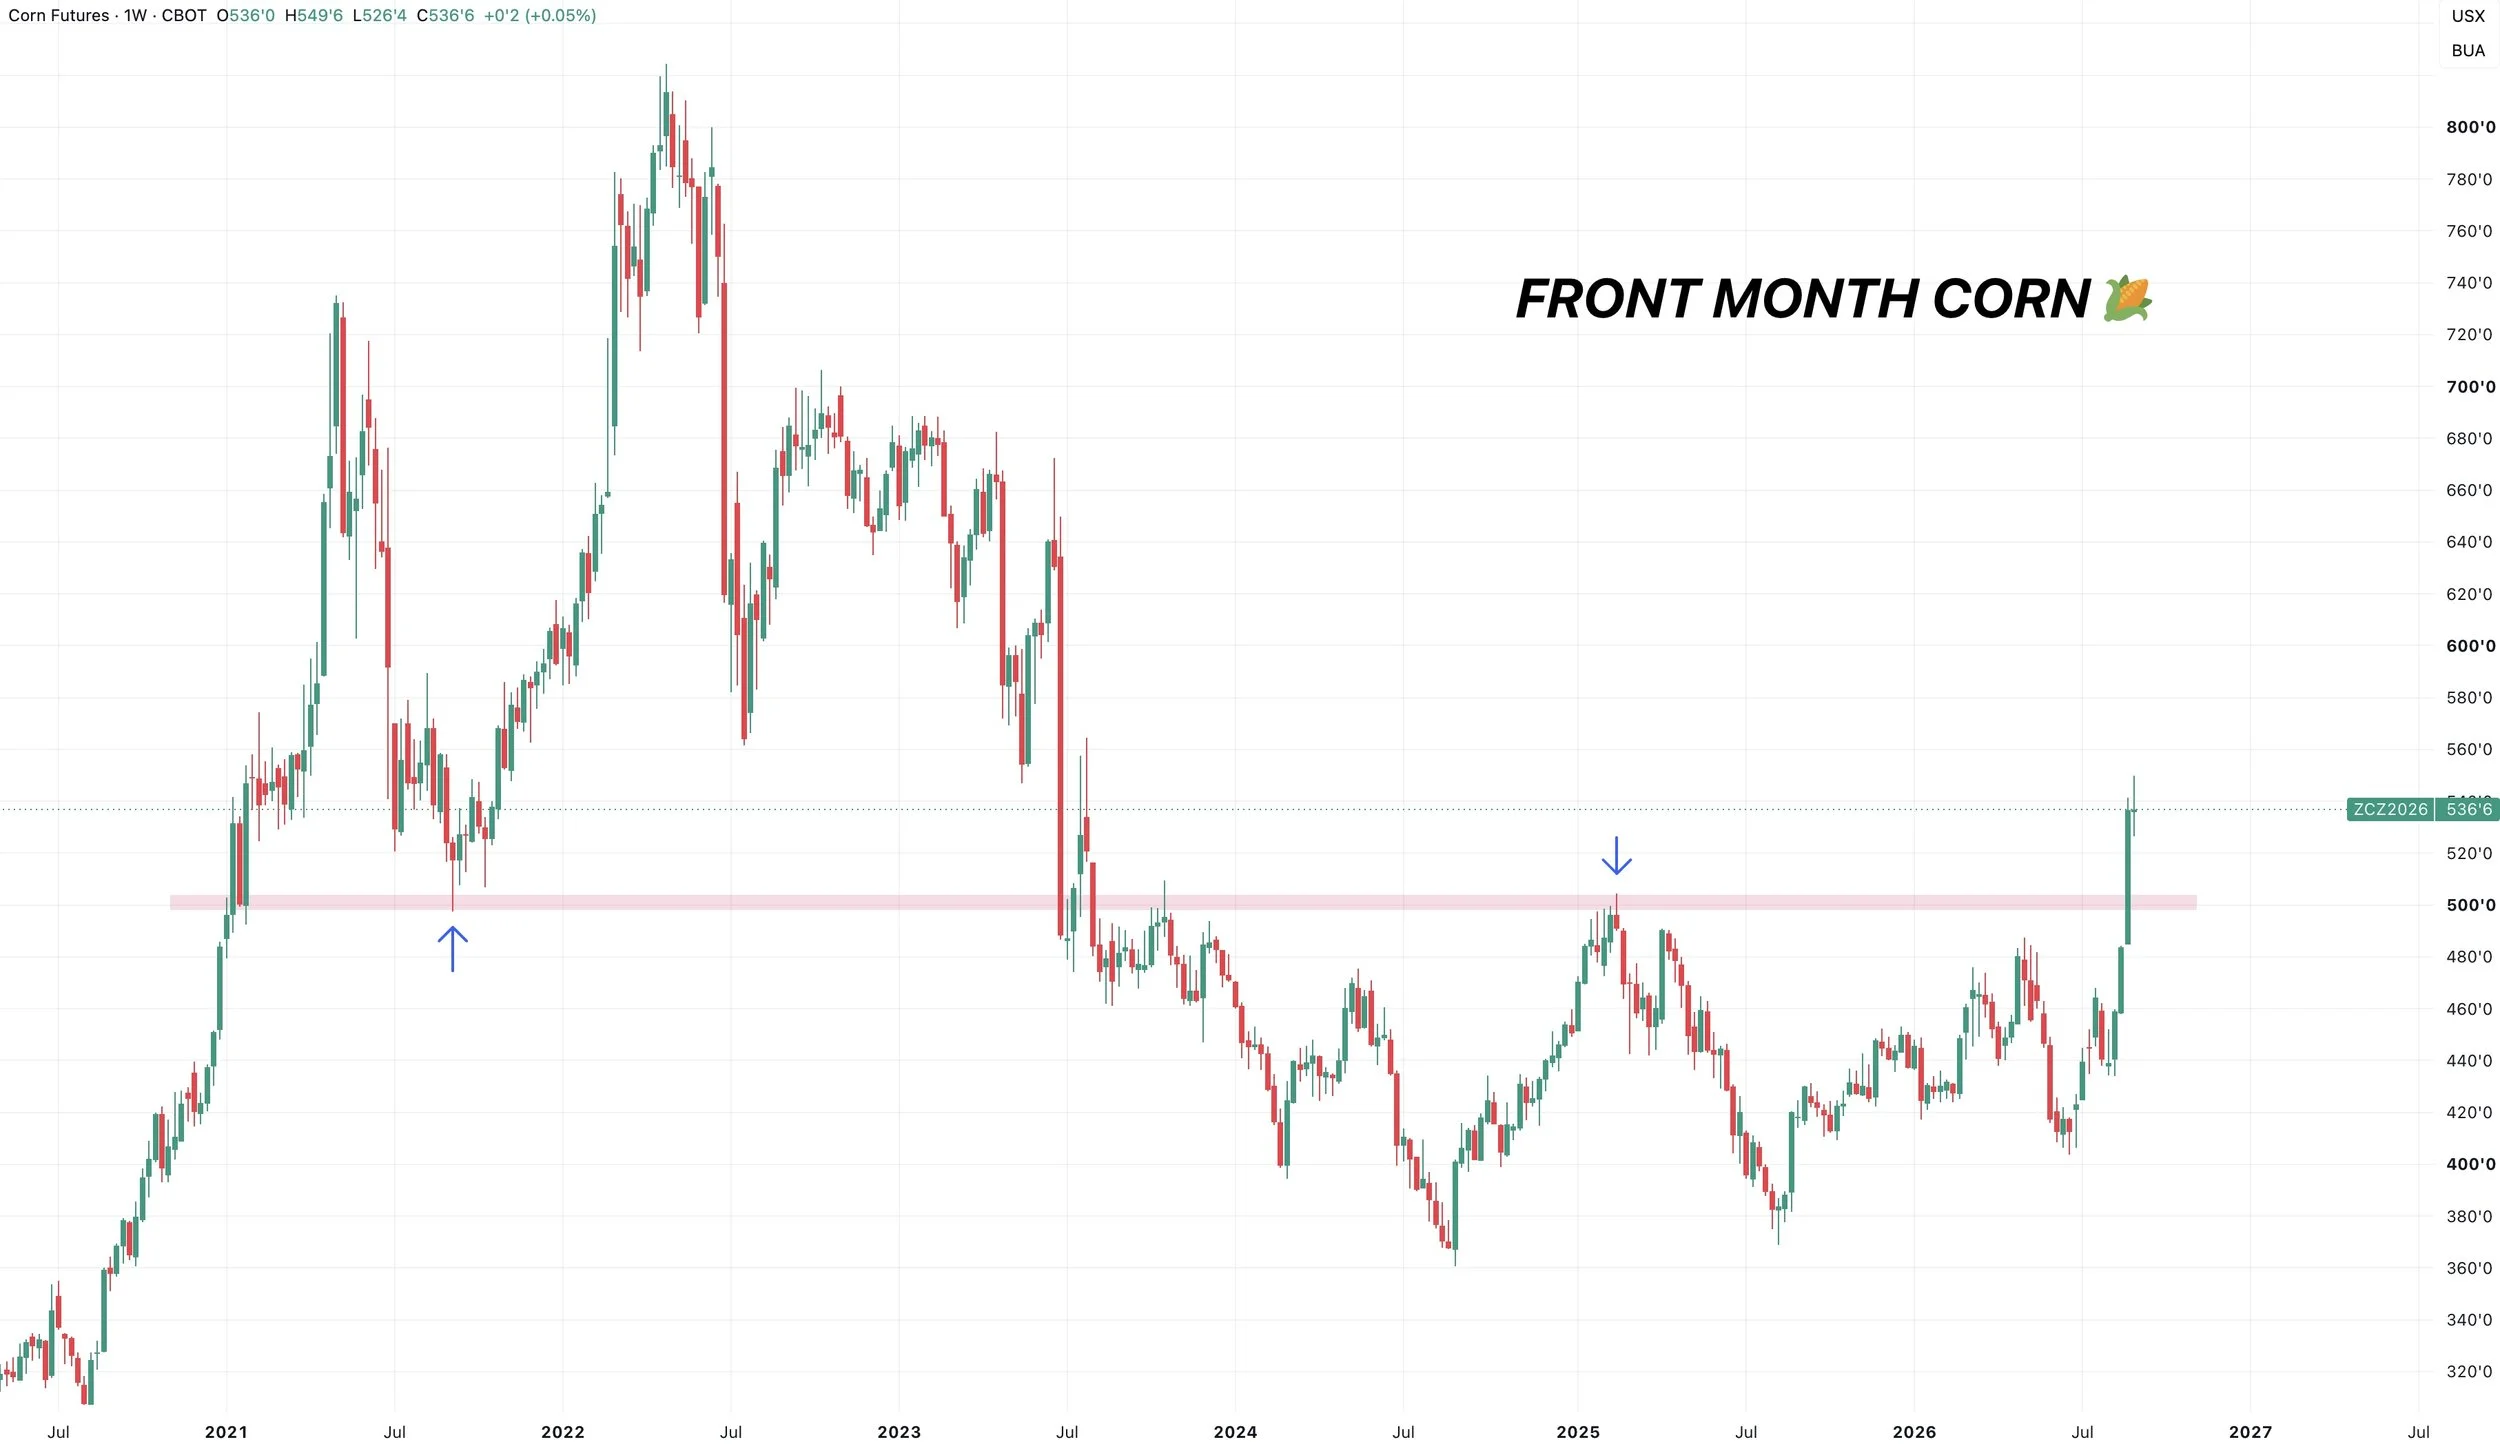
Weekly Chart: Old Resistance is New Support?
Again, we do not have to get a large pullback.
But if we do, here is another reason why that 50% retracement at $5.04 would be a key level to watch.
The highs from 2025 also come in right at $5.04
Often times, old resistance turns into new support.
So seeing us come back down and test the point of breakout would not be come as a shock at all. But we do not have to.
I'm just saying if we do, it would be perfectly normal.
Weekly Chart: Possible Long Term Target
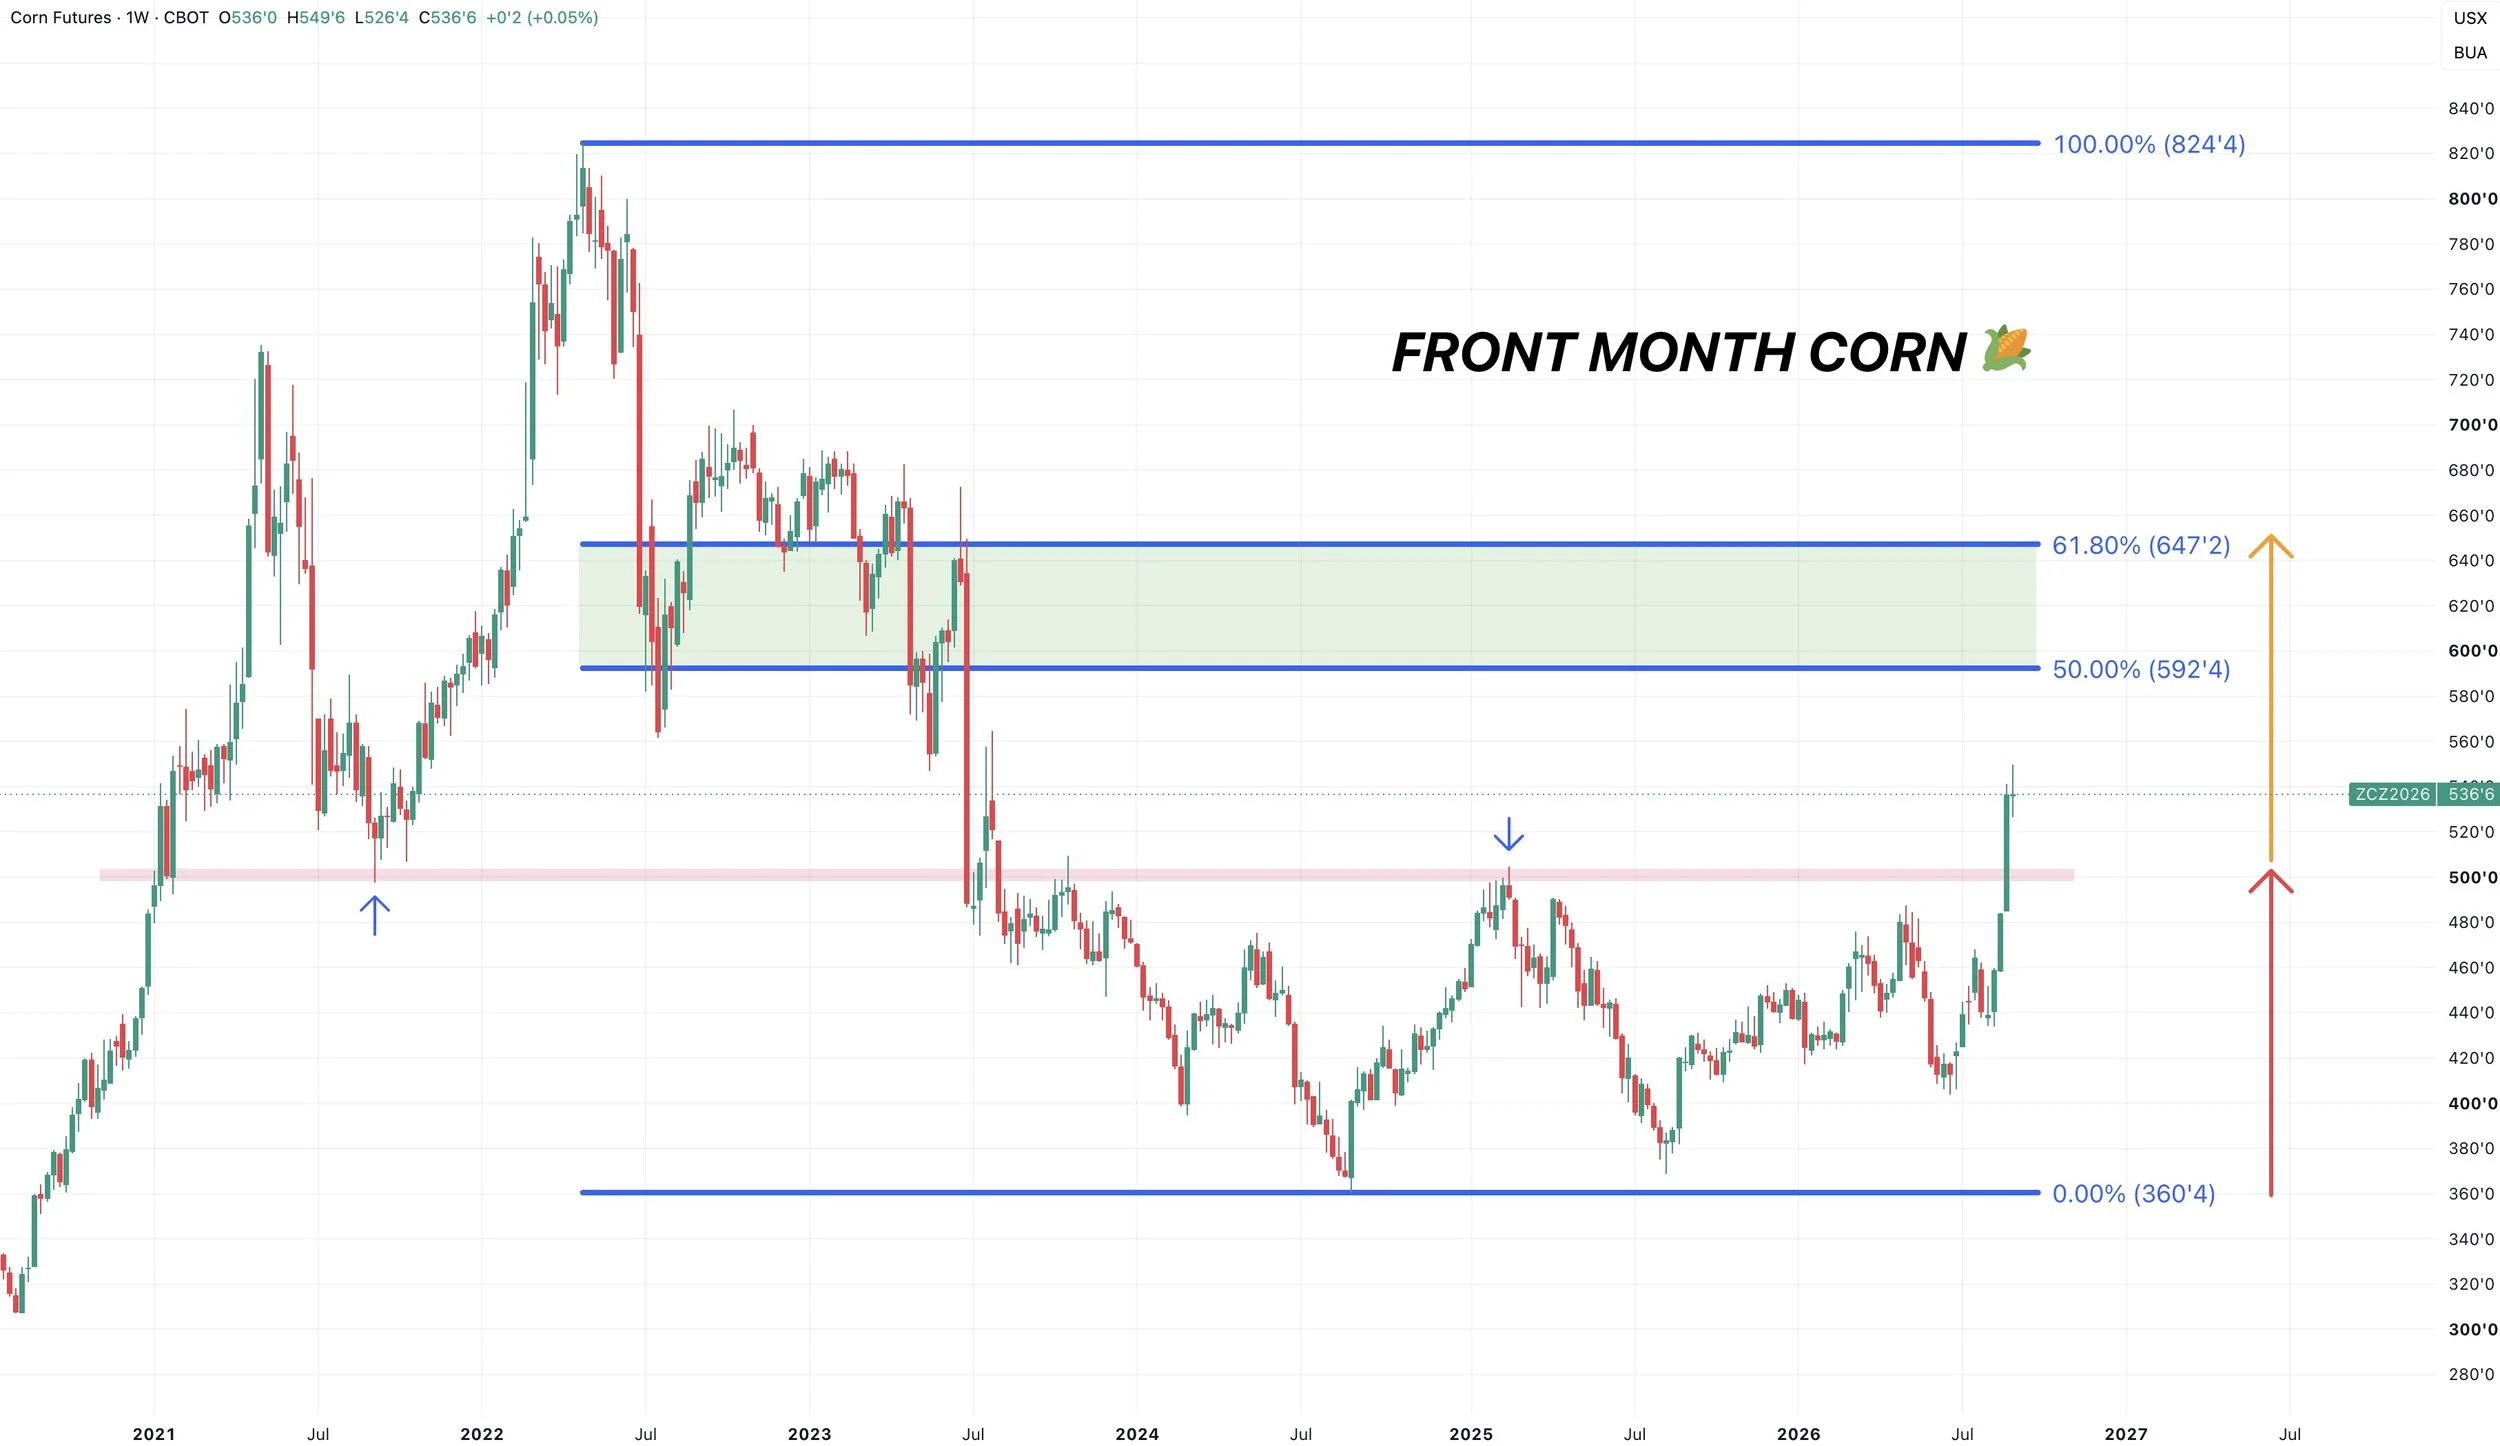
Pullback short term or not, the long term stucture in corn is very bullish and I think there is a very good chance we are higher longer term.
We got our first higher high of the entire bear market.
We finally broke out of that 3 year range.
That is not bearish and opens the door to higher possibilities.
If you take the range we were trapped in for the last 3 years, it's a $1.44 range from the lows in 2024 to the highs in 2025.
If you add that exact $1.44 range on top of the point of breakout from the range, it gives you exactly $6.50
Something else that's interesting is that the 61.8% retracement from the 2024 lows up to the 2022 highs also comes in right about at $6.50
So that's going to be a potential longer term target we will be keeping our eyes on.
Monthly Chart: Bullish Long Term
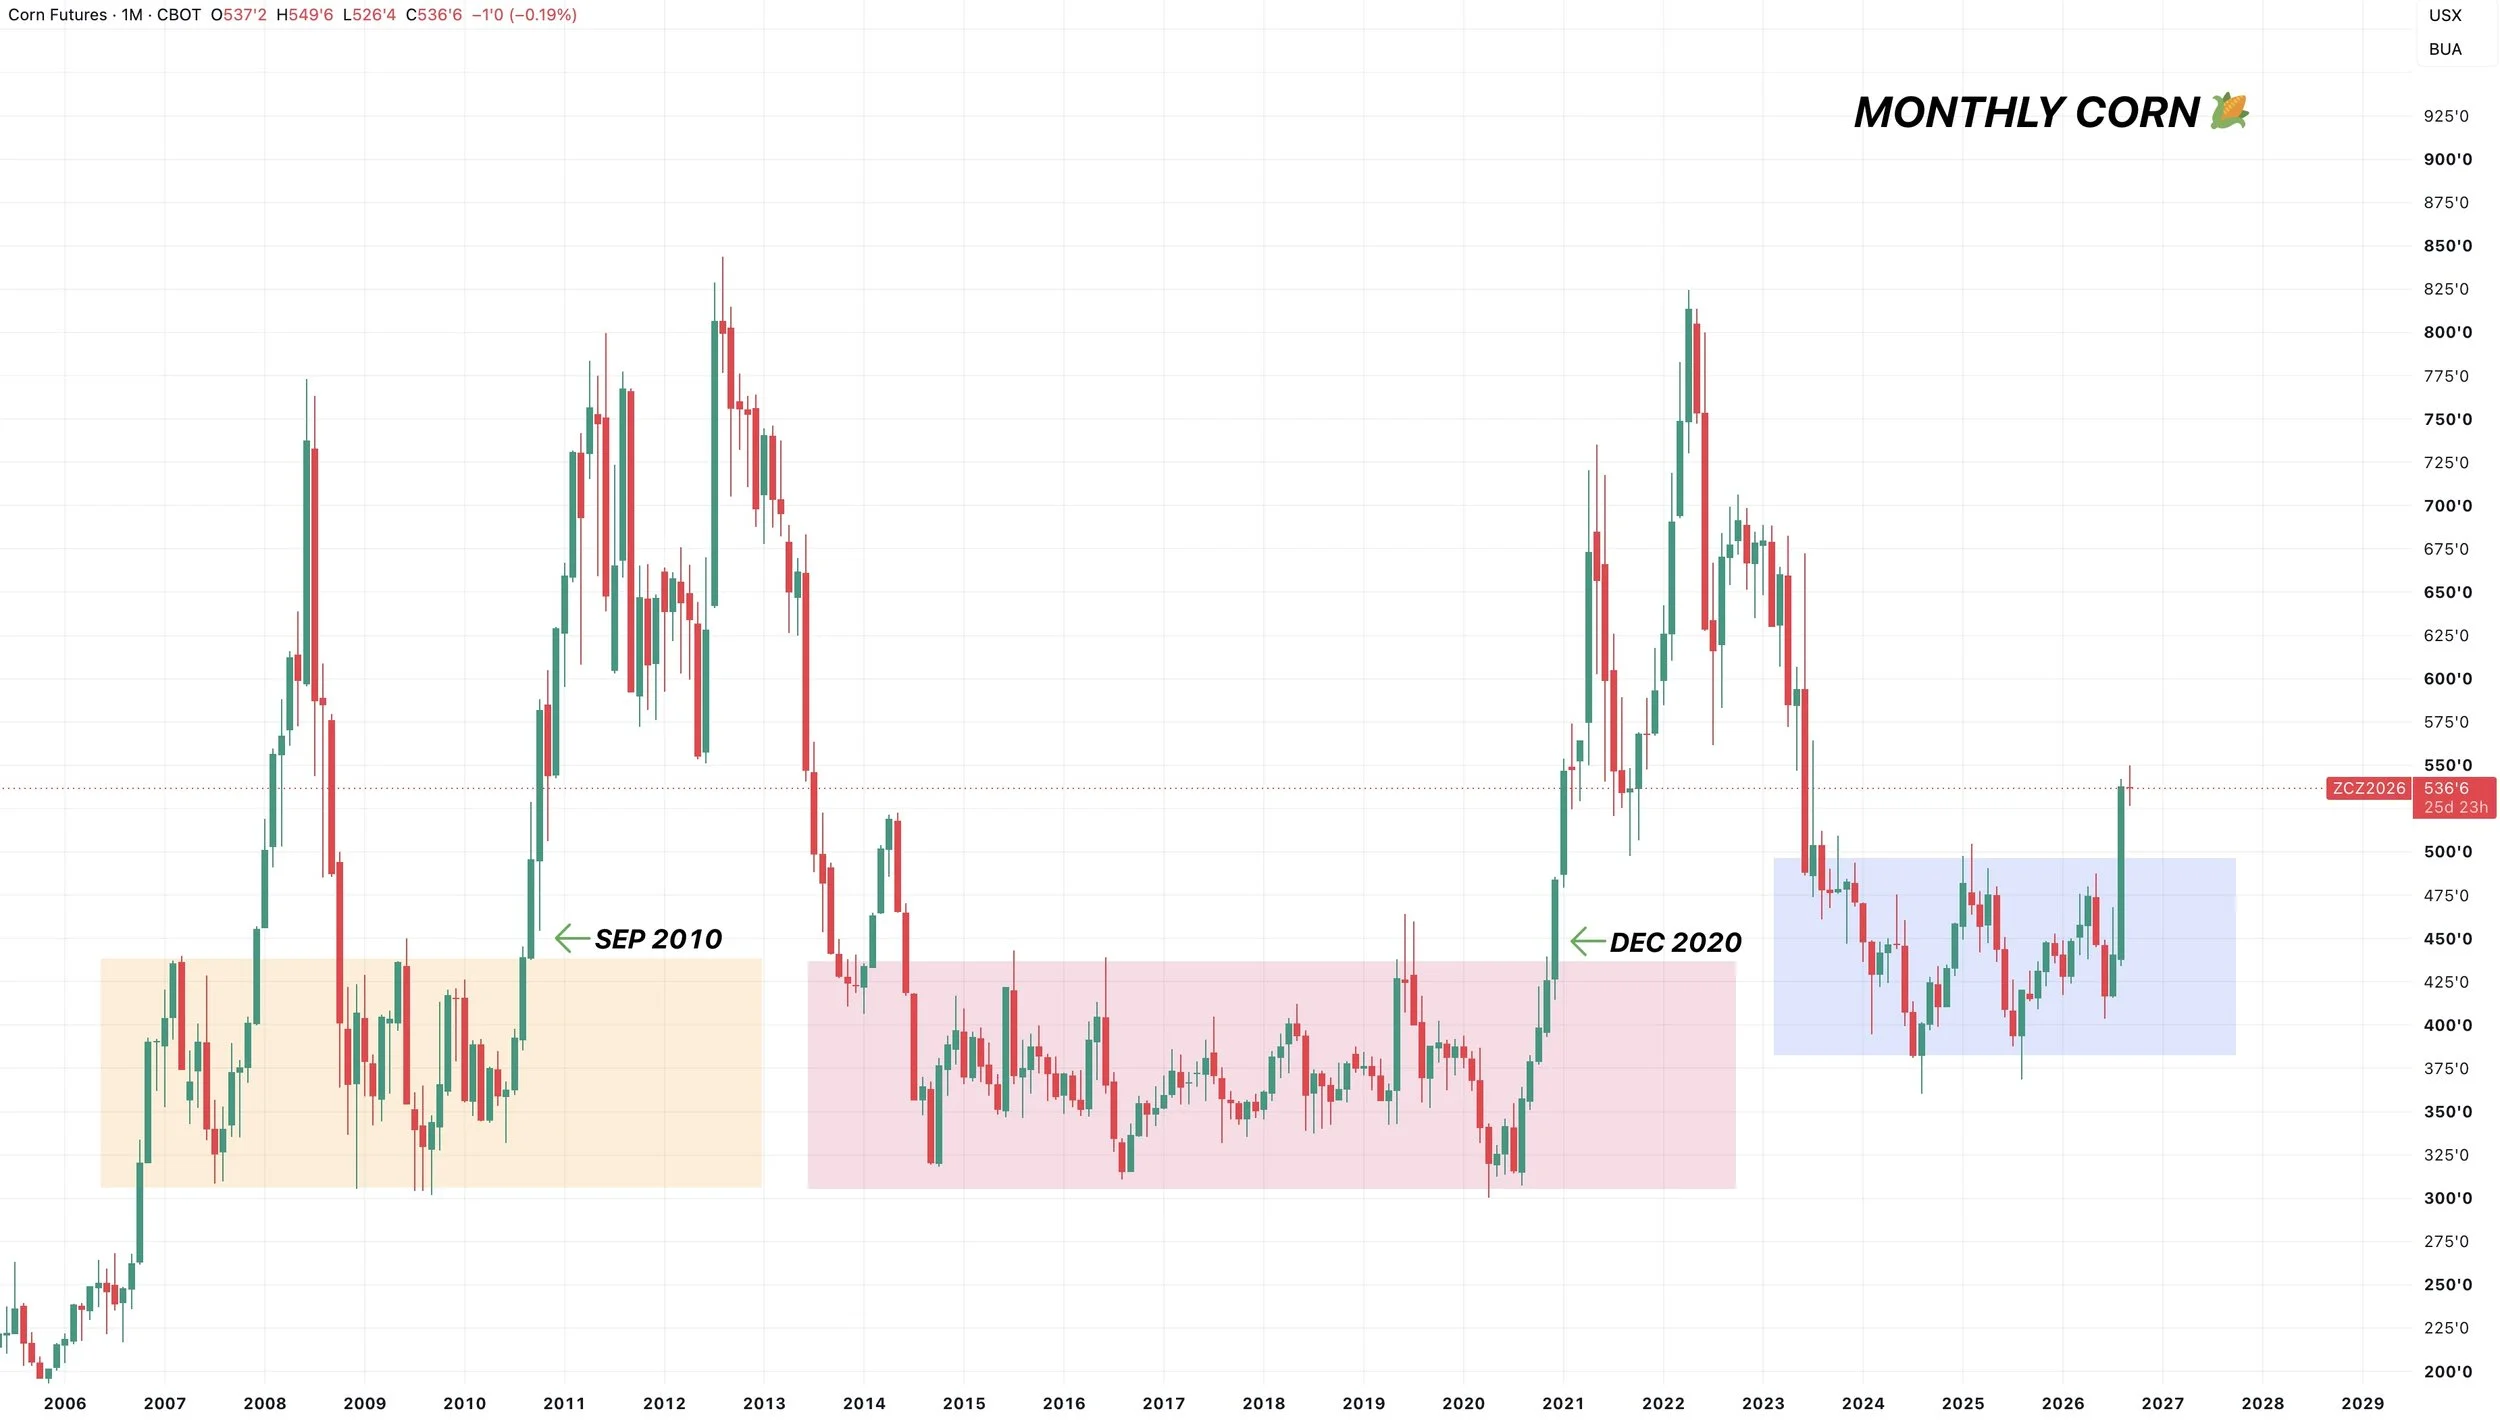
The monthly chart looks very bullish as well.
We got the first breakout on a monthly basis since 2020.
Funny enough.. the last two monthly breakouts happened in 2010 and 2020..
Both also happened at the end of the year rather than during the spring or summer. Like this year.
I still think there are plenty of similarities happening here.
Strategy for USDA Report:
We've got a big report in exactly a week.
Who knows what the USDA has in store.
What I do know is that there is a simple way you can protect yourself for it.
Whether you are someone who has to move stuff off the combine and needs protection, or if you want to try it as a spec, as this trade does offer a good risk to reward.
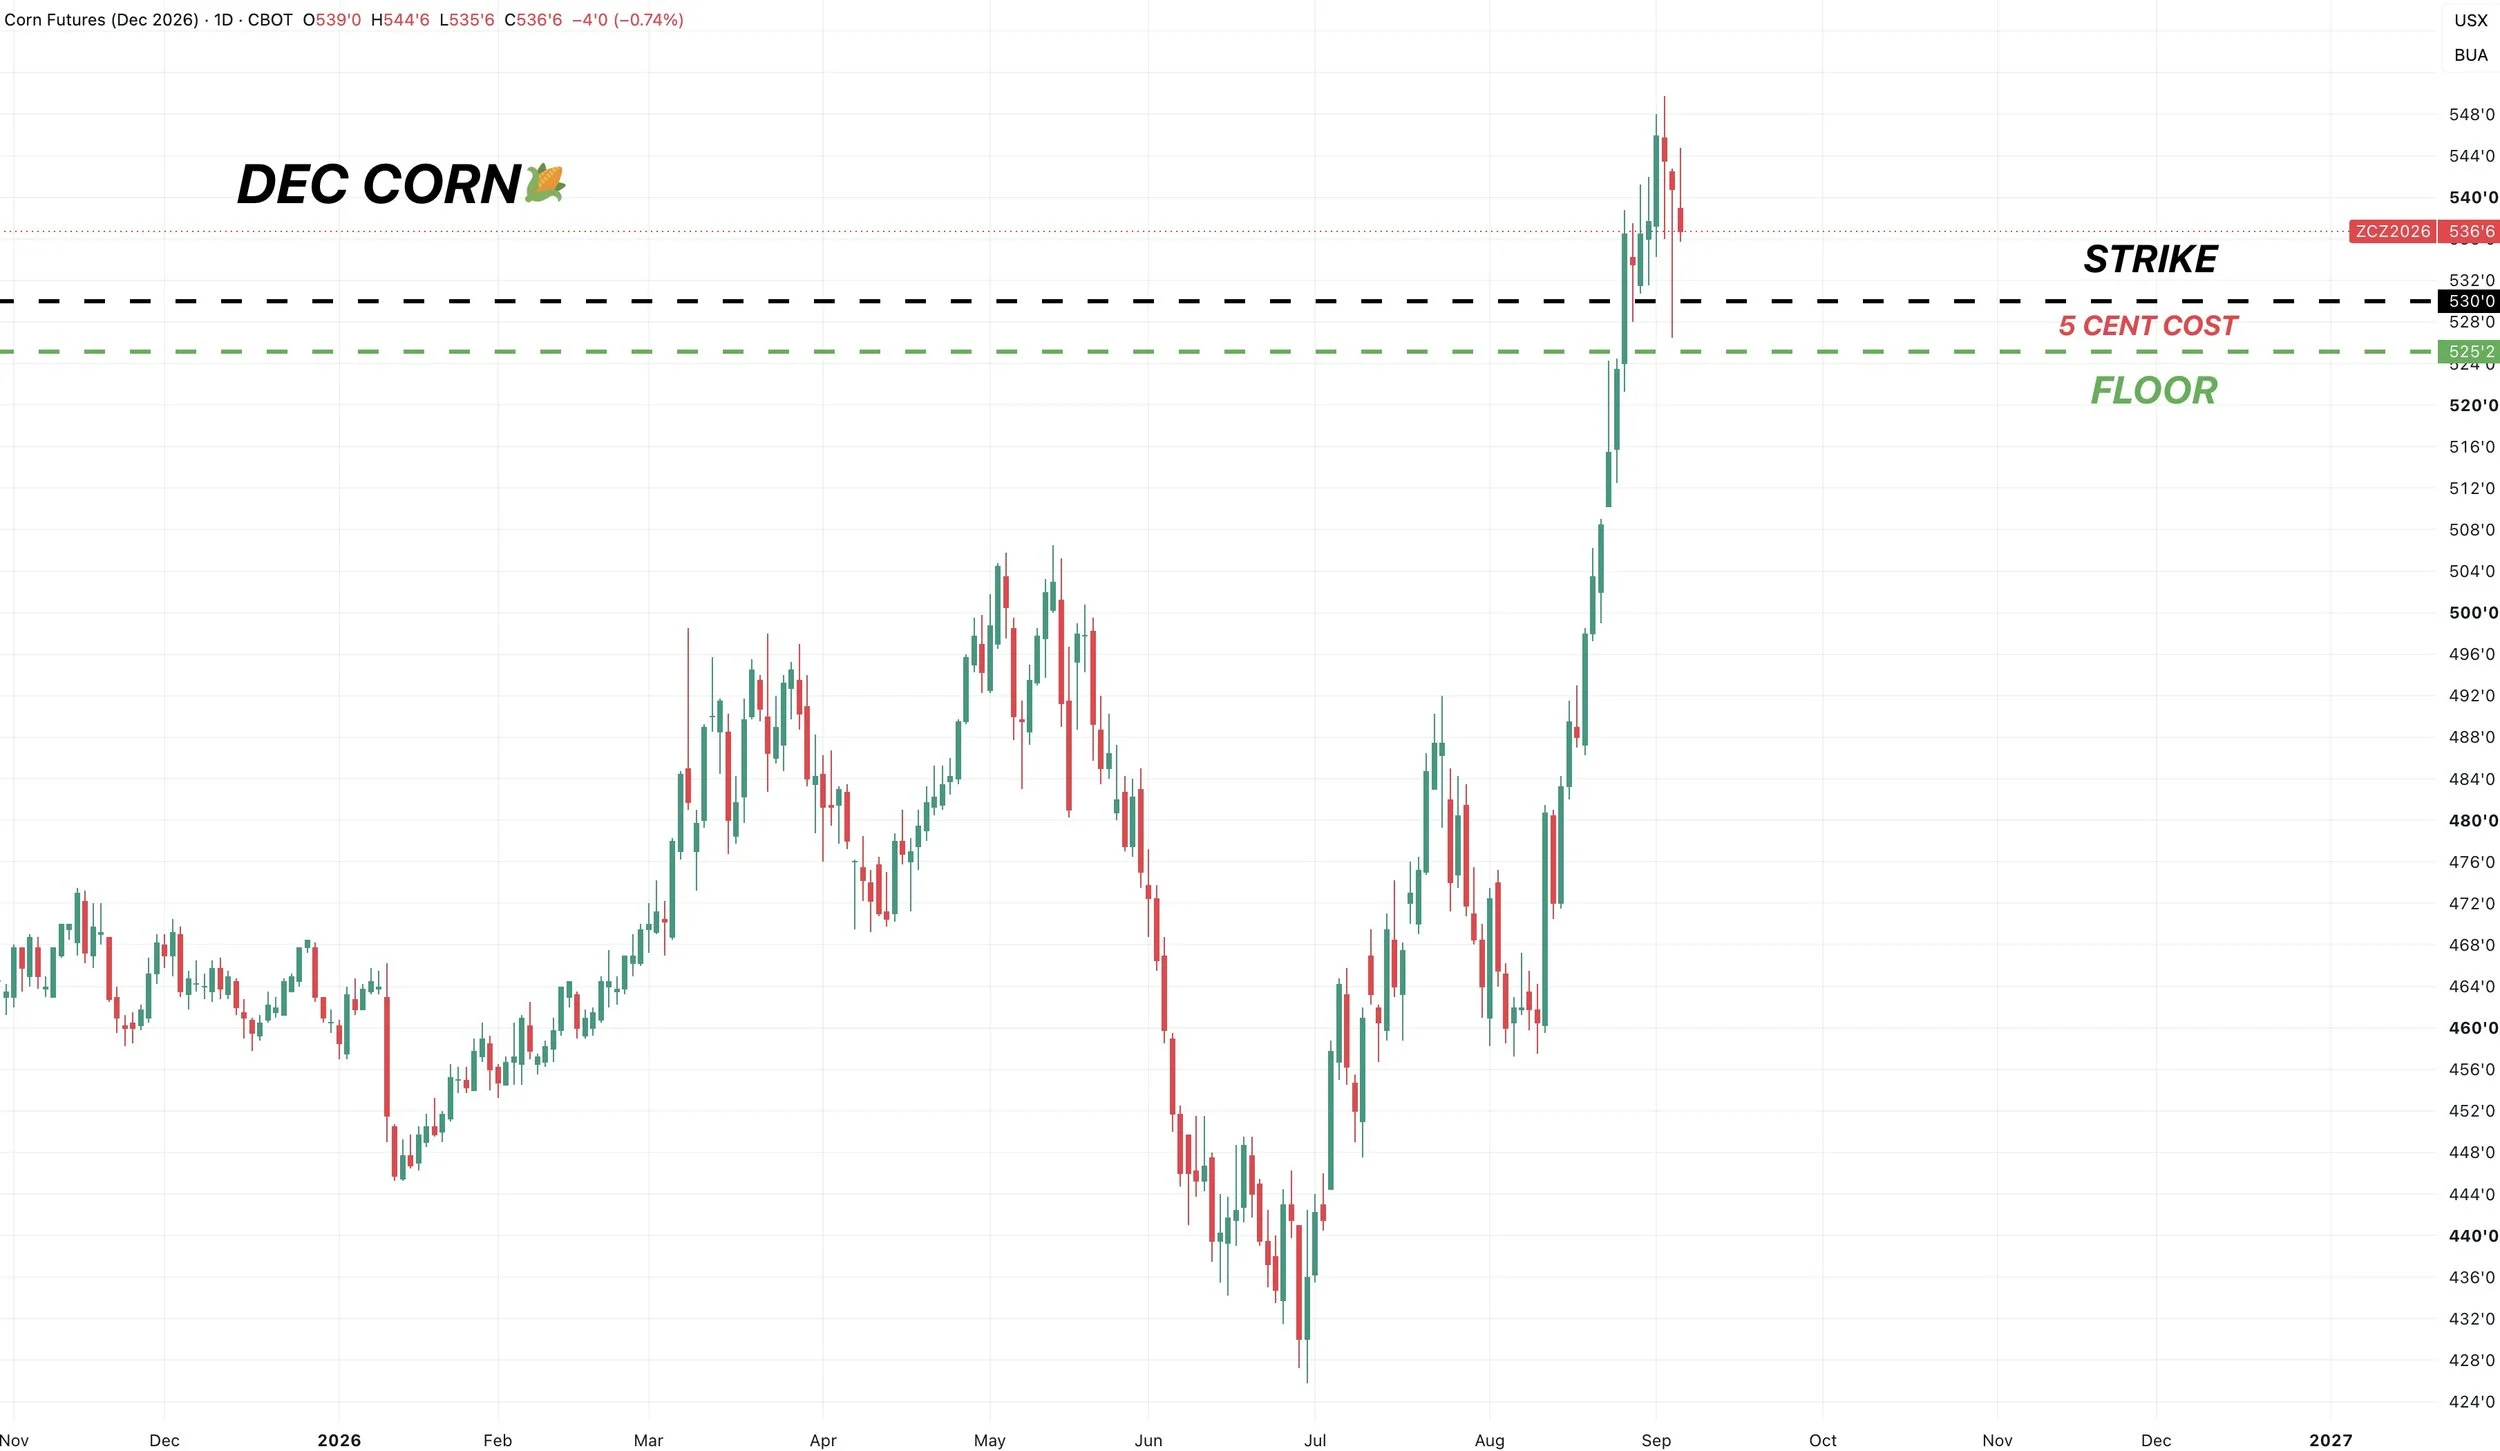
A $5.30 weekly put that expires on the day of the USDA report (7 days away). Costs about 5 cents.
So you could lock in a floor of $5.25.
We do not want protection for several months. We simply want some short term protection while we try to ride the market higher.
If you have questions or want to put together a strategy that suites you and your operation, feel free to reach out to us anytime.
Office: (806)484-1214
If you are someone who wants some upside exposure instead of downside protection going into the report, check out the re-ownership strategy we covered in this week's hedge alert or reach out to get the strategy with updated strikes and quotes.
This Week's Alert: Click Here to View
Soybeans
Tuesday's Sell & Hedge Alert:
We also sent out a sell signal and hedge alert in soybeans earlier this week.
If you missed it: Click Here
As all of the signals were this week, and as most have been this entire year. this was more so for those who have to move stuff or are behind etc.
Again, those will plenty of time on your hands, you can afford to be more patient than those who can’t.
We still think there is plenty of upside, but it makes sense for those in some situations to be managing their risk here.
Nov Beans Chart:
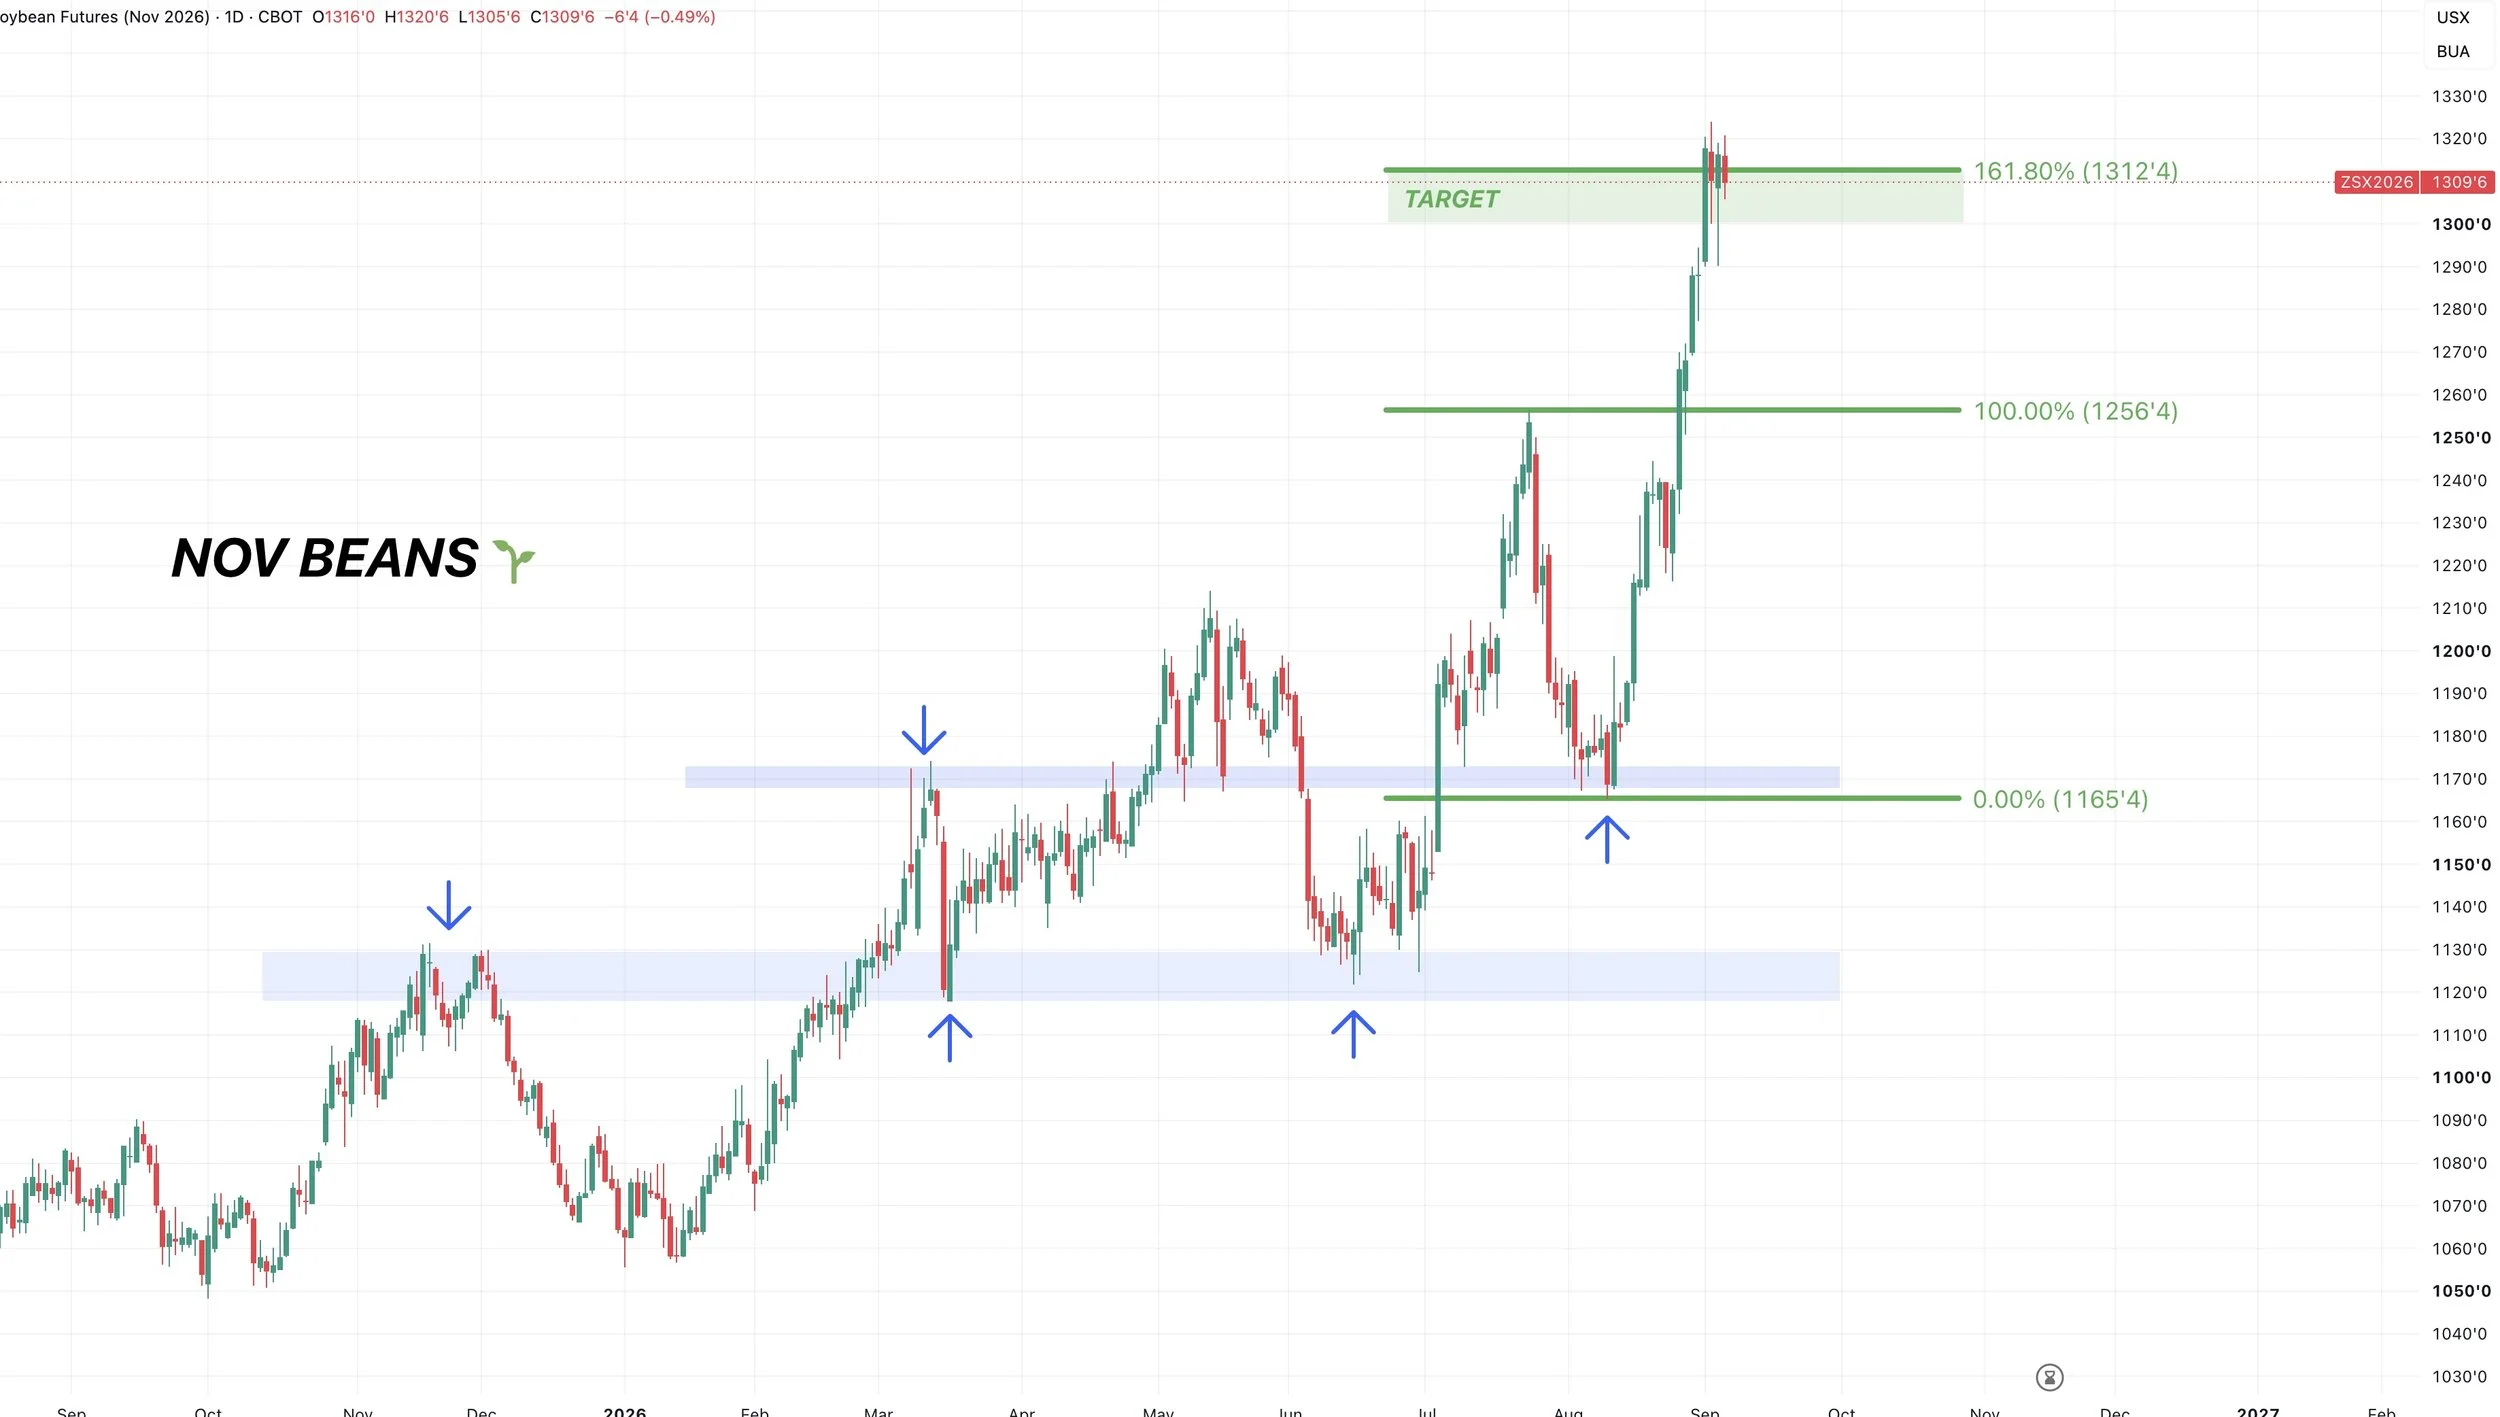
The main reason for the alert was that we hit our next target we've had for the last month or so.
The golden fib. Which is the 161.8% retracement from the August lows up to the July highs.
This is a common continuation target and an area where seeing this rally take a breather would not come as a shock.
Of course we do not have to and this market could just continue to run, but short term it's a reason for some to warrant managing their risk if they should be doing so or lack time.
So far we are simply chopping around right at that target.
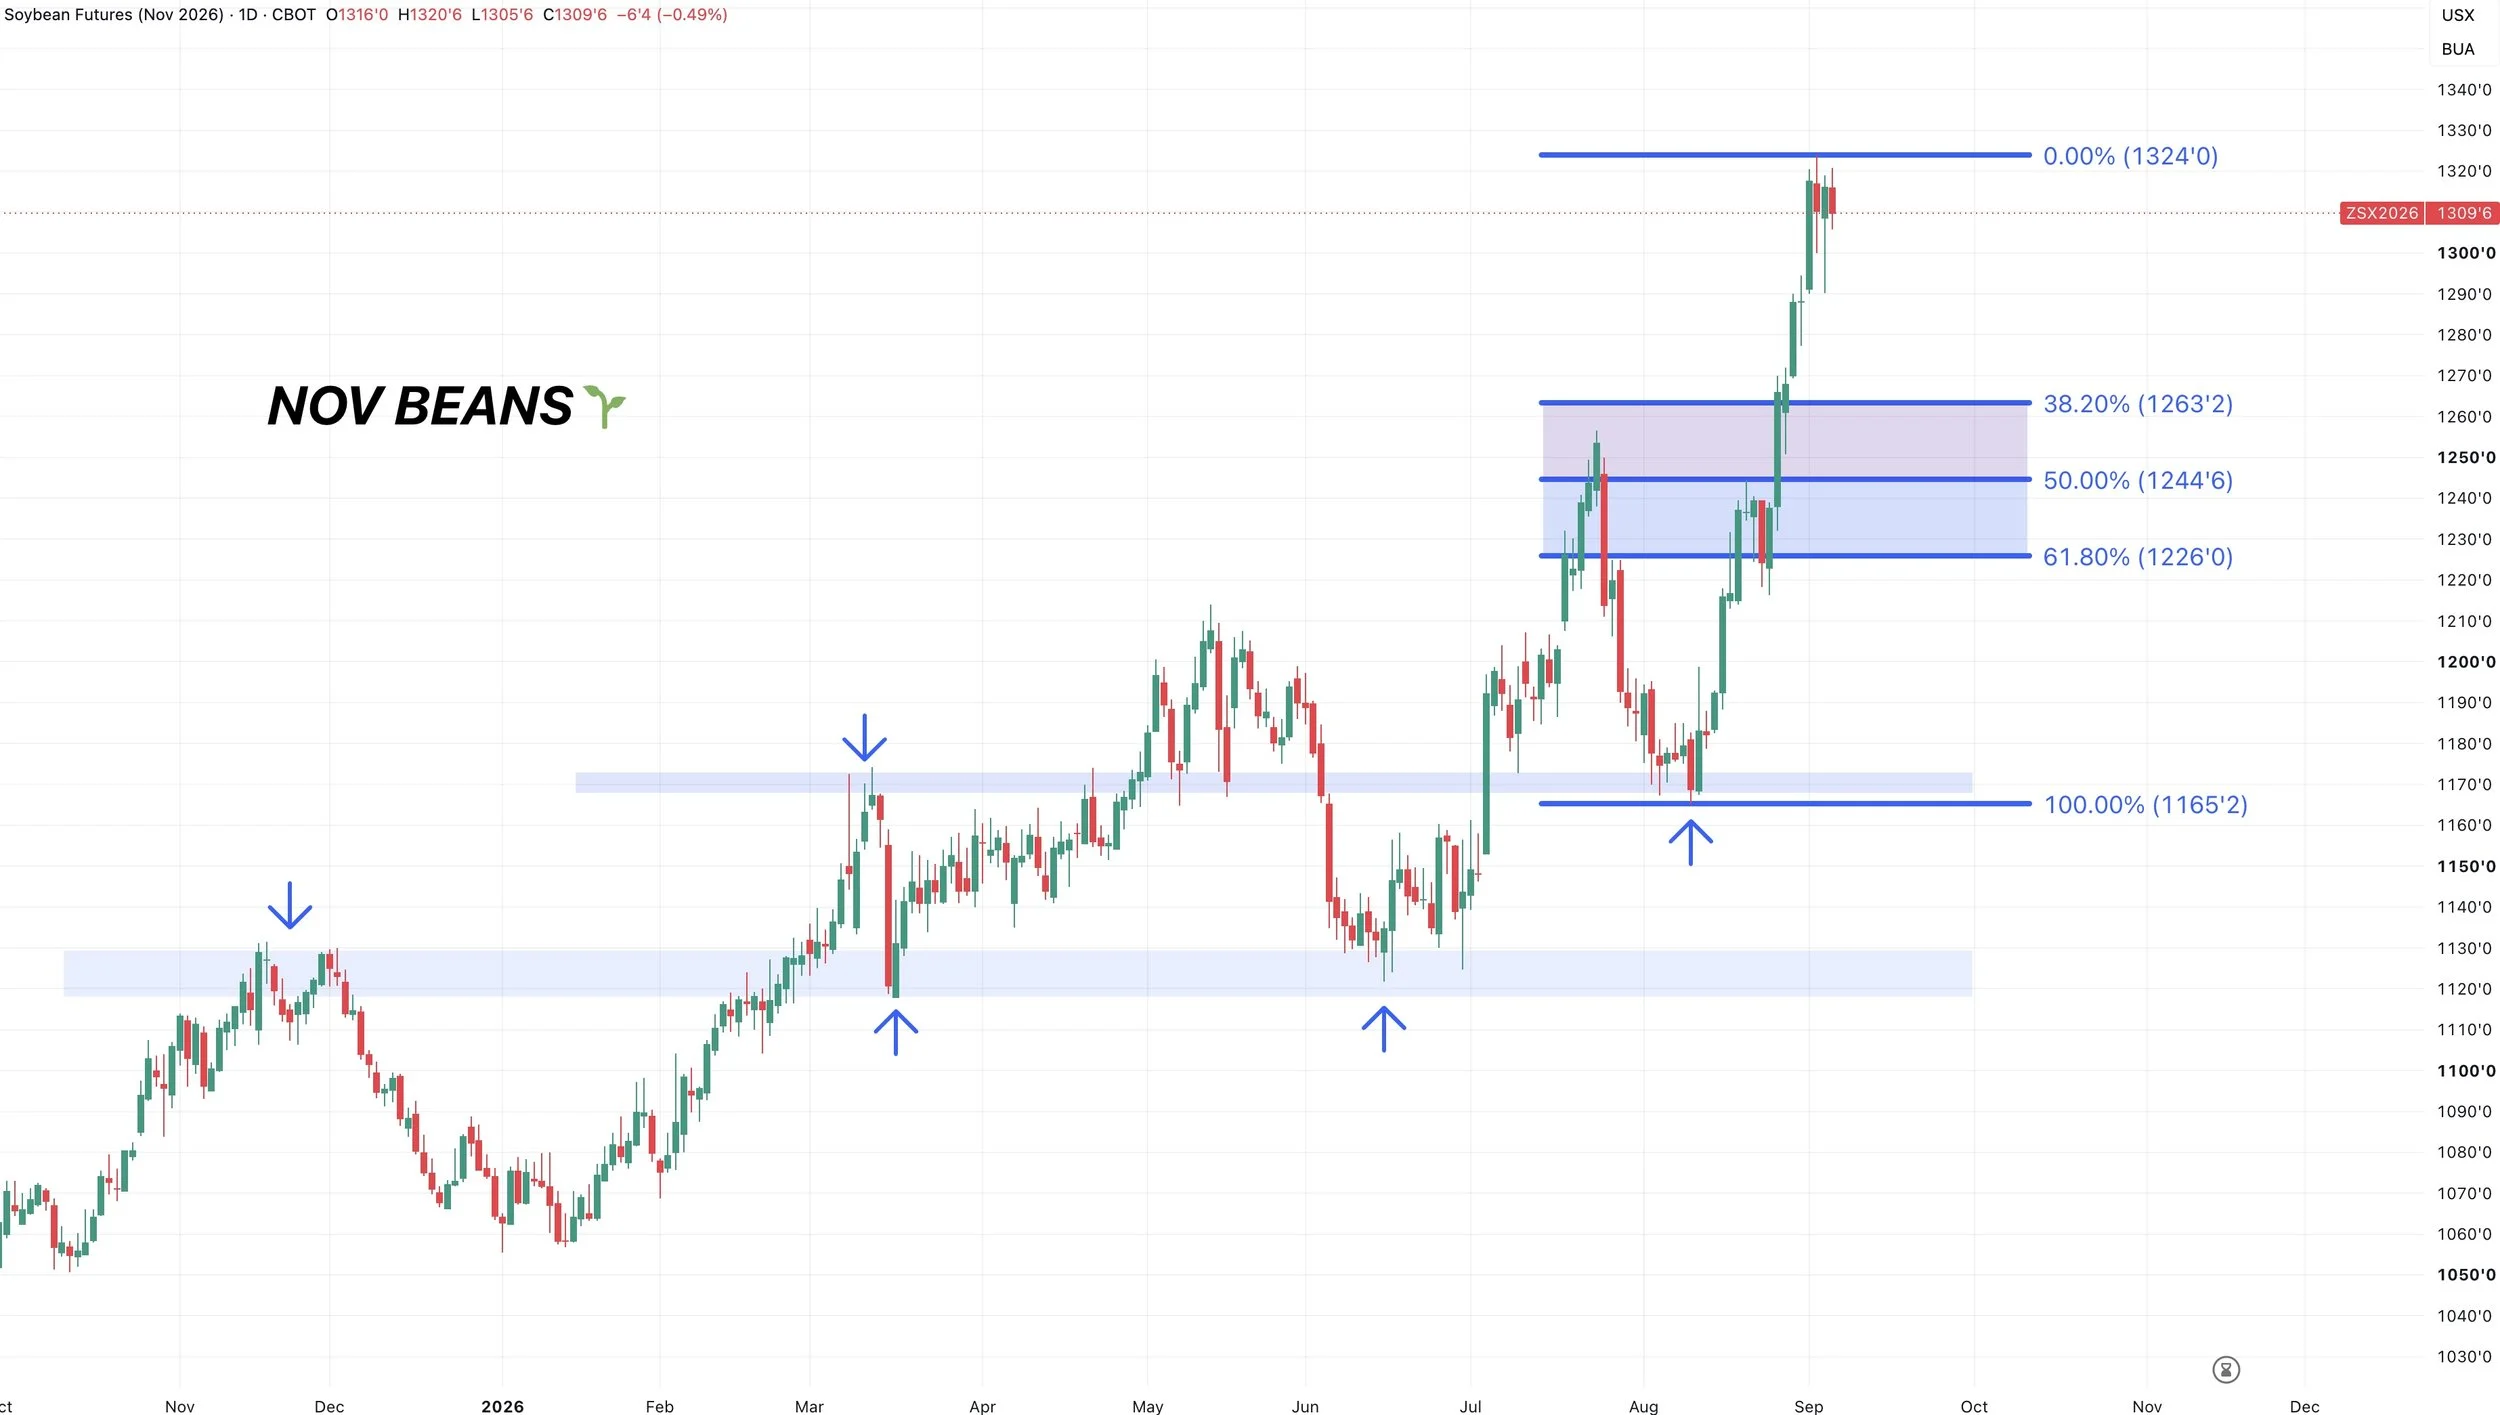
If we get a pullback, how deep could it go?
If we got one, seeing us come down to that 38.2% to 50% retracement would not be a surprise.
Which would line up with a re-test of those highs from July.
Since we went straight up, we created no support below here.
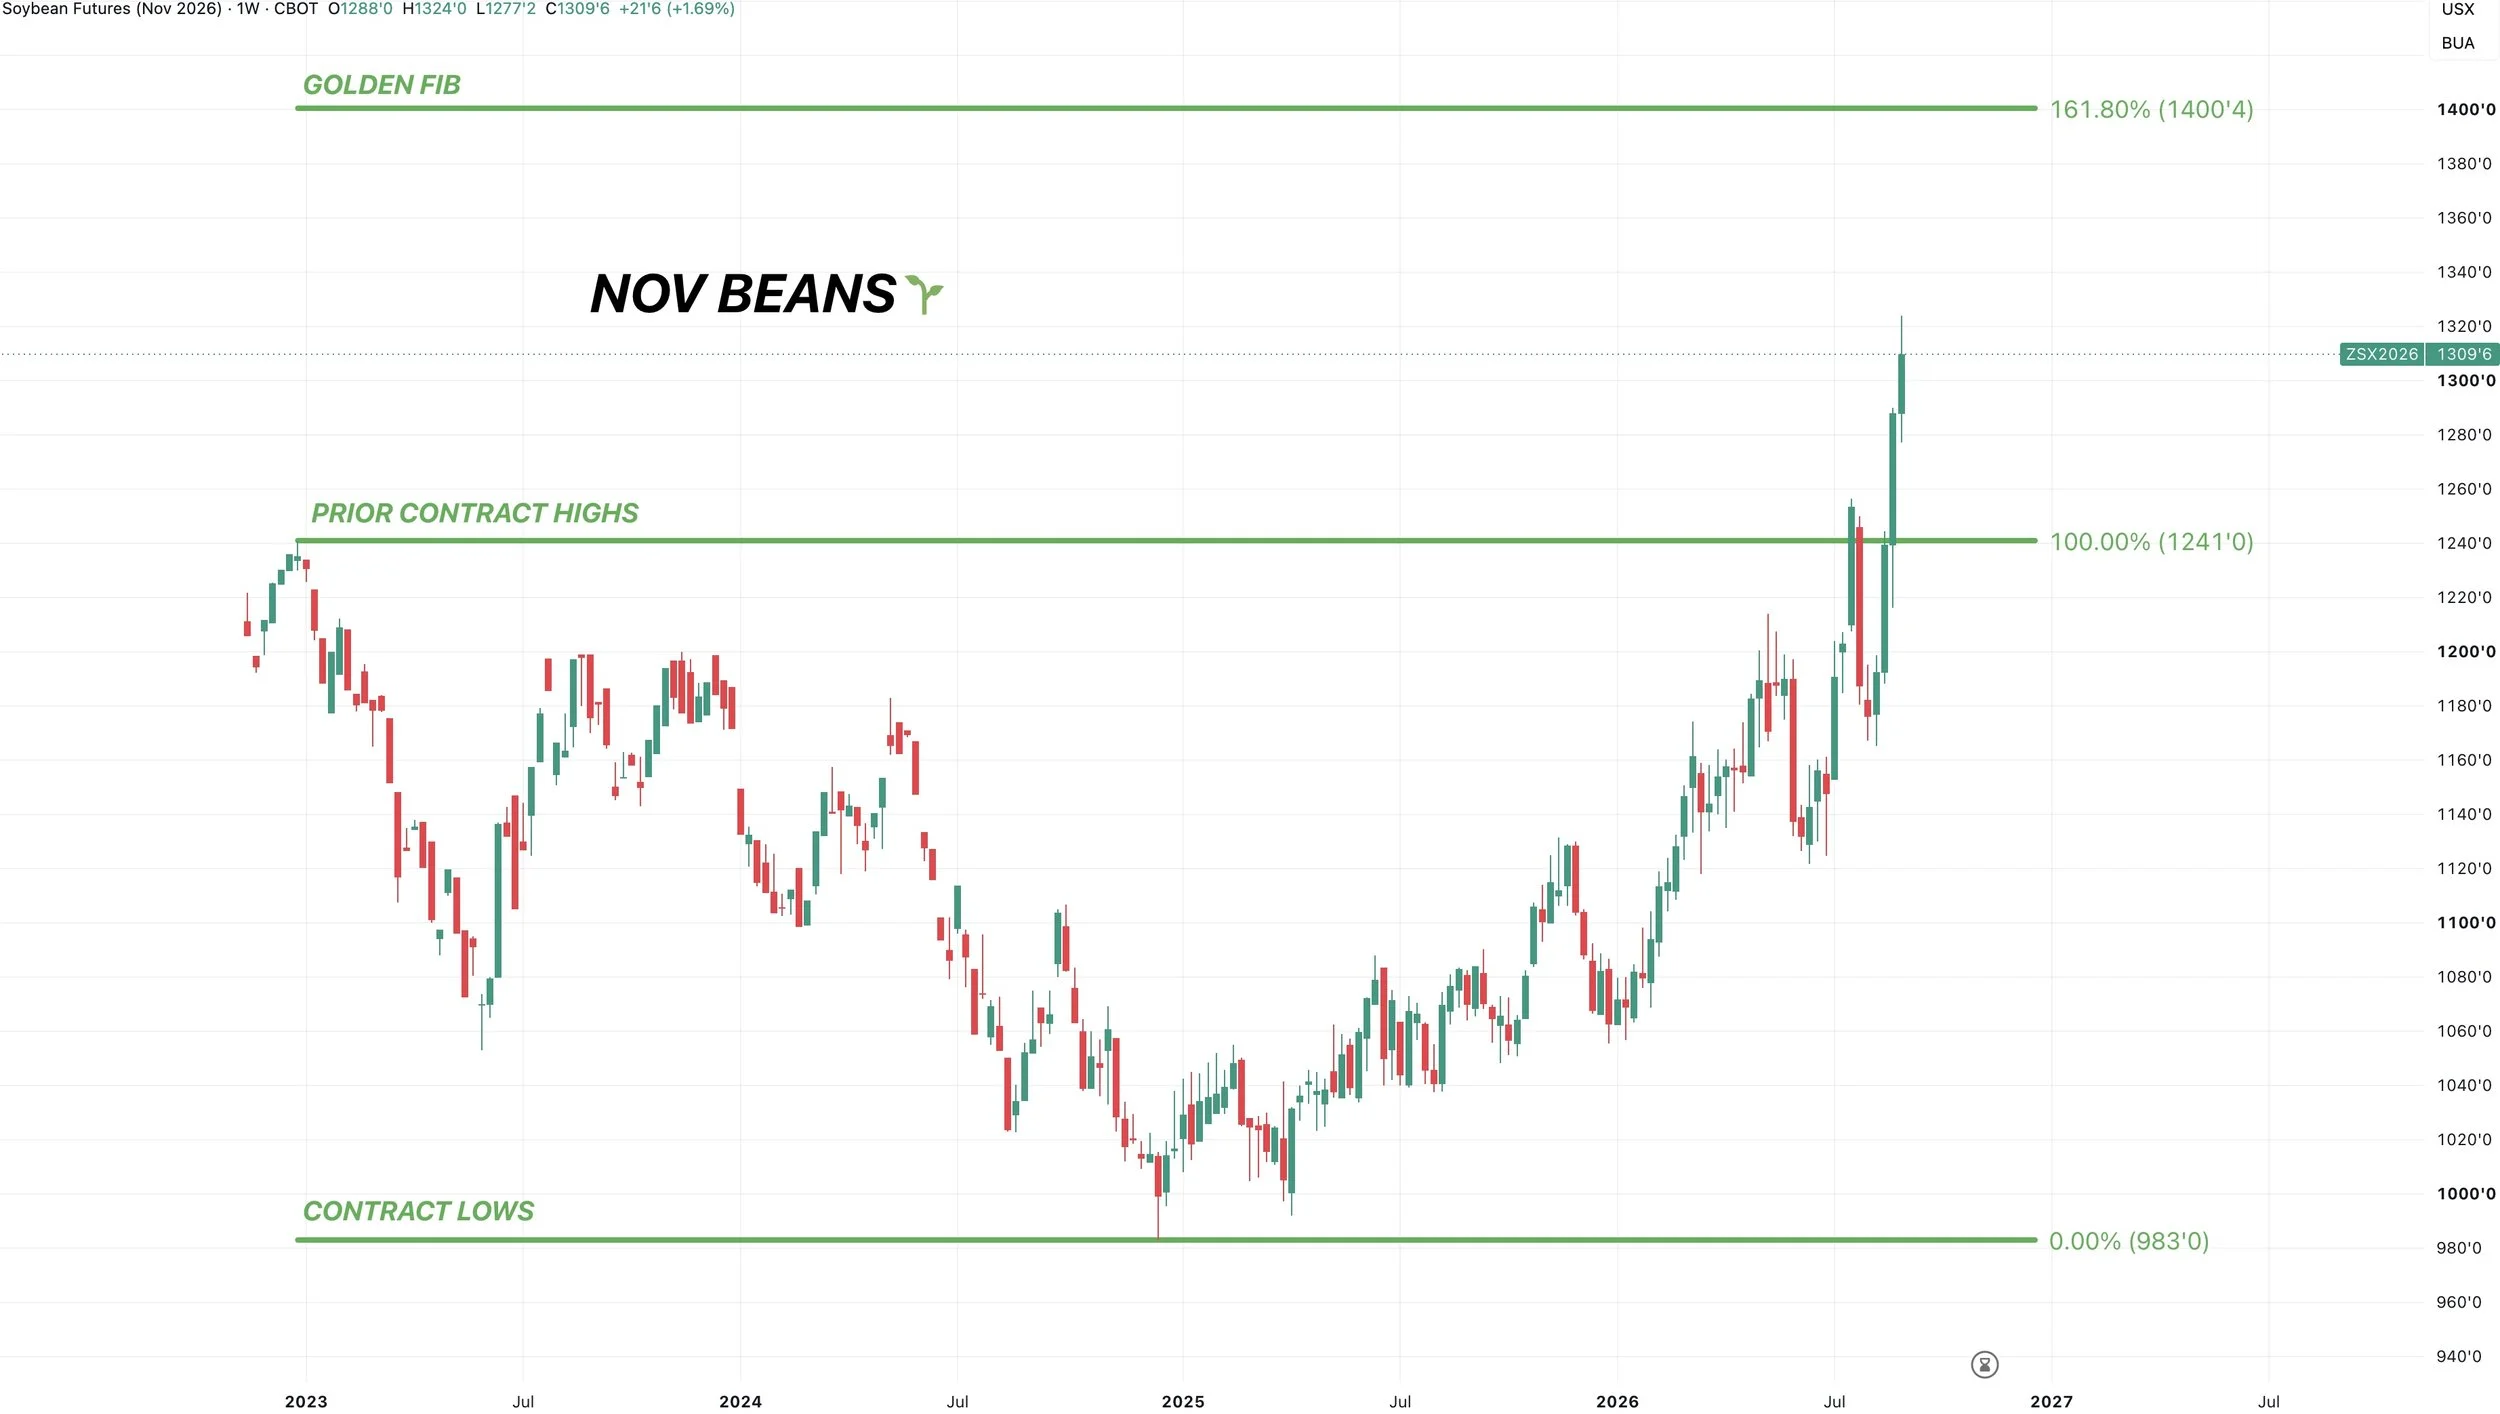
Next Possible Target:
Since we hit that first target, this would be our next potential long term target.
The golden fib, 161.8% retracement of the contract lows up to the previous contract highs comes in right at $14.00
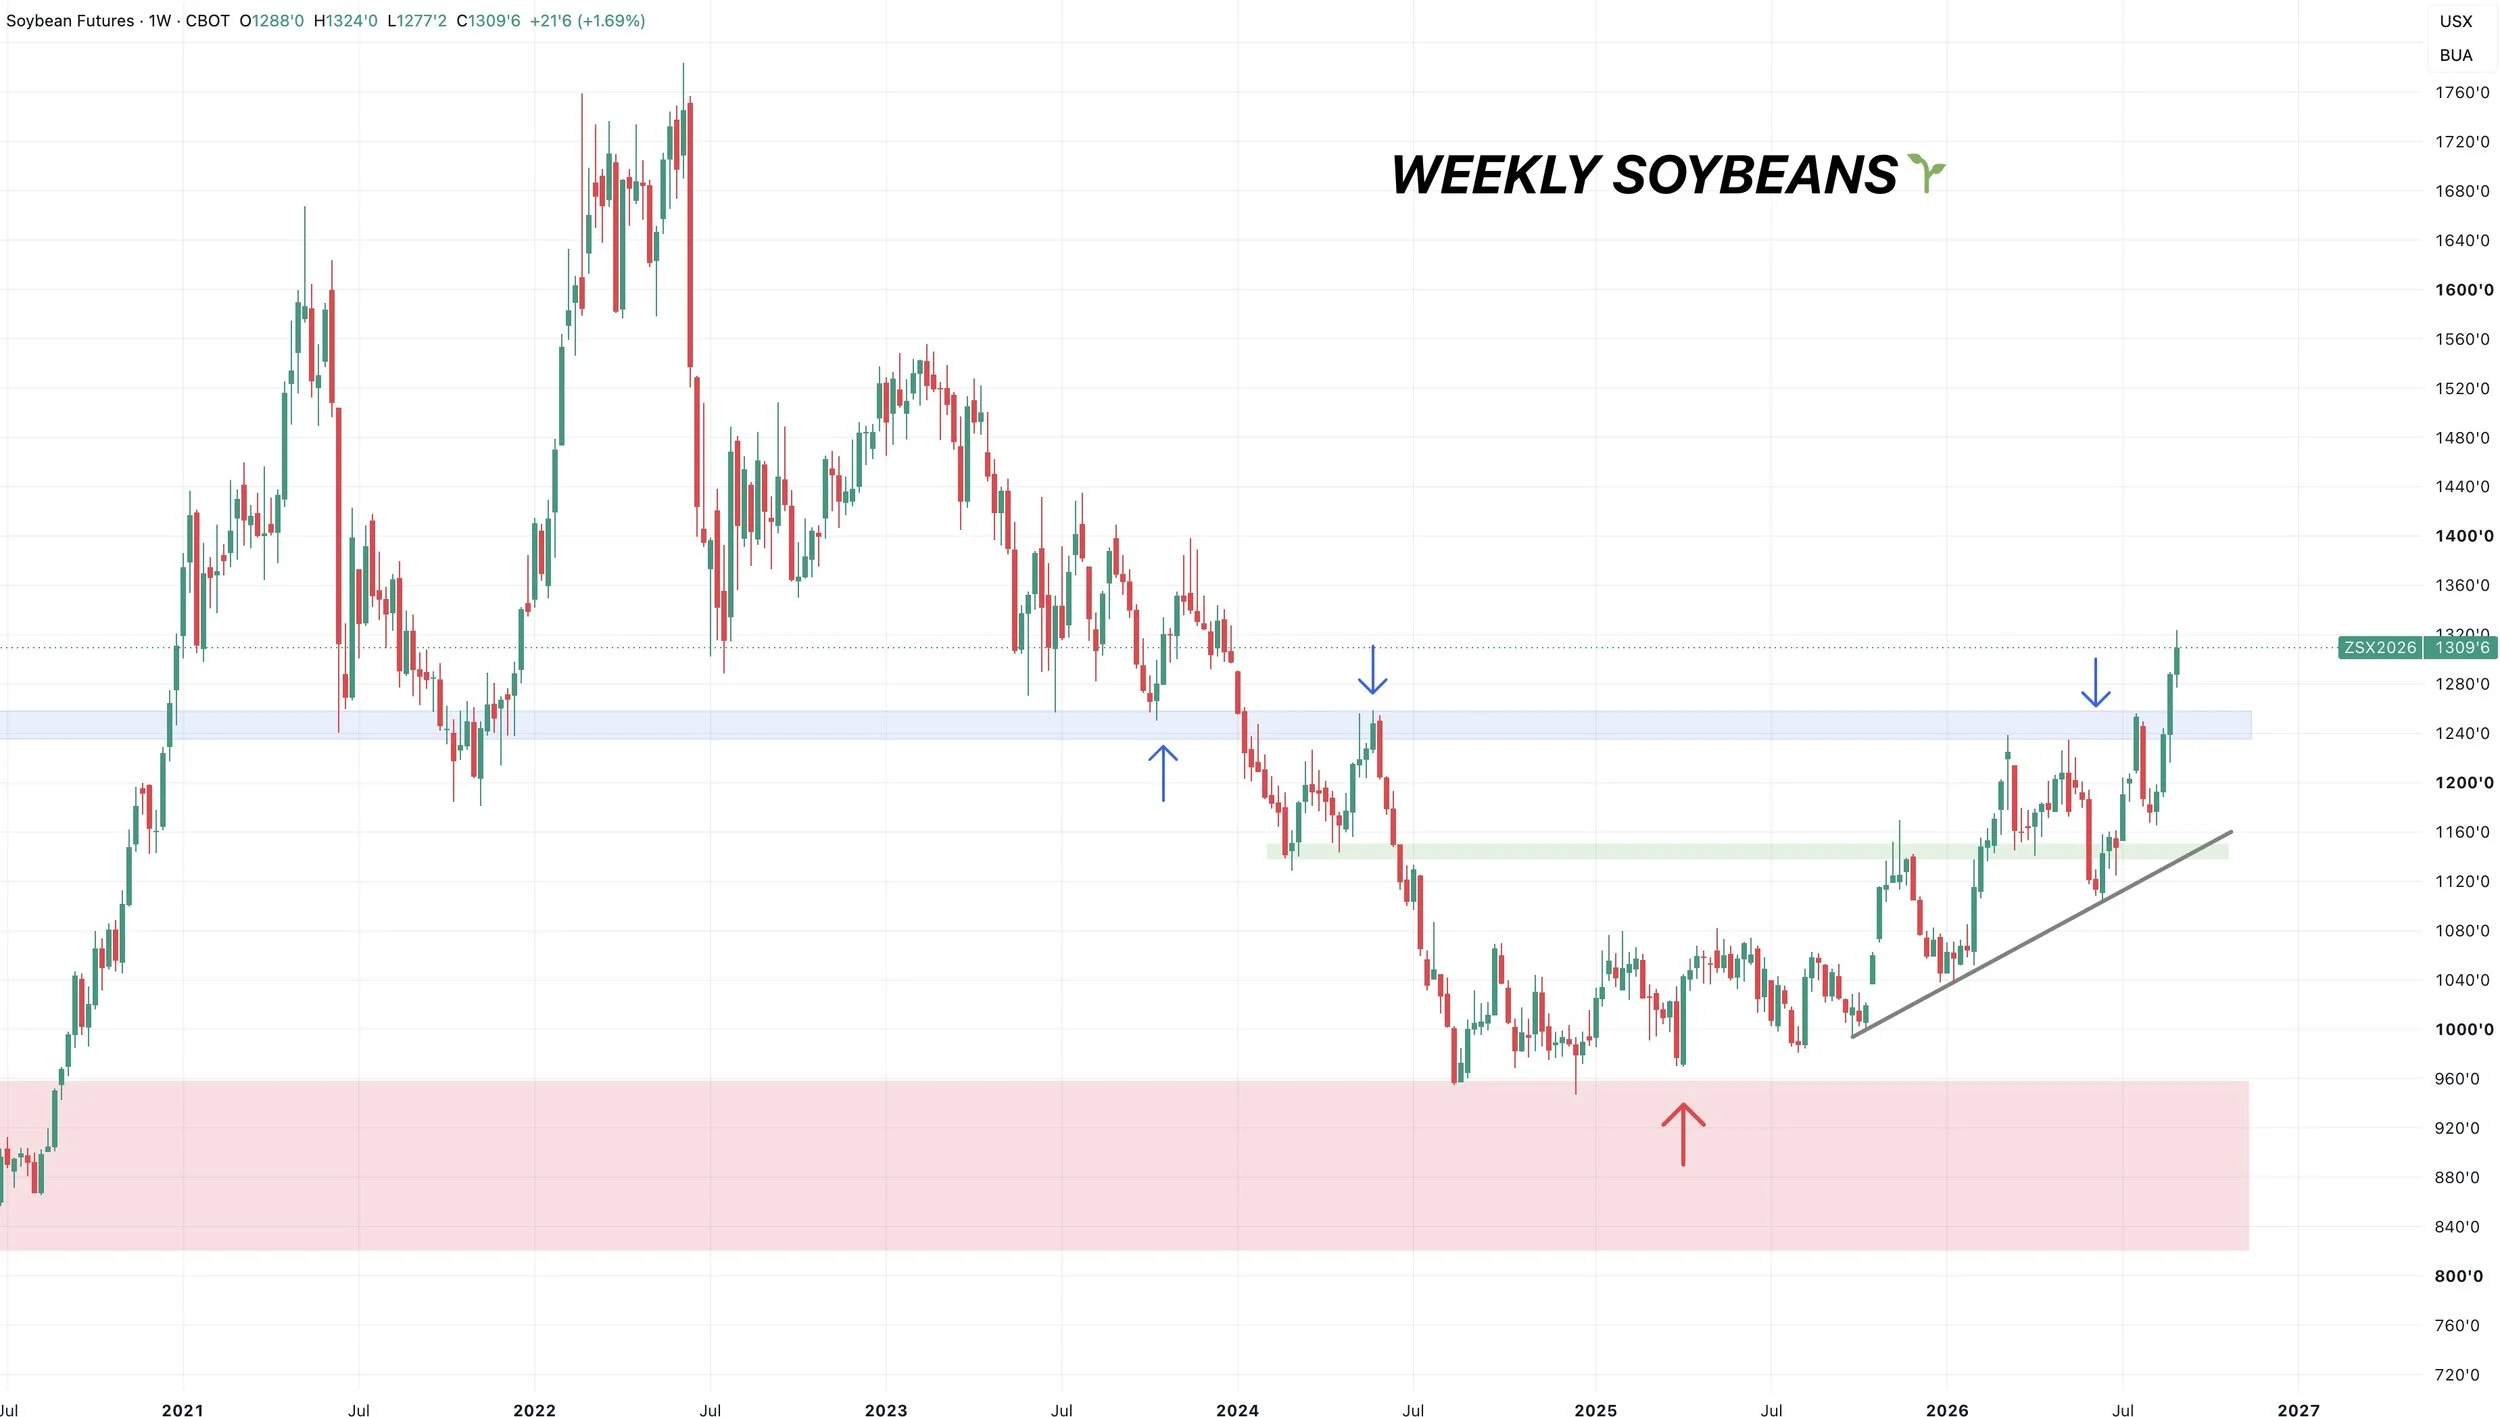
Weekly Chart:
The weekly chart looks great. The long term structure in soybeans is clearly higher.
We just broke through some key resistance. That's been a key level countless times over the last decade.
So seeing us come back down to test that key resistance before resuming higher would not be a major surprise here either.
Again, this does not have to happen, but it would be something to watch if we get a pullback, and it would be completely healthy if it happened.
Regardless of a pullback first or not, breaking that resistance offers plenty of further upside from here.
Monthly Chart:
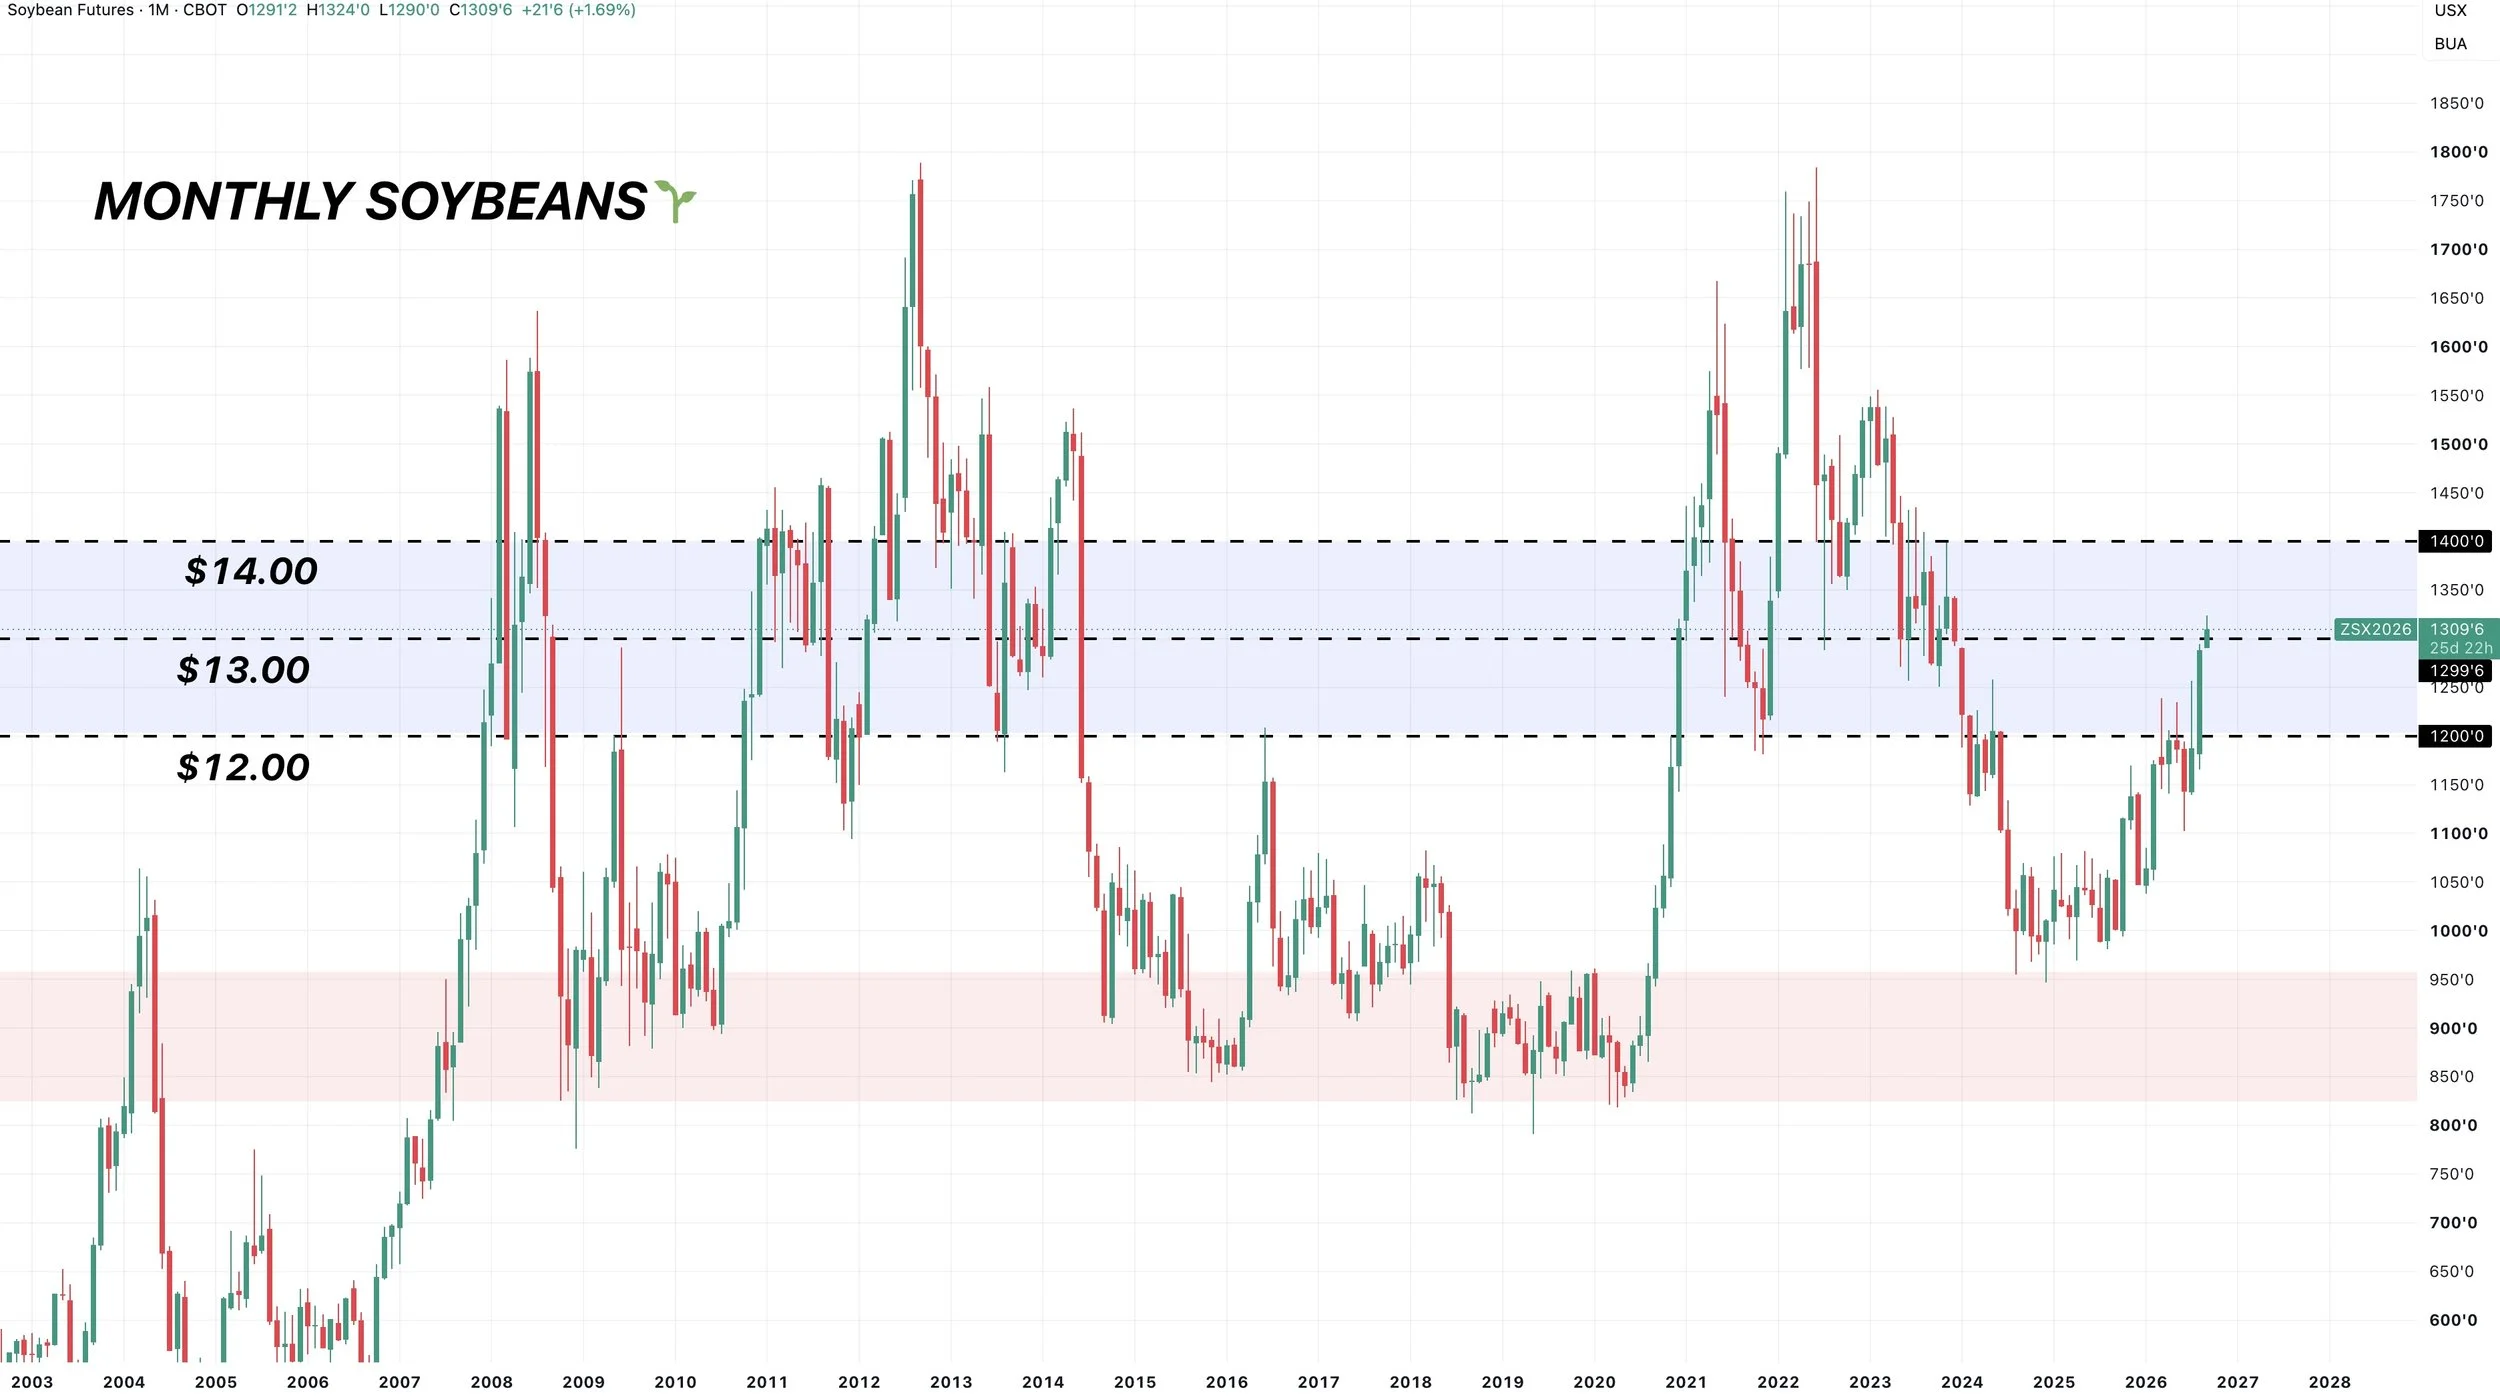
I showed this chart early this week.
Every single time we have seen a monthly close above $12.00, the market has ran to $14.00 or higher.
Not just simply traded above $12.00, but when we got a monthly close above.
Which we just did in August.
So I think there is a good chance we see $14.00 at some point, whether we get a short term set back here first or not.
Meal Daily Chart:
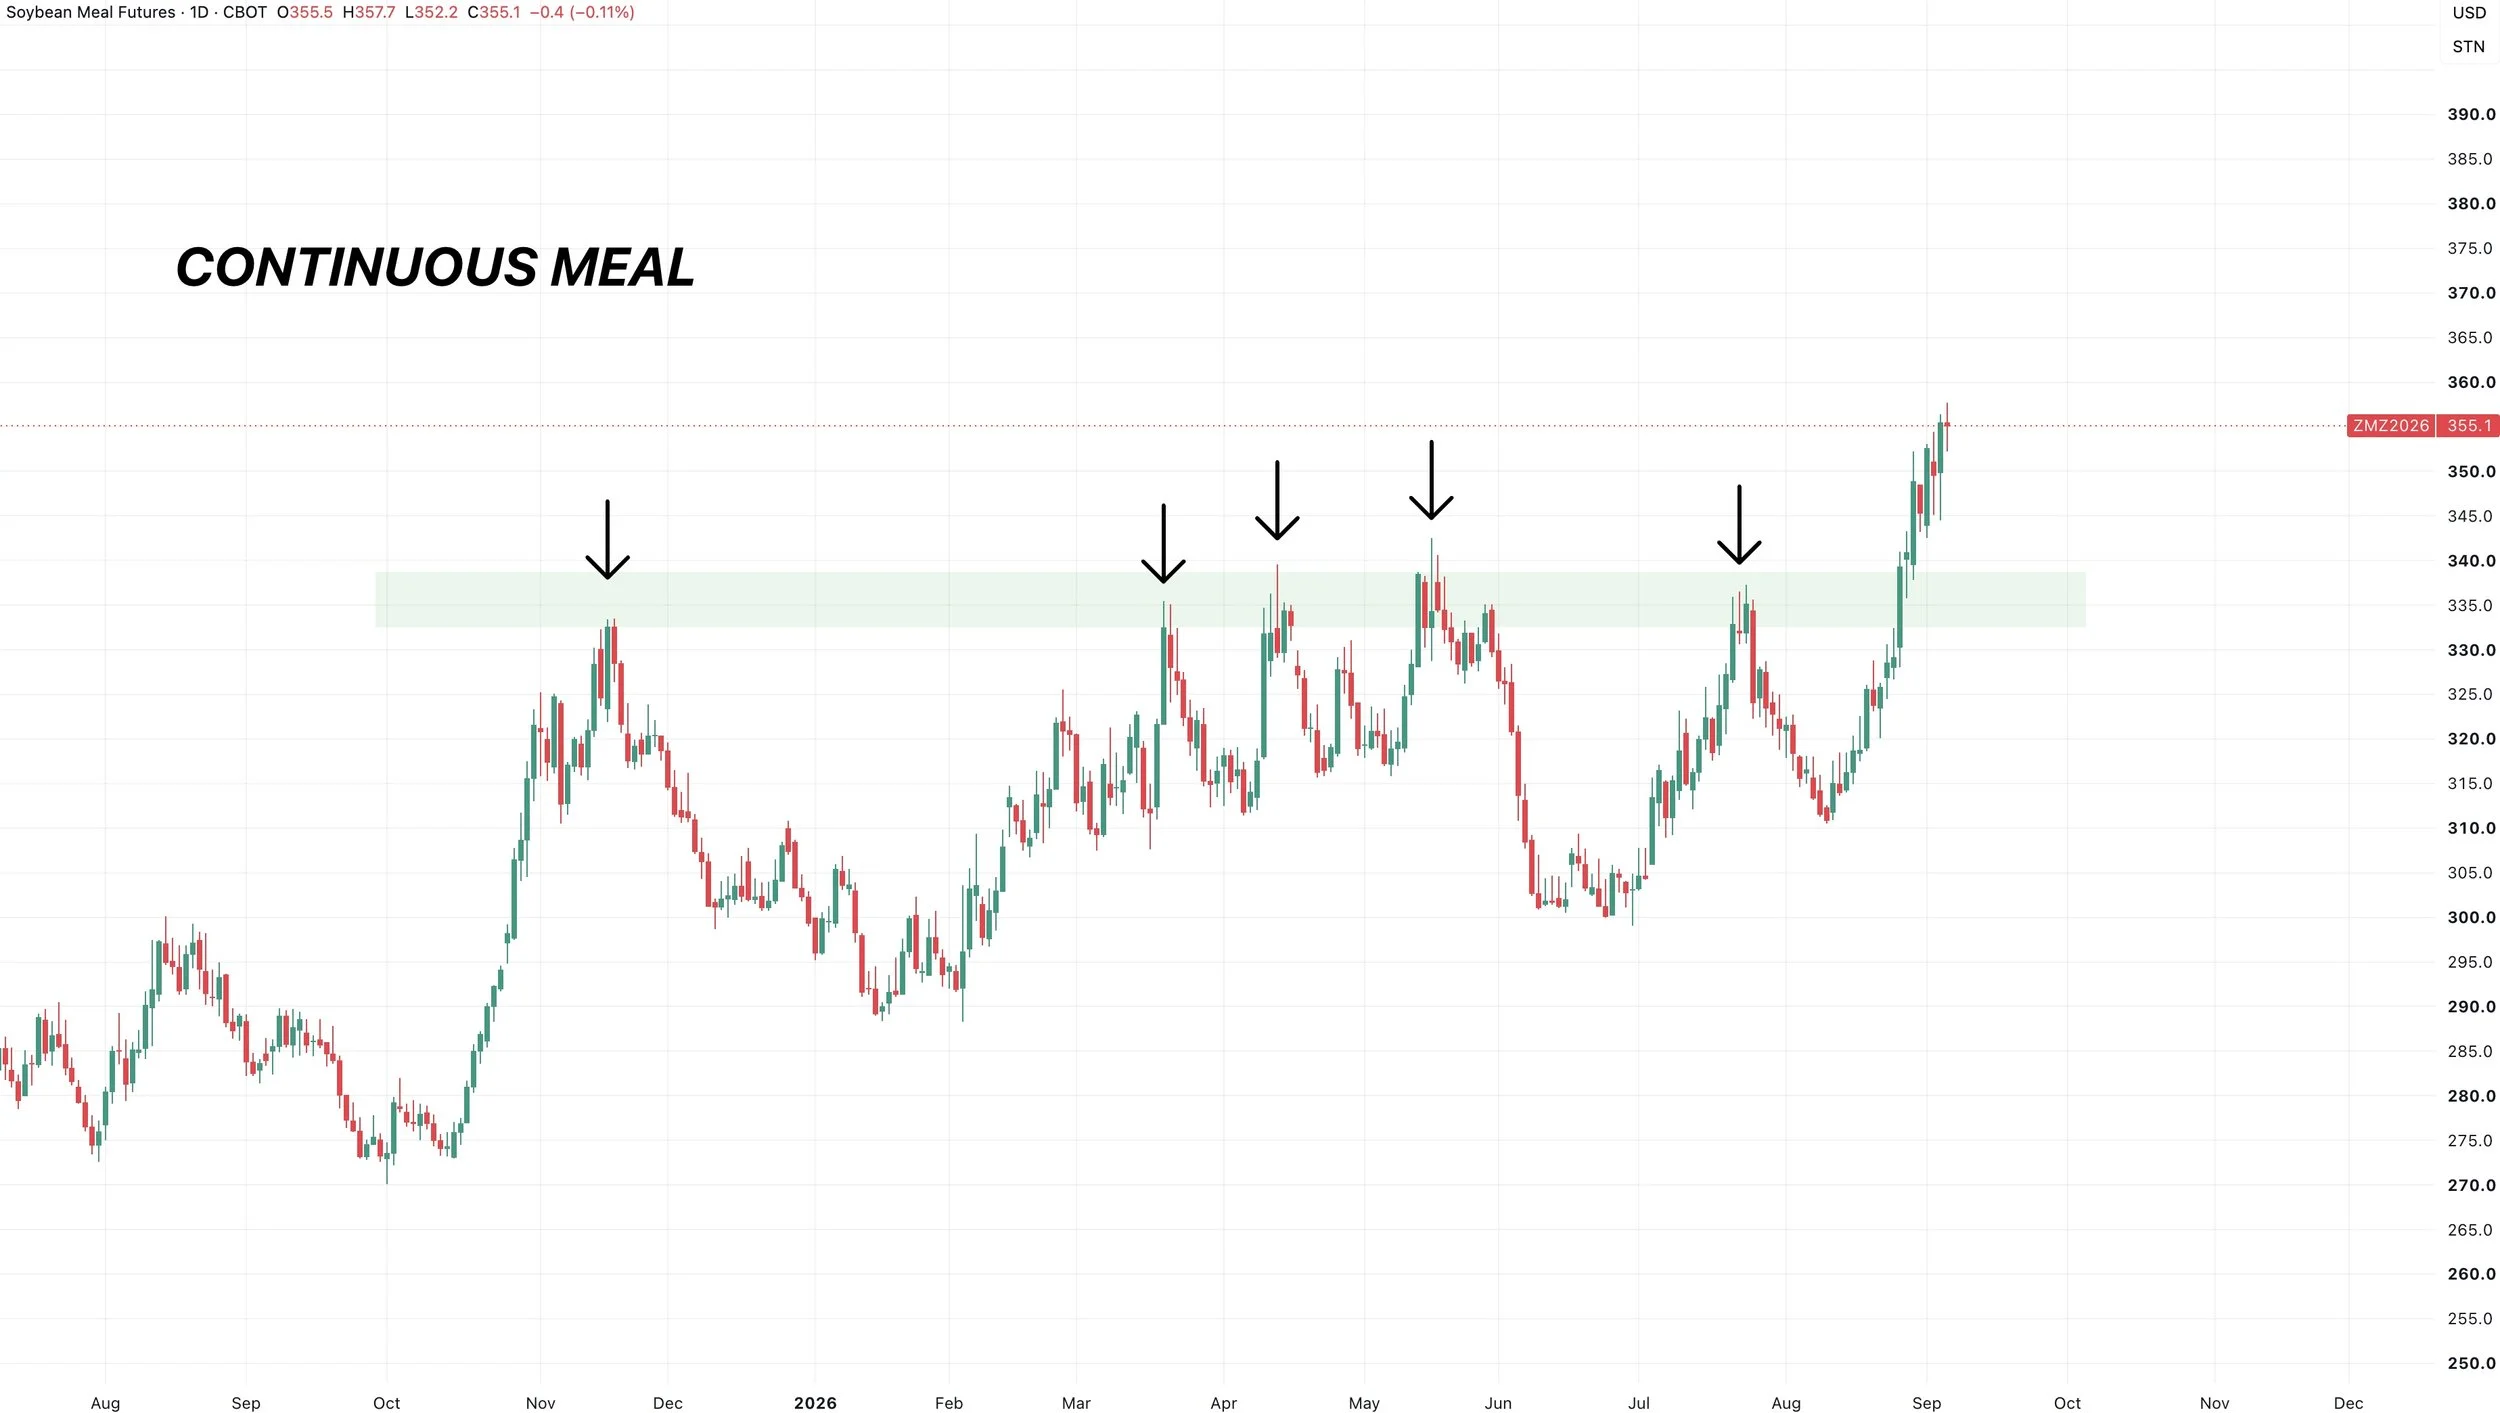
Here is the front month chart for meal.
I included meal today because there is some interesting things happening here.
It broke some major resistance.
That green box marked the highs 5 separate times over the last year.
We finally got the breakout.
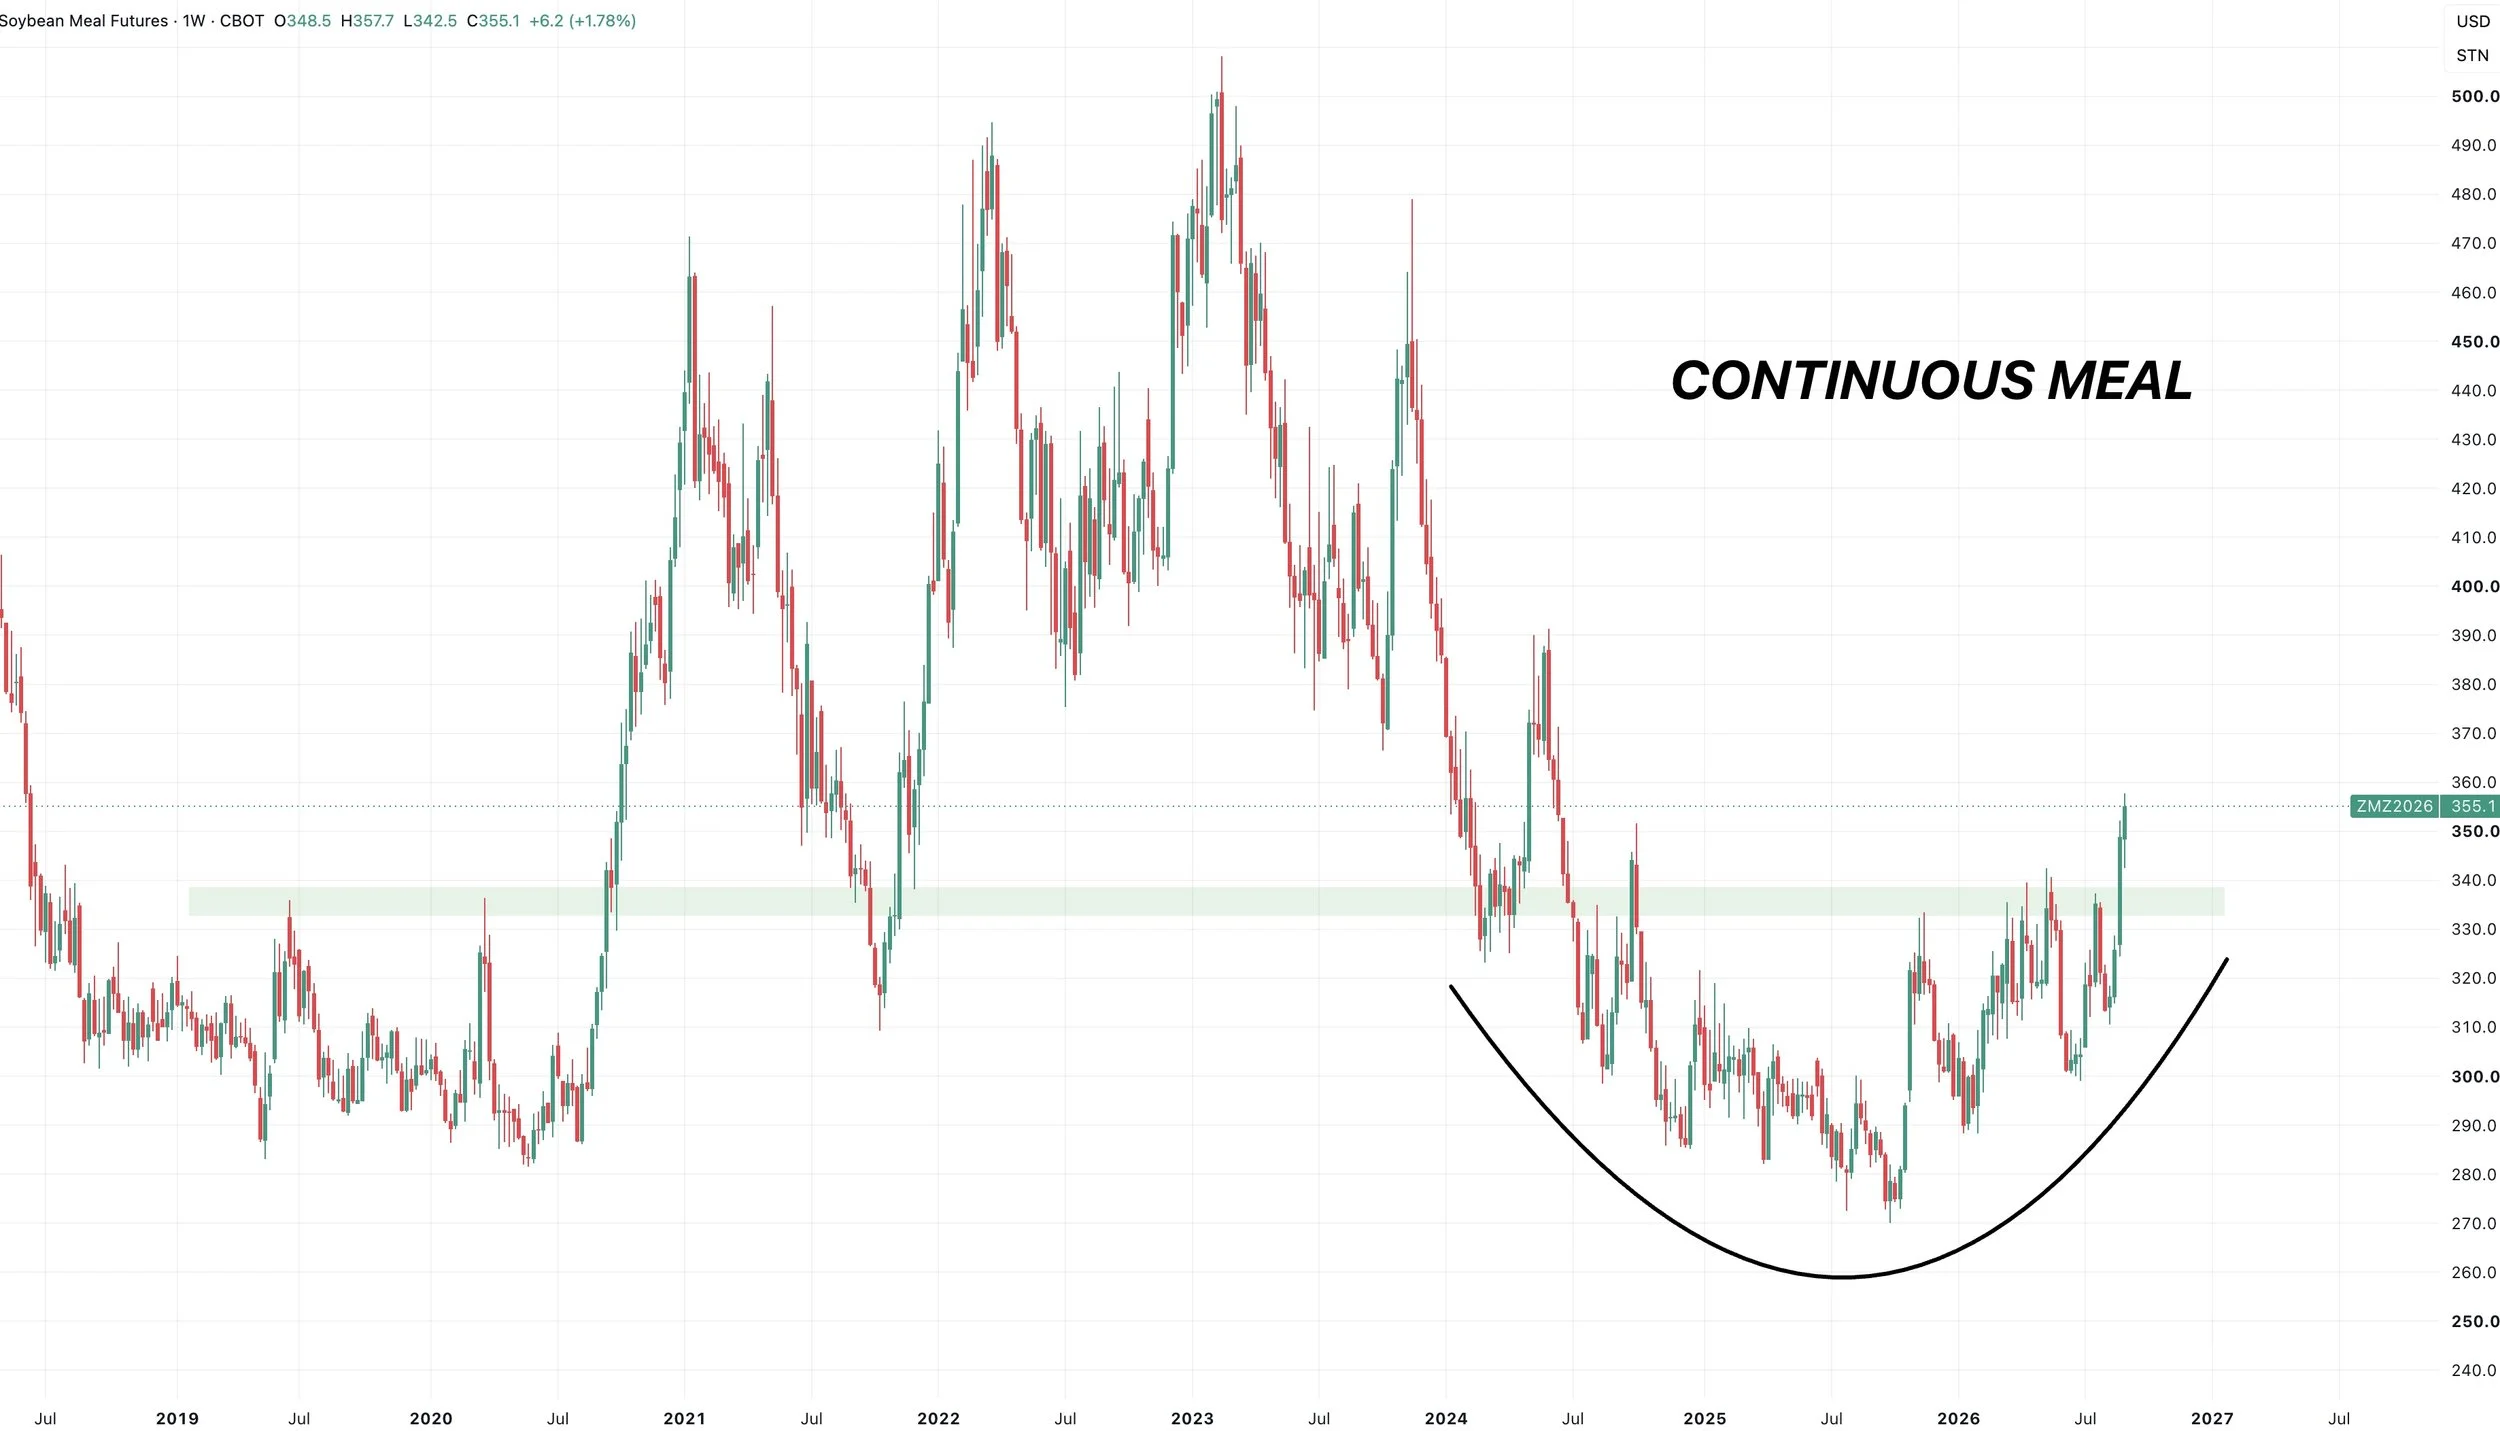
If you zoom out and look at the weekly chart, meal could have plenty of room to run long term.
So this should ultimately be friendly for soybeans as well if it runs.
Strategy for Report:
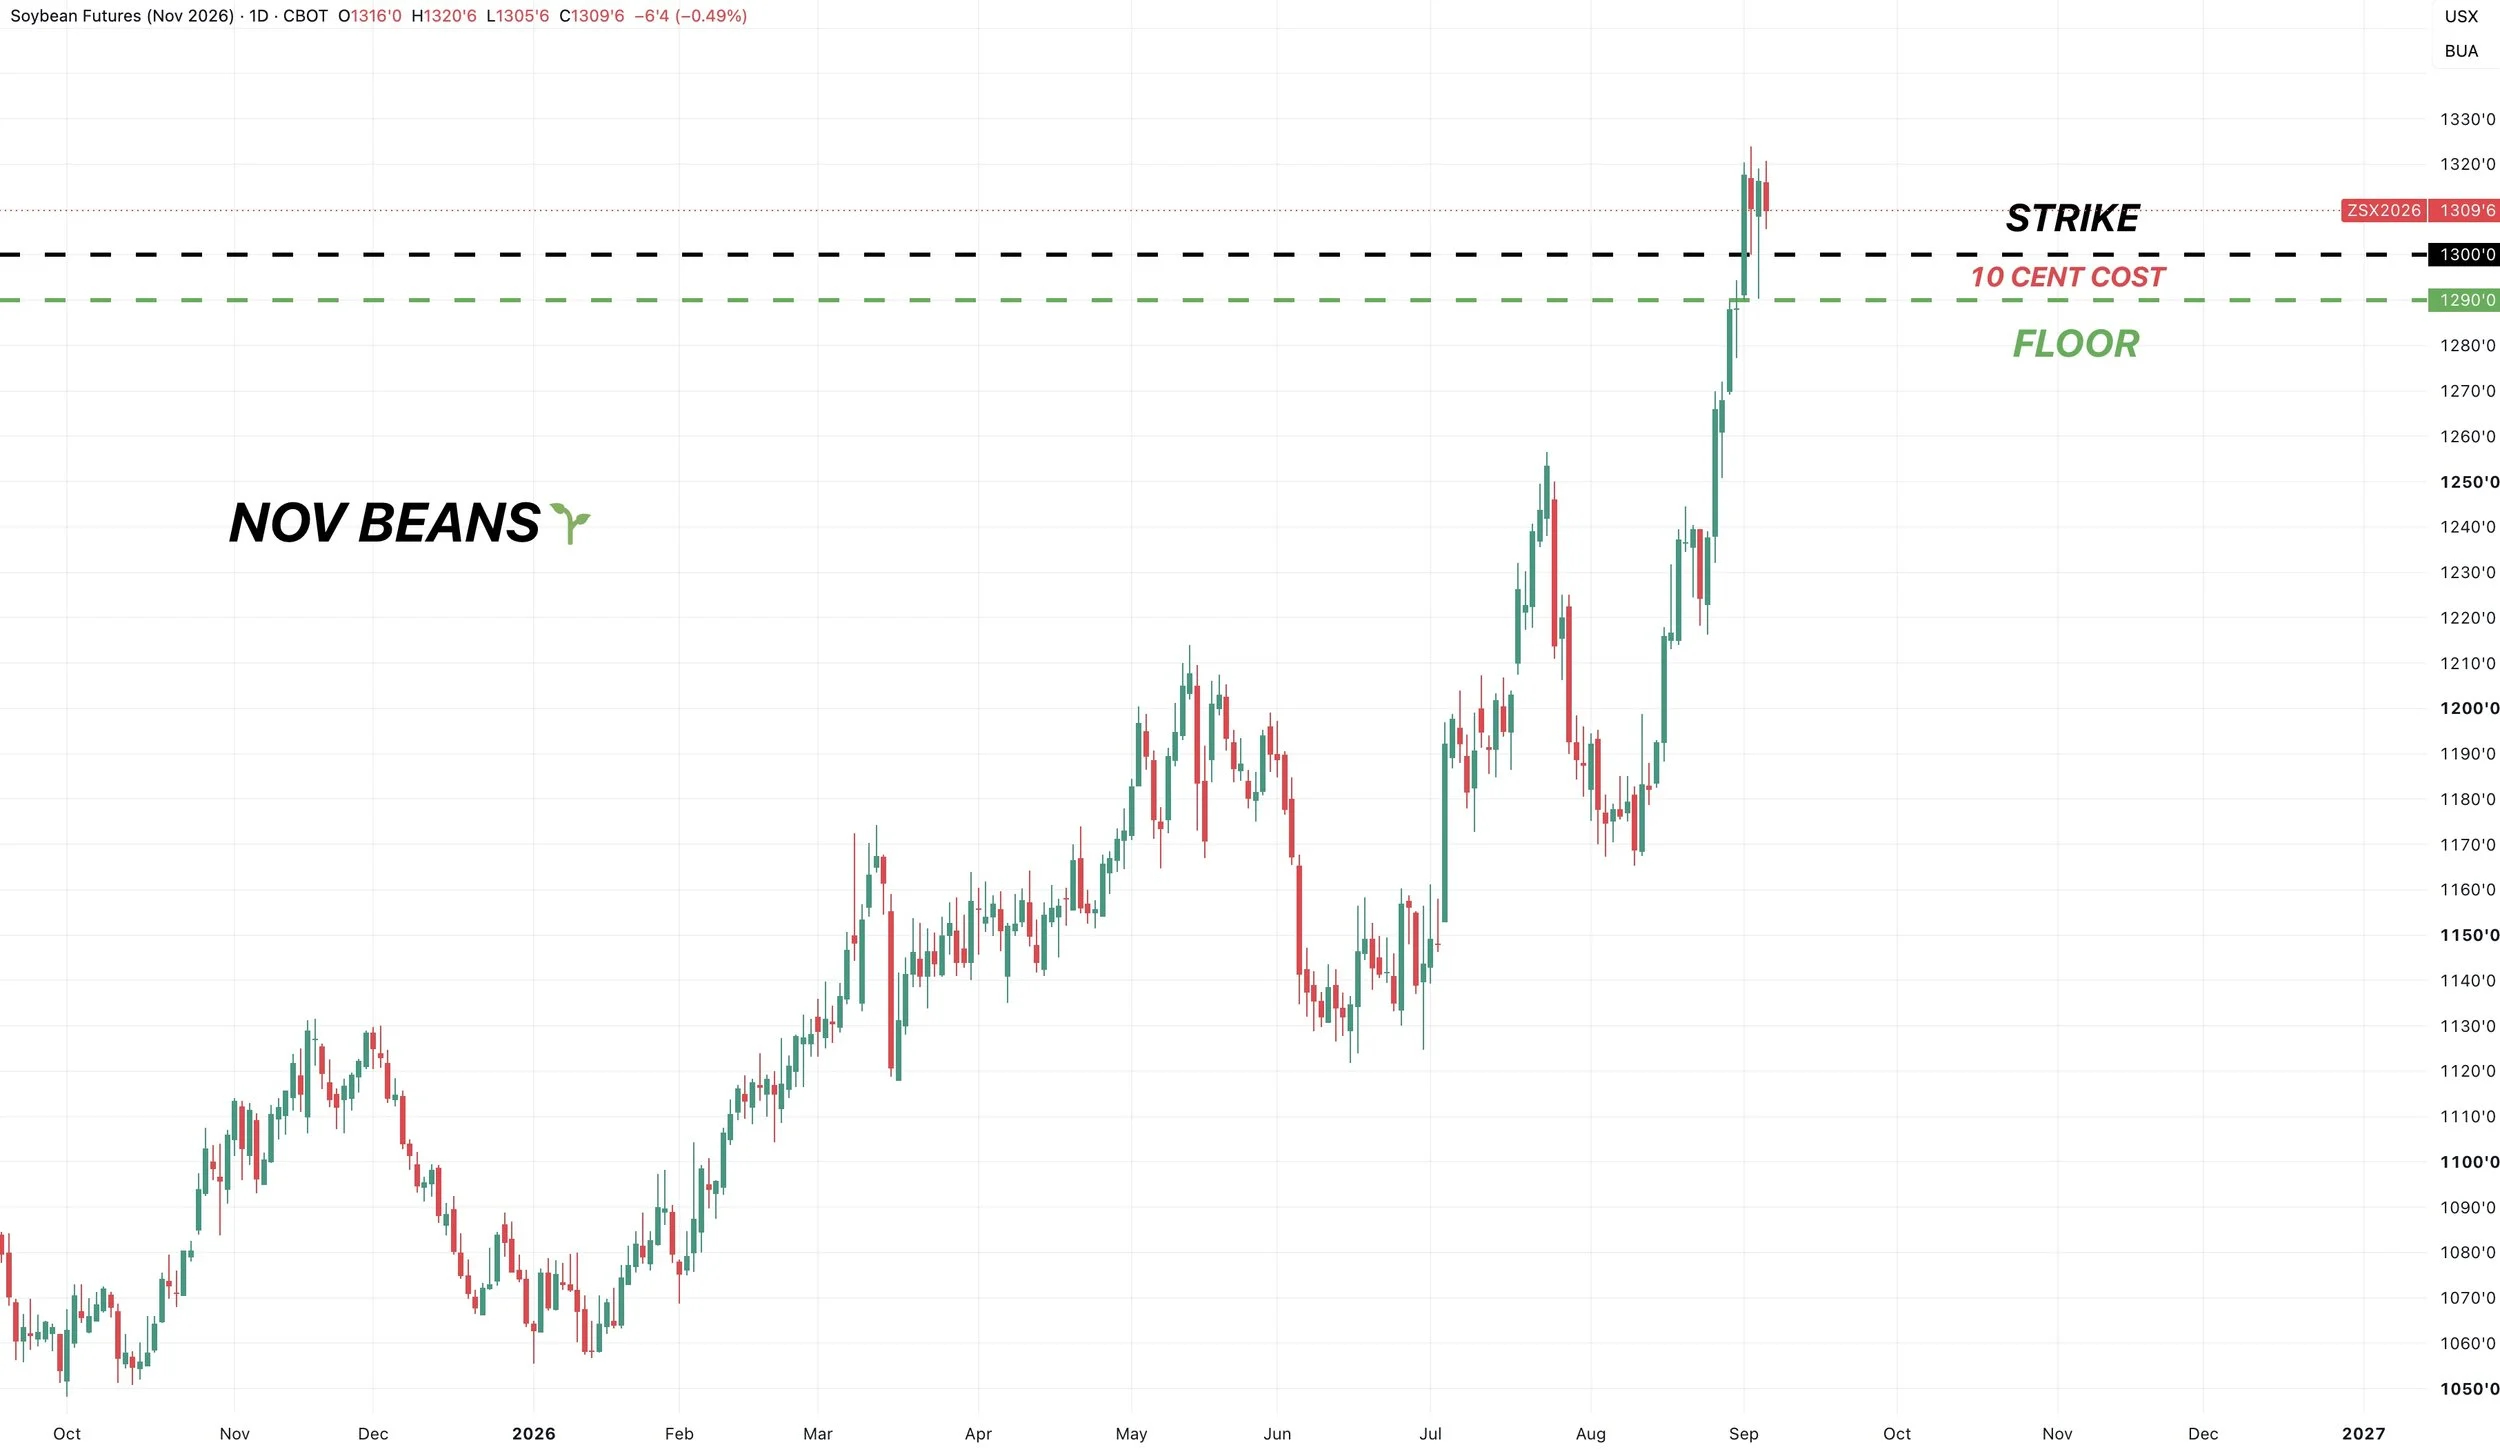
Like in corn, we do not want a long term floor. They are far too expensive.
The best thing we like doing for downside protection is a simple put that expires the day of the USDA report.
You could get a $13.00 put for about 10 cents. Which would give you a floor of $12.90
Wheat
Last Friday's Sell & Hedge Alert:
Last week we had our first alert in wheat in a while.
Inside the alert we went over some strategies as well. As we like taking advantage of the high implied volatility in options.
If you missed it: Click Here
The strategies we talked about in the alert won’t be the exact same costs etc given the pullback, but relatively similar approaches. Reach out if you'd like to discuss some strategies.
Office: (806)484-1214
Dec KC Chart:
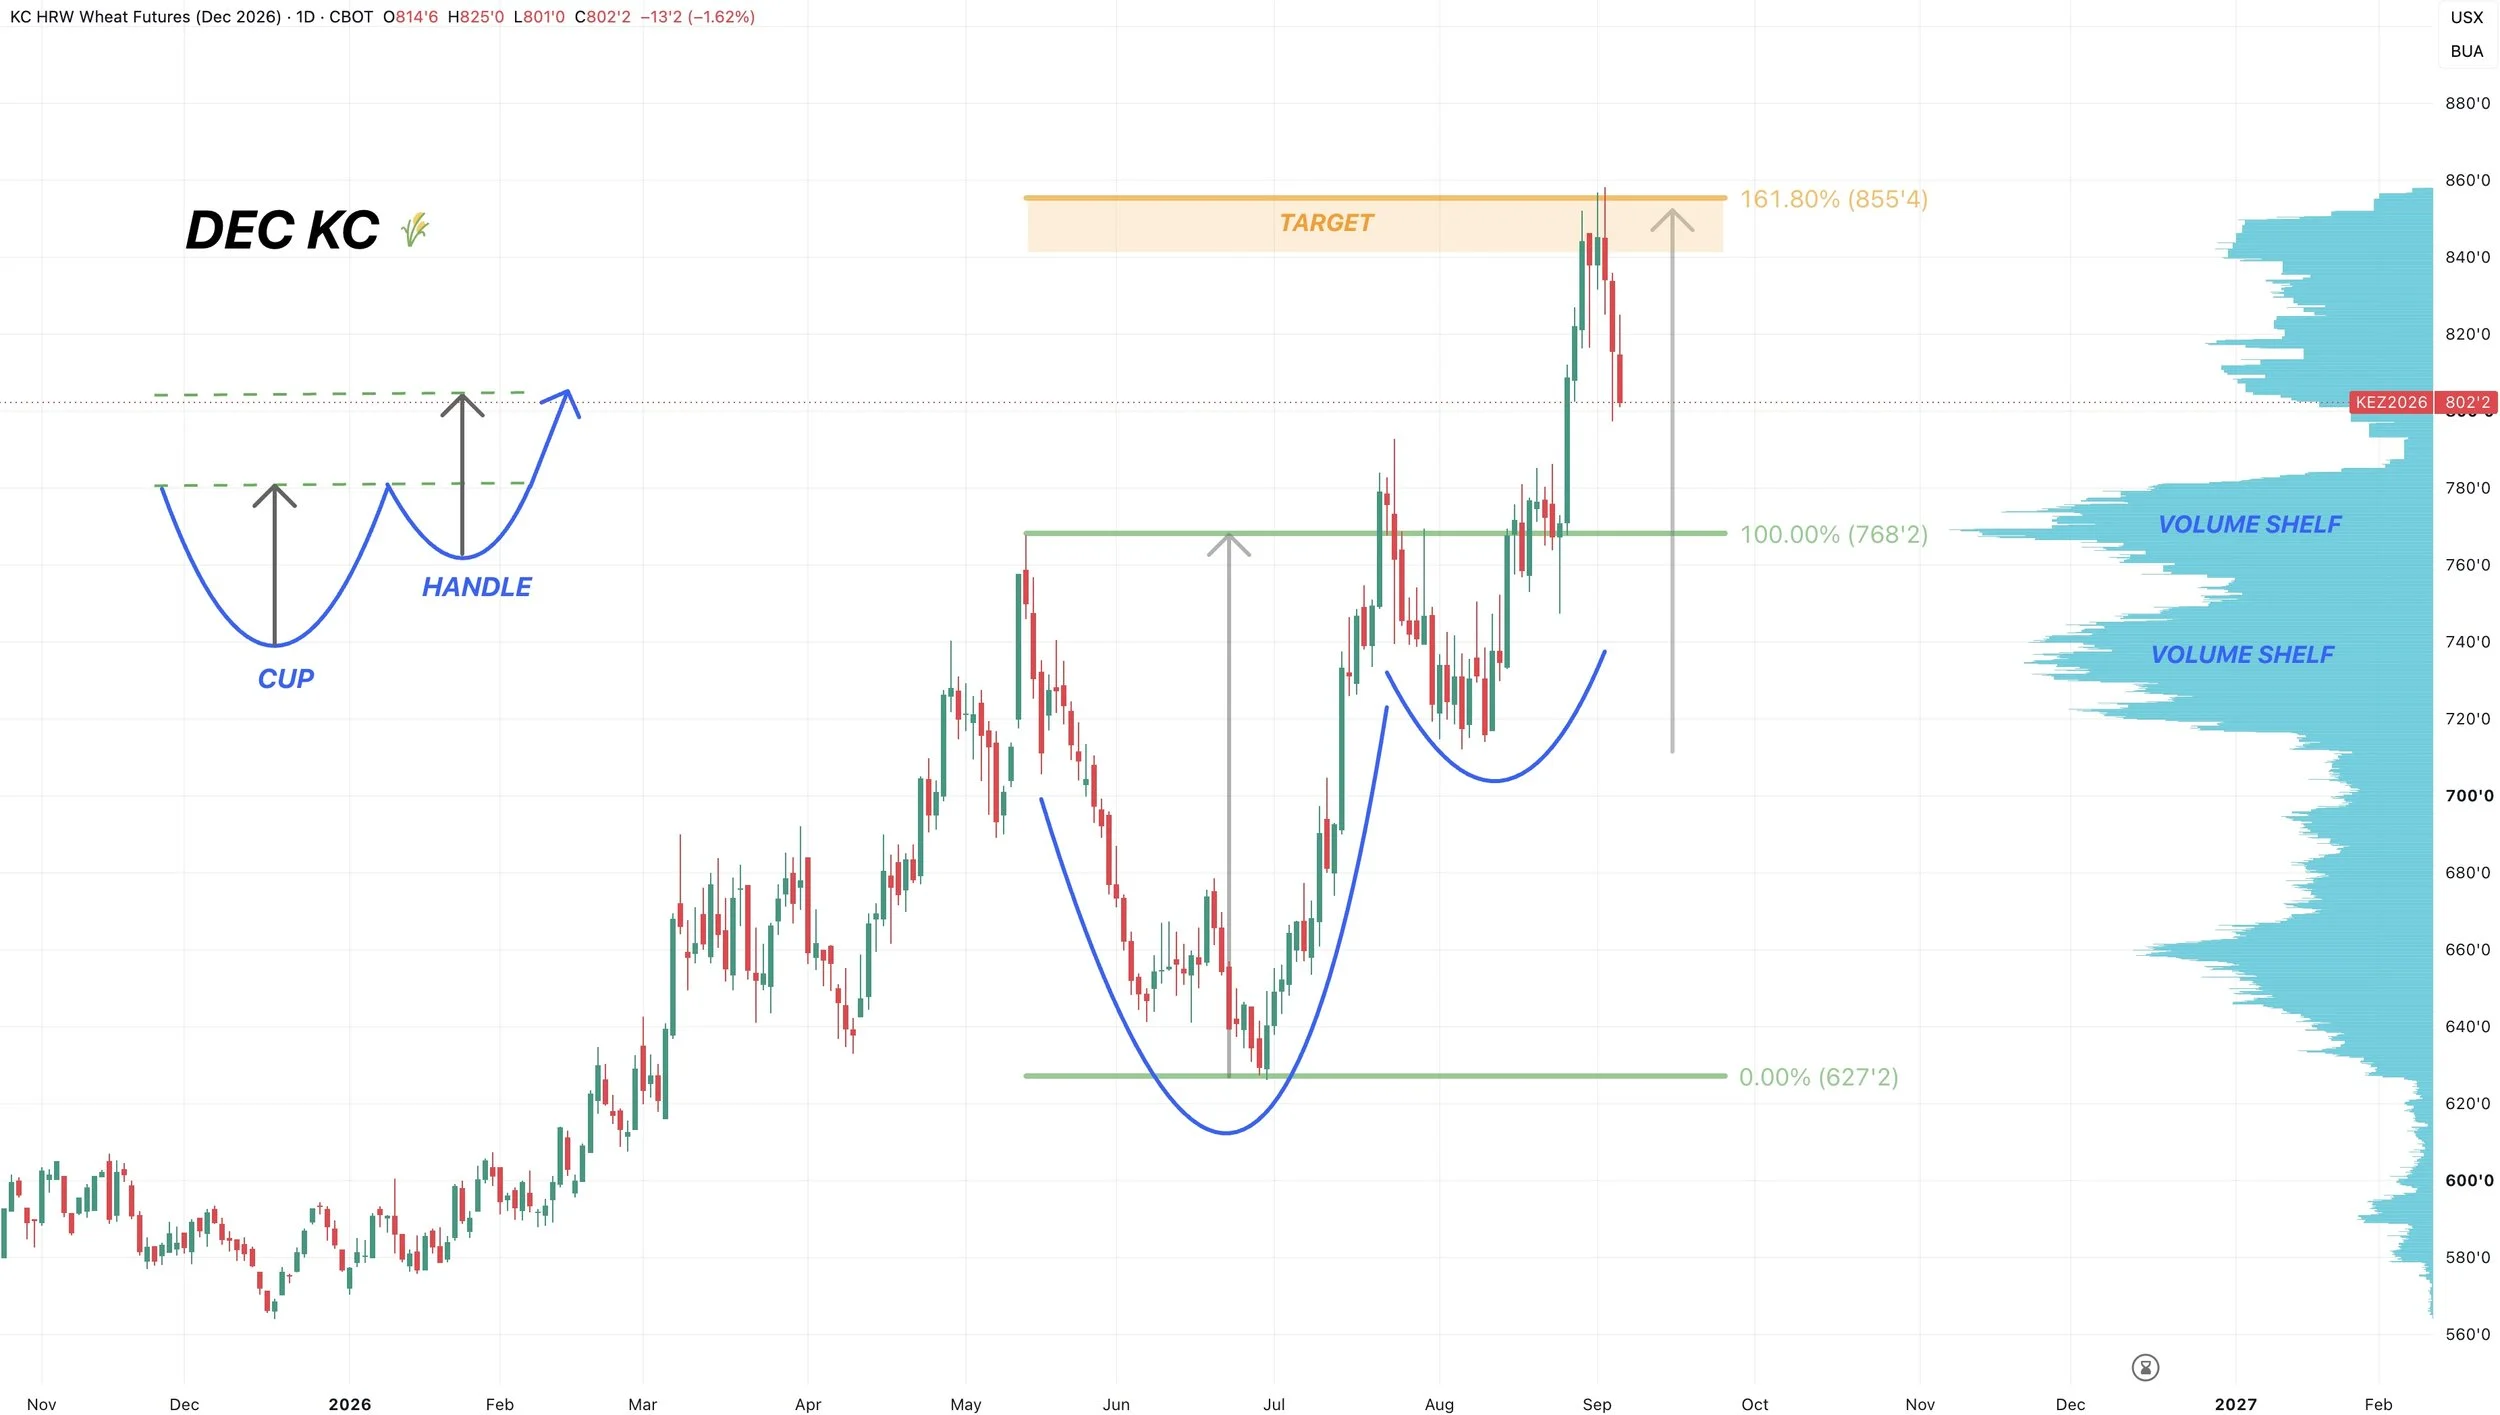
The reason for the alert was that we hit our target.
We perfectly hit that golden fib. Which was 161.8% of the June lows up to the May highs.
Like in the rest of the grains and our other targets, this is a very common continuation target in a bullish market like this one.
Not only was this the golden fib, but this was the exact implied move from the cup and handle pattern we had been talking about for the last month or so.
We are now seeing wheat reject that target and get a pullback.
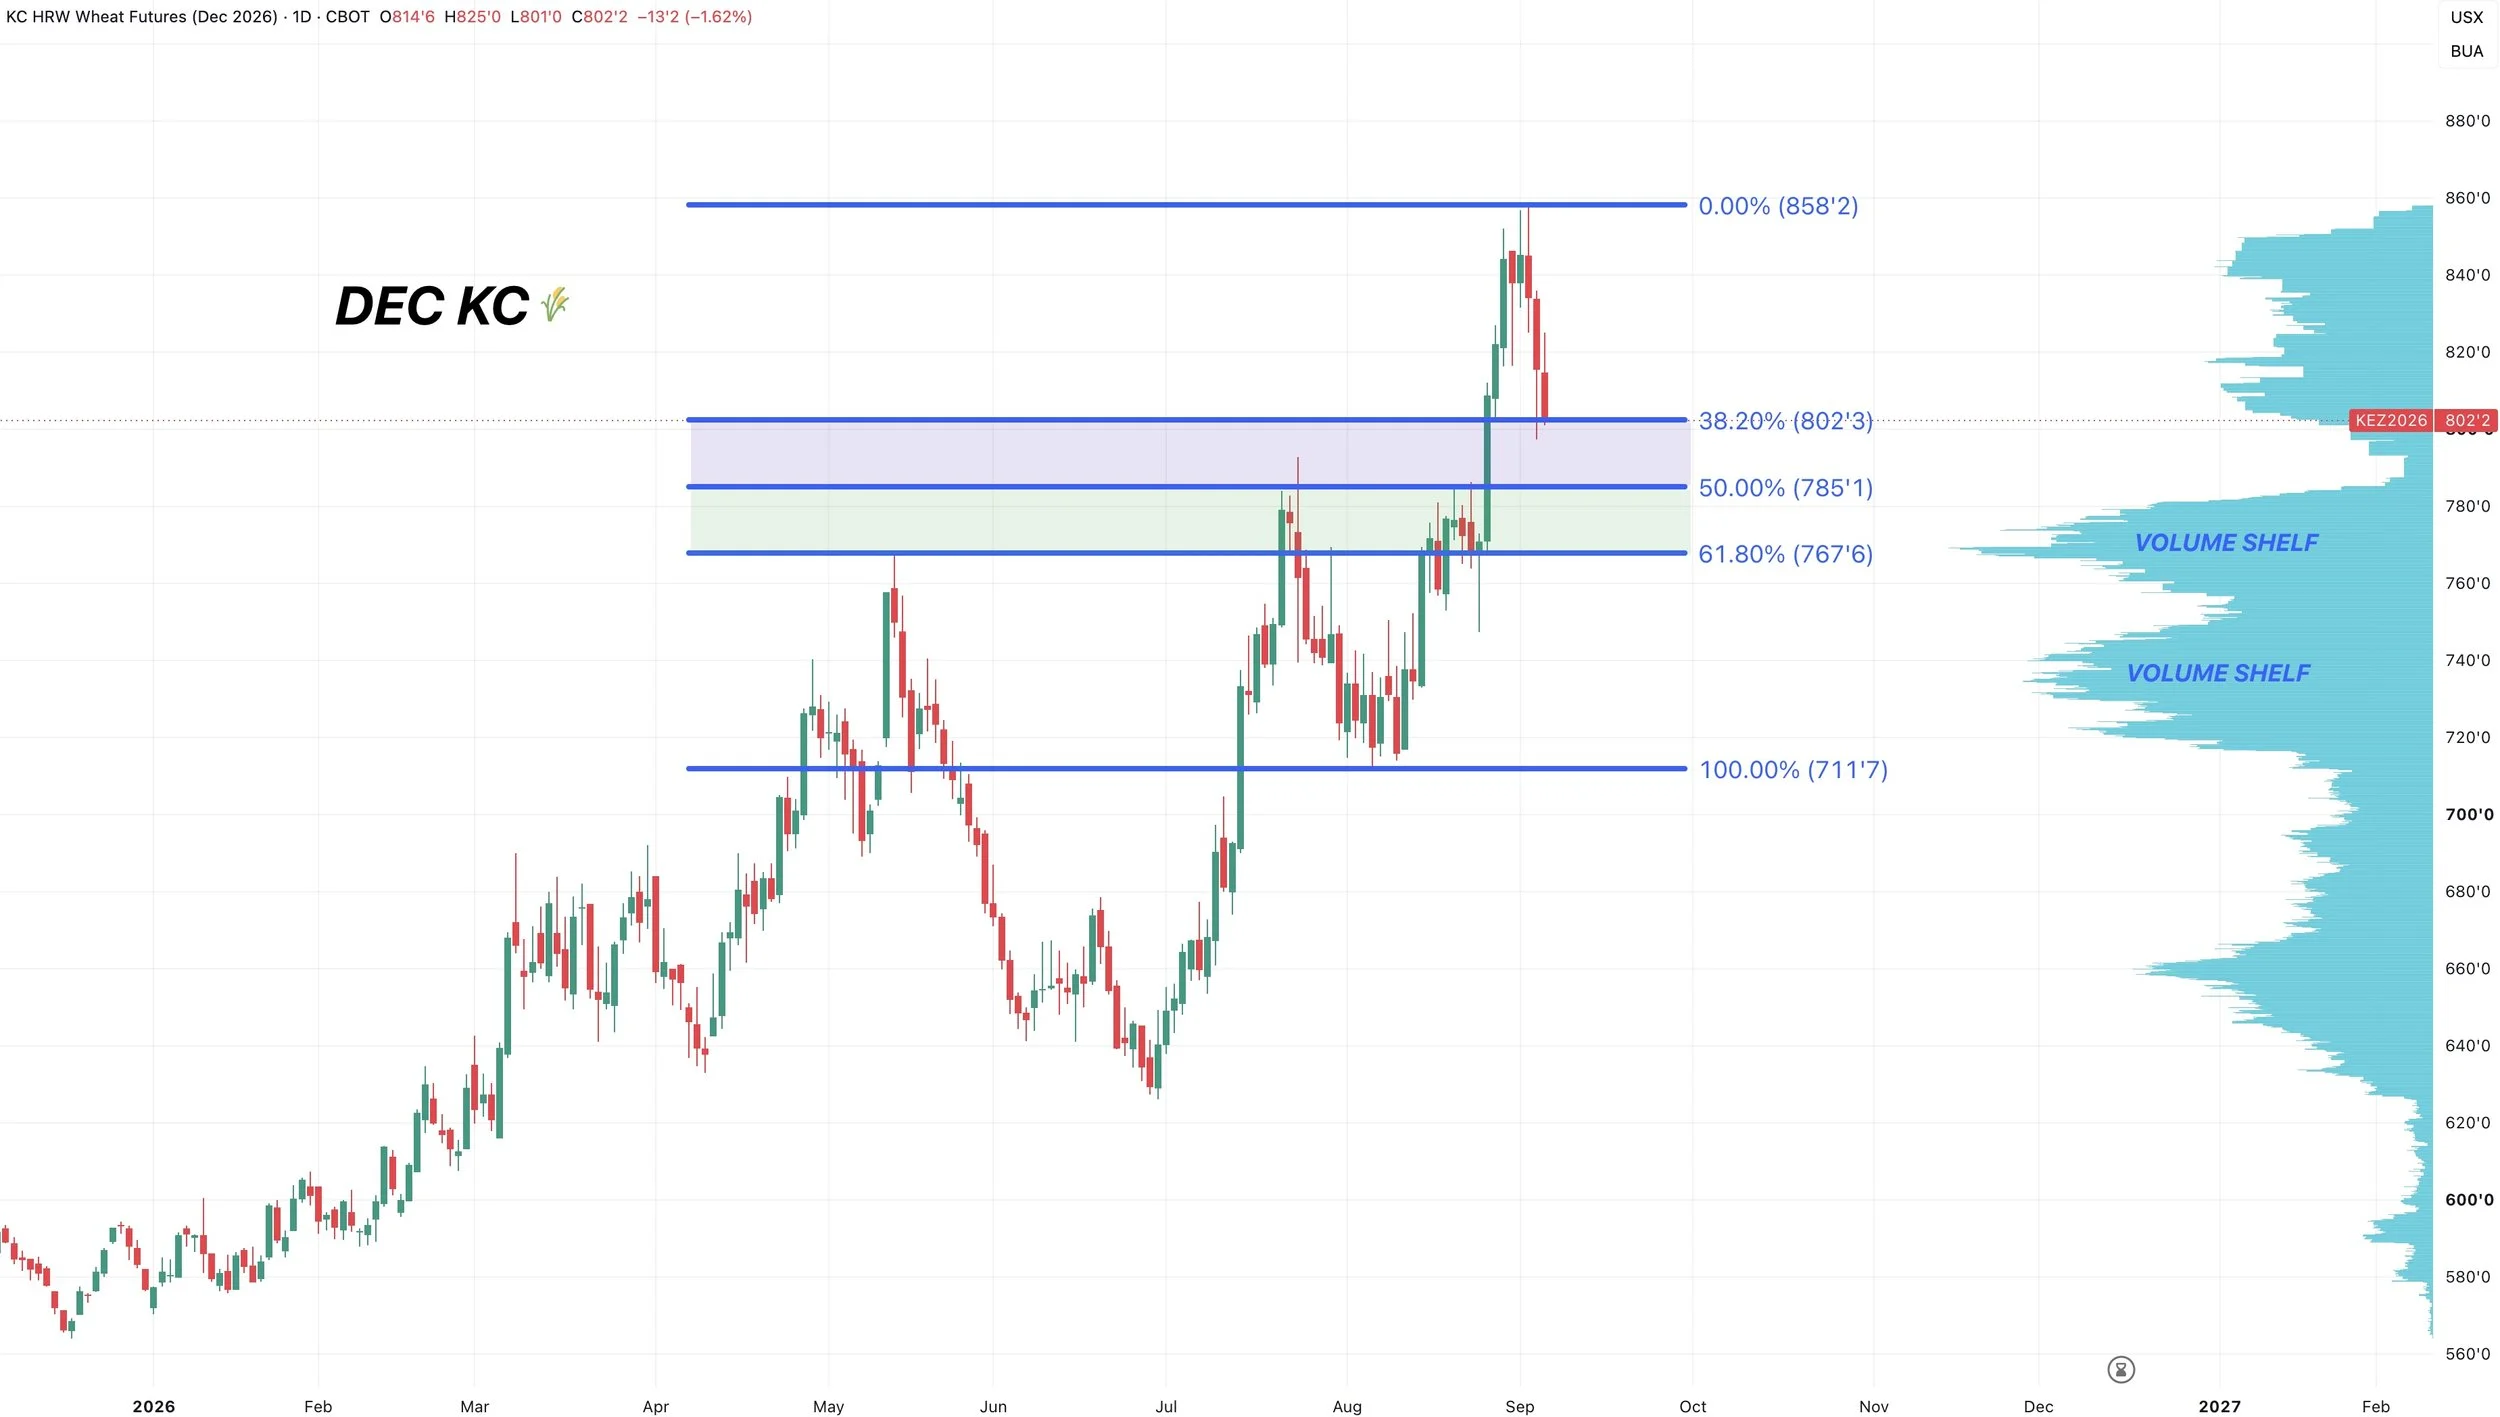
How far could we pullback?
The golden zone, the 50-61.8% retracements down to those August lows lines right up with those prior highs.
So I could see us turning those old highs into some new lows.
There is a big shelf of volume that sits right at that level as well.
Volume shelves can often act as magnets.
So that is where I would expect us to find some life if we are unable to hold yesterday’s lows.
Monthly KC Chart:
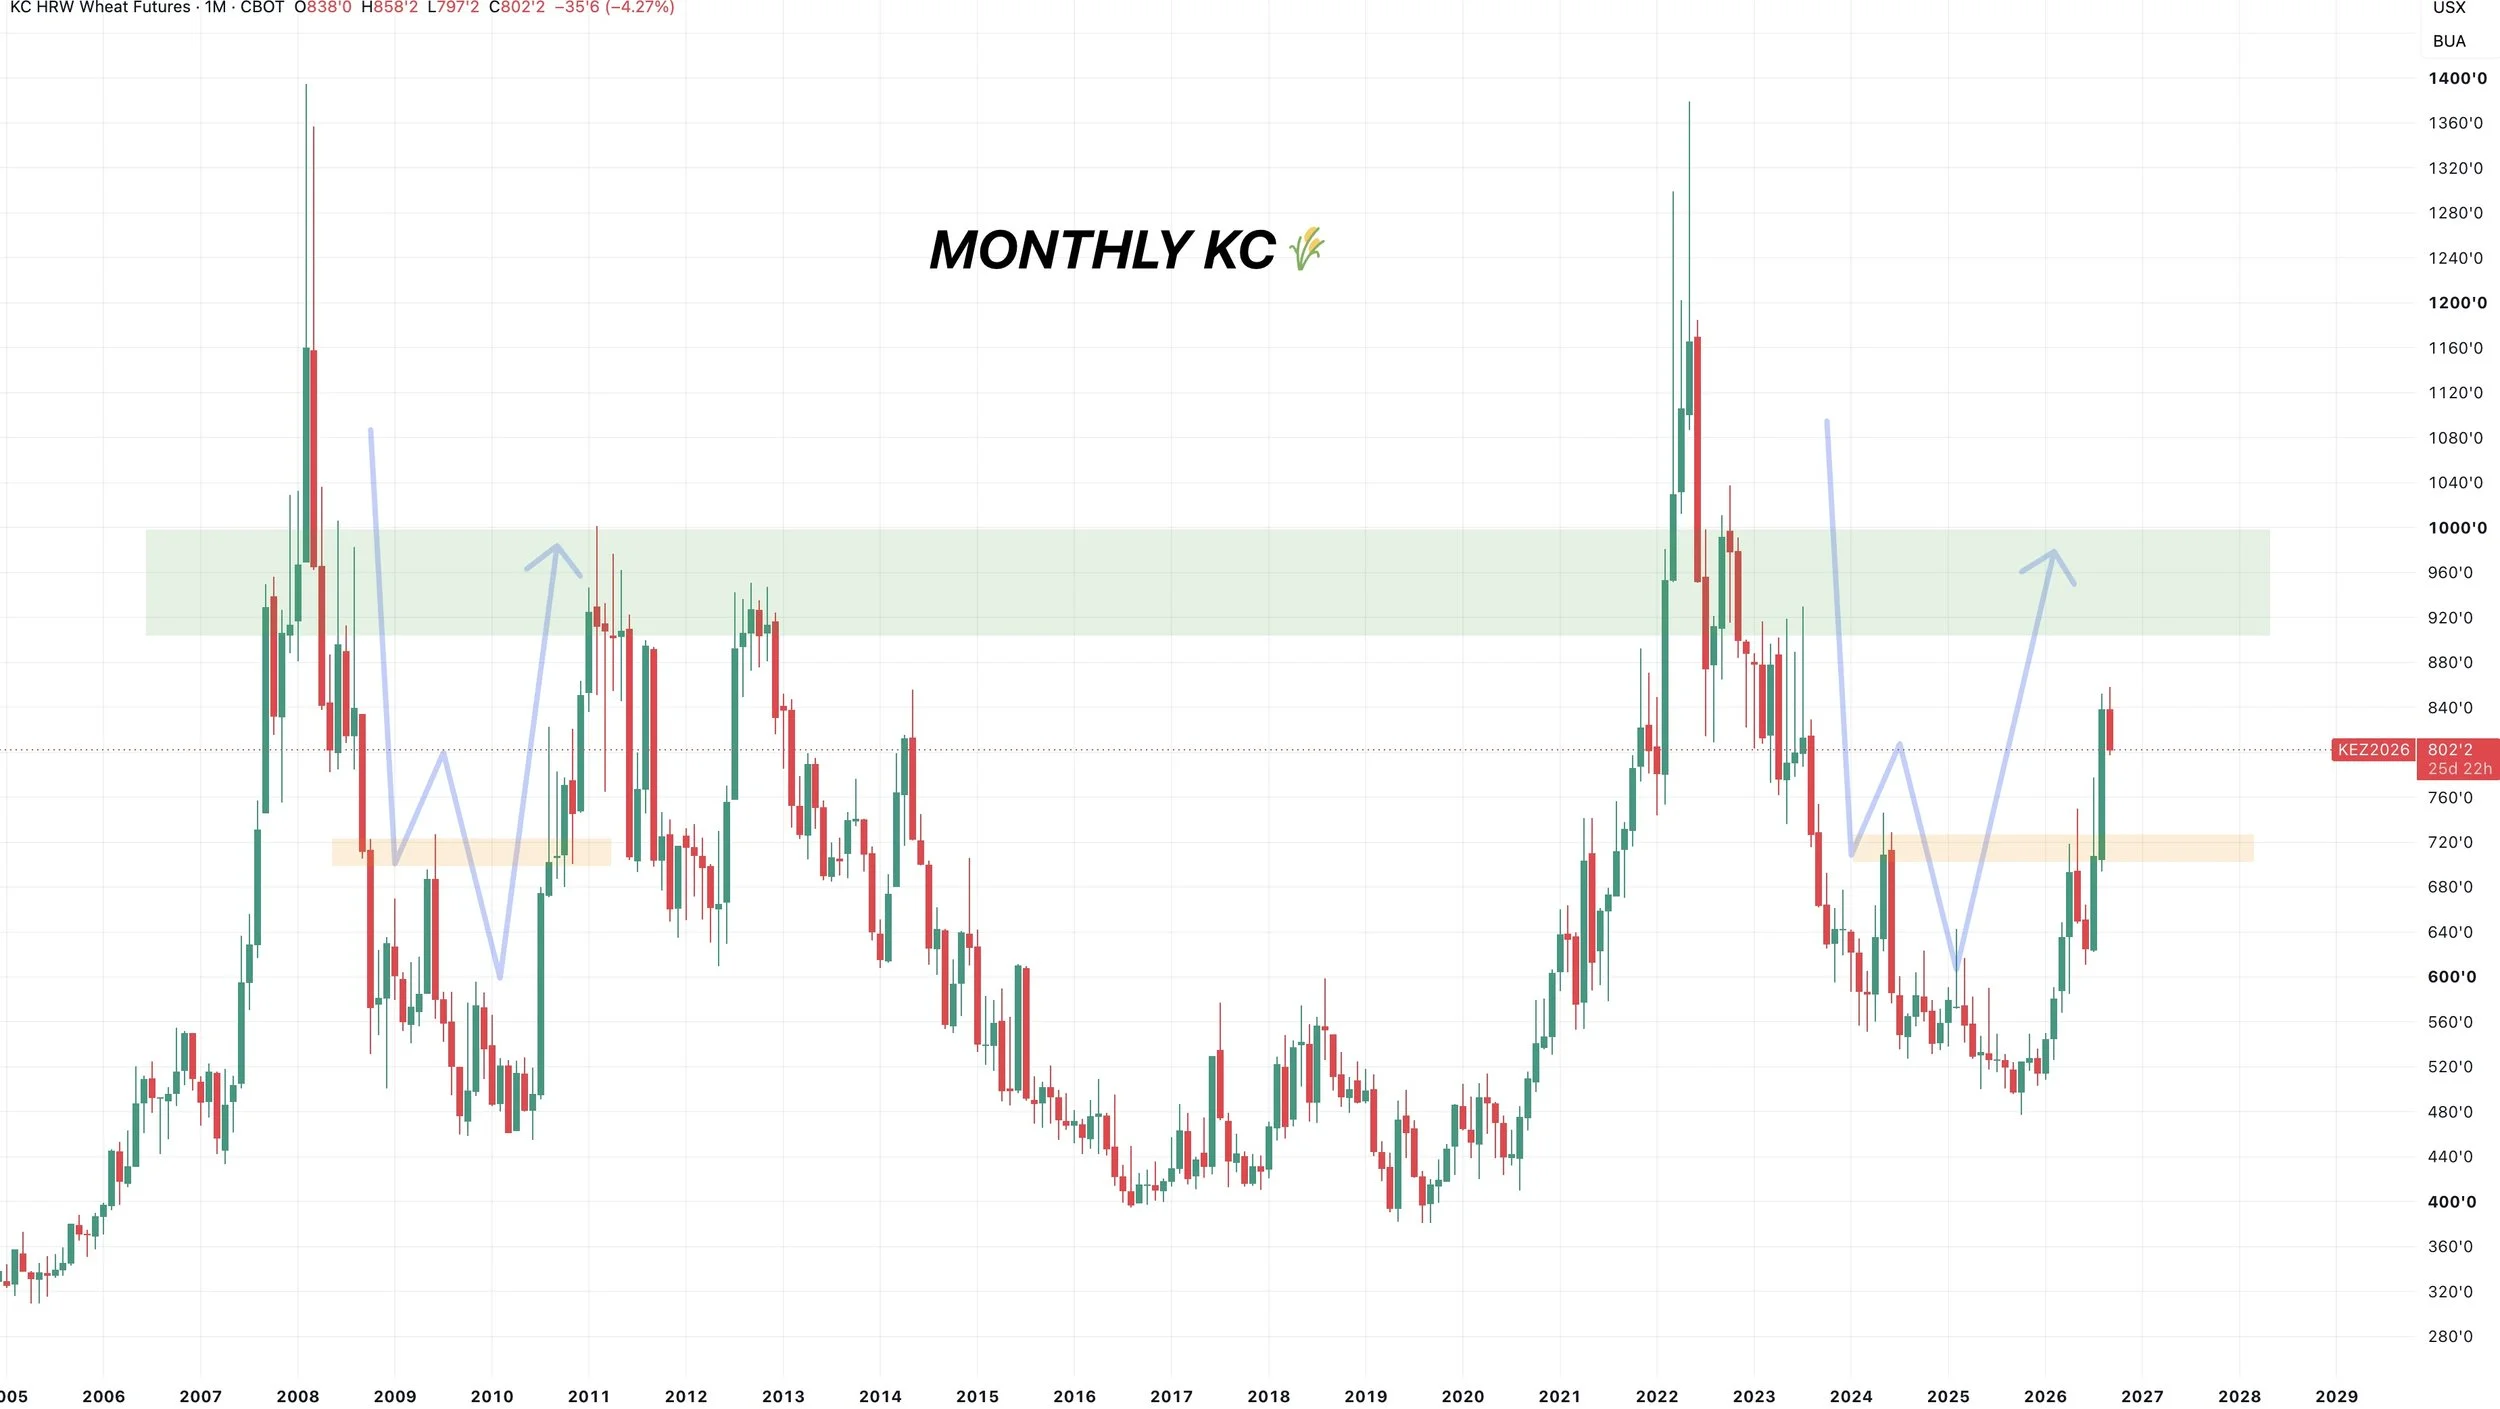
Long term the wheat market still looks great.
Every major rally over the last decade has resulted in wheat going up to at least $9.00 which I found interesting. (Except 2014).
We have only closed above that green box for 4 months ever.
So $9.00 to $10.00 wheat (green box) is where you probably want to be taking a lot of risk off the table.
Weekly KC Chart:
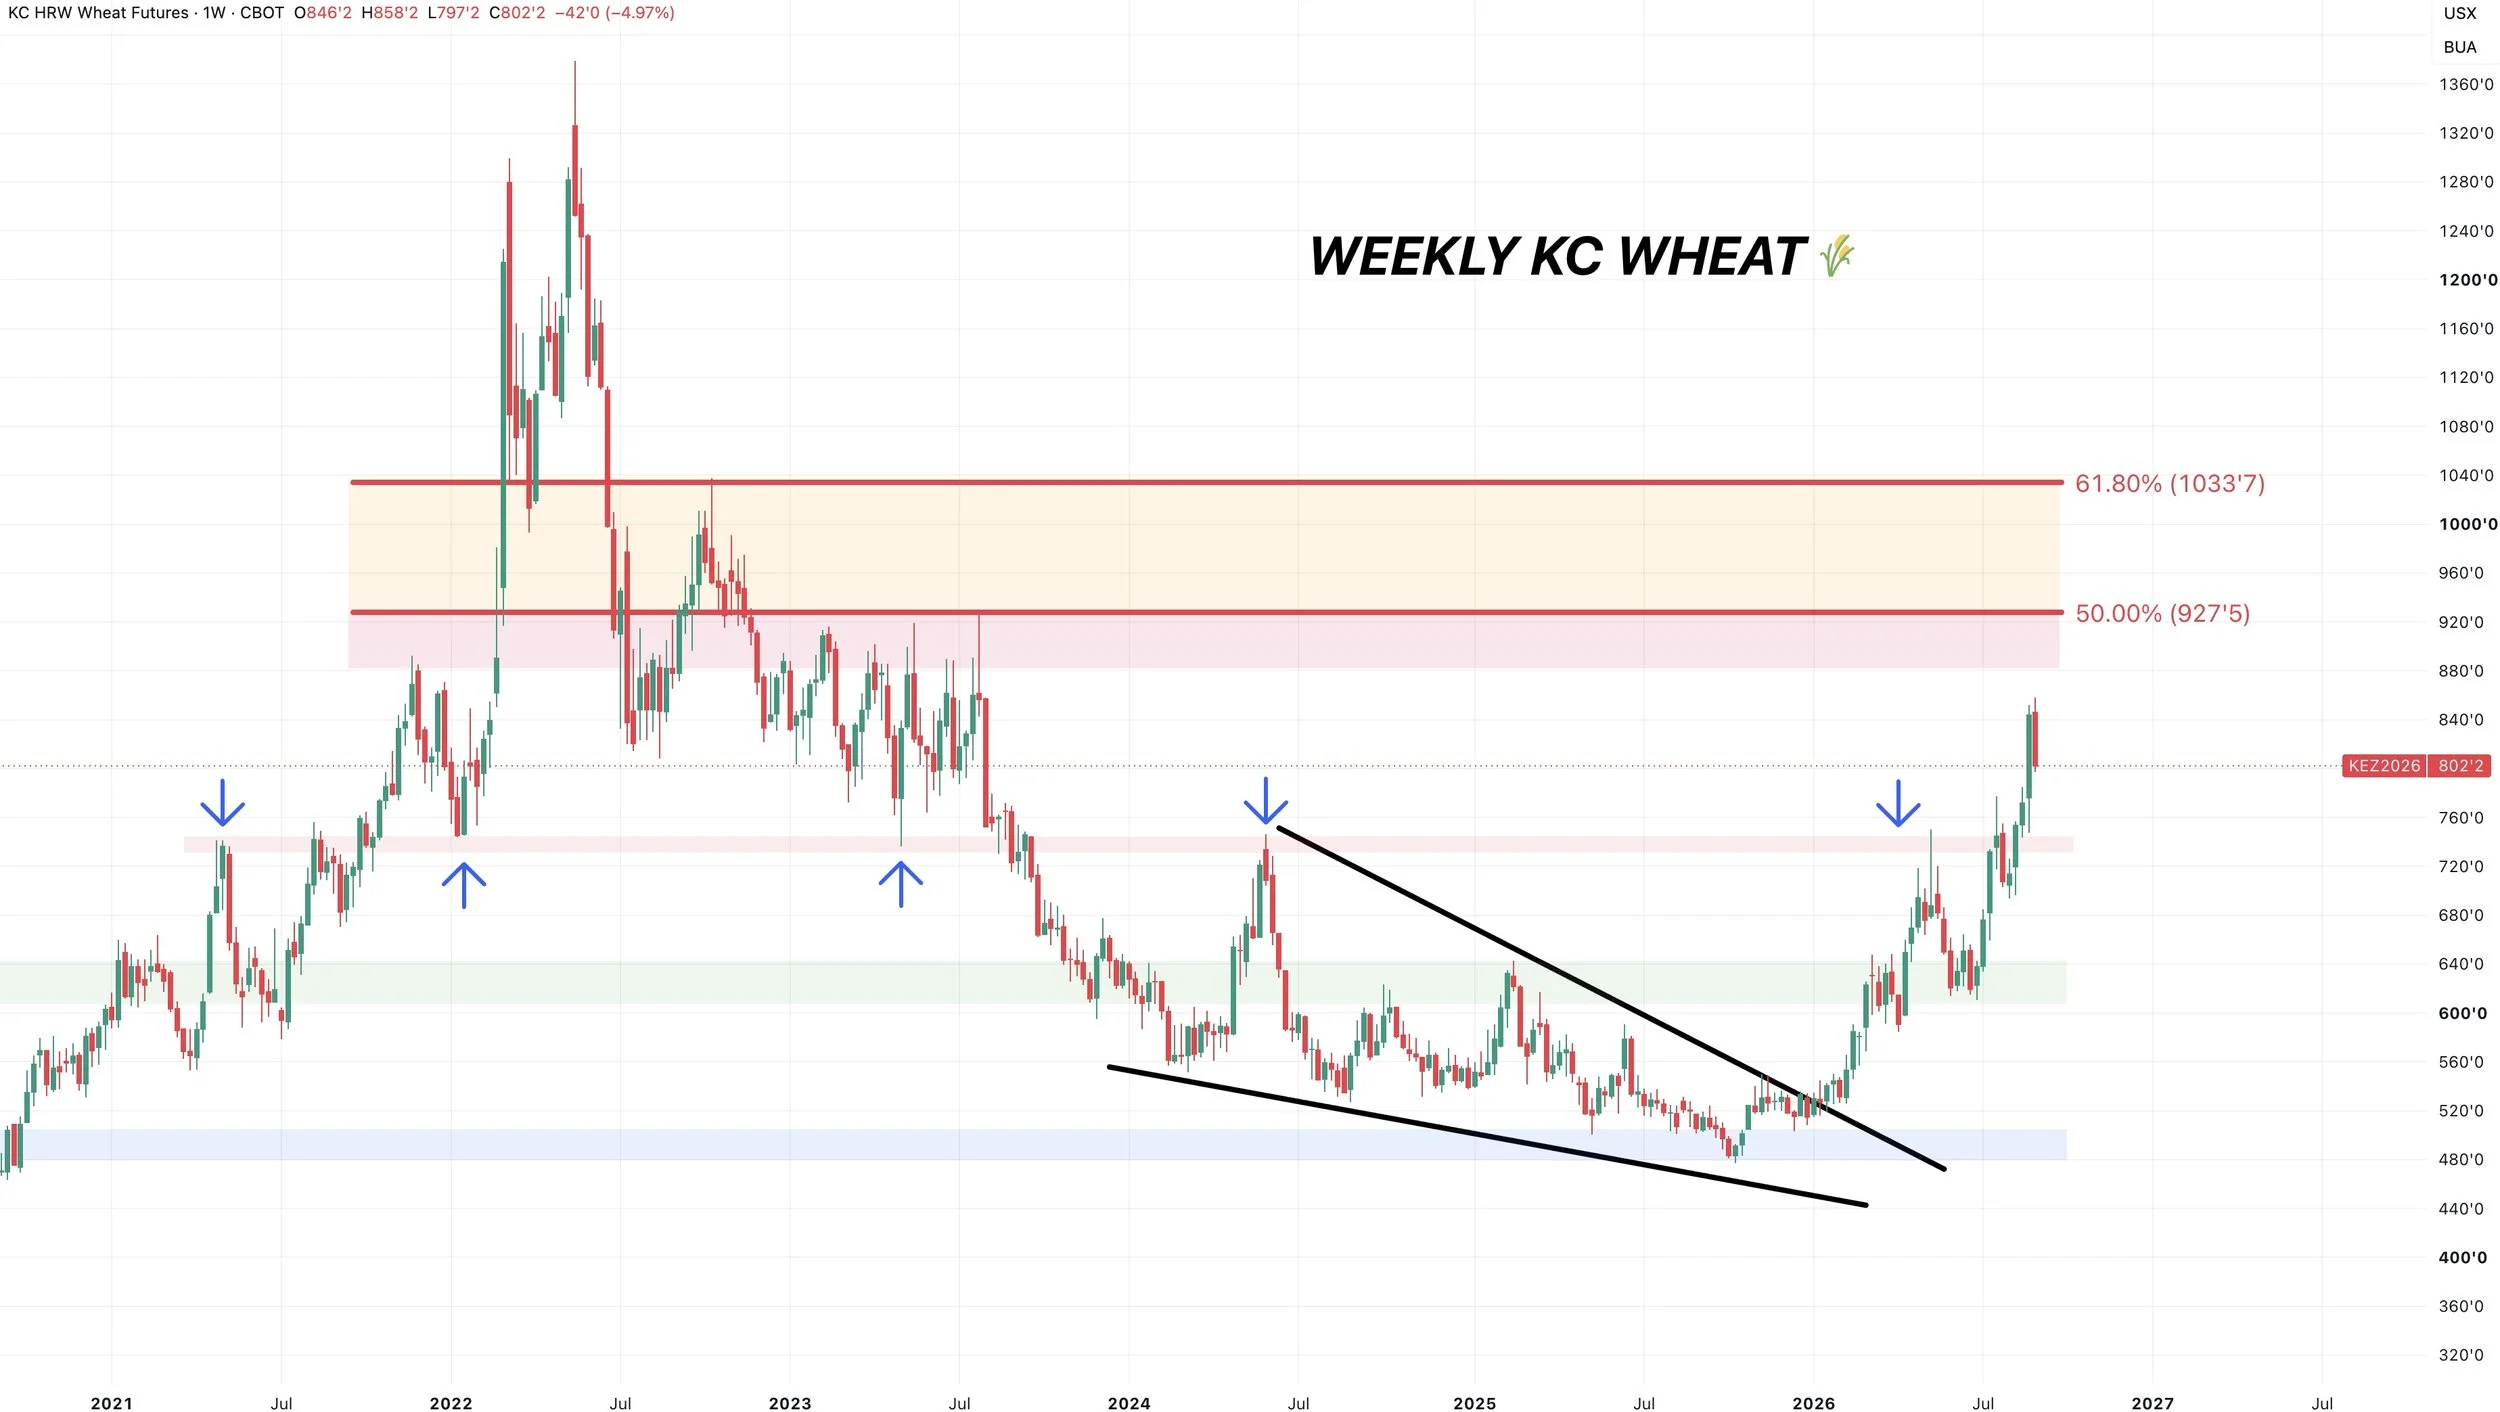
If you look at the weekly chart, that $9.00 area is also the upper end of the range from 2023.
If we clawed back 50% of those 2022 highs, we would be at $9.27
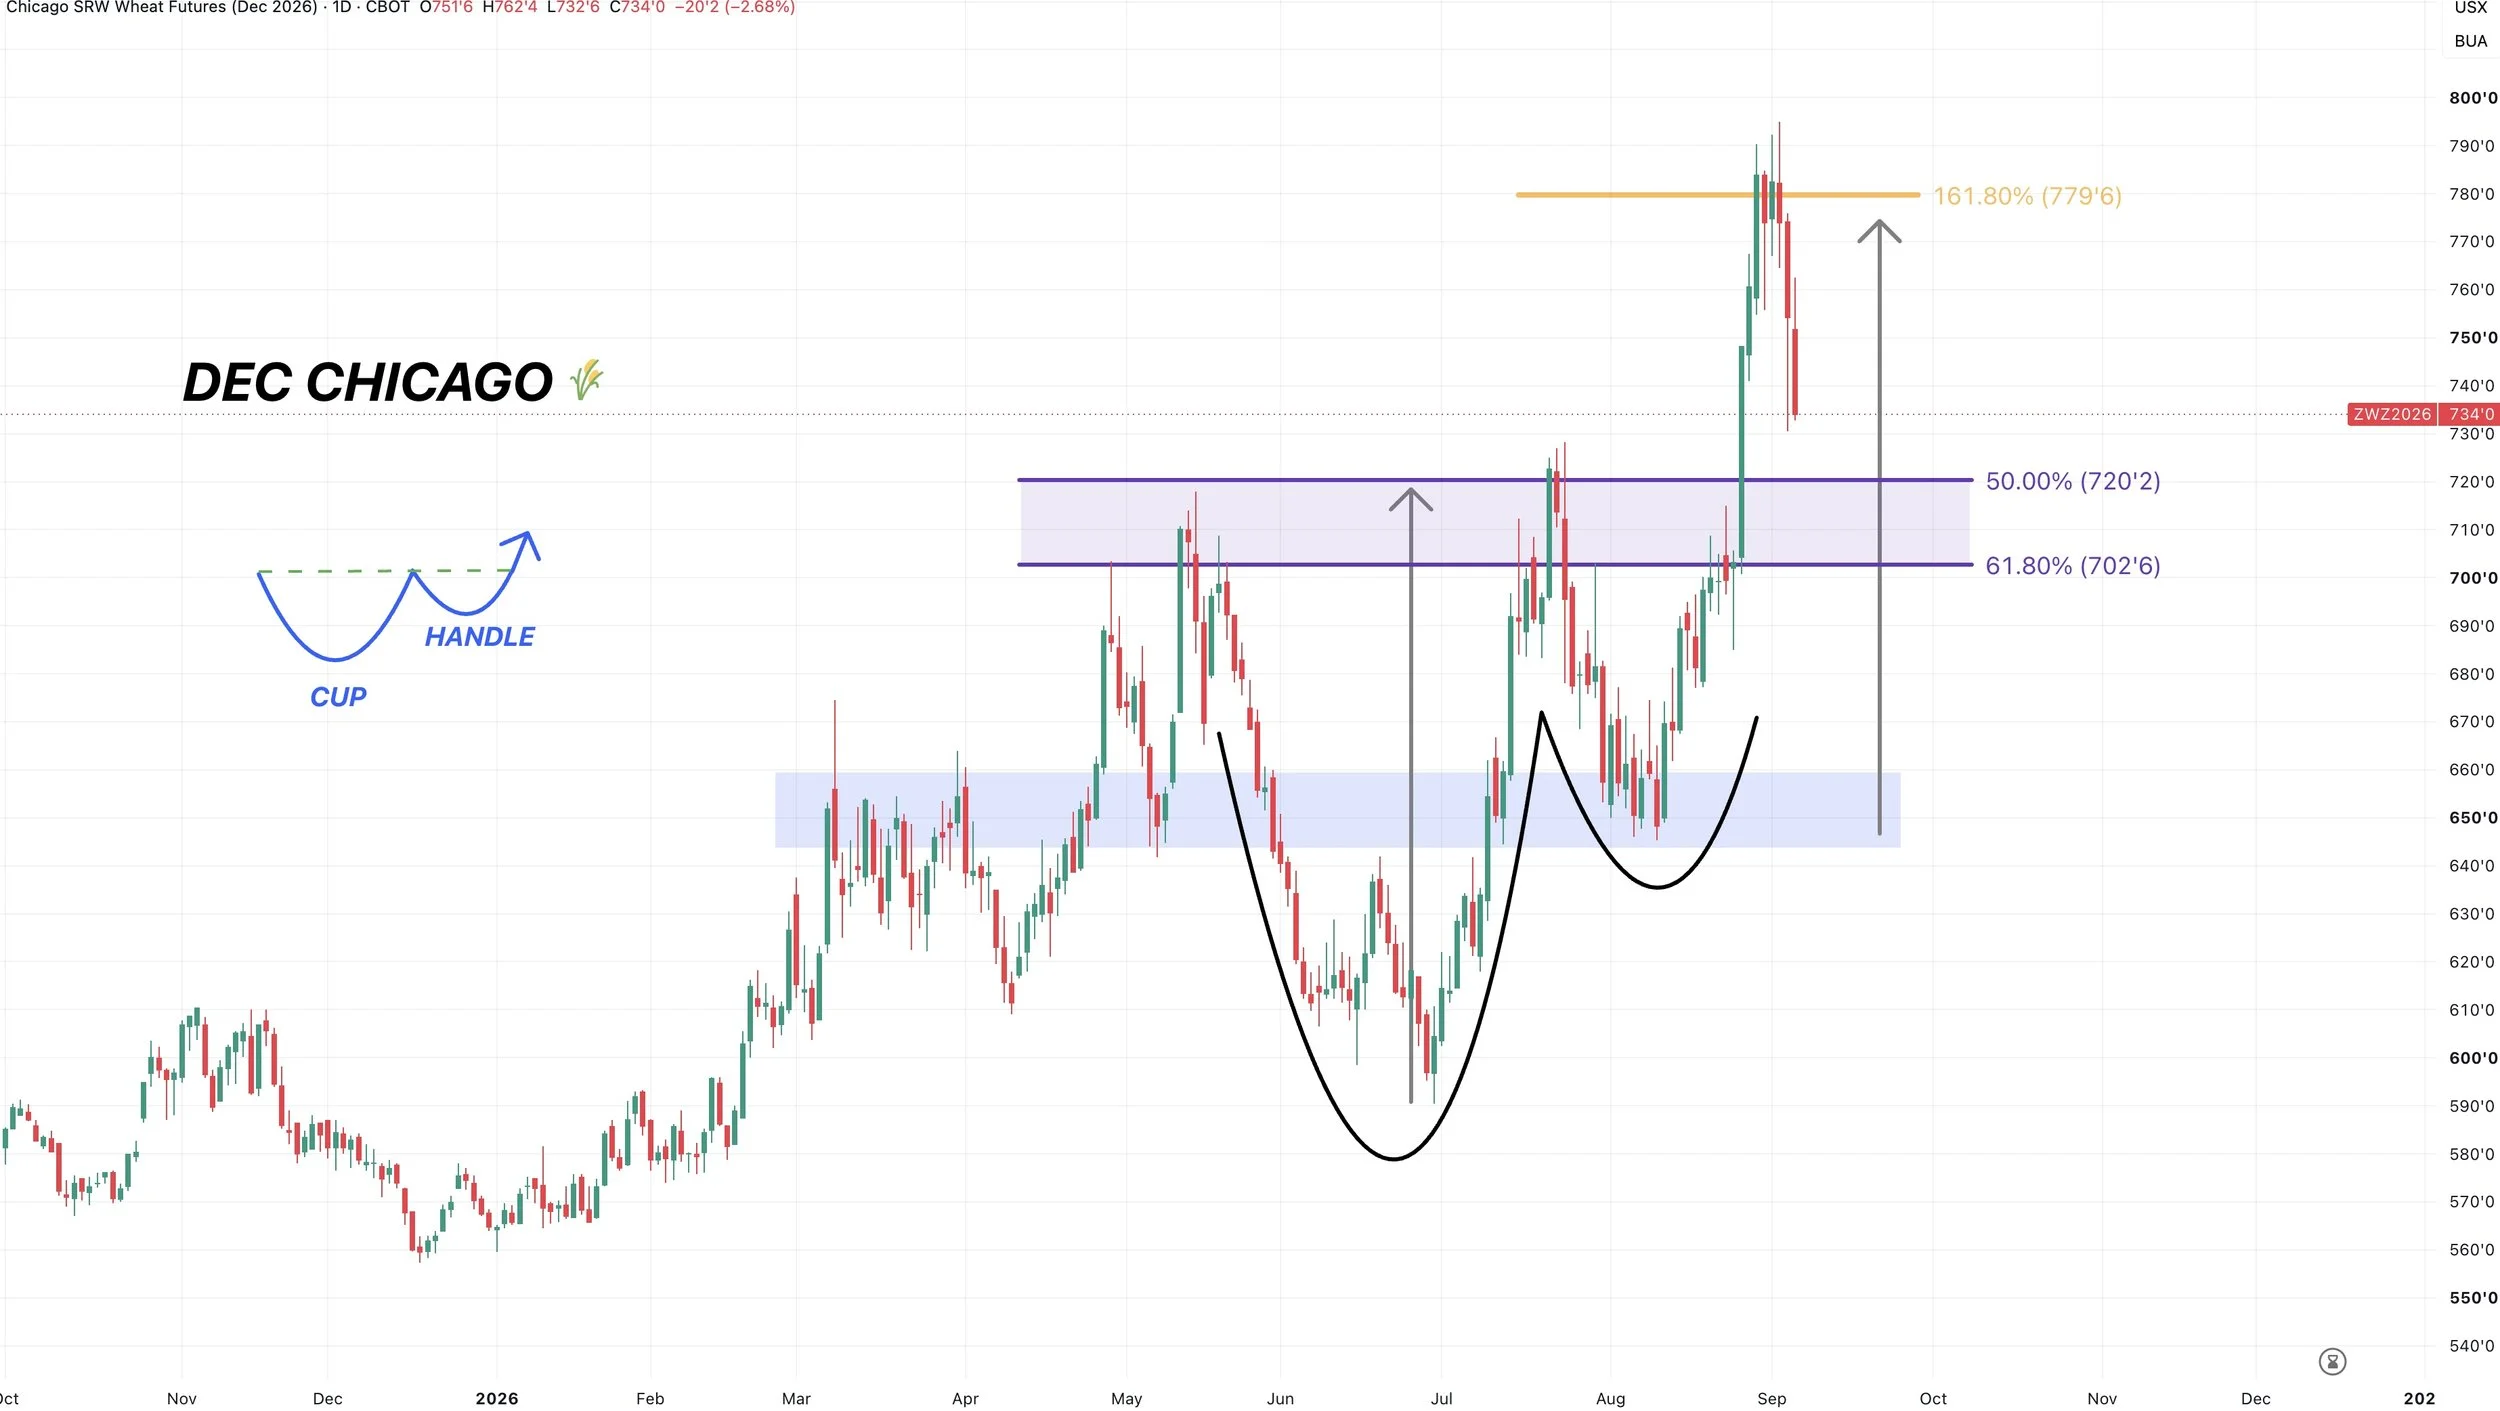
Dec Chicago Wheat:
Also rejected right off that golden fib target. Which was also the implied move from the cup and handle.
I am looking for us to find some life in this golden zone from $7.00 to $7.20.
This would align with us re-testing the prior highs.
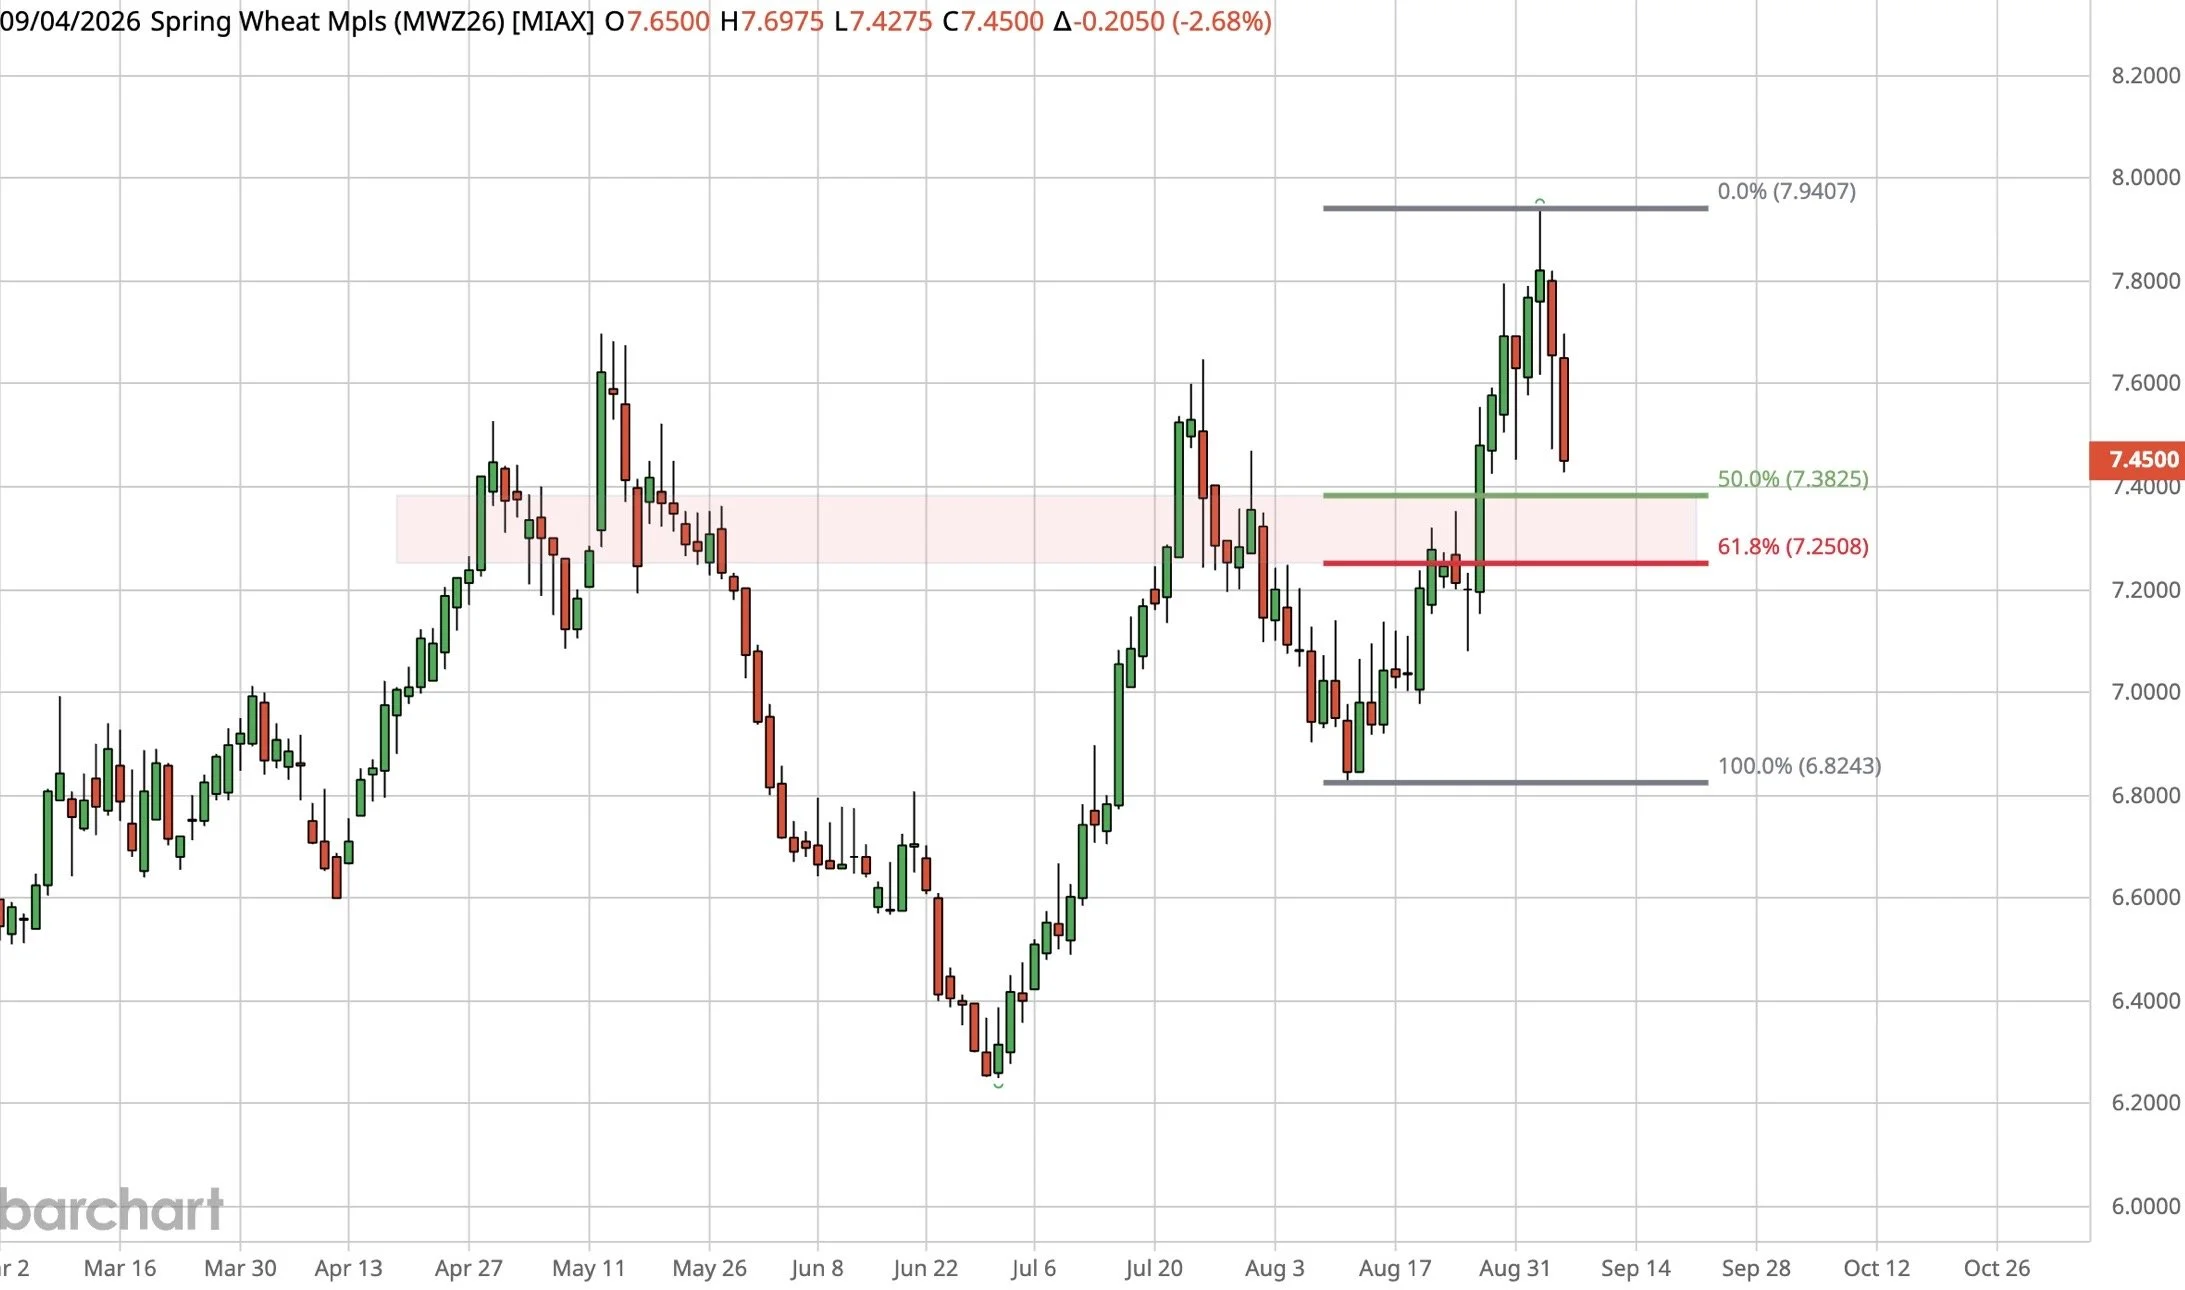
MPLS Wheat Chart:
MPLS has been lagging behind on the recent rally.
I'd like to see us hold the golden zone and the 61.8% retracement at $7.25
That would be where I would expect a bounce. Not only is that the most common level for a correction to end, but it's been key support and resistance in the past as well.
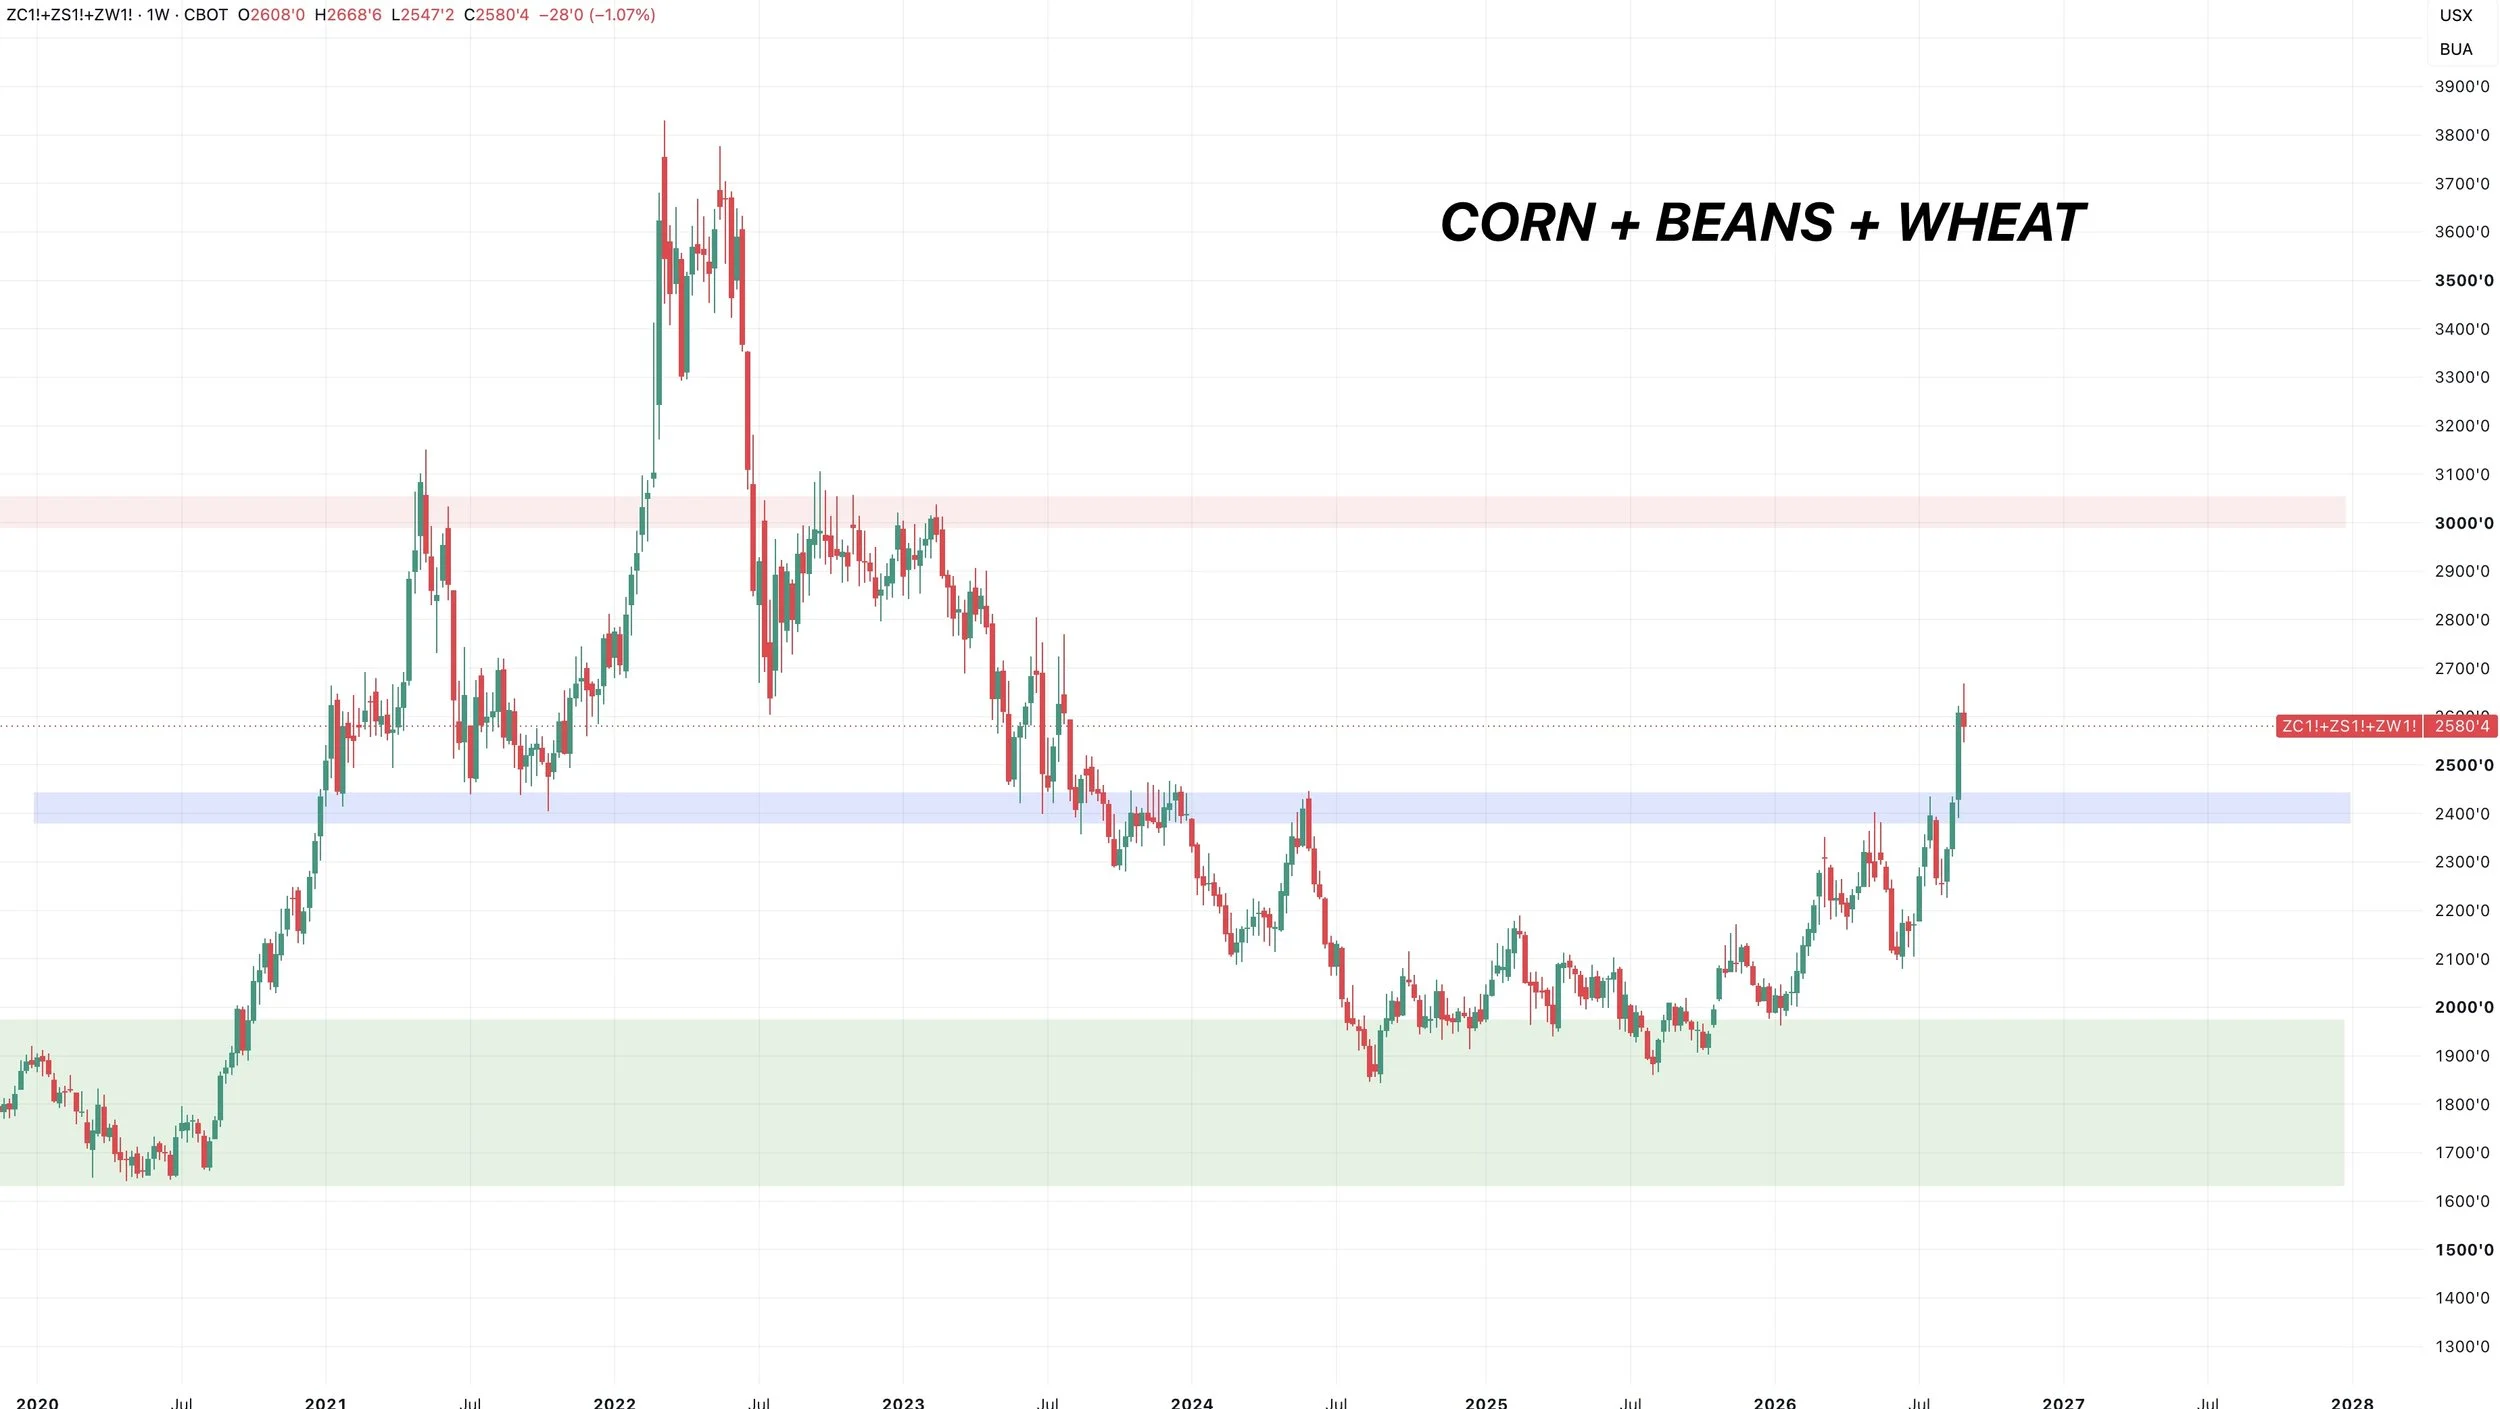
Grains Complex
Corn + Beans + Wheat Chart:
I showed this chart the other day.
I wanted to look at the grain complex as a whole because this chart seems pretty important.
This combines corn + soybeans + wheat.
This thing broke some major resistance.
Long term this should be very friendly for grains, as there looks like there is plenty of room to run.
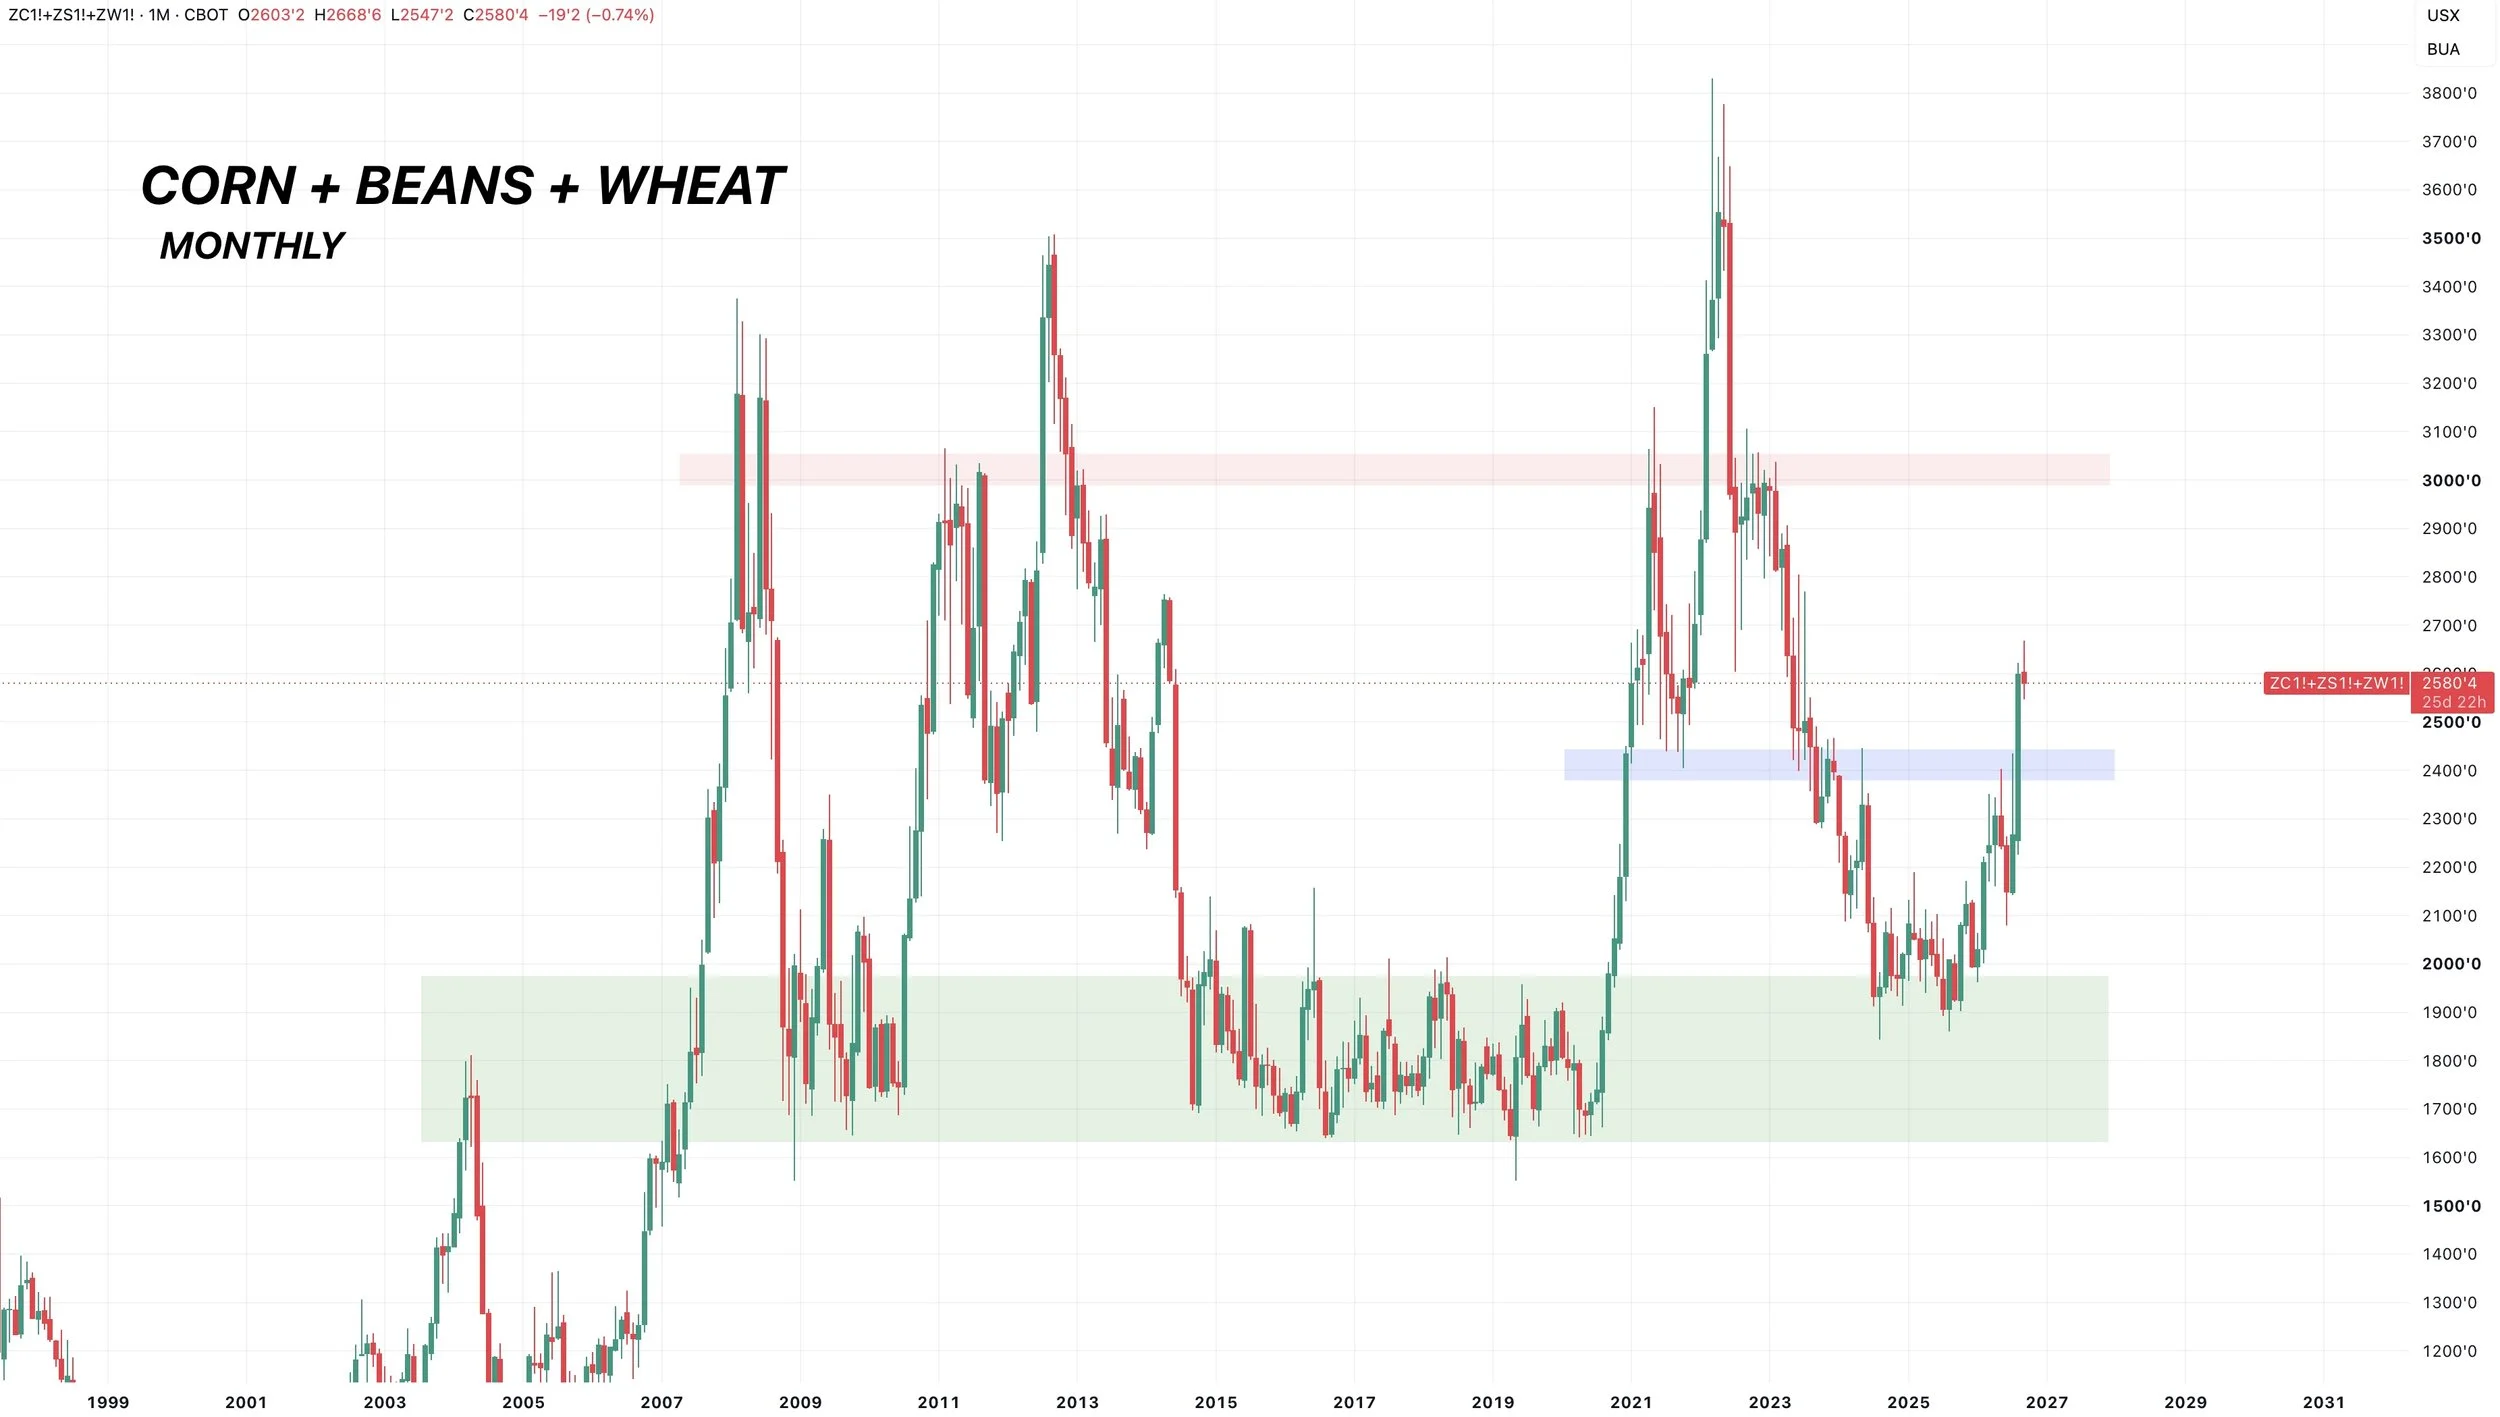
Here is the monthly chart for a more zoomed out perspective.
Again, I'd argue there is still plenty room to run long term.
That red box where we have historically found stiff resistance.
Cattle
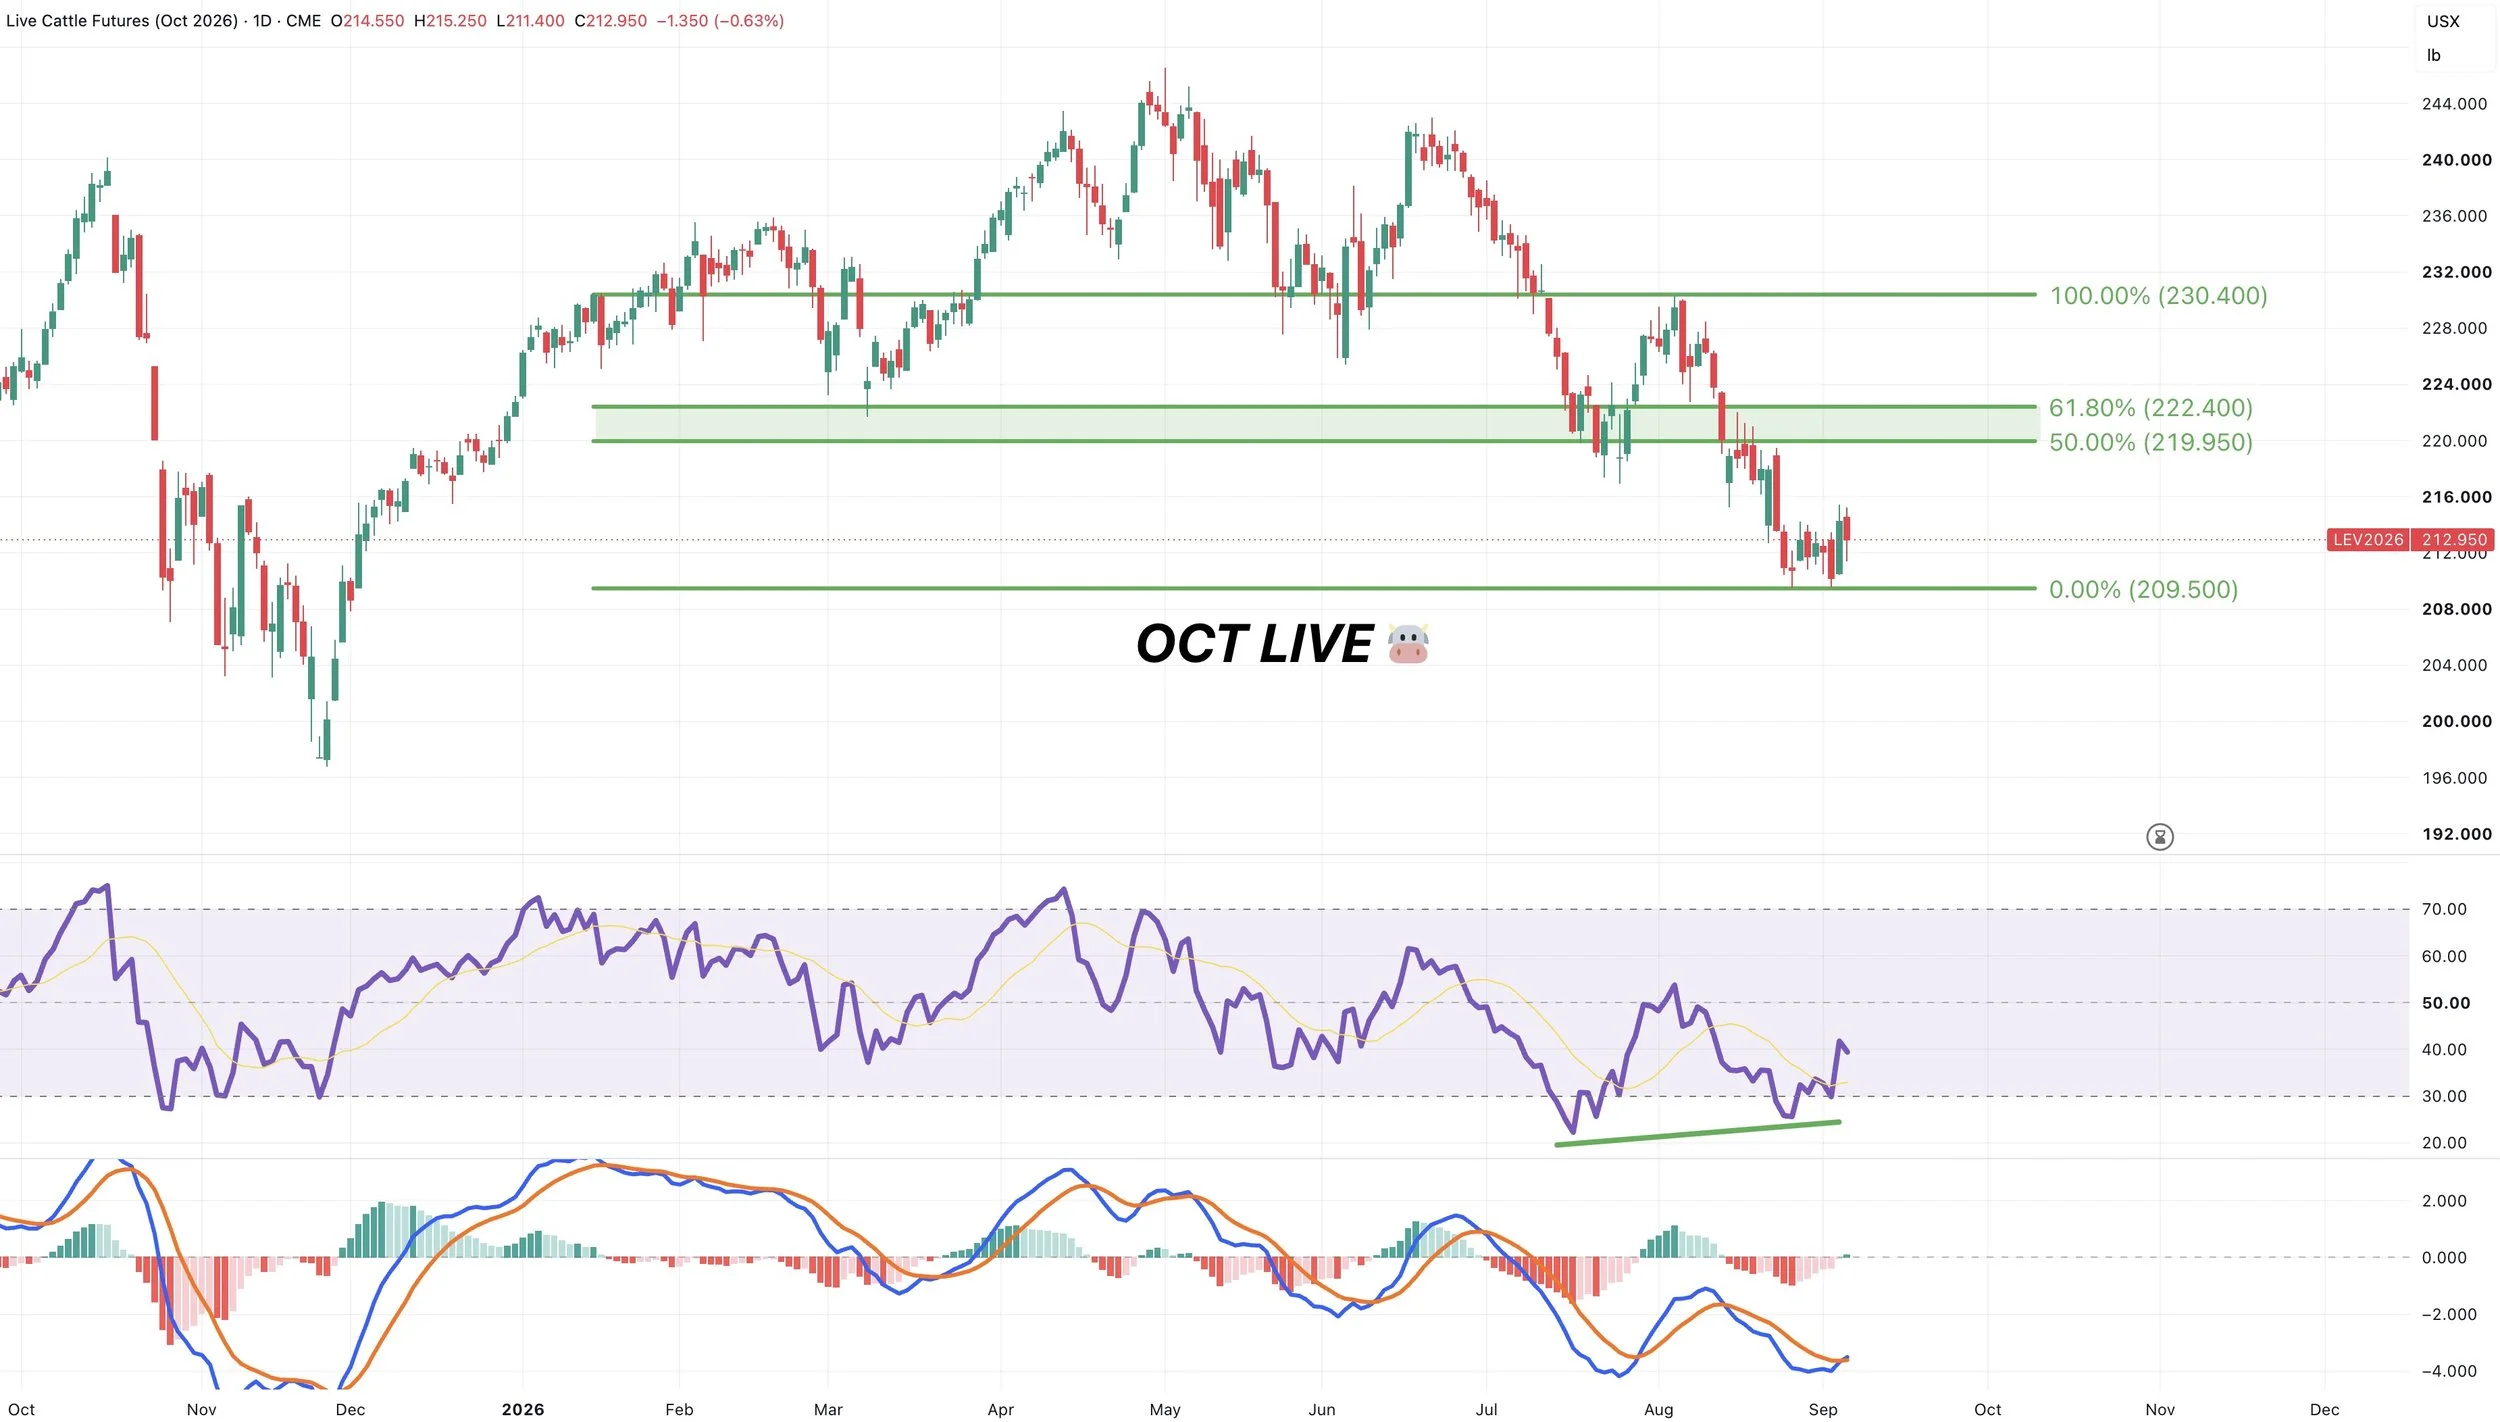
Oct Live Chart:
If we can start to put together a bounce, the first area of resistance is going to be around 220 to 222.
That claws back 50-61.8% of those recent highs from August.
That same area has been key support before.
So that would be a possible area to look for a bounce to and an area to defend.
We are still showing bullish divergence on the RSI. Prices made new lows, the RSI did not.
At the same time, the MACD did cross bullish for the first time since that late July bounce. So momentum looks like it might be trying to shift higher here.
But overall, I think any rally needs to be treated as a relief rally. As I think the overall trend in cattle is lower.
Oct Feeders Chart:
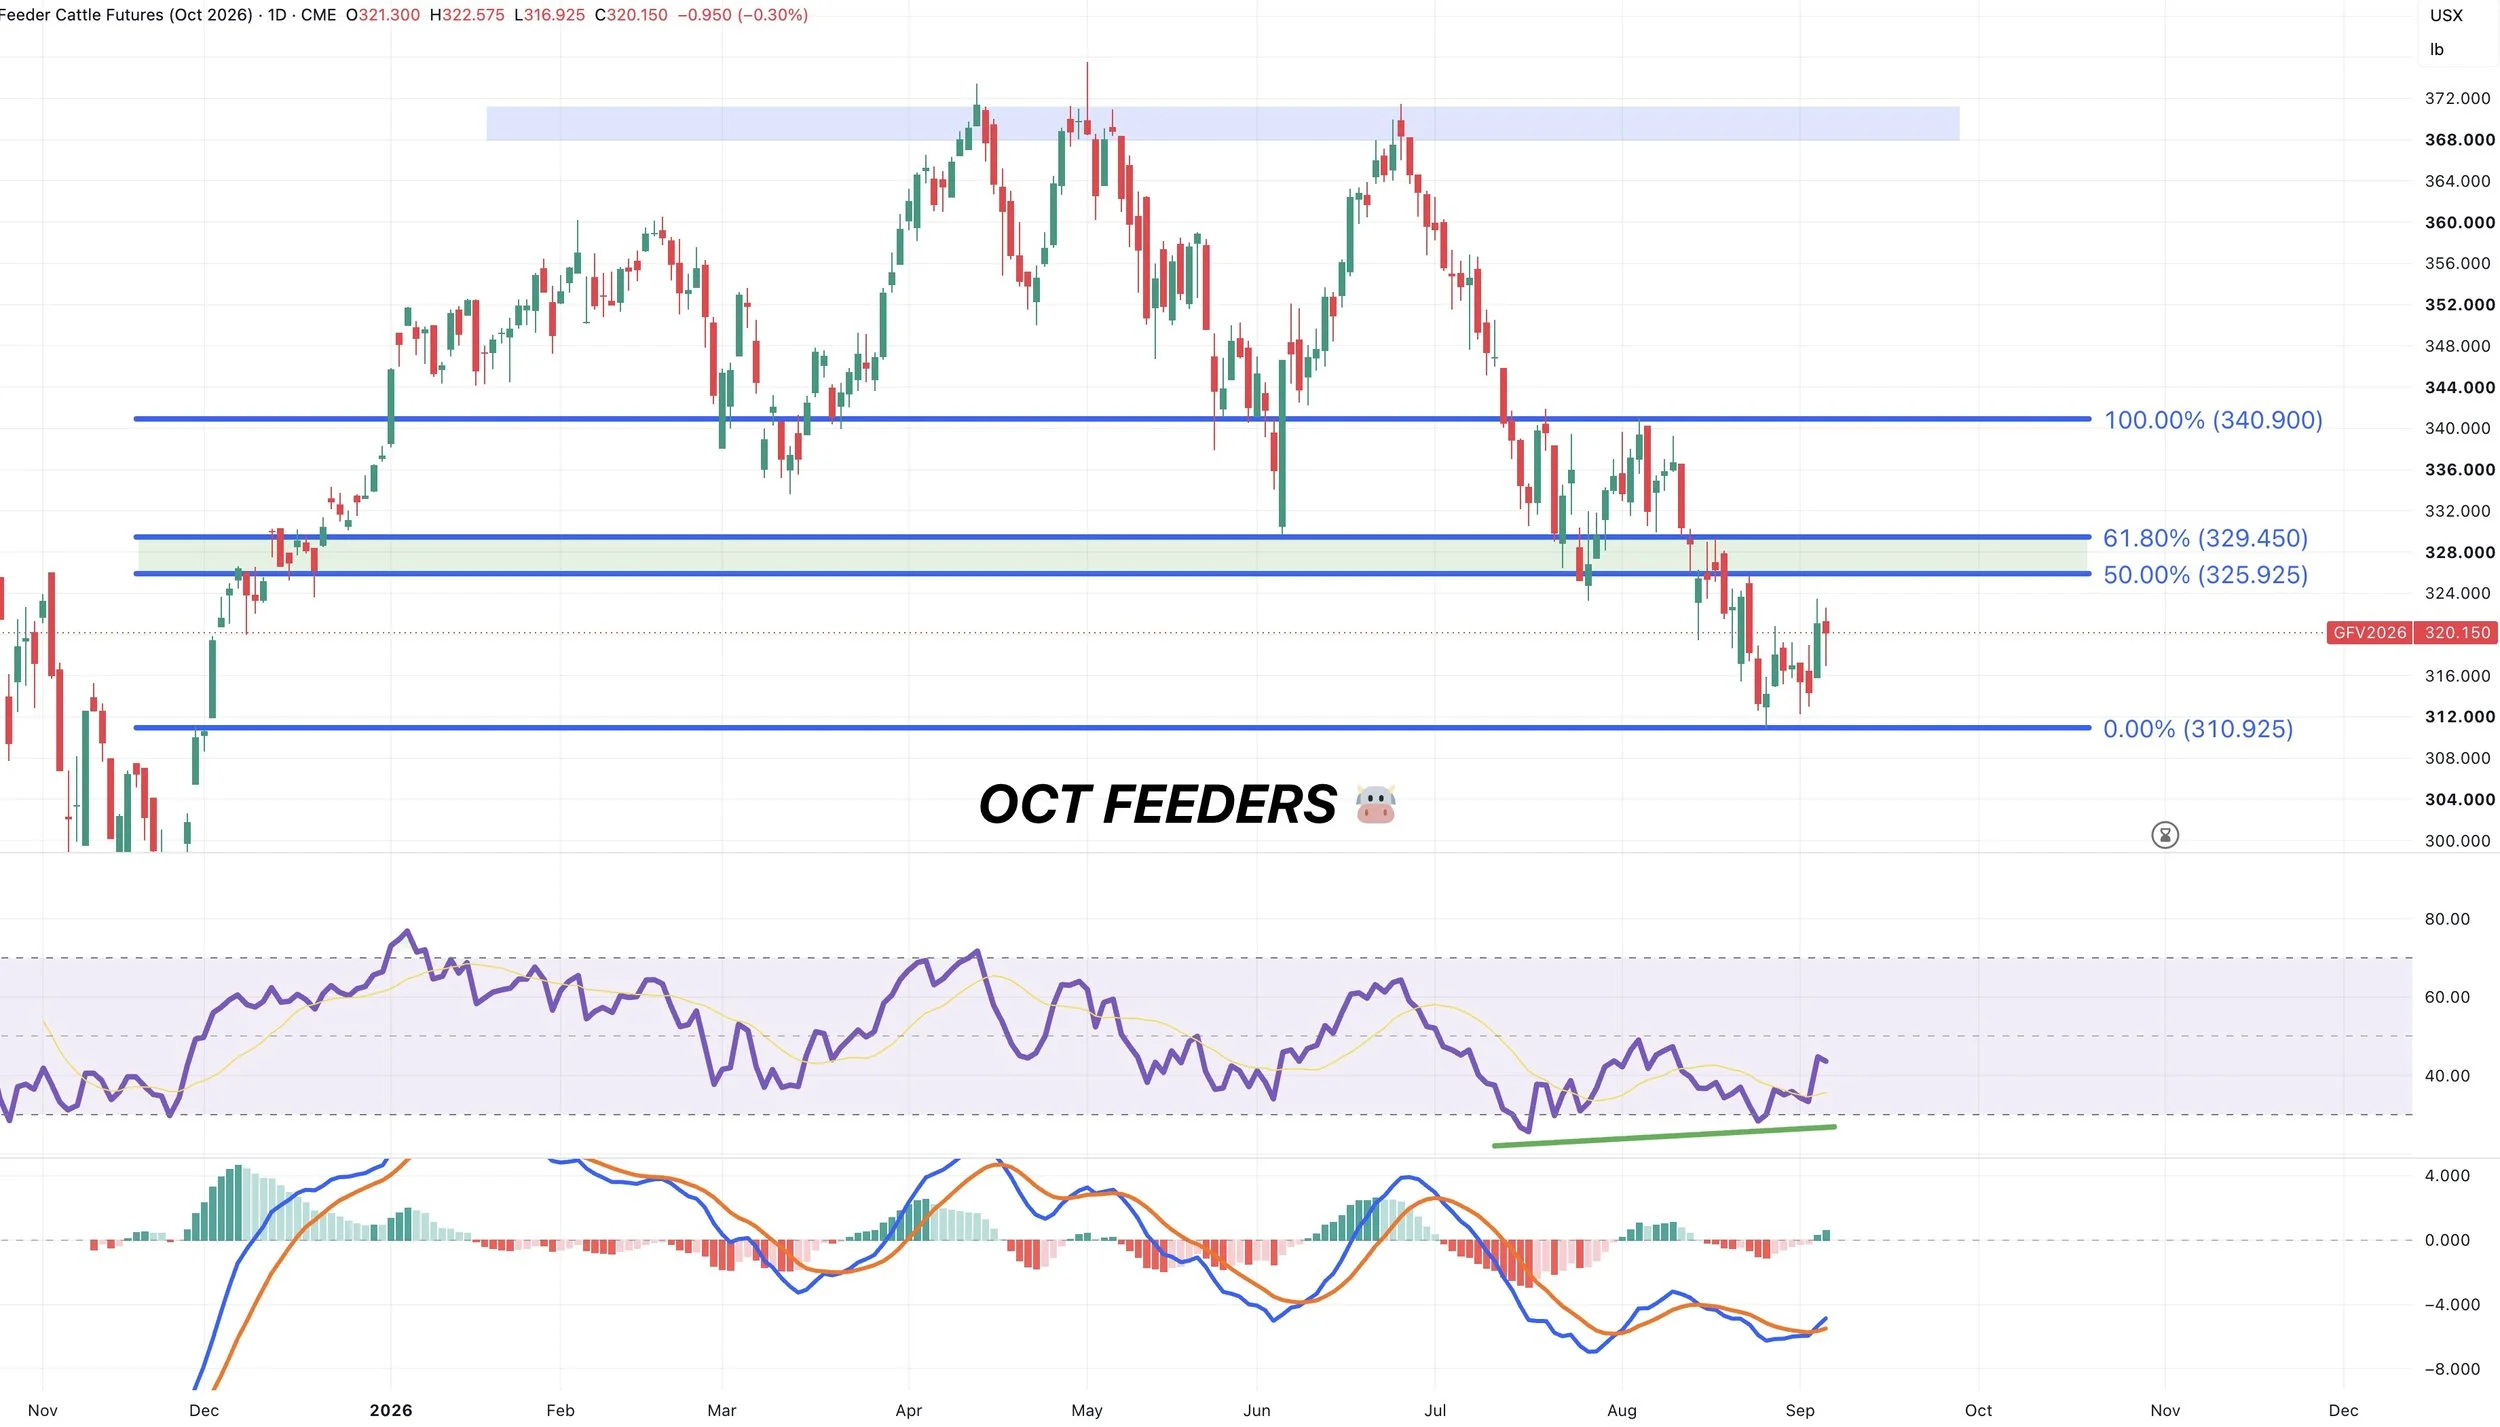
Very similar set up here in feeders.
The first resistance is going to be the golden zone up to those August highs. Between 326 to 329.
That area has been prior support as well.
Like in live cattle, we do still have bullish divergence and the MACD crossed bullish.
So there are some signs that we could possibly get a bounce out of here. But if we do, I think it should still be treated as nothing more than a relief bounce until proven wrong.
Want to Talk?
Our phones are open 24/7 for you guys if you ever need anything or want to discuss your operation.
Jeremey & Office: (806)484-1214
Sebastian: (605)280-1186
Email: sfrost@dailymarketminute.com
Hedge Account
Interested in a hedge account? Use the link below to set up an account or give us a call.