
SEASONAL SEP BOTTOM?
MARKET UPDATE
You can scroll to read the usual update as well. As the written version is the exact same as the video.
Timestamps for video:
Overview: 0:00min
Sep Bottom?: 1:20min
Corn: 3:10min
Beans: 8:05min
Wheat: 10:50min
Cattle: 12:30min
Want to talk about your situation?
(605)295-3100
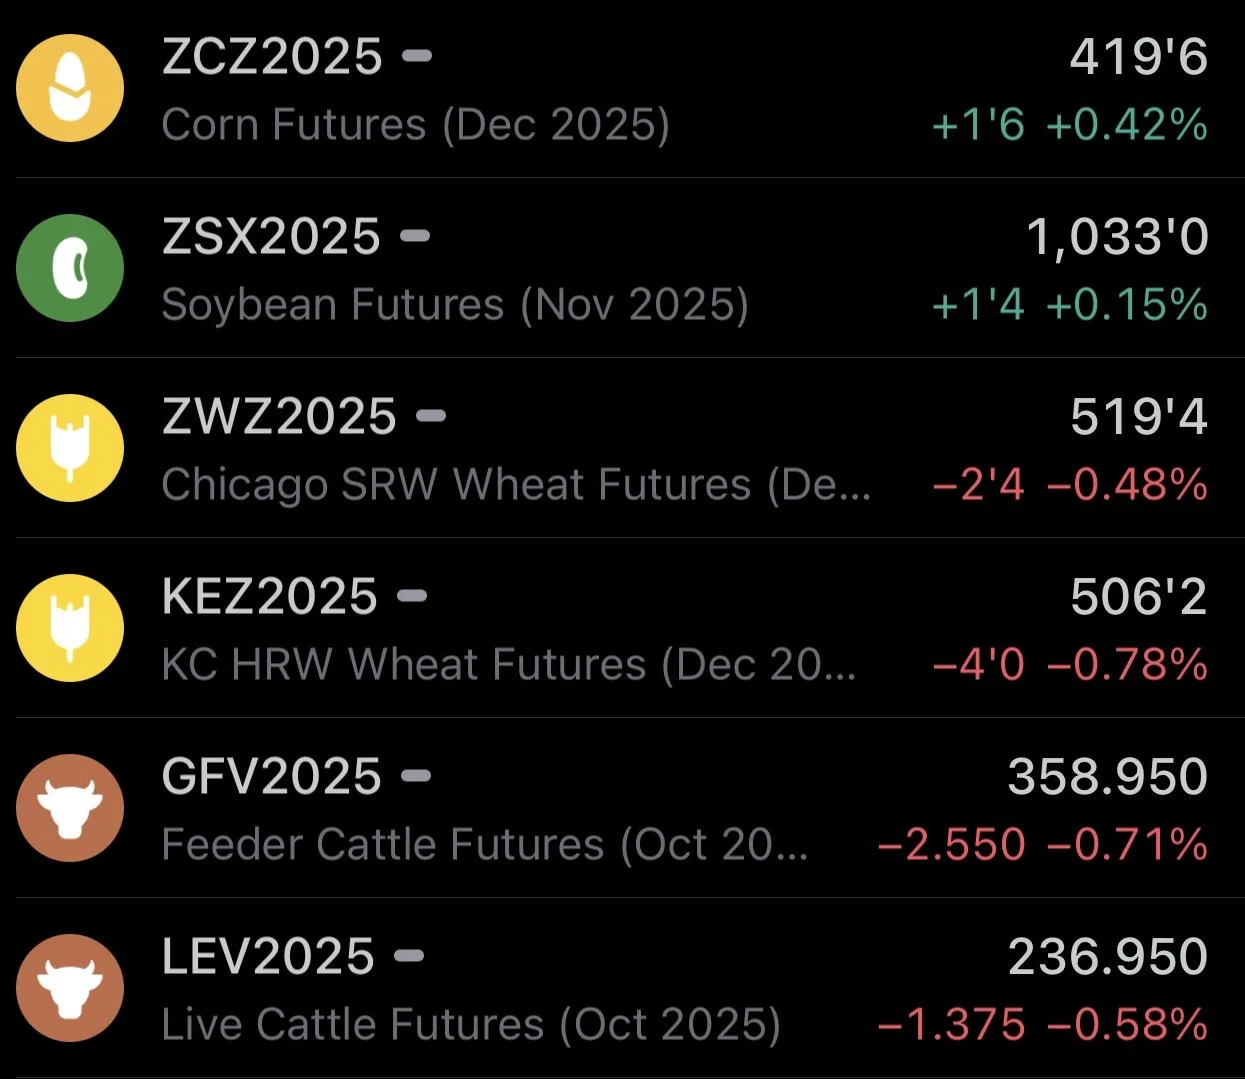
Futures Prices Close
Overview
Decent action in the grains today.
We started off the session well in the red but bounced. After corn being down -4 and beans being down -10 cents they both closed in the green.
Meanwhile the cattle market closes lower for the 3rd day in the row. The first time we've seen that happen since June.
We are seeing two completely different stories play out between corn & soybeans.
Corn is facing an oversupply issue due to the massive acerage. Yet, demand has been phenomenal. Export sales are double what they were last year at this time, and the best since the China driven buying in 2021/22.
Soybeans on the other hand are dealing with the opposite problem. We might not have enough supply, with acres being the 2nd lowest in the last decade. We just had a record dry August that has led to crop conditions slipping. However, demand is the thing everyone is worried about. China continues to avoid the US and opt for Brazil instead. With zero US beans sold to China.
Trump stated that China's President is teaming up with Putin and Kim Jong Un to conspire against the US

Wheat continues to struggle to find a story, as the US and the rest of the world isn’t short on wheat. This is despite the US being very competitive on exports. As recently we've seen the strongest demand numbers for wheat in over a decade.
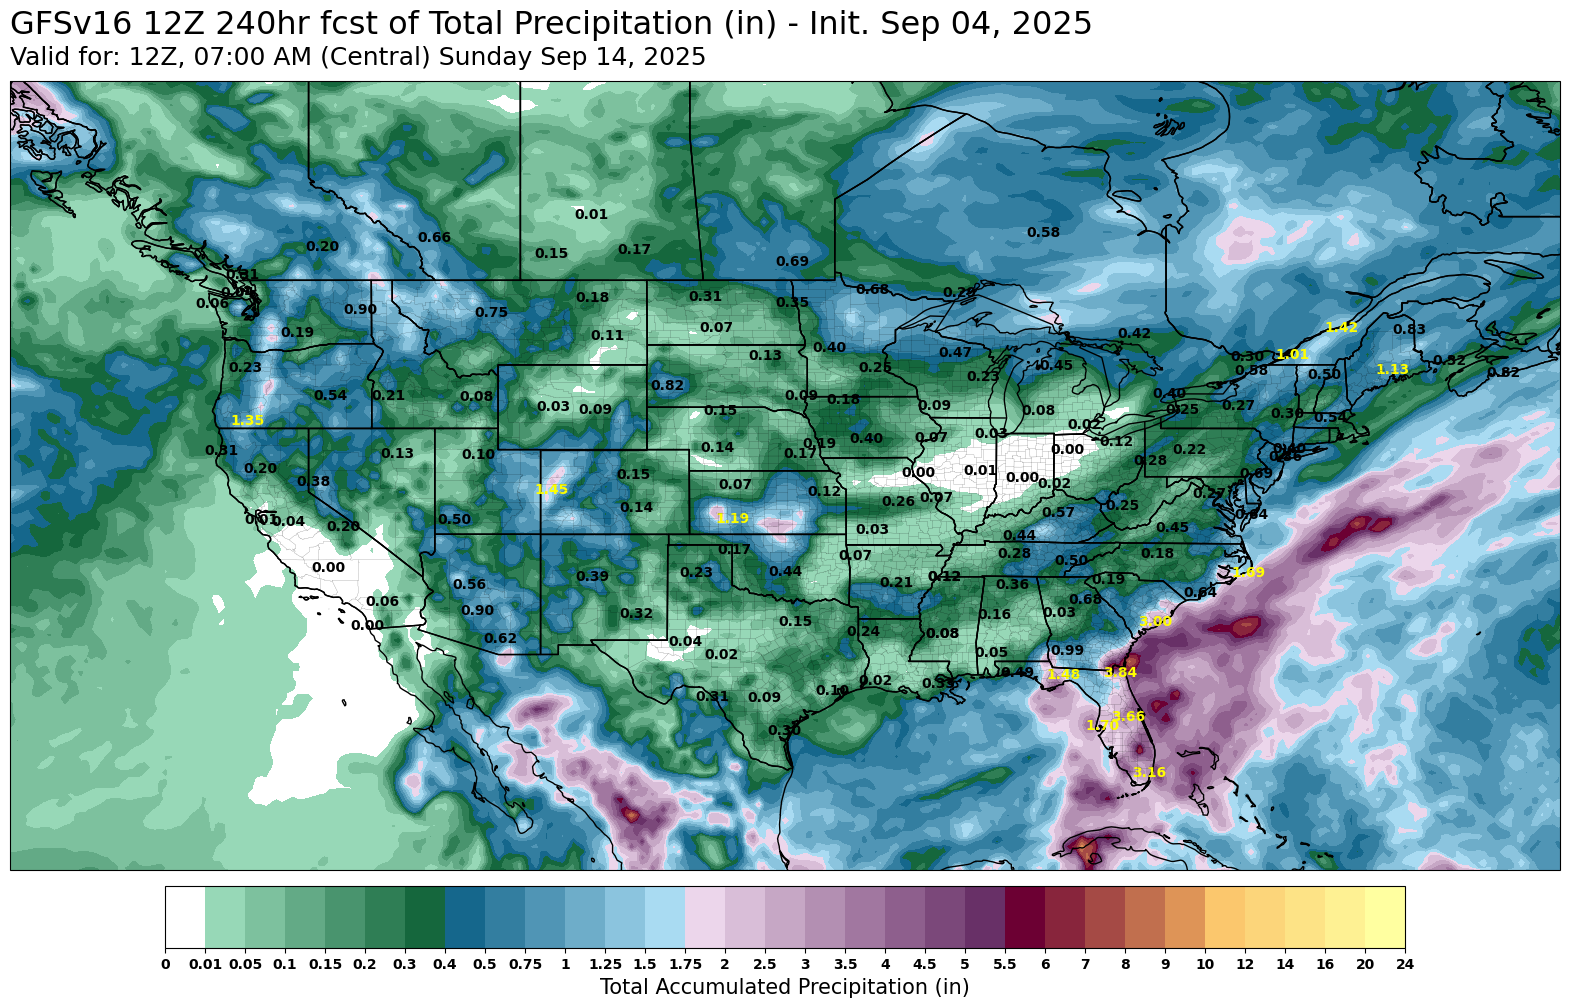
Dry Finish Continues
We already know we just had a record dry August.
But the next 10 days are suppose to stay bone dry for most of those same regions that have been struggling.
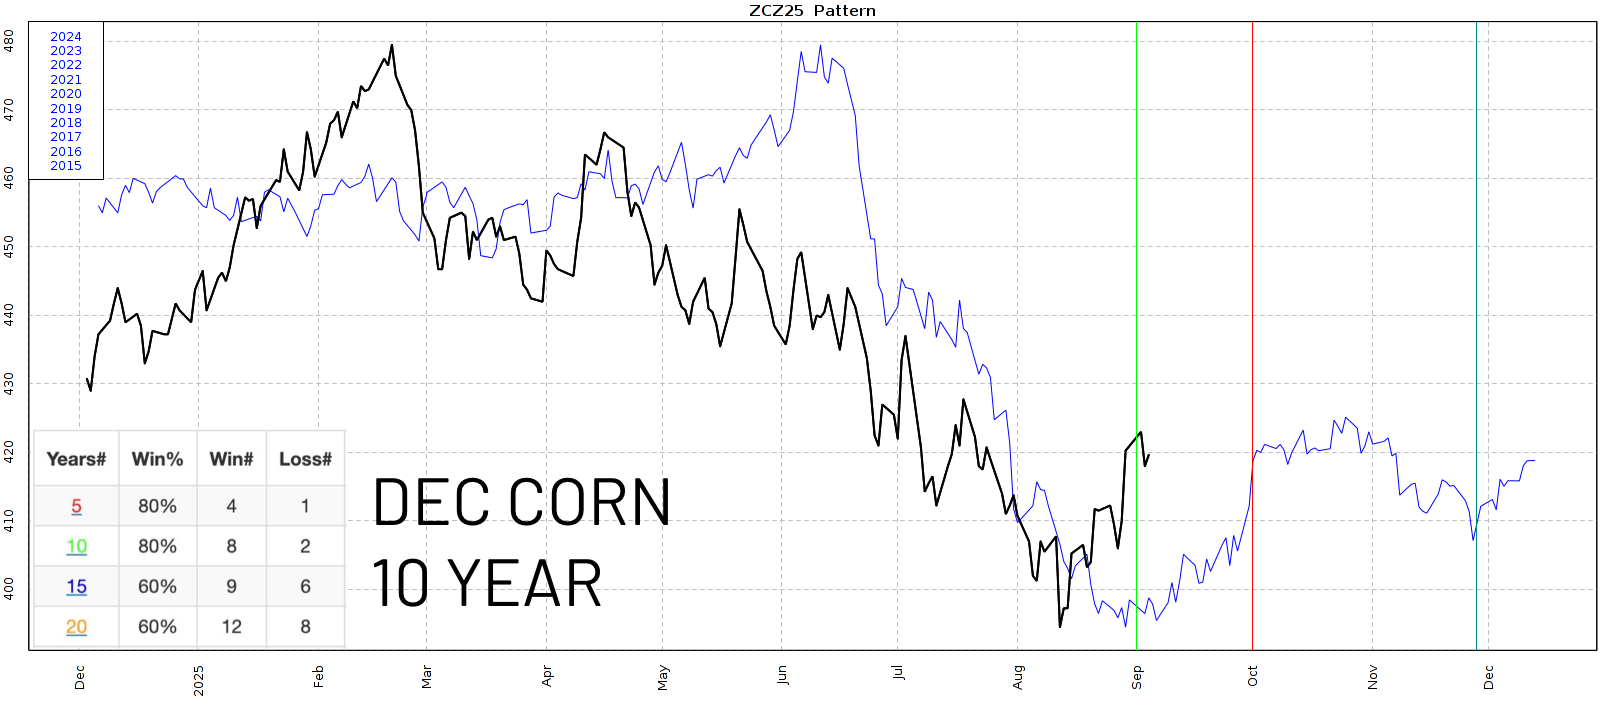
Sep Seasonal Bottom?
On Tuesday I went over how during the past decade, the month of September is typically a friendly month for the corn market.
Here is the data in case you missed it.
From Sep 1st to Oct 1st.
Corn has traded higher 4 of the last 5 years.
Higher 8 of the last 10 years.
The only years we did not trade higher was 2023 and 2018.

On the 10 year seasonal, we normally trend higher until pretty much October 1st before trending sideways.
Right in time for the start of fall insurance pricing.
If we compare this year to last year, we continued higher until October 3rd.
Topping out at $4.30
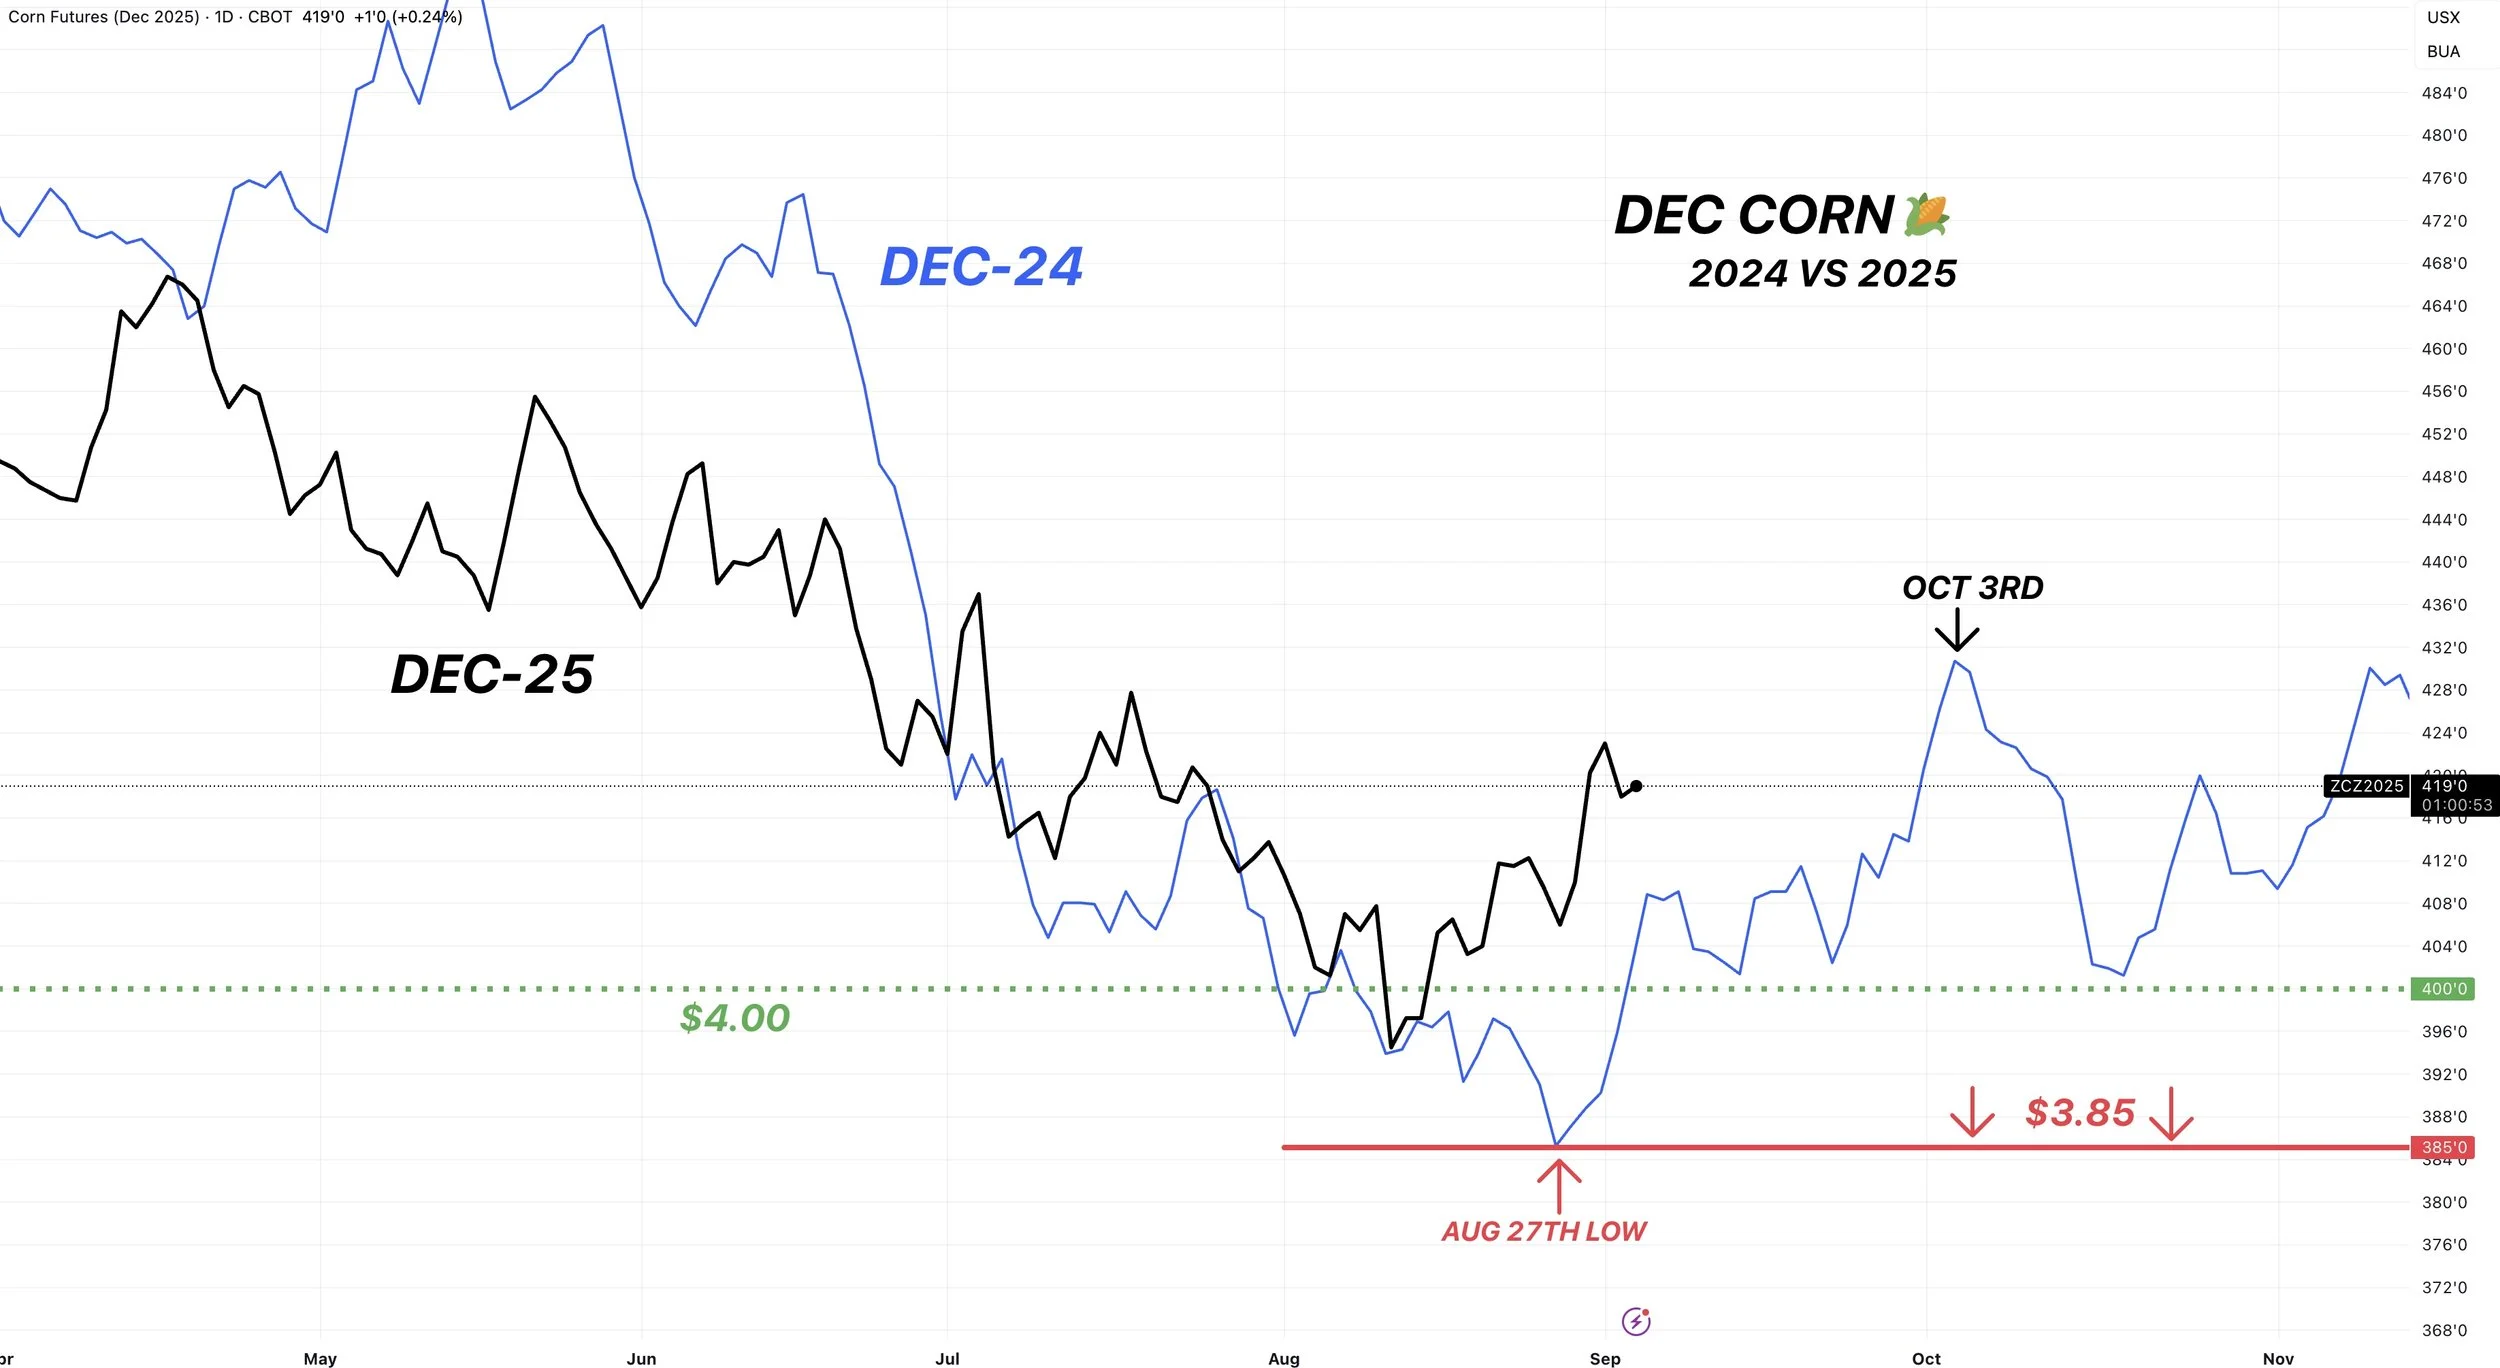
To make this comparison to last year even more intriguing..
Here is the funds positions for last year vs this year.
This year, they started covering at the exact same time that they did last year.

What about the wheat market?
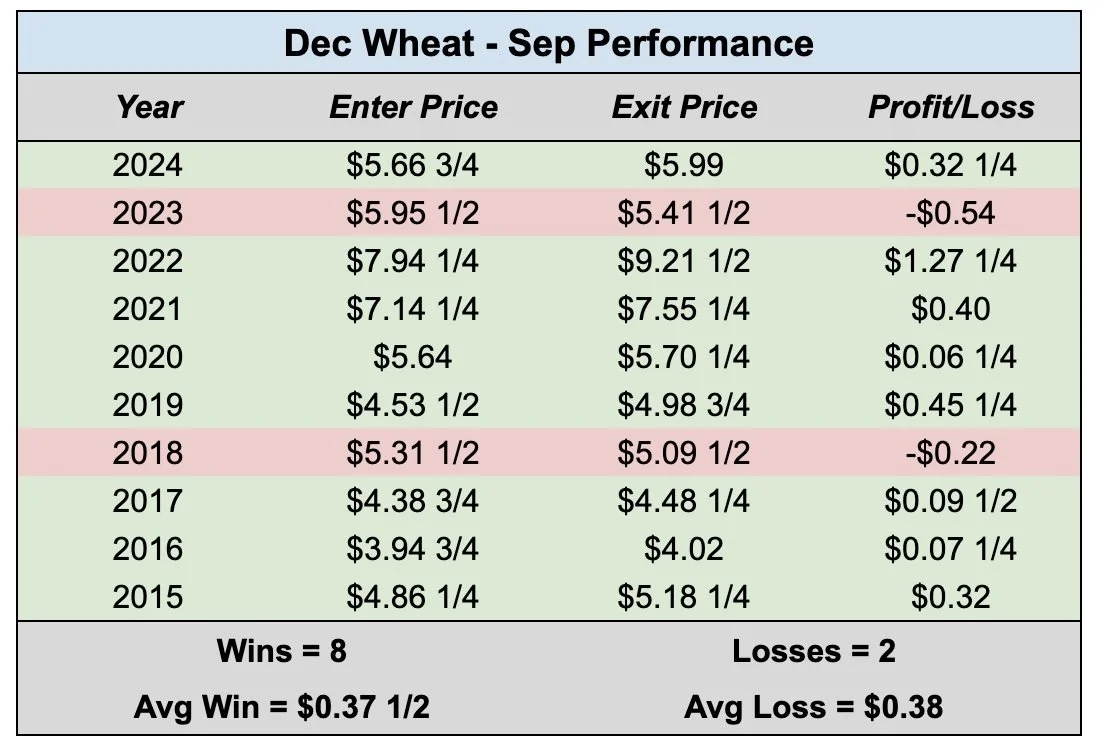
I found a similar pattern in the wheat market.
Here is the data for the month of September.
It is exactly the same as corn.
Higher the last 4 of 5 years.
Higher the last 8 of 10 years.
The only two years we traded lower were once again 2023 and 2018.
Now if we look at the actual seasonal chart, it has the wheat market posting it's bottom basically right now.
Before trending higher into the middle of October.
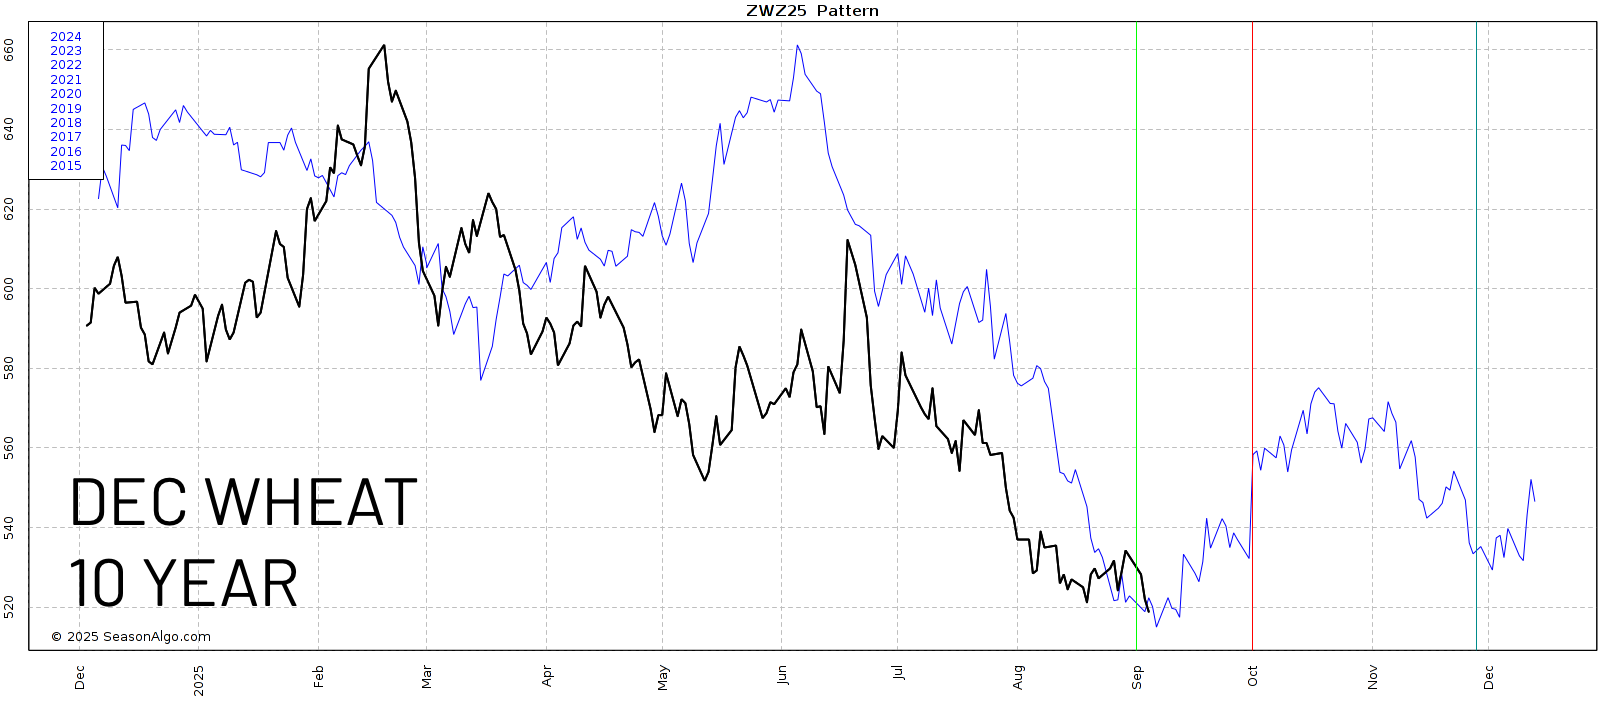
Comparing this year to last year, we found a bottom right about now. At about the same price levels we are currently sitting at around $5.20.
Before topping out on October 3rd after a +90 cent rally.

Does this mean corn or wheat "has" to rally in September.
No of course not.
This is simply what the historical data suggests.
Today's Main Takeaways
Corn
We have a supply that is getting smaller (although still record).
We have some of the best demand on record.
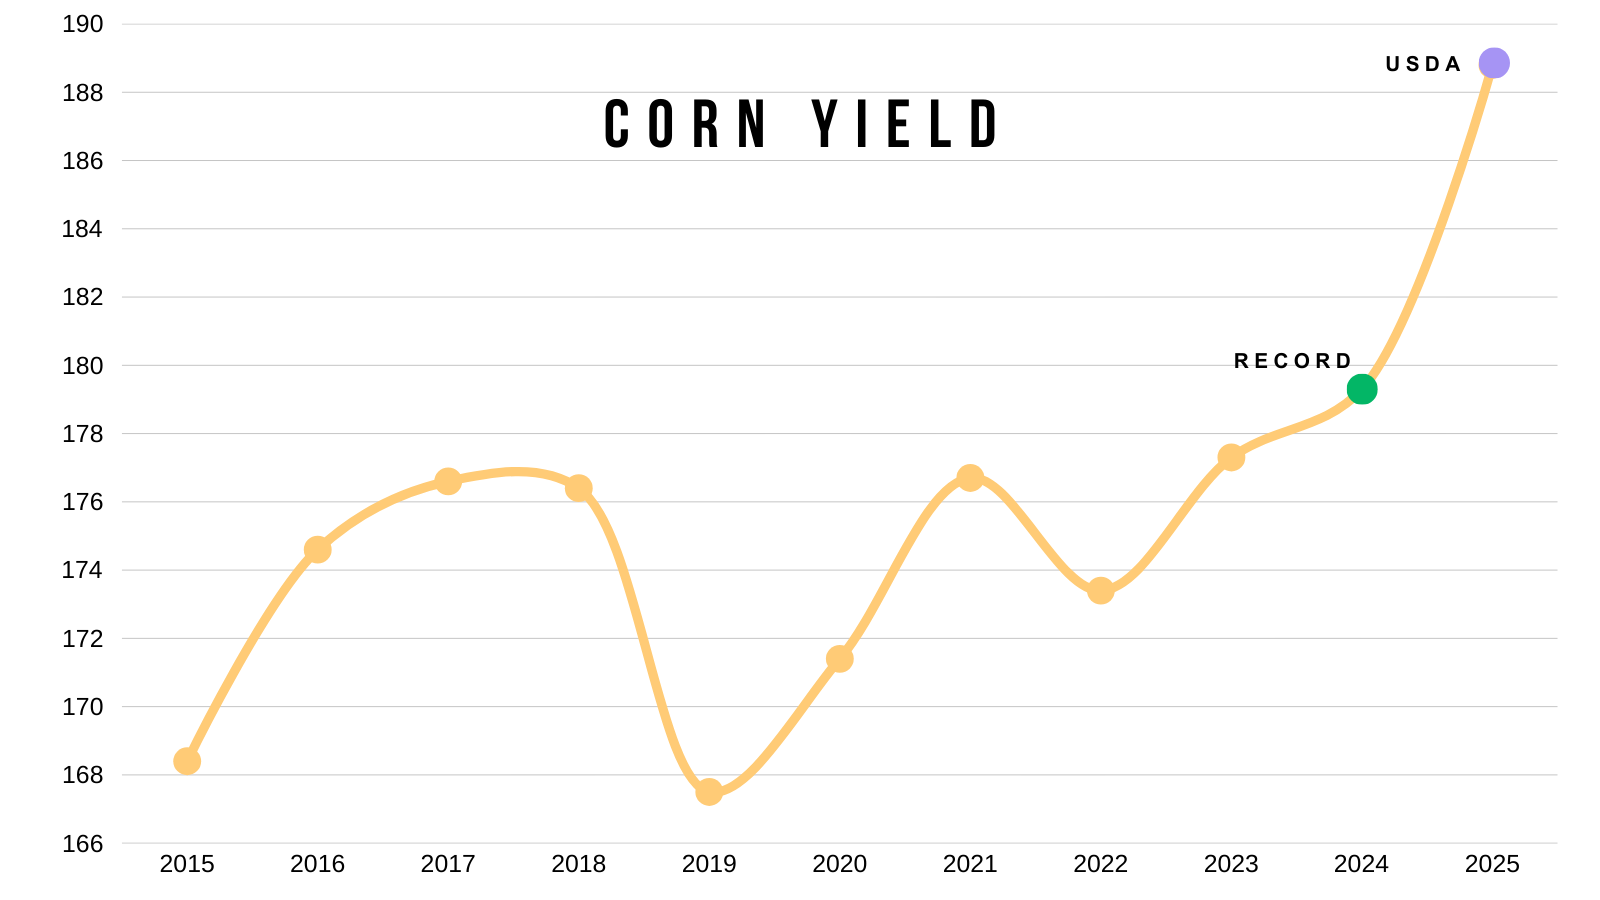
A 188.8 yield isn’t going to happen.
However, that is already now likely partially being priced in on the recent rally.
But I do think corn is supported until the USDA report because I'm sure plenty of traders want to know where yield is going to come in at.
The market's job is to put prices at fair values.
I have no clue if the yield is 180 or 185. But we do know supply is getting smaller.
How much does this matter?
Let's look at the balance sheet to find out.
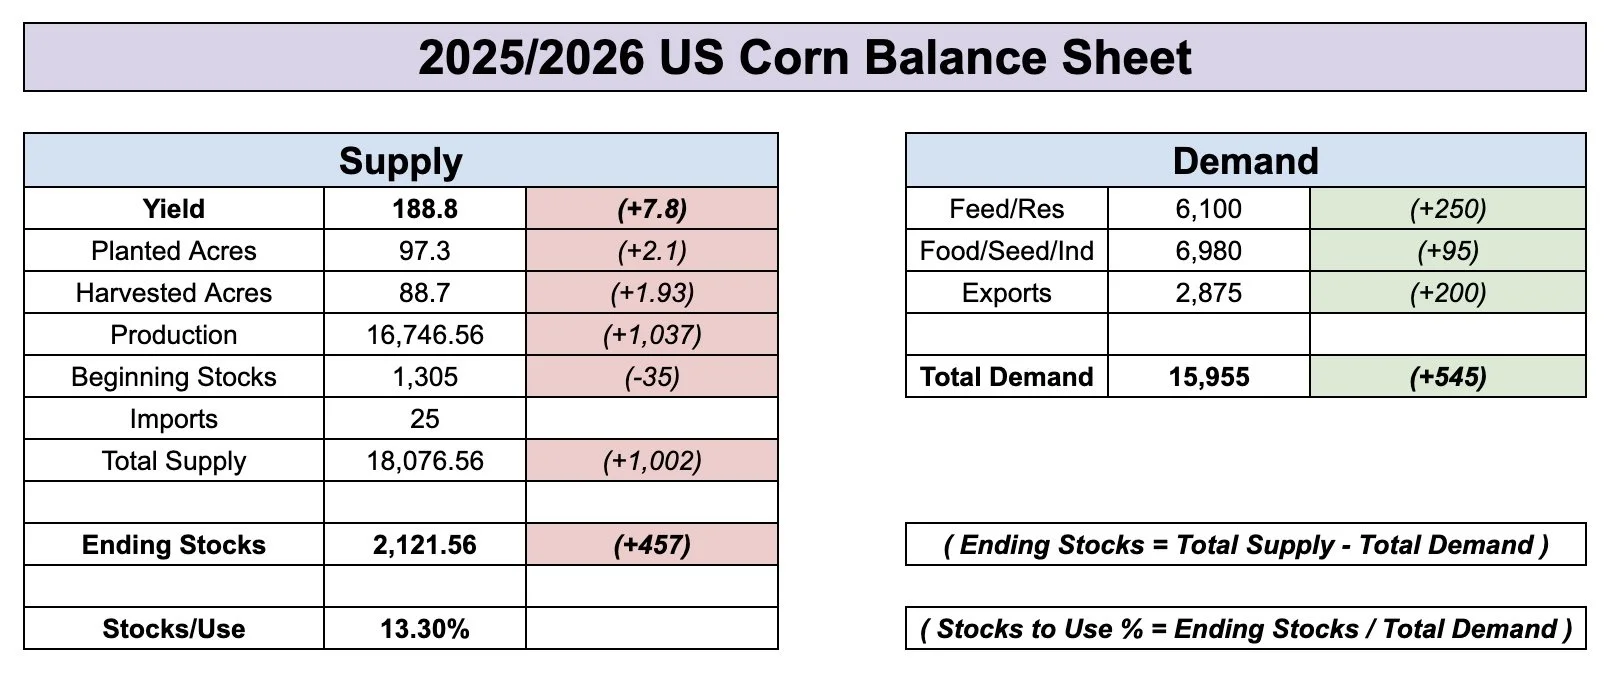
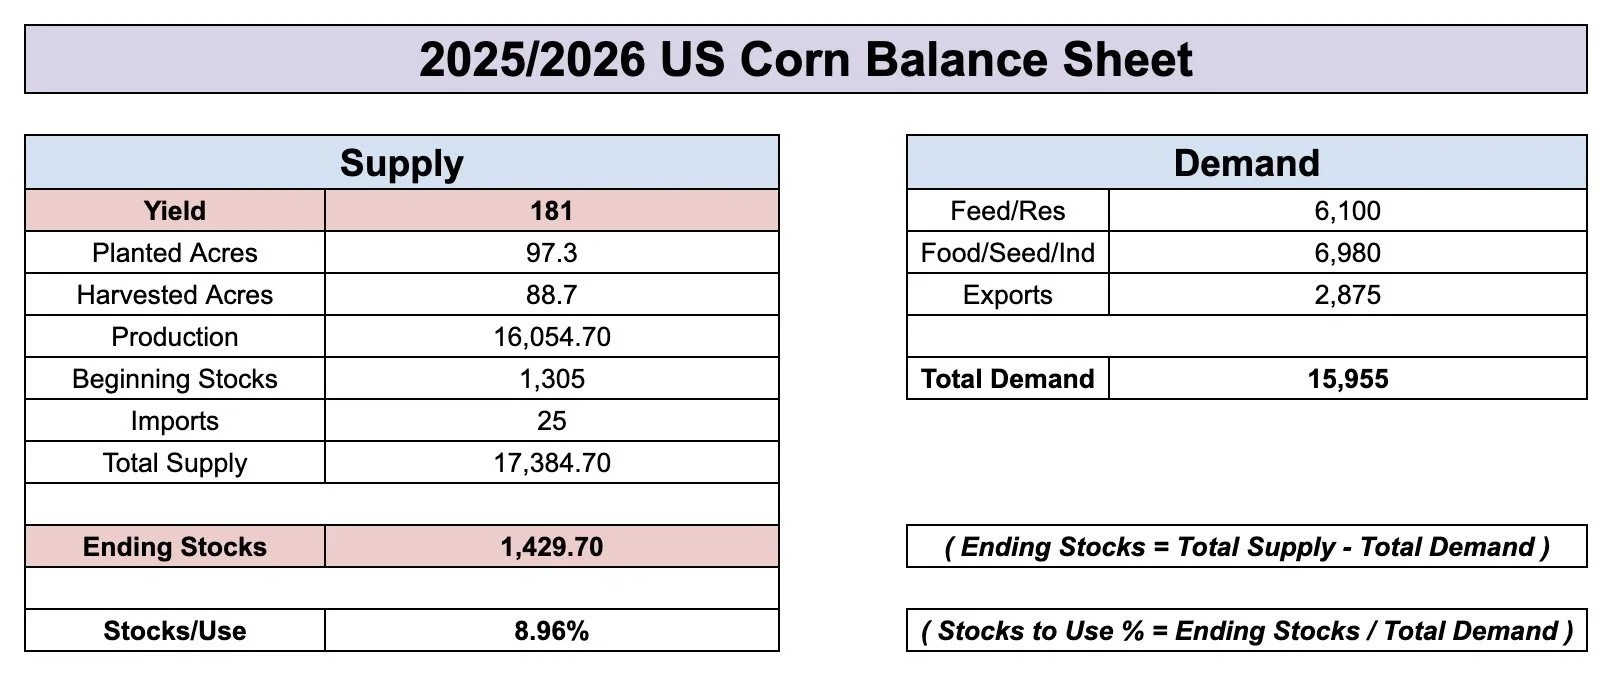
Here is the current balance sheet. I left the last changes the USDA made on it.
Red is bearish, green is bullish.
If you remember, the USDA added +1 billion bushels of supply, but offset half of that with an extra +500 million bushels of demand.
Let's just say yield dropped to 185.
Without changing demand, it would still print a 1.80 billion bushel carryout.
Which isn’t as burdensome as the current 2.10 billion but is still far from being bullish.
When supply gets cut, the USDA will probably offset part of it with a decrease to demand as well.
Given they added that fresh +500 million bushels of demand, it gives them wiggle room to play with.

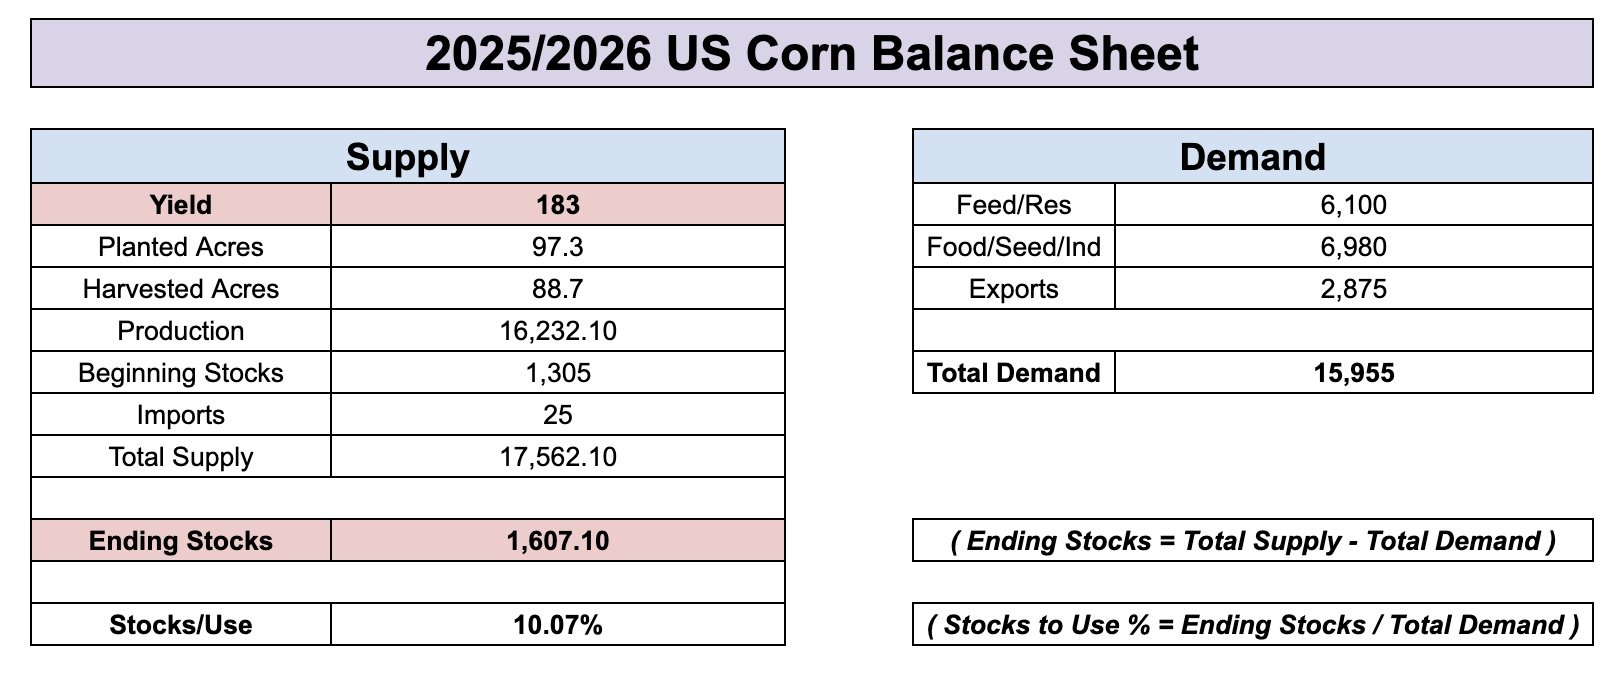
If yield dropped to 183, things do become more interesting.
The drop will not be this dramatic given they will also lower demand, but it spits out a 1.60 billion bushel carryout and a 10% stocks to use ratio.
Typically anything below 10% is considered bullish.
Now let's just say somehow yield actually came in at their original 181 estimate.
Well, that would paint the balance sheet pretty bullish.
Before changing demand, it drops the stocks to use ratio to 9%.
Which is bullish.
Here is a visual of corn carryout the past few years.
I plotted those scenarios on the chart.
If yield is 185 or less, we are still looking at our tightest carryout for this time of year since 2022.

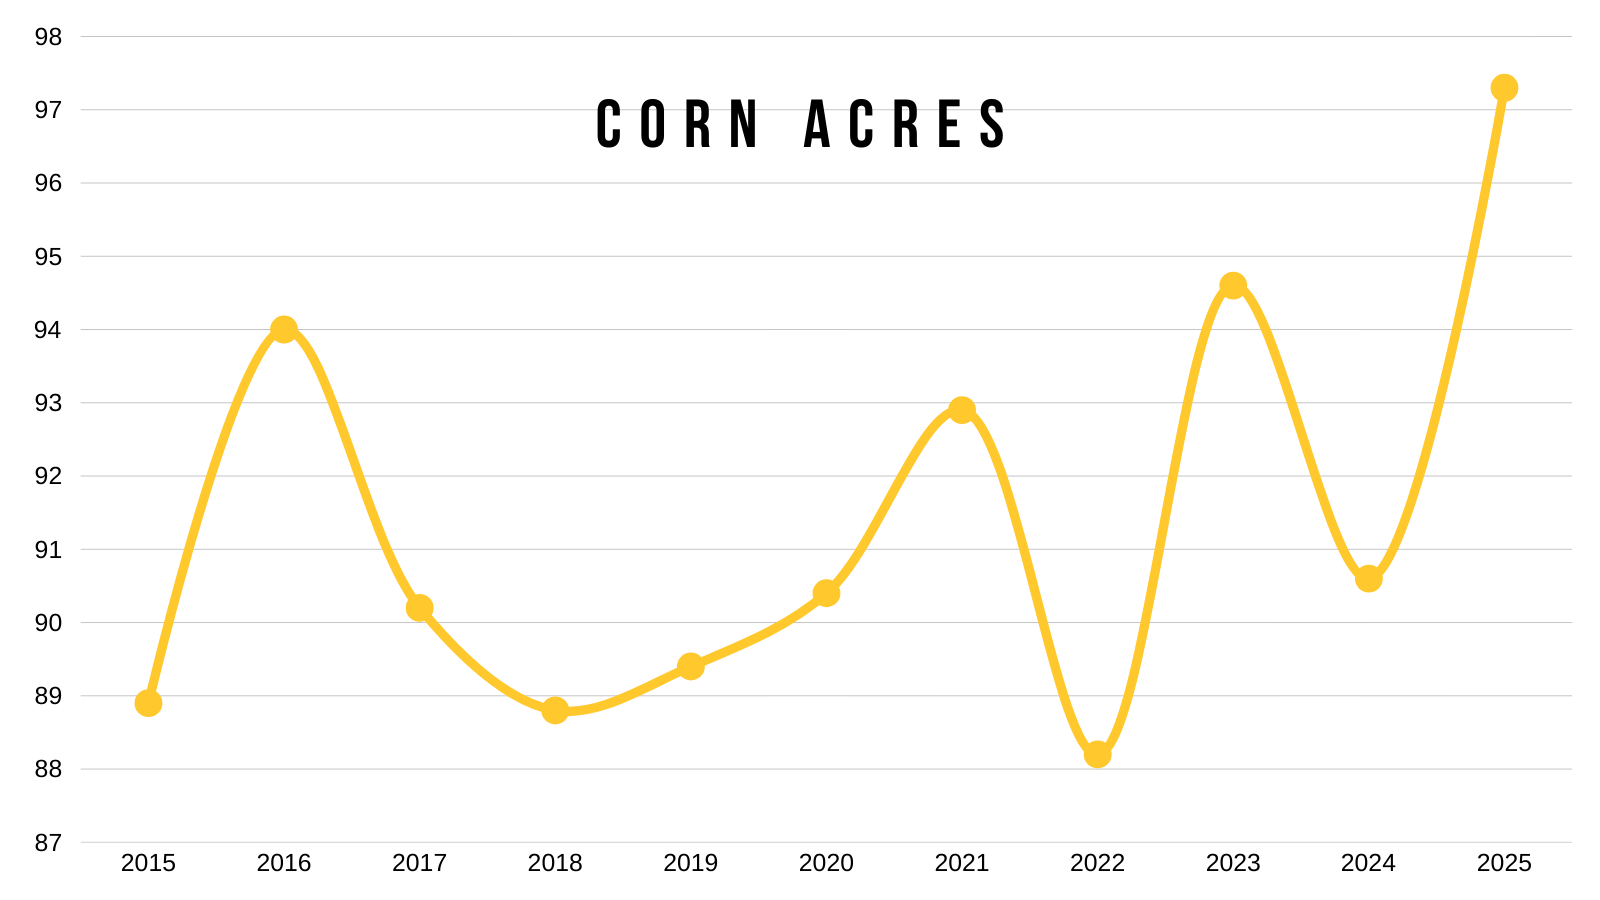
We are going to have record production no matter how you slice it.
We have near record acres.
Along with a record yield.
Far greater than anything we've ever seen before.
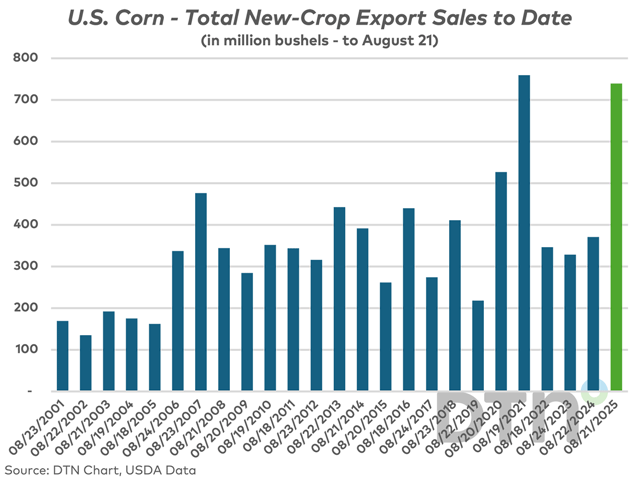
But we are also exporting more corn than ever which is helping offset that major production.
Like I mentioned, export sales were great last year.
We are literally double what were sitting at the past 3 years during this same time.
Chart from DTN
Why I think the harvest low is in:
There are a few reasons why I think we posted our harvest lows.
Could I be wrong? Absolutely. But here is my thought process.
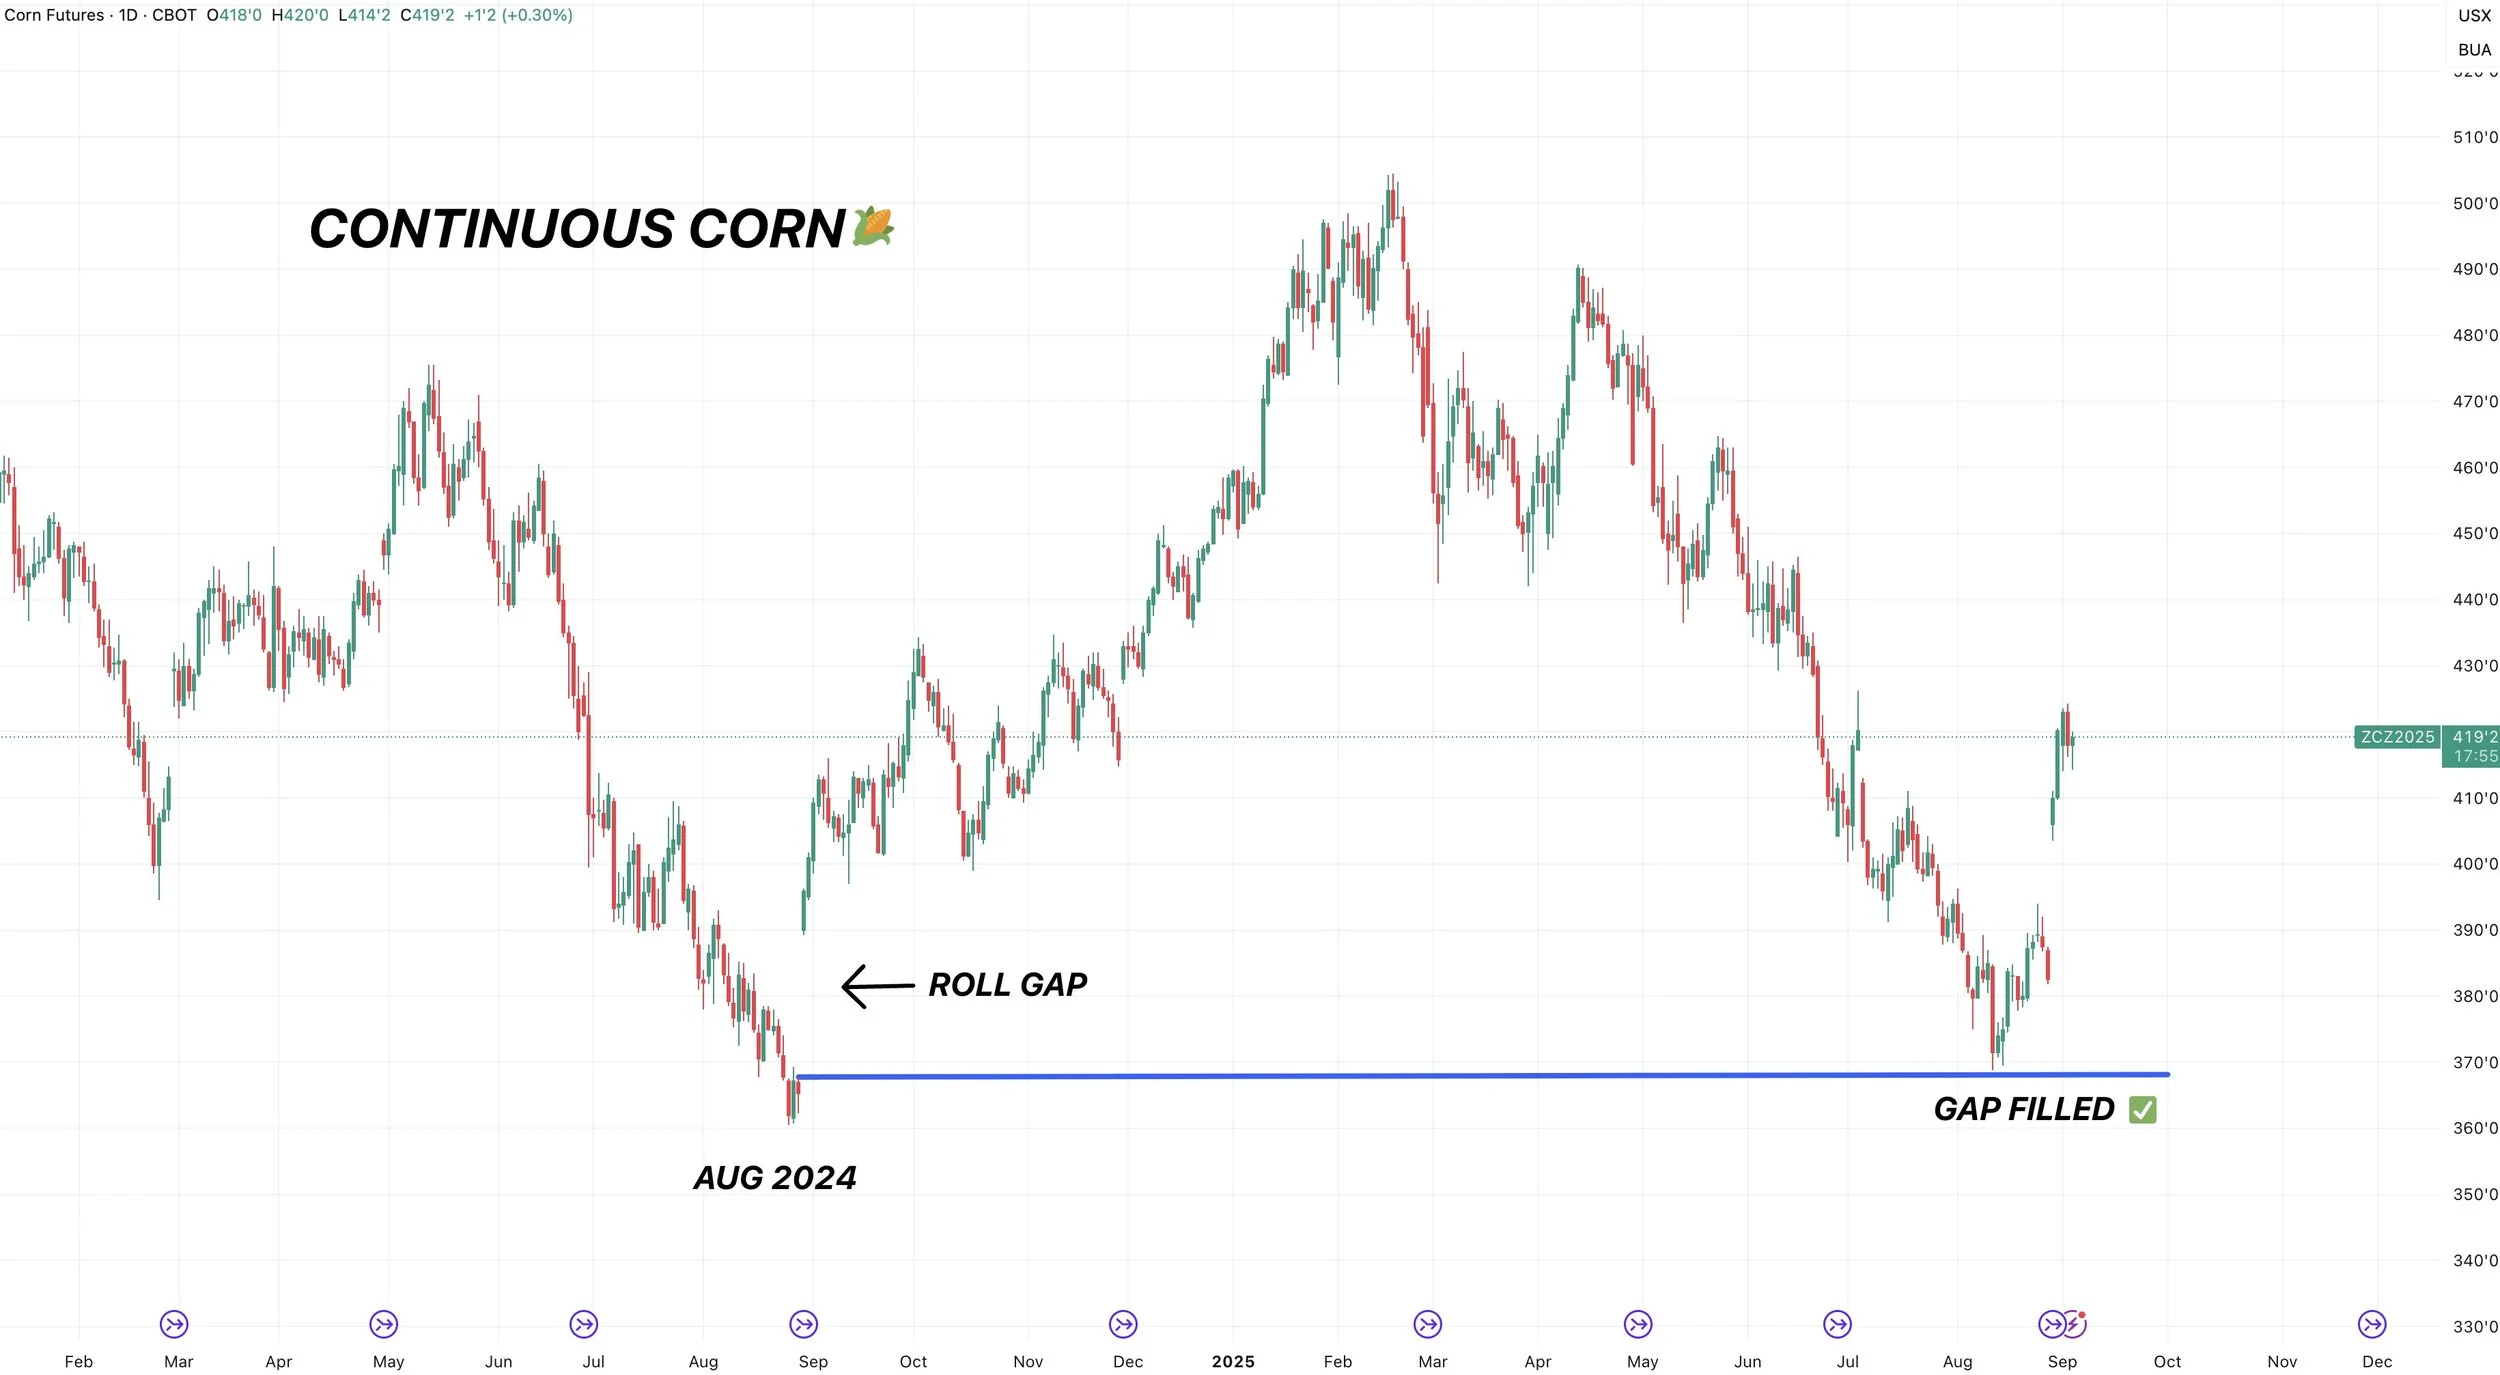
Continuous Chart:
This chart shows front month corn.
On August 29th last year, this chart rolled from the September contract to the December contract.
Since Dec was trading higher than Sep, it left a roll gap higher.
That gap remained unfilled for an entire year.
On the day of the USDA sell off in August, we almost perfectly filled that gap before heading higher.
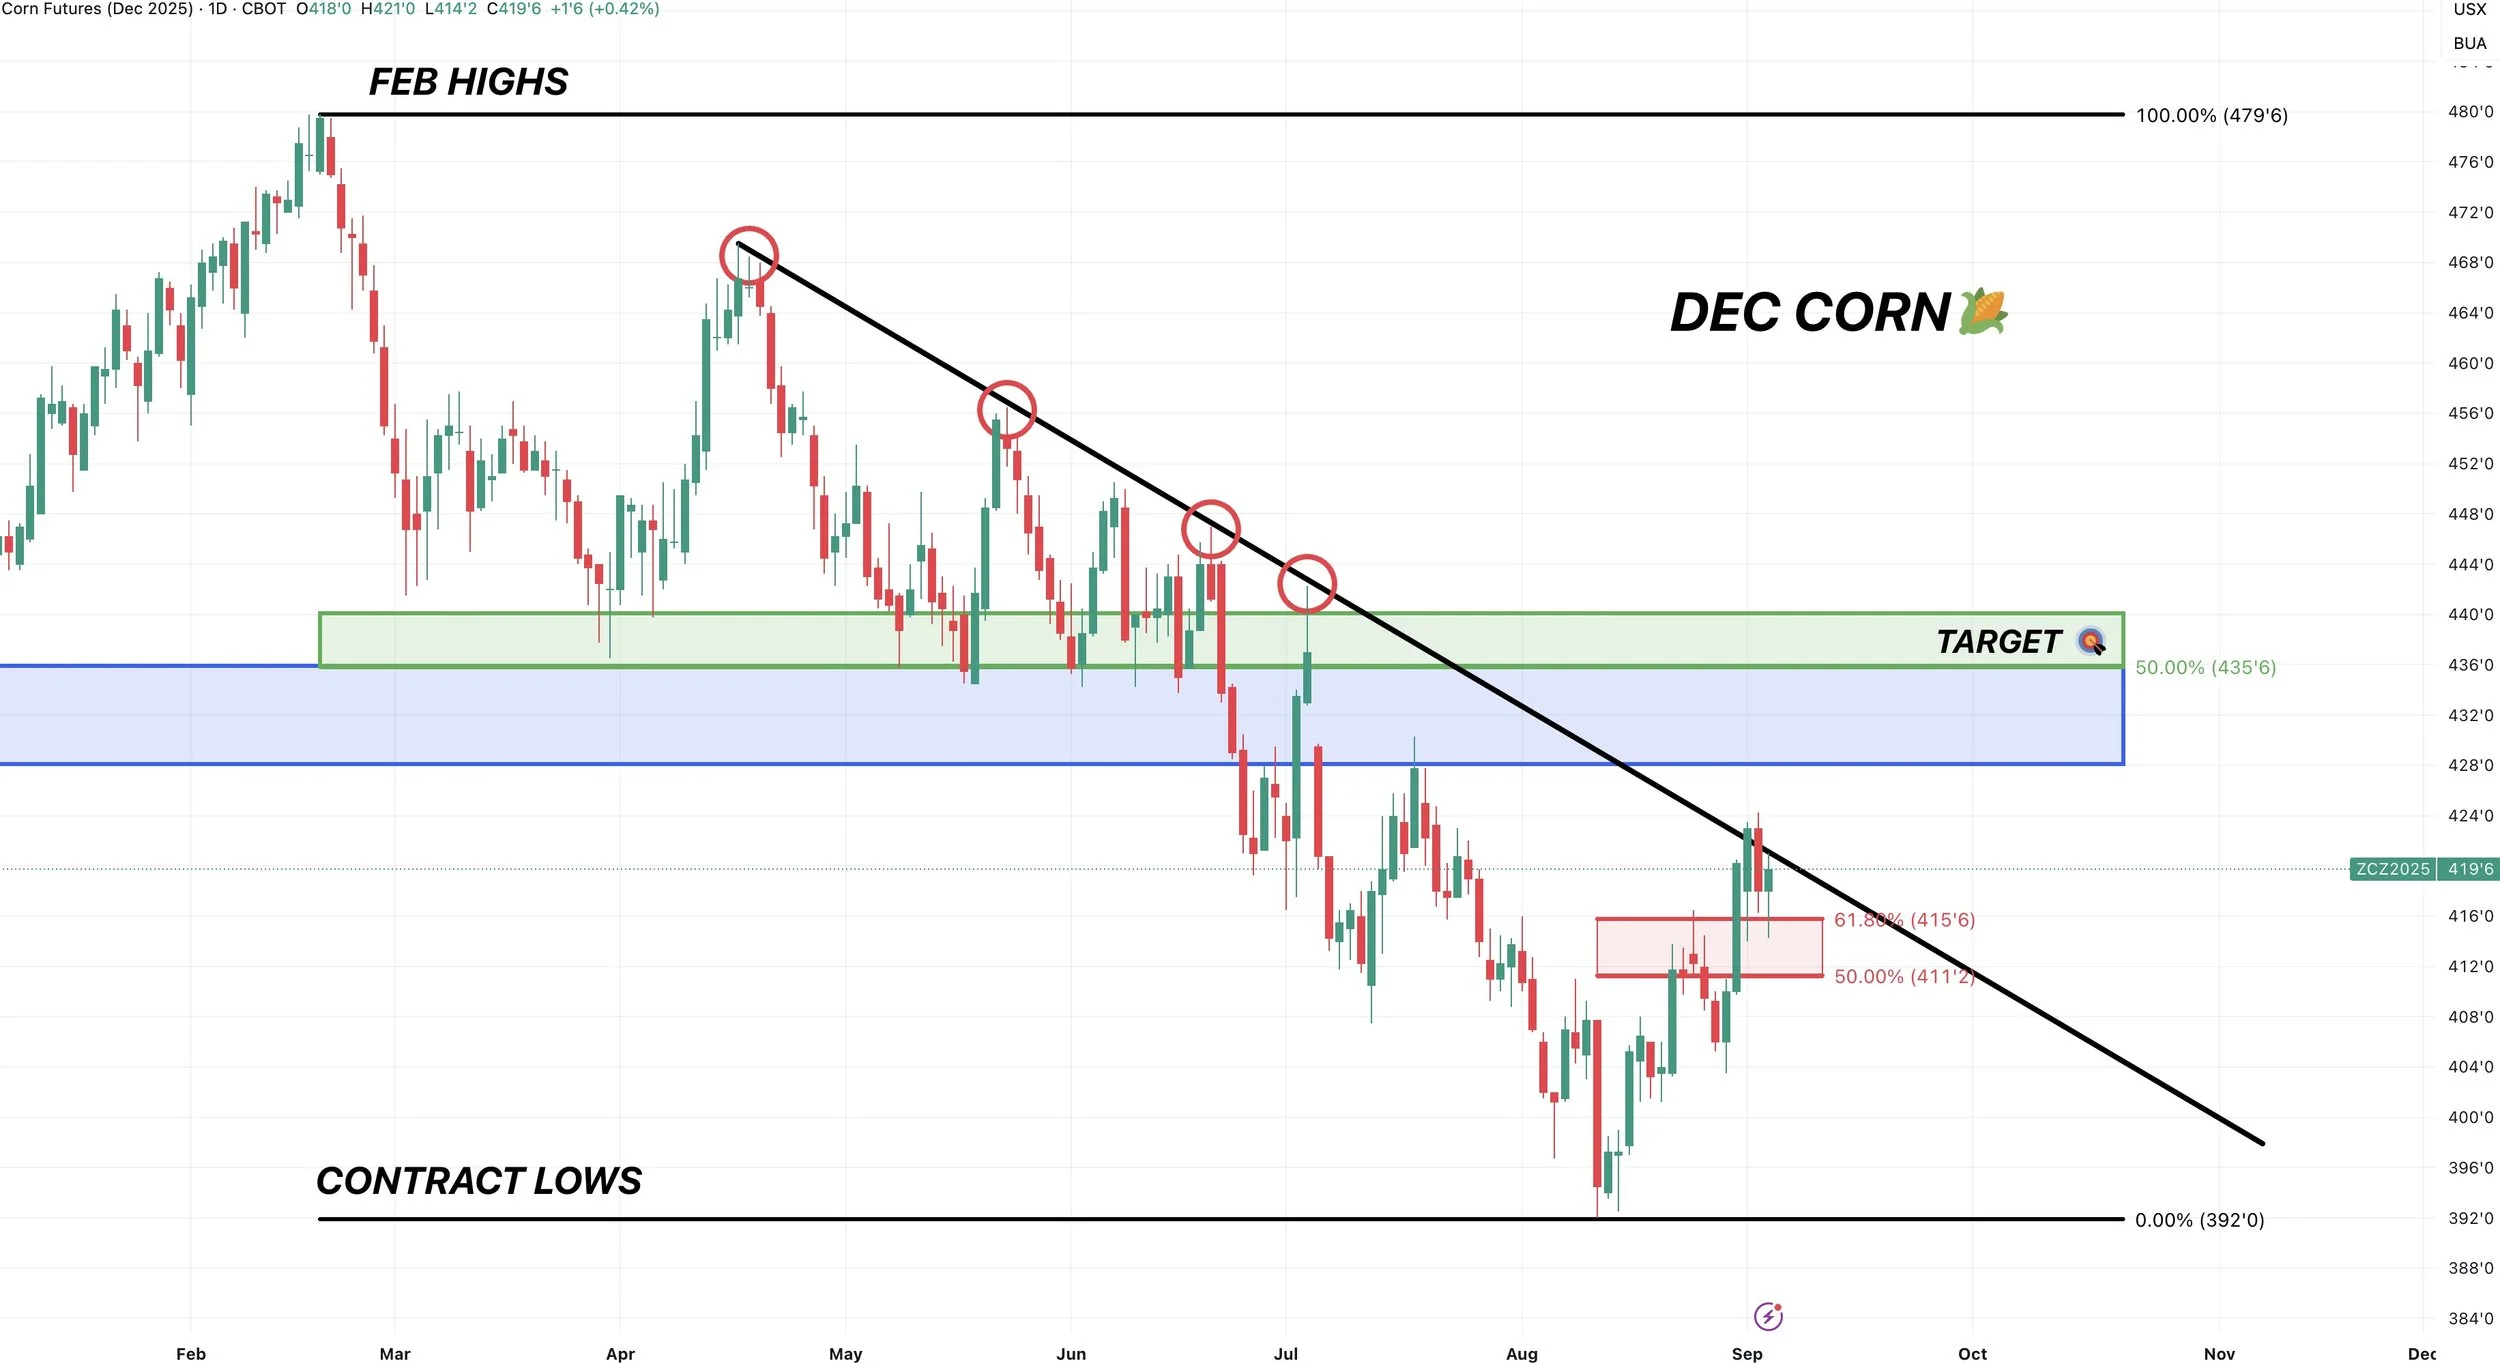
Daily Dec Chart:
I mentioned this Tuesday.
We closed above the 61.8% retracement up to those mid-July highs (red box).
This tells us that this rally off contract lows is seen as more than just another correctional bounce before heading lower.
As a standard correctional bounce or correctional sell off is usually 61.8%.

Yesterday we rejected right off this downward trend from April.
It has marked a top in this market countless times.
If we bust above, it should spark a leg higher.
My Target: $4.35
$4.35 gives back 50% of the Feb highs.
It is also our old support level from spring.
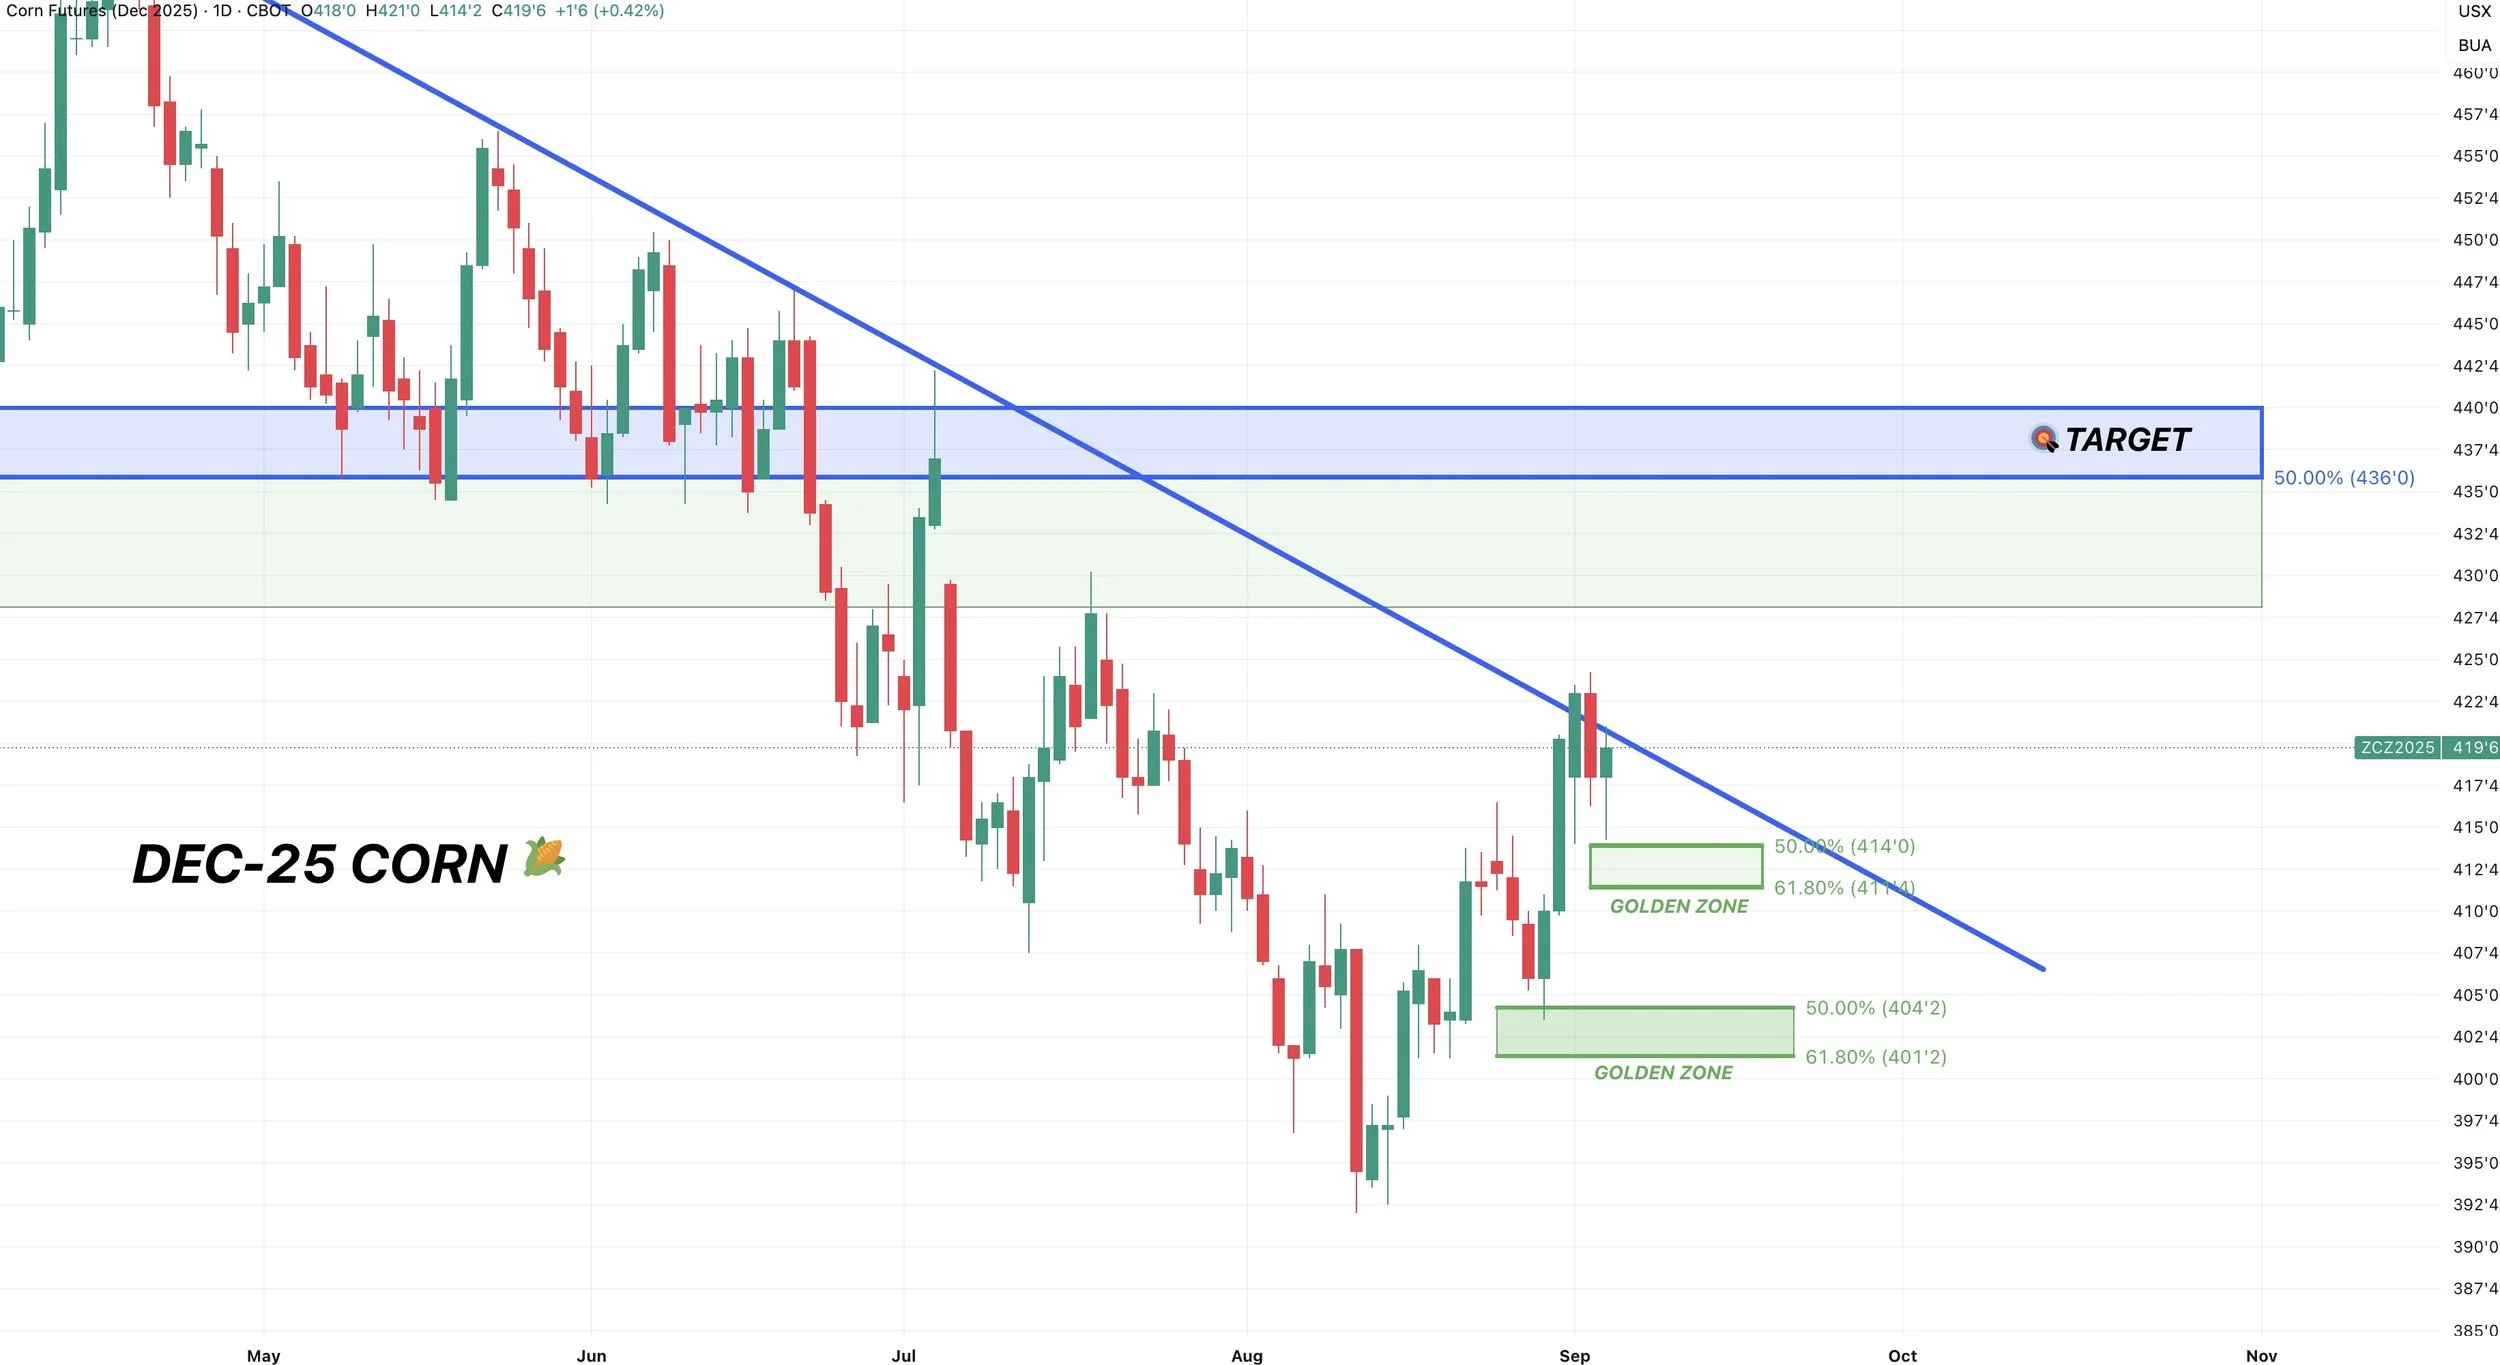
Here is a more short term analysis.
On yesterday and this morning's sell off, we retracement almost 50% of the recent 3-day rally.
That is seen as deep enough for a standard correction.
On the last mini sell off, we also bounced right at the 50% retracement level.
So that "could" have been it for the correction.
We need to take out yesterday’s highs for confirmation.
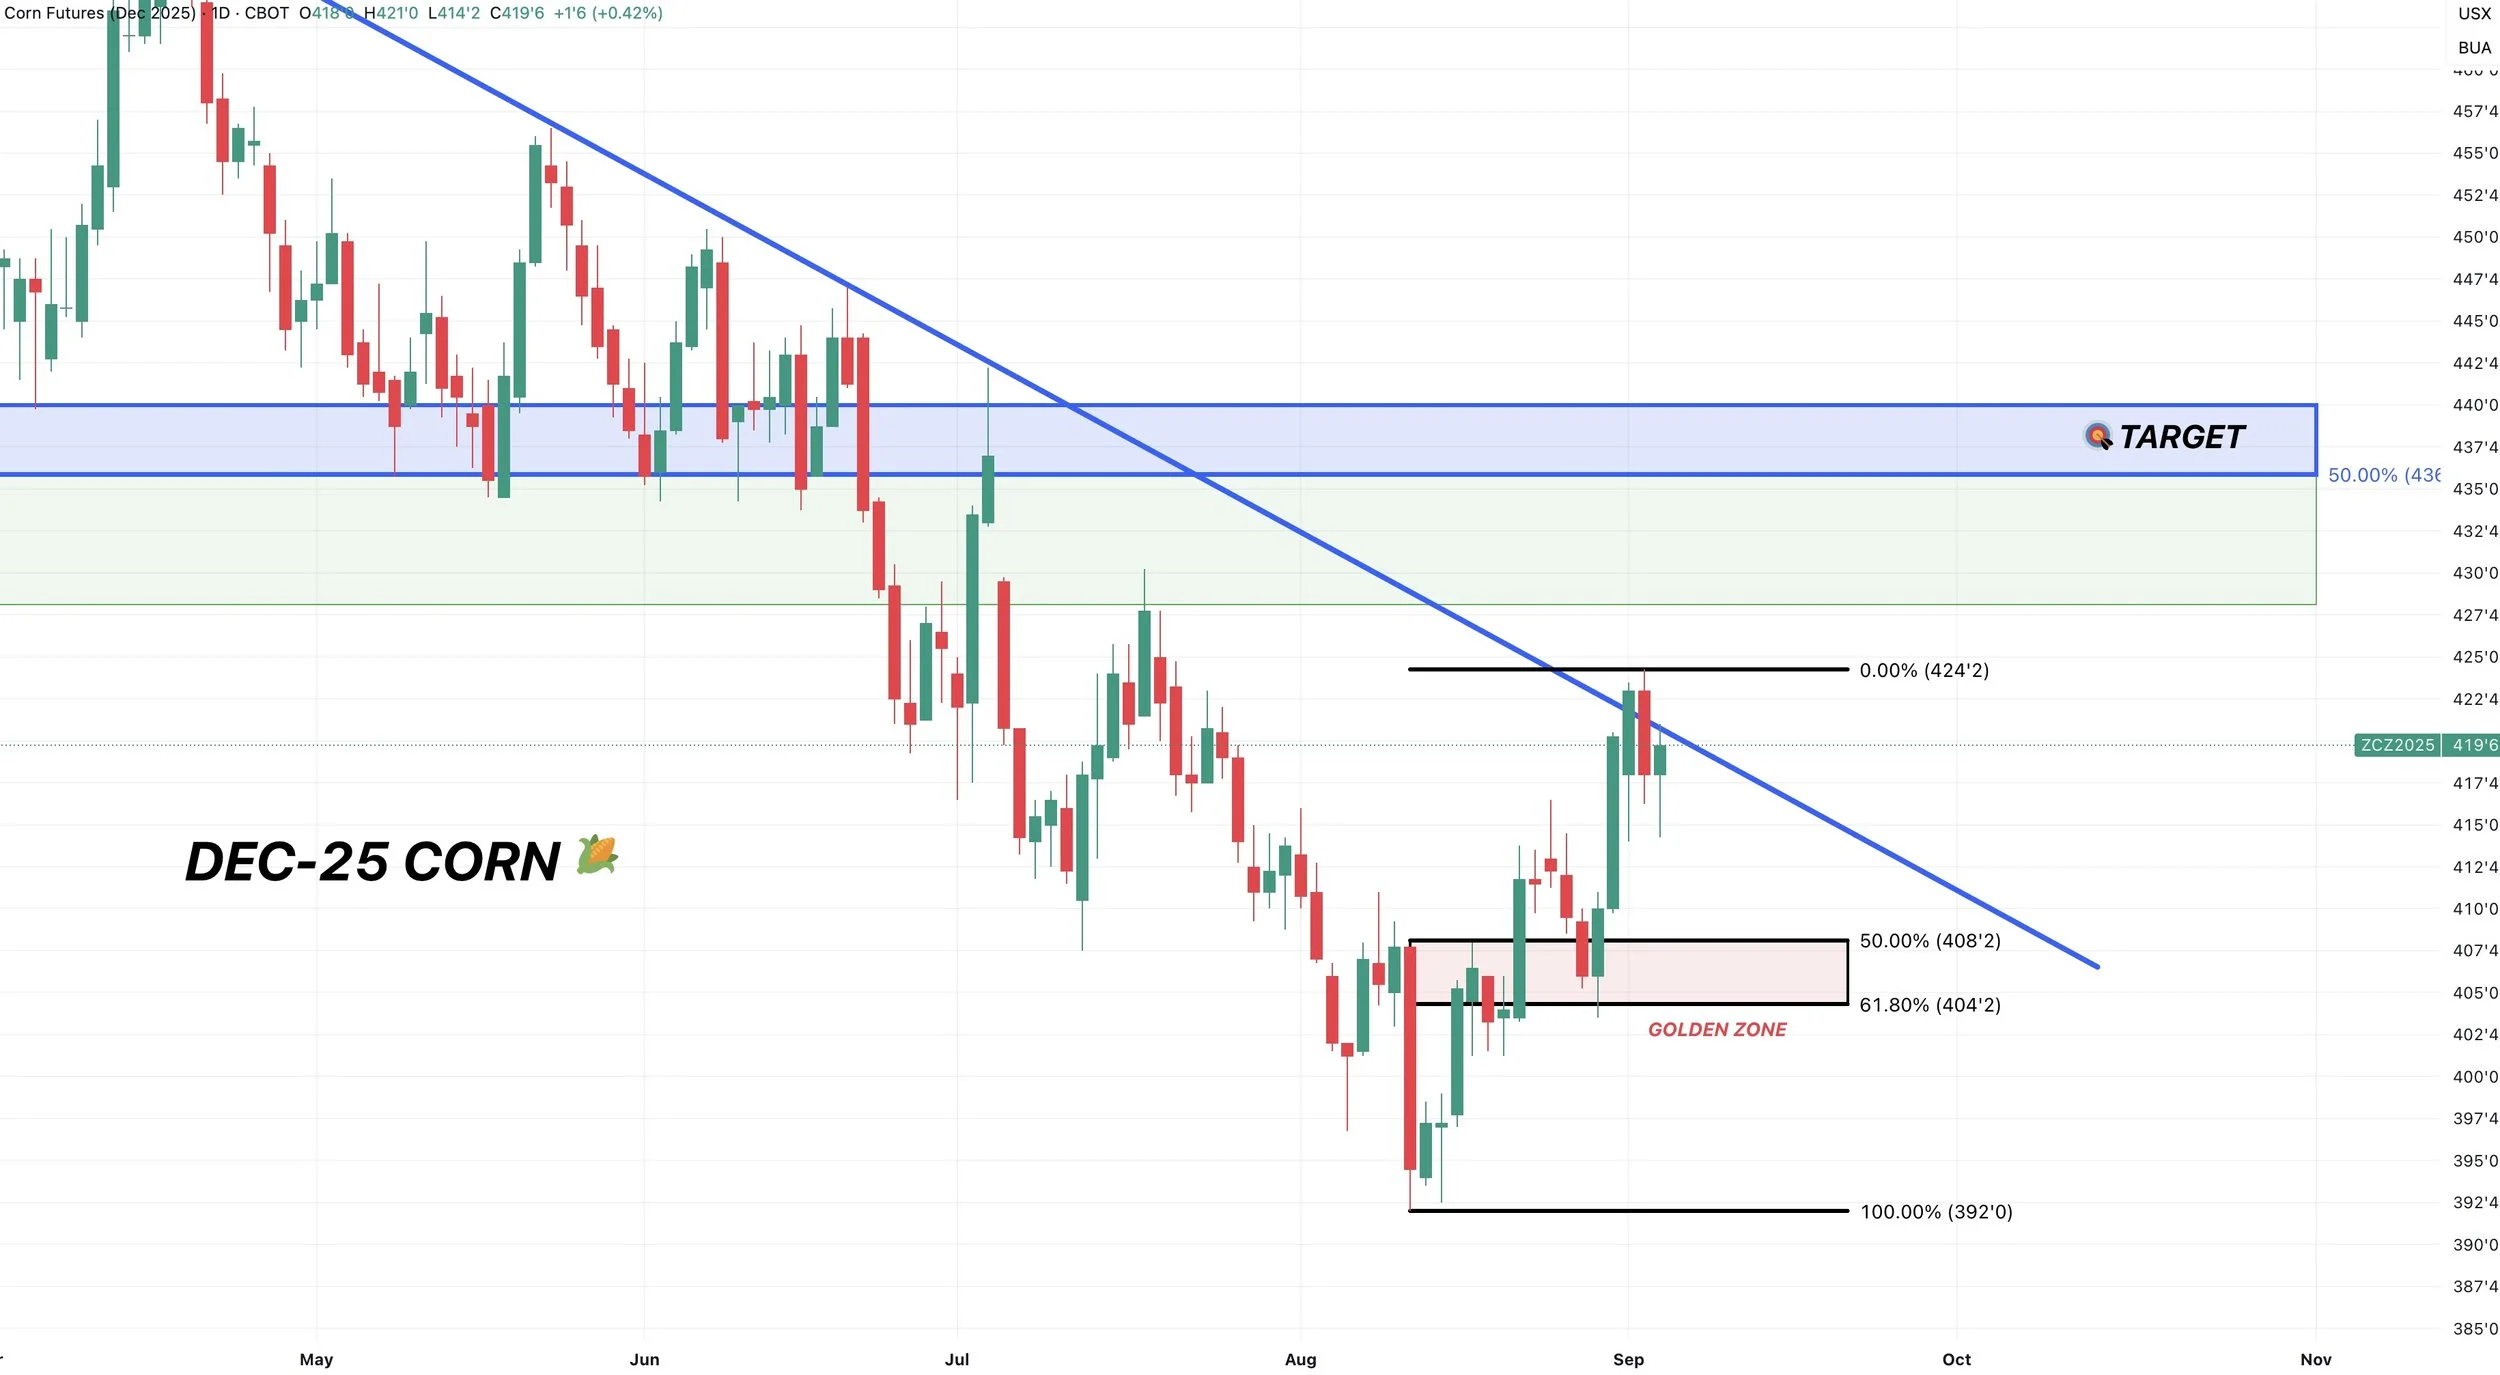
Well what if this was our local top?
What level do we need to hold?
We need to hold $4.04
$4.04 is the 61.8% retracement of the entire rally off contract lows.
If we break below $4.04 we would probably test contract lows, although I don’t think this happens.
Soybeans
Basically a broken record story in beans.
A battle of not enough US supply but not enough demand from China.
Tuesday, we went over how the US balance sheet is razor-thin.
Even with a record yield, our carryout is sitting at 3-year lows.
And that number drastically falls if yield falls.
But the obvious concern is demand.
What if China refuses to buy US soybeans?
How big of an impact could this have?
Last year China bought 810 million bushels of soybeans from the US.
During the last trade war they only bought 330 million bushels.
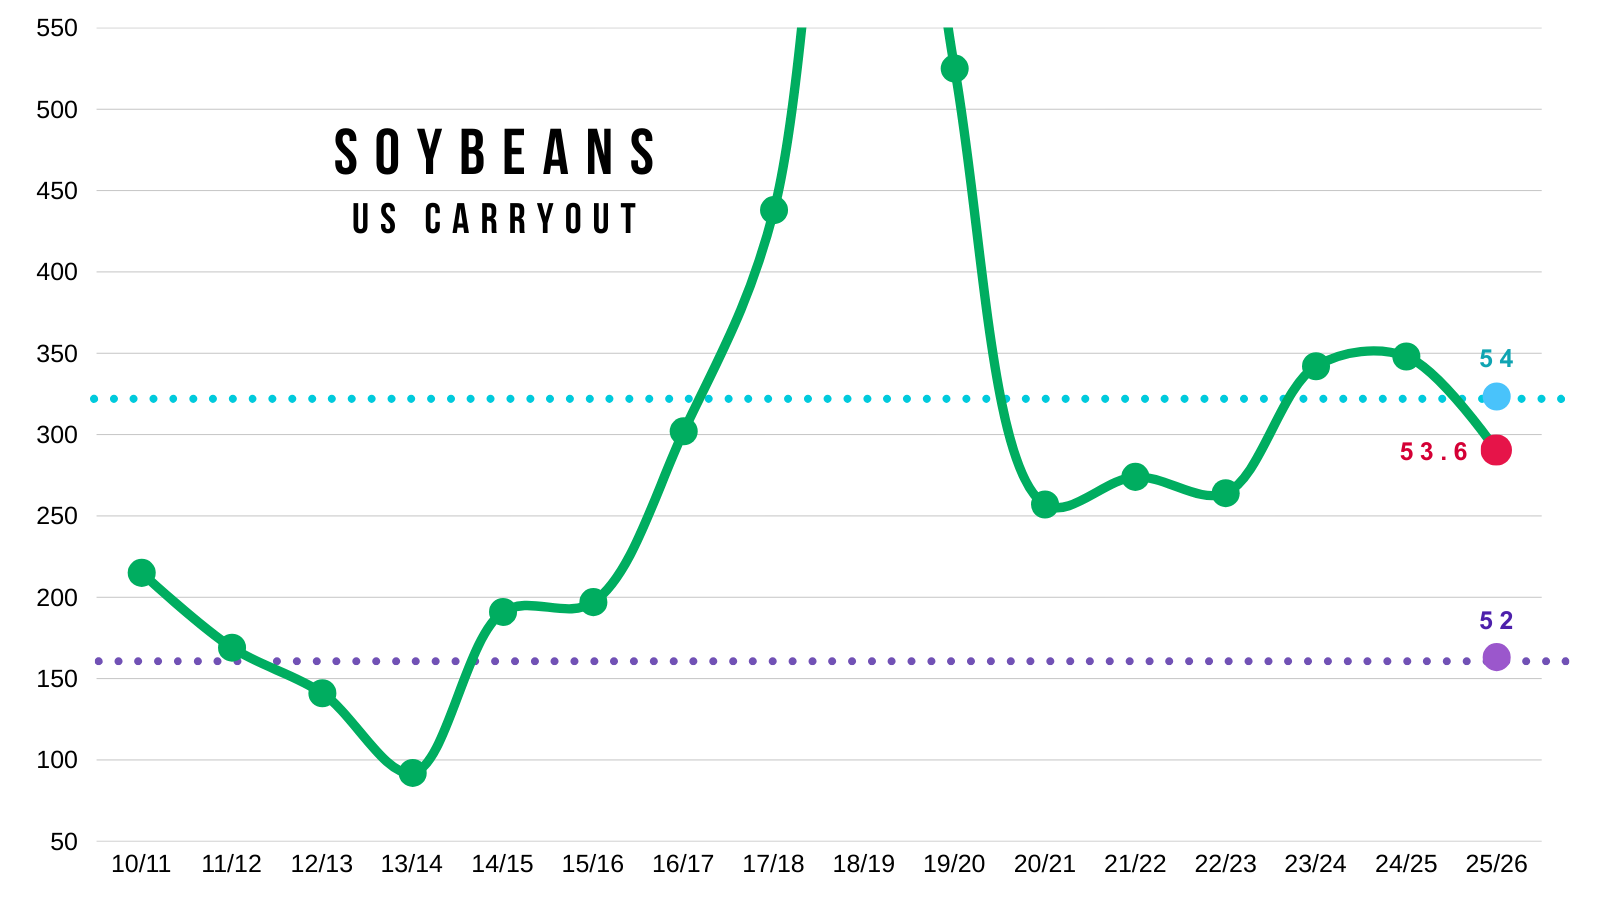
Here is the current balance sheet.
Our carryout is 290 million.
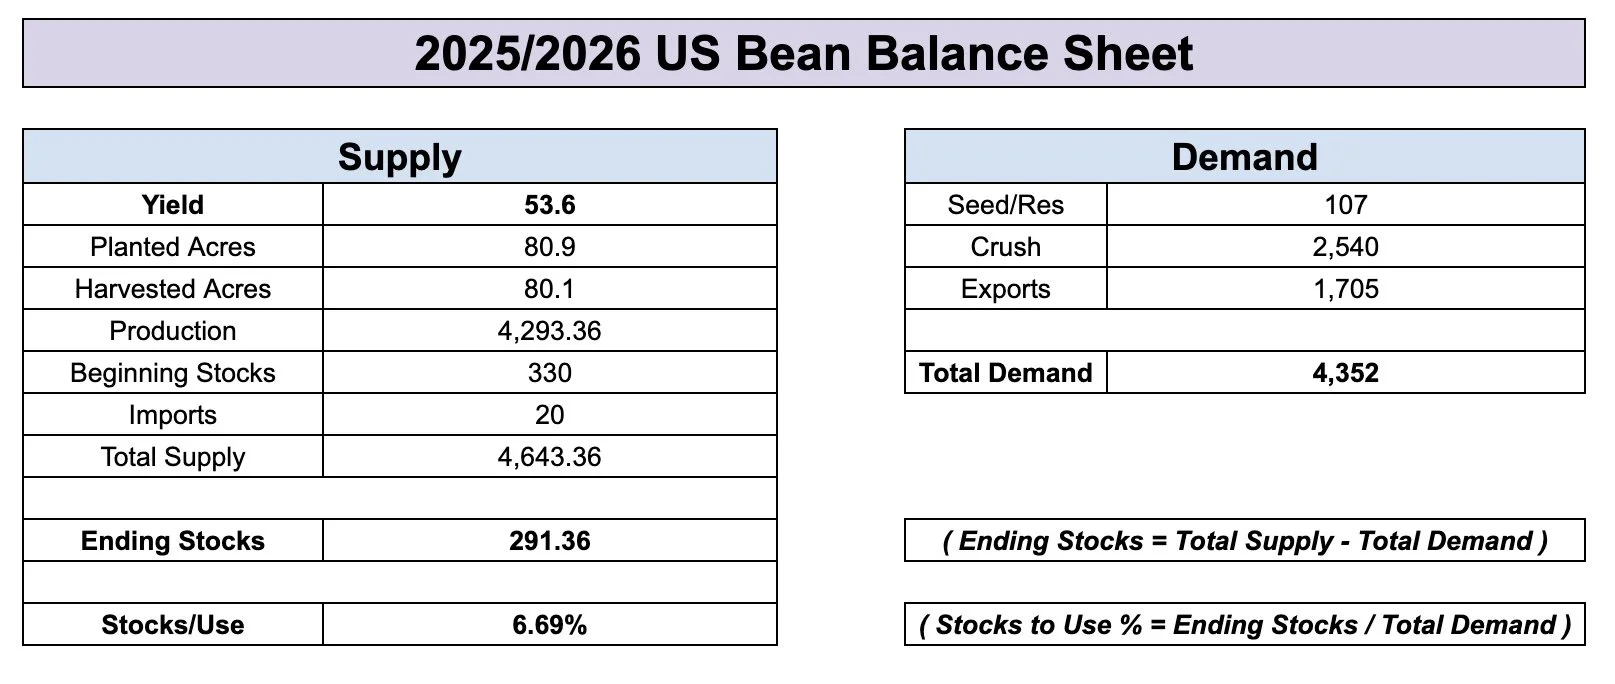
Now or the sake of this arguement, let's say export demand is overstated by 500 million bushels.
This number is based on last years sales (810 million), and the previous trade war's sales (330 million).
If this happened, it would sky rocket our carryout to nearly 800 million bushels vs the current 290 milllion.

Here is what that looks like on the carryout chart.
Our carryout would be the 2nd highest of all-time.
Only behind last trade war.
So yes. We need China.
I have a hard time believing China completely cuts off the US, but I guess it's possible.
Even if China does not come to the table. Some of that business that normally goes to Brazil might wind up coming to the US. So this is an extreme example.
On the other hand, the upside in this market is higher than anyone thinks if China does come to the table.

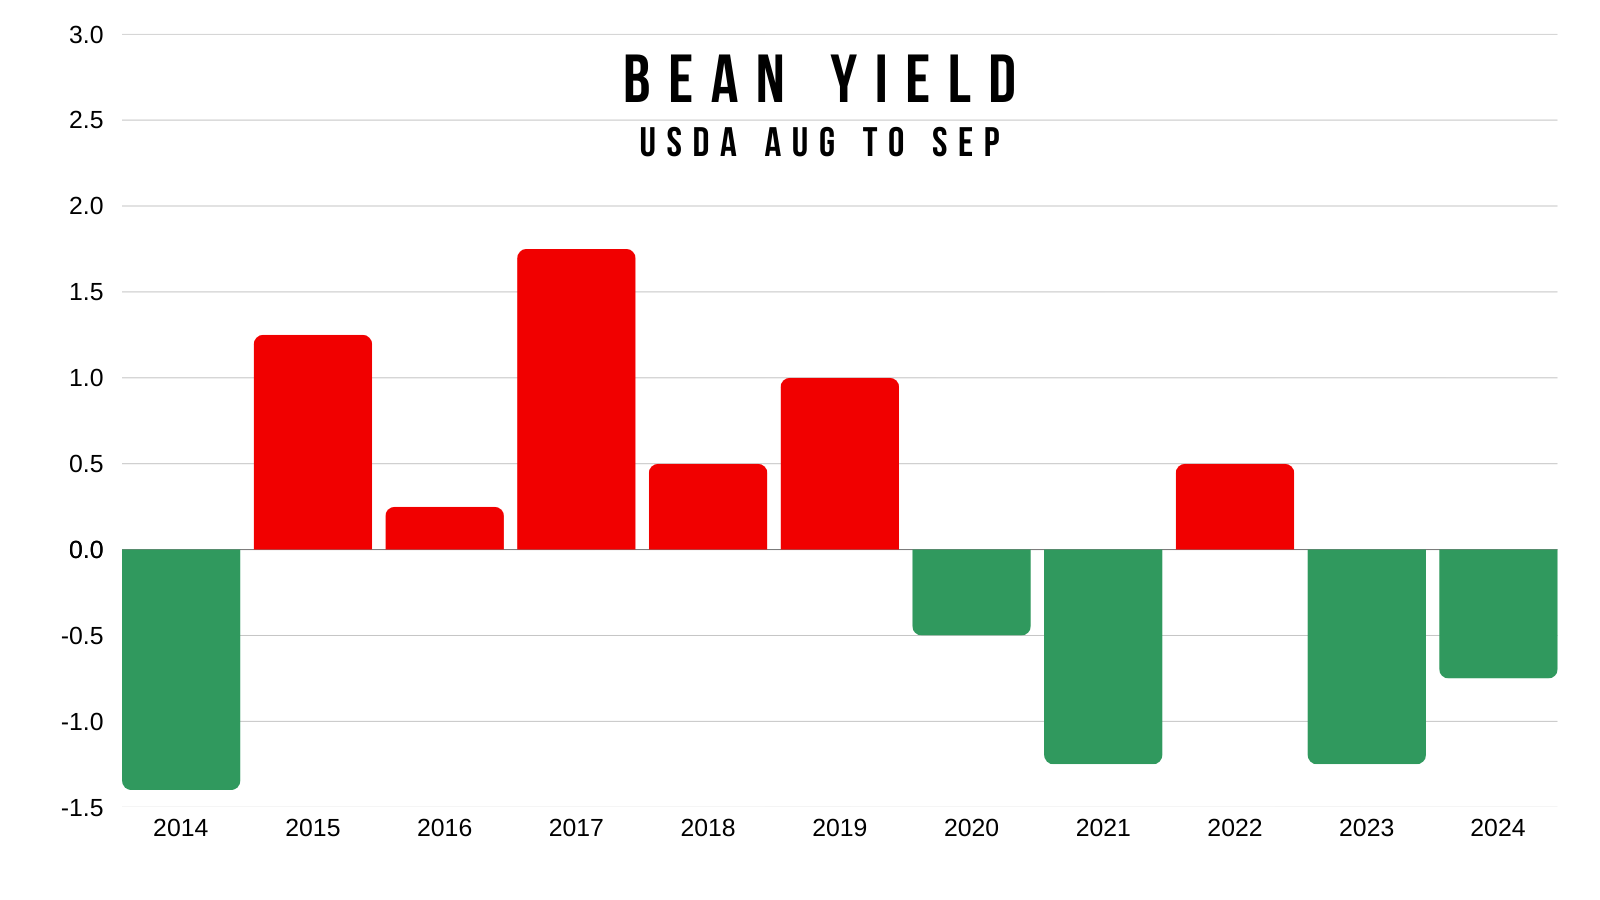
USDA Yield
The USDA report is next Friday.
In August, they have cut yield 4 times in the past 5 years.
The average cut is 1 bpa.
Which would put yield at 52.6 bpa if it happened again.
Daily Nov Chart:
We have been mentioned that if we broke below this green box, our next stop could very well be the blue box.
The green box was the golden zone of this mini rally (50-61.8% retracement).
The blue box is the golden zone of the entire rally off of $9.80.
Today we bounced perfectly off of the 50% retracement at $10.22
Which means this move was technically deep enough for a standard correction and it might be over.
However, I am not ruling out testing the 61.8% level at $10.12
That is the line in the sand to keep the chart bullish.
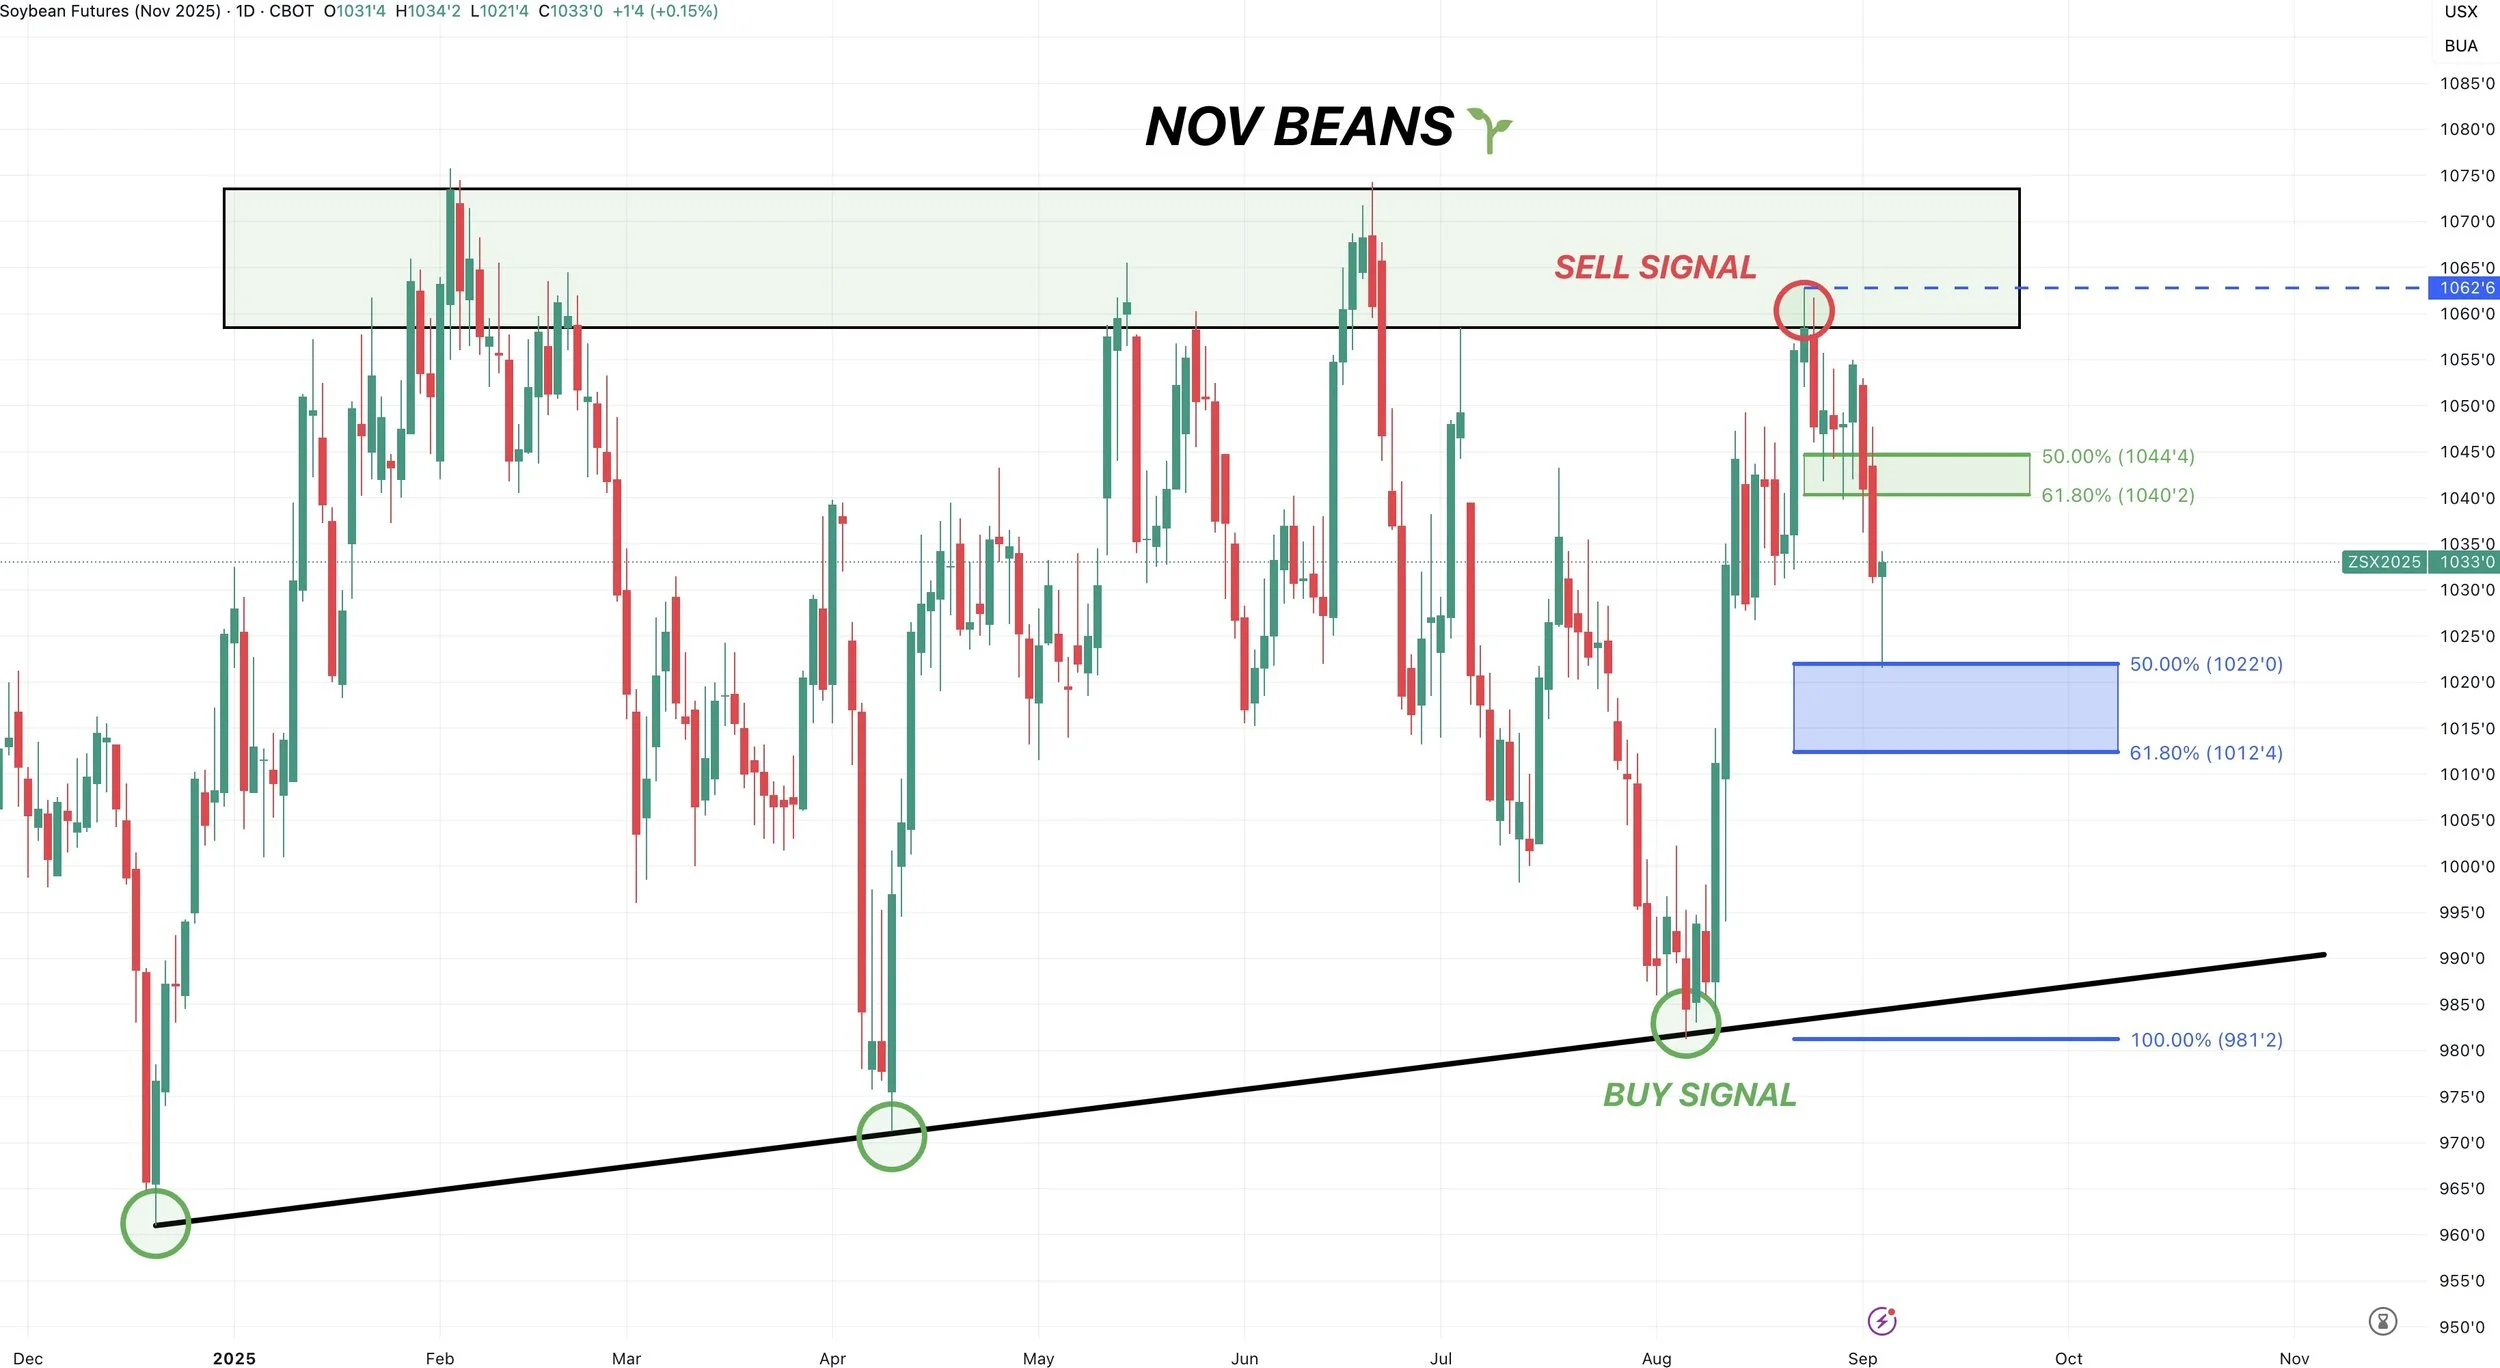
For confirmation that this correction is over, I need to see a close above $10.47
That reclaims 61.8% of this sell off.
When we close above that level, it tells us that a move is no longer correctional.
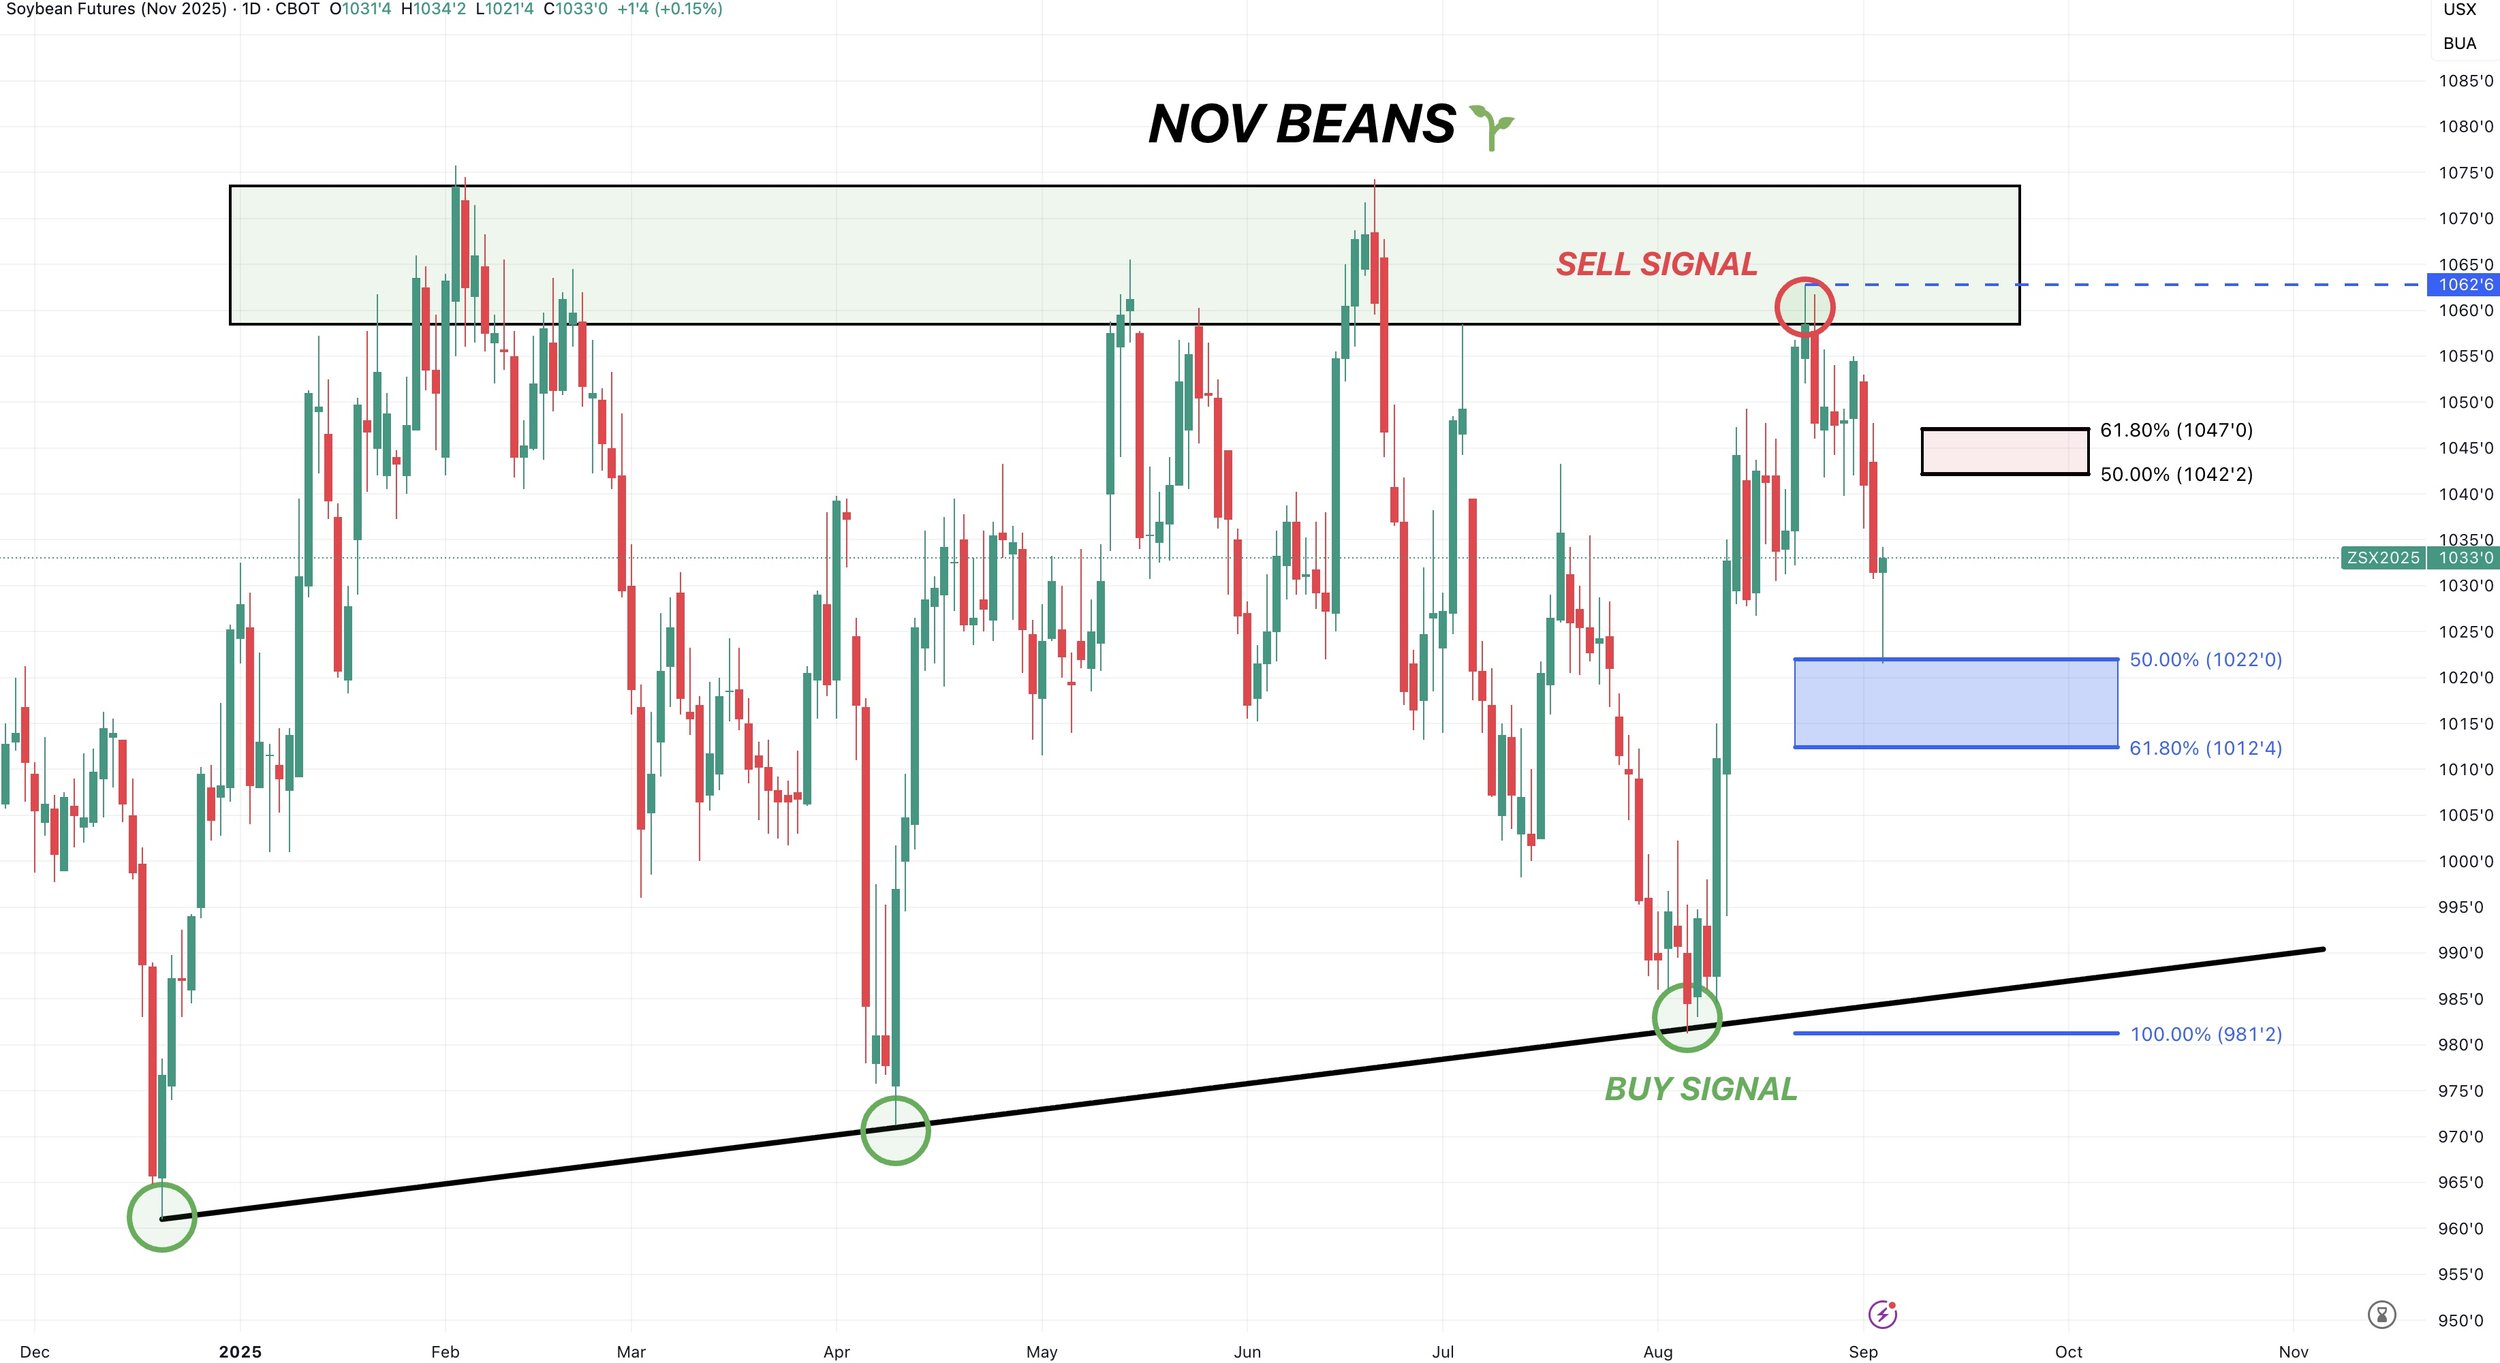
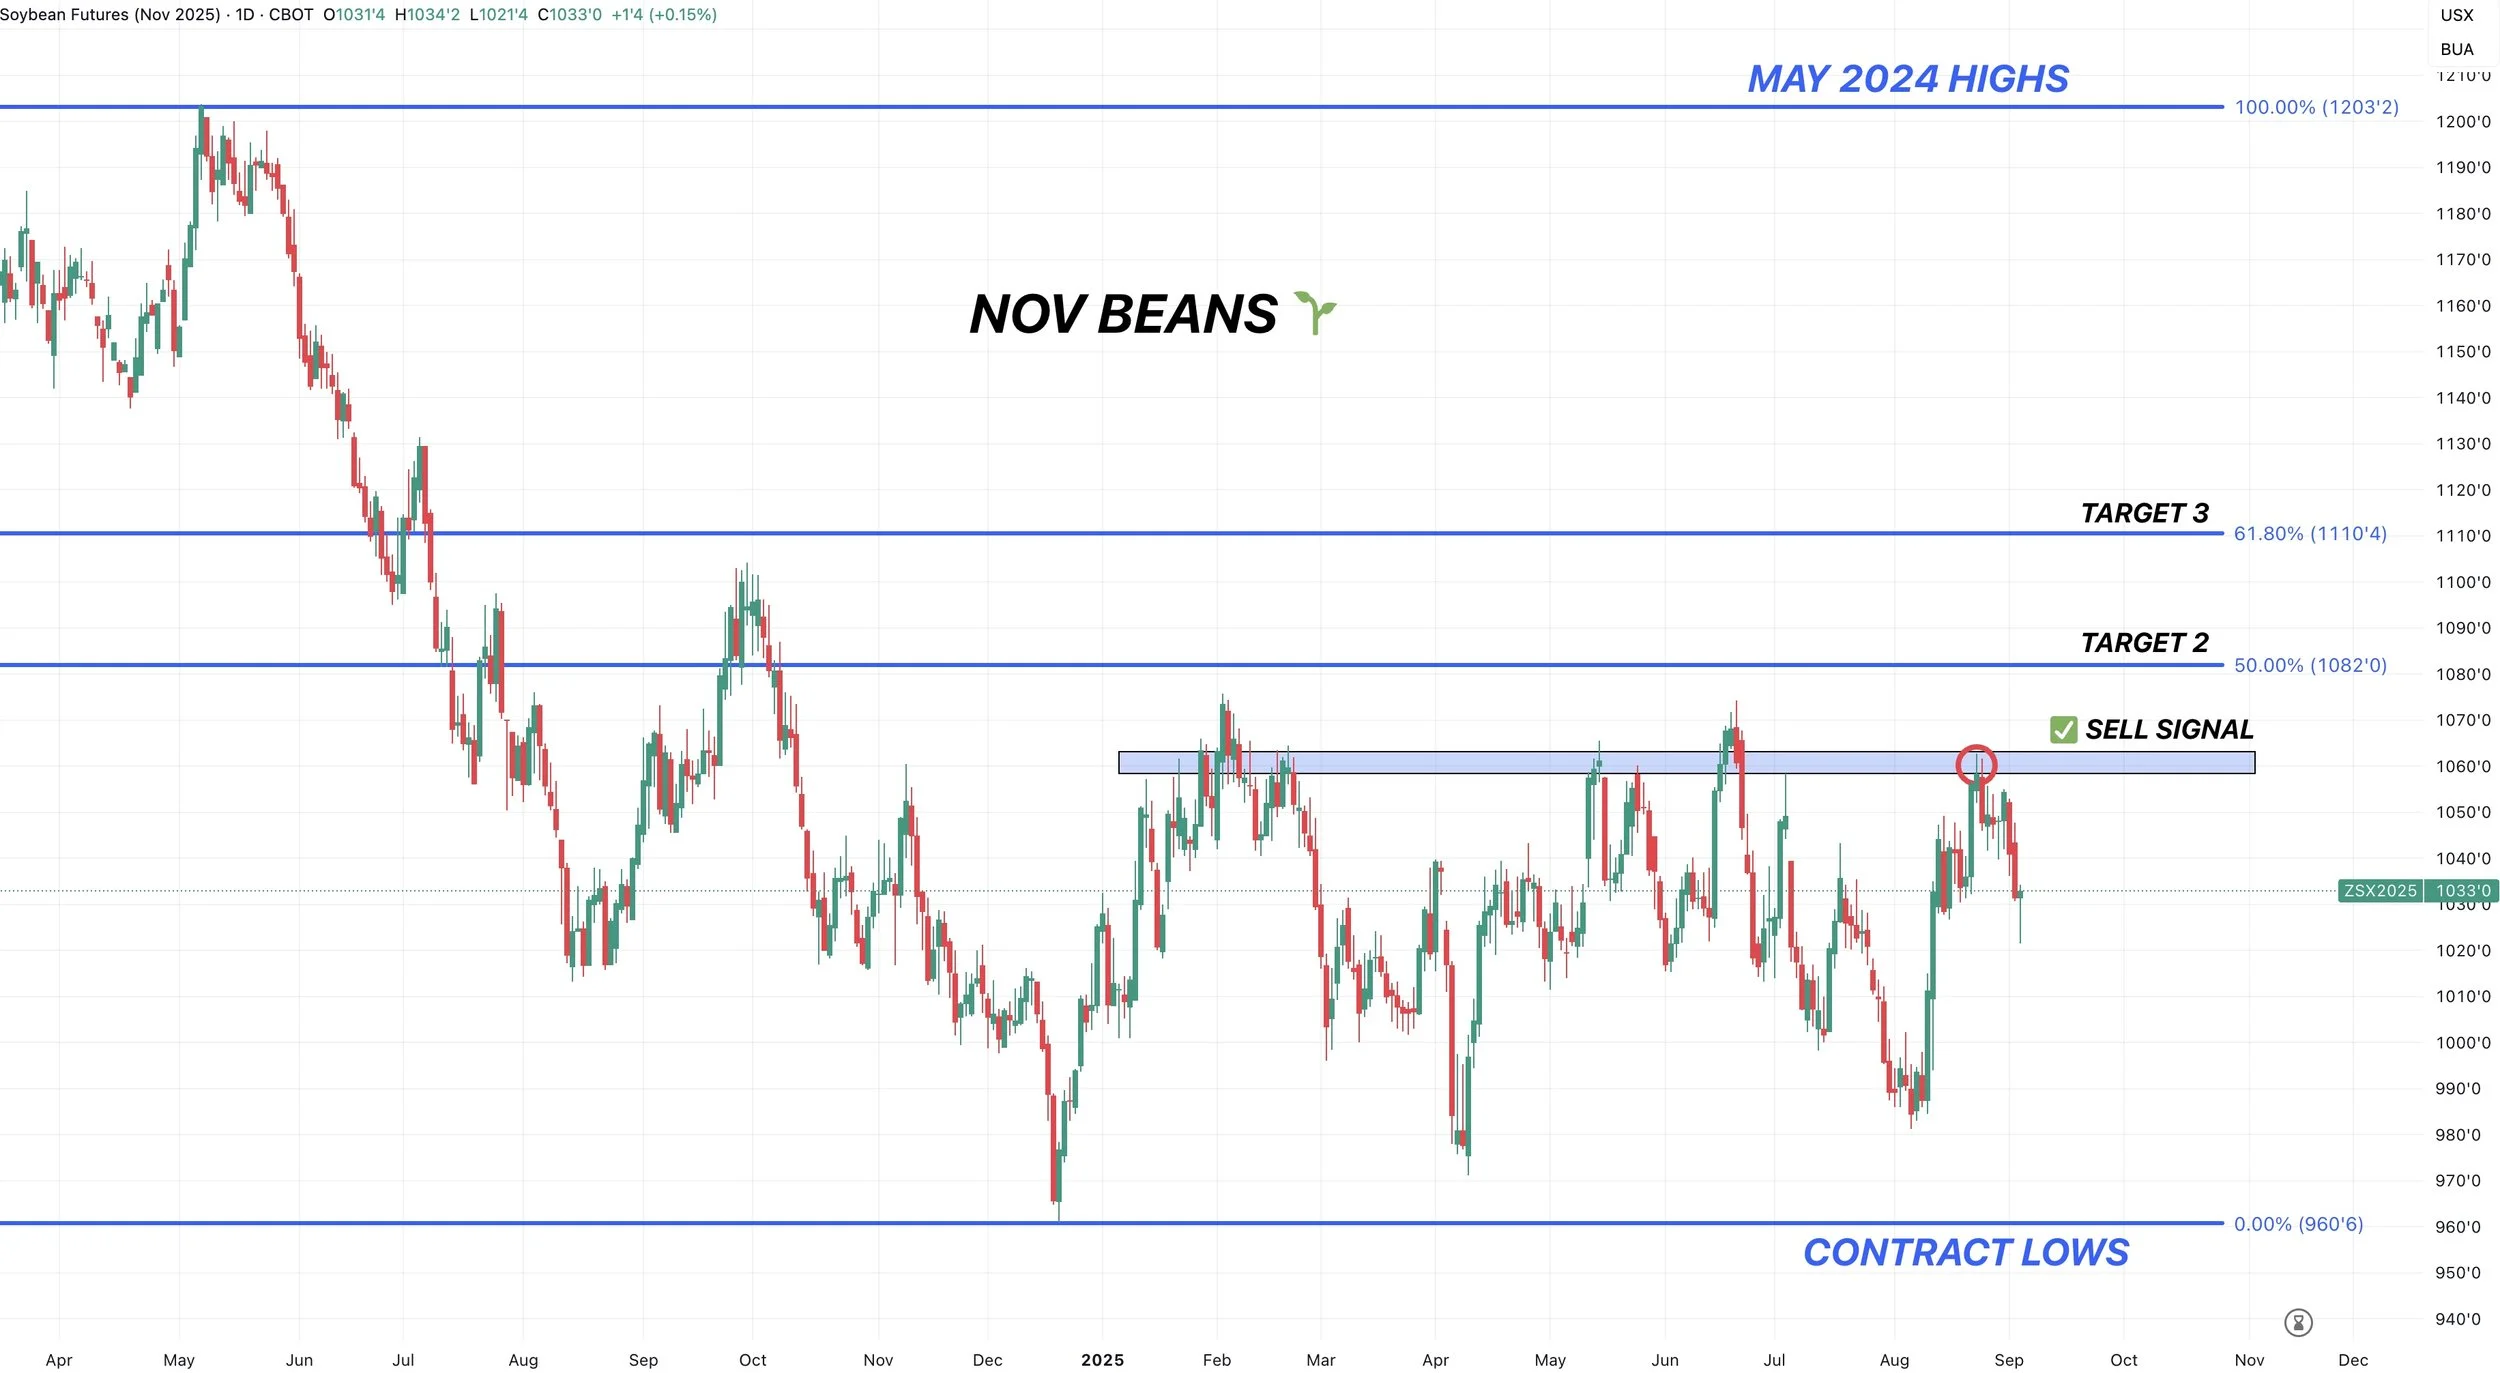
August 22nd we had a sell signal & hedge alert at the highs.
The next target to de-risk further is still going to be $10.82 as of now.
Wheat
Wheat continues to be the dog of the grains.
Nothing new fundamentally.
Demand has been amazing lately. We're extremely competitive on the export markets. Yet we continue to struggle.
Here is the US stocks to use ratio.
It's at it's highest levels since 2020.
There is just simply an ample amount of wheat to go around.
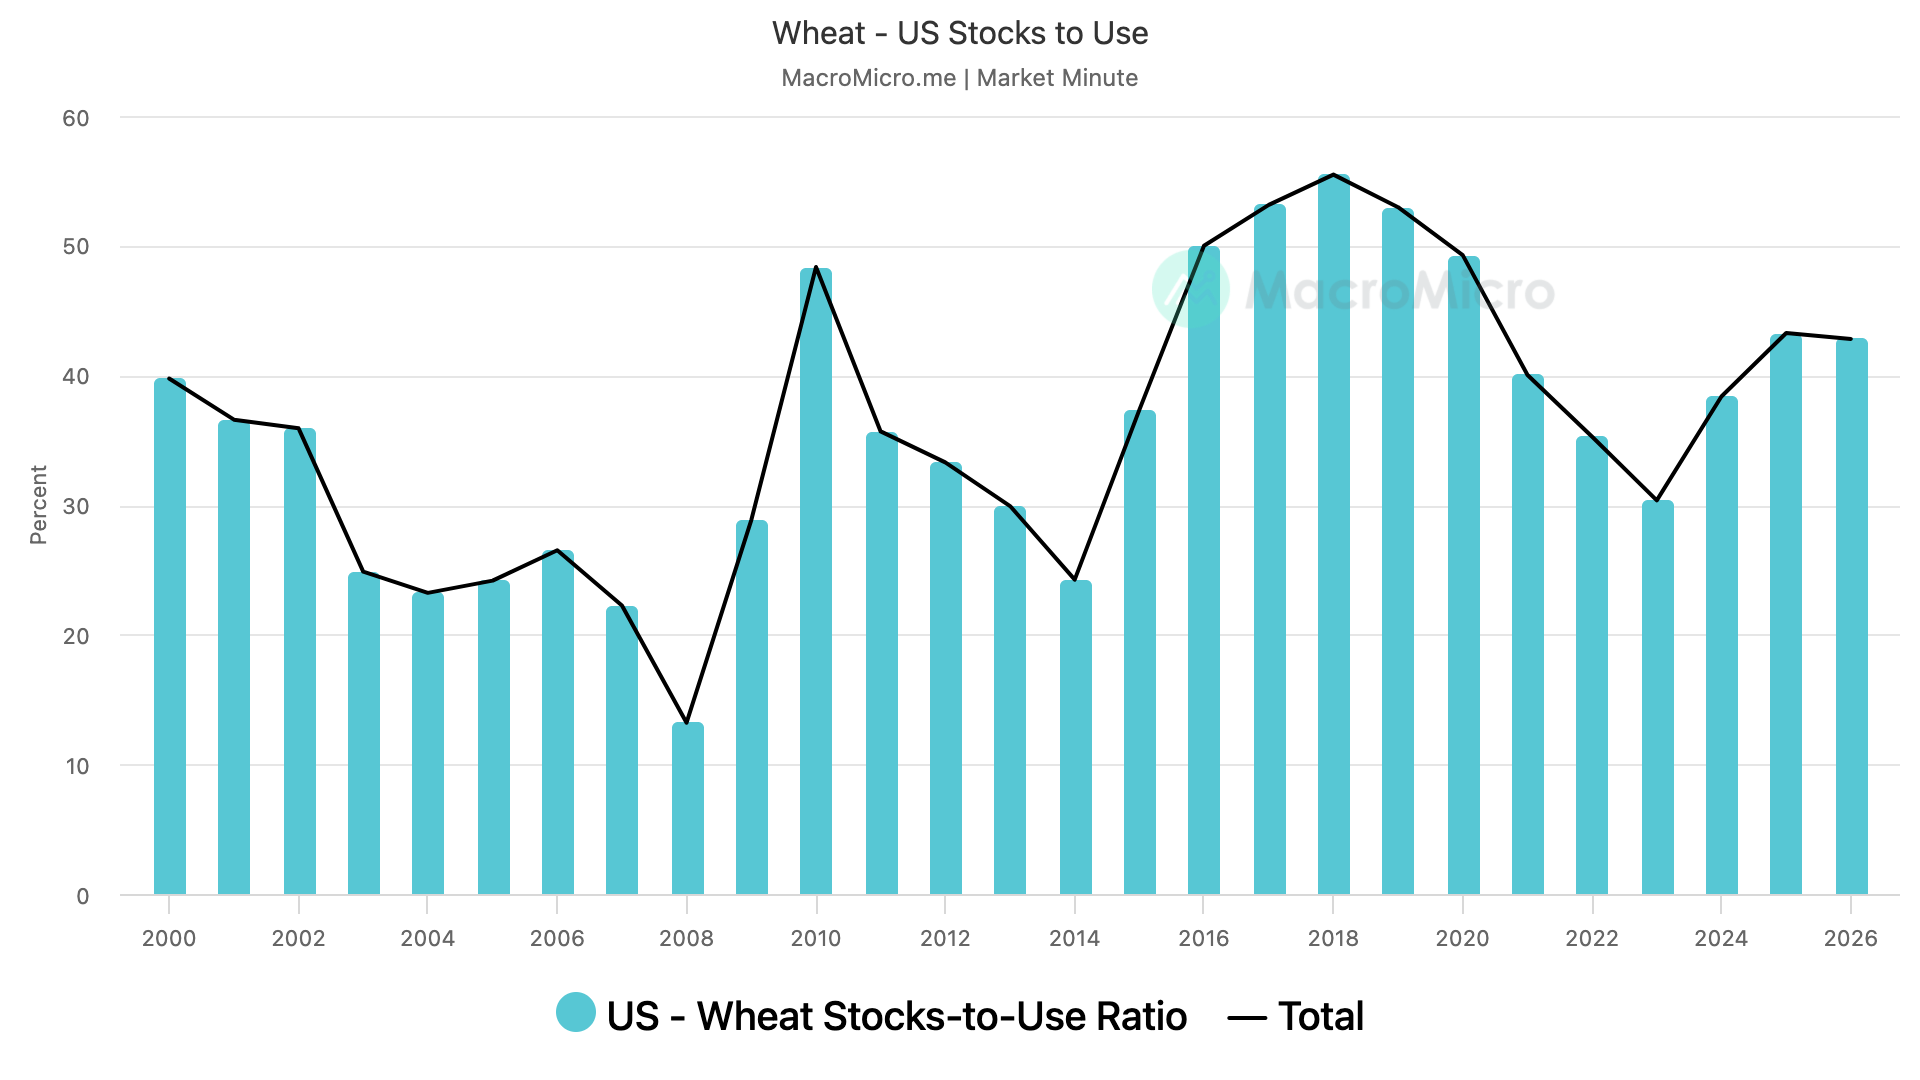
Despite not having a true bullish catalyst.
I do still think the wheat market catches a bid down here eventually.
Seasonally, we put in our lows here.
The funds recently bought for the first time since June.
Although there isn’t a reason to be mega bullish, I find it very hard to get bearish at these price levels.
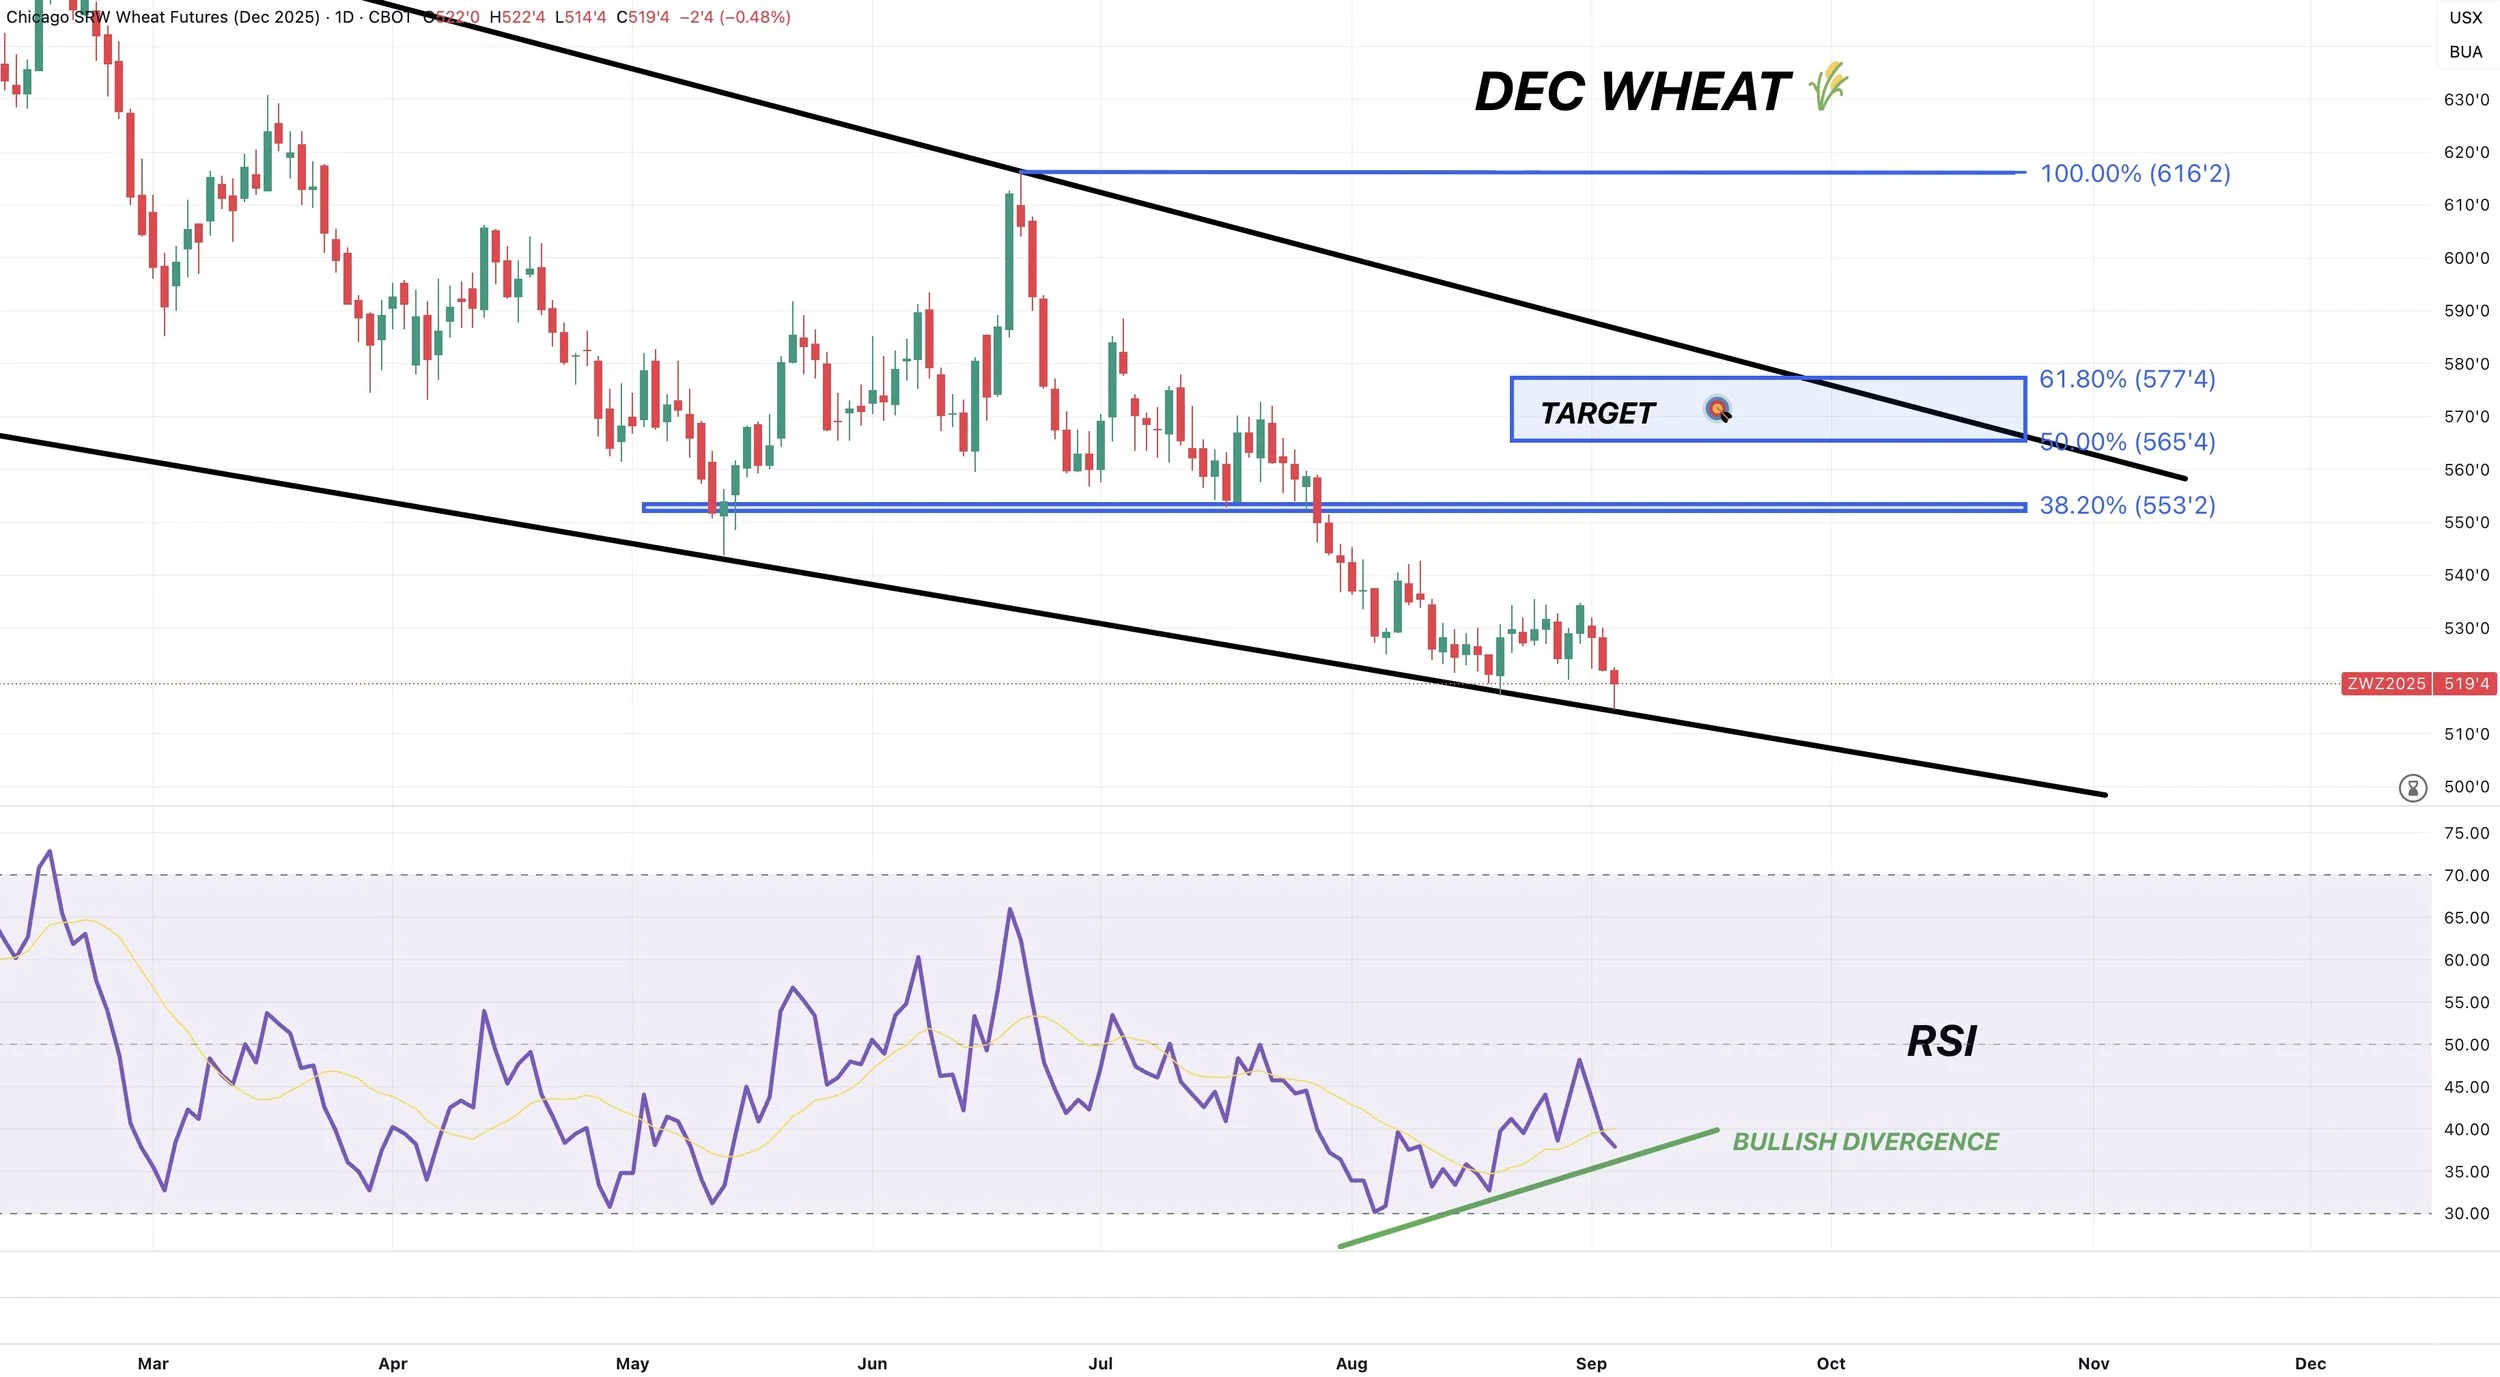
Daily Chicago:
We bounced at the bottom of this massive channel once again.
We posted new contract lows today before bouncing nicely off the lows.
A sign of a "potential" bear trap.
If we can clear $5.35 it will be a good indication we are headed higher.
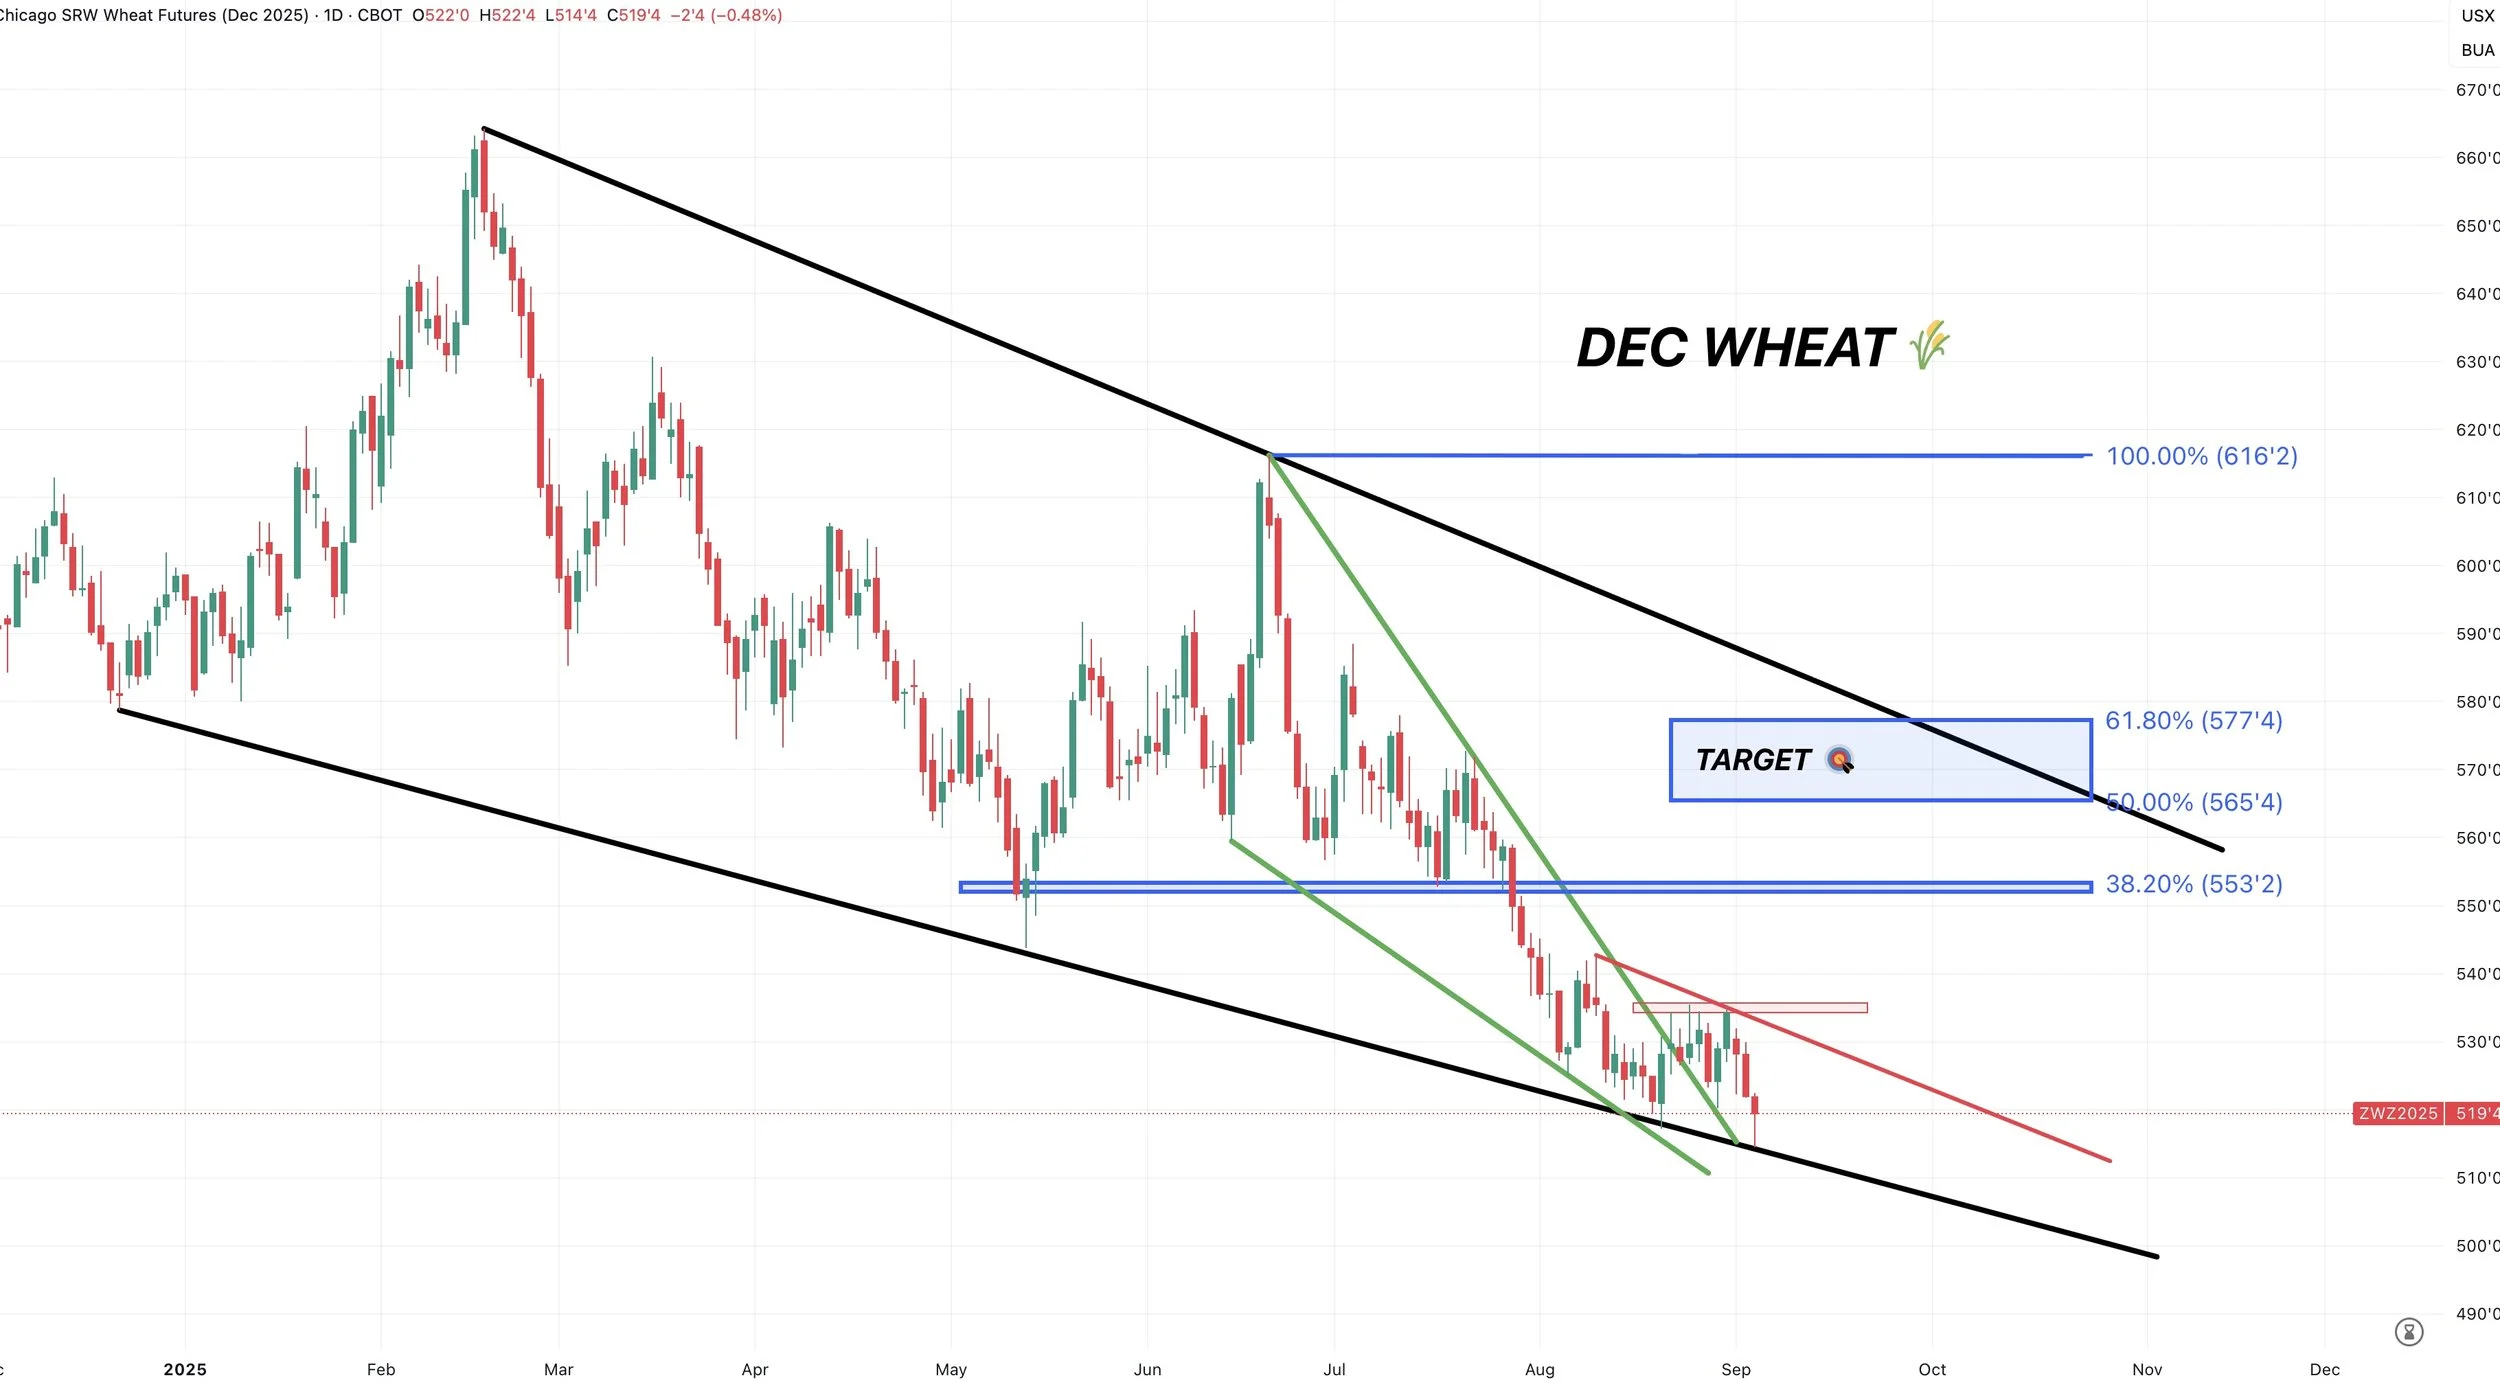
We are showing some very clear signs of bullish divergence here.
Prices made new lows.
The RSI did not.
This suggests downside momentum is getting weaker.
Remember how the seasonals had us topping in October?
That thought process also lines up with this chart.
Every 4 months the wheat market has provided an opportunity.
I'd like to think it happens again.

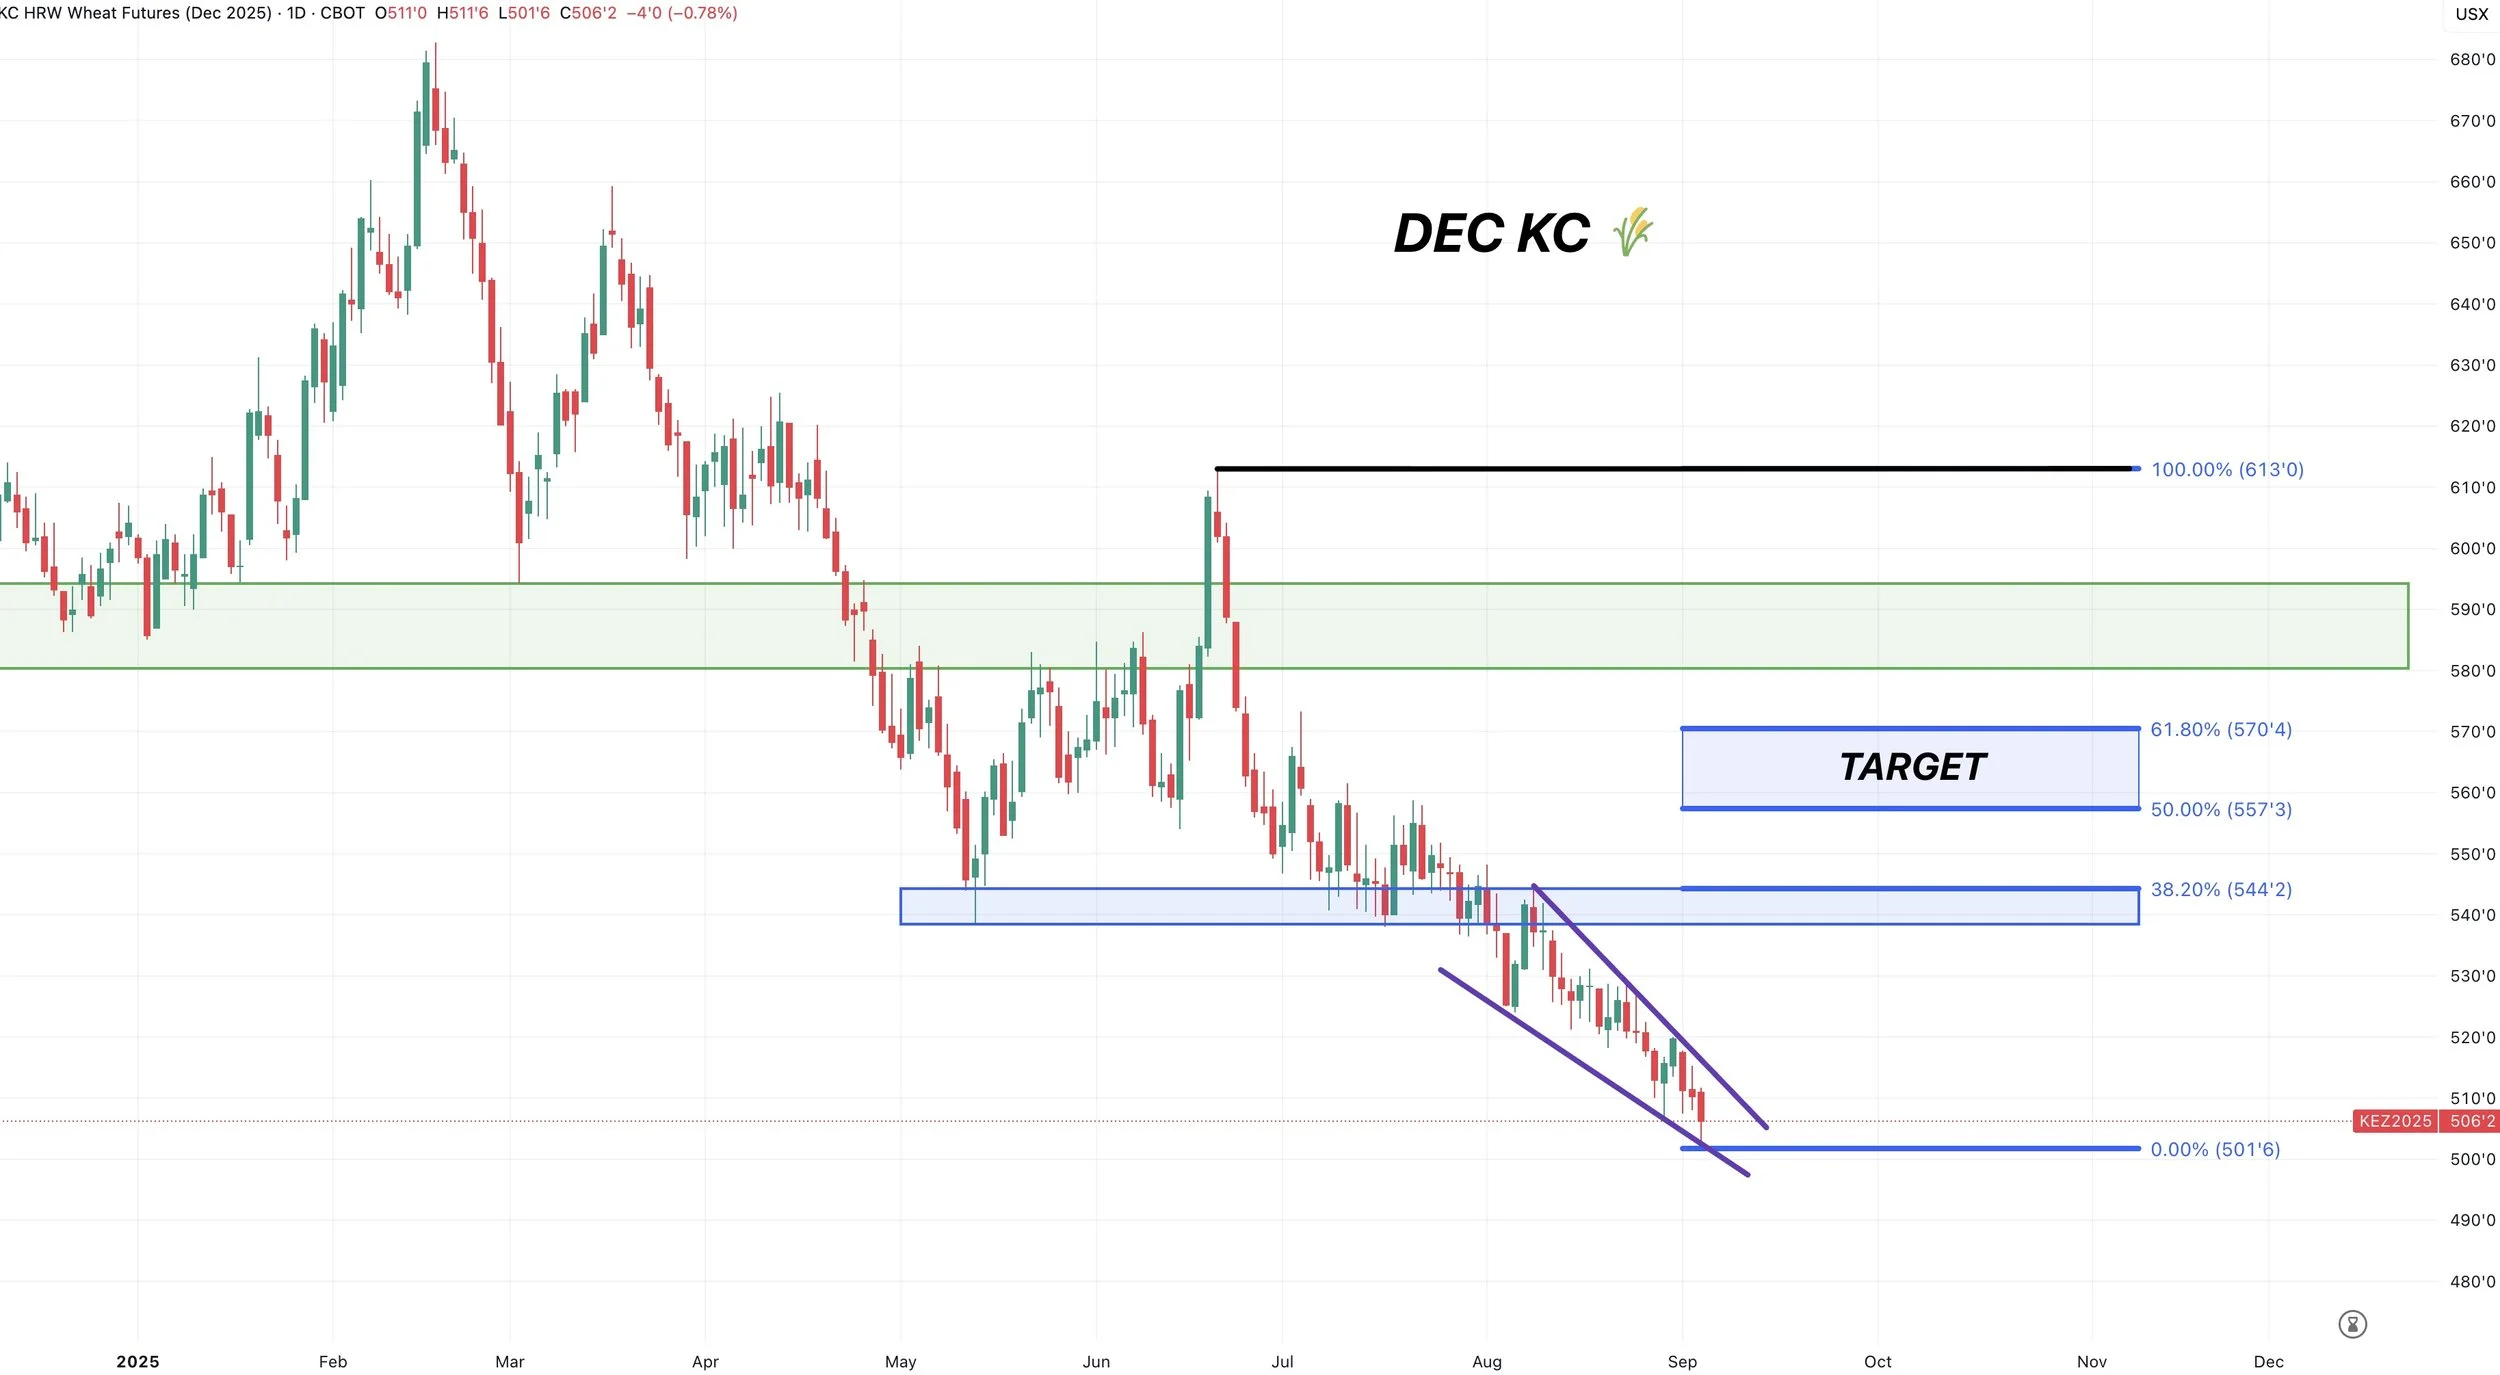
Daily KC Wheat:
Nothing to update here.
Waiting patiently for a break out.
First real resistance is all the way at $5.40 or so.
Cattle
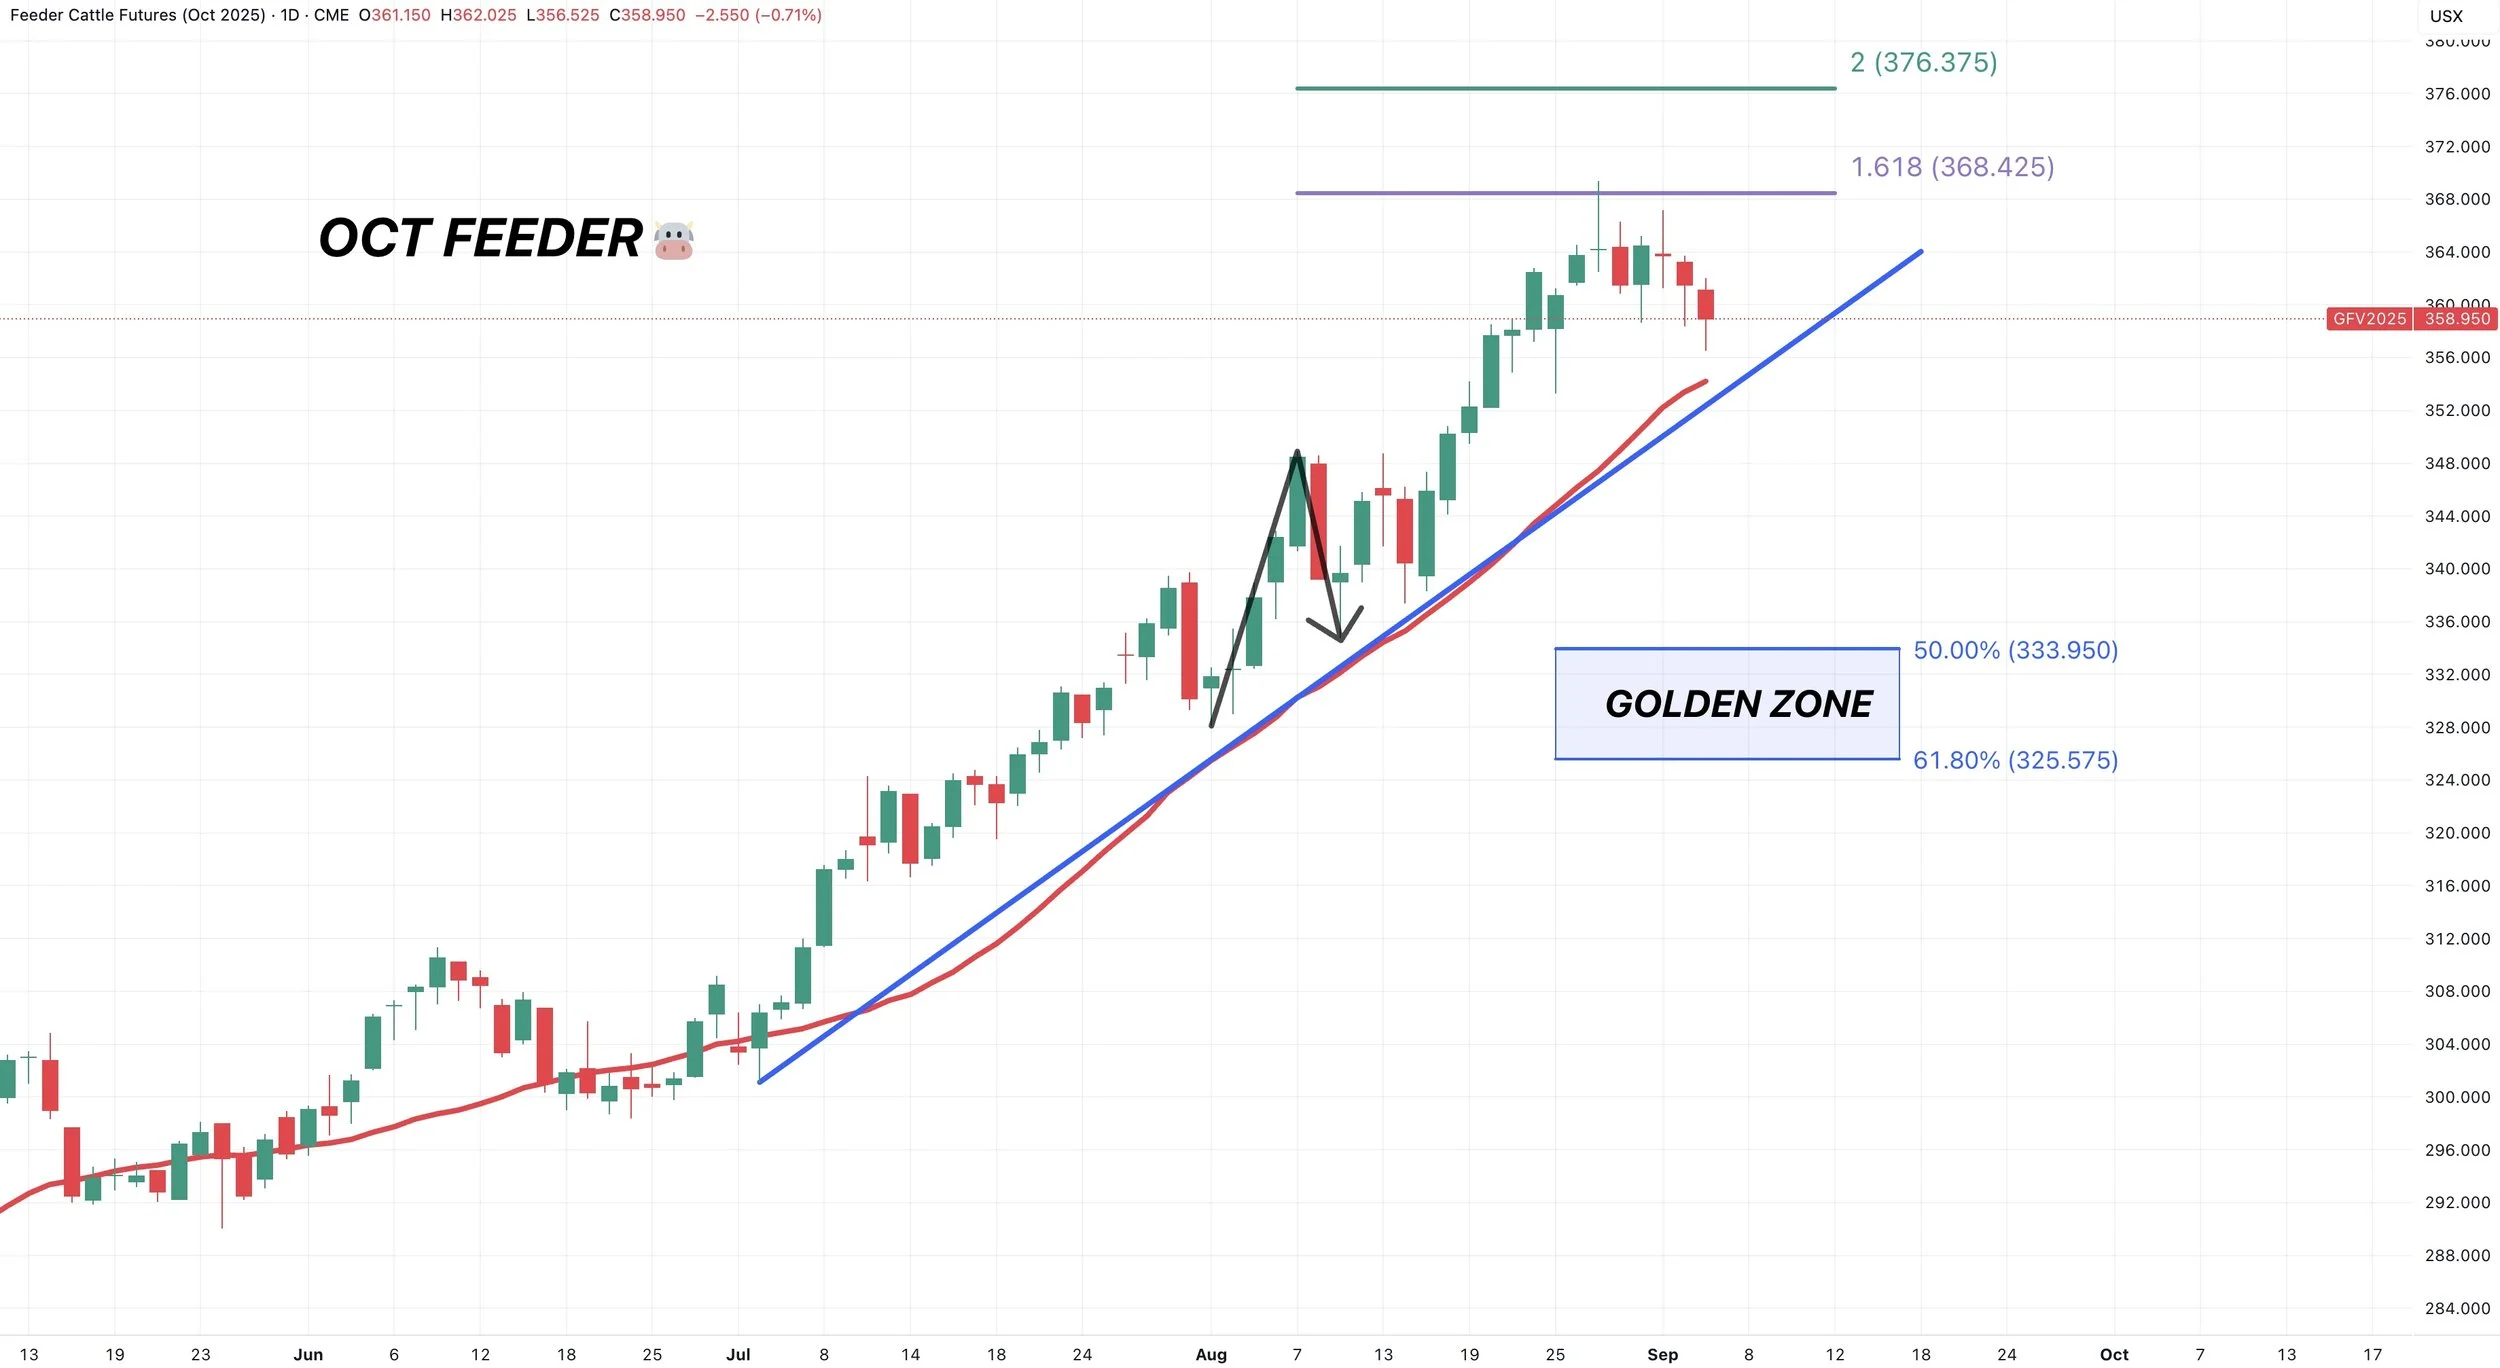
Oct Feeder:
We closed lower for 3 days in a row.
This is the first time we have seen this in 3 months.
I do view this as a potential sign our local top is in.
Am I saying the bull market is over? No of course not. But a simple correction shouldn’t come as a surprise.
Nobody knows if this is THE top of just another mini top before the dip gets bought.
We rejected the golden fib extension.
We have not closed below the 20-day MA since June (red line).
If we do, that could open the door lower.
If we head lower, the target is the blue box.
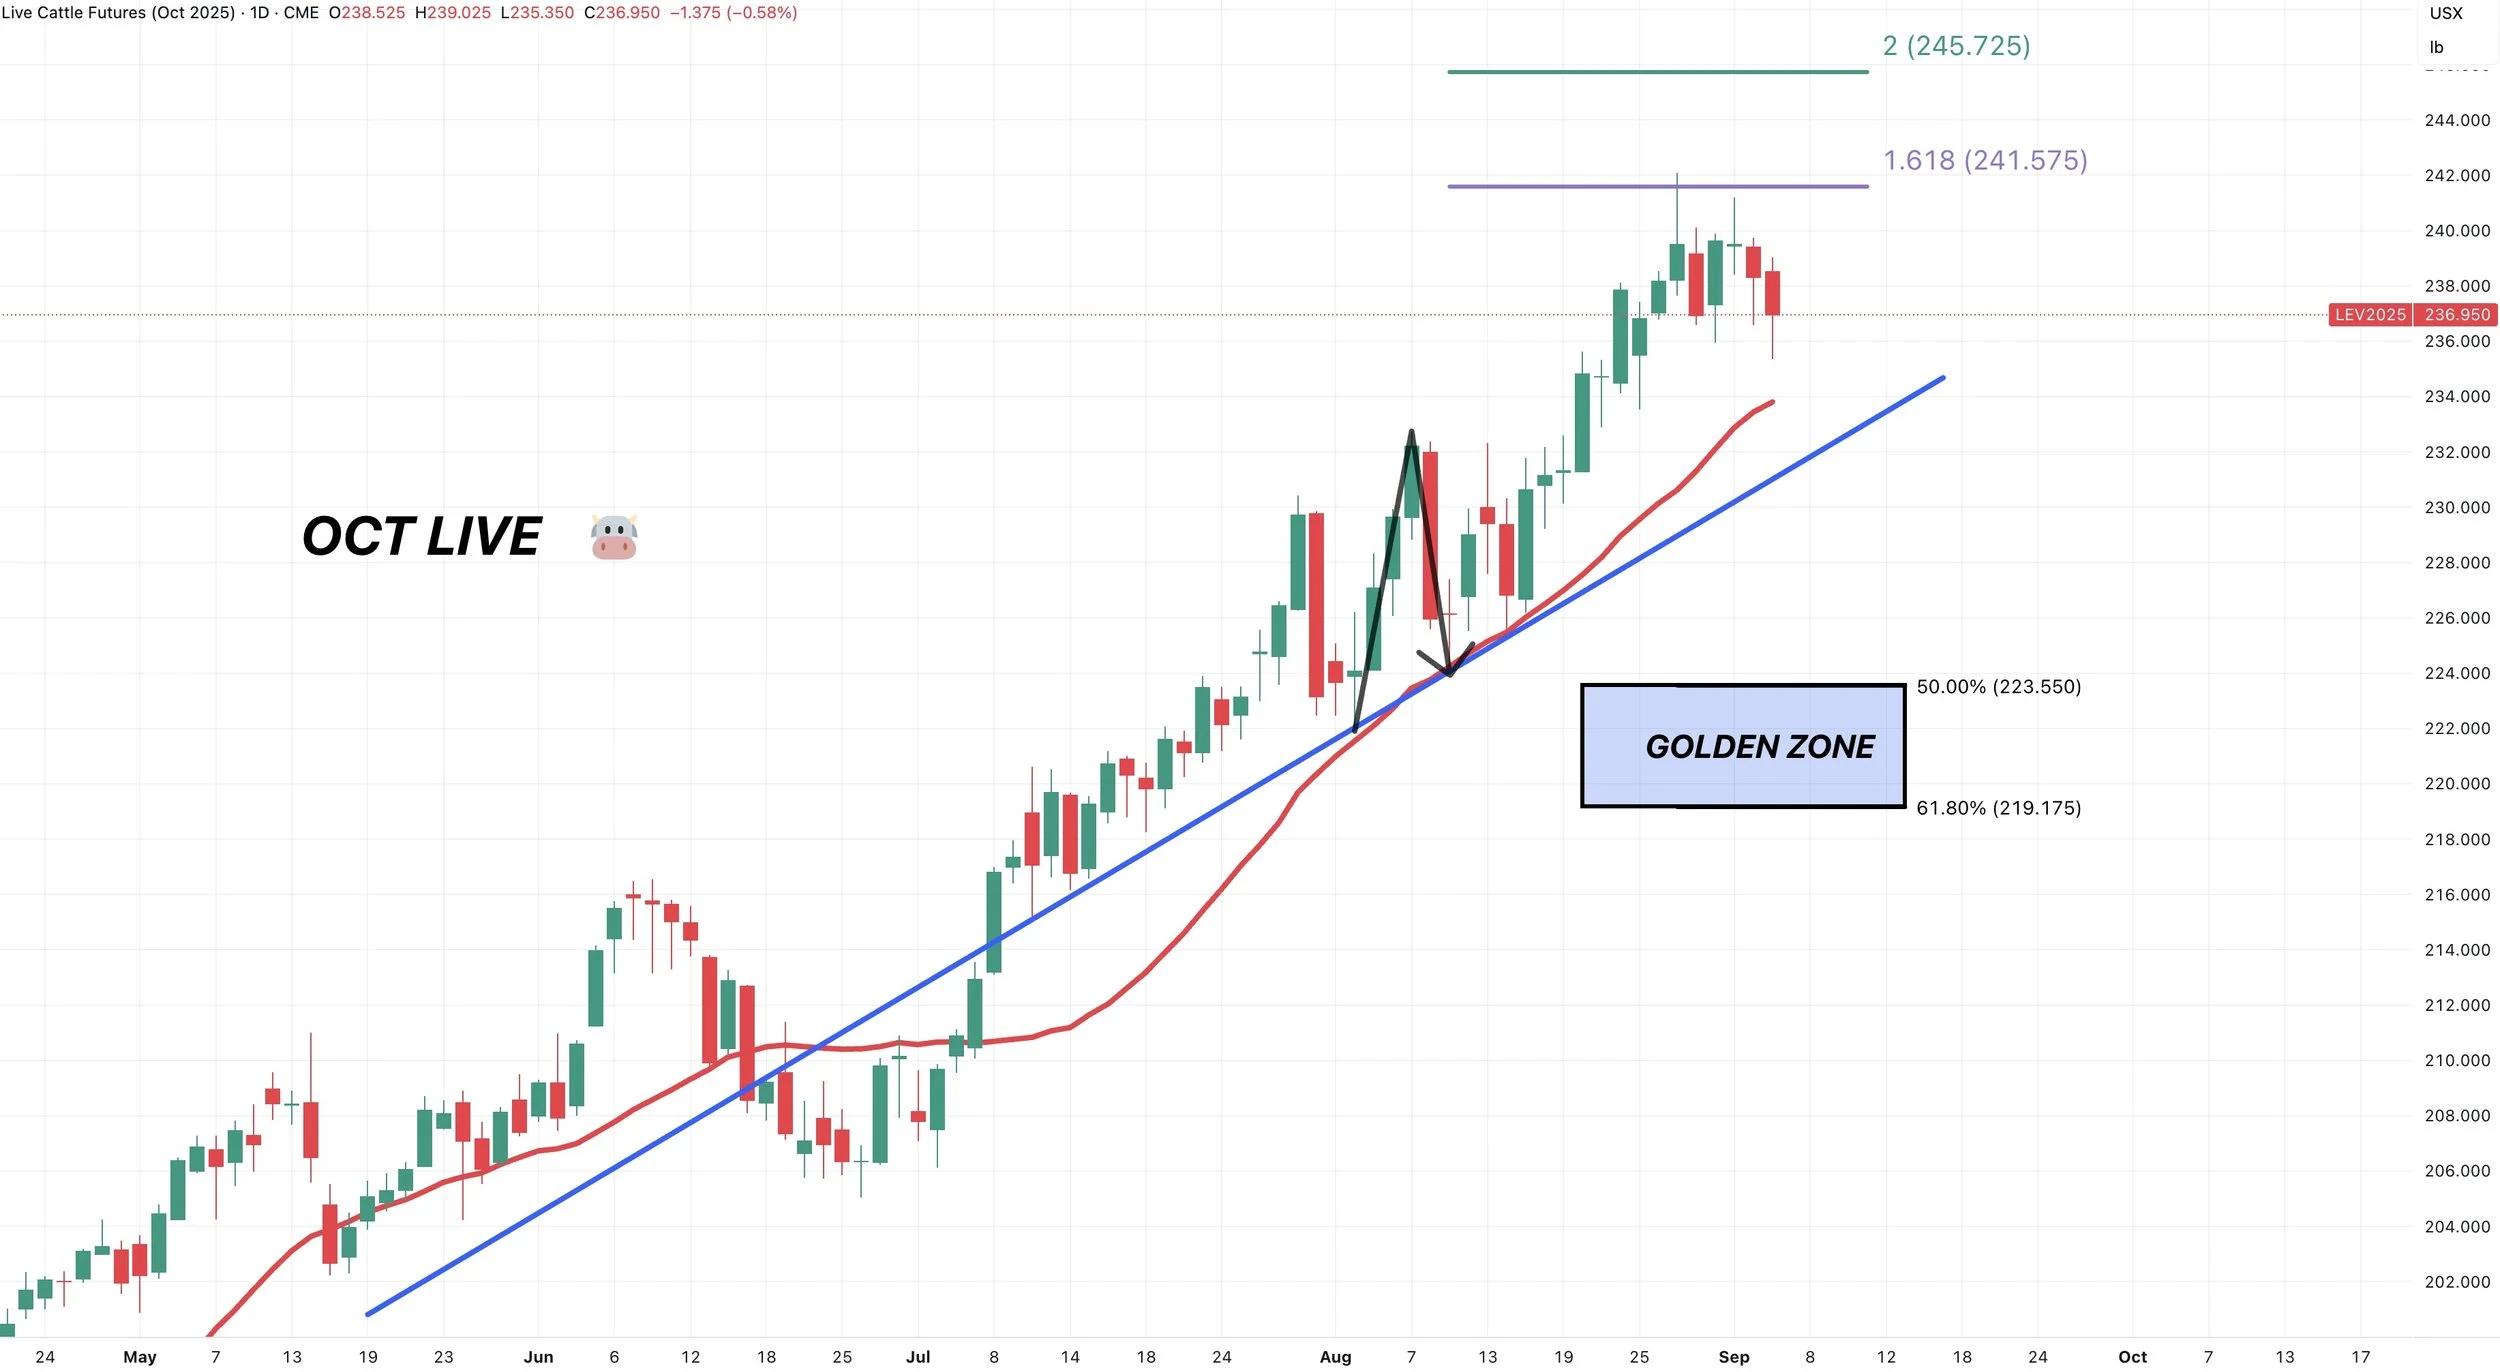
Oct Live:
Also rejected the golden fib.
Downside target if we get a true correction is the blue box.
Past Sell or Protection Signals
Aug 22nd: 🌱
Soybean sell signal & hedge alert.
July 31st: 🐮
Cattle sell signal & hedge alert.
July 10th: 🐮
Cattle sell signal & hedge alert.
CLICK HERE TO VIEW
June 5th: 🐮
Cattle sell signal & hedge alert.
June 2nd: 🌾
MPLS wheat sell signal.
April 10th: 🌽
Old crop corn sell signal.
March 19th: 🐮
Cattle hedge & sell signal.
Feb 18th: 🌽 🌾
Old crop KC wheat & old crop corn signal.
Jan 23rd: 🌽 🌱
Corn & beans old crop sell signal.
CLICK HERE TO VIEW
Jan 15th: 🌽 🌱
Corn & beans hedge alert/sell signal.
Jan 2nd: 🐮
Cattle hedge alert at new all-time highs & target.
Dec 11th: 🌽
Corn sell signal at $4.51 200-day MA
CLICK HERE TO VIEW
Oct 2nd: 🌾
Wheat sell signal at $6.12 target
Sep 30th: 🌽
Corn protection signal at $4.23-26
Sep 27th: 🌱
Soybean sell & protection signal at $10.65
Sep 13th: 🌾
Wheat sell signal at $5.98
May 22nd: 🌾
Wheat sell signal when wheat traded +$7.00
Want to Talk?
Our phones are open 24/7 for you guys if you ever need anything or want to discuss your operation.
Hedge Account
Interested in a hedge account? Use the link below to set up an account or shoot Jeremey a call at (605)295-3100.