
USDA BREAKDOWN. LOWEST RESPONSES EVER?
MARKET UPDATE
You can scroll to read the usual update as well. As the written version is the exact same as the video.
Timestamps for video:
Overview: 0:00min
Corn: 1:55min
Beans: 8:30min
Wheat: 10:20min
Cattle: 13:35min
Want to talk?
Office: (806)484-1214
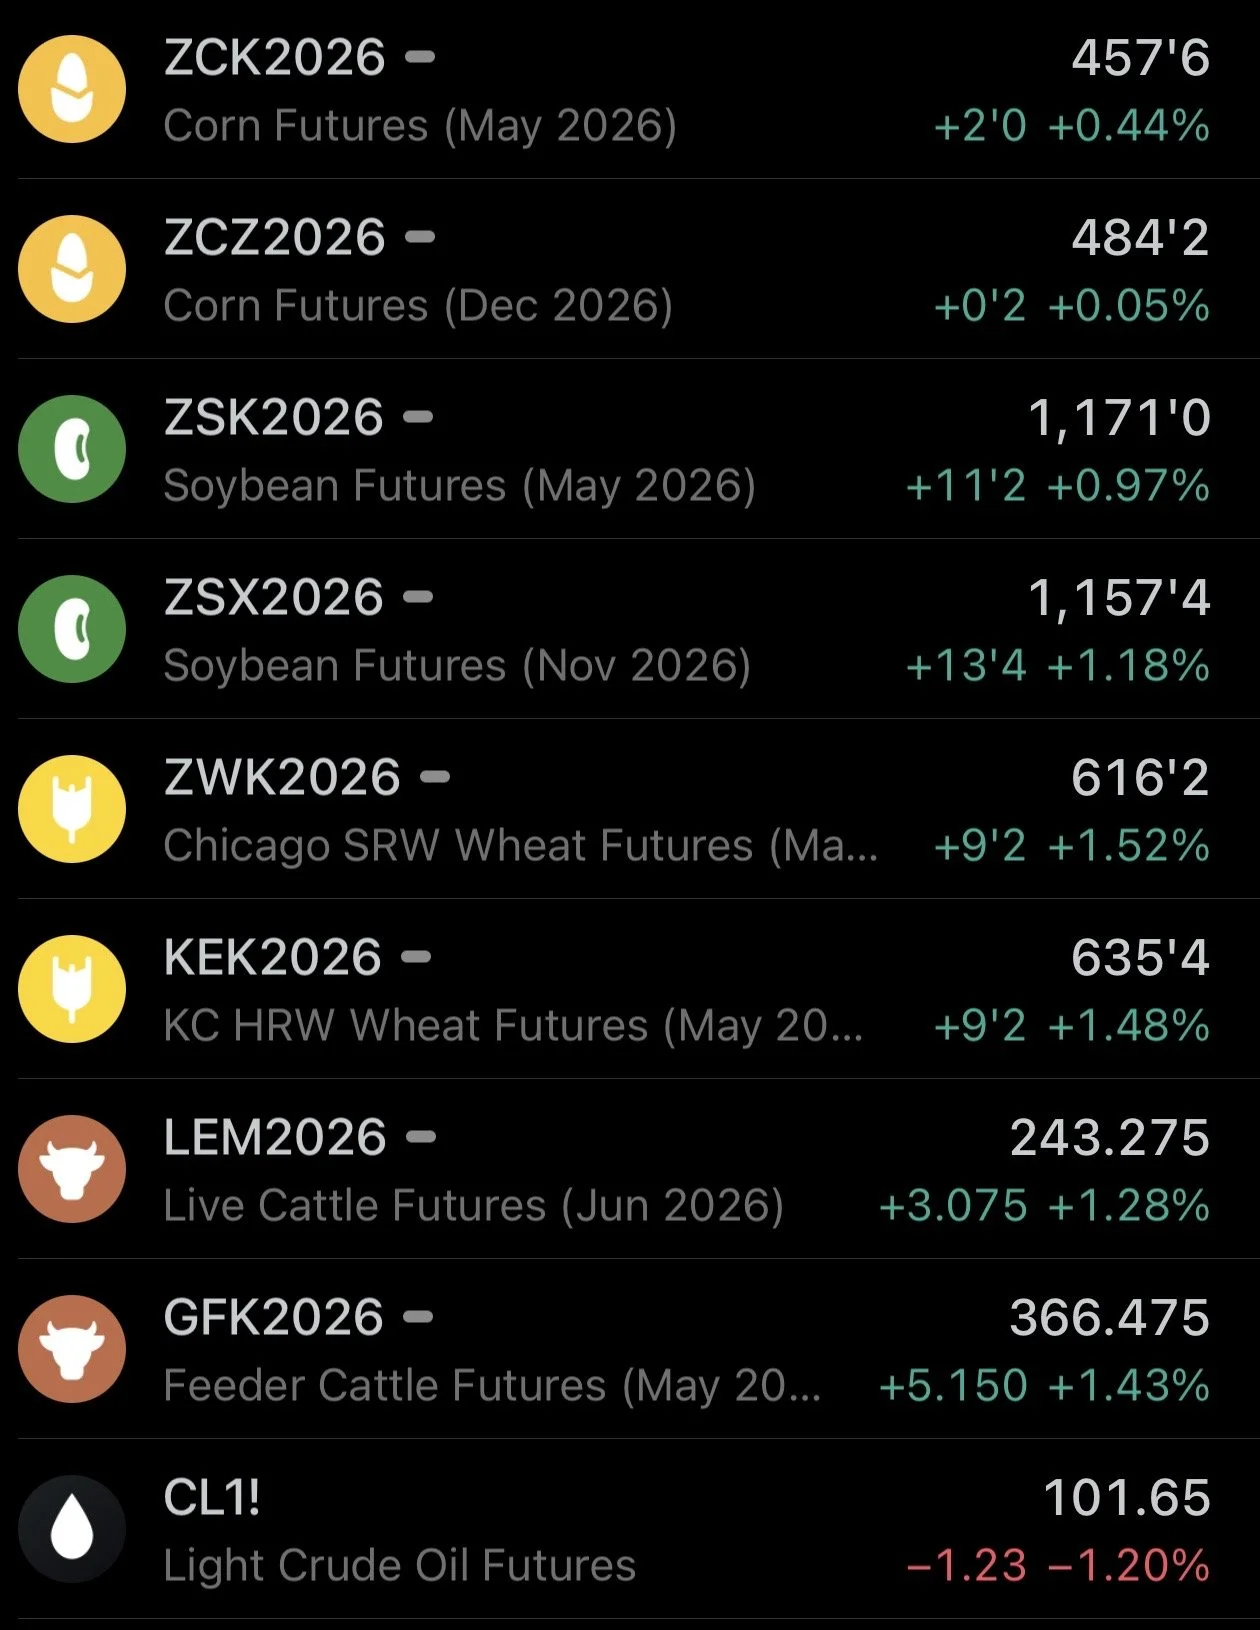
Futures Prices Close
Overview
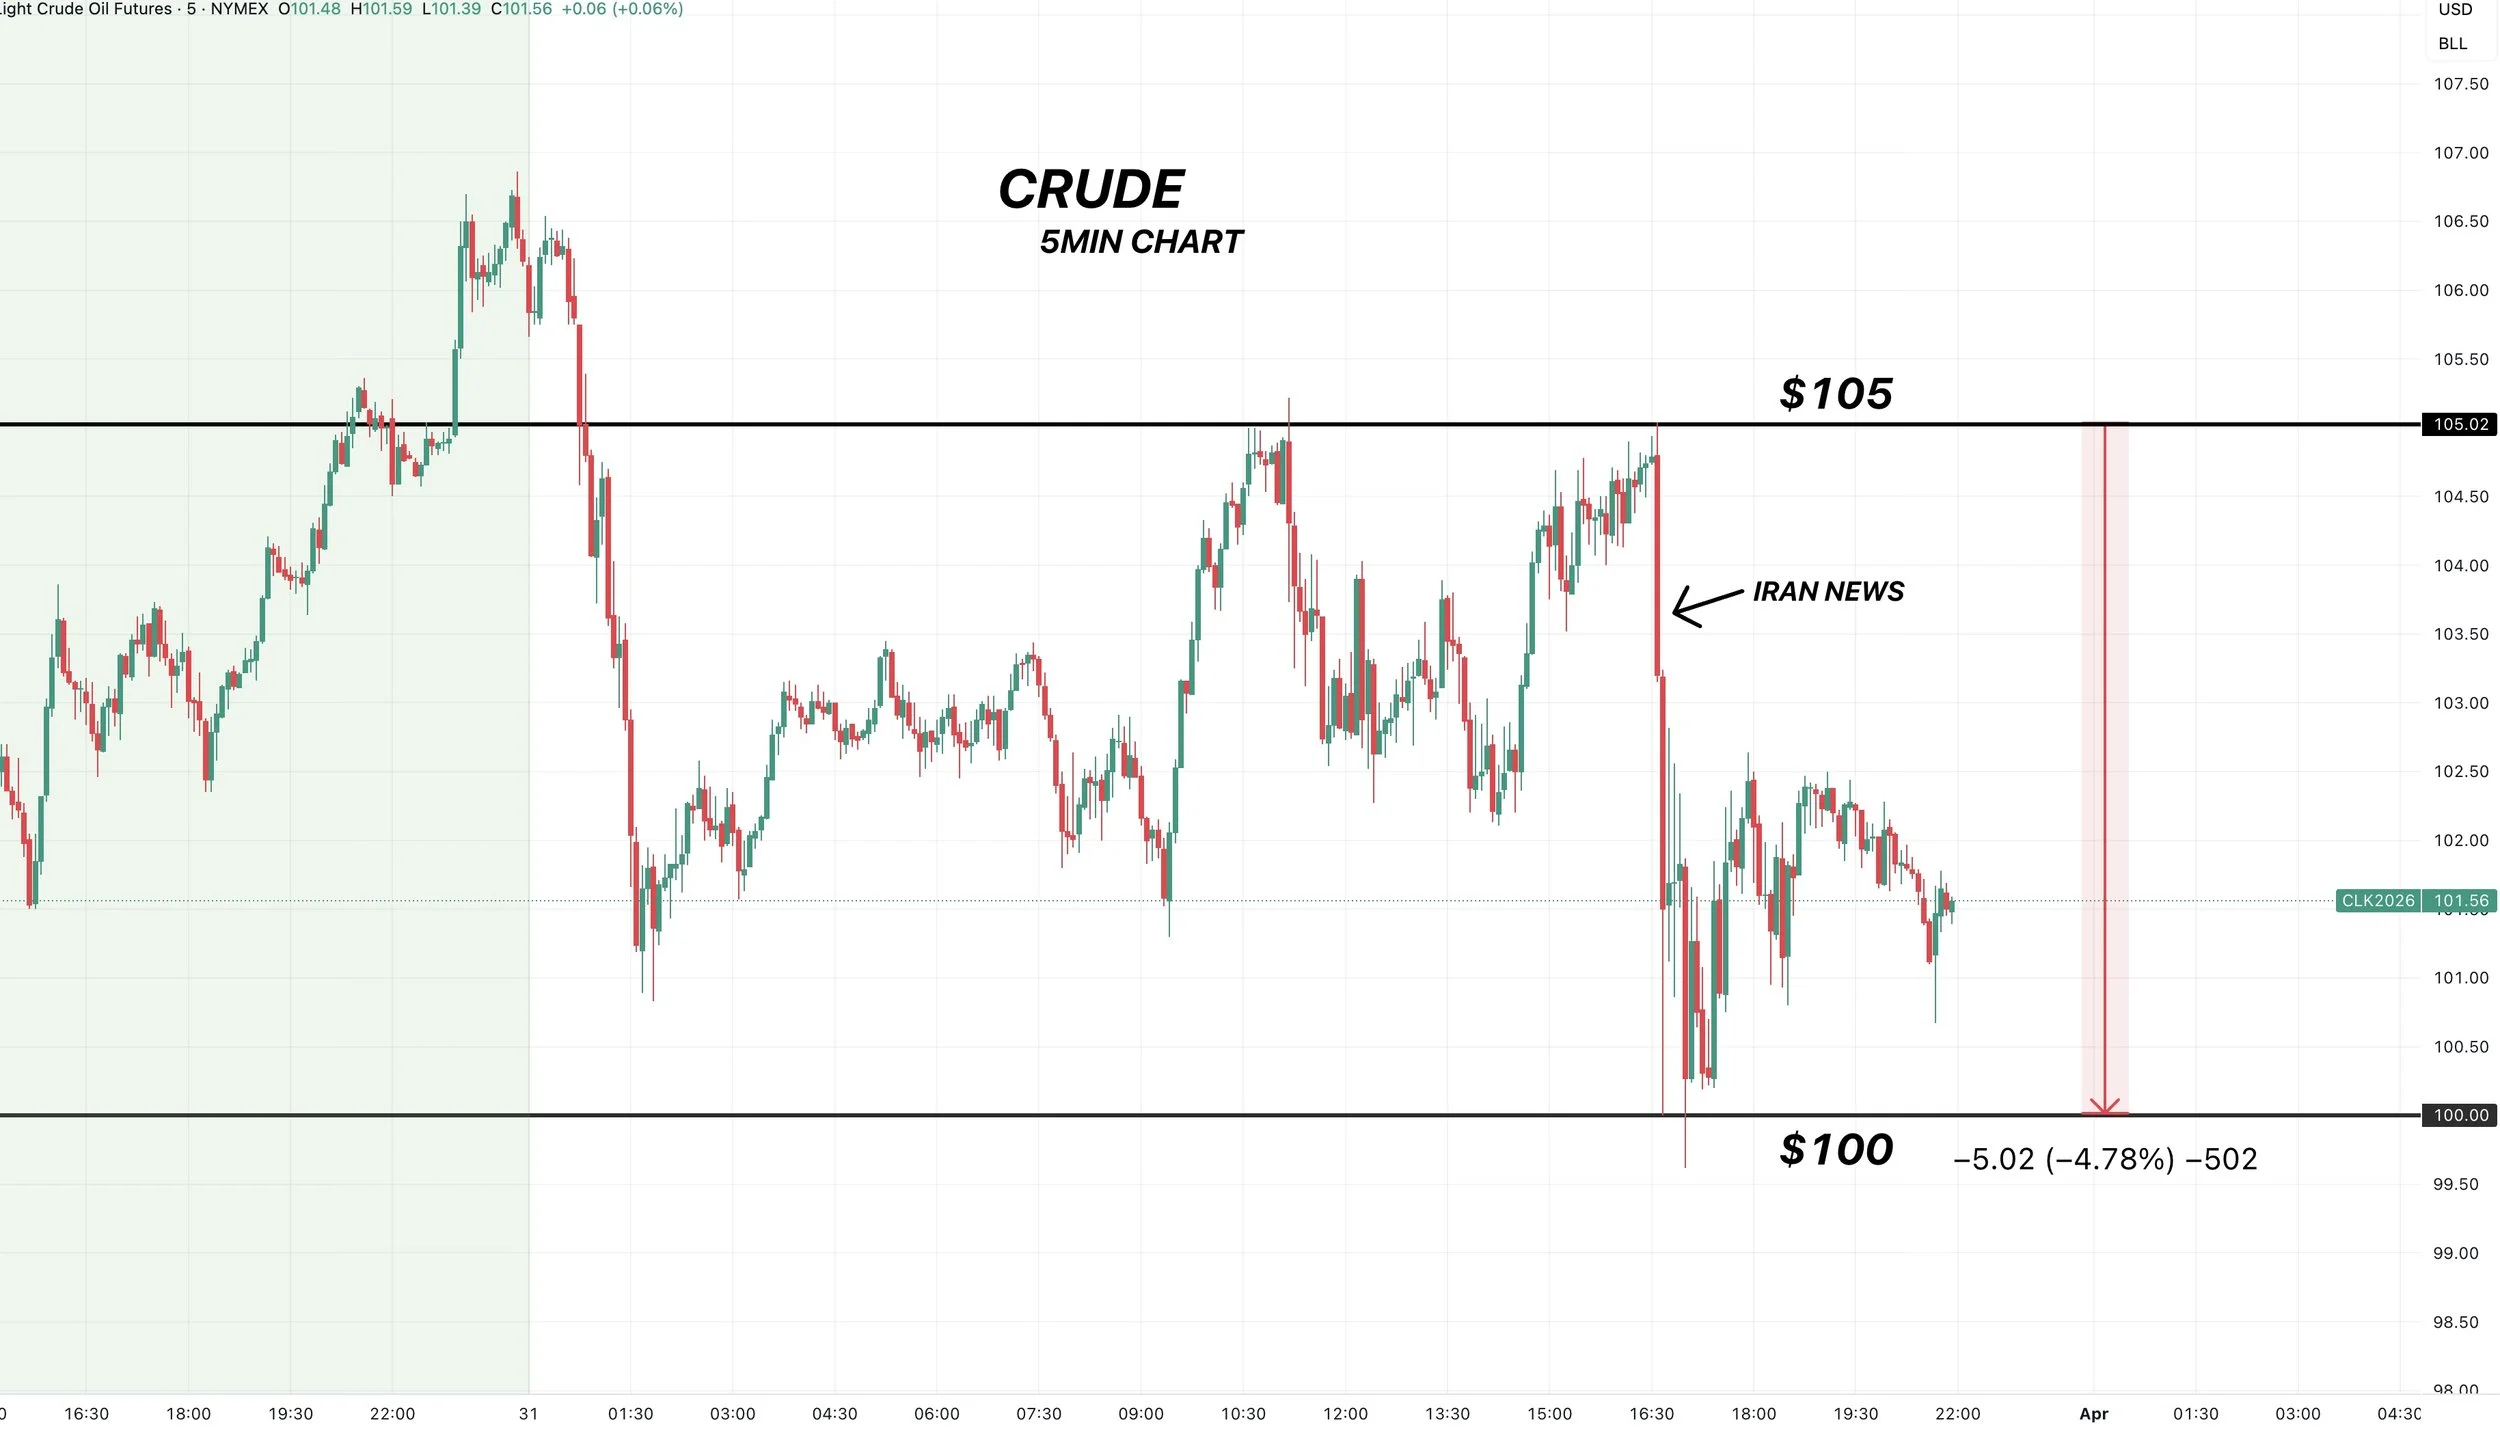
Solid day across the board for grains as well as cattle. Meanwhile, crude oil continues to be extremely volatile, as we closed above $100 a barrel yesterday for the first time since 2022.
Today was of course all about the USDA planting intentions and quarterly stocks report.
The market had a positive reaction to the numbers.
However, there was one war headline out today.
Iran's President said that they are ready to end the war if they "receive guarantees."
It was not specified what those guarantees were.

This news led to crude seeing a huge swing.
We were trading as high as $105 a barrel, then when this news came out we dropped below $100 in under 10 minutes.
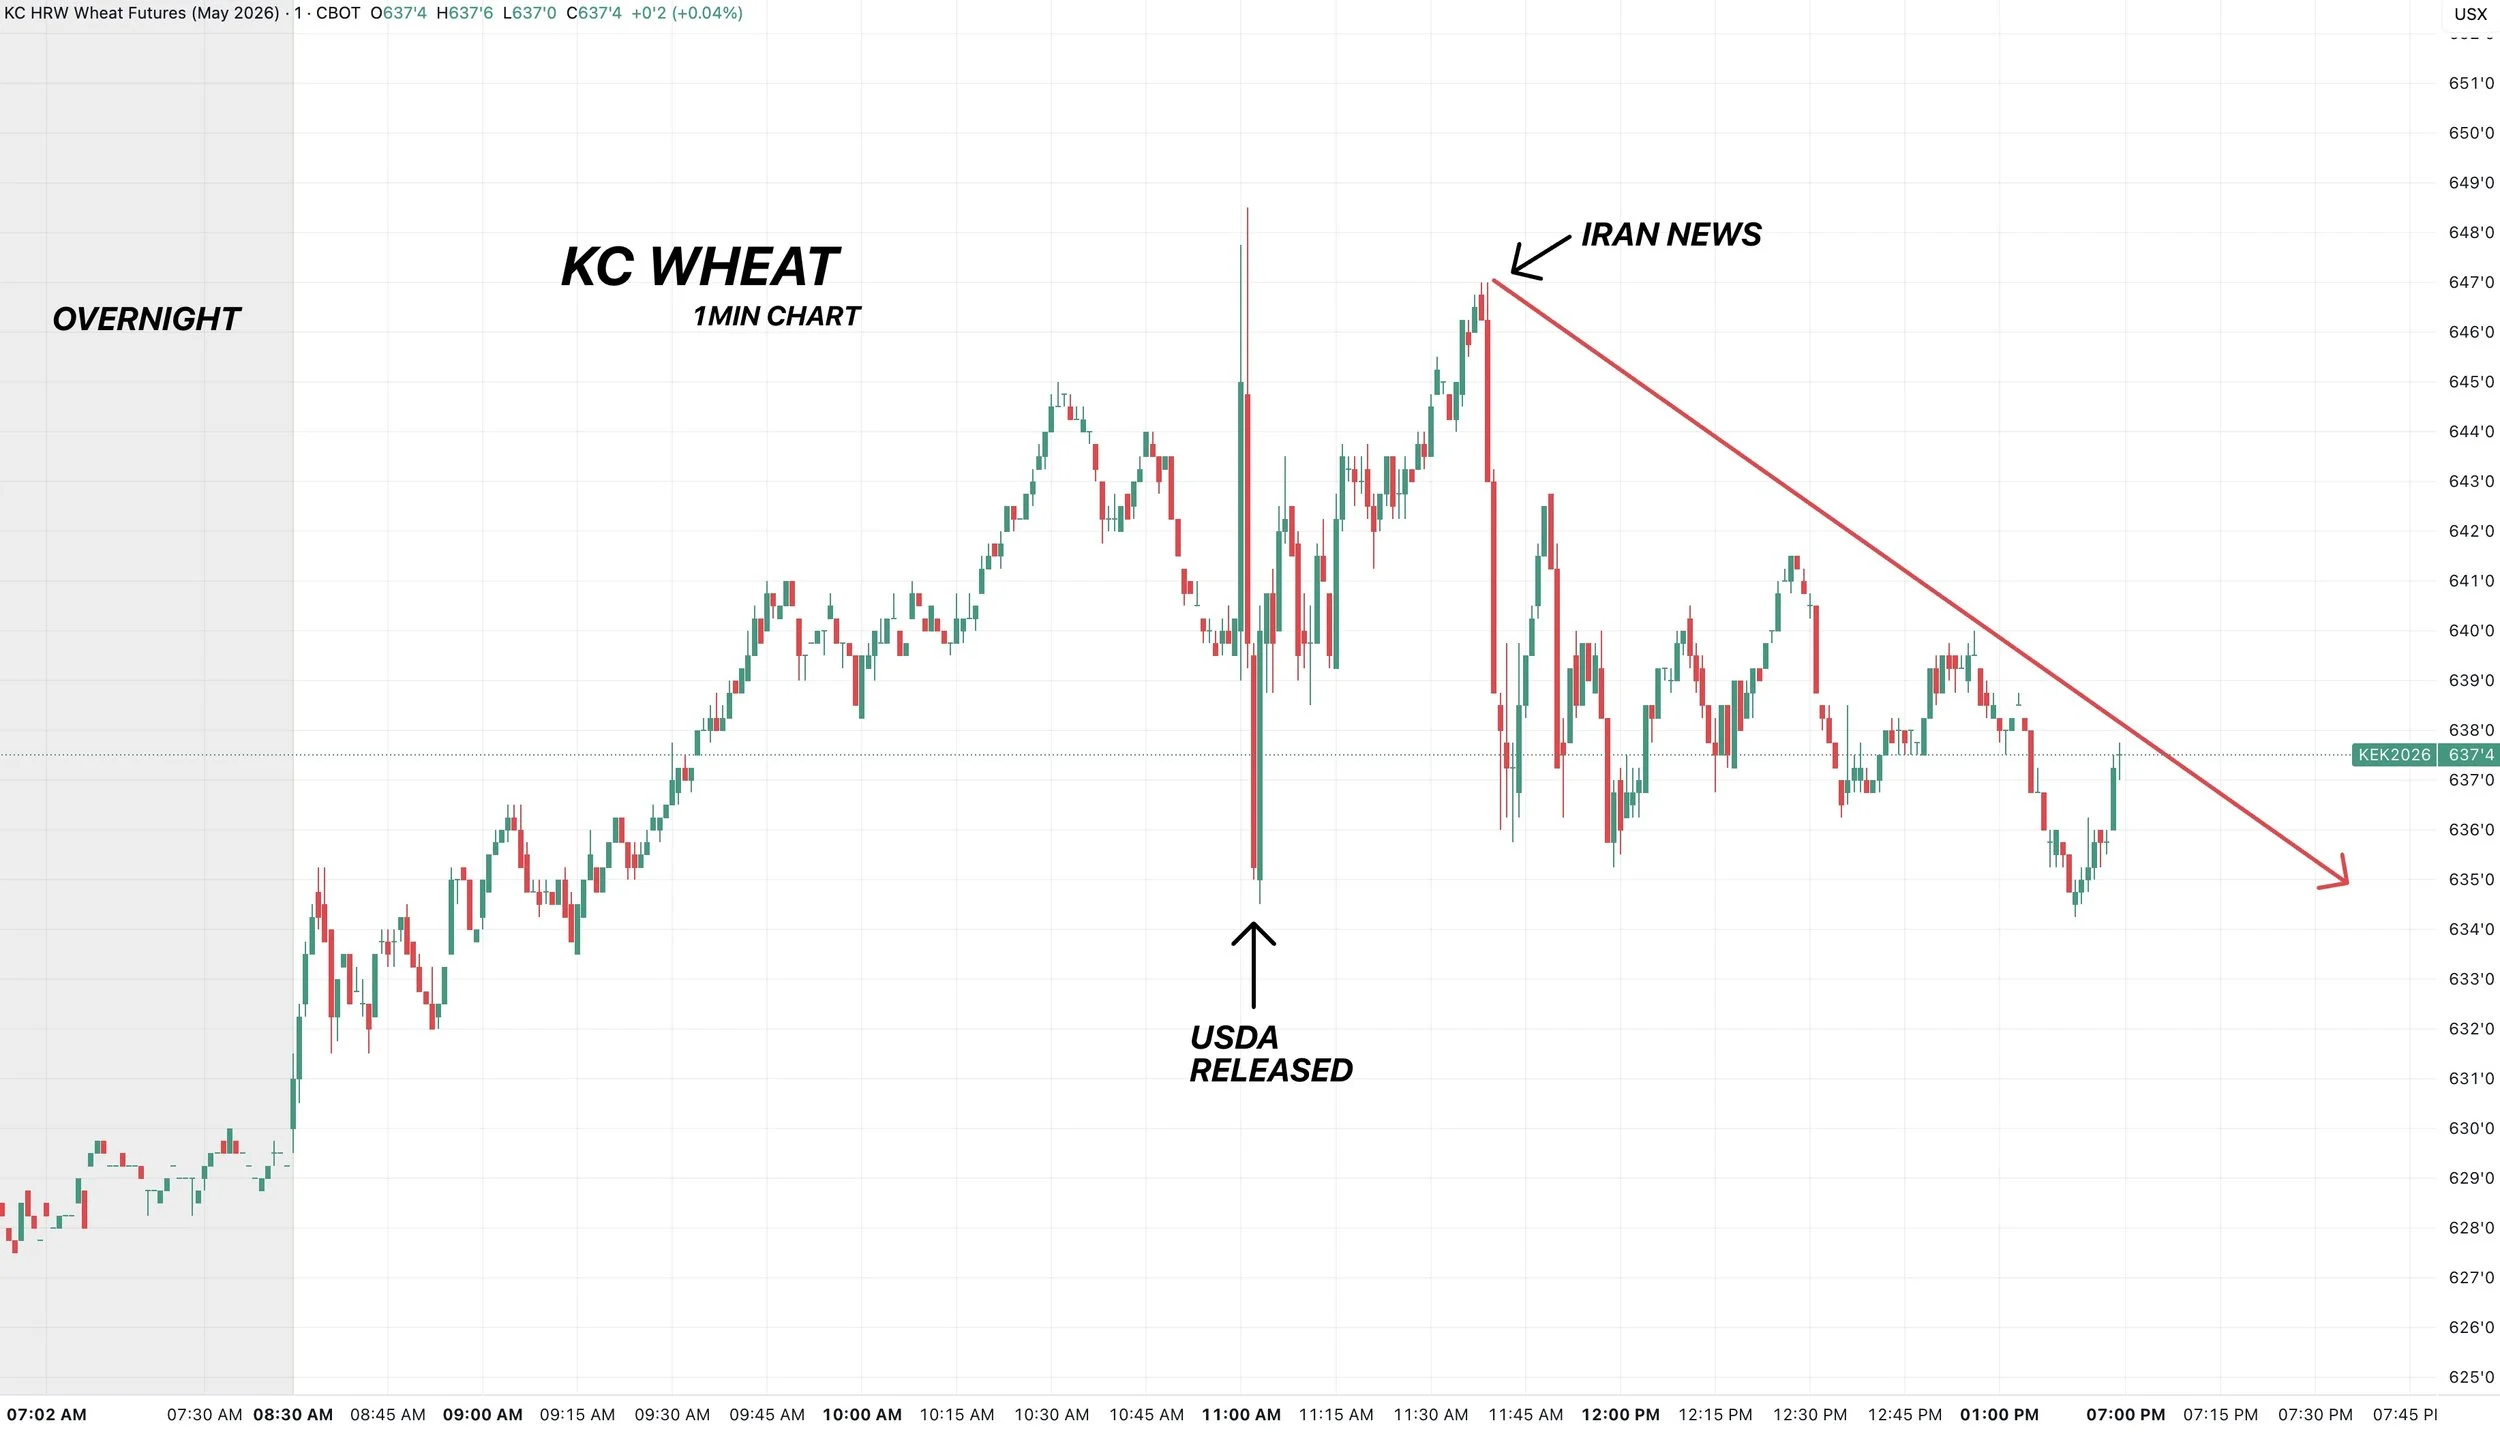
This news also led to the grains closing well of their highs from the intial bullish reaction to the USDA report.
For reference, KC wheat closed -13 cents off of it's highs today.
We were up nicely until the Iran news came out.
So the grains are also still trading the war headlines, and that still offers risk for the grains.
USDA Breakdown
Acres
Corn:
Acres came in 1 million higher than the trade was expecting.
95.34 million vs the 94.37 million estimates.
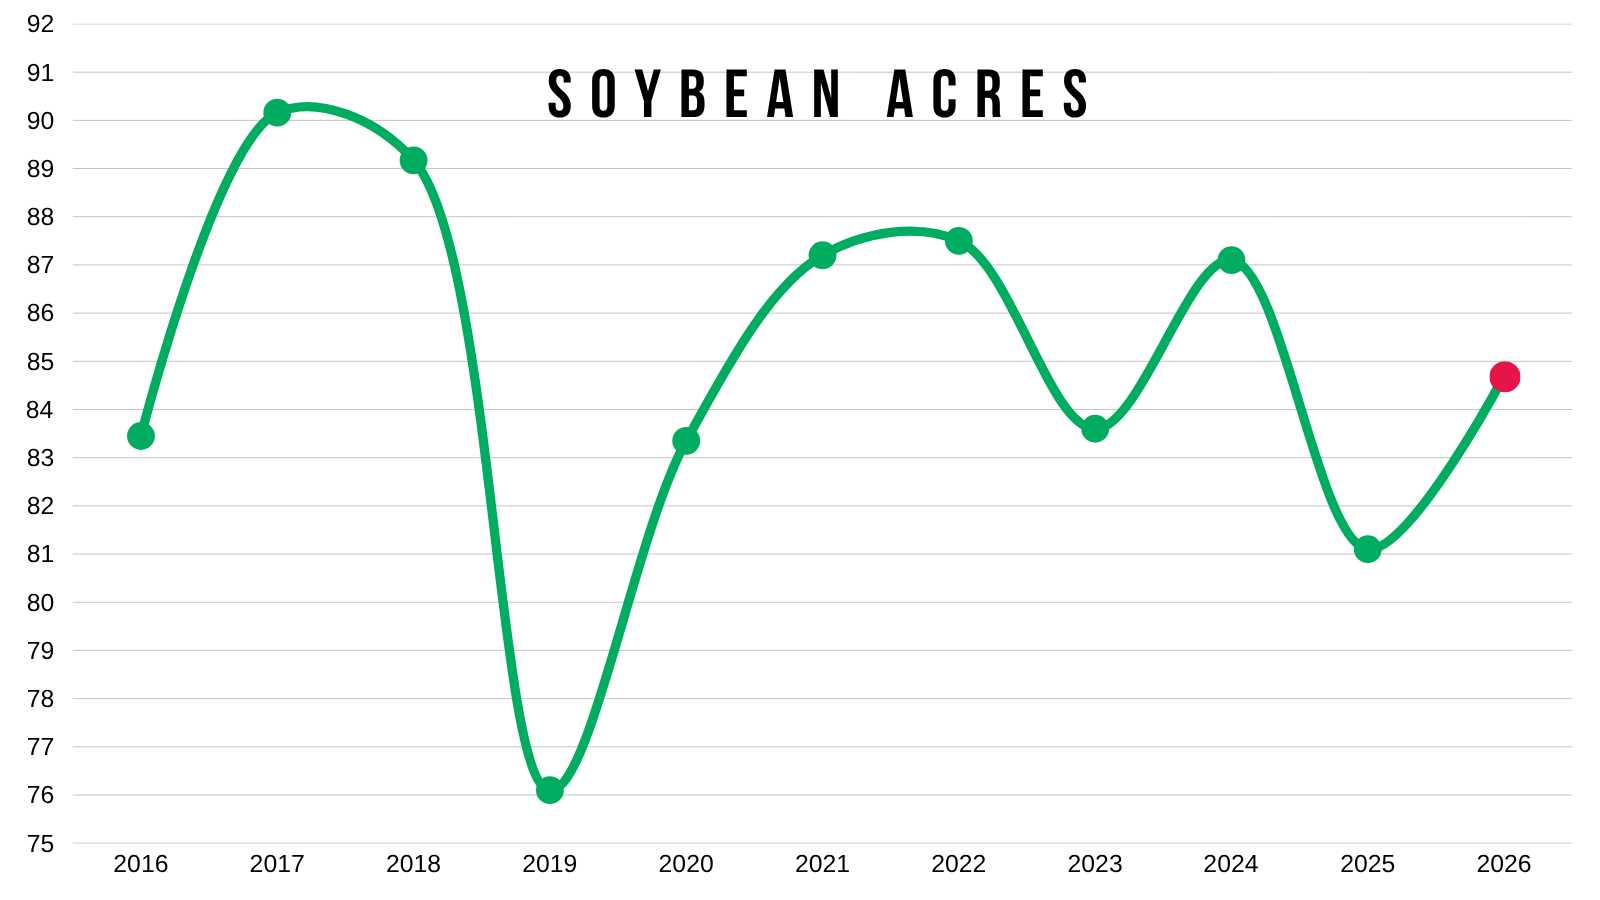
Soybeans:
Came in 800k lower than the estimates.
84.70 million vs the 85.55 million estimates.
Wheat:
Also came in 1 million lower than expected.
43.78 million vs the 44.79 million estimates.

Stocks
Corn:
Surprised below the trade expectations.
9.024 billion vs the 9.104 billion estimates.
Soybeans:
Came in above the estimates.
2.105 billion vs the 2.067 billion estimates.
Wheat:
Came in just below the estimates.
1.300 billion vs the 1.310 billion estimates.

Today's Main Takeaways
Corn
Corn Stocks:
First let's start with the stocks.
This was probably the more important number on the report for corn.
As everyone knows the acres are going to be changing and there are still plenty of question marks as to how the whole fertilizer situation etc is going to play a role.
But corn stocks were friendly in this report.
They were up from last year but smaller than expected.
So this tells us that demand is either stronger than expected, or last year's crop might not be quite as large as advertised.
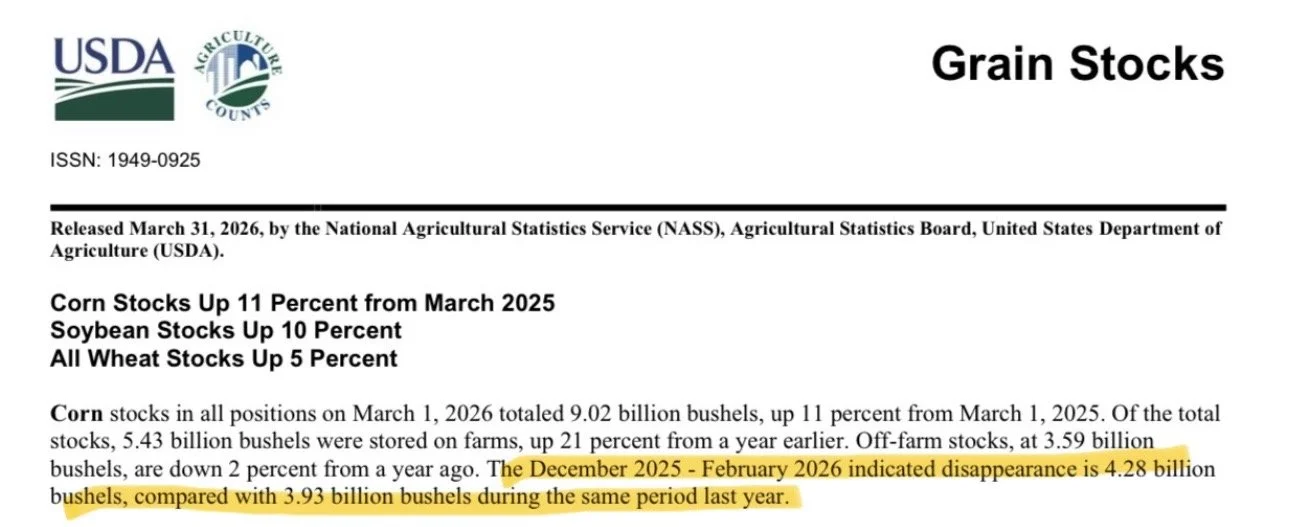
Demand is still strong as ever.
Disappearance (aka demand for Q2) was 4.28 billion bushels. This was over 100 million bushels more than the trade was expecting.
Compare that to last year's 3.93 billion for the same period. That is a 350 million bushel difference. Meaning we used 350 million bushels more compared to last year.
Corn's massive supply continues to be met with massive demand.
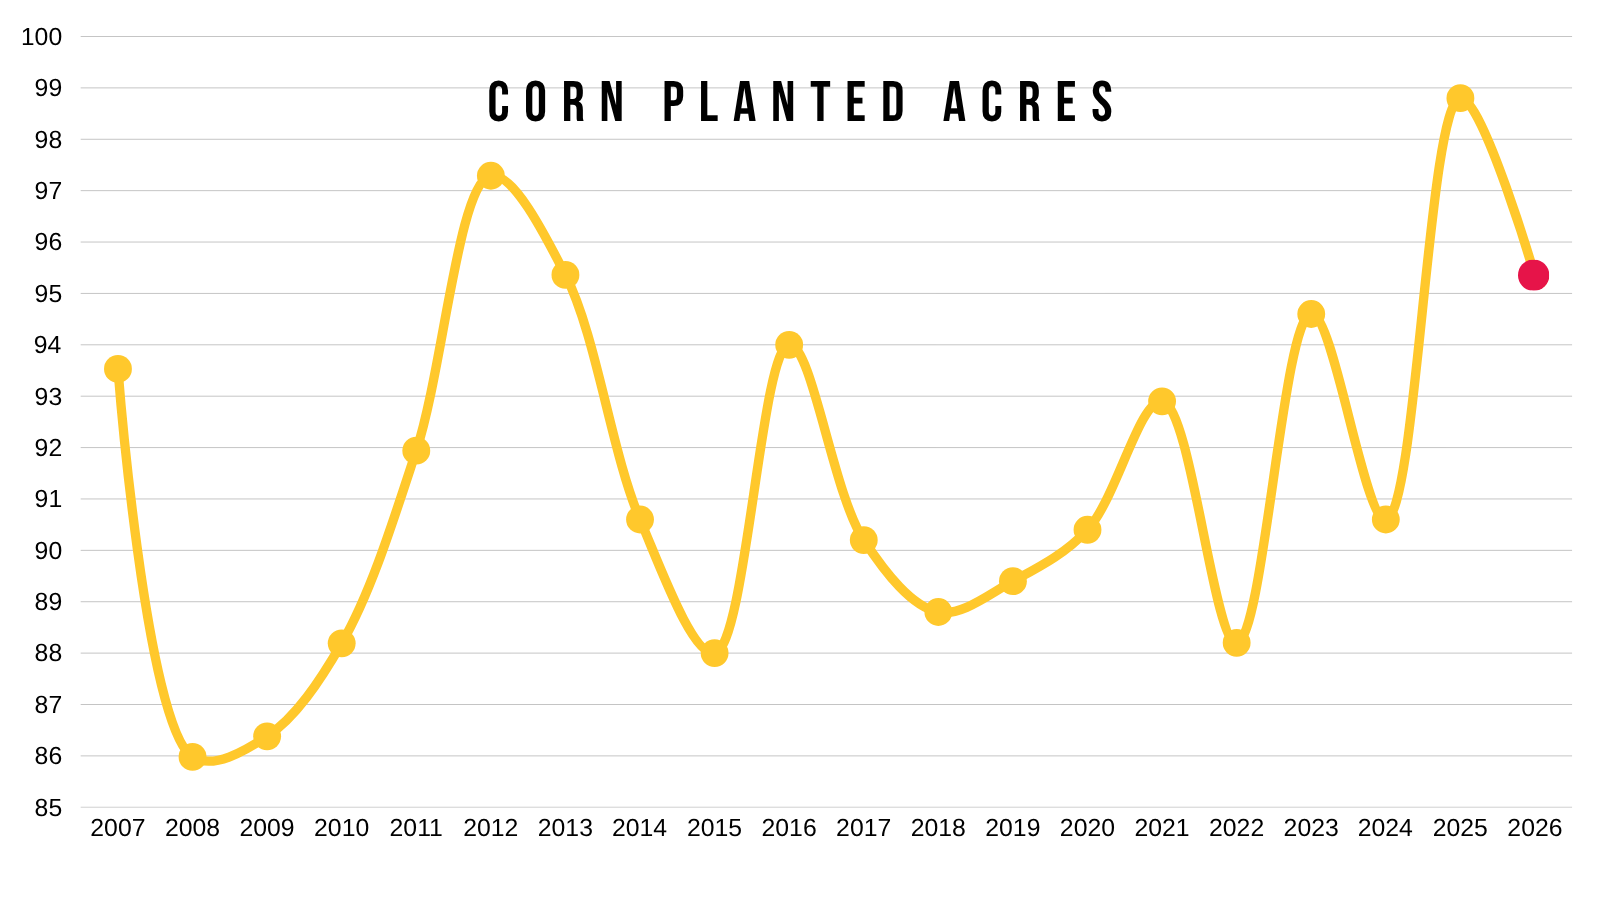
Corn Acres:
Corn acres surprised about 1 million more the the trade was expecting. But still 3.5 million less than last year's record.
Which is a sizeable drop from last year, but still one of the higher numbers ever if realized.
Even though acres were 1 million more the trade was guessing, corn did manage to close higher so you can’t hate the price action.
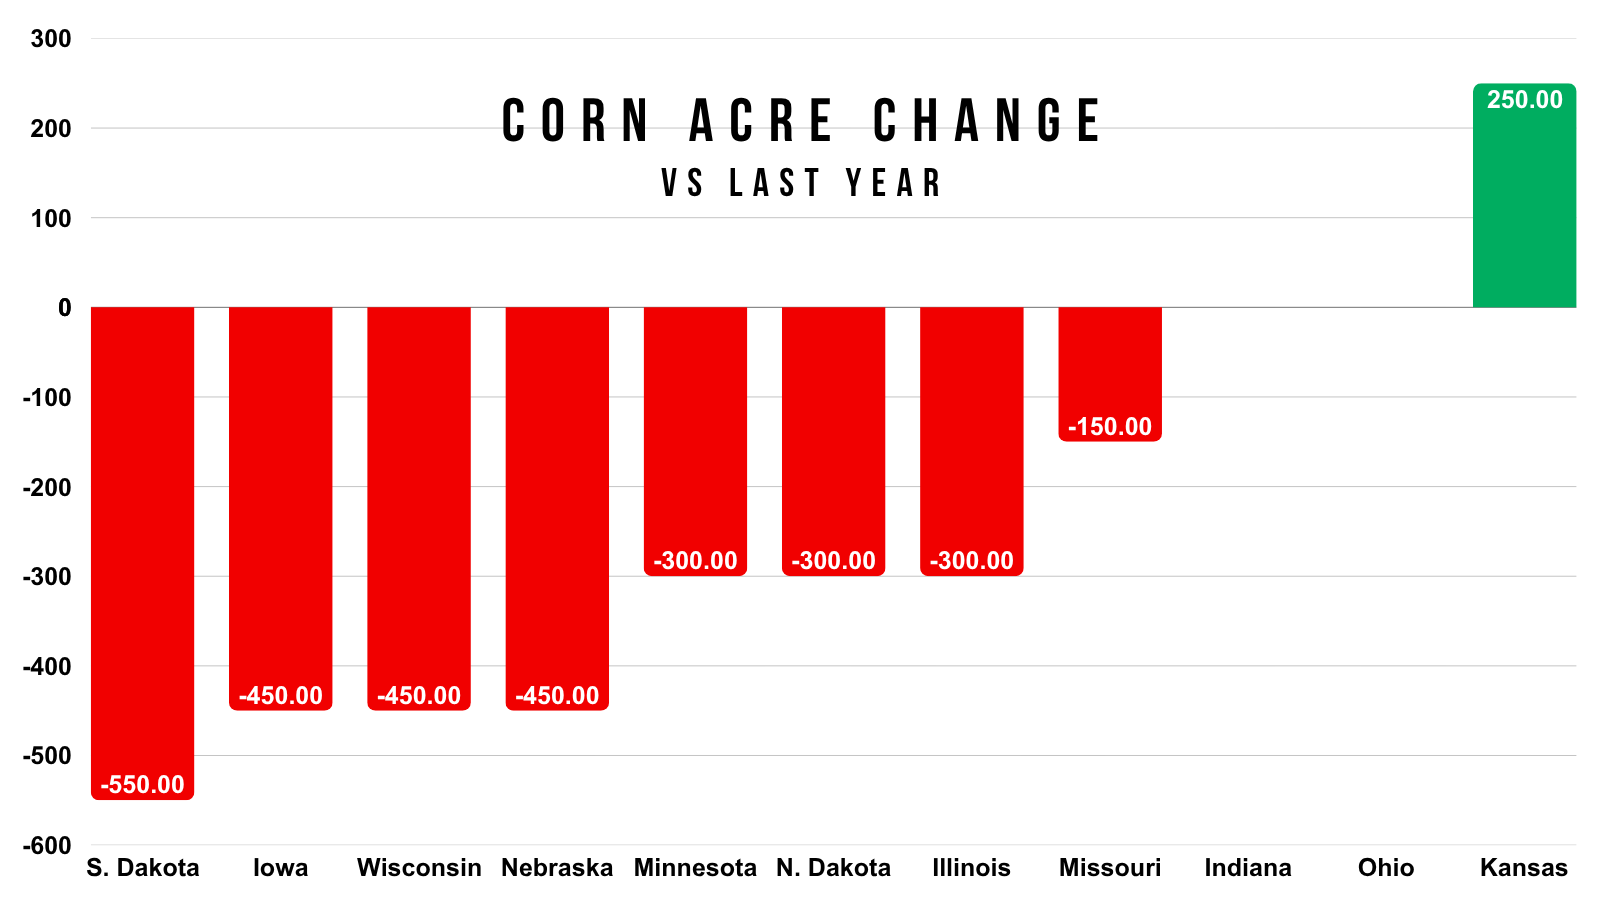
Here is the state by state changes from last year to this year.
The only state that is expected to plant more corn acres than last year is Kansas.
The market traded the acre numbers today, but overall the market will probably take the corn and soybean acres with a grain of salt from here.
Considering that this was a survey based report. Most of the survey was conducted before the entire Iran situation and fertilizer boom.
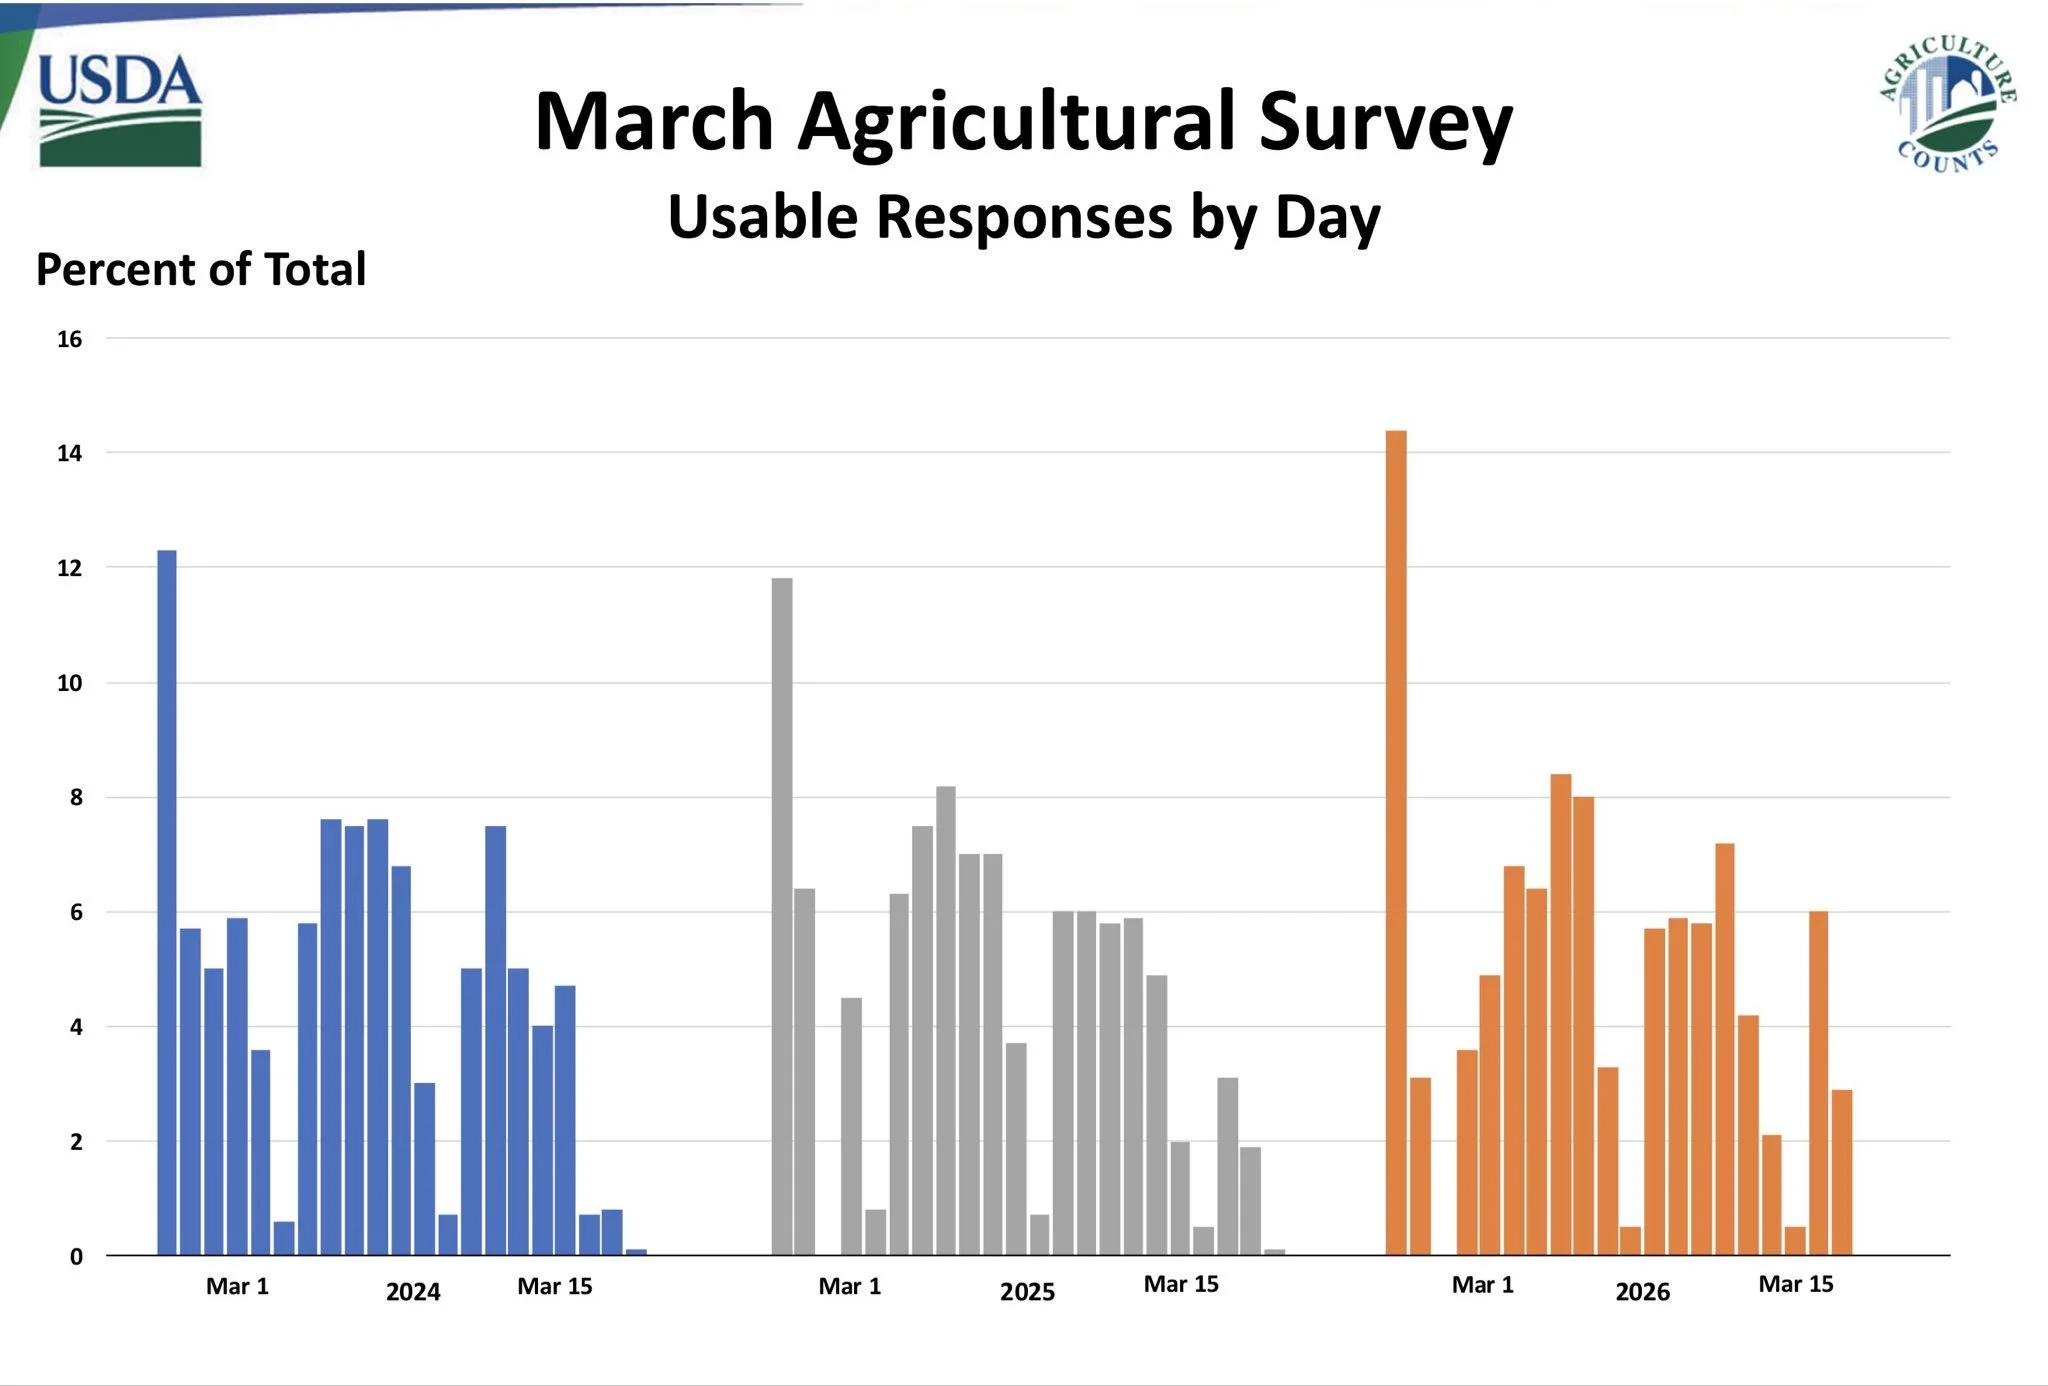
Here is a chart the USDA put out showing what percentage of responses were recorded on what date.
The responses for this report leaned heaviest on the earliest responses.
More so than the previous two years did.
This has to be another thing that makes you question the validity of the acre numbers.
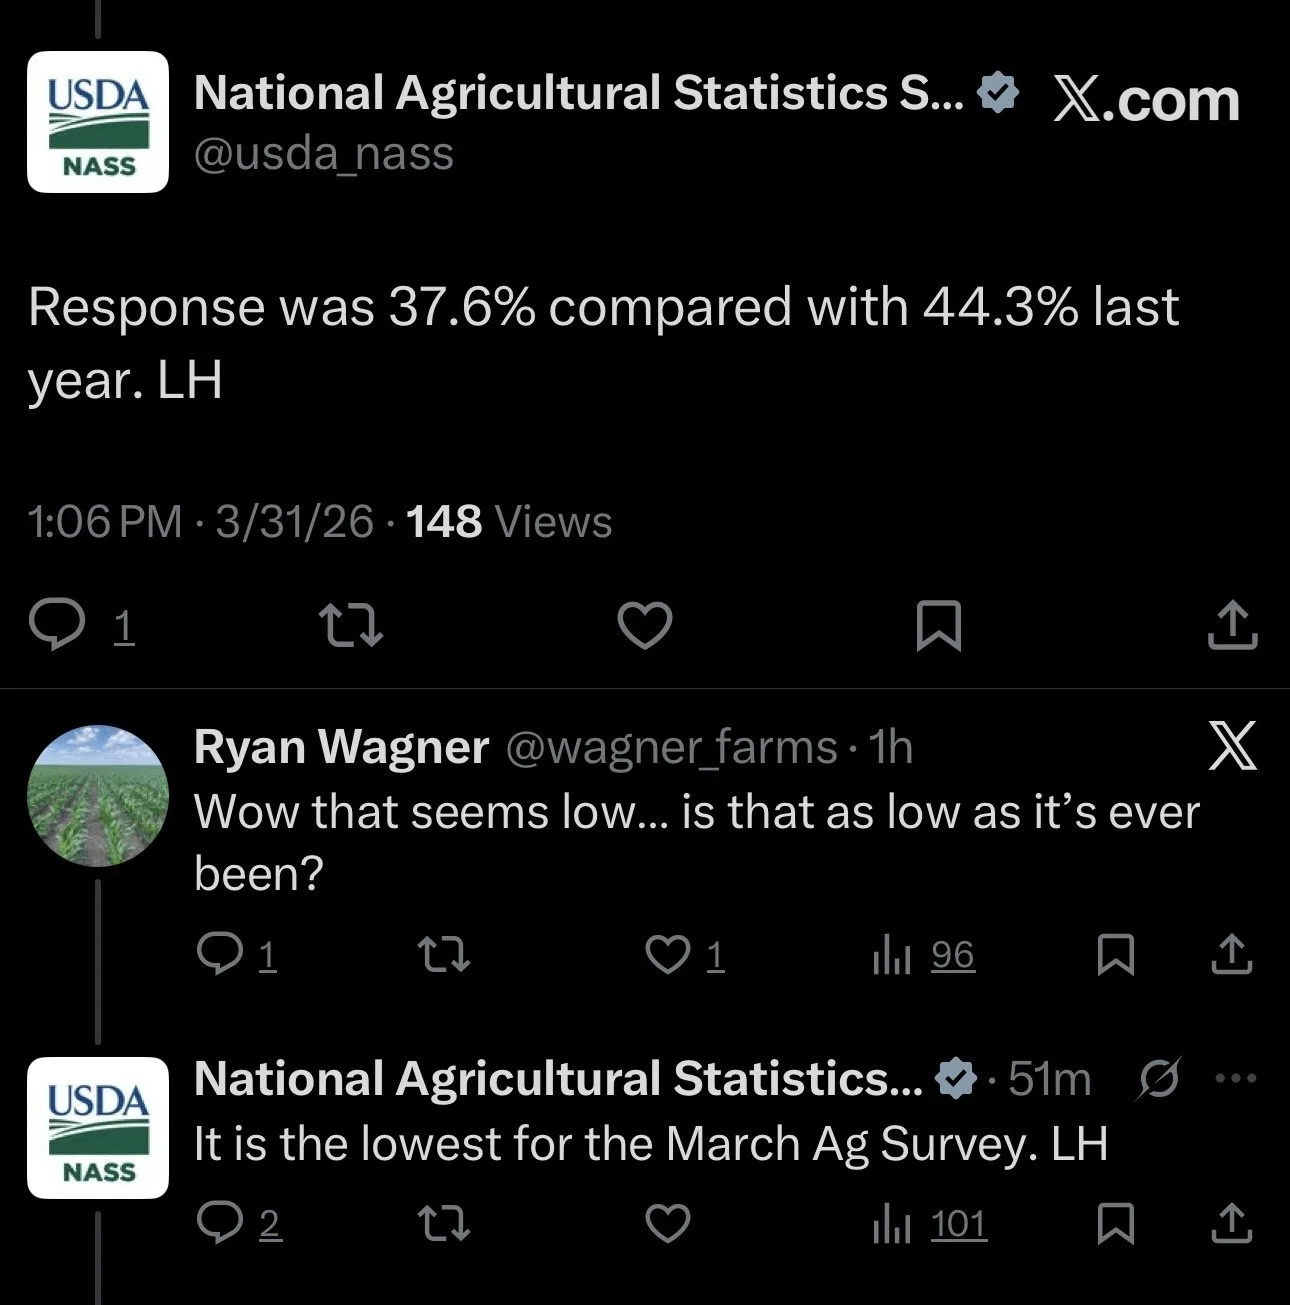
Least responses ever?
Someone on X asked the USDA what the response rate for this report was.
Their answer was 37.6% vs 44.3% last year.
They said it was the lowest response rate they've ever had for the March report.
We will likely be seeing some revisions moving forward.
Regardless, these are the numbers that we will be working with until June 30th, and we will not get a good idea on acres until then.
So these acre numbers will be what is used on those first new crop balance sheets.
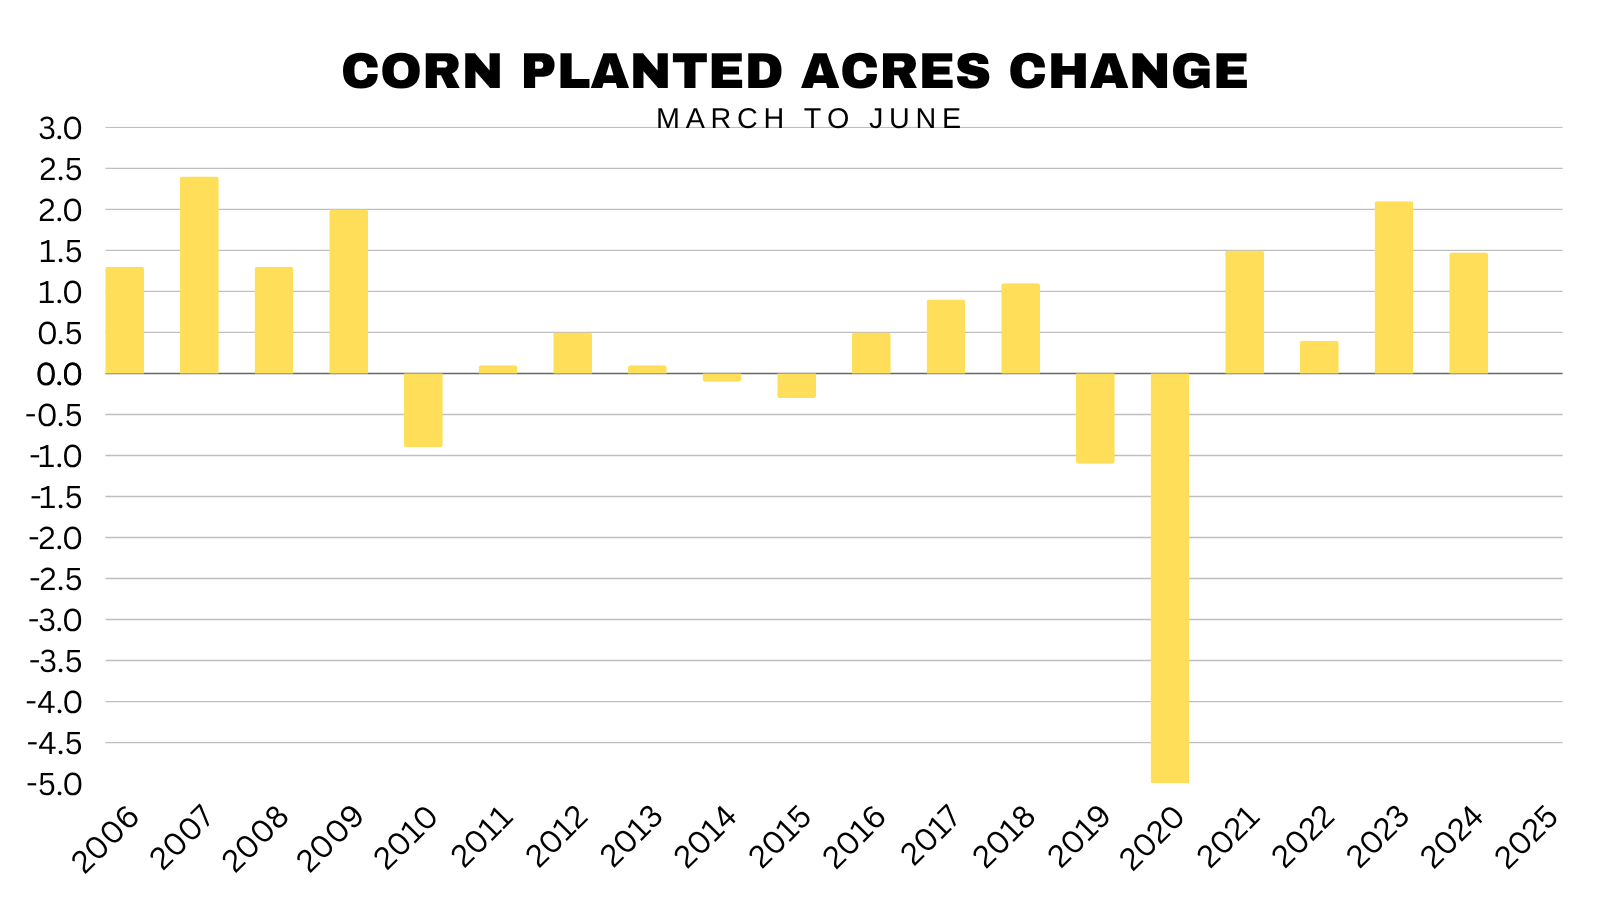
Now normally.. corn acres tend to jump from the March intentions to the June report.
It's happened in the last 7 of 11 years.
Last year was the first time they did not jump since 2020.
But this year is not a normal year.
I'd lean towards this year being one of those years we do not see acres increase from here.
Now if acres do end up coming down, new crop could definitely still have a story, even without war propping up the market.
We still have a demand monster in corn.
If acres were to slip, you can eat into that balance sheet pretty fast.
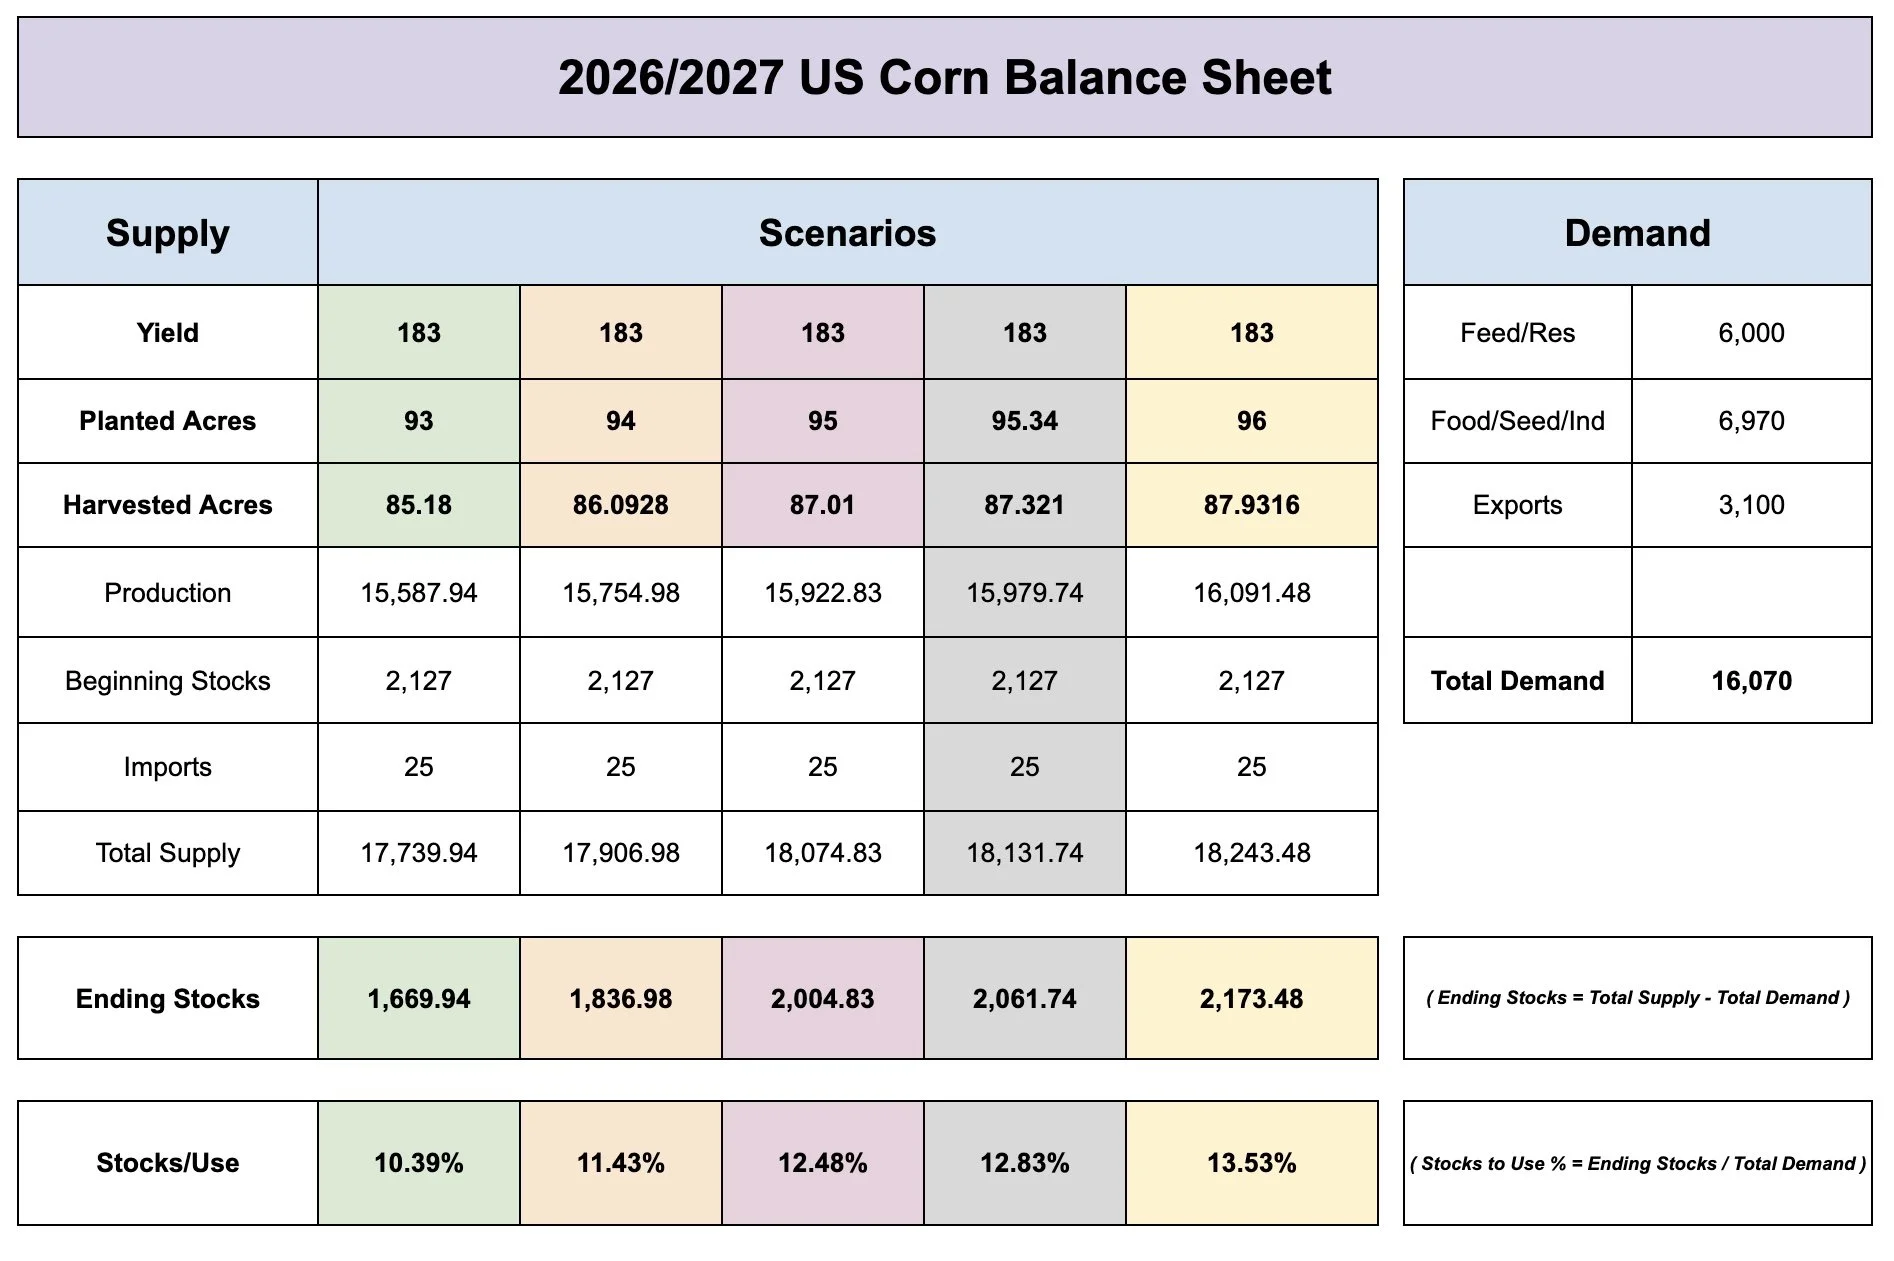
These examples use the Feb Outlook demand numbers along with a 183 yield, and different sets of acres.
1 million acres = 167 million bushel change to carryout on the balance sheet.
This examples are not perfect as demand is going to of course change and this is just based off their intital Feb numbers anyways.
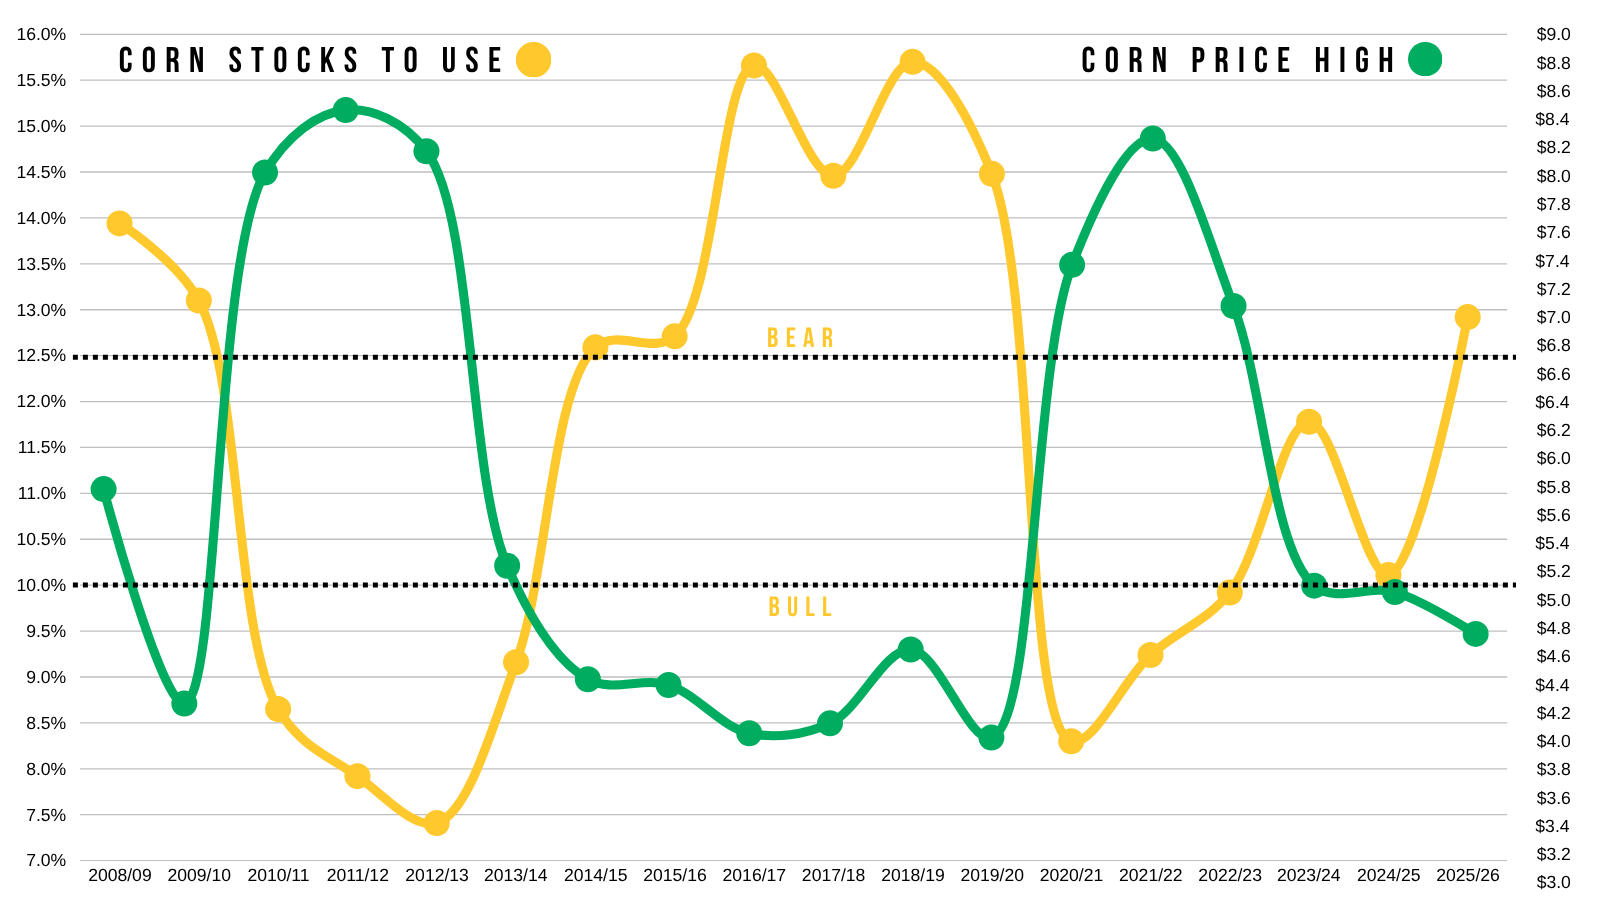
But based on those, if acres start to drop closer to 93 it could paint a friendly scenario even with a 183 yield.
Now IF these numbers held.. that 95.4 million acre number would print roughly a 2 billion bushel carryout based on the same demand numbers and a 183 yield.
So not the friendliest number, but we've seen just how far off the USDA can be with their starting acres.
The other big factor is of course going to be the war and the energy markets.
If the war continues to drag out for several months, crude will continue higher and corn should continue to follow along for the ride.
Like we've seen every other time crude has stayed above $100 for months on end, corn tends to folllow.
If the war starts to calm down and comes to an end, and they reopen the Strait of Hurmoz, we could expect corn to lose a lot of that war premium and follow crude lower.
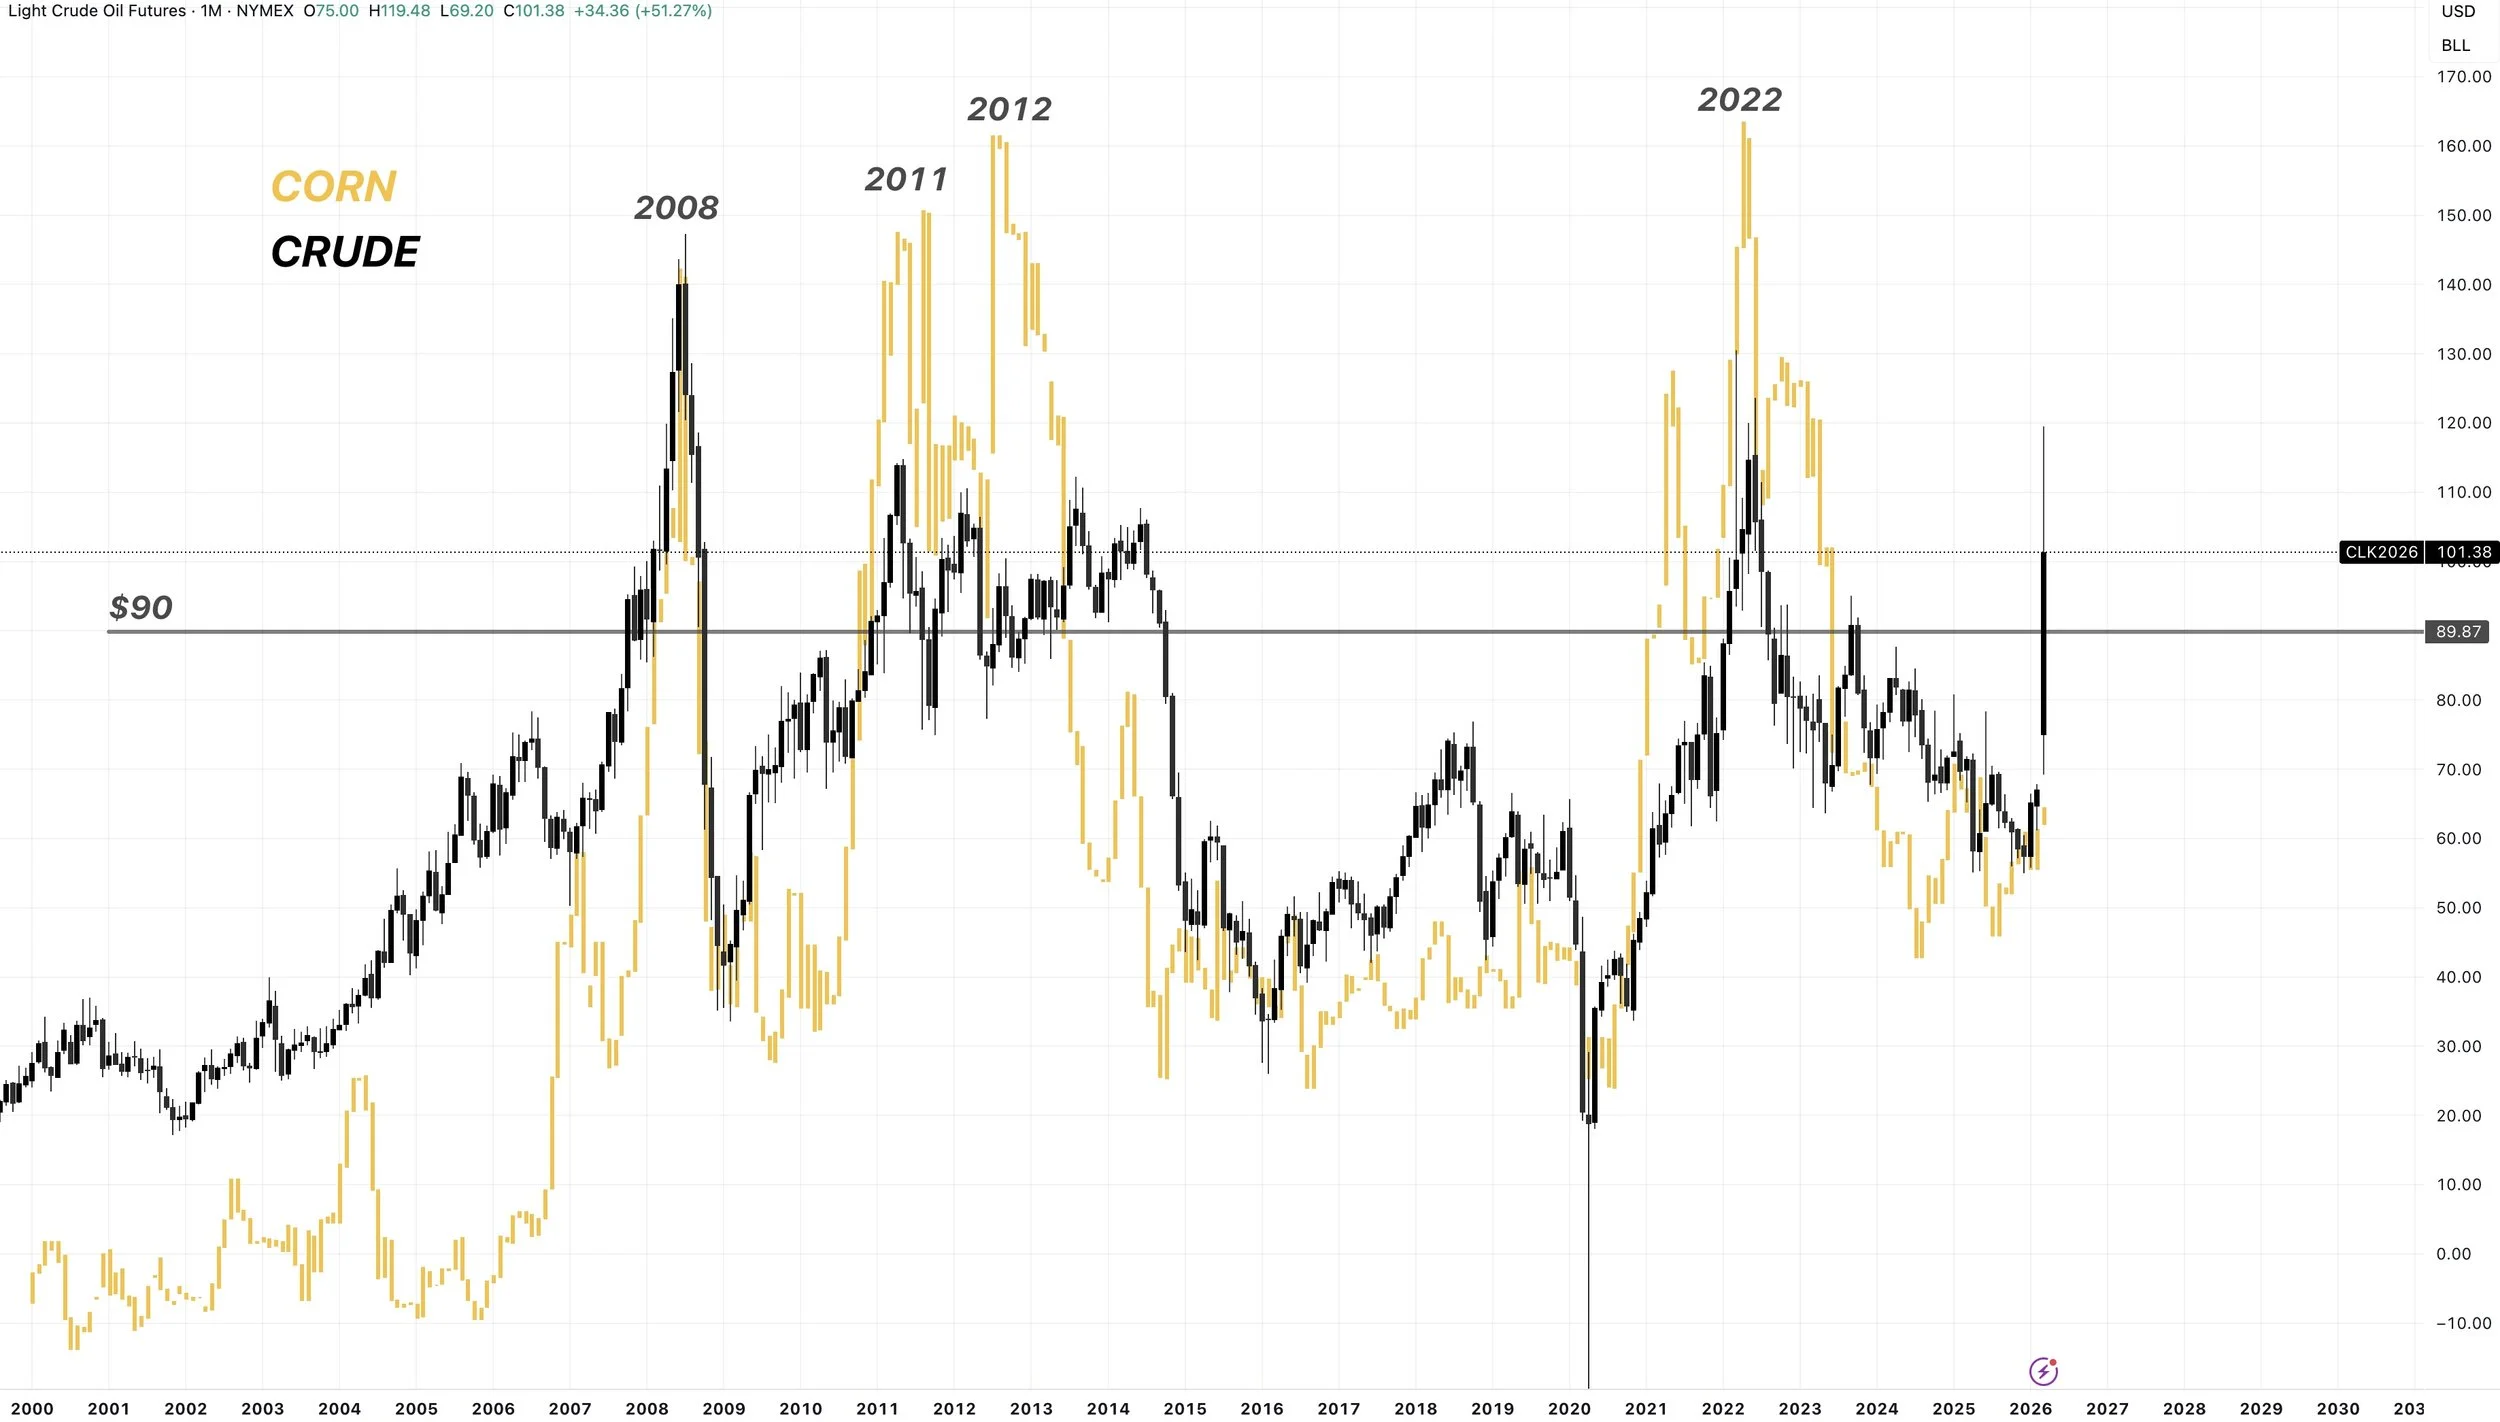
As I would still argue that without the war, corn would be potentially a lot lower than it is today.
As the current fundamentals don’t suggest corn having this really bullish outlook.
But fundamentals can be trumped by money flow.
And the fundamentals could definitely change if we lose acres or run into a weather hiccup.
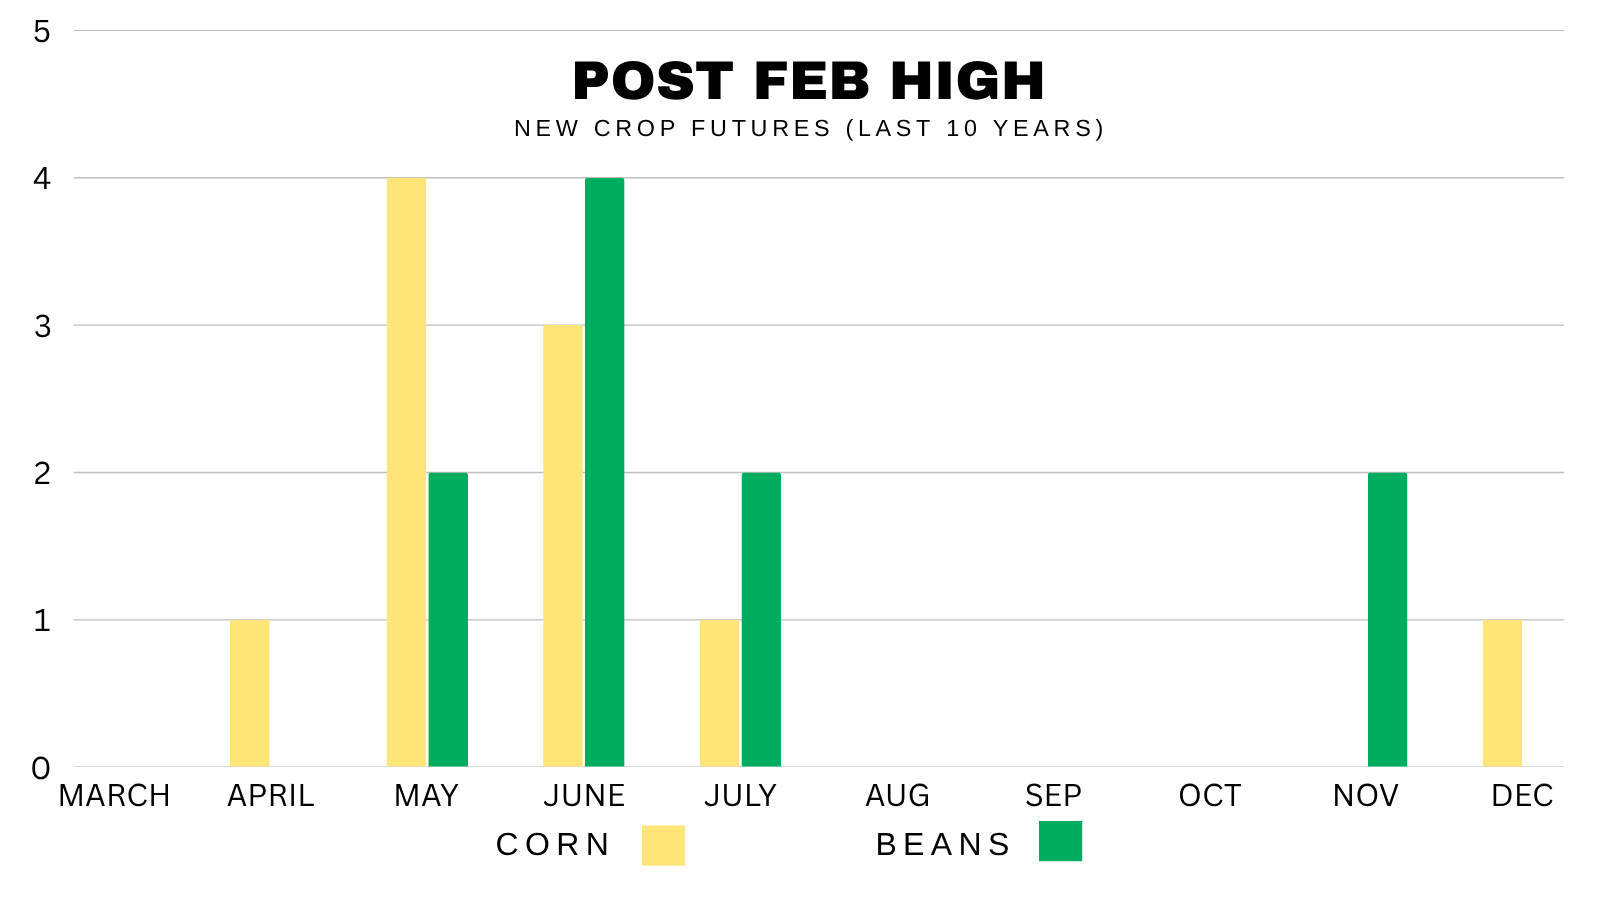
In at least the last 20 years, new crop corn and beans haven’t topped in March.
If we look at our post February highs, that of course usually comes between April to June.
So you could argue that the market should keep weather premium heading into the growing season like we usually do.
But this isn’t a normal year either with the war.
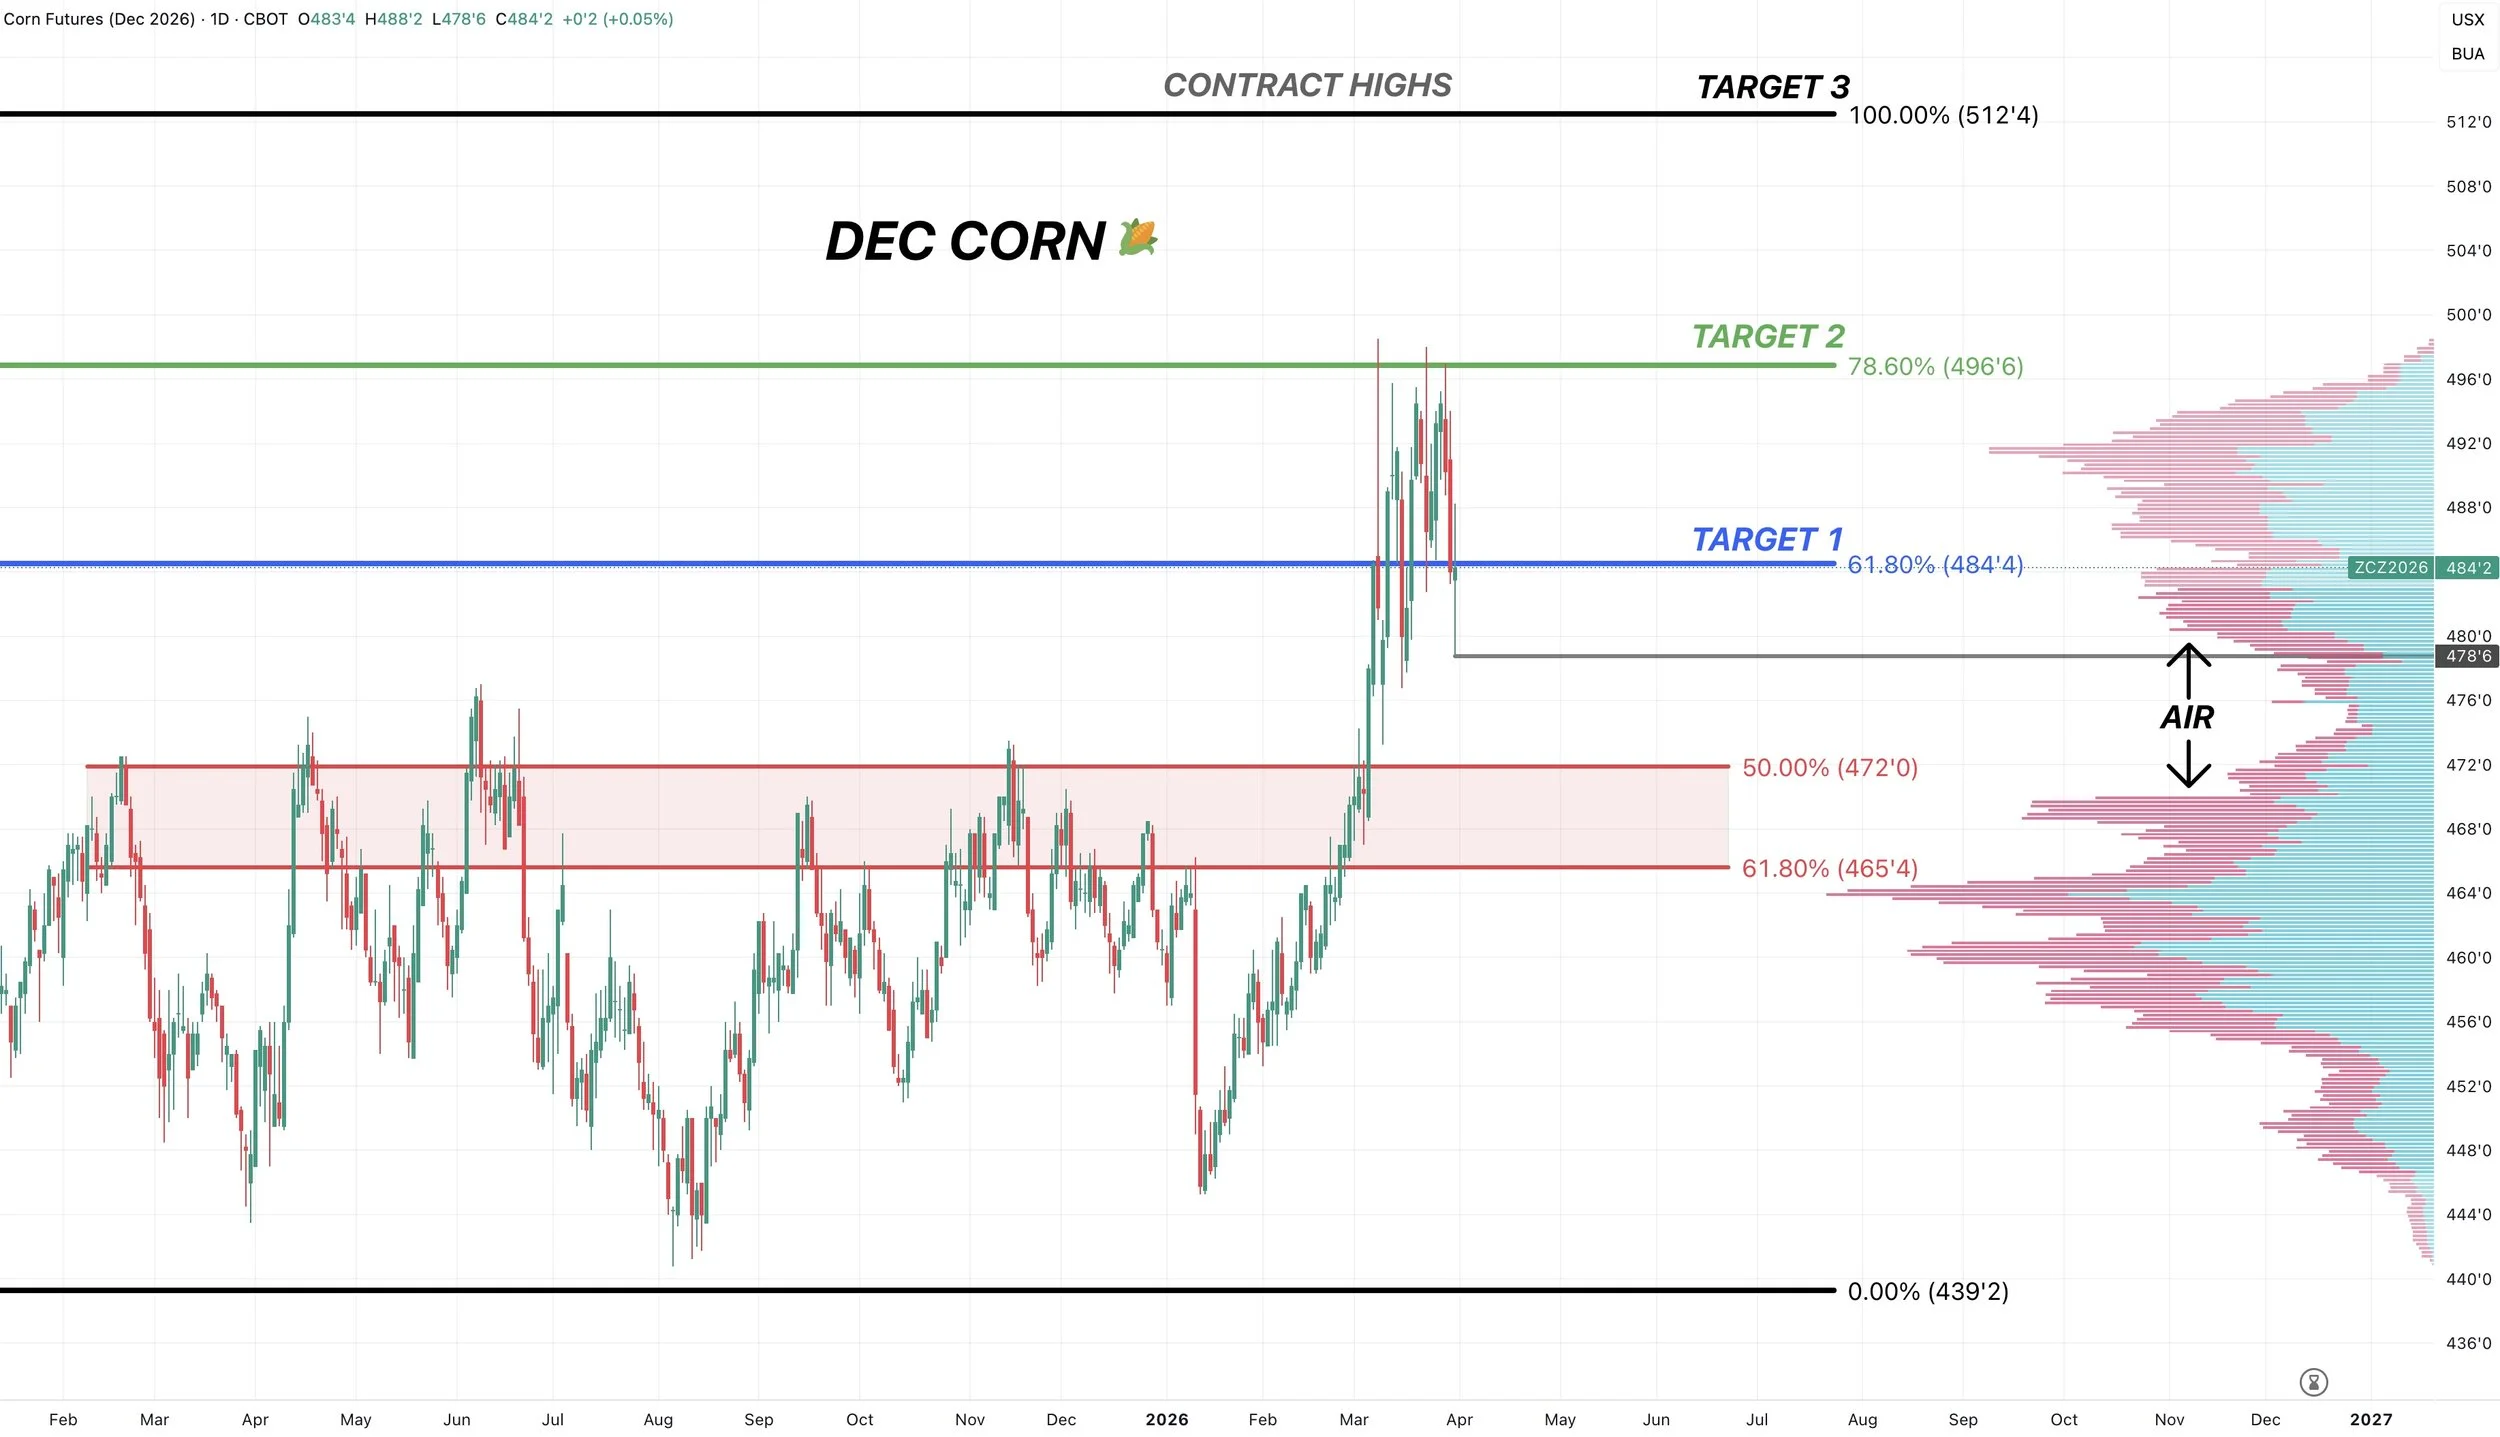
Dec Corn Chart:
Last week we talked about hitting that $4.96 target along with the bearish divergence on the RSI that signaled some potential weakness in store for us short term.
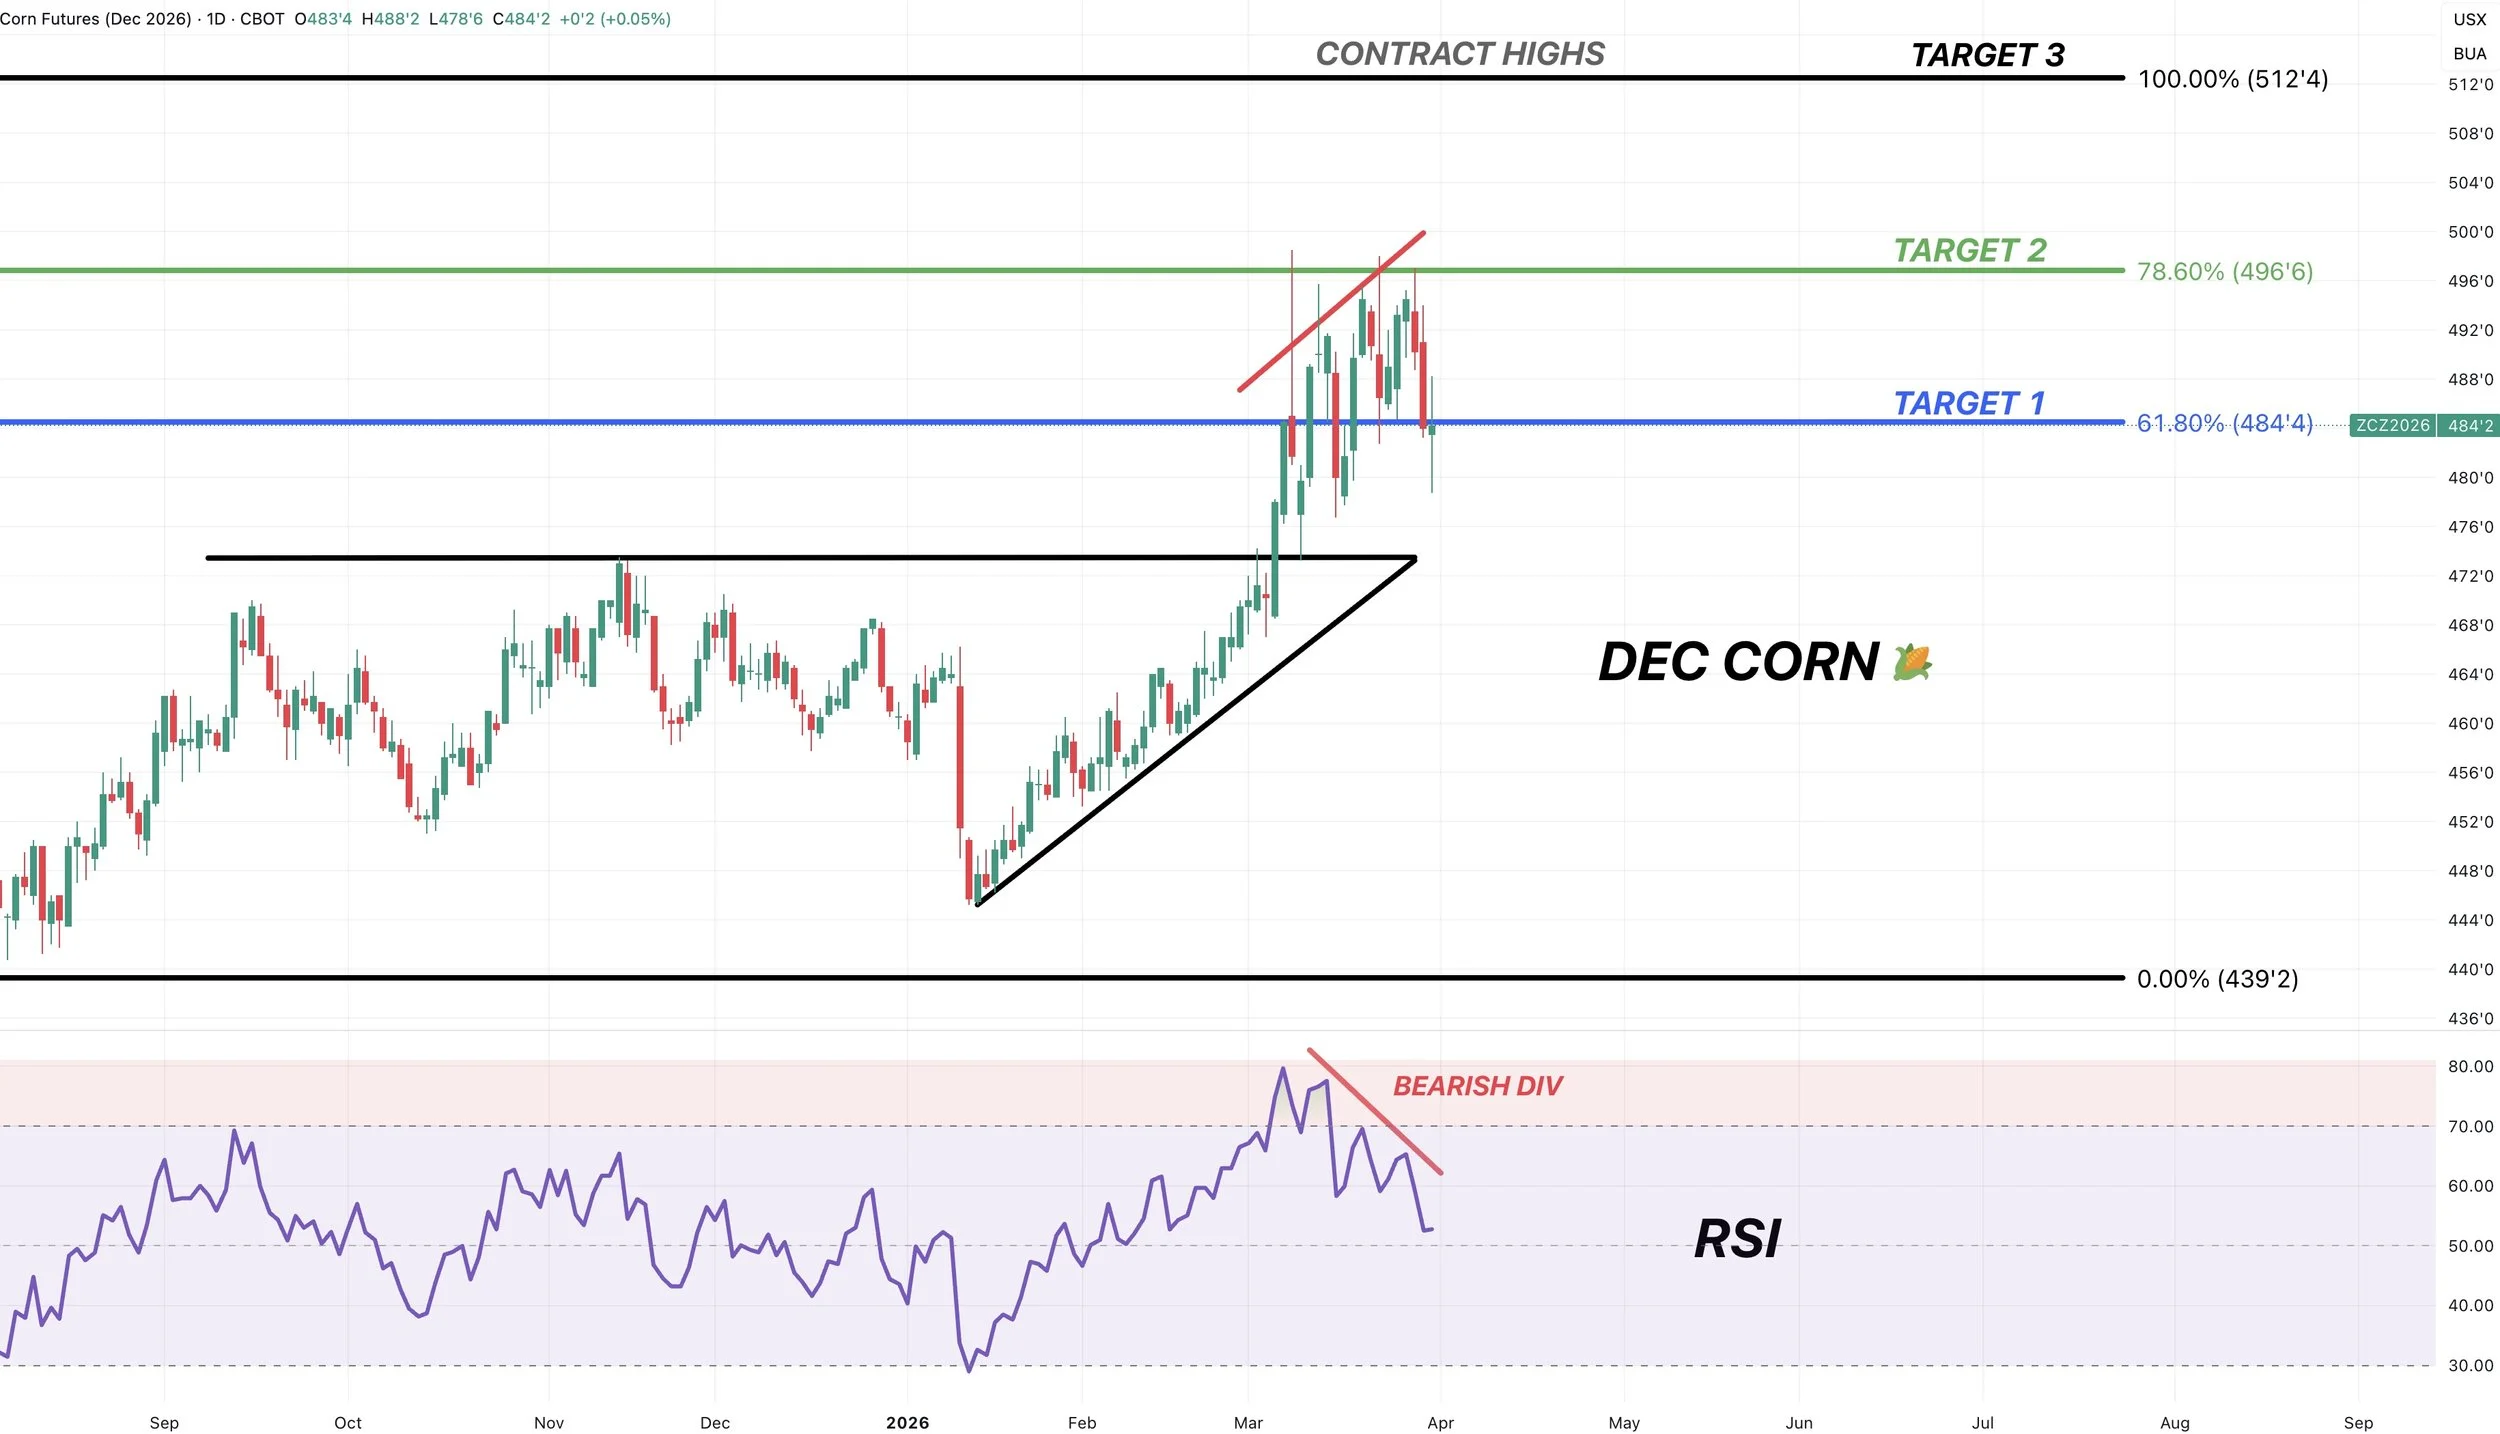
Clearly the trend still remains higher for now.
I'd say we need to hold today's lows.
If you notice, there is very little volume or support from $4.80 down to $4.70
If we fail to hold today's lows of $4.79 we could see a move towards $4.65 to $4.72
That would be the golden zone retracement of the entire rally and the next area of high volume.
Today's candle was an indecision candle. We closed 4-5 cents off the highs as well as the lows.
The price action the next few days should be telling.
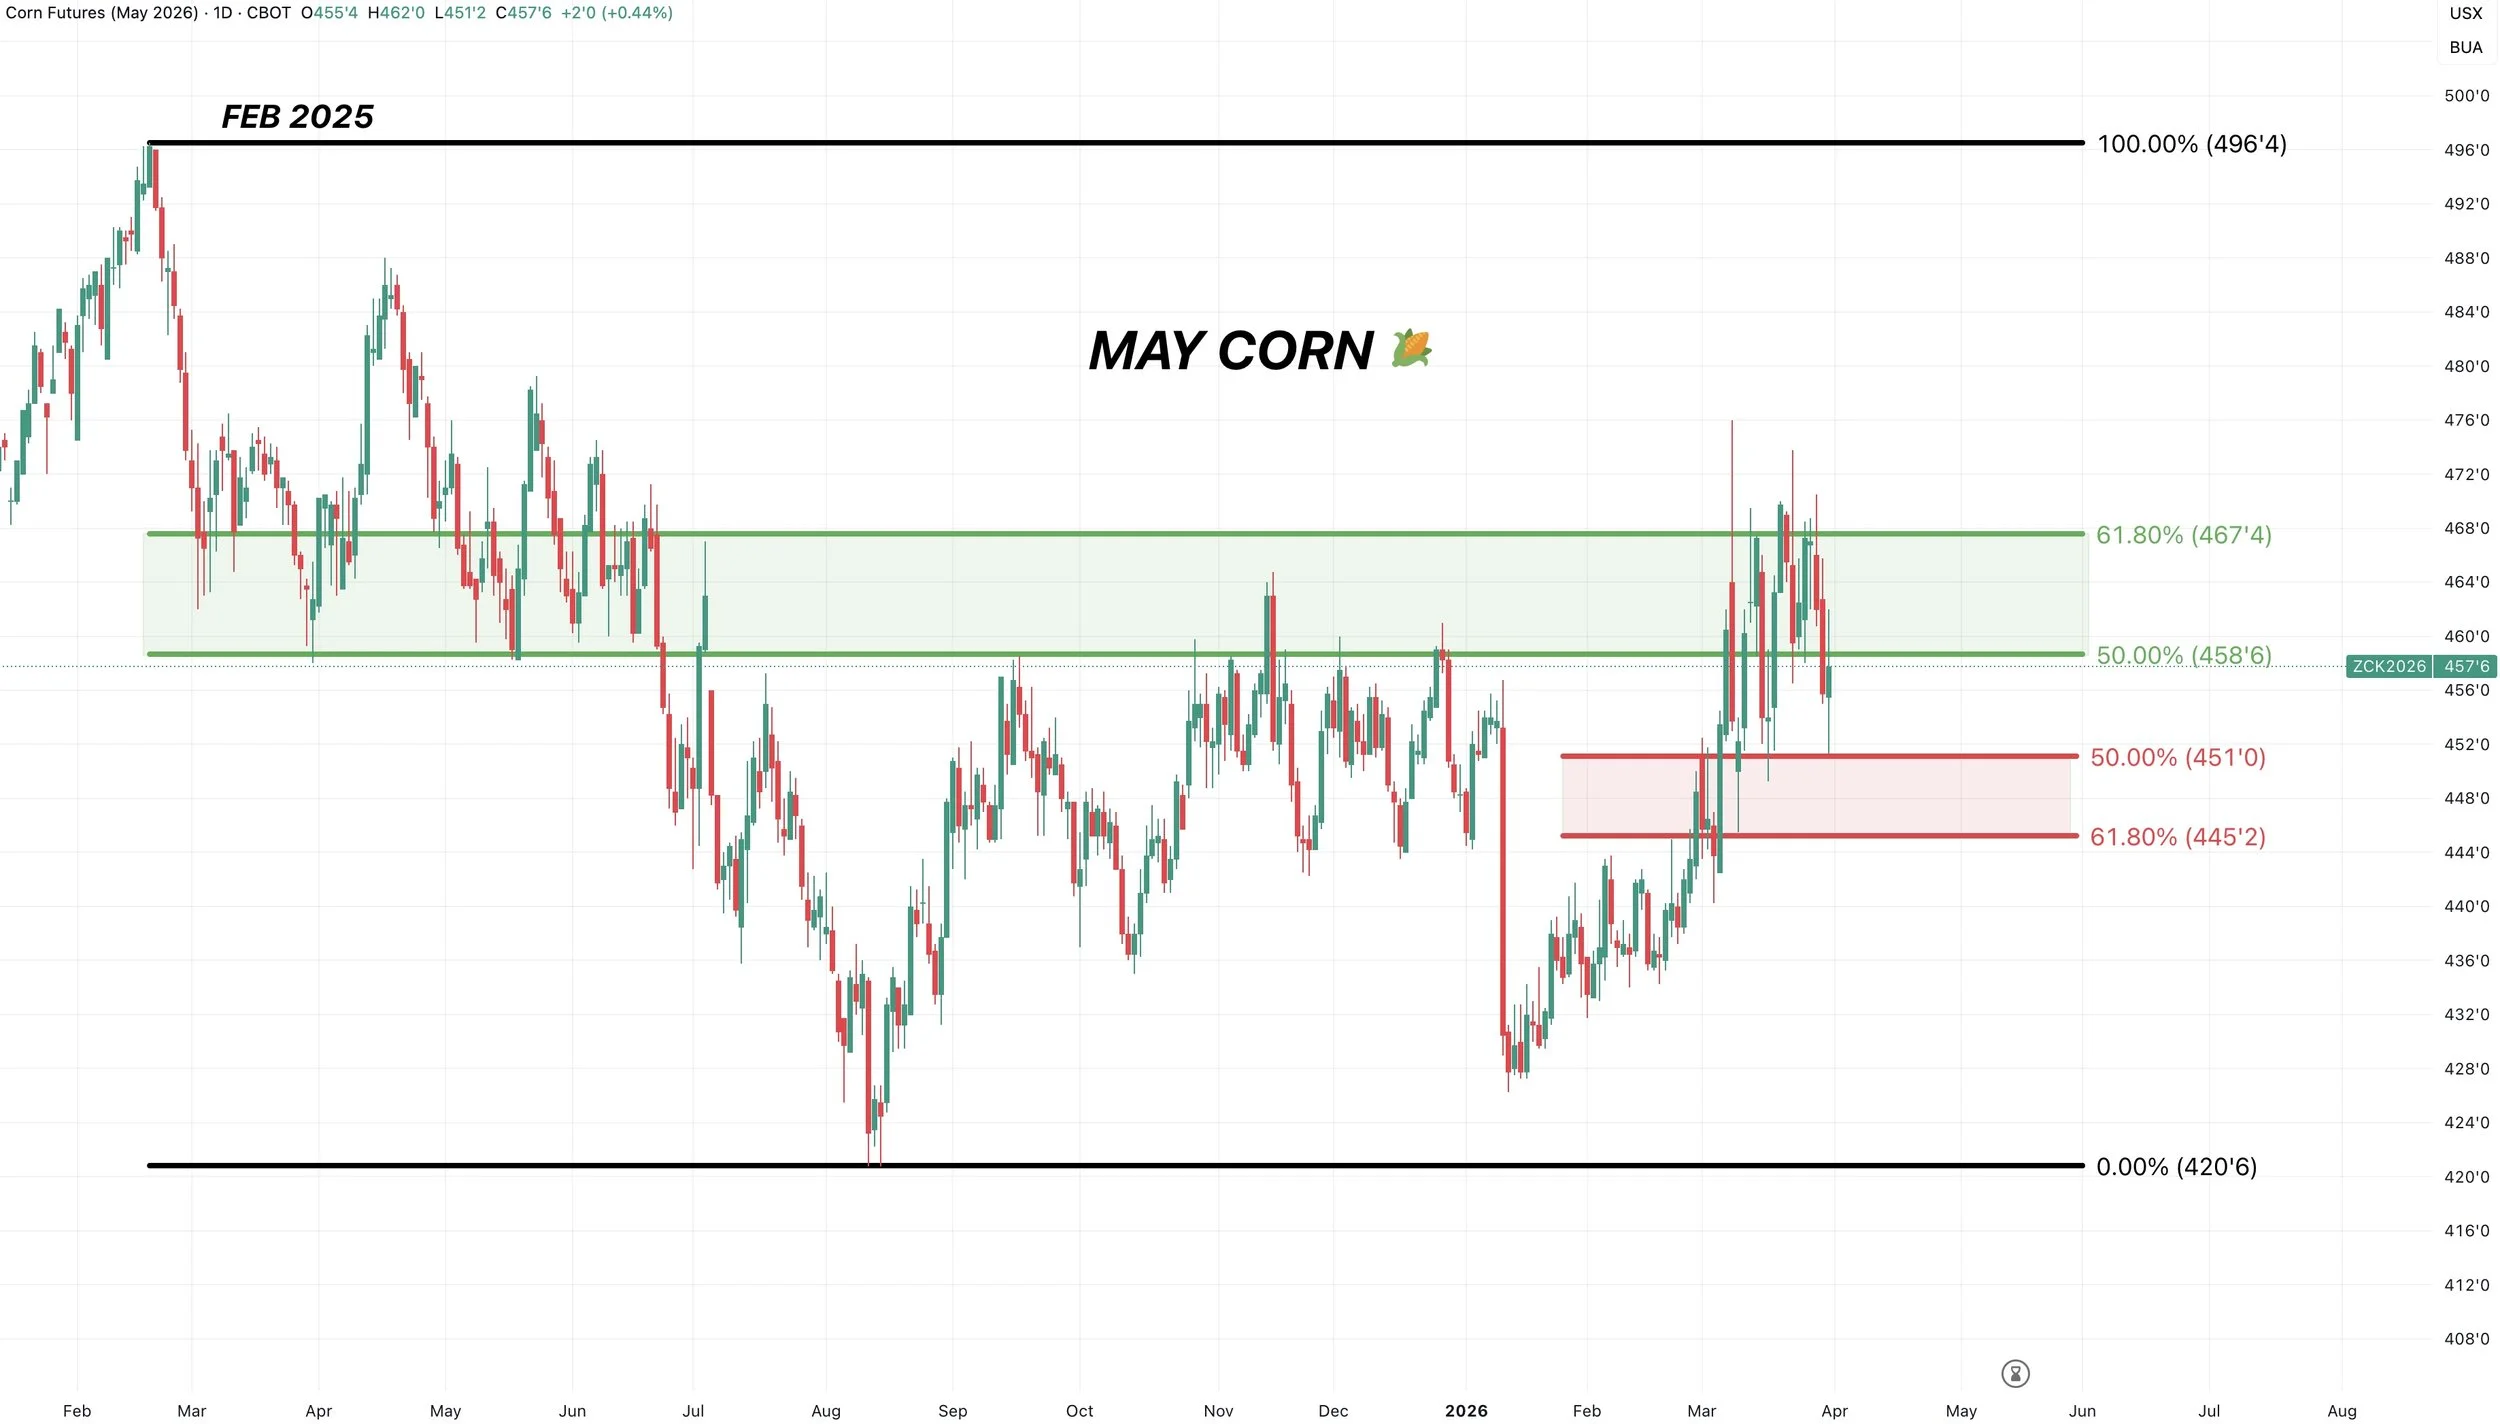
May Corn Chart:
Currently struggling in the golden zone from contract lows up to the Feb 2025 highs.
The trend remains higher as long as we hold the red box.
Which is $4.45 to $4.51, which gives back 50-61.8% of the entire rally. That level is also support from last fall.
We bounced right at the 50% level today.
Soybeans
USDA:
Soybeans had pretty much the complete opposite report as corn.
Corn acres came in high while stocks came in low.
Soybean acres came in low while stocks came in a little high.
They had acres up 3.5 million vs last year, but this was around 1 million less than the trade was expecting. Hence why soybeans saw a nice day today.
But again, I am pretty sure these numbers are going to be changing multiple times moving forward.
You have the fertilizer situation, along with the fact that it was the lowest response rate they've ever had.
So that has to be the risk moving forward for soybeans, if acres end up higher than the USDA stated today.
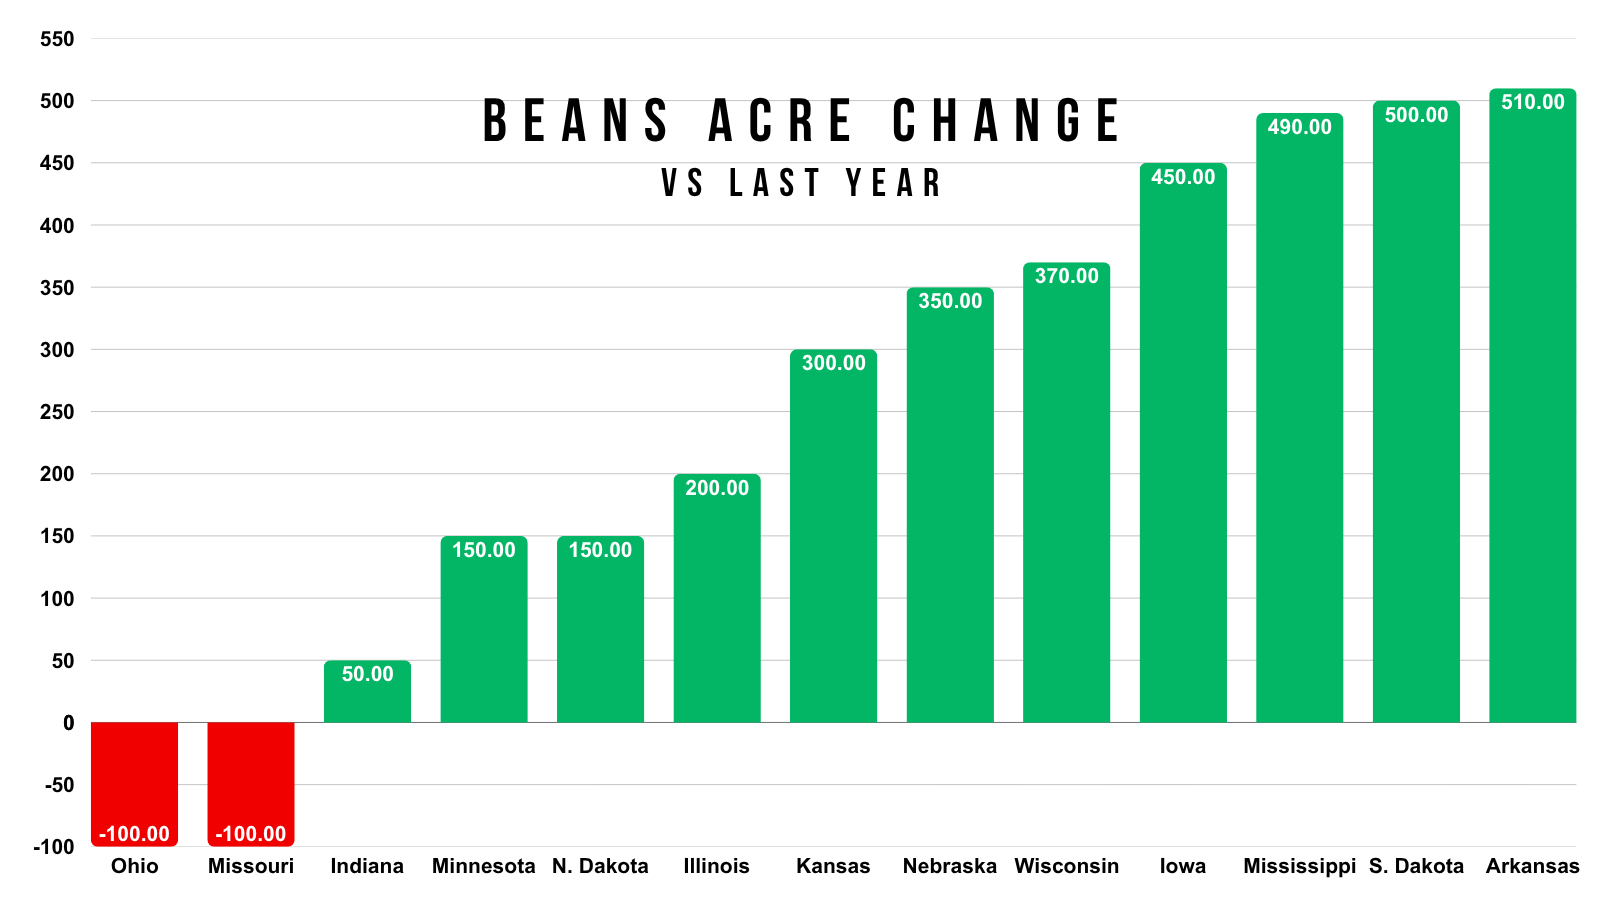
Here is a state by state breakdown on how they see soybean acres changing from last year.
They expect almost every state aside from Ohio and Missouri to plant more this year.
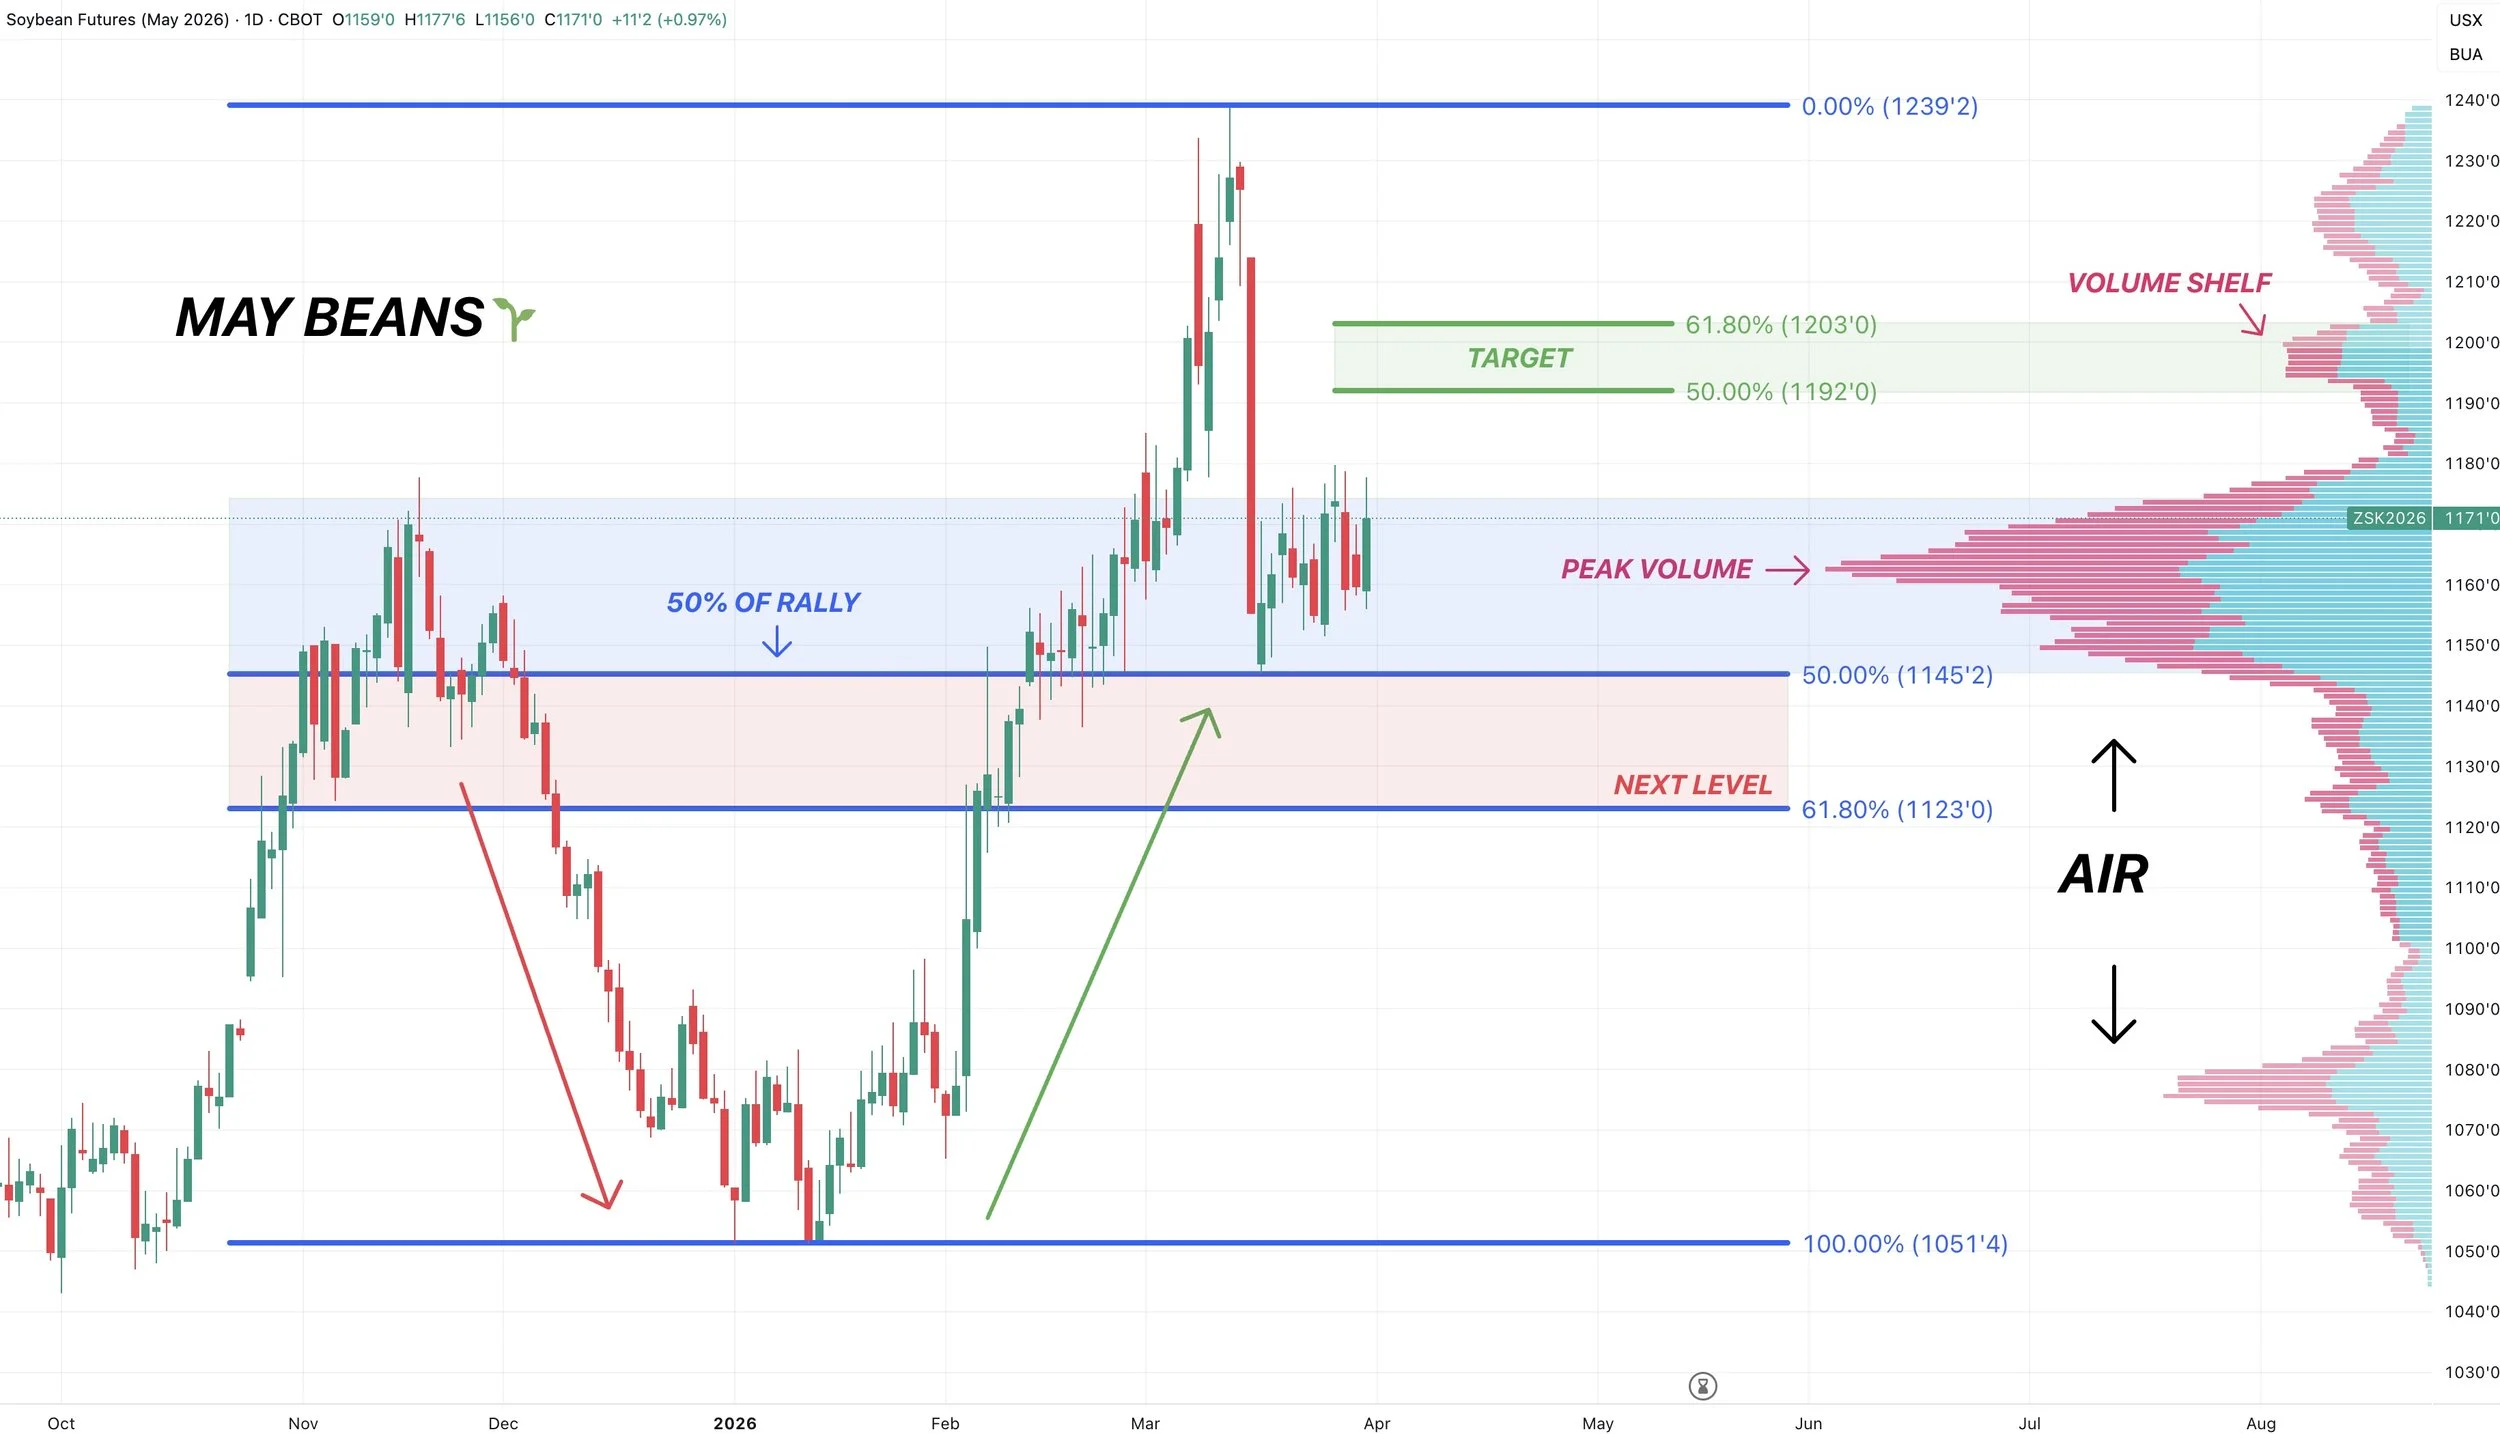
May Beans Chart:
We continue to find support right where we need to.
At that big area of volume after giving back 50% of the entire rally.
We've been completely sideways for 2 weeks now.
If we can bust above this range, we are looking for a move towards $11.90 to $12.00
That claws back 50-61.8% of the sell off and is the next area of high volume.
On the flip side, we still need to hold $11.45 to prevent a leg lower. There is virtually no support beneath that level.
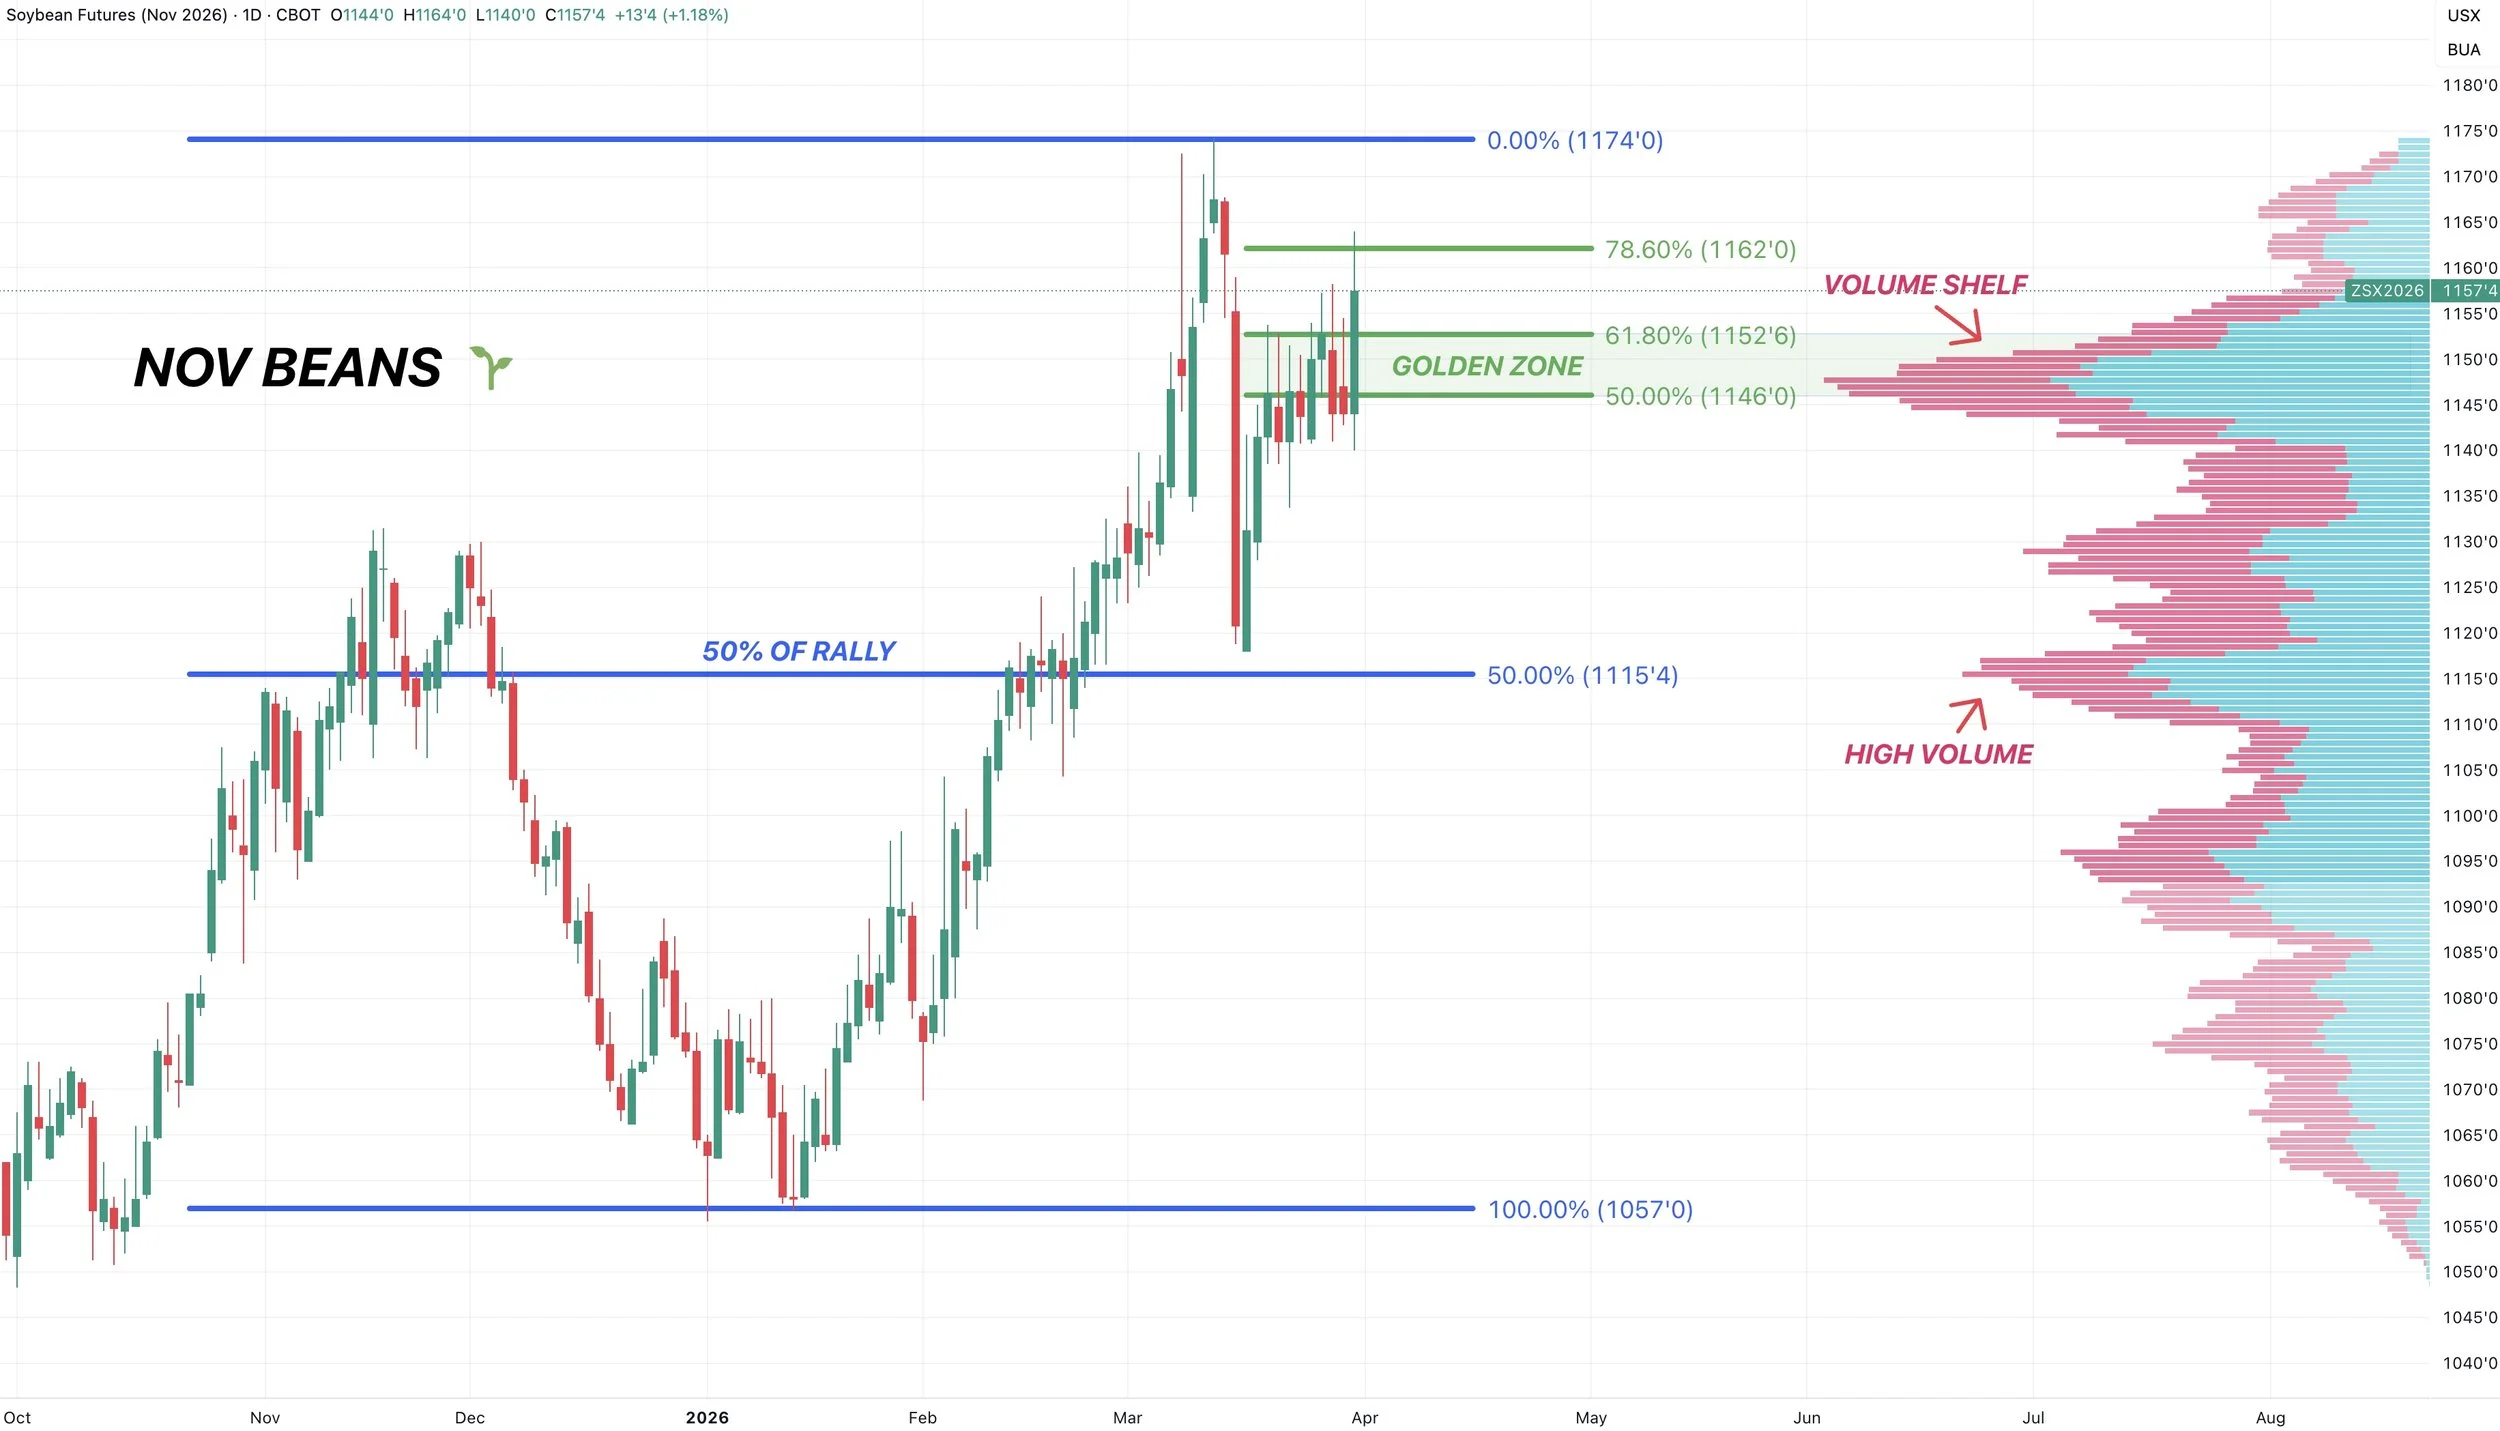
Nov Beans Chart:
We actually did manage to take out the 61.8% level from the recent lows up to those highs.
That was the level we rewarded, as it's the most common area to struggle. But the USDA potentially gave us a boost.
Not all of the time, but often times if you get consecutive closes above this level it tells us that this is more than just a relief bounce and we could challenge the highs.
Wheat
Lowest Wheat Acres Ever:
Wheat probably had the most friendly report of the grains.
Total wheat acres came in at 43.78 million.
Which was 1 million lower than the trade was expecting, and well below the Feb Outlook's 45 million.
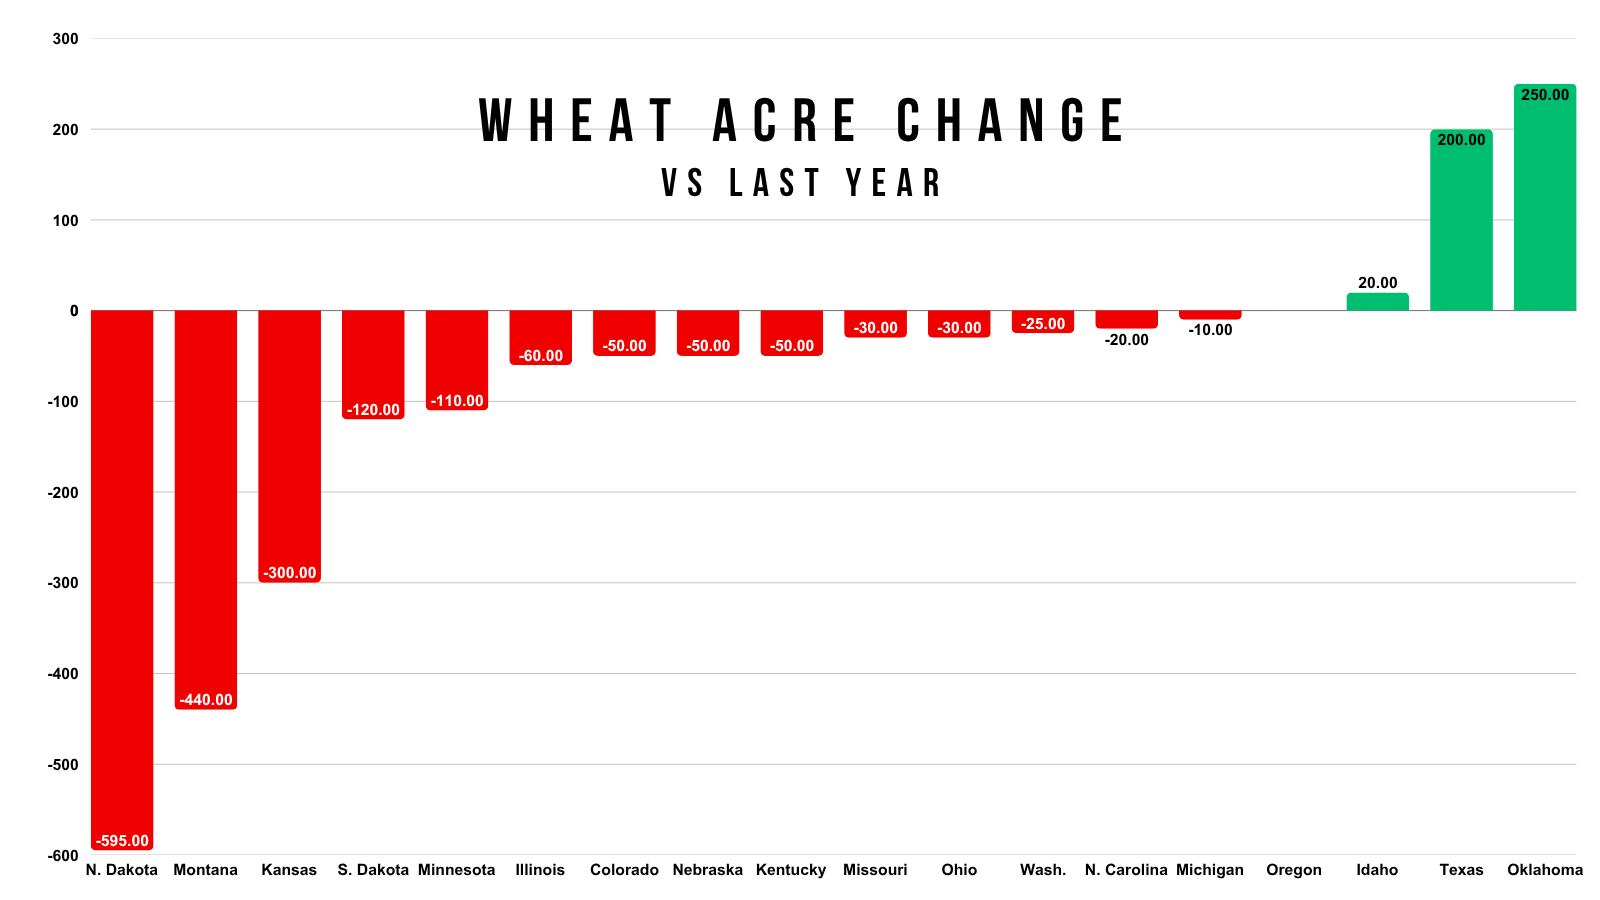
Here is the state by state changes vs last year.
Only Texas and Oklahoma are expected to plant more than last year.
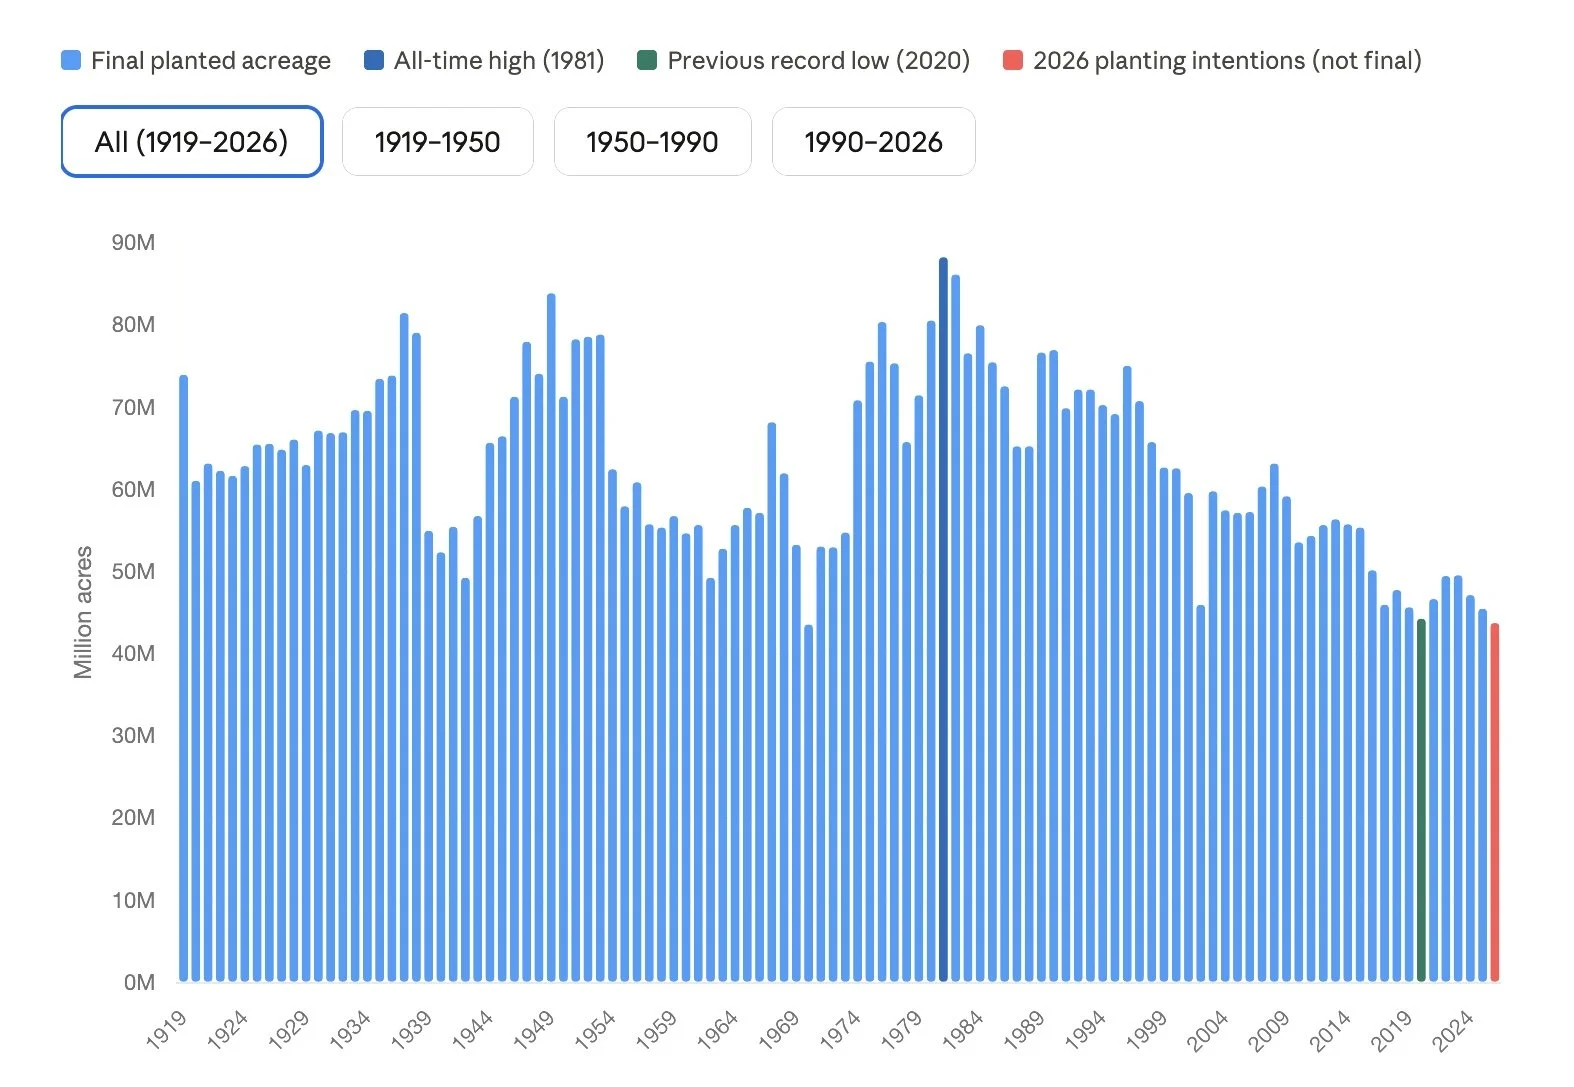
Those planted acres would be an all-time low for wheat.
They started tracking planted acres in 1919, over 100 years ago.
This number would be the lowest ever.
So that is of course a bullish item for wheat if it materializes.
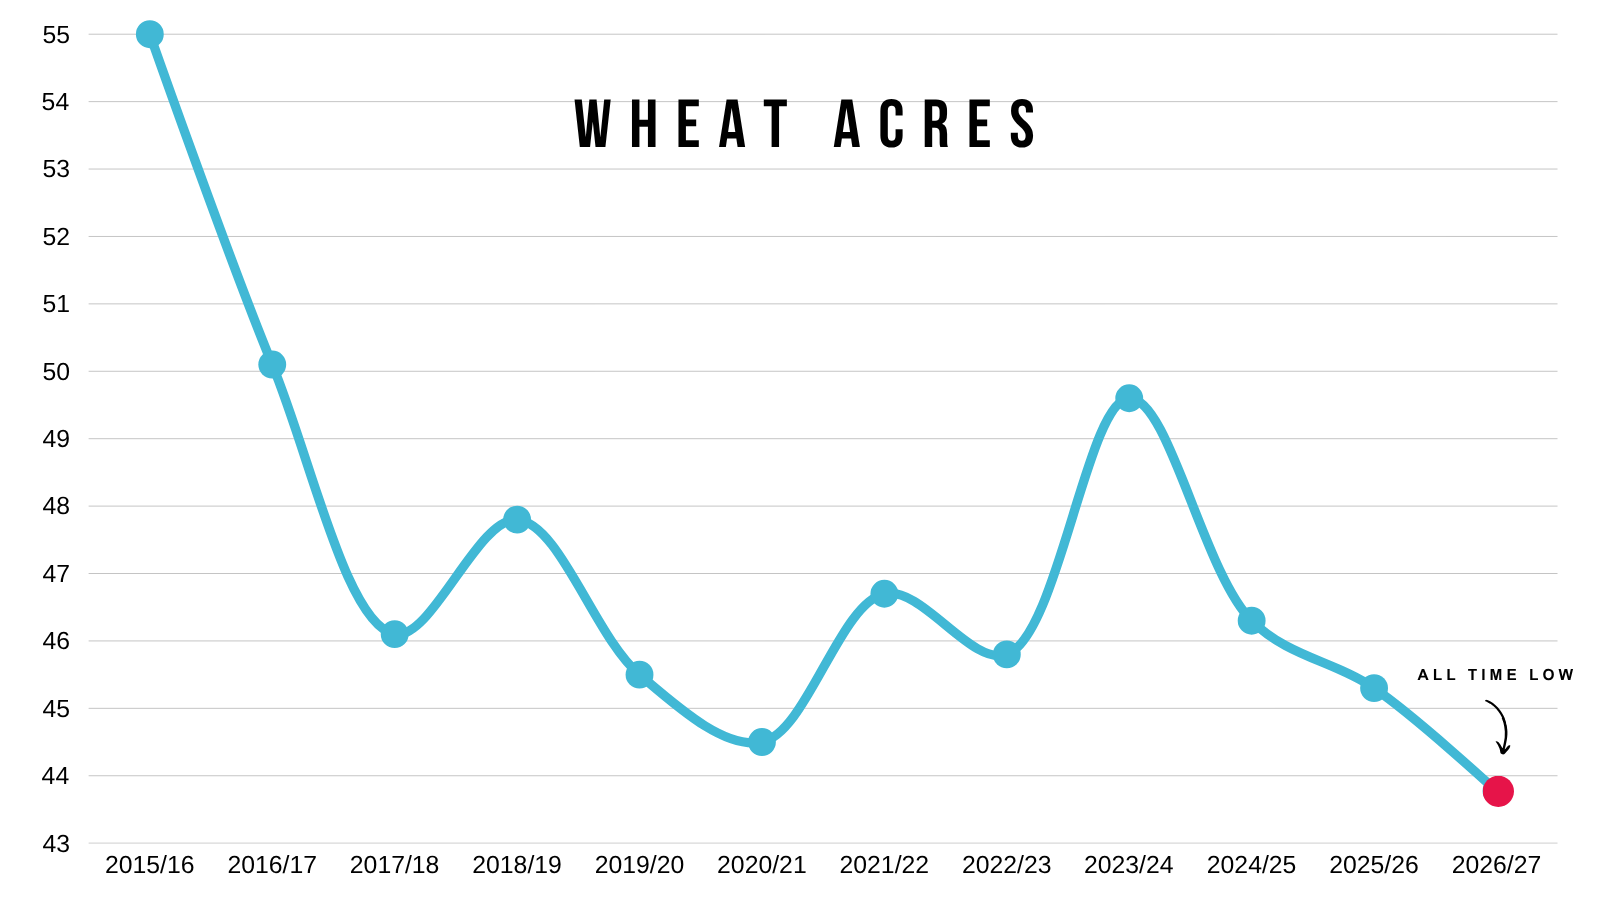
Here is what the data looks like if you zoom out to 1919.
It's been a steady decline since the 80's.
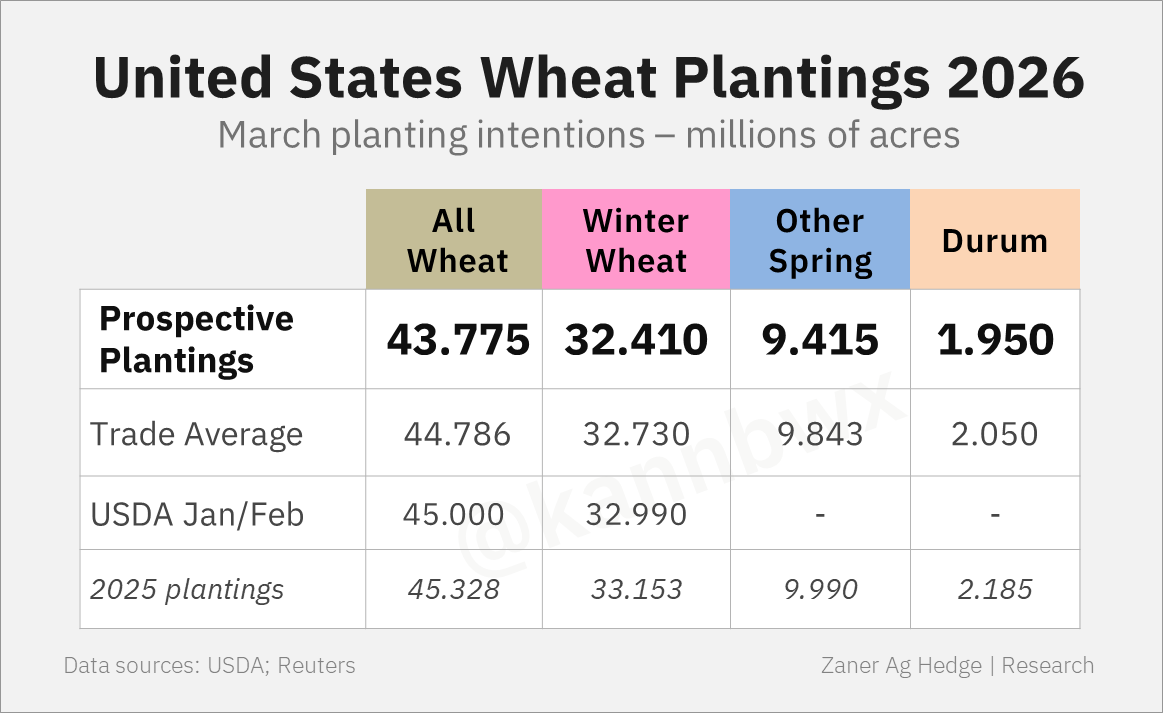
Here is all of the wheat planting intentions.
Total wheat acres are expected to be down around -3% vs last year and at an all-time low.
Spring wheat acres are expected to be down -6% from last year. This number would be the lowest in nearly 60 years for spring wheat.
Chart from Karen Braun
Weather Premium:
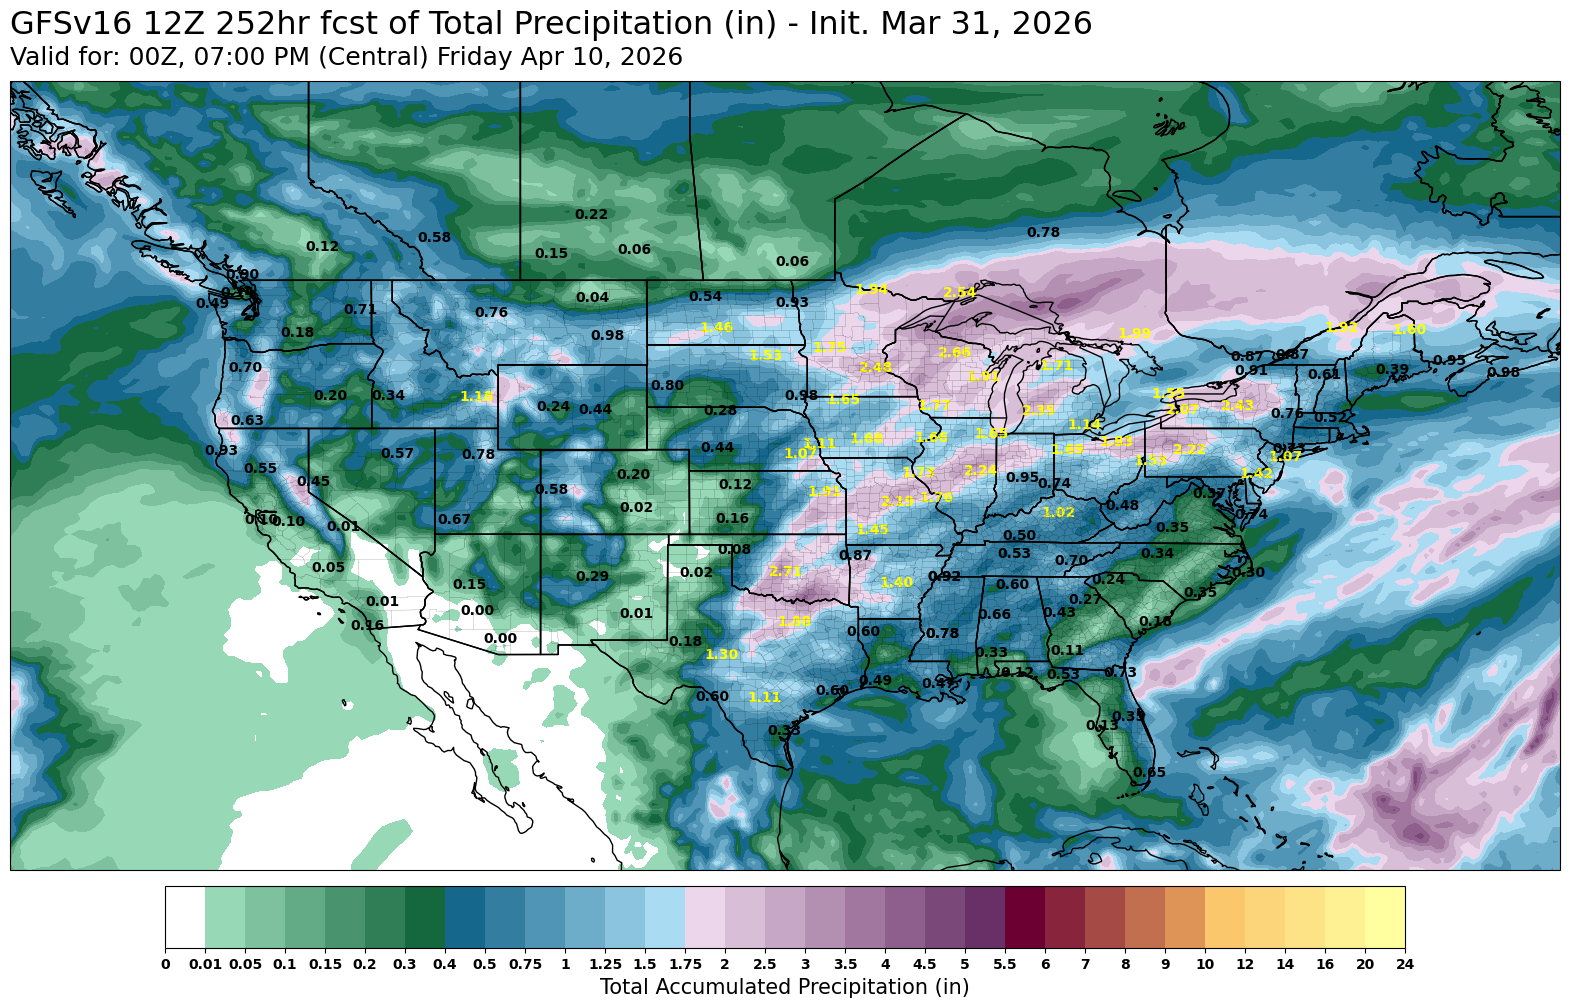
Wheat is still being driven by some drought.
The corn belt is scheduled to get plenty of the rain the next two weeks, but it looks like some of those winter wheat regions are going to be missing out.
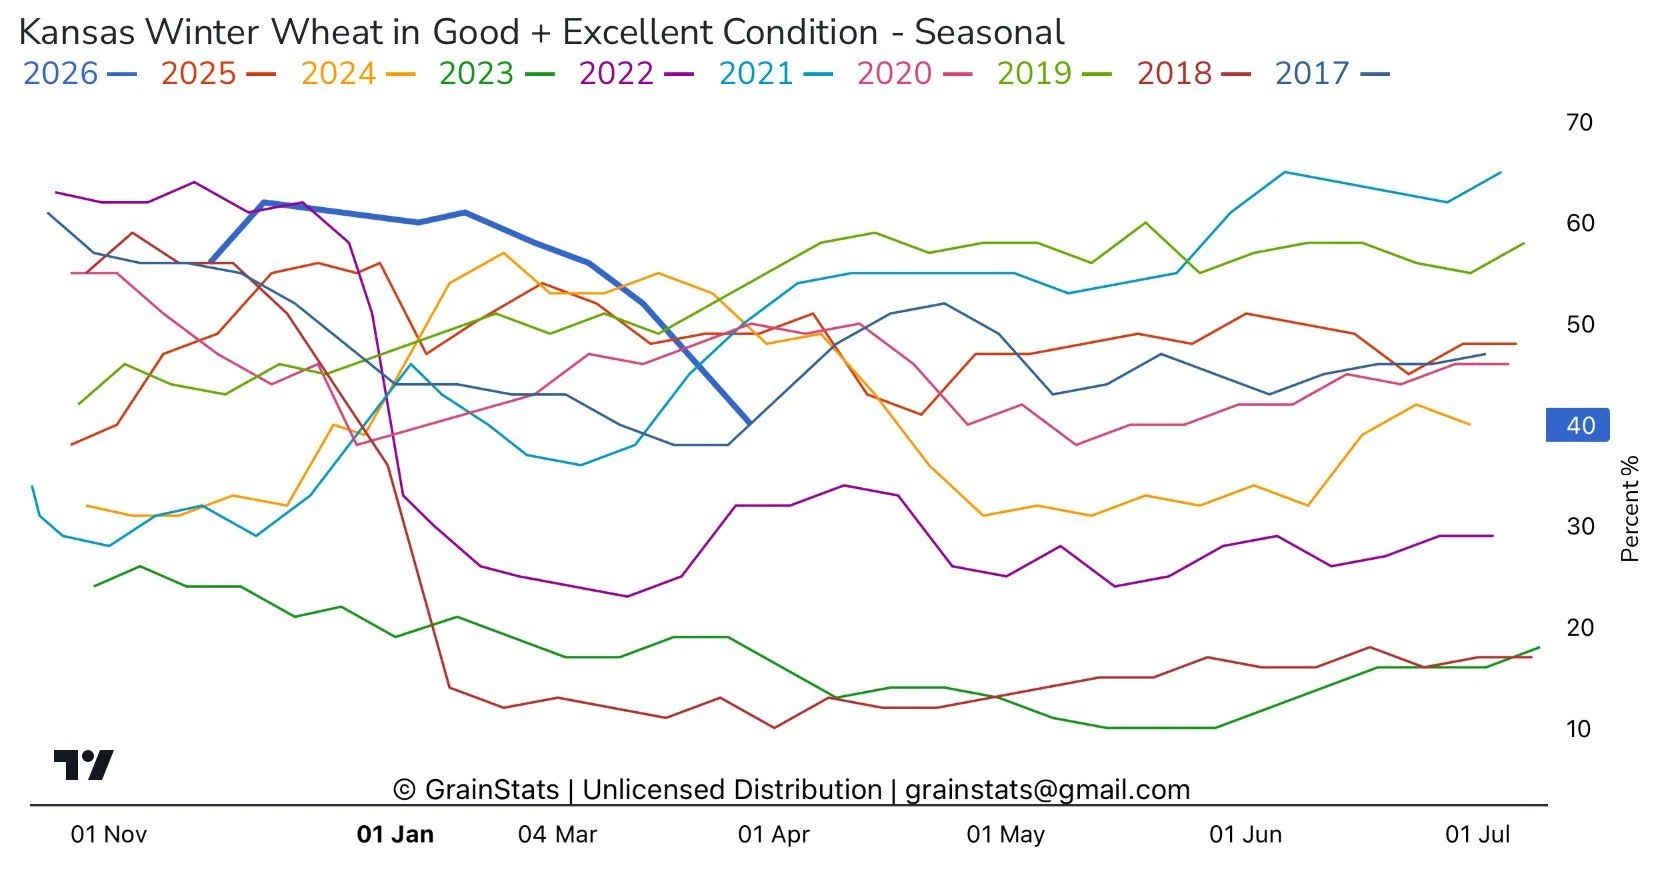
Here are two nice charts from GrainStats.
The first is Kansas winter wheat ratings.
40% of the crop is rated G/E and has been on a decline all year long.
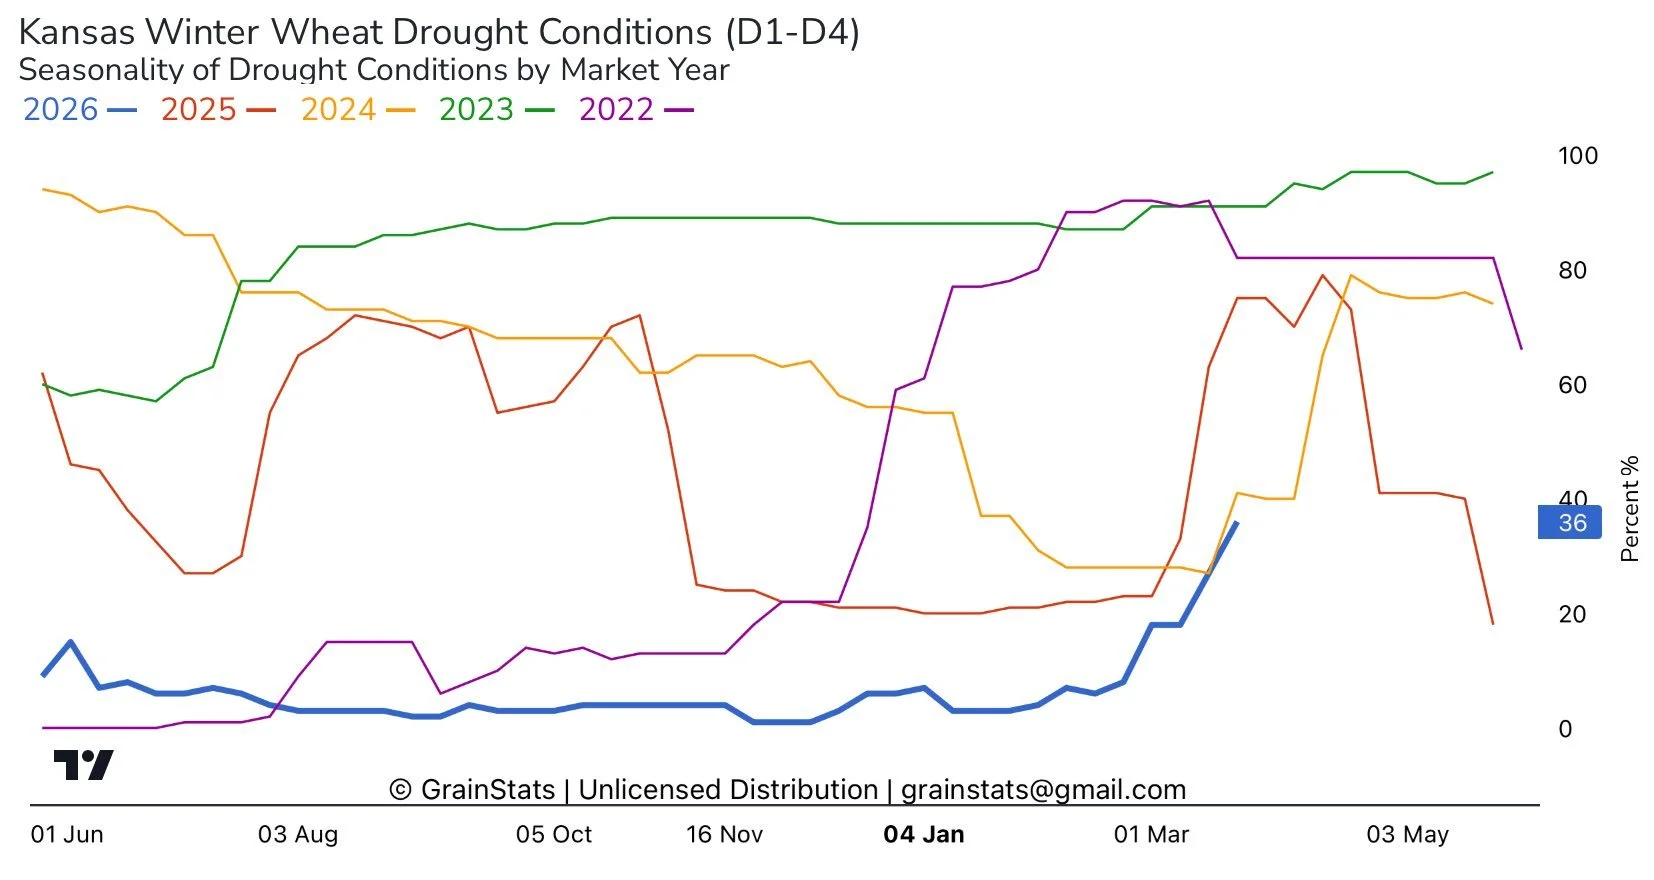
The 2nd chart is Kansas winter wheat areas in drought.
It's also starting to ramp up.
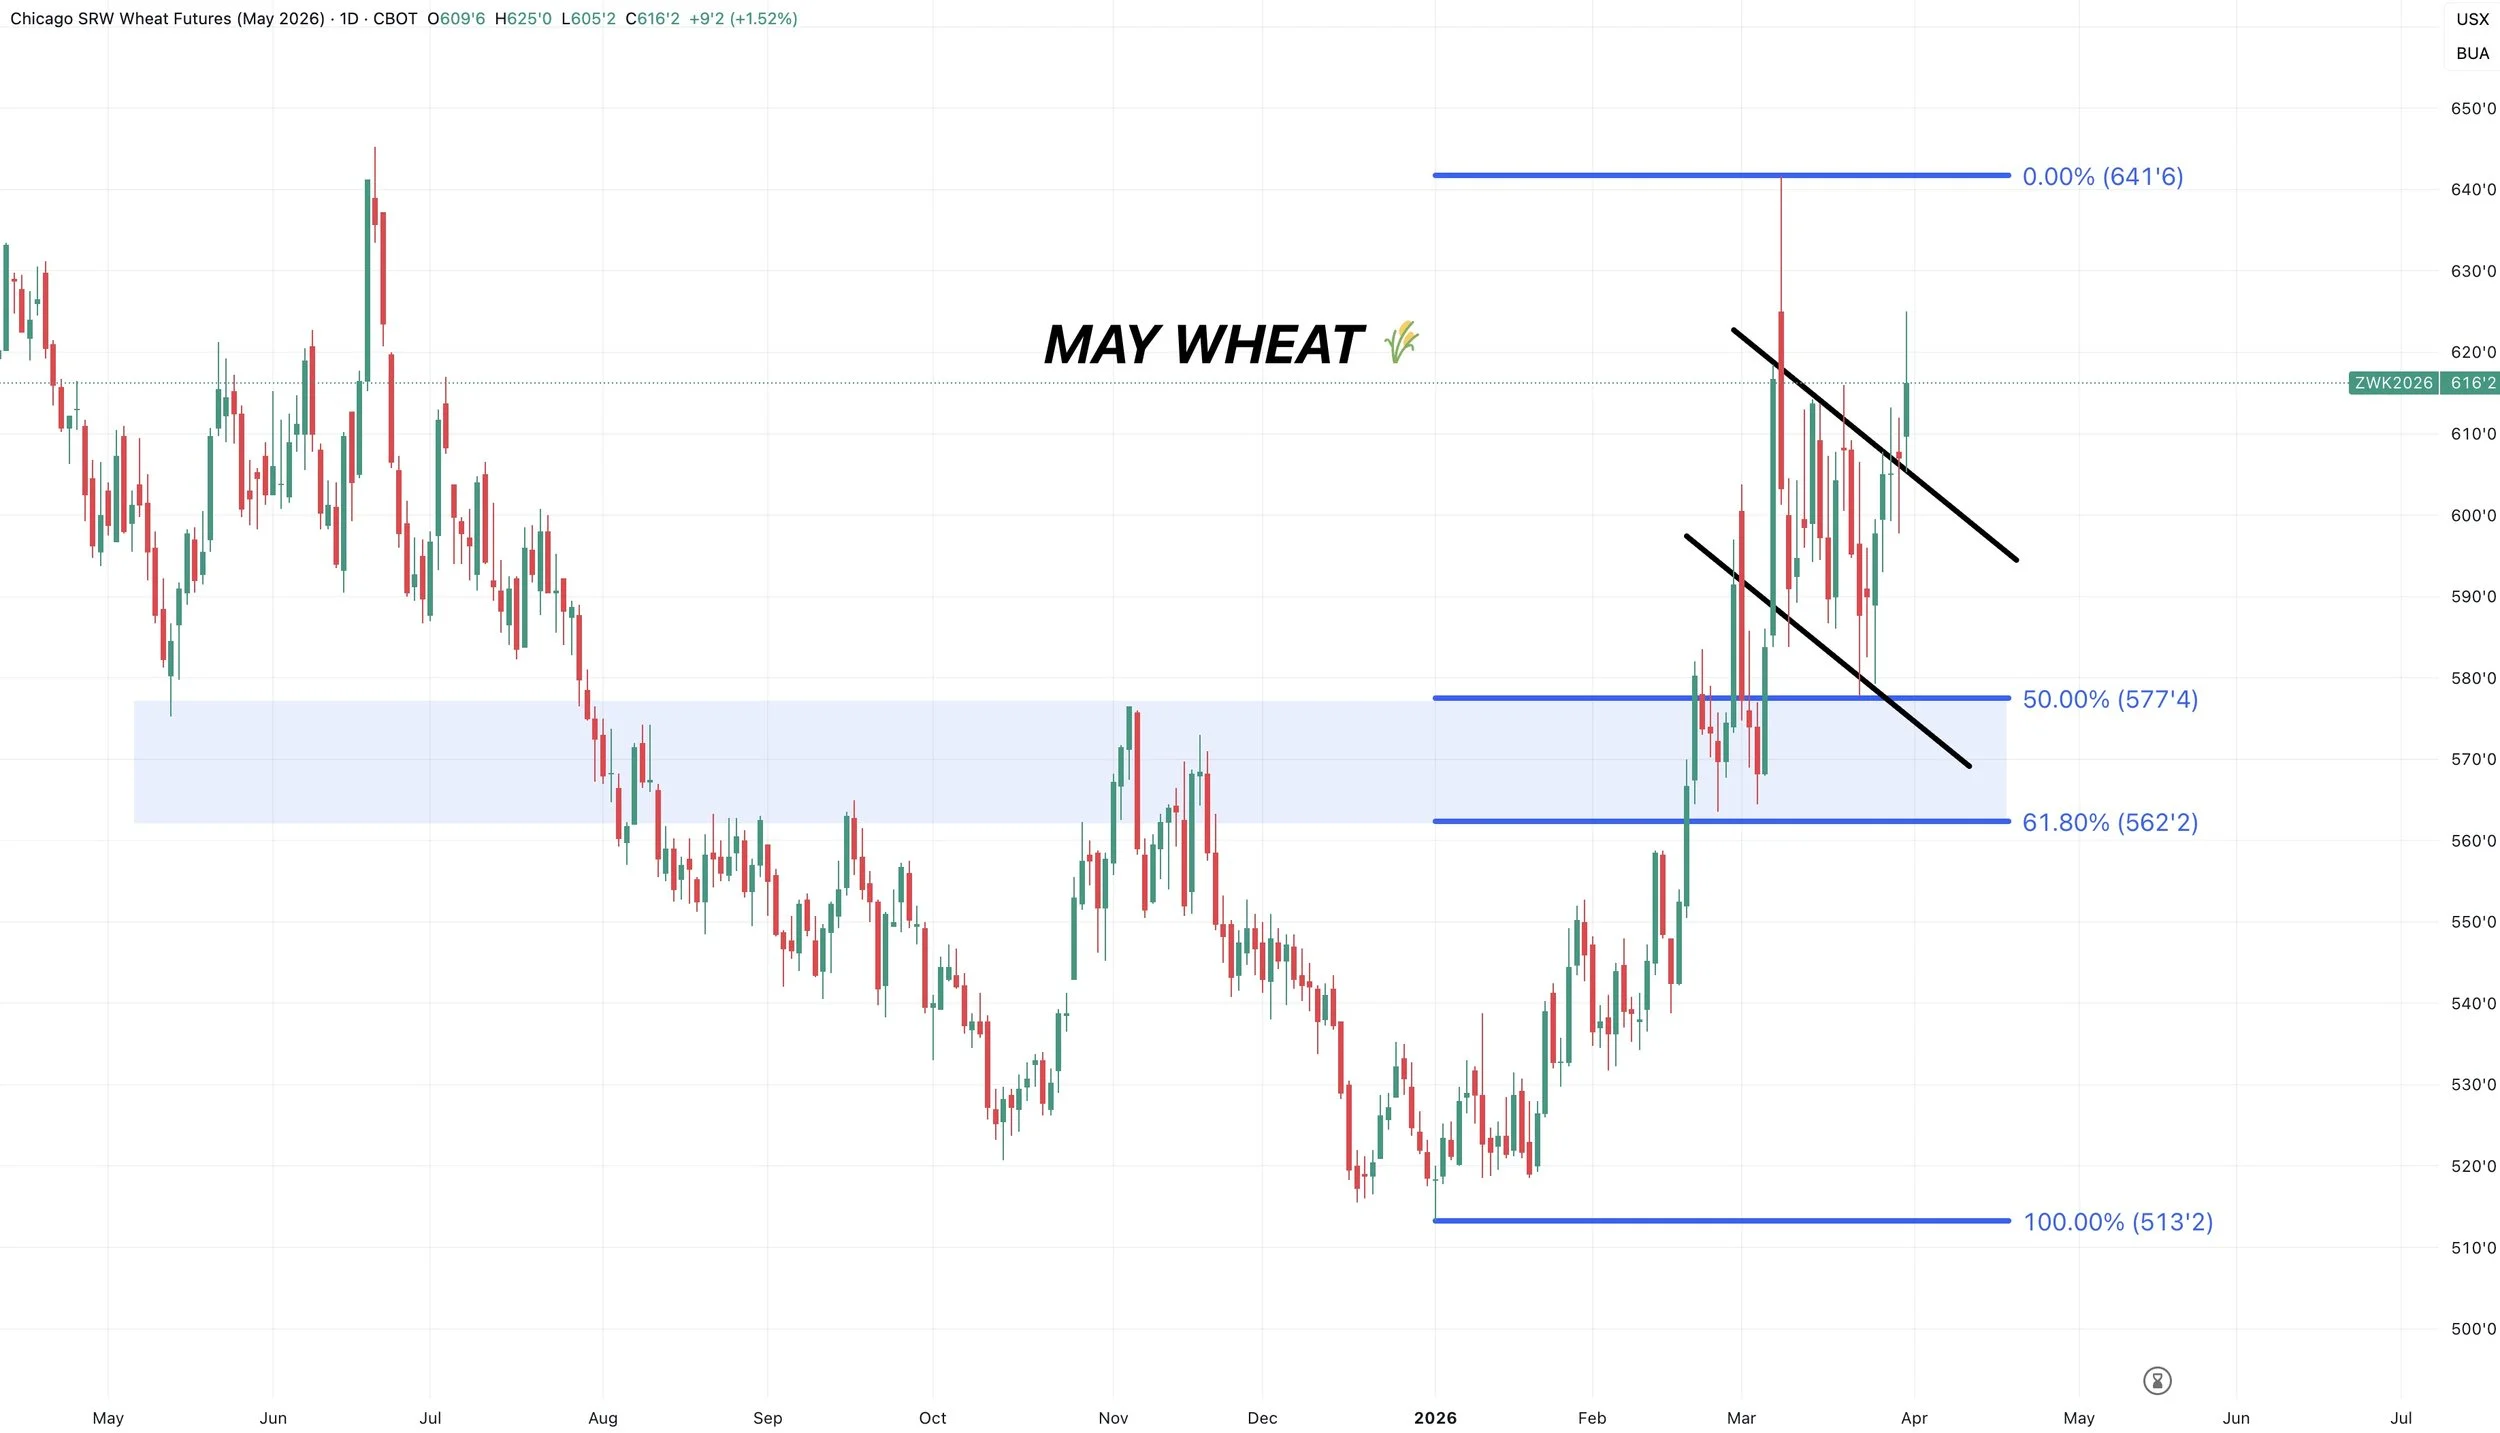
May Chicago Chart:
Let's look at Chicago here first.
We bounced after giving back 50% of the rally.
We have somewhat of a flag formation going on here.
It looks like a break out is potentially under way.
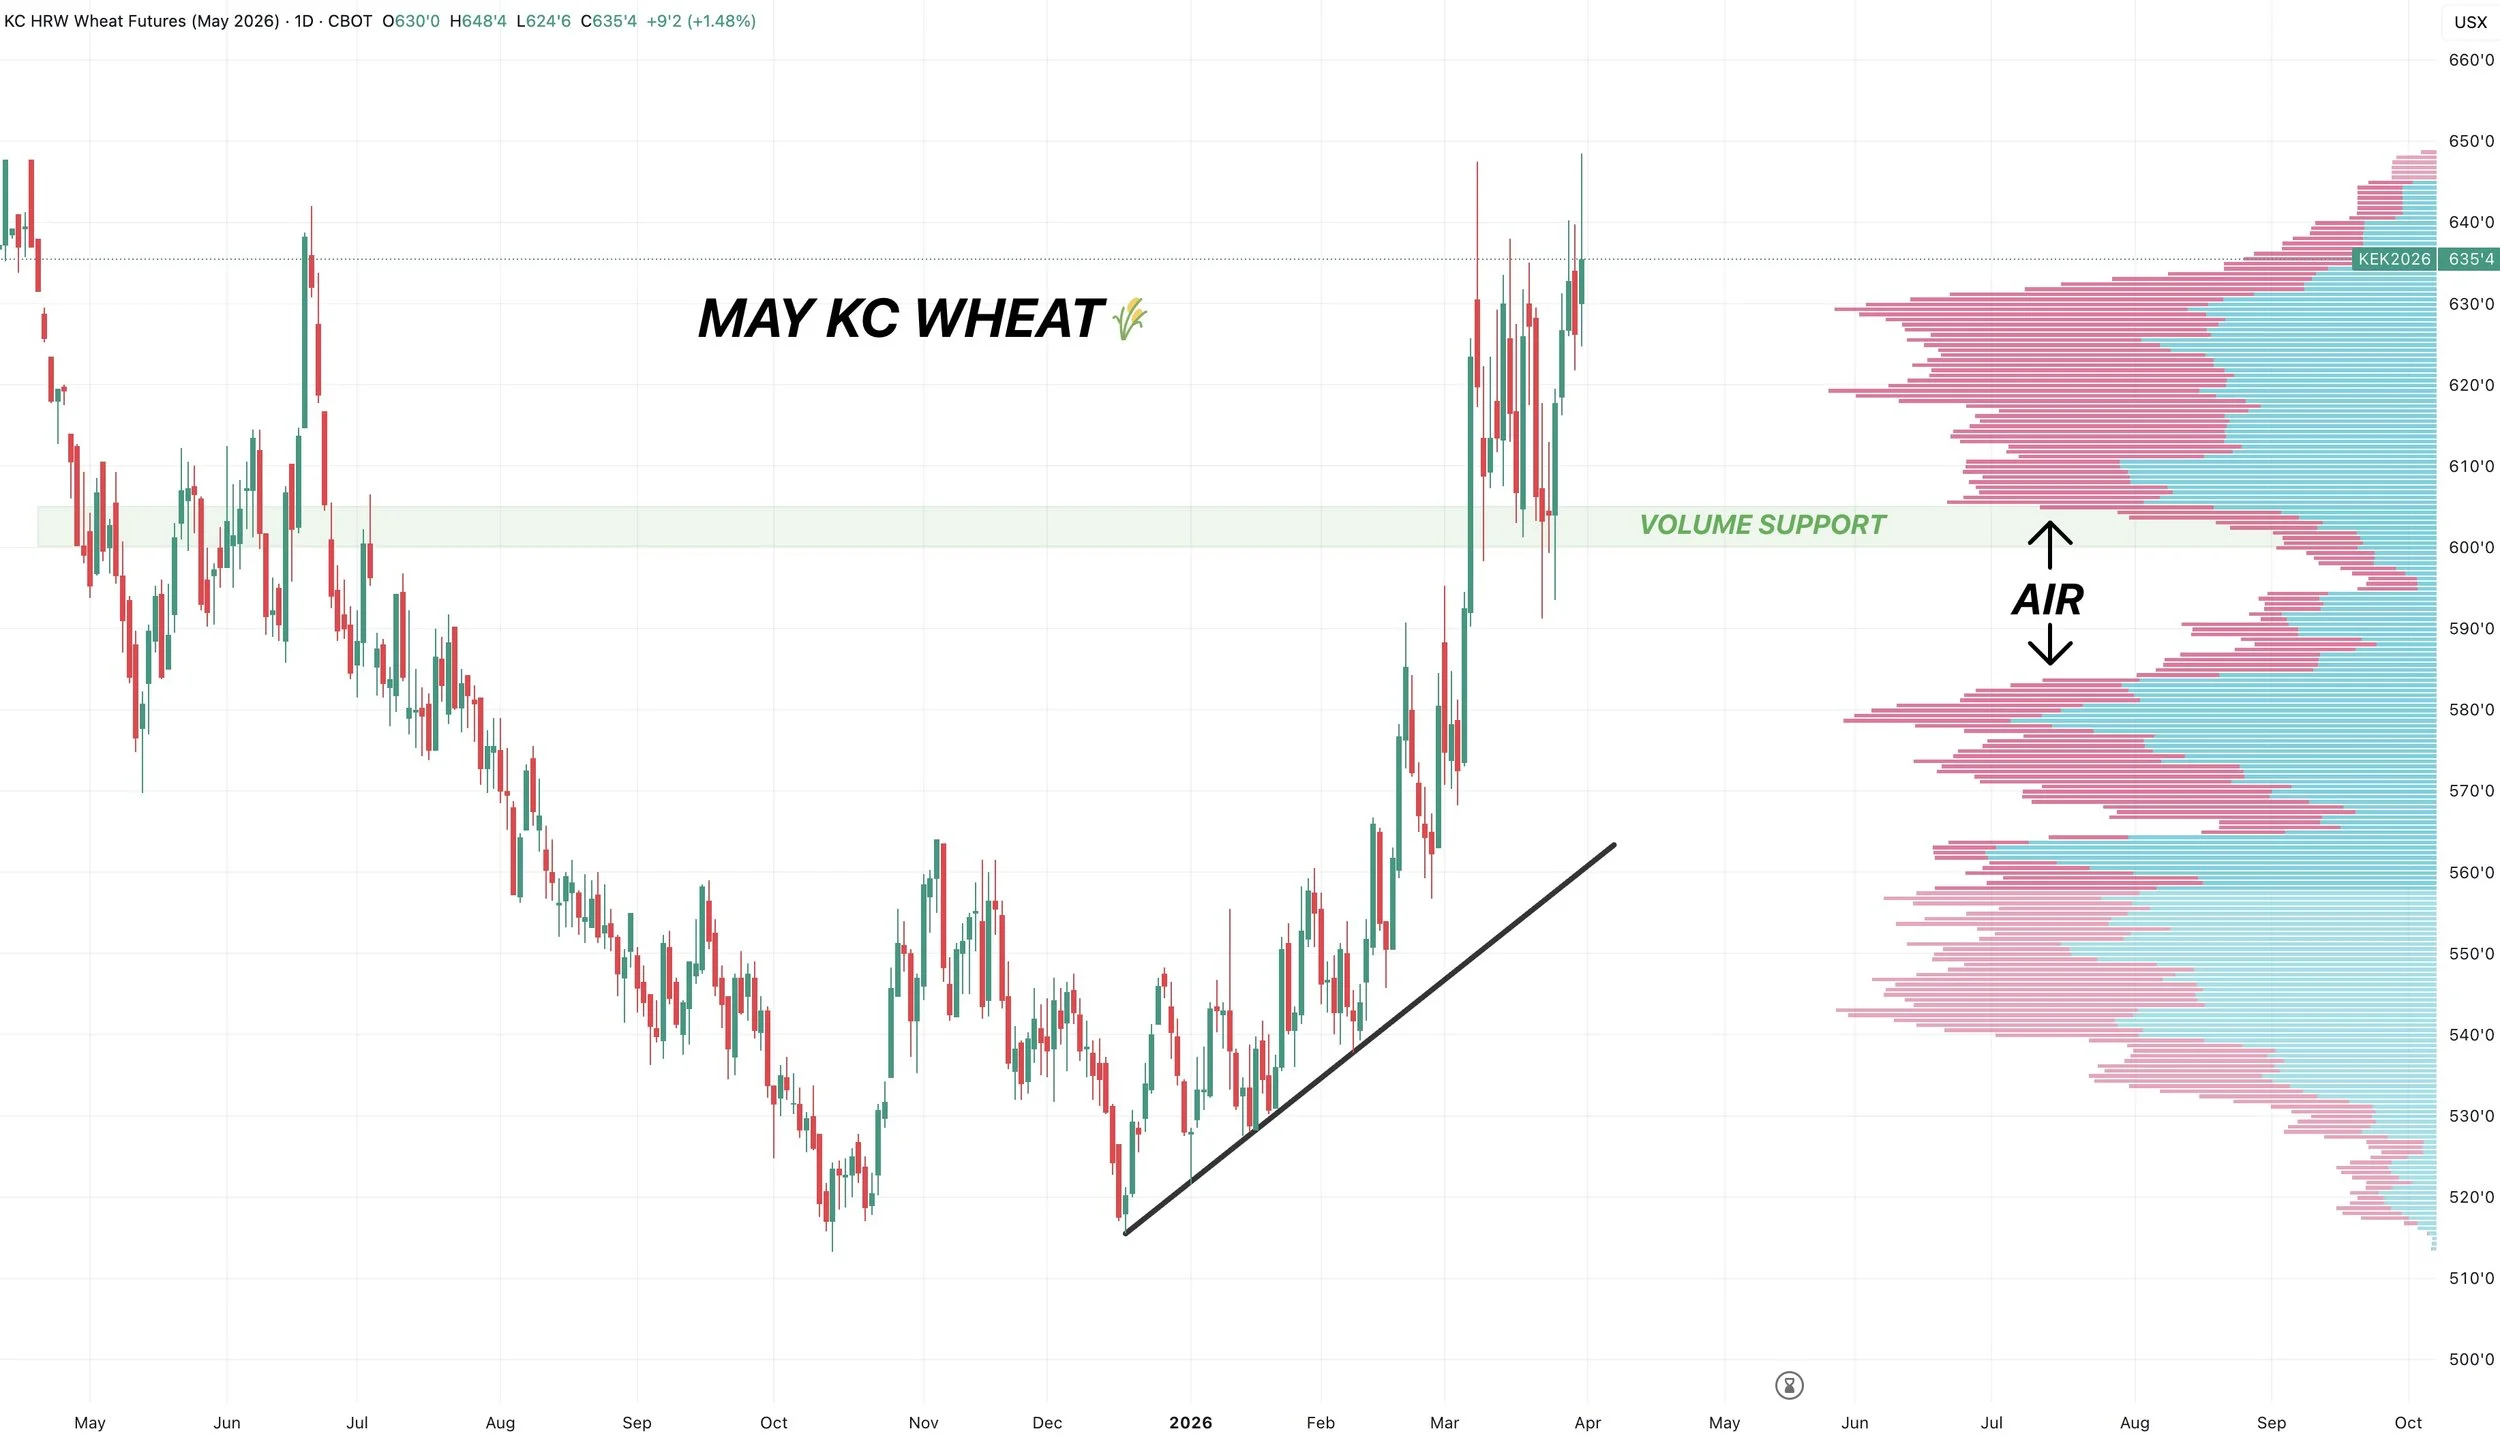
May KC Chart:
Last week we held right where needed to at that key support and area of high volume.
KC posted new highs today despite closing well of the highs.
We already took some chips off the table at this level earlier in the month.
If we continue higher, I am currently playing my next target by ear for now.
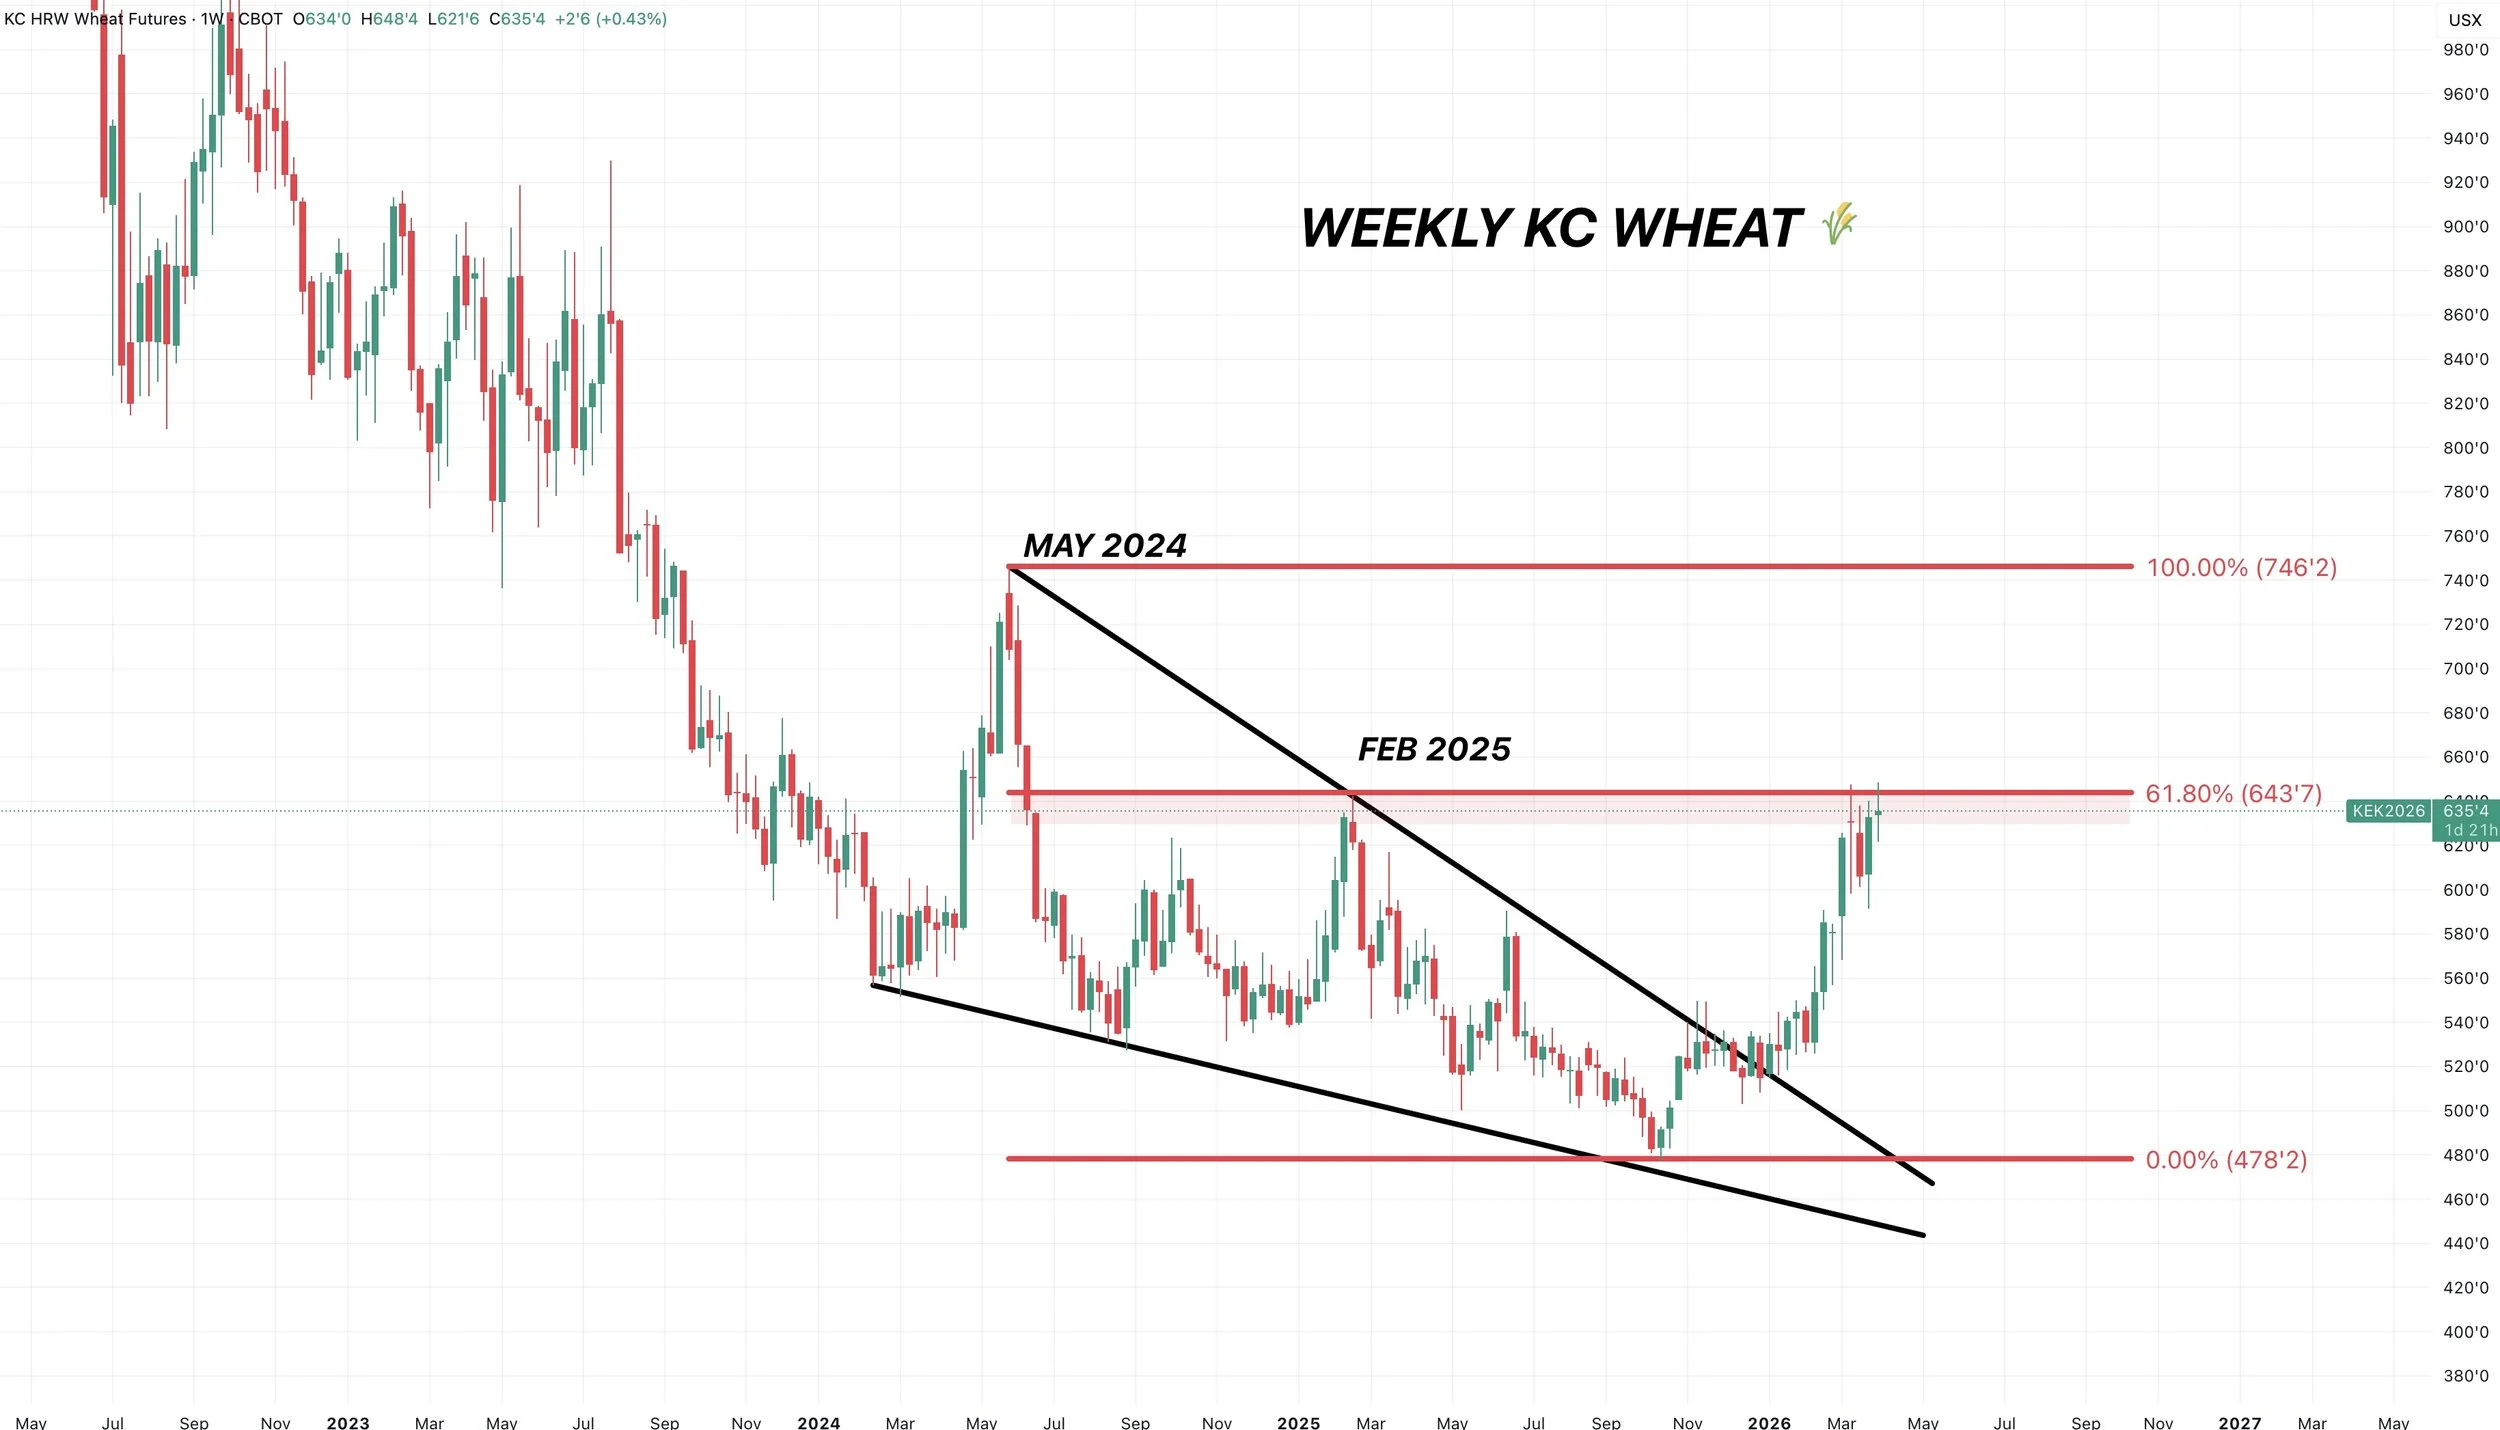
Continuous KC Chart:
Here is the front month chart.
We are right up against those Feb 2025 highs.
This is also 61.8% of the May 2024 highs.
This is still some big resistance hence why we already took some risk off at these levels a few weeks ago.
But if you break above here it looks like we could have some serious potential room to run.
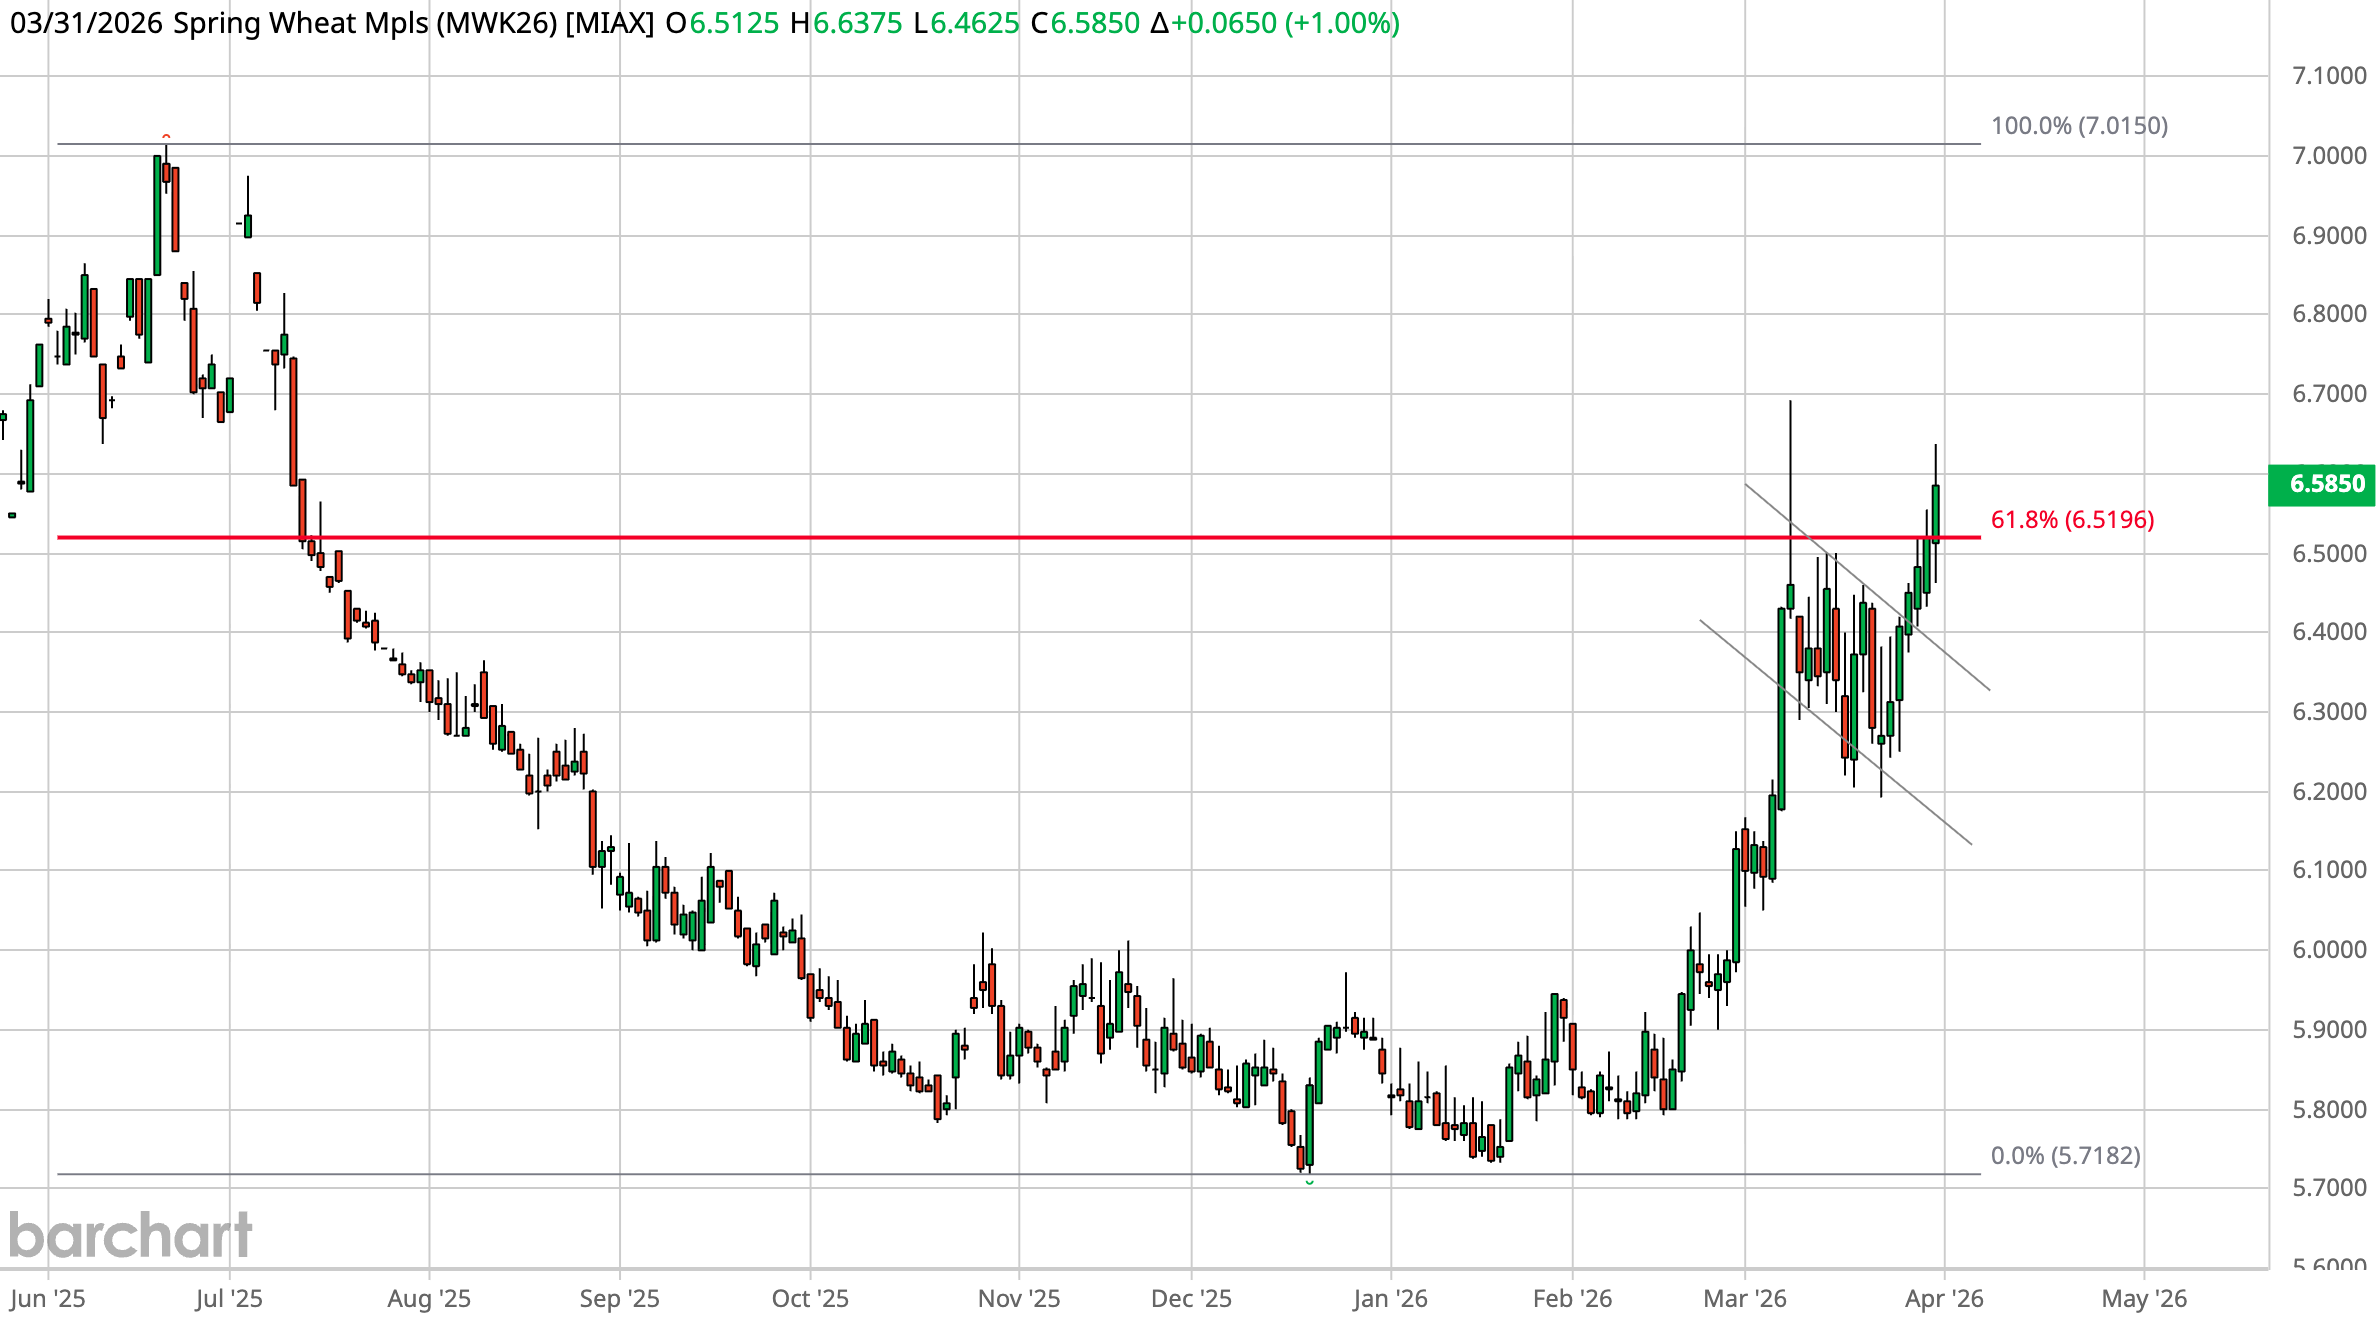
May MPLS Chart:
I apologize for the poor chart here, as my platform I use doesn’t offer MPLS.
New high close in MPLS.
We took out 61.8% of the June highs. A potential sign of further upside.
Also looks like we're breaking out of a possible bull flag.
Chart looks positive for now and suggests more upside is possible.
Cattle
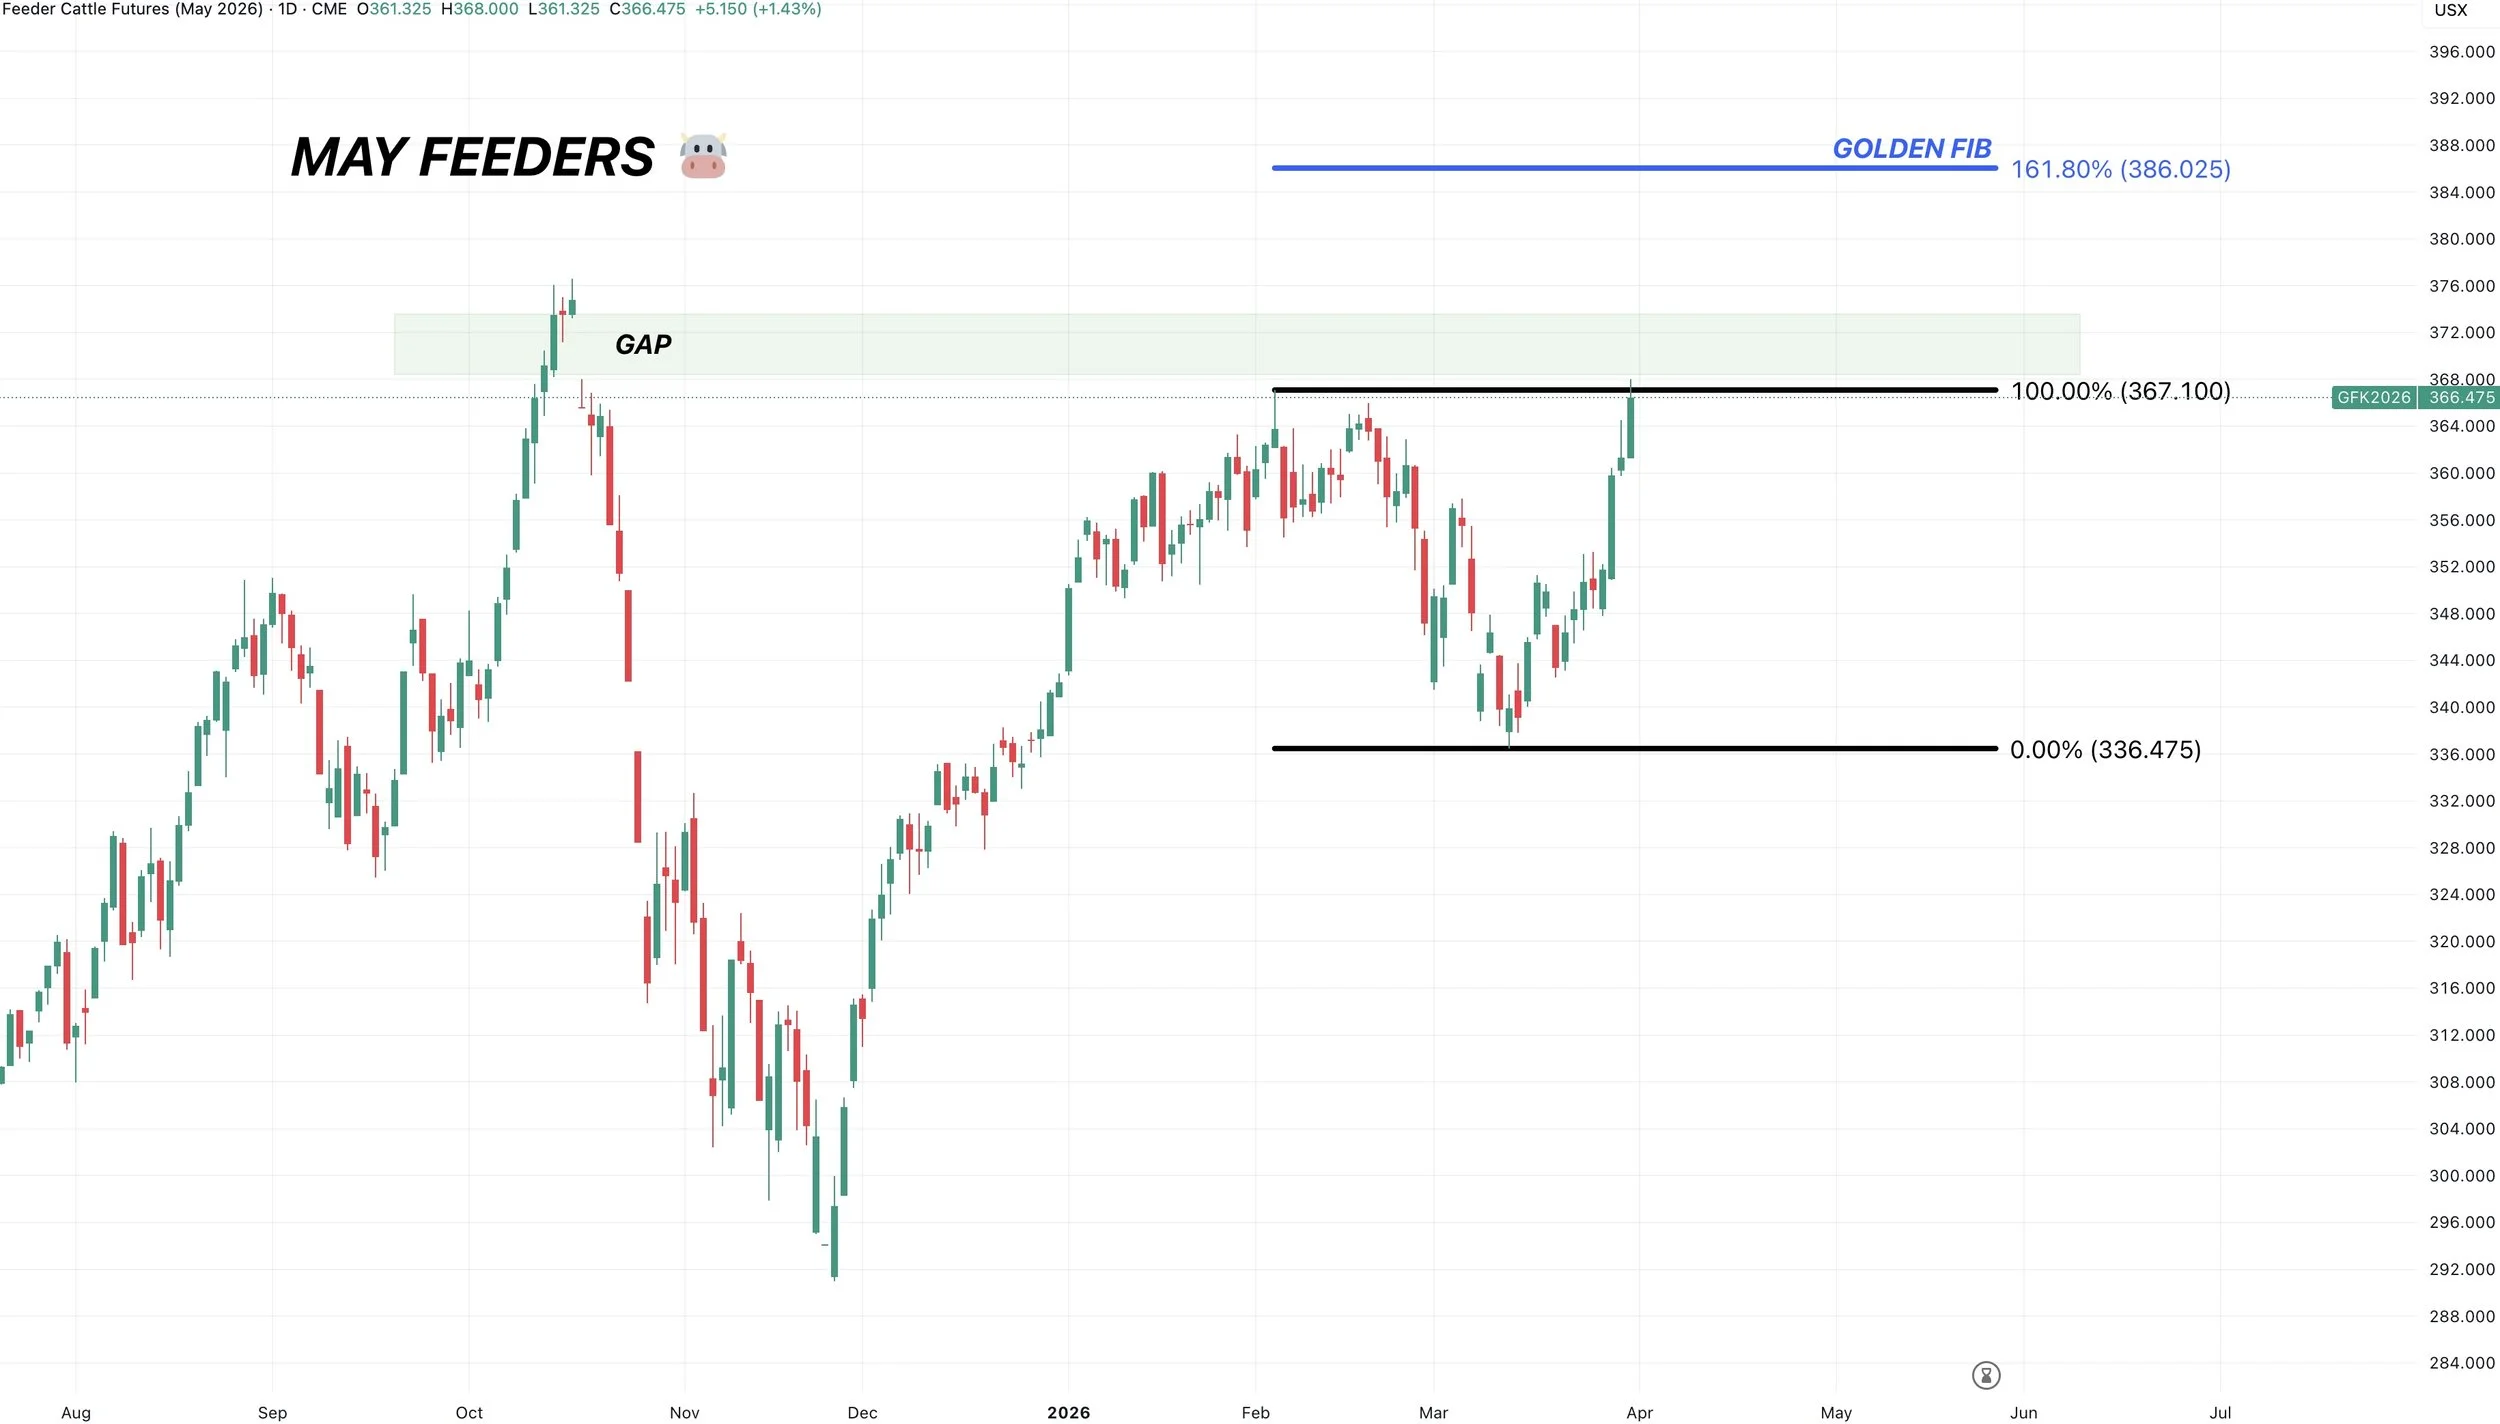
May Feeders Chart:
Today's update was about the grains, but cattle continue to run.
As we posted new highs for the year.
I still see headline risk in this market so I don’t want to be unprotected on this rally.
But the most obvious next target has to be that unfilled gap sitting just over 373.
The secondary target would be the golden fib extension from the recent sell off.
161.8% of the recent lows up to those Jan highs comes in at 386.
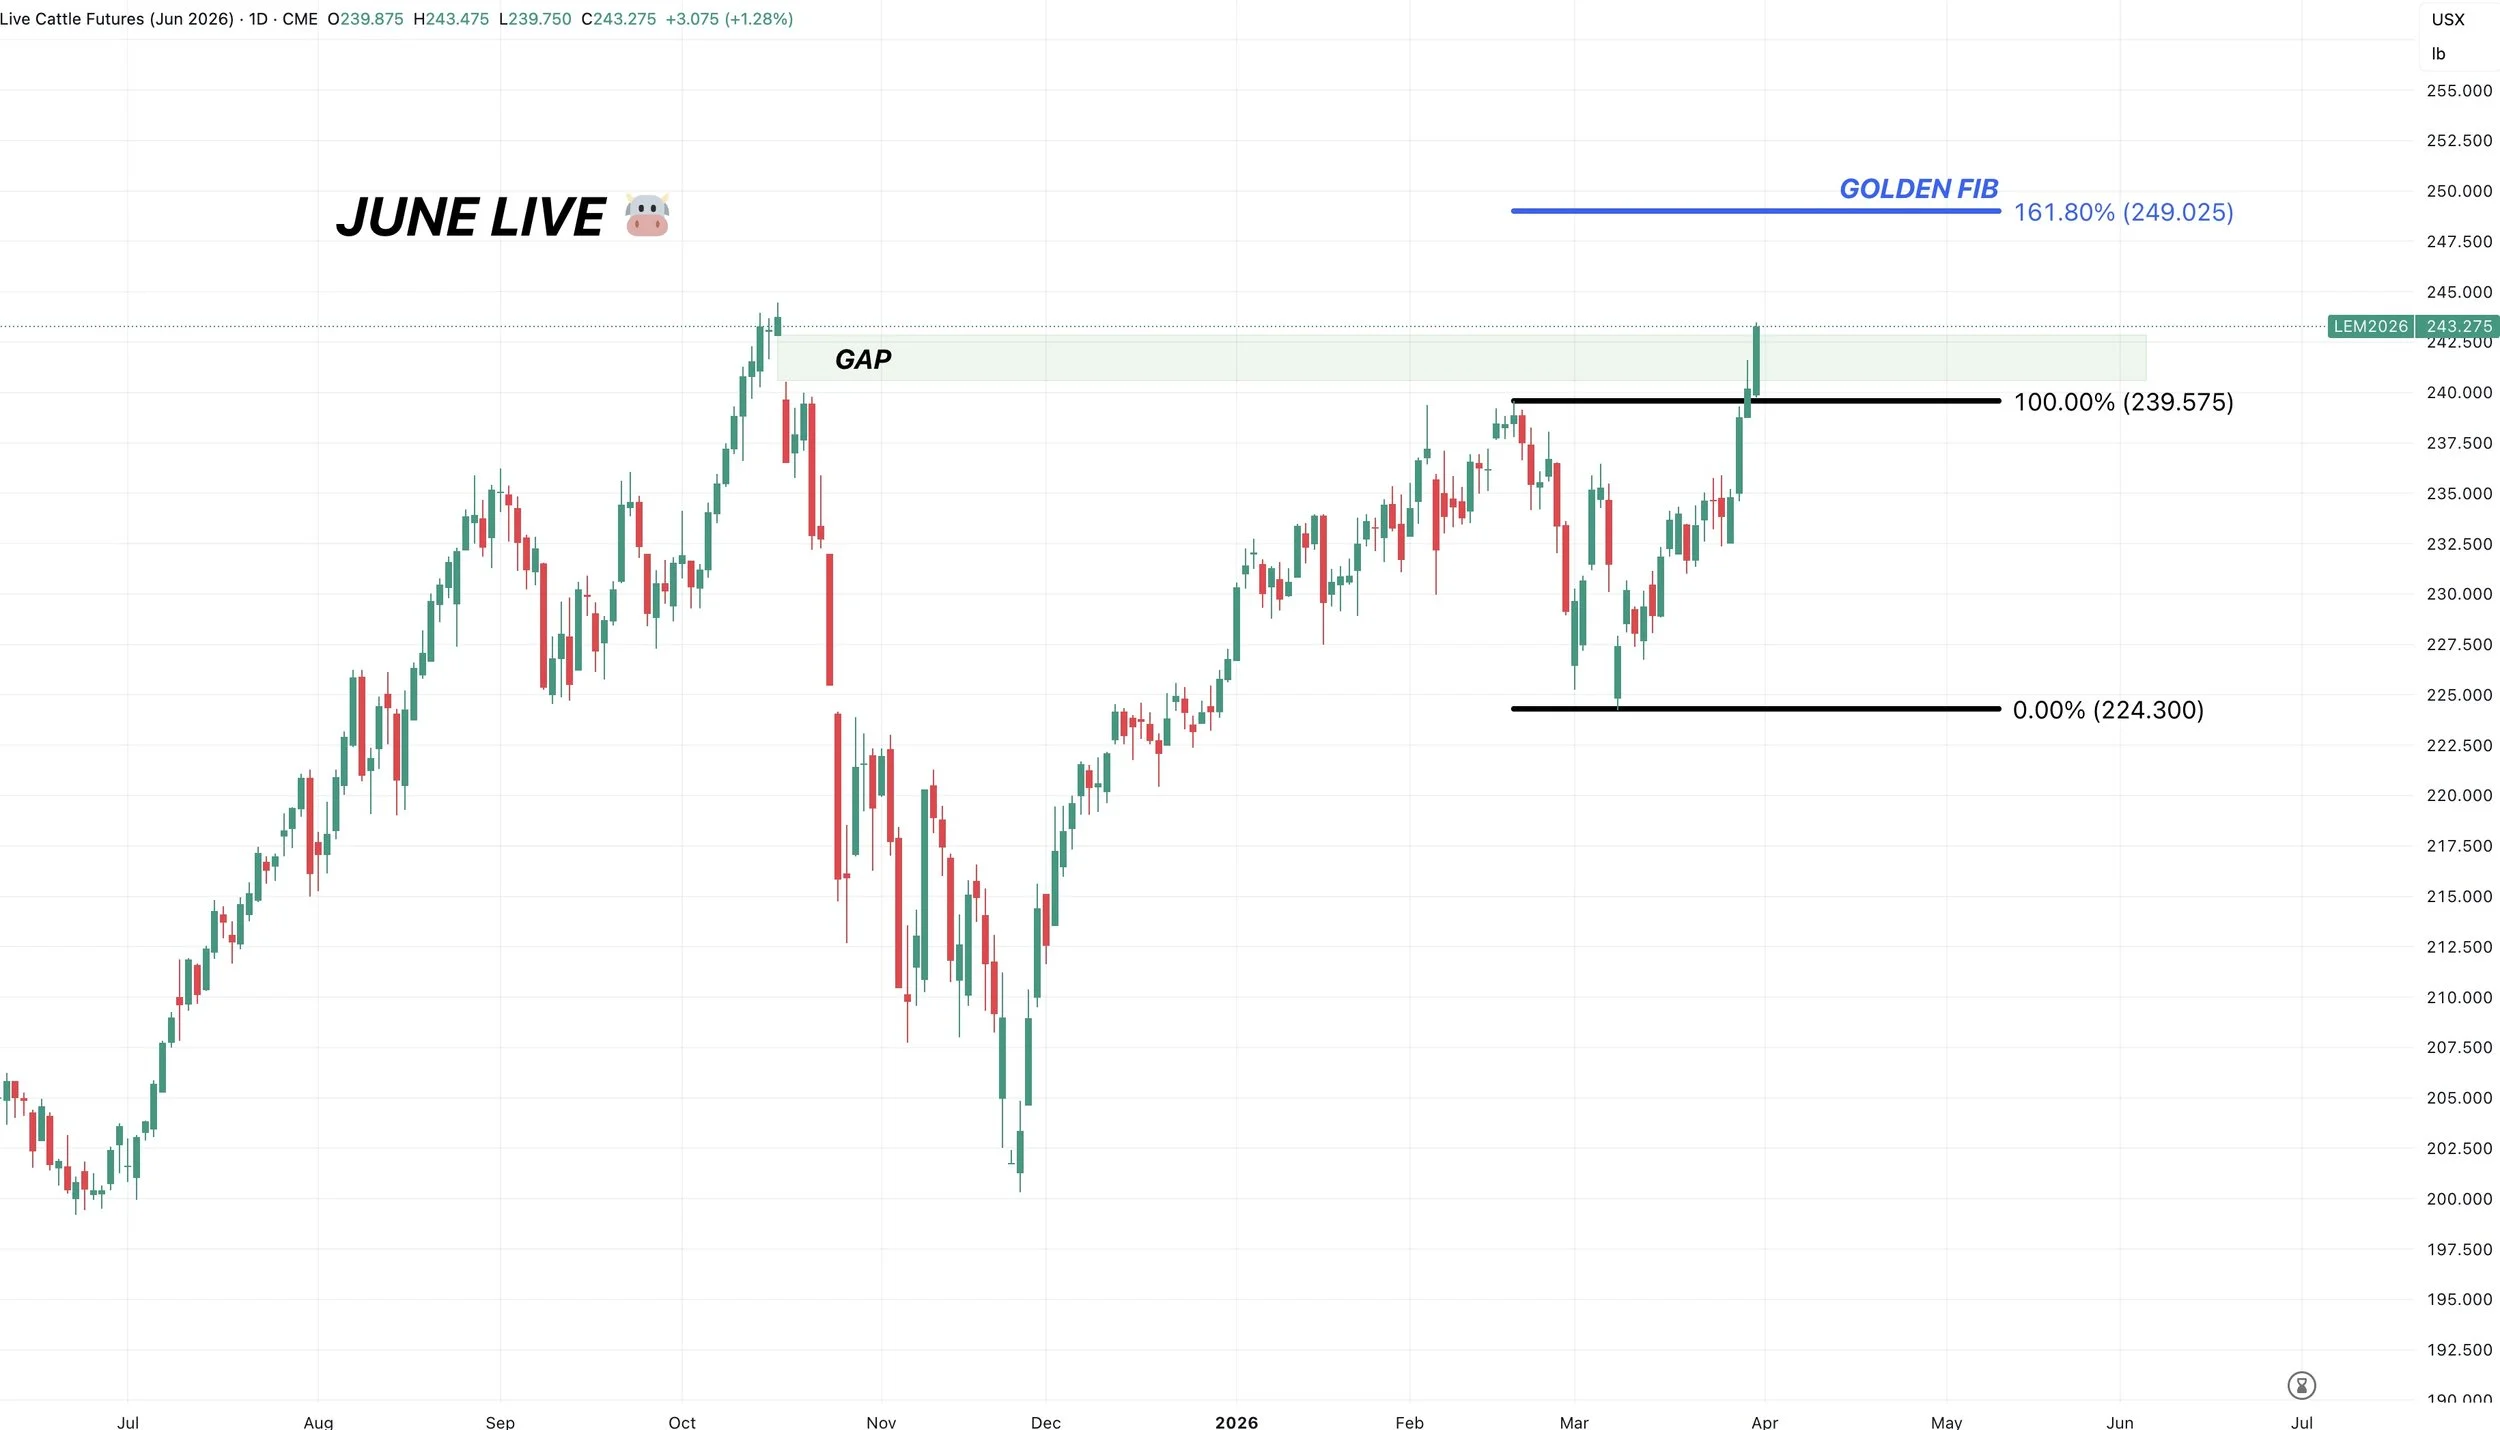
June Live Chart:
New highs on this contract.
We did fill that gap from October.
So if you don’t have any protection, I like having some here.
The secondary target would be the golden fib extension of the recent sell off.
Which comes in at 249.
Want to Talk?
Our phones are open 24/7 for you guys if you ever need anything or want to discuss your operation.
Jeremey, Lauren & Office: (806)484-1214
Sebastian: (605)280-1186
Email: sfrost@dailymarketminute.com
Hedge Account
Interested in a hedge account? Use the link below to set up an account or give us a call.
Recent Signals
March 19th, 2026: 🌱
New crop soybeans signal & hedge alert.
CLICK HERE TO VIEW
March 9th, 2026: 🌱
Soybeans signal & hedge alert. Sent via text.
March 6th, 2026: 🌽 🌾
Corn & wheat sell signal & hedge alert.
March 3rd, 2026: 🌽
Old crop & new crop corn sell signal & hedge alert.
Feb 26th, 2026: 🌱
Old crop & new crop beans sell signal & hedge alert.
Feb 19th, 2026: 🌾
KC wheat sell signal & hedge alert.
Feb 6th, 2026: 🌽 🌱
Old crop corn & soybean sell signal & hedge alert.
Feb 4th, 2026: 🌱
Soybean sell signal & hedge alert.
Nov 17th, 2025: 🌱
Soybean sell signal & hedge alert.