
DOES THE USDA CHANGE ANYTHING?
MARKET UPDATE
You can scroll to read the usual update as well. As the written version is the exact same as the video.
Timestamps for video:
USDA: 0:00min
Corn: 2:55min
Beans: 10:00min
Wheat: 14:35min
Cattle: 16:10min
Want to talk?
Office: (806)484-1214
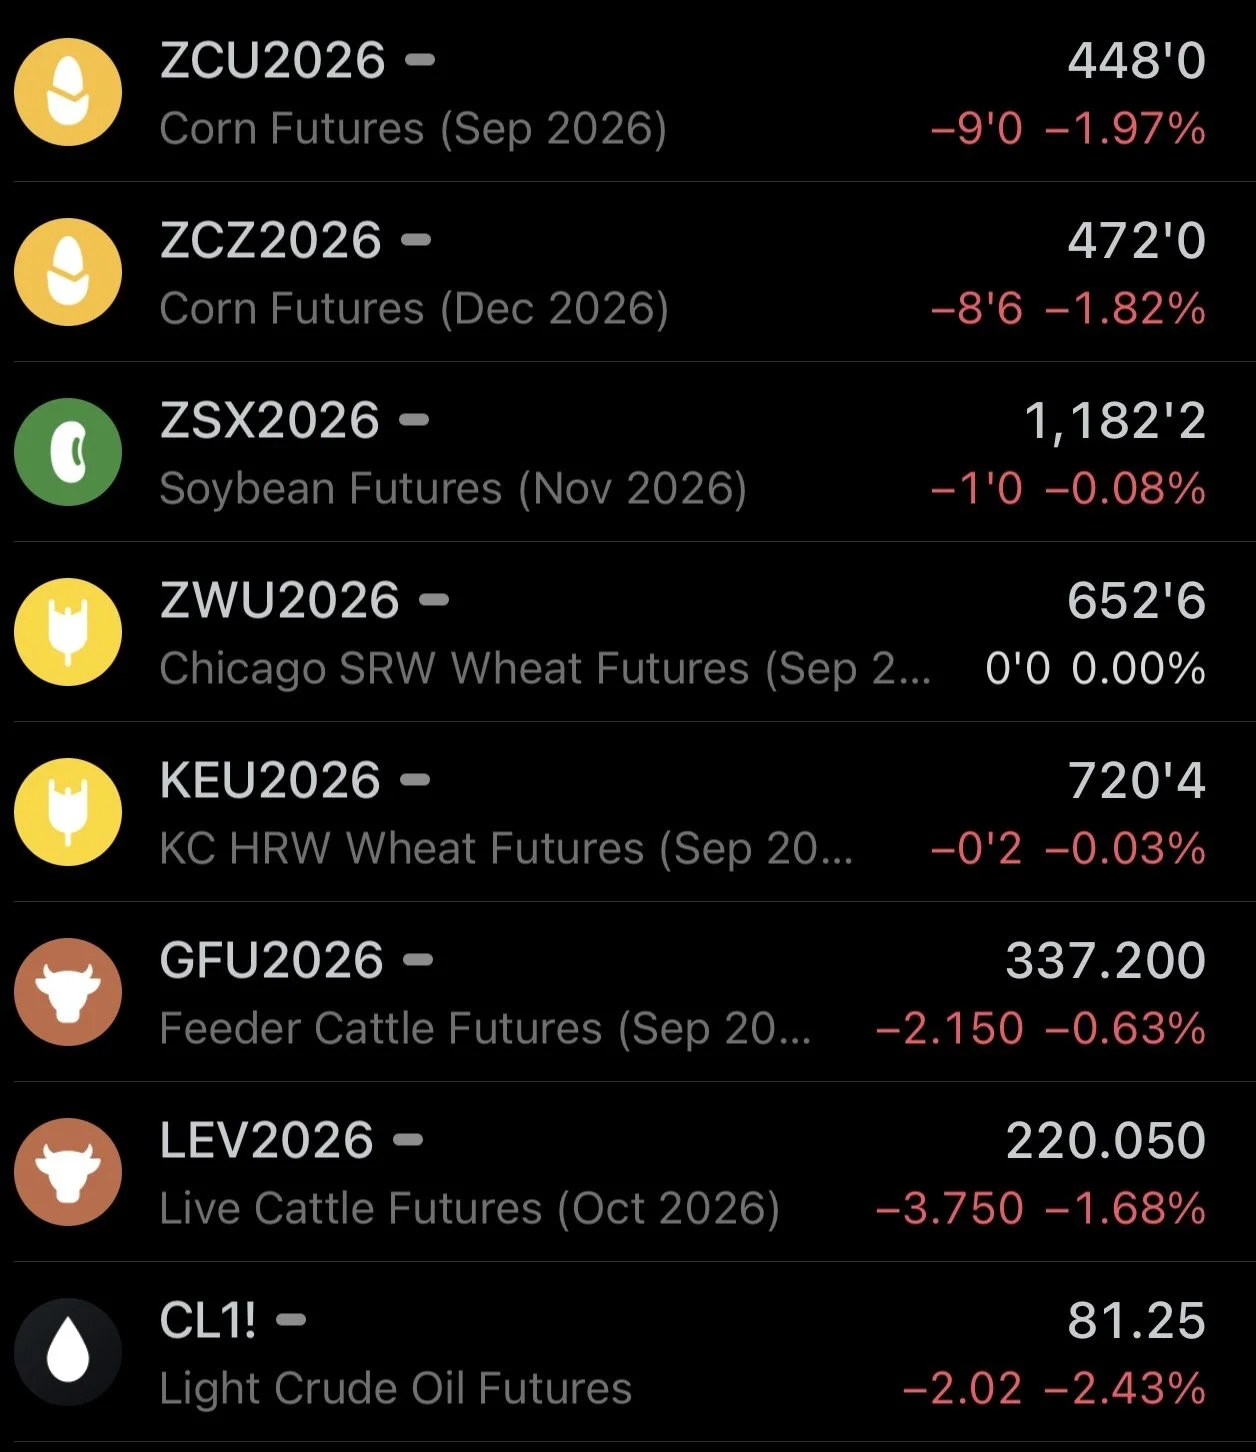
Futures Prices Close
Overview
Grains on the weak side following yesterday's strong move with the USDA report. As today corn gave back a good portion of yesterday’s rally, meanwhile soybeans and wheat were just fractionally lower.
Yesterday was Dec corn's strongest day of the entire year. It was actually the first time this contract has ever traded +20 cents higher on a single day.
So being unable to follow up that move is disappointing, but seeing some weakness following the strongest day of the year isn’t a surprise or reason for concern.
USDA
We covered the report in yesterday’s audio, but today we are going to do a deeper dive into what some of this could potentially mean moving forward especially for corn.
Balance Sheet Changes
Corn Balance Sheet:
First I wanted to look at corn.
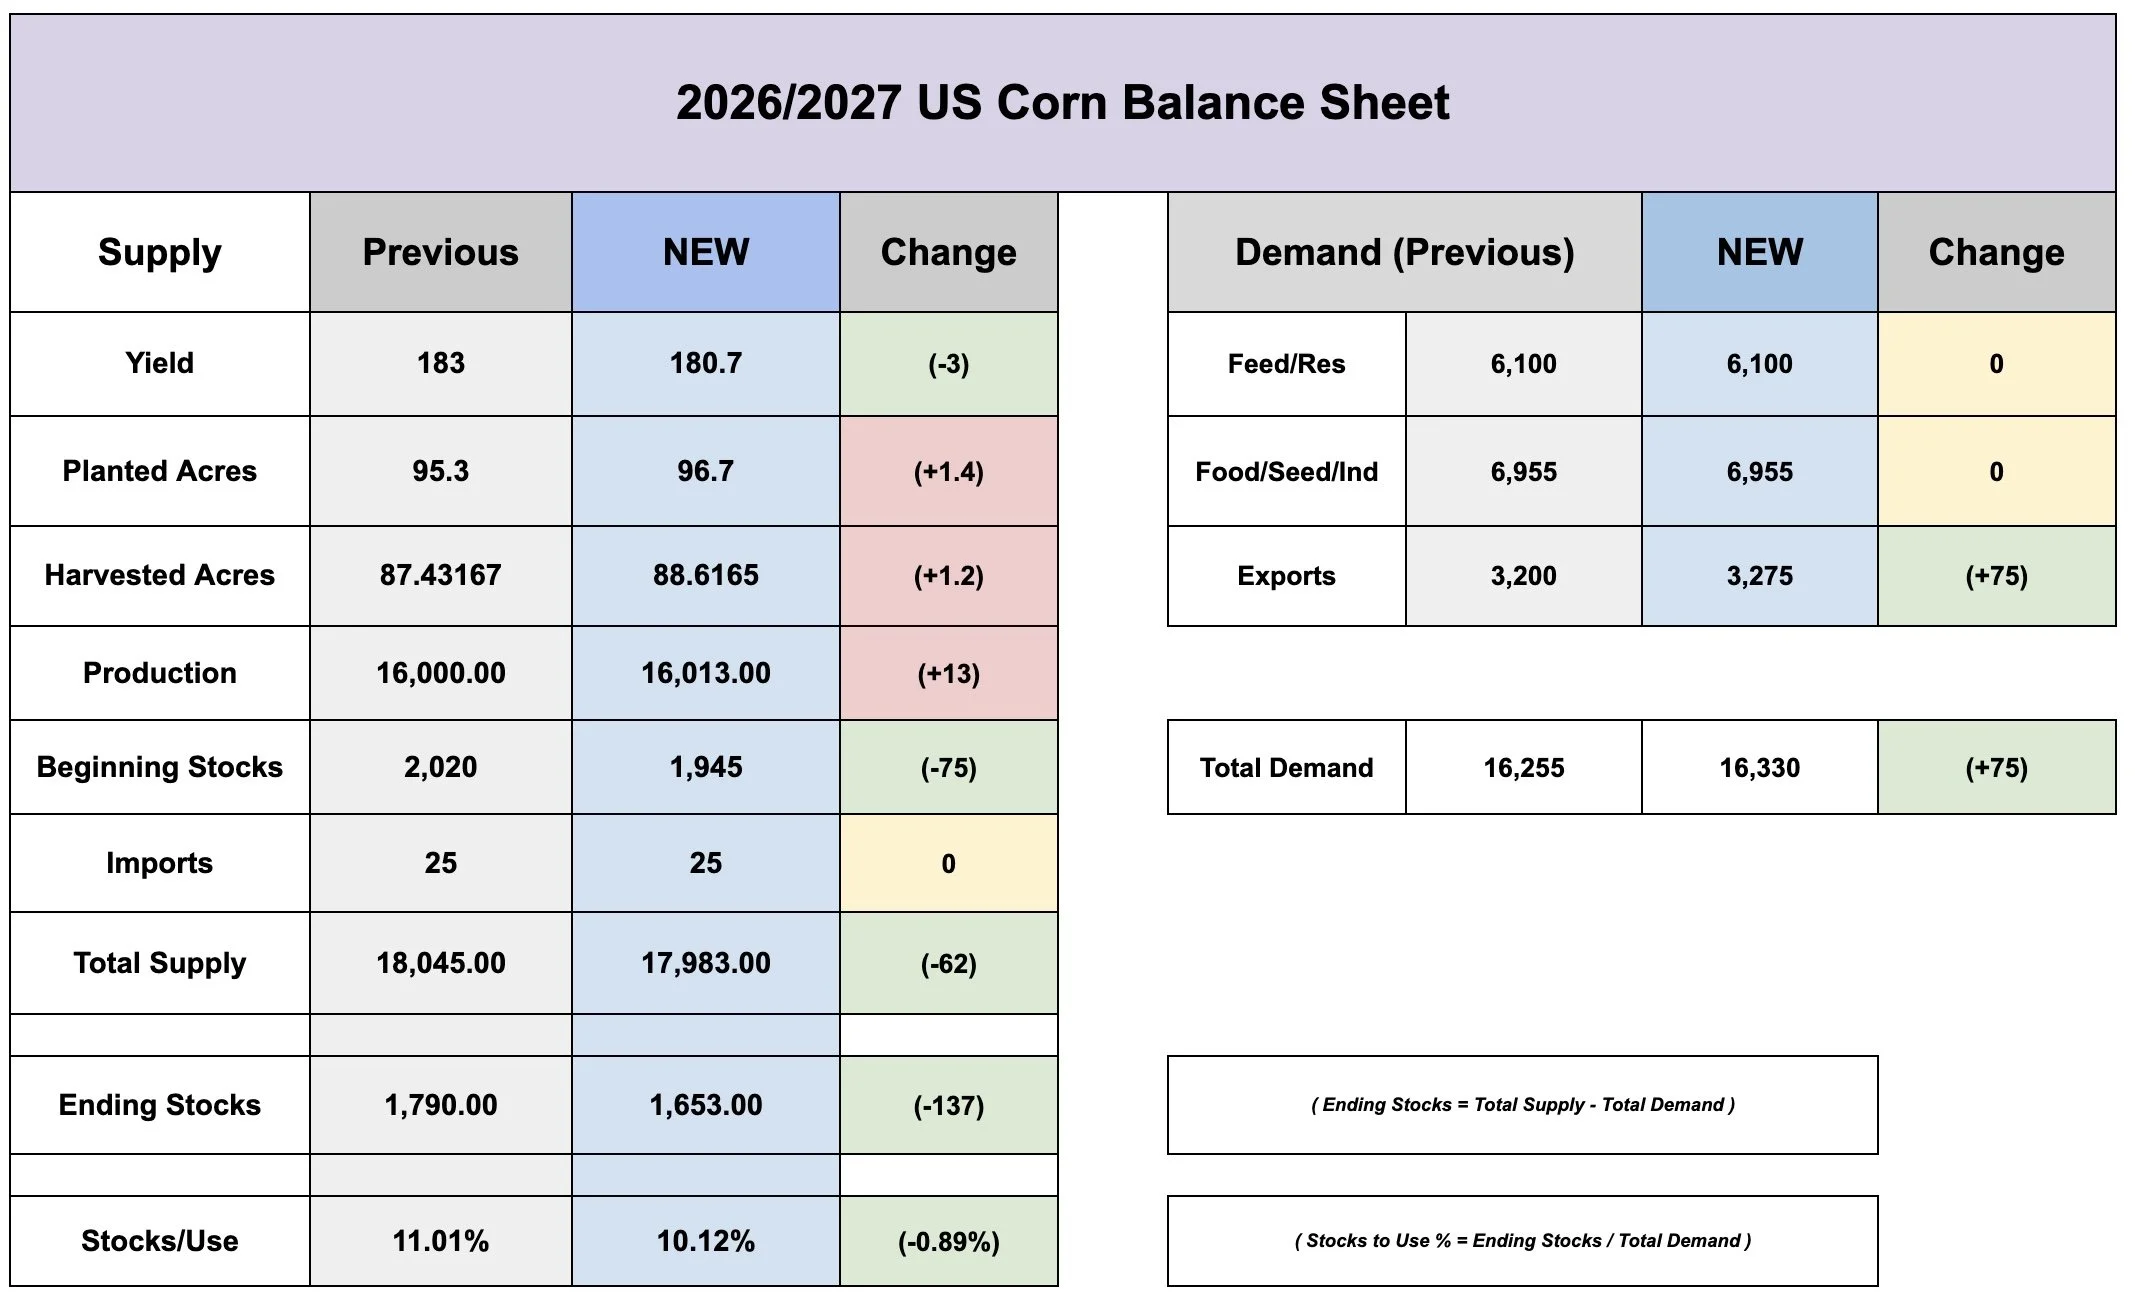
Here is the balance sheet changes.
Red = Bearish Change
Green = Bullish Change
Yellow = No Change
First off we got that yield drop from 183 to 180.7 bpa.
However, we also saw them bump acres by +1.4 million.
So this led to nearly a wash on the supply side.
Despite that big yield drop, our total production actually increased just slightly by +13 million bushels. Because the extra acres more than offset the yield cut.
So why did the balance sheet get tighter if we actually gained more production?
Well that would be due to demand.
The USDA raised old crop exports by +75 million. As a result, the new crop beginning stocks fell -75 million.
At the same time, they also bumped our new crop exports by +75 million.
So with the +150 in demand, and +13 million in production. The net loss to carryout was -137 million.
This led to our stocks to use ratio falling down to 10.12%.. which we will touch on more here later in today's update.
This number was probably the friendliest item, given acres offset the yield.
Soybean Balance Sheet:
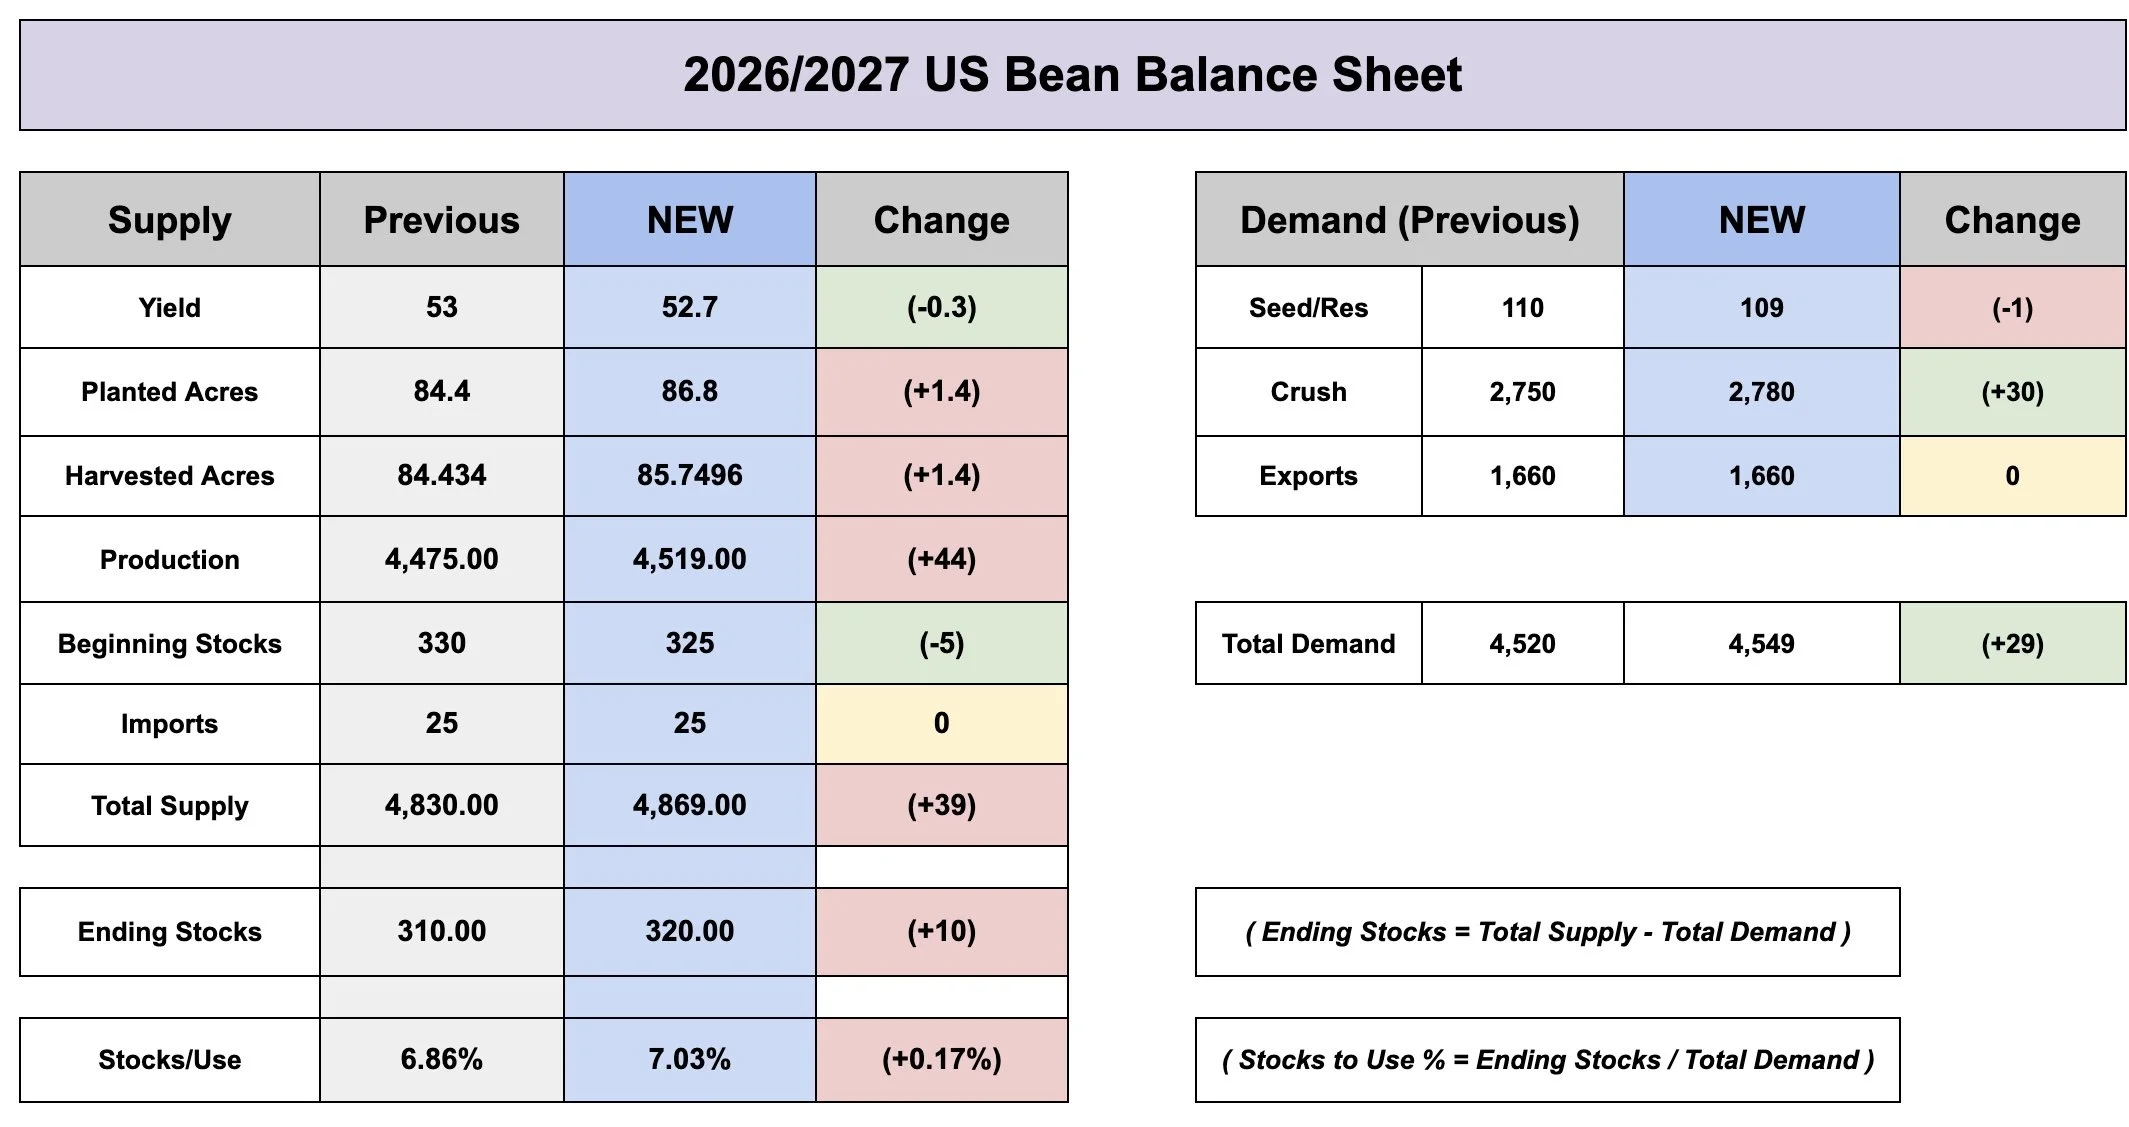
Now soybeans didn’t have all that friendly of a report.
I'd call it mostly neutral.
We saw yield drop from 53 to 52.7 bpa.
But just like in corn, we saw more acres. Those extra acres more than offset the losses in yield.
With total supply increasing by +40 million despite the lower yield.
At the same time, the USDA bumped crush by +30 million.
So we saw a net increase of +10 million to the carryout.
Record Combined Acres
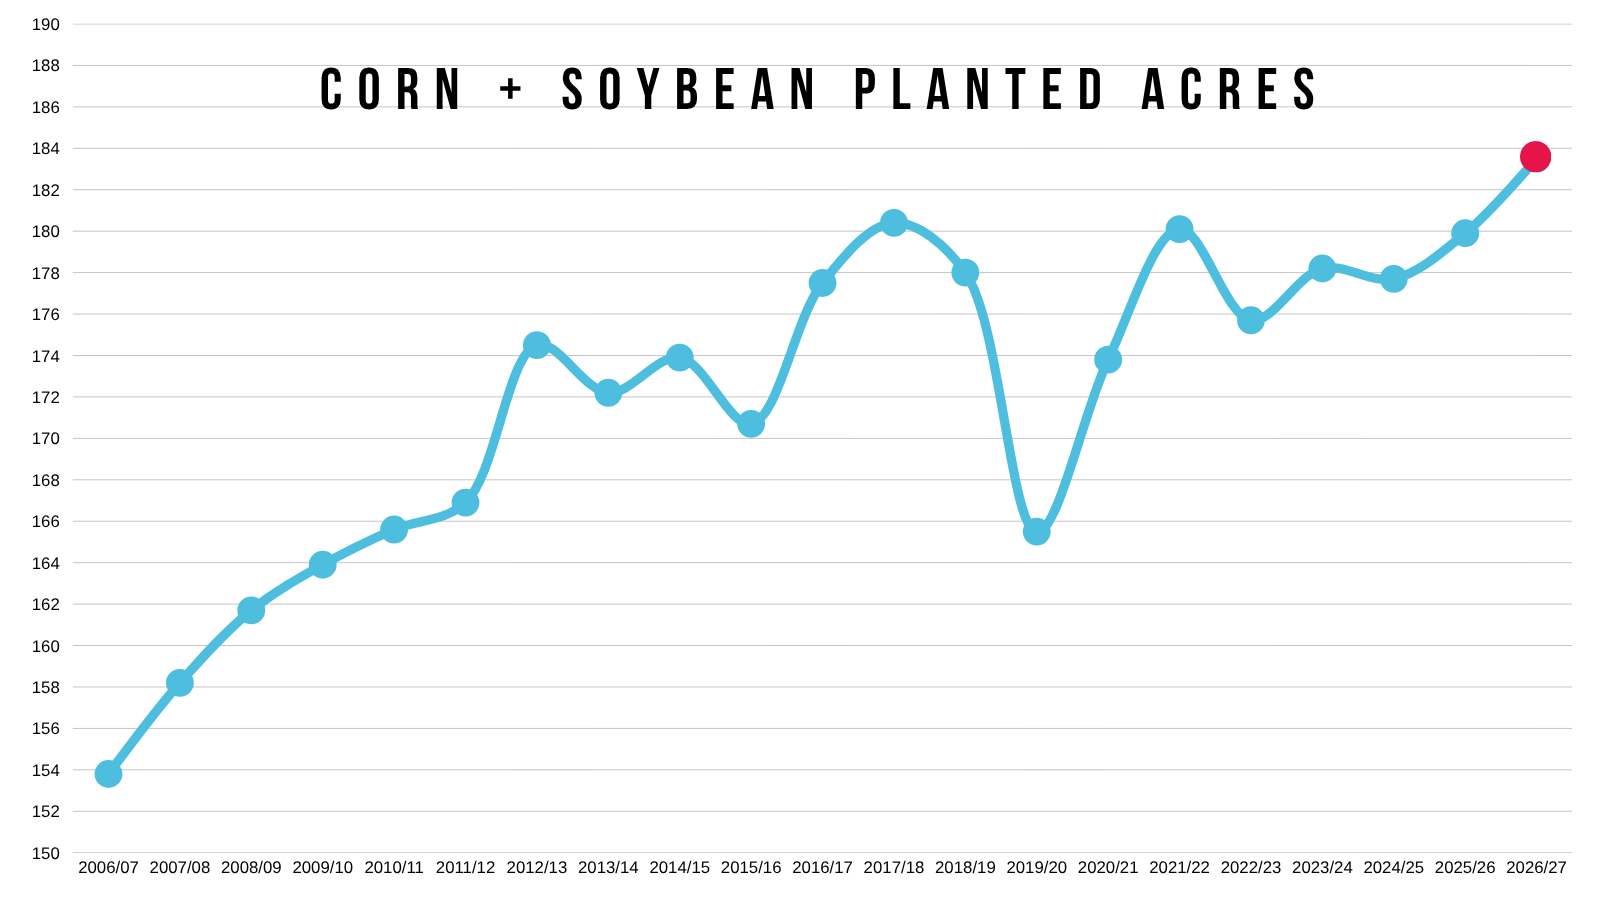
With the extra acres, this would actually be the largest combined corn and soybean acres on record.
It's the largest by around +3 million acres.
Could we see the USDA continue to bump corn acres?
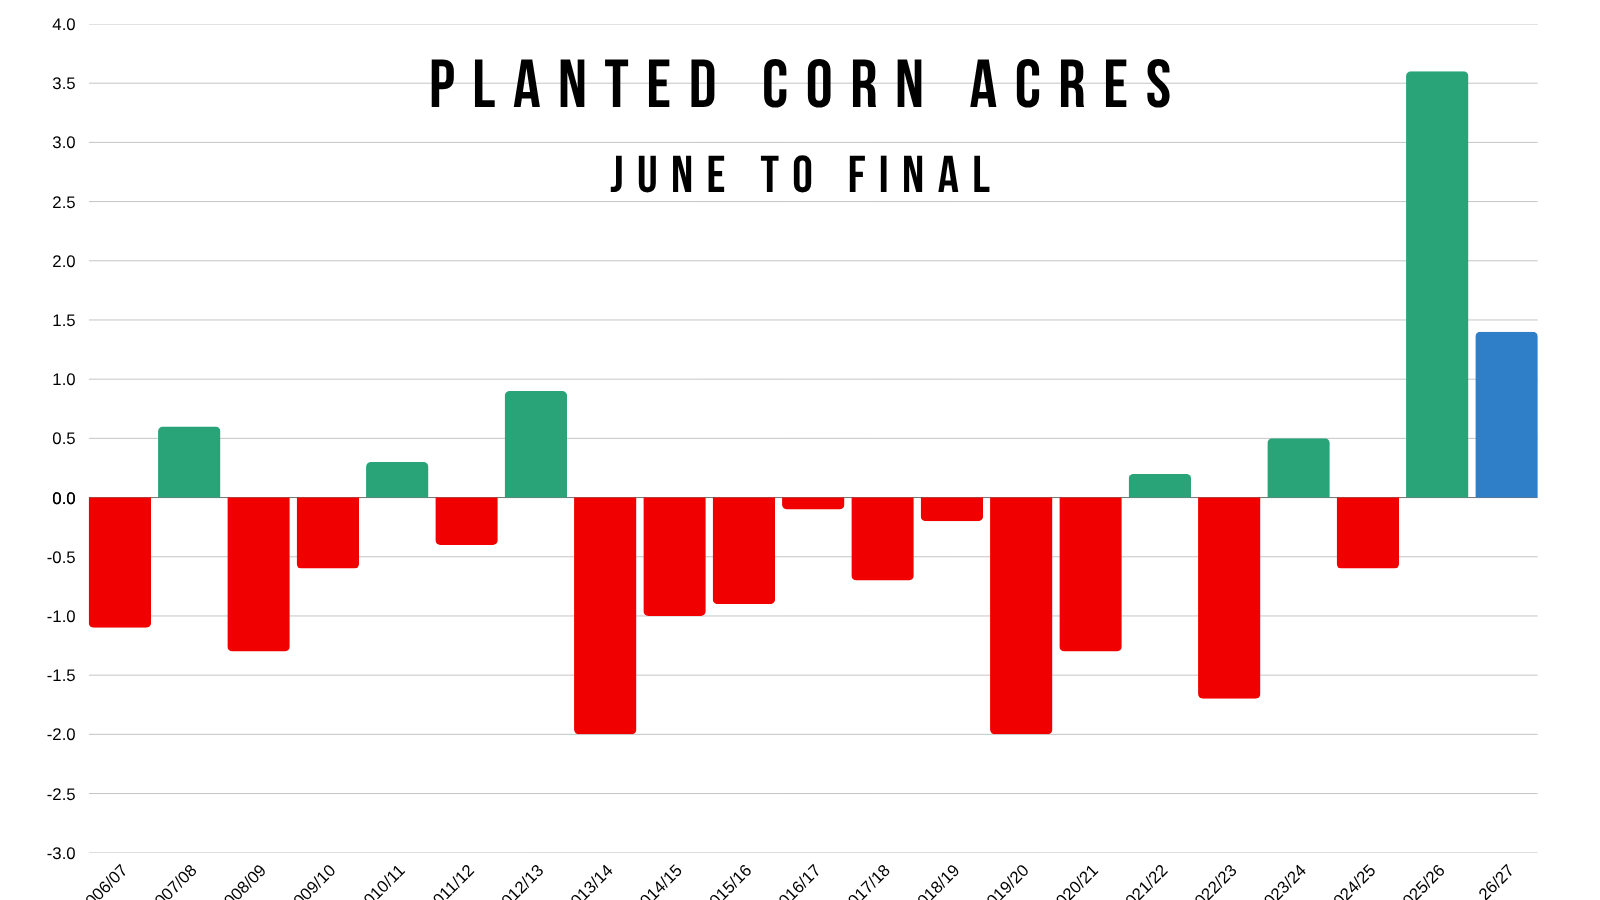
Who knows. Here is the history of corn June to final acres.
Last year we had that anomoly of a miss.
This year would also be the 2nd largest increase.
Today's Main Takeaways
Corn
As we had been talking about the last few weeks, the crop ratings did suggest a below trend yield.
We went over a ton of data suggesting this.
I was skeptical that the USDA would admit it this early, but it was great to see they made the adjustment.
To see yield increase from here, we might need to see those ratings improve from here.
(Below is final ratings vs how yield changed from May)
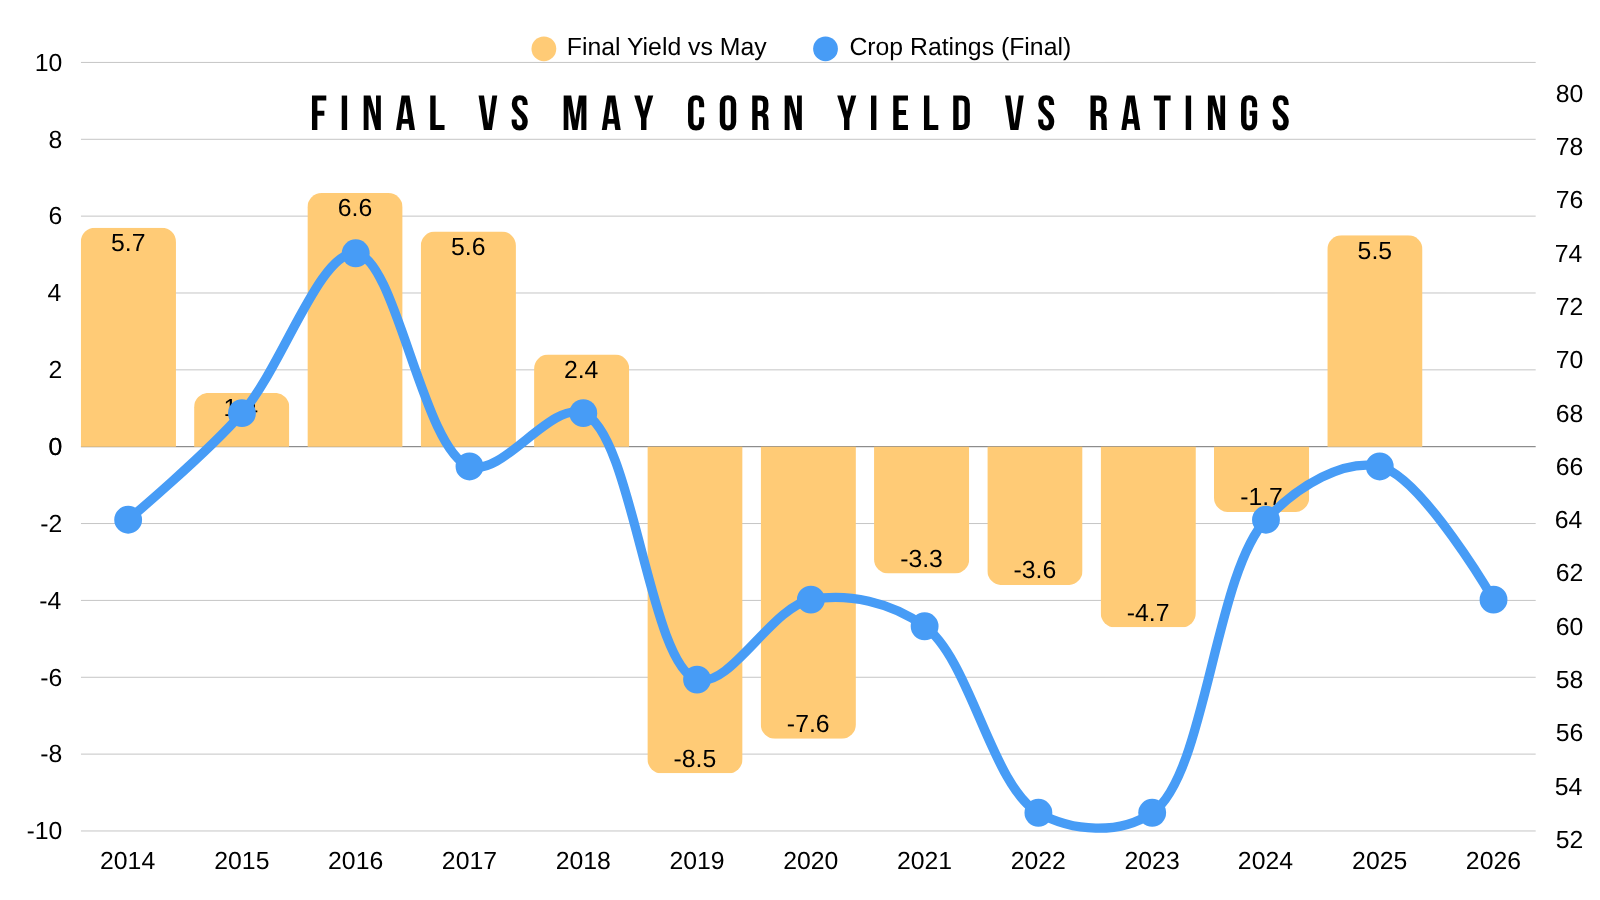
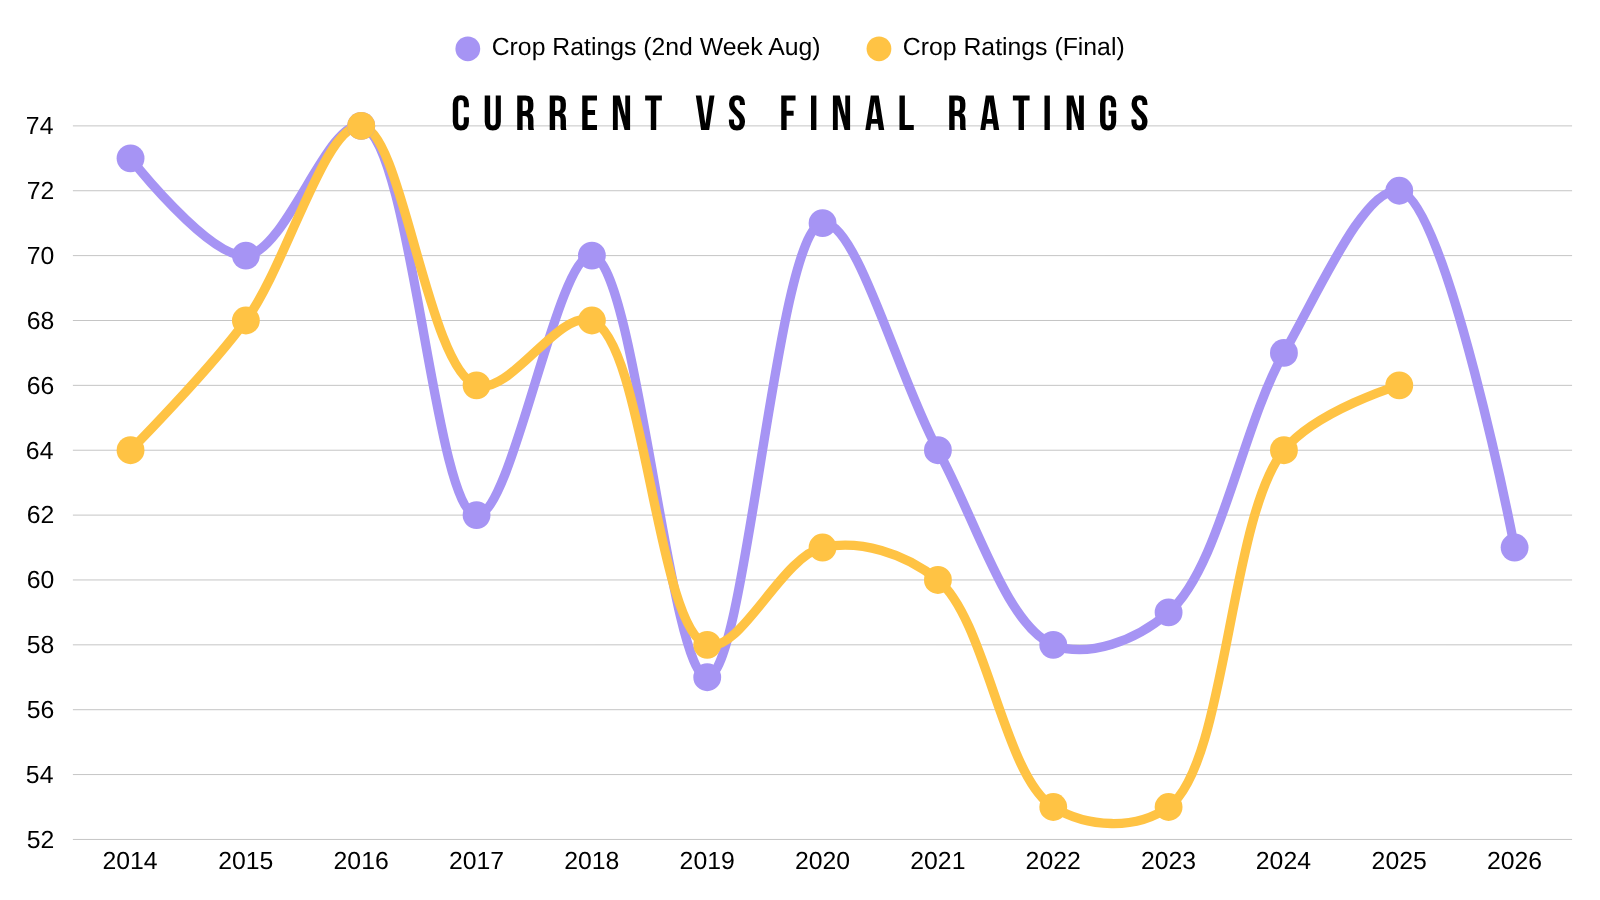
However they do historically tend to decrease as the year goes on.
The last time today's ratings were better than the final was 2019.
Stocks to Use:
For the last several months, we had been talking about how there were several pathways for the new crop stocks to use to drop into that 10% or lower range.
Yesterday the USDA just dropped our new crop stocks to use from 11% down to nearly 10%.
Which is down a pretty sizeable amount from old crop's 11.68%.
Why is this a big deal?
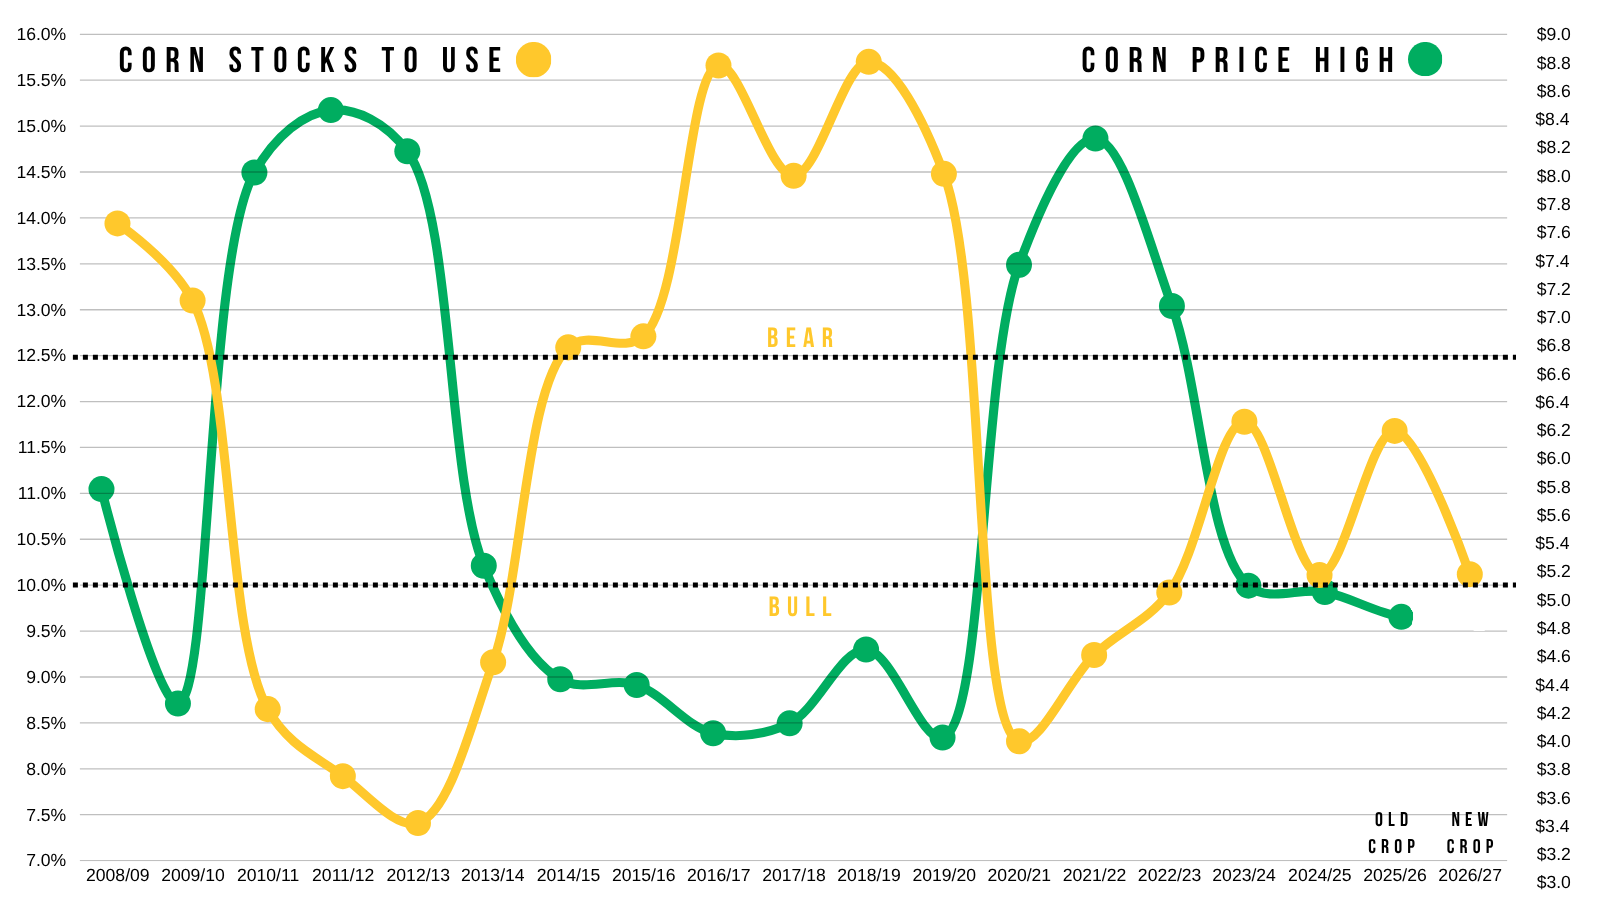
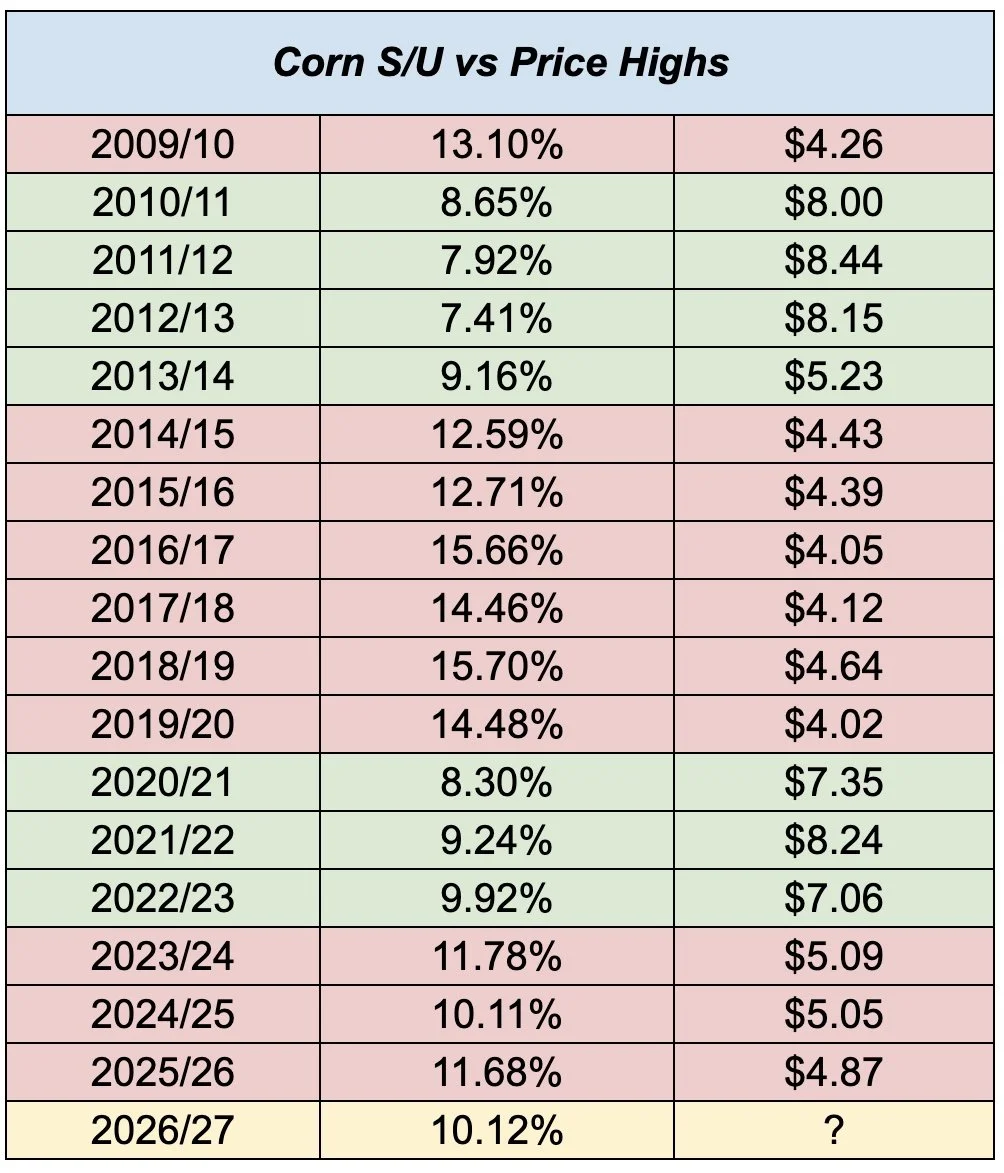
I've shown this chart a thousand times.
It compares our stocks to use, with our highest price of the year for the front-month contract.
Usually, for us to see front-month corn much above $5.00 we need to see that stocks to use drop below 10%.
So we are not in full blown bull market territory just yet.. but essentially we are knocking on the door of a bullish situation.
Here is a spreadsheet example for every year.
A 10% stocks to use is not associated with $4.50, it's more so associated with corn in that $5.00 range.
But again, to get corn much above $5.00, you usually need to see it drop into that 8% to 9% range.
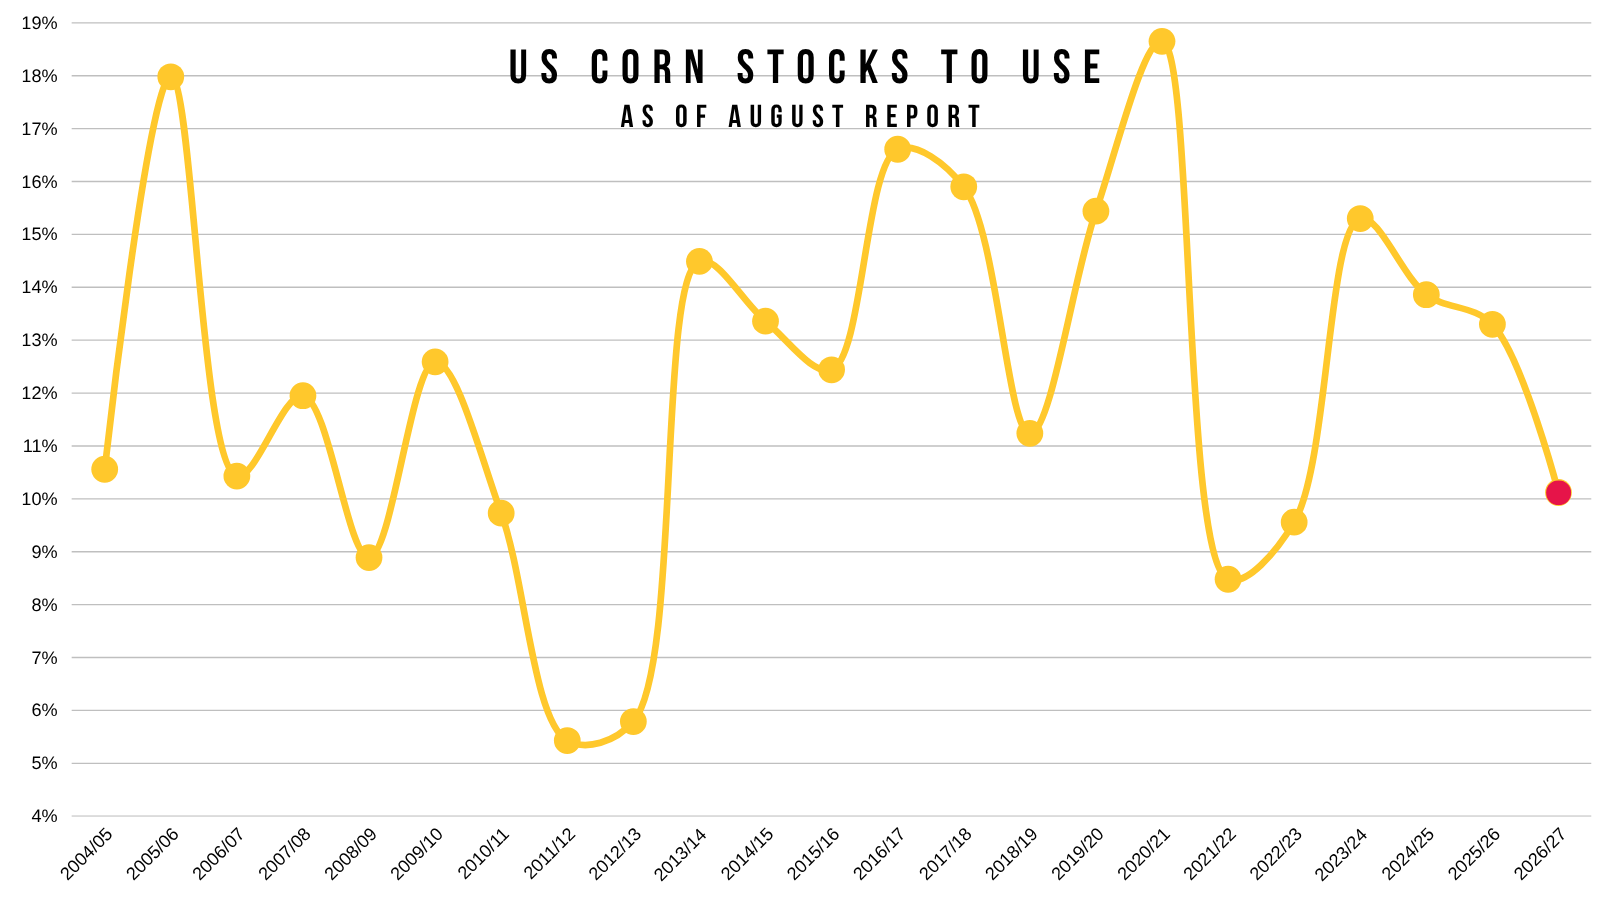
Here is one of the more interesting parts.
This is where our stocks to use ratio was on the August report over the years.
We are STARTING off a lot tigher than usual.
As we haven’t been this tight in August since 2022.
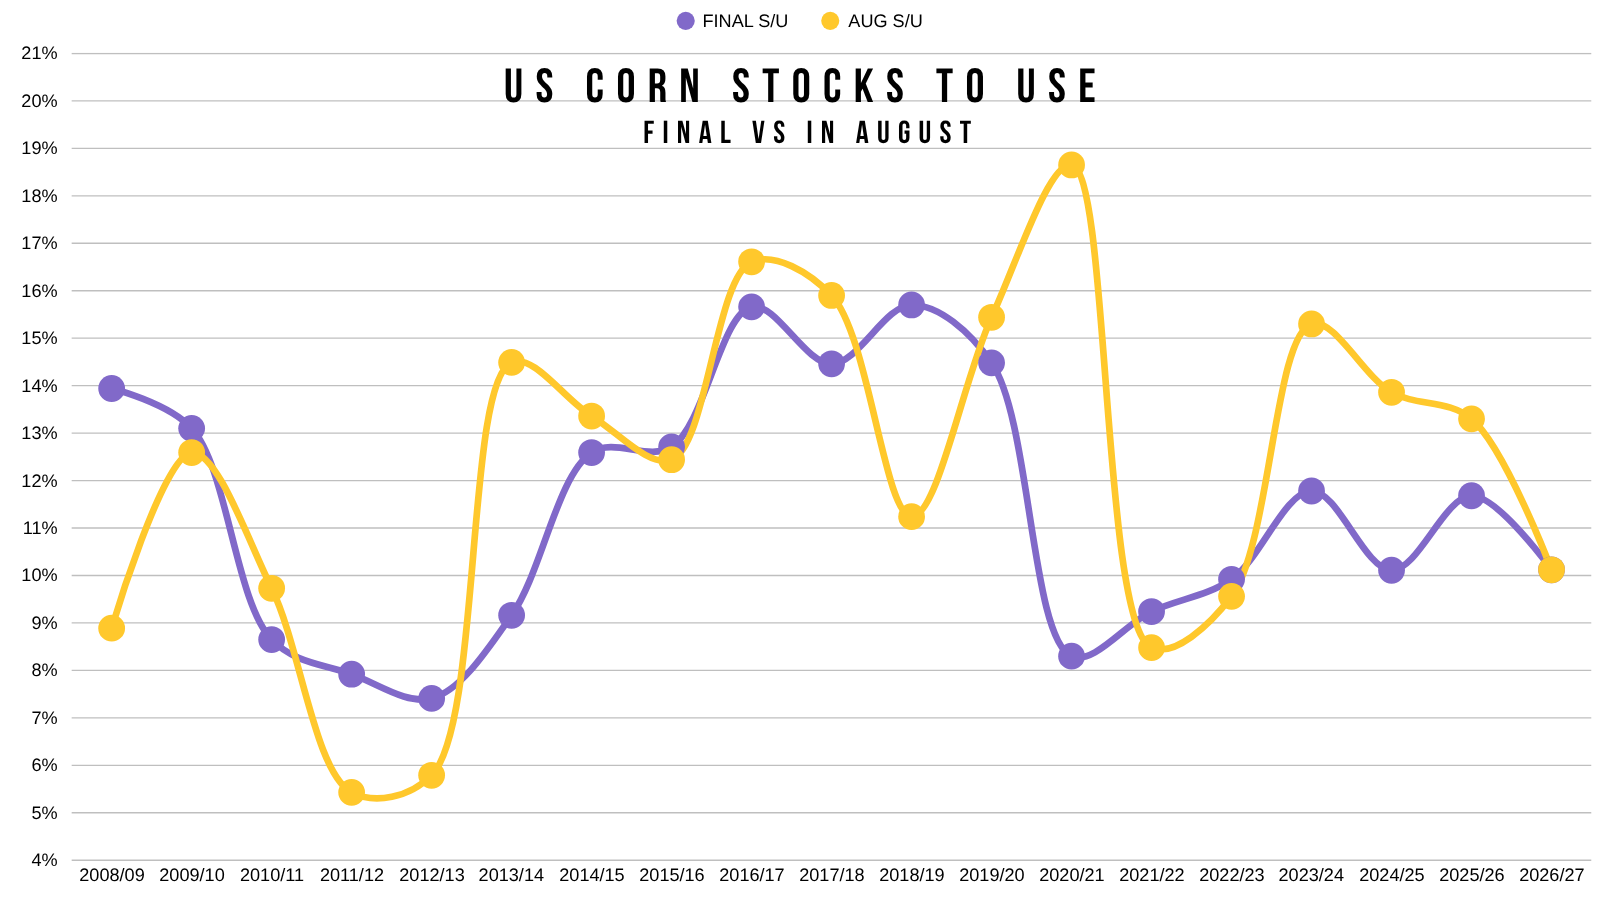
Here is what it looks like if you compare the August S/U to the Final S/U.
The last several years, the final number was a lot tighter than where it was in August.
The last time we saw the final number looser than the August one was back in 2022/23.
You have years such as 2024/25 that ended up around 10%. But we did not start there in August like we are this year.
So we are starting out in a much tighter situation than we have over the last several years.
Demand is King:
Like we mentioned. We actually have more production now than we did with a 183 yield simply due to the acres.
The bull case largely resides in the demand arguement.
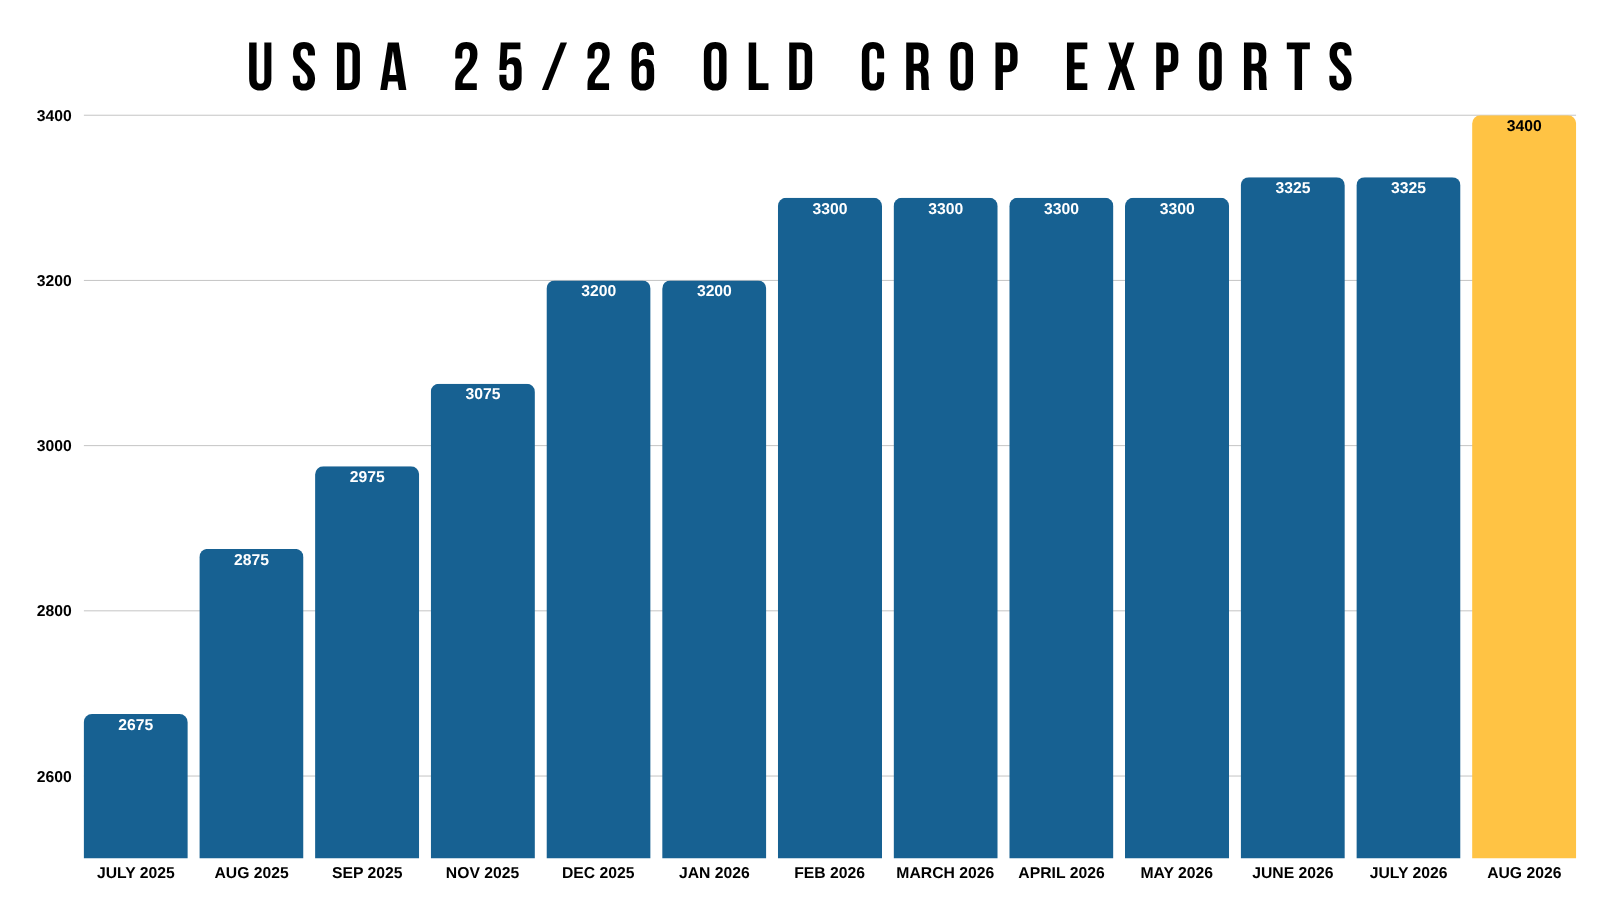
The USDA is probably going to need to raise the old crop exports gain, given how far ahead of pace we are.
The USDA is expecting our new crop demand to be worse than our old crop demand. That doesn’t magically happen on it's own. Most of the time, if you want to justify lower demand we need to see higher prices justify lower demand.
Just for reference, looks look at how the exports for old crop shaped up.
In July last year, they had exports at 2.70 billion.
Yesterday those exports came in at 3.40 billion.
A very large +700 million increase.
Even our old crop carryout is now under 2 billion due to monster demand.
It took a record yield AND record acres to get this number, and we still couldn’t get carryout above 2 billion.
(Bars = Yield & Line = Acres)
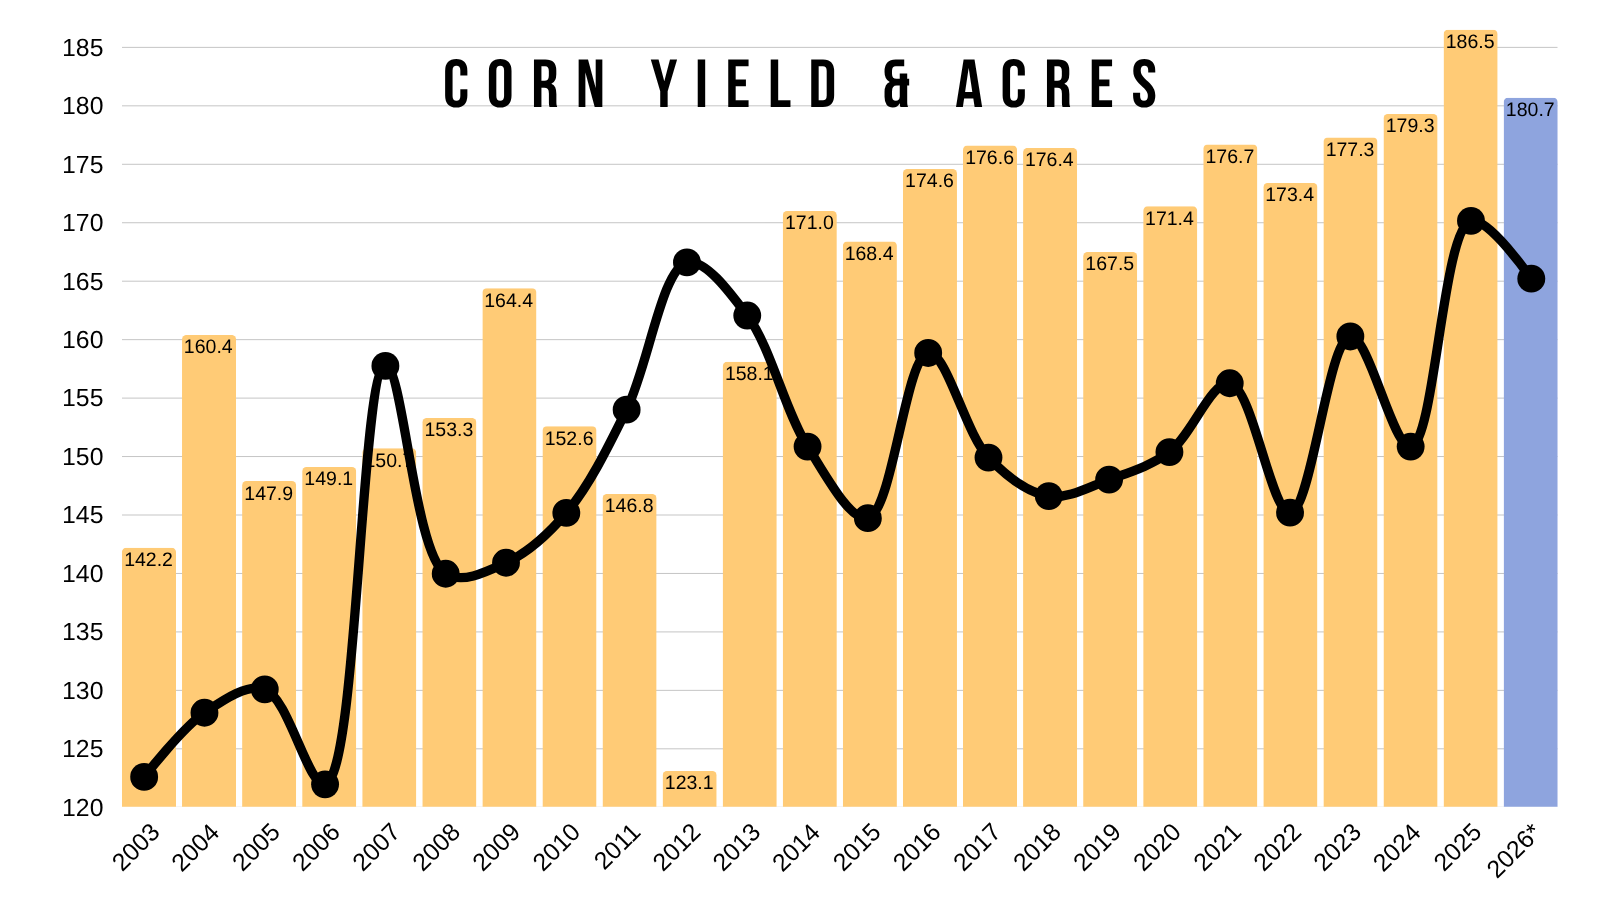
Now we have a 1.65 billion carryout that really doesn’t have much room for error.
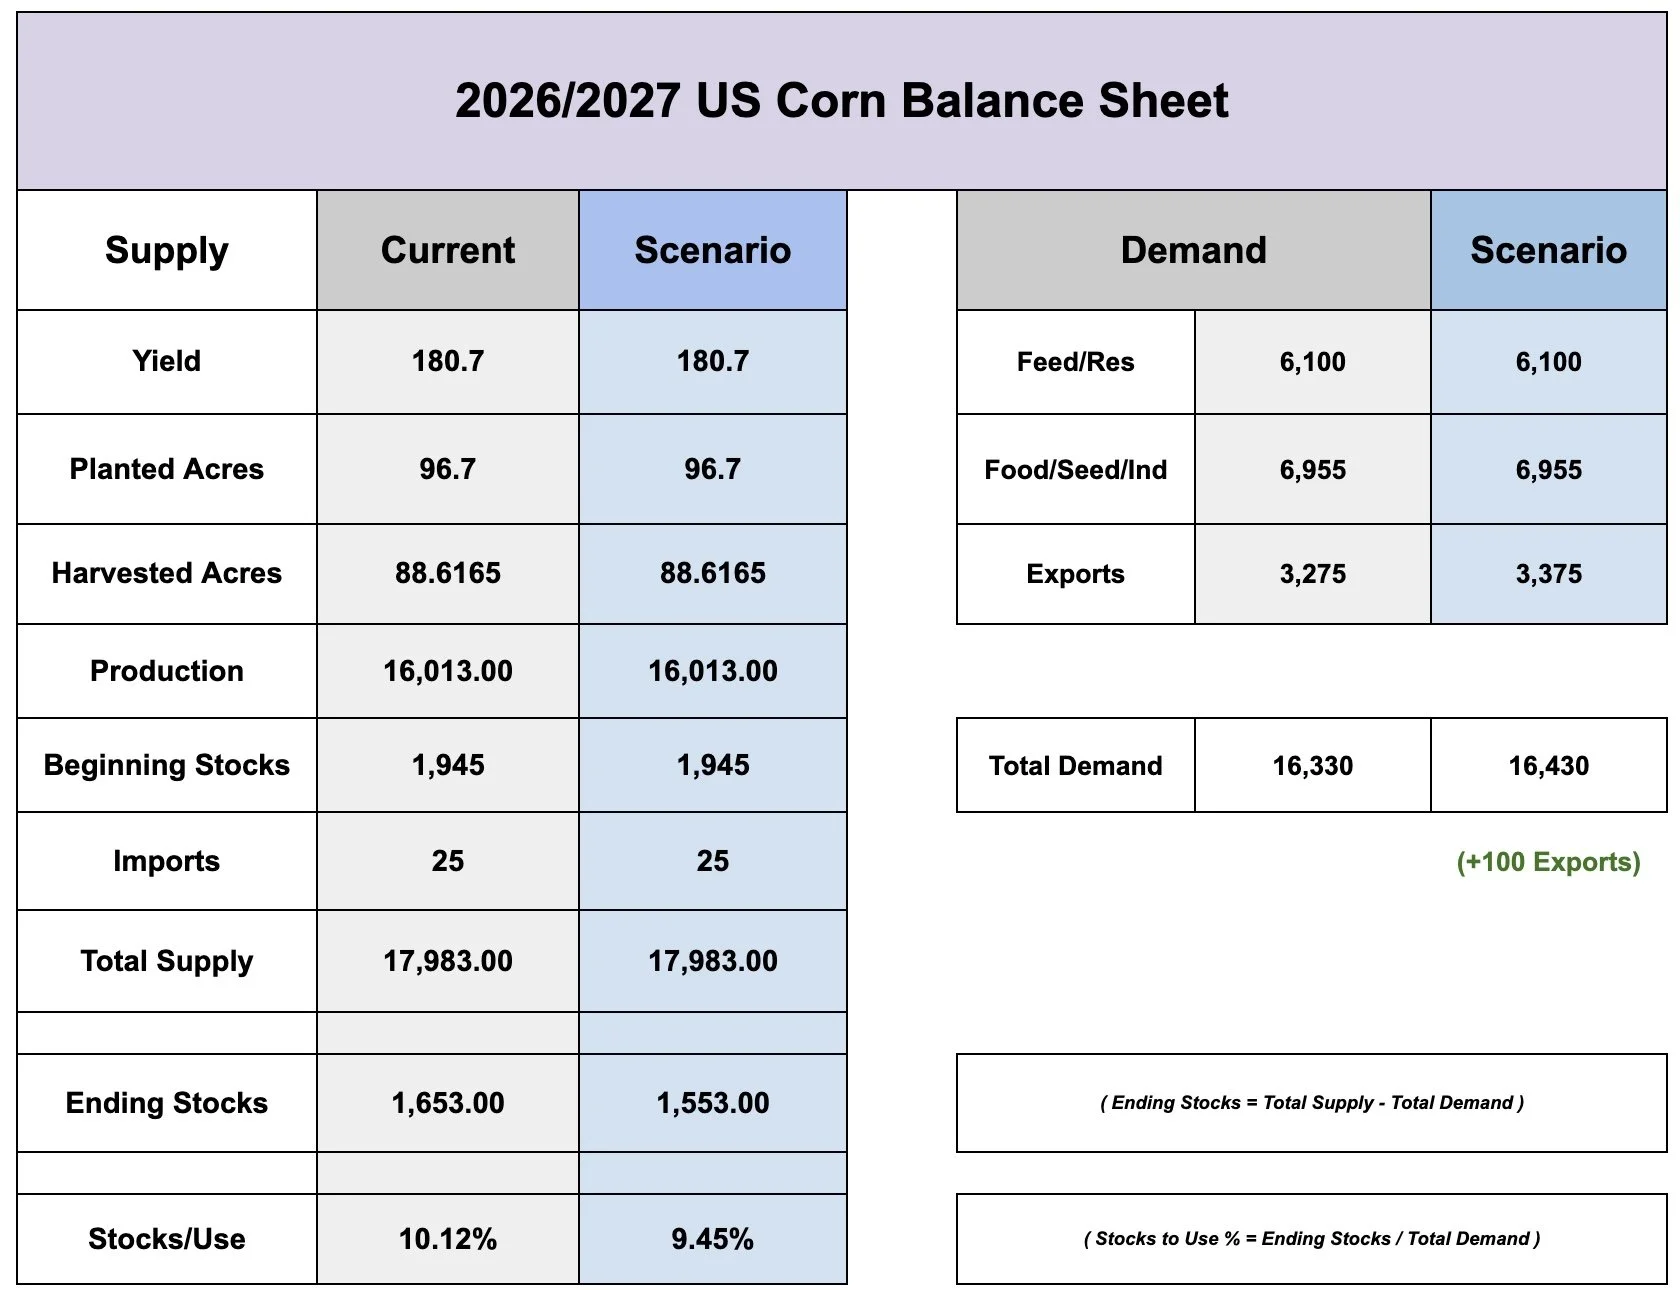
As long as acres don’t magically increase from here again, any further cut to yield would likely bring that stocks to use below 10%.
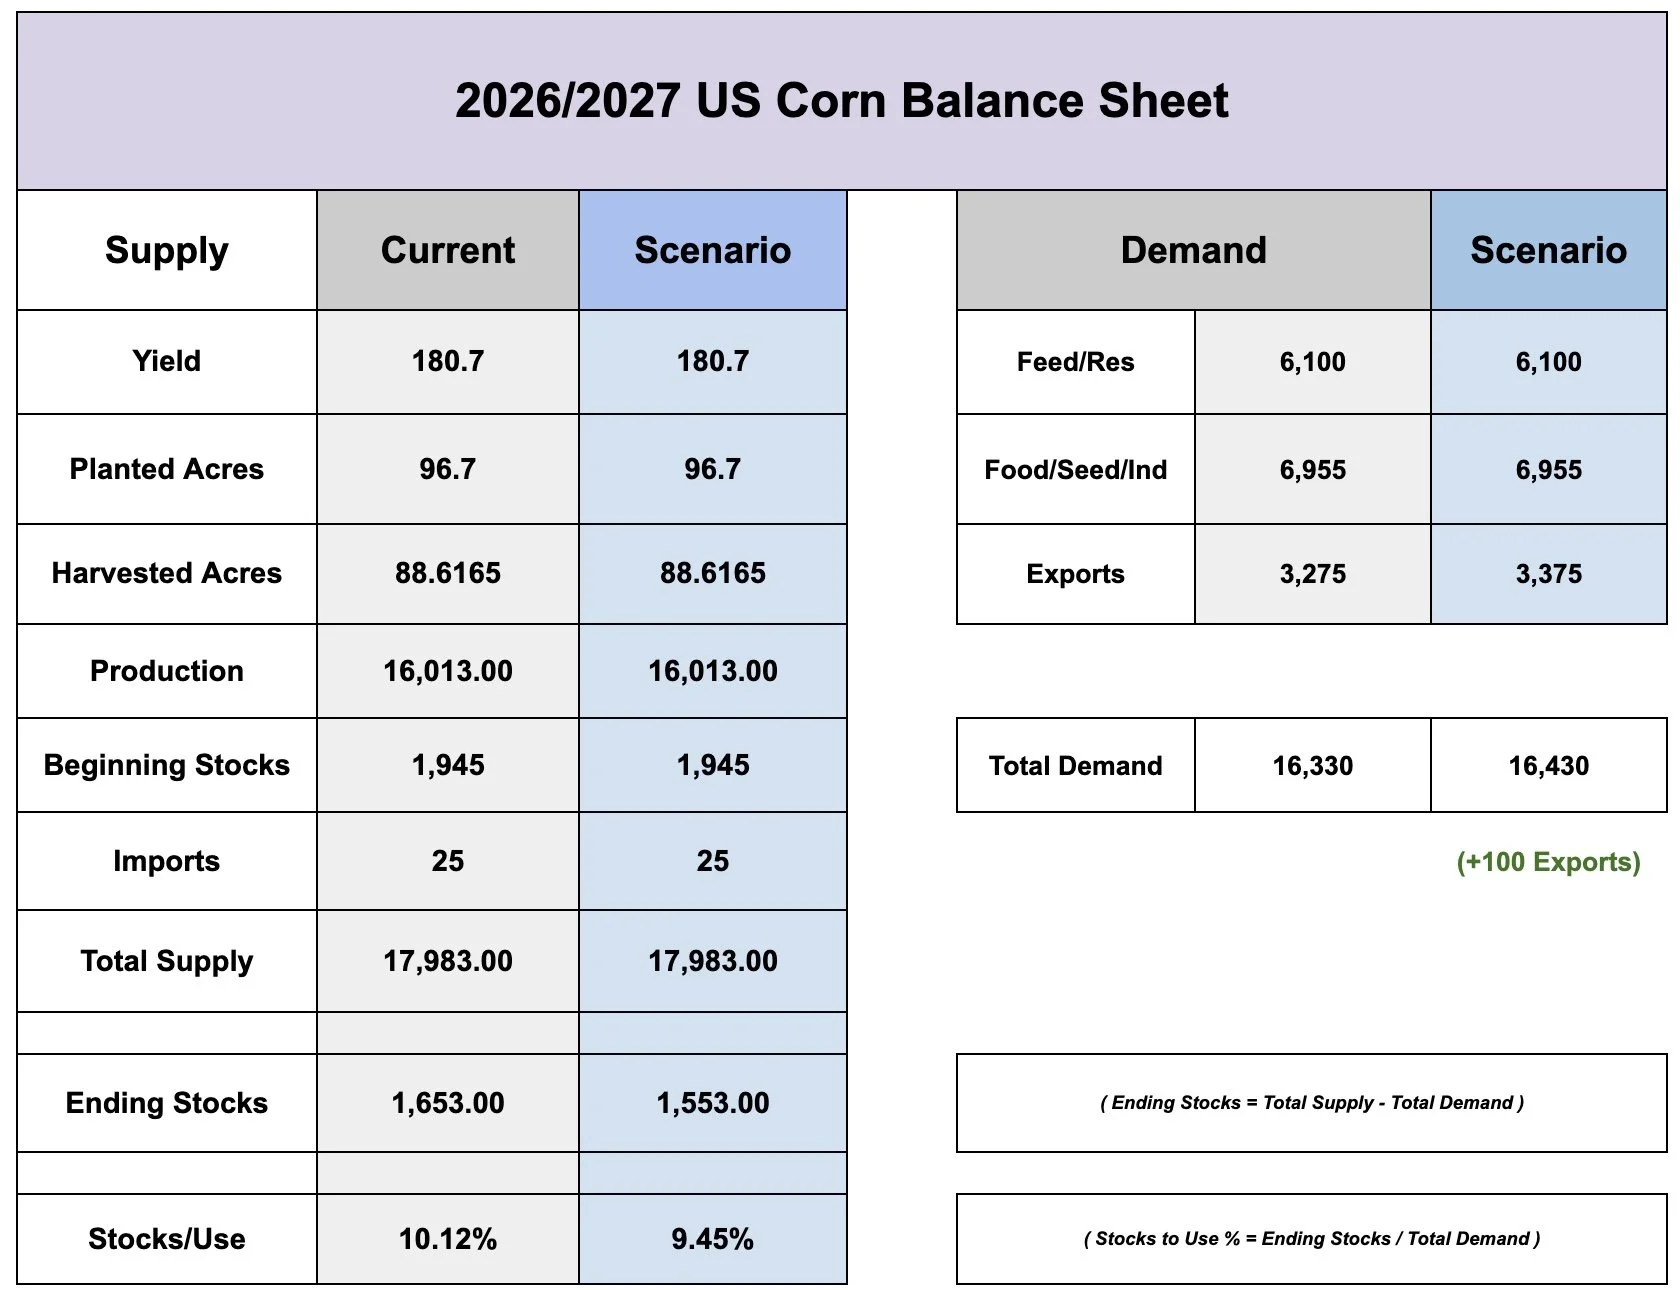
Or for example, let's just say exports ultimately come in 100 million bushels higher when it's all said and done, but yield and acres stay where they are. That gives you a sub 10% stocks to use.
Given how tight we are starting, there just isn’t a massive room for error.
Now yes, some would argue that the USDA has plenty of wiggle room to "fudge" the feed and residual number.
Which is true, the number doesn’t make sense, but they've been arguing this for a very long time. The reason they kept it this high could’ve easily been as simple as they overestimated yield last year, so they used the number as a scapegoat.
(179 Yield Scenario)
(+100 Exports Scenario)
Bottom Line:
I think corn has plenty of potential long term as has been my bias for several months.
People can argue about the numbers from the USDA all day long. All I know is that we have the most "potential" we've had in a long time.
That doesn’t mean we "have" to go a lot higher, but the potential is certainly there long term.
Demand led markets don’t happen overnight. It's not the same as a supply driven market. It can take a while to build.
Overall I am remaining patient waiting for the next opportunity.
However, one thing to note is that short term we are heading into harvest. So that adds some caution with potential harvest pressure.
New crop corn is still +50 cents off the lows and sitting at 4-year highs if you’re someone who knows you are going to have to move something off the combine.
There are several ways you can protect yourself or lock in a floor. Call us if you want to discuss your situation.
Office: (806)484-1214
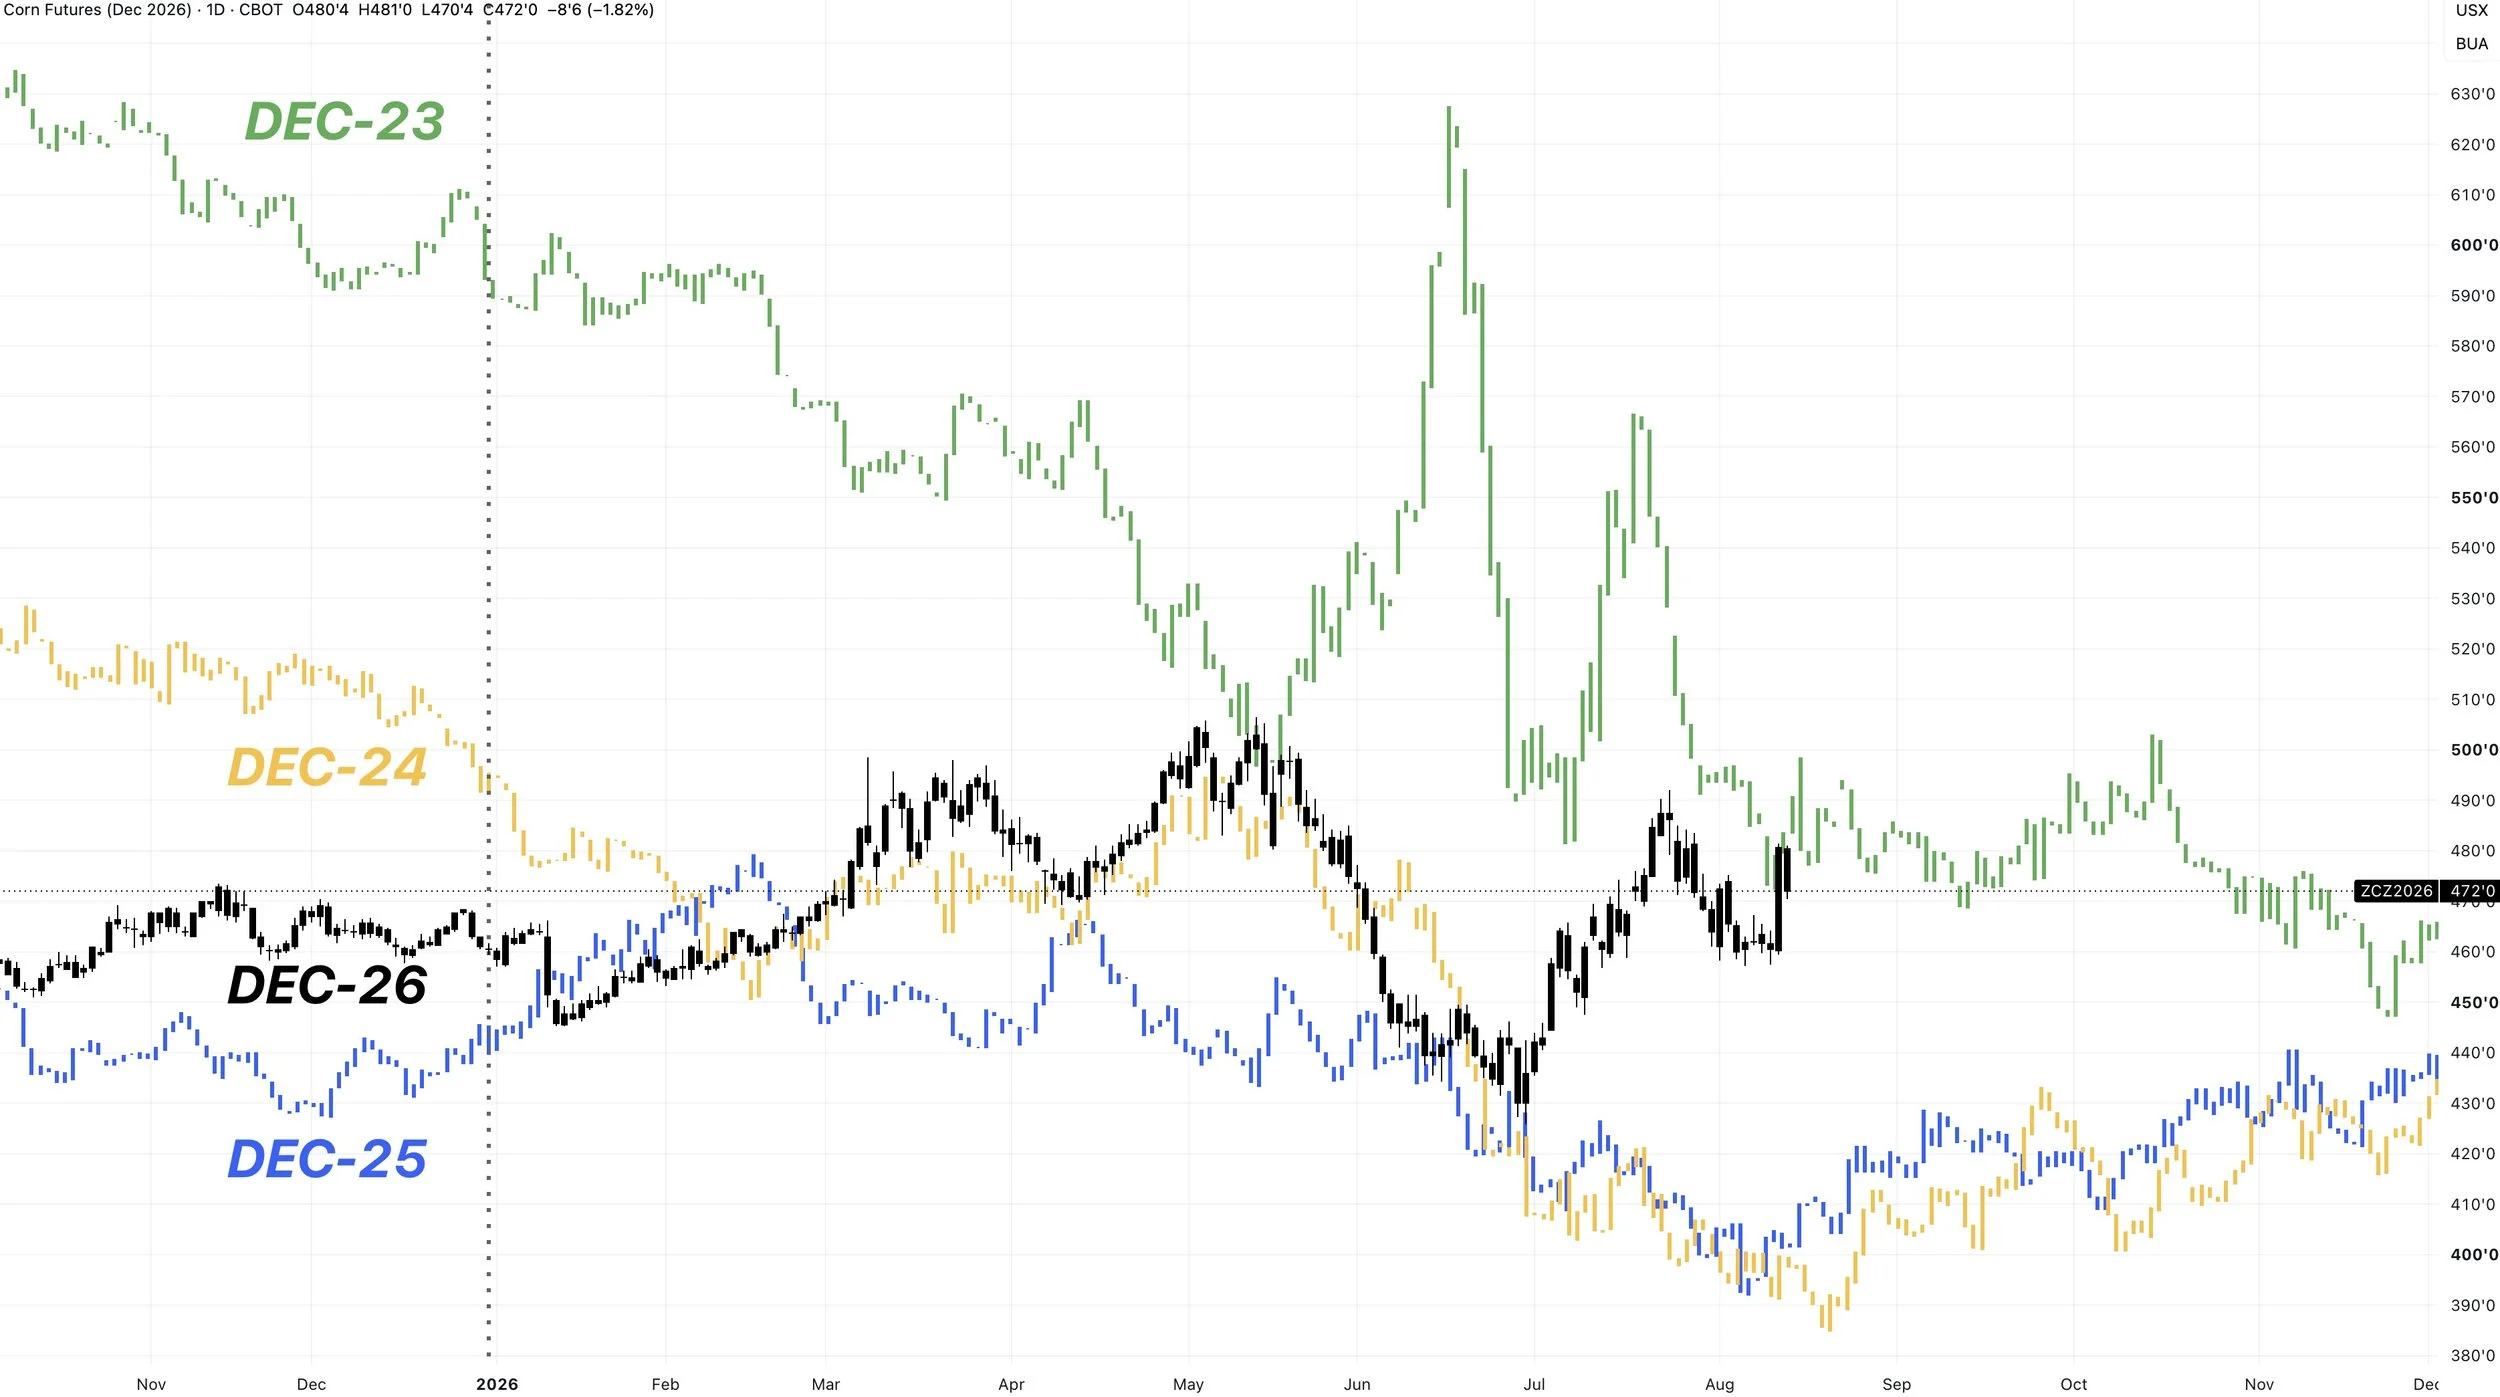
Dec Corn Chart:
Huge day yesterday.
Yes it was disappointing we followed it up with weakness today, but I don’t see any reason to be concerned here. Markets don’t usually go straight up and yesterday was the best day ever for this contract.
The $4.66 to $4.69 level would be a perfectly common spot for us to retrace to before resuming higher.
As that gives back 50% to 61.8% of the recent mini pop. So short term, we'd like to hold there.
We're also sitting right at a bunch of moving averages as well.
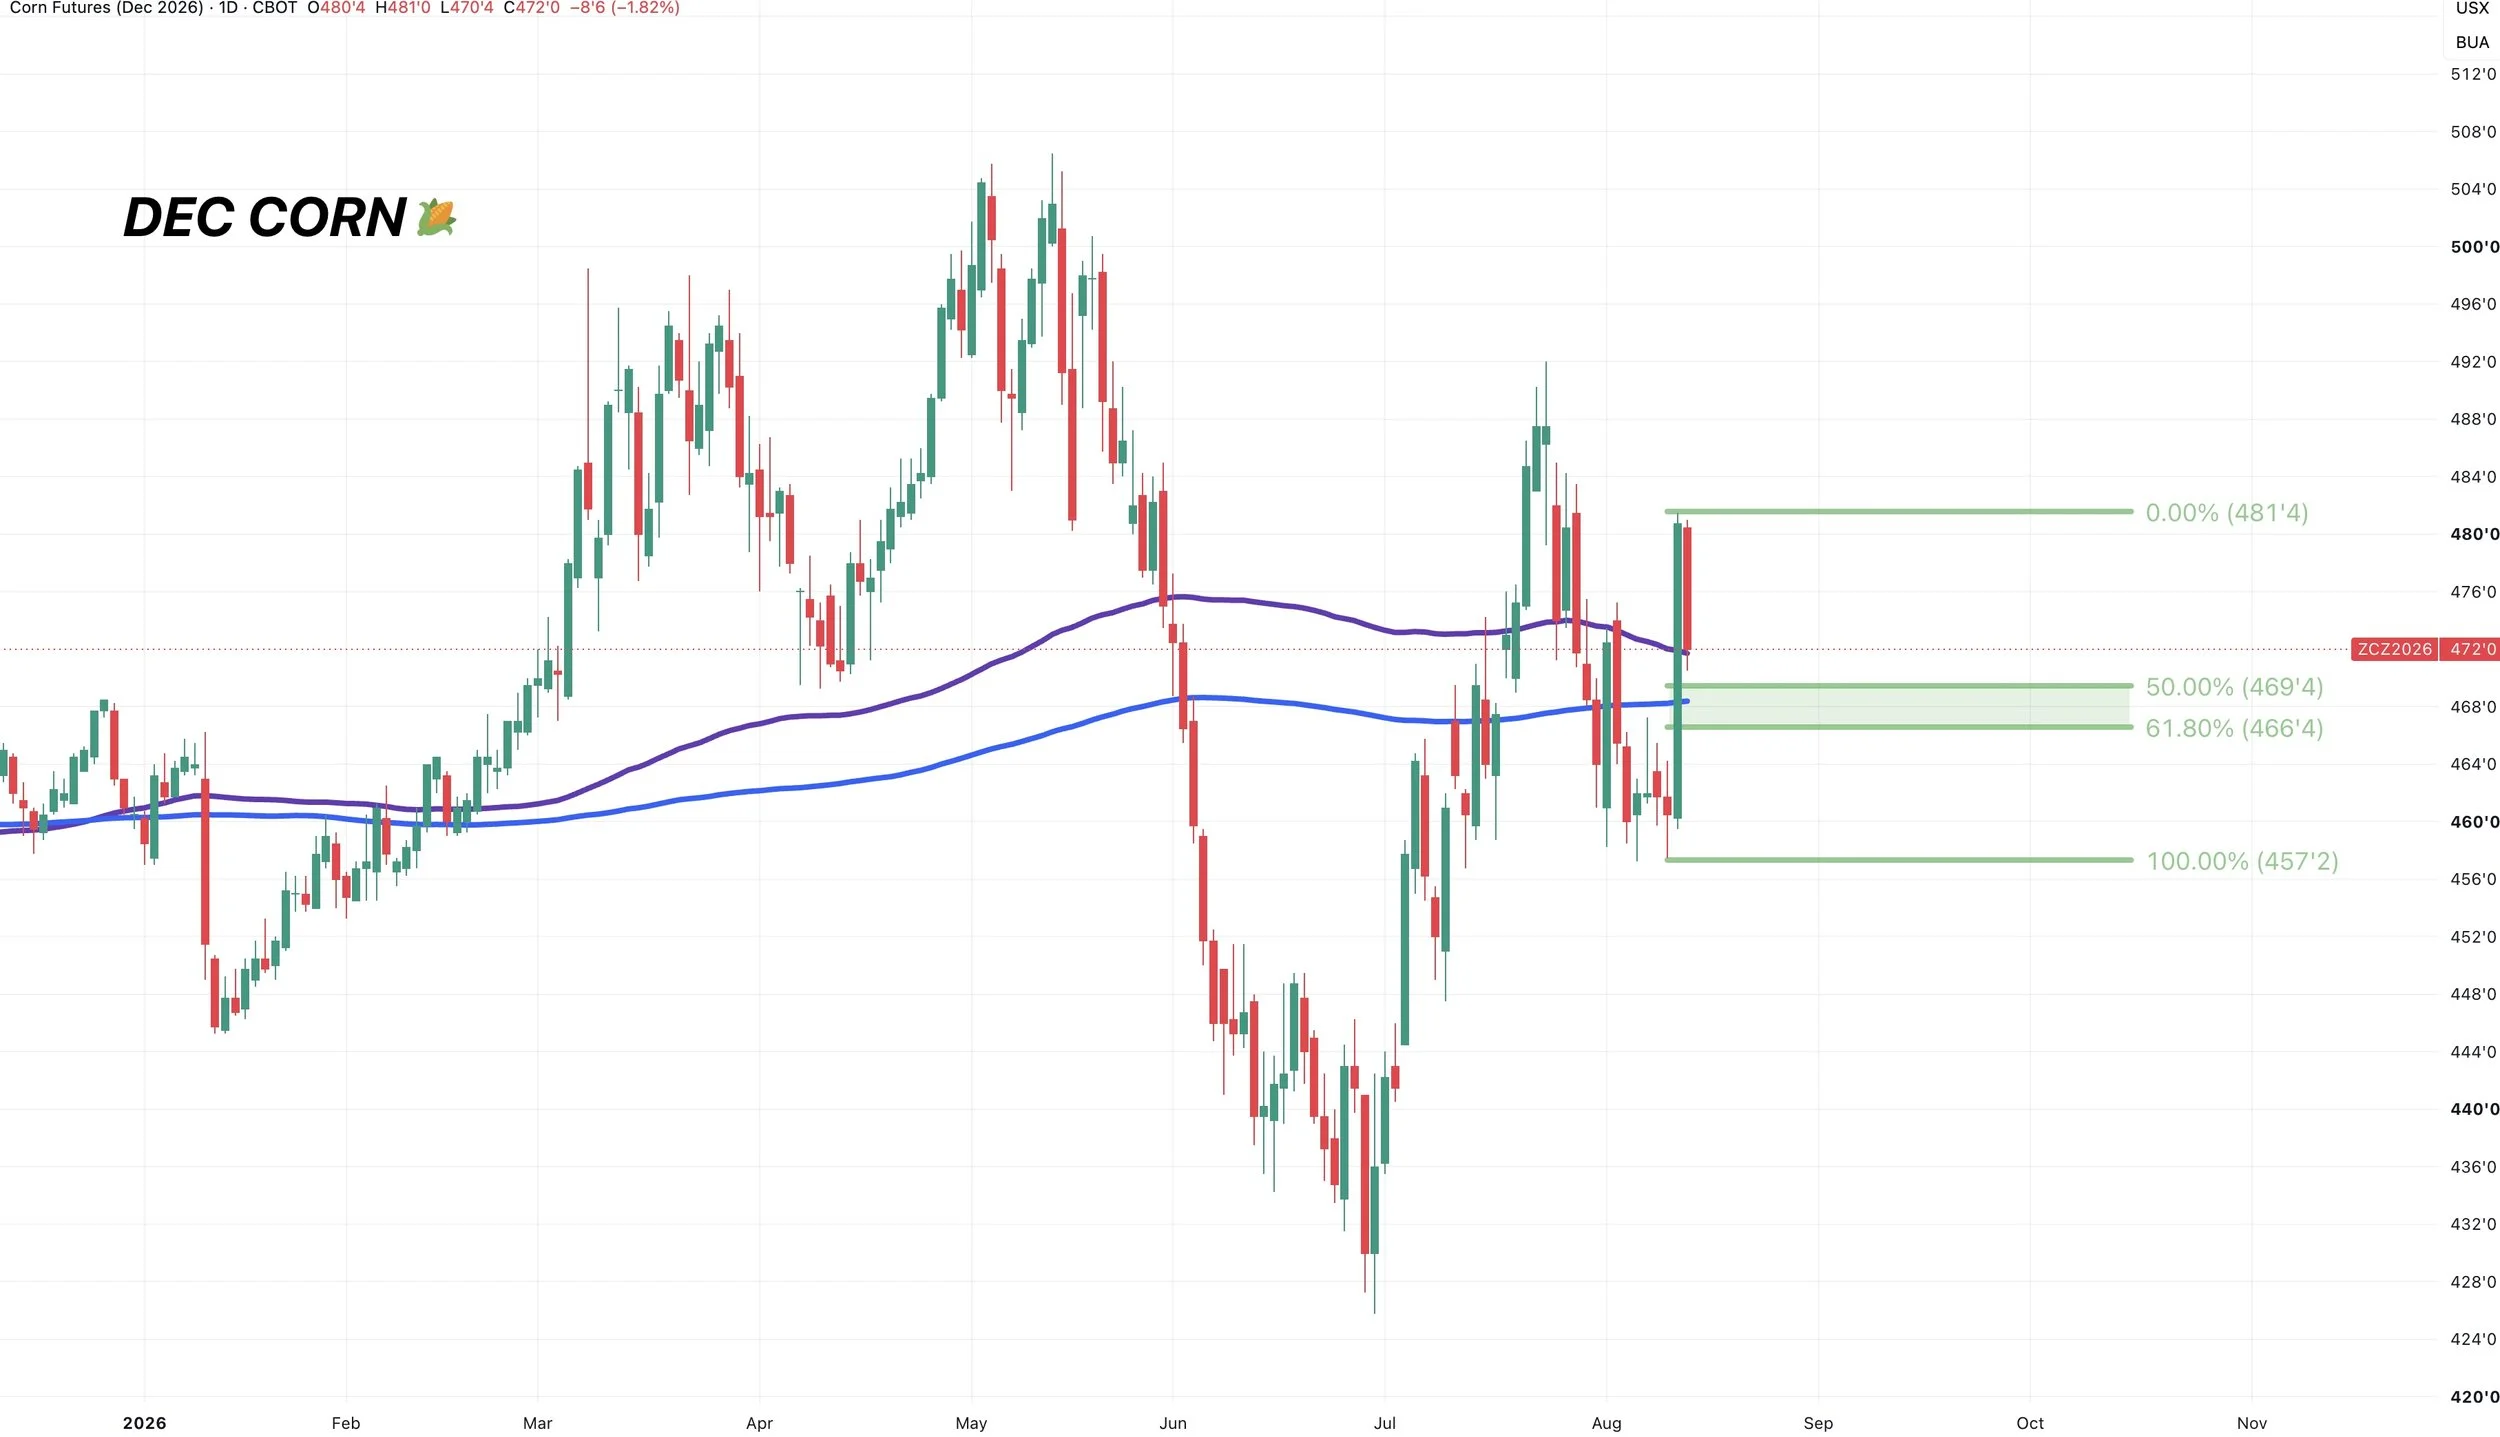
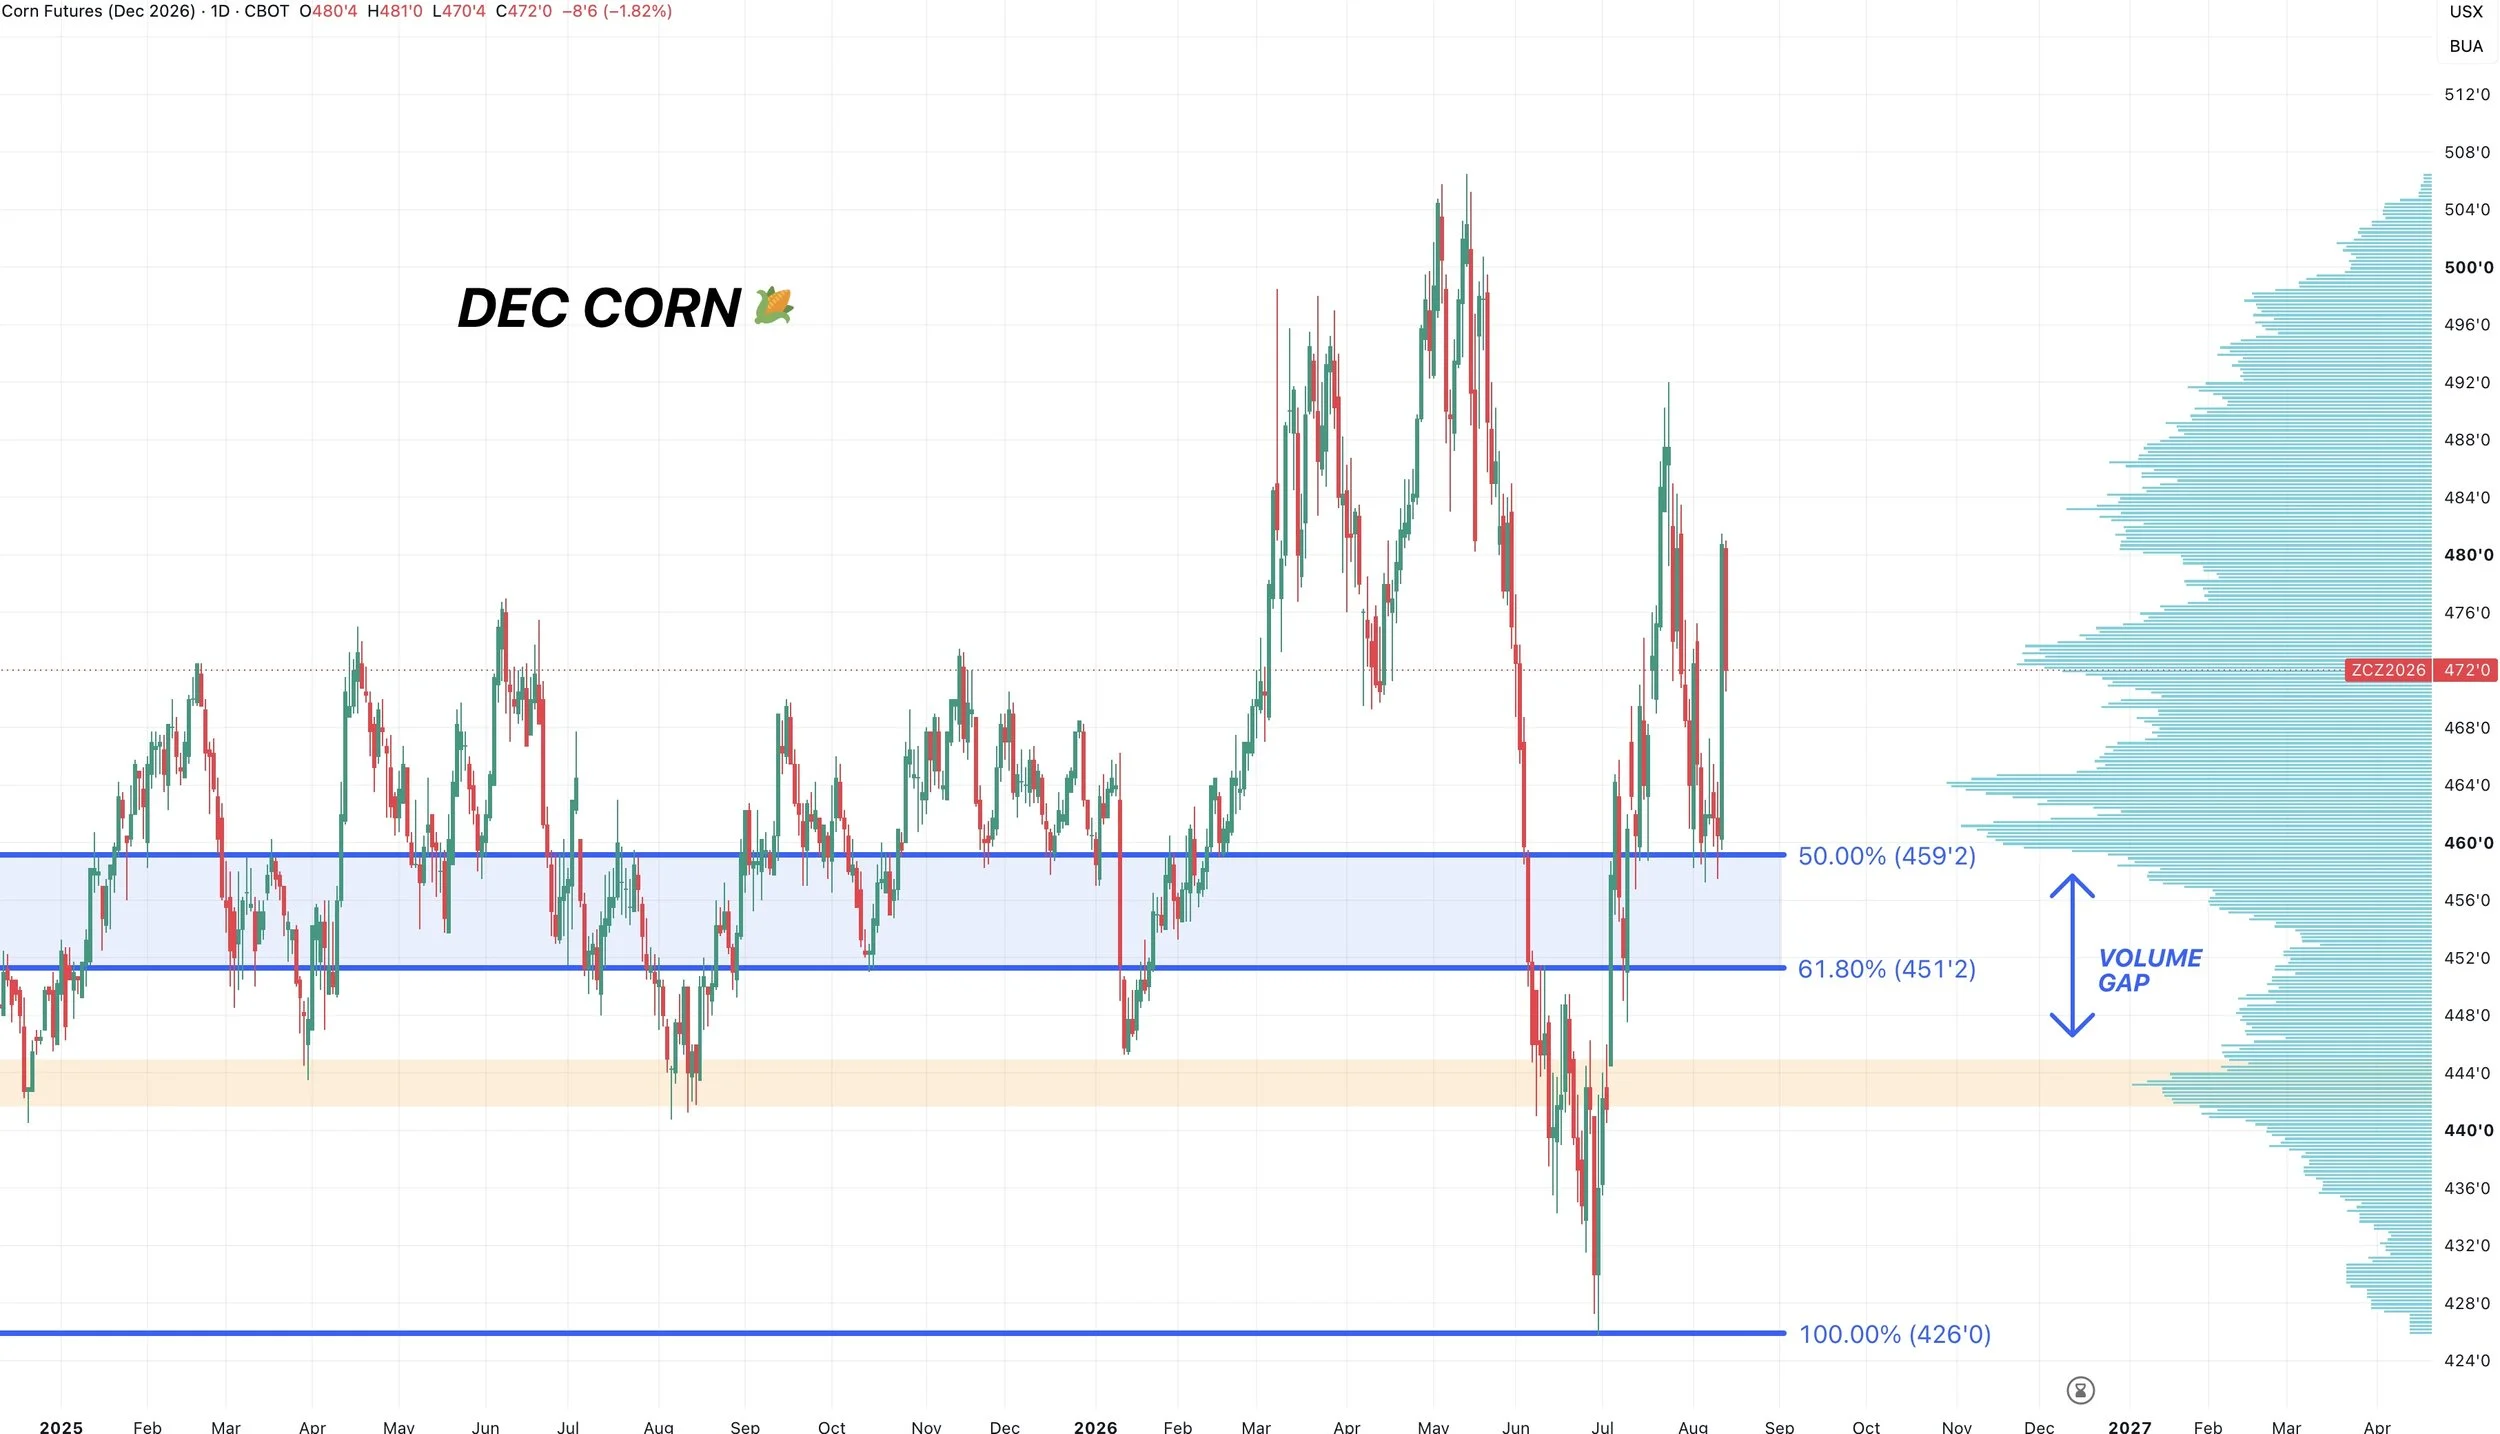
We found life after giving back 50% of the entire rally.
That same level was a massive shelf of volume.
So we bounced right where we needed to.
Even if we don’t hold the levels above, the upward structure still remains in tact, and my bias leans higher unless we break below the 61.8% level down to the contract lows at $4.50
I will be going over some upside targets later as we get closer to them.
Soybeans
Weather:
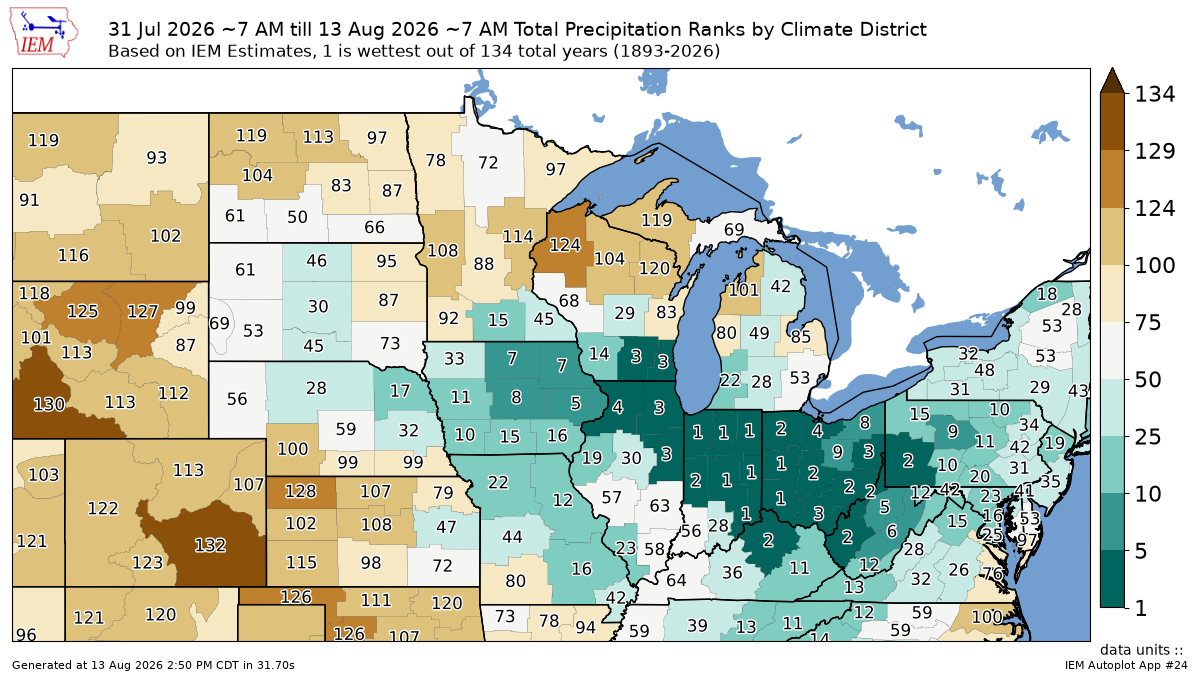
Weather isn’t exactly screaming bullish for soybeans.
We still have plenty of rain in the forecasts.
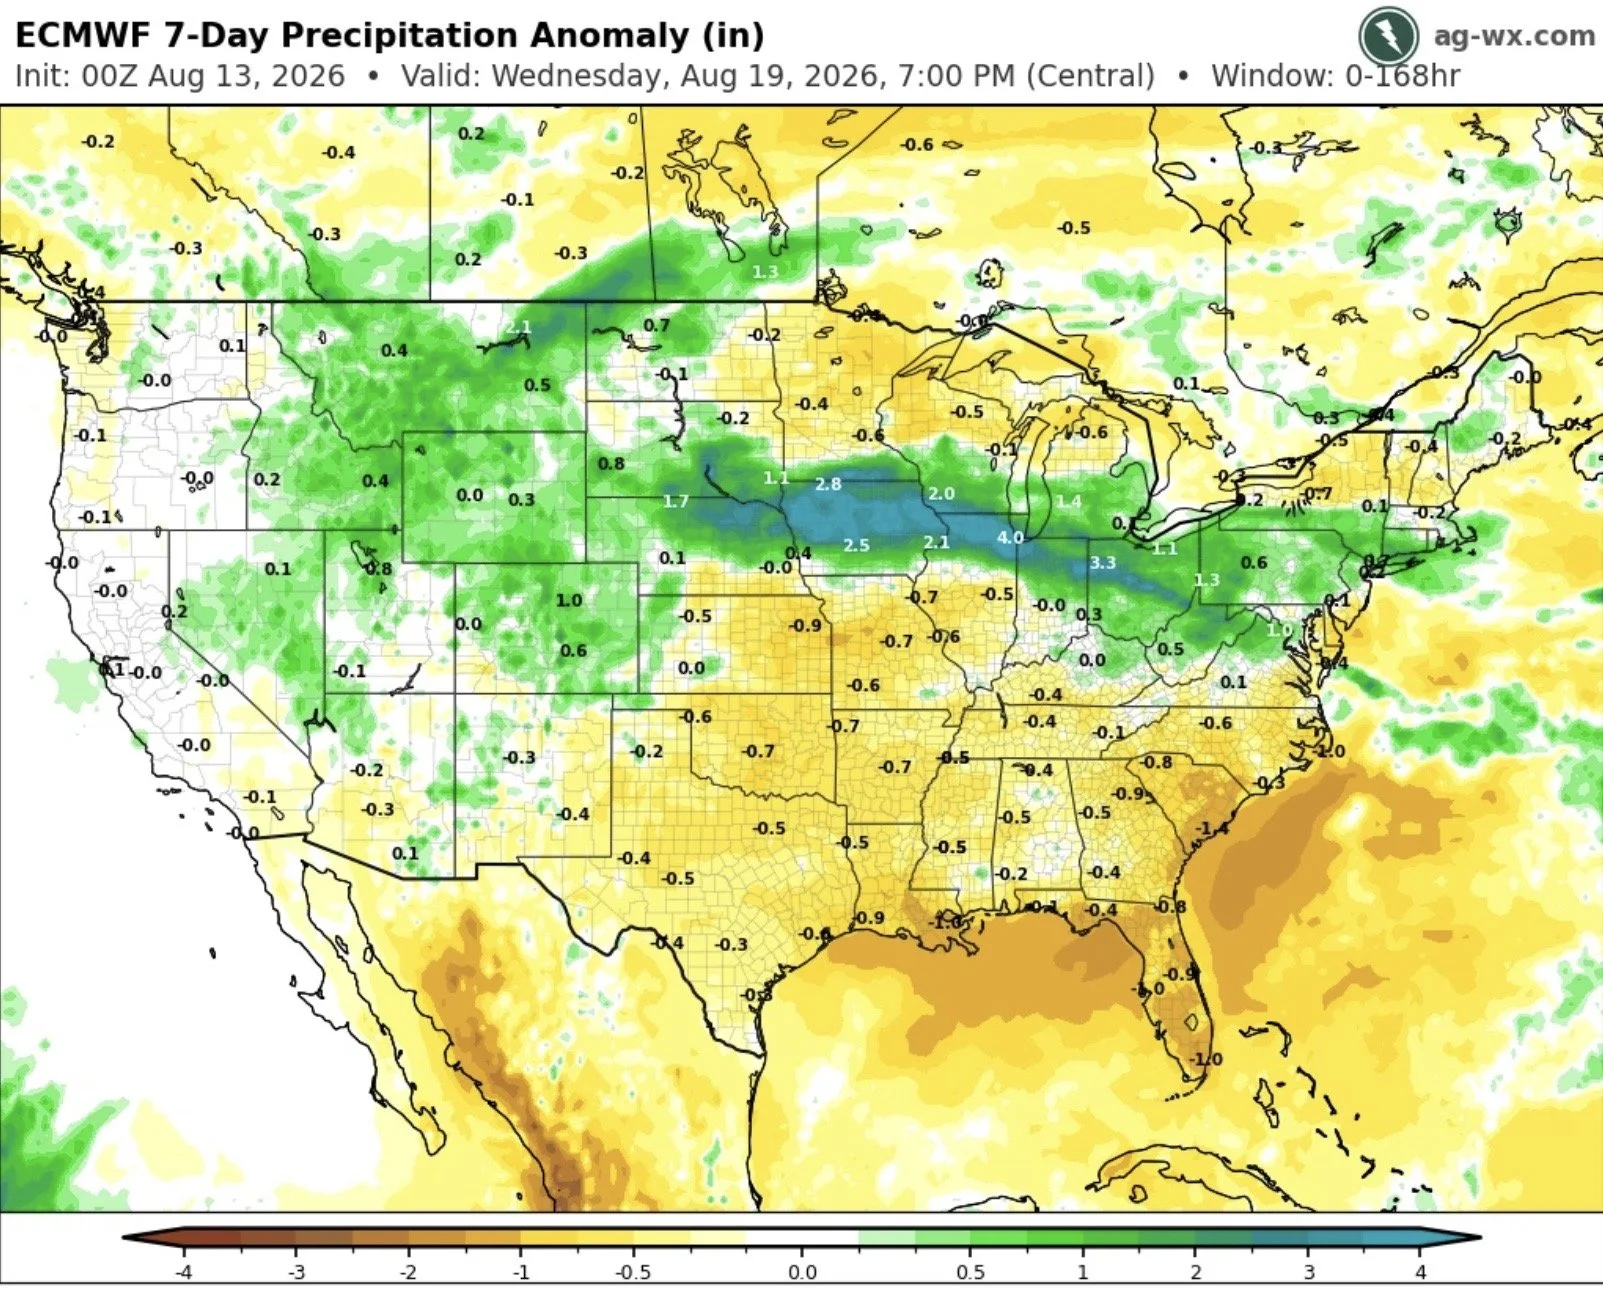
Here is the precip ranks for August so far.
We've seen a very wet month across the I-states.
So you could argue that the soybean crop does still have potential, especially when compared to corn.
US vs World Story:
Here are some similar charts to the corn stocks to use ratio chart I showed in corn.
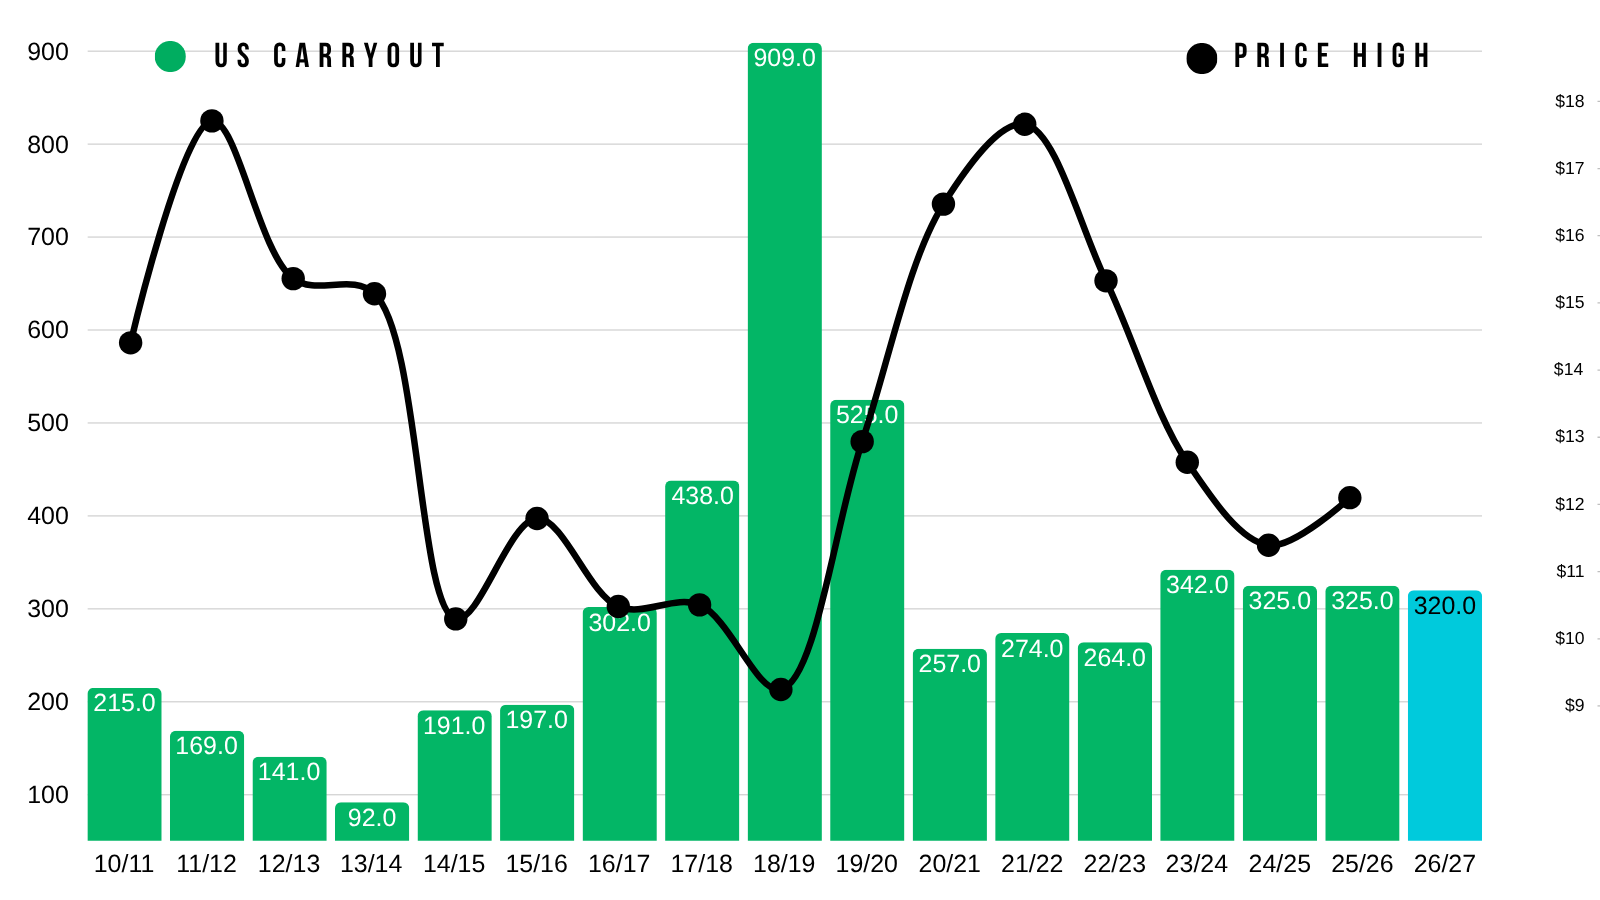
This first one is the US carryout vs soybeans highest price of the year.
With the increase to carryout, we are basically right on par with where we were the last two years.
The current US situation right now isn’t considered super bullish, but it's not bearish either.
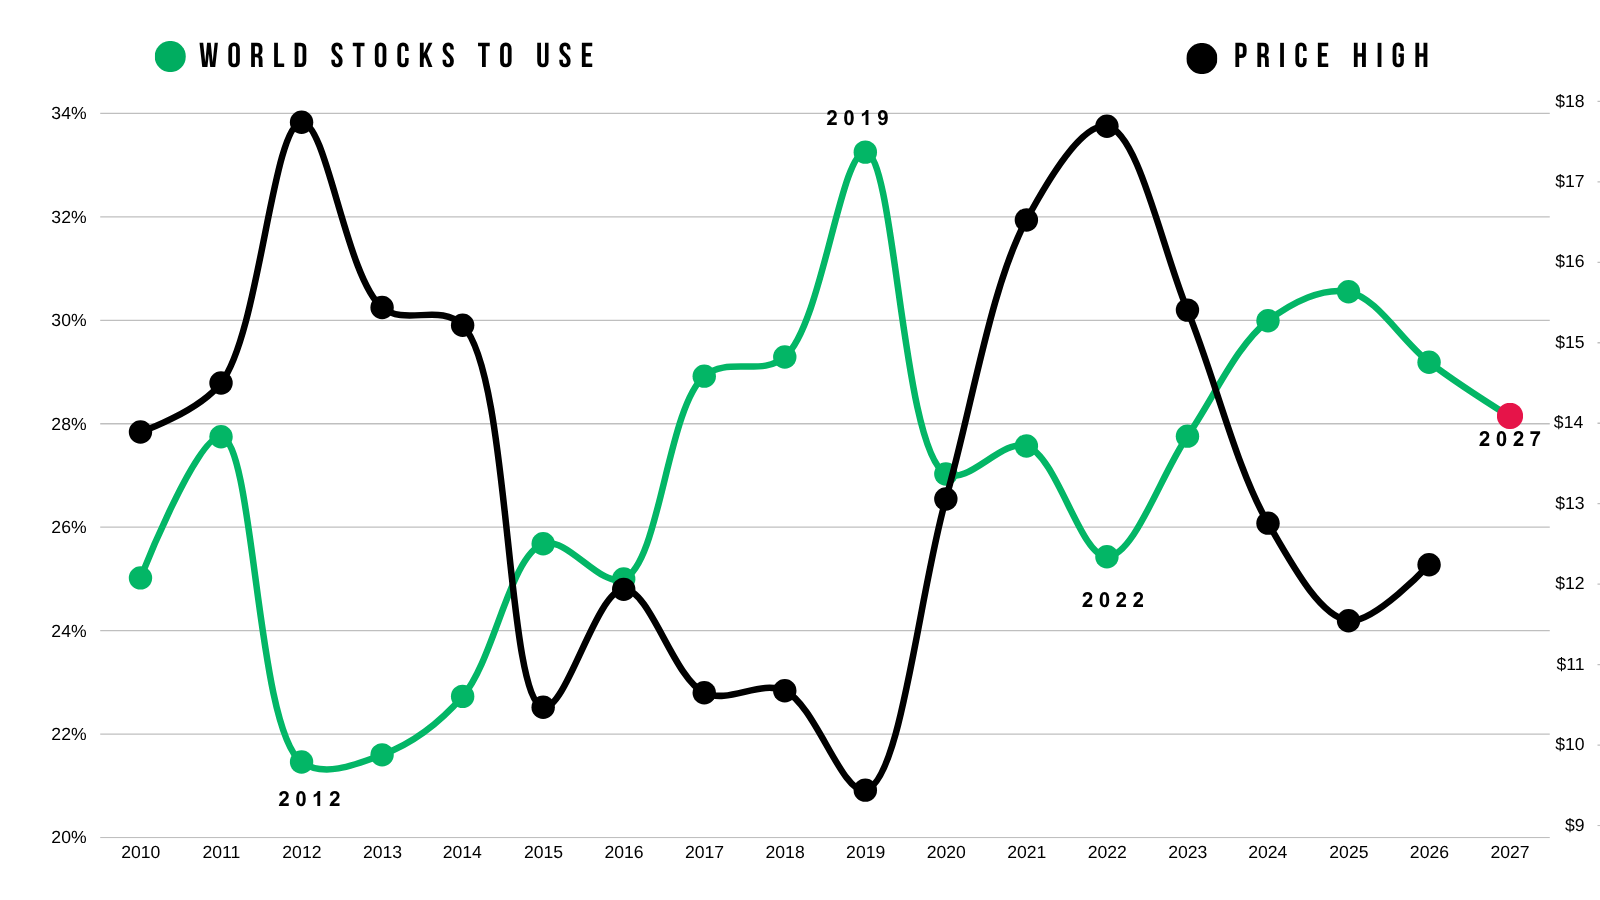
But given that soybeans are more of a global crop than corn is, with Brazil being the dominant player outside of the US.
The world situation is a better resemblance for soybeans.
Right now, the world situation is the tightest it's been in several years.
Not as tight as 2022, but the tightest since 2023.
This is despite Brazil having record crop after record crop. Yet the world story is getting tighter and tighter.
You can imagine what happens if South America where to have a hiccup.
What if China lives up to their goal?:
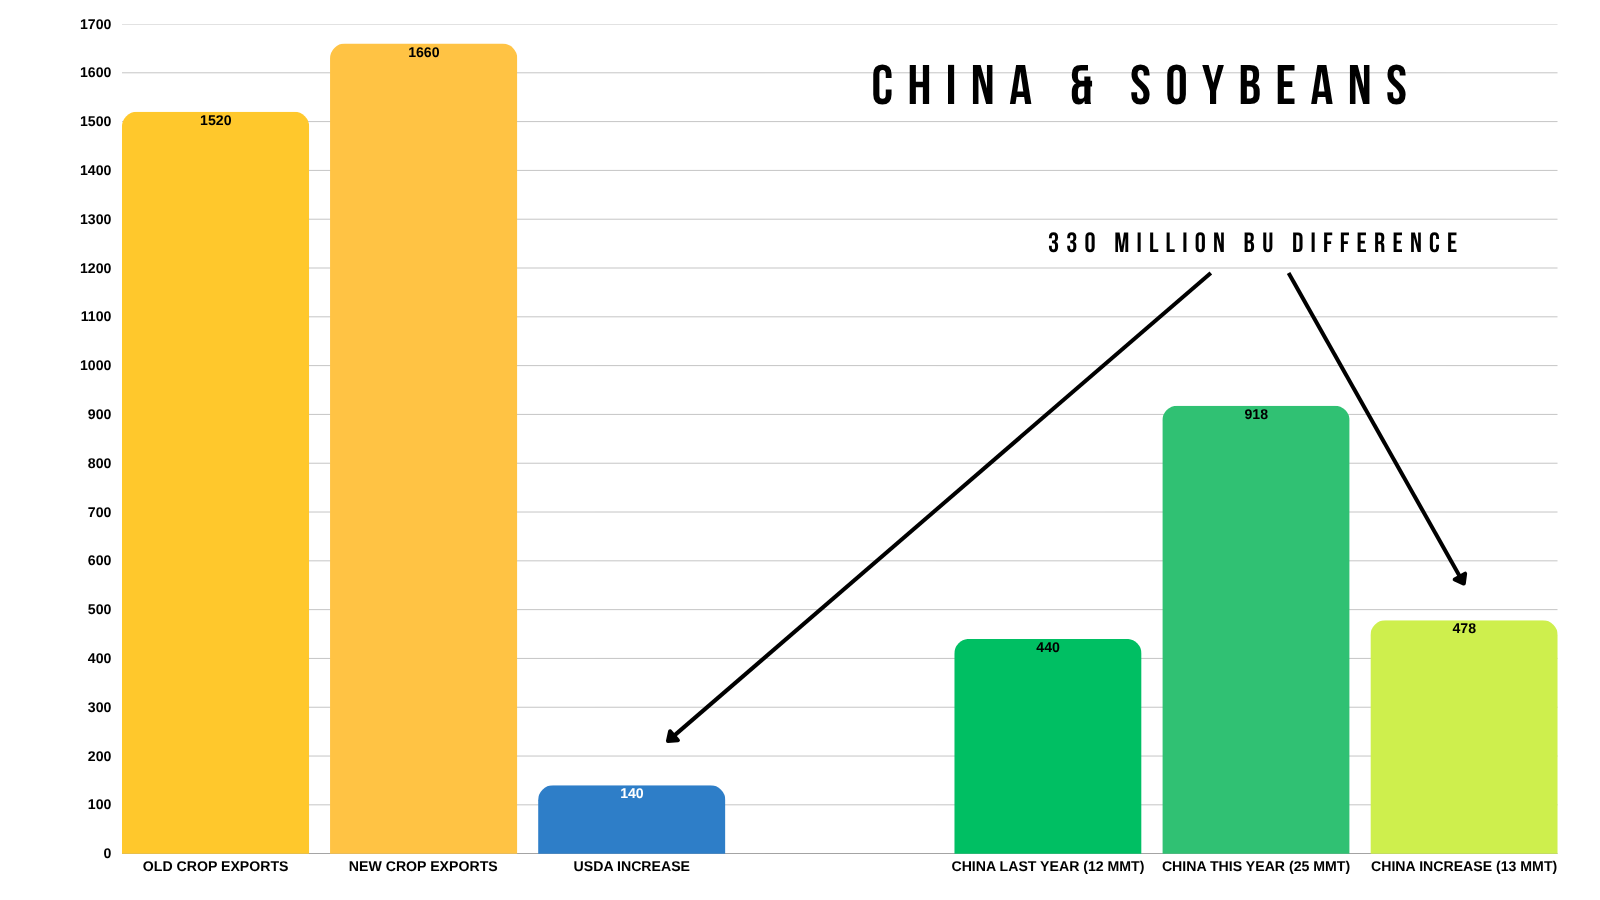
I touched on this the other day, but the USDA is only expecting China to buy 16 MMT of our soybeans vs the 25 MMT they agreed to.
This isn’t some offical number on the balance sheets, but you can find it if you throw around some numbers.
The USDA has:
Old Crop Exports: 1,520 million bu (41.4 MMT)
New Crop Exports: 1,660 million bu (45.2 MMT)
Difference: 140 milllion bu (3.8 MMT)
Last year China bought 12 MMT or 440 million bu of soybeans.
This year they agreed to buy 25 MMT or 920 million bu of soybeans.
Which is 13 MMT more than last year or 480 million bushels of soybeans.
Yet.. the USDA only expects soybean exports to be up 3.8 MMT or 140 million bu compared to last year.
Which means they are only expecting China to buy 16 MMT or 590 million bu given that demand to non-China remains the same as last year.
So this tells us that if China buys the full 25 MMT (920 million bu), that would be 9 MMT (330 million bu) more than the USDA's guess of 16 MMT (590 million).
This is a big deal because that 9 MMT (330 million bu) is literally the same size as our entire carryout.
So if China even comes close to fulfilling that goal, we simply do not have the supply to meet that number and China's goal.
If this were to happen, we would need to ration demand lower and incentive less non-China demand.
How do you incentive lower demand? Usually through higher prices.
That would be the potential bull case for soybeans and why we have a lot of potential if China agrees to do what they said they would.
I threw together a chart that might help you visualize the numbers. Hopefully it makes sense.
So simplify all of this, the USDA only has exports up 140 million vs last year. But China agreed to buy 480 million more than last year.
Which is over a 300 million difference.
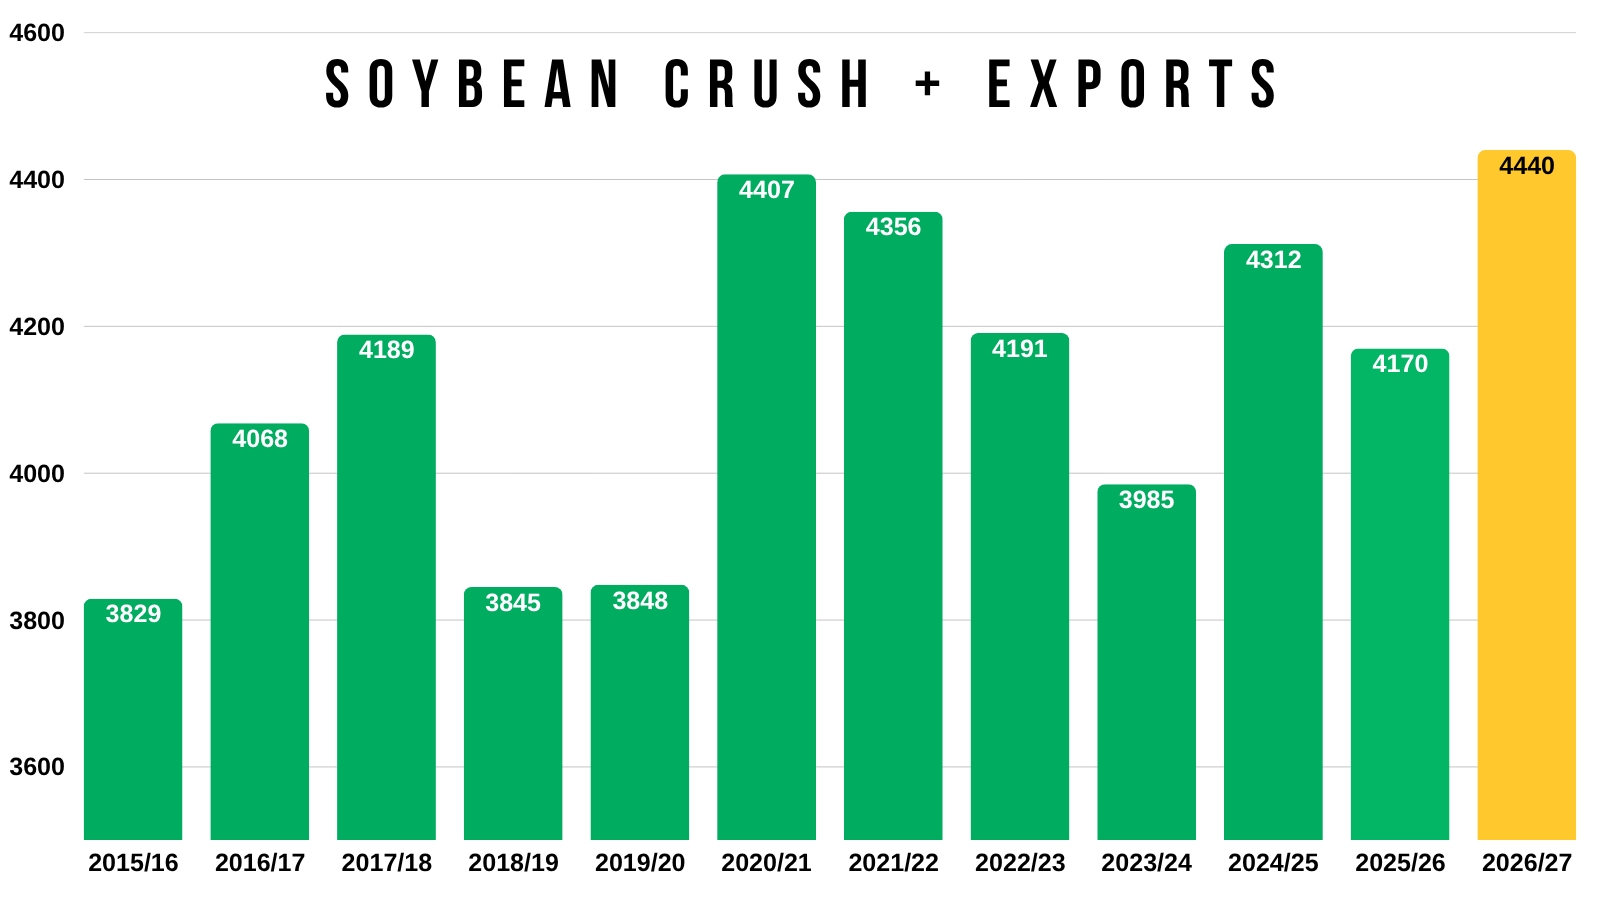
Crush Demand:
Demand is the story for soybeans.
Look at our crush demand. It's not going anywhere.
What happens if exports improve?
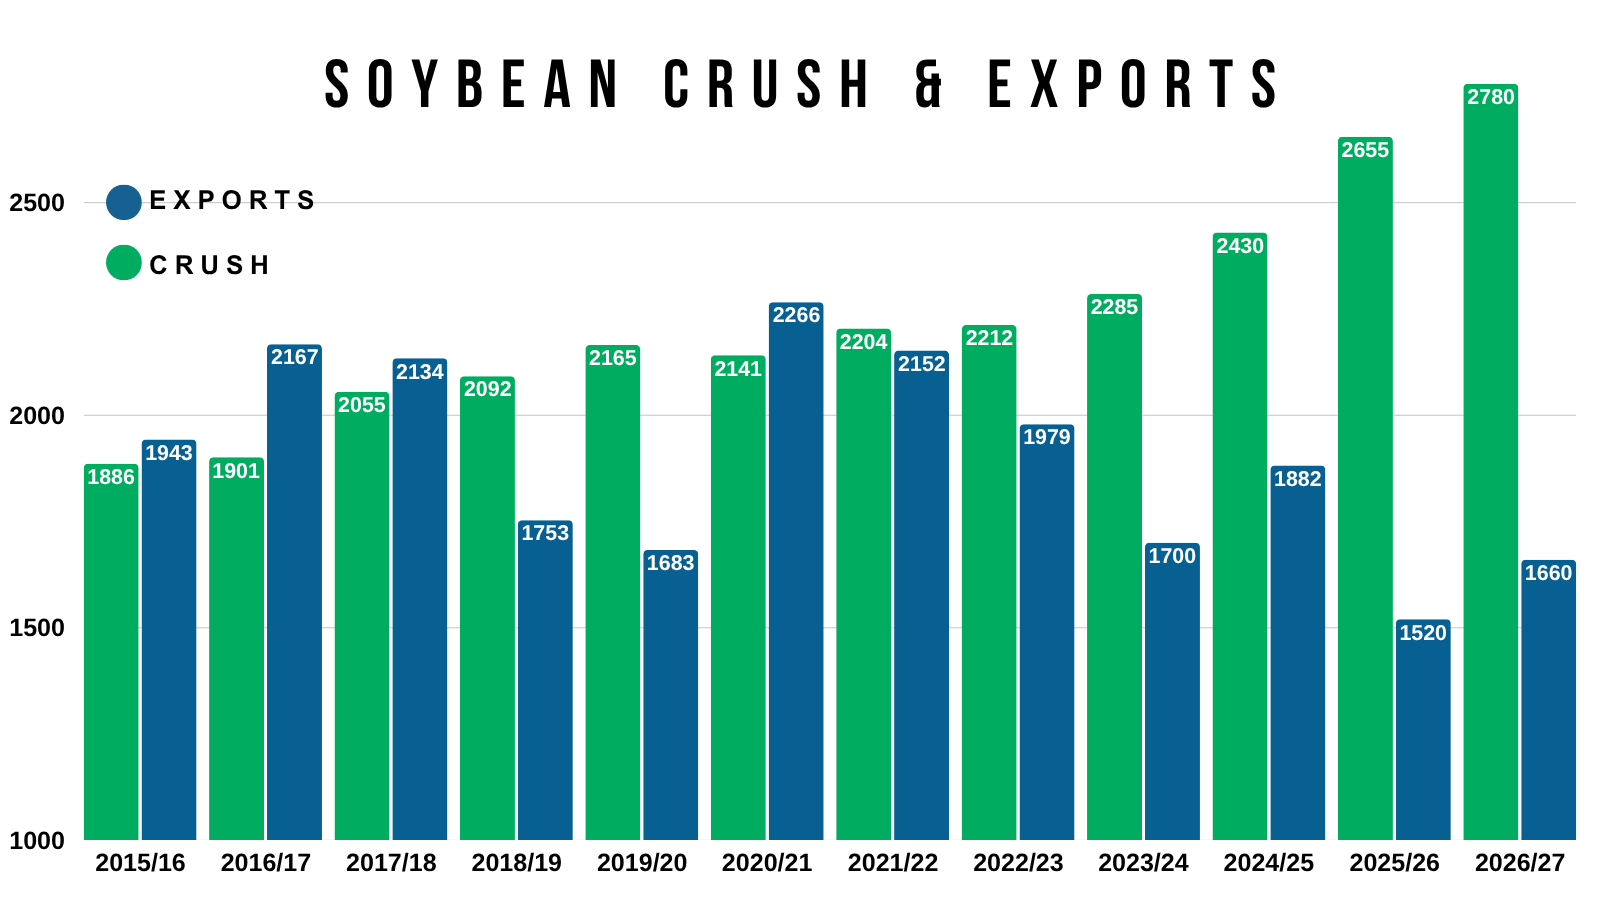
If you add the crush demand plus export demand, it's the best it's ever been.
Meaning the record crush is outpacing the losses in exports.
Resulting in the best domestic demand we've ever seen for soybeans.
Bottom Line:
Weather isn’t bullish, and seasonallly we could run into some harvest pressure that might try to keep a lid on things.
But looking forward, like corn, soybeans still have a ton of potential. Largely led by potential demand.
The US balance sheet isn’t mega bullish, but the world situation is the tightest it's been in years.
We have a South America weather season right around the corner along with the Super El Nino that's going to make the next few months interesting.
Overall, I'm being patient waiting for the next opportunity.
Nov Beans Chart:
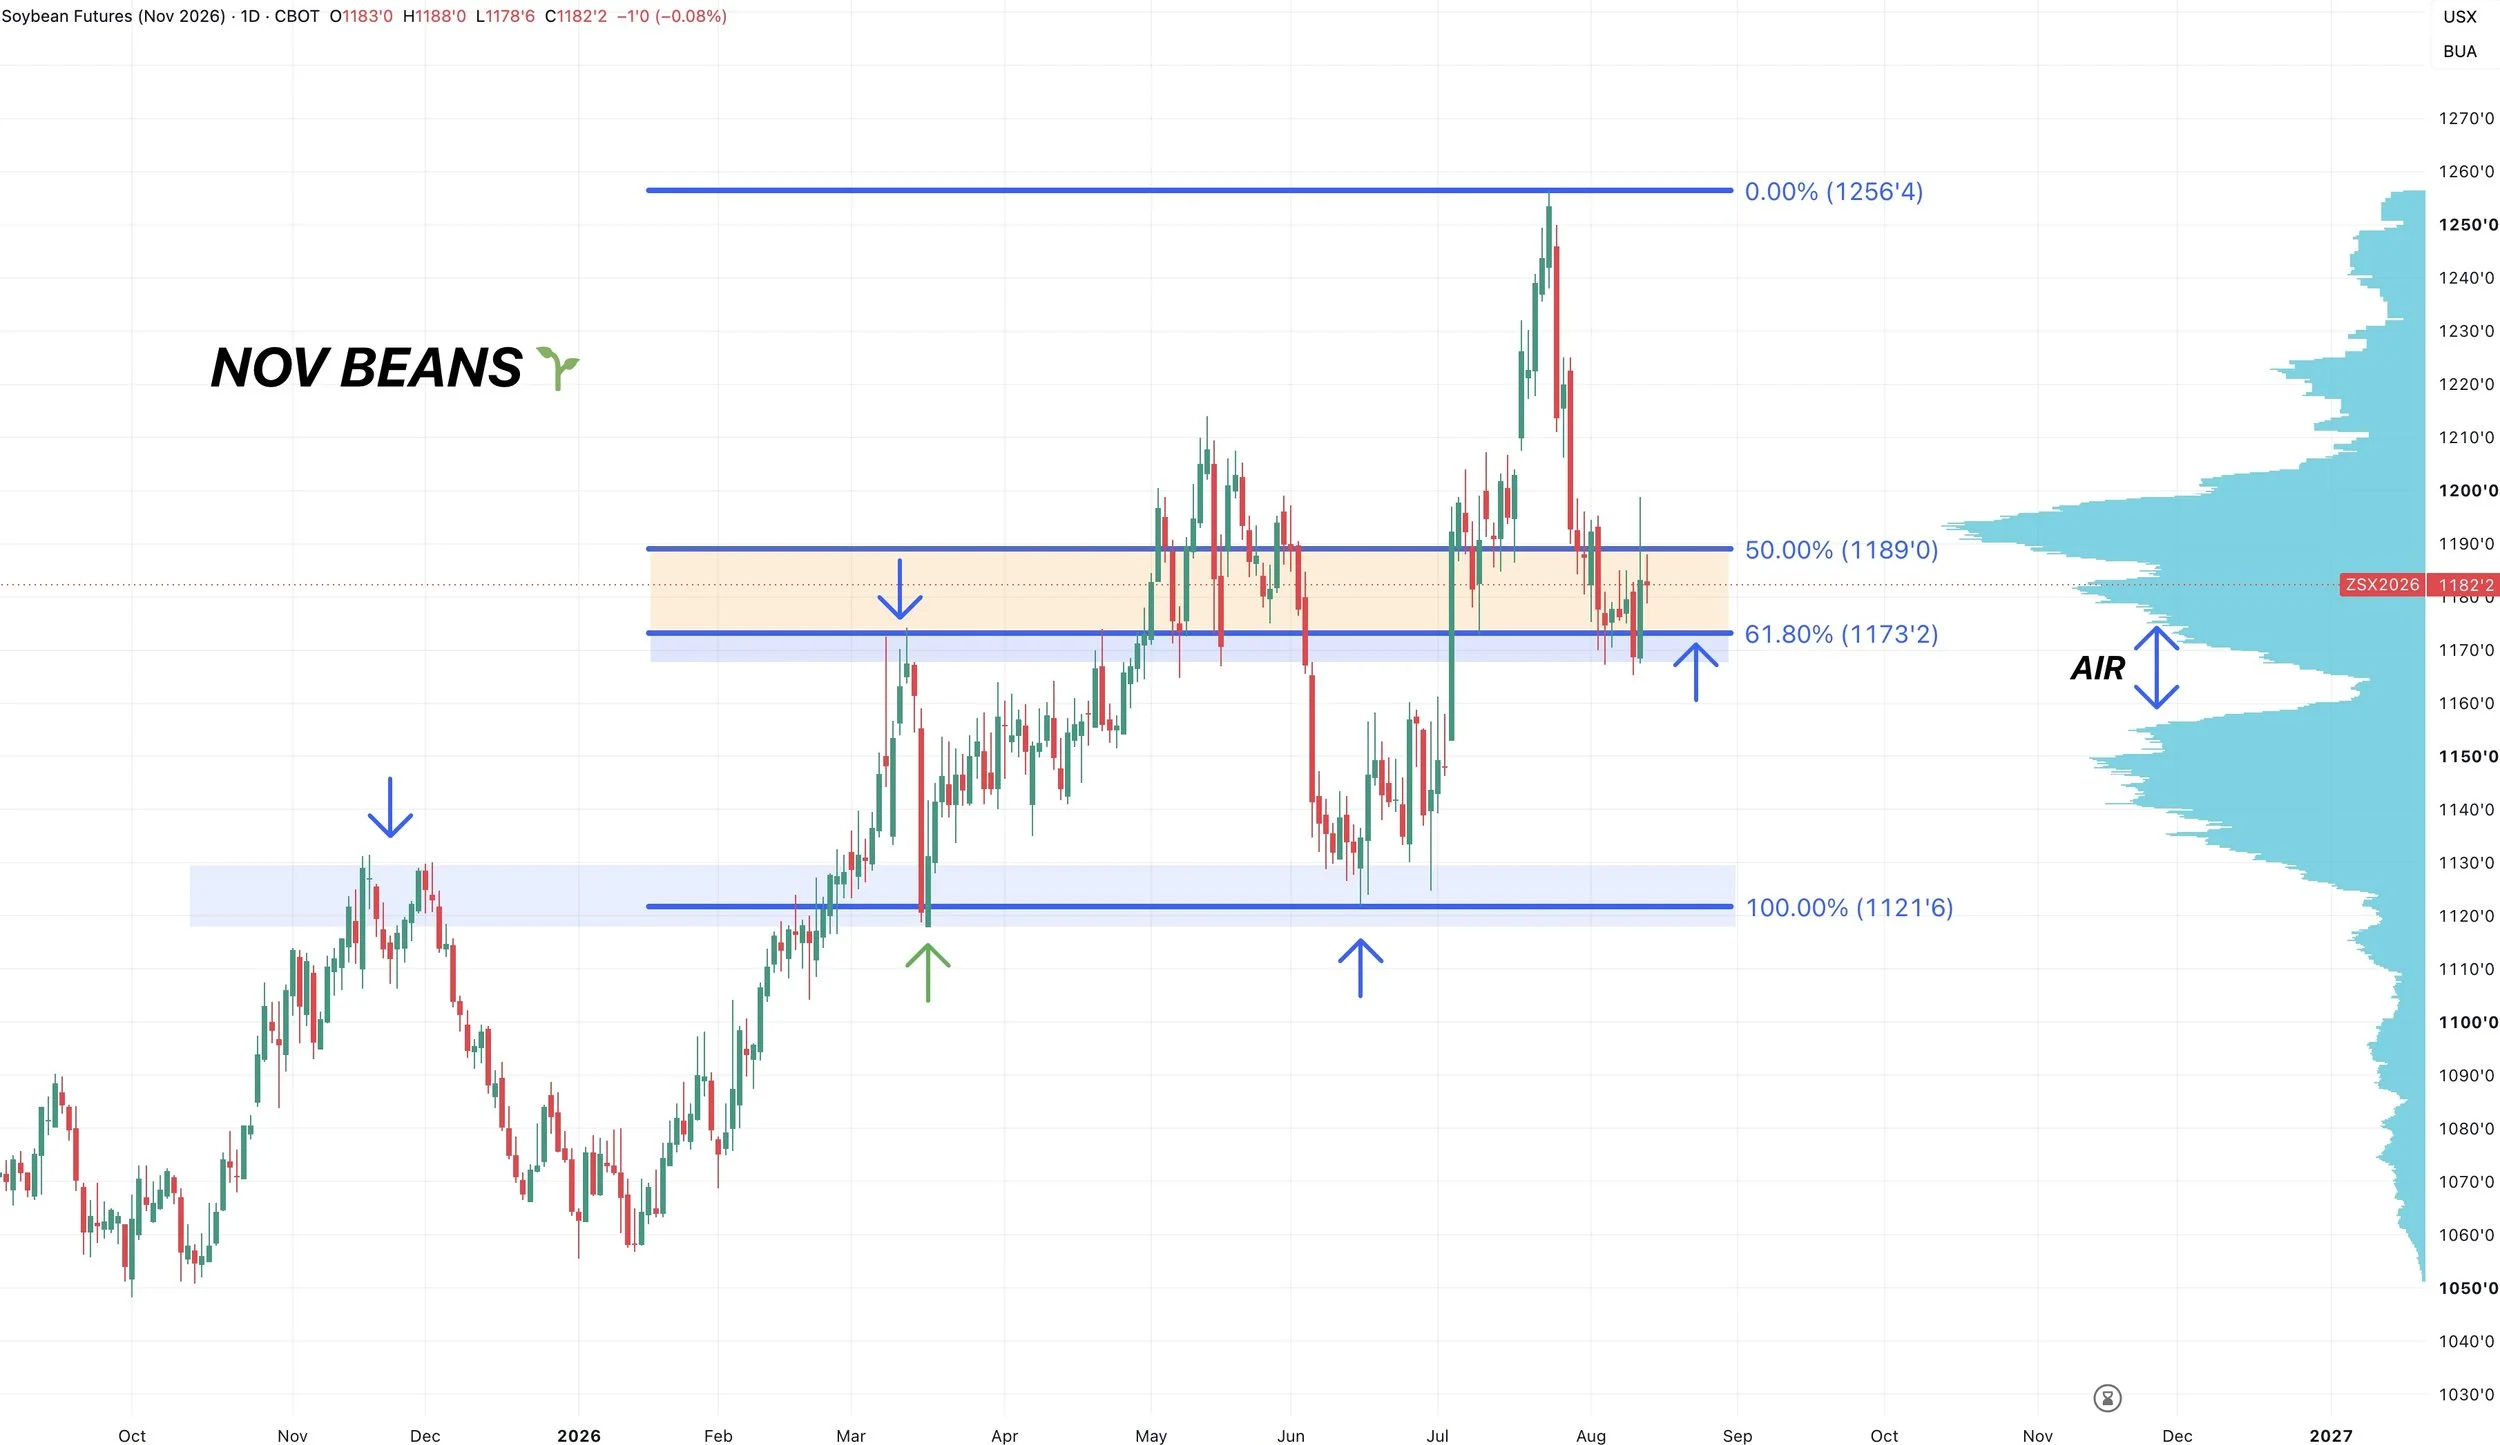
We continue to hold key support right where we need to.
If we are going to bounce, this would still be where we would expect it to happen.
Right at this golden zone and those March highs.
However, despite this being where we'd expect a bounce. It is still a must hold level, as if we break below the recent lows, we will likely spark a leg lower towards the bottom of the range from June.
As we still have a gap of volume to the downside. With plenty of air to the downside if we fail to hold the recent lows.
So there is a defined point of risk here.
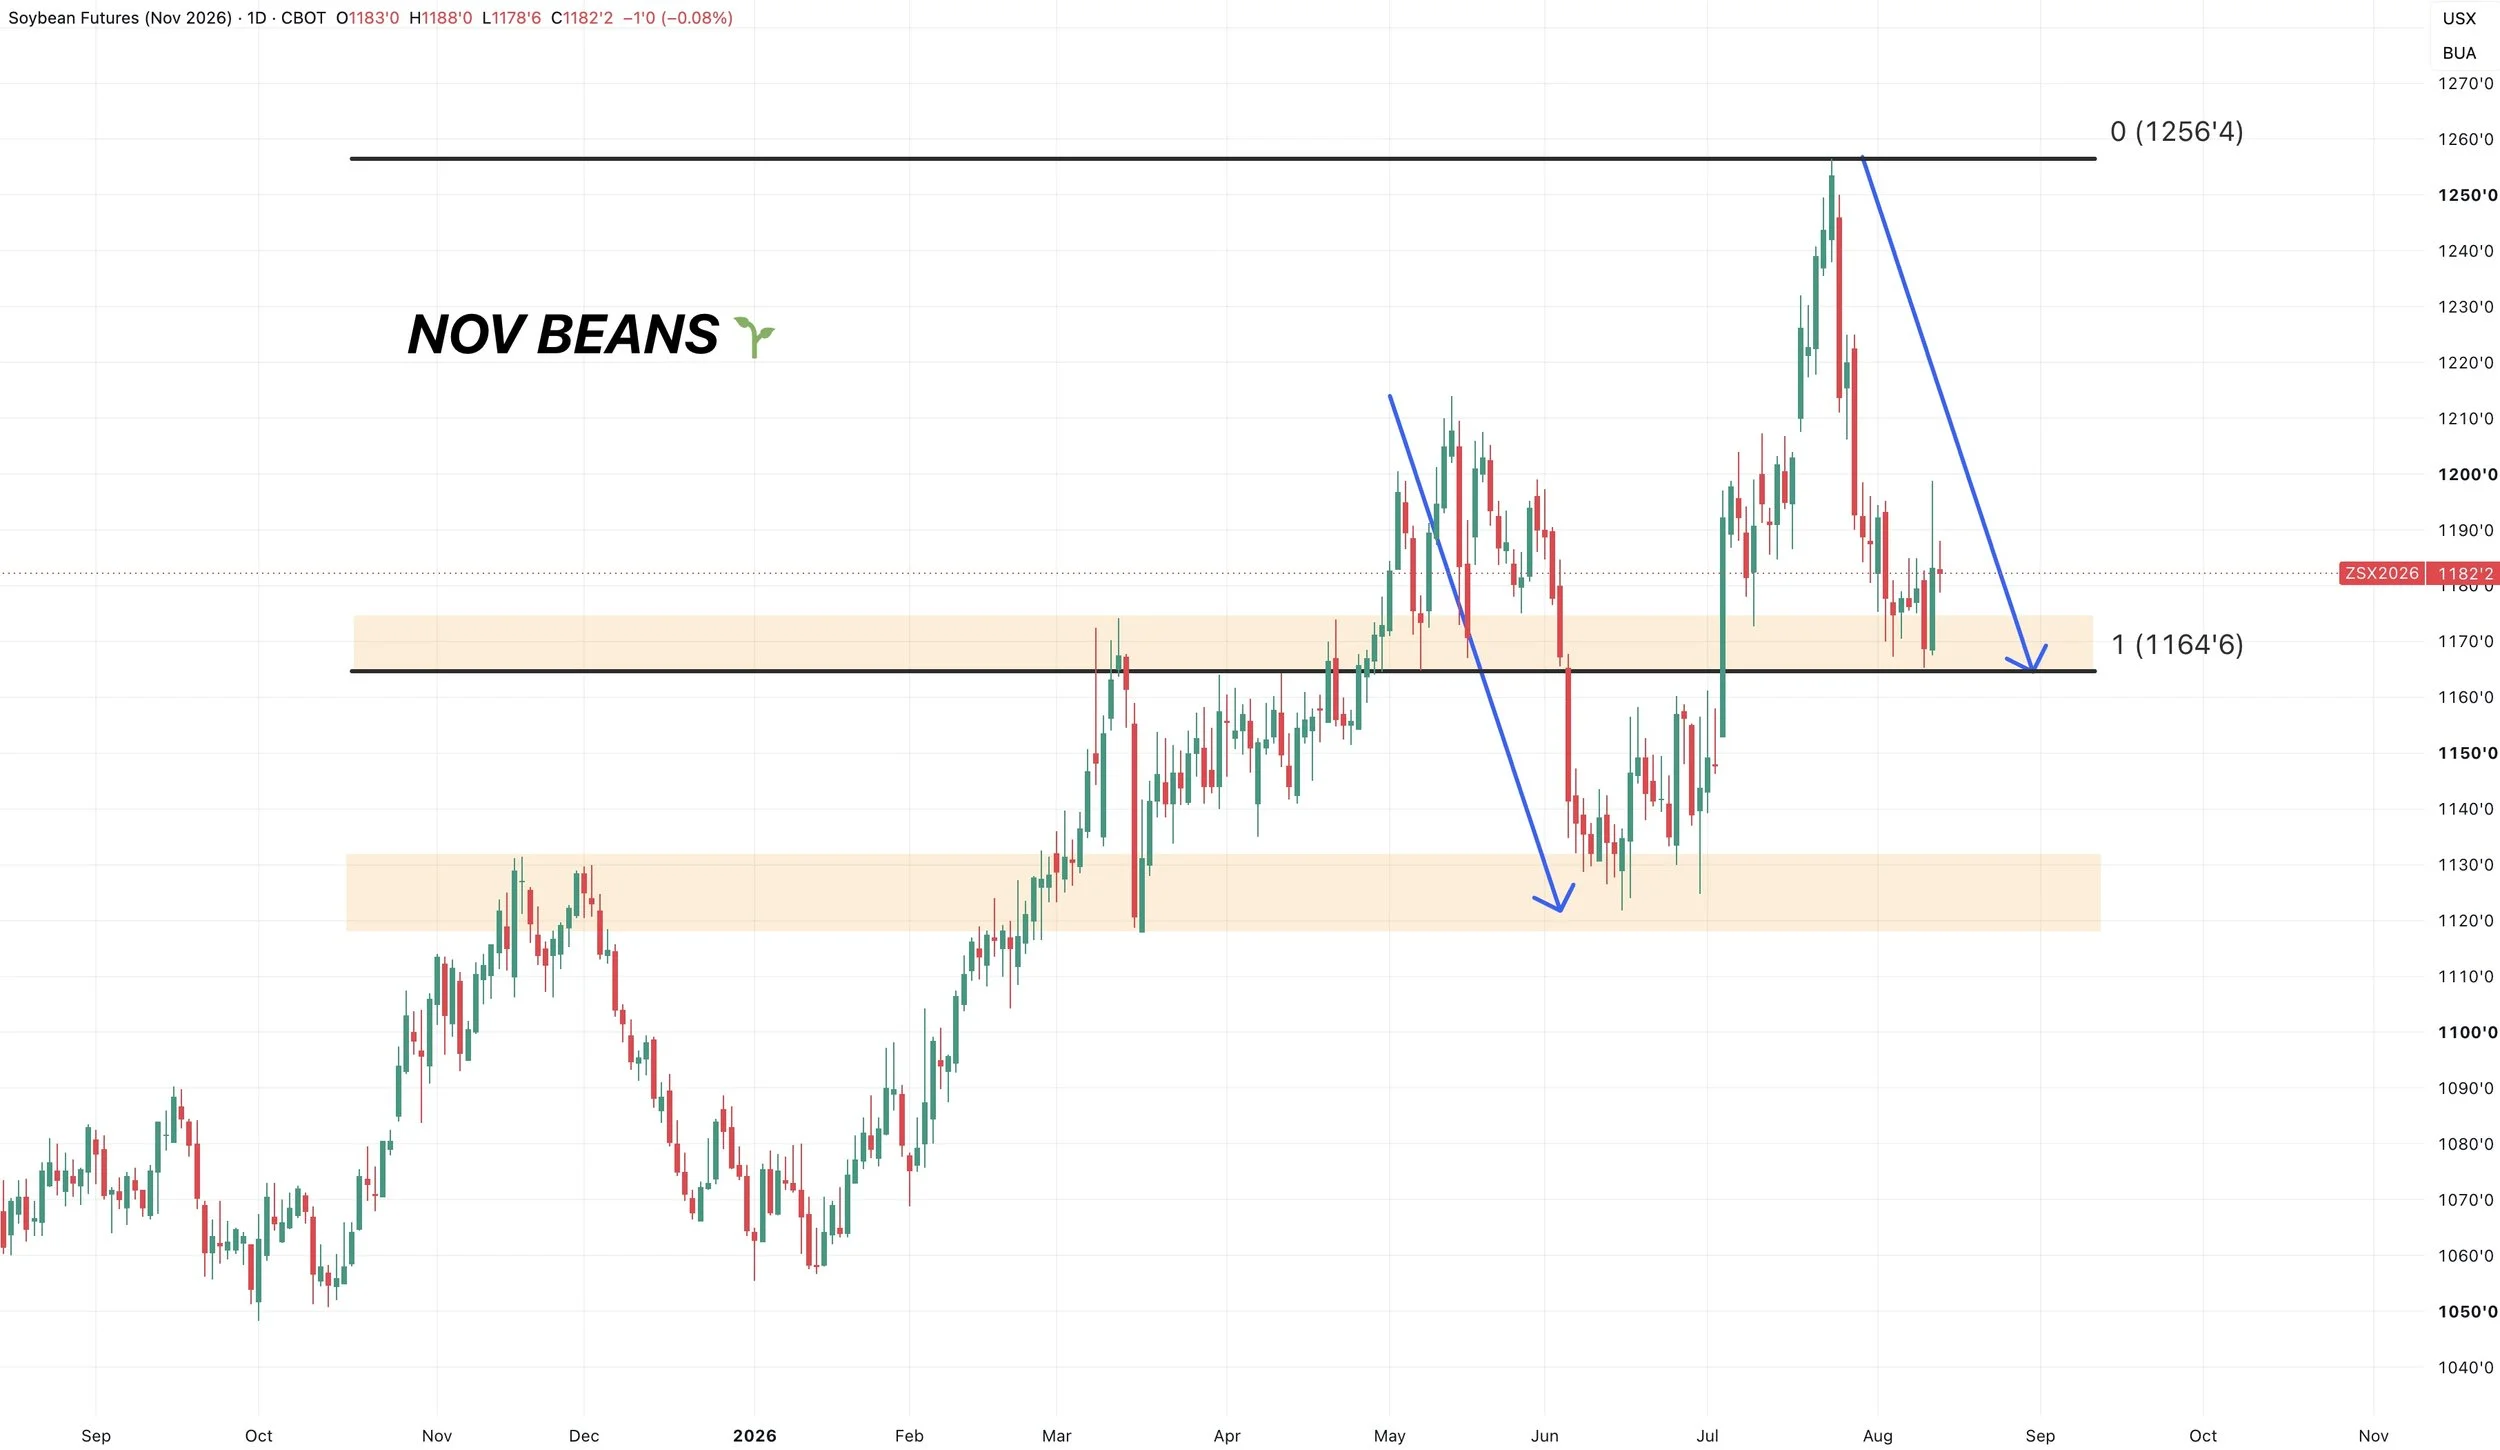
Another reason why this is a big level is that we perfectly hit the 1:1 move from the June sell off.
Meaning this sell off is the exact same size as the June one.
Again, happening right at those highs from March.
So a very crucial level for soybeans to hold.
Support is expected to hold. But if support gives out, it opens the flood gates lower.
Wheat
The USDA report didn’t have a major impact for wheat. It was pretty much just neutral.
US wheat production is still the lowest ever.
The issues in the Black Sea don’t just make global wheat vanish, but it could certainly impact exports and the flow.
So for now the market seems to have lost interest. Although, I do still think the possible long-term impacts are being somewhat underrated.
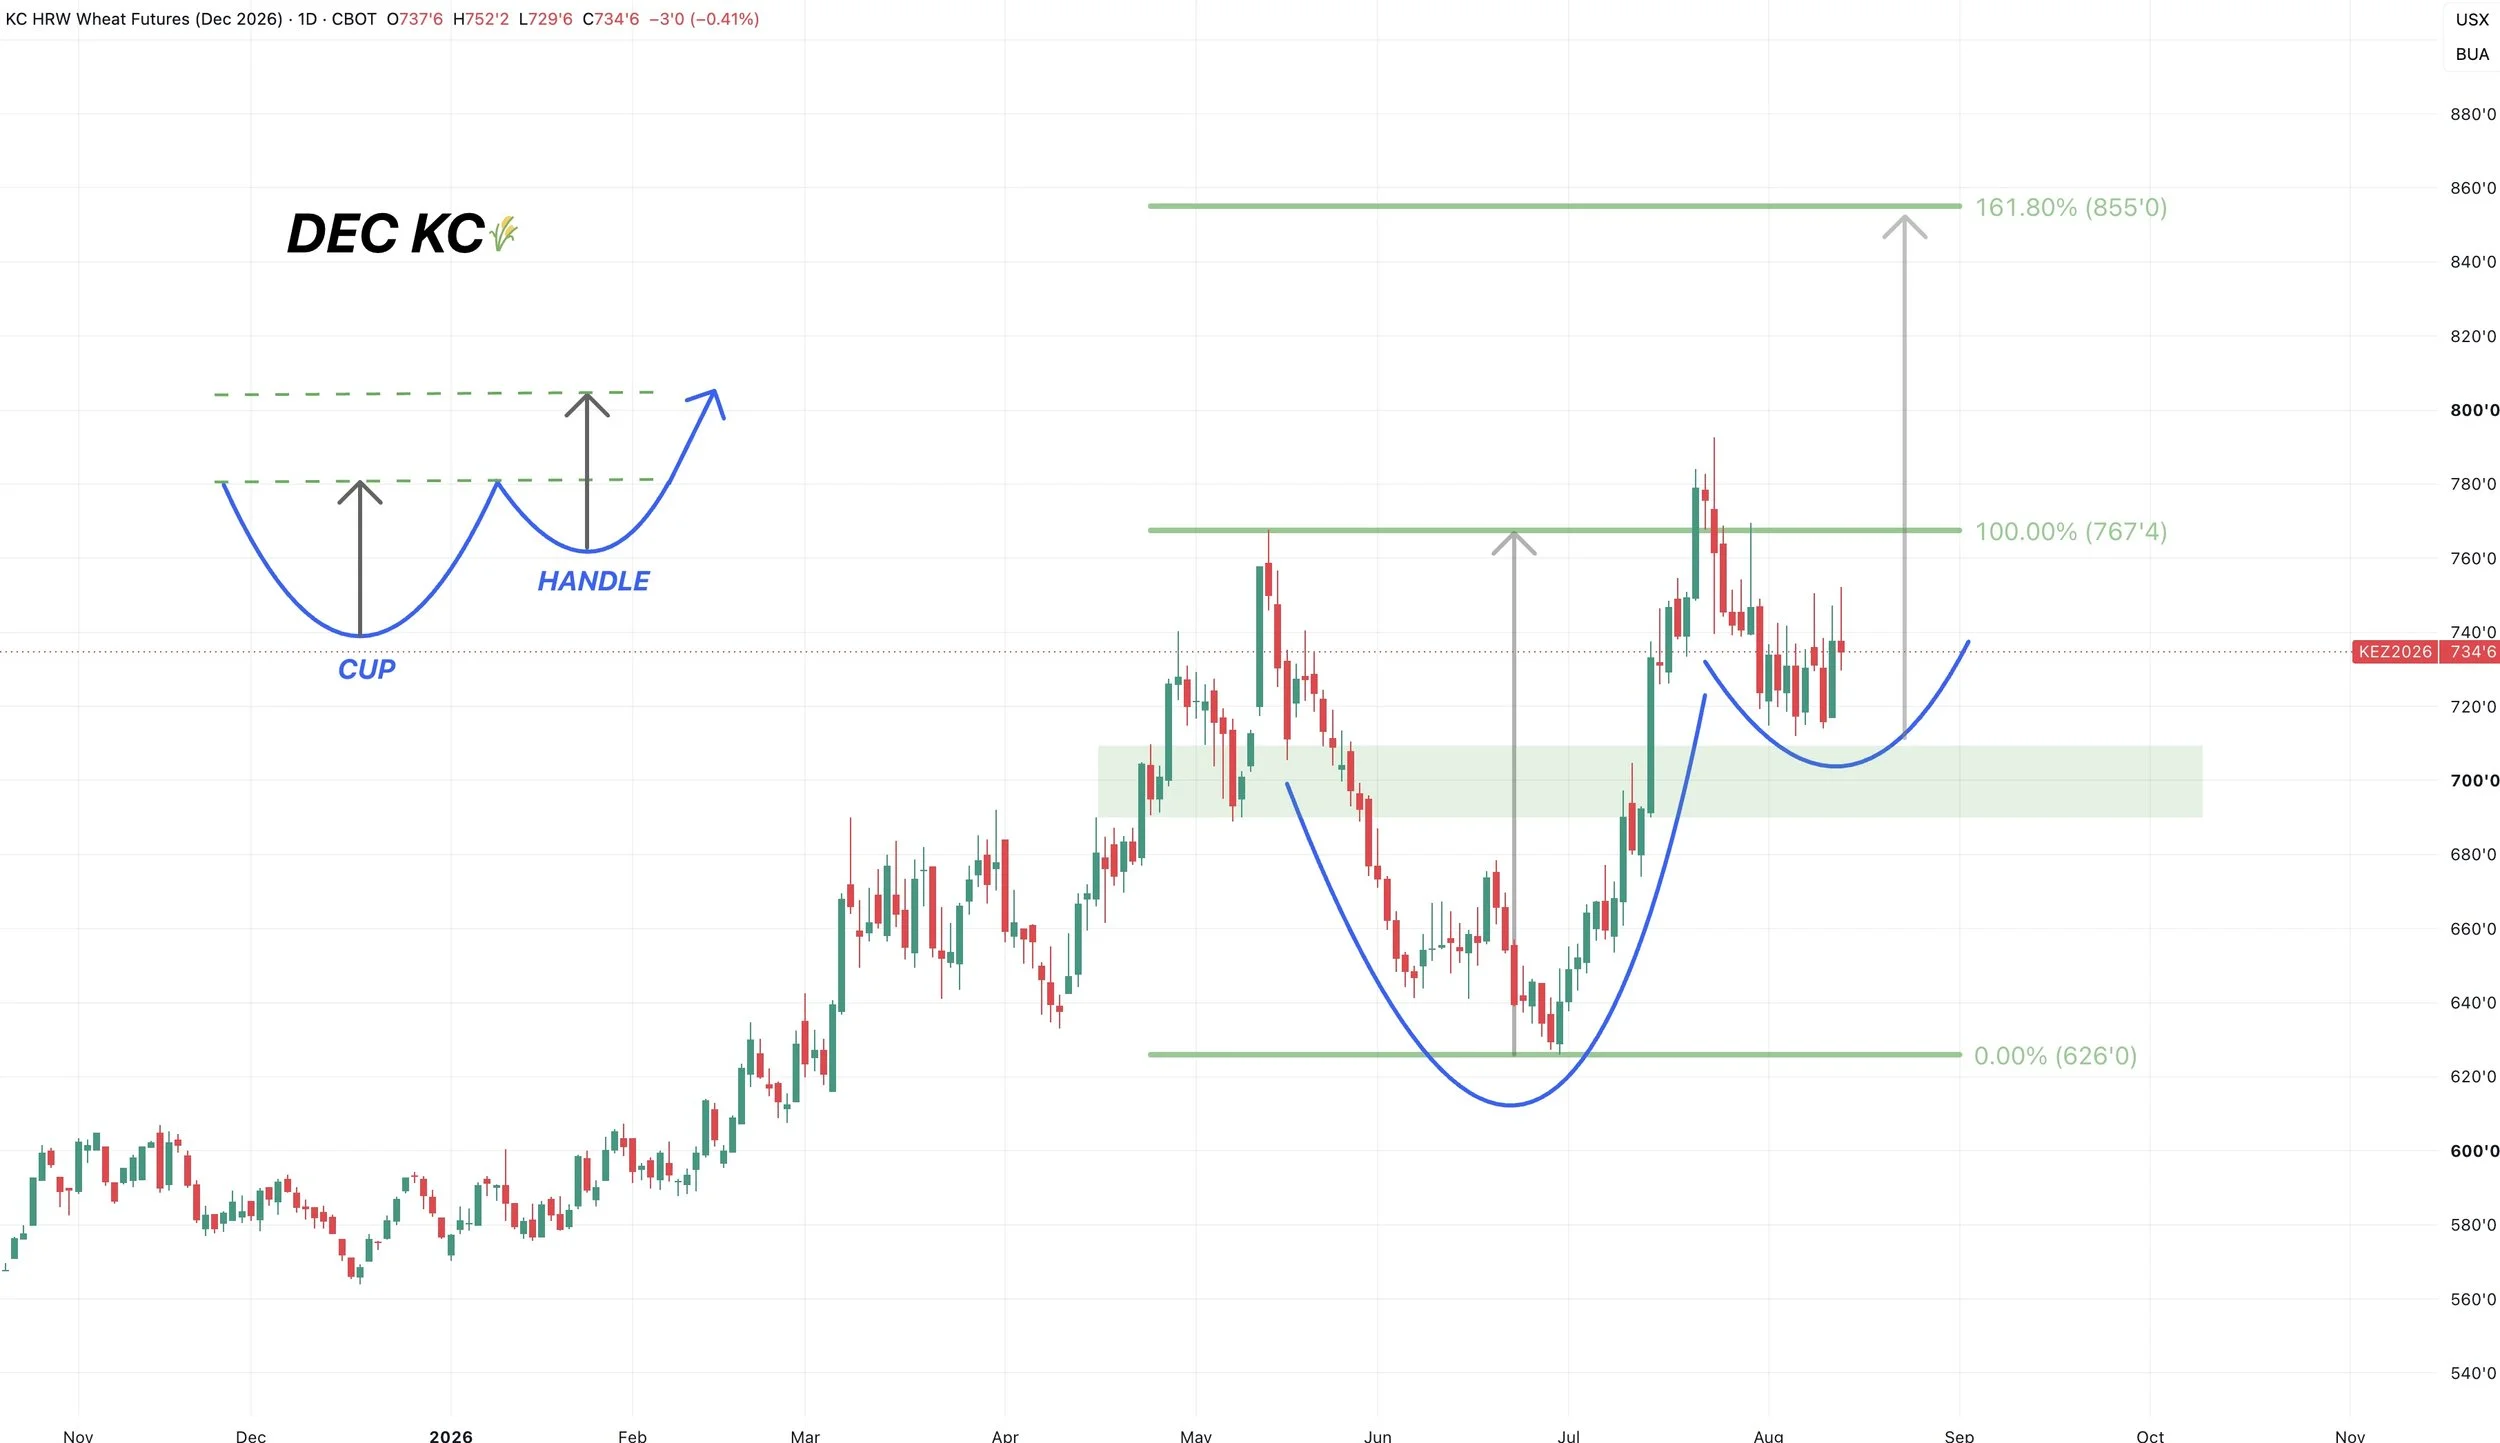
Dec KC Wheat Chart:
Nothing has changed.
We are simply chopping around at the bottom of this range and area of high volume.
The structure remains higher as long as we hold the 61.8% level at $6.90
If we break below that key support, I'd start to get concerned. But for now, this is viewed as a healthy pullback and consolidation unless that happens.
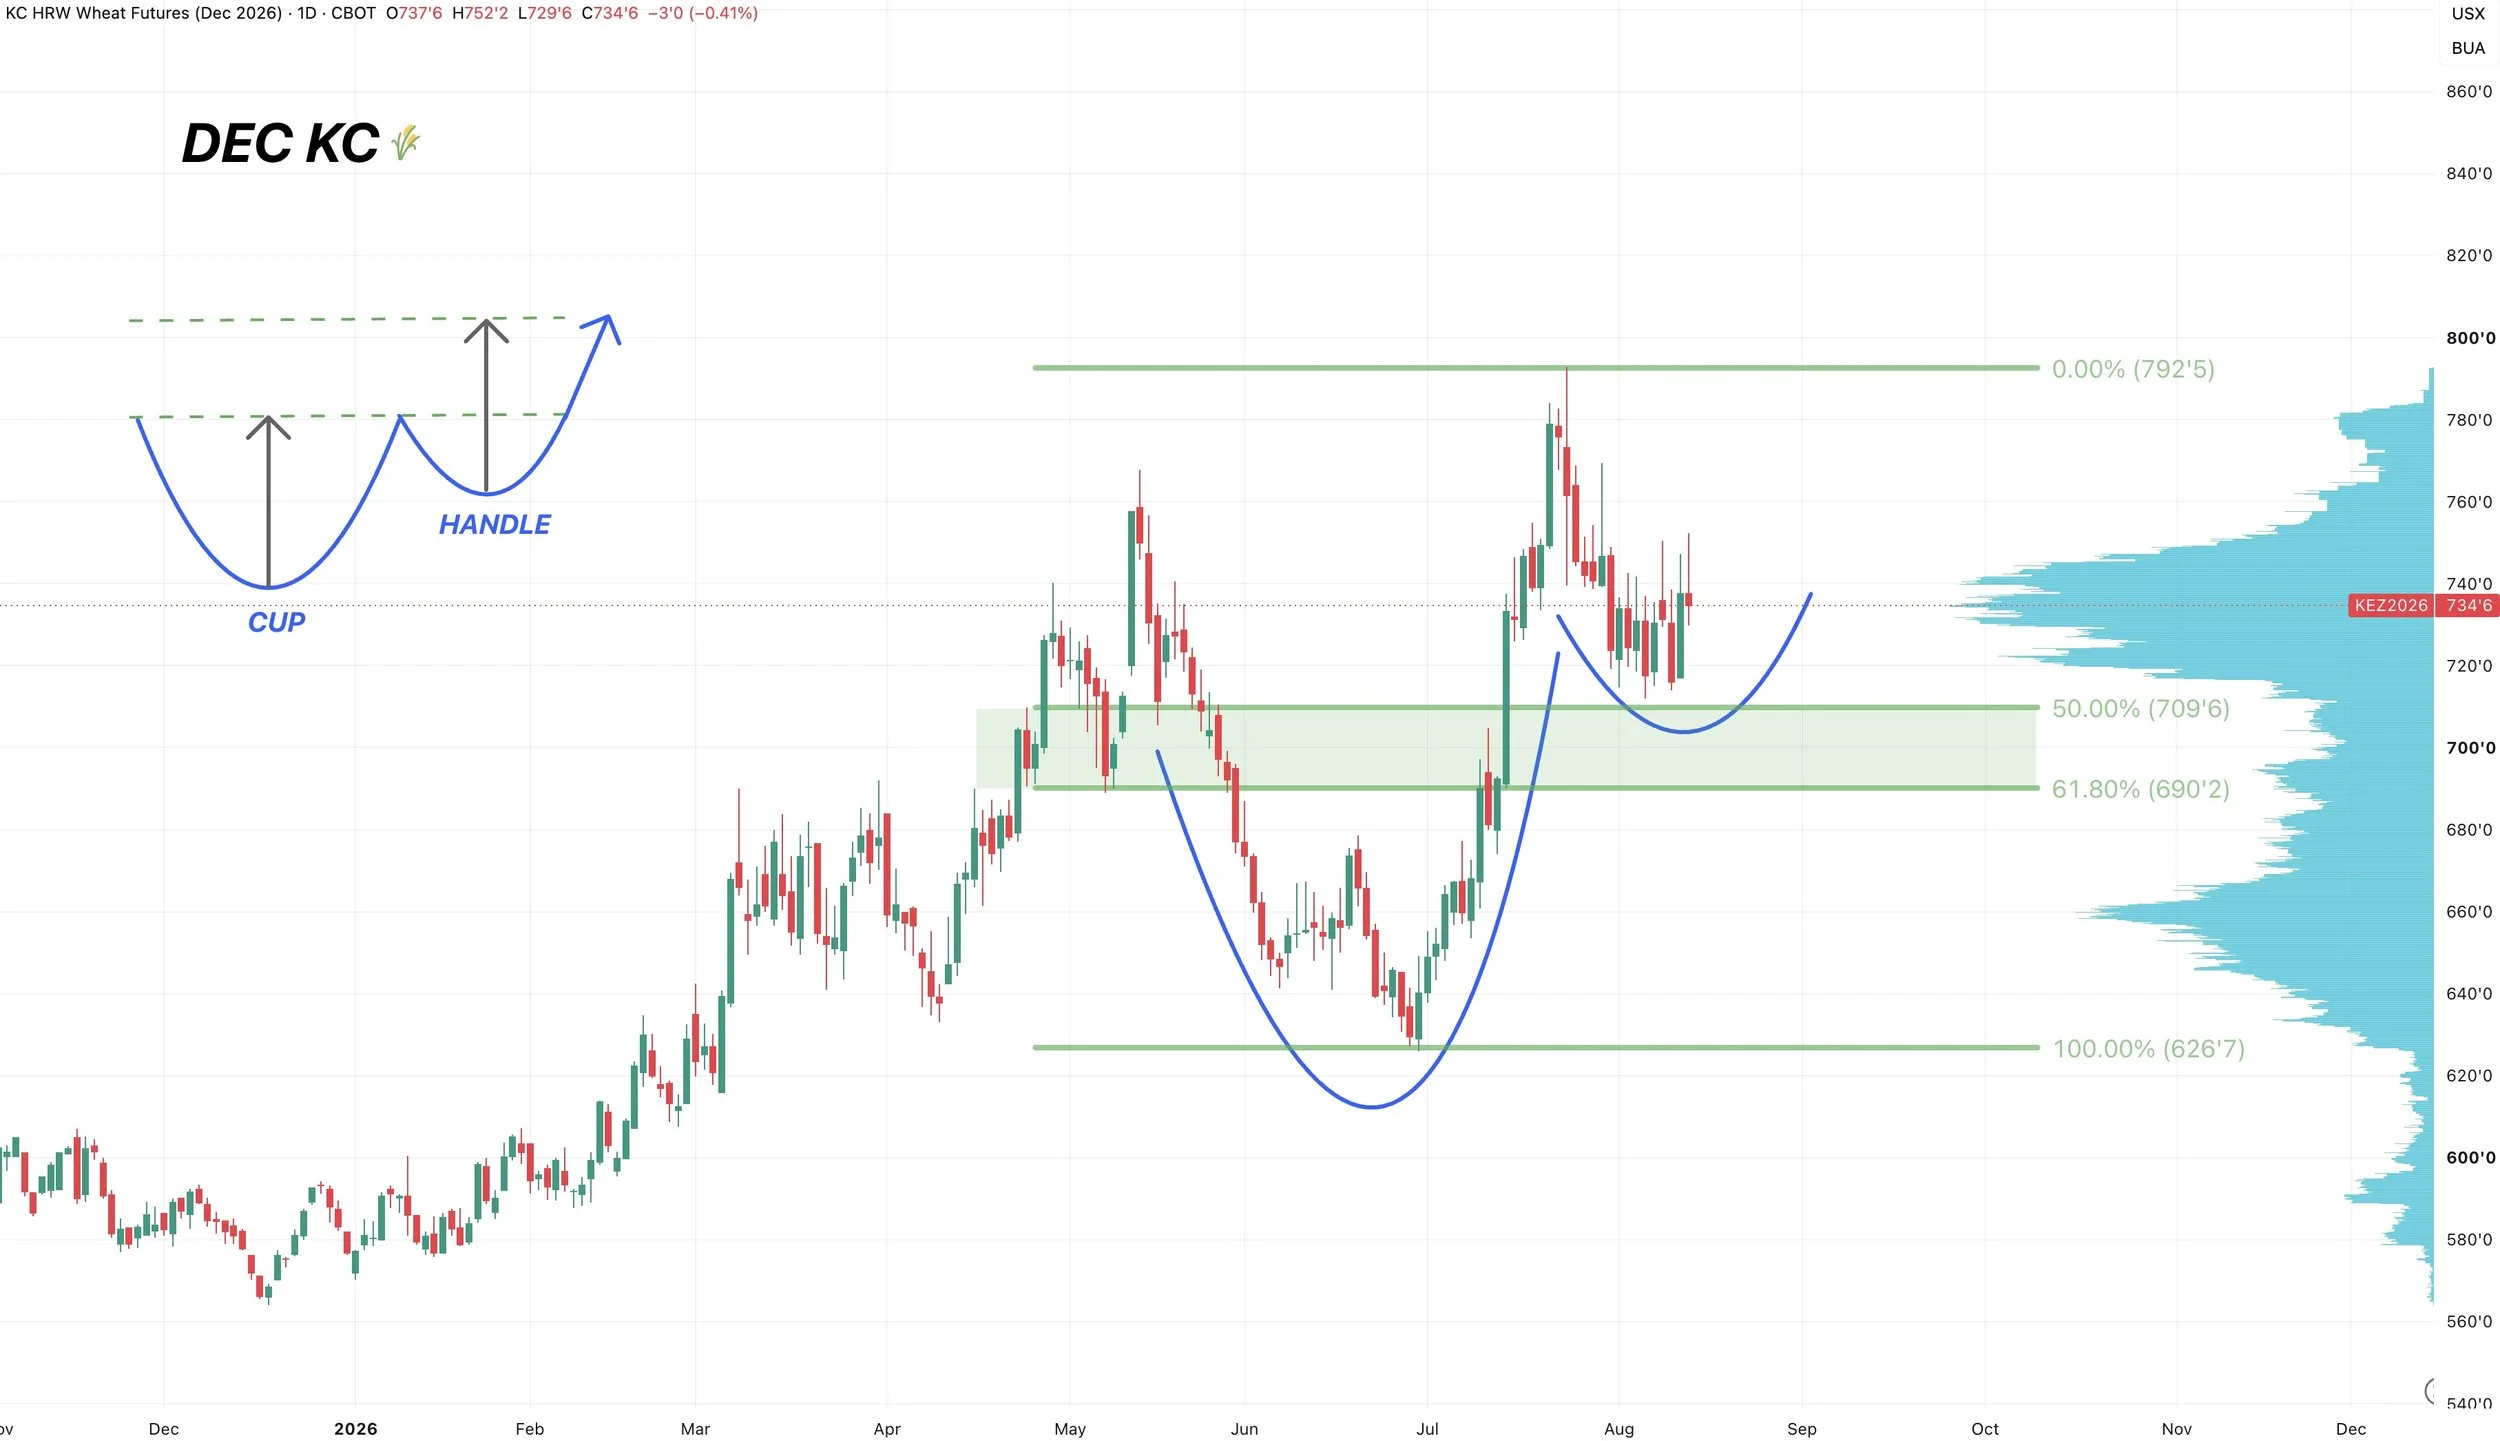
We could be possibly setting up for a cup and handle pattern.
Which would be viewed as a bullish set up if it plays out.
The implied move for this pattern takes you up towards that $8.40 to $8.50 range.
Which is also the golden fib from the May sell off.
Meaning it equals 161.8% of the June lows up to the May highs.
So that would be a possible long term target. $8.40 to $8.50
Of course this target does not have to hit. This one seems pretty far away right now.
Targets are simply out there to let you know it's a good area to de-risk if they do.
Targets are also subject to change as the charts play out.
Before we even think about upside targets, we need to hold this support first.
Cattle
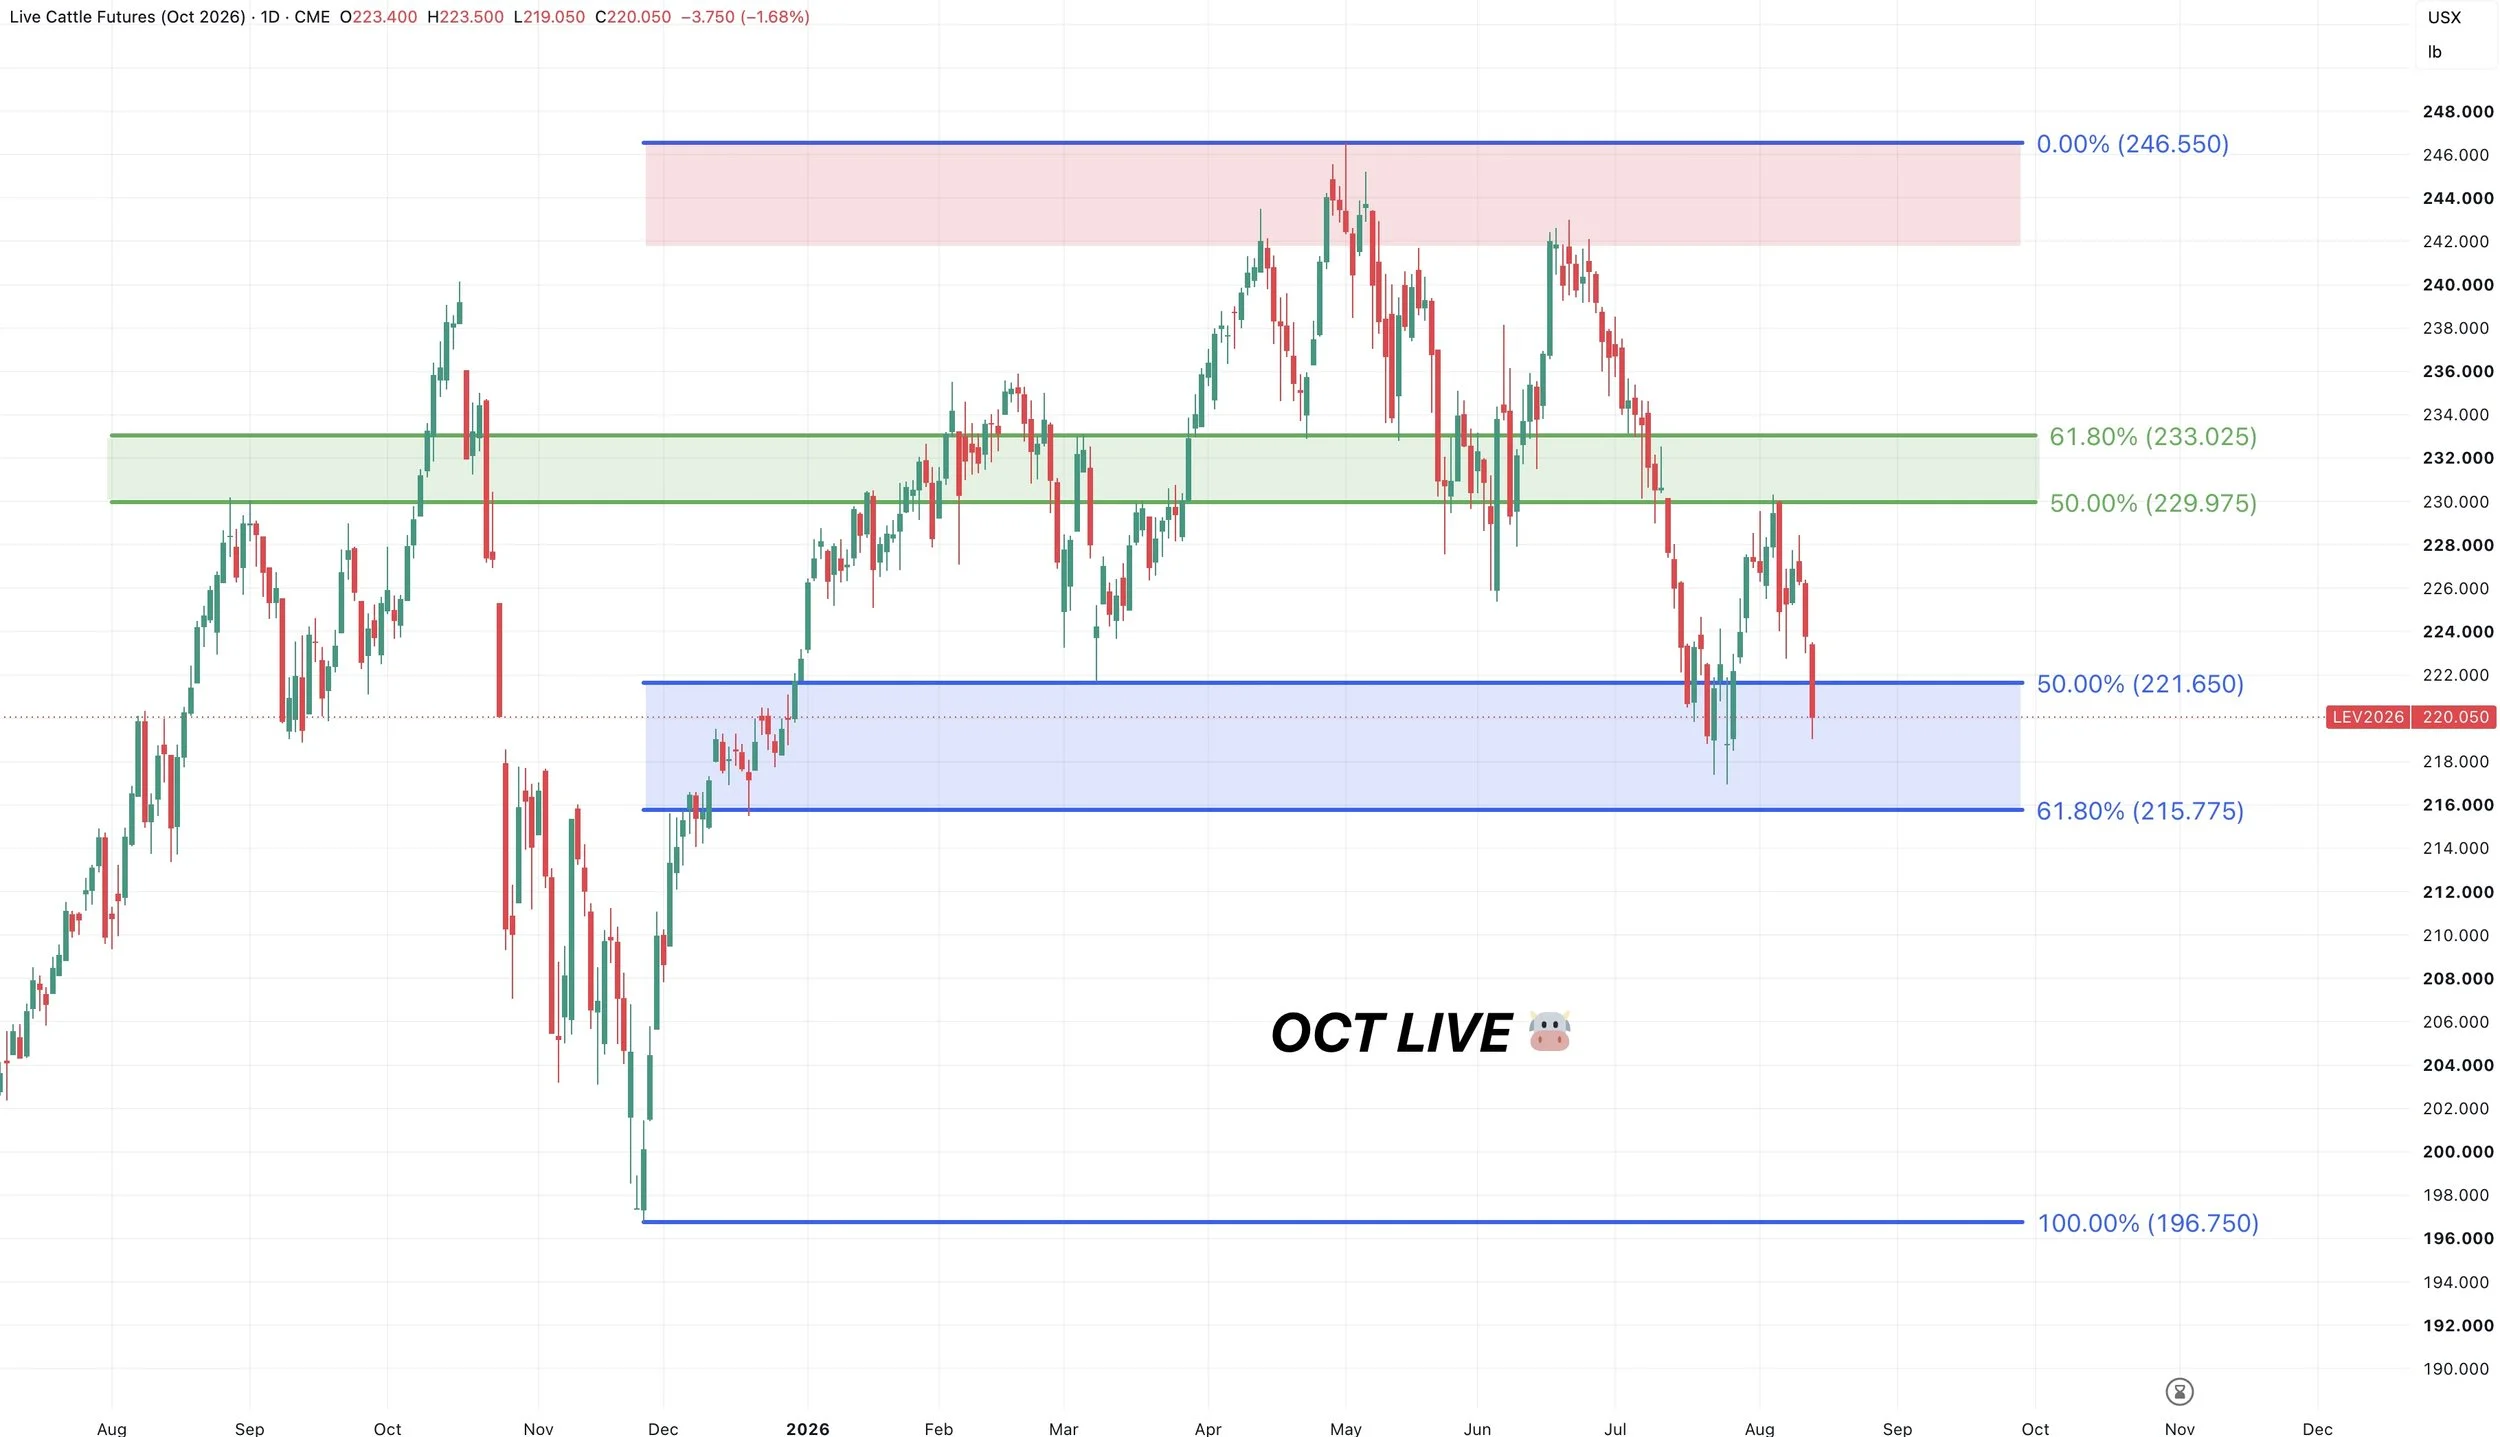
Oct Live Chart:
Not great price action in cattle.
There was news about a Tyson Foods in Illinois closing which added pressure.
Something to note is that the last plant closure did mark a bottom in cattle. So I guess we will have to see how the market reacts to the headline tomorrow.
We failed after clawing back 50% of the sell off.
If we fail to hold those recent lows, it does open the door potentially a lot lower.
As if we break below the 61.8% level down to the lows from late last year, it would not be a good sign.
The overall trend in cattle is lower unless we break above the green box. So I still have the mindset of protecting any sort of rally.
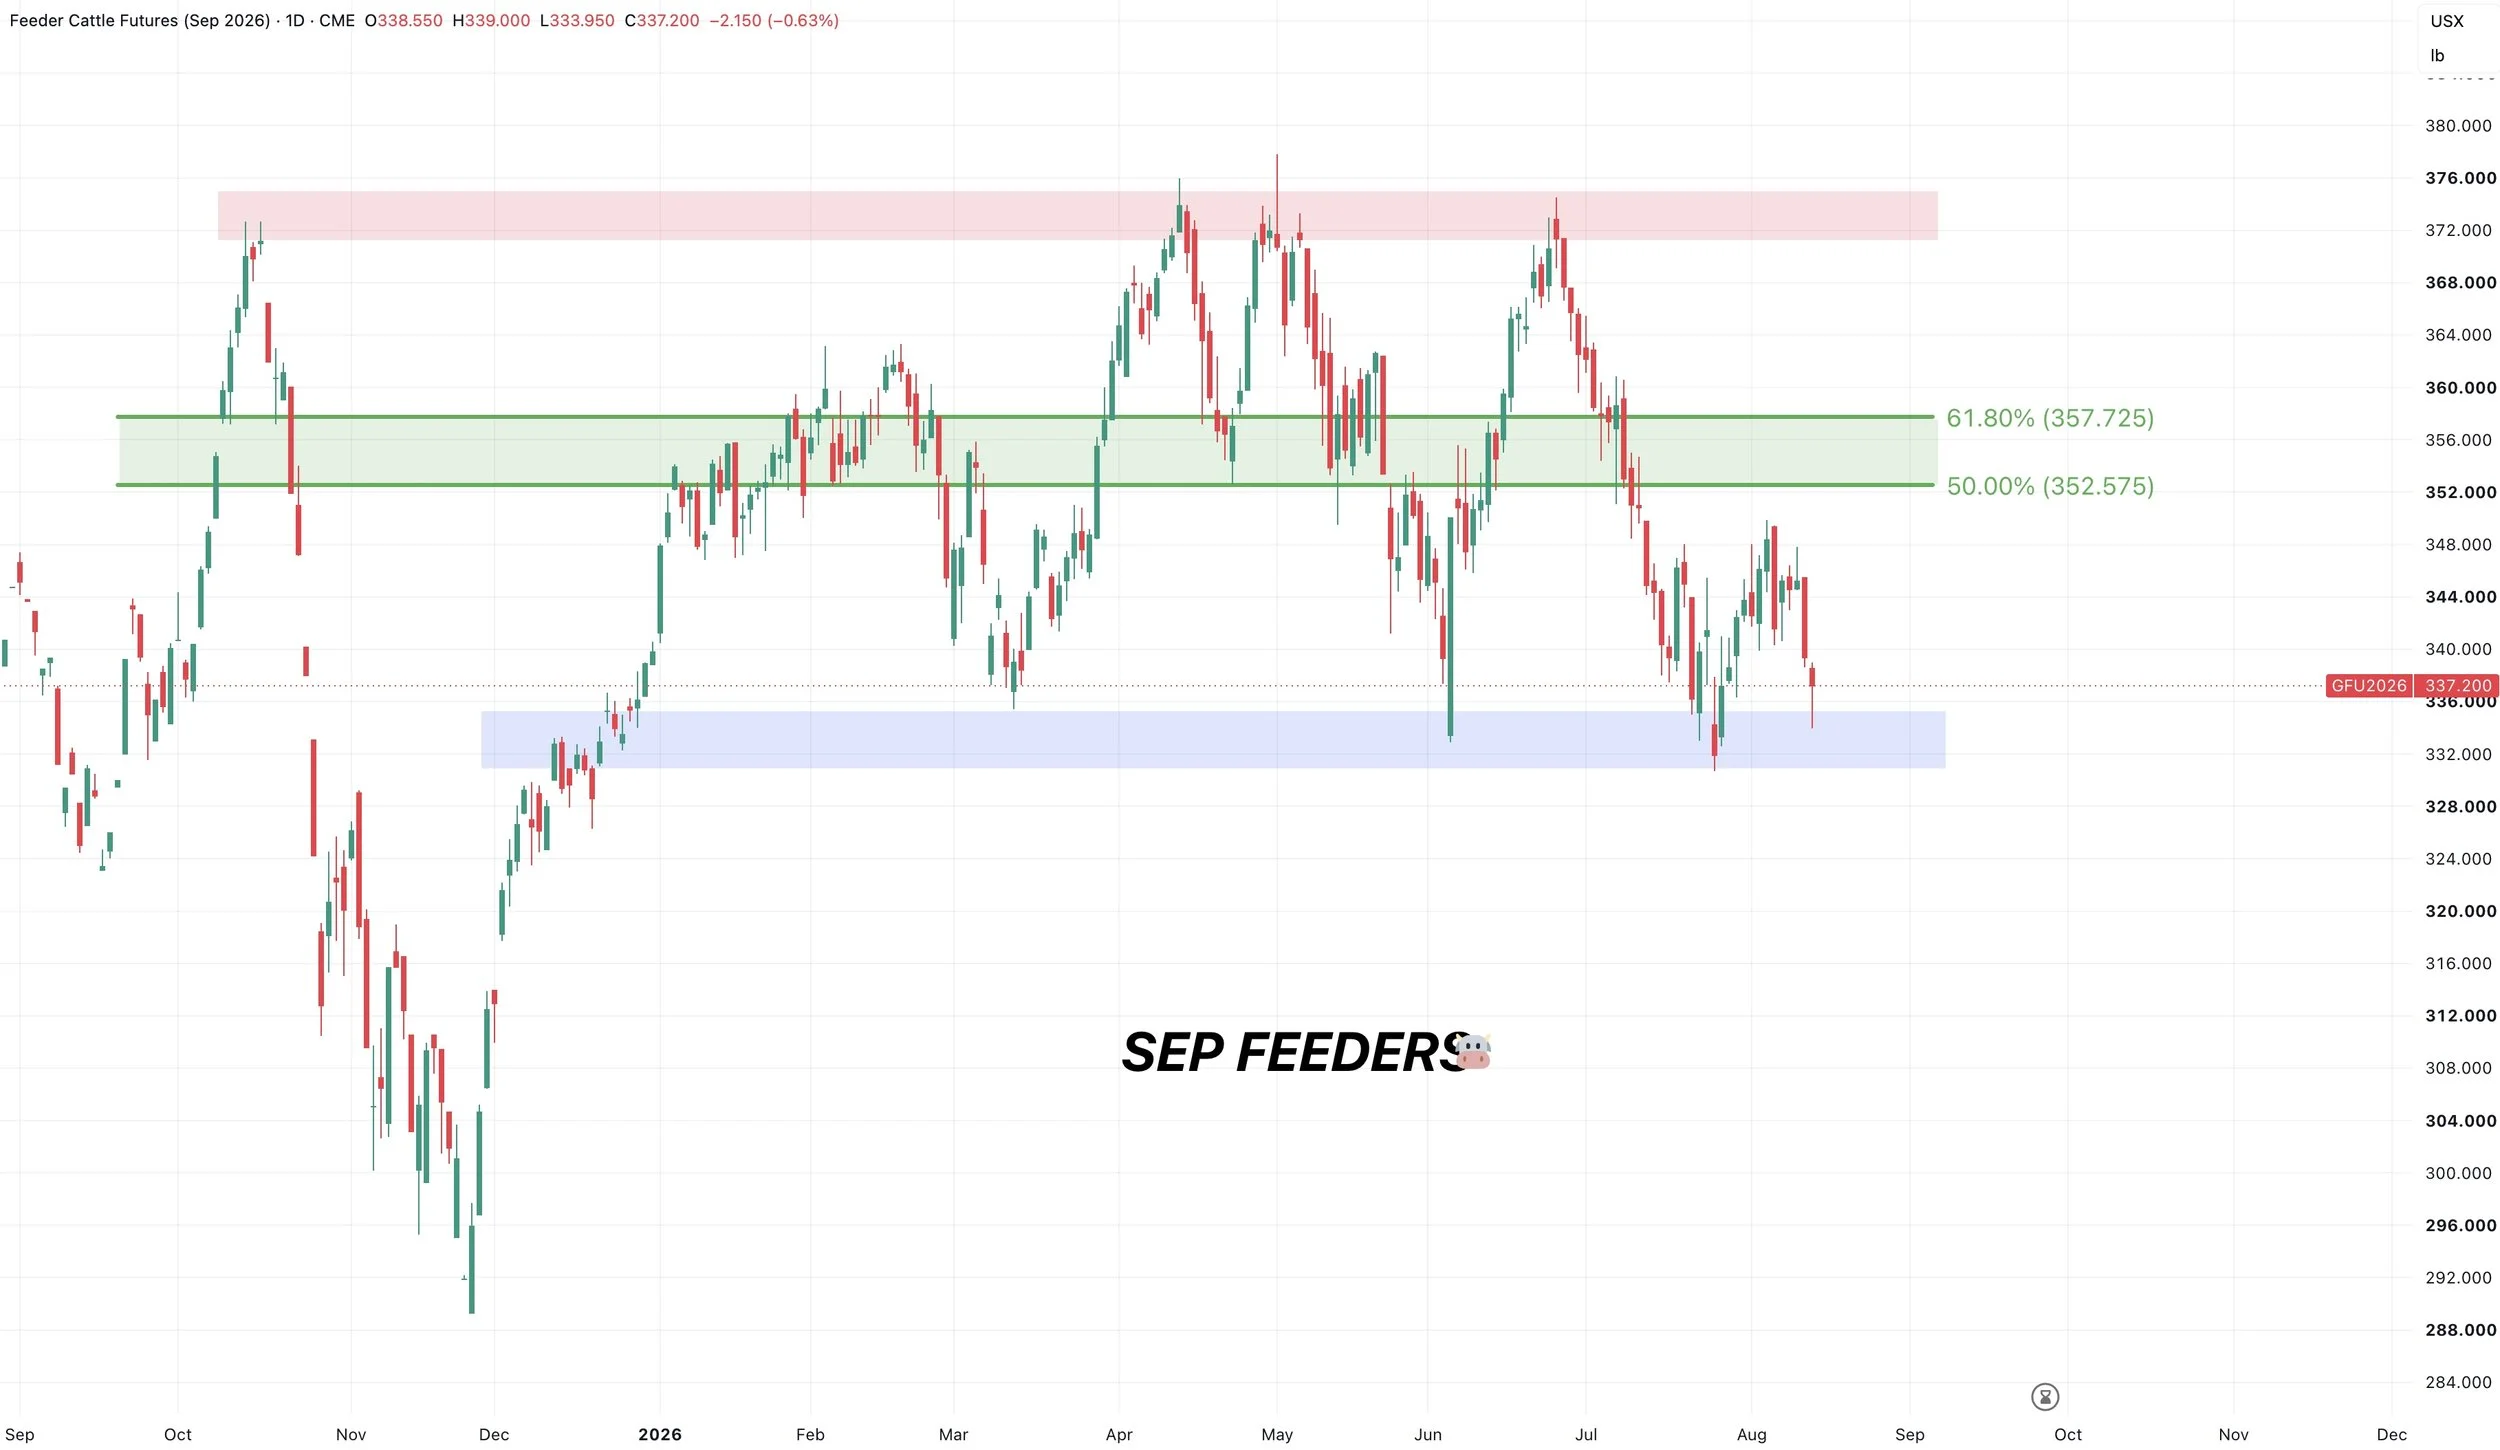
Sep Feeders Chart:
We had a nice candle today, closing well off the lows.
Biggest thing to watch is those recent July lows.
If we break below that, it could open the flood gates lower.
As this is clear key support bulls want to hold. Meaning if it breaks, there is a lot of air to the downside.
Want to Talk?
Our phones are open 24/7 for you guys if you ever need anything or want to discuss your operation.
Jeremey & Office: (806)484-1214
Sebastian: (605)280-1186
Email: sfrost@dailymarketminute.com
Hedge Account
Interested in a hedge account? Use the link below to set up an account or give us a call.