
CORN CLOSE TO BOTTOM? BEANS BREAKING OUT?
MARKET UPDATE
You can scroll to read the usual update as well. As the written version is the exact same as the video.
Timestamps for video:
Corn Strategies: 0:20min
Corn Charts: 2:40min
Beans: 5:45min
Wheat: 8:30min
Cattle: 9:15min
Want to talk?
Office: (806)484-1214
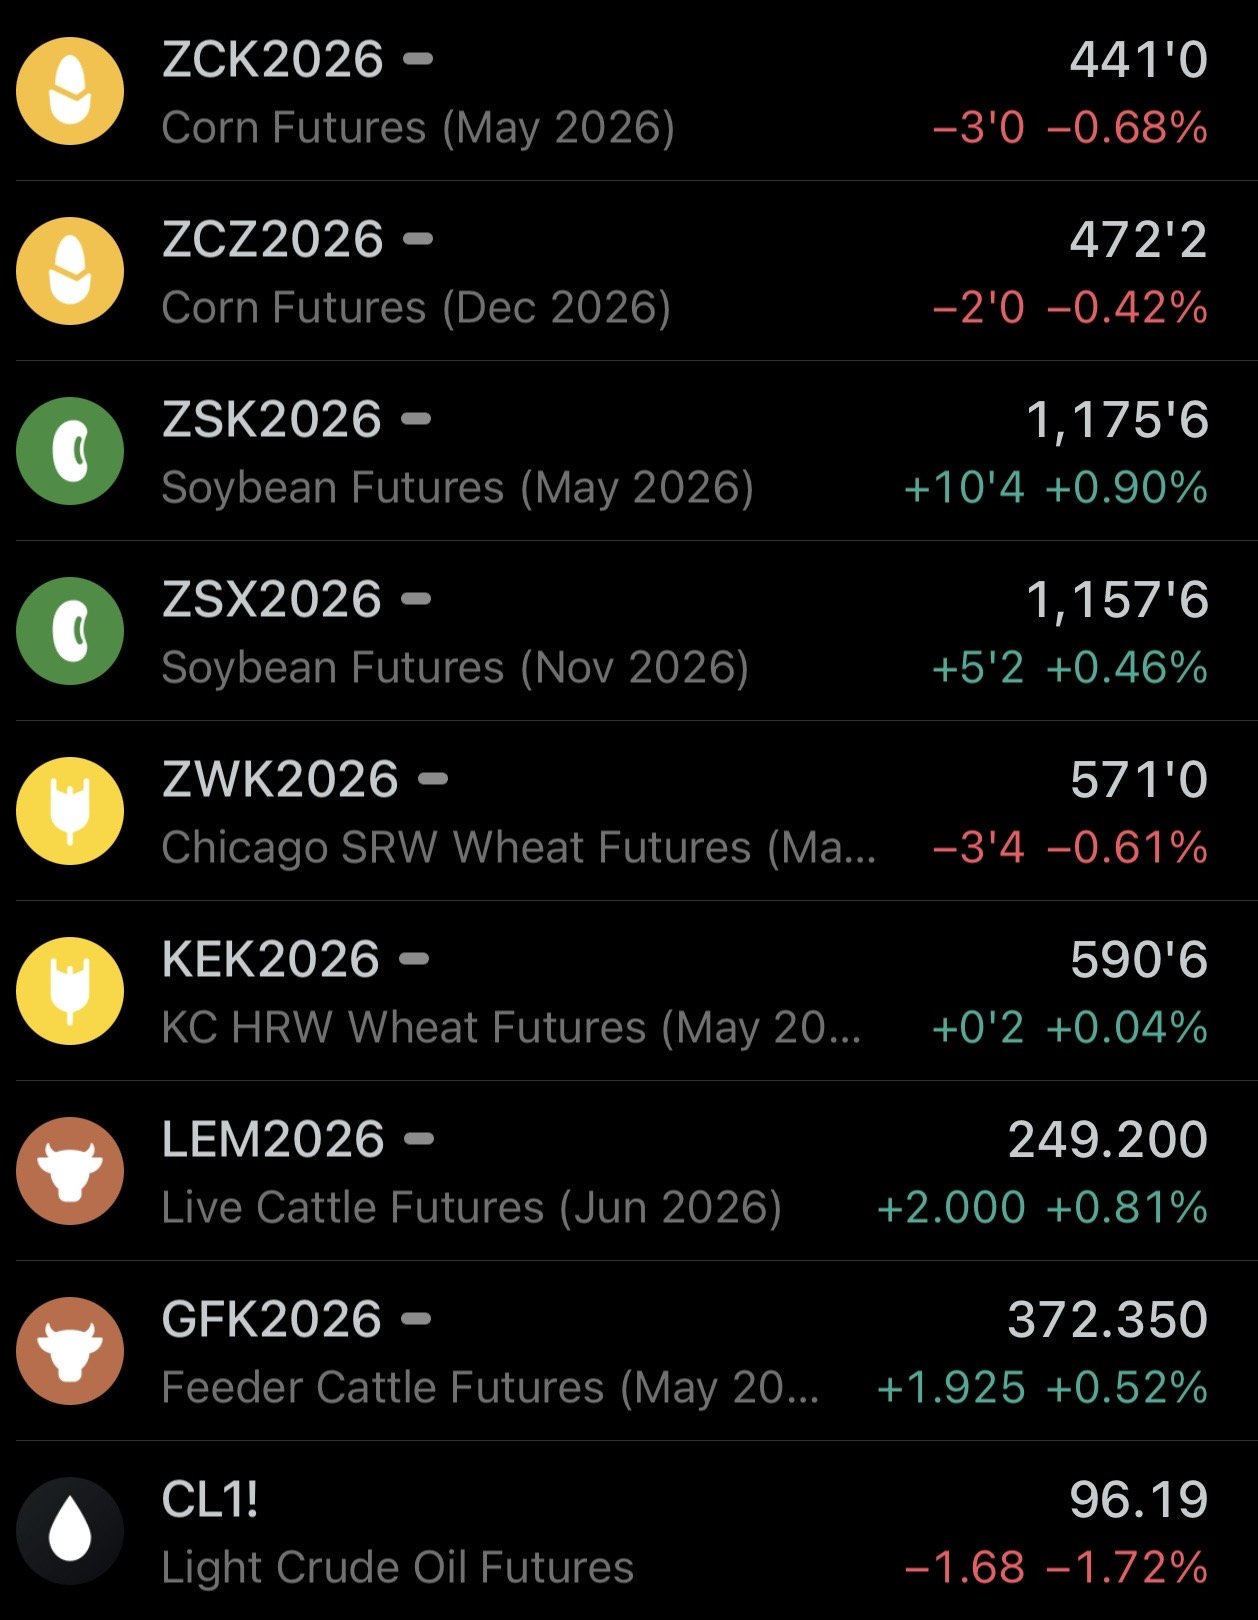
Futures Prices Close
Overview
Today's update is going to be fairly brief compared to usual.
Mostly going to be running through the charts as we went over some fundamentals yesterday and I'm seeing some important things on the charts.
So let's dive right in.
Today's Main Takeaways
Corn
Today we did issue a buy signal for corn.
I'll get into the details and reasoning behind the alert, as well as some upside objectives, but first I wanted to go over some strategies you could consider.
Texas Hedge put these together for you guys.
Strategies:
We prefer to own Dec corn. That is where the funds are buying. Because if crude stays high and we see higher inflation, the story is in new crop.
Strategy 1: Futures
You could consider buying futures with a stop below $4.60 for 10-12 cents of risk. The 200-day MA sits at $4.62.
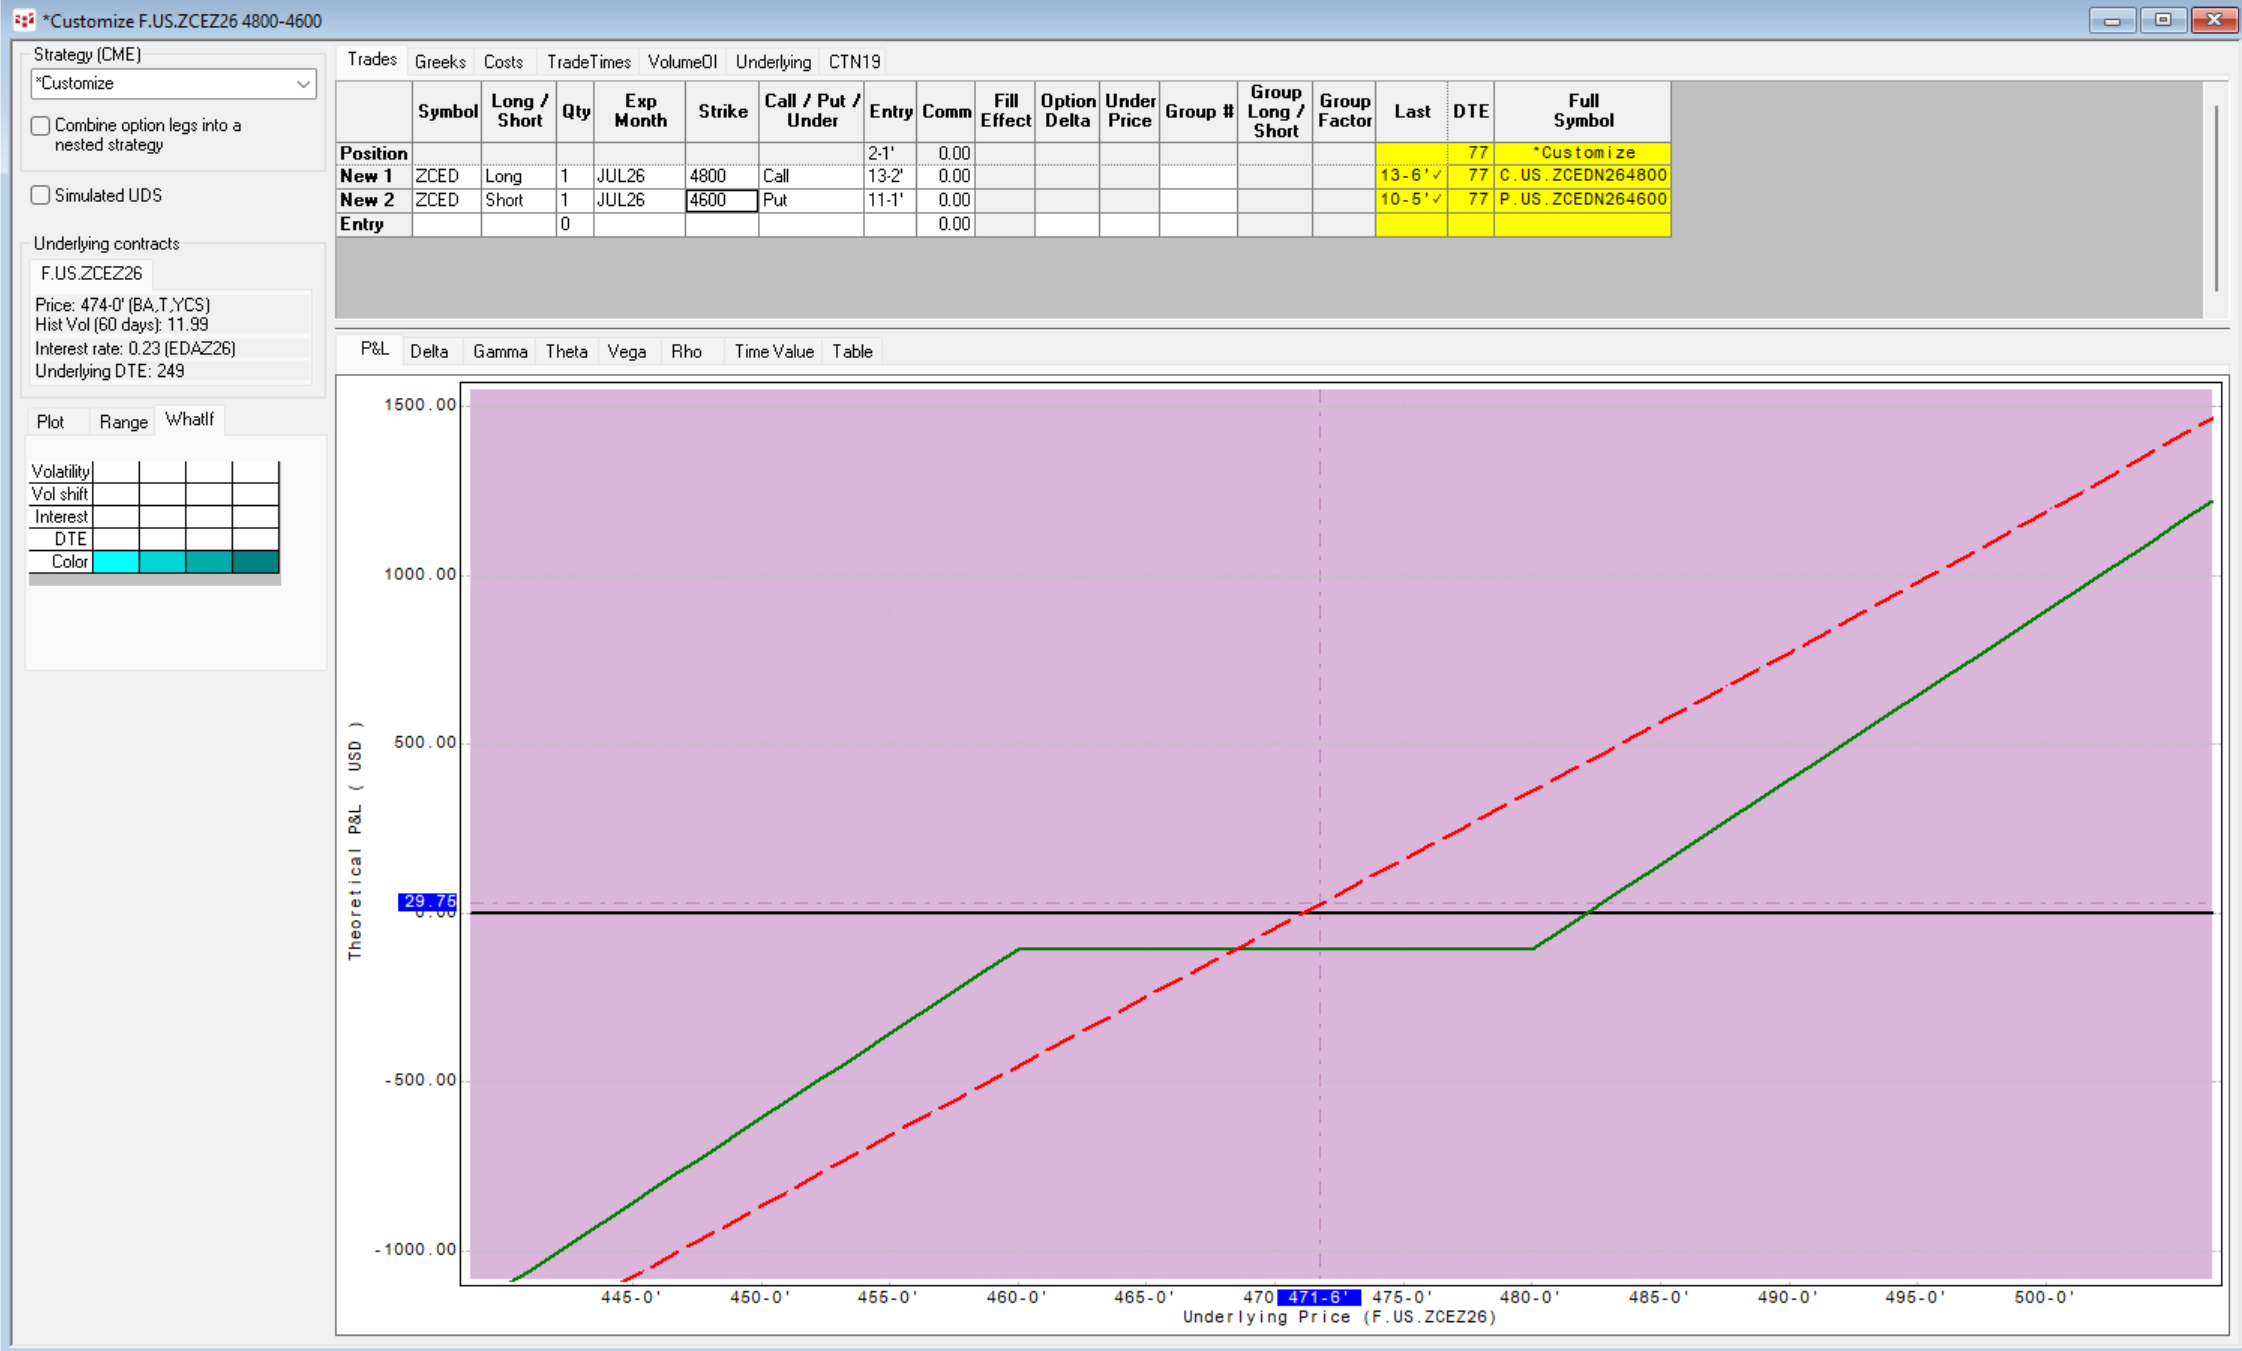
Strategy 2: Synthetic Long
December short dated vs July (expires June 26)
Buy a $4.80 call
Sell a $4.60 put
Net cost is around 2 cents.
Below $4.60 you are essentially long futures via the short put.
If we rally above $4.85, you would then manage your risk by rolling up the long call, buying back the short put, and or selling a higher call against the long call ($5.20).
If we stay between $4.60 and $4.80 you lose the 2 cents.
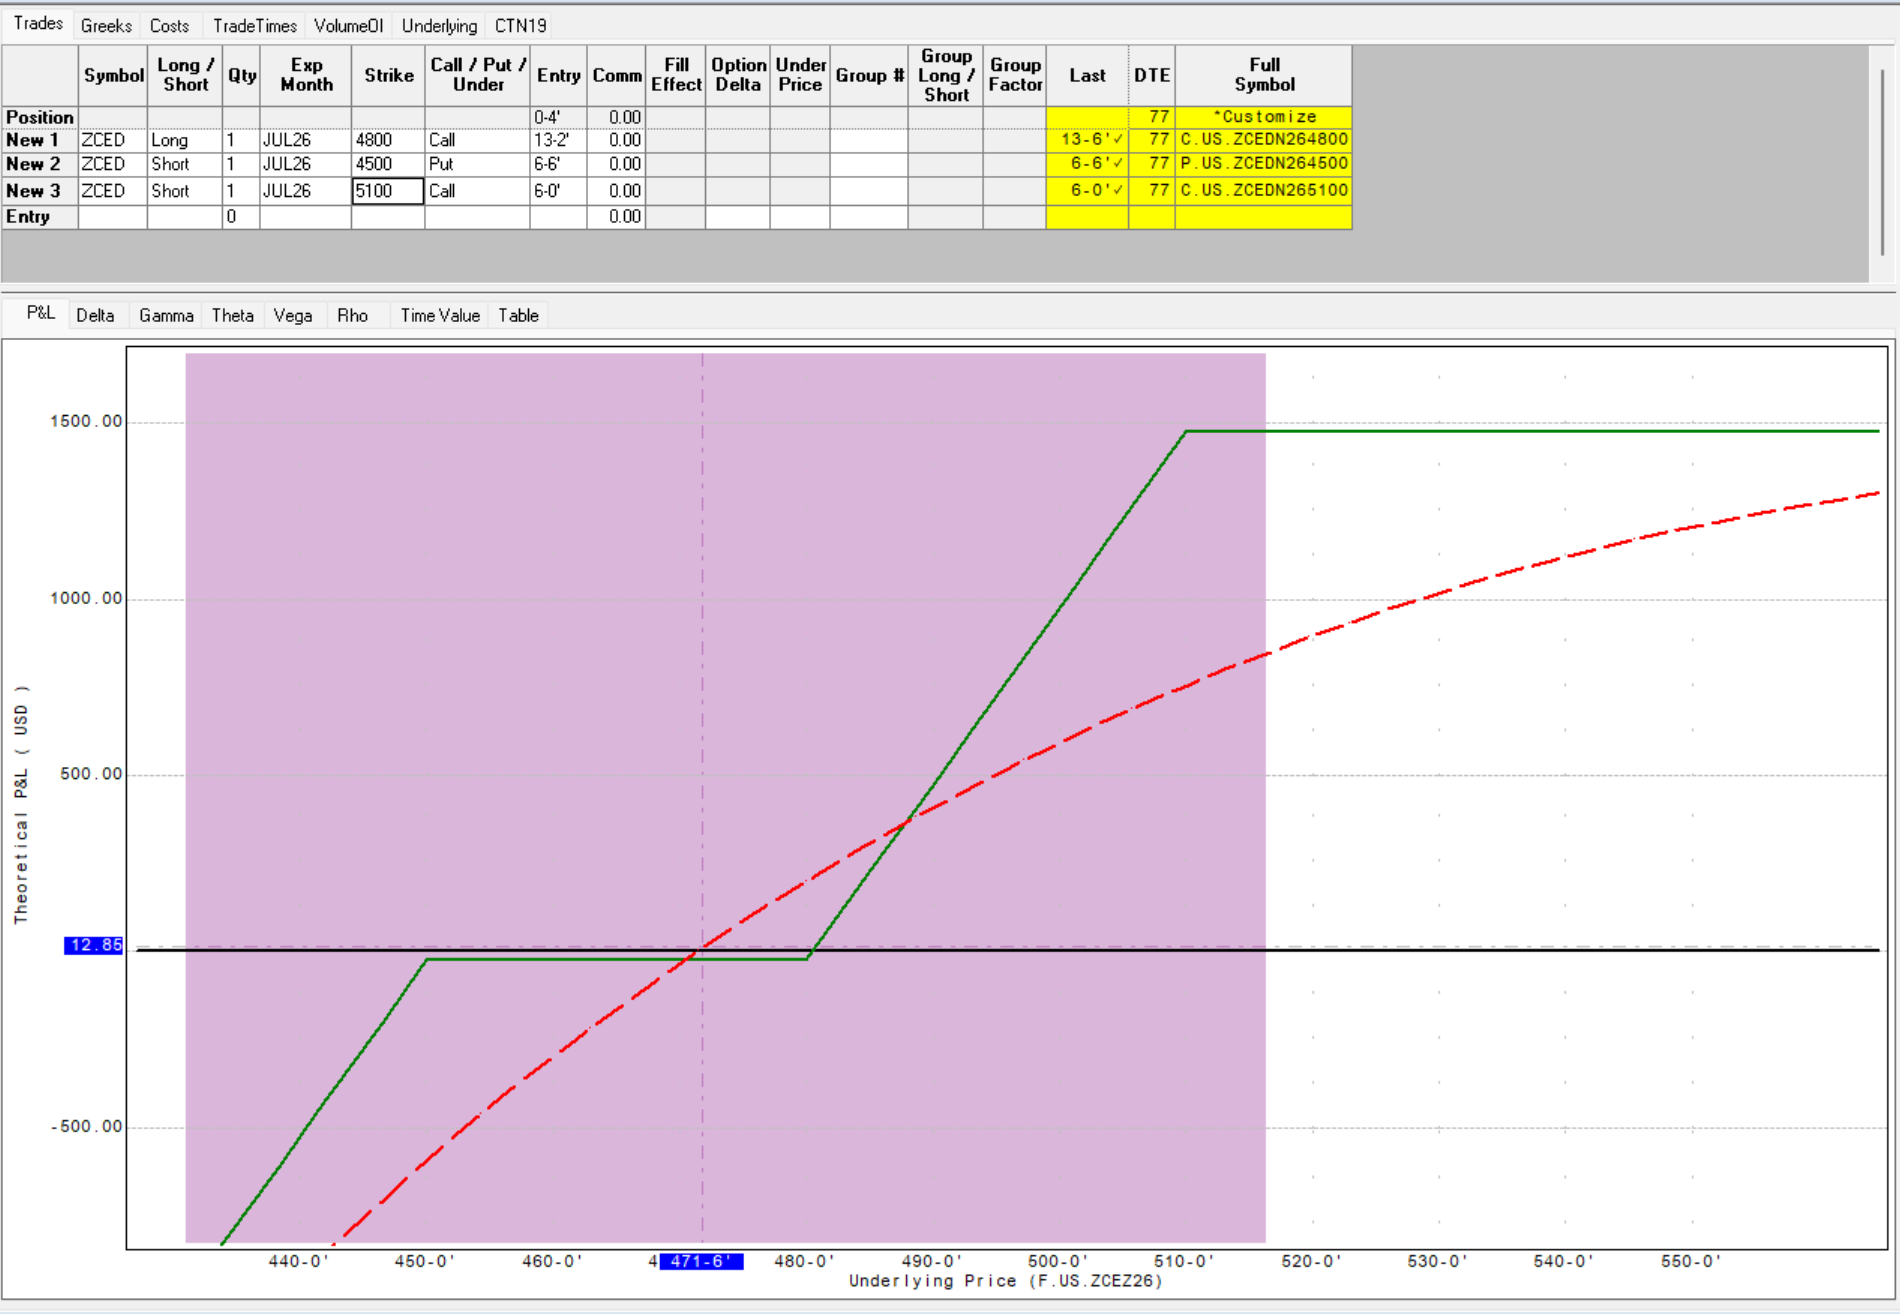
Strategy 3:
Buy July short dated $4.80 call (expires June 26th)
Sell $5.10 call
Sell $4.50 put
Cost is about 1/2 a cent.
The main risk is the full downside risk of the short put.
You are participating in 30 cents of upside with your downside strike risk being 20 cents away at the bottom of the range.
So you make and lose nothing besides the 1/2 cent if corn is between $4.50 and $4.80 at expiration.
If corn is between $4.80 and $5.10 you make money, with a max profit of 30 cents.
Below $4.50 at expiration, you lose money.
Some of these trades may or may not be for you. All of them offer different risks.
If you have questions or want to talk to us about them, don’t hesitate to reach out anytime.
Office: (806)484-1214
The Charts
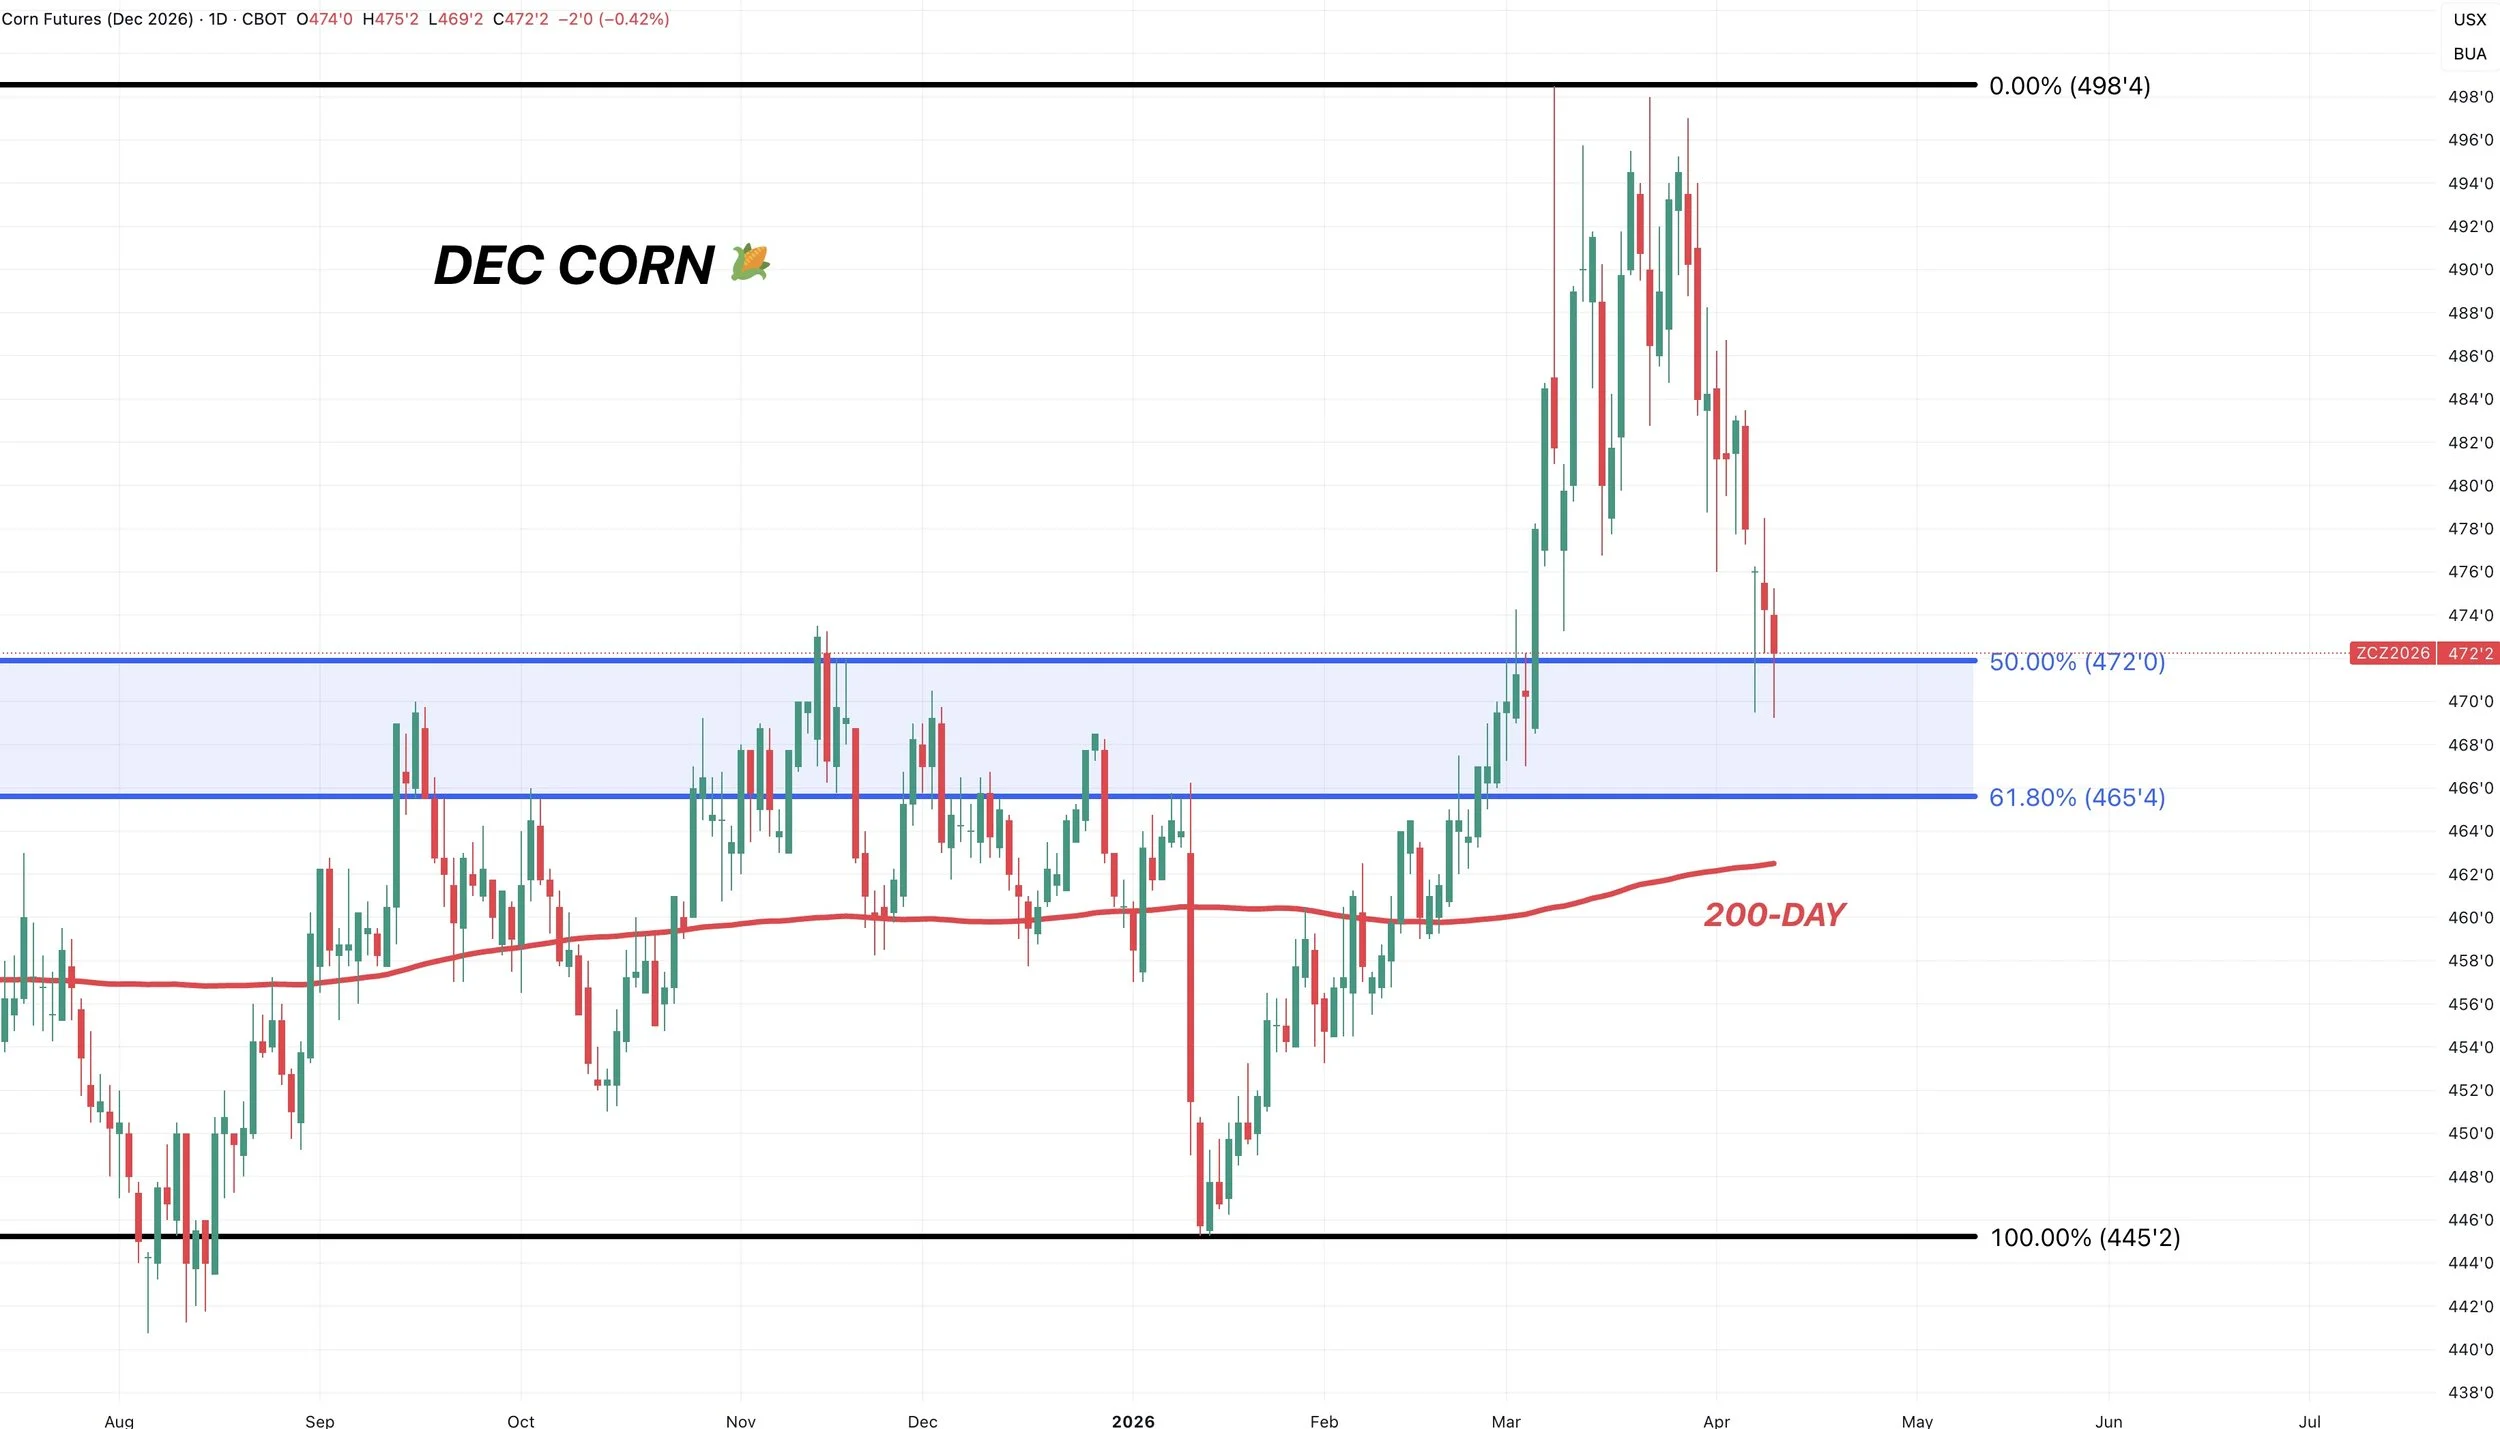
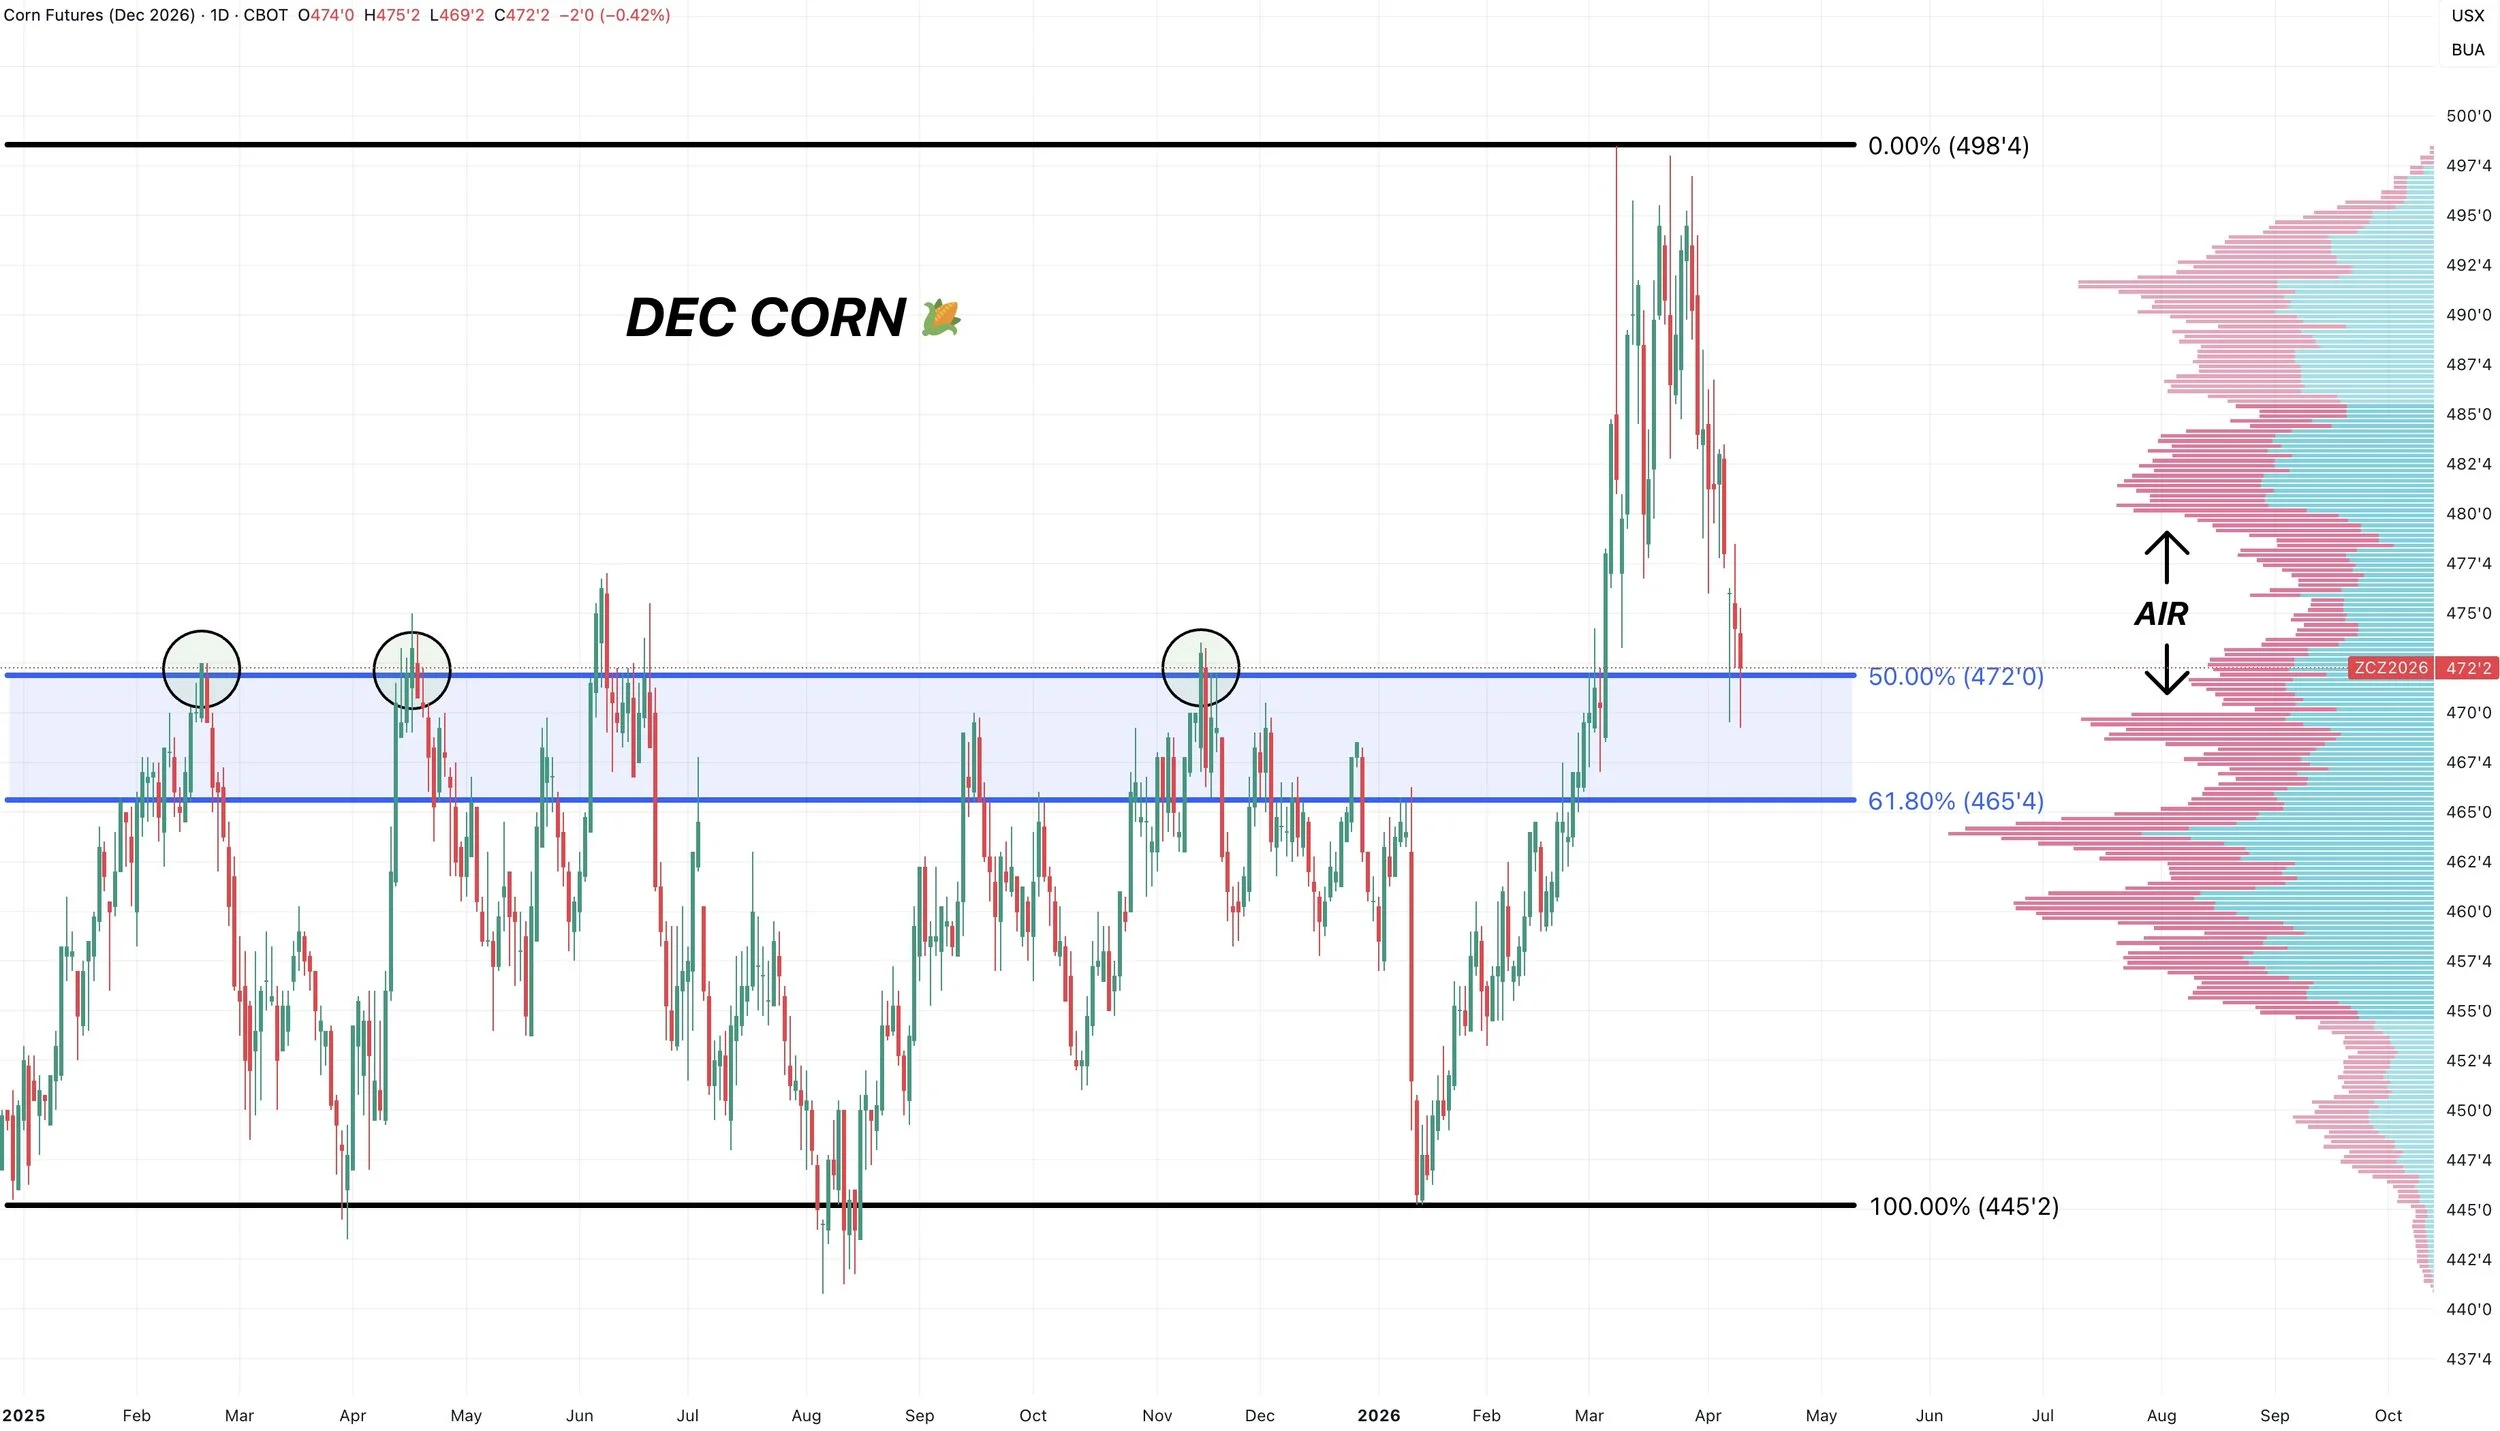
Dec Corn:
We gave back 50% of the entire rally.
This same level happens to be that old key resistance where this market failed to break through on several occasions.
Often one of the simplest things on the charts is just old resistance turning into new support.
I'd like to think we find some support here.
If we do not, the next level of support would be the 61.8% level at $4.65. That is pretty much the line in the sand.
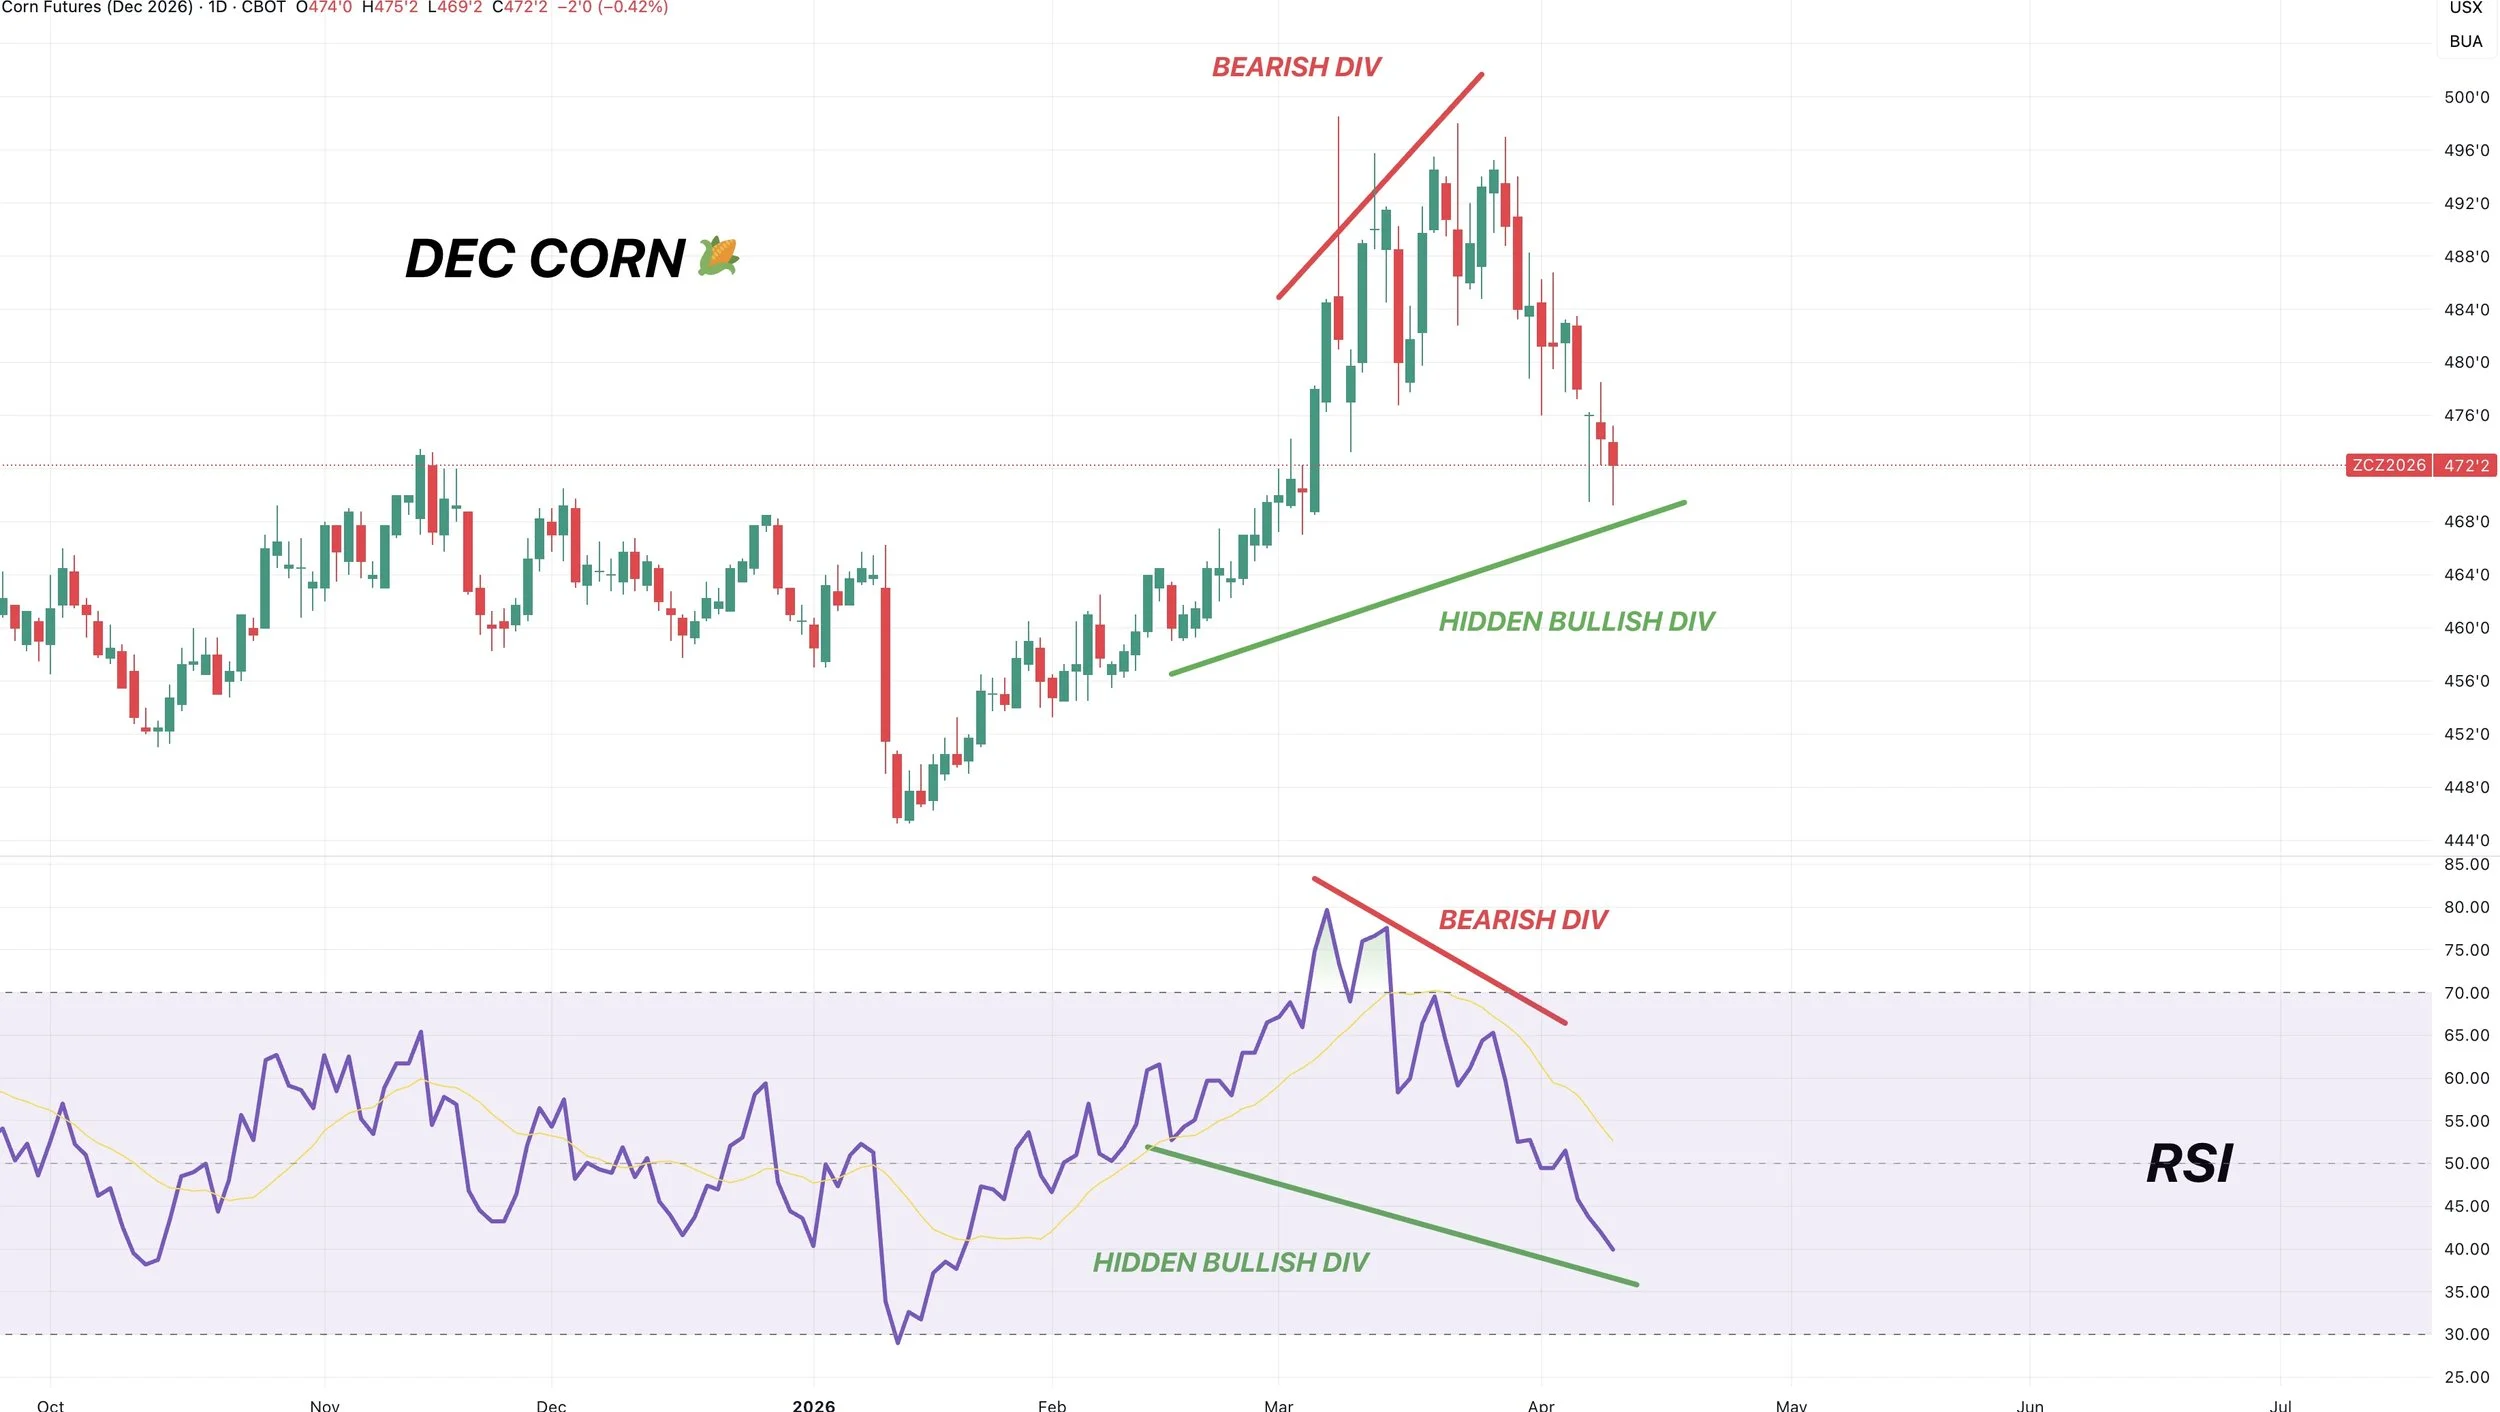
Hidden Bullish Divergence?
The RSI made new fresh lows.
Prices are much higher than they were when the RSI was this low.
It's not an end-all, be-all indicator.
But that bearish divergence we talked about a few weeks ago marked the highs.
1st Target:
If we bounce, we won't know if it's a simple dead cat bounce of the start of something of bigger.
But most relief bounces claw back 50% to 61.8% of the sell off.
Which comes in at $4.84 to $4.87
So that will be the first target in case we get something like this. An ABC correction, where we make a low (what we are doing right now), then get a relief bounce, then make a final leg lower.
That 50% to 61.8% level is usually where we find out if this is just a bounce or not. If you take out that level you will often challenge the highs or post new highs.
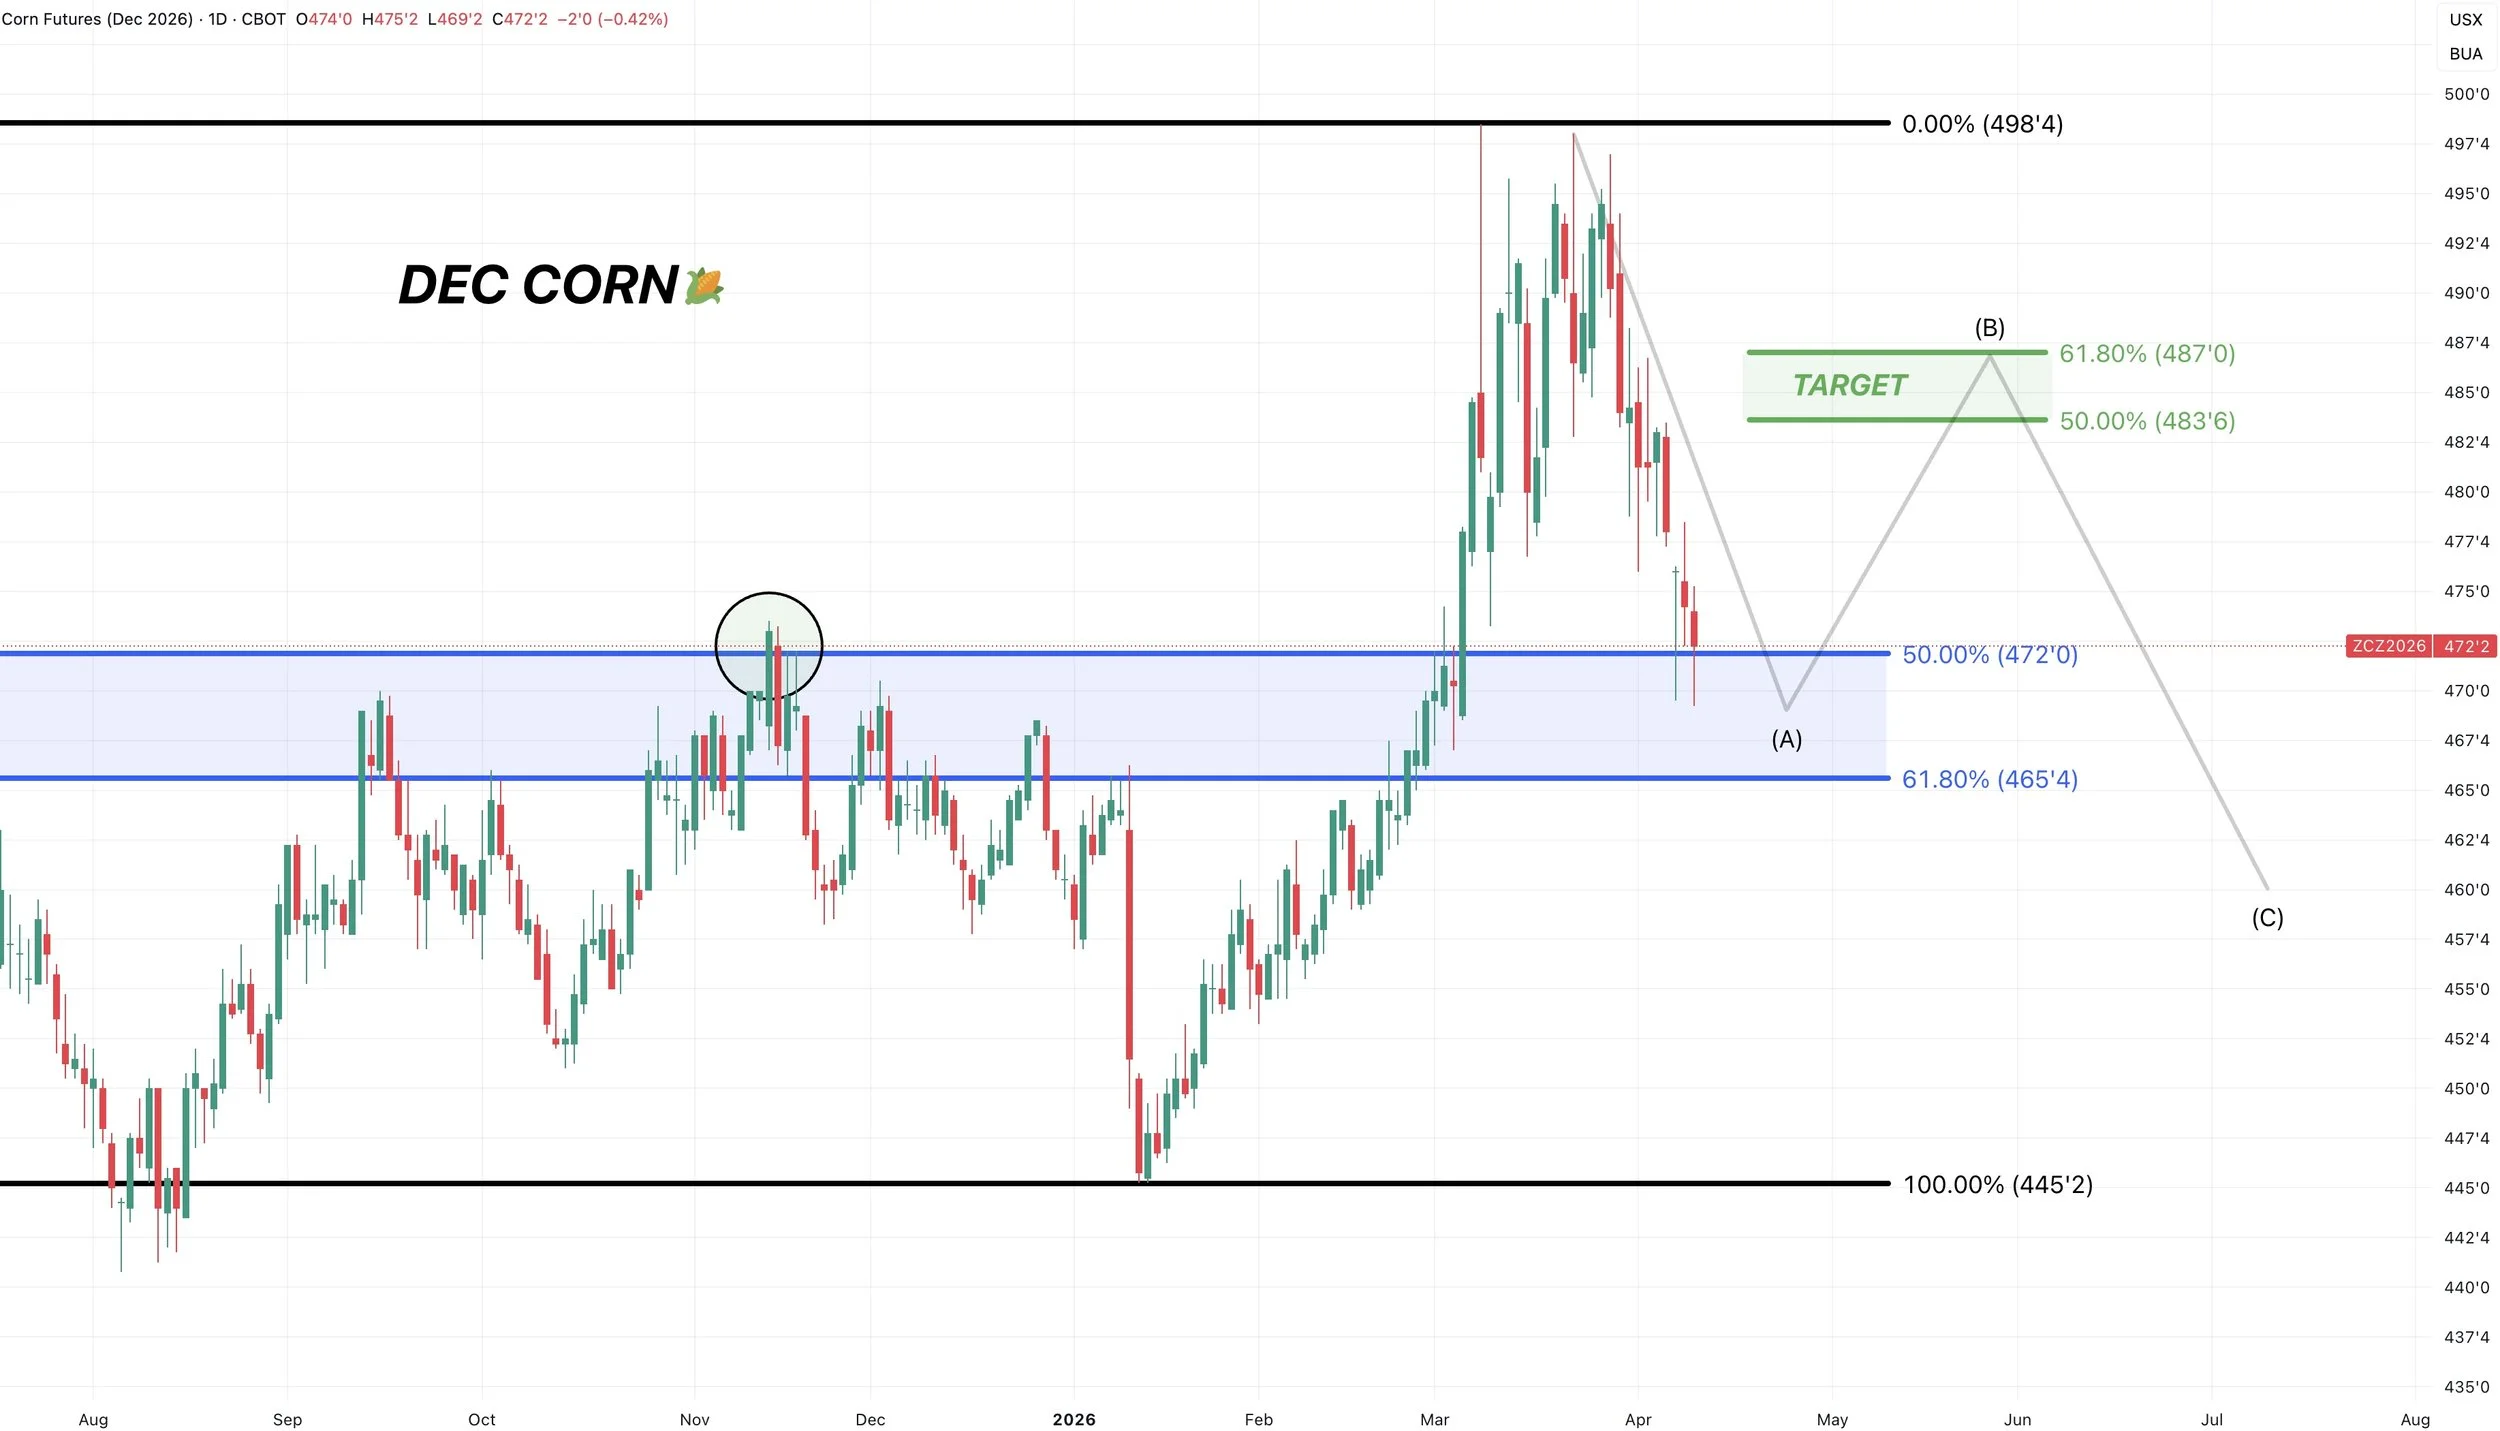
Secondary targets are always subject to change.
But for now, this is the game plan.
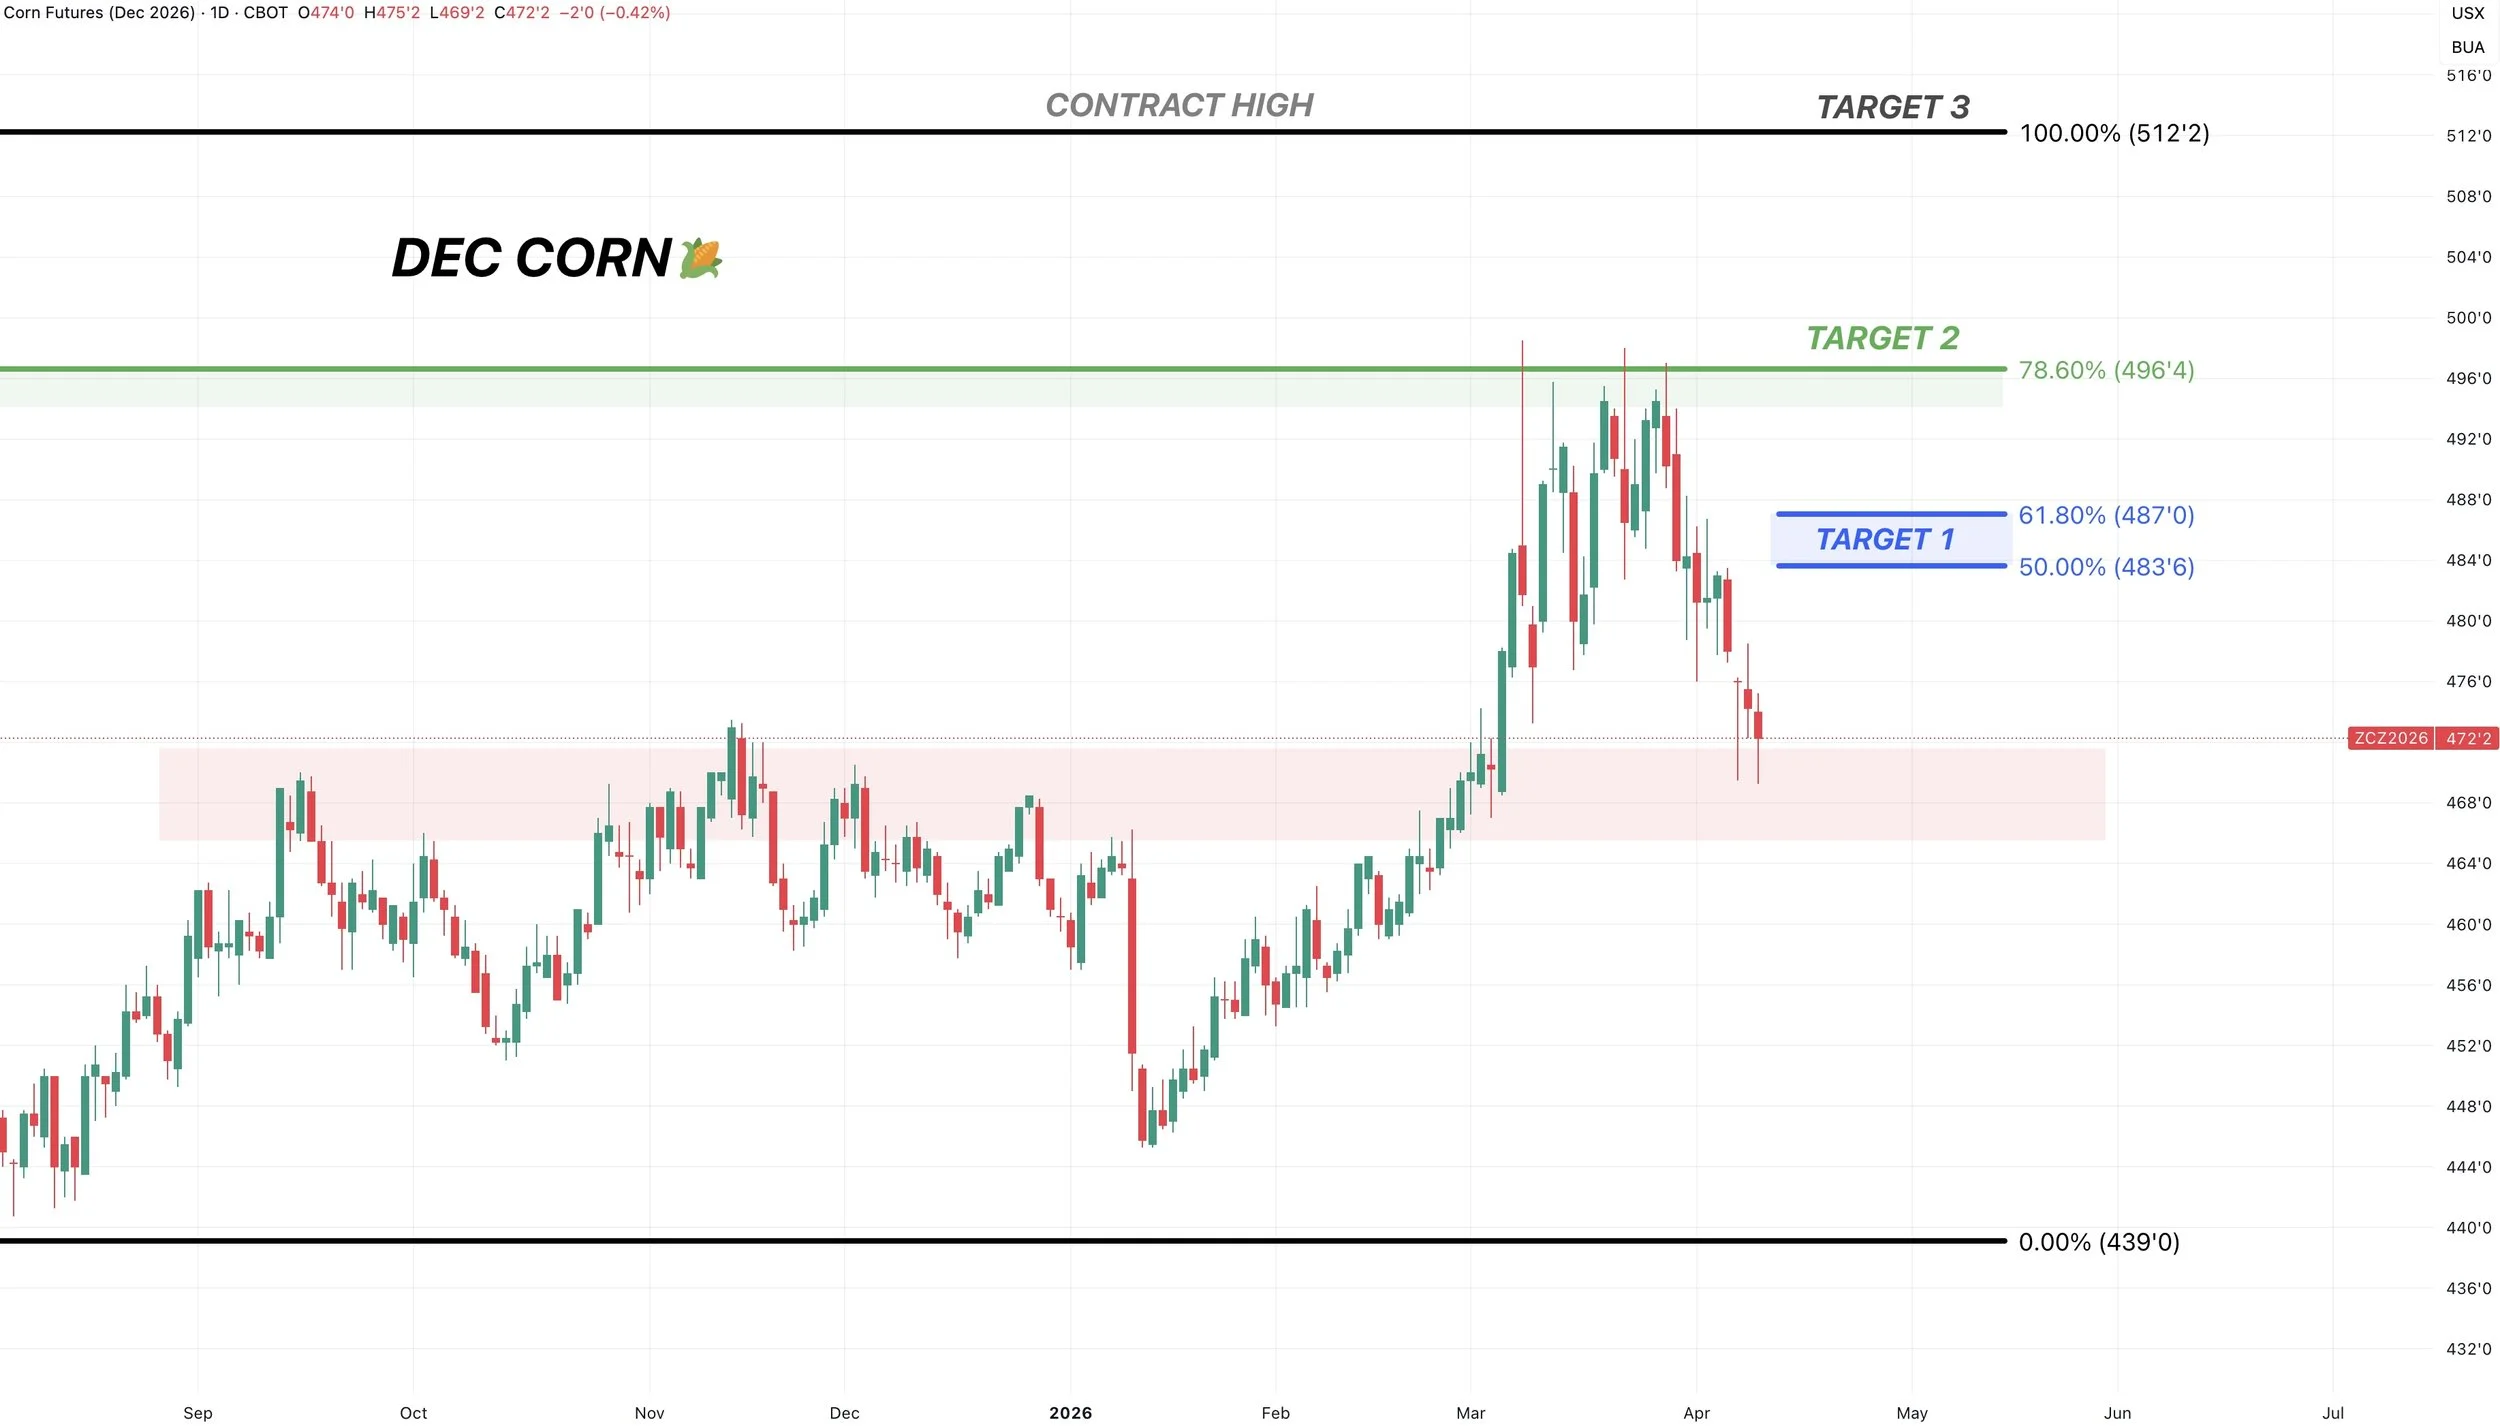
2nd Target:
Would simply be a re-test of those highs around that $4.95 range.
3rd Target:
Would be those contract highs at $5.12
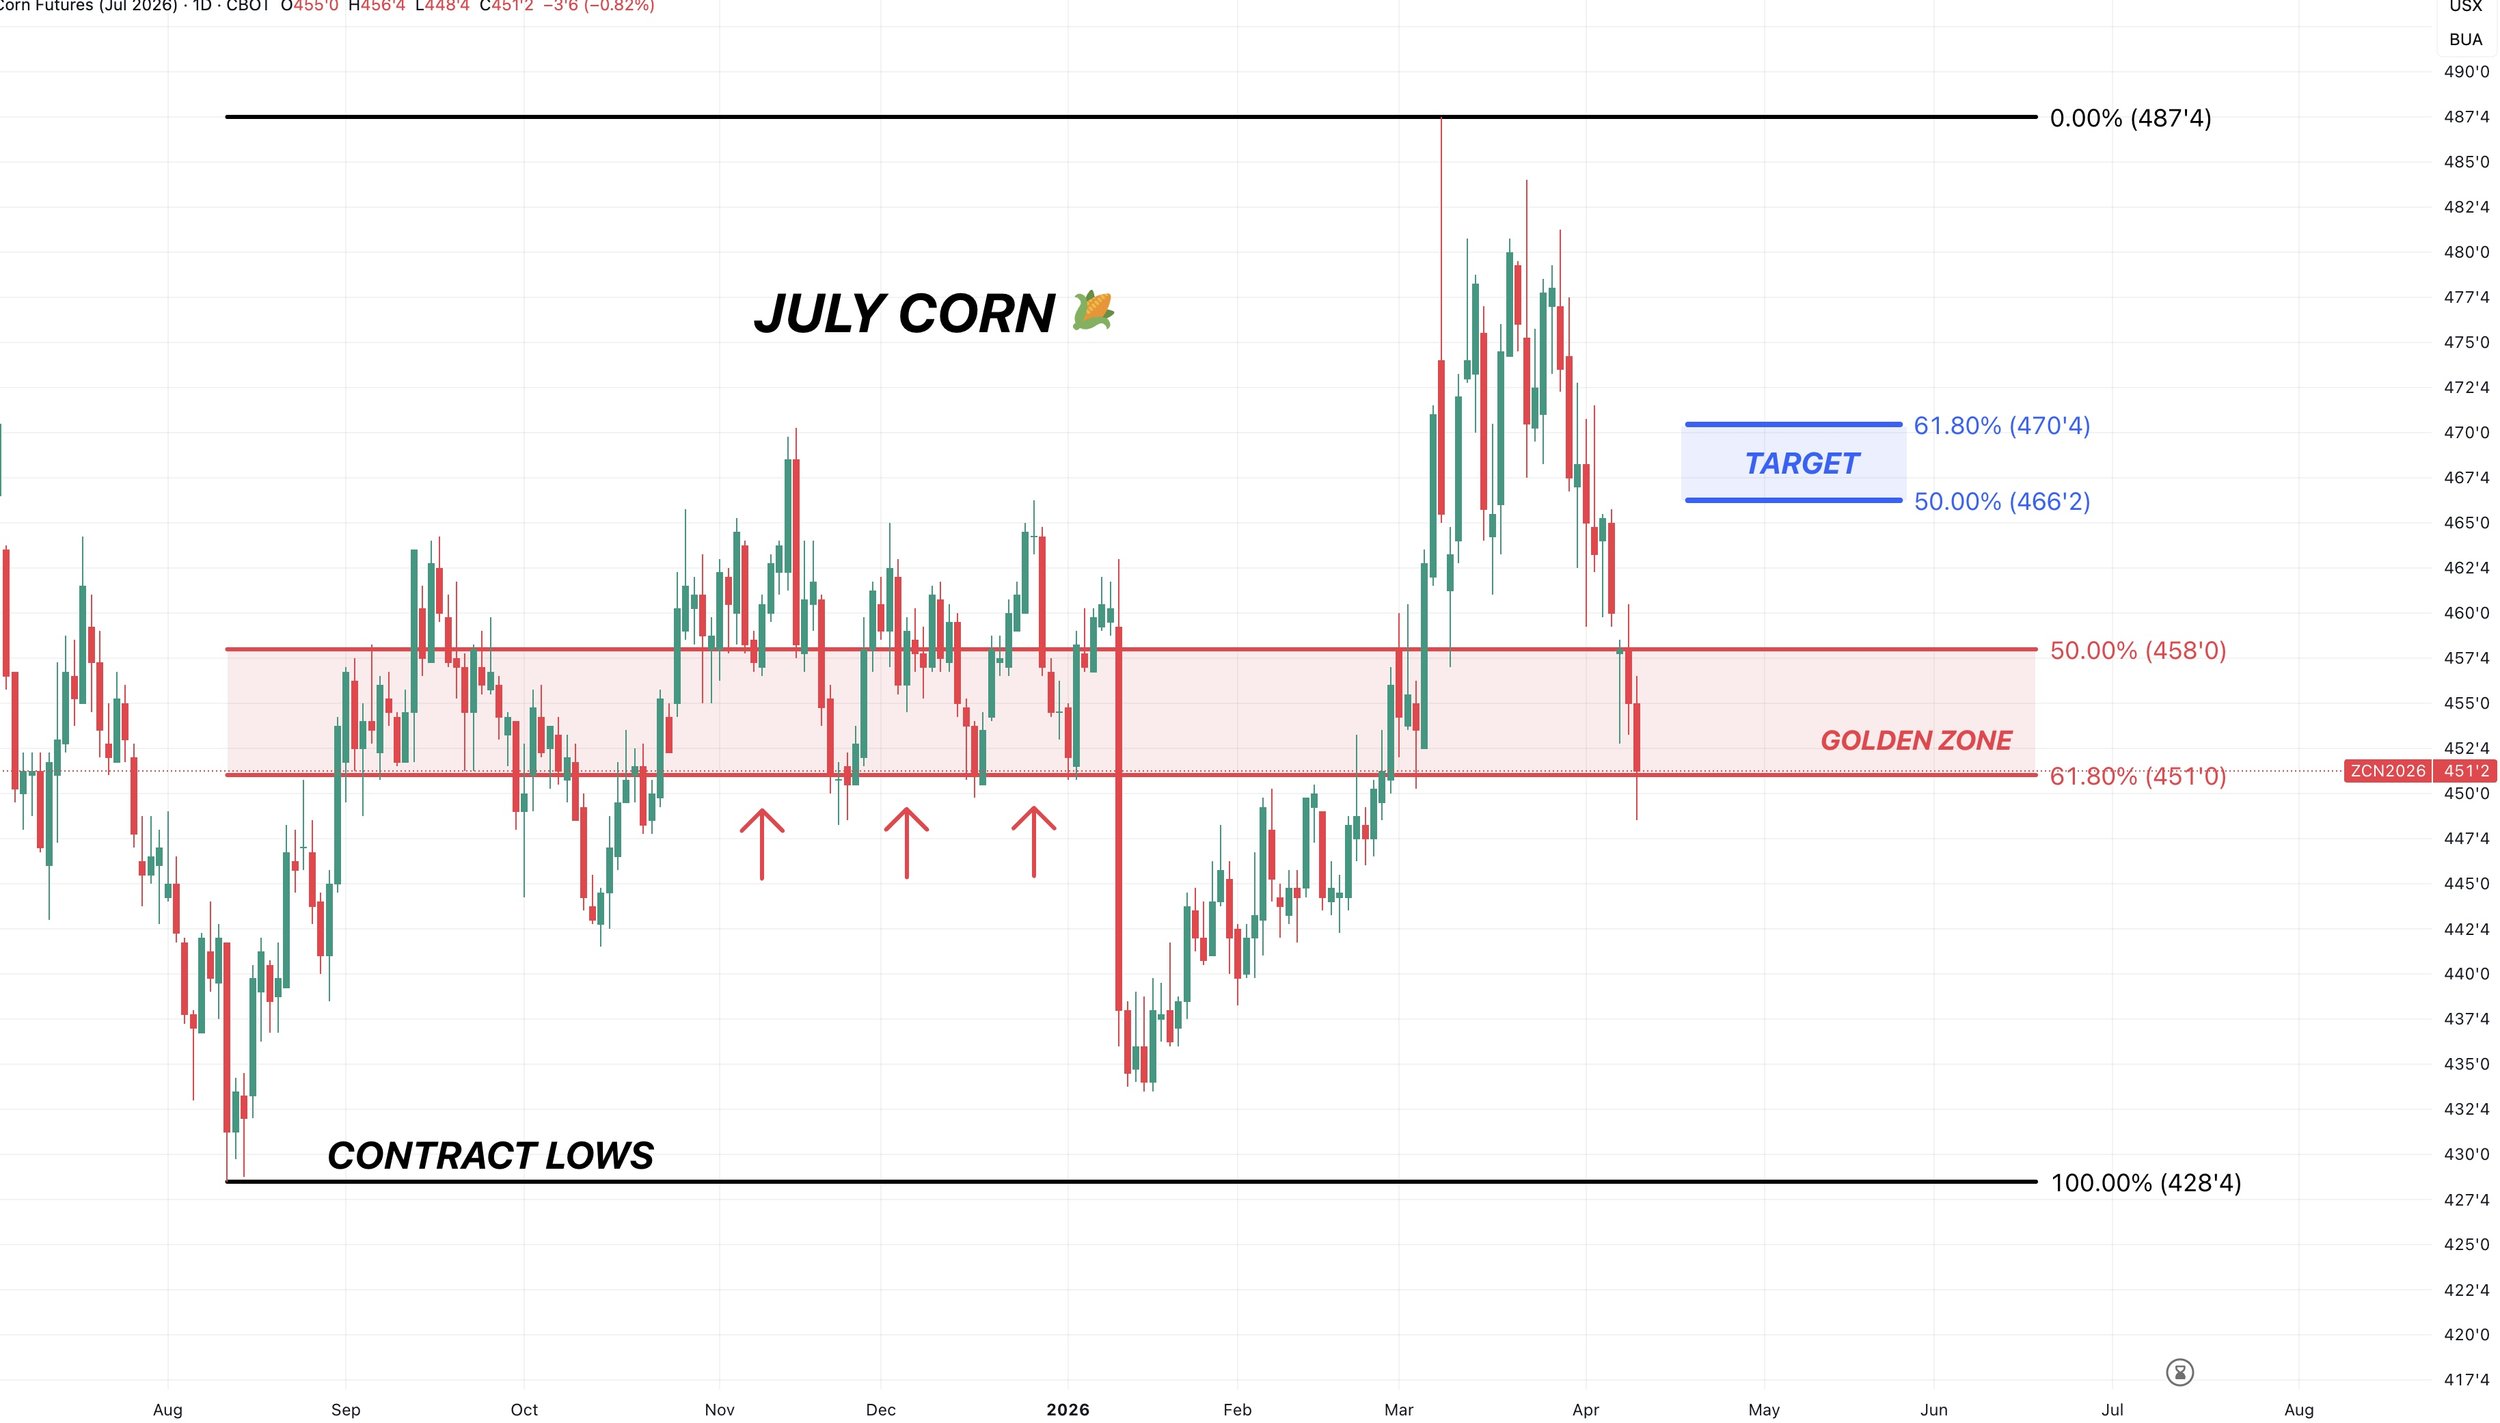
July Corn Chart:
If you take the recent highs, all the way down to the contract lows we are sitting right at the 61.8% level. The most common level and where the market makes a big decision.
This same level is also that key support from last fall.
Target:
A typical relief bounce would take you towards that $4.65 to $4.70 range.
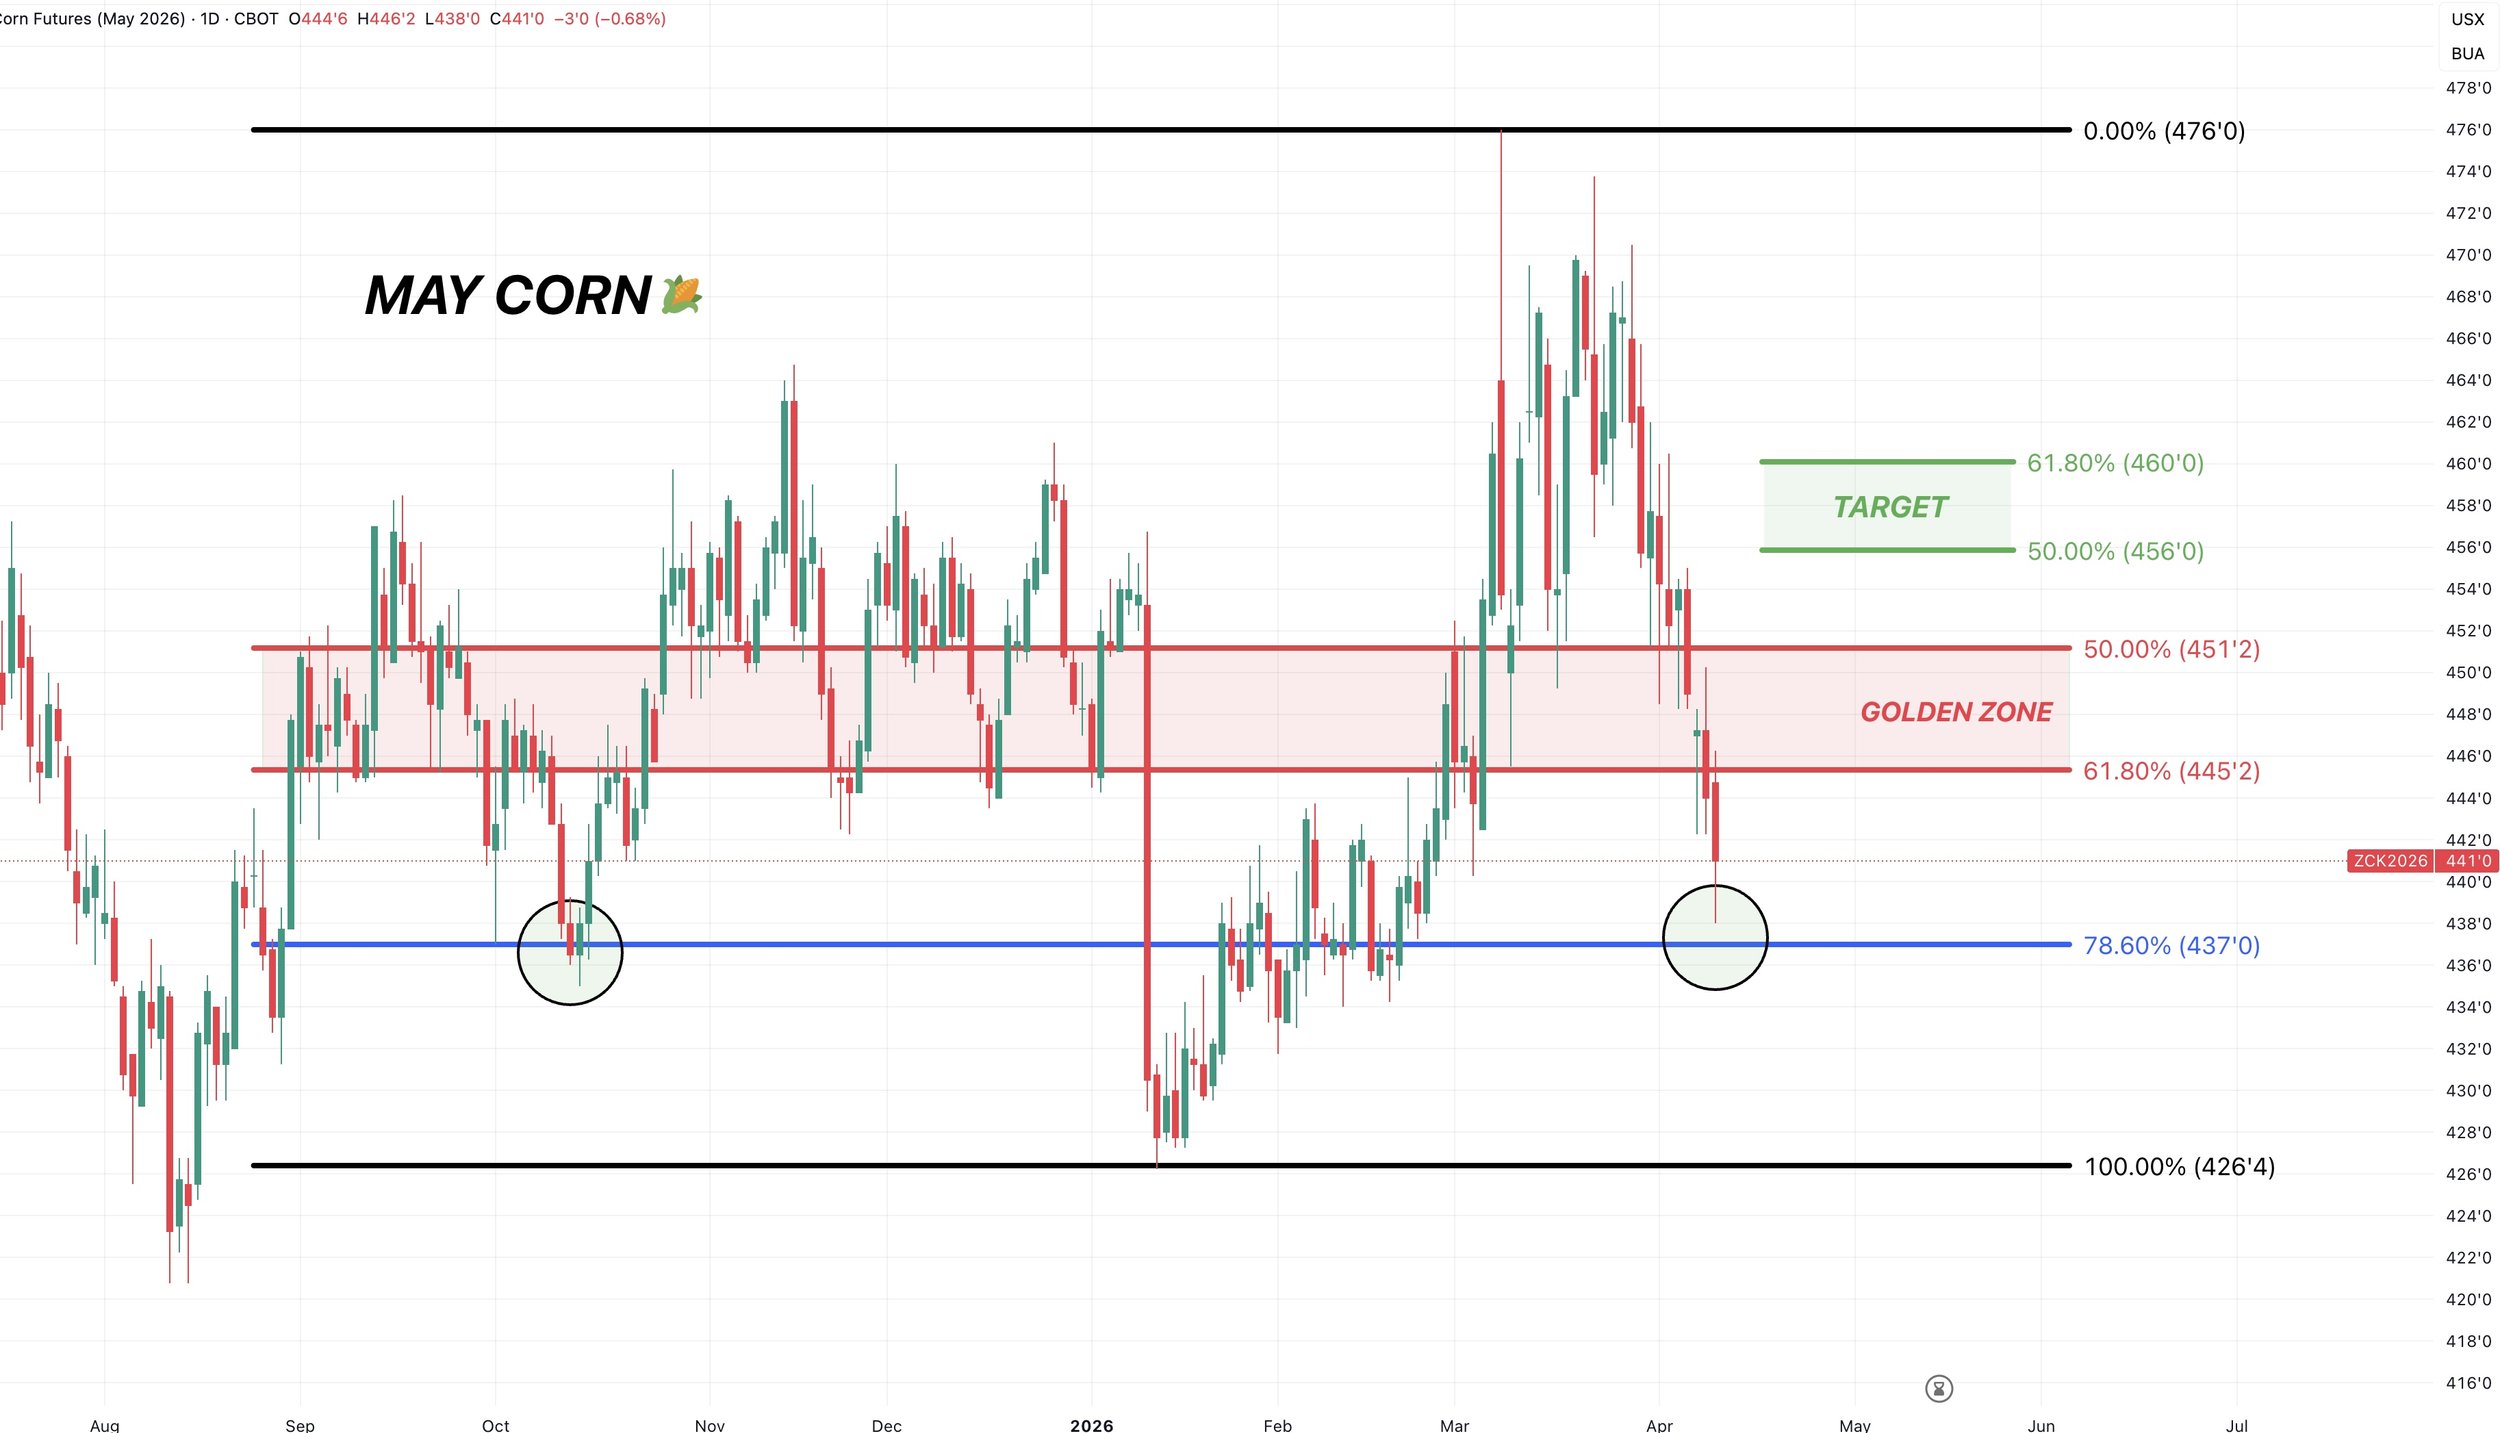
May Corn:
May corn looks the weakest.
We broke below the 61.8% level. Objectively, that is not a good sign. As it would suggest that the top is likely in given how deep the pullback was.
As a break below that level often tell us this isn’t your normal correction before resuming the uptrend.
However, we are now essentially at our last level of support before those contract lows.
Today we almost tagged that 78.6% level and those lows from October.
If you break below that level, we likely go and test the lows.
Target:
If this was the bottom, a usual bounce would take you to around $4.55 to $4.60
Essentially re-challenging that resistance from back in fall.
Soybeans
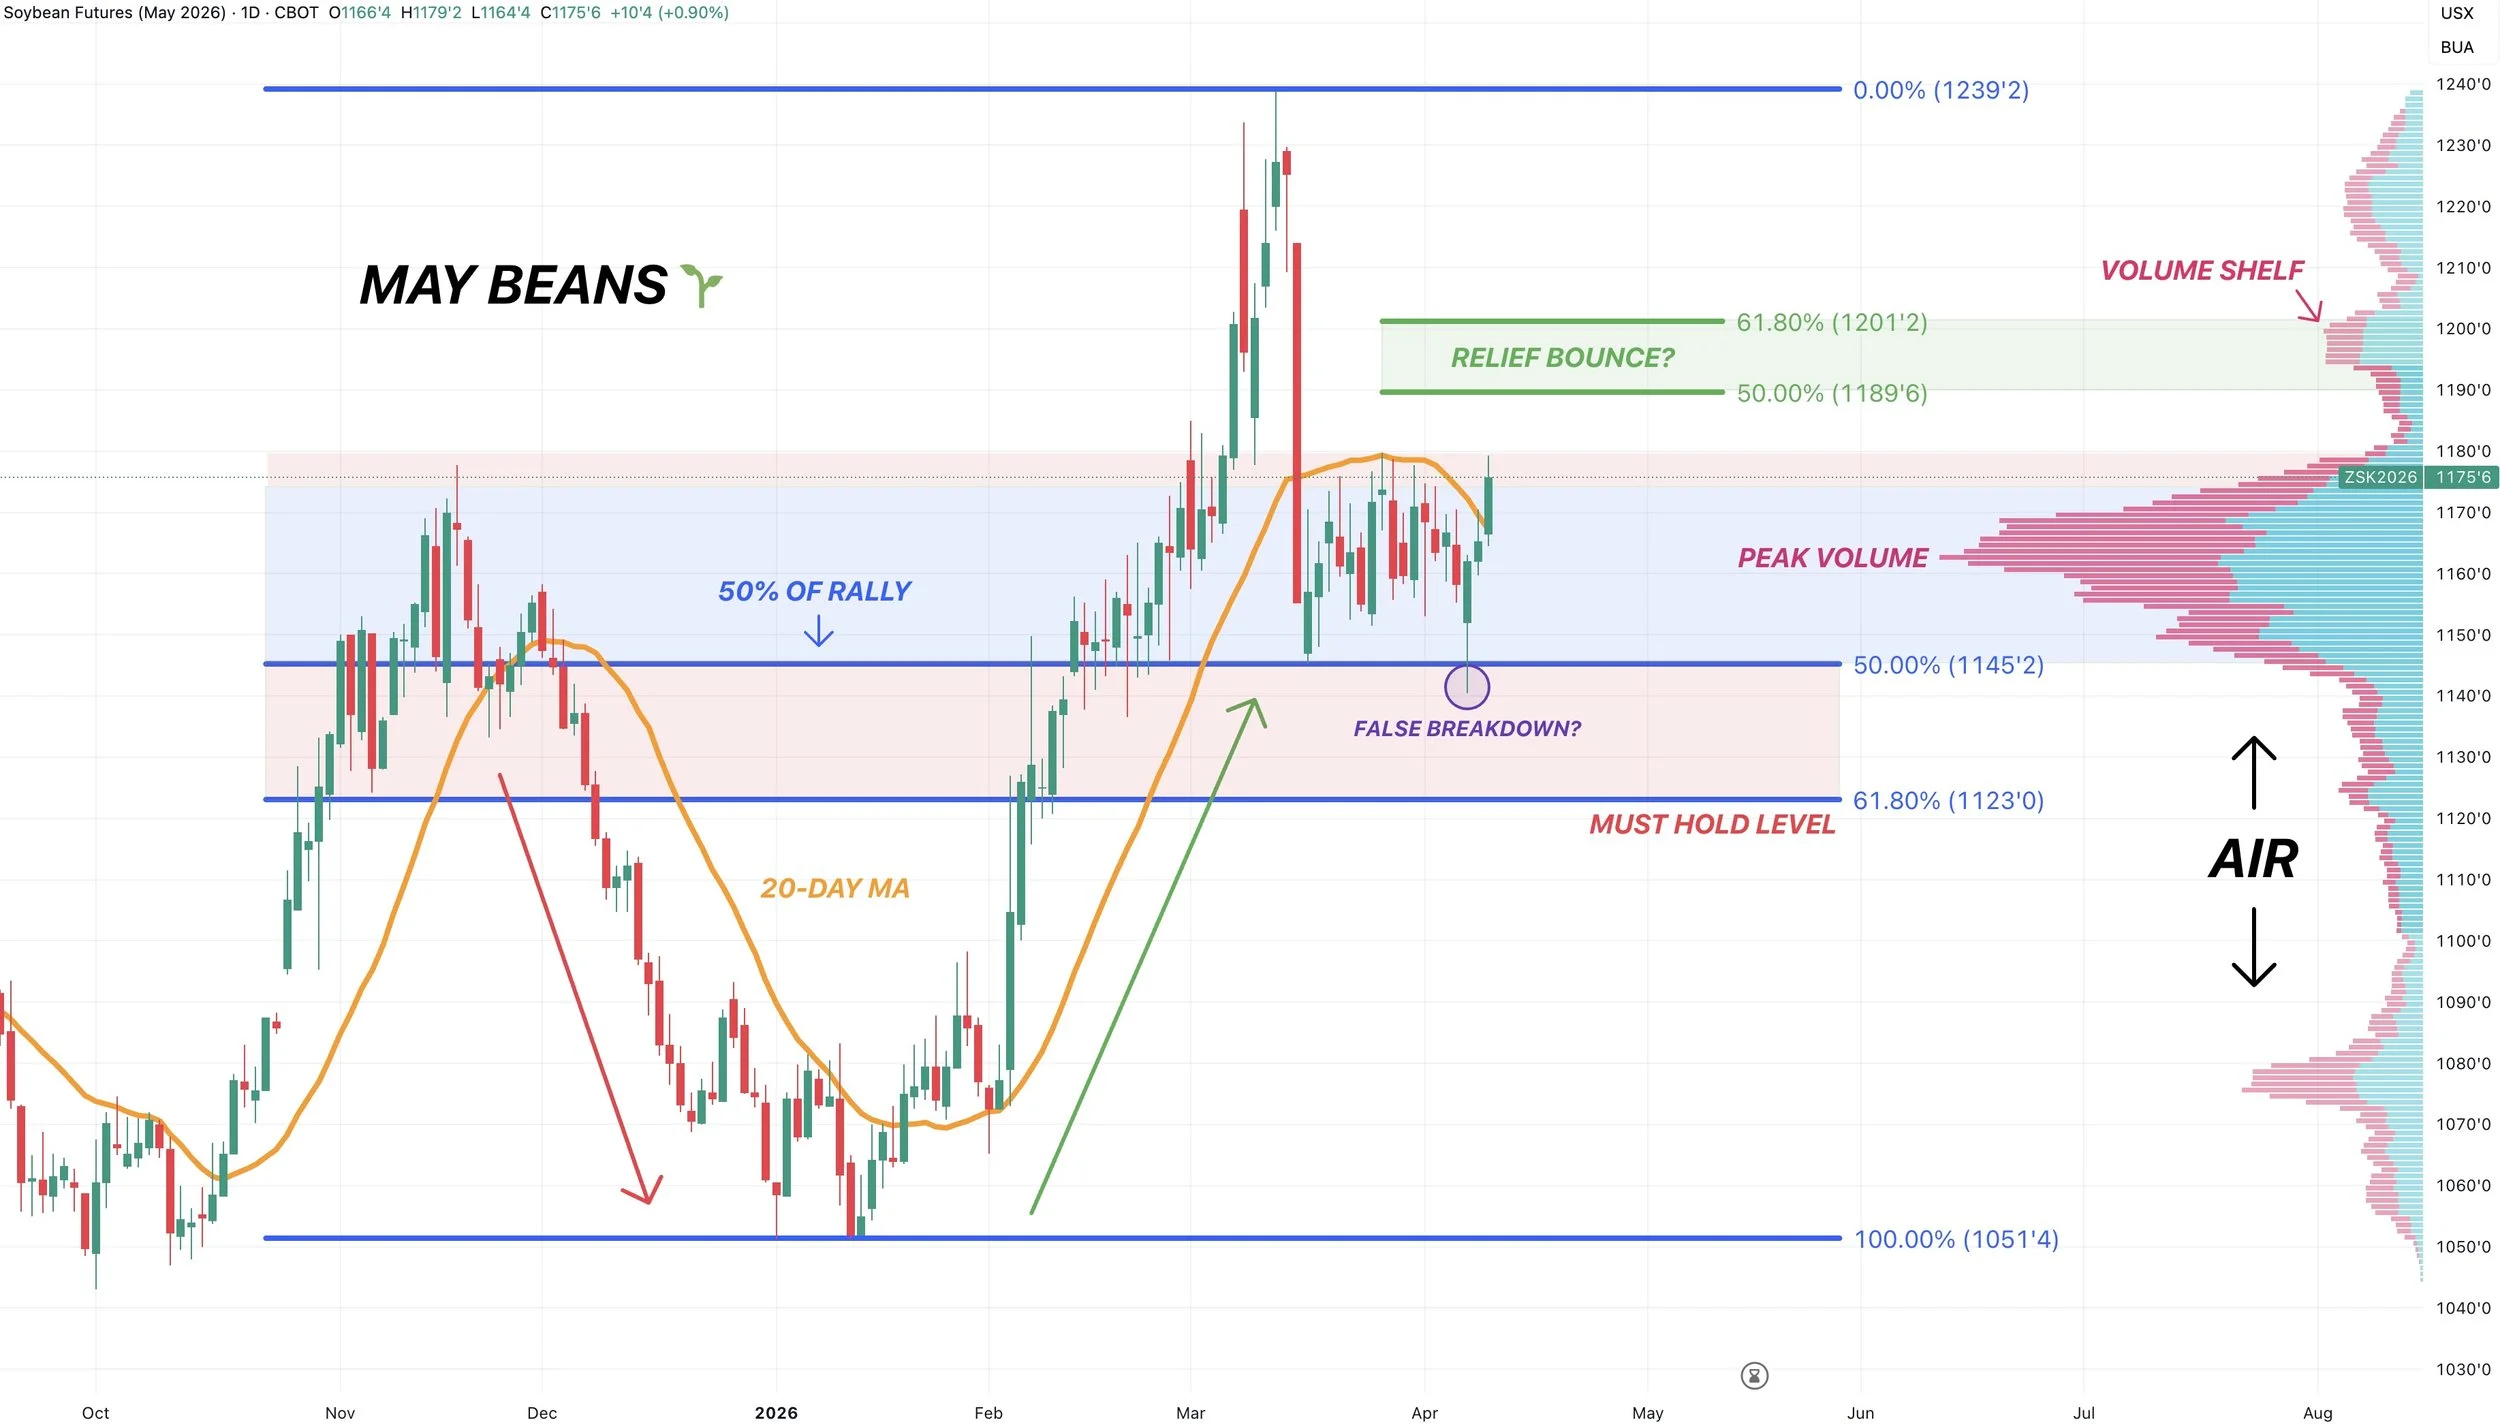
May Beans Chart:
We finally cracked above the 20-day MA.
That is a great sign as we had rejected off that pretty much every other day during this brutal chop the last several weeks.
Breaking above this could spark some further upside.
We've continued to hold that key support and volume we've been talking about for weeks.
How high of a bounce could we get?
Target:
A usual relief bounce would take you towards $11.90 to $12.00
That is where we are looking to reward.
That is 50% to 61.8% of the sell off.
Not only that, but if you notice we do have a volume shelf right at that area as well.
Volume shelves act as big areas of resistance and support. Hence why we've continued to hold this level.
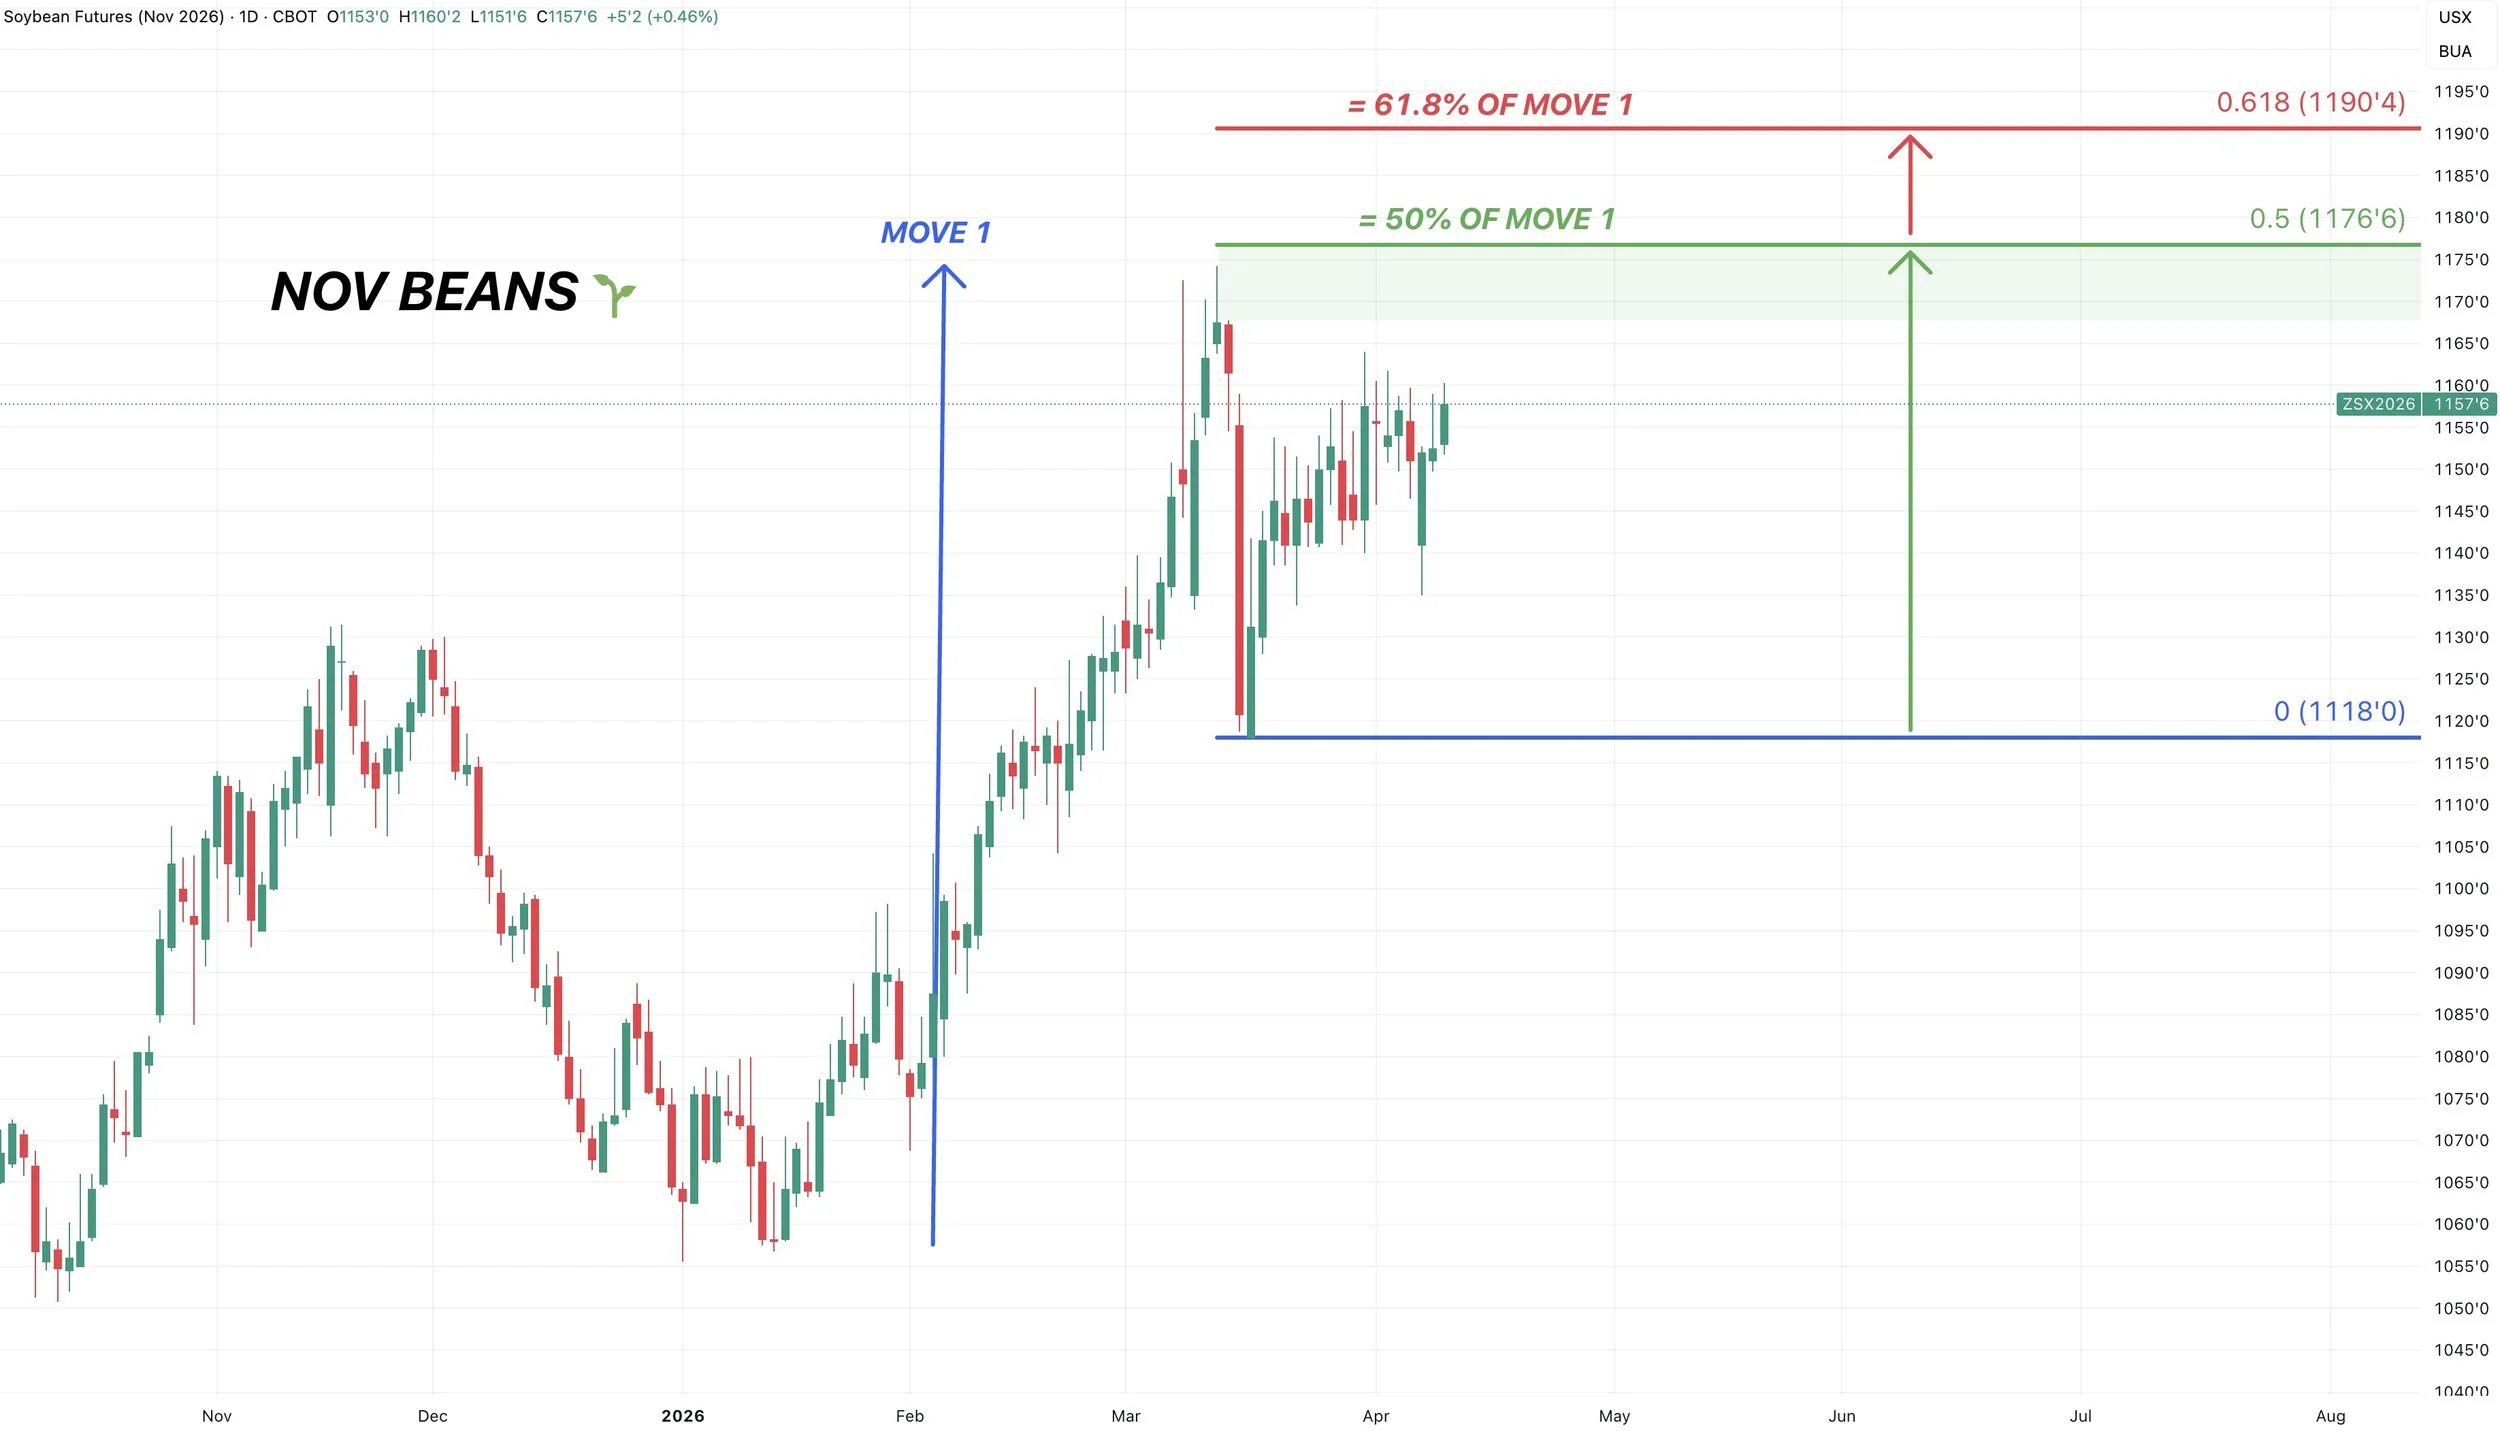
Nov Beans:
We already hit target one a few weeks ago and have continued to chop in this range and area of high volume.
So we already rewarded this move.
As the golden zone is where most relief bounces struggle.
However, since we are above it, it often suggests we will go and challenge the highs or even post new highs.
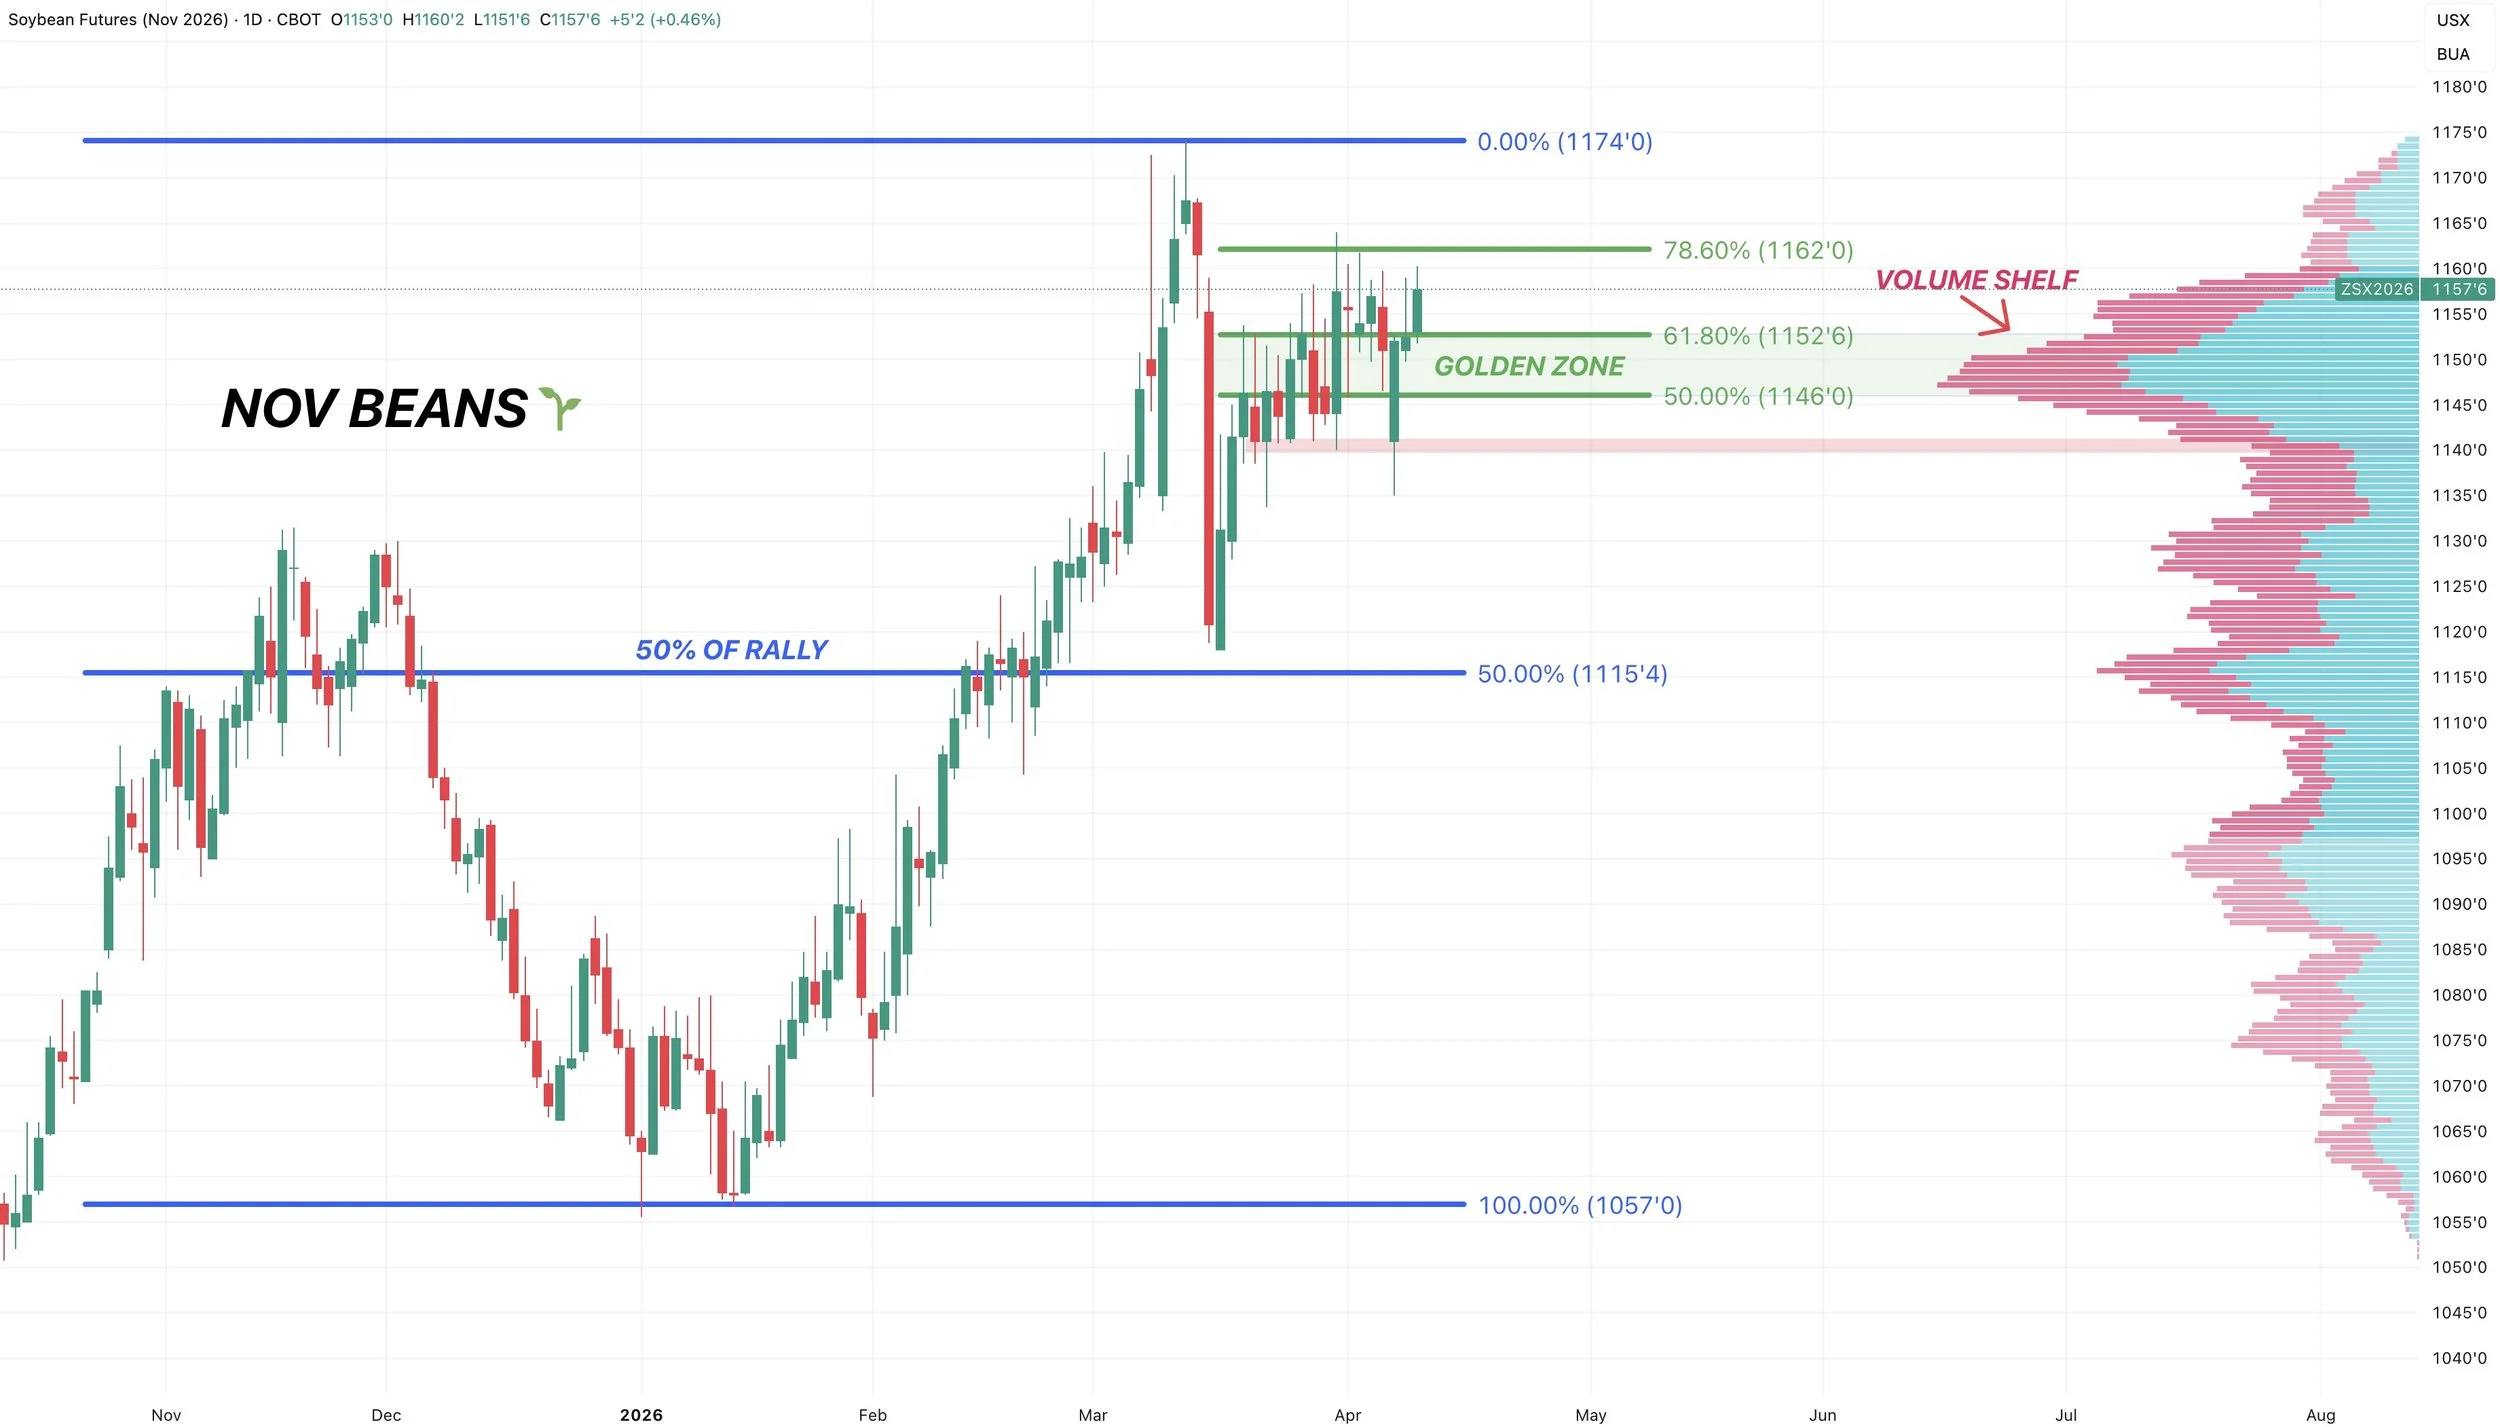
Next Possible Targets
If you take a trend based fib extension from the January lows, up to the March highs, then back down to recent March lows.
Which measures the size of that first rally, and then projects it from the recent lows.
The 50% extension comes in at $11.76 which is right near those $11.74 highs. Which means that equals 50% of the size of the first rally.
The 61.8% extension comes in at $11.90
Those are the next targets, but as always subject to change.
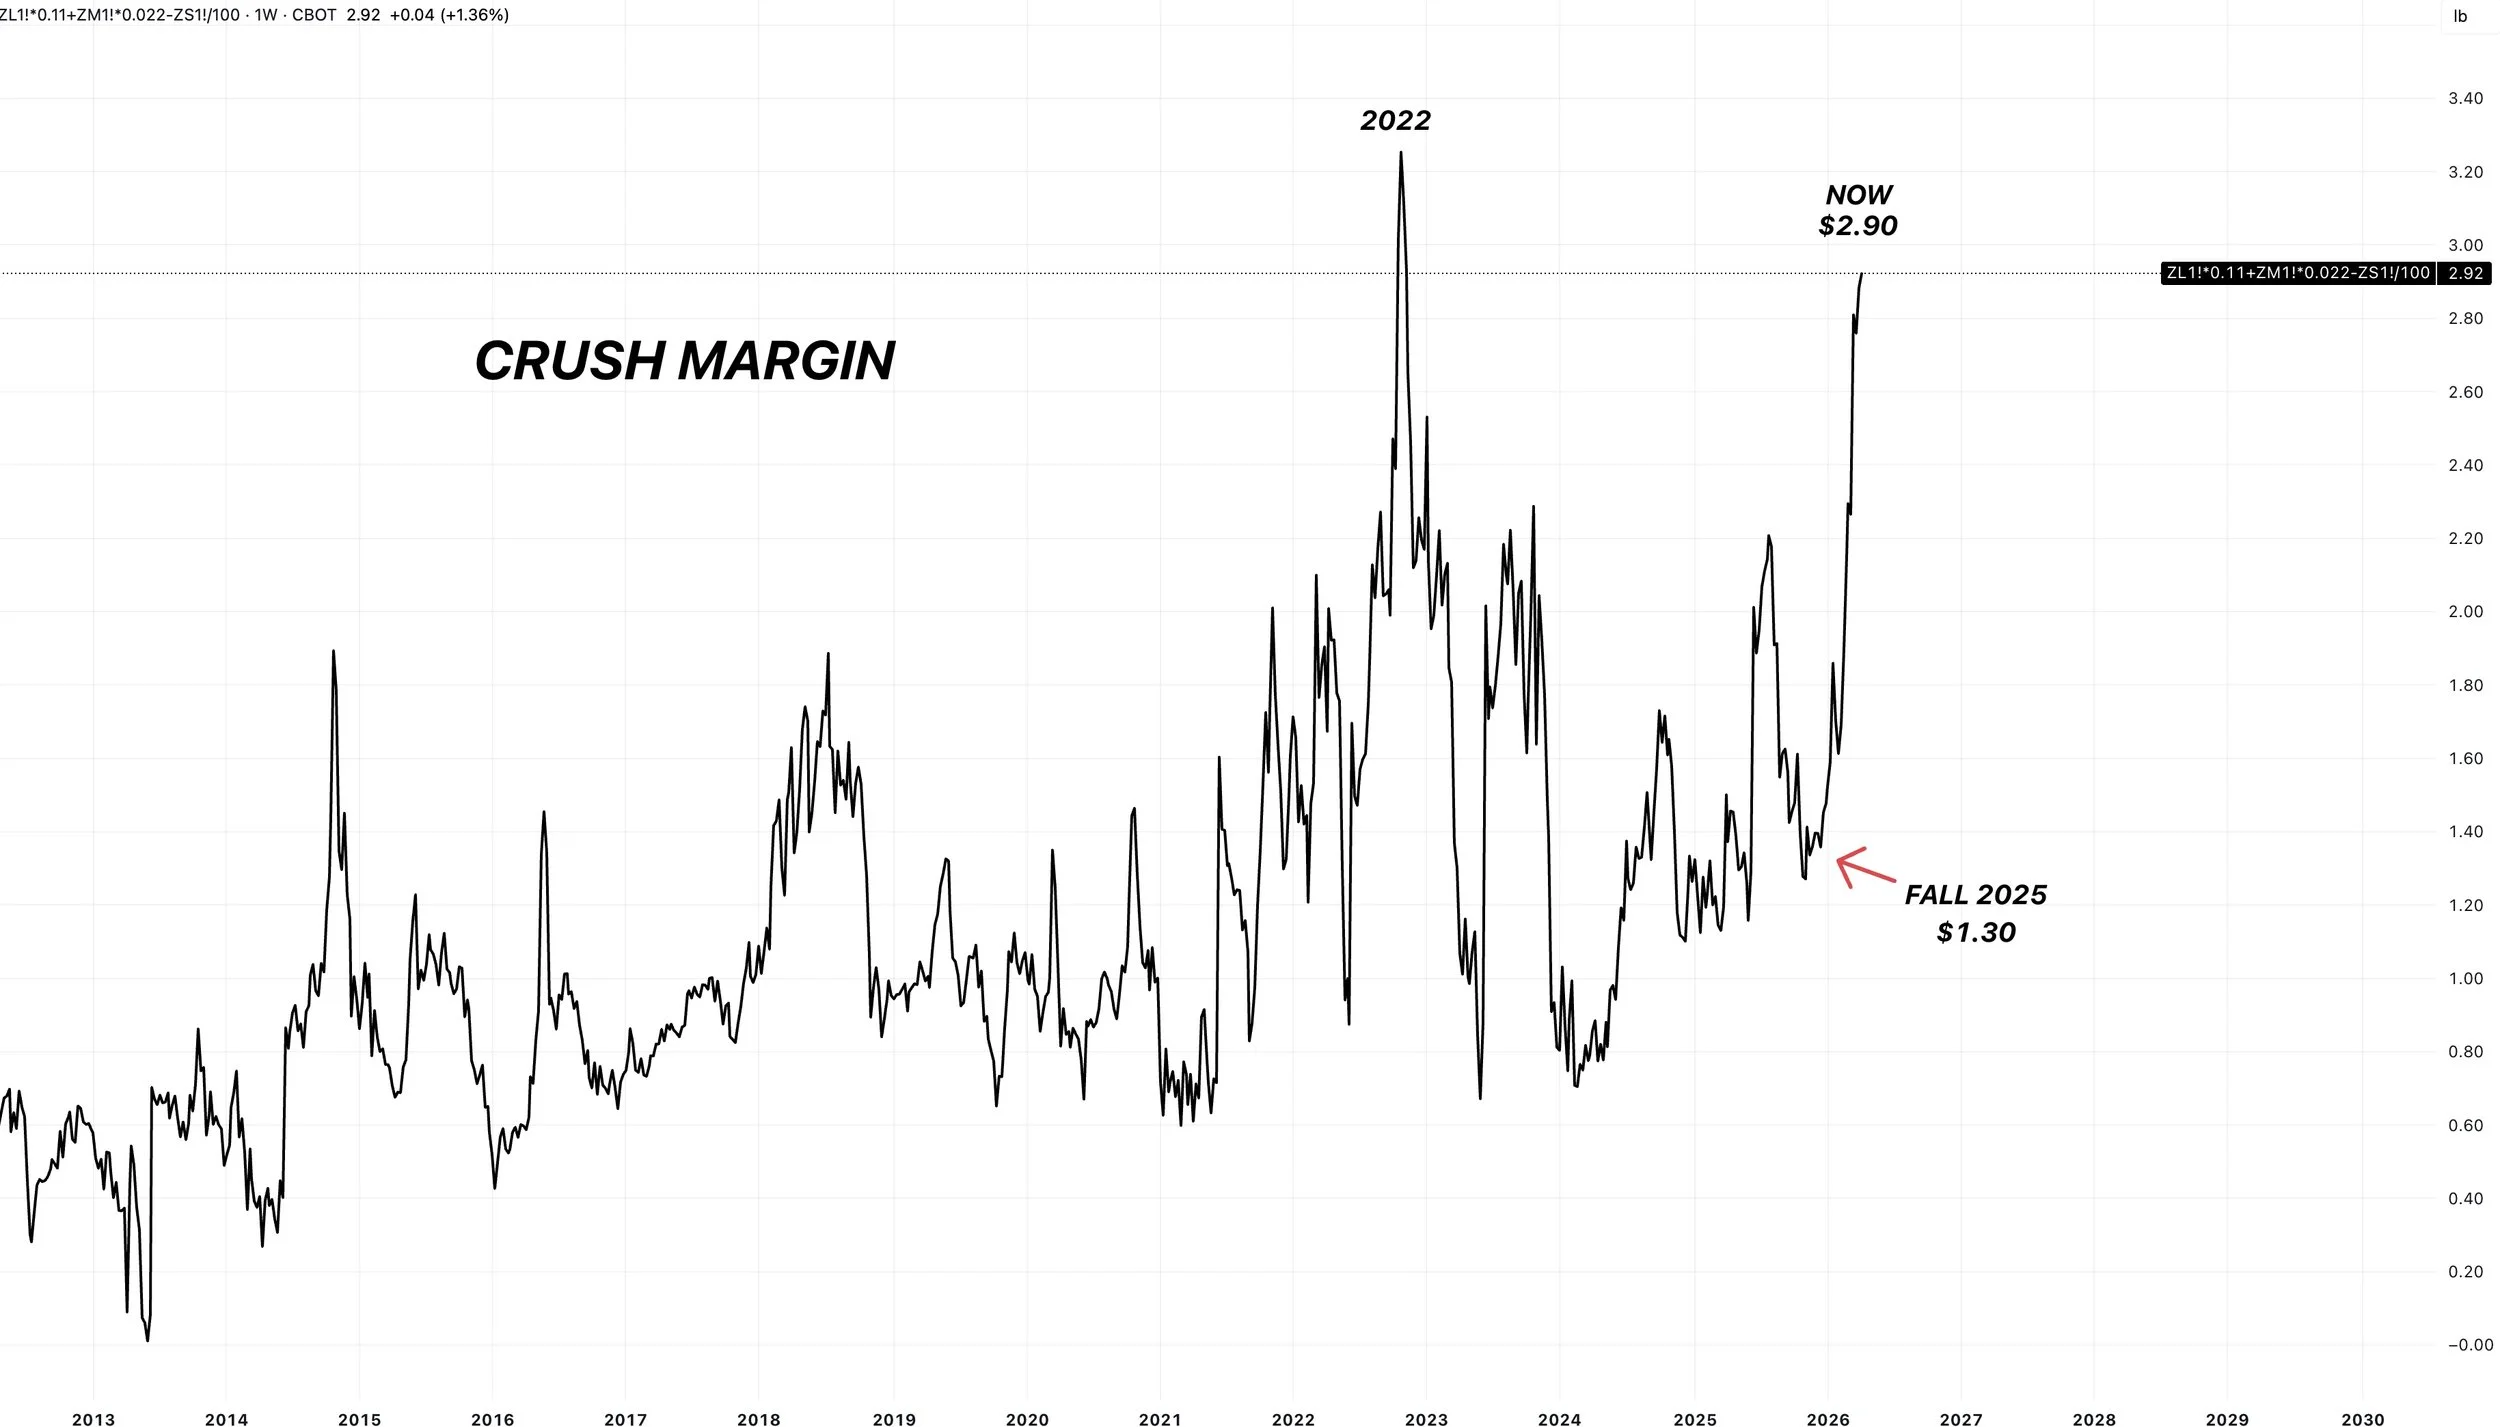
Crush Margin:
Just wanted to throw this into today's update as well.
Here is a great tweet the highly respected Mister Commodity where he talks about crush margin.
Earlier this week all I heard was how everyone thought soybeans were going to fall out of bed. Instead we've pushed higher.
In the tweet below he talks about how crush margin is nearly $3.
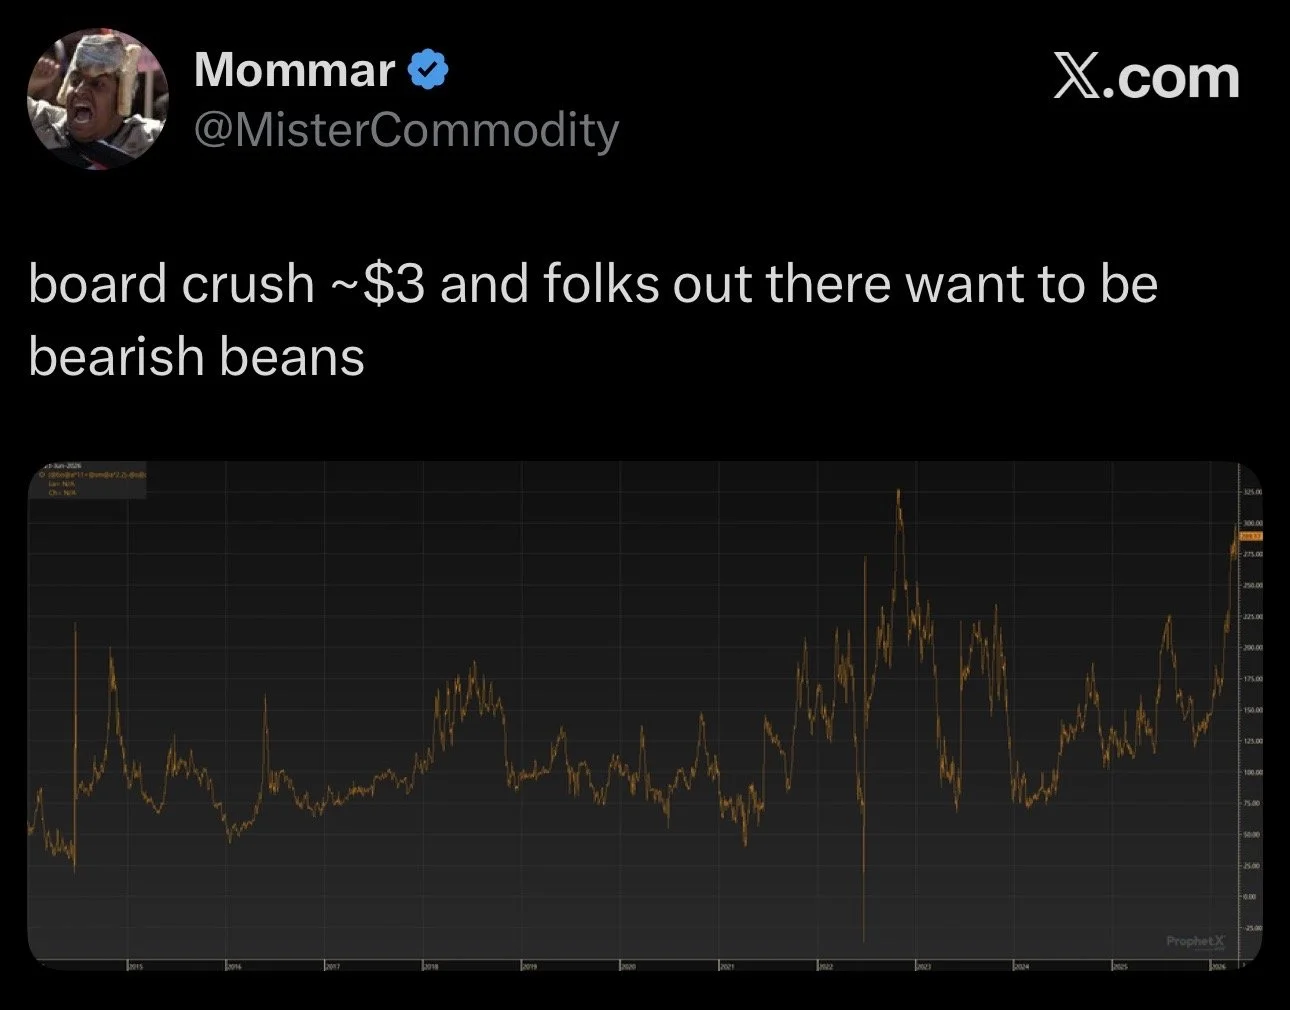
What does this mean?
Price of Oil + Price of Meal - Price of Beans = Crush Margin
$3 is historically a high margin. The 2nd highest ever.
When a processor is making $3 a bushel, that’s a pretty nice incentive to continue to buy soybeans.
Basically, it's a green light for processors to continue buying as many soybeans as possible and helps provide a floor under the market as long as they are making a good profit.
Back in early March, the margin was around $2.10. Back in fall, it was $1.30. It's now almost $3.
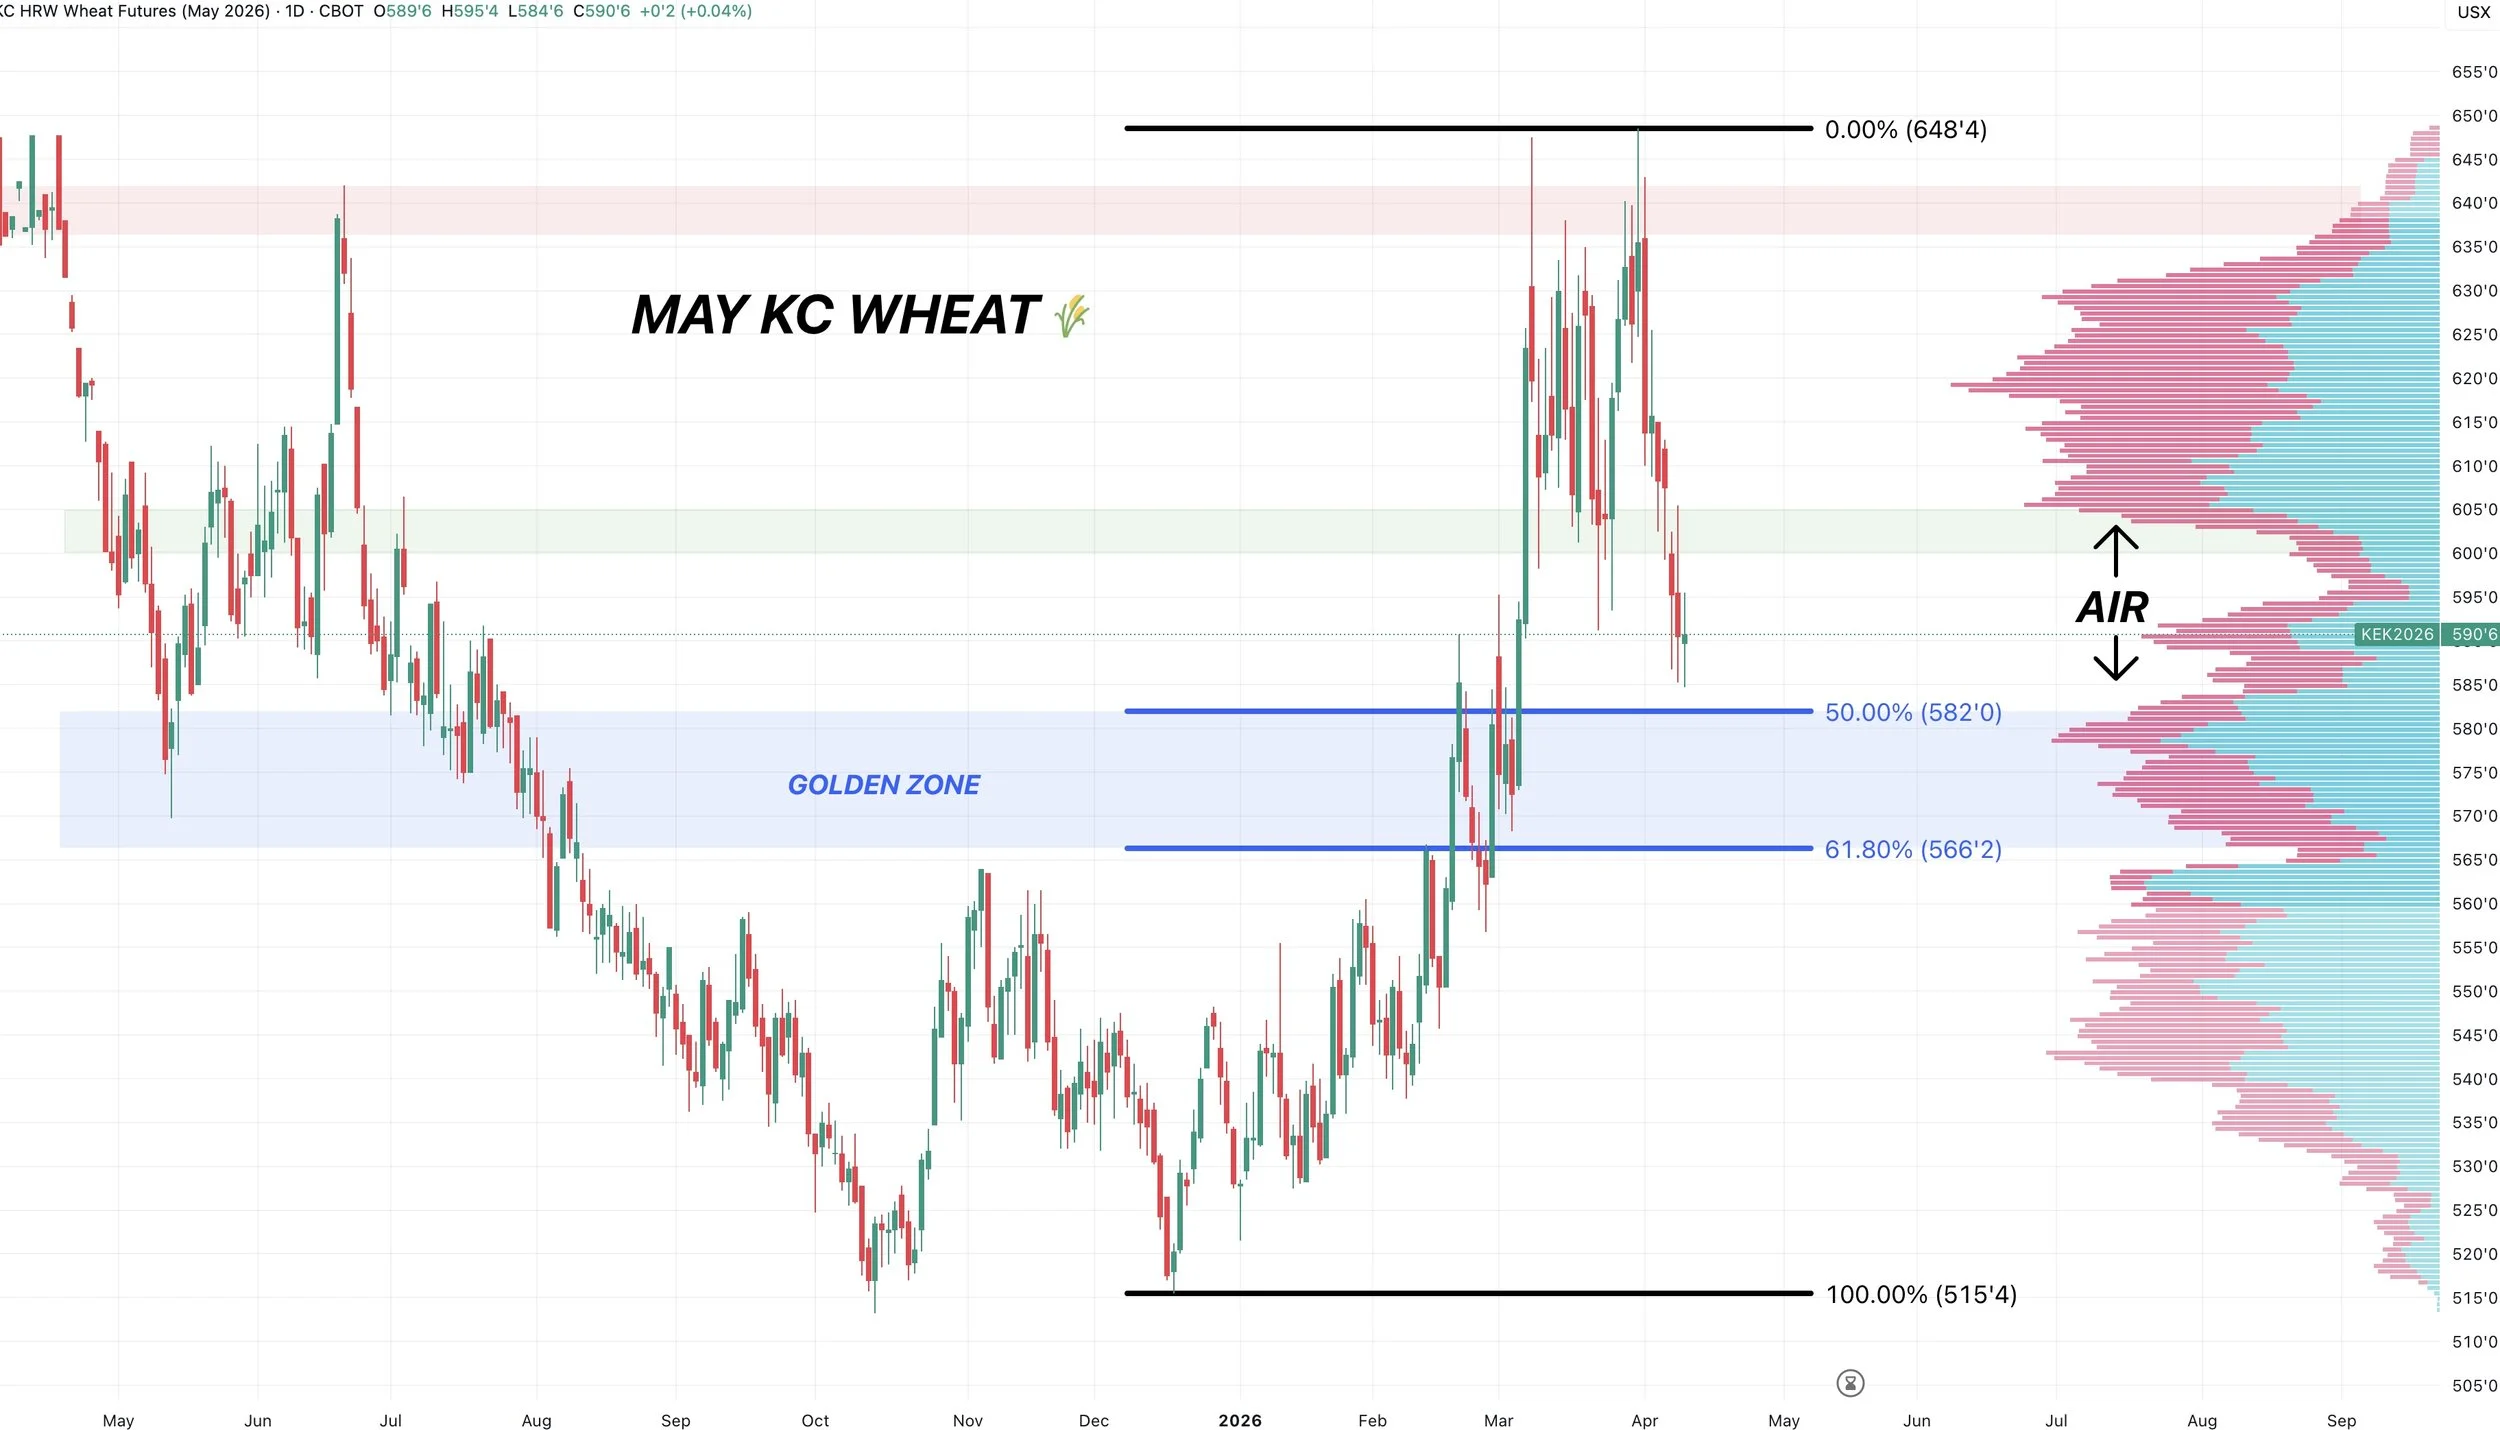
Wheat
May KC Chart:
Not much to update here vs yesterday.
We are getting close to that 50% level.
Would like to think we find a bottom soon.
Must hold level is $5.65
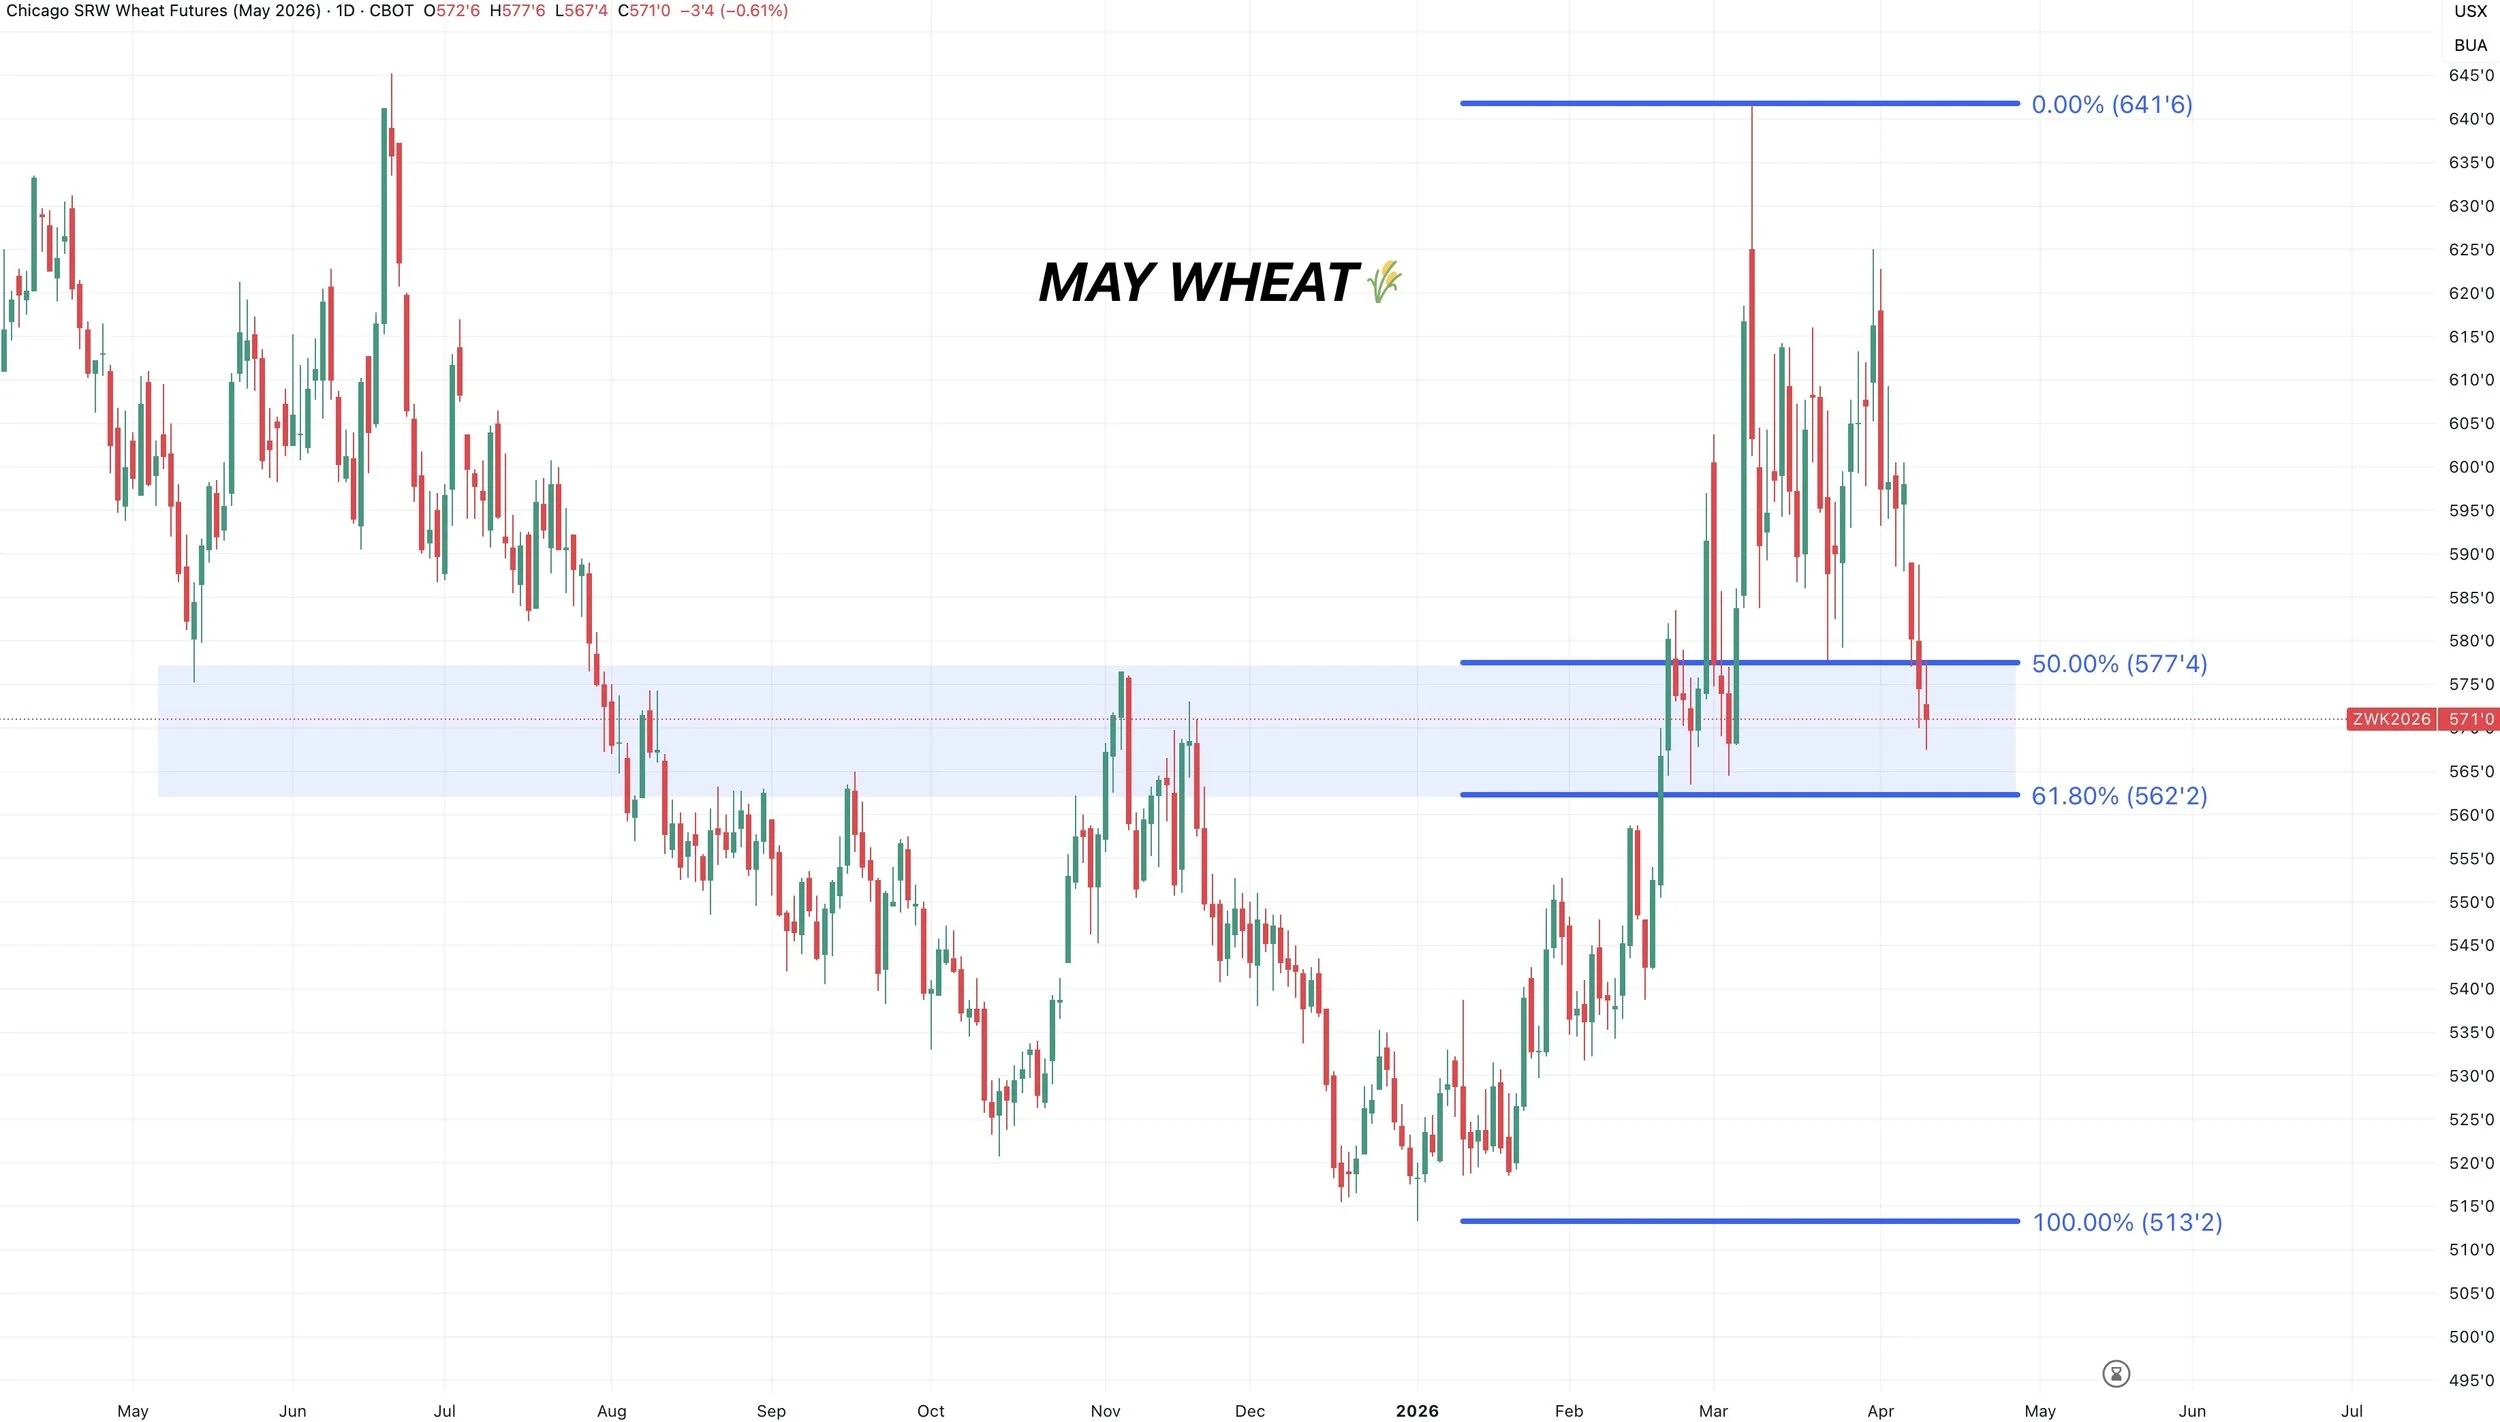
May Chicago Chart:
The Chicago chart is another reason to think we could bounce soon.
As Chicago is approaching the 61.8% level at $5.62
Which is viewed as a must hold level.
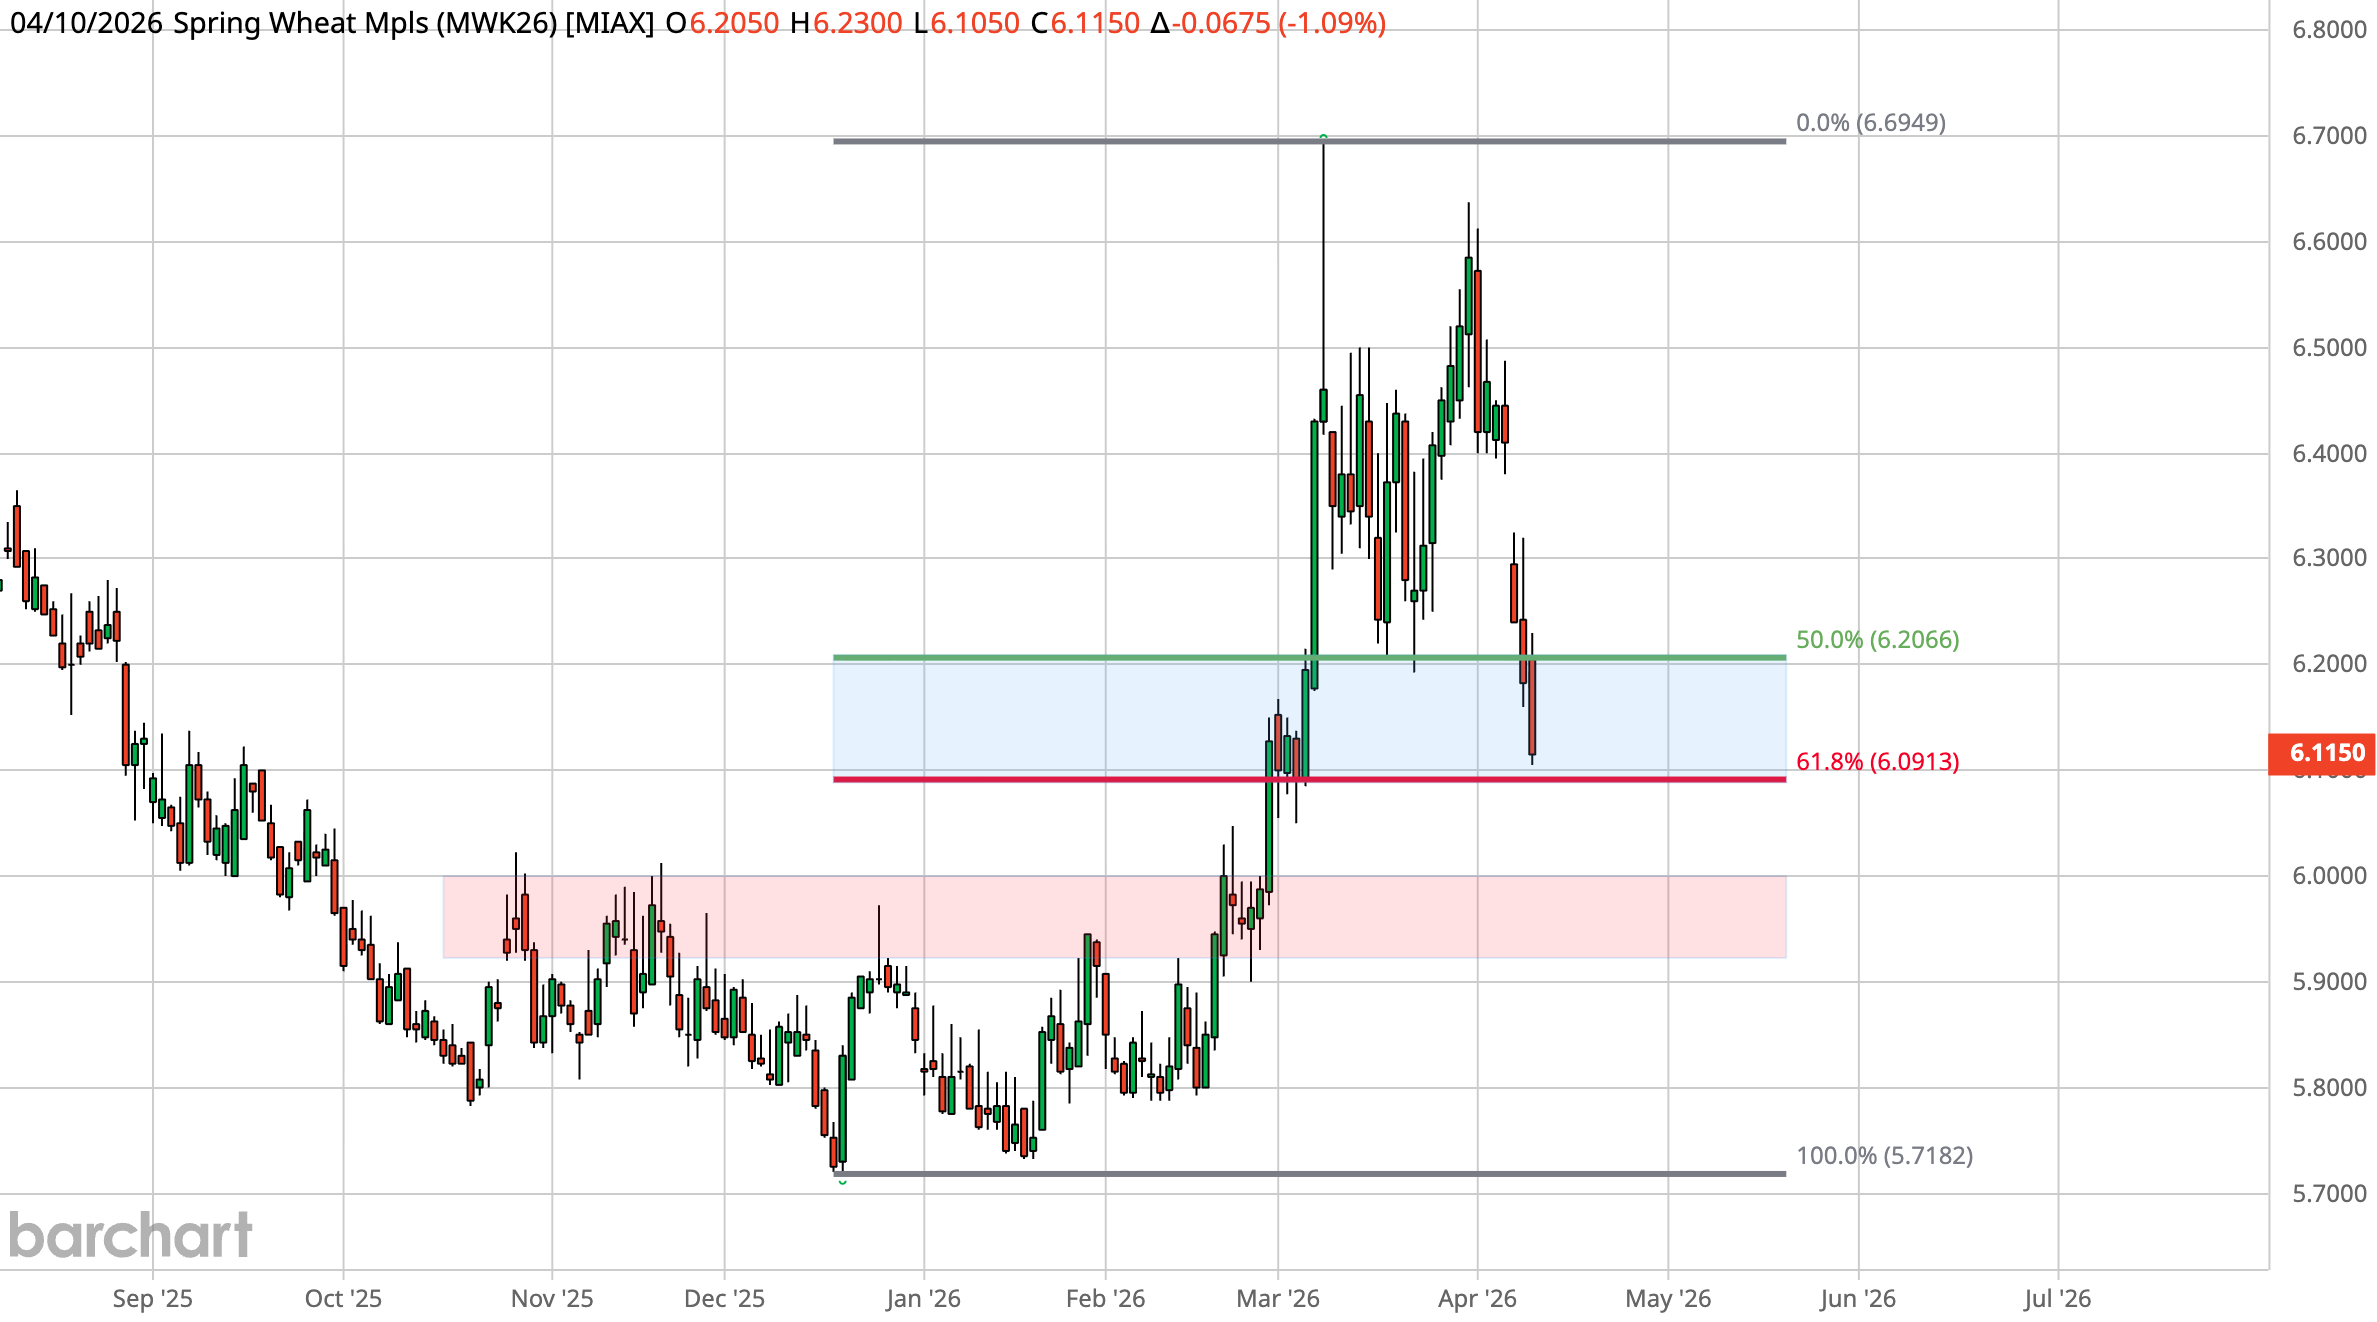
May MPLS Chart:
Nearly at that 61.8% level. Which is usually viewed as the must hold level.
That same level was some prior support.
Bulls absolutely want to hold here or there is some air lower.
Cattle
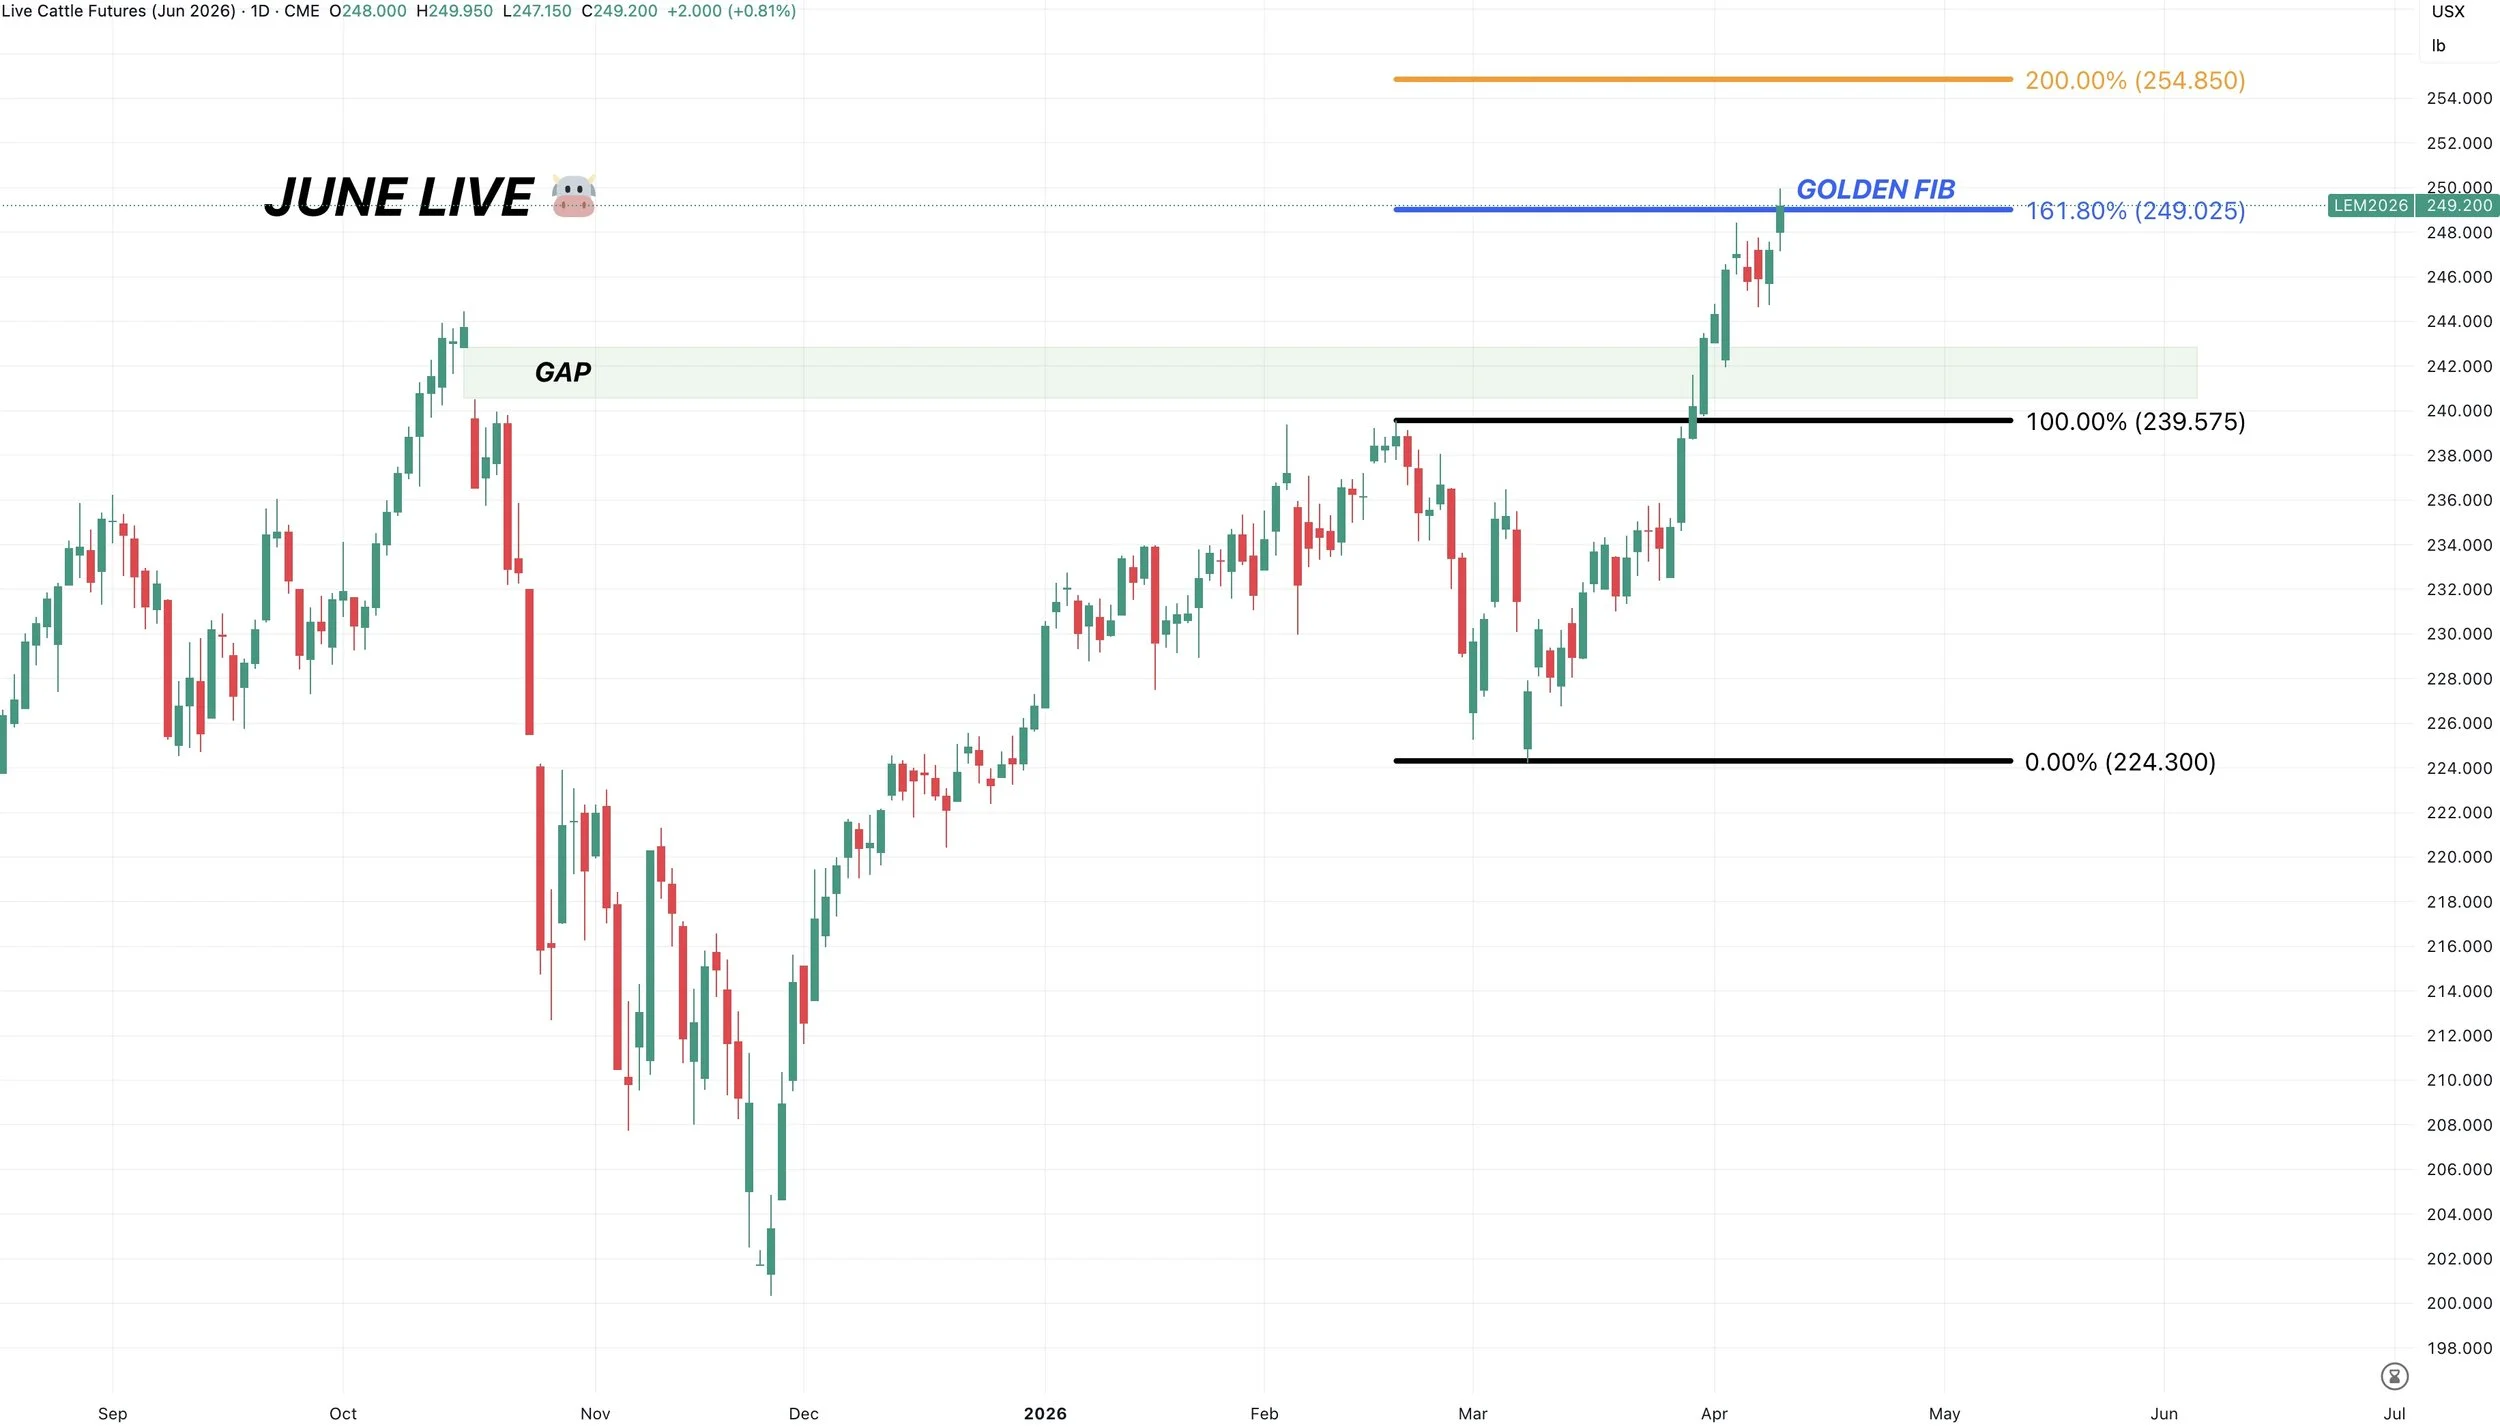
June Live Chart:
Offically tagged the golden fib today.
Which equals 161.8% of the recent lows up to the Feb highs.
This is a common area for a rally to pause, so I like defending this level.
Secondary target would be the 200% level at just under 255
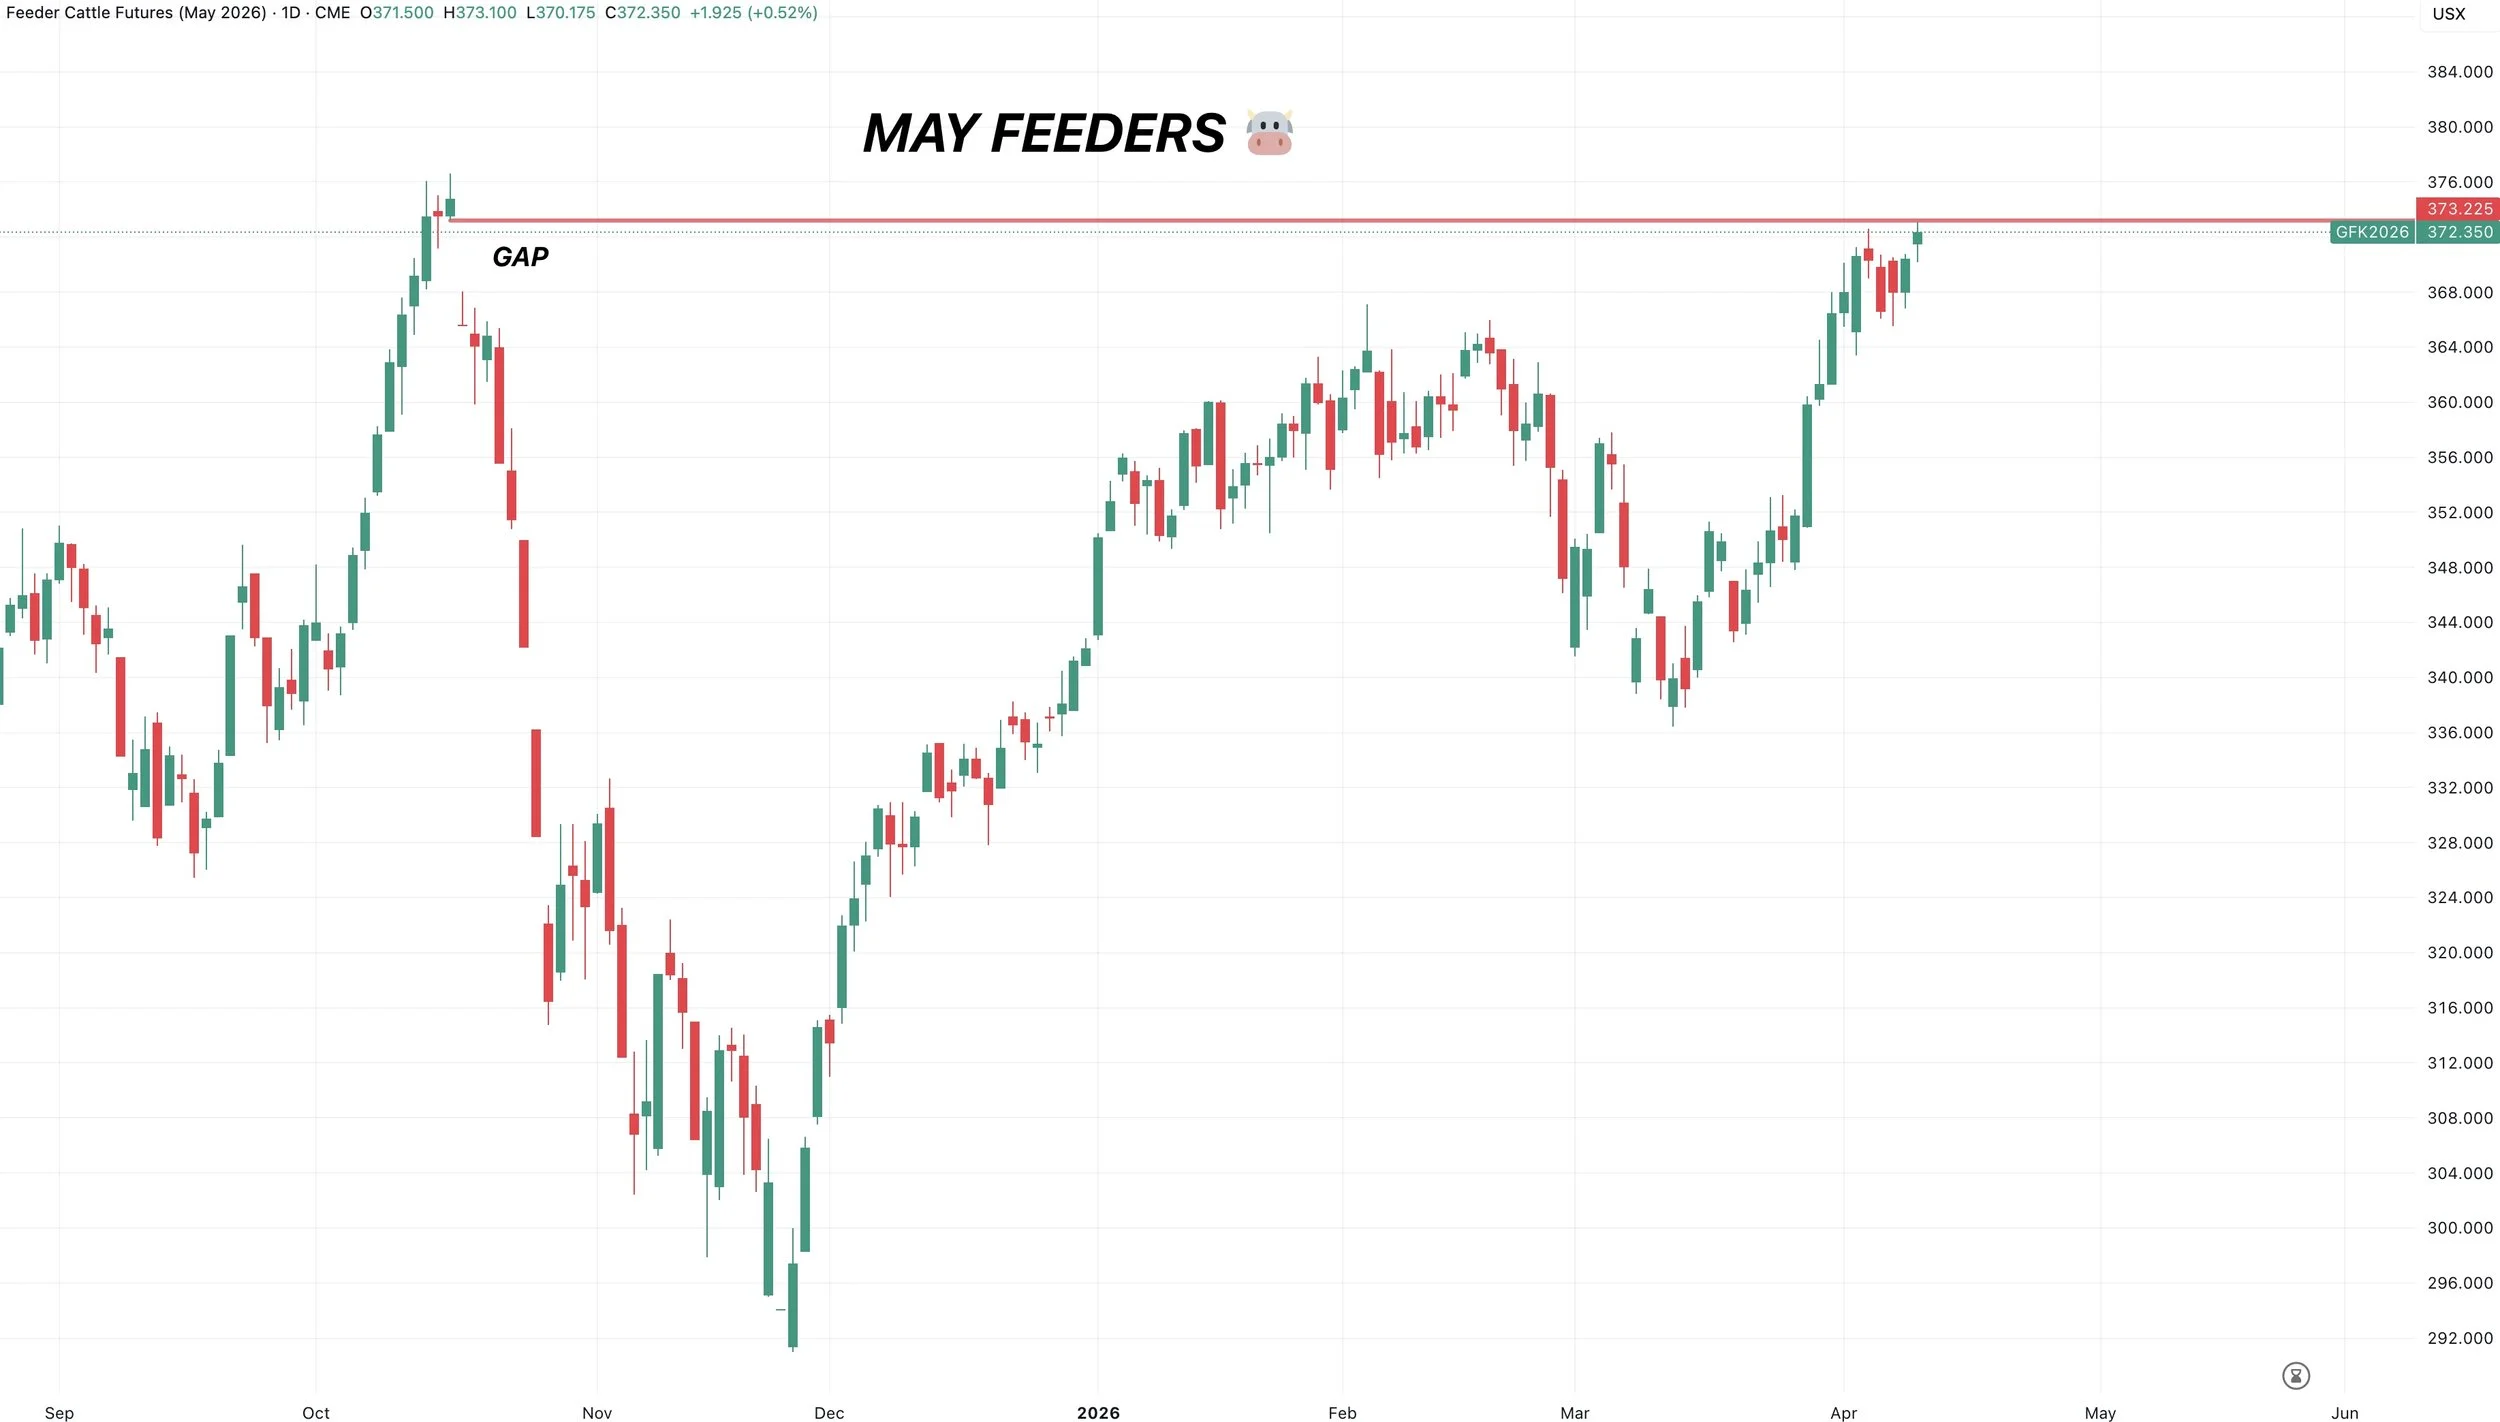
May Feeders Chart:
We still somehow failed to fill the gap today.
As we missed it fractionally.
The gap was at 373.225
Our high today was 373.100
Continuing to fail to fill the gap is disappointing and adds some caution.
But something to note is that every other contract has already managed to fill the gap.
There isn’t anything fundamentally or technically saying we can’t push higher, as it feels like this market wants to.
It just simply makes sense to have some protection at these levels if you don’t.
Want to Talk?
Our phones are open 24/7 for you guys if you ever need anything or want to discuss your operation.
Jeremey & Office: (806)484-1214
Sebastian: (605)280-1186
Email: sfrost@dailymarketminute.com
Hedge Account
Interested in a hedge account? Use the link below to set up an account or give us a call.
Recent Signals
March 19th, 2026: 🌱
New crop soybeans signal & hedge alert.
CLICK HERE TO VIEW
March 9th, 2026: 🌱
Soybeans signal & hedge alert. Sent via text.
March 6th, 2026: 🌽 🌾
Corn & wheat sell signal & hedge alert.
March 3rd, 2026: 🌽
Old crop & new crop corn sell signal & hedge alert.
Feb 26th, 2026: 🌱
Old crop & new crop beans sell signal & hedge alert.
Feb 19th, 2026: 🌾
KC wheat sell signal & hedge alert.
Feb 6th, 2026: 🌽 🌱
Old crop corn & soybean sell signal & hedge alert.
Feb 4th, 2026: 🌱
Soybean sell signal & hedge alert.
Nov 17th, 2025: 🌱
Soybean sell signal & hedge alert.