
LONG TERM POTENTIAL VS SHORT TERM RISK
AUDIO COMMENTARY
Catch up corn signal following buy signal
Corn marketing based on situation
Corn hitting golden zone (charts below)*
Long term there is friendly outcomes that could potentially develop down the road
Planting came in around expectations
Iowa way behind in planting
Exports are great, but starting to slow down
Feels like SA won’t be exporting ton of corn given their domestic demand and some potential concerns
Rumors of China looking for old crop beans
Wheat crop conditions unchanged but some poor to very poor ratings jumped
If you are struggling to get contracts rolled and don’t think you’ll have something
When will weather premium be built in?
Some strategies to consider in corn
Full chart breakdowns below*
Listen to today’s audio below
Want to talk?
Office: (806)484-1214
CHART BREAKDOWNS
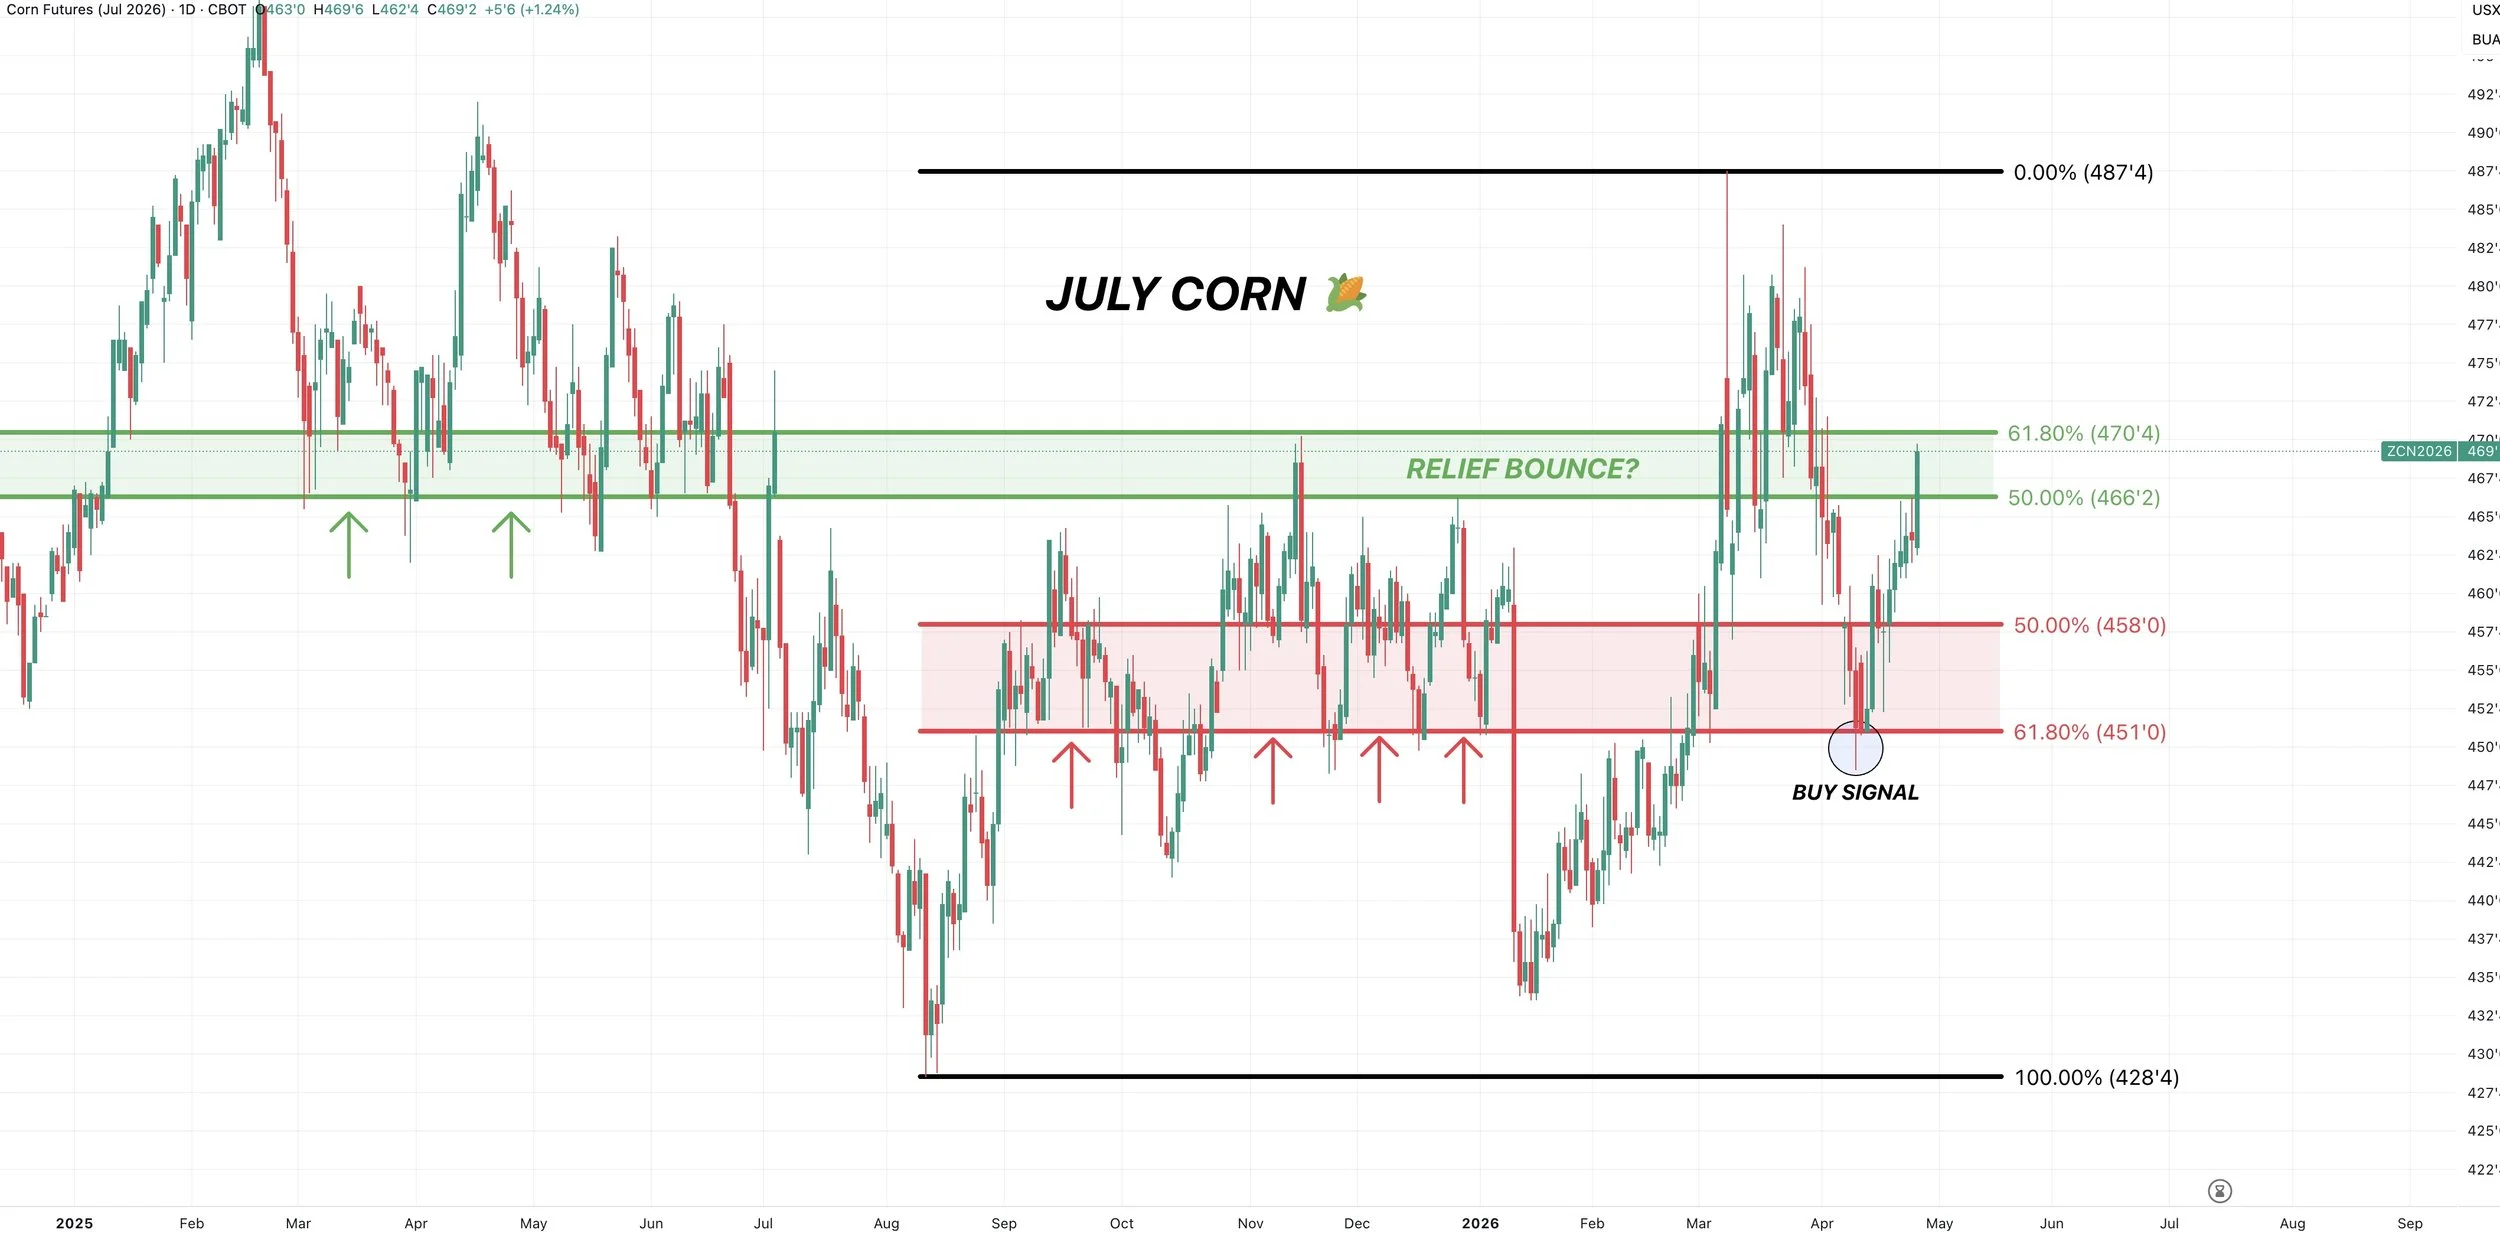
July Corn 🌽
We bounced right off the 61.8% level and old support from fall.
We’ve now rallied nicely. Sitting right in the golden zone.
This is a big area. This is where the market typically makes a decision.
It decides if this is simply a dead cat bounce or the start of a bigger rally, and if it’s time to go challenge the highs or not. As if this is a dead cat bounce, this is usually where they fail.
This level was also resistance last fall, as well as support from last spring. Another reason why it’s a big level.
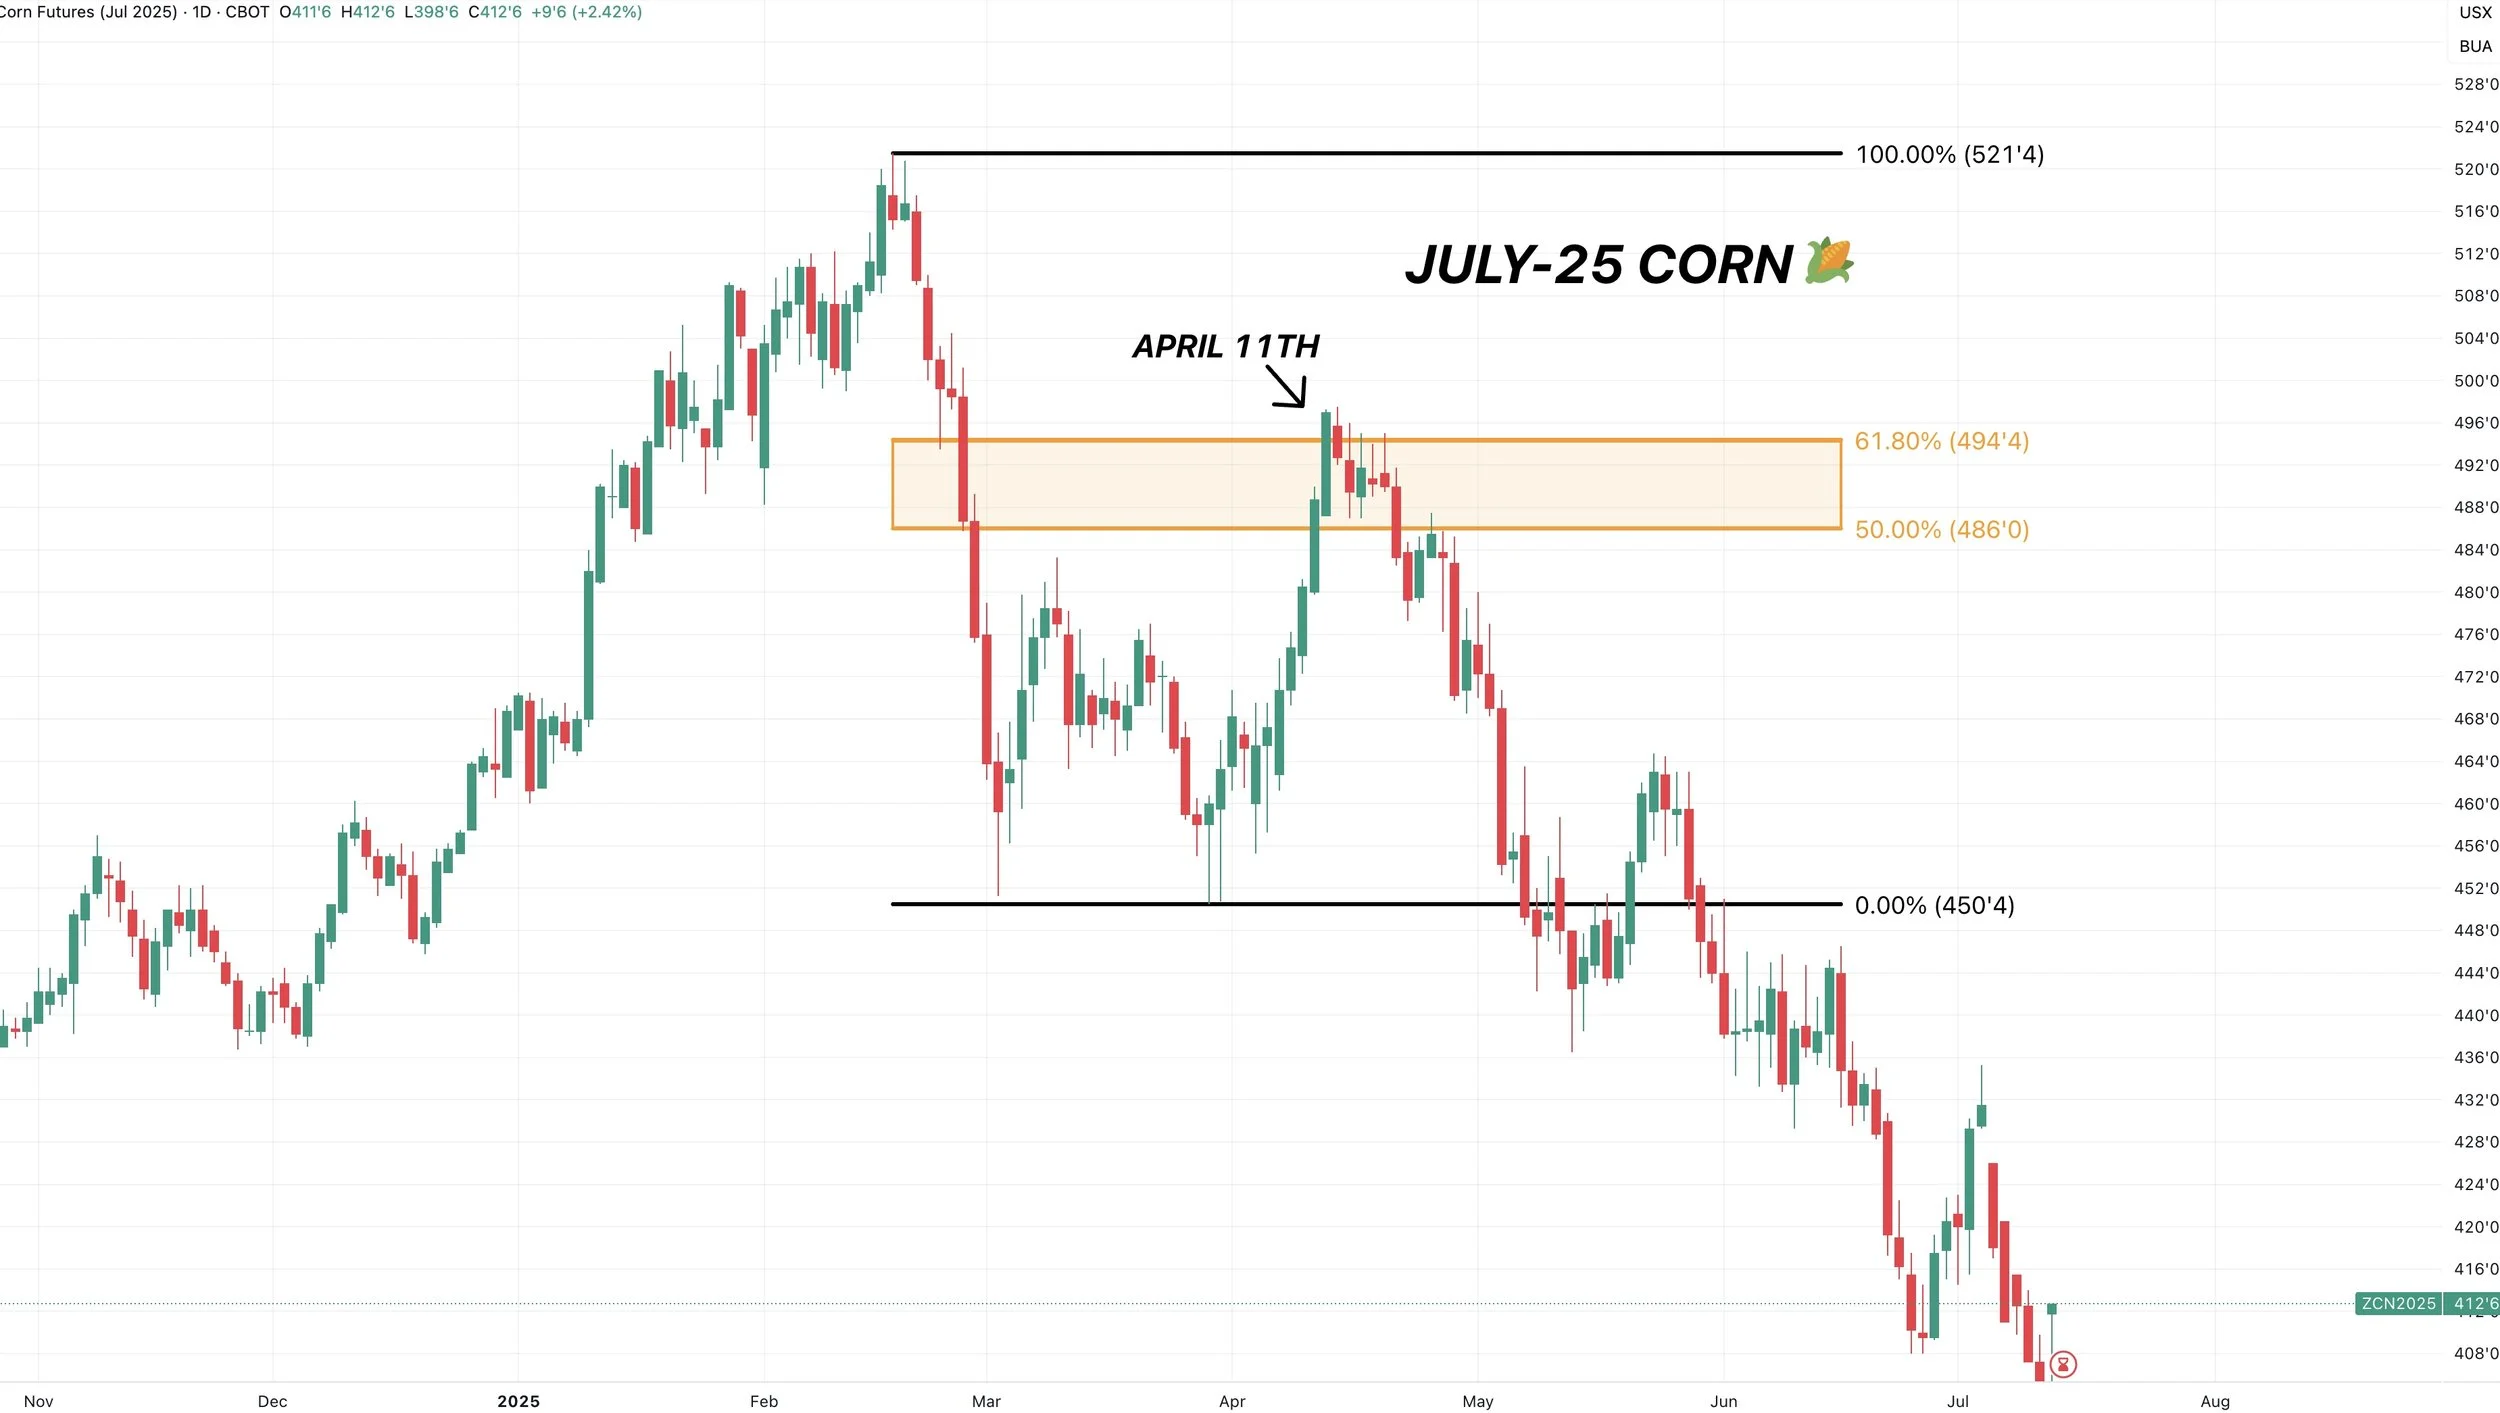
July Corn 2025 🌽
Here is July corn from last year.
This year and last year are completely different scenarios.
But I just wanted to point out that last year in April, we clawed back 61.8% of the Feb highs before failing.
It doesn’t have to play out this way again, and I don’t personally think it does, but it is something to note.
This is where the market usually makes that decision. If this is simply a relief bounce or not.
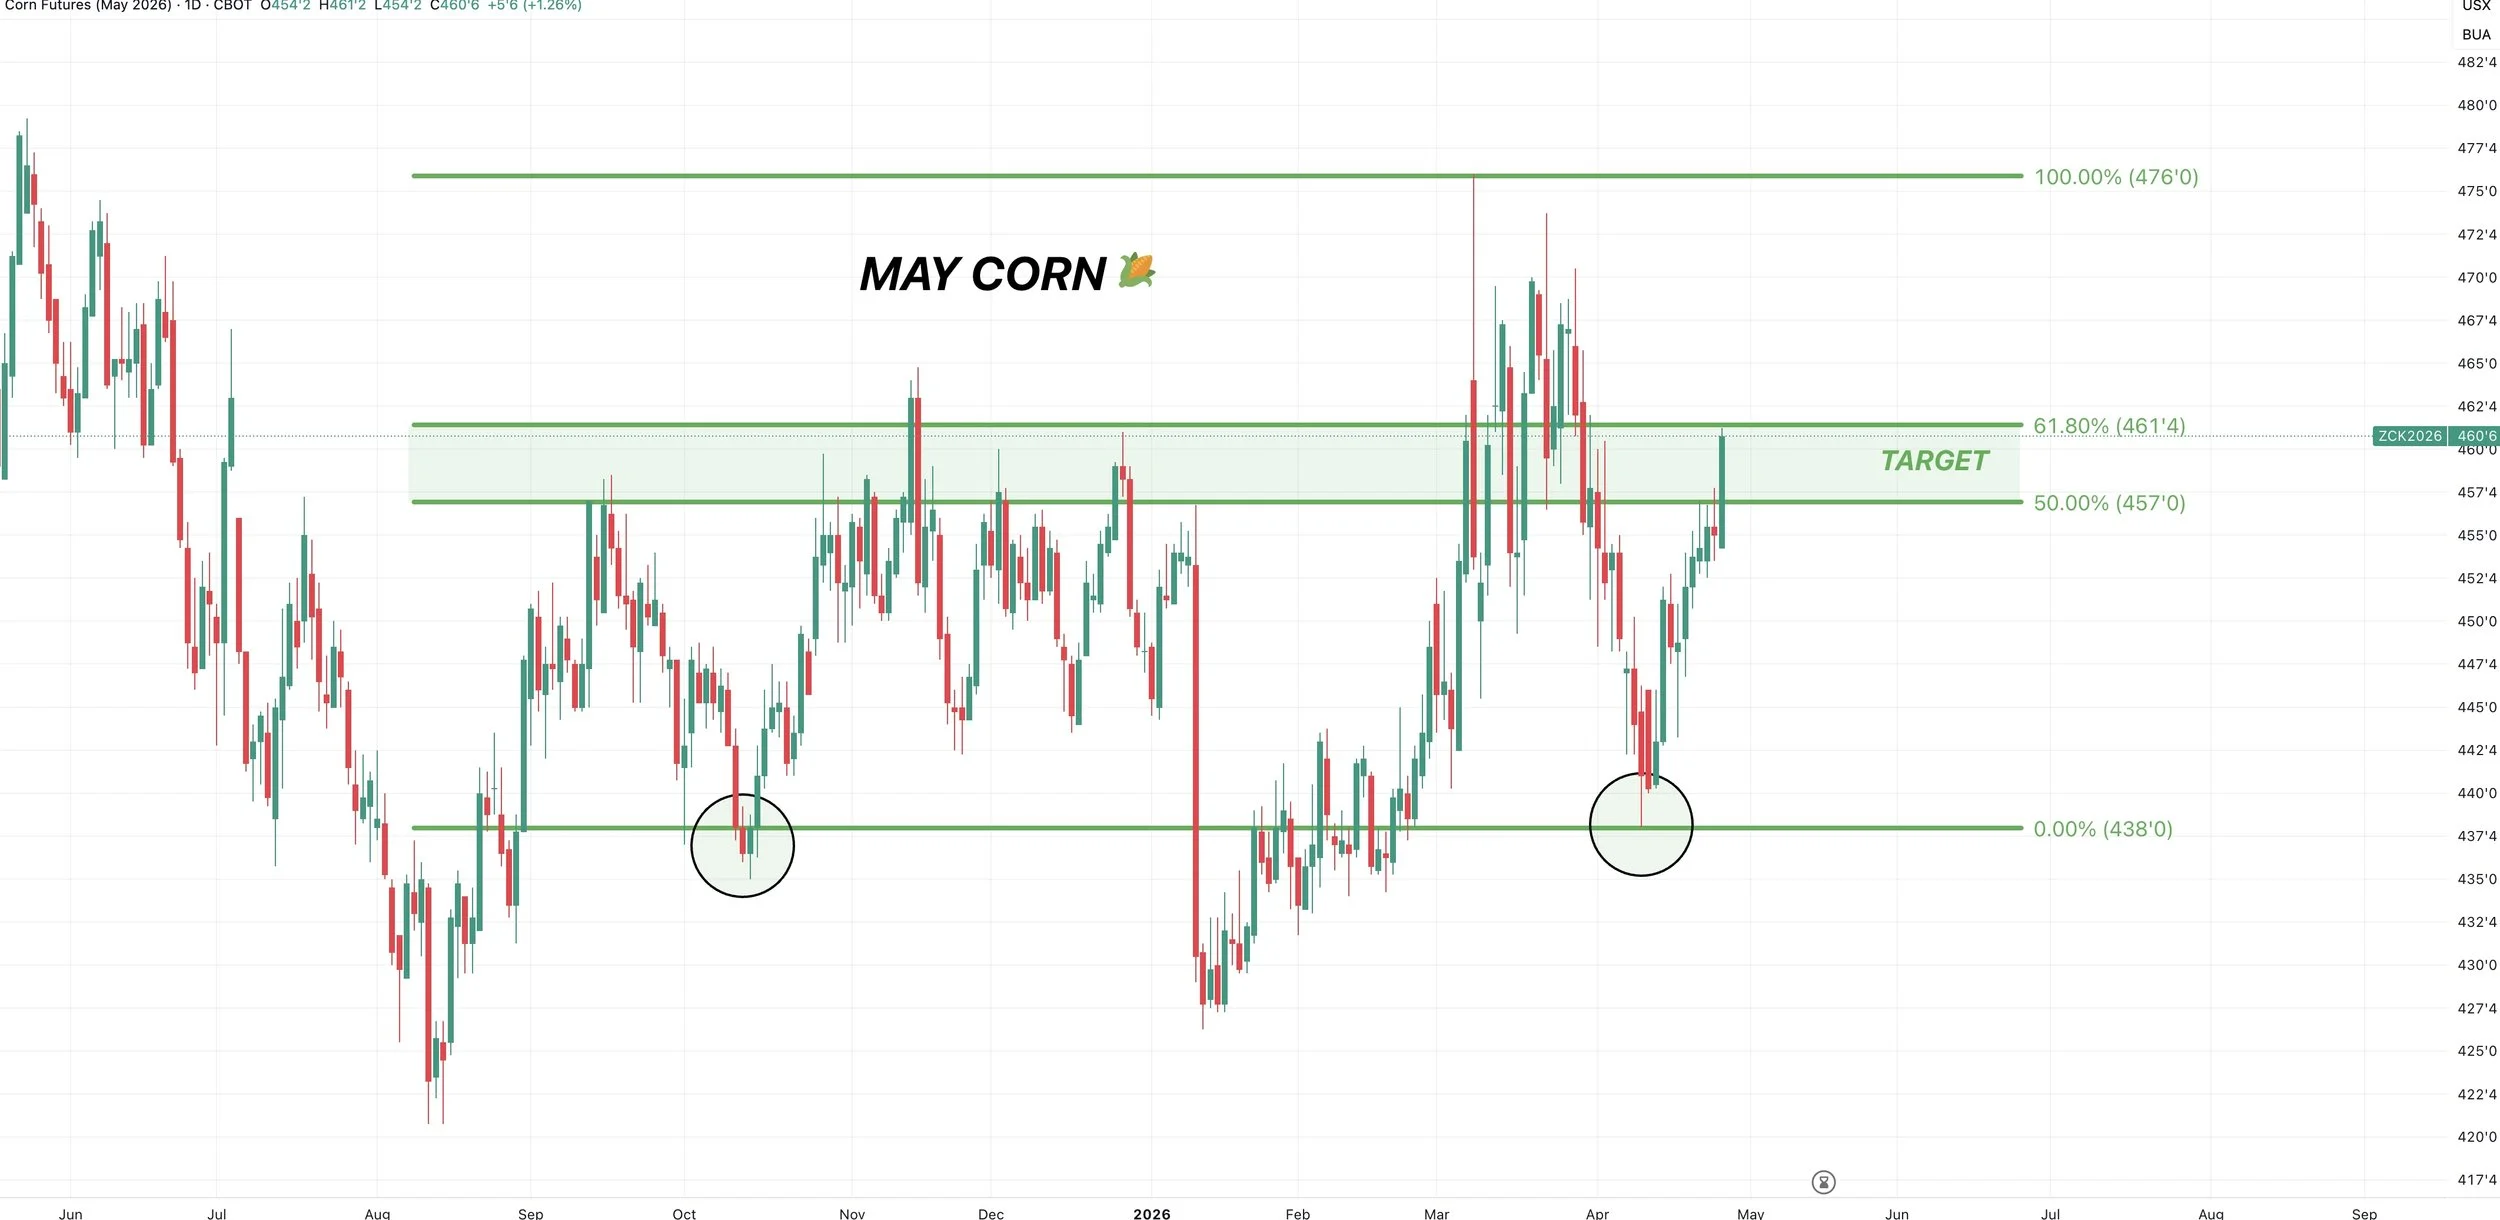
May Corn 🌽
The focus has shifted to July corn now.
But May also clawed back 61.8% of the highs.
This is the decision area.
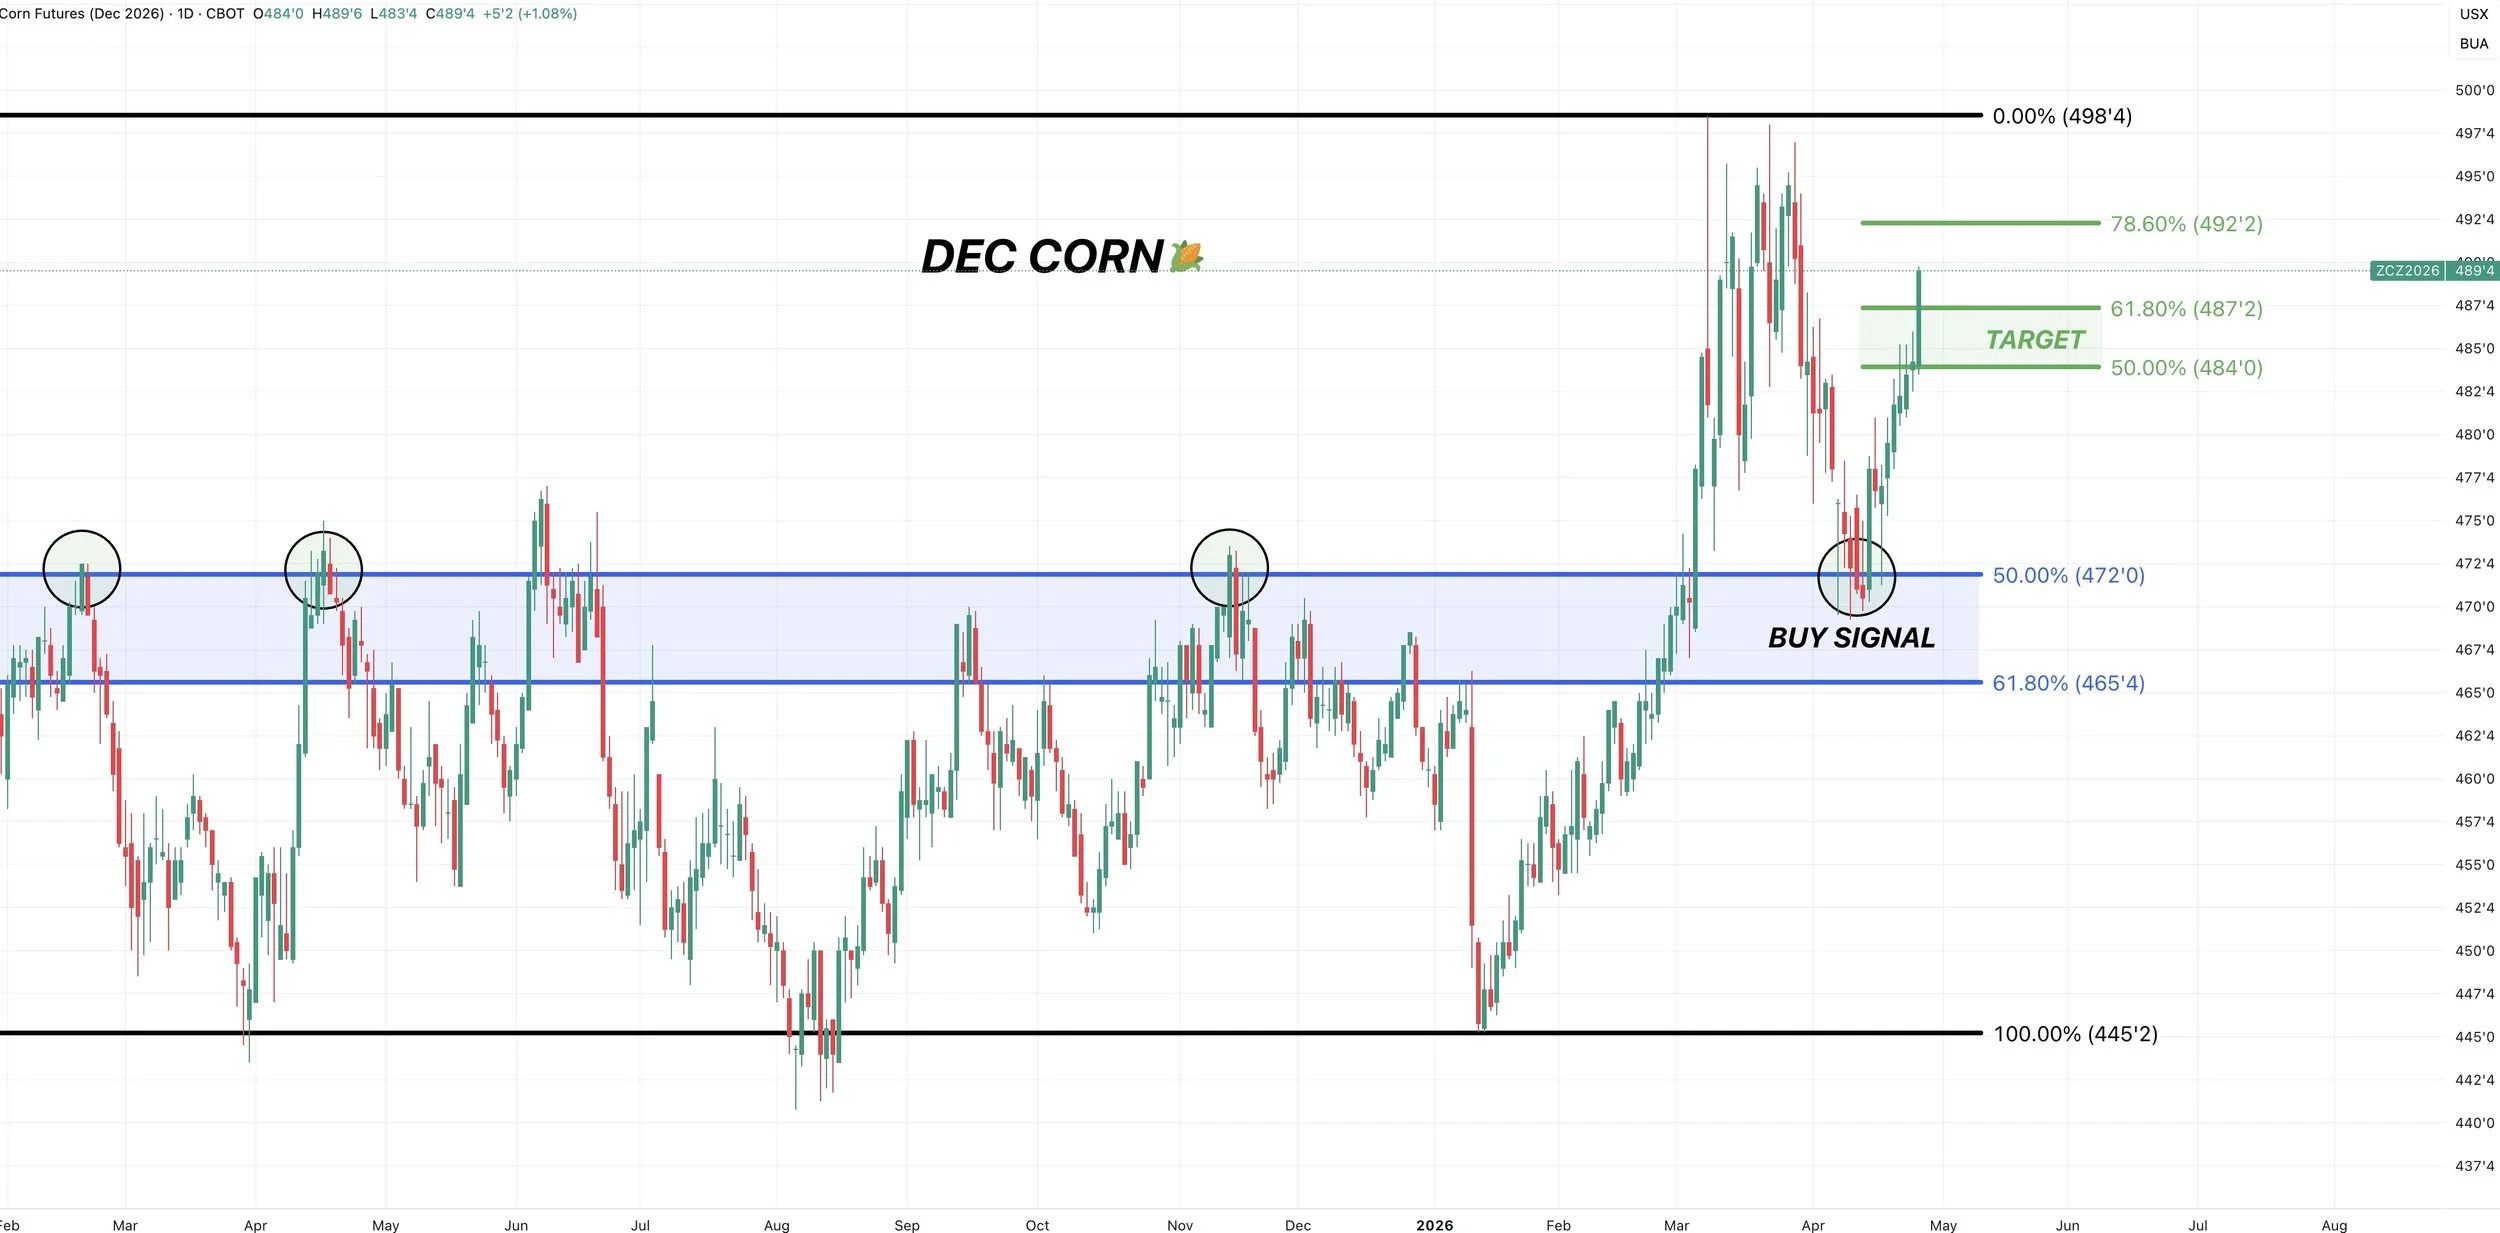
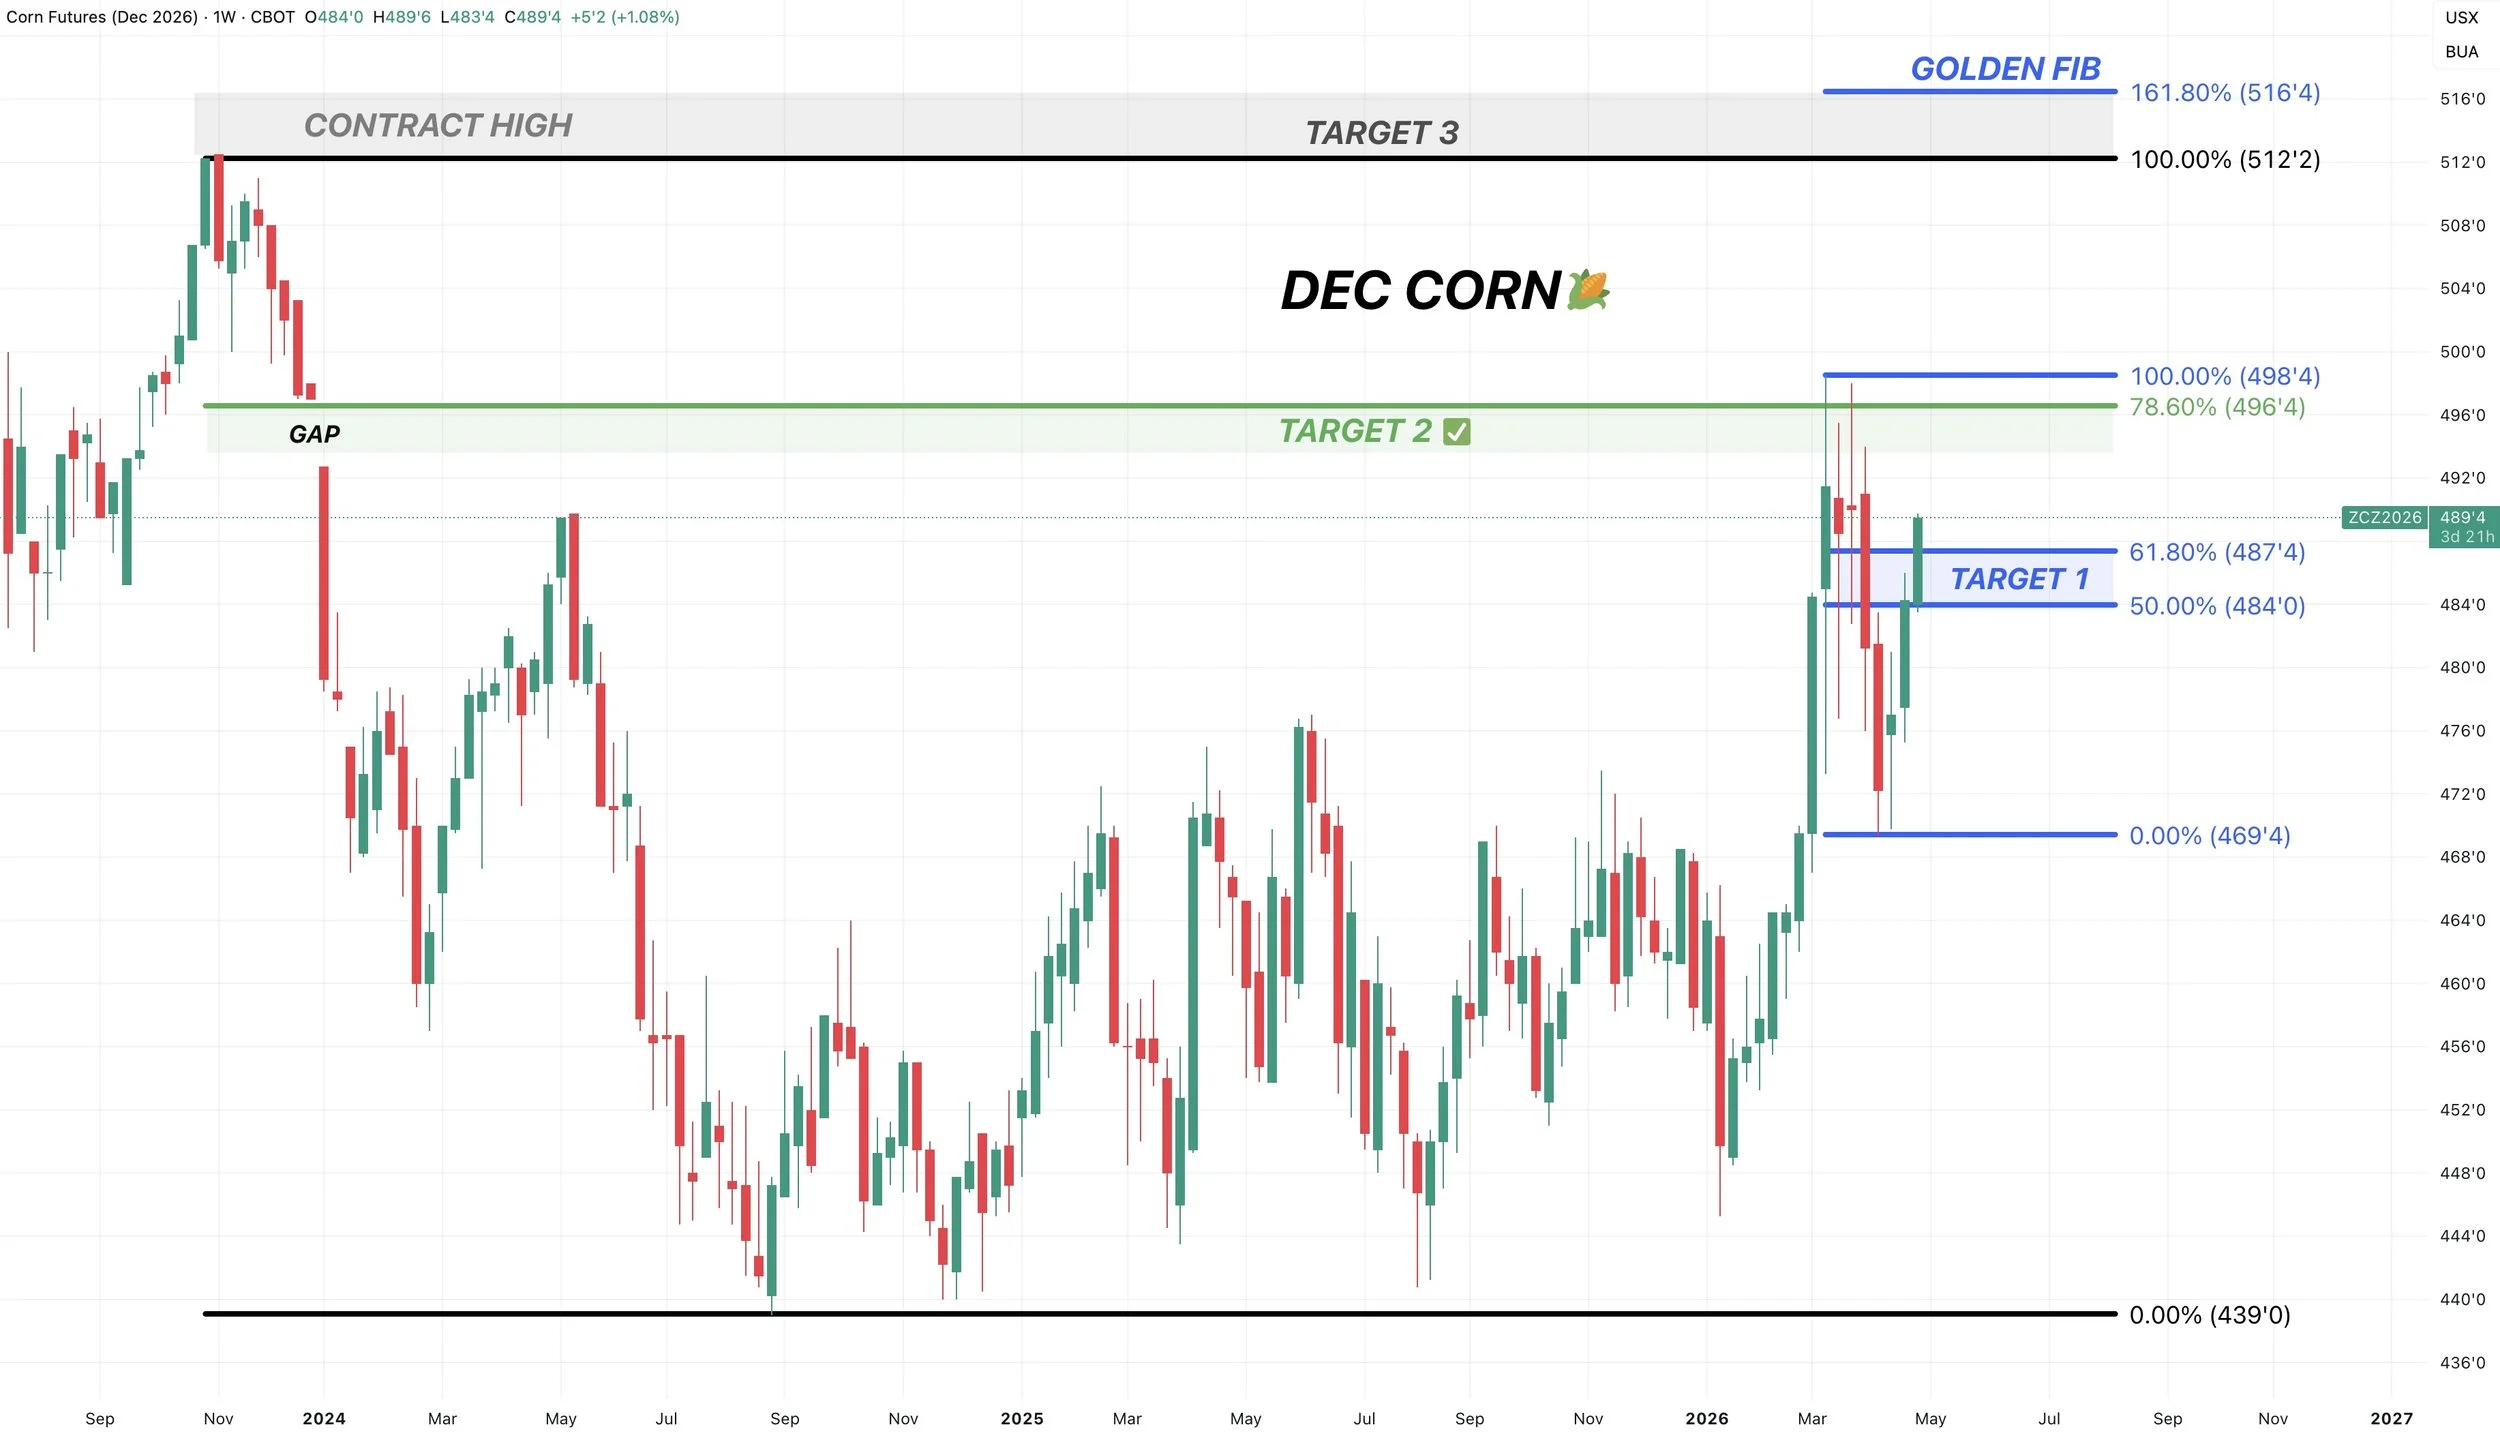
Dec Corn 🌽
We’ve seen a nice rally following the April 10th buy alert.
We bounced after giving back 50% of the rally. That same level was prior resistance on several occasions last year.
Today we closed just above the 61.8% level.
A relief bounce can overshoot to the 78.6% level, especially if it’s not the front month contract.
But again, if this is a relief bounce, this is where we’d usually struggle.
If not, and we get another day like today, we will probably go test the highs.
Here is the next targets for Dec corn on the weekly chart.
$4.96 is the original target we had back in March if you missed it. Which was 78.6% of the contract highs and the open gap we had.
The secondary target is $5.12-5.15
$5.12 is the contract highs.
$5.15 is the golden fib extension of the recent sell off. Meaning that equals 161.8% of the recent lows up to those March highs. Which is a common continuation target.
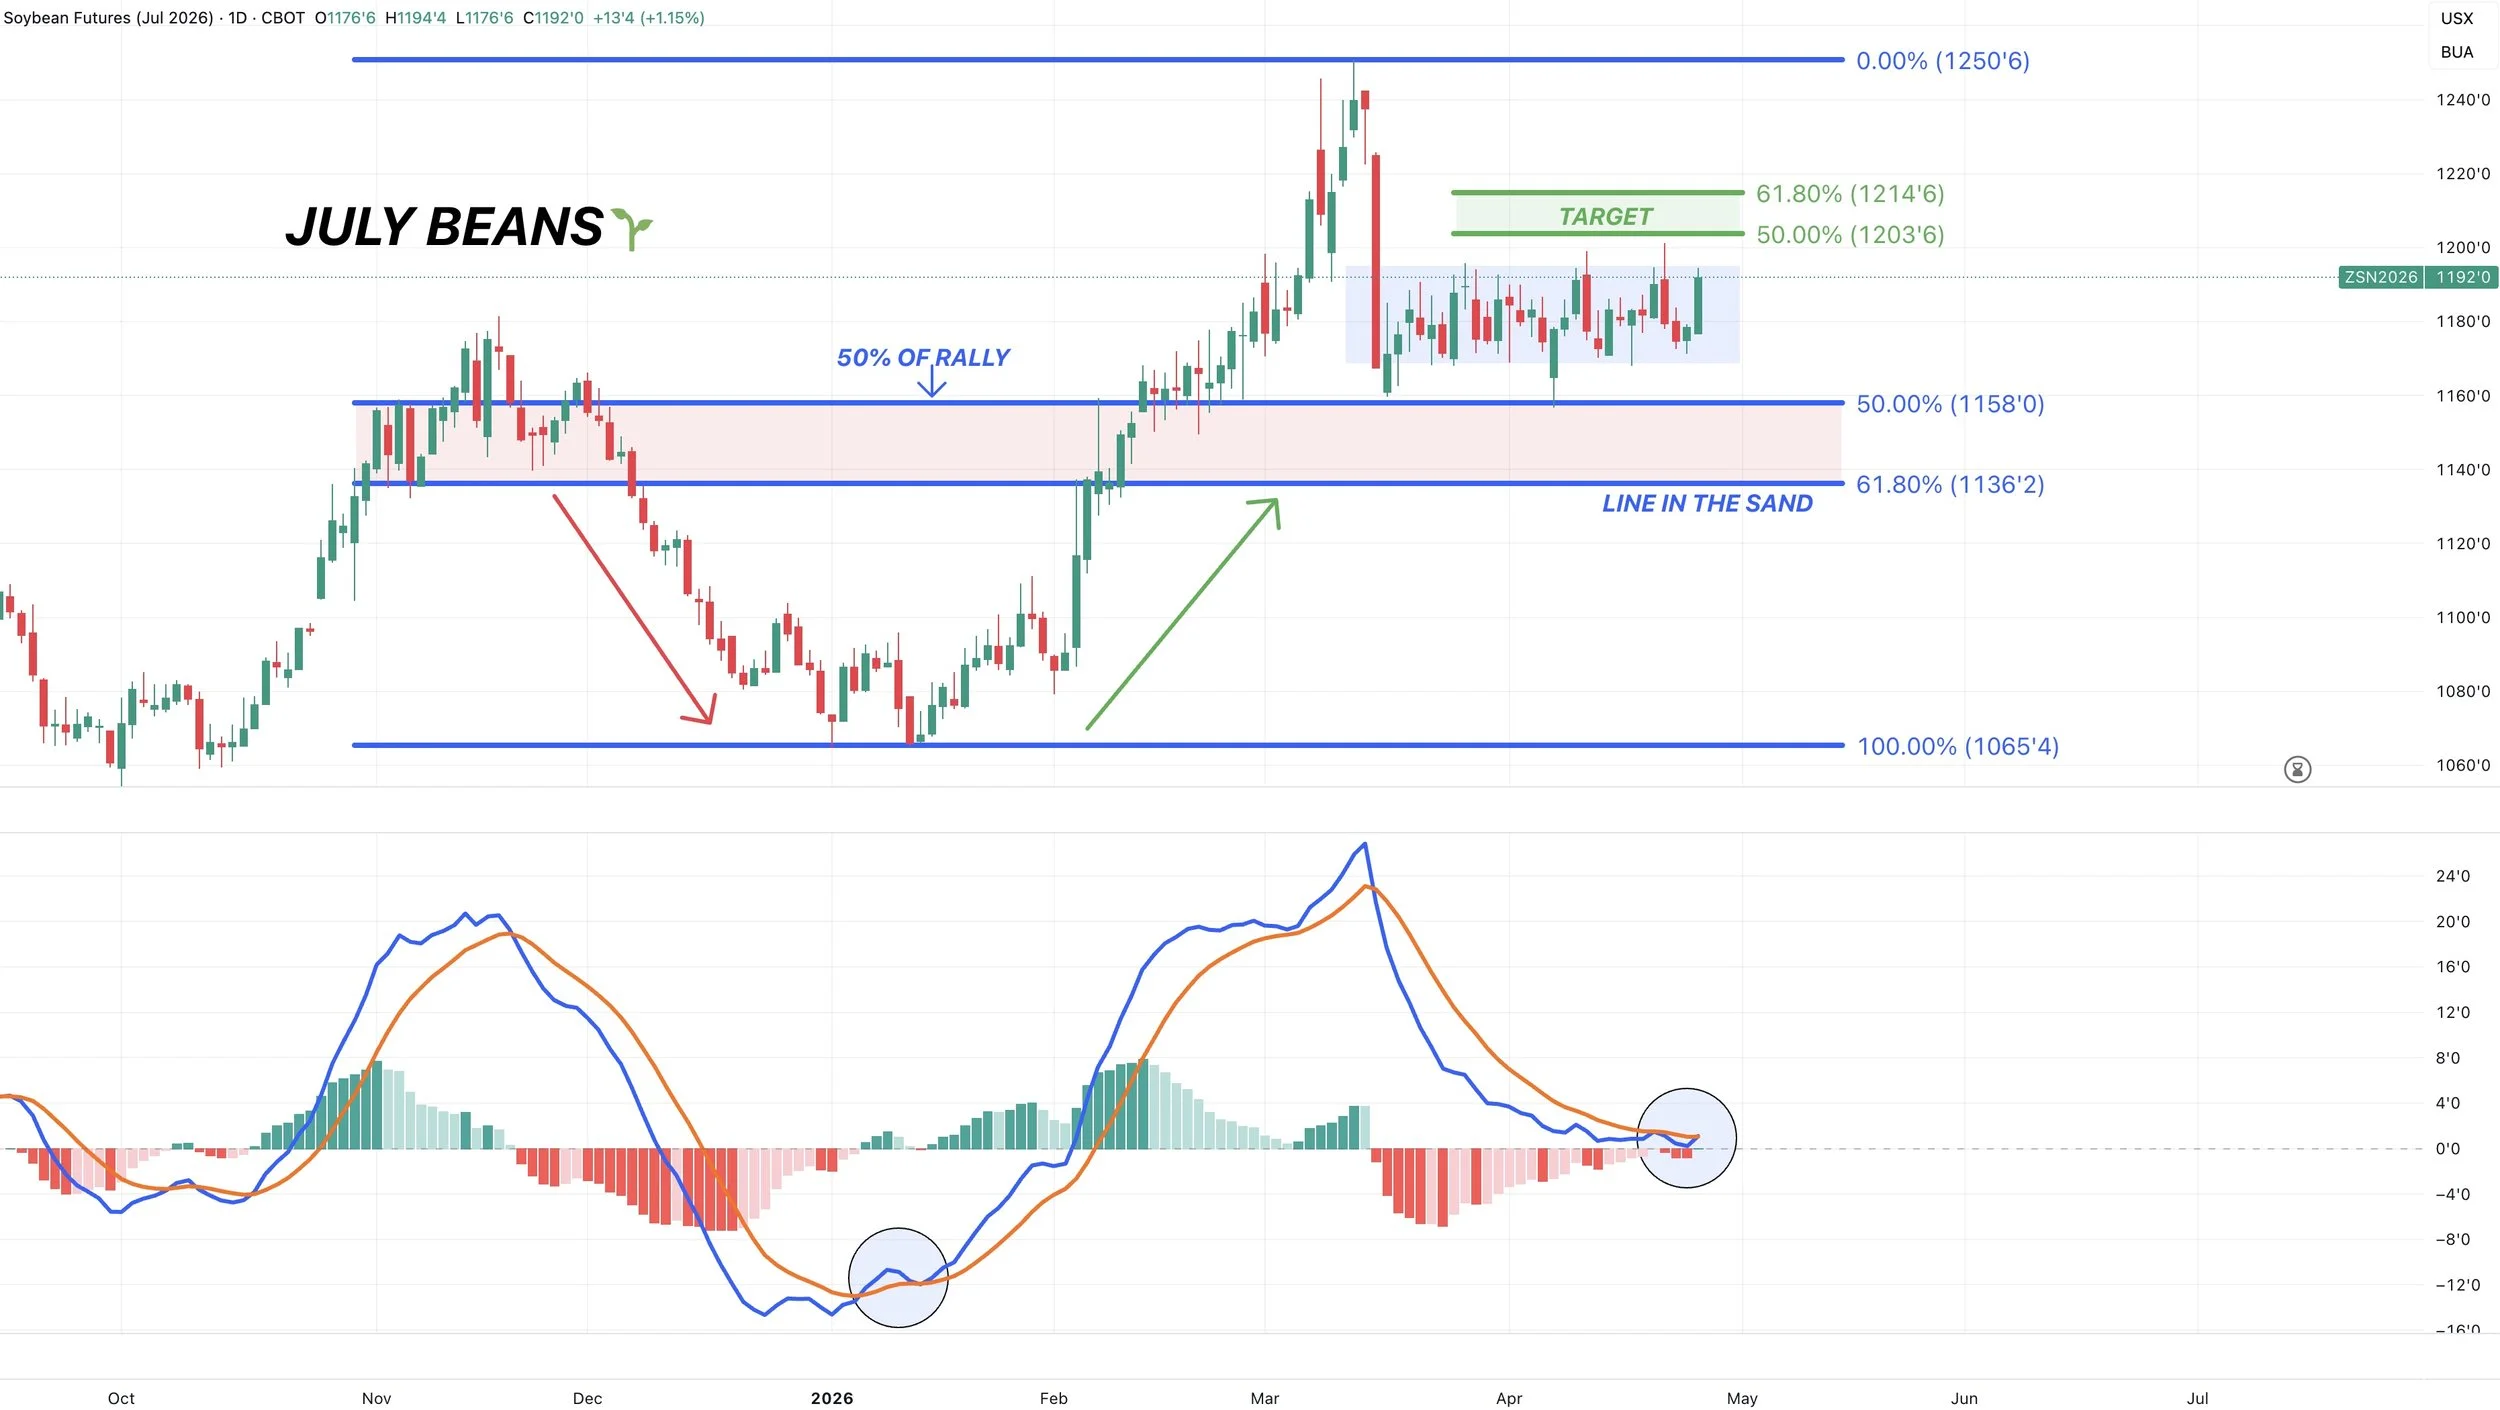
July Beans 🌱
Still completely sideways. Waiting for a breakout either way.
Looking to reward a move towards $12.04 to $12.14 in the golden zone.
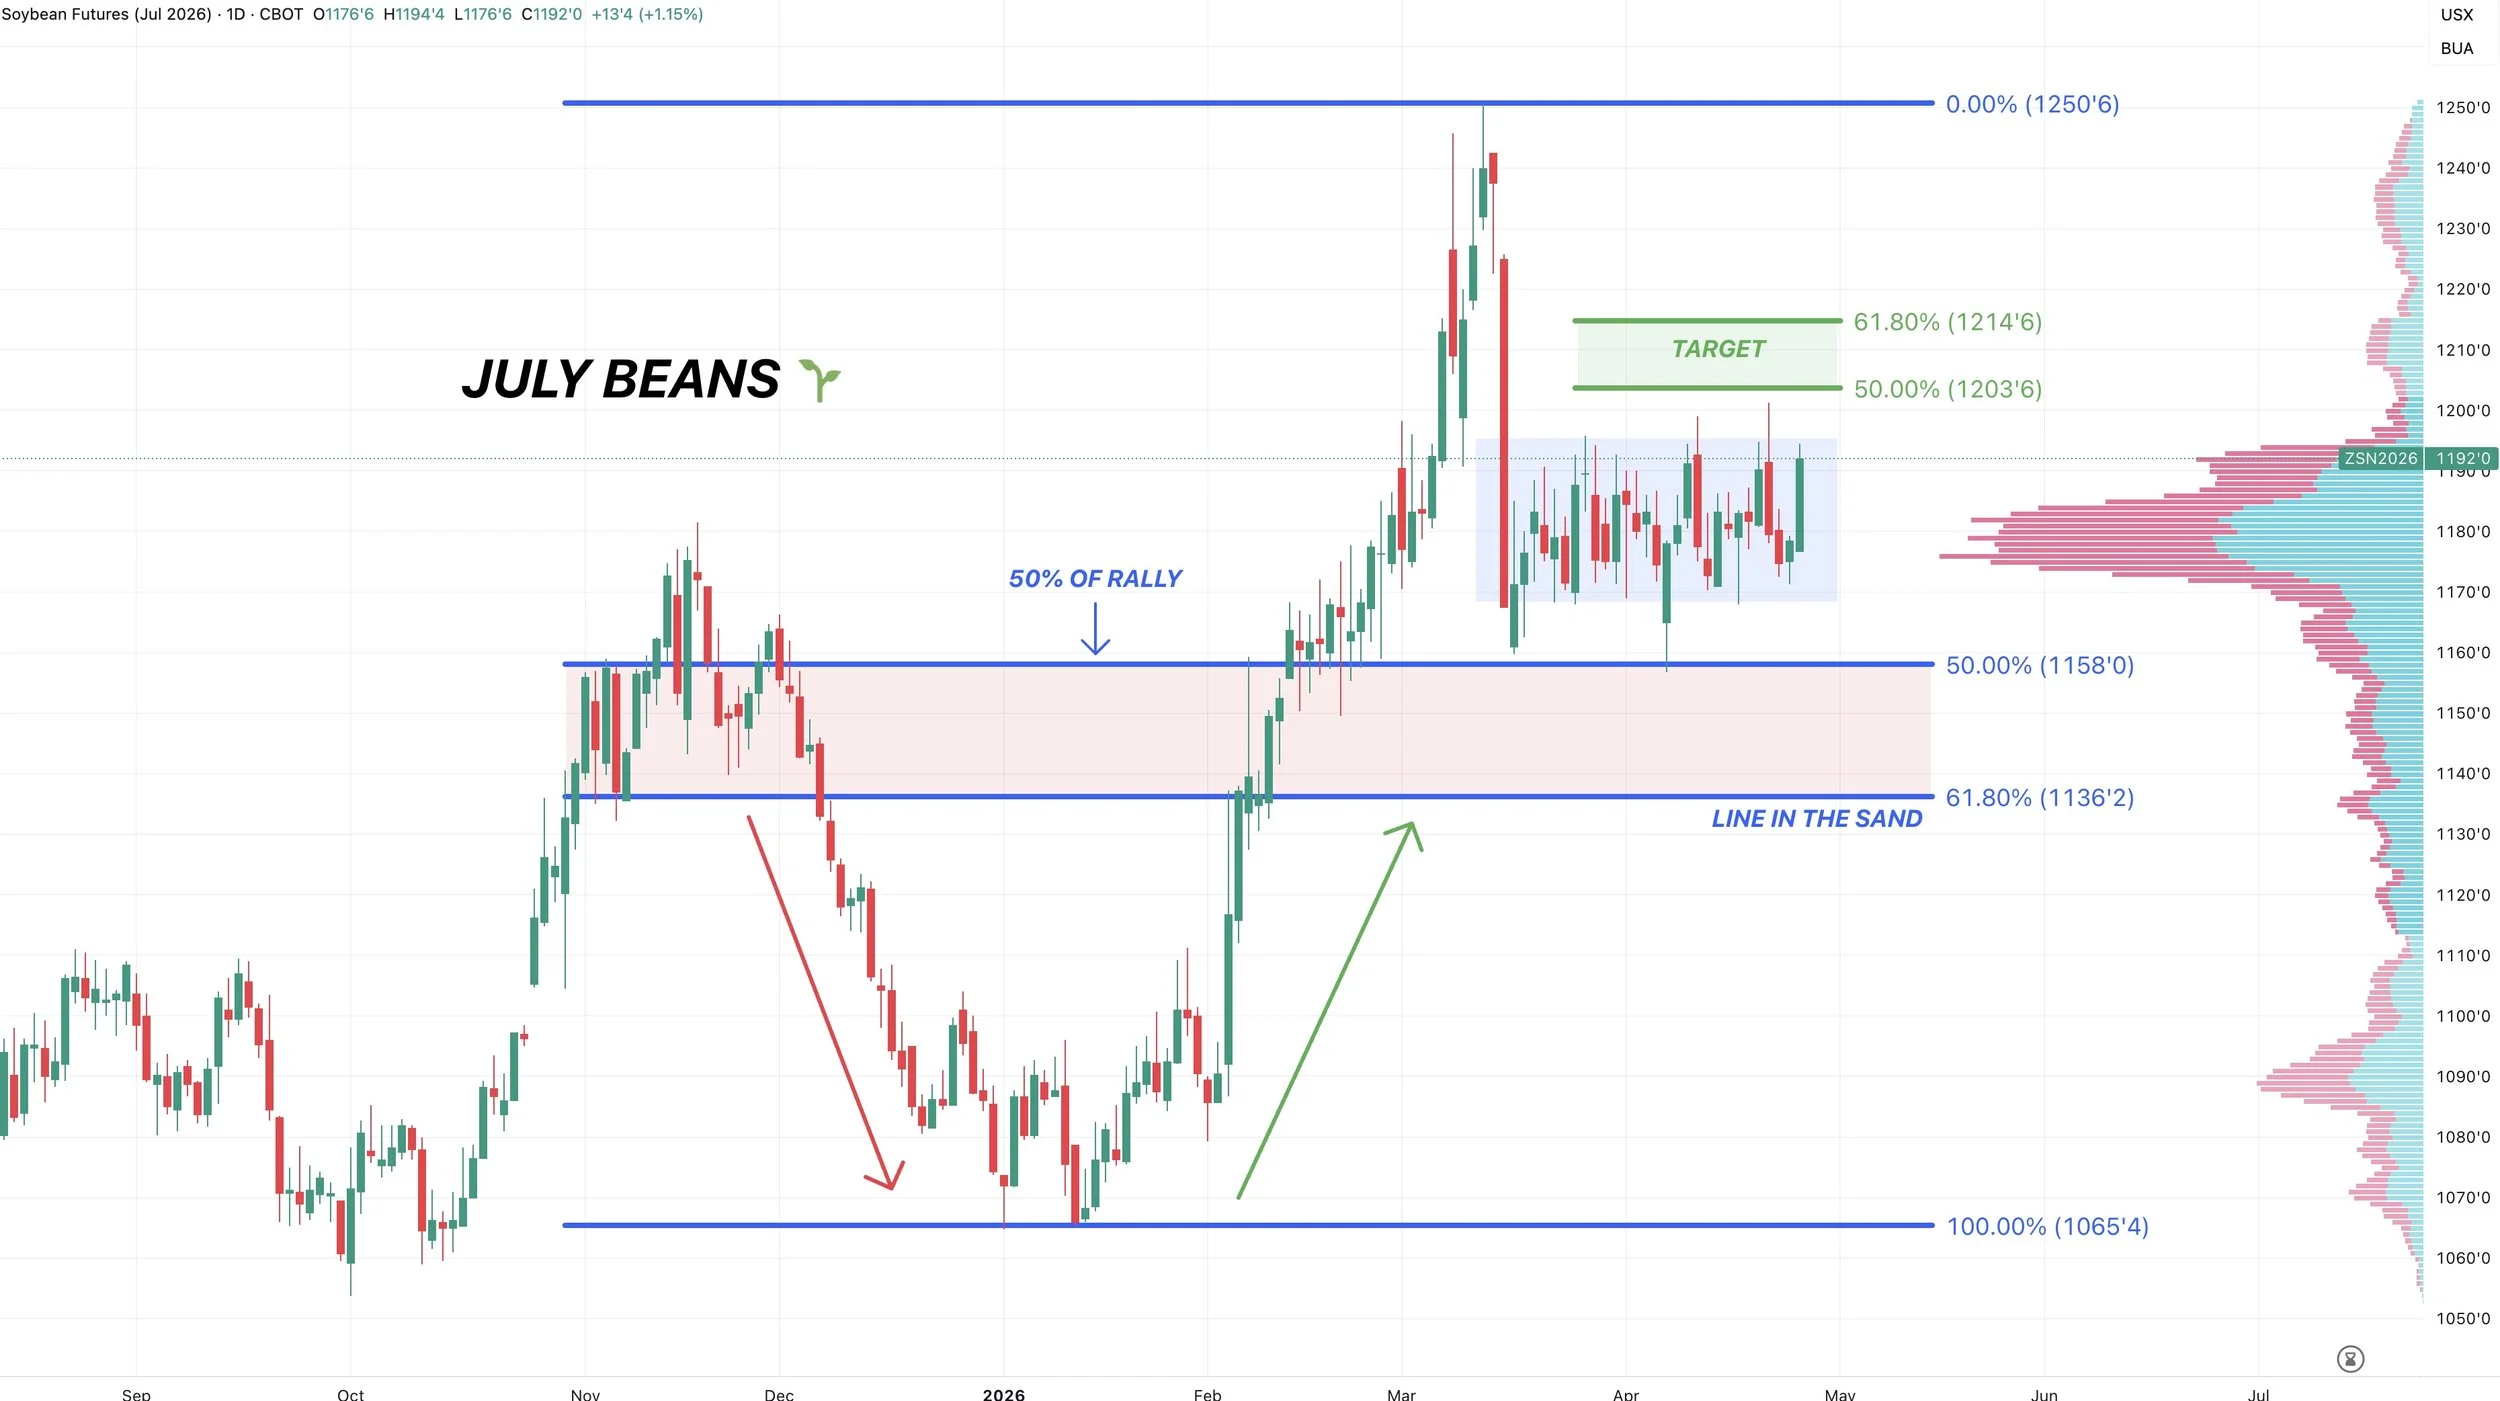
Something to note is that the MACD indicator did almost flip bullish for the first time since those January lows. So that is potentially a good sign, resulting in my personal bias leaning towards a breakout higher not lower.
This thing has coiled for months now, and we should get our answer soon. As we will eventually break from the range.
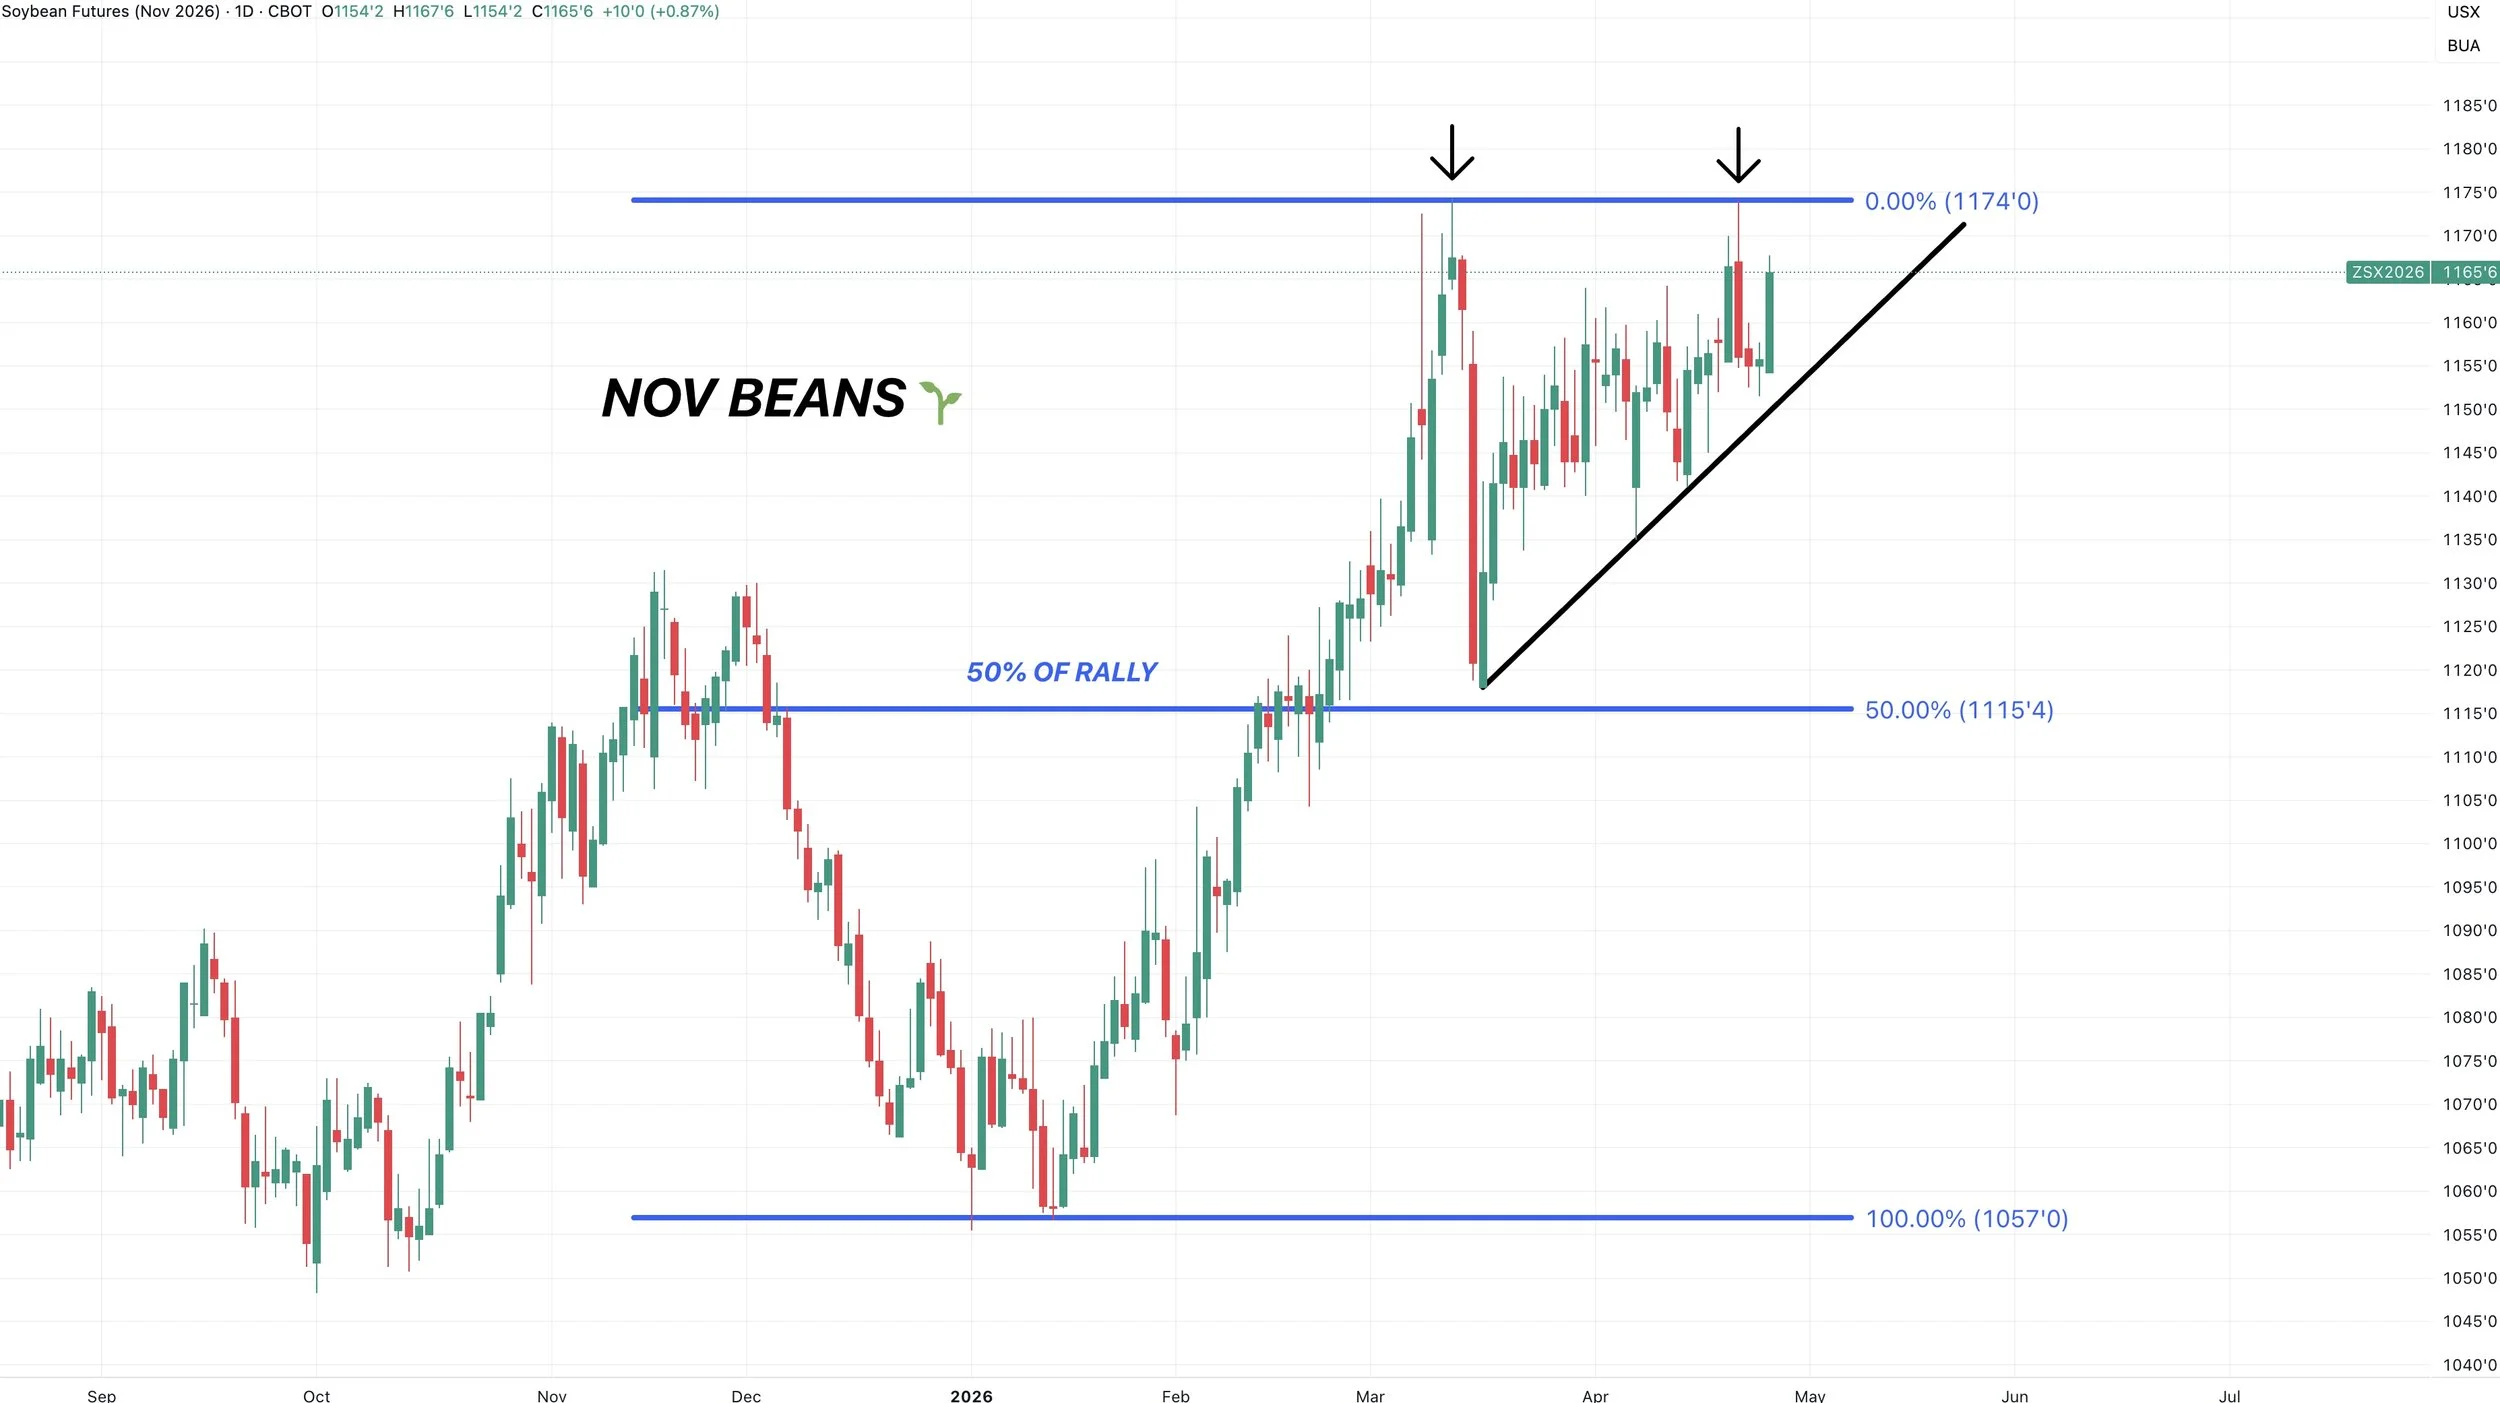
Nov Beans 🌱
We had that double top last week.
If we break above those highs we should have some room to run.
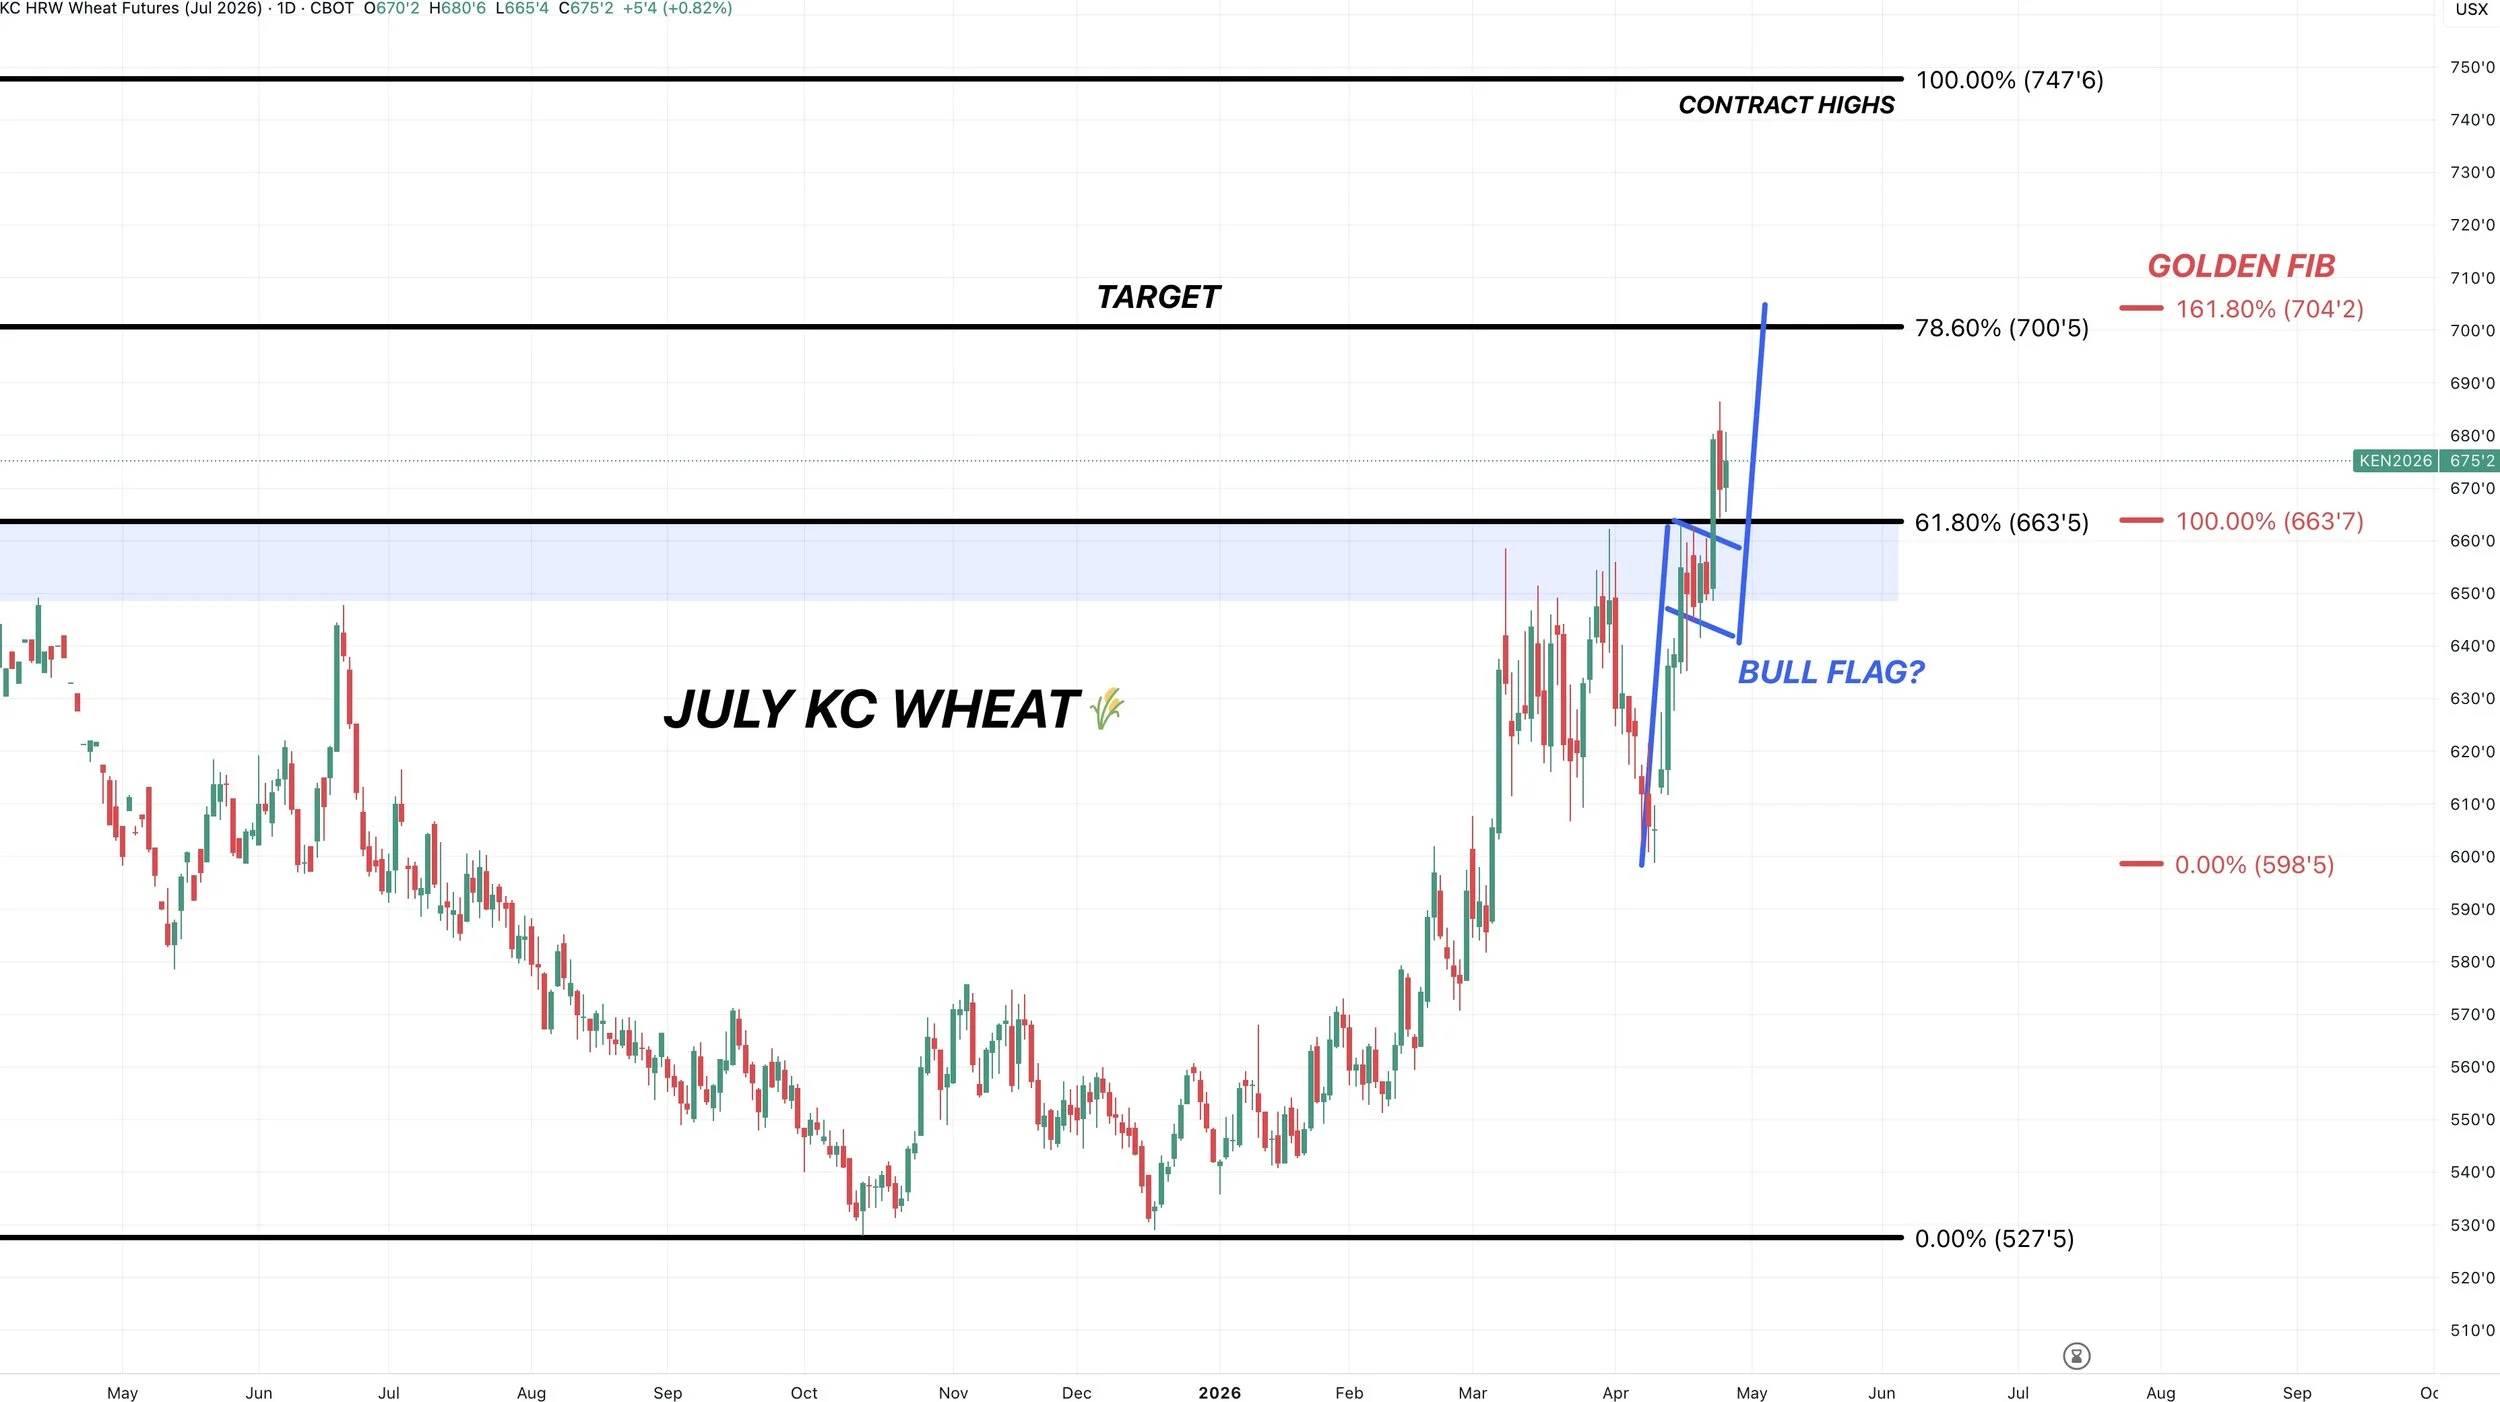
July KC 🌾
We got that break out last week, breaking above where this market struggled to break above on three separate occasions.
It now looks like we back tested that old resistance. So we would like to see us continue to hold above those old highs.
Next target is $7.00
That is the implied move from the potential bull flag.
That is the next retracement level up to contract highs. The orginal rally failed at the 61.8% level. The next level is the 78.6% level at $7.00
$7.00 is also the golden fib extension. 161.8% of the recent lows up to the March highs.
So quiet a few different reasons to have your eyes on $7.00
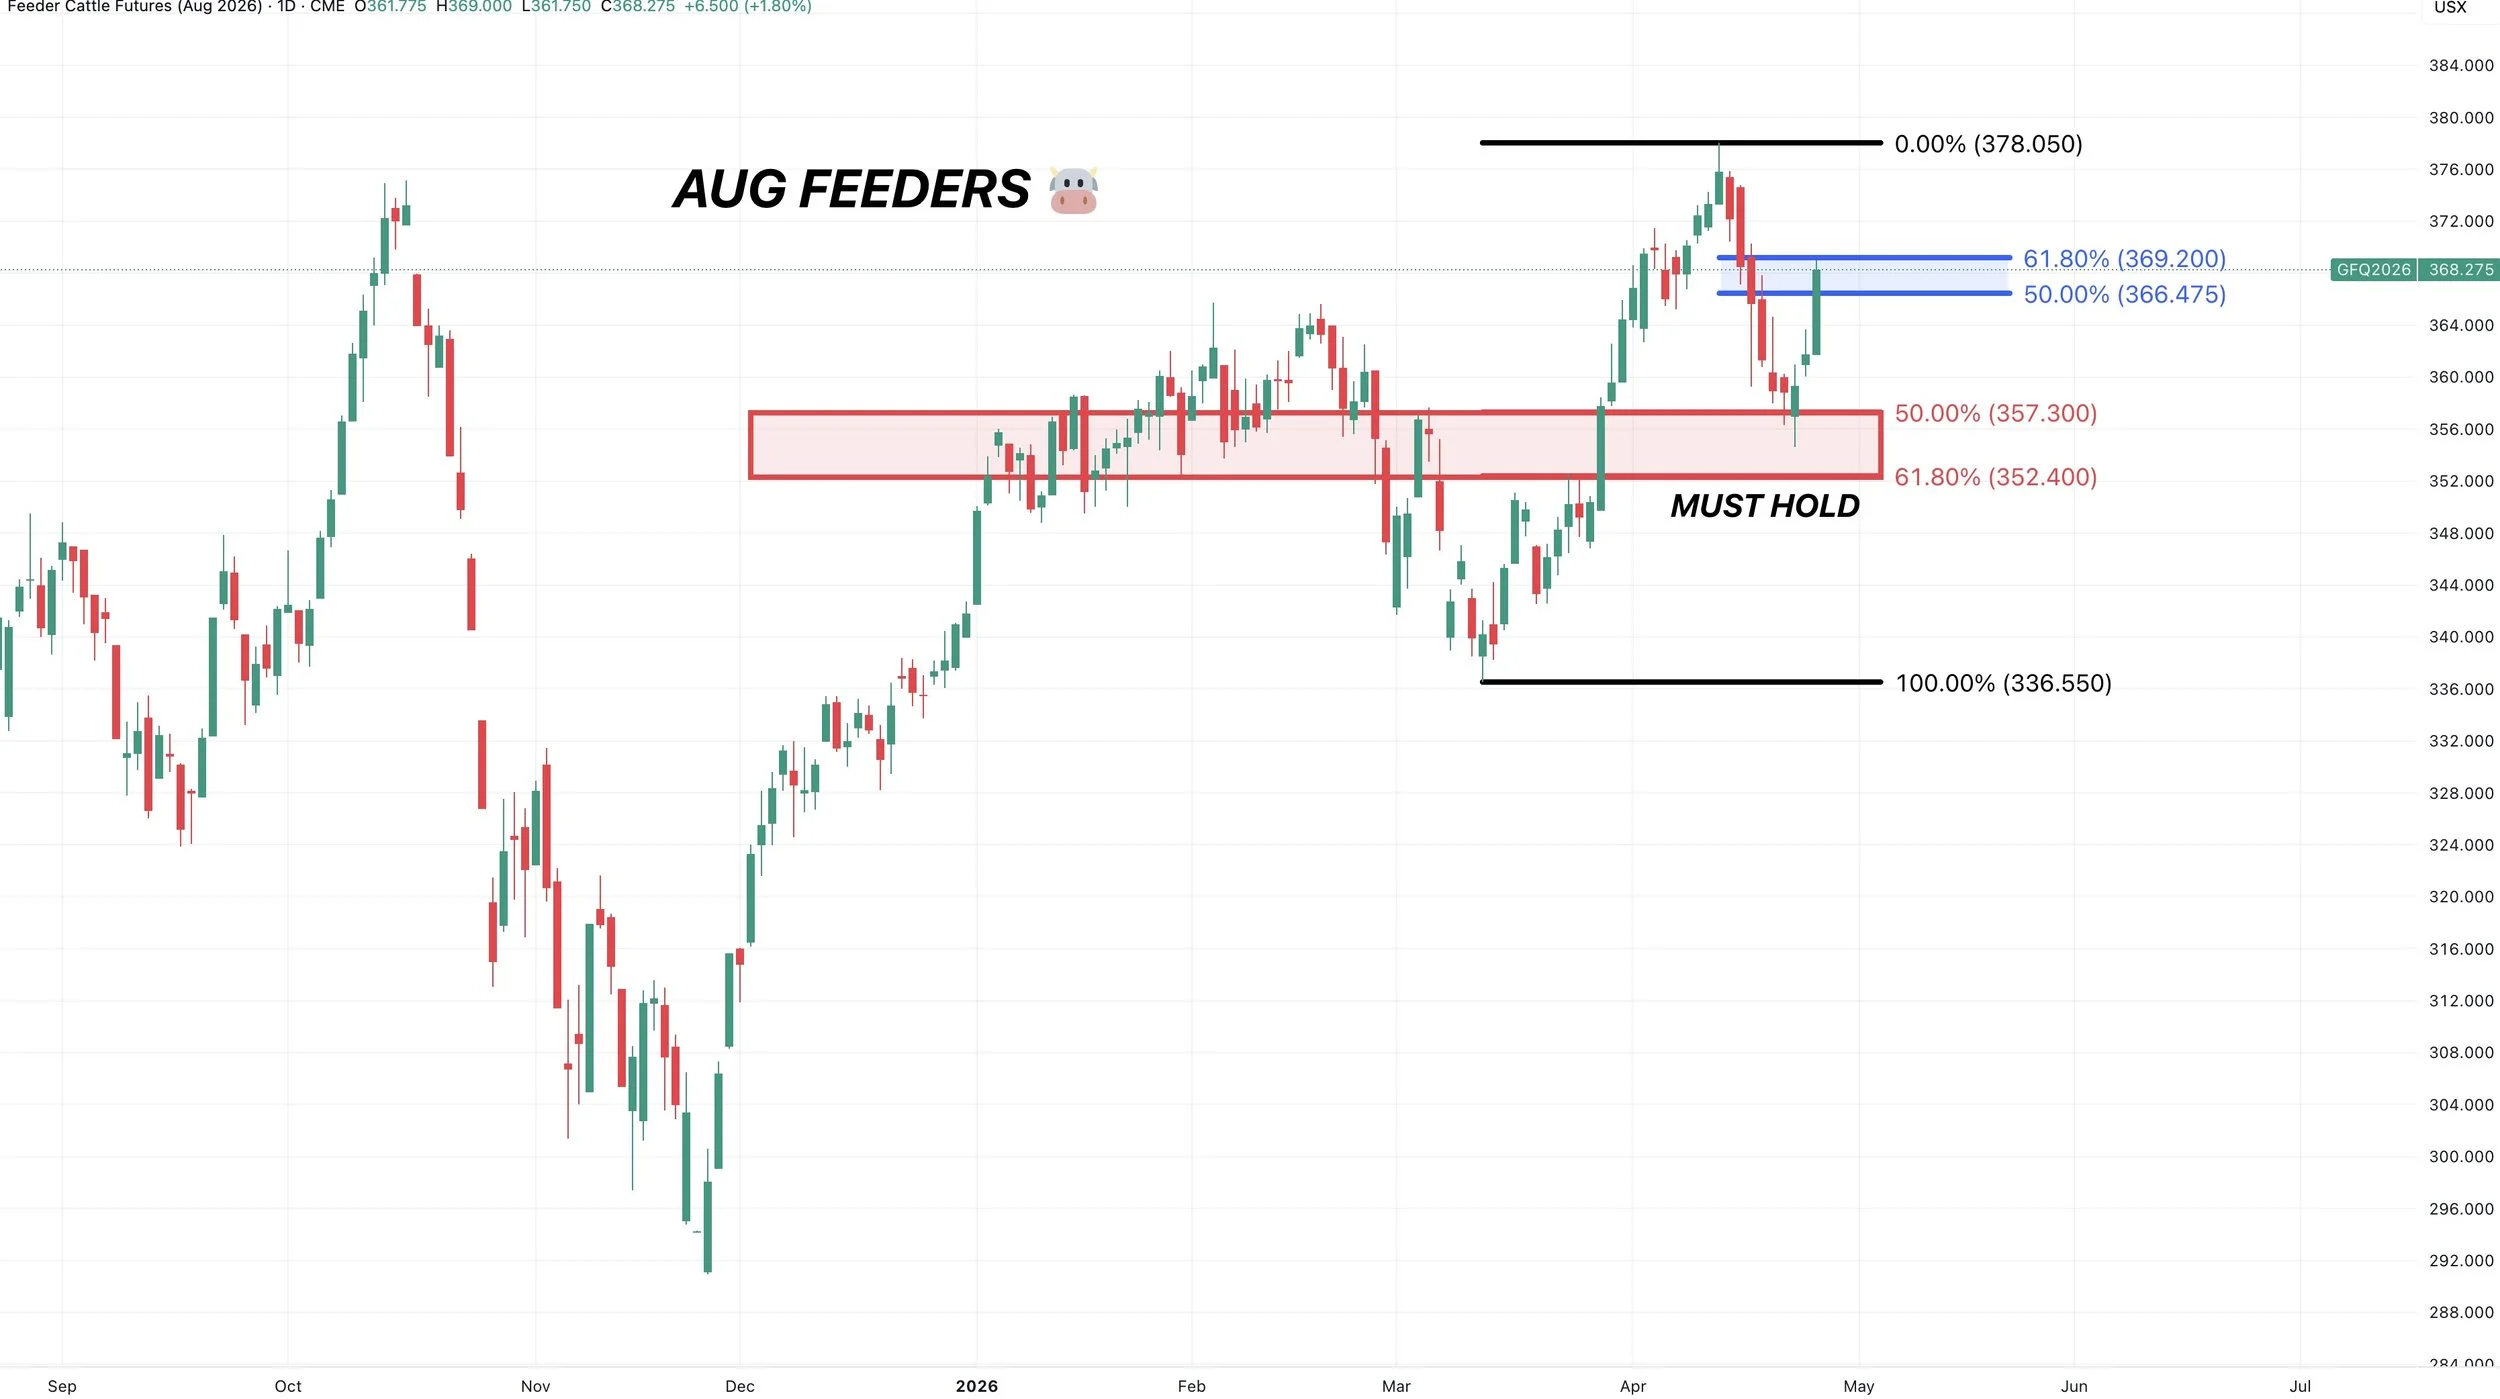
Aug Feeders 🐮
Bounced right in that golden zone at the must hold level.
We’re now testing the golden zone to the upside, as we’ve clawed back 61.8% of the recent sell off. Big spot here as this is where the market decides if this is a dead cat bounce or not.
Still in a clear uptrend unless that red box gives out.
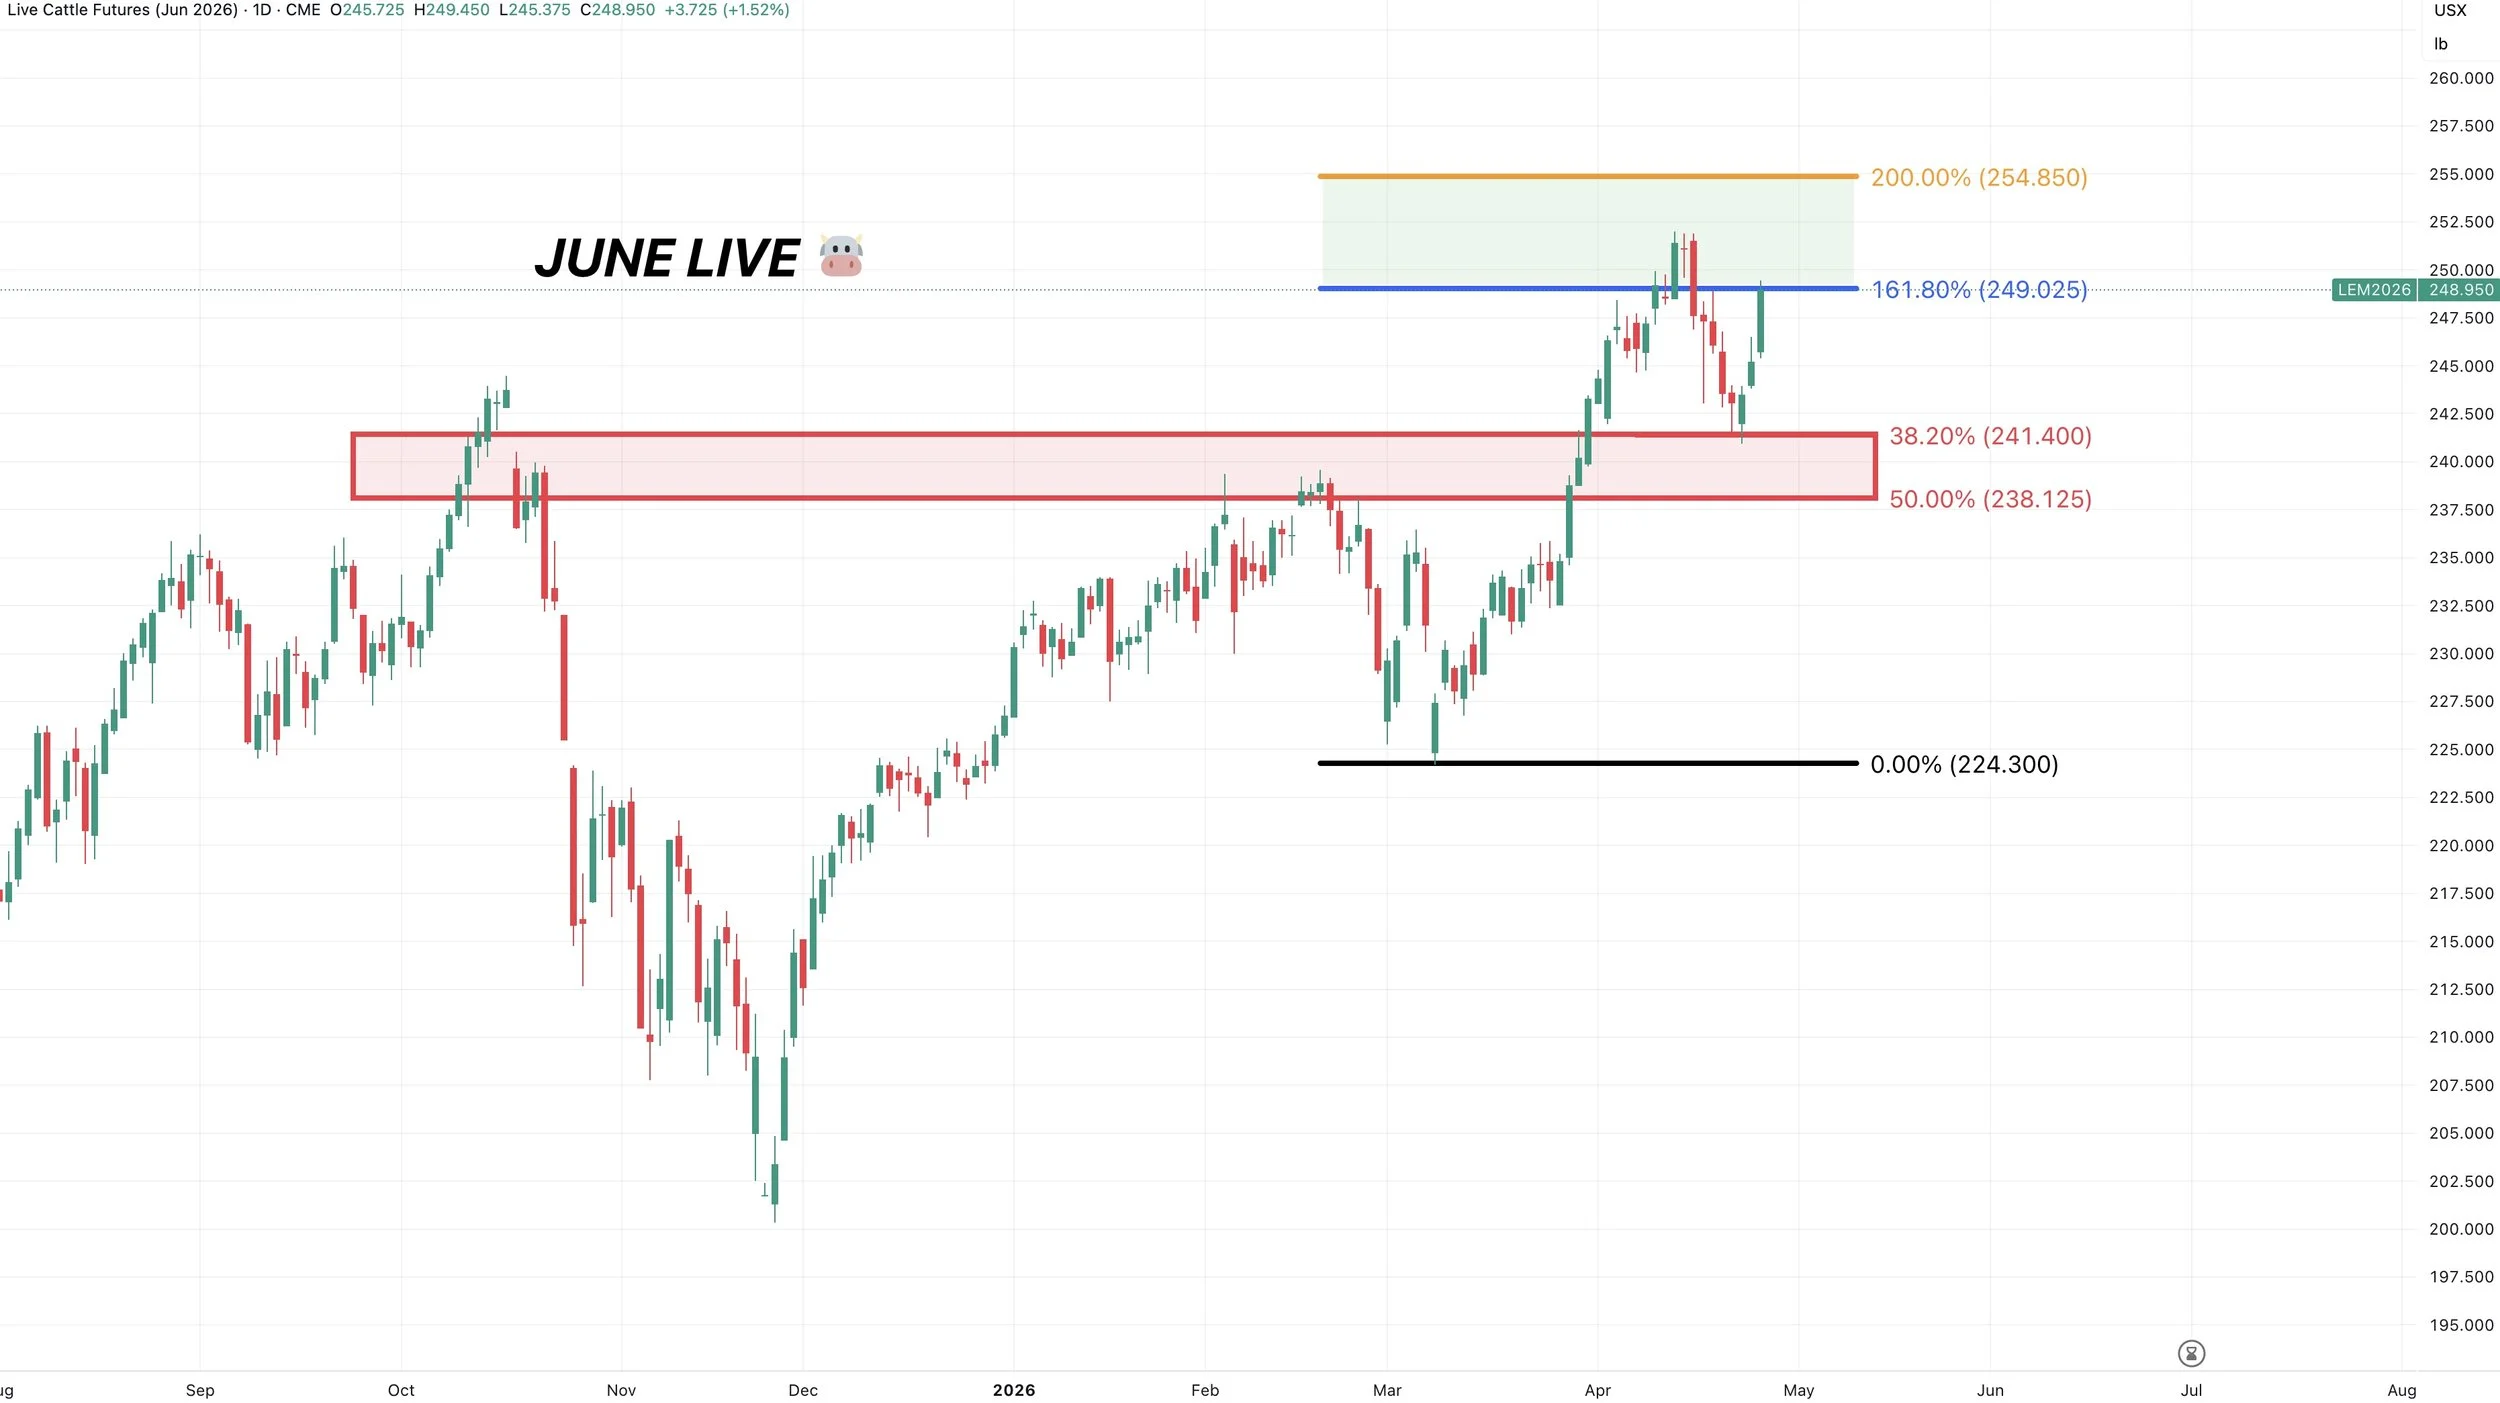
June Live 🐮
Bounced right where we needed to.
Chart is still in a clear uptrend for now.
Want to Talk?
Our phones are open 24/7 for you guys if you ever need anything or want to discuss your operation.
Jeremey & Office: (806)484-1214
Sebastian: (605)280-1186
Email: sfrost@dailymarketminute.com
Hedge Account
Interested in a hedge account? Use the link below to set up an account or give us a call.
Recent Signals
April 27th, 2026: 🌽
Corn catch up sell signal.
April 10th, 2026: 🌽
Corn buy signal.
March 19th, 2026: 🌱
New crop soybeans signal & hedge alert.
March 9th, 2026: 🌱
Soybeans signal & hedge alert. Sent via text.
March 6th, 2026: 🌽 🌾
Corn & wheat sell signal & hedge alert.
March 3rd, 2026: 🌽
Old crop & new crop corn sell signal & hedge alert.
Feb 26th, 2026: 🌱
Old crop & new crop beans sell signal & hedge alert.
Feb 19th, 2026: 🌾
KC wheat sell signal & hedge alert.
Feb 6th, 2026: 🌽 🌱
Old crop corn & soybean sell signal & hedge alert.
Feb 4th, 2026: 🌱
Soybean sell signal & hedge alert.
Nov 17th, 2025: 🌱
Soybean sell signal & hedge alert.