
2-YEAR HIGHS IN WHEAT
MARKET UPDATE
You can scroll to read the usual update as well. As the written version is the exact same as the video.
Timestamps for video:
Overview: 0:00min
Corn: 1:30min
Beans: 8:20min
Wheat: 9:30min
Cattle: 16:05min
Want to talk?
Office: (806)484-1214
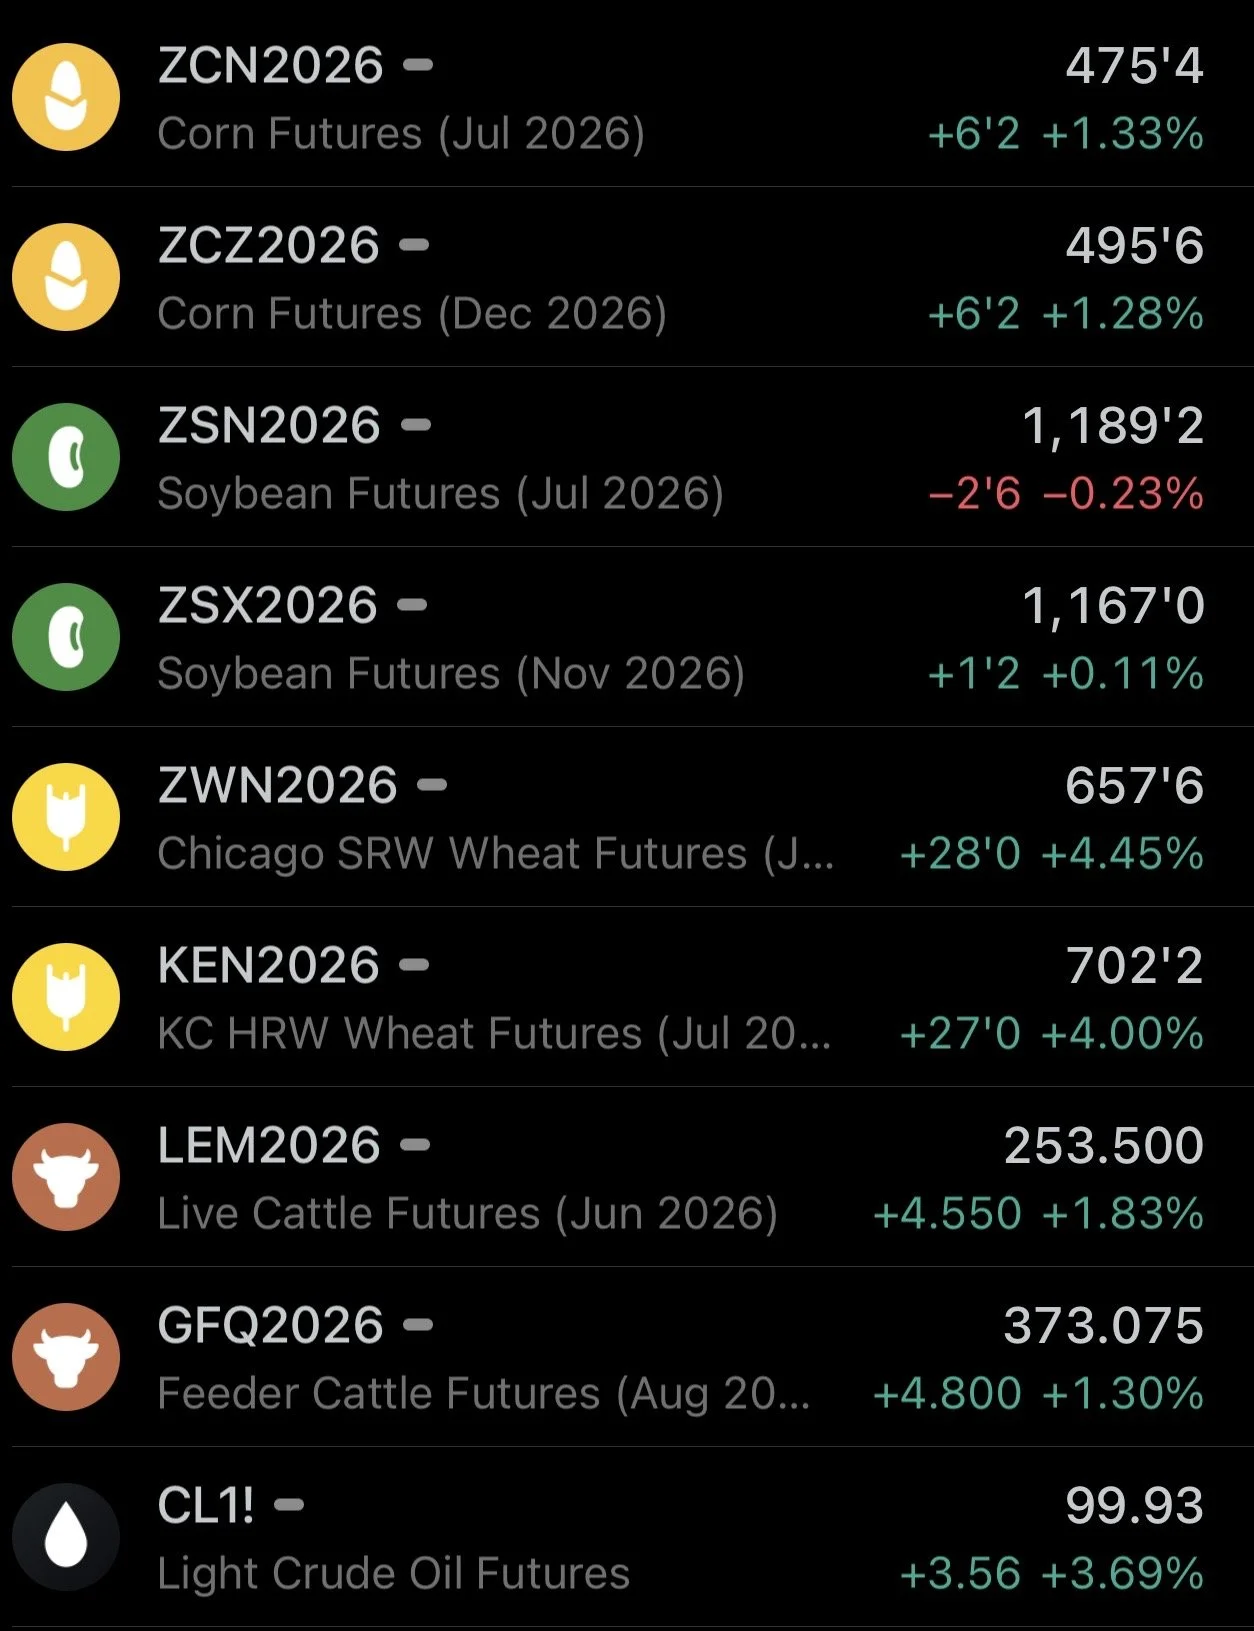
Futures Prices Close
Overview
Great day across the board for the grains and cattle, with everything outside of soybeans higher.
As corn, wheat and cattle all continue to push higher.
Crude oil is back above $100 as the war headlines continue to flip back and forth.
Dec corn closed higher for the 8th day in a row and is back at the highs.
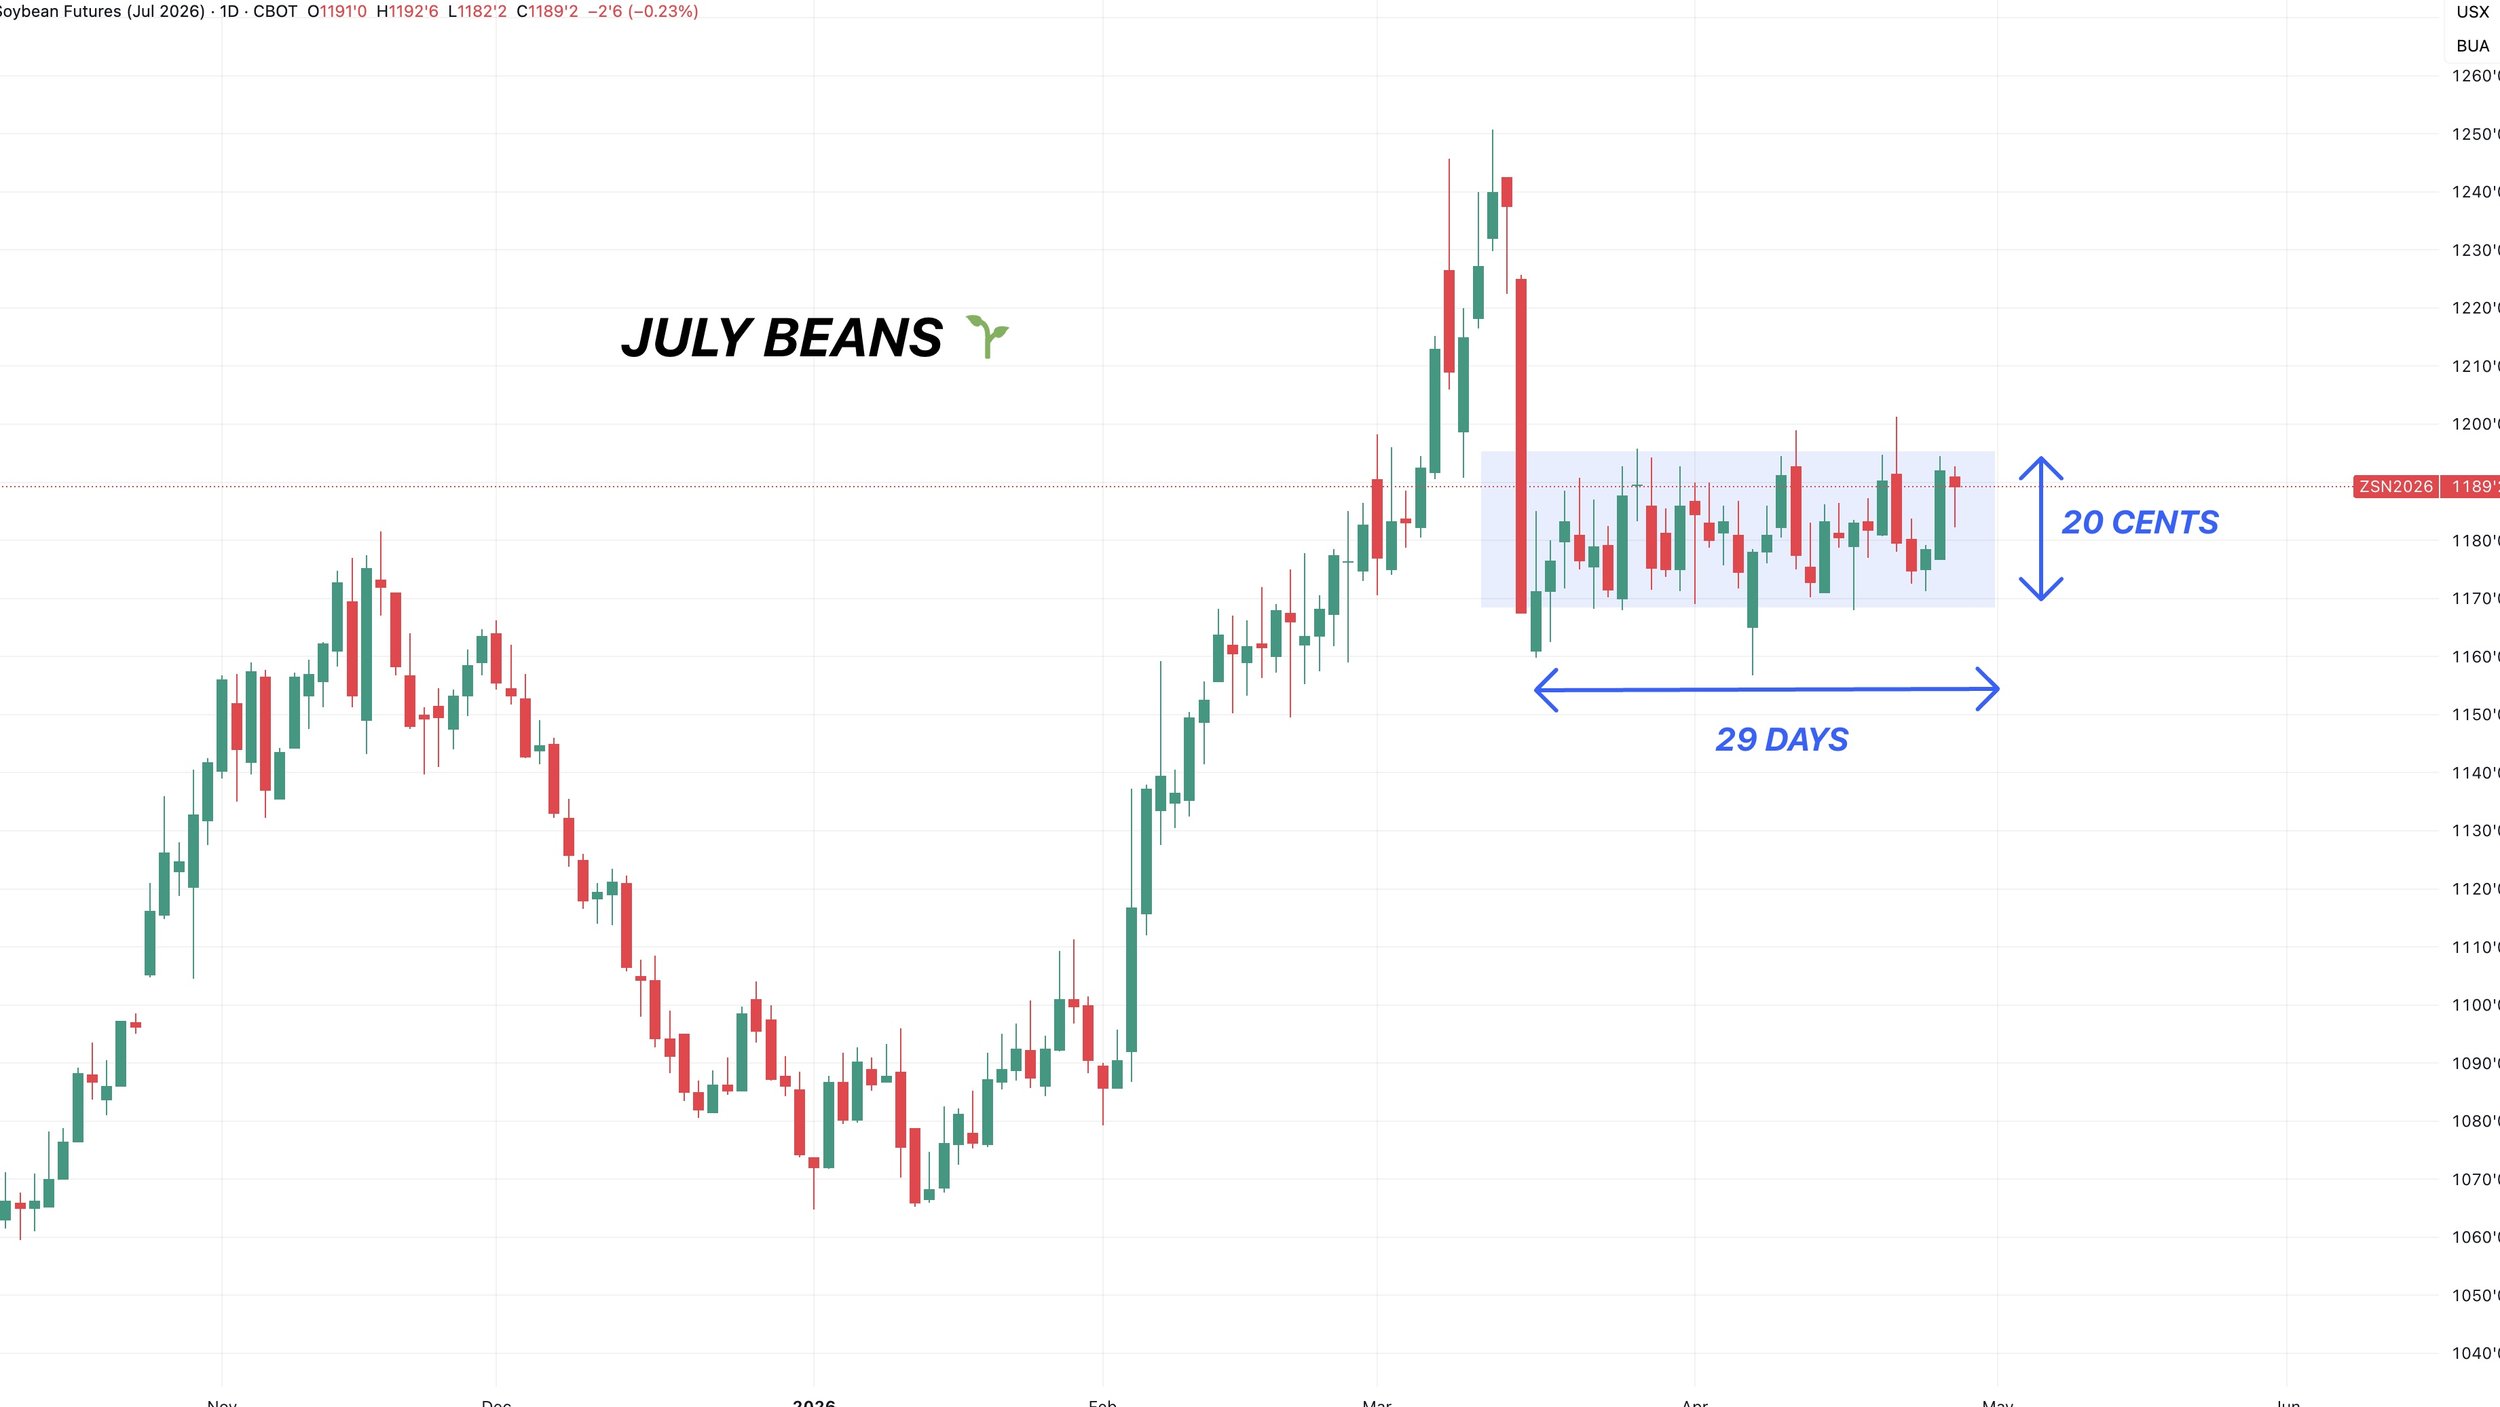
Soybeans continue to chop around in a small range. We've closed within a 20-cent range for the last 29 trading sessions in a row now.
Corn had a larger trading range than that the last week, and wheat had a larger trading range than that today alone. That's how tight the trade has been in beans.
Cattle is pushing higher as it seems like the fear surrounding the border re-opening has vanished for now.
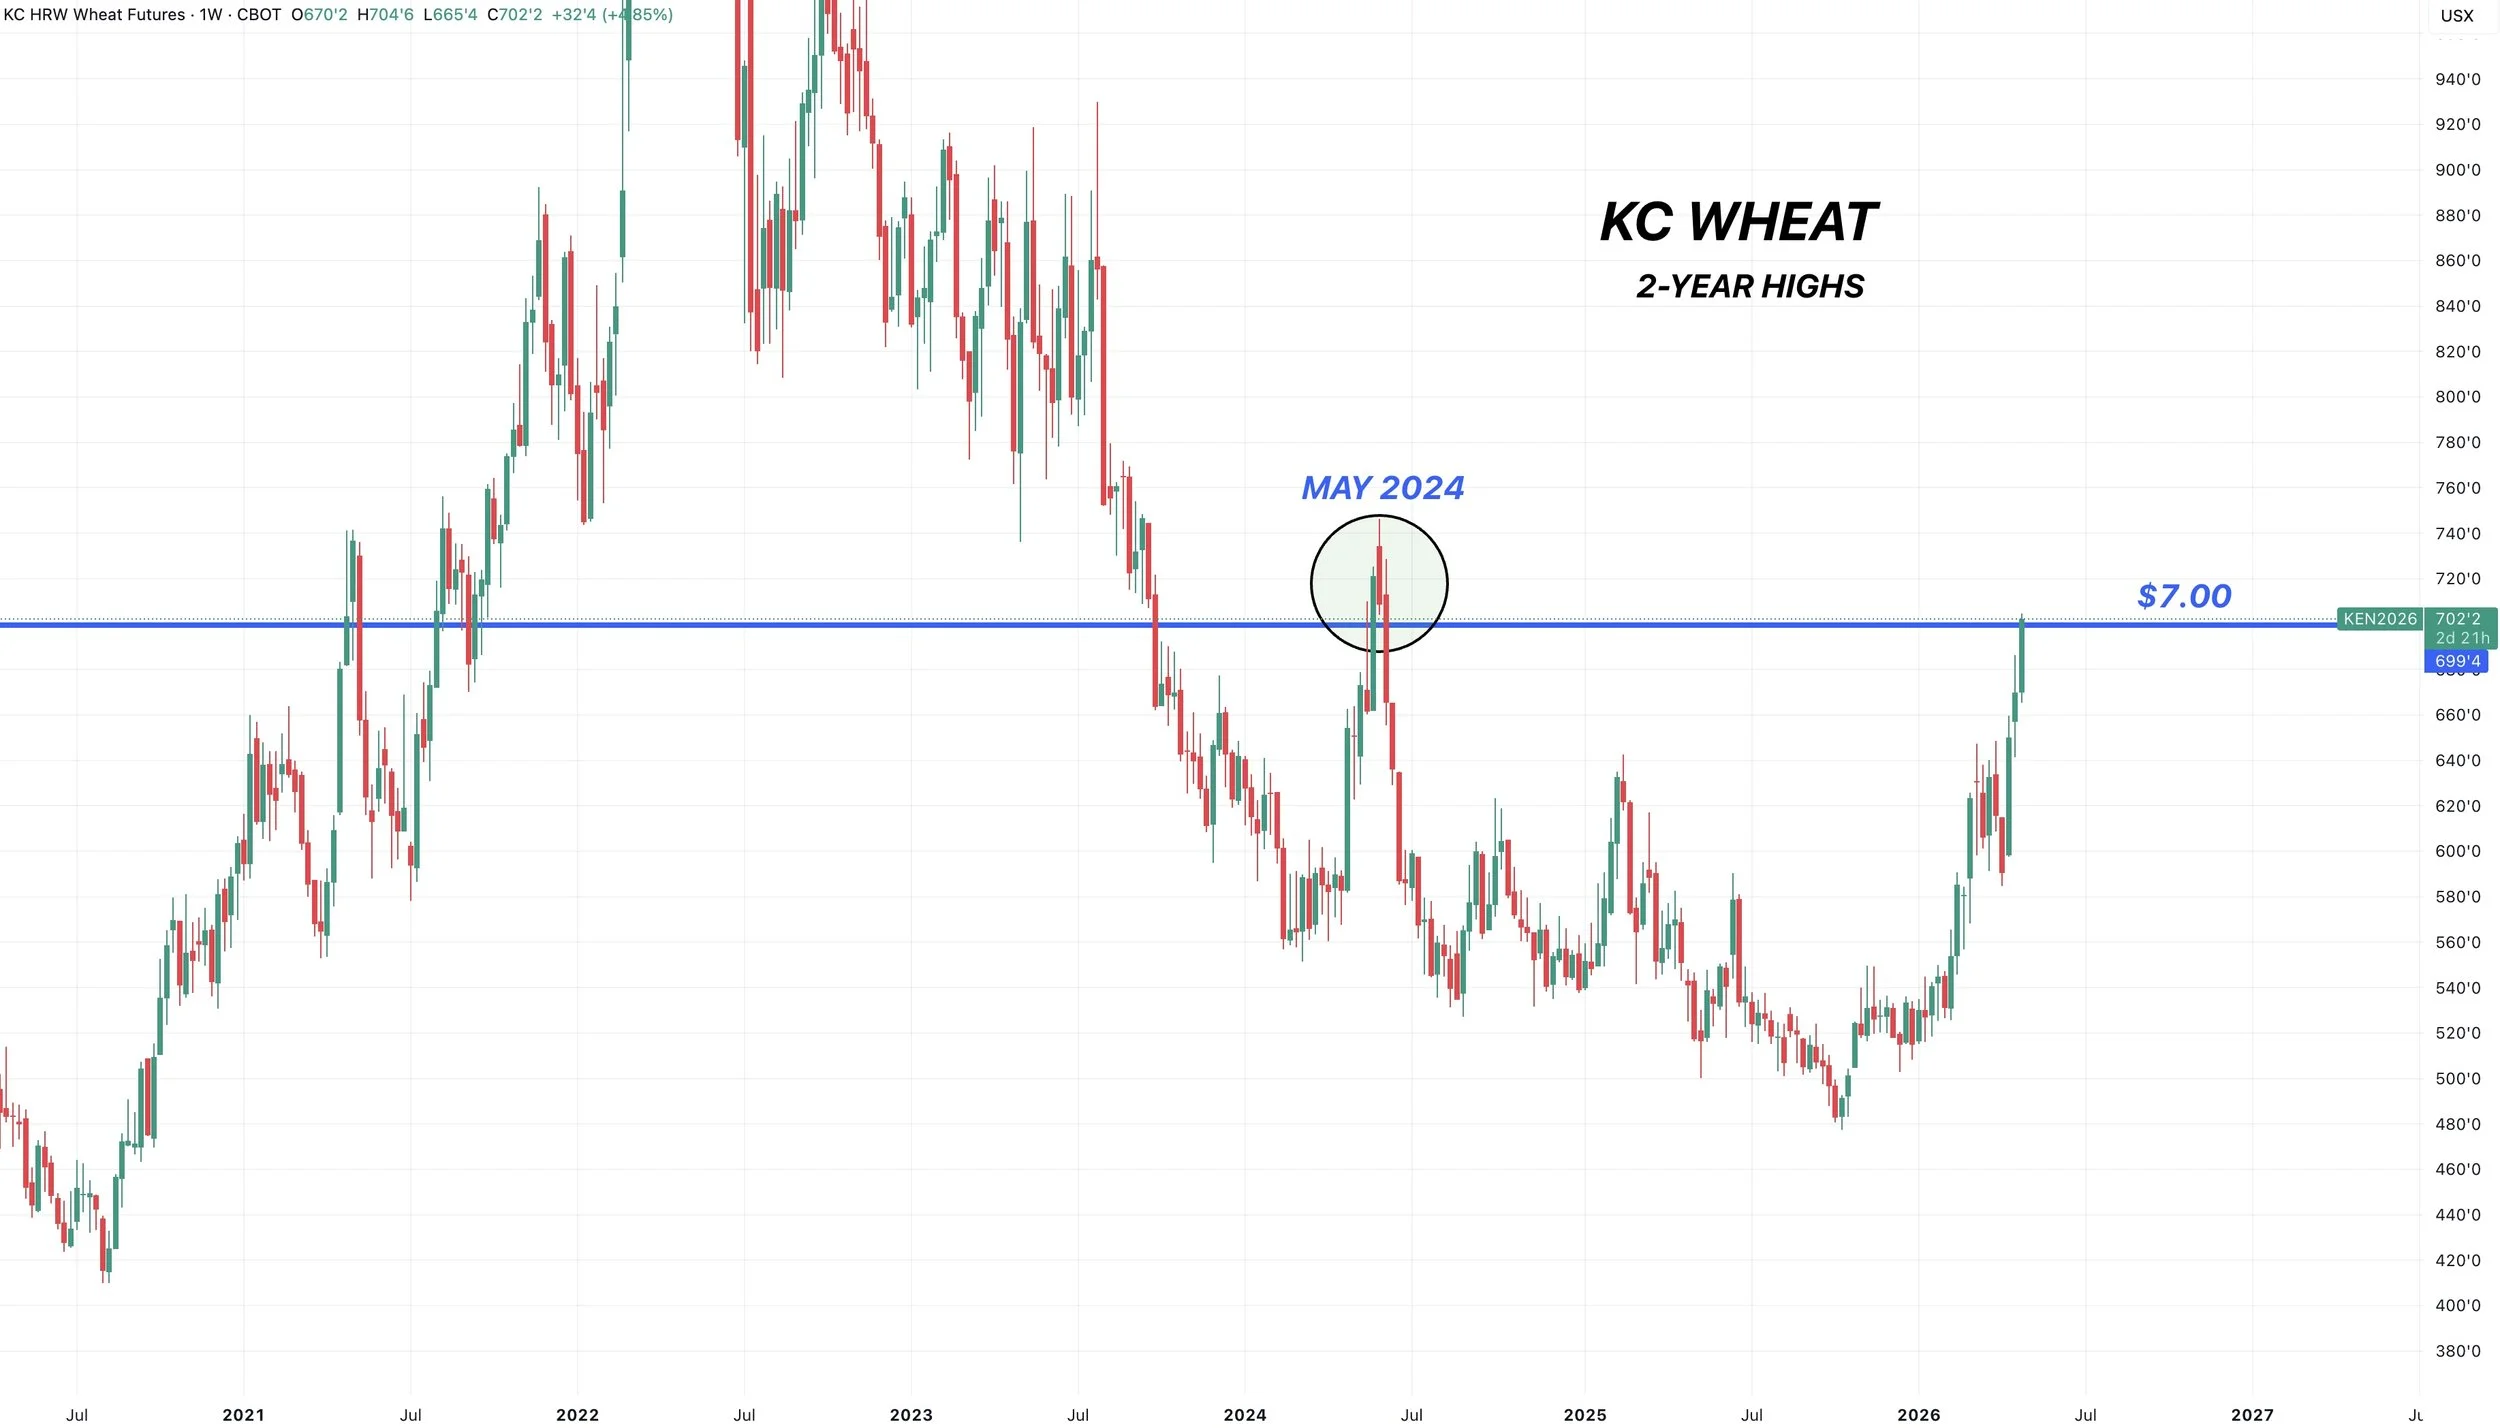
Today KC wheat traded above $7.00 for the first time since May 2024 when we saw that Russia drought fueled rally.
Wheat is now $1.00 of it's lows posted just two weeks ago.
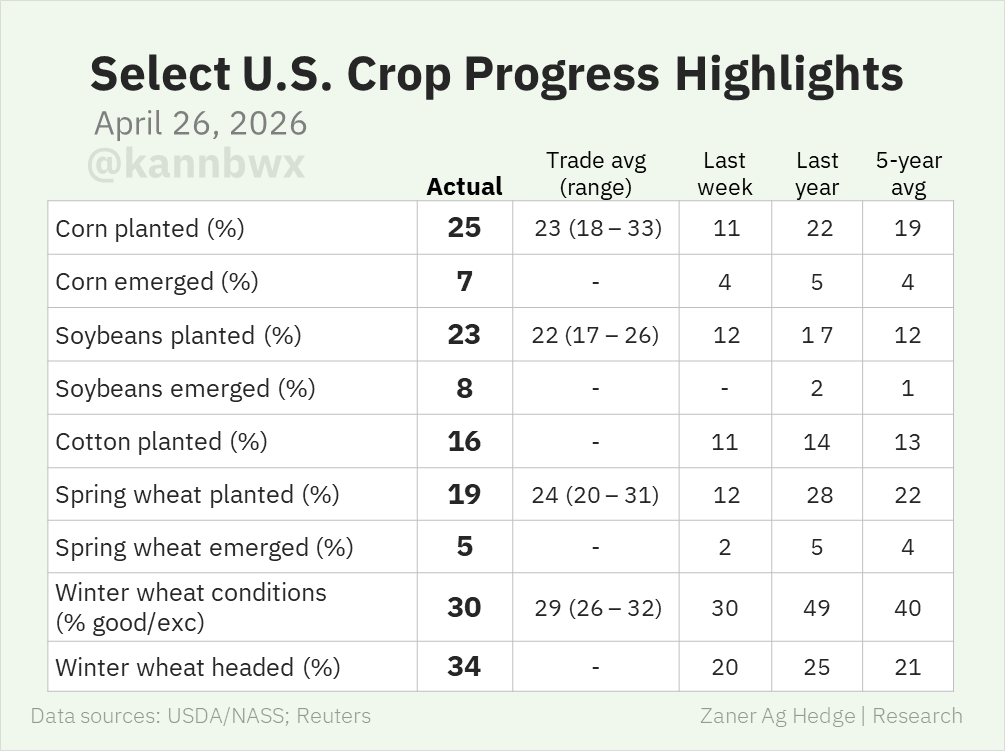
Crop Progress
Corn and soybeans are both well ahead of the average pace.
Corn: 25% (Avg: 19%)
Beans: 23% (Avg: 12%)
Winter wheat ratings came in unchanged at 30% G/E. Which was somewhat of a surprise but the ratings are being propped up by the SRW crop. The HRW crop still has some serious issues which we'll go over later in today's update.
Chart from Karen Braun
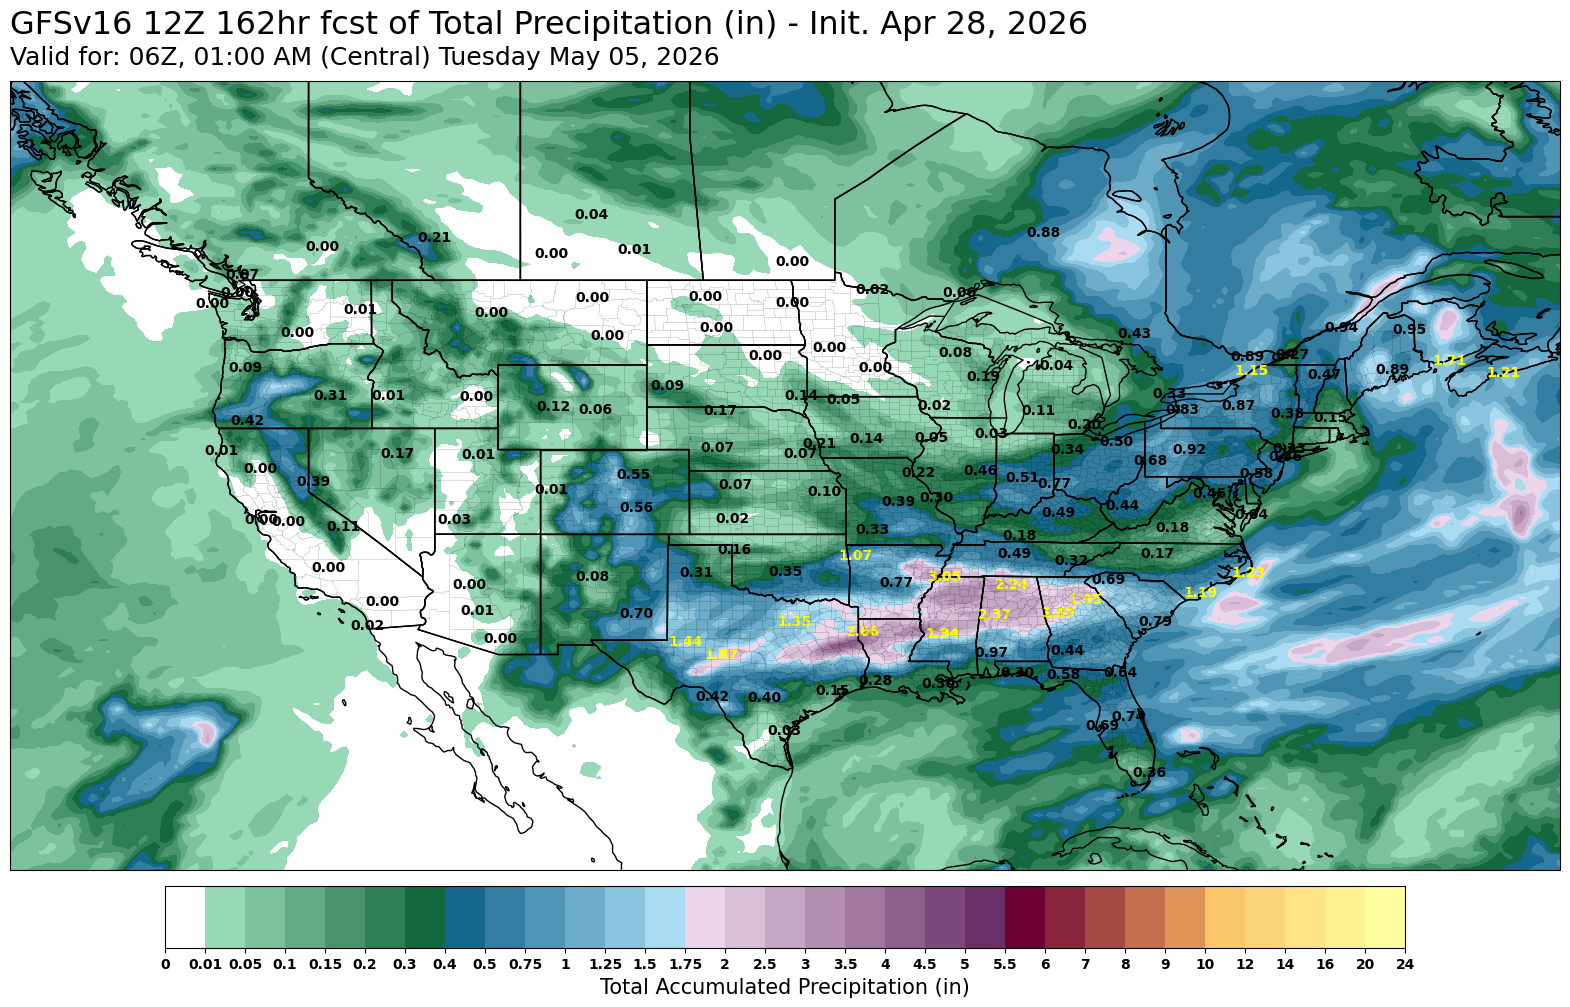
The next week looks like it's going to dry out for a good chunk of the corn belt.
So we should continue to see planting ramp up.
Today's Main Takeaways
Corn
Yesterday's Catch Up Alert:
Yesterday we sent out a catch up sell signal and hedge alert. Here is the link in case you missed it.
Click Here to View
This alert was more for those who feel like they are behind or feel like they missed out back in March, and was just a generic guideline as to how sold or hedged we like being at these levels depending on what situation you might be in.
In that alert we went over 4 scenarios.
1) No Storage + Cash Only
2) No Storage + Hedge Account
3) Storage + Cash Only
4) Storage + Hedge Account
Fundamentals:
This isn’t your usual fundamental rally. We aren’t trading the balance sheets.
If we were, corn wouldn’t be as high as it is today.
It seems like the market is starting to pick up more and more of that fertilizer story. Which could make an even larger impact to next year's crop if the situation doesn’t get resolved.
I personally still think acres are too high to begin with, but we won’t know that until at least June.
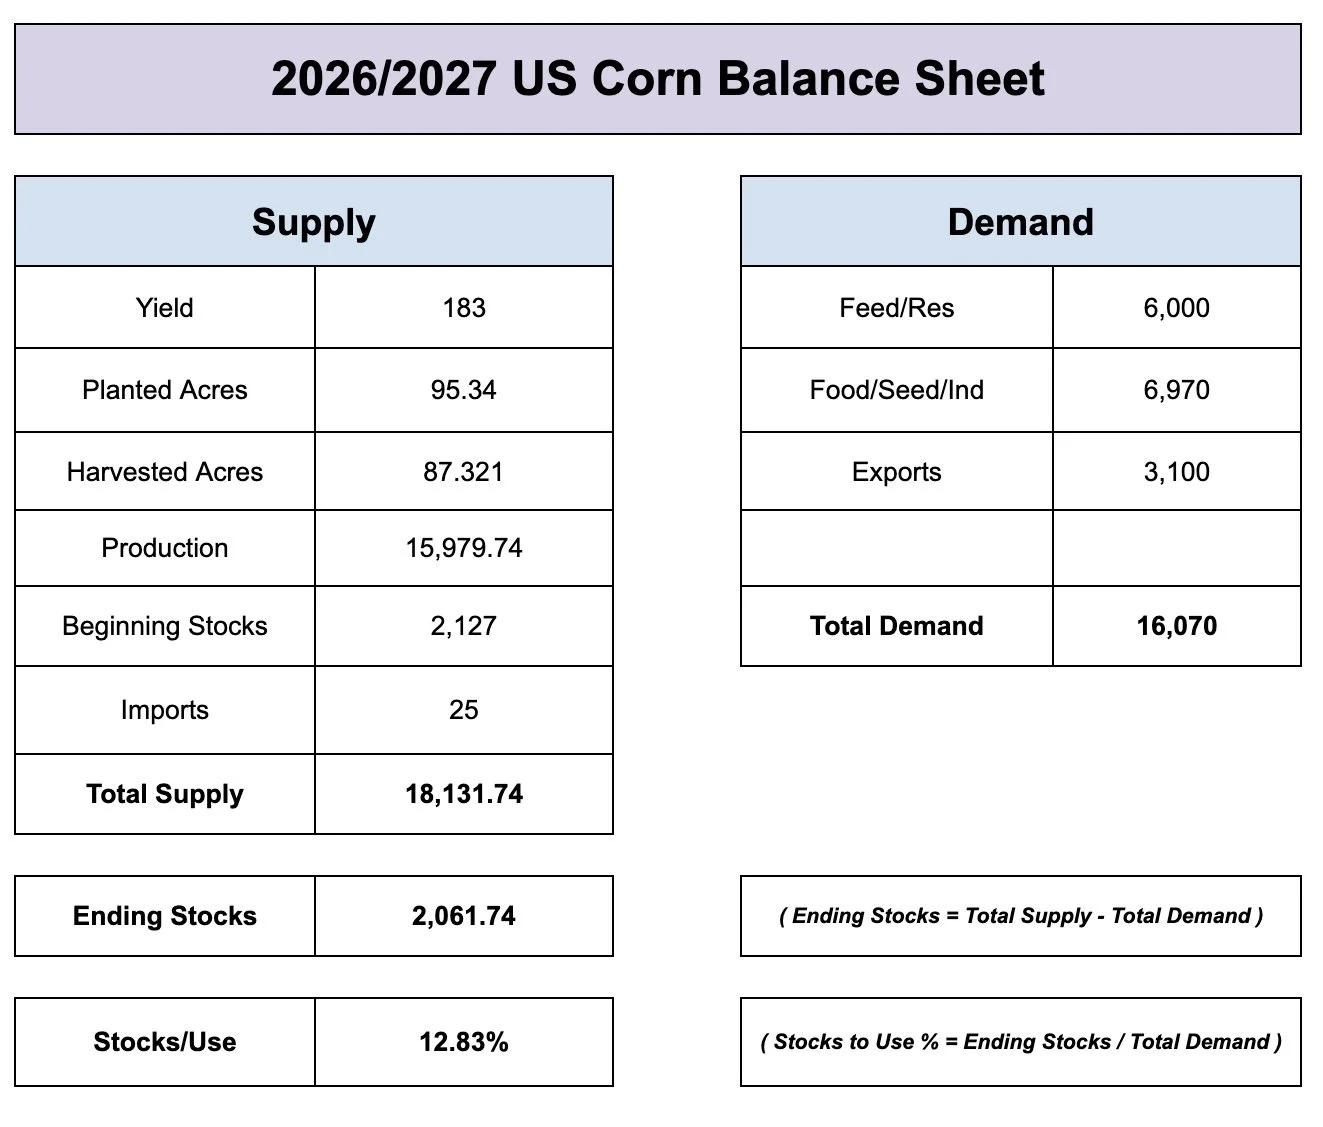
We will get our first official new crop balance sheet in the May USDA report, but I mean the new crop balance sheet based on the Feb Outlook demand numbers and March Intentions Acres does still project around a carryout of 2 billion bu.
So it's clear the market isn’t paying attention to those right now.
Money is going to flow where to wants to flow, and for now they see a story.
Normally, you wouldn’t expect the funds to puke out of their long position until we get further into the growing season, as we usually tend to keep some of that weather premium.
Again, we won’t get a good handle on acres for a while.
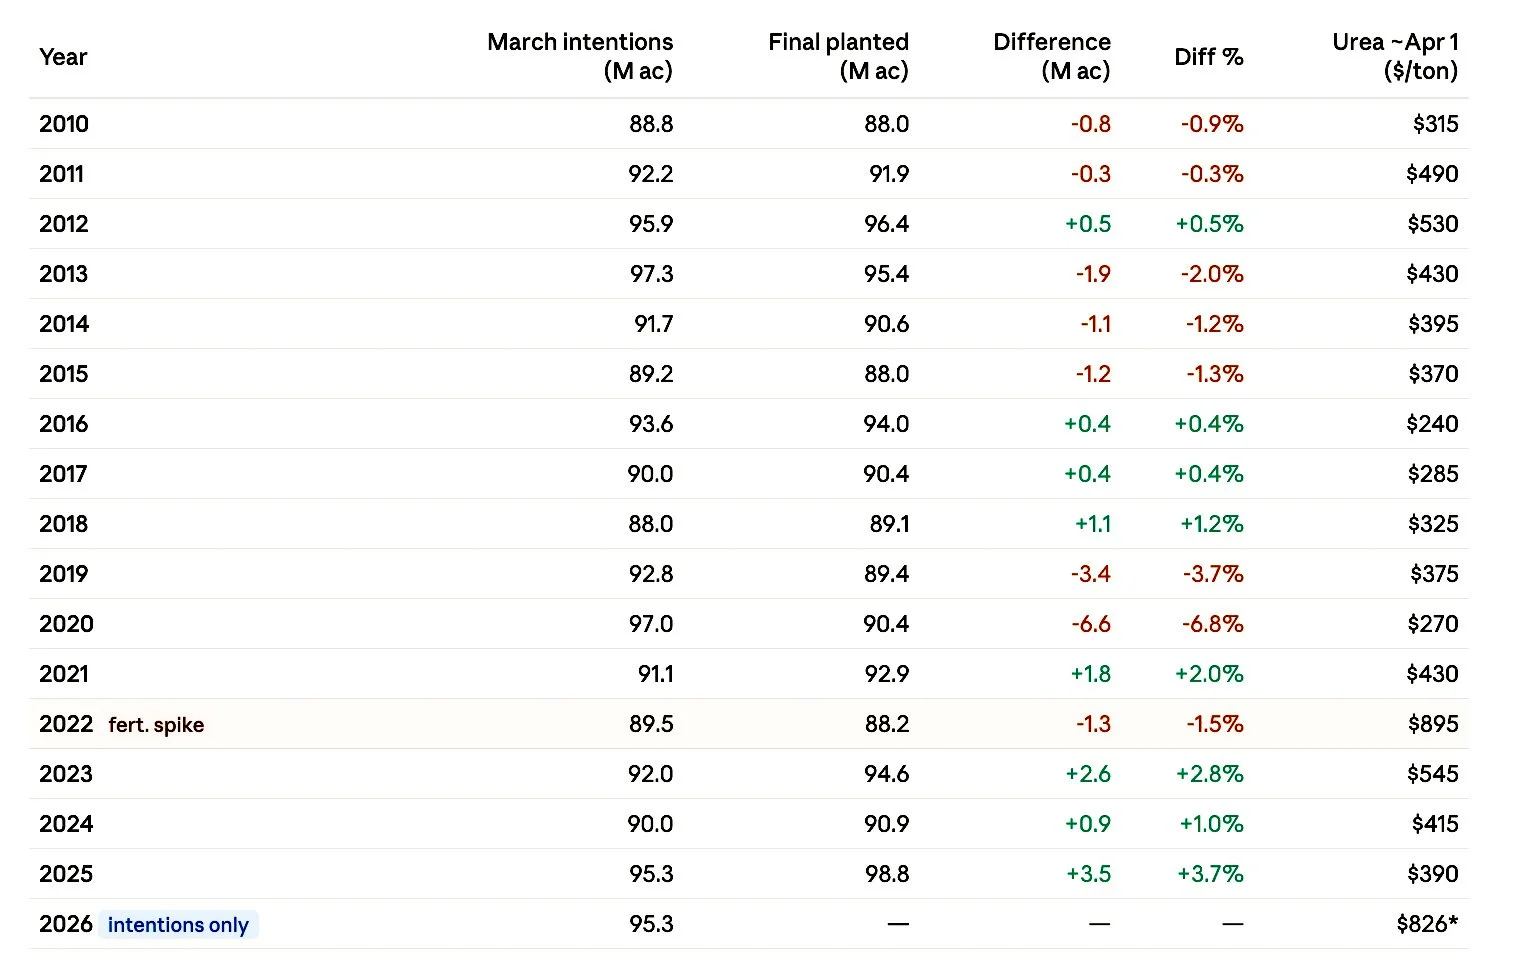
But the last time fertilizer was this high we saw final corn acres drop over 1 million from the March intentions.
And the March intentions haven’t come within 1 million of the final number since basically 2017 regardless.
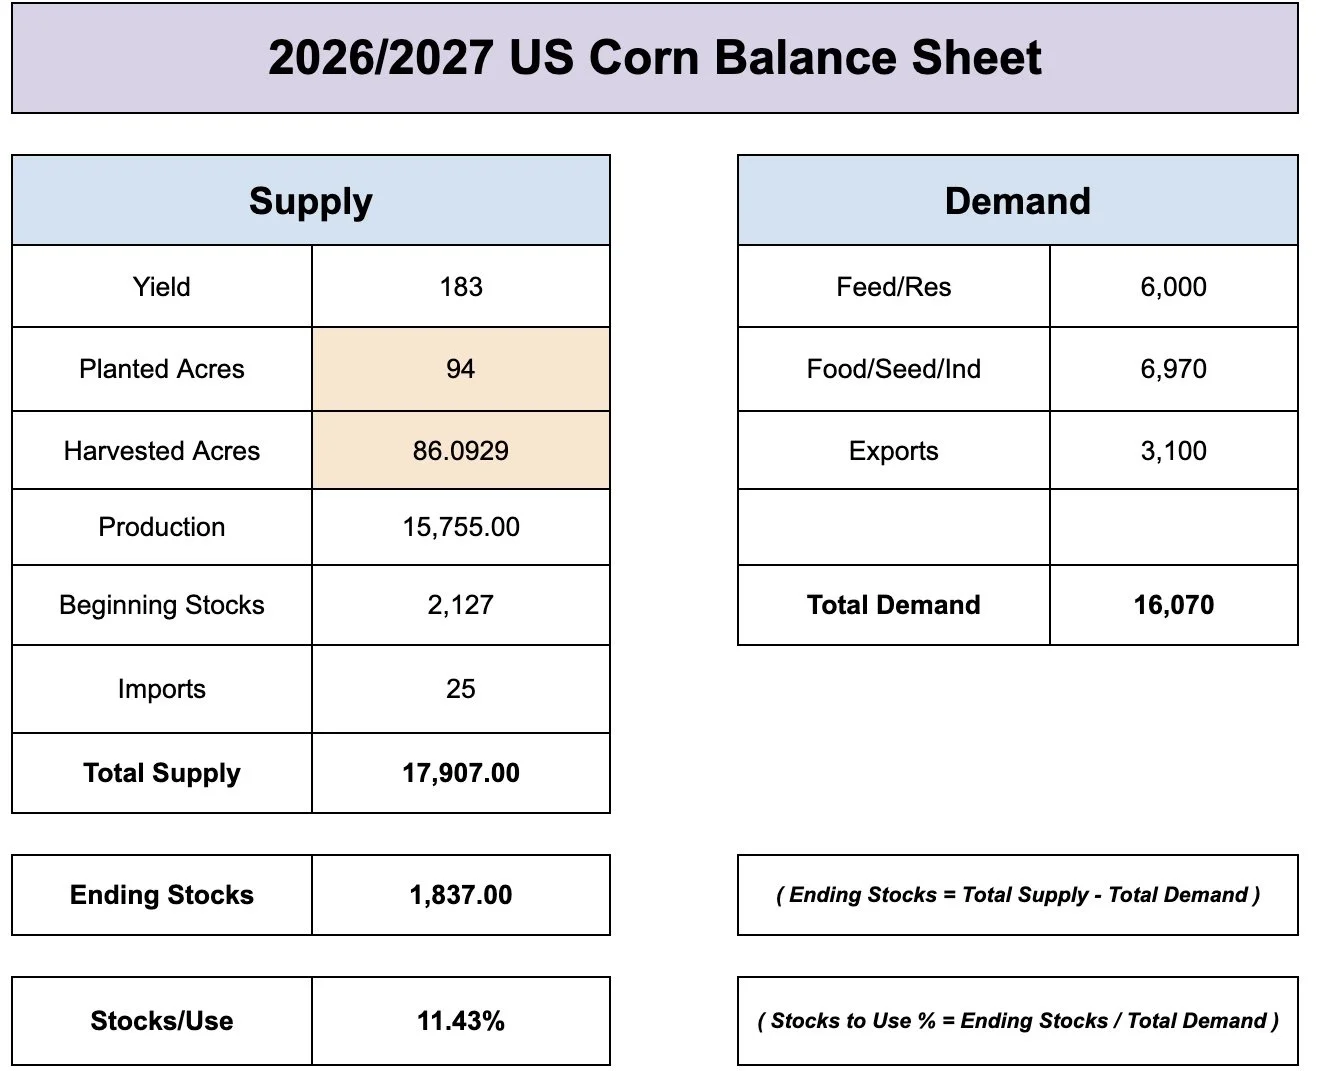
Dropping acres down to 94 million cuts the balance sheet by almost 200 million bushels.
Then every 1 bpa drop in yield cuts the production by roughly 90 million.
So this could be a bigger story down the road.
This figure also uses a 183 yield. So you can imagine what happens to the balance sheet if both acres and yield are too high at the end of the day.
We've got plenty of supply right now and the old crop story isn’t considered bullish.
But all of these possible bullish factors are more medium to long term factors.
With crude, inflation, fertilizer, etc. That could all leave a lasting impact down the road.
Window of Opportunity:
Seasonally speaking, we are entering the time frame where we typically post our highs.
The next 30-60 days is that usual seasonal window of opportunity.
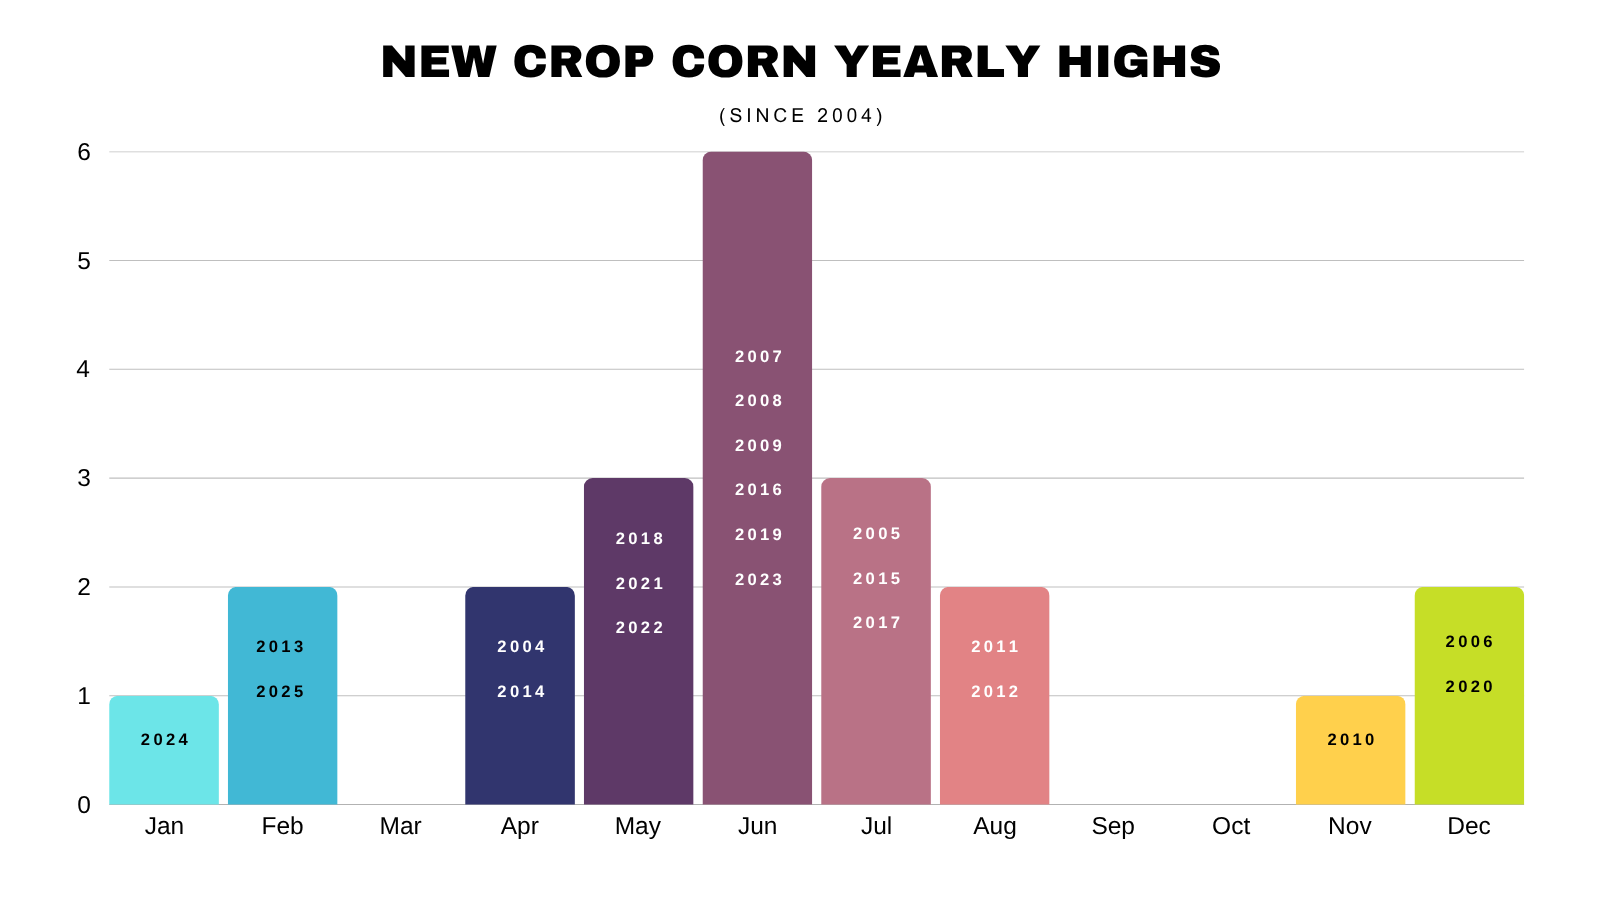
Here is when we've made our highs by each month over the years.
It typically comes between April to June.
Sometimes it comes in July if we get a drought scare in the summer.
Highs by Month Since 2004 (22 years)
April: 2 (9%)
May: 3 (14%)
June: 6 (27%)
July: 3 (14%)
We've talked about courage calls a lot before. If you don’t already have any, you could consider layering into some if you are someone who struggles to make sales. As an example, the July $5.50 calls are 2-3 cents. They happen to expire when we typically post that seasonal high.
Reach out if you have questions on those.
Office: (806)484-1214
Here are the seasonal charts.
The number one thing they have in common is a free fall by July and heading into harvest.
So typically we will want to have a good chunk of our marketing done before that 4th of July weekend.
Like we talked about in yesterday's alert, if you are someone who does not have storage and does cash only, you usually want to be around 3/4 sold by early July.
Could China Buy Corn?
One major wildcard is China.
Who knows if they'll buy corn or not.
It would be incredibly friendly if they do.
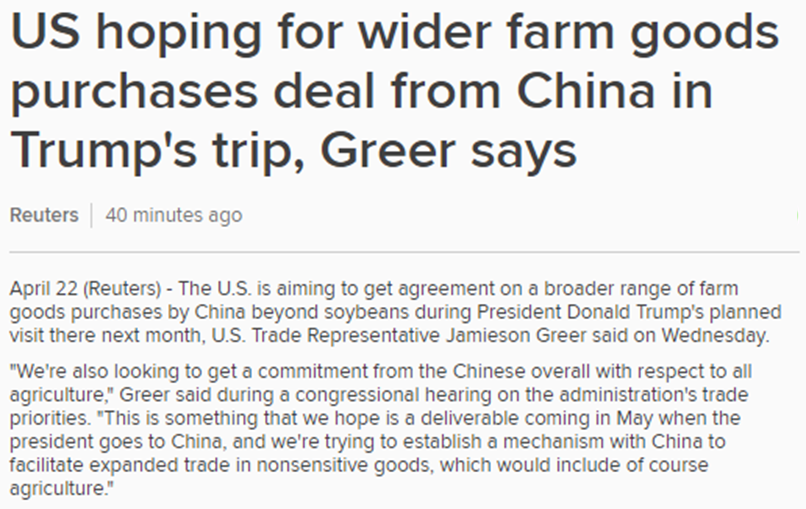
We talked about this last week, but the US has reported that they are trying to get China to agree to buy a broader range of farm good outside of soybeans.
Trump meets with China on May 14th.
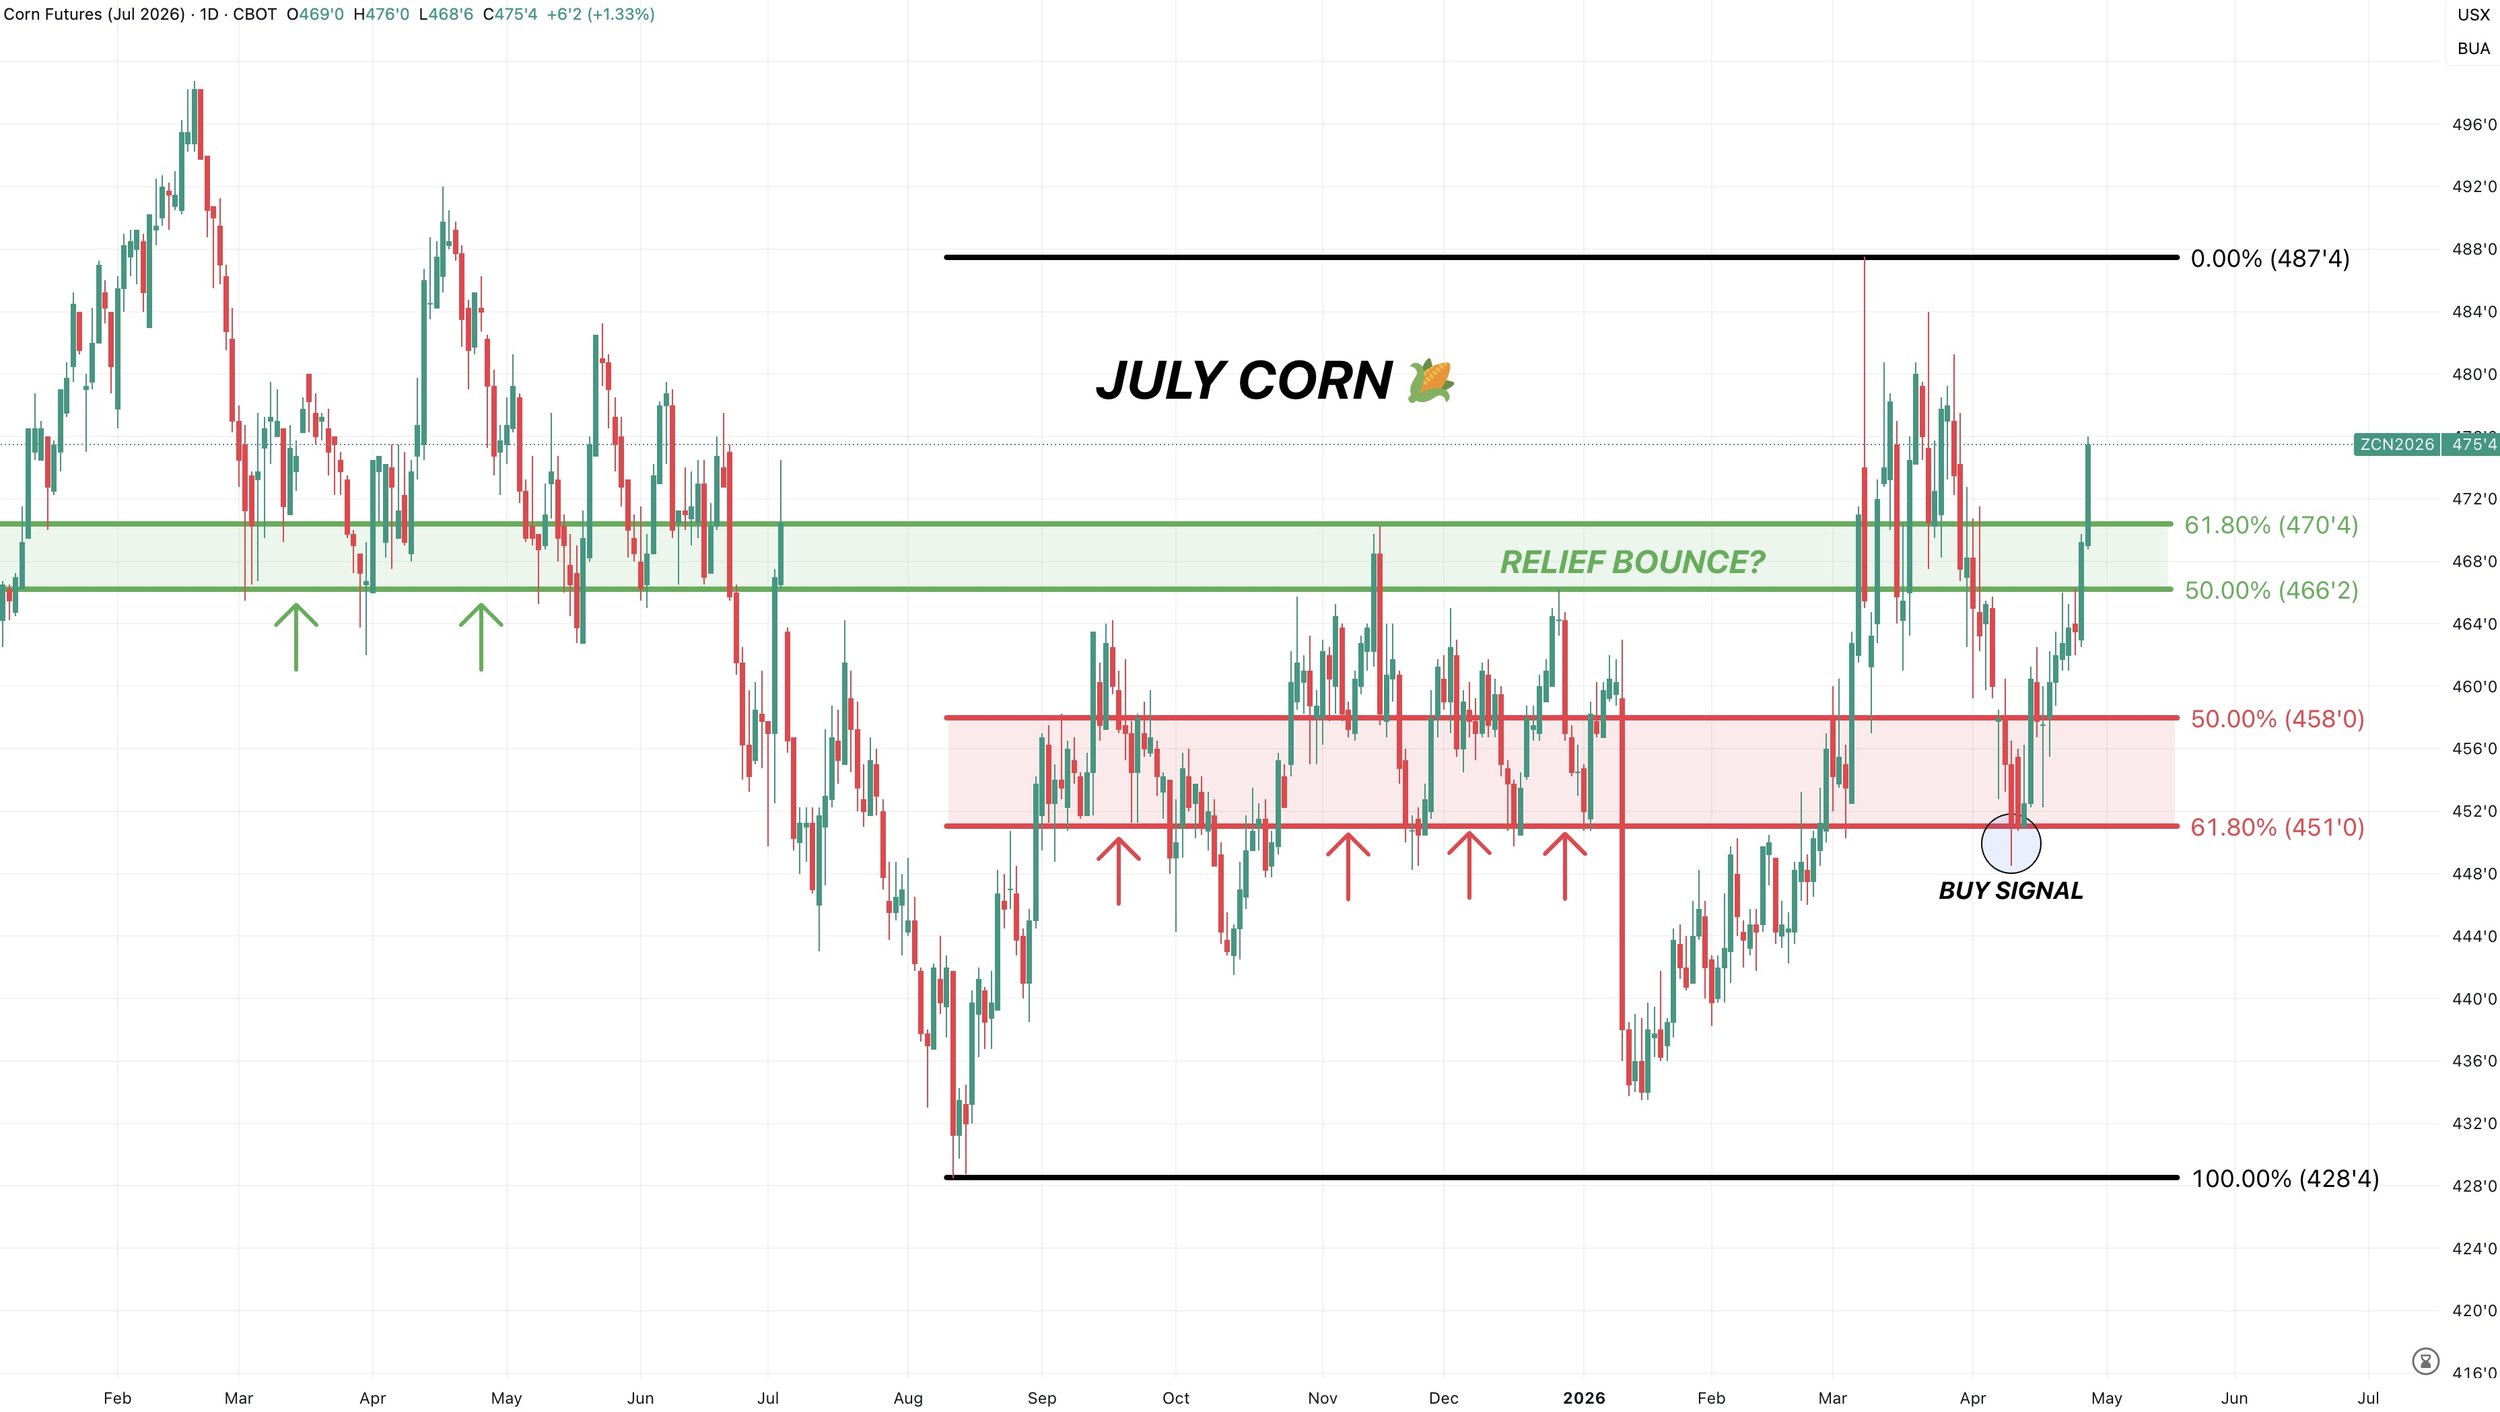
July Corn Chart:
The charts in corn look solid.
We found our bottom after giving back 61.8% of the entire rally, that same level was key support from last fall. Which was the reasoning behind our buy signal on April 10th.
Link to April 10th Buy Signal
July corn has now broke above that golden zone to the upside. Which clawed back 50-61.8% of the sell off.
More often than not, this suggests that this rally is no longer viewed as just a dead cat bounce, but something more. A sign that this potentially has some legs to it.
Next Old Crop Target:
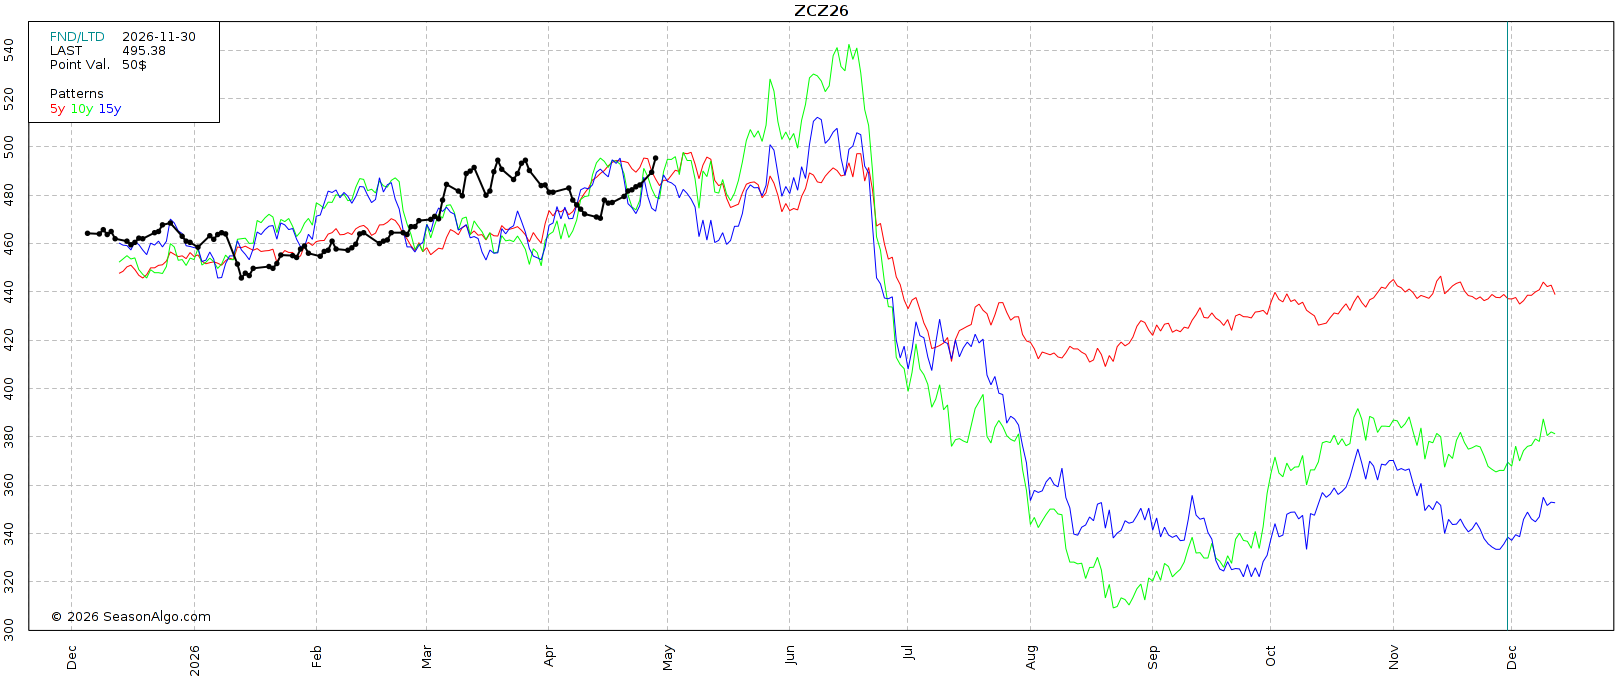
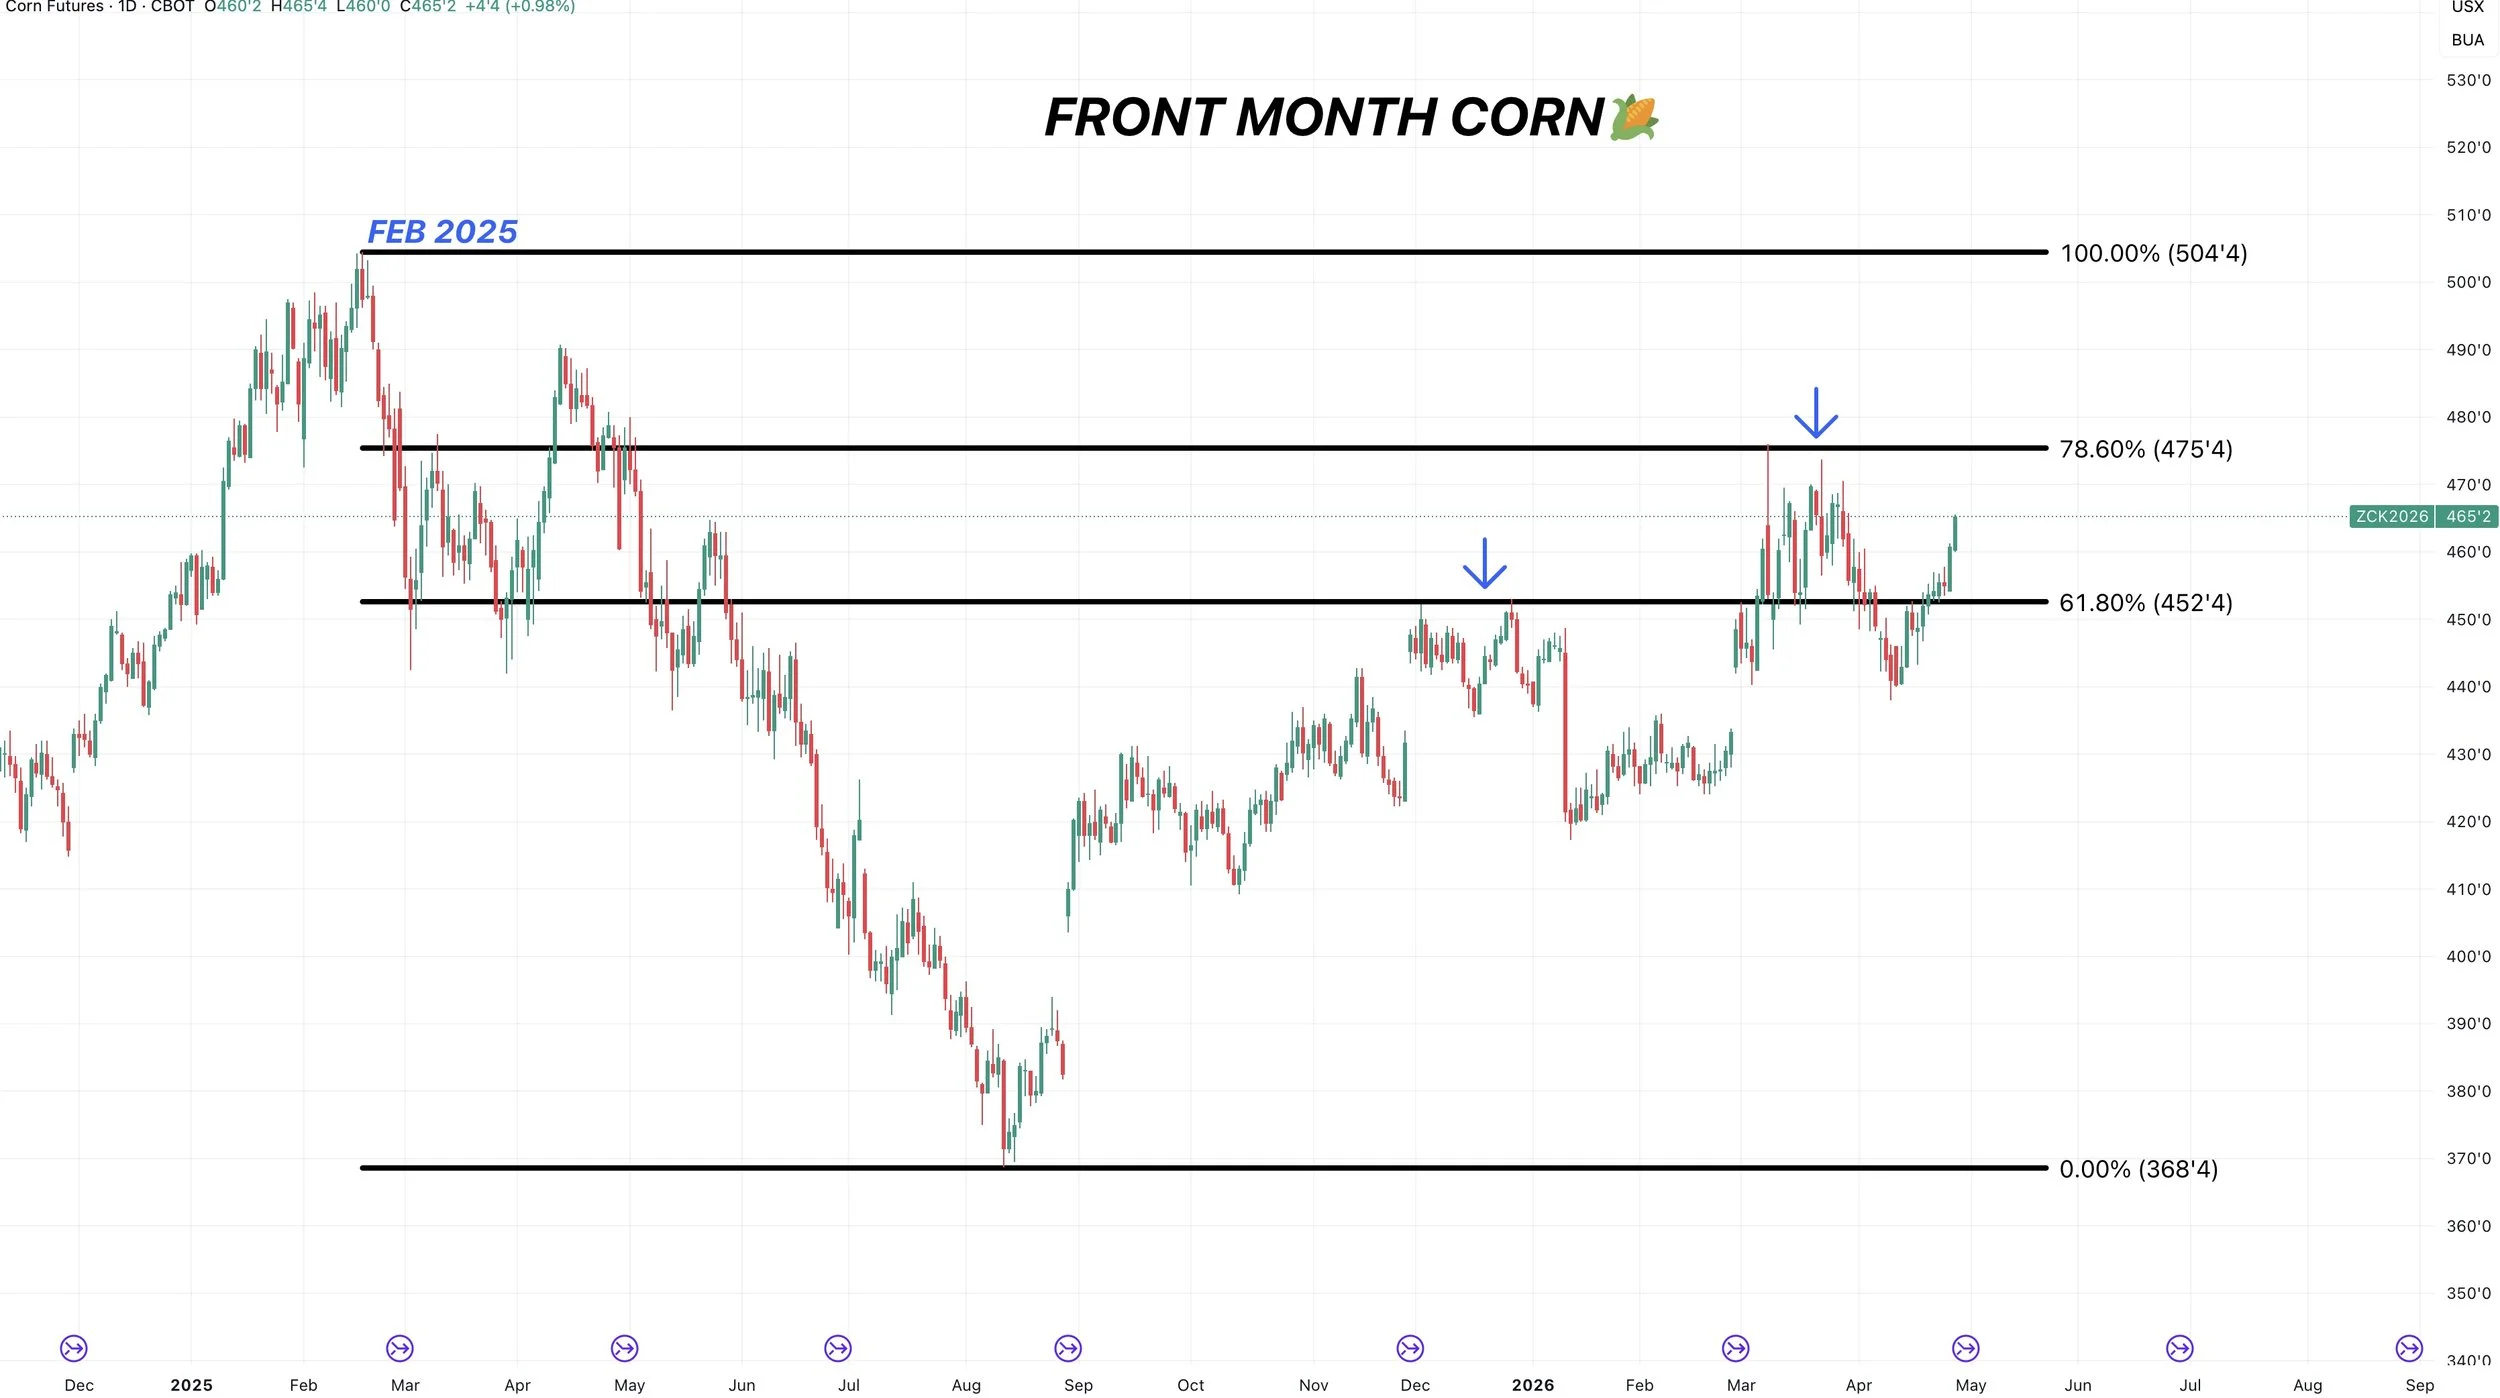
Here is the continuous chart for front month corn.
Currently, it shows May corn. But on Friday it will show July corn.
If you notice on this chart, when March was on leading it rejected the 61.8% level.
When May was leading it rejected the 78.6% level.
When this chart rolls to May, we will be right about at that 78.6% level at $4.75
So the next major point of interest would be those highs at $5.00 from February 2025.
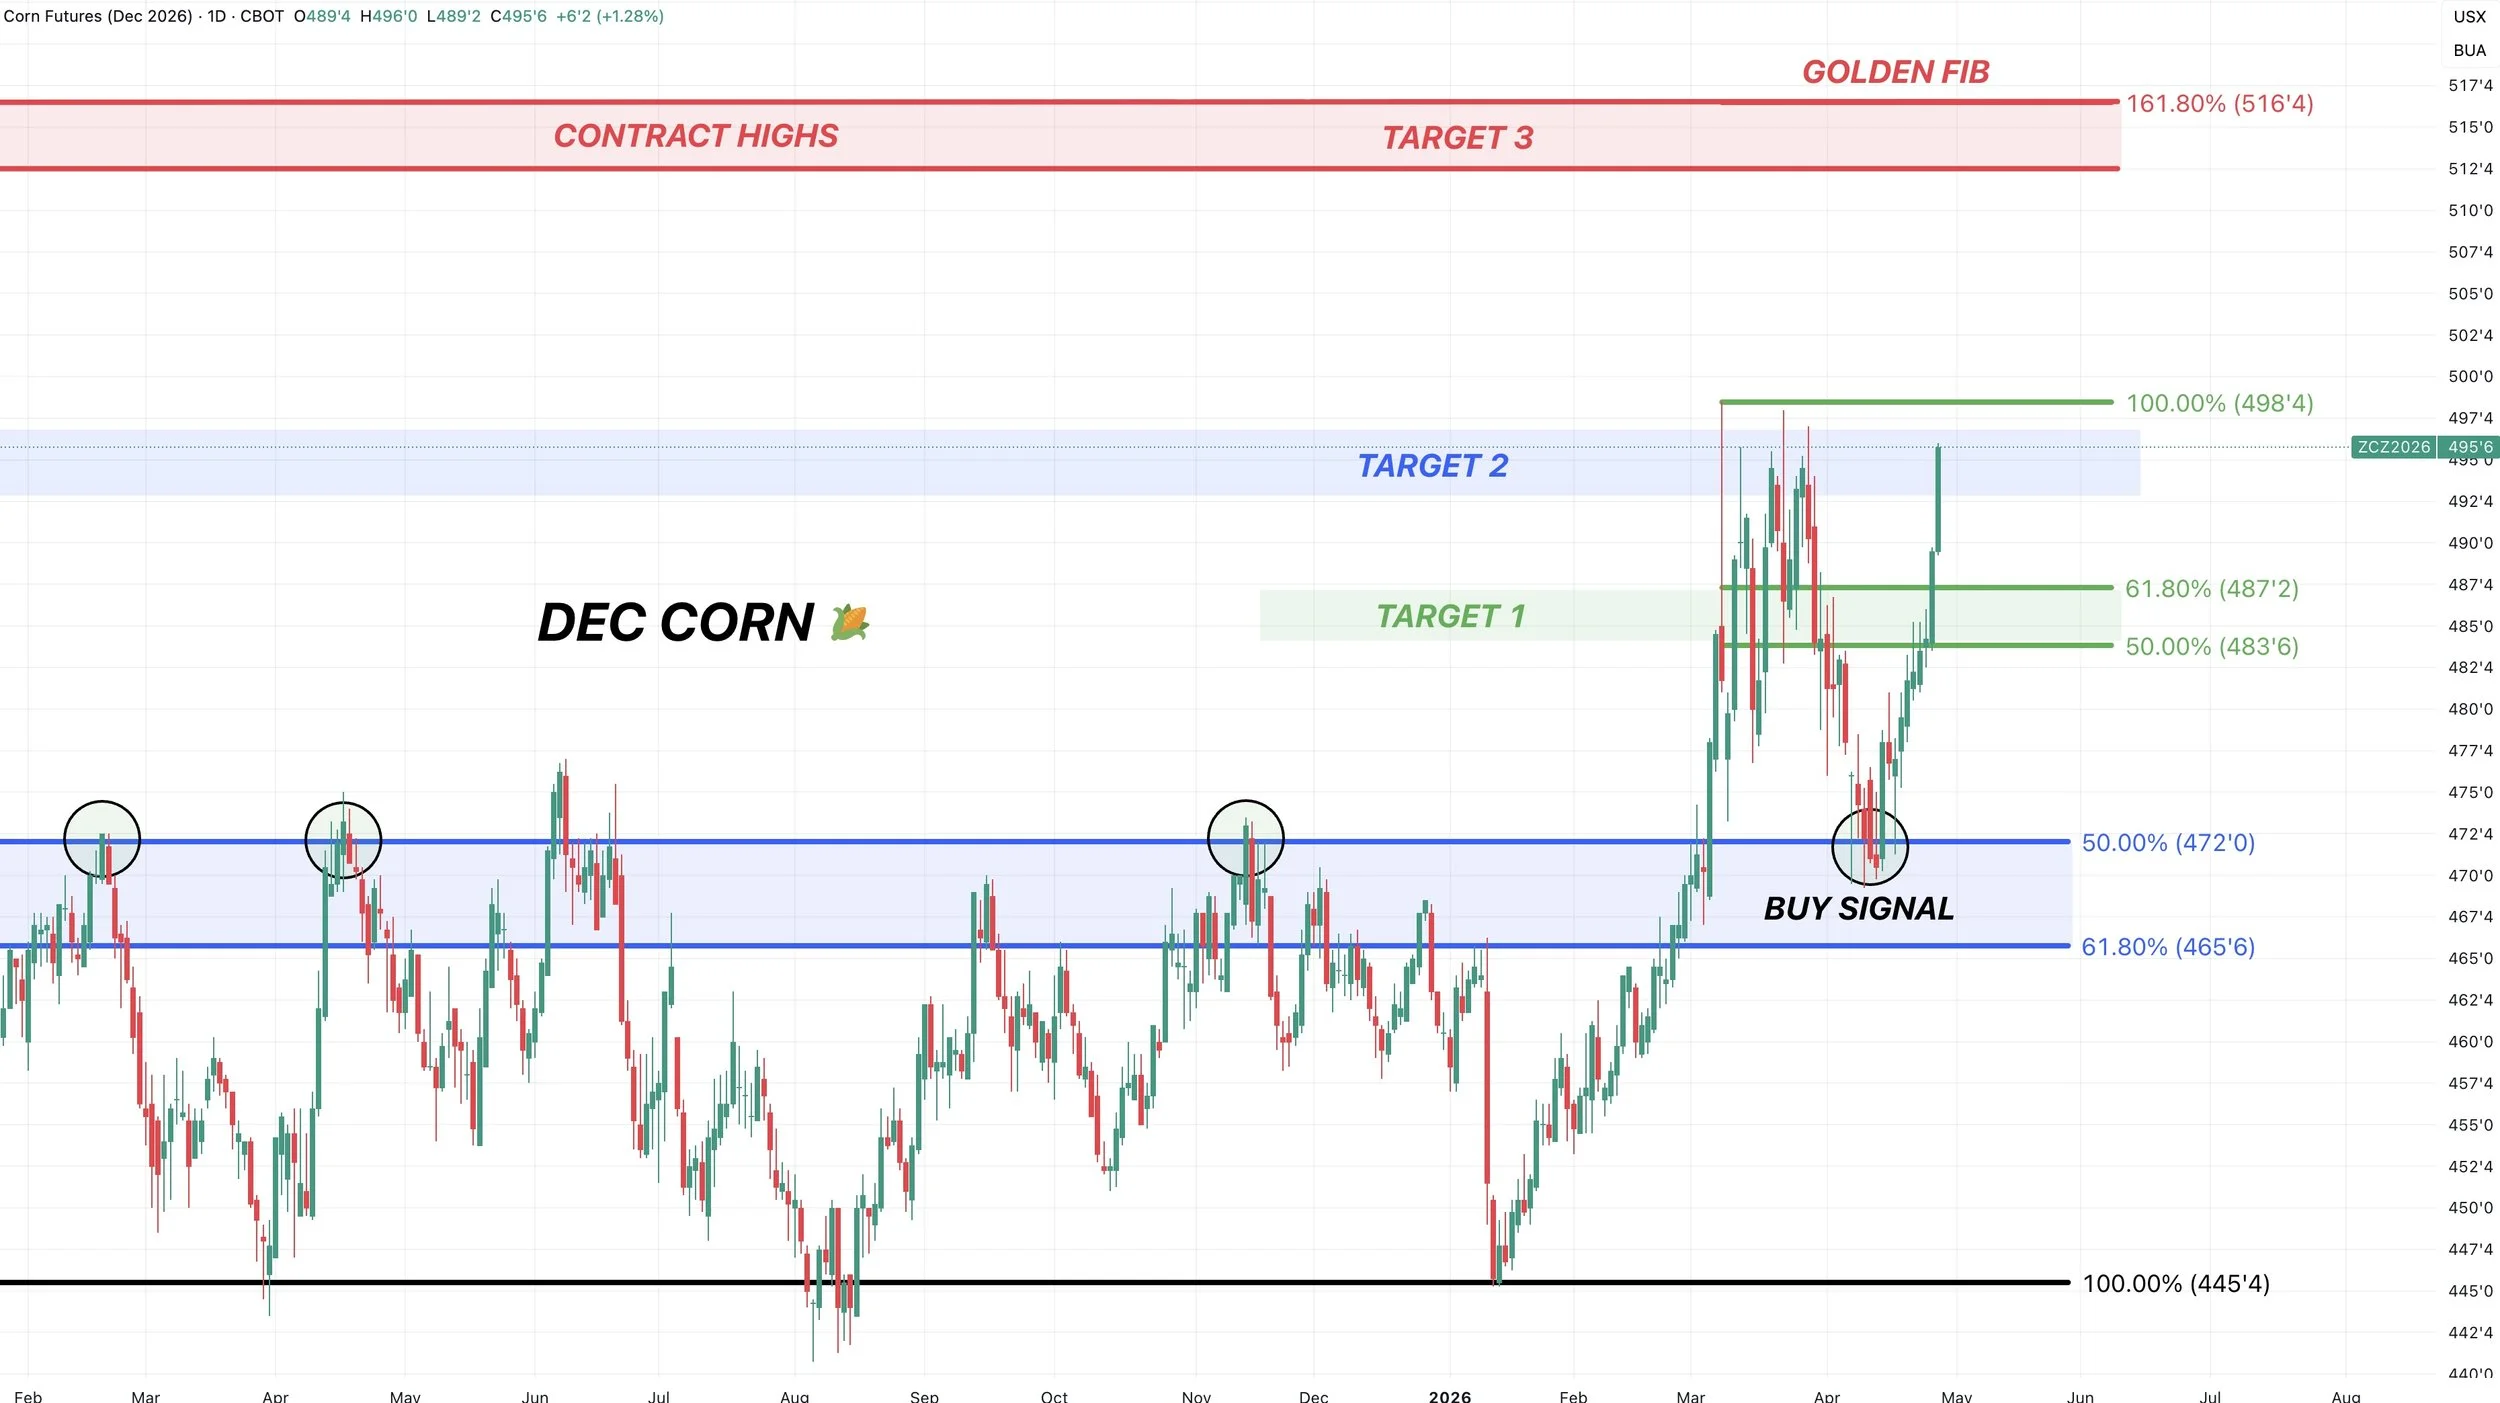
Dec Corn Chart:
Dec corn looks great. We actually posted a new high close today.
The first rally failed after closing that big gap. Which was the original $4.96 target back in March. So if you missed that target we are right back at the highs.
We then came down and found a bottom right where we needed to. We gave back 50% of the entire rally. That same level was previous resistance where this market failed to break through on multiple occasions.
Now currently sitting right at those March highs and some big resistance.
If we can break above, it should lead to the next leg higher.
The next target is $5.12 to $5.15
$5.12 is the contract highs.
$5.15 is the golden fib extension from the recent sell off. Meaning $5.15 is 161.8% of the recent lows up to those March highs. Which is a common continuation target.
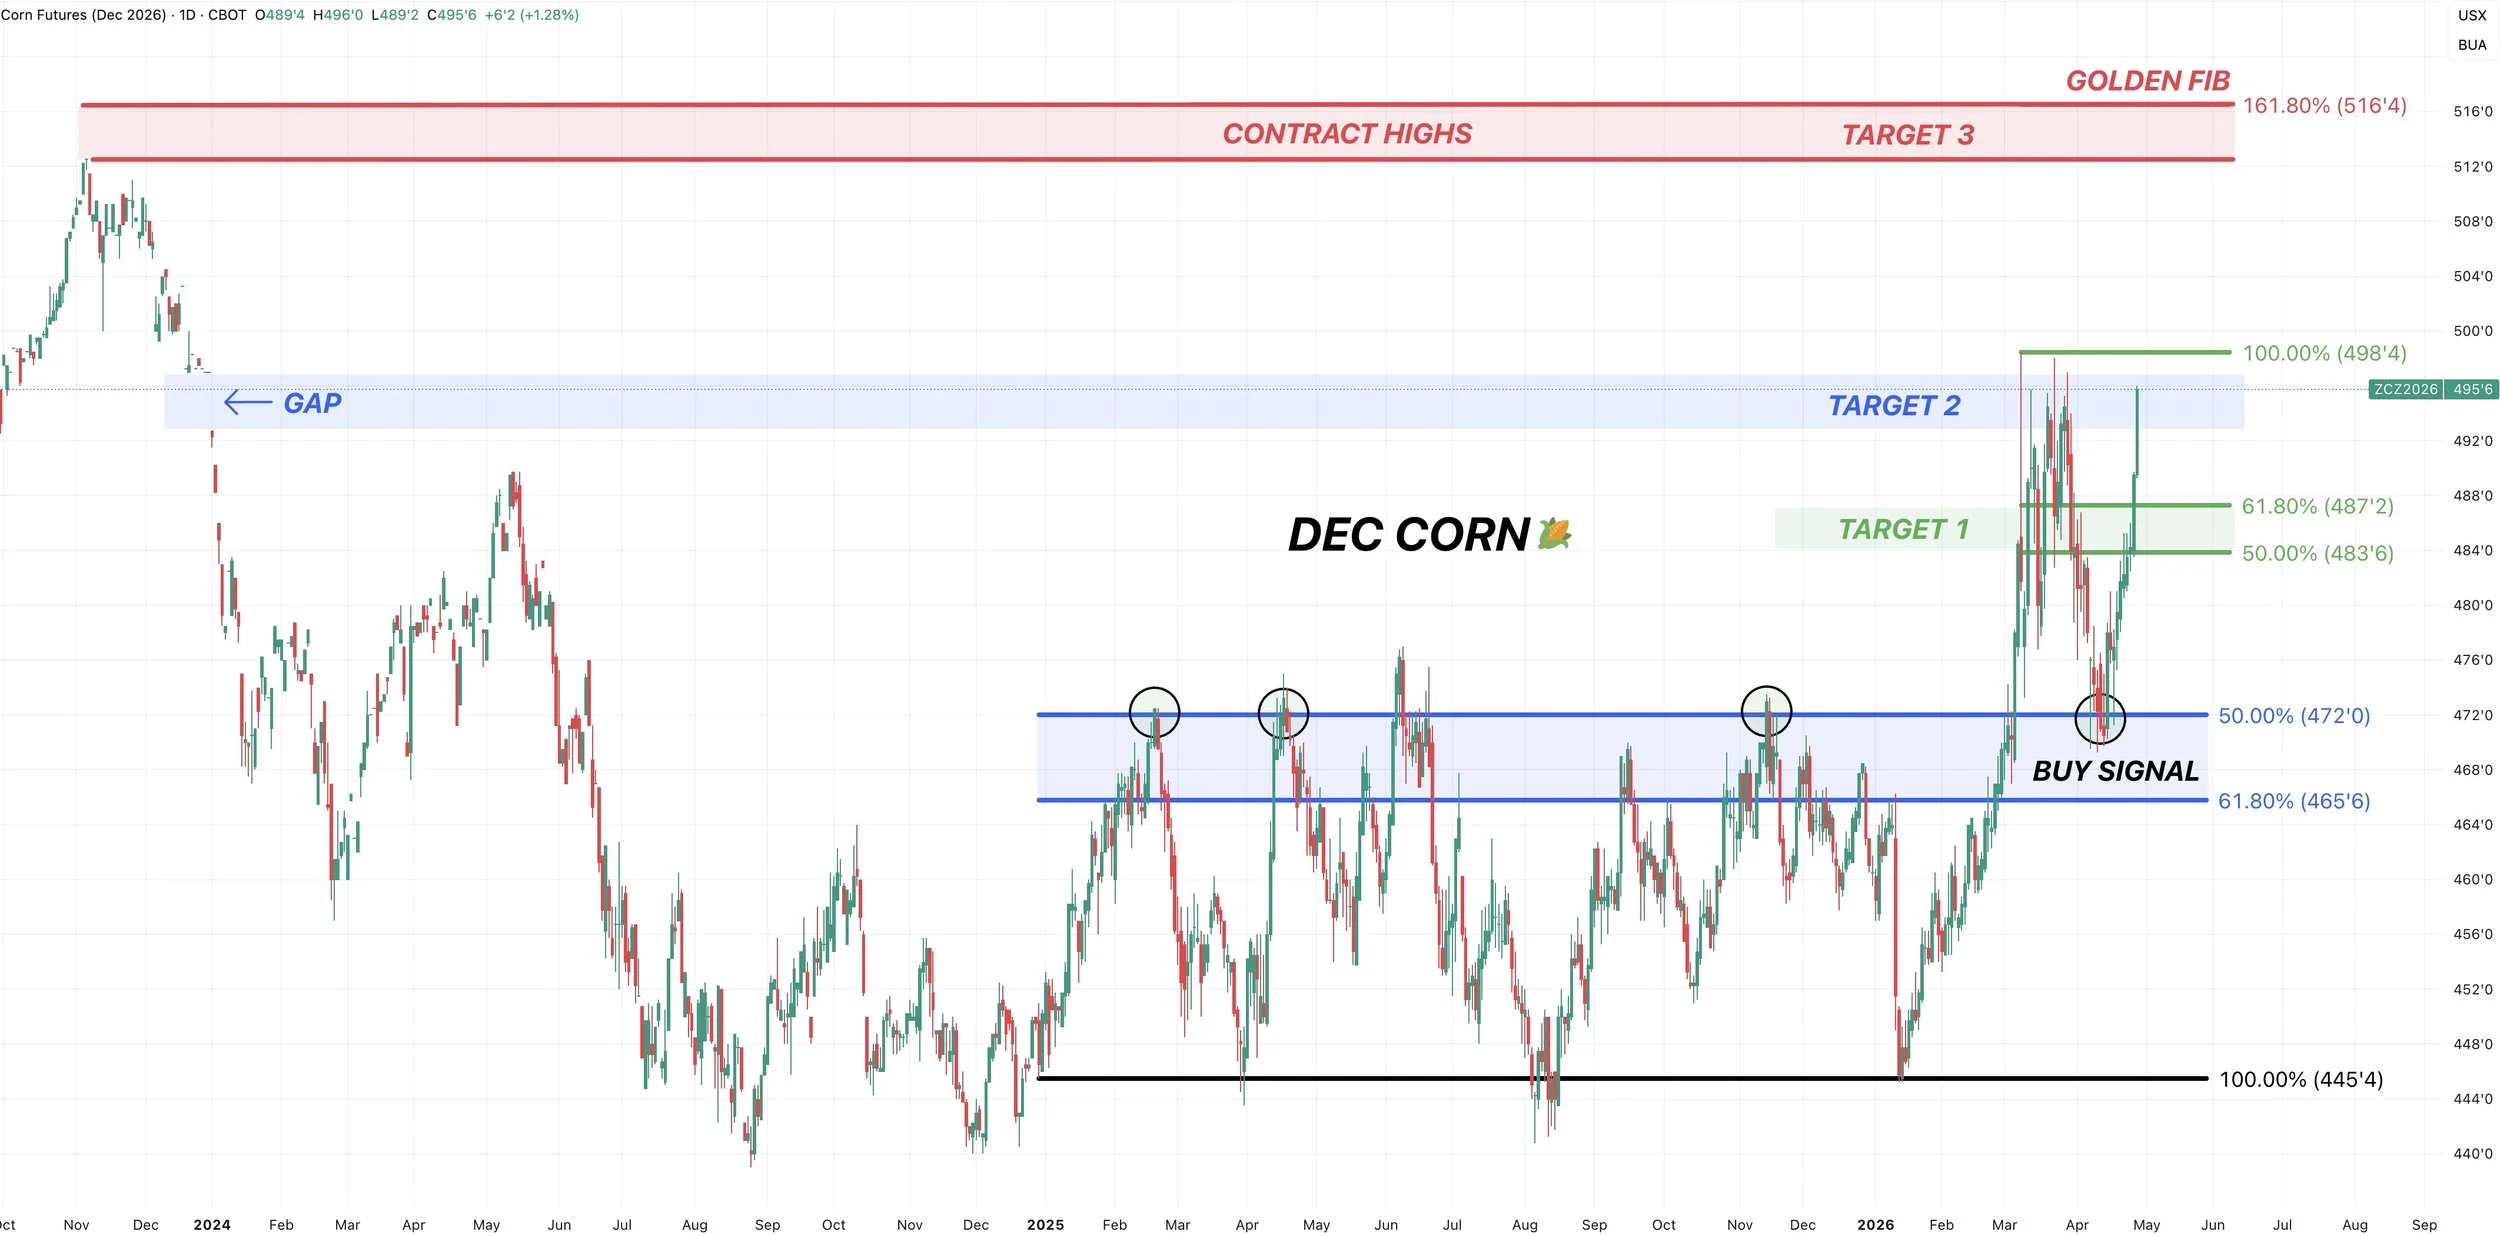
Here is a more zoomed in view.
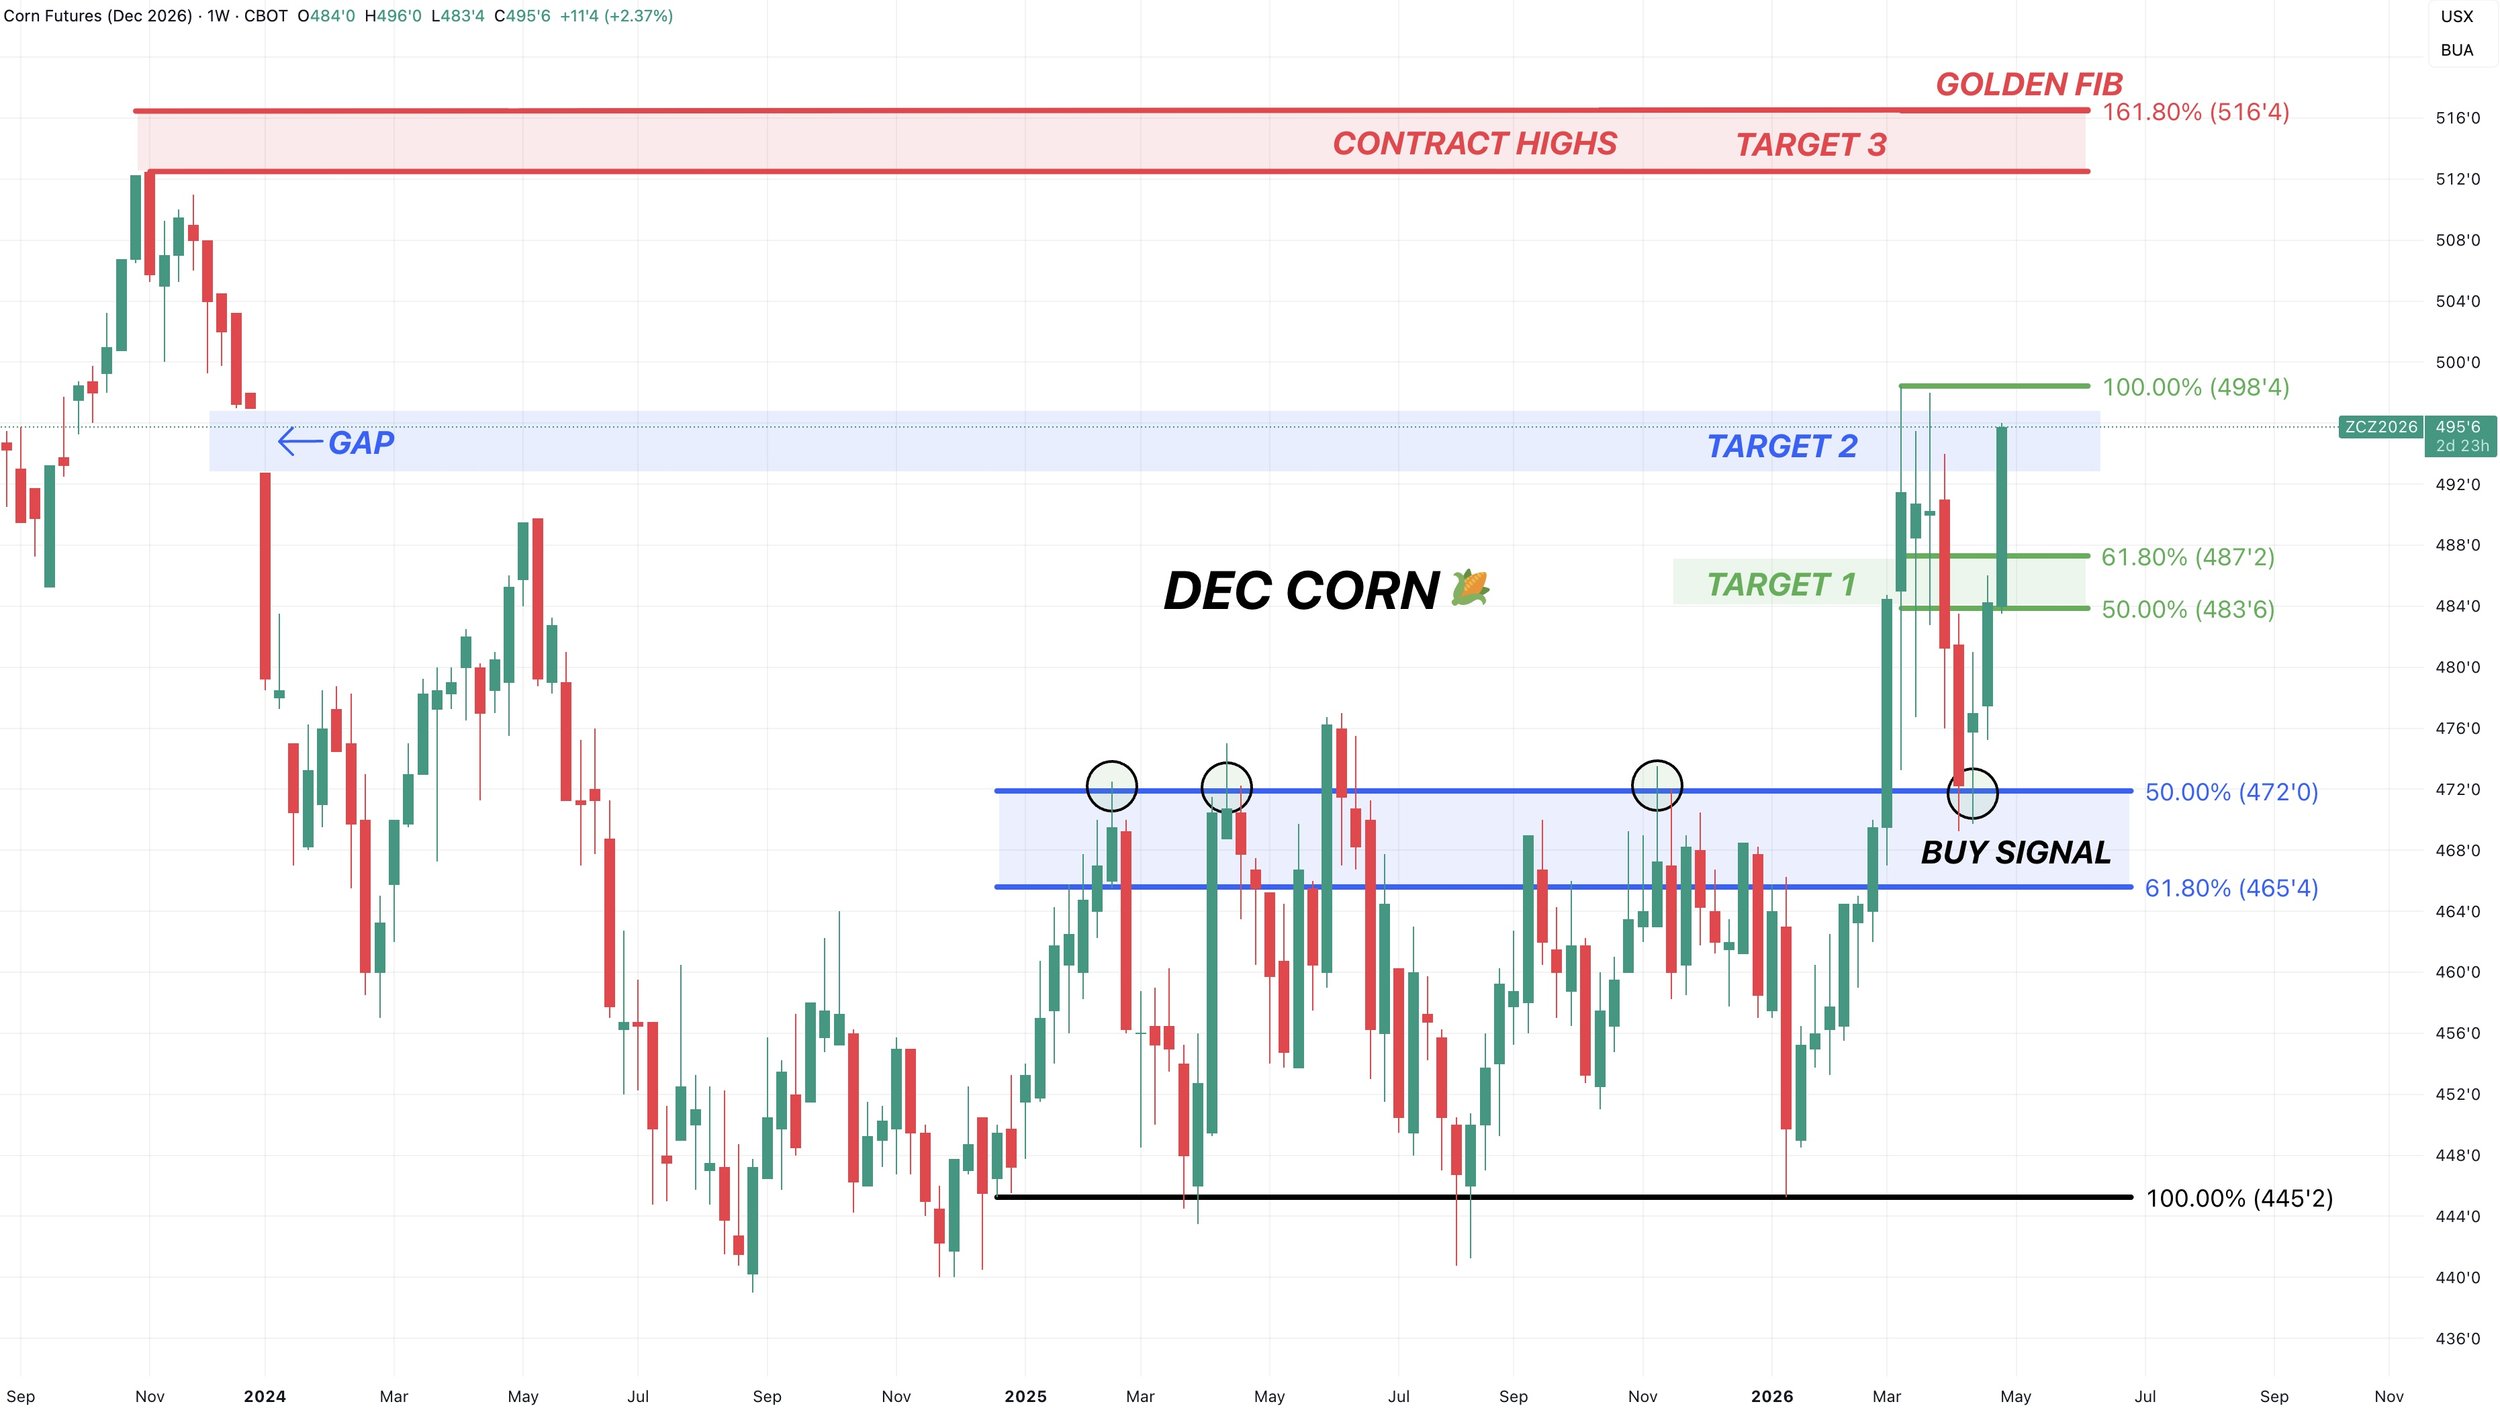
Here is the weekly view as well to give you another perspective.
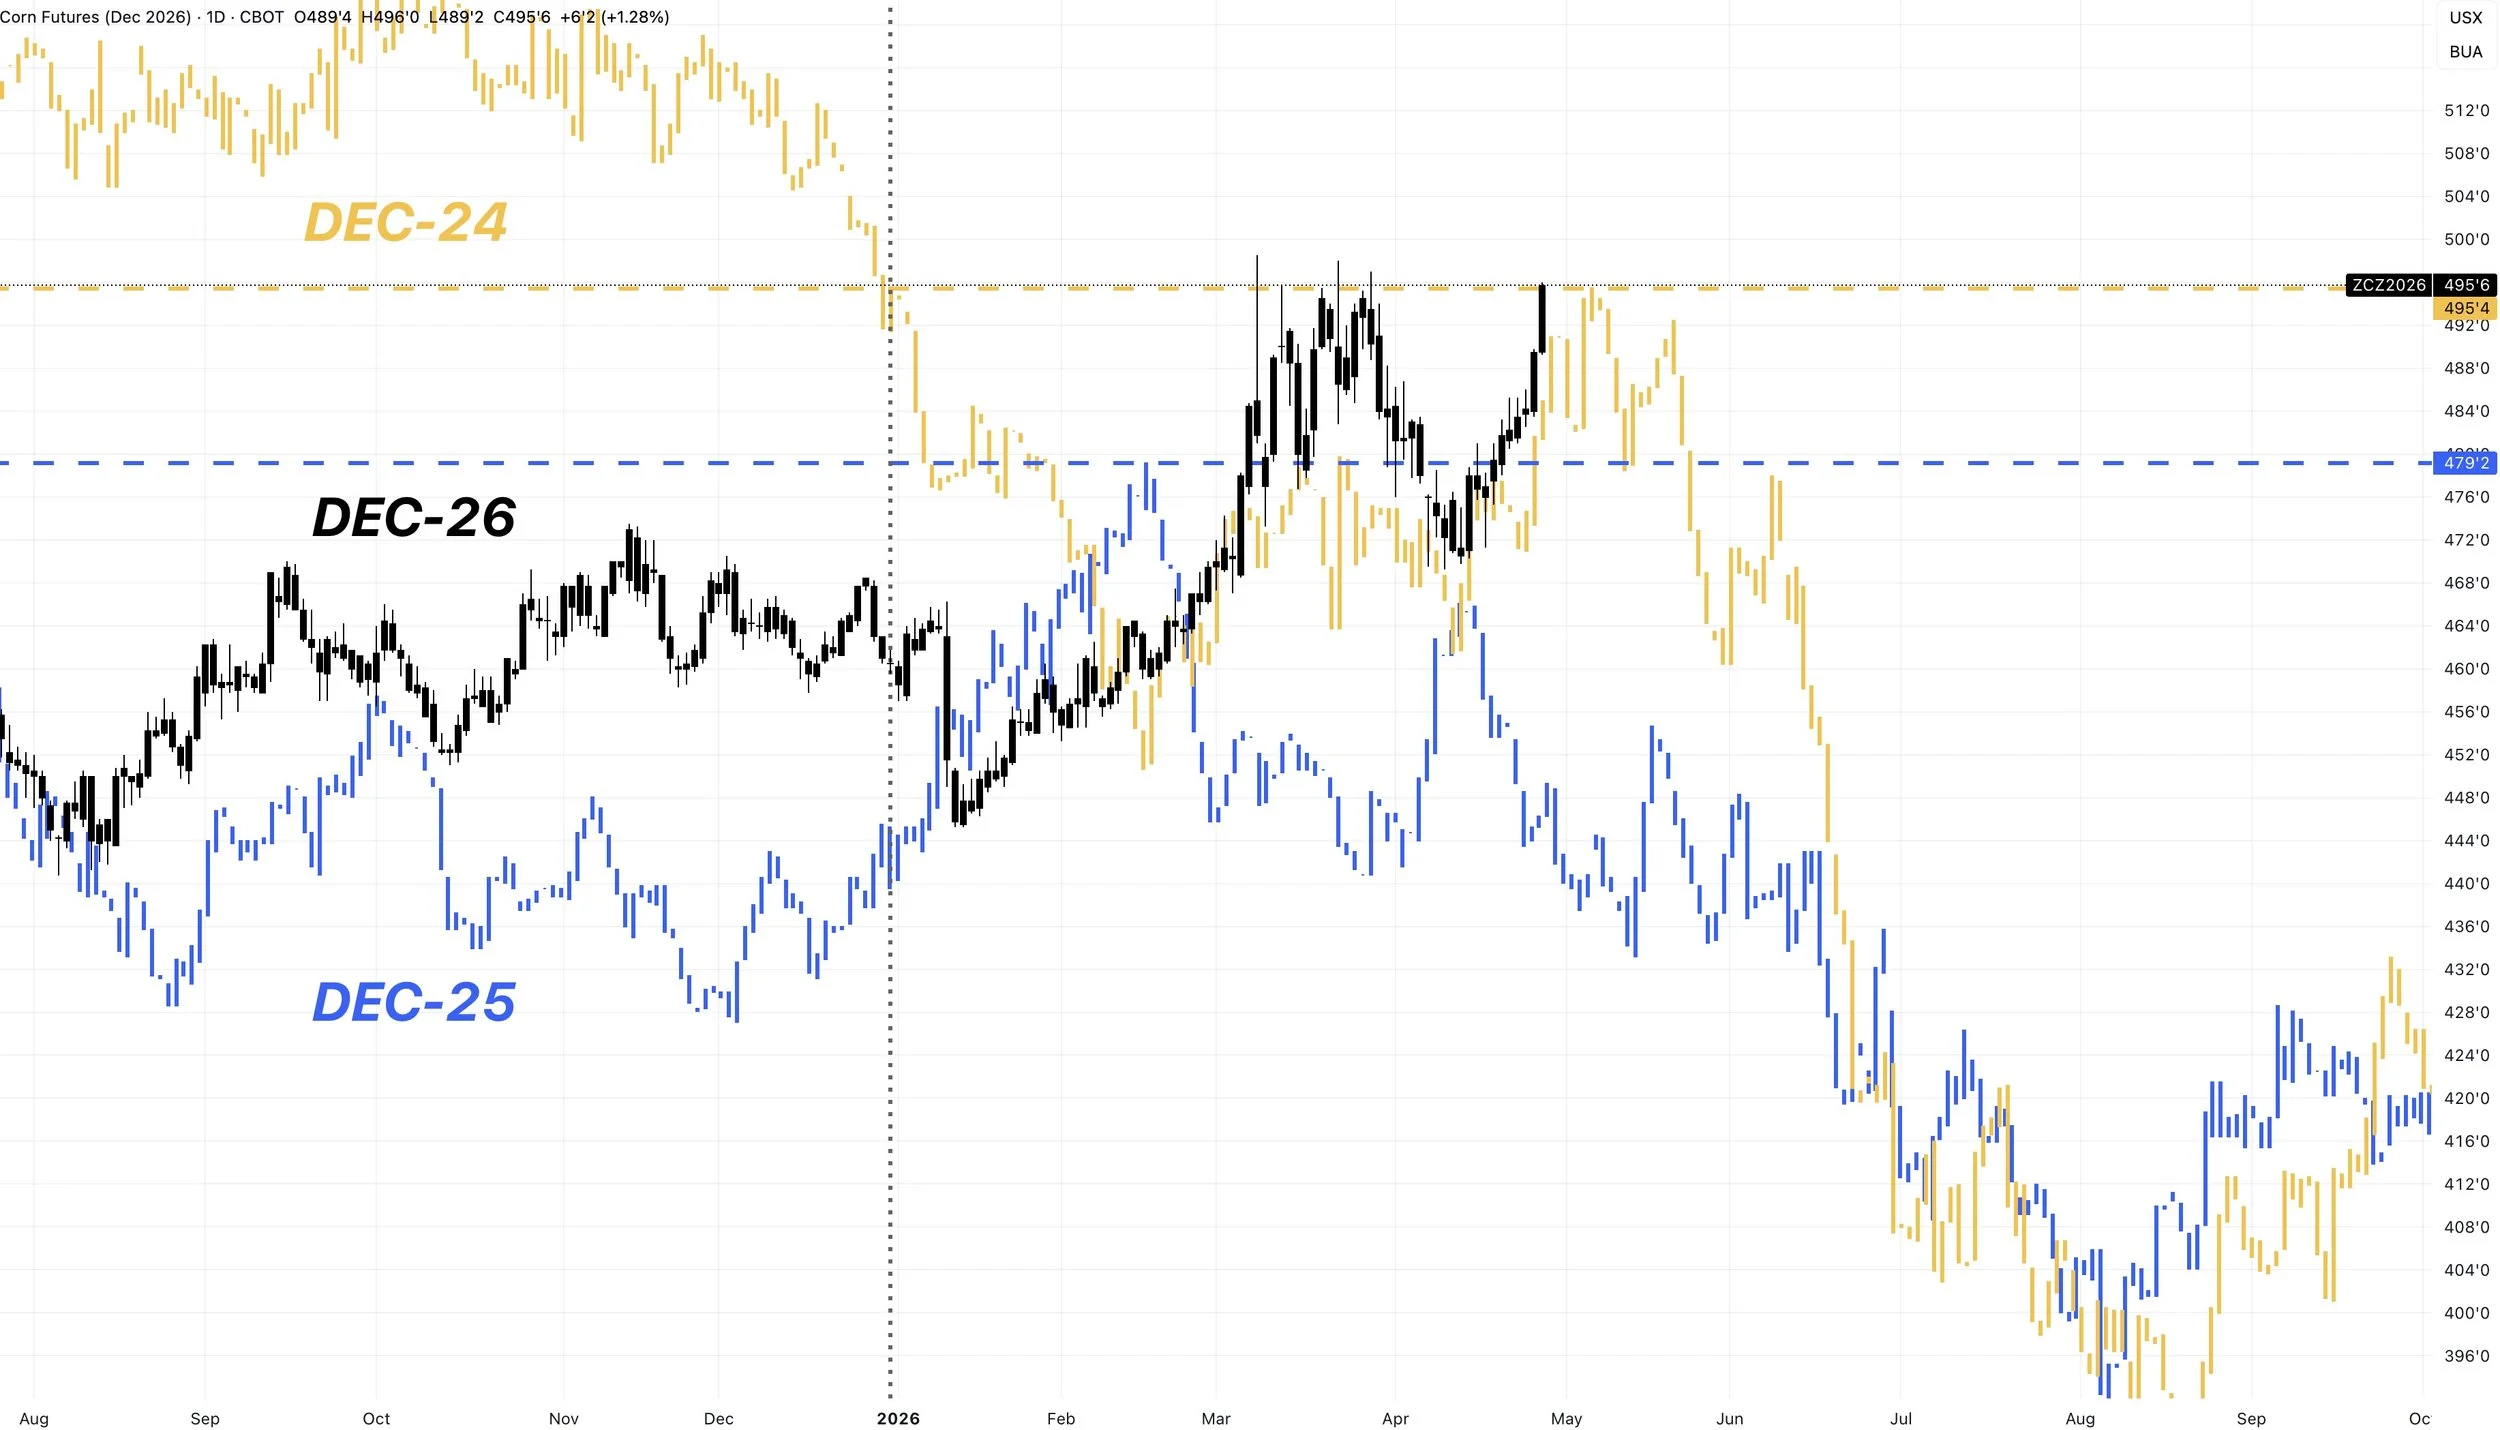
Dec Corn 2024 vs 2025 vs 2026:
December corn is trading at it's highest levels since 2023.
Don’t want to completely ignore 3 year highs.
Soybeans
Really not a ton to update on soybeans. Going to spend the least amount of time today here.
Soybeans are still simply waiting for a catalyst.
We've got that meeting with China in a little over two weeks.
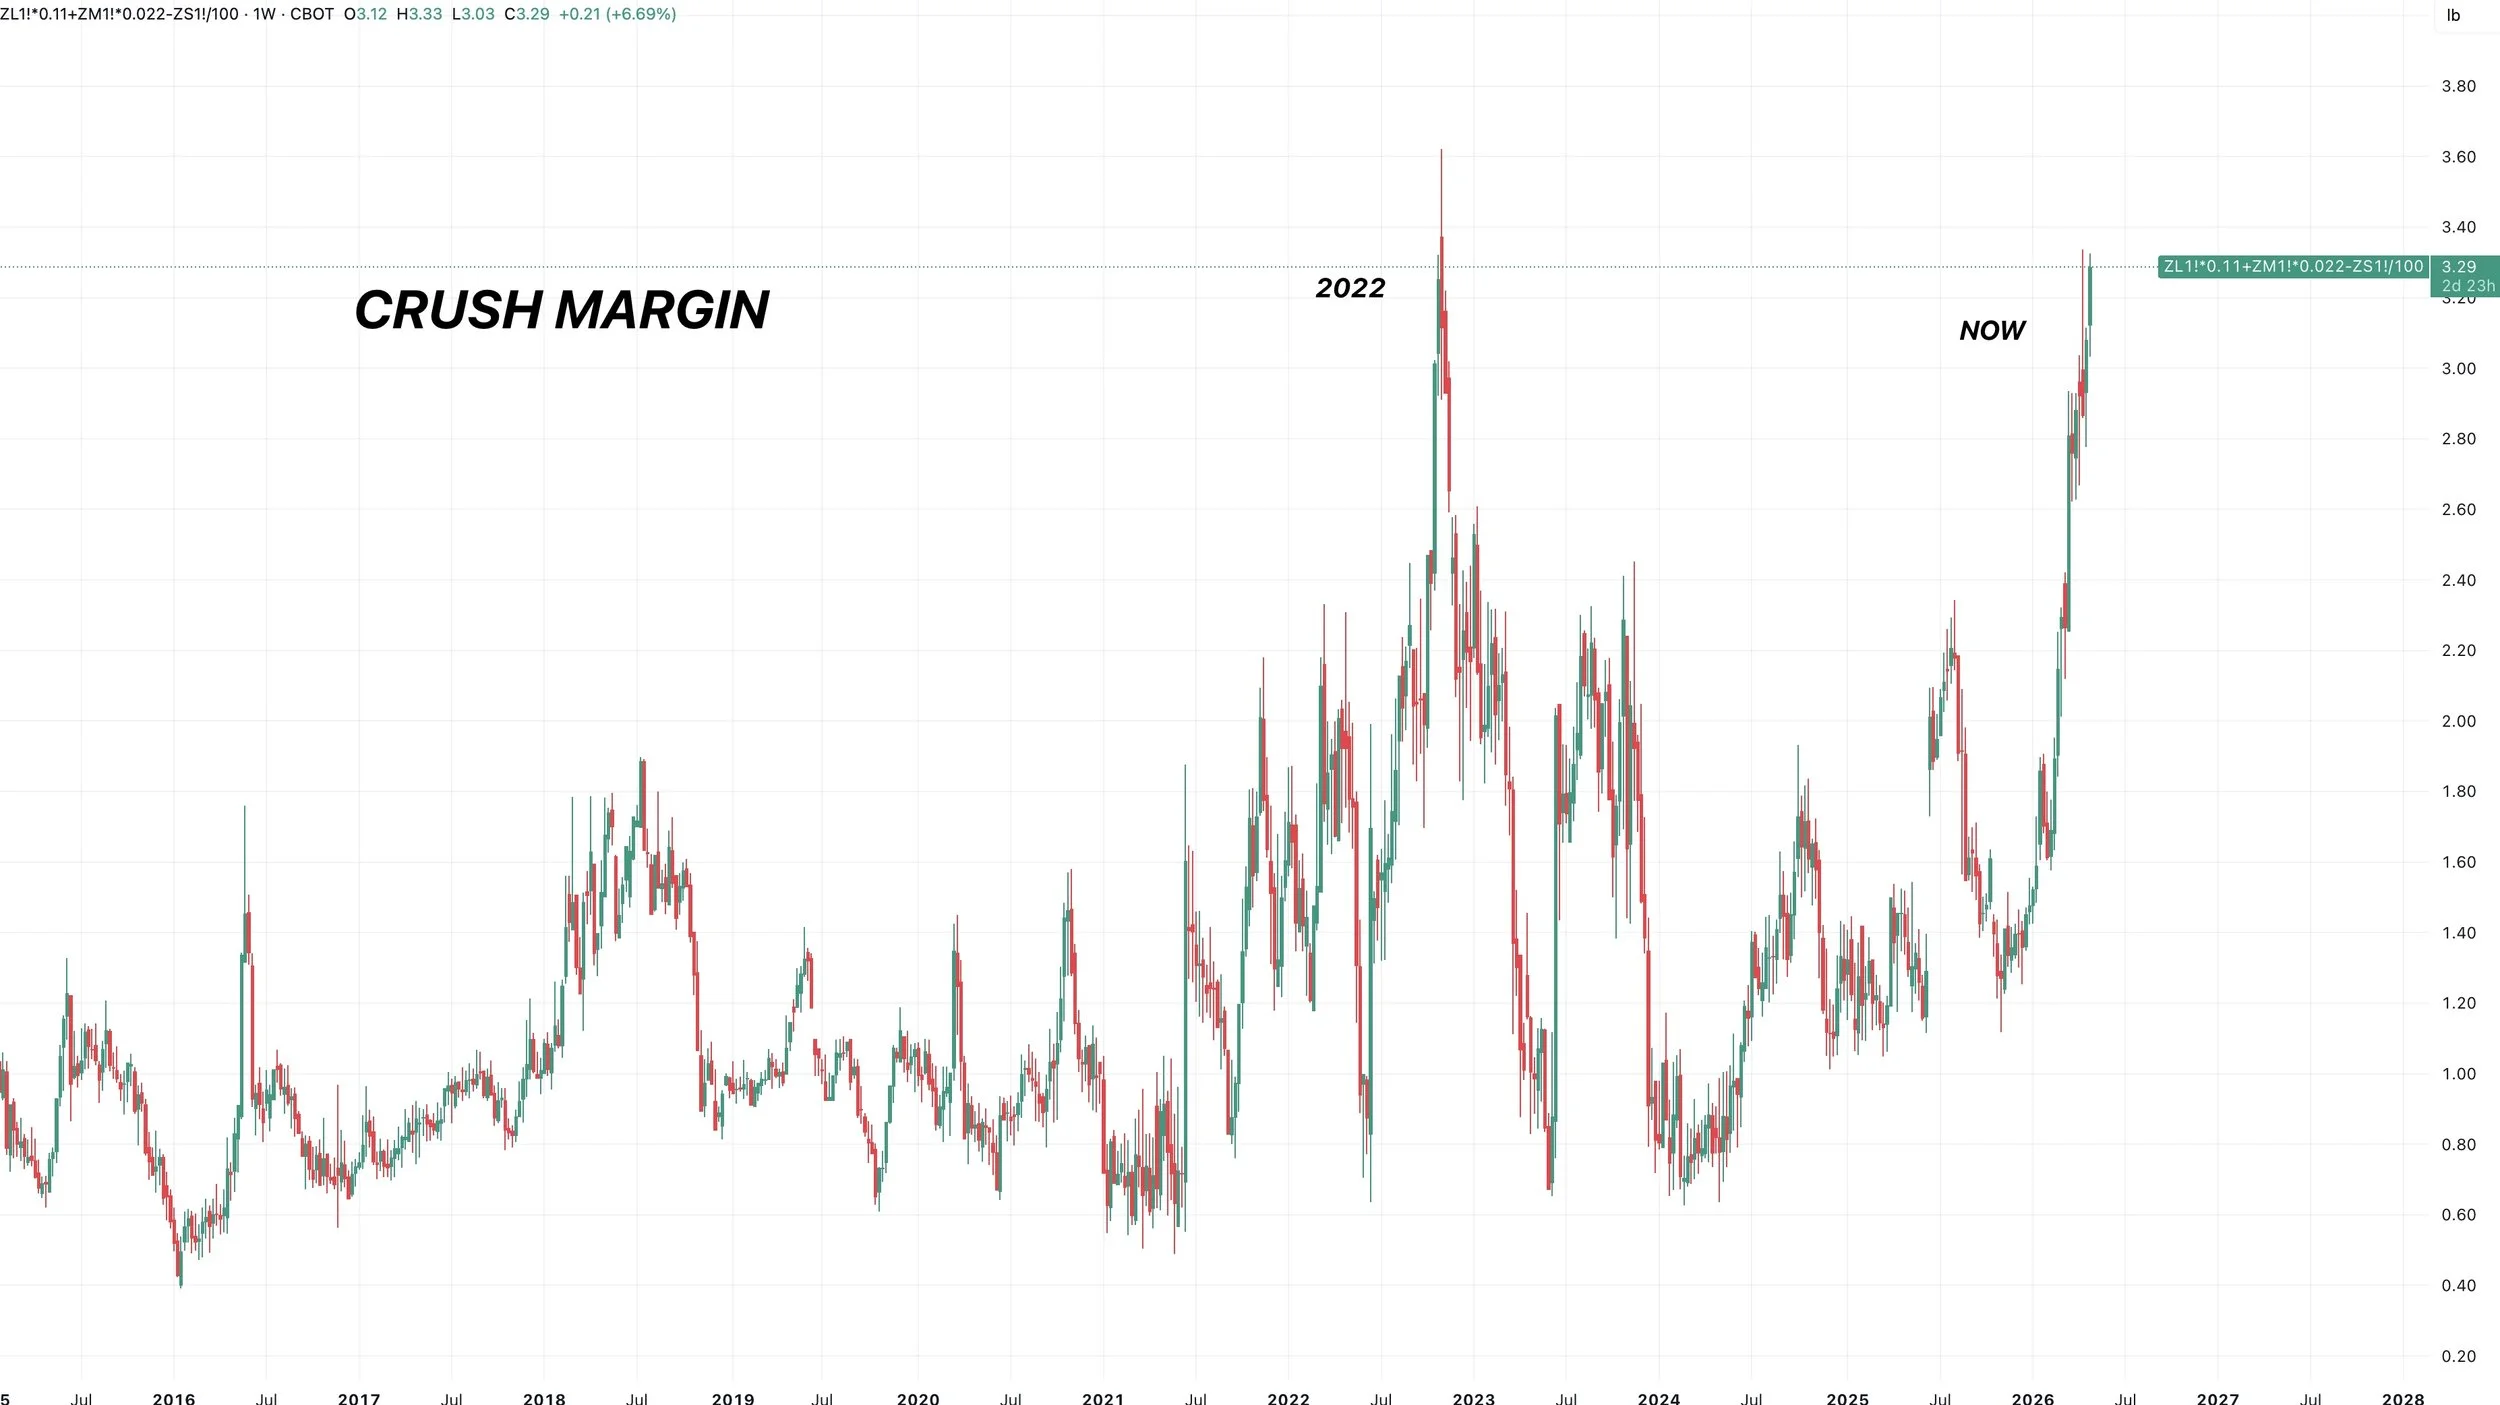
Something to note is that crush margins continue to soar.
Sitting at $3.30 today.
This would be the highest weekly close ever.
That is not bearish for soybeans.
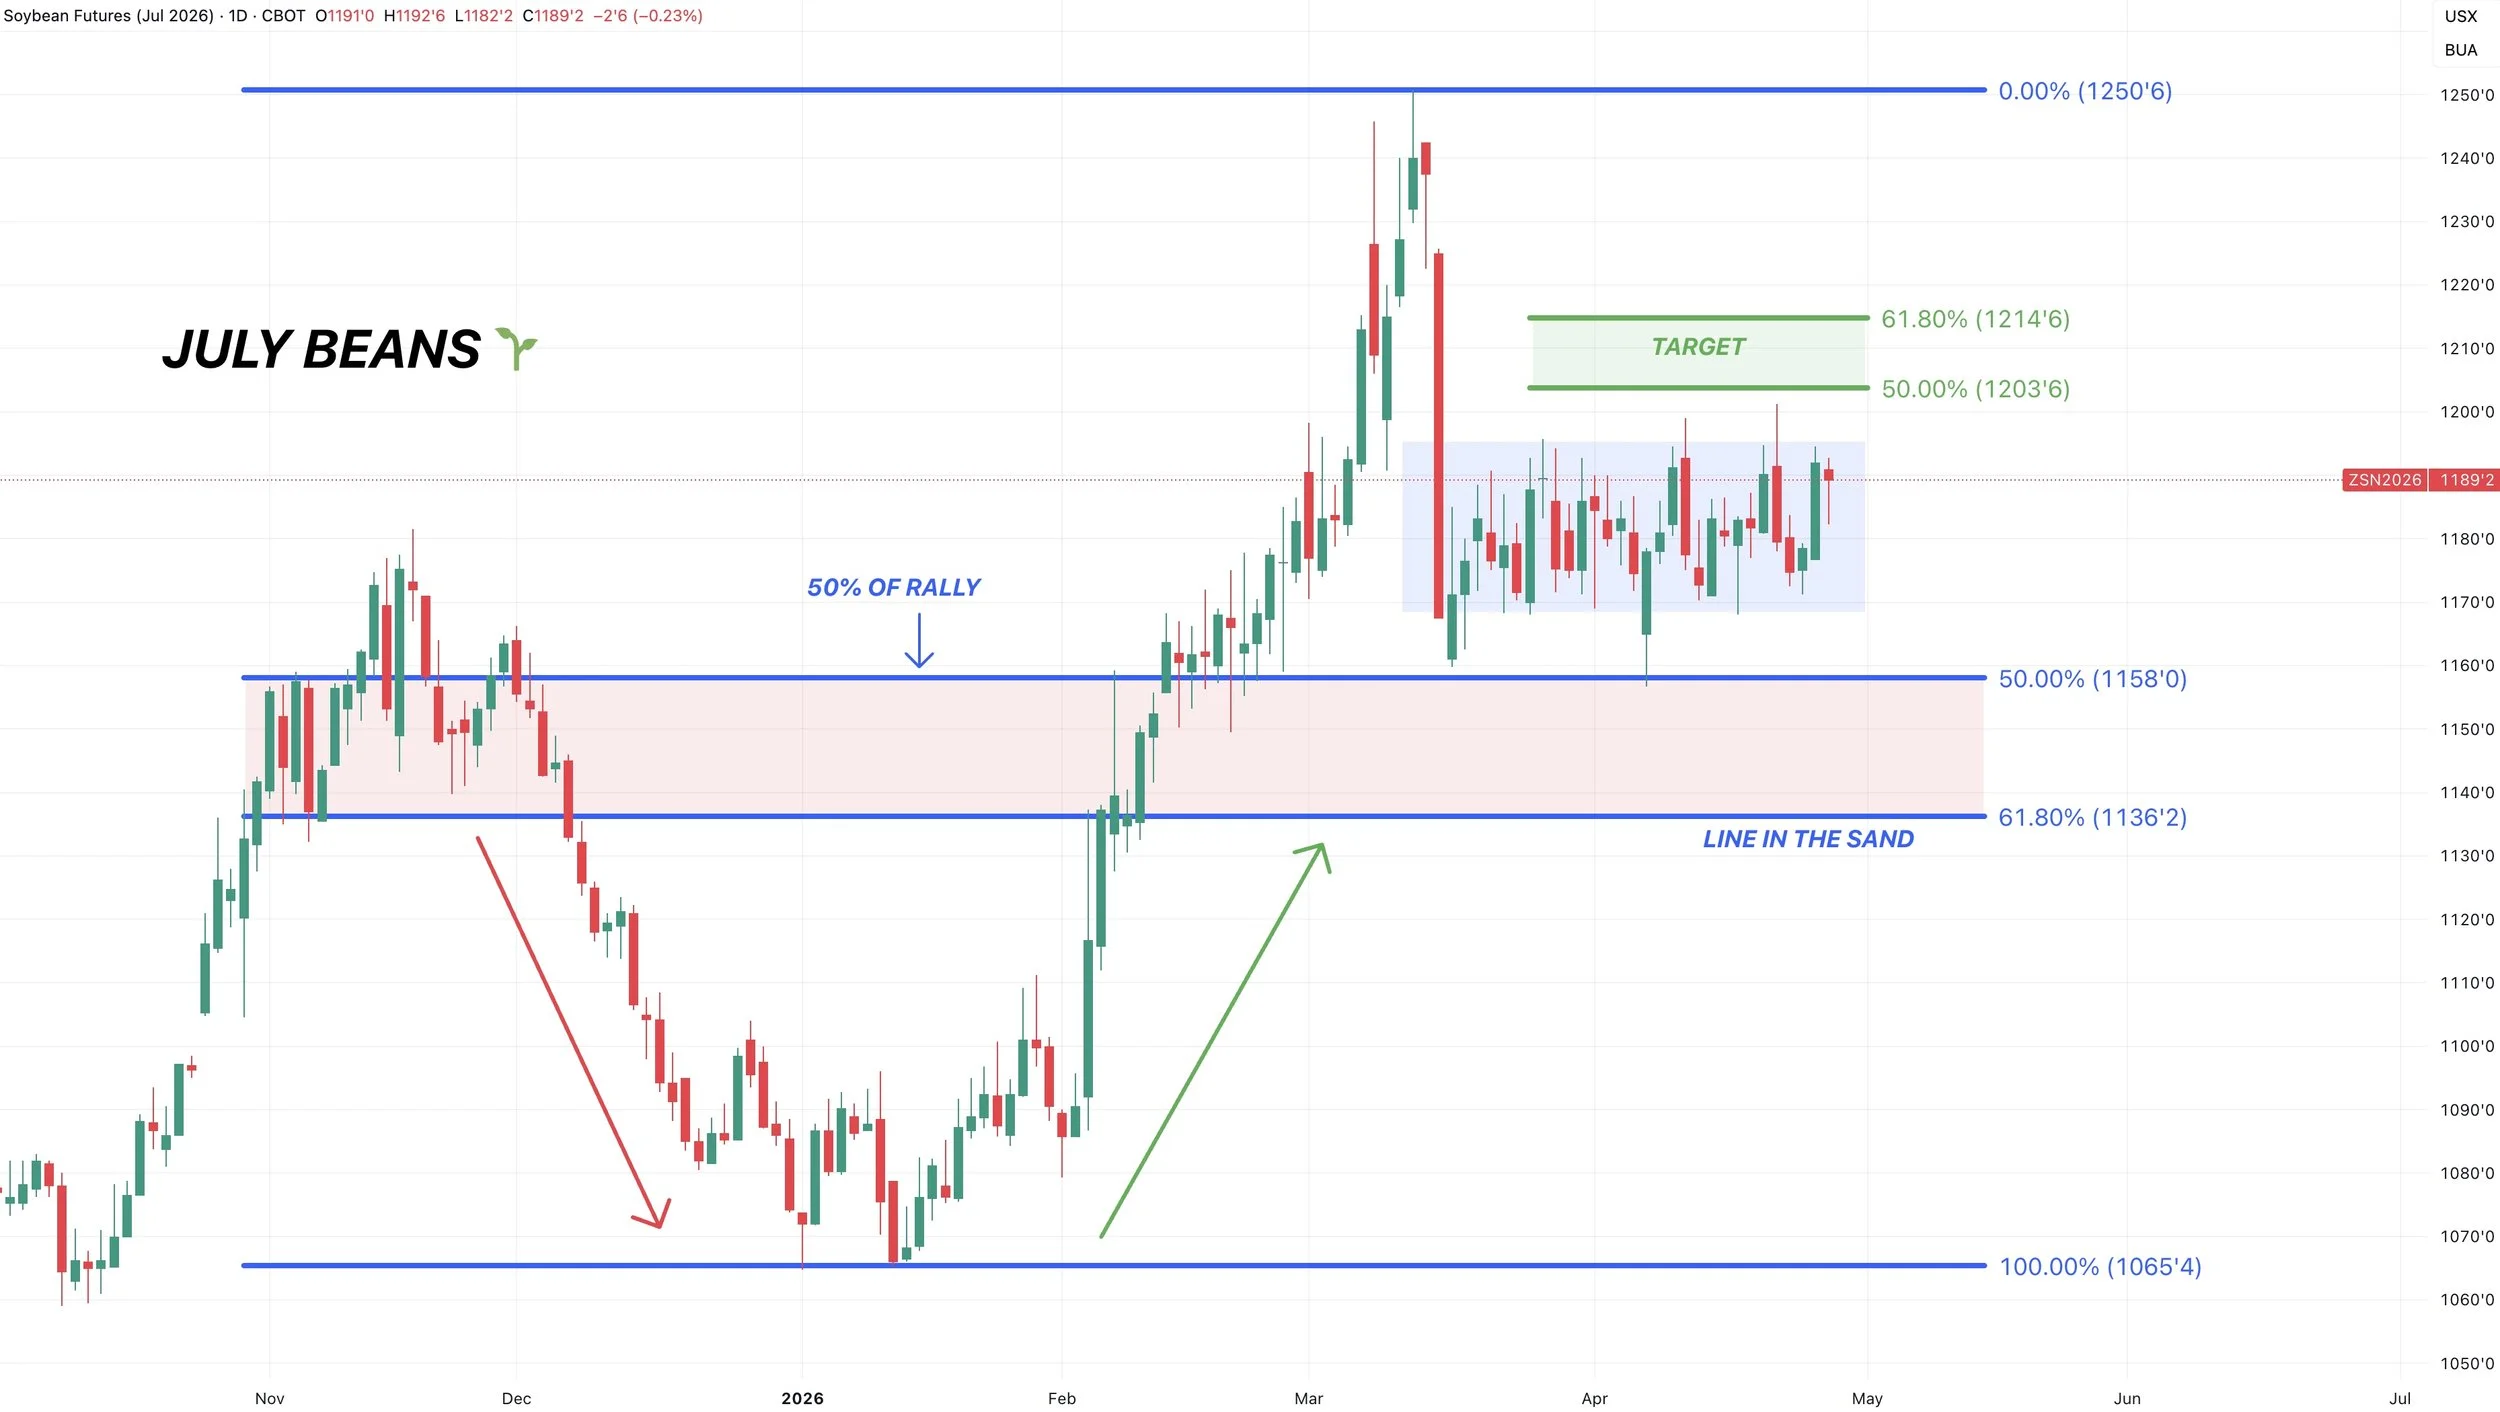
July Beans Chart:
Day 29 of the chop.
Soybeans have went absolutely nowhere for a month.
So we're coiling for a move whether that's higher or lower.
We've continued to build a nice base of support here.
You could argue that if soybeans were going to fall apart, wouldn’t we have already done so by now?
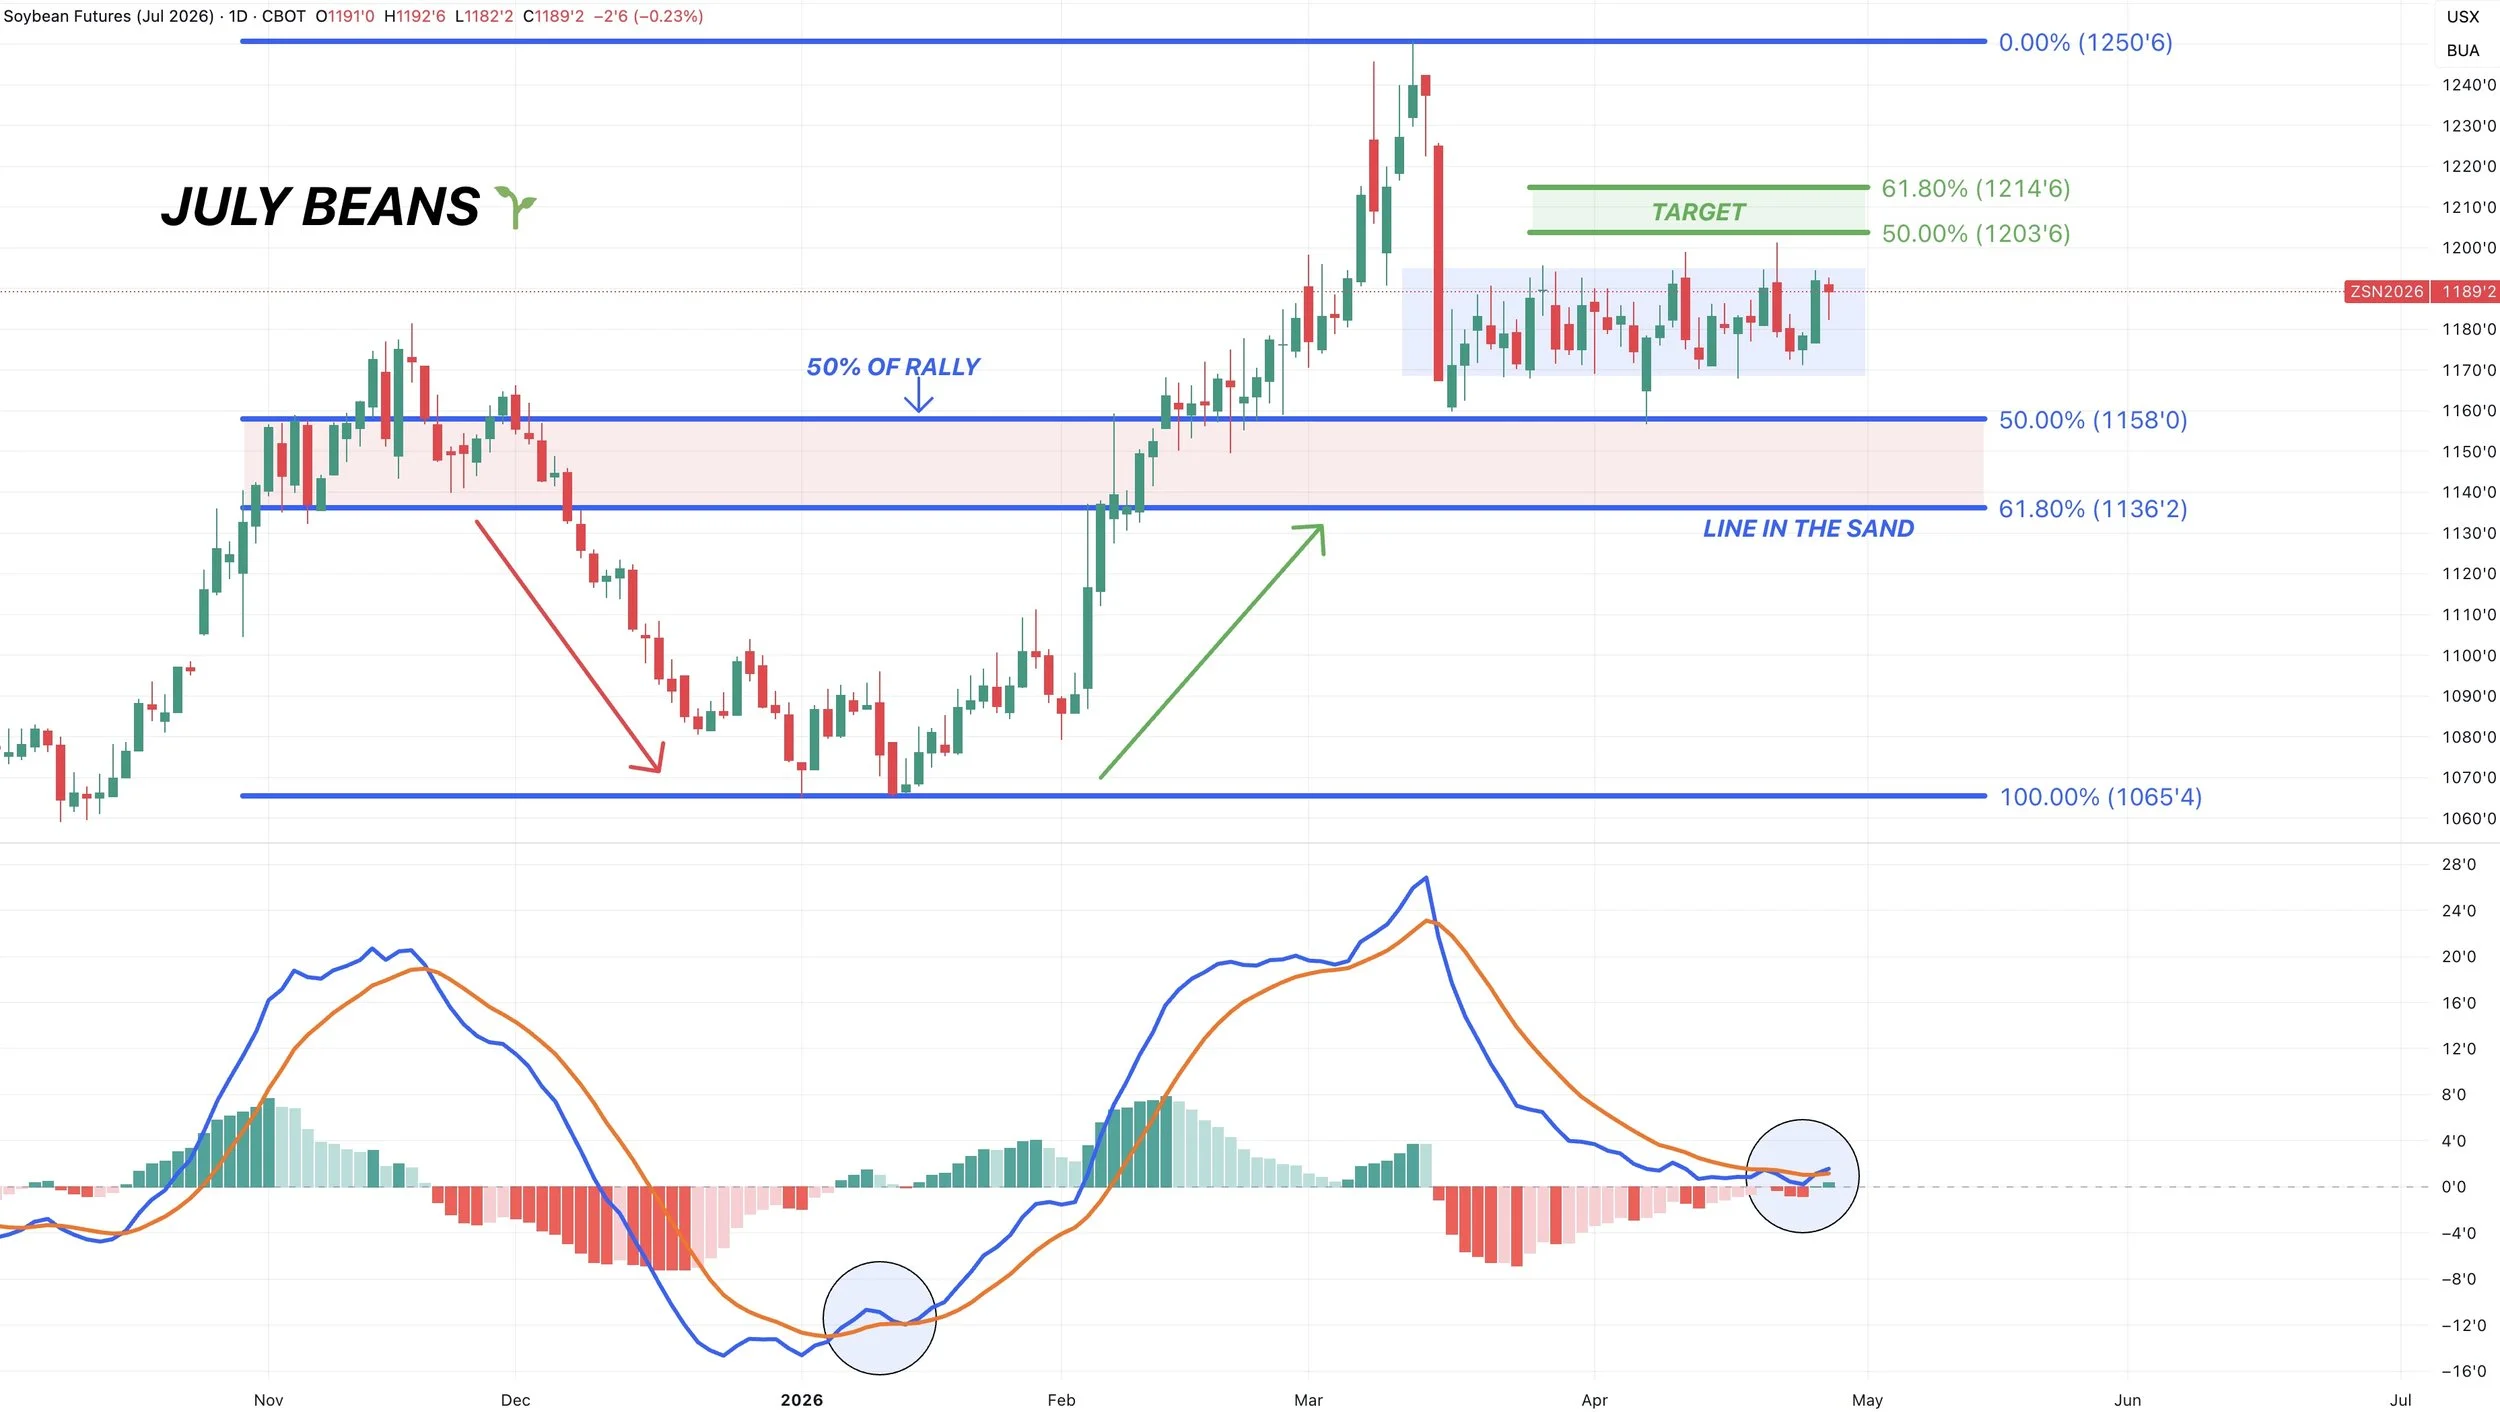
MACD Flipped Bullish:
Something to note is that the MACD did flip bullish for the first time since those January lows.
This isn’t a perfect indicator by any means. But it does tell us that momentum may have shifted higher here.
The MACD simply tells us where the momentum is.
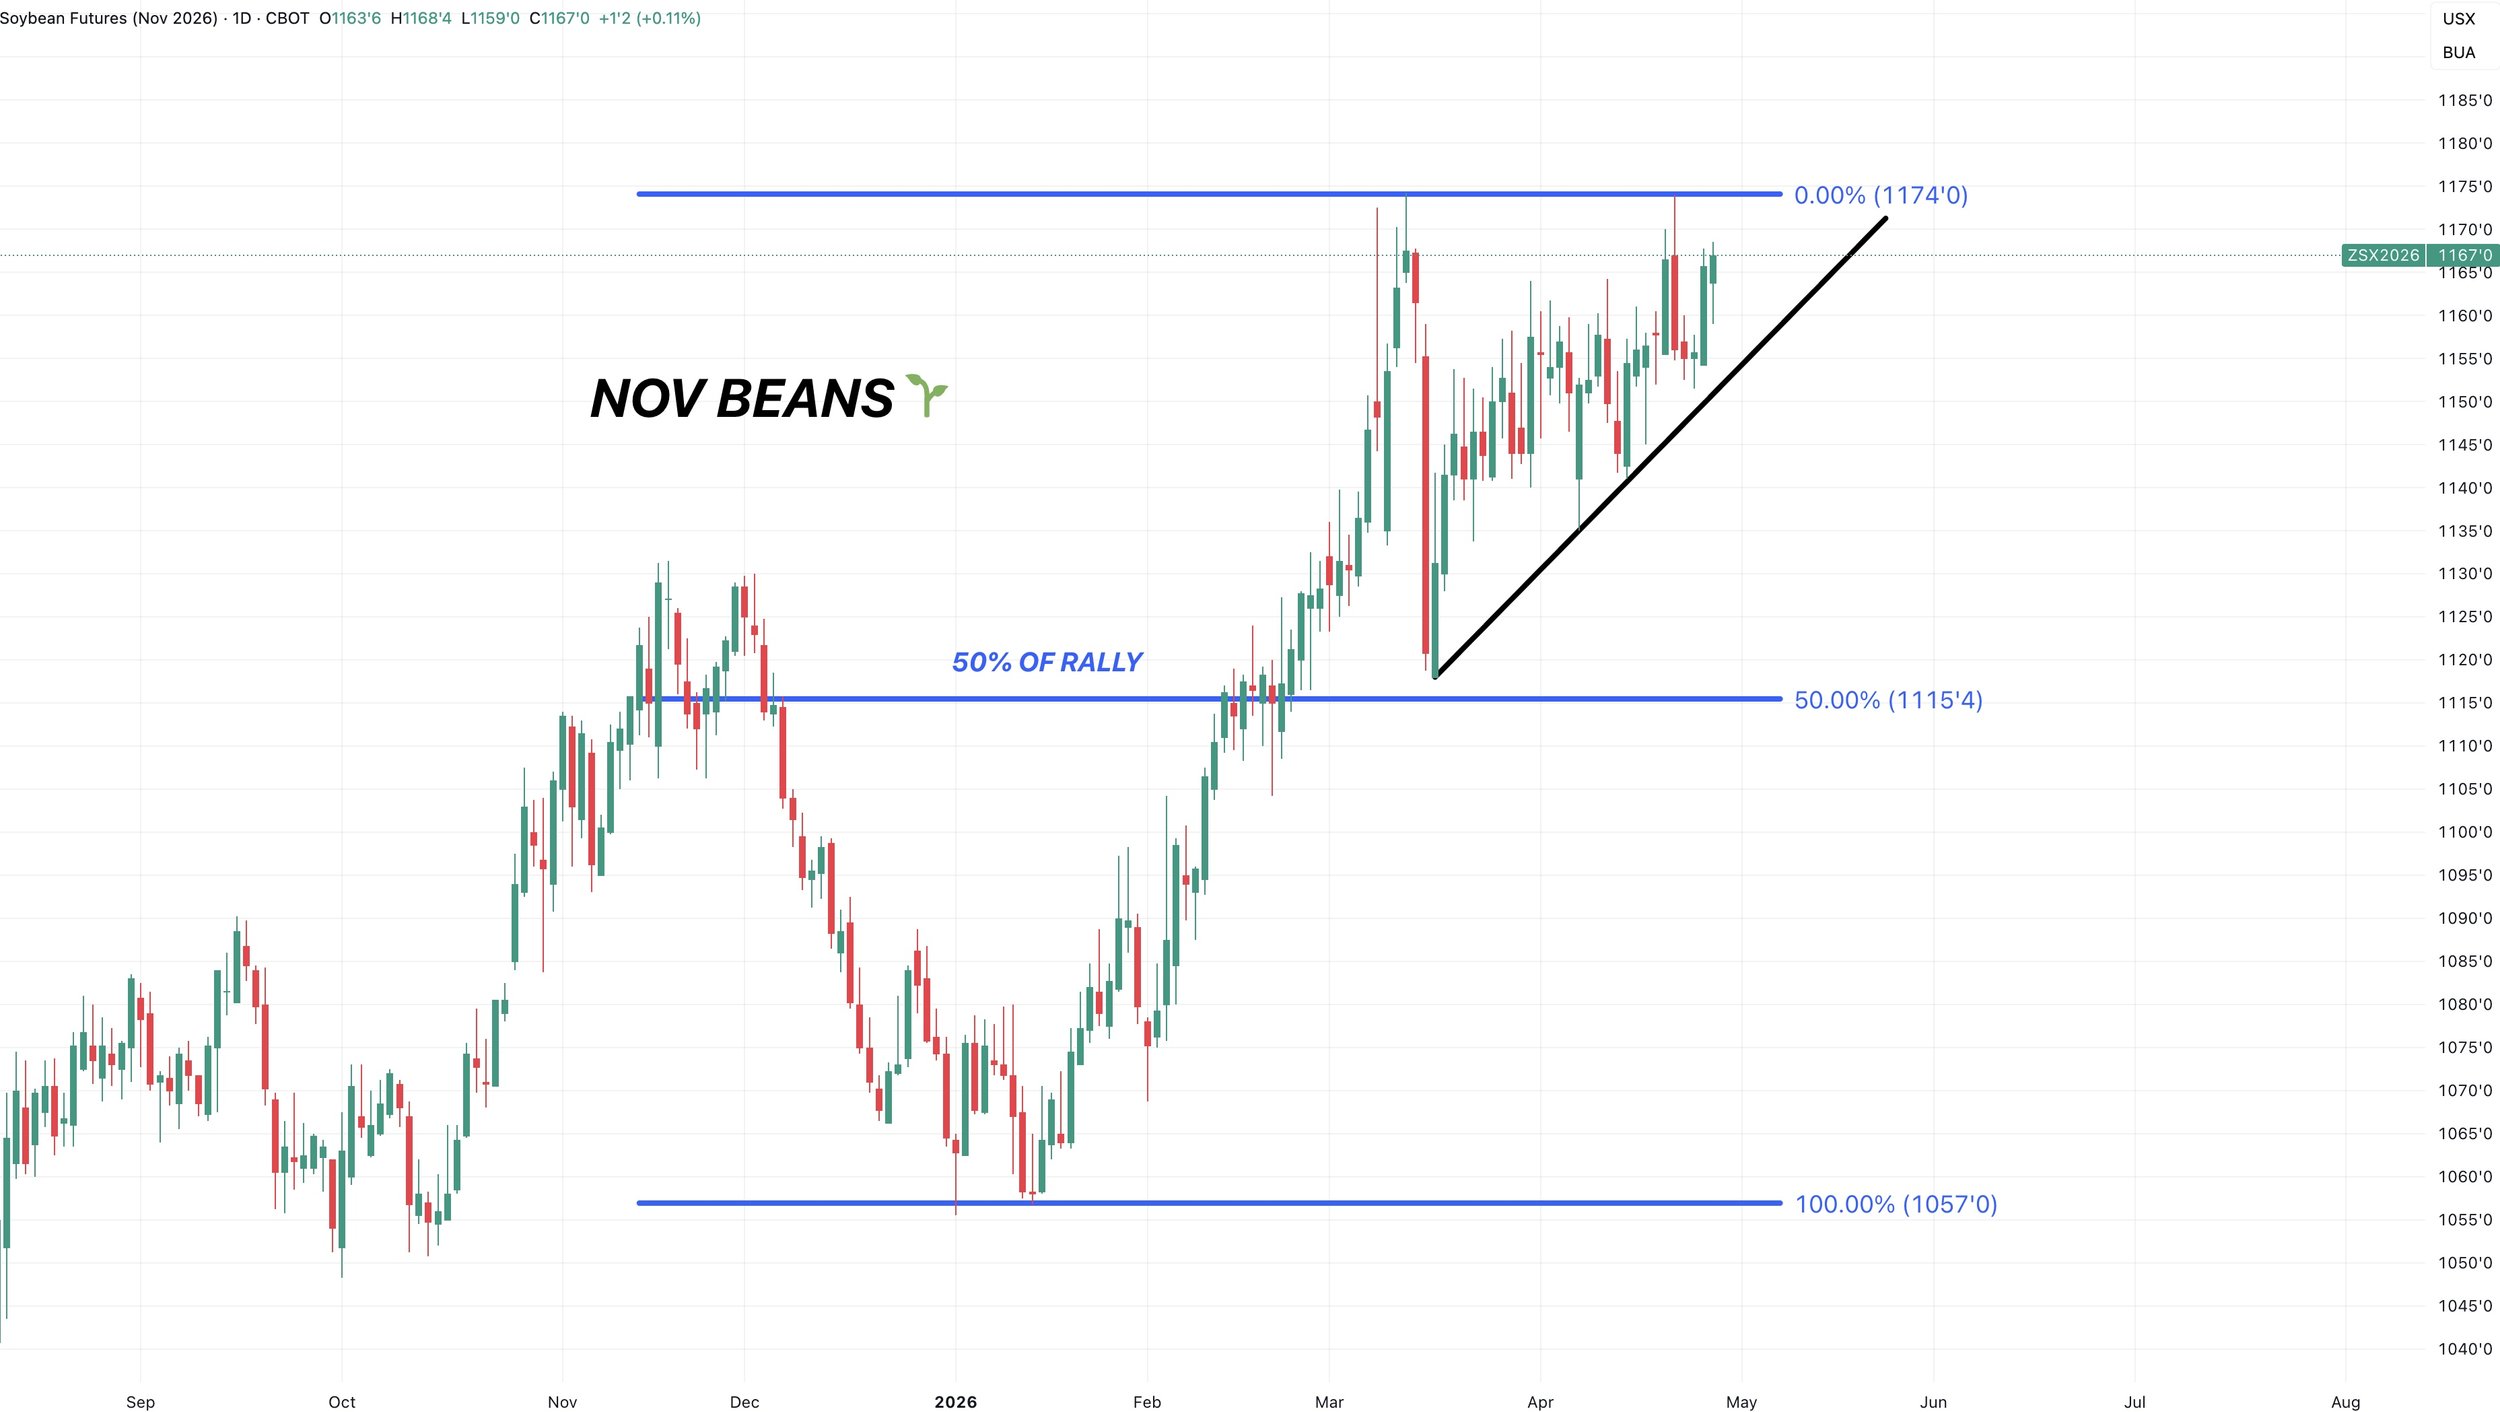
Nov Beans Chart:
We contine to flirt with the highs following that double top last week.
If we get the break above, we should get a leg higher.
Will have our next target if we get the breakout.
Wheat
Drought Continues:
Wheat continues to steal the show.
We are up +60 cents the last week alone.
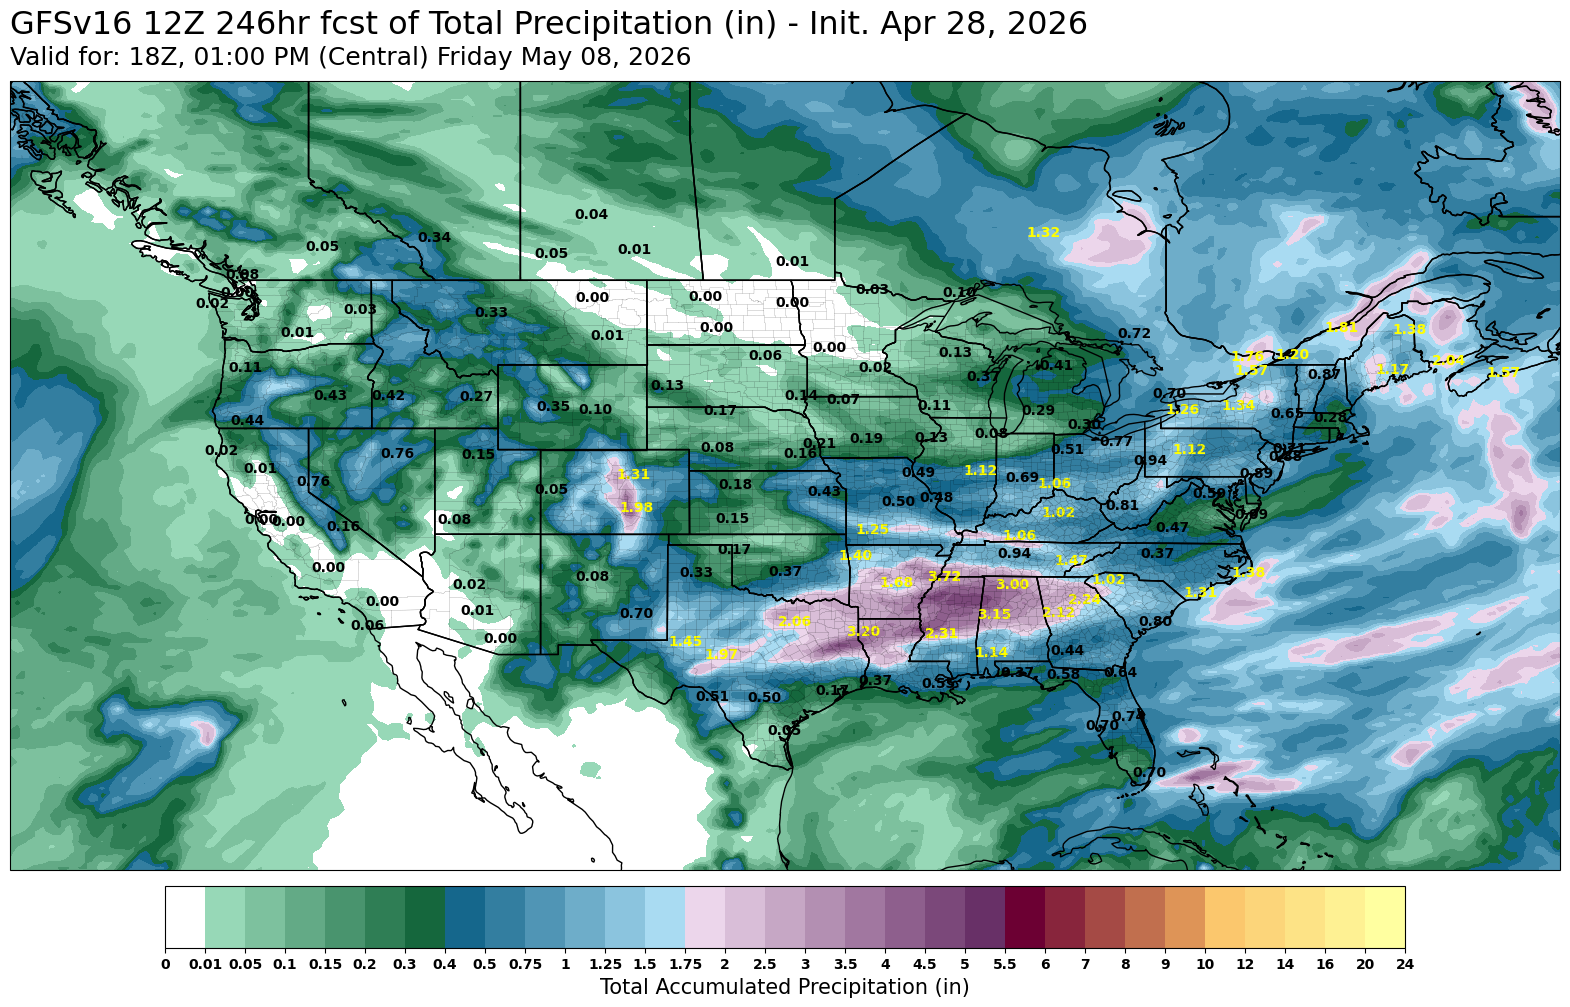
The weather models continue to eliminate rain for Kansas and those key HRW regions.
Here is the outlook through May 8th.
It is dry through the middle of the May. That is a problem.
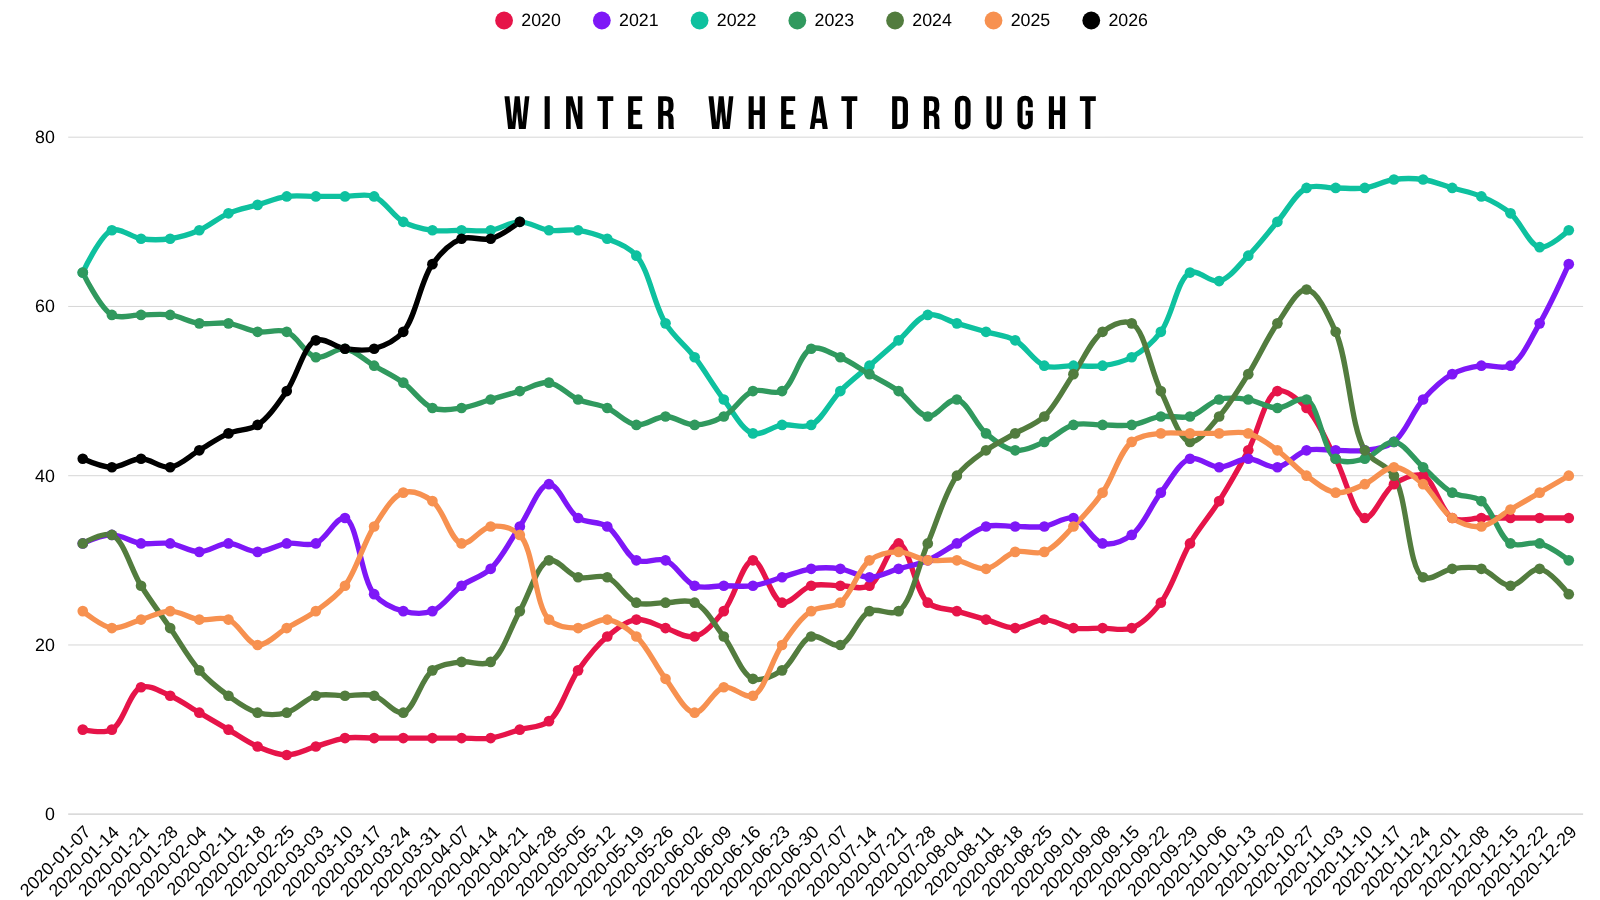
They'll have an updated number this week, but the last rating had 70% of winter wheat areas in drought.
That is a record amount for this time of year.
Tied with 2022.
Winter wheat ratings remained unchanged at 30% G/E yesterday.
It was somewhat surprising they were left unchanged, but it would still be one of the worst on record.
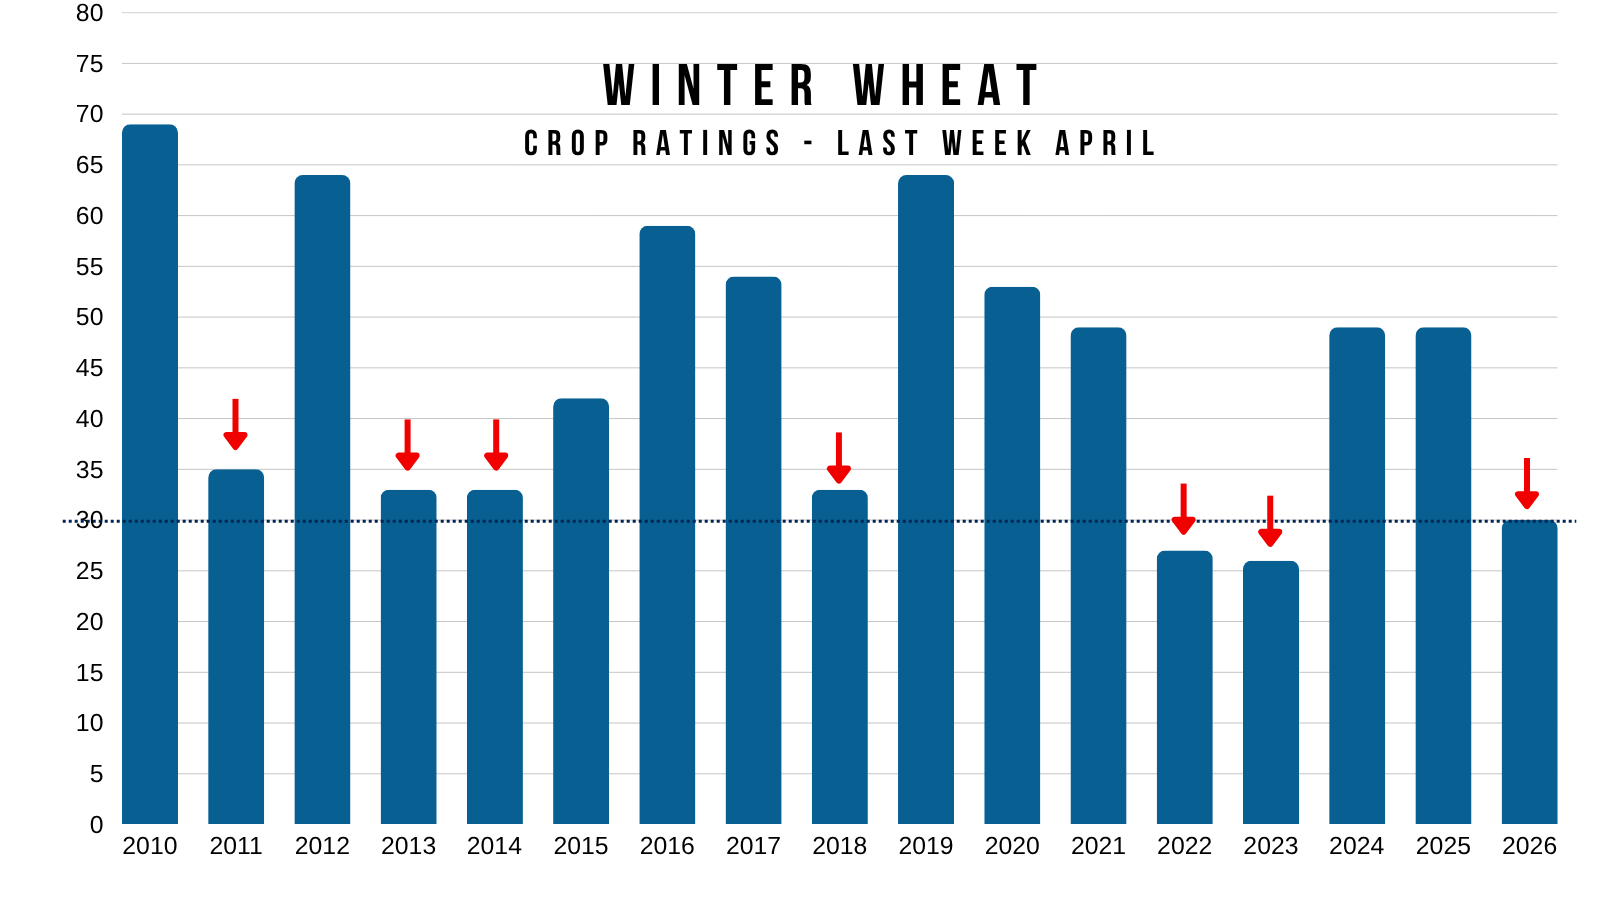
Here is how yield shook out on other years that had a similar rating.
This bad of crop conditions alone would suggest below average yields.
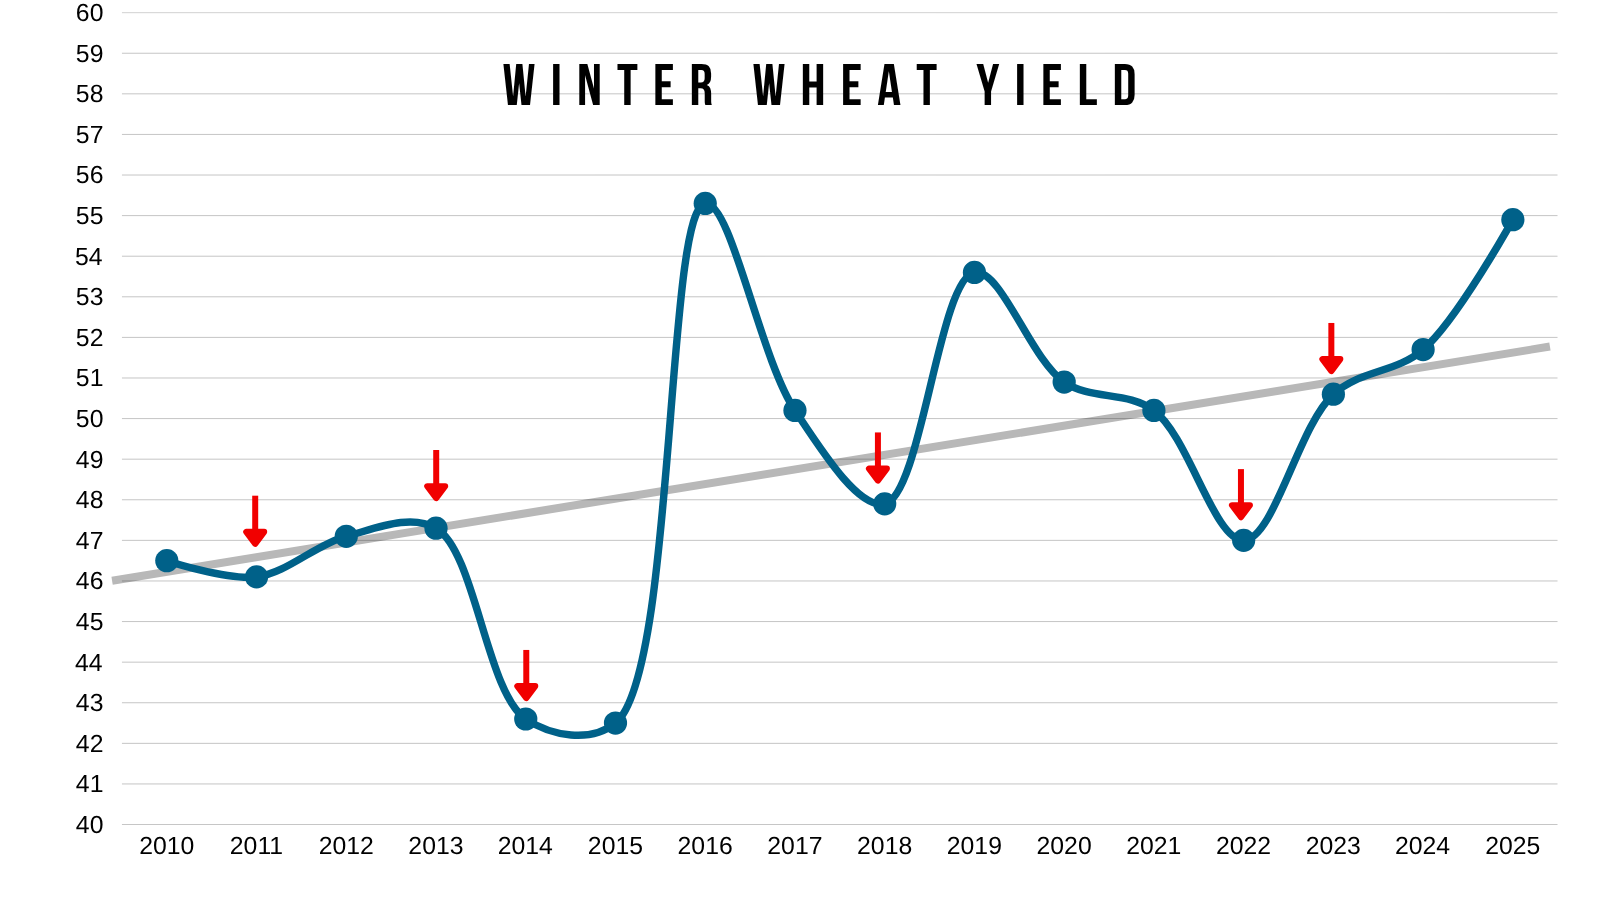
But as I've been talking about for a long time, that doesn’t really paint the entire story.
National crop conditions were unchanged this week.
But the key HRW states continue to struggle.
The national rating is behind propped up by SRW ratings.
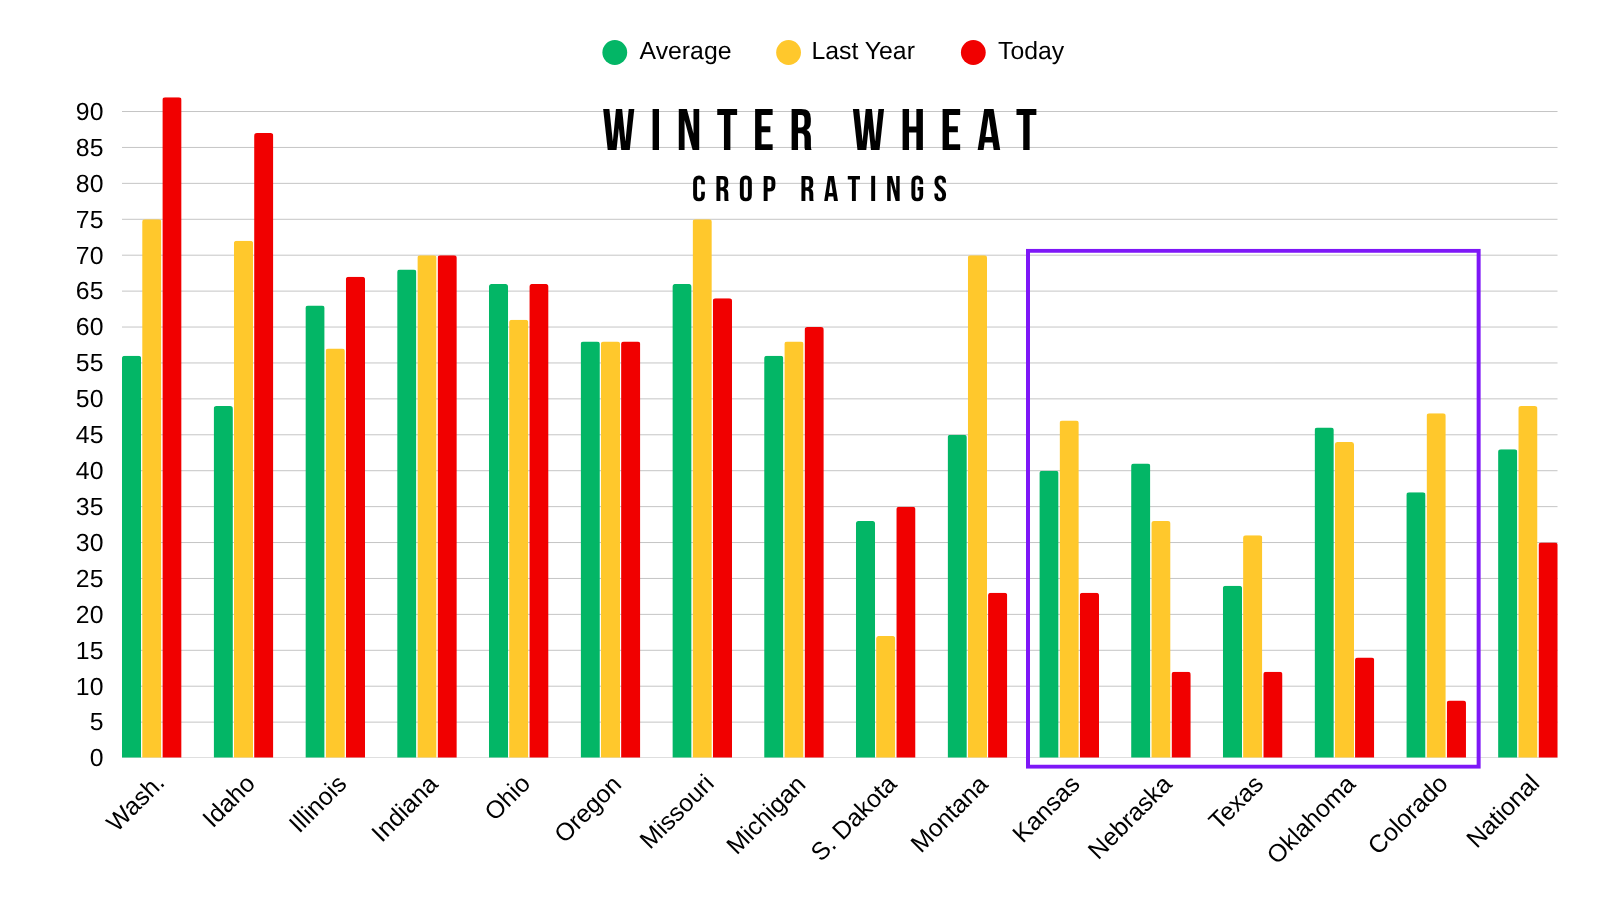
Here is how every state's ratings stack up vs last year and their average.
Plenty of states are fine.
It's the plains that are struggling.
The top 5 growers of Kansas, Oklahoma, Texas, Colorado and Nebraska account for roughly 70% of all HRW production.
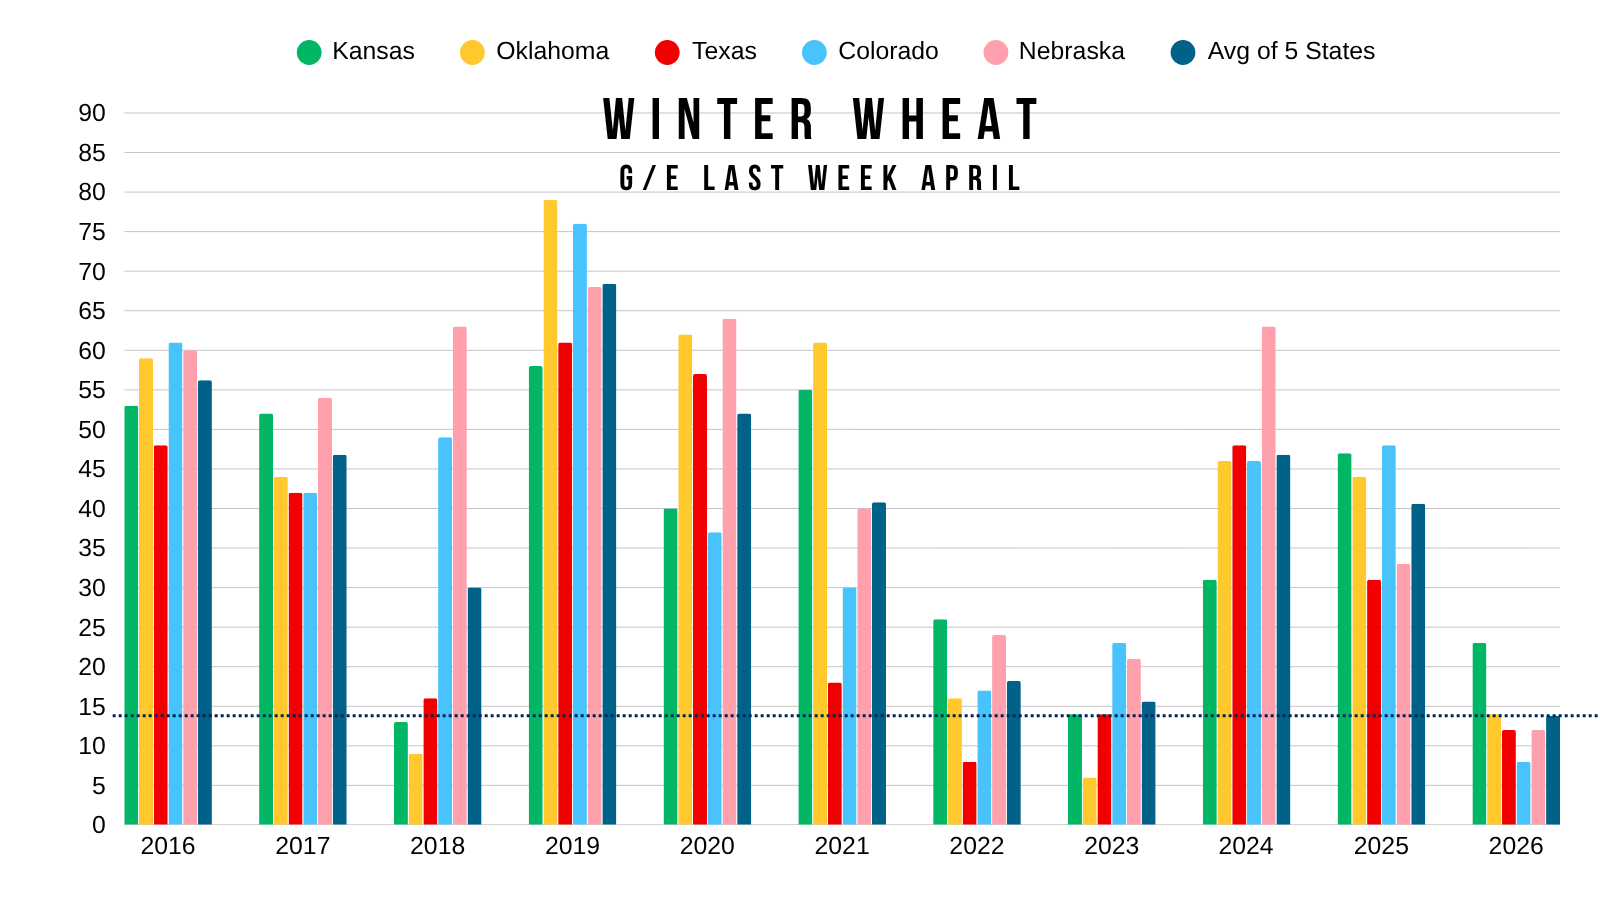
Here is the ratings for those top 5 HRW growers and how they stack up vs the last decade.
Current Rating vs Last Decade:
Kansas 23% G/E (3rd lowest)
Oklahoma: 14% (3rd lowest)
Texas: 12% (2nd lowest)
Colorado: 8% (lowest)
Nebraska: 12% (lowest)
If you take the average rating of these five states you get 13.8%.
That would be the lowest in at least the last decade.
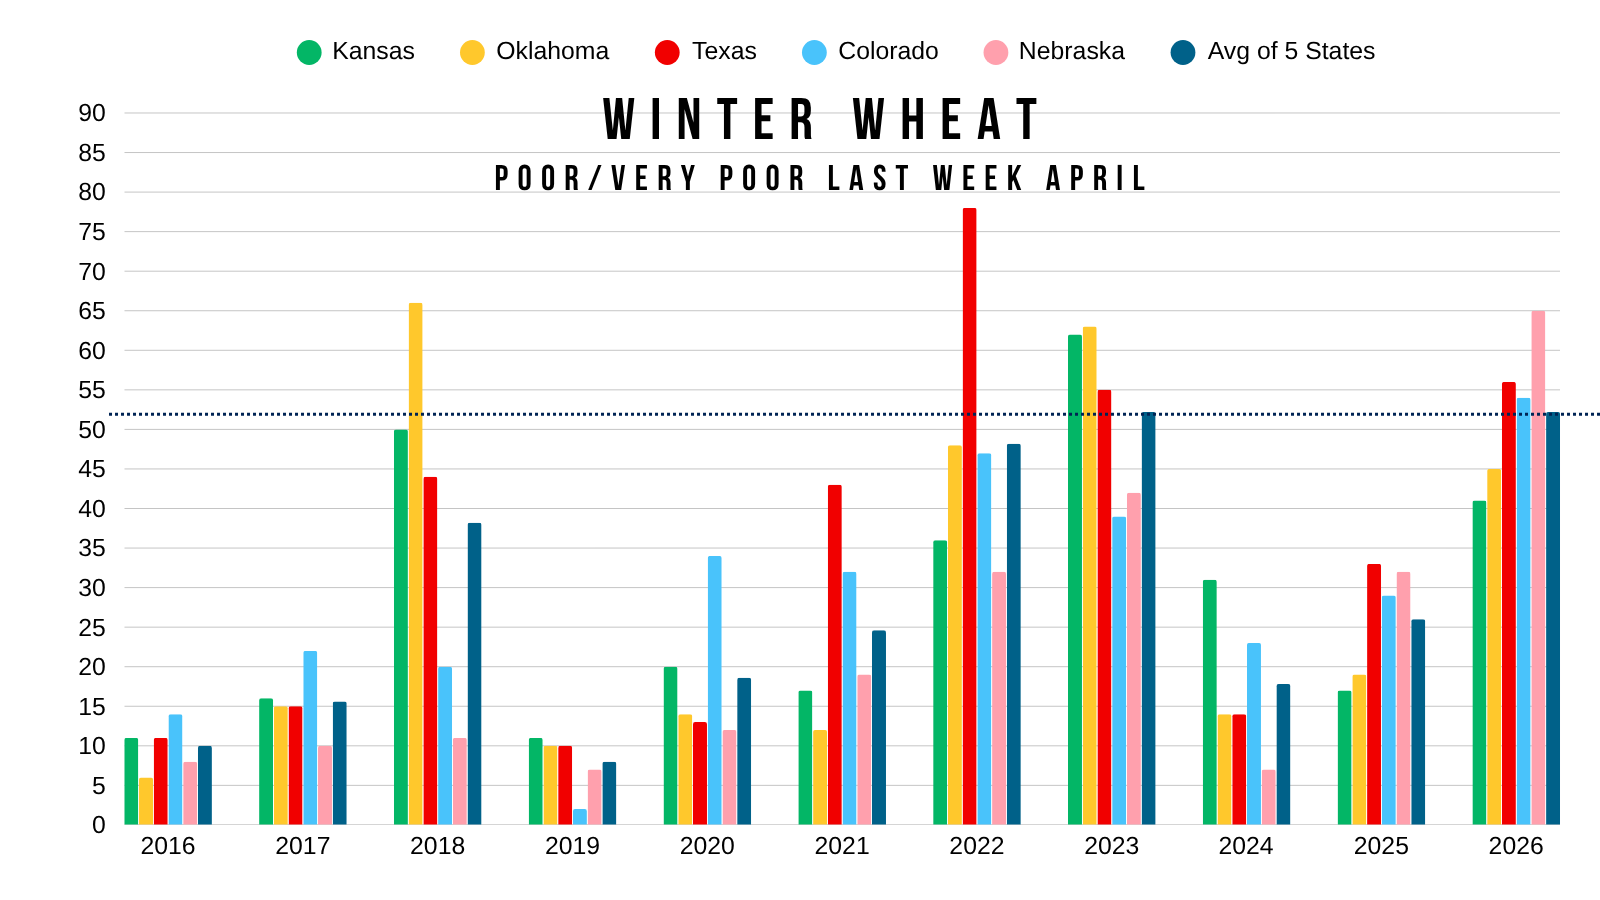
Here is what is looks like if you take those same five states poor to very poor ratings instead of their good to excellent ratings.
It tells the same story.
Both Nebraska and Colorado having their worst crop in at least a decade.
Last week Nebraska's good to excellent ratings actuallly rose by 1%, but their poor to very poor ratings surged by 20%.
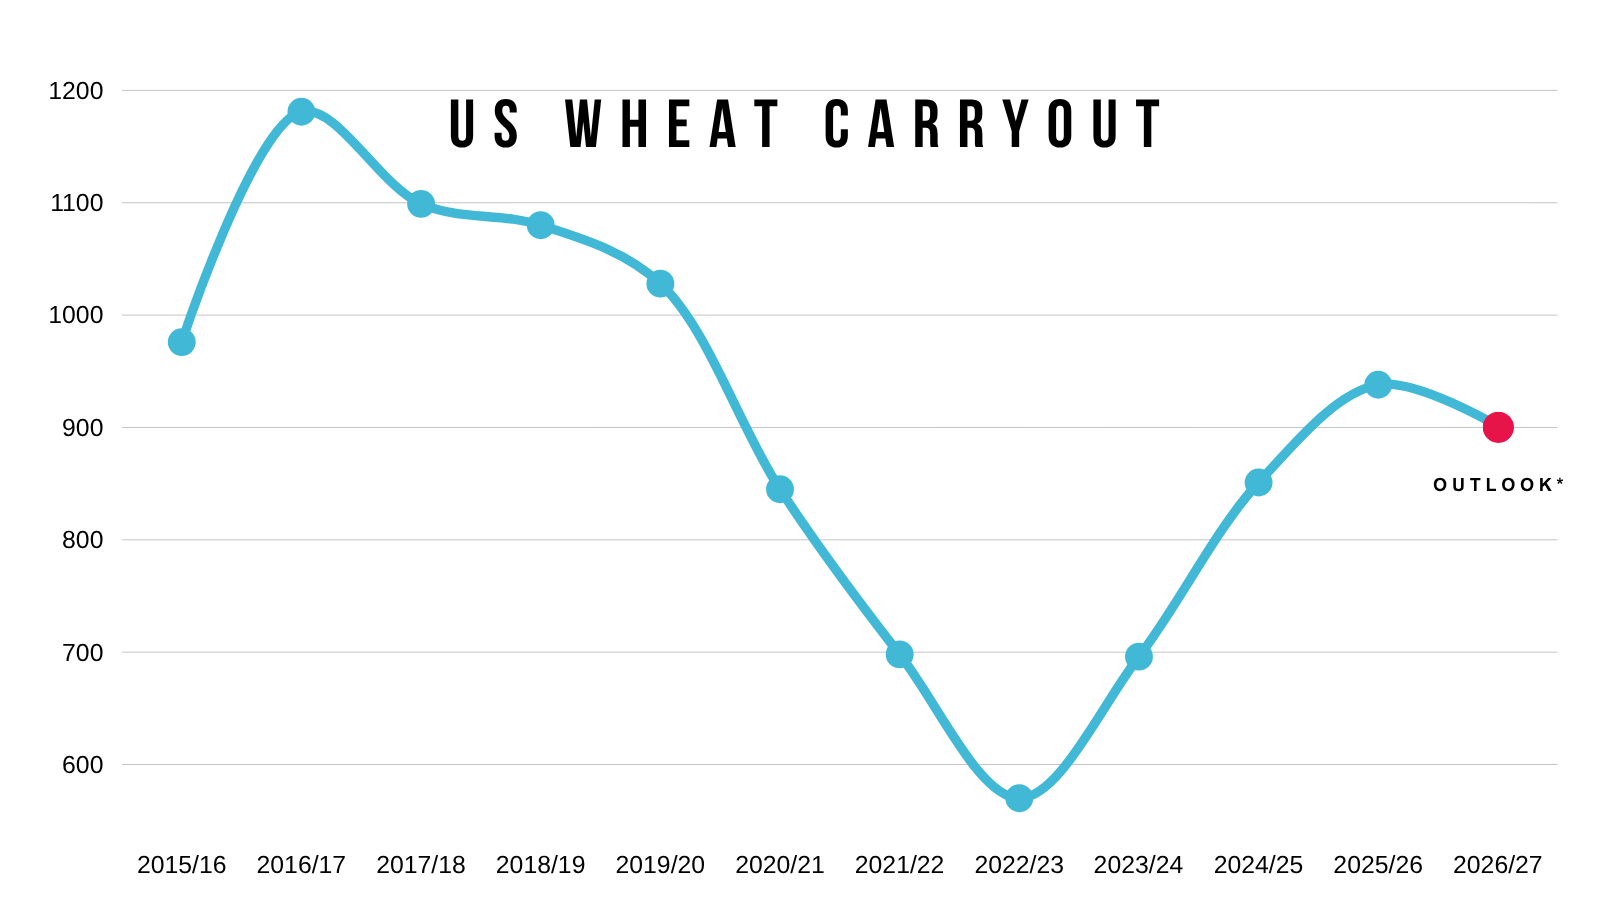
On the surface the US wheat situation nor the world situation are considered "bullish".
But you have the fertziler situation that is impacting the world and other countries such as Australia. Who could see a massive drop in production this year.
We are going to have record low wheat acres in the US this year.
Throw one of the worst droughts the plains have seen in decades on top of that, and you have a recipe for a friendly scenario.
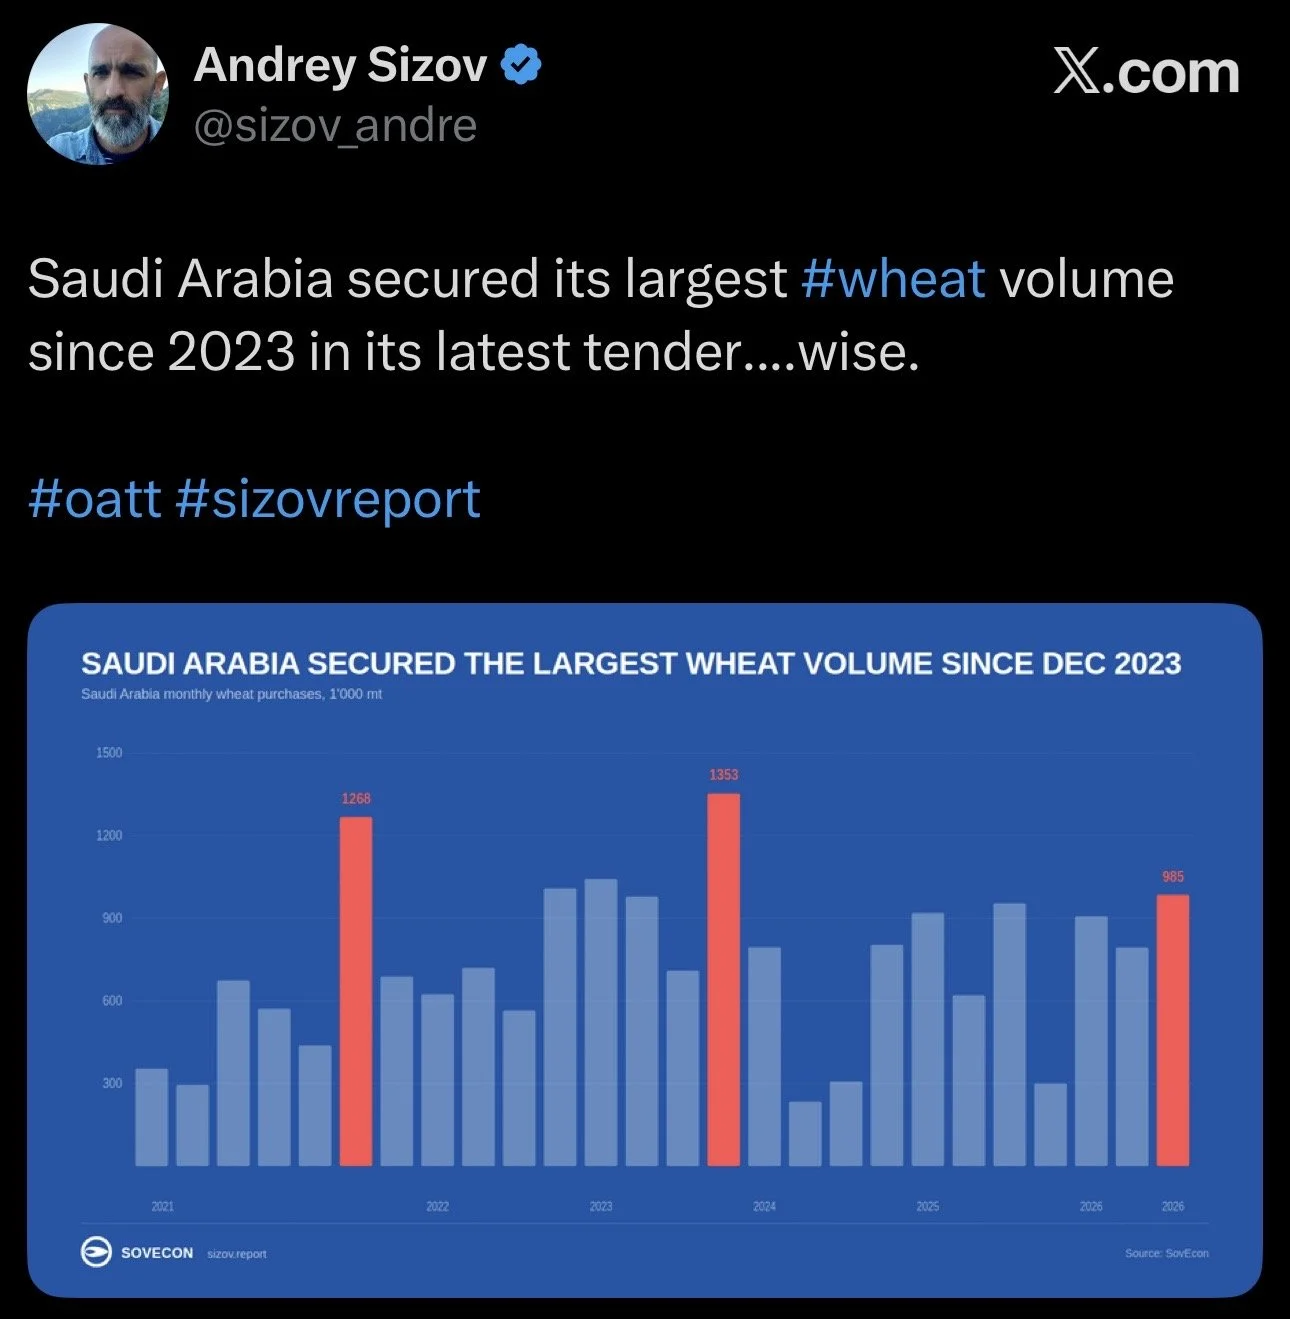
Today we had Saudi Arabia secure their largest amount of wheat since 2023.
As they locked in a tender for nearly 1 MMT.
If a buyer like that is stepping in, it might suggest they view the current price as good value here.
You don’t buy usually buy something if you think you'll be able to get it cheaper later.
Today's Sell Signal & Hedge Alert:
Today we did issue is a sell signal and hedge alert for those of you that do not have storage or have hedge accounts.
Link to Alert: Click Here to View
We think wheat still has upside, but if you don’t have storage you don’t have the ability to remain patient. You have to be more aggressive.
For those without storage we like scaling into and selling 10-25%.
For those with hedge accounts, we like selling the $7.50-$8.00 calls for up to 25% of production for each.
Call or text us if you have questions.
Office: (806)484-1214
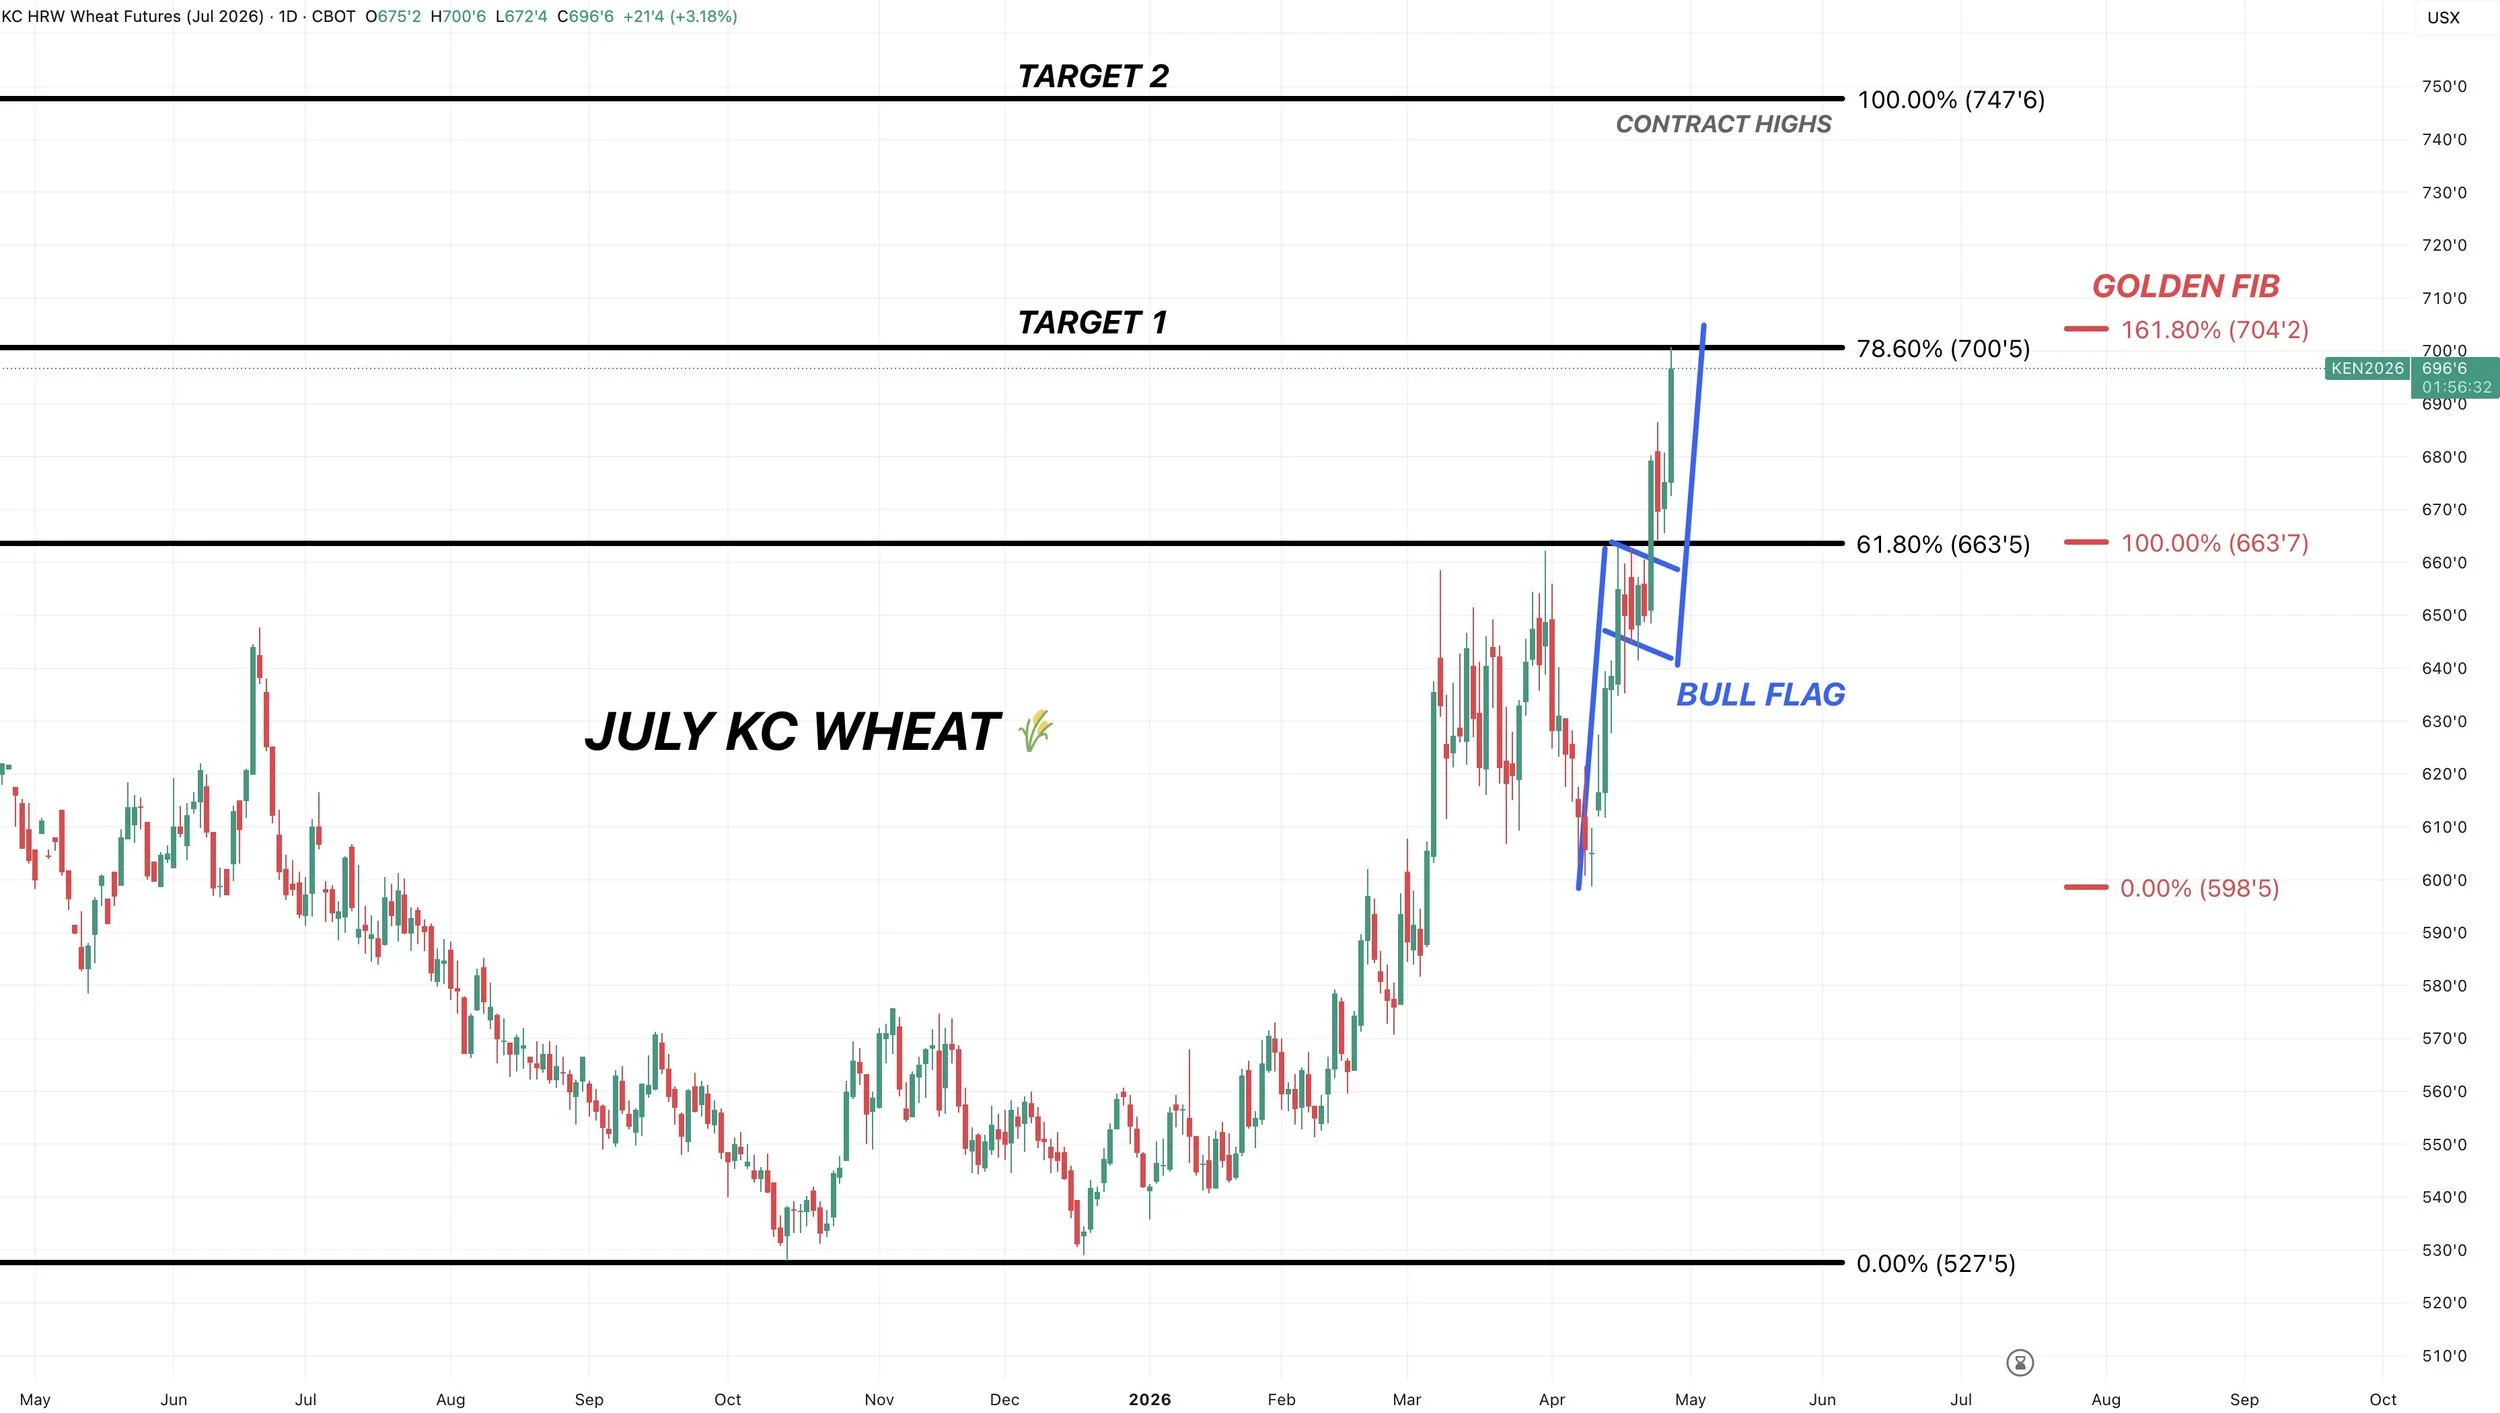
The Charts:
July KC hit $7.00 today. The first time we've seen $7.00 wheat in 2 years.
We think wheat still have further upside potential, but $7.00 was the next target.
$7.00 was 78.6% of the contract highs.
The original rally failed at the 61.8% level.
$7.00 was the implied move for the bull flag we broke out of.
$7.00 was the golden fib extension of the recent sell off. So 161.8% of those recent lows up to the March highs comes in at $7.00
So it makes sense for those without storage to reward this market. As this is a possible level we could find resistance and we haven’t seen these prices in a few years.
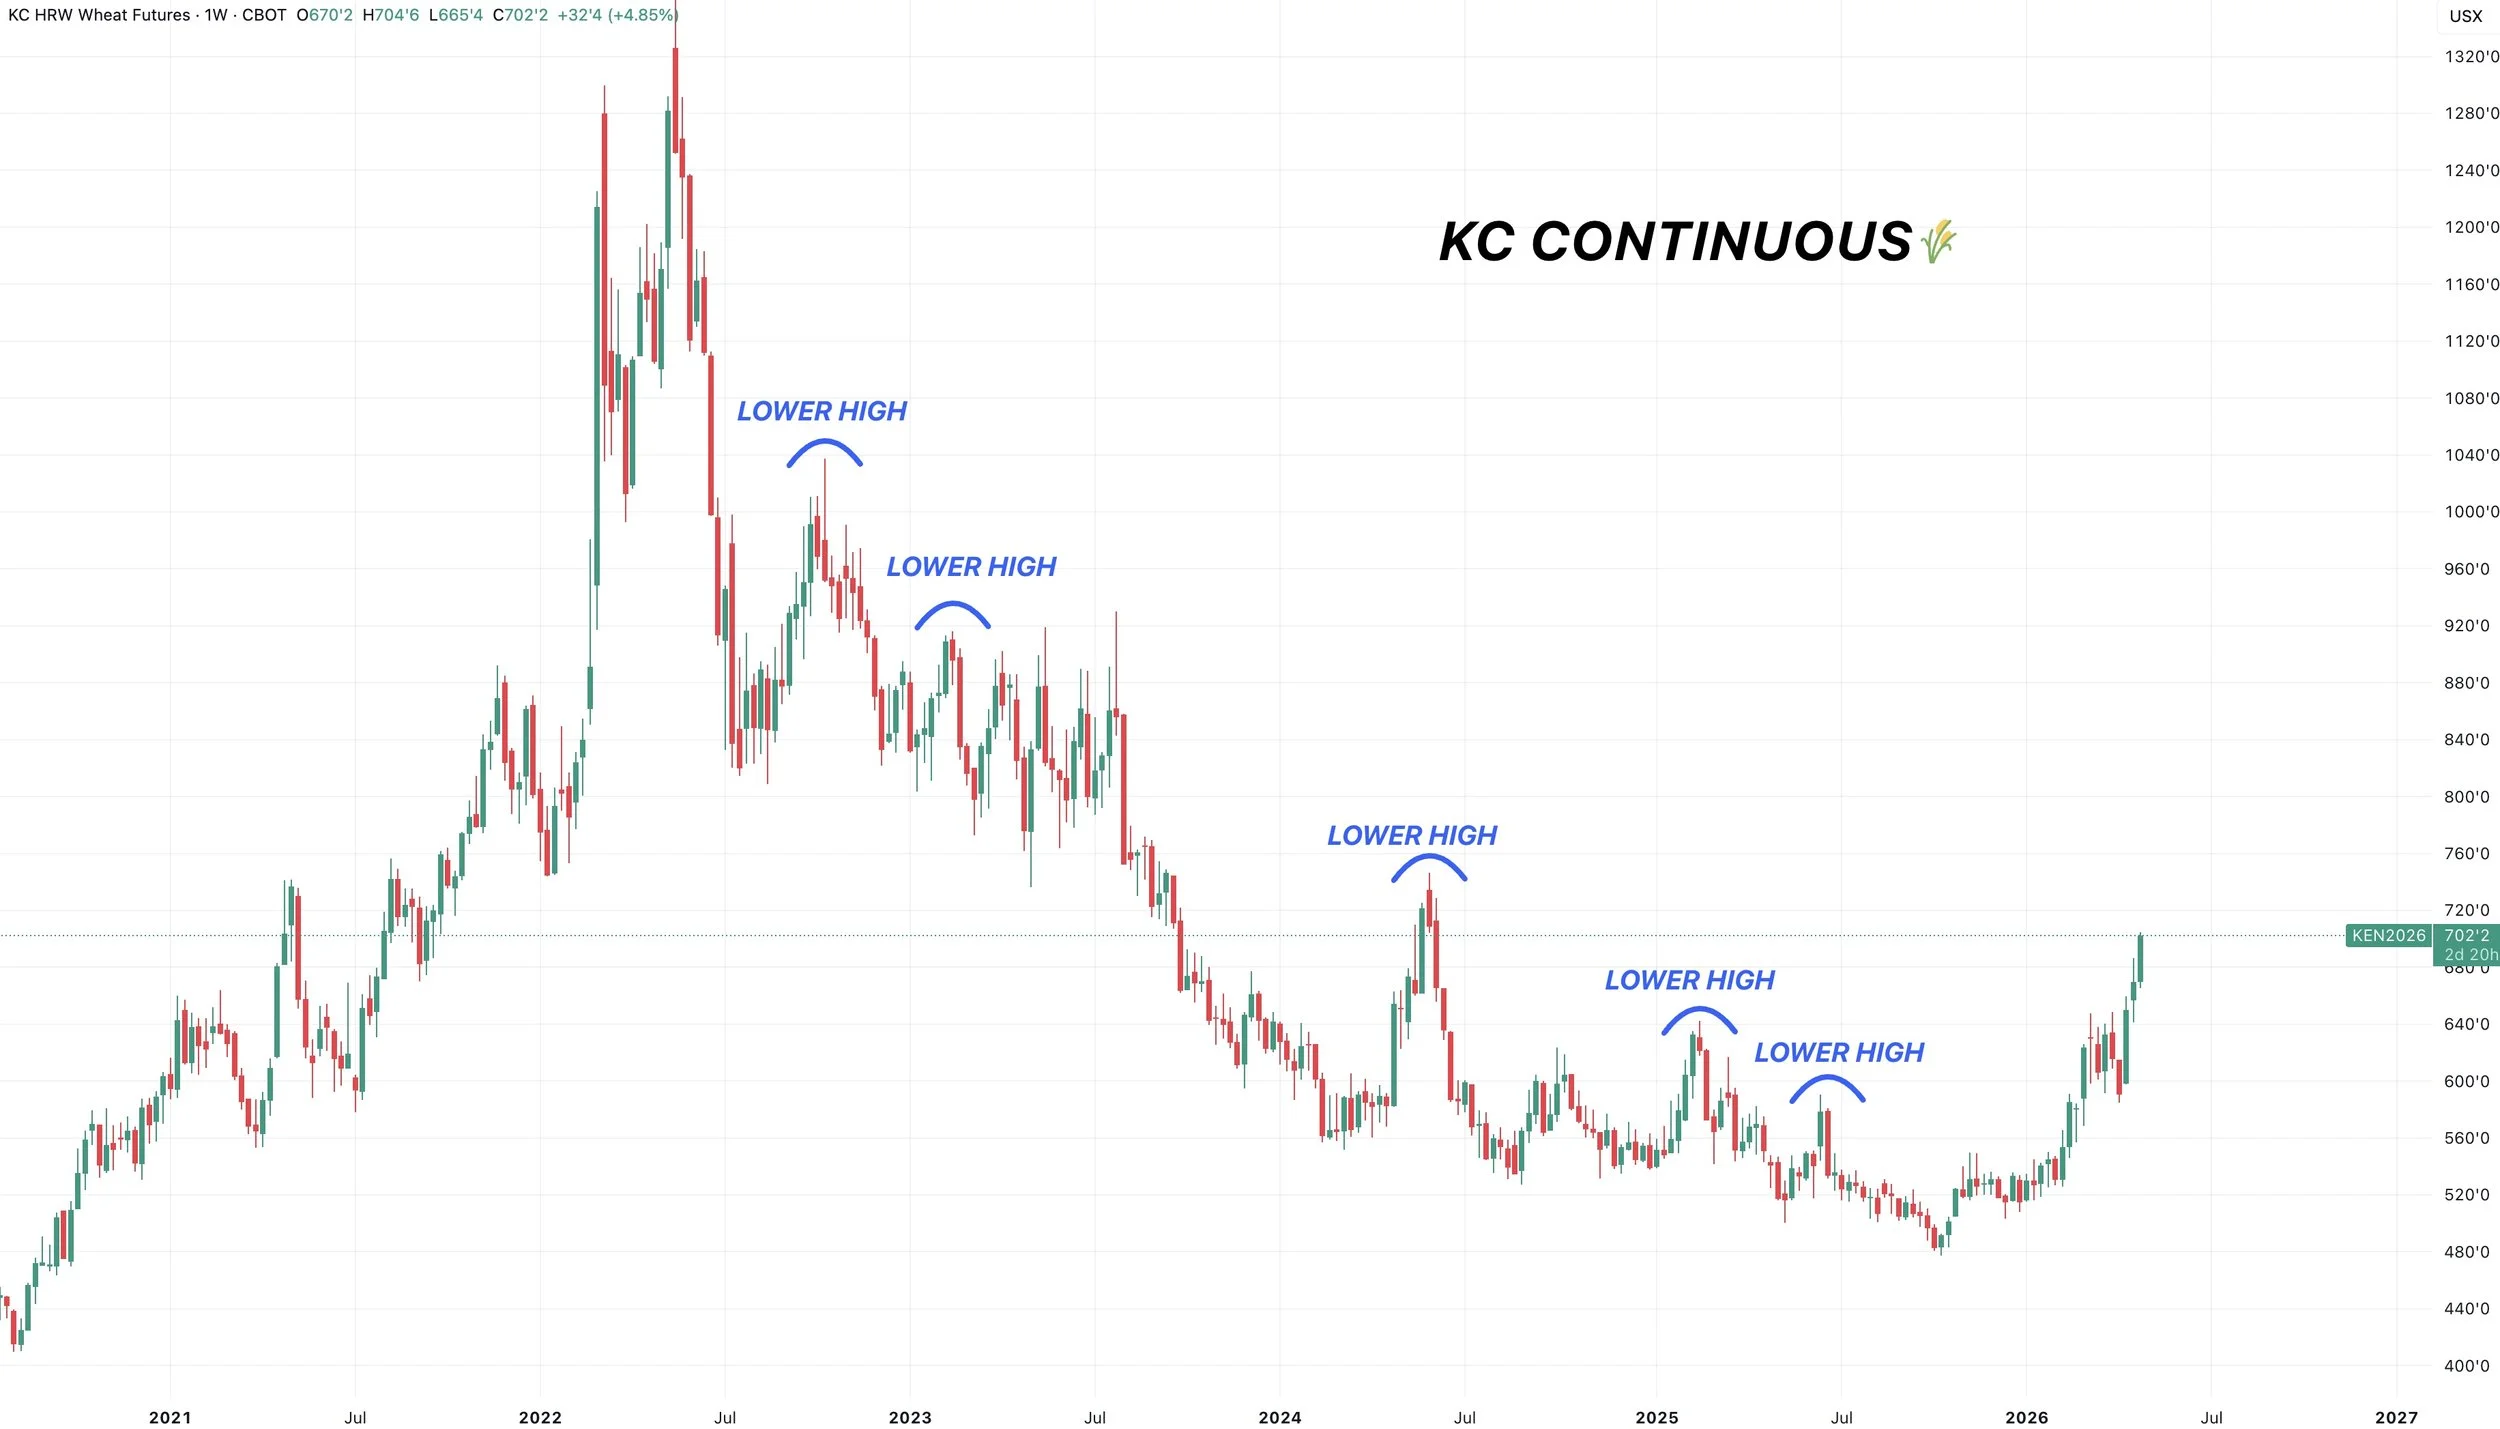
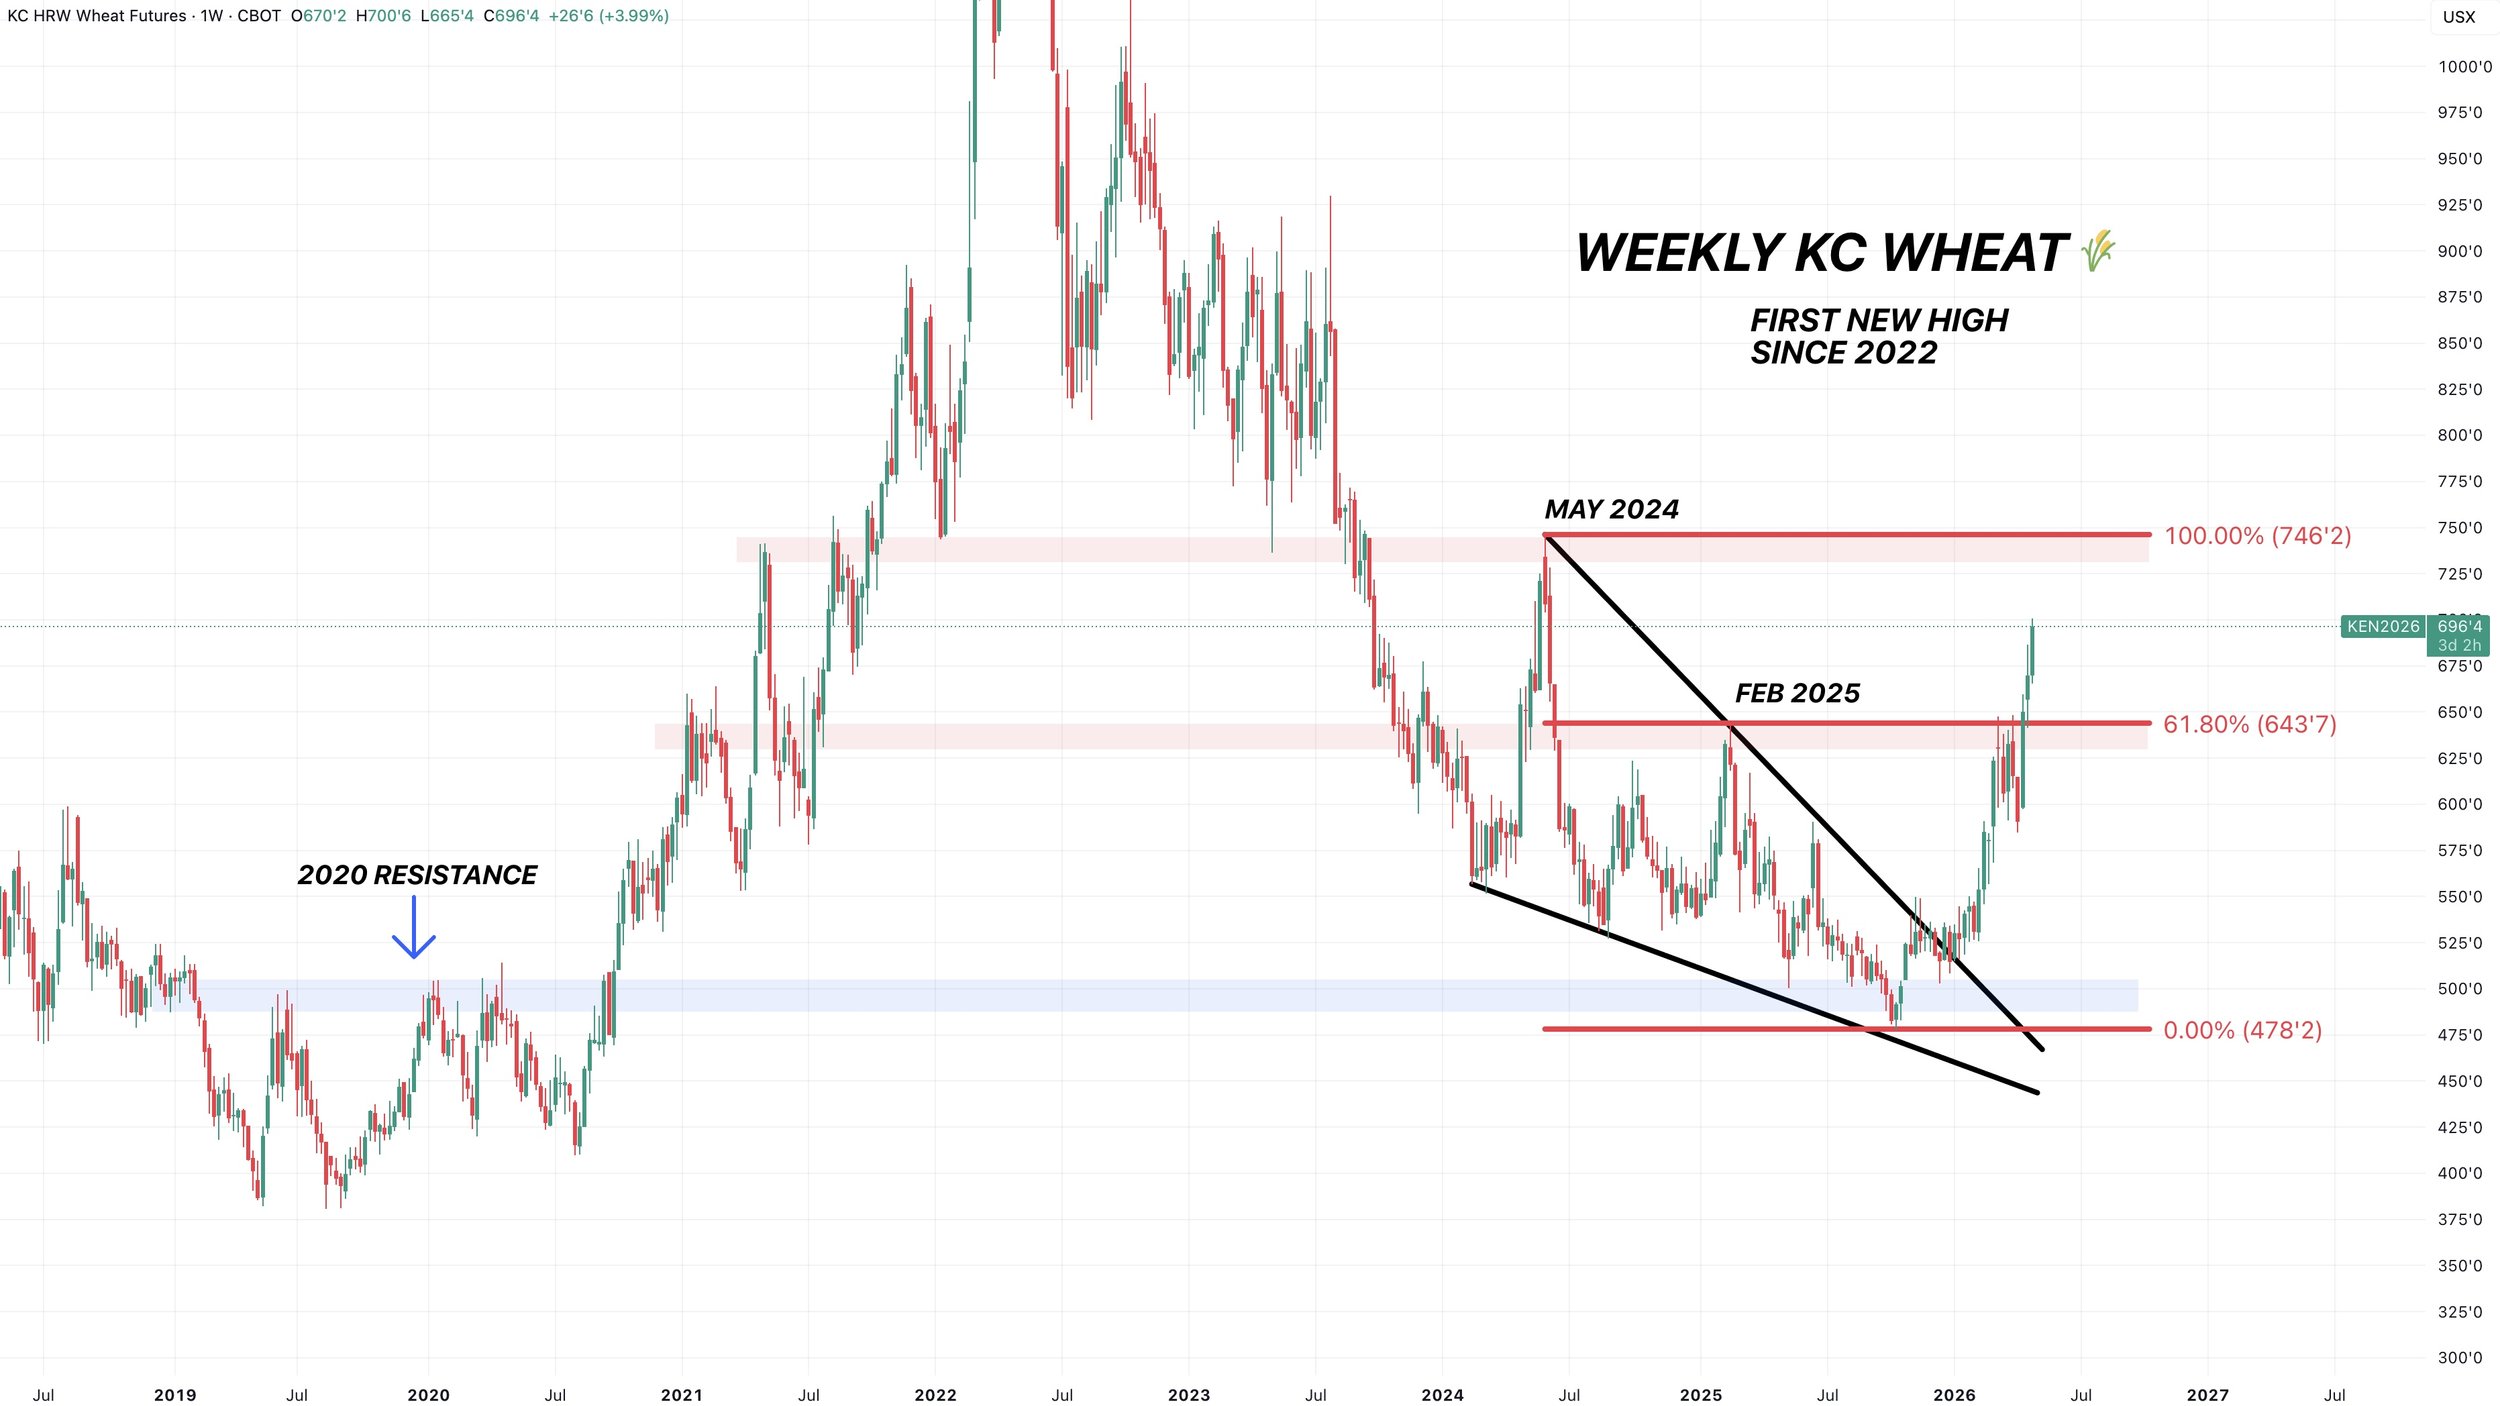
First Higher High:
Now let's zoom out and take a bigger picture approach.
Today we traded to our highest levels since May 2024.
We posted our first higher high since all the way back in 2022.
That tells us the long term trend in this market has likely changed.
The lows we posted back in December could very well be our lows for a long time.
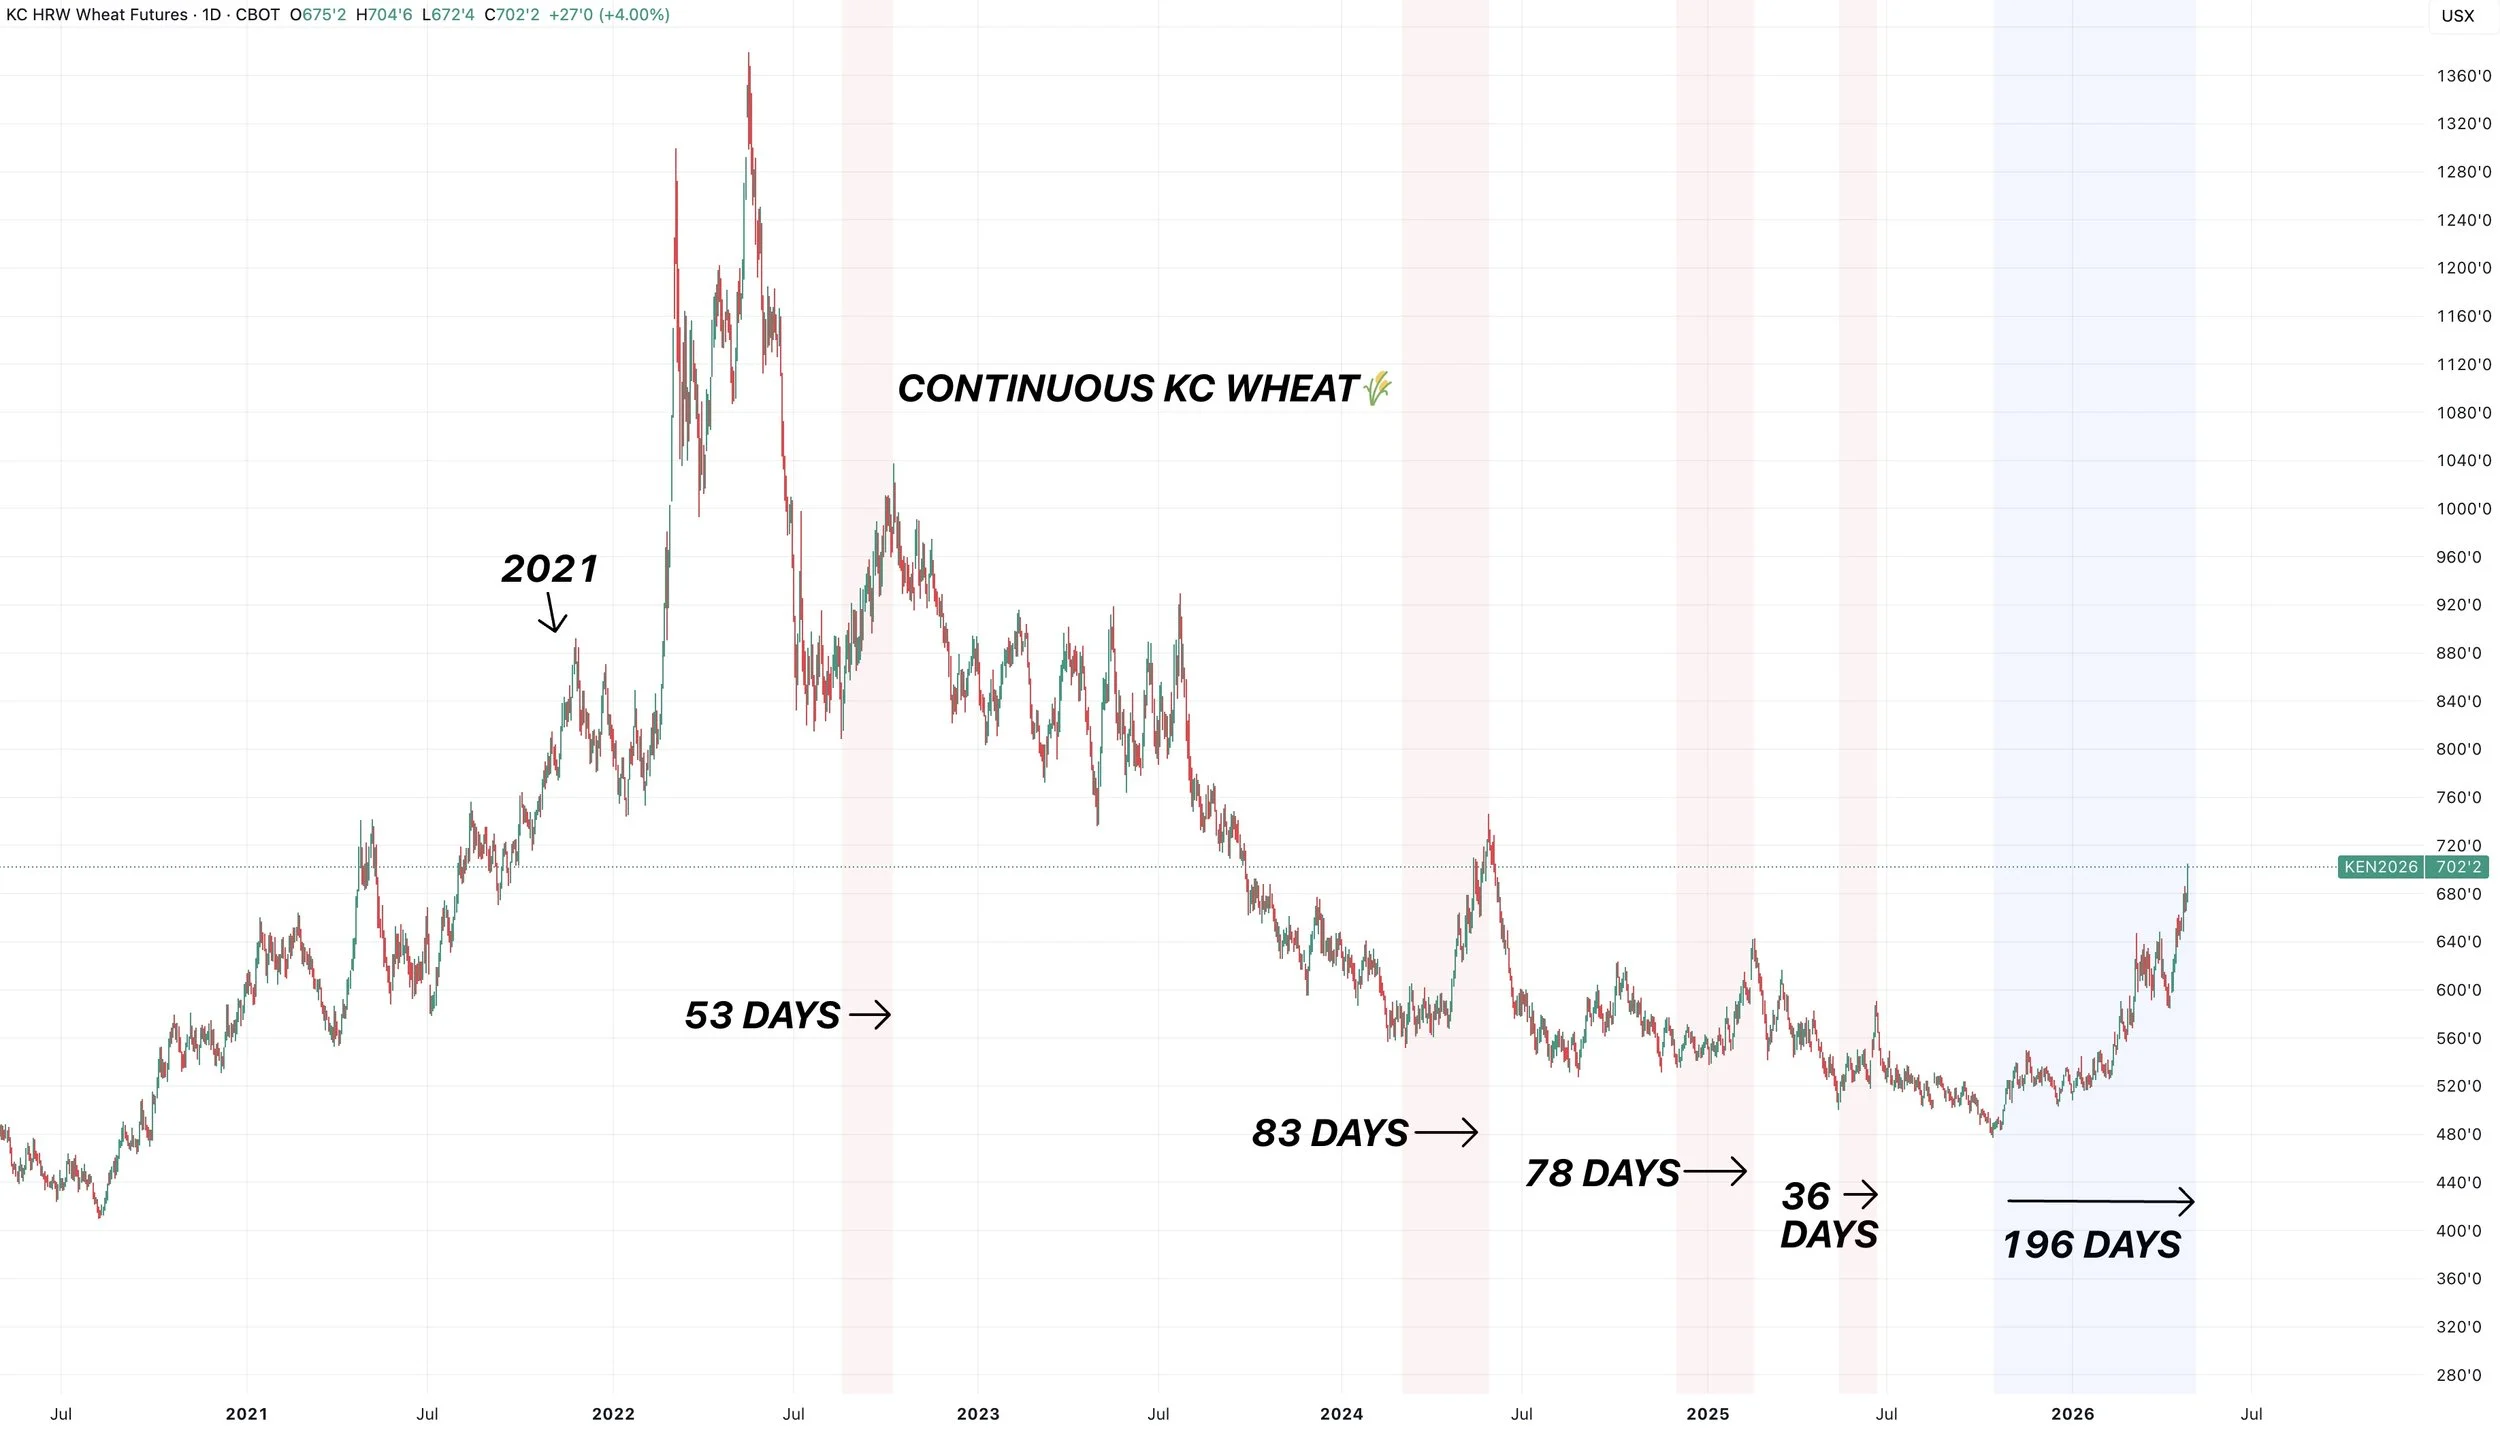
Longest Rally in 4 Years:
This rally has lasted 196 days.
The longest rally we've seen since the bull market top in 2022.
It's actually double the length of the next longest.
Another reason to believe wheat has put in some major long term lows.
This isn’t just a random one month rally like we saw back in 2024.
This has been a 6 month grind higher.
Next Target:
Here is the front month chart again.
We took out those highs from February 2025.
That same level was 61.8% of the May 2024 highs.
That was a major level of resistance we cleared.
As a result, we are running like we've talked about for months could happen if we ever cleared this level.
The next major resistance comes in around $7.50 and those highs from May 2024.
$7.47 is also the contract highs in July KC right now.
So that's the next target.
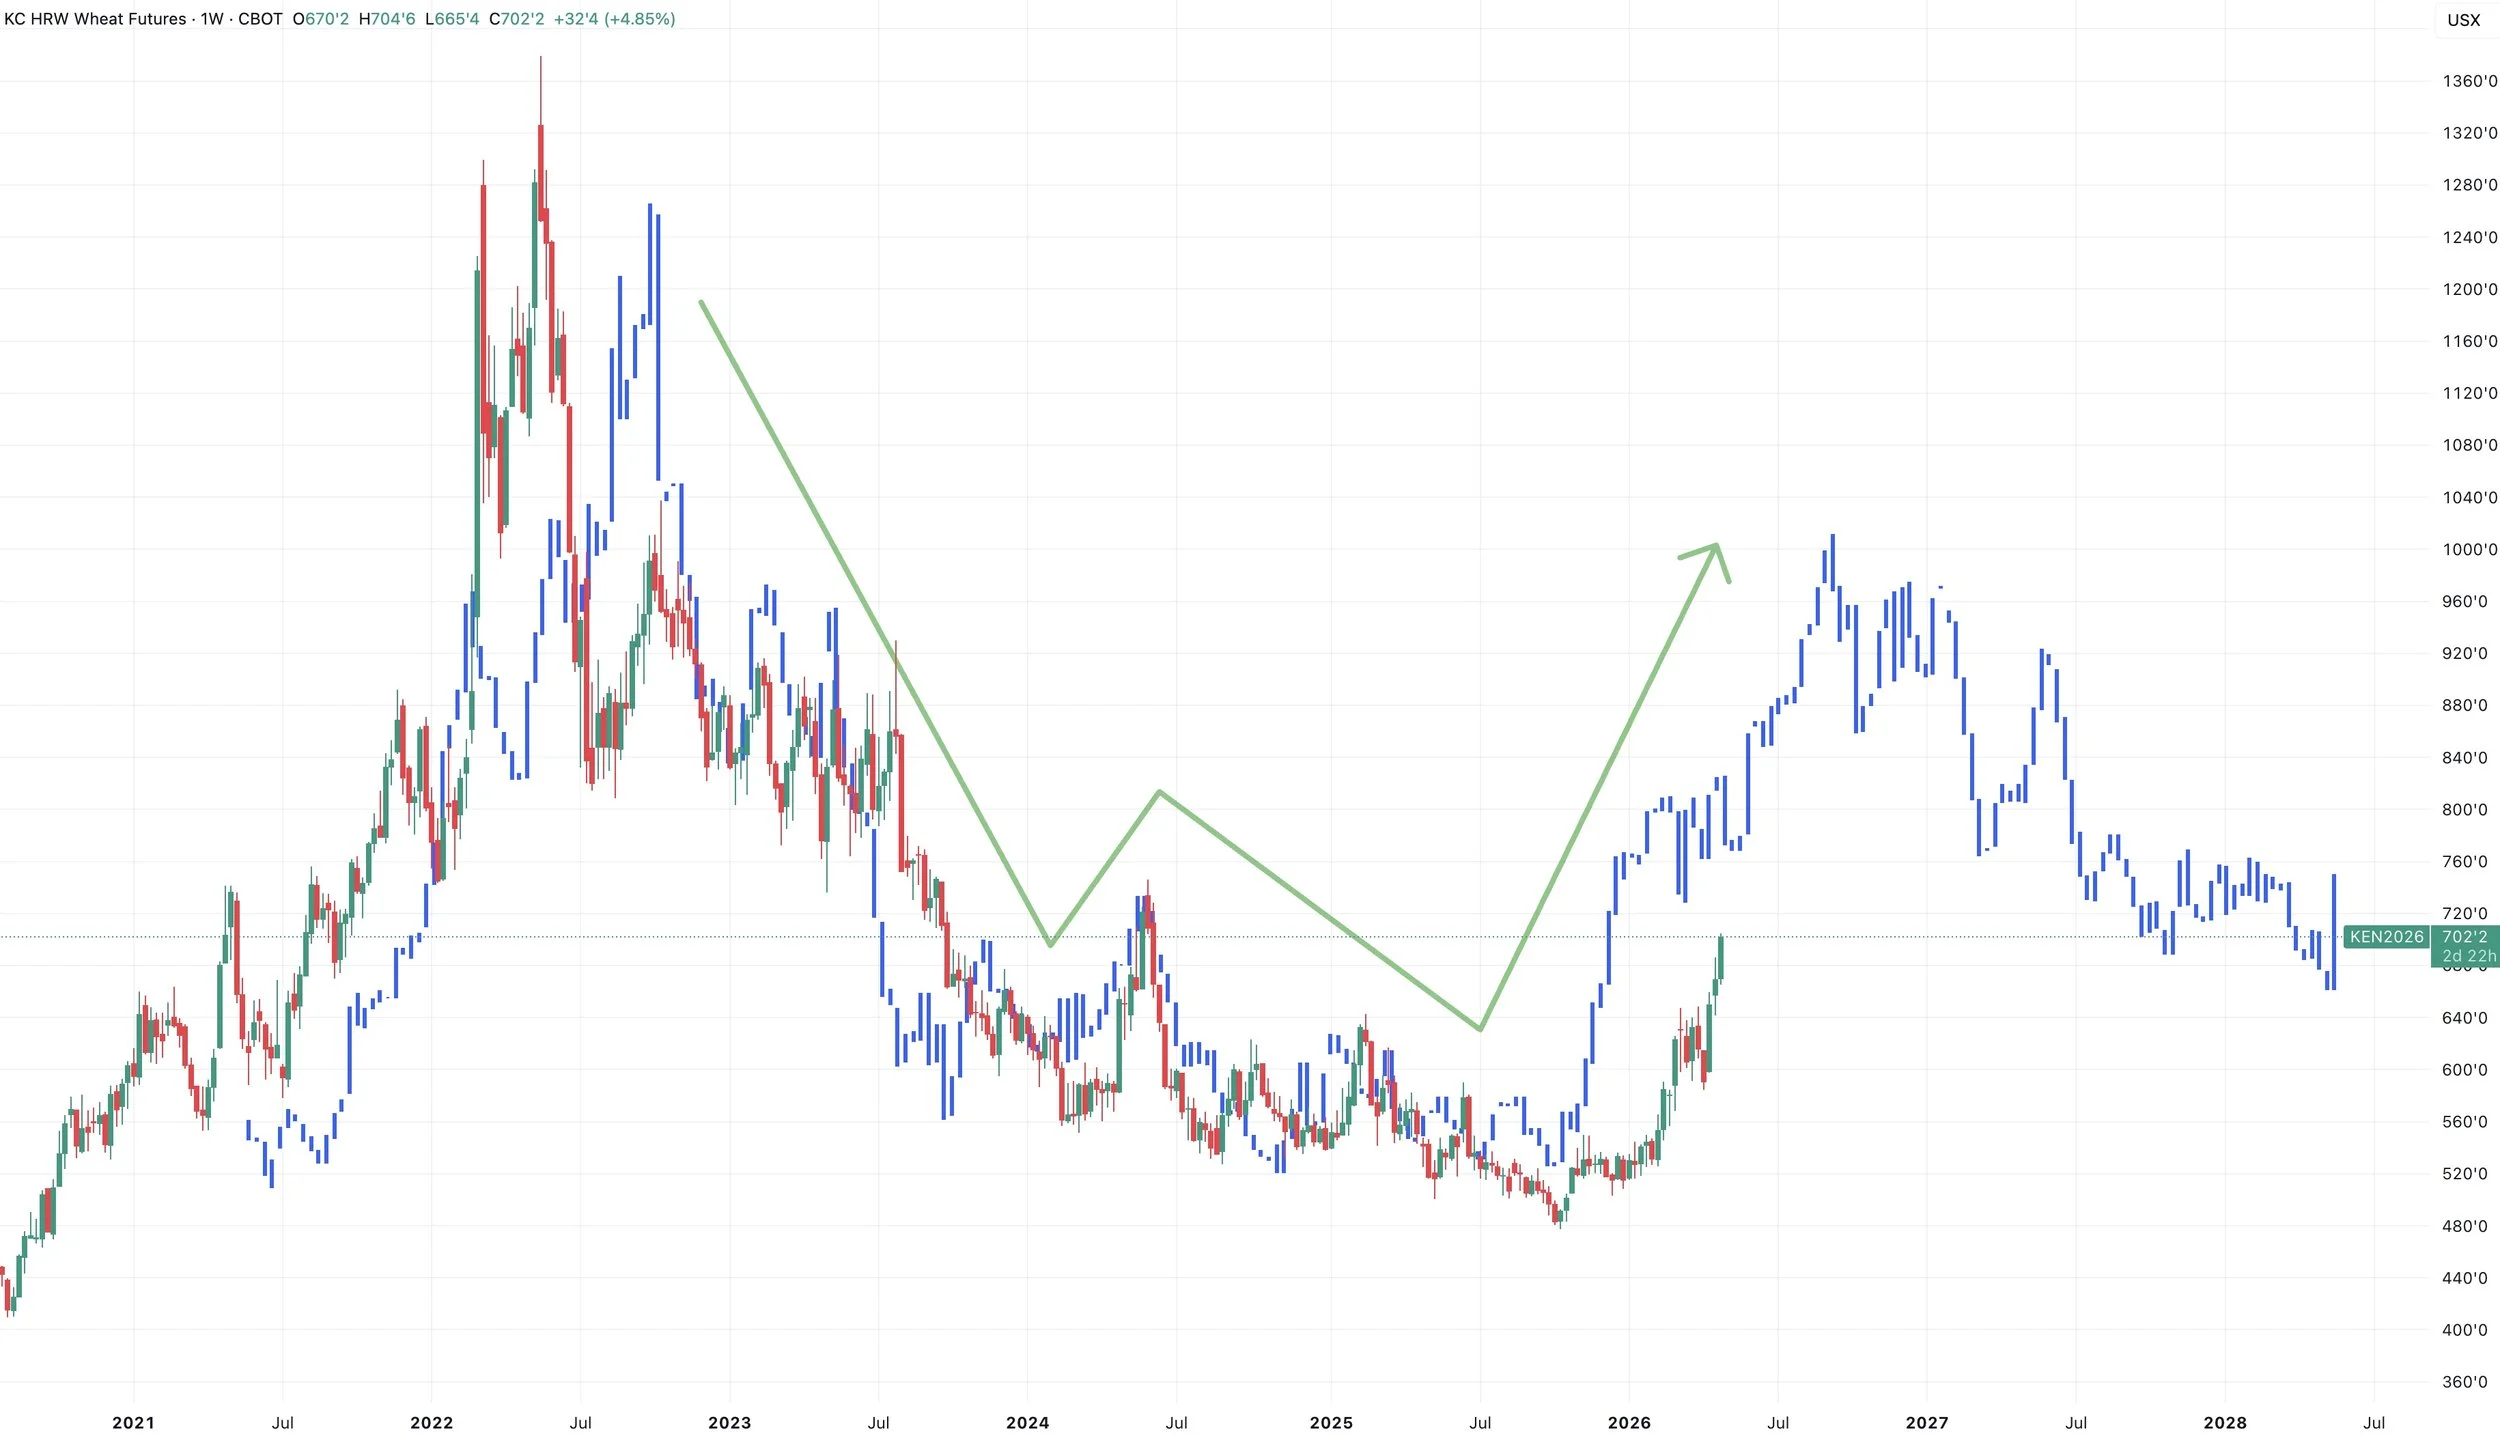
Bull Case Fractal:
Here is the 2007 to 2011 price action overlayed on top of the 2022 to 2026 price action.
This would be a bull case scenario and I am not saying it is going to happen at all, but the two patterns have been awfully similar up to this point.
Both had that big run up, then hard sell off, then the mini pop, then another sell off before heading higher.
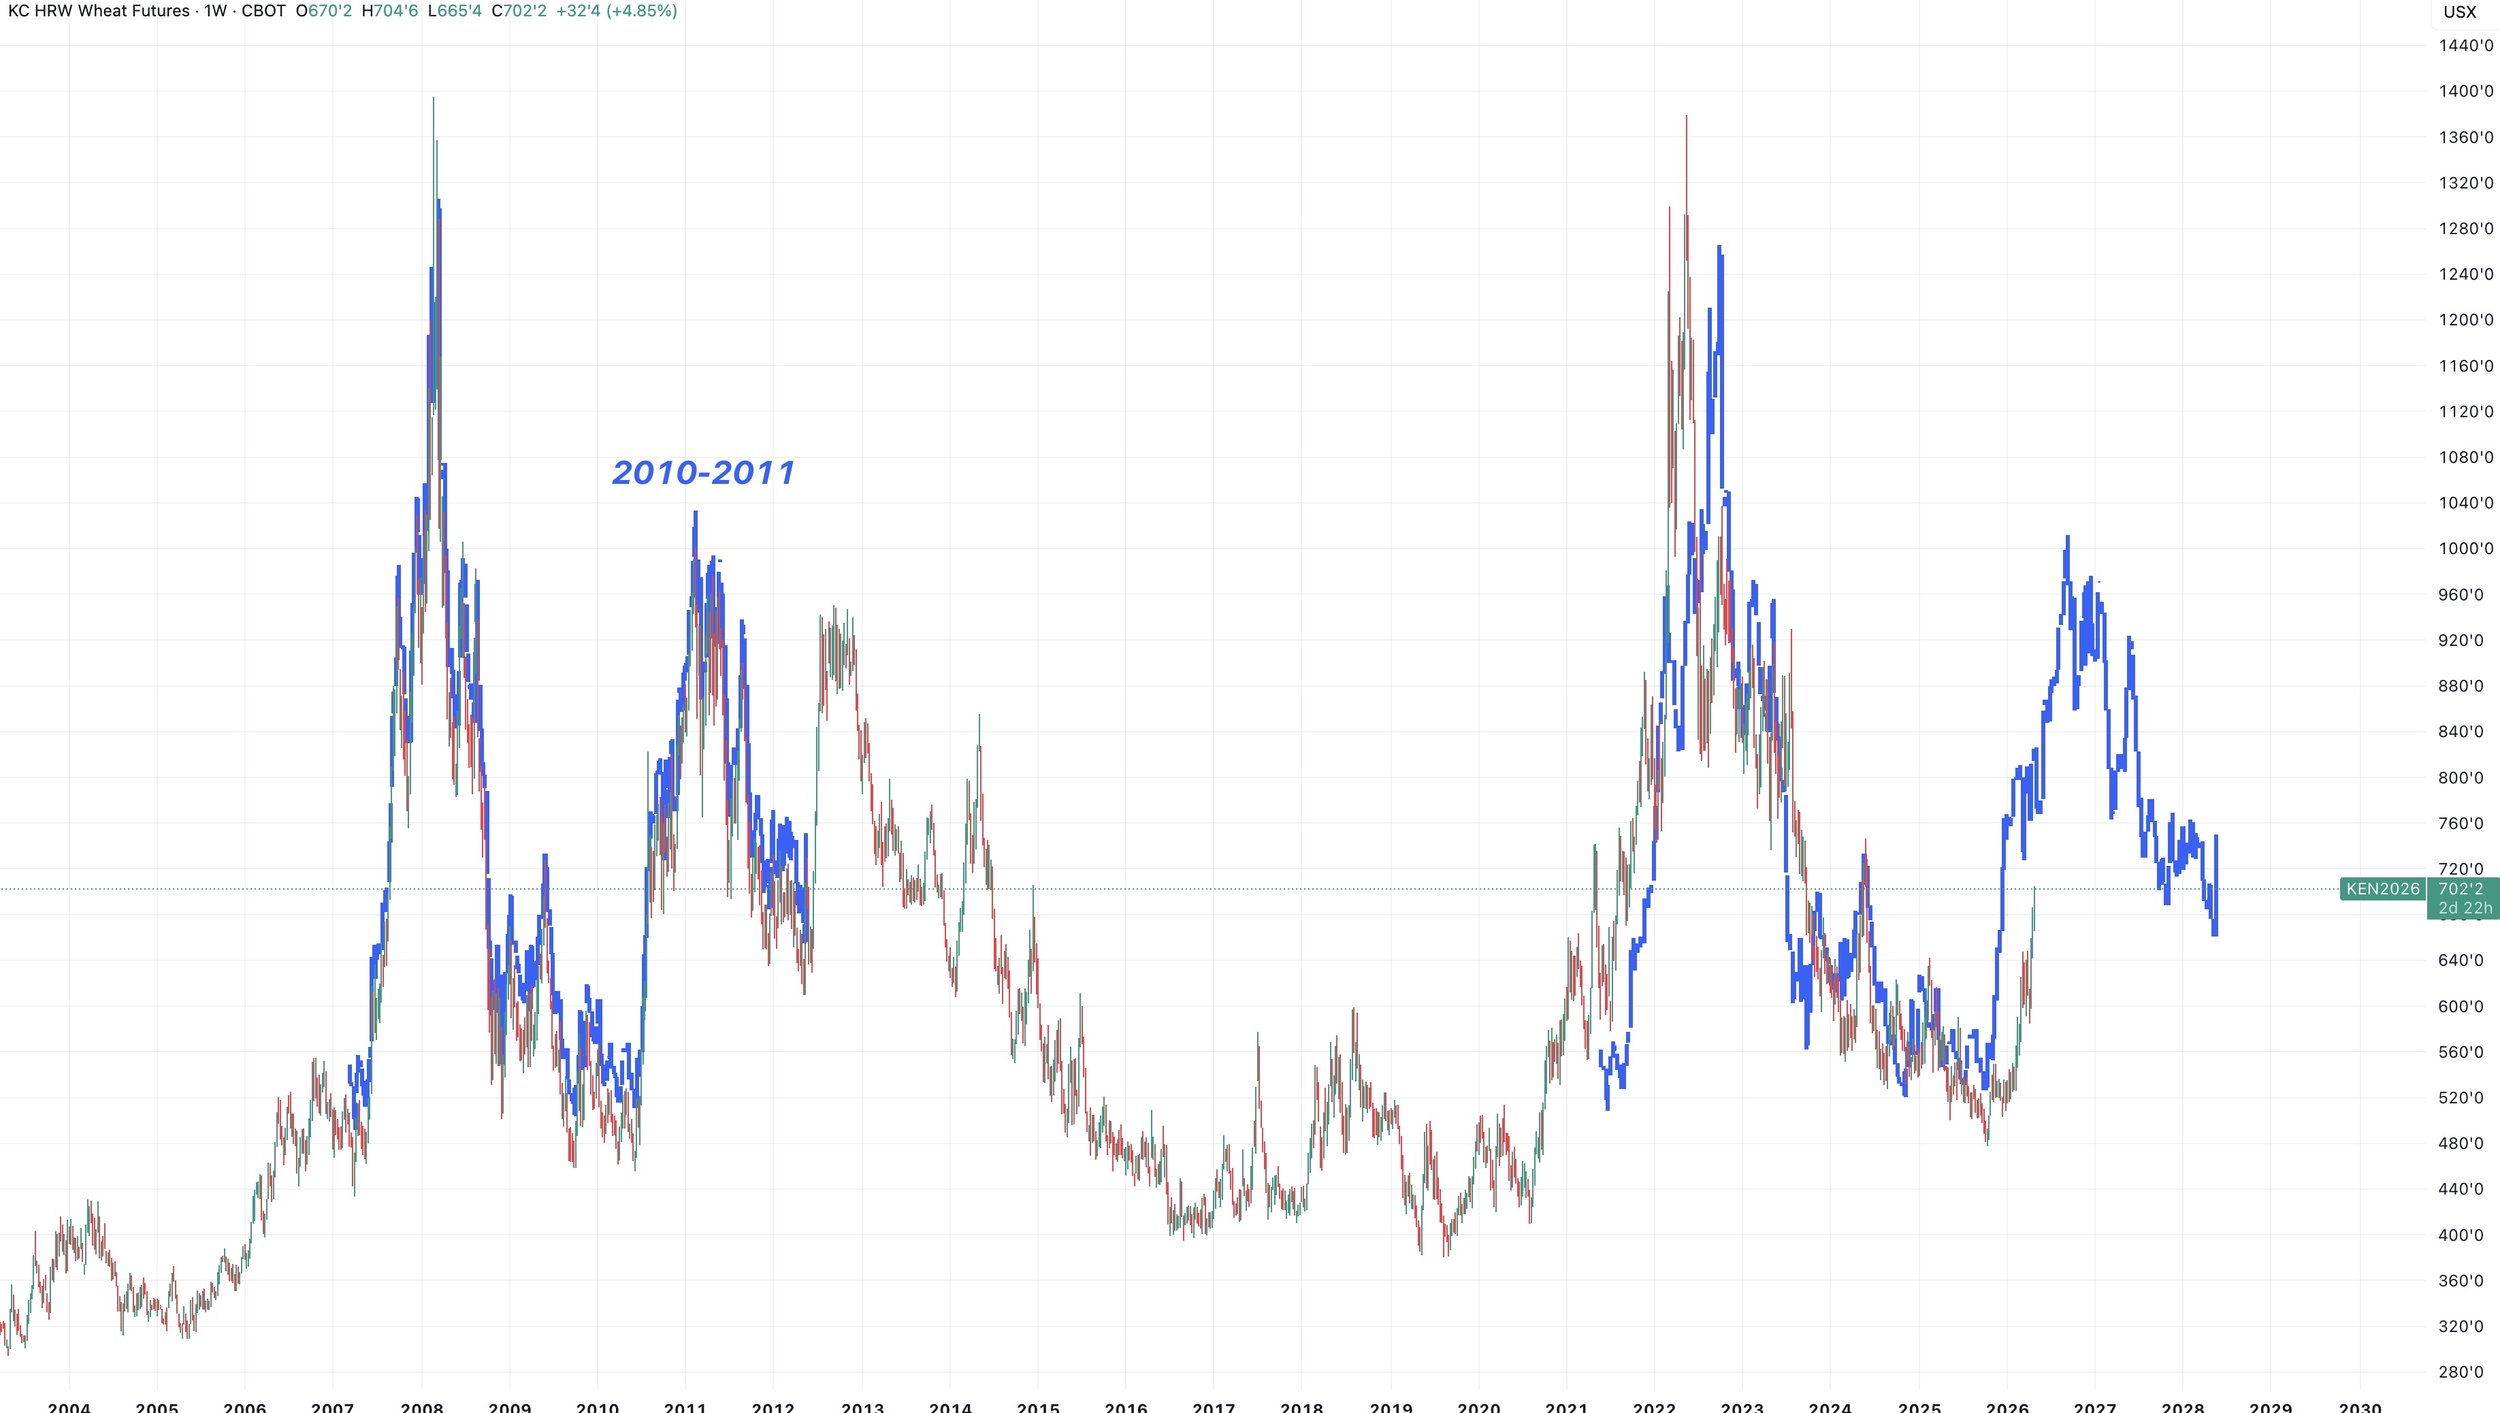
Here is a zoomed in view.
Cattle
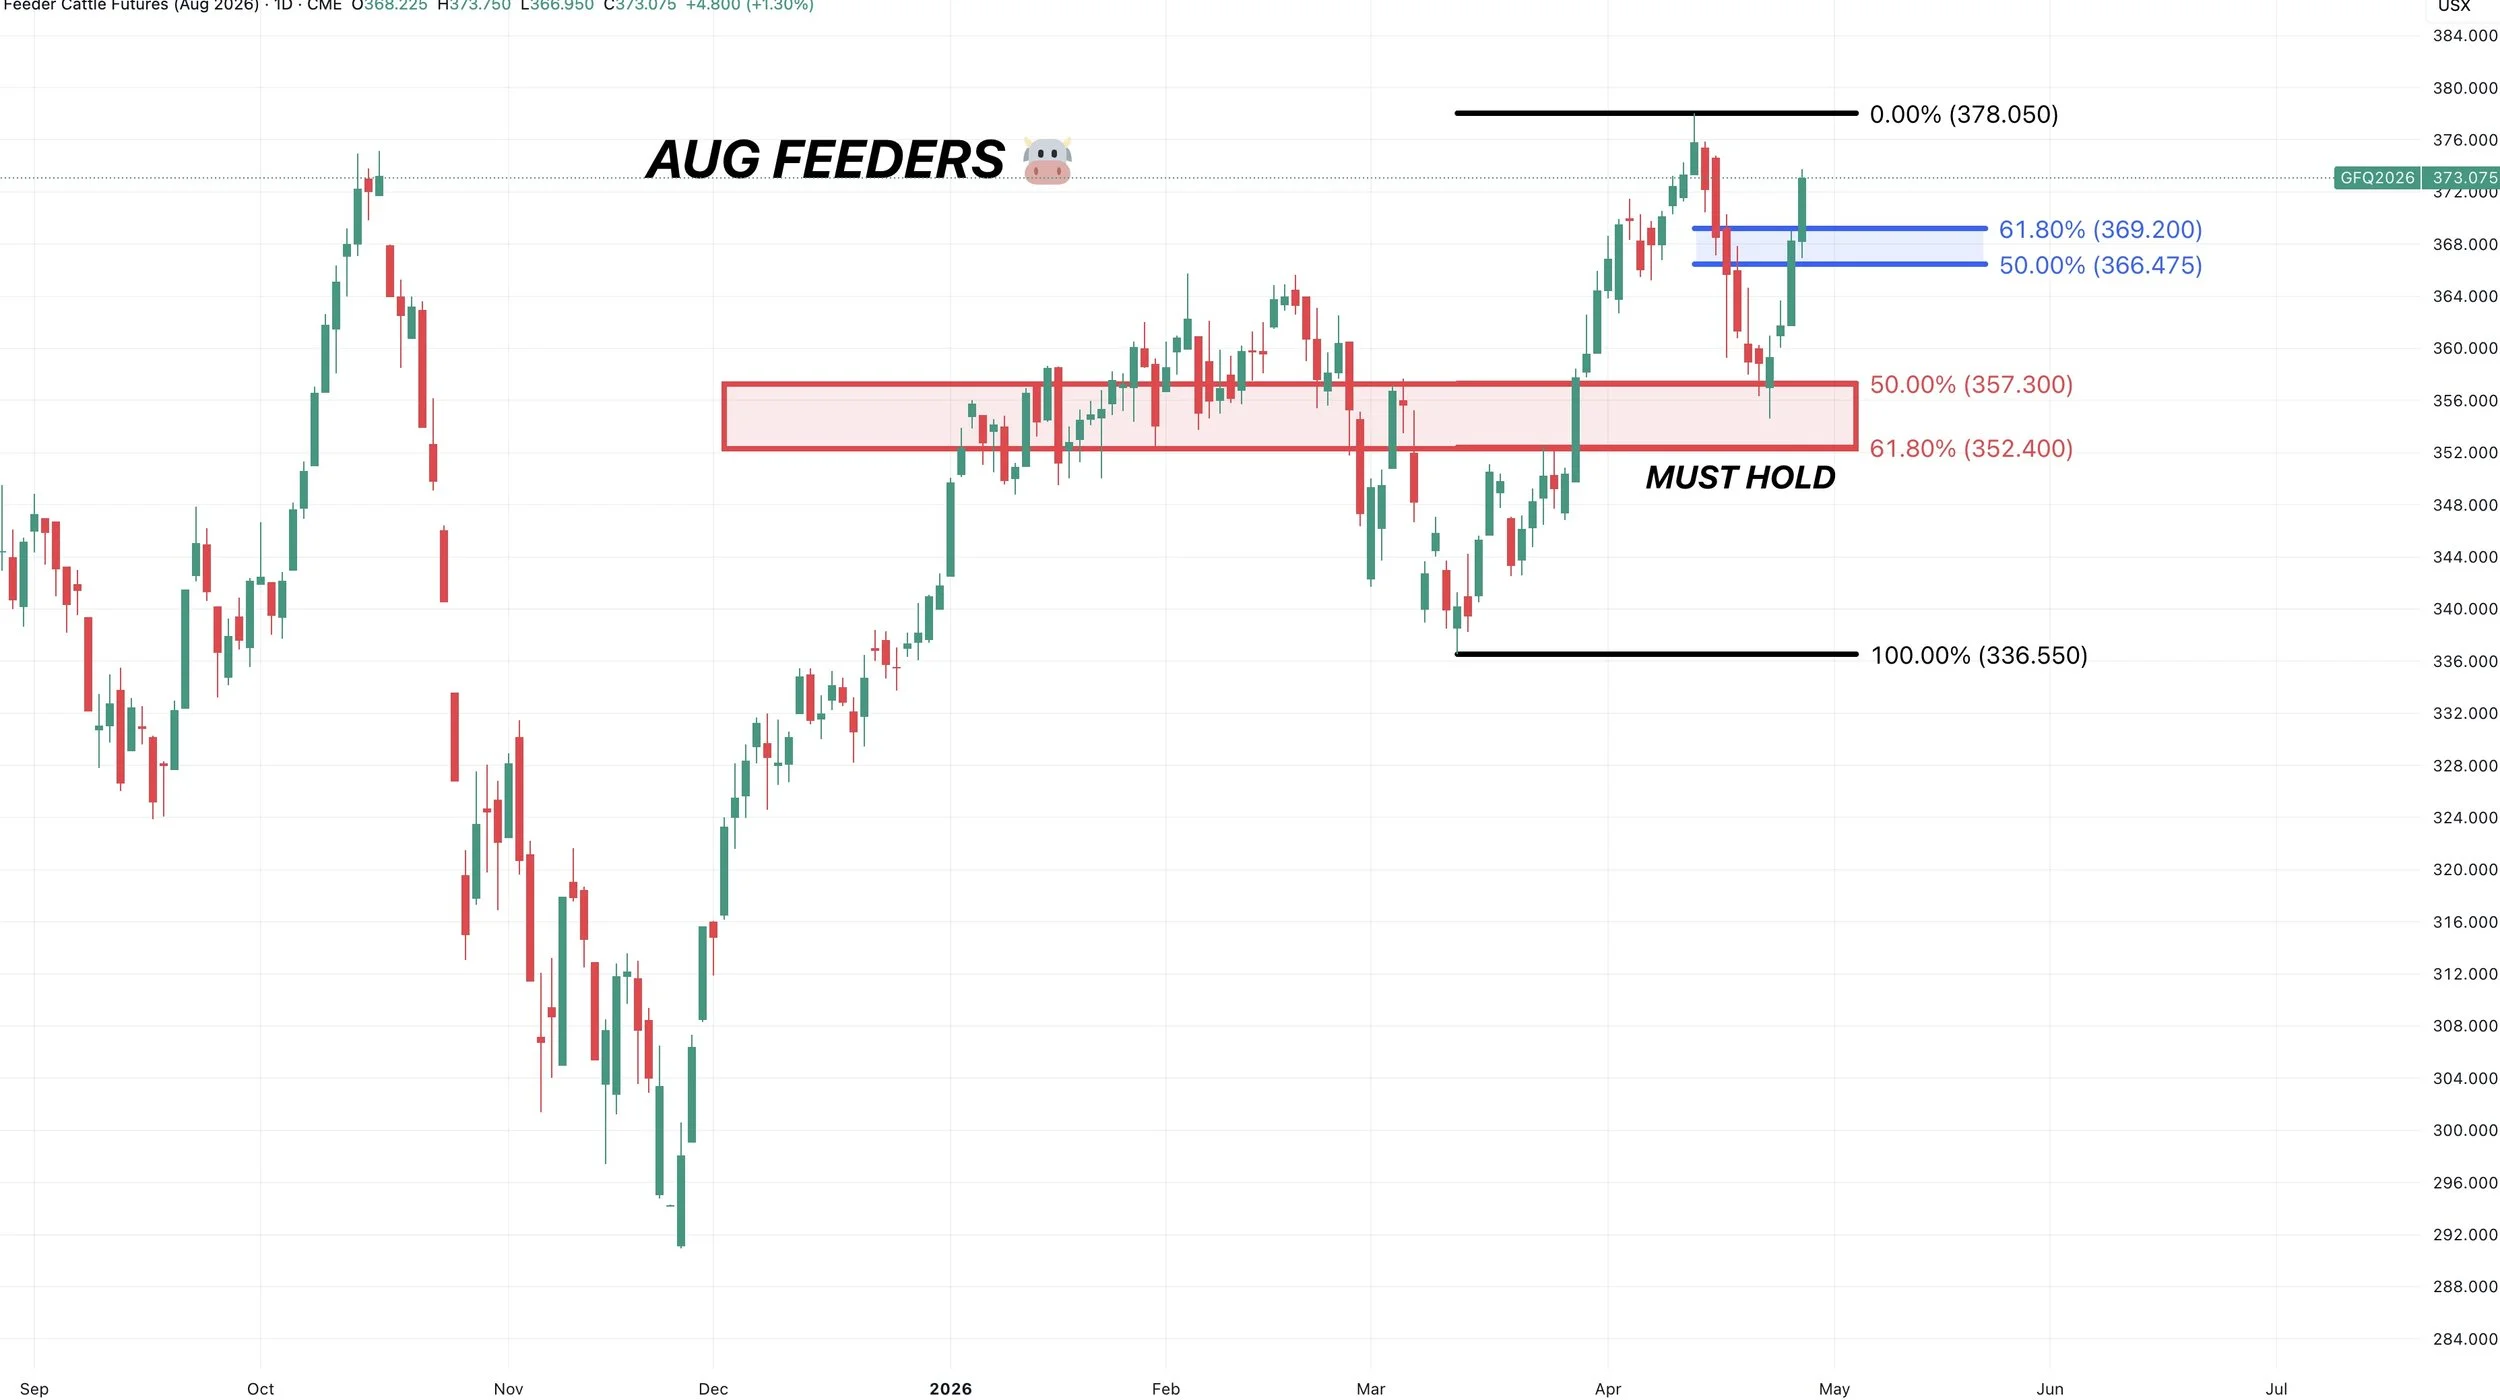
Aug Feeders Chart:
Not spending much time on cattle today.
We had that fear of the border re-opening which was a large part of the recent weakness. It seems like that fear has left the market.
On the sell off, we bounced exactly where we needed to at that must hold box.
Now to the upside, we broke above the golden zone which tells us this likely isn’t a dead cat bounce.
So the trend is still higher and it looks like we could be ready to make the next leg higher for now.
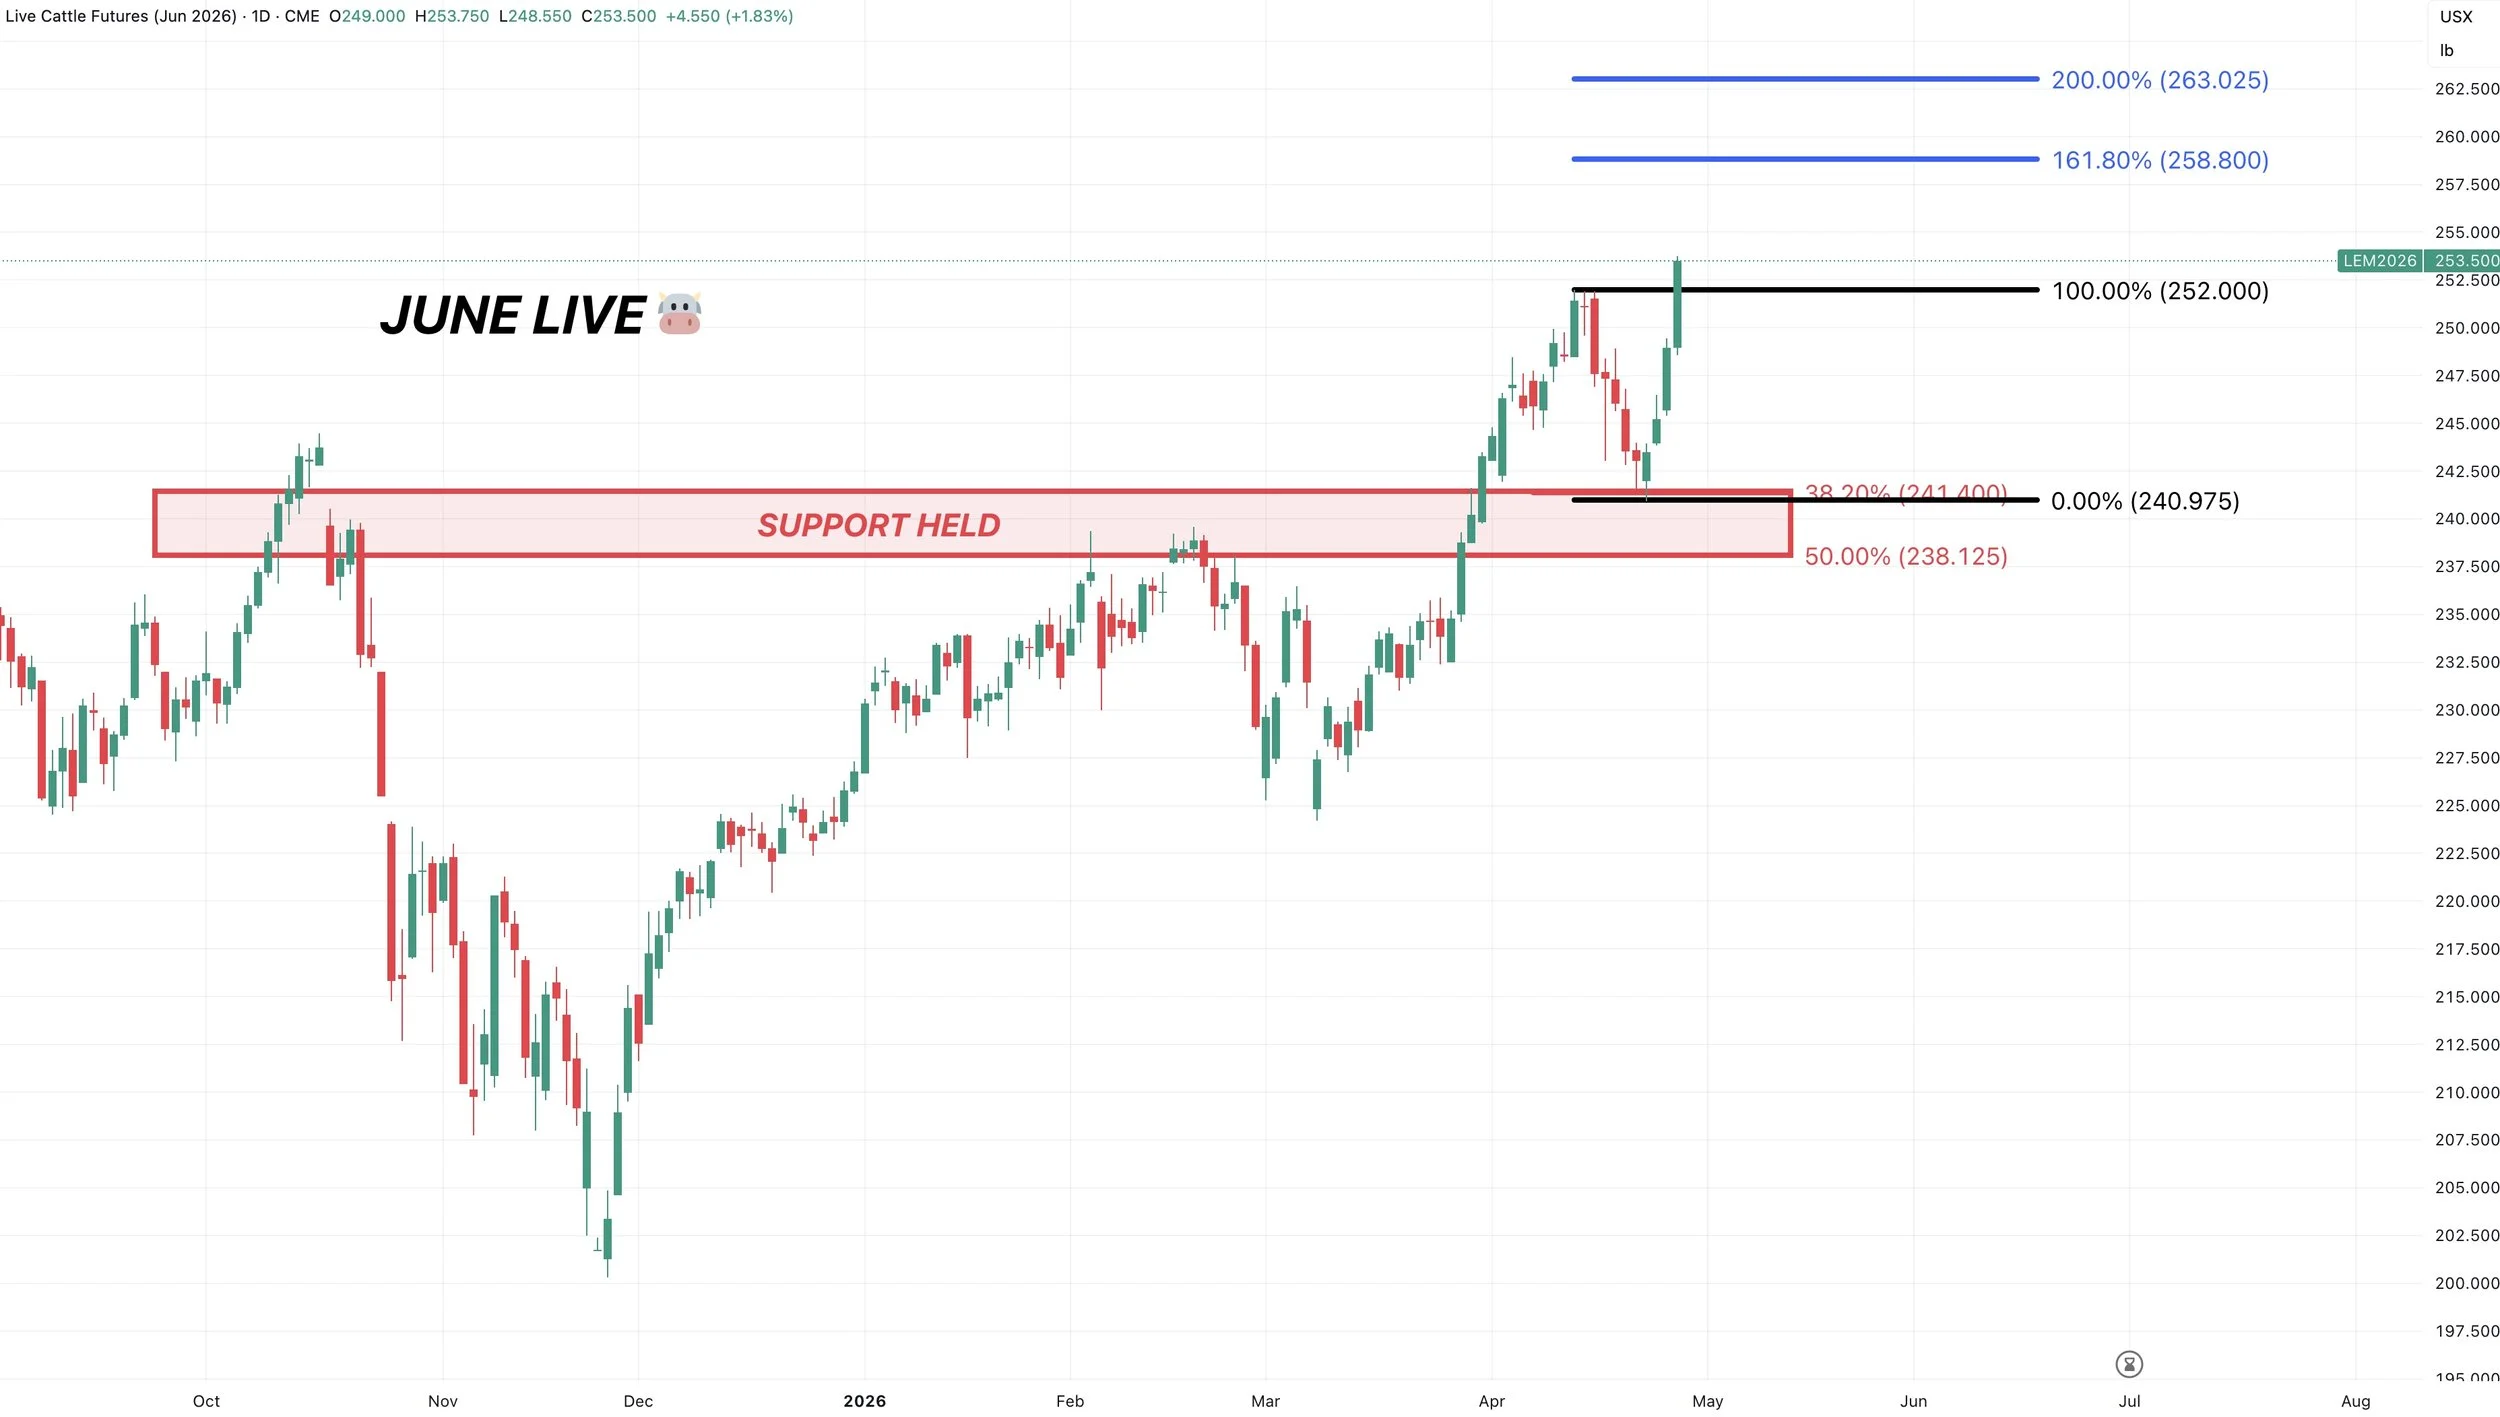
June Live Chart:
Live cattle also found life where we needed.
We've now posted new contract highs looking like we want to continue to run.
We still think it makes sense to keep some sort of protection up at these levels, but the next target would be the golden fib that comes in at 258 to 259.
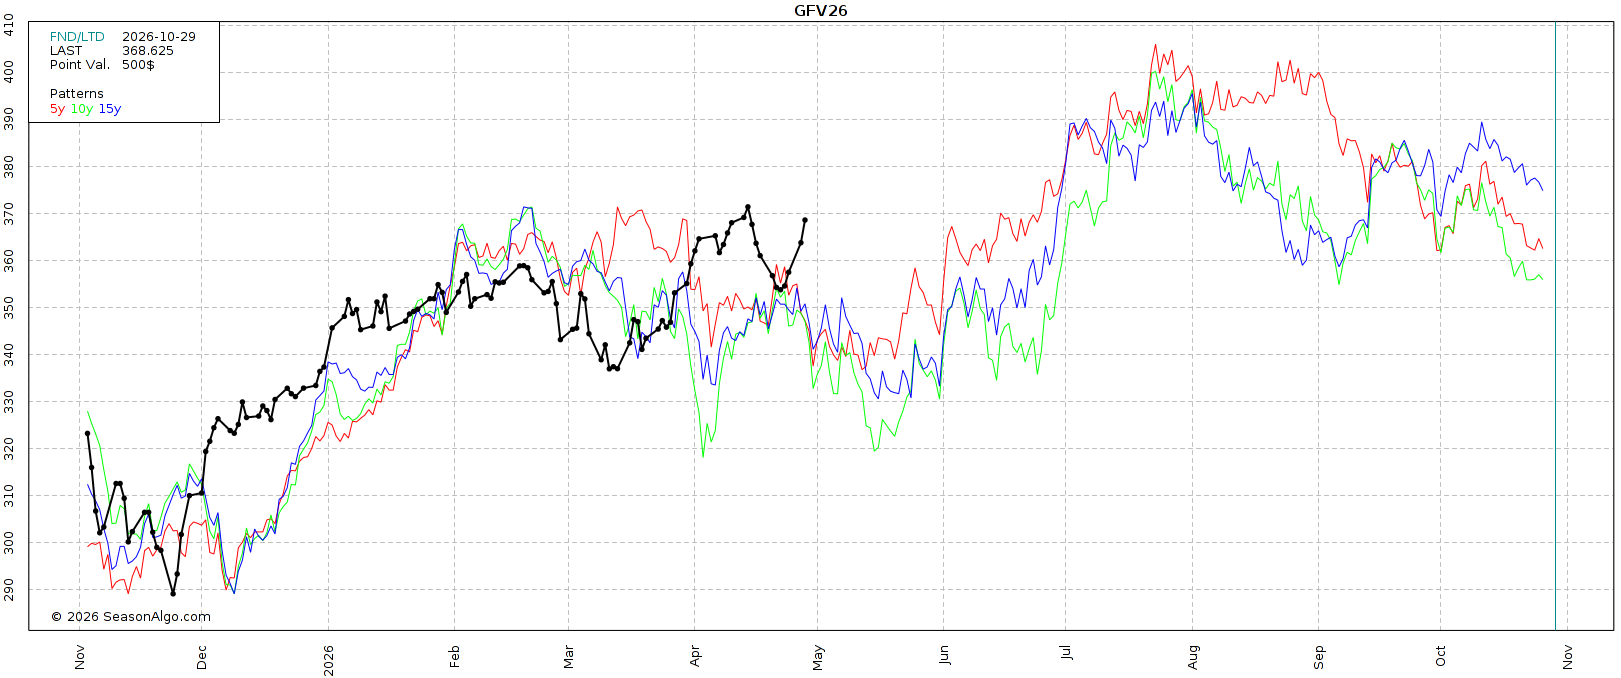
Seasonals:
Seasonally, this cattle market does continue to grind higher into the summer.
We are entering the time of year where we should see the best beef demand.
Want to Talk?
Our phones are open 24/7 for you guys if you ever need anything or want to discuss your operation.
Jeremey & Office: (806)484-1214
Sebastian: (605)280-1186
Email: sfrost@dailymarketminute.com
Hedge Account
Interested in a hedge account? Use the link below to set up an account or give us a call.
Recent Signals
April 28th, 2026: 🌾
KC wheat specific signal.
CLICK HERE TO VIEW
April 27th, 2026: 🌽
Corn catch up sell signal.
CLICK HERE TO VIEW
April 10th, 2026: 🌽
Corn buy signal.
CLICK HERE TO VIEW
March 19th, 2026: 🌱
New crop soybeans signal & hedge alert.
CLICK HERE TO VIEW
March 9th, 2026: 🌱
Soybeans signal & hedge alert. Sent via text.
March 6th, 2026: 🌽 🌾
Corn & wheat sell signal & hedge alert.
March 3rd, 2026: 🌽
Old crop & new crop corn sell signal & hedge alert.
Feb 26th, 2026: 🌱
Old crop & new crop beans sell signal & hedge alert.
Feb 19th, 2026: 🌾
KC wheat sell signal & hedge alert.
Feb 6th, 2026: 🌽 🌱
Old crop corn & soybean sell signal & hedge alert.
Feb 4th, 2026: 🌱
Soybean sell signal & hedge alert.
Nov 17th, 2025: 🌱
Soybean sell signal & hedge alert.