
DEEP DIVE INTO SEASONALS
MARKET UPDATE
You can scroll to read the usual update as well. As the written version is the exact same as the video.
Timestamps for video:
Overview: 0:00min
Seasonal Dive: 1:10min
Weather & Drought: 8:30min
Corn Charts: 11:15min
Bean Charts: 13:00min
Wheat Charts: 14:30min
Cattle Charts: 17:50min
Want to talk?
Office: (806)484-1214
Futures Prices Close
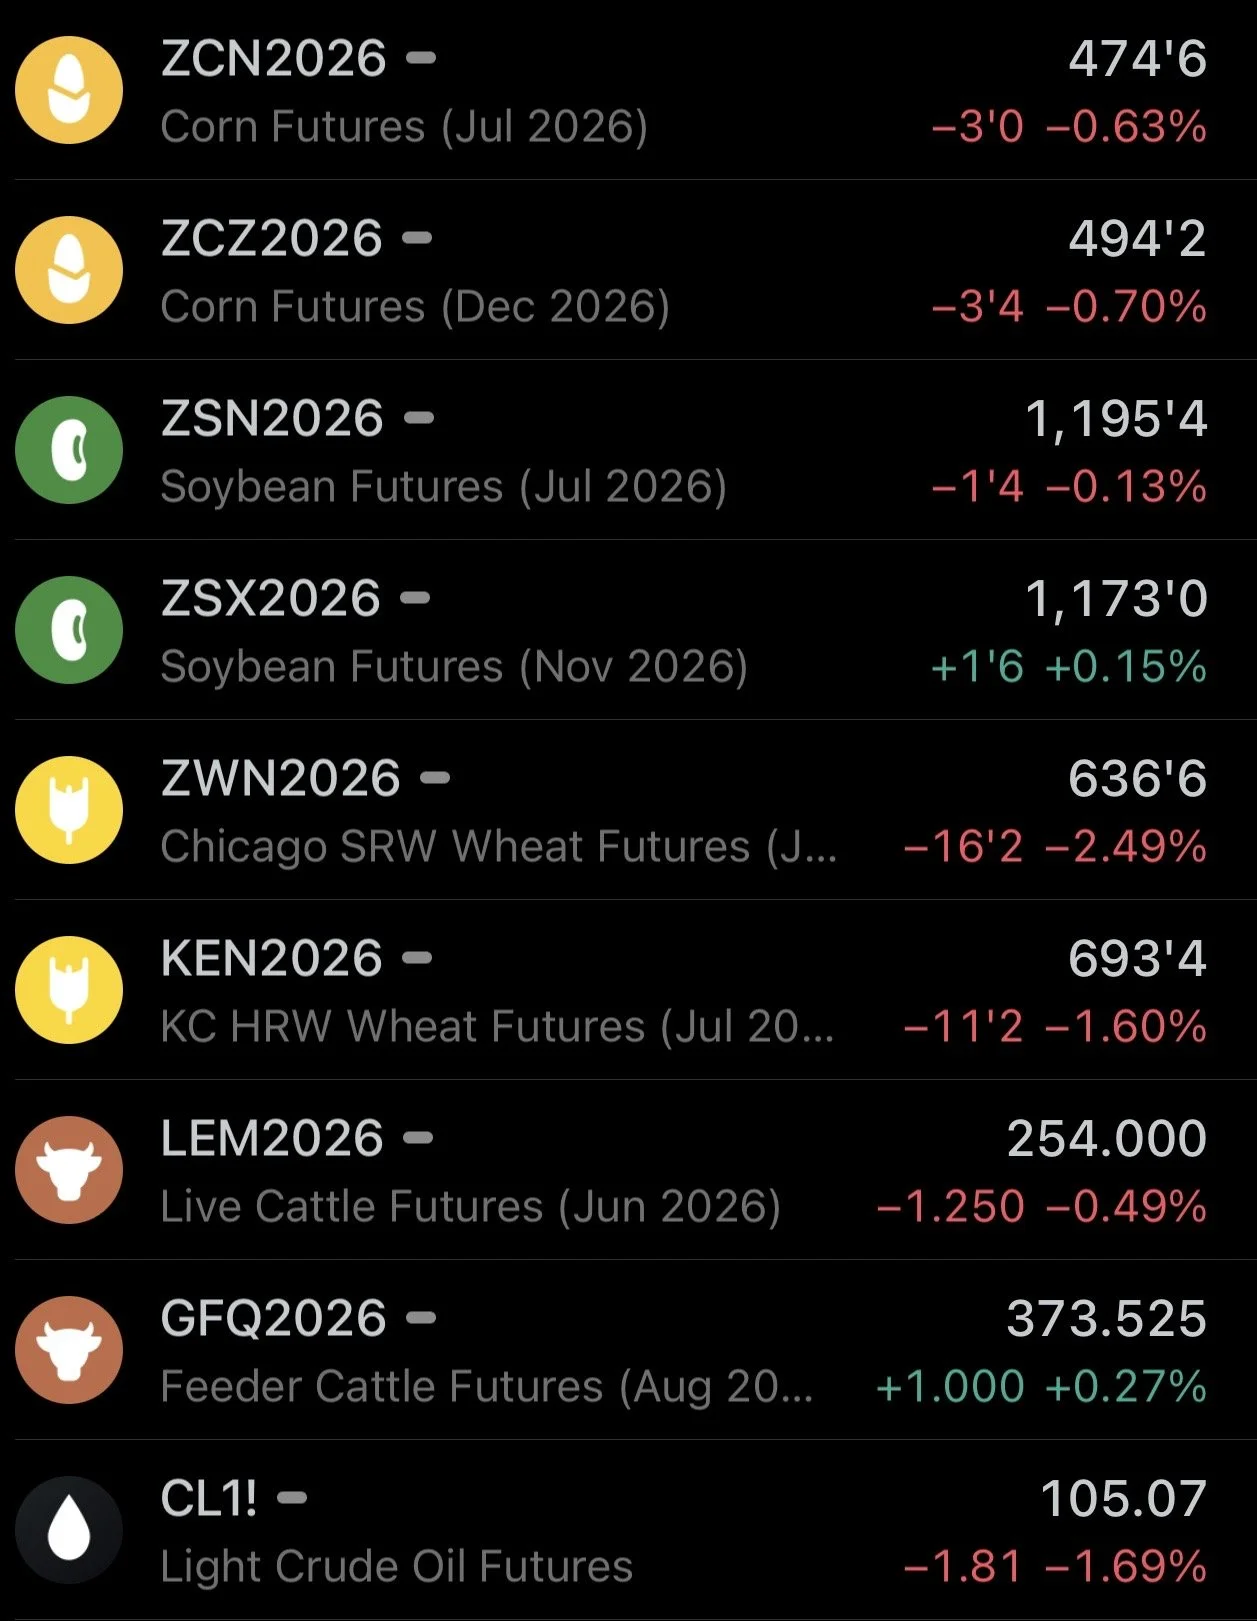
Overview
Grains mostly lower today, with wheat leading the way lower following their recent rally.
Price changes for the month of April:
July Corn: +6 1/2 cents
Dec Corn: +10 cents
July Beans: +9 1/2 cents
Nov Beans: +15 1/2 cents
July KC Wheat: +45 cents
Not a ton of fresh news out today.
Today was first notice day for May futures.
Deliveries were light for both corn and soybeans. However we saw some heavier deliveries for KC wheat and soybean oil.
Deliveries:
Corn: 19
Beans: 0
Meal: 0
Bean Oil: 400
KC Wheat: 578
Deep Dive Into Seasonals
Today both new crop corn and new crop soybeans posted new highs for the years.
We are going to take a deep look into the seasonals for corn and soybeans and dive into:
Do we ever post our highs for the year in April?
Do we usually take out the April highs at some point?
What happened in years where we topped out super early or super late?
How often are we lower from today come August?
Amongst some other seasonals and a bunch of different data.
So let's jump right in...
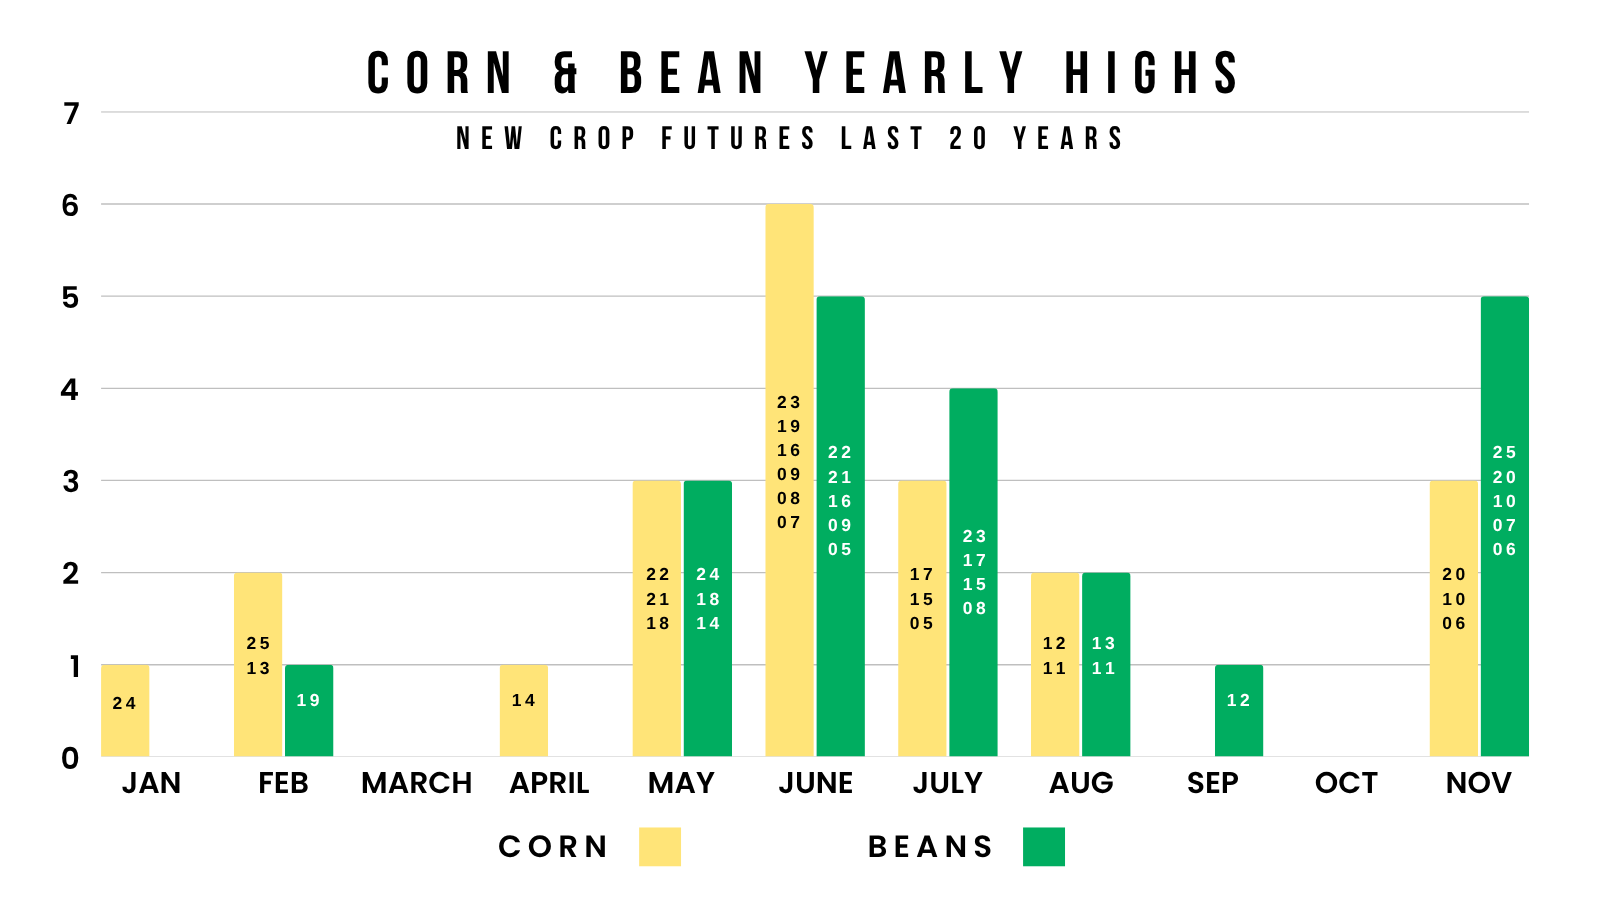
Entering Seasonal Window of Opportunity:
We are quickly approaching that seasonal time frame where we typically post our highs.
Anywhere from May to July is that usual window where we see our highest prices of the year.
Here is the data for the last 20 years.
Corn
May: 3 times (14%)
June: 6 times (29%)
July: 3 times (14%)
Soybeans
May: 3 times (14%)
June: 5 times (24%)
July: 4 times (19%)
12 of the last 21 years featured a top between these 3 months for both corn and soybeans.
Corn has only posted it's high in April once. Back in 2014.
Soybeans have never posted their high in April.
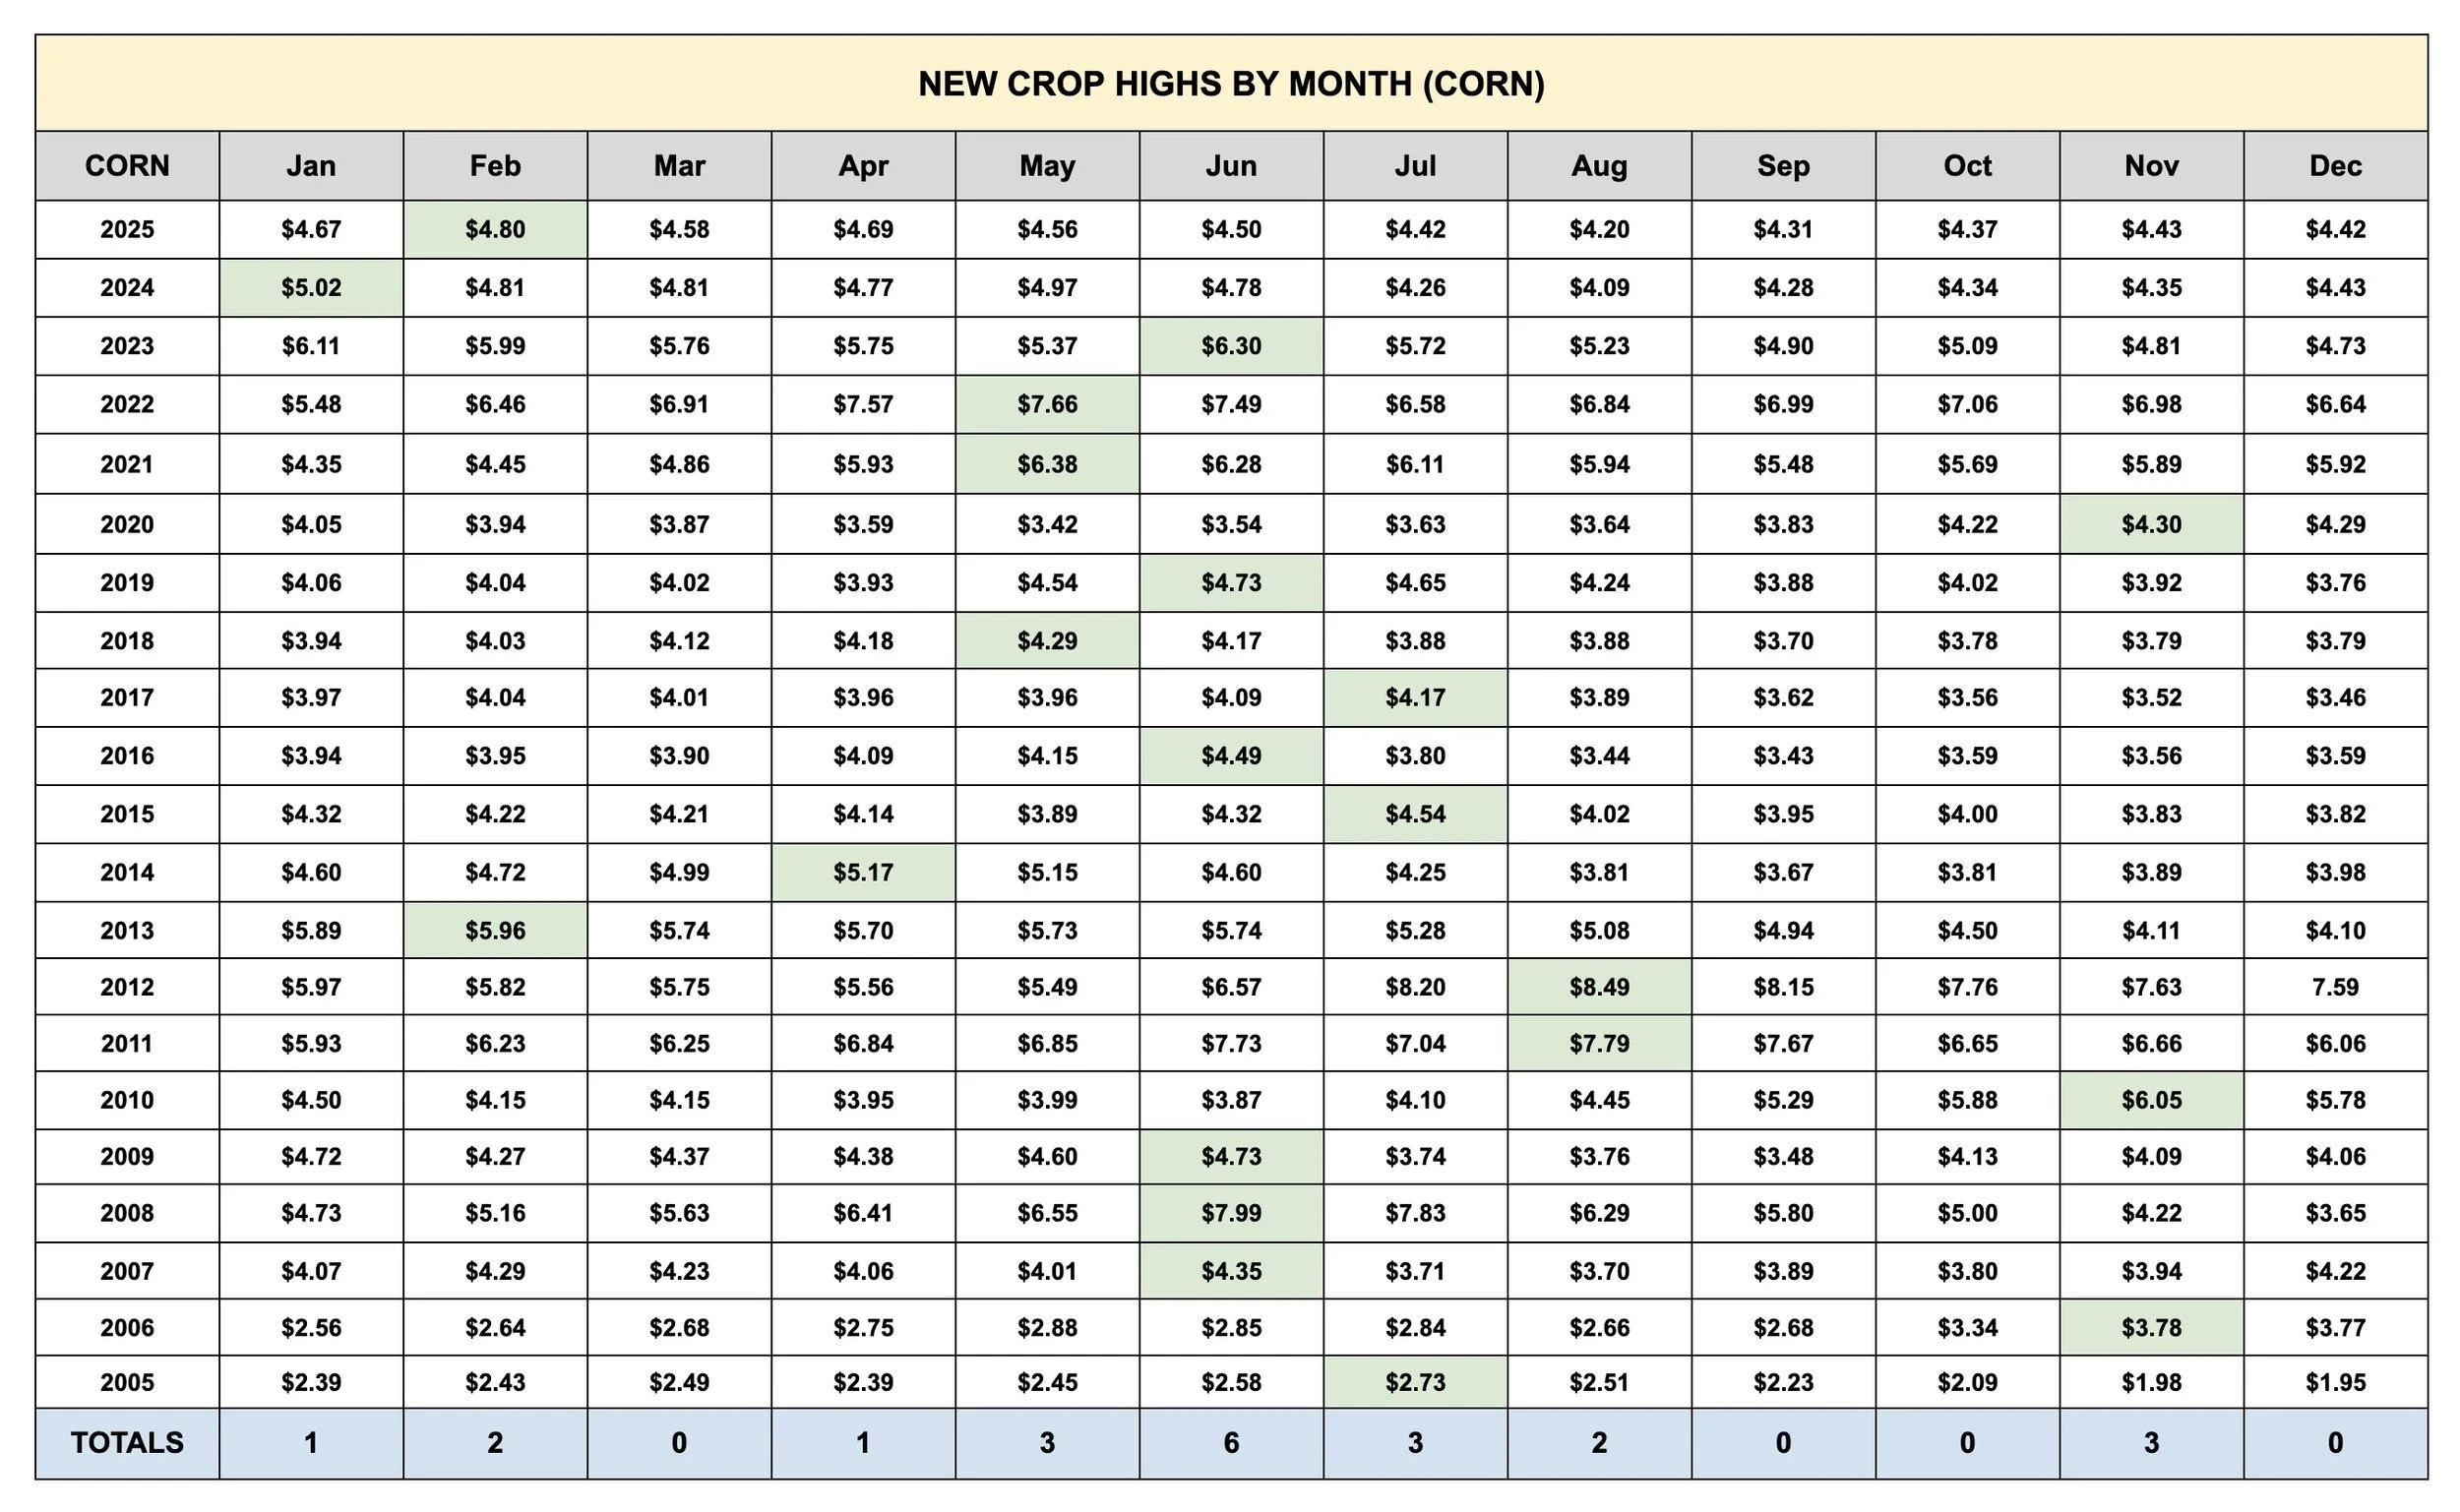
Corn Seasonal Tendencies:
This next chart shows Dec corn's highs by month for every year since 2005.
Again if you notice, most of the time that high comes within May to July.
While only coming in April once.
But what about the years where we didn’t top out in those three months?
Where we topped super early in January or February like the last two years, or made a late year push into November like in 2020?
That brings me to my next chart..
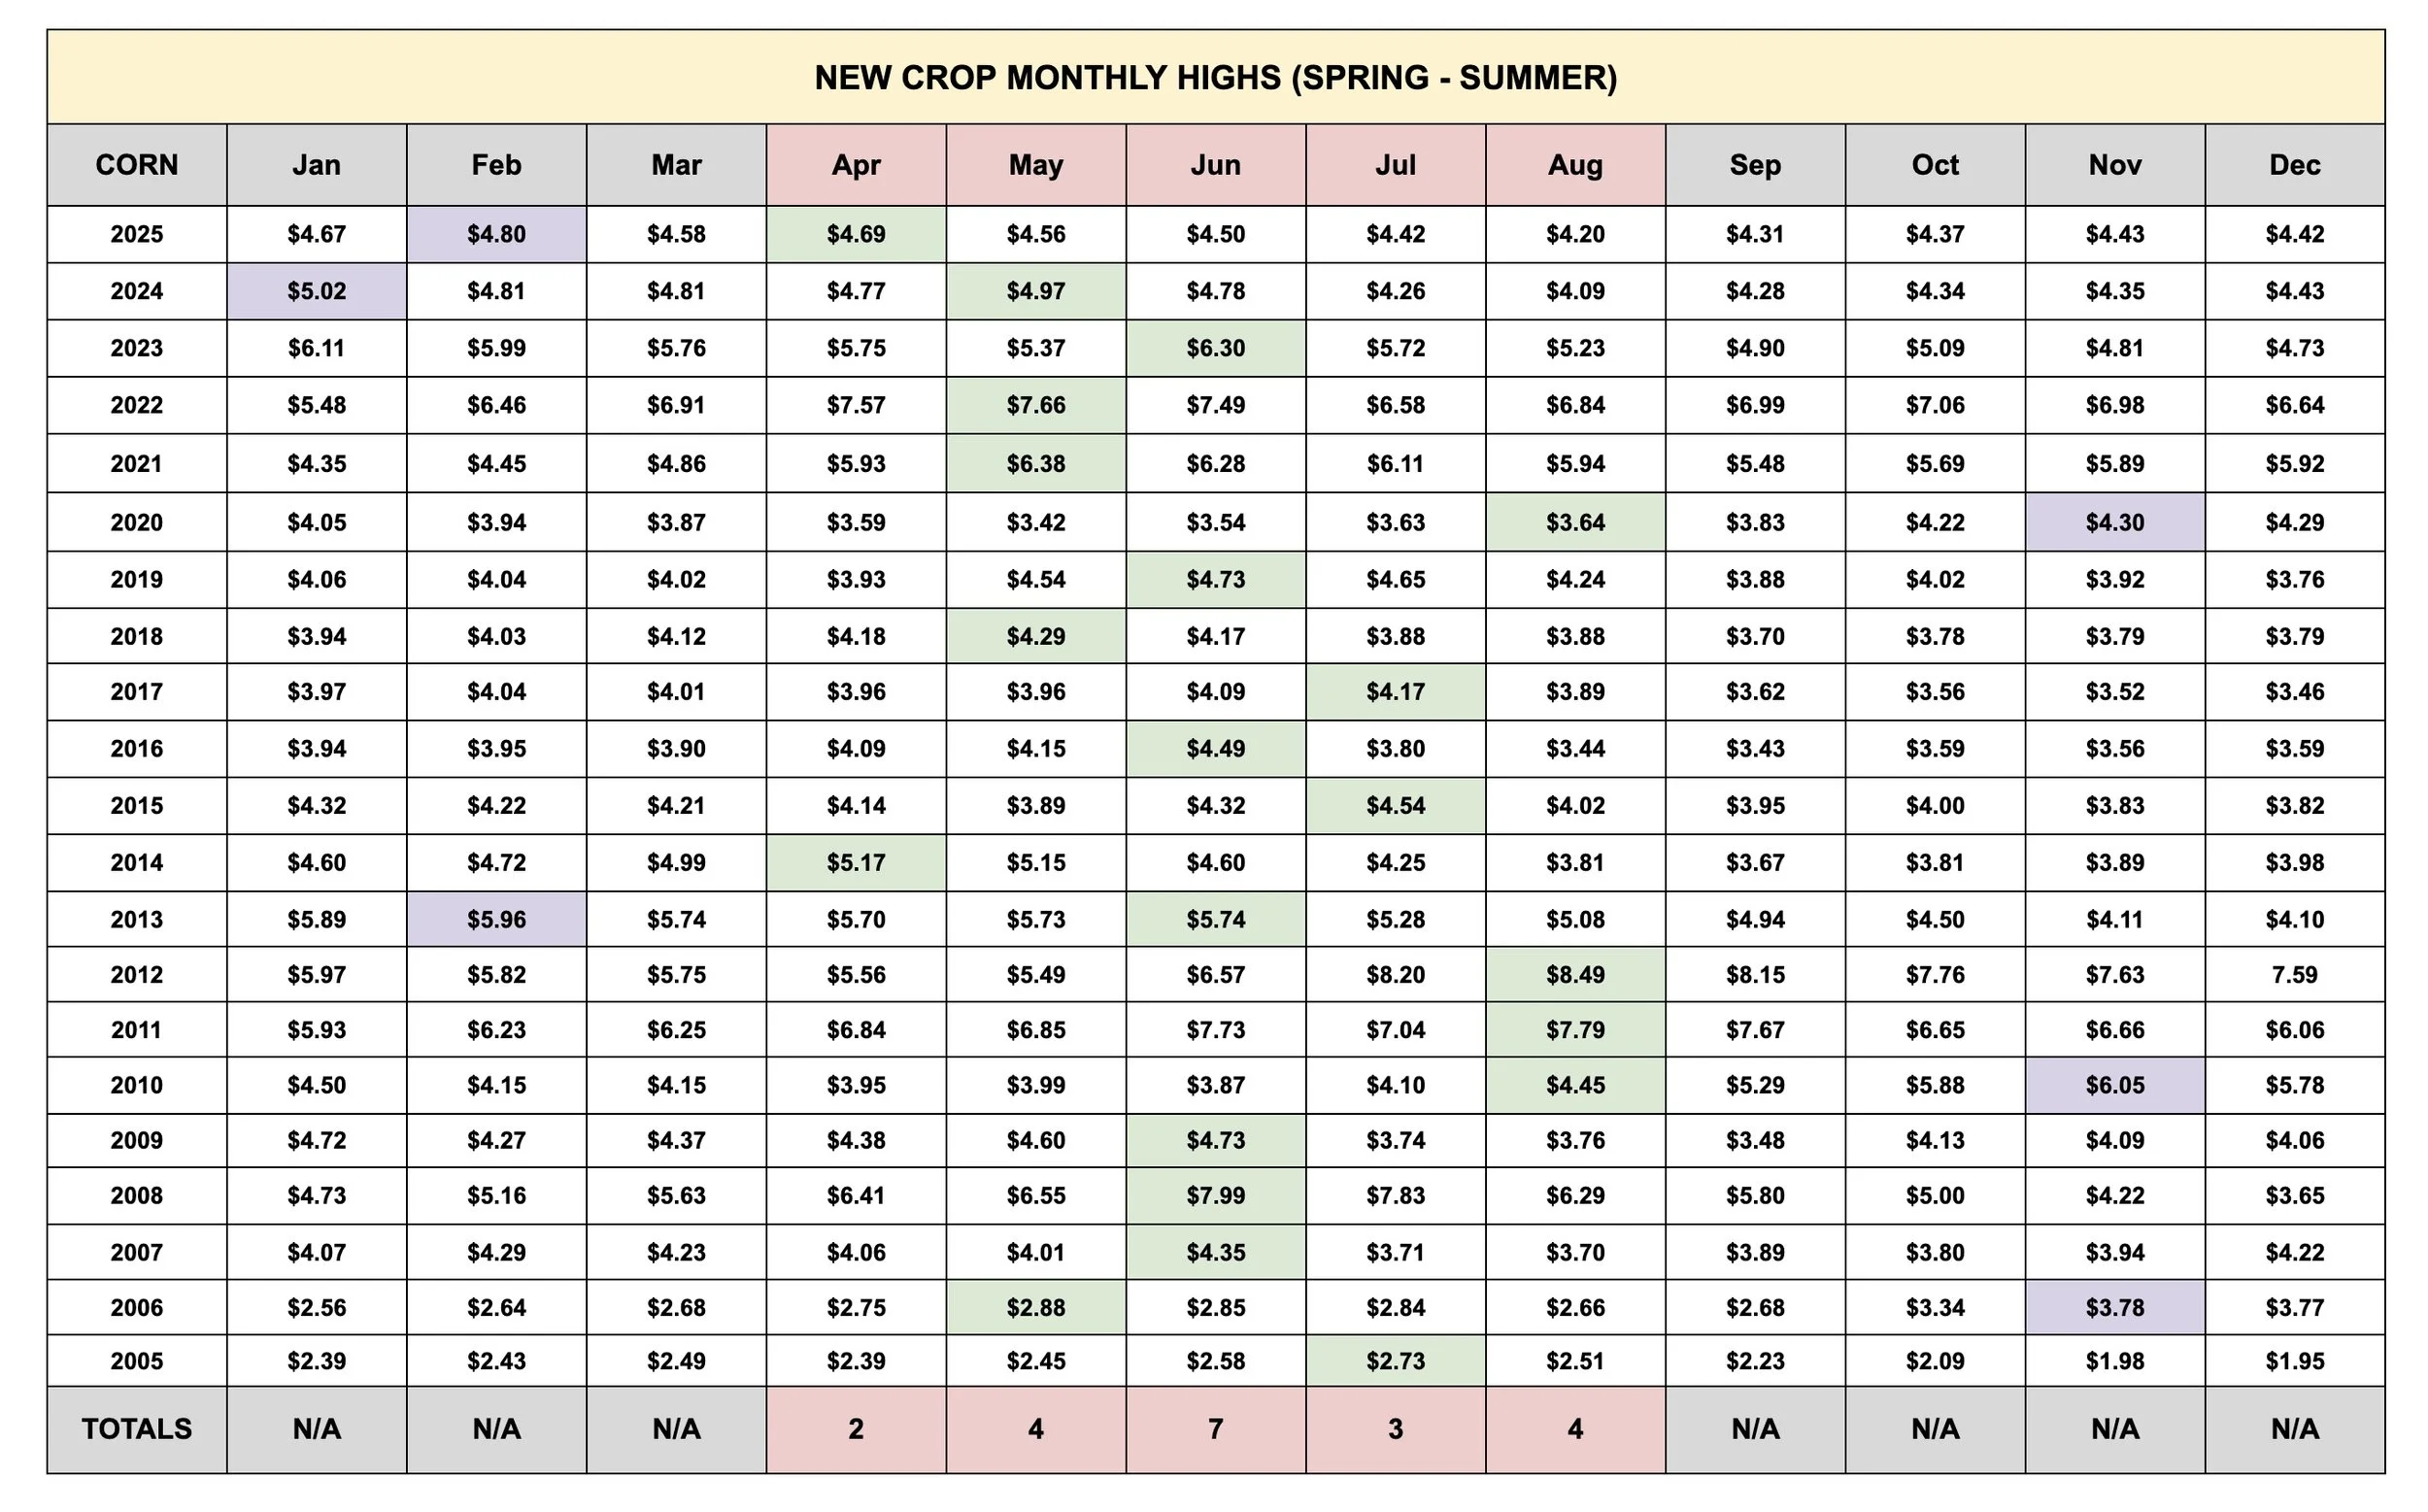
Here is that same chart with the same set of data.
However, in this one we will be focusing on when we posted our highs during the spring to summer. From April to August.
This elimates those years where we had a "non-seasonal" top when you look at the year as a whole.
On this chart I left those non-seasonal tops highlighted in purple.
While marking the spring to summer highs in green.
If there is only one green highlight for that year and no purple, that means the yearly high came within that April to August time frame.
There are only 6 years since 2005 where the yearly high was posted outside of April to August.
If you look under the red columns, our spring to summer high has only been marked in April twice.
The first was 2014, where that was our definitive high for the year.
The other was last year. We posted our highs in February, we then made a secondary high in April before heading lower the rest of the year.
In the other "non-seasonal" years, despite the high for the year coming in November for some years and February for others, most featured a spring to summer high from May to August. Not April.
Spring to Summer Highs by Month:
April: 2 times (9%)
May: 4 times (19%)
June: 7 times (33%)
July: 3 times (14%)
August: 4 times (19%)
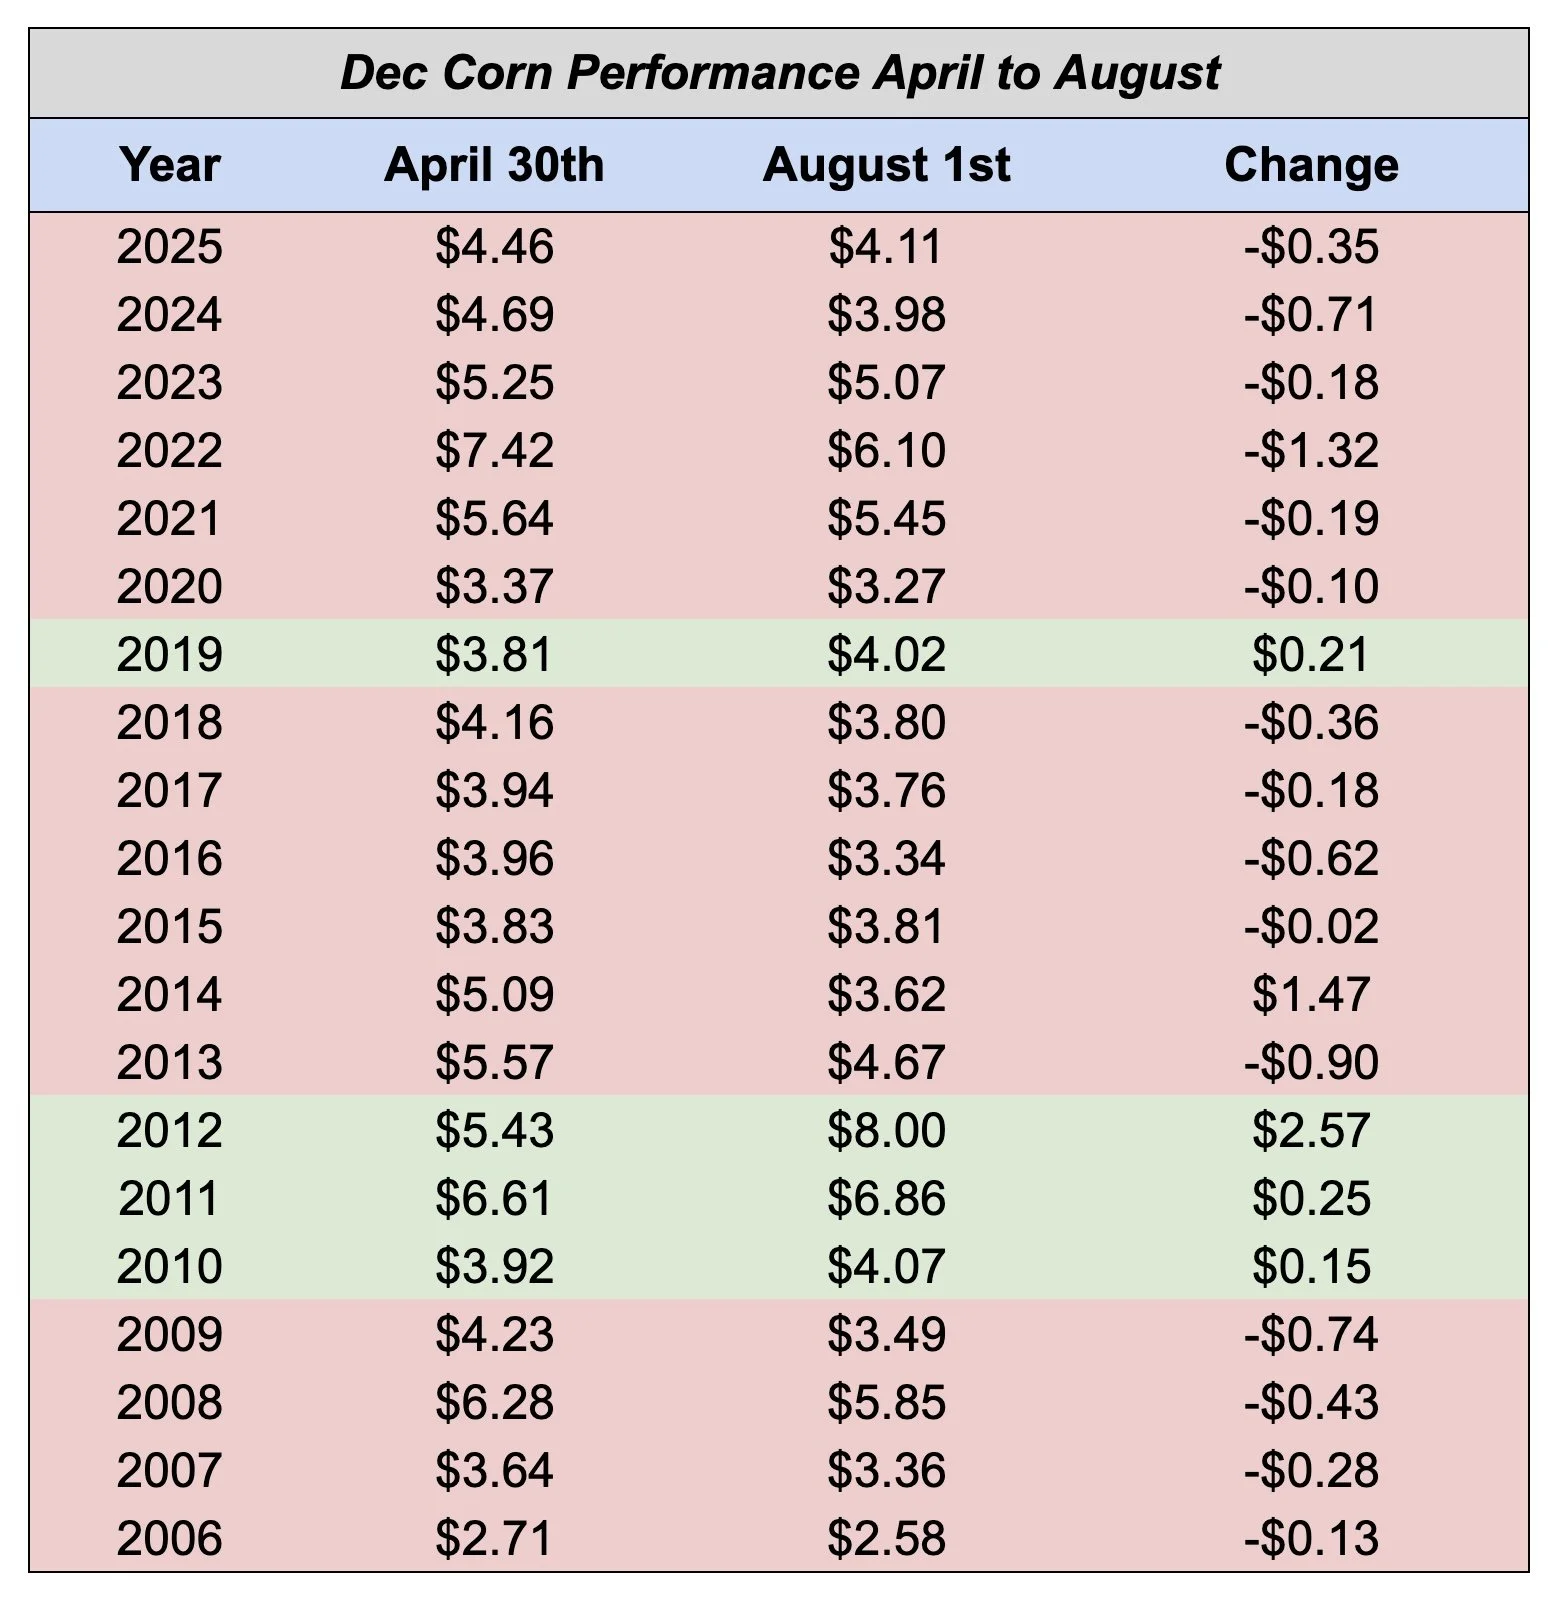
Did you know that corn is lower from today, April 30th, to August 1st in the last 17 of 21 years (81%).
Lower the last 9 of 10 years (90%).
The only years we were not lower from today by August was 2019, and then a three year stretch from 2010 to 2012.
But does that tell the whole story?
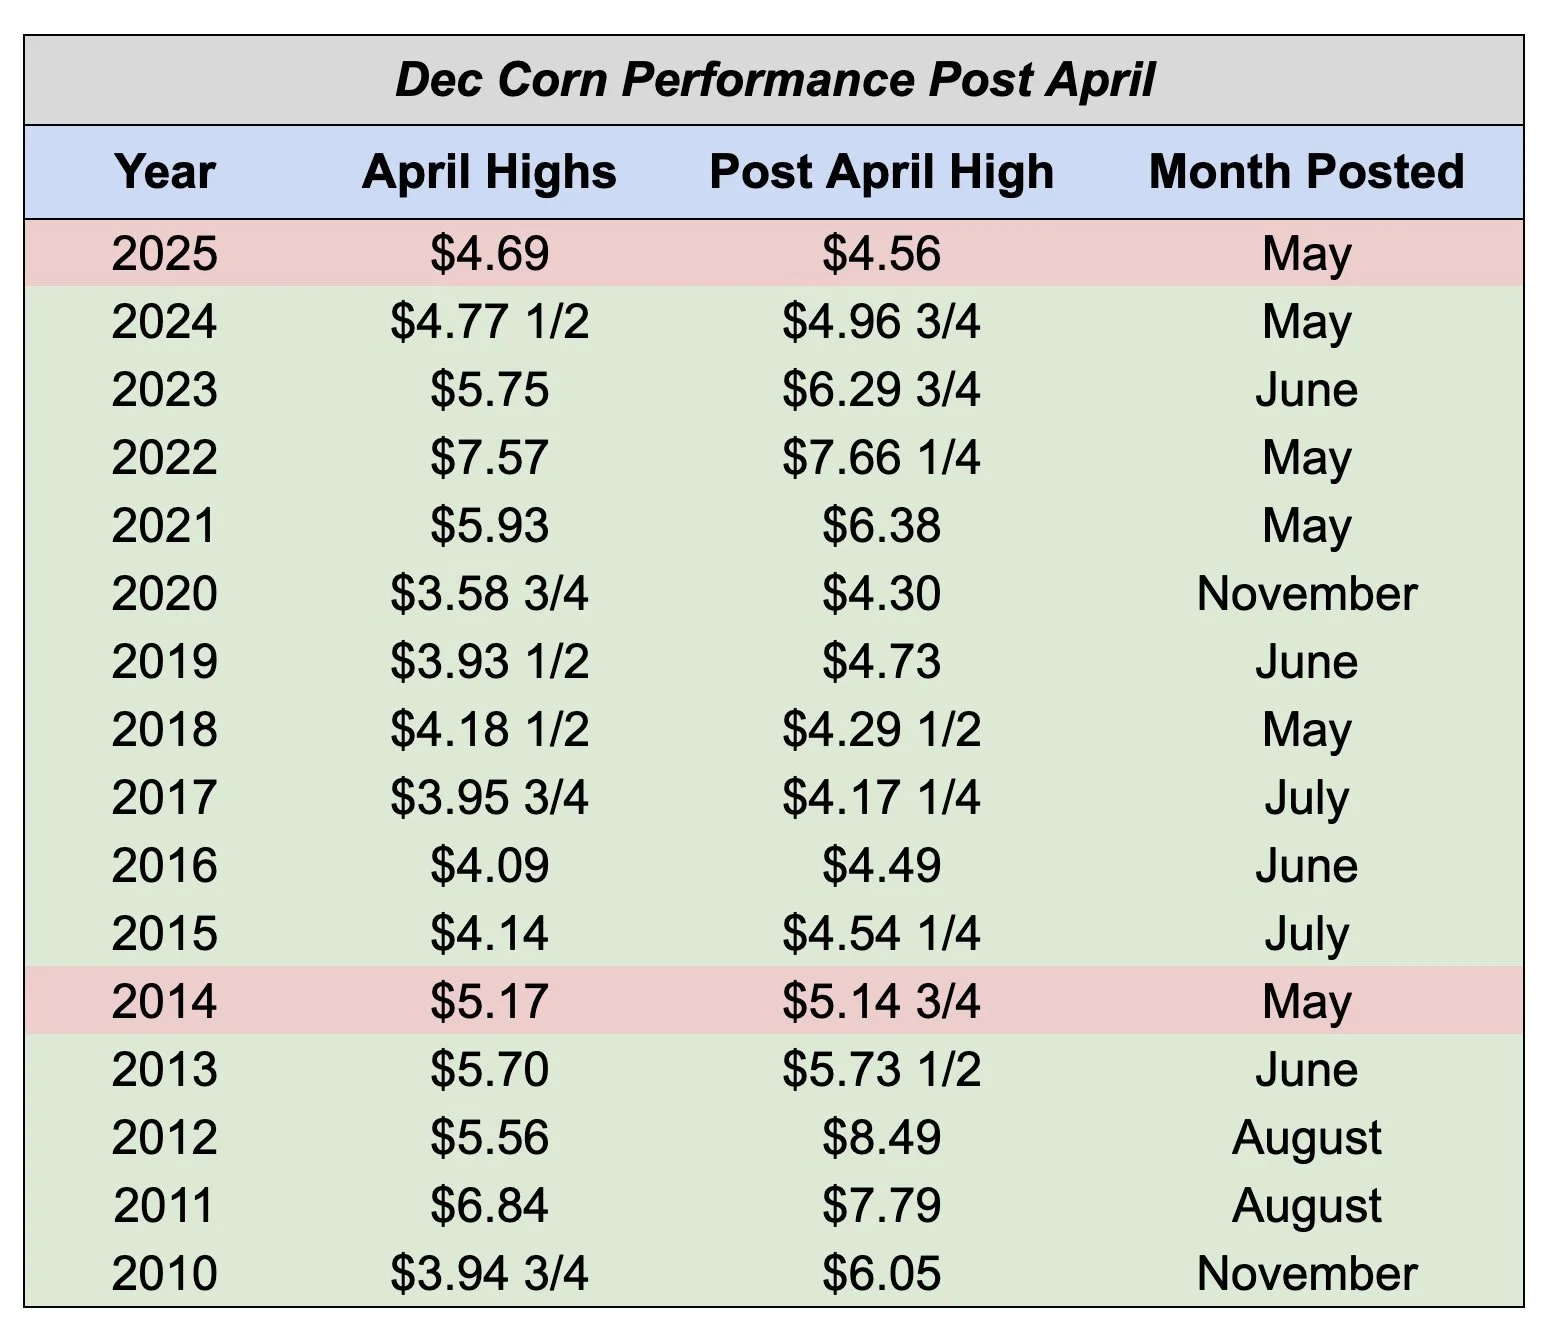
Here is another simple way to look at the data when asking how often do we take out the April highs.
This chart simply shows the April highs, and our post April highs.
Yes, we are usually lower by August.
But we've only NOT taken out the April highs twice.
Last year being one of them.
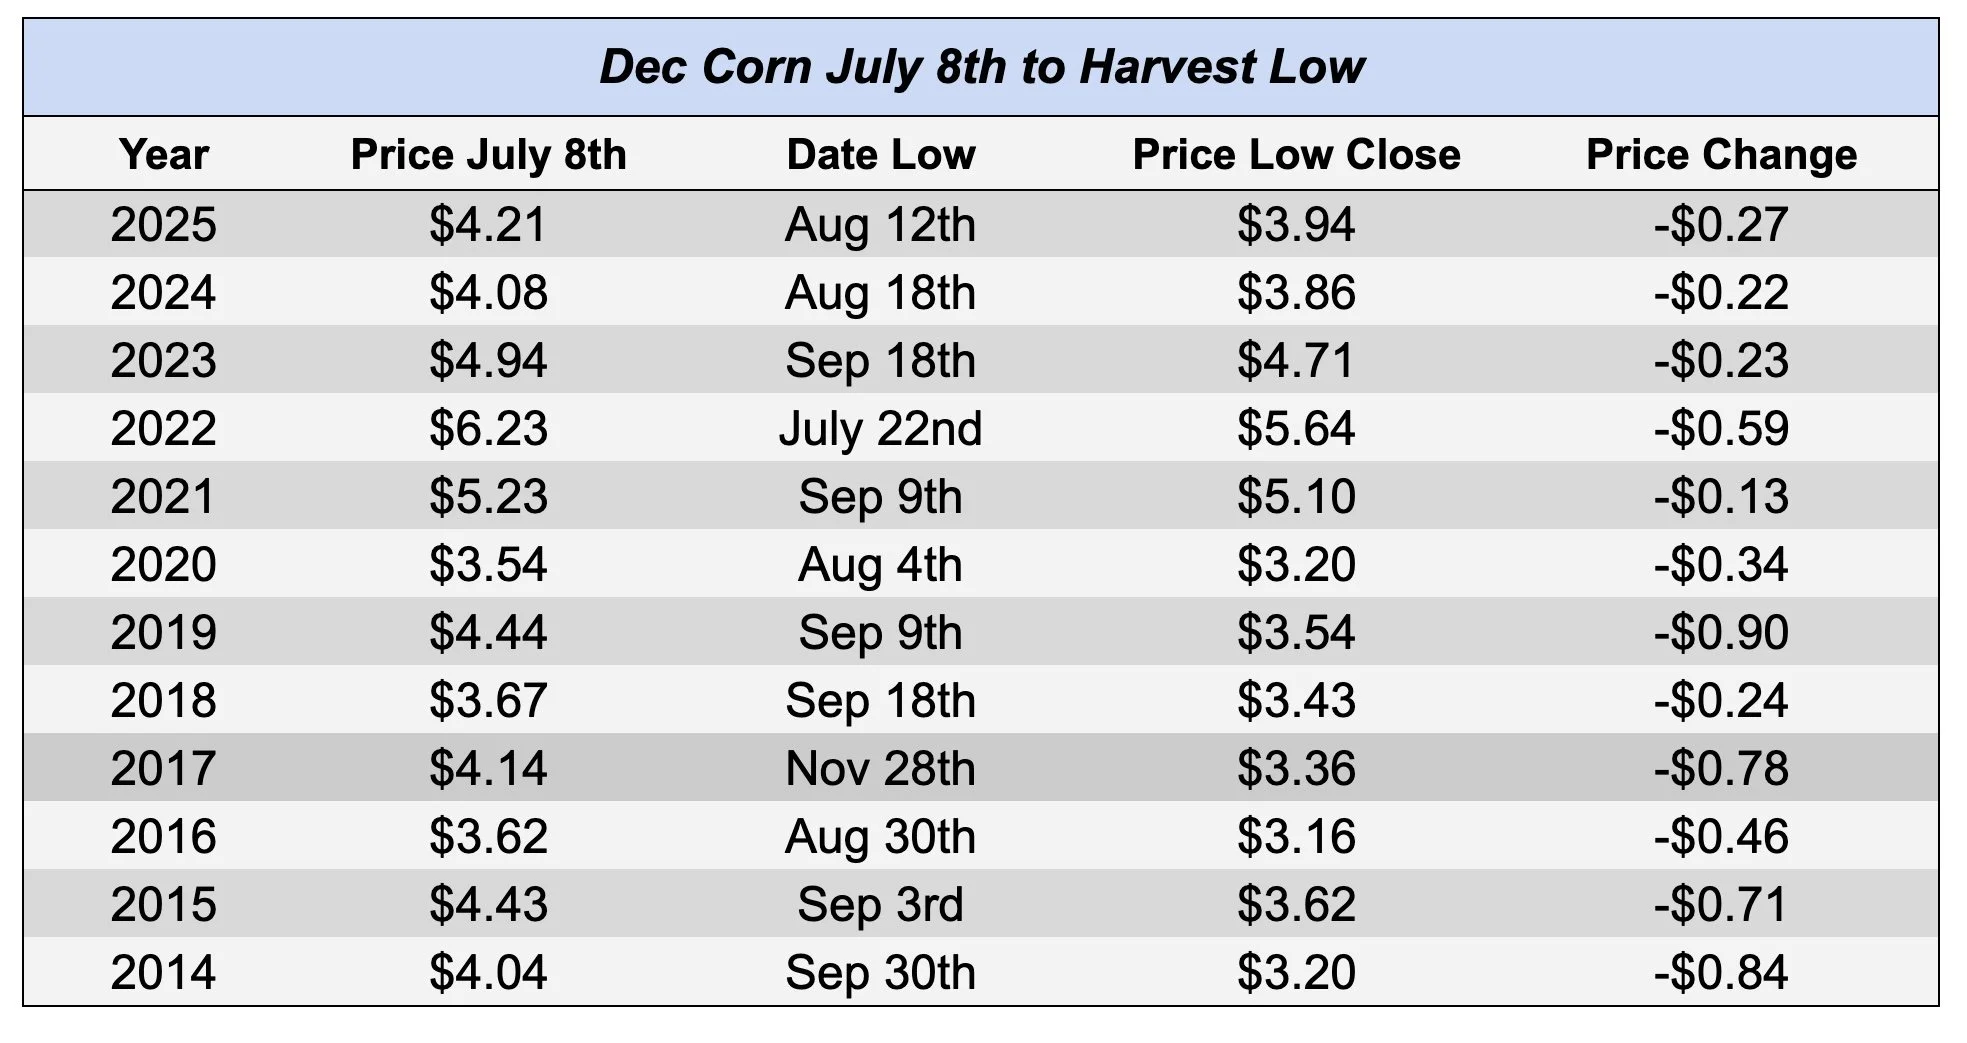
Now here is the data from July 8th to our harvest lows.
Every year for the past decade has indeed featured lower prices from early July heading into August and September.
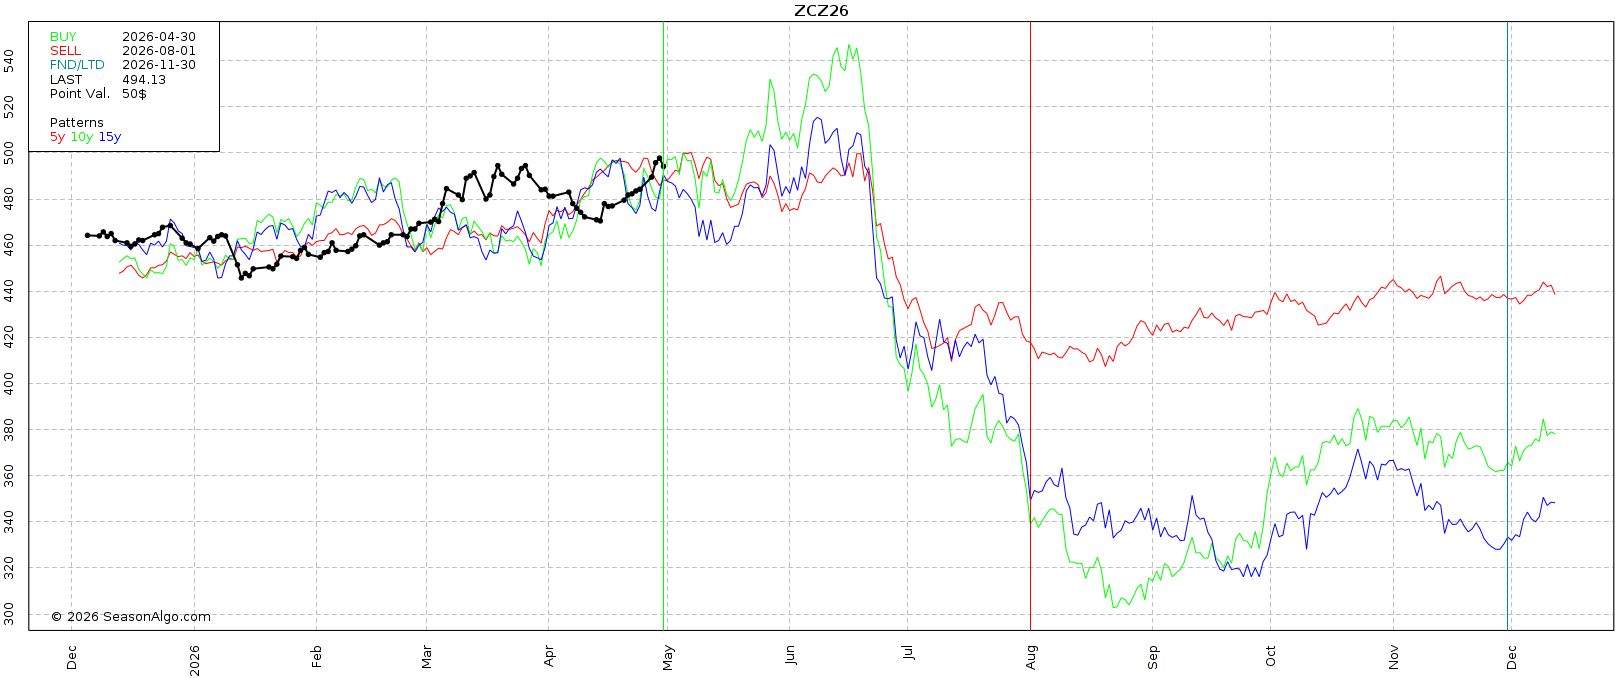
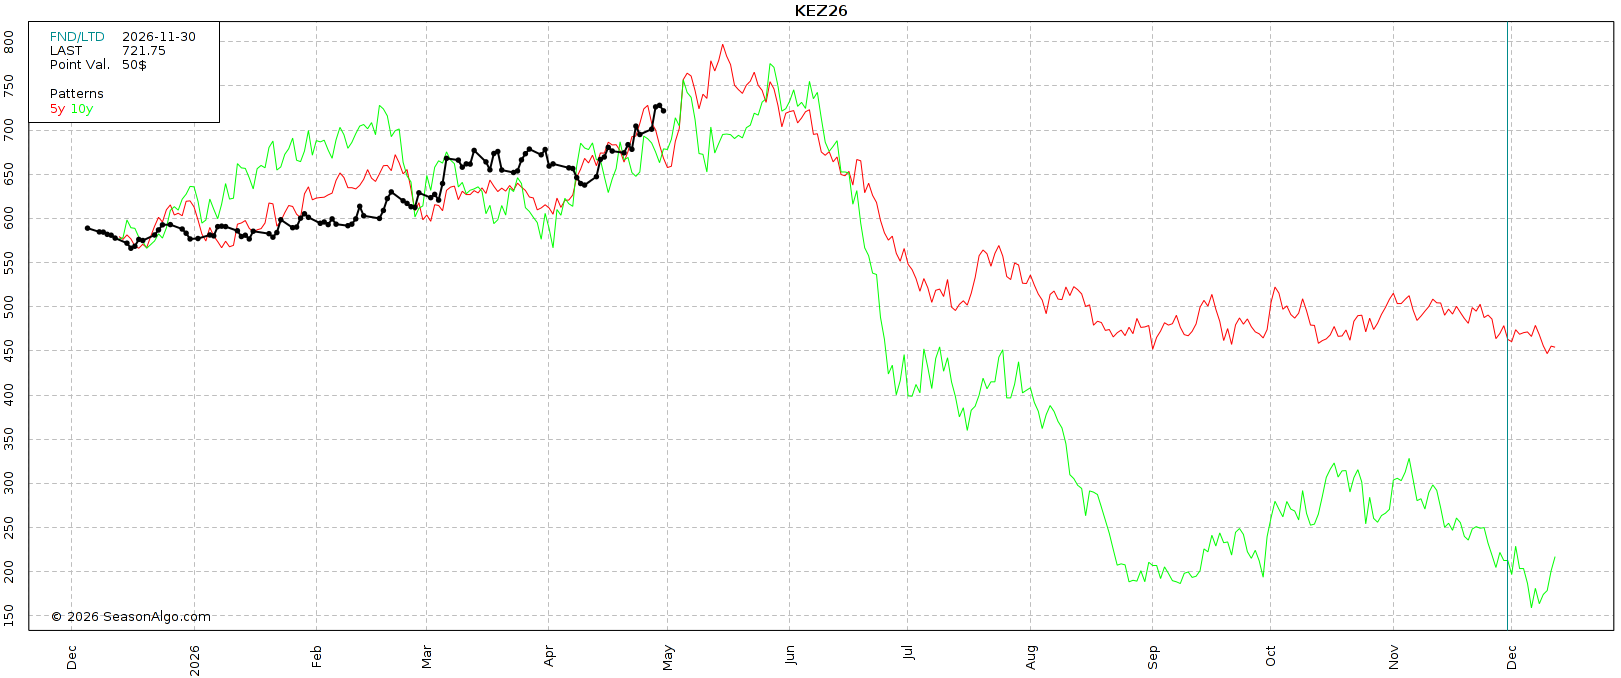
Here is the seasonal chart.
This shows the 5-year (red), 10-year (green) and 15-year patterns (blue).
We have a very strong tendency to fall in late June to early July.
Here is a chart that shows the last few years of price action stacked on top of each other.
As of recent, every single year has featured weakness heading into August and September.
We are entering our seasonal window of opportunity.
So bottom line, we are quickly entering that time of year that should to present opportunities. The next 30-60 days are that "usual time frame".
We are "almost" always lower by August to September.
But very rarely do we not trade higher than we did in April.
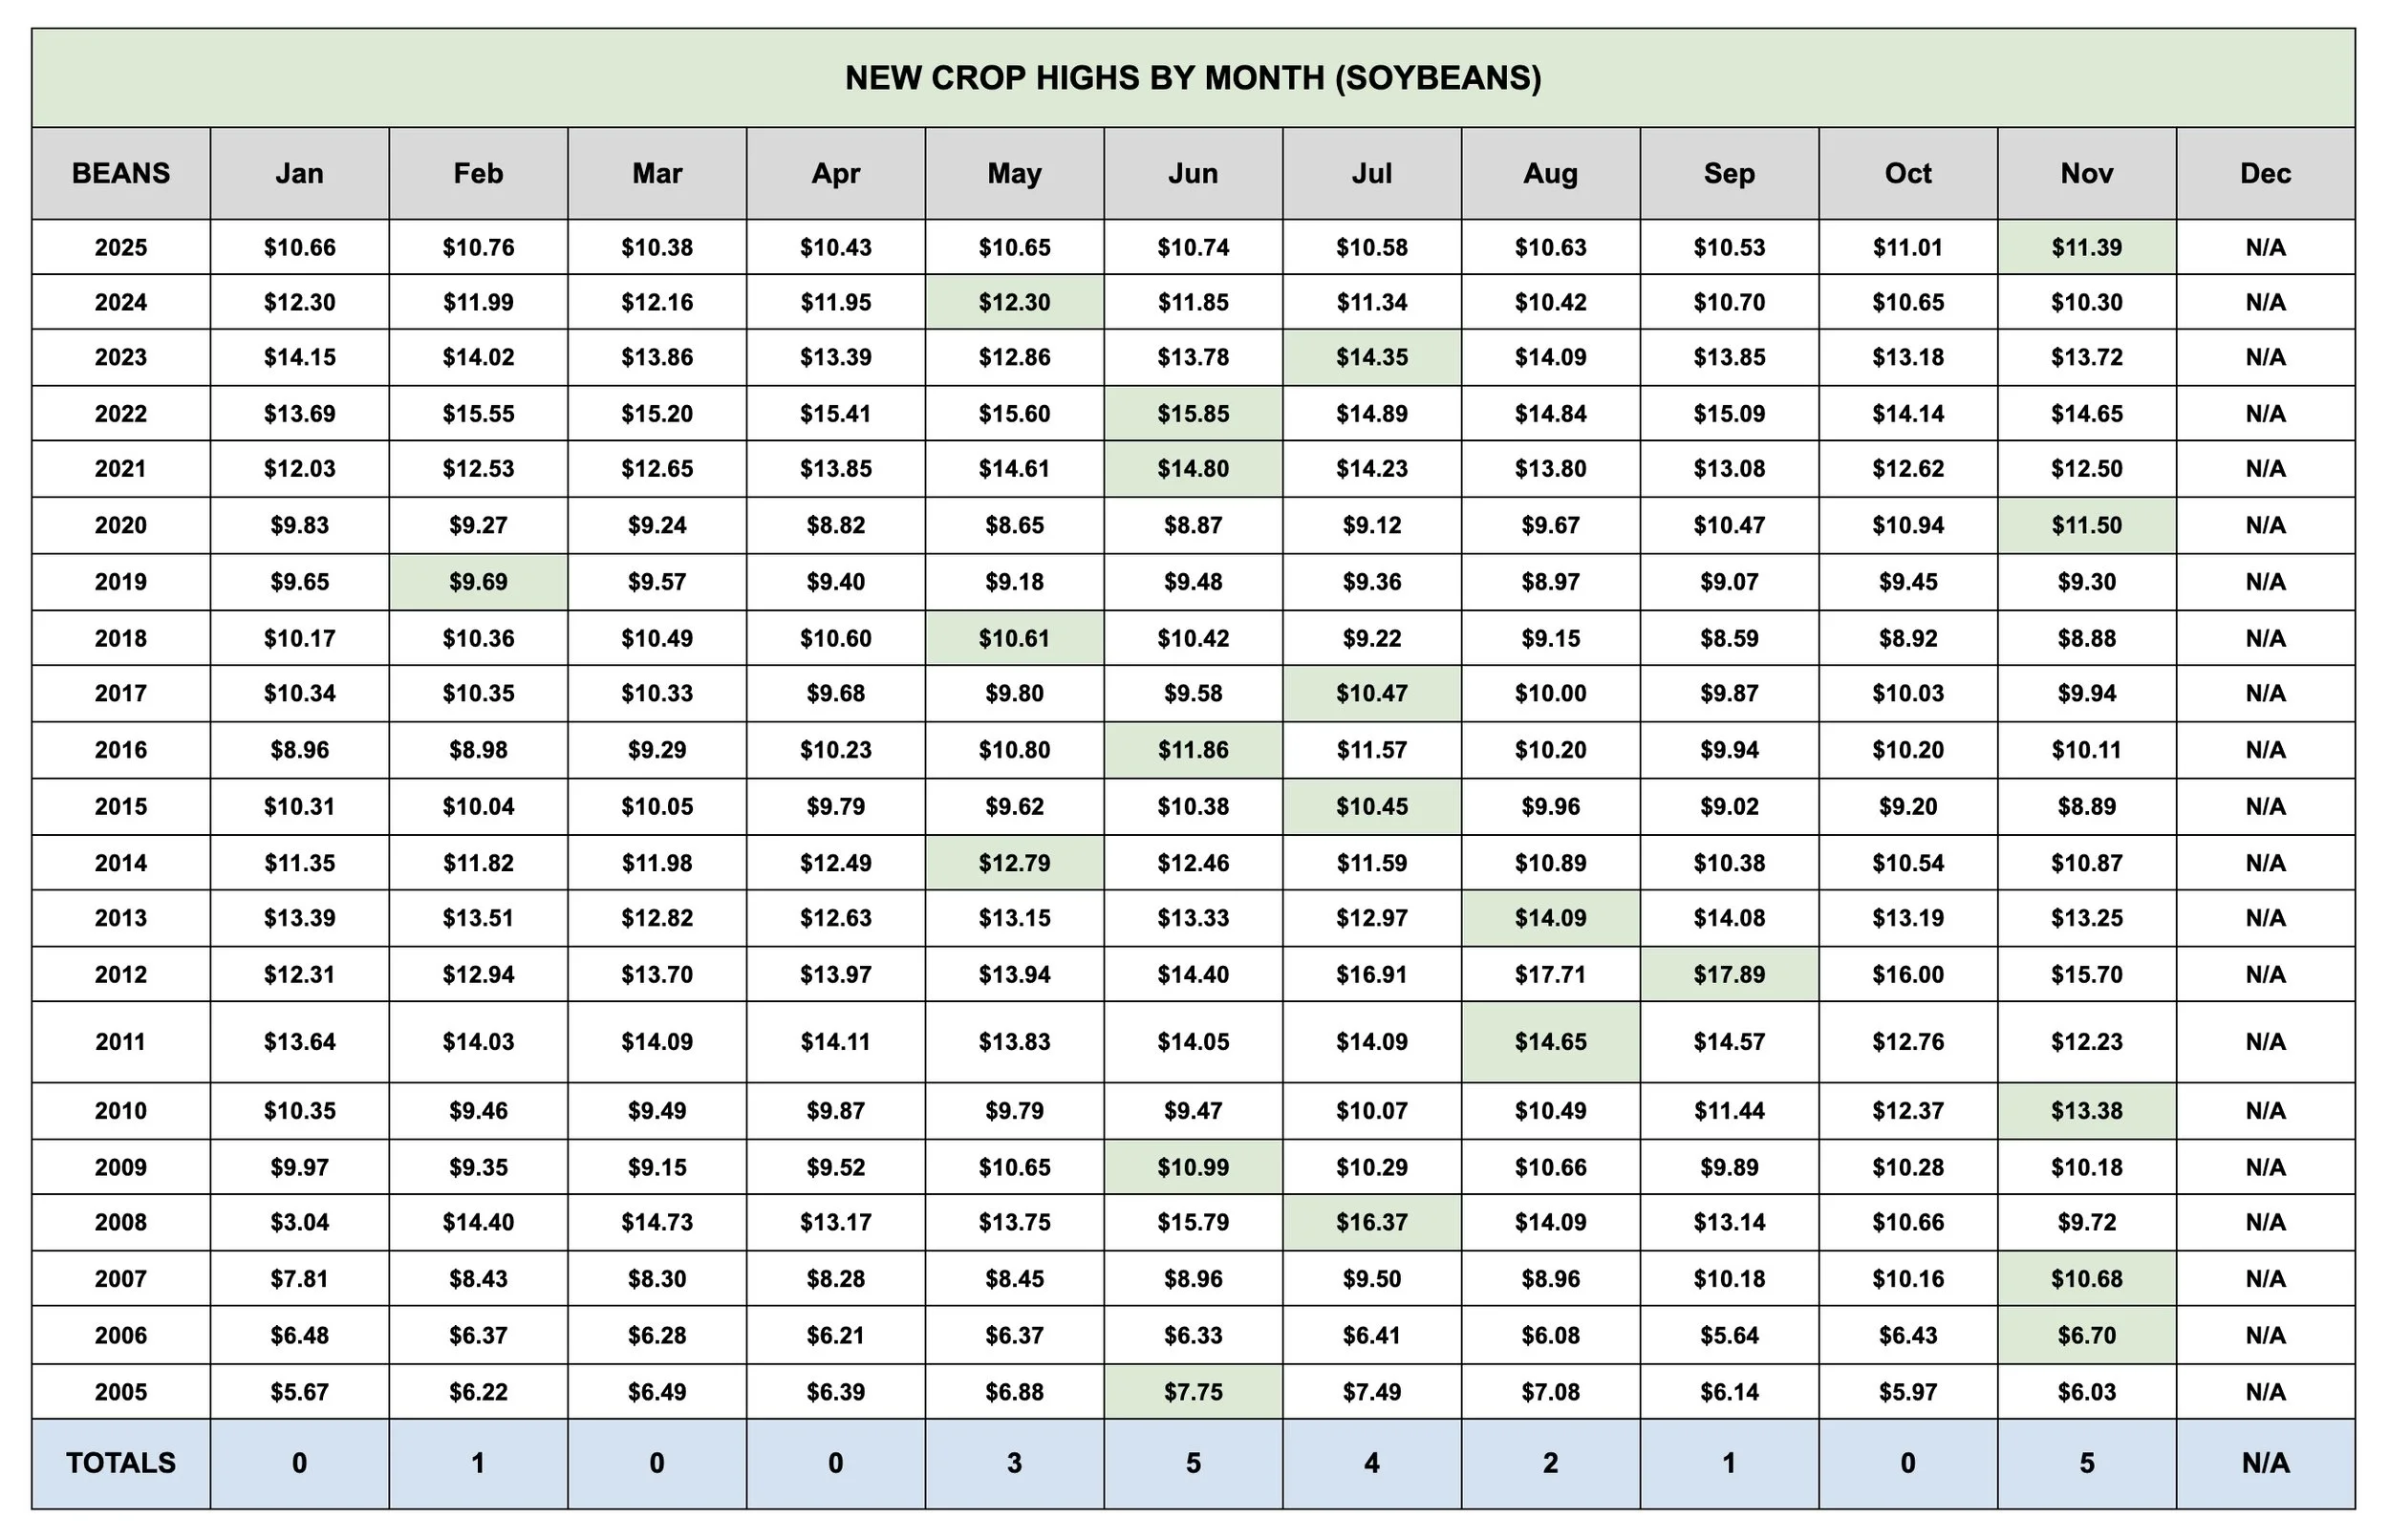
Soybean Seasonal Tendencies:
Here is the price highs for new crop soybeans in every single month since 2005.
Months with Most Highs:
June: 5 times (24%)
Nov: 5 times (24%)
July: 4 times (19%)
May: 3 times (14%)
Soybeans have never once posted their highest price for the year in the month of April.
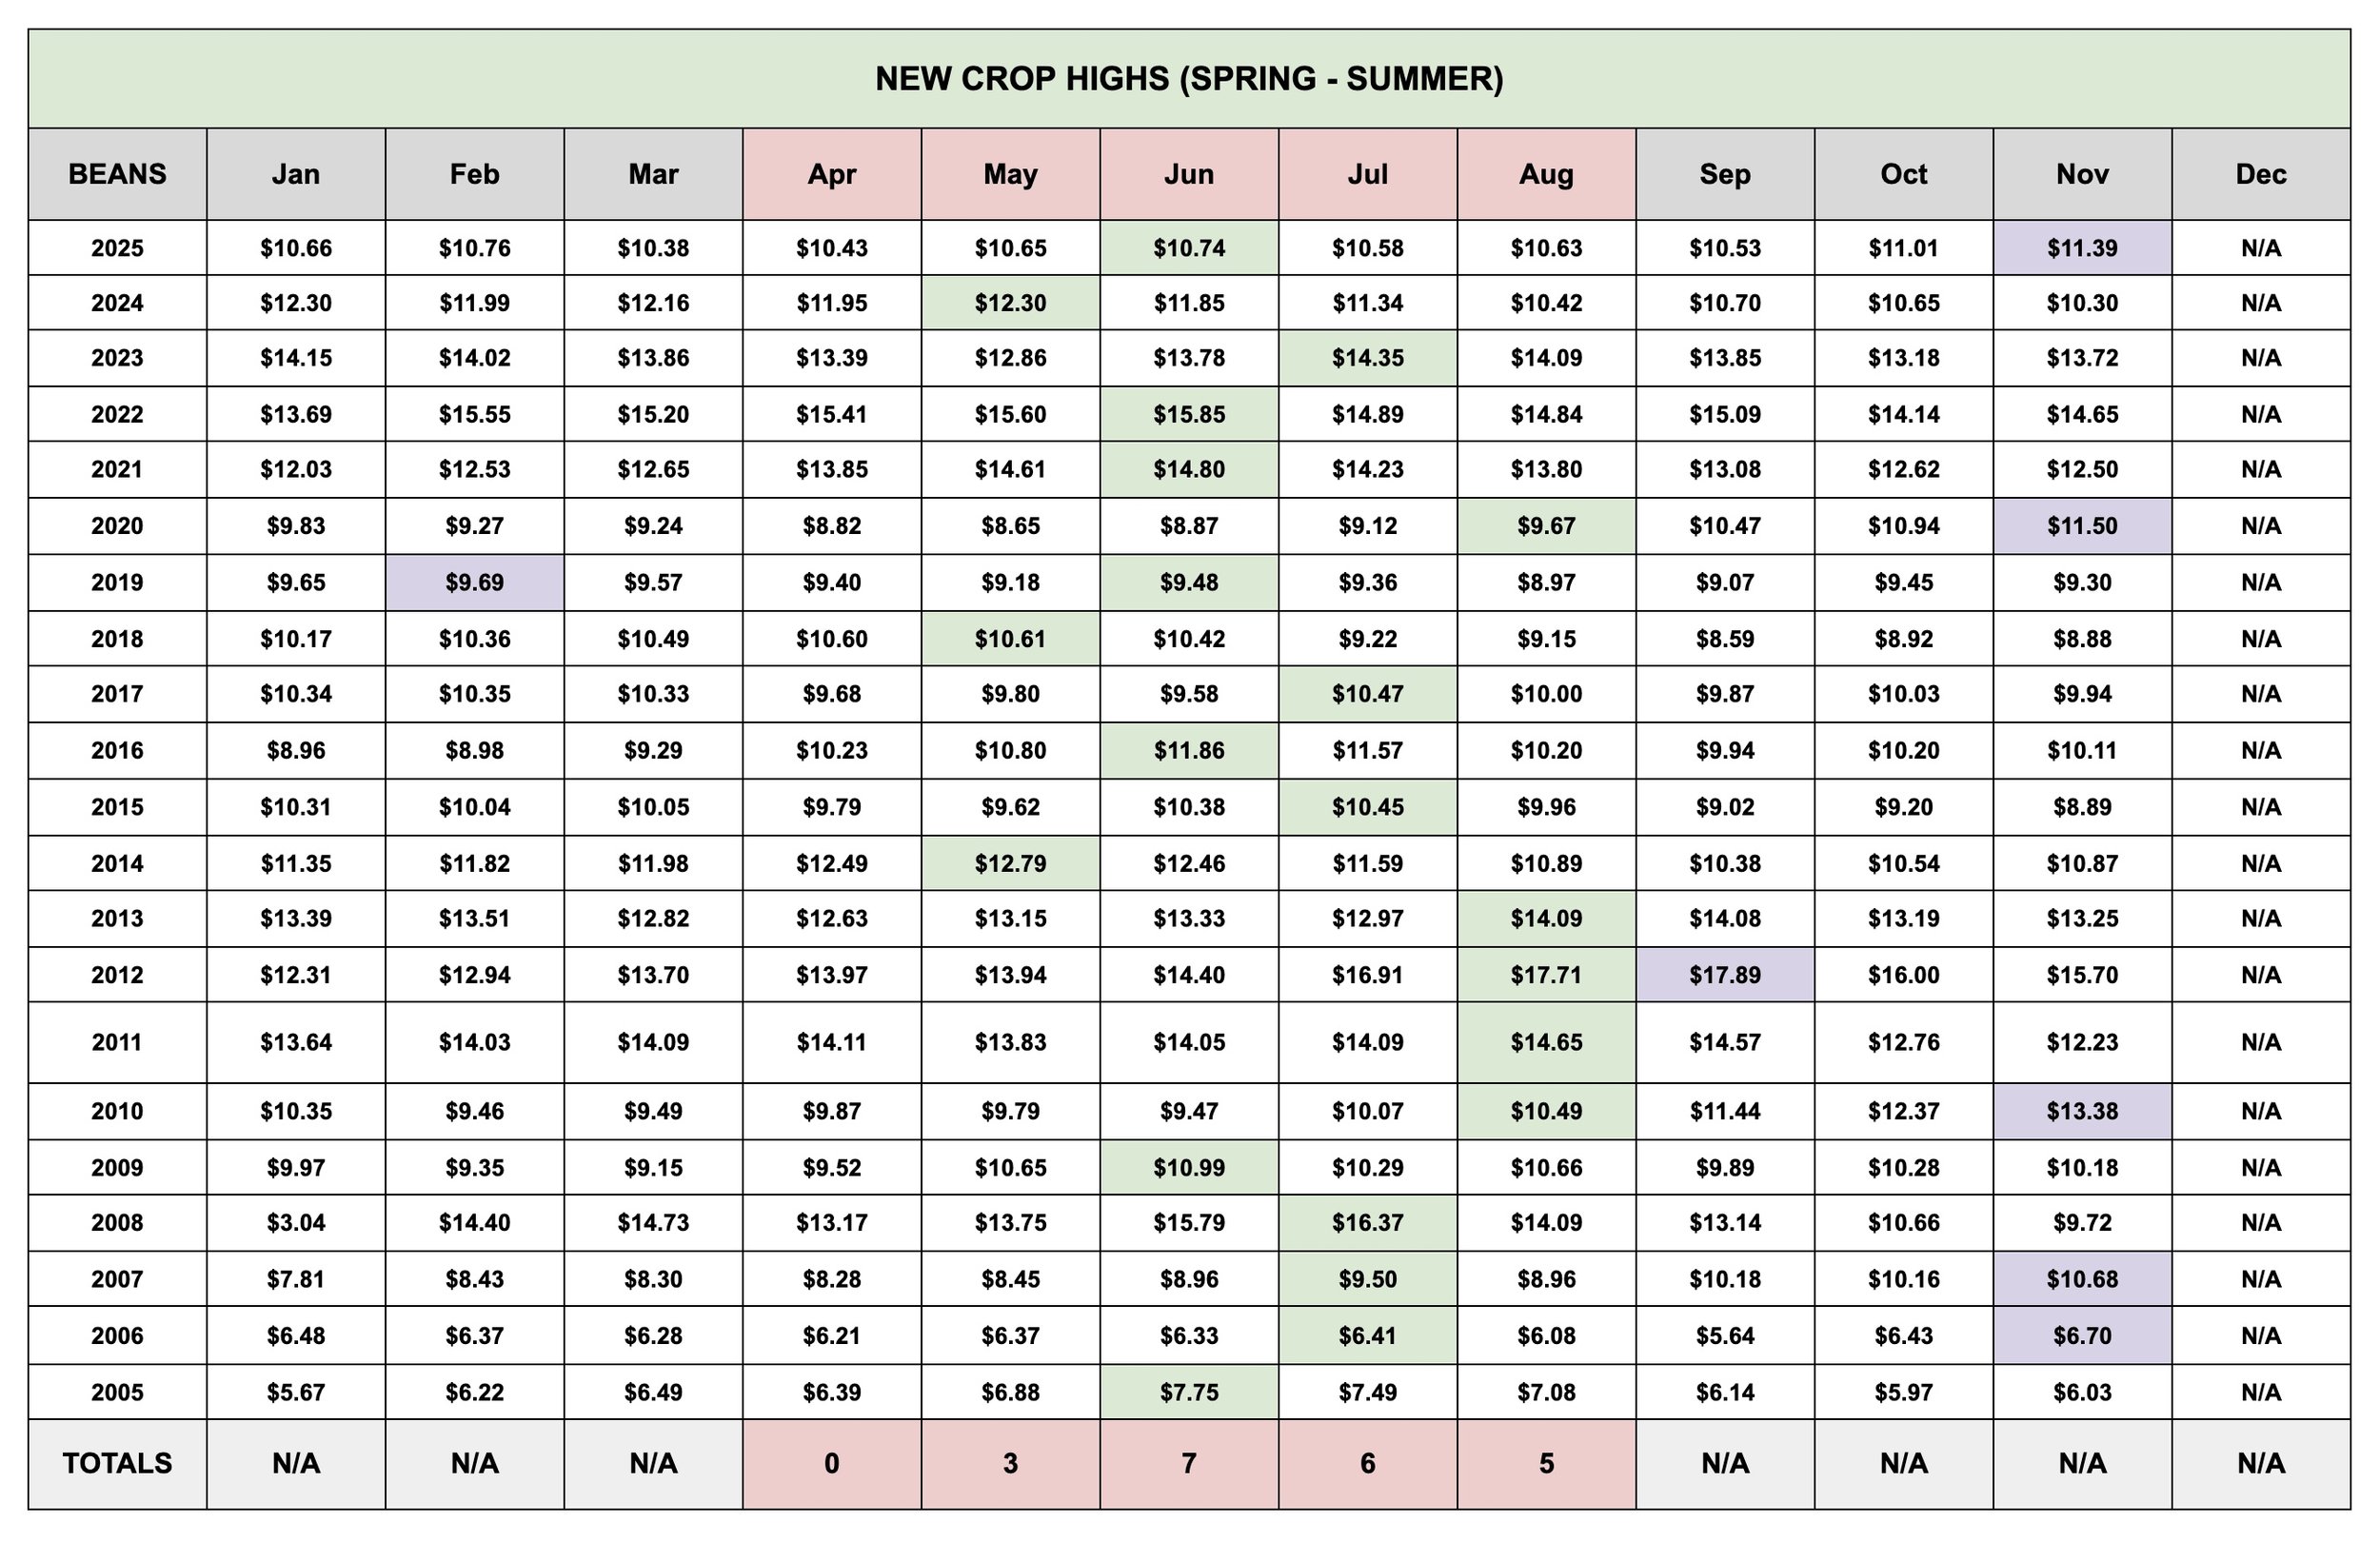
Often times, soybeans tend to get a late year push due to the Brazil growing season etc.
So what do the seasonals look like if we simply remove those late year highs and instead focus on the spring to summer?
Again on this chart we highlighted the orginal highs that came in the non-seasonal time frame in purple, while highlighting the spring to summer high in green.
Looking at April to August the numbers change to:
April: 0
May: 3 (14%)
June: 7 (33%)
July: 6 (29%)
August: 5 (24%)
Even the spring to summer high has never come in April, and usually it doesn’t tend to come in May very often either. With it only happening in 2024, 2018 and 2014.
18 of the last 21 years (86% of the time) it's come within June to August.
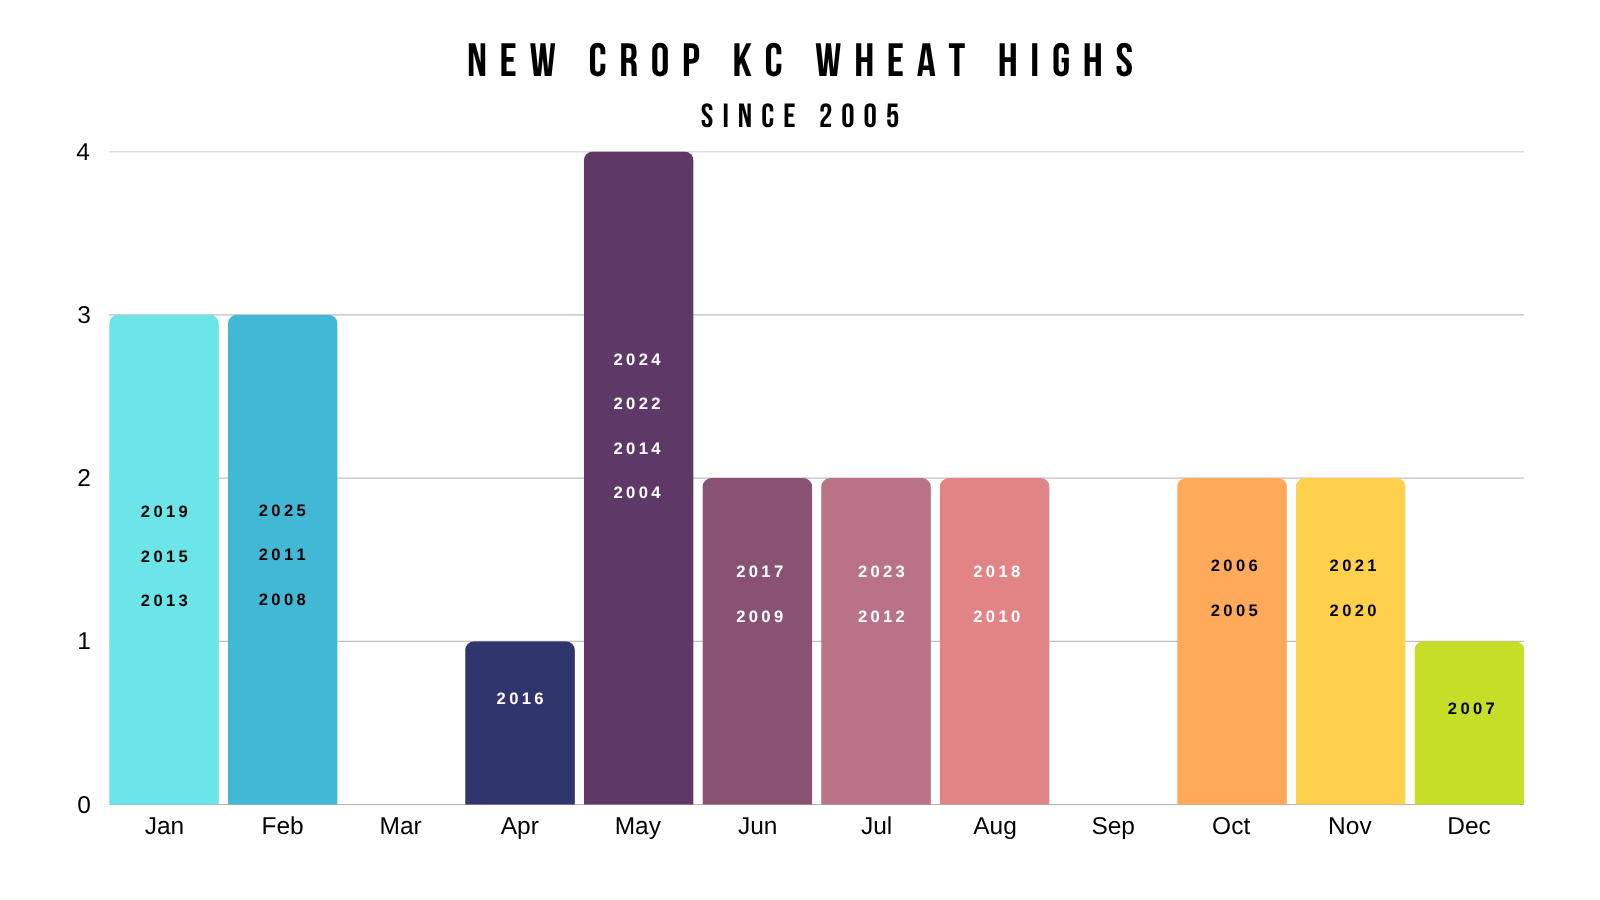
Wheat Seasonal Tendencies:
Wheat is a global crop. Someone around the world is always growing wheat. It revolves less around one growing season like corn and the US or soybeans and the US/Brazil.
So it's not as "seasonal" as corn or beans.
But here the data for new crop KC for the last 20 years.
The highs have come in almost every month except March and September. So not as clear of tendencies as corn or soybeans.
Something to note is that we've only printed the highs in April once. Back in 2016.
May leads all months. With 4 times.
Although, wheat doesn’t have as consistent as top, we do have a seasonal pattern.
Here is the 5 (red) and 10-year (green) patterns.
We do tend to fall apart after May to June.
Weather, Drought & No Drought
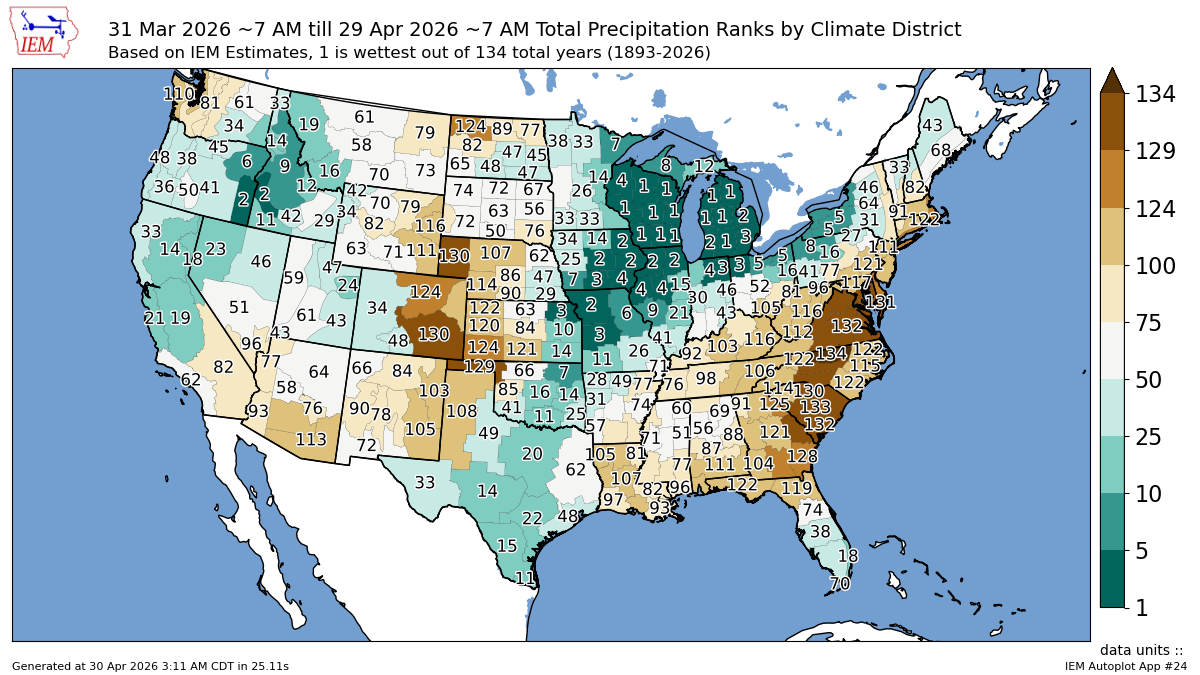
Here is the month of April's precip ranks.
There has been a clear divide.
Part of the I-states and northern corn belt had it's wettest April ever.
Meanwhile in the southeastern corn belt, it's been one of the driest.
If you go over to the plains, we of course have some of those key HRW regions having one of their driest stretches ever as well.
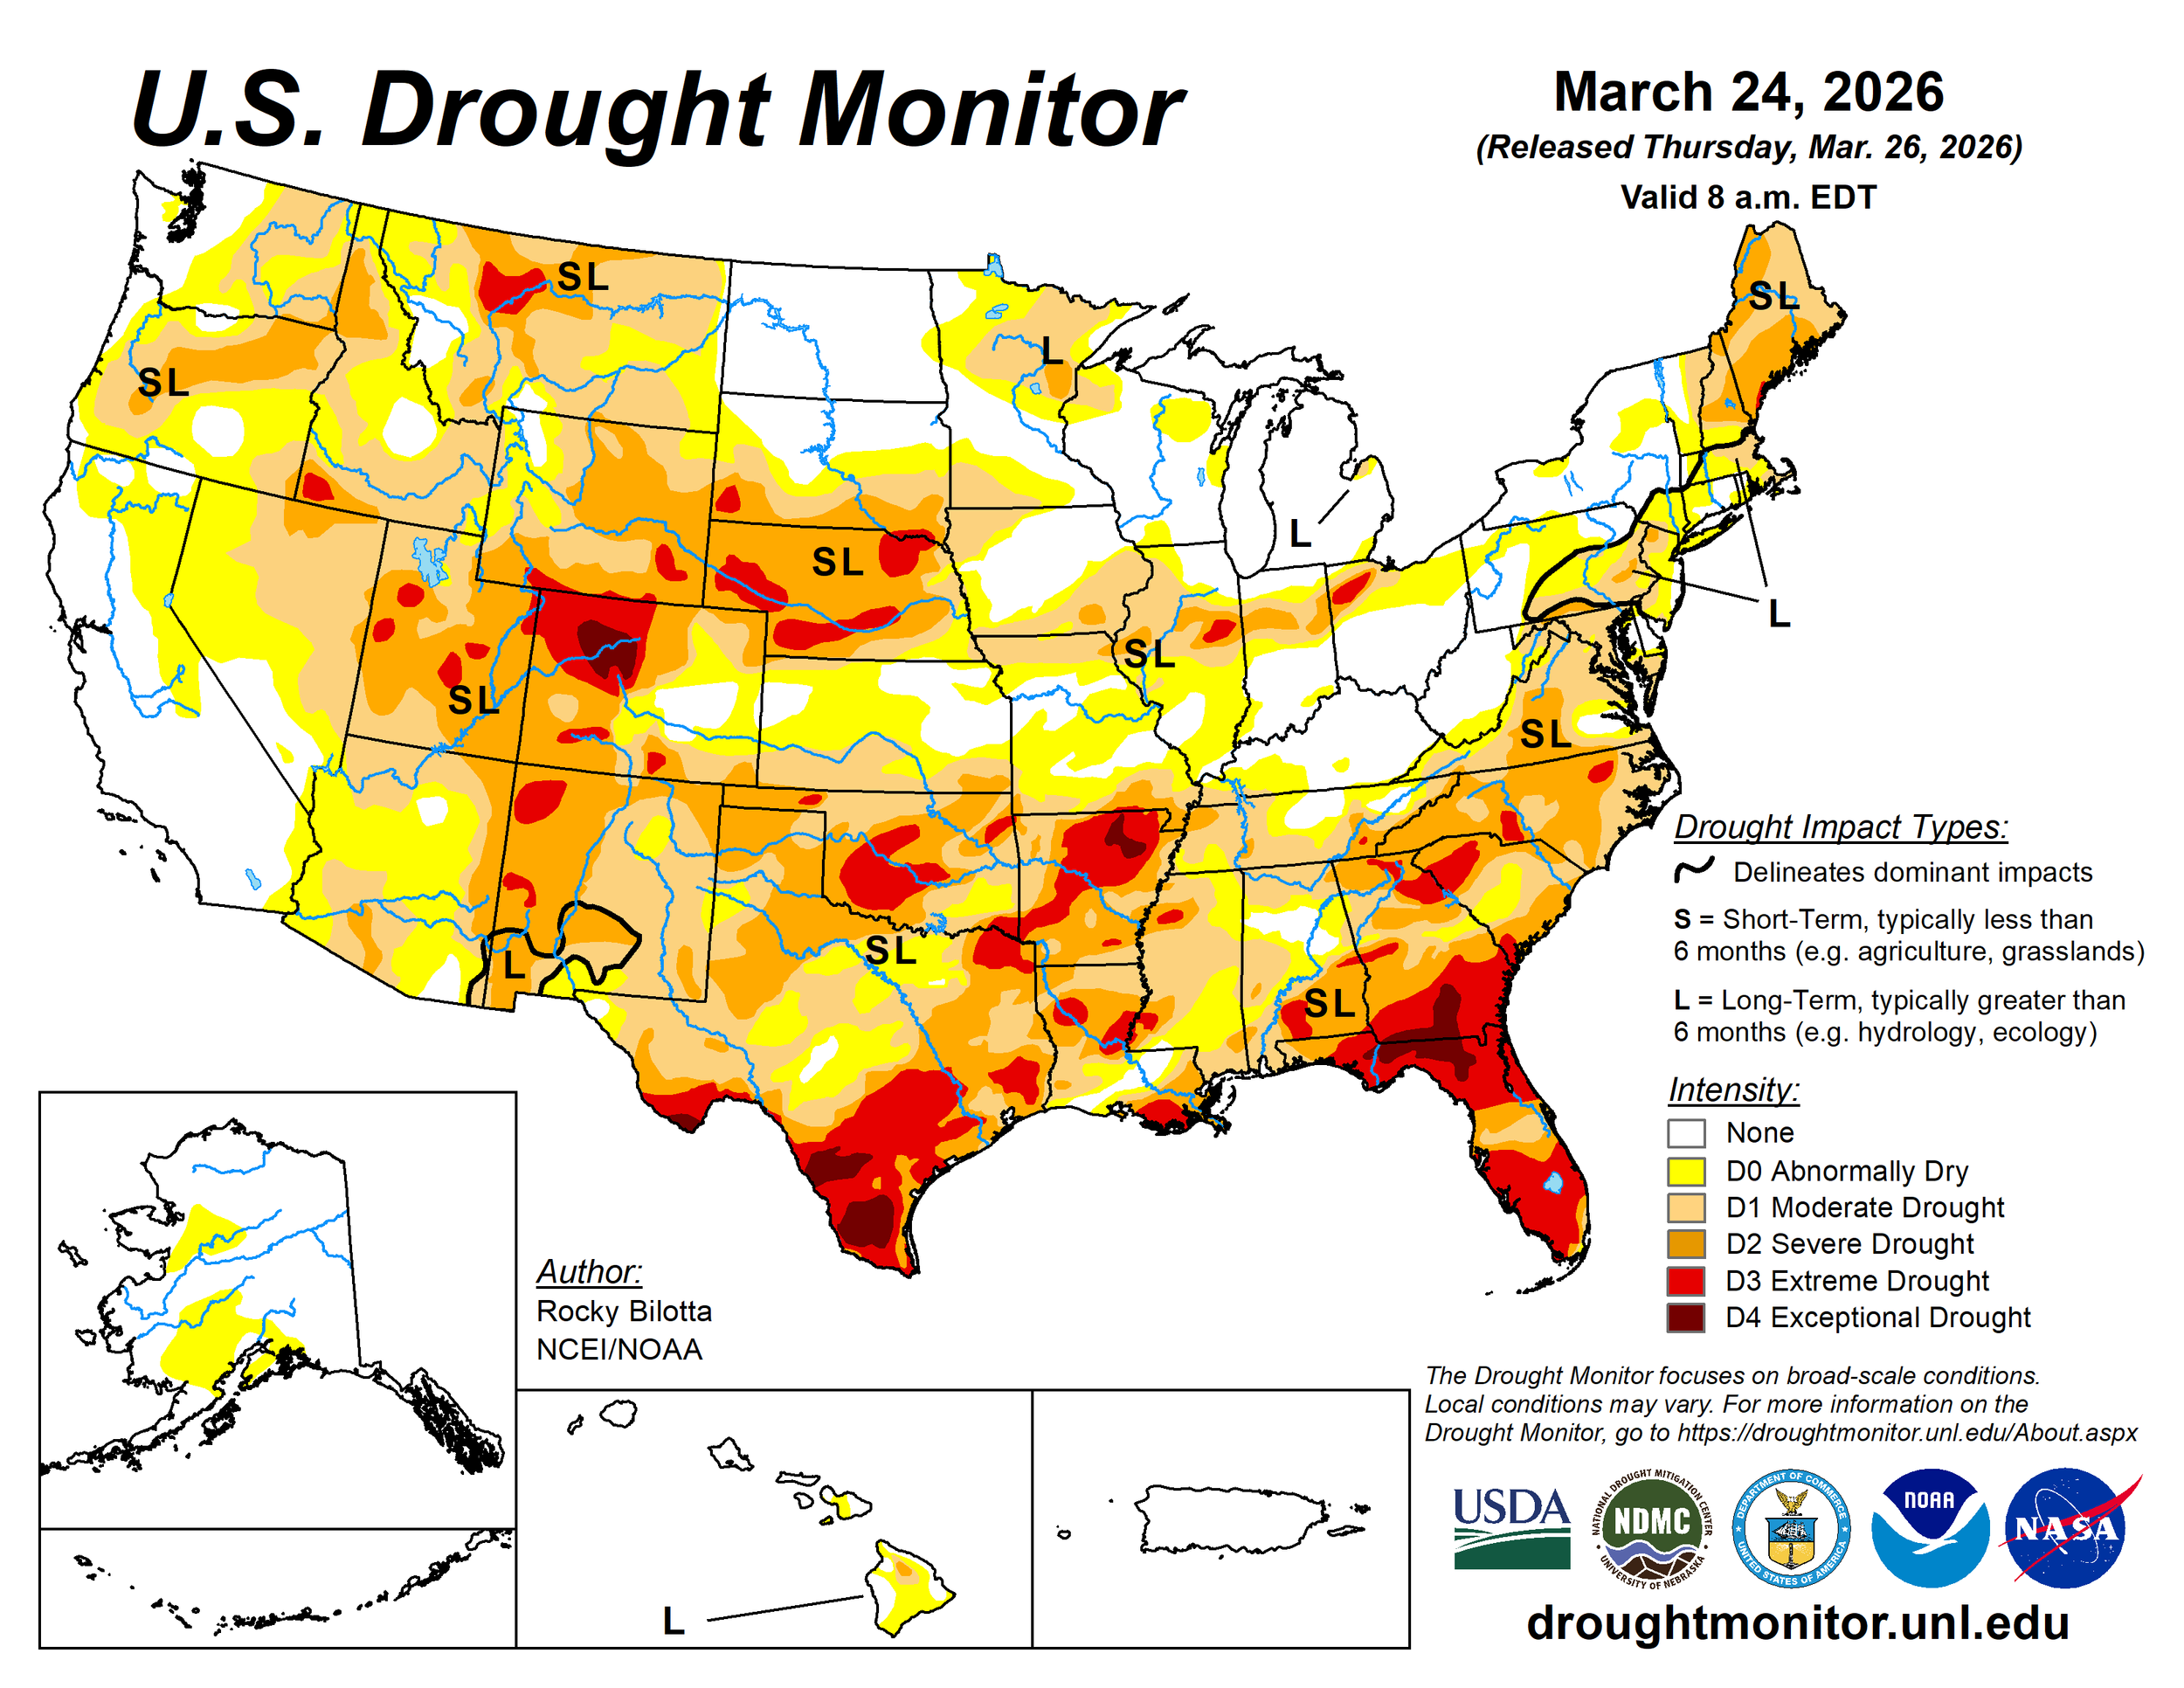
Here is what the drought monitor looked like a month ago.
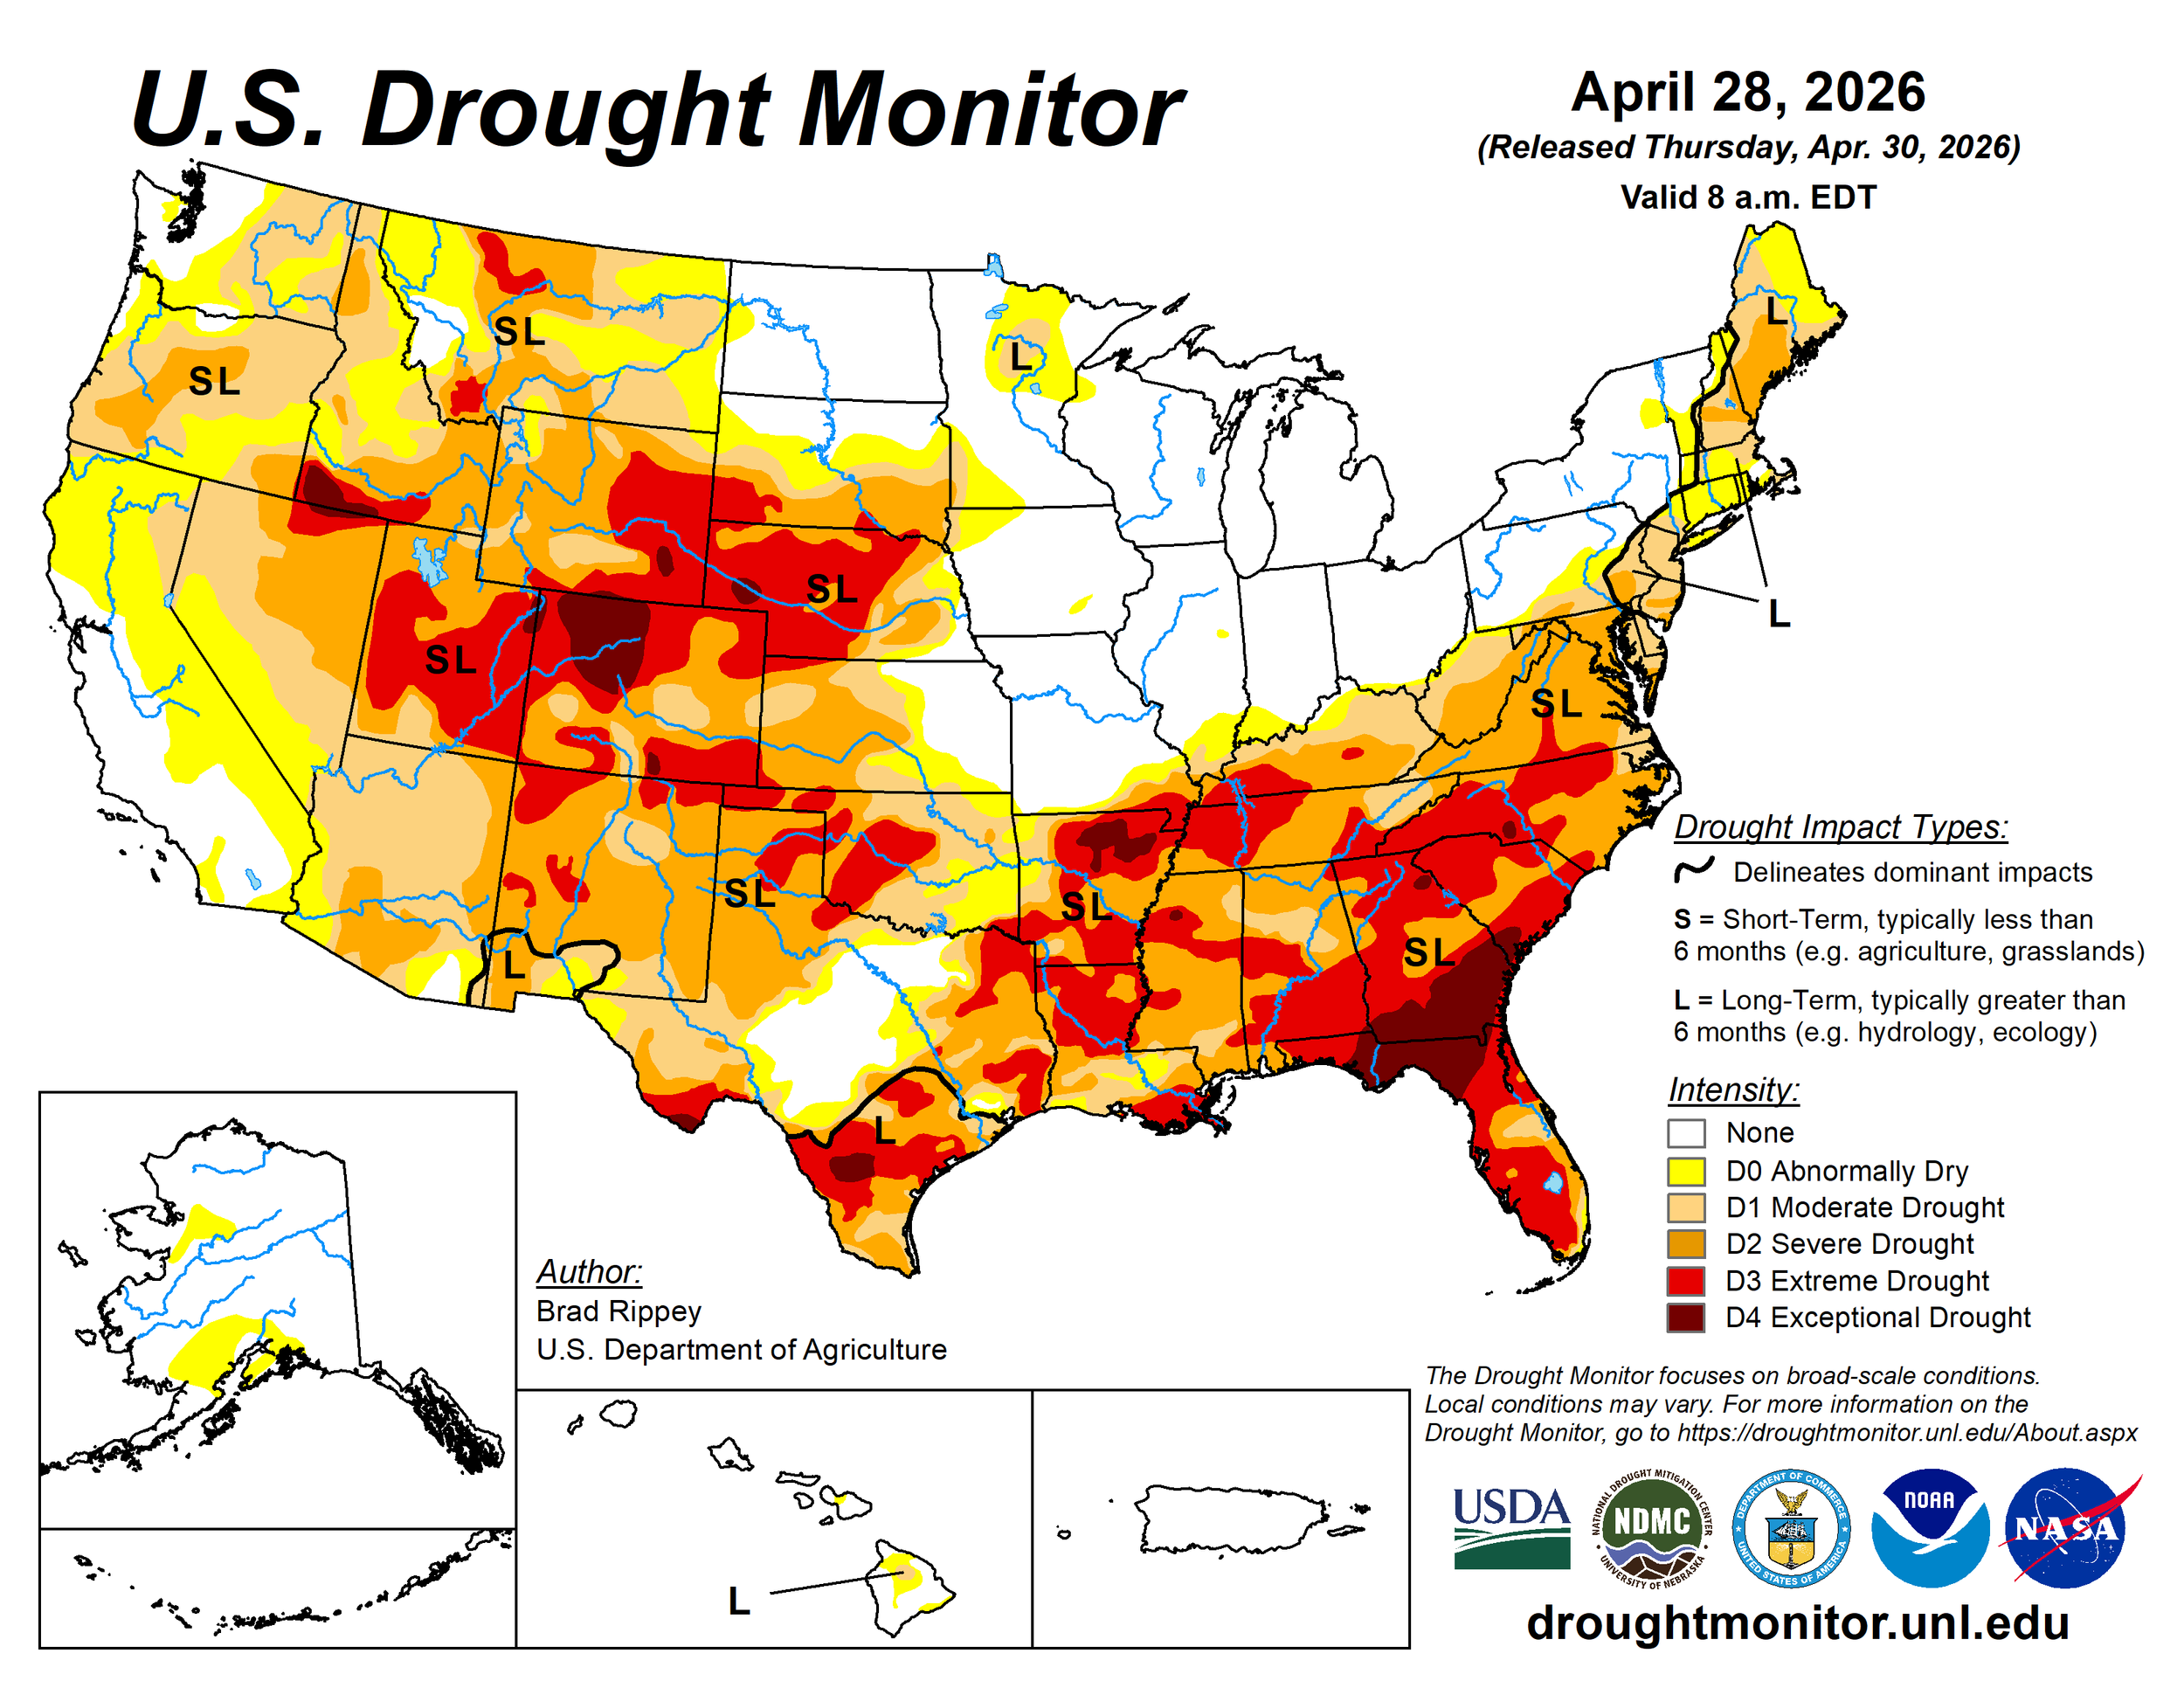
Here is what it looks like today.
Huge differences and extremes in different parts of the US.
Drought has almost been entirely removed from the I-states.
Whereas the plains and western corn belt, along with the southern corn belt are all suffering from some pretty severe drought.
You do have to wonder if that drought has a chance to spread into the I-states or not, despite the recent rain.
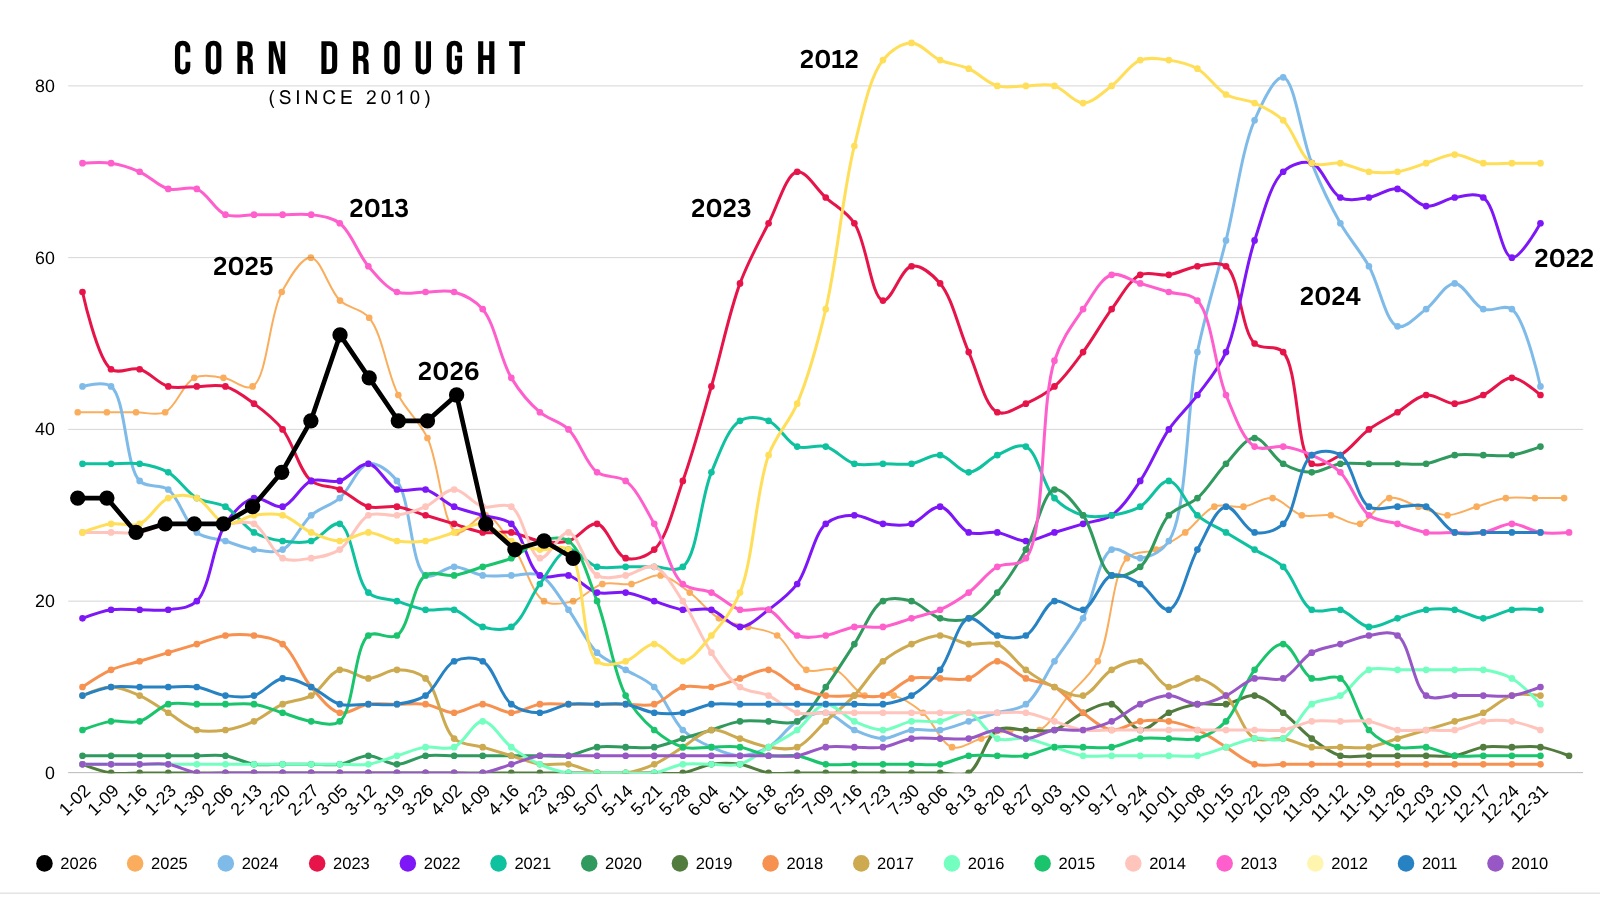
Here is a visual of the corn drought for every week since 2010.
We started off pretty dry.
But currently, there is no concerns with corn drought nationally with the rain we've seen in the I-states of course.
Sitting about in the middle of the pack.
However, drought matters more as you get into late June.
Take 2023 and 2012 for example. Neither ramped up until June.
Planting delays or not?
The last few days featured some heavy rain across the corn belt, so there is some chatter about potential planting delays.
Where as that western Kansas and HRW area missed out. As drought continues to build.
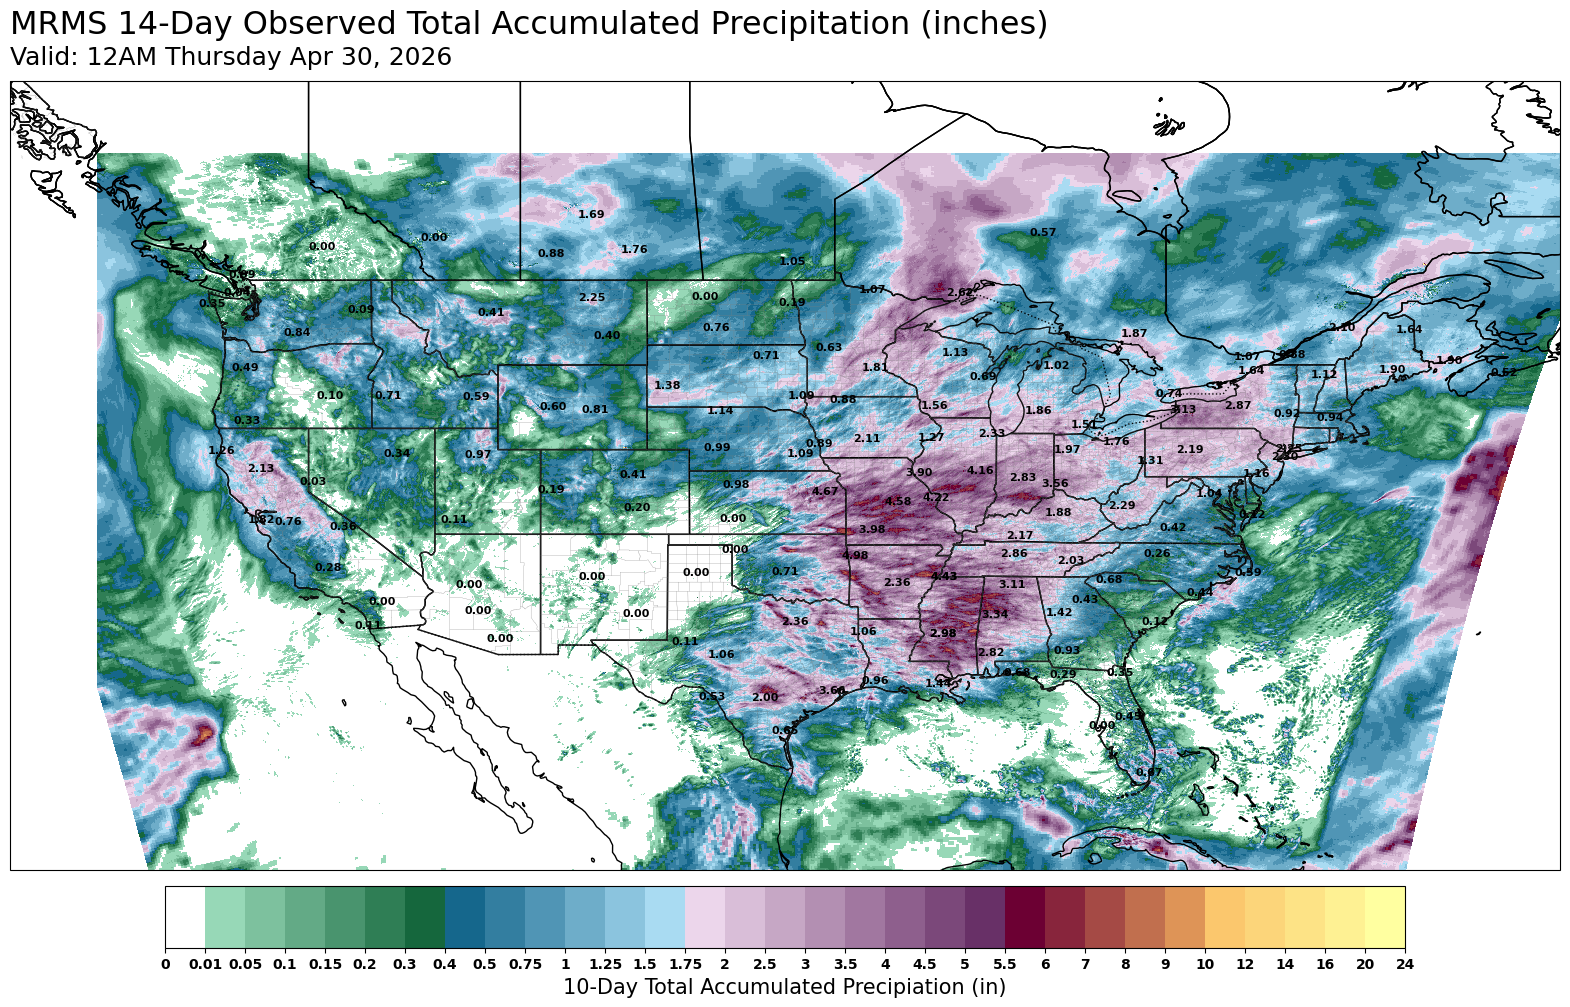
But it does look like it's suppose to dry out for the next week.
So we could see planting start to ramp up, and I don’t think we have any sort of planting delay story built into the market as I don’t see a delay story for now.
Planting is currently well ahead of pace nationally.
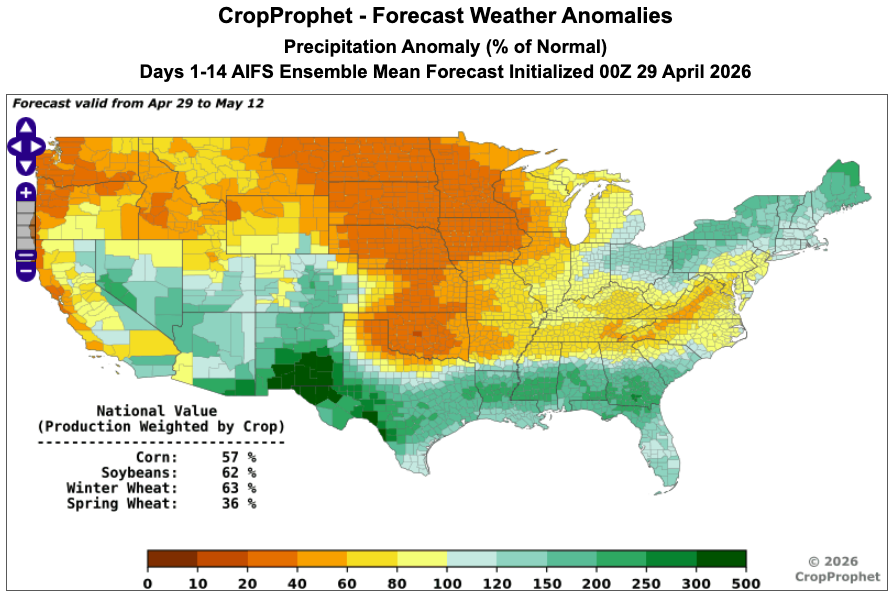
HRW regions still look dry.
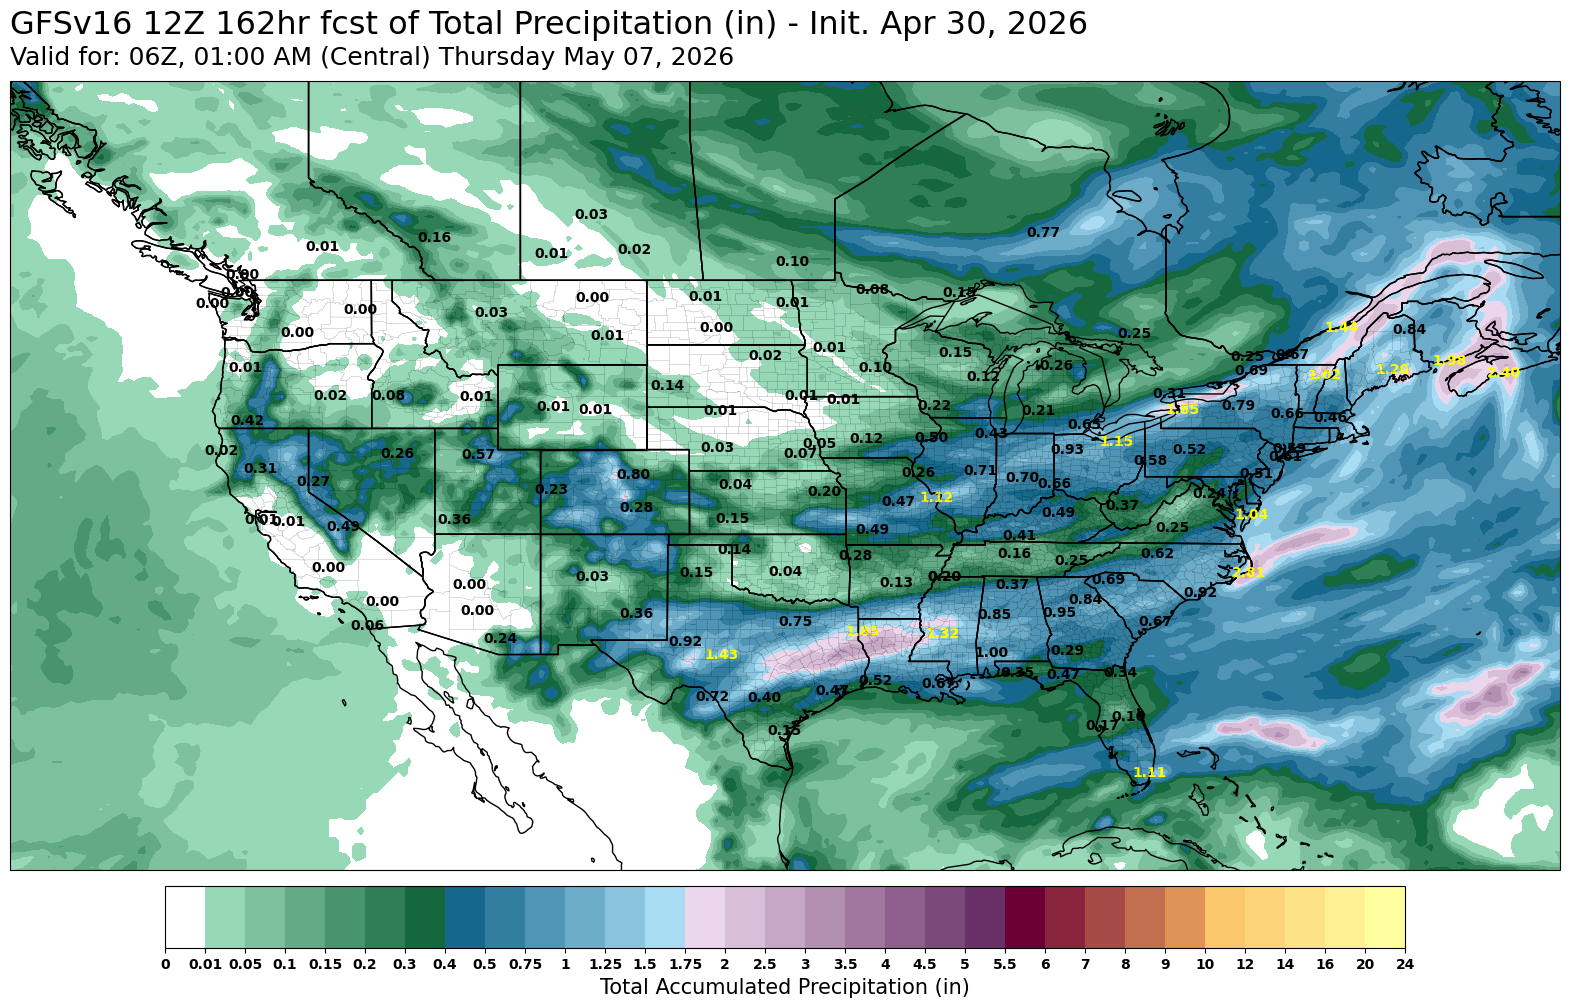
Here is a 2-week anomaly forecast from CropProphet.
Again, looks like it's supposed to start to dry out, so I don’t think planting delays as the story.
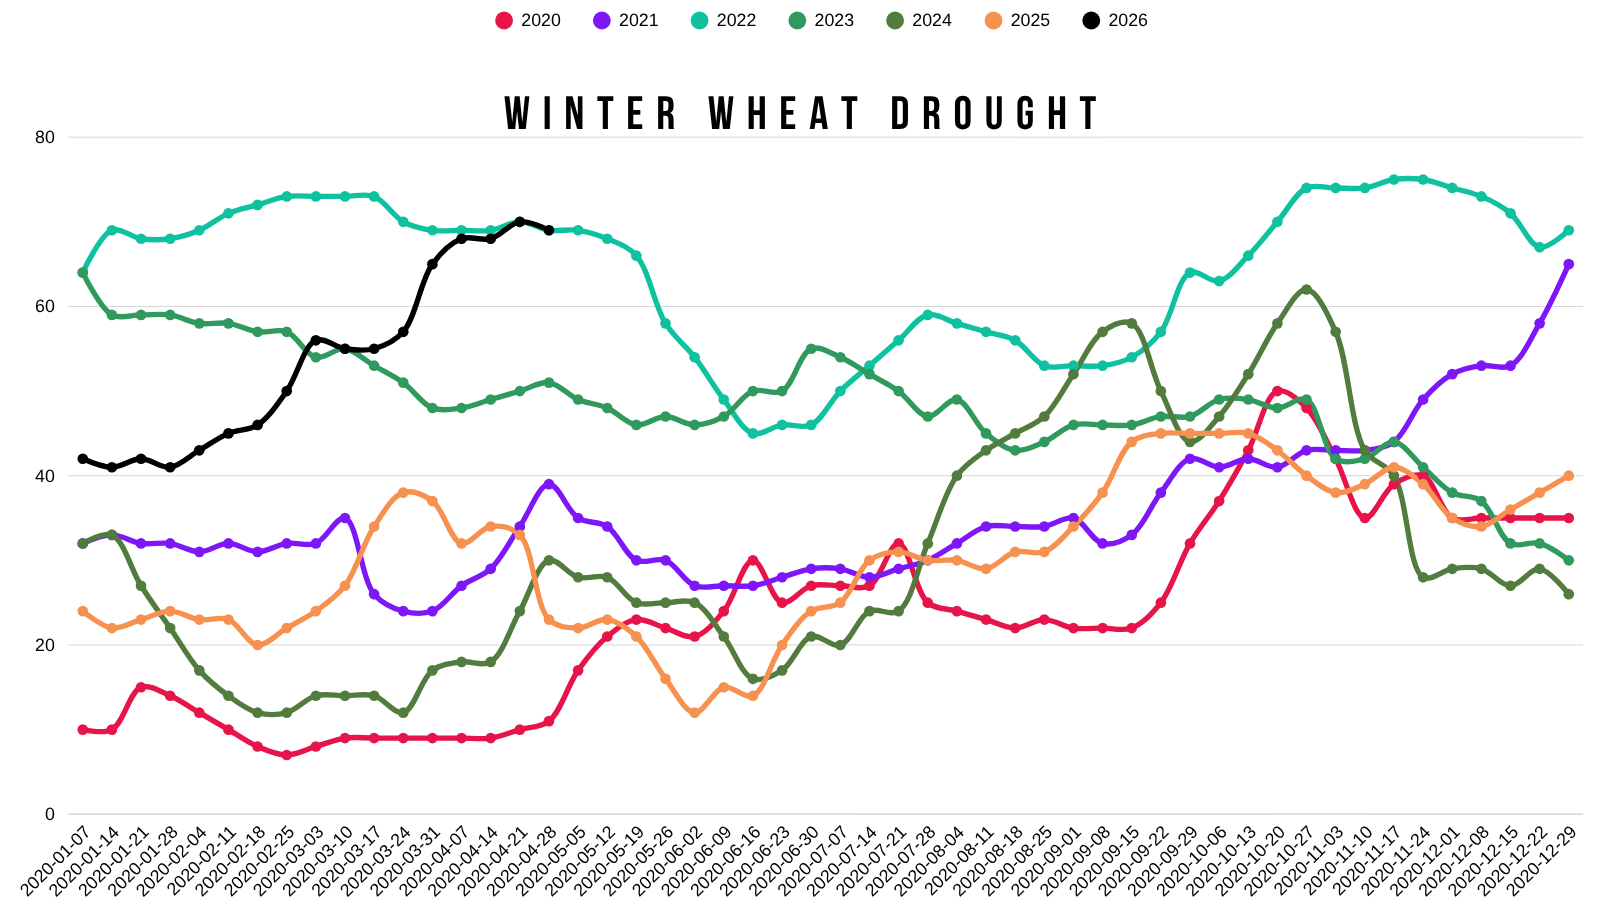
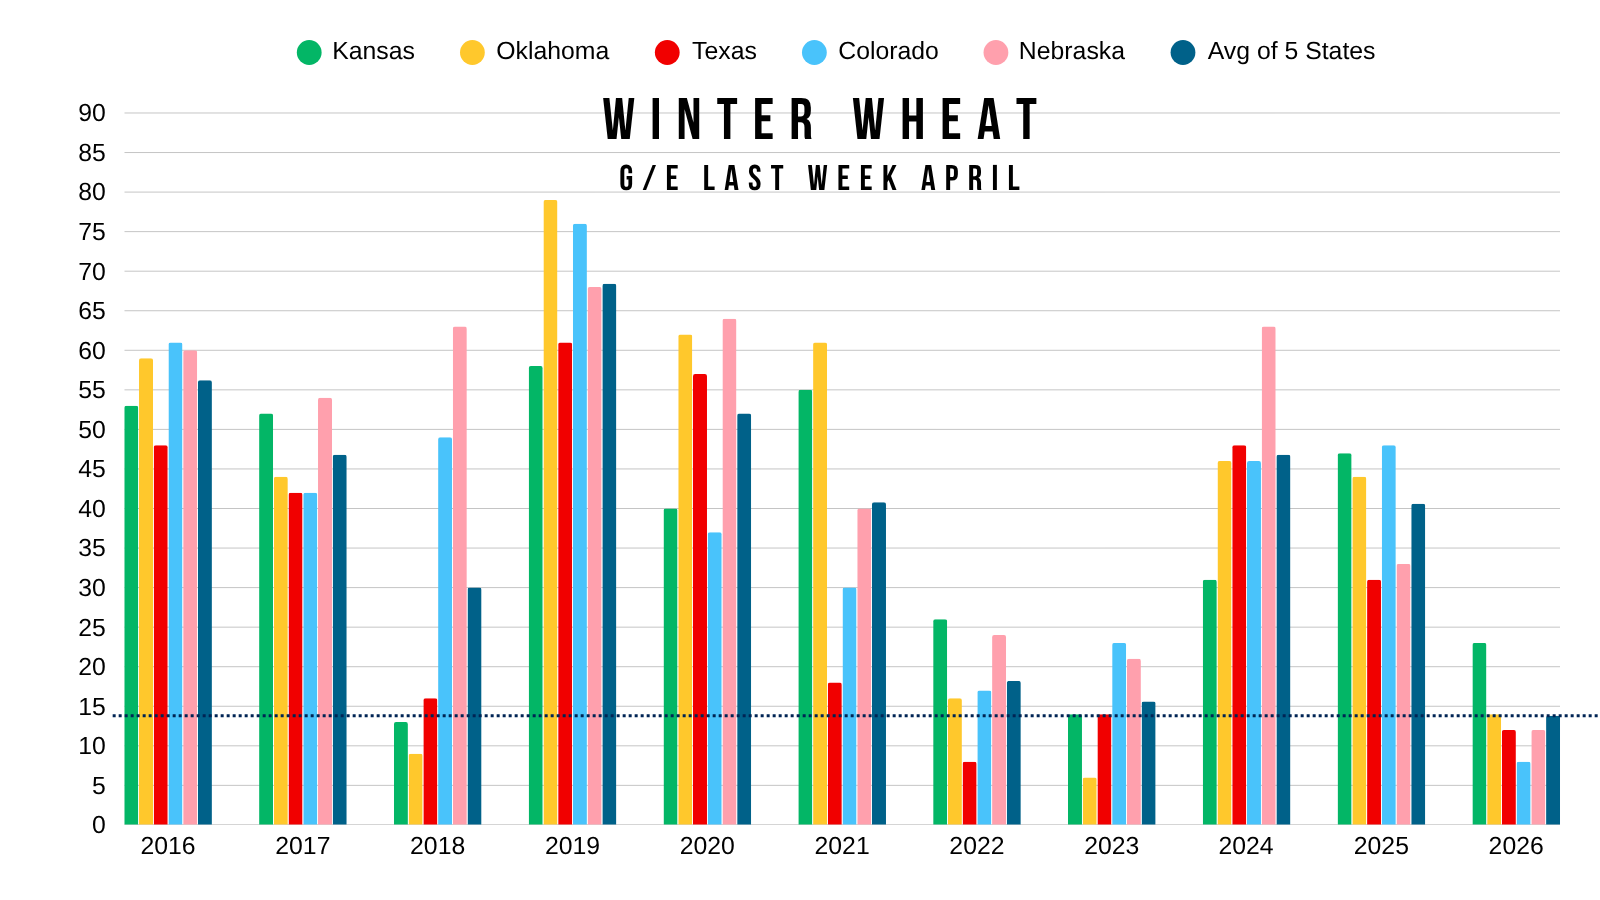
Record Winter Wheat Drought:
Winter wheat areas in drought dropped slightly from last week.
Dropping by -1% down to 69% now.
That would still be the most drought ever for this time of year.
Tied with 2022's record drought.
Today's Main Takeaways
Corn
Not much else to add on corn today, as we've went over plenty of fundamentals in the past.
Let's just look at the charts and some next targets.
July Corn Chart:
Currently battling resistance.
We also had an iffy candle and almost had an outside down day.
If we get a pull back, we could fall all the way down to the blue box and still be in an upward market.
That's the golden zone and would re-test those resistance levels from last fall.
If we break above this resistance level, we can get the next leg higher.
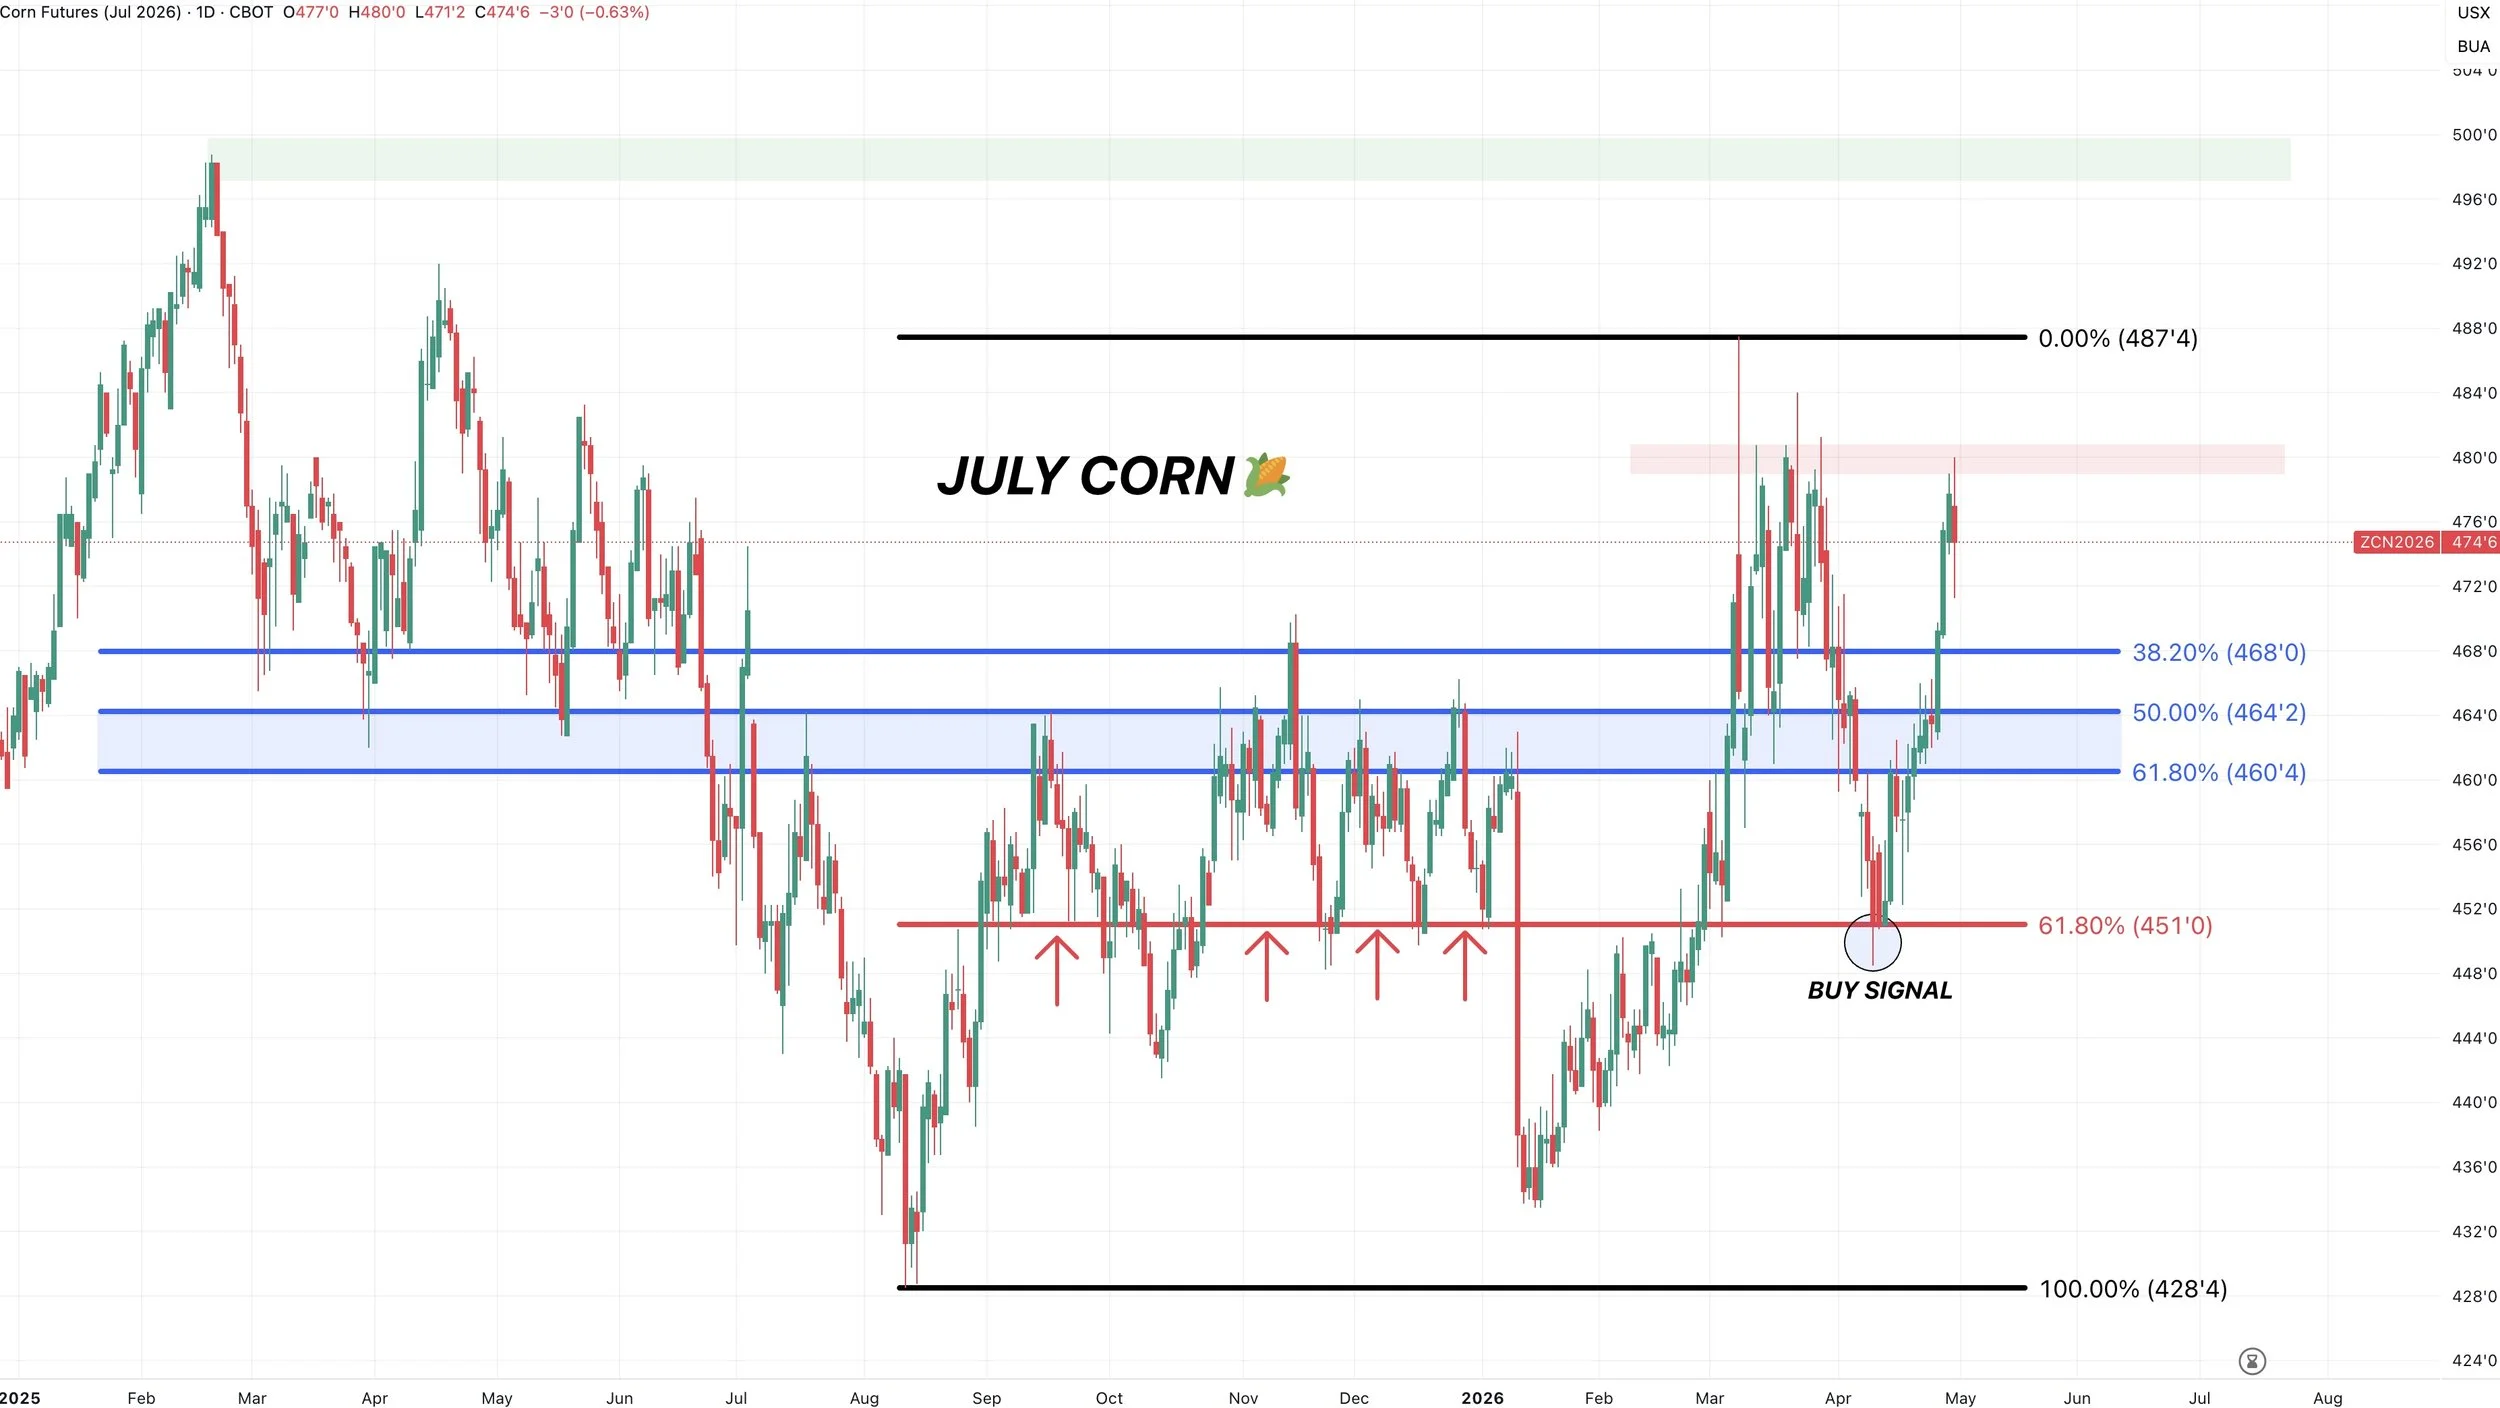
Next Old Crop Target:
July is front month now, so we left a roll gap.
Currently we are sitting right at that 78.6% retracement level up to the highs from Feb 2025.
If July can post new highs, the next major point of resistance would be around $5.00
If you notice, when March was the front month we failed at the 61.8% level. When May was the front month we failed at the 78.6% level. Next level is the highs from last Feb.
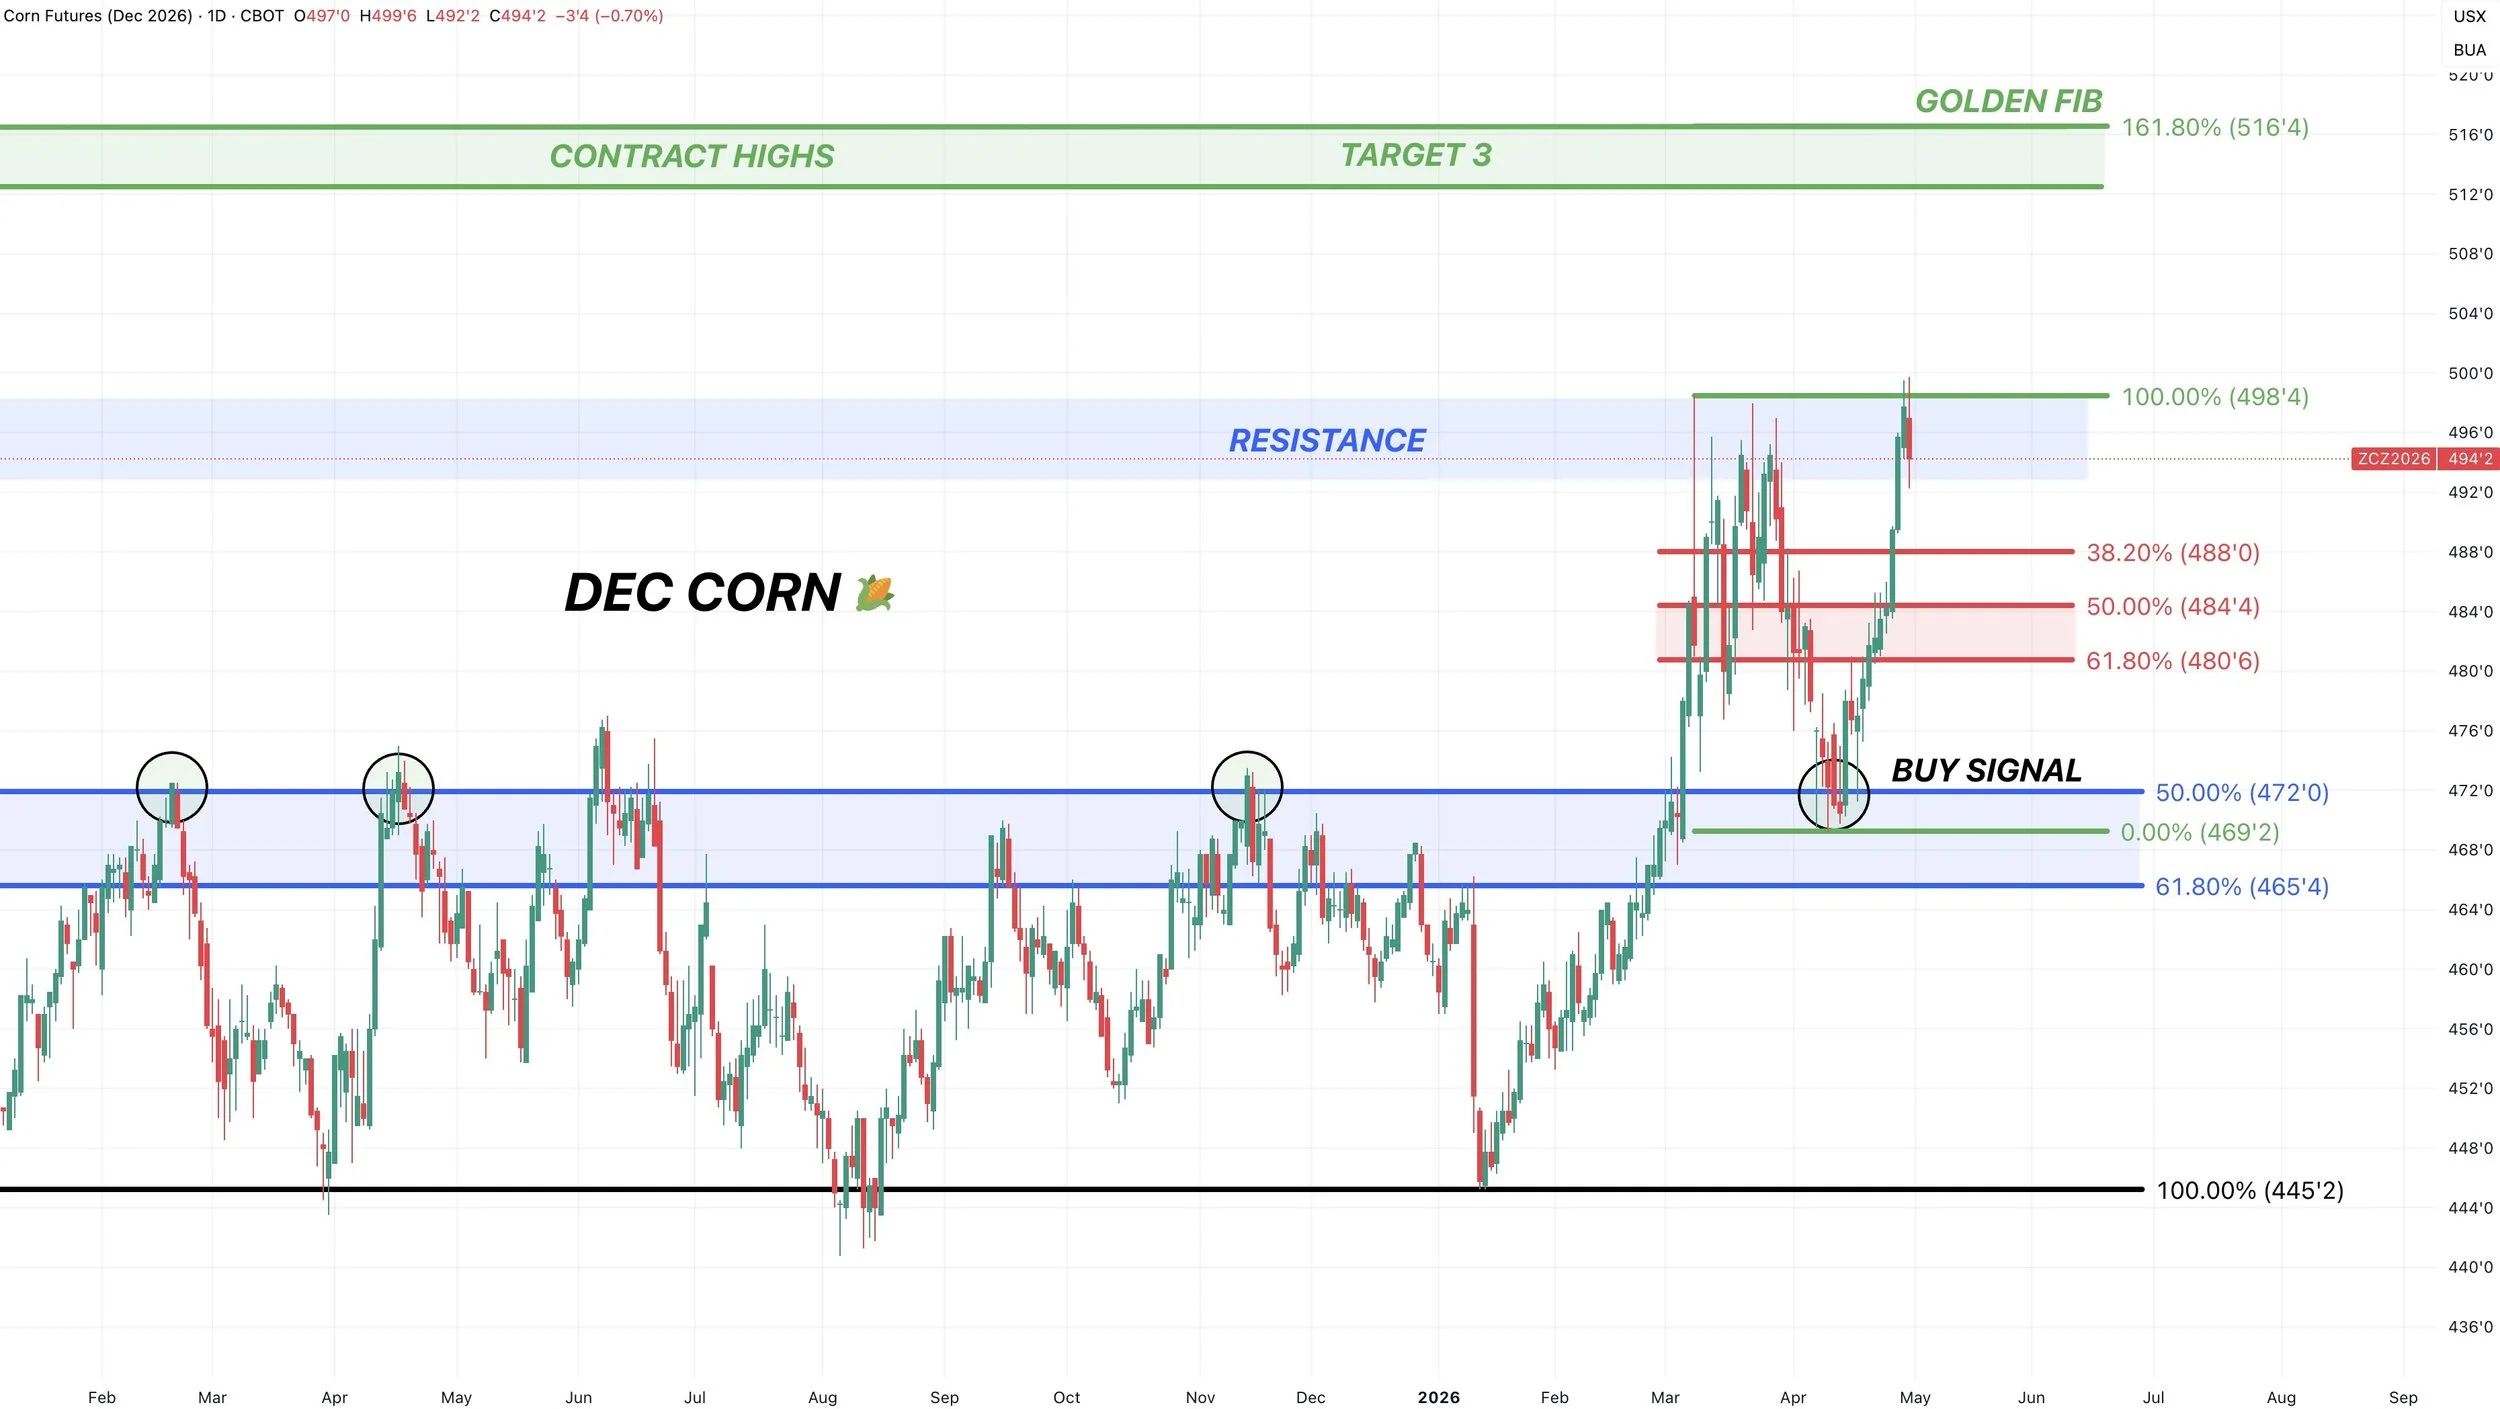
Dec Corn Chart:
Currently right up against those prior highs.
Not the best candle today, as we nearly left a key reversal. Posting new contract highs but closing right at yesterday's low.
This is resistance, so if you feel like you missed out or are behind, we like getting caught up here.
We had a catch-up signal a few days ago that went over how sold or hedged we like being, depending on your situation.
Click Here for Signal
If we get the breakout, the next target is $5.12 to $5.15 area.
$5.12 is the contract highs.
$5.15 is the golden fib of the recent sell off.
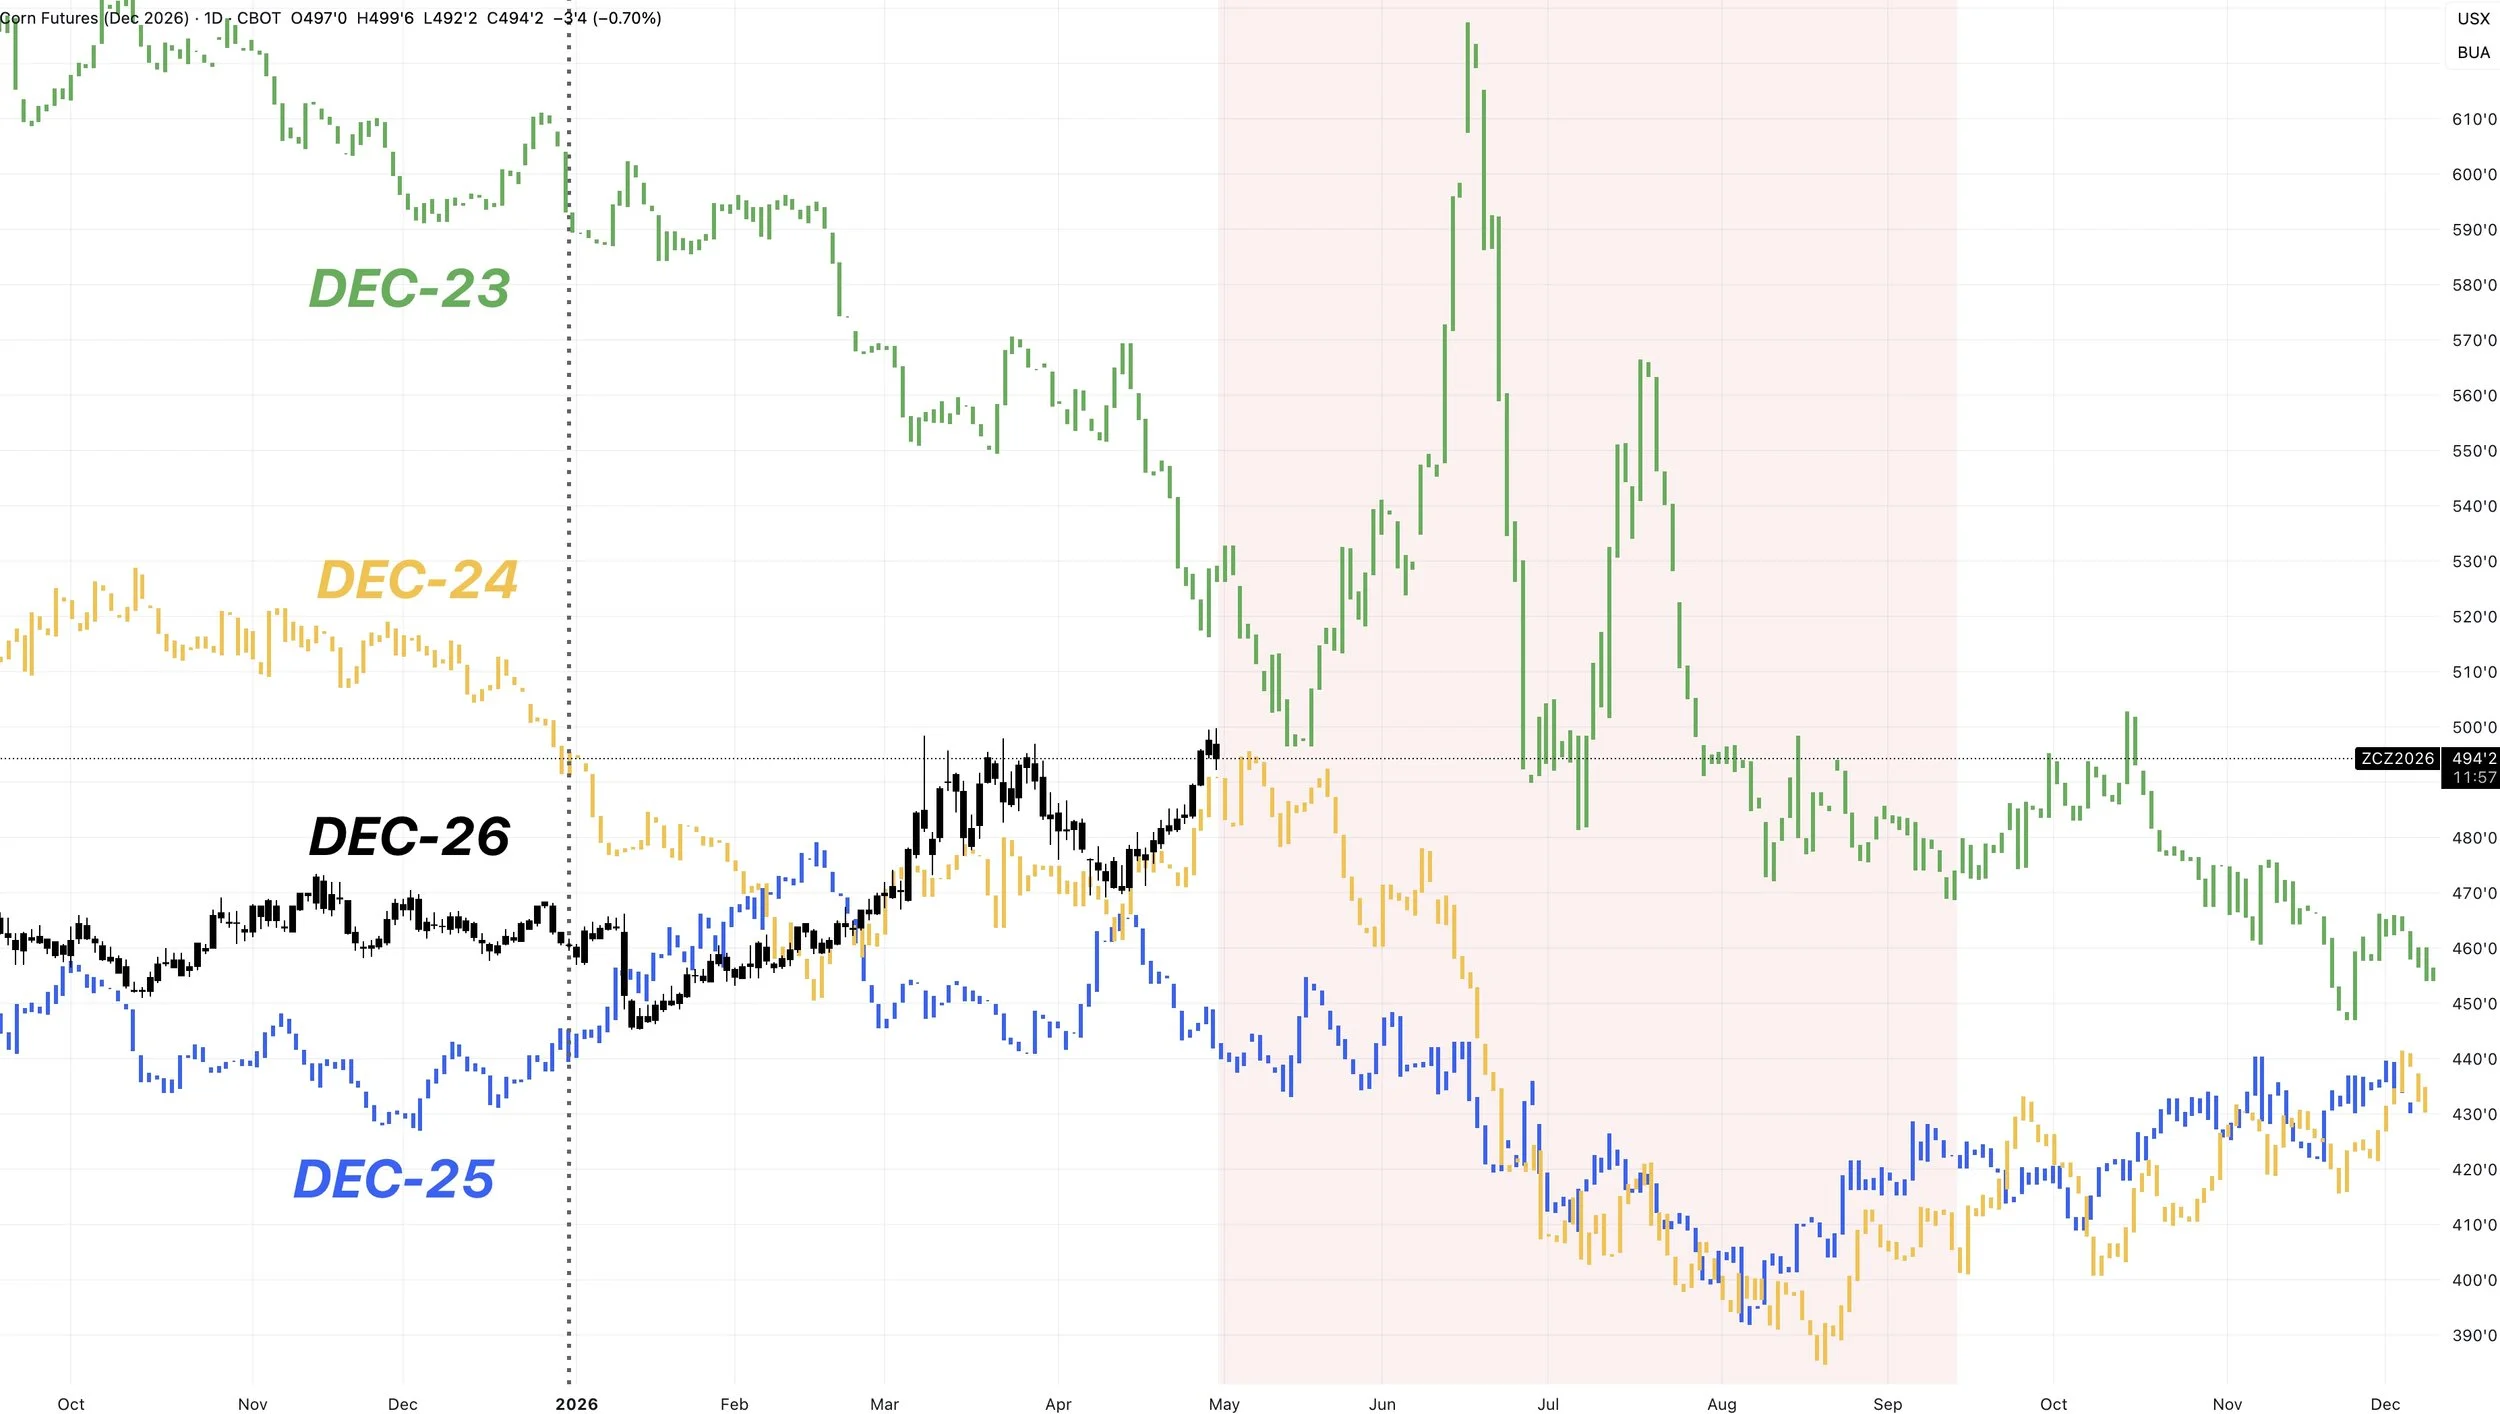
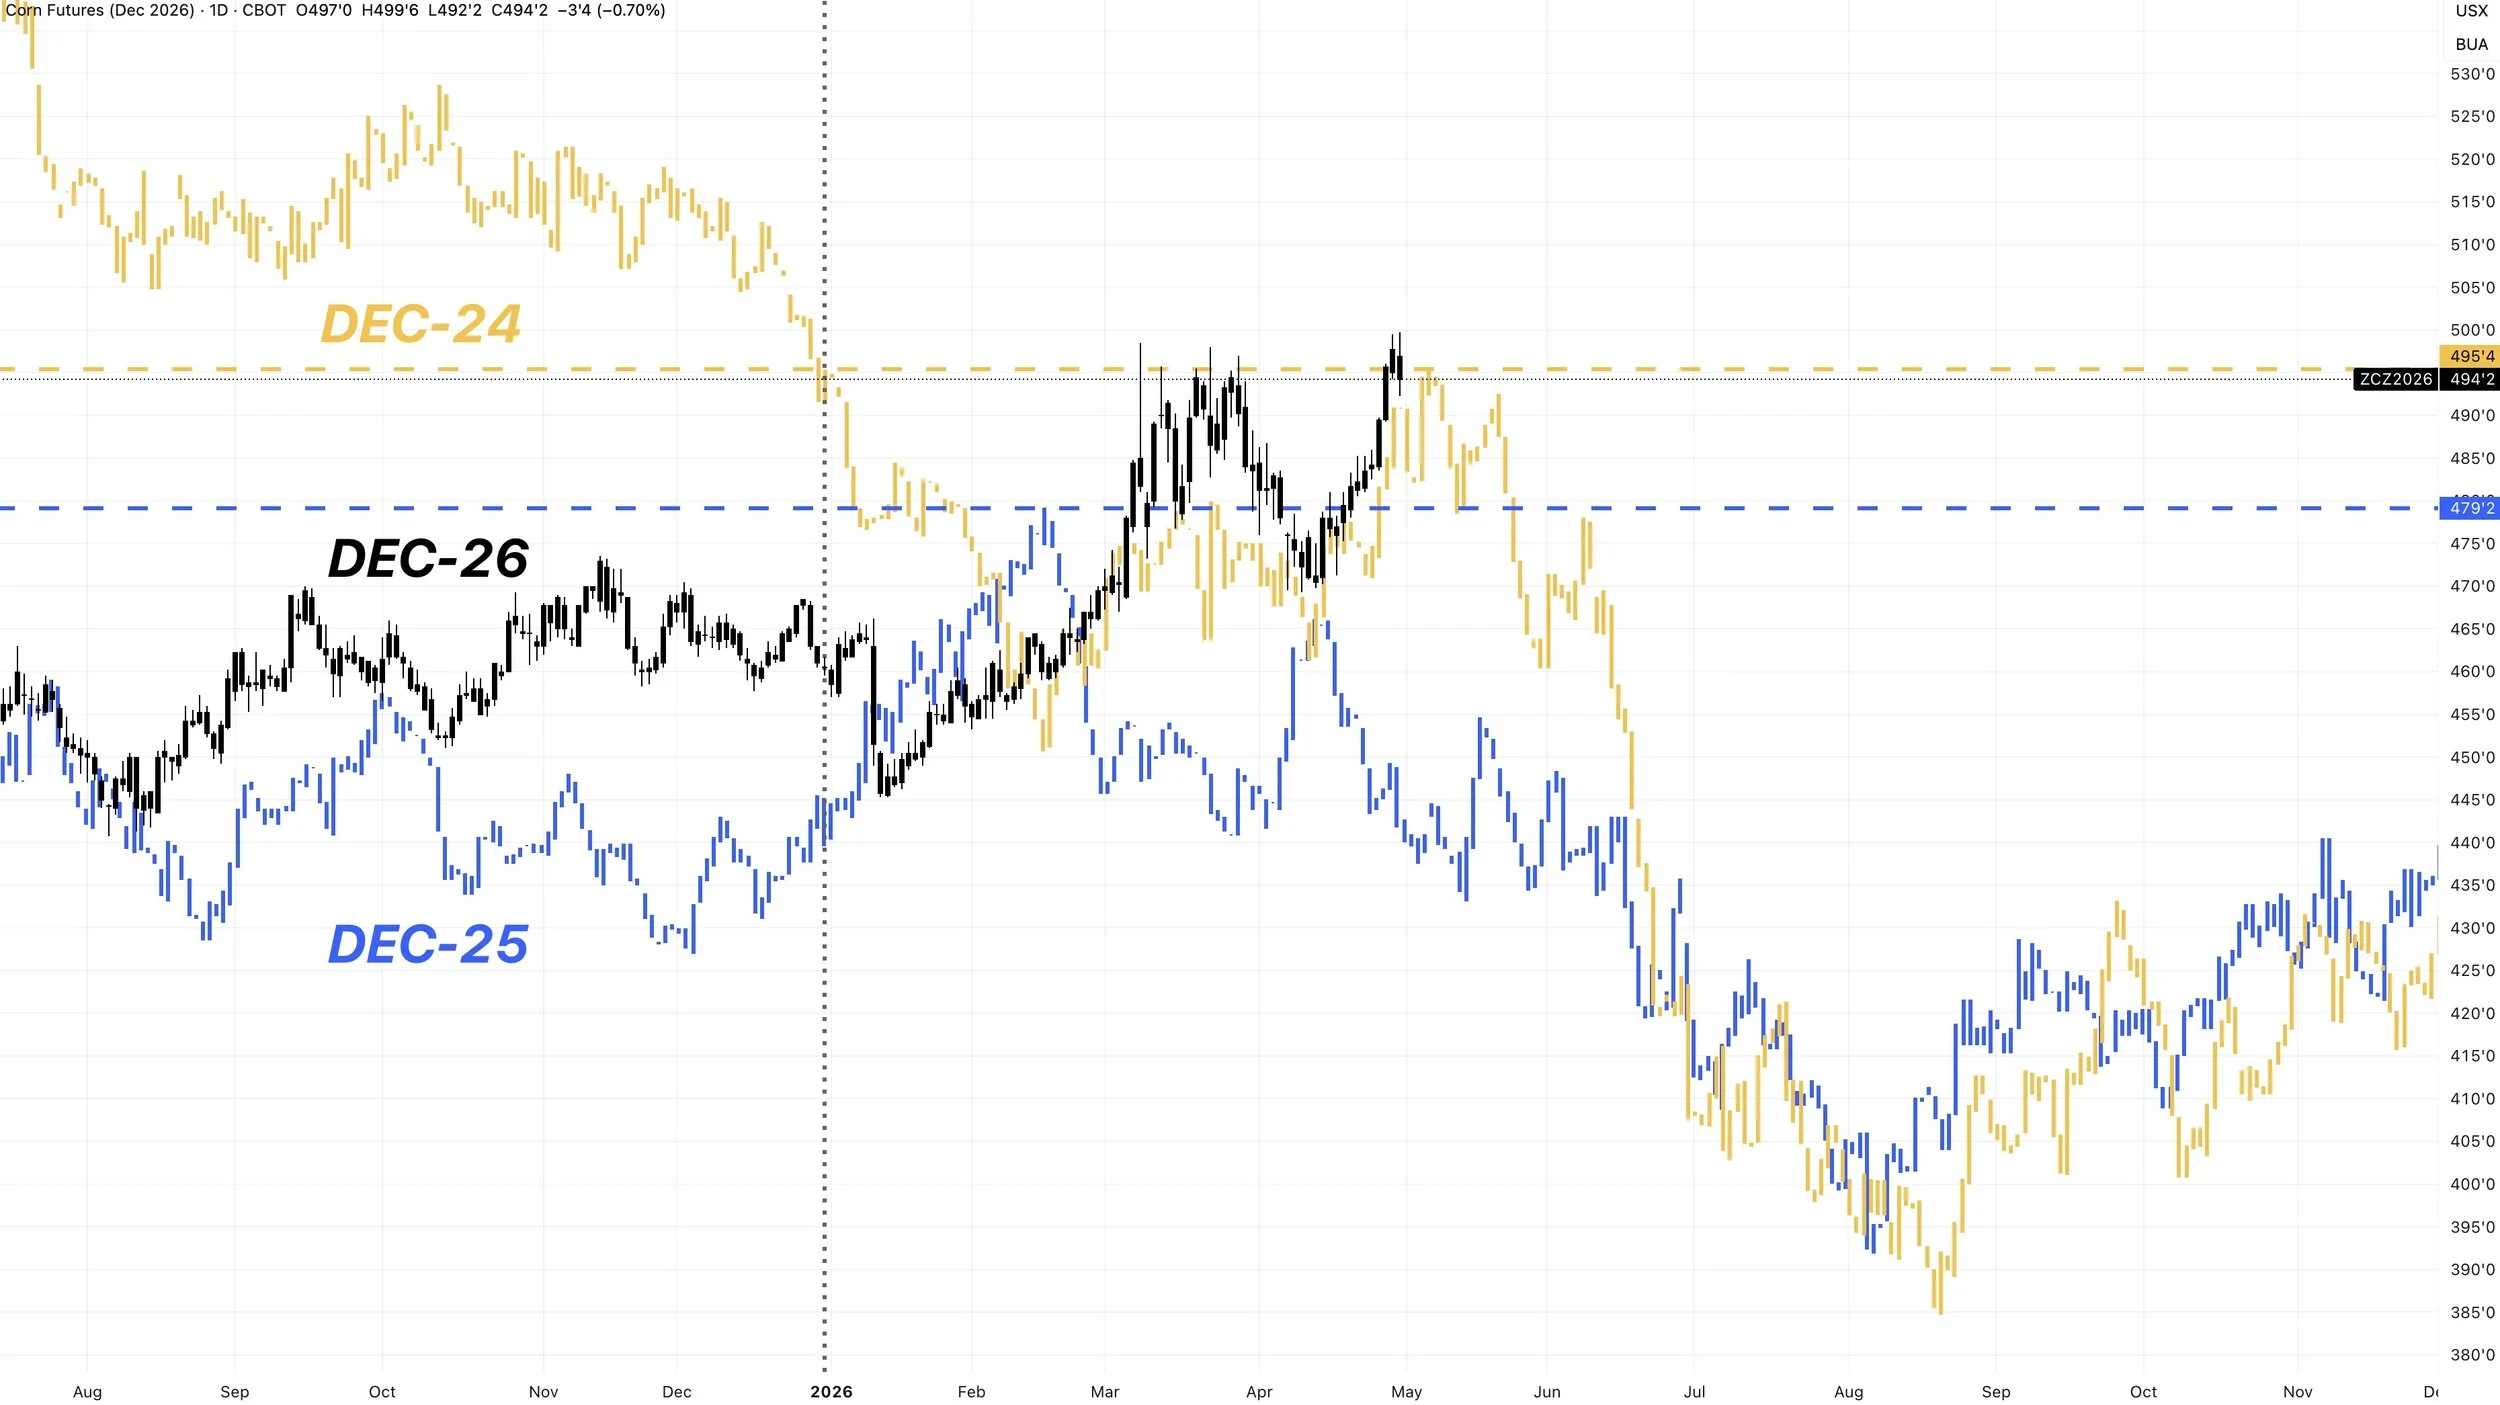
Dec Corn 2024 vs 2025 vs 2026:
Just wanted to note that we did just post 3 year highs.
You haven’t had a chance at these levels in new crop since 2023.
Soybeans
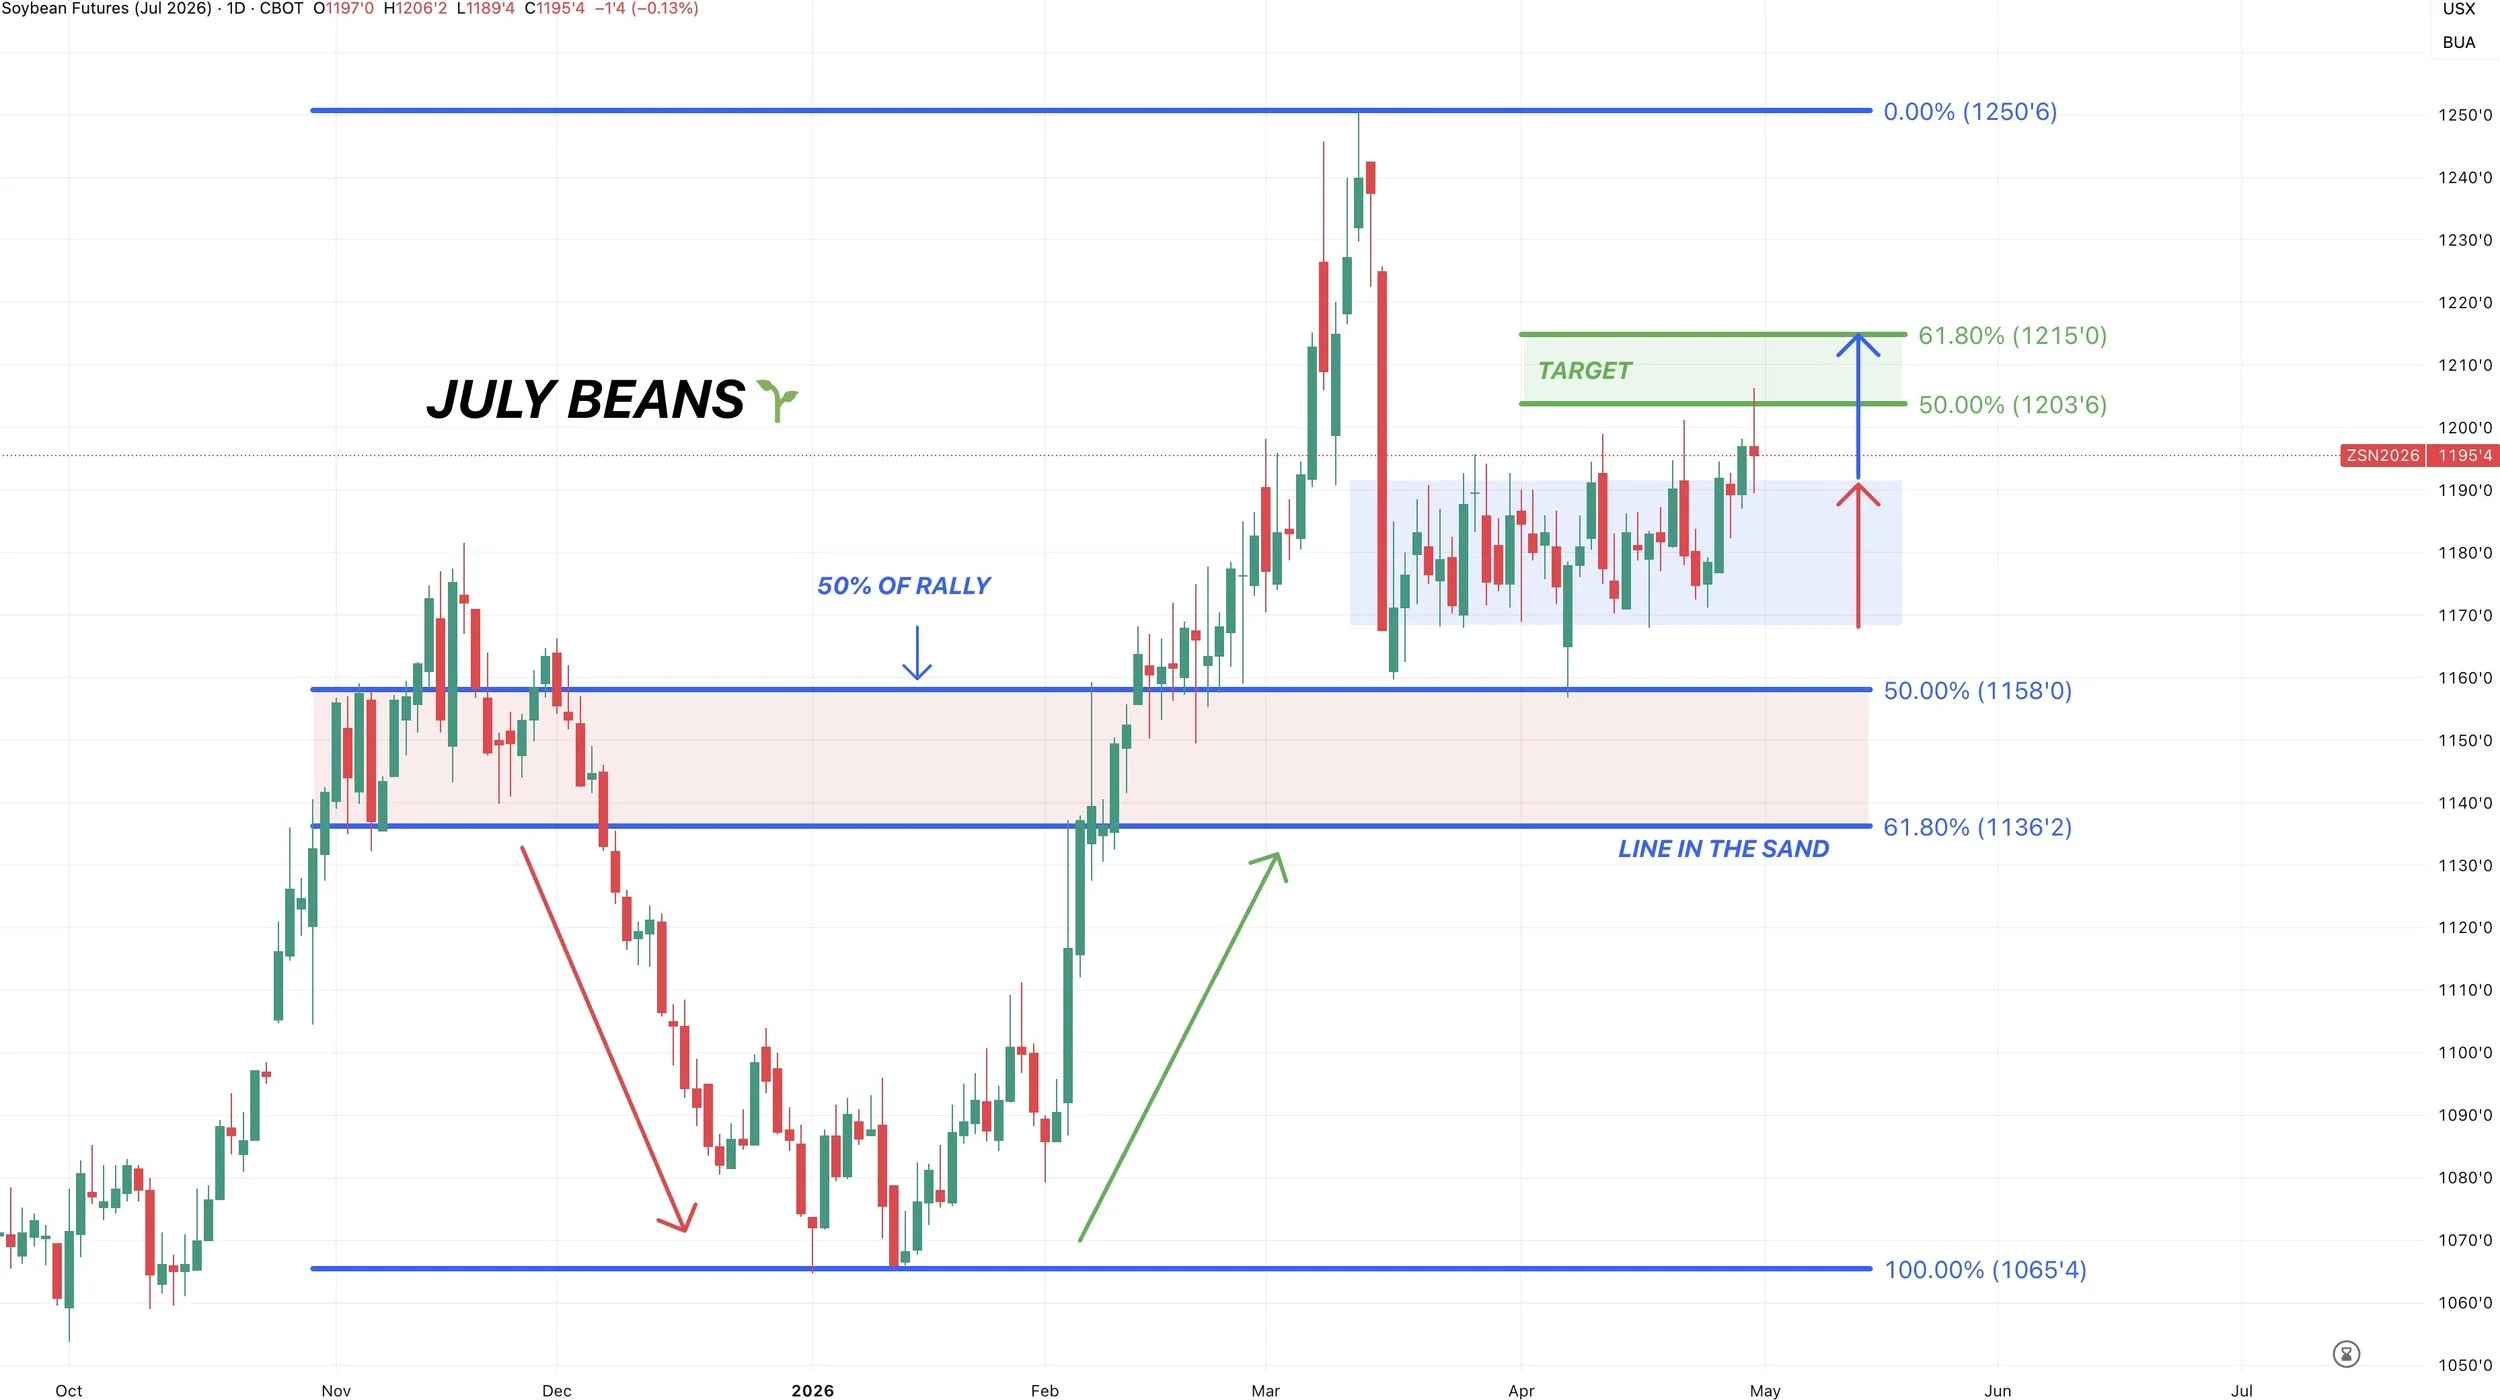
July Beans Chart:
We may have finally broken out of the brutal range we've been trapped in for over 30 straight trading days in a row now.
But still not quiet out of the woods just yet..
If we can close above $12.00 I think we should at the very least see a move towards $12.15
That claws back 61.8% of the sell off.
If you take the recent range, and double it, it also gives you $12.15
$12.15 will then be the decision point and tell us if we are going to challenge the highs or not.
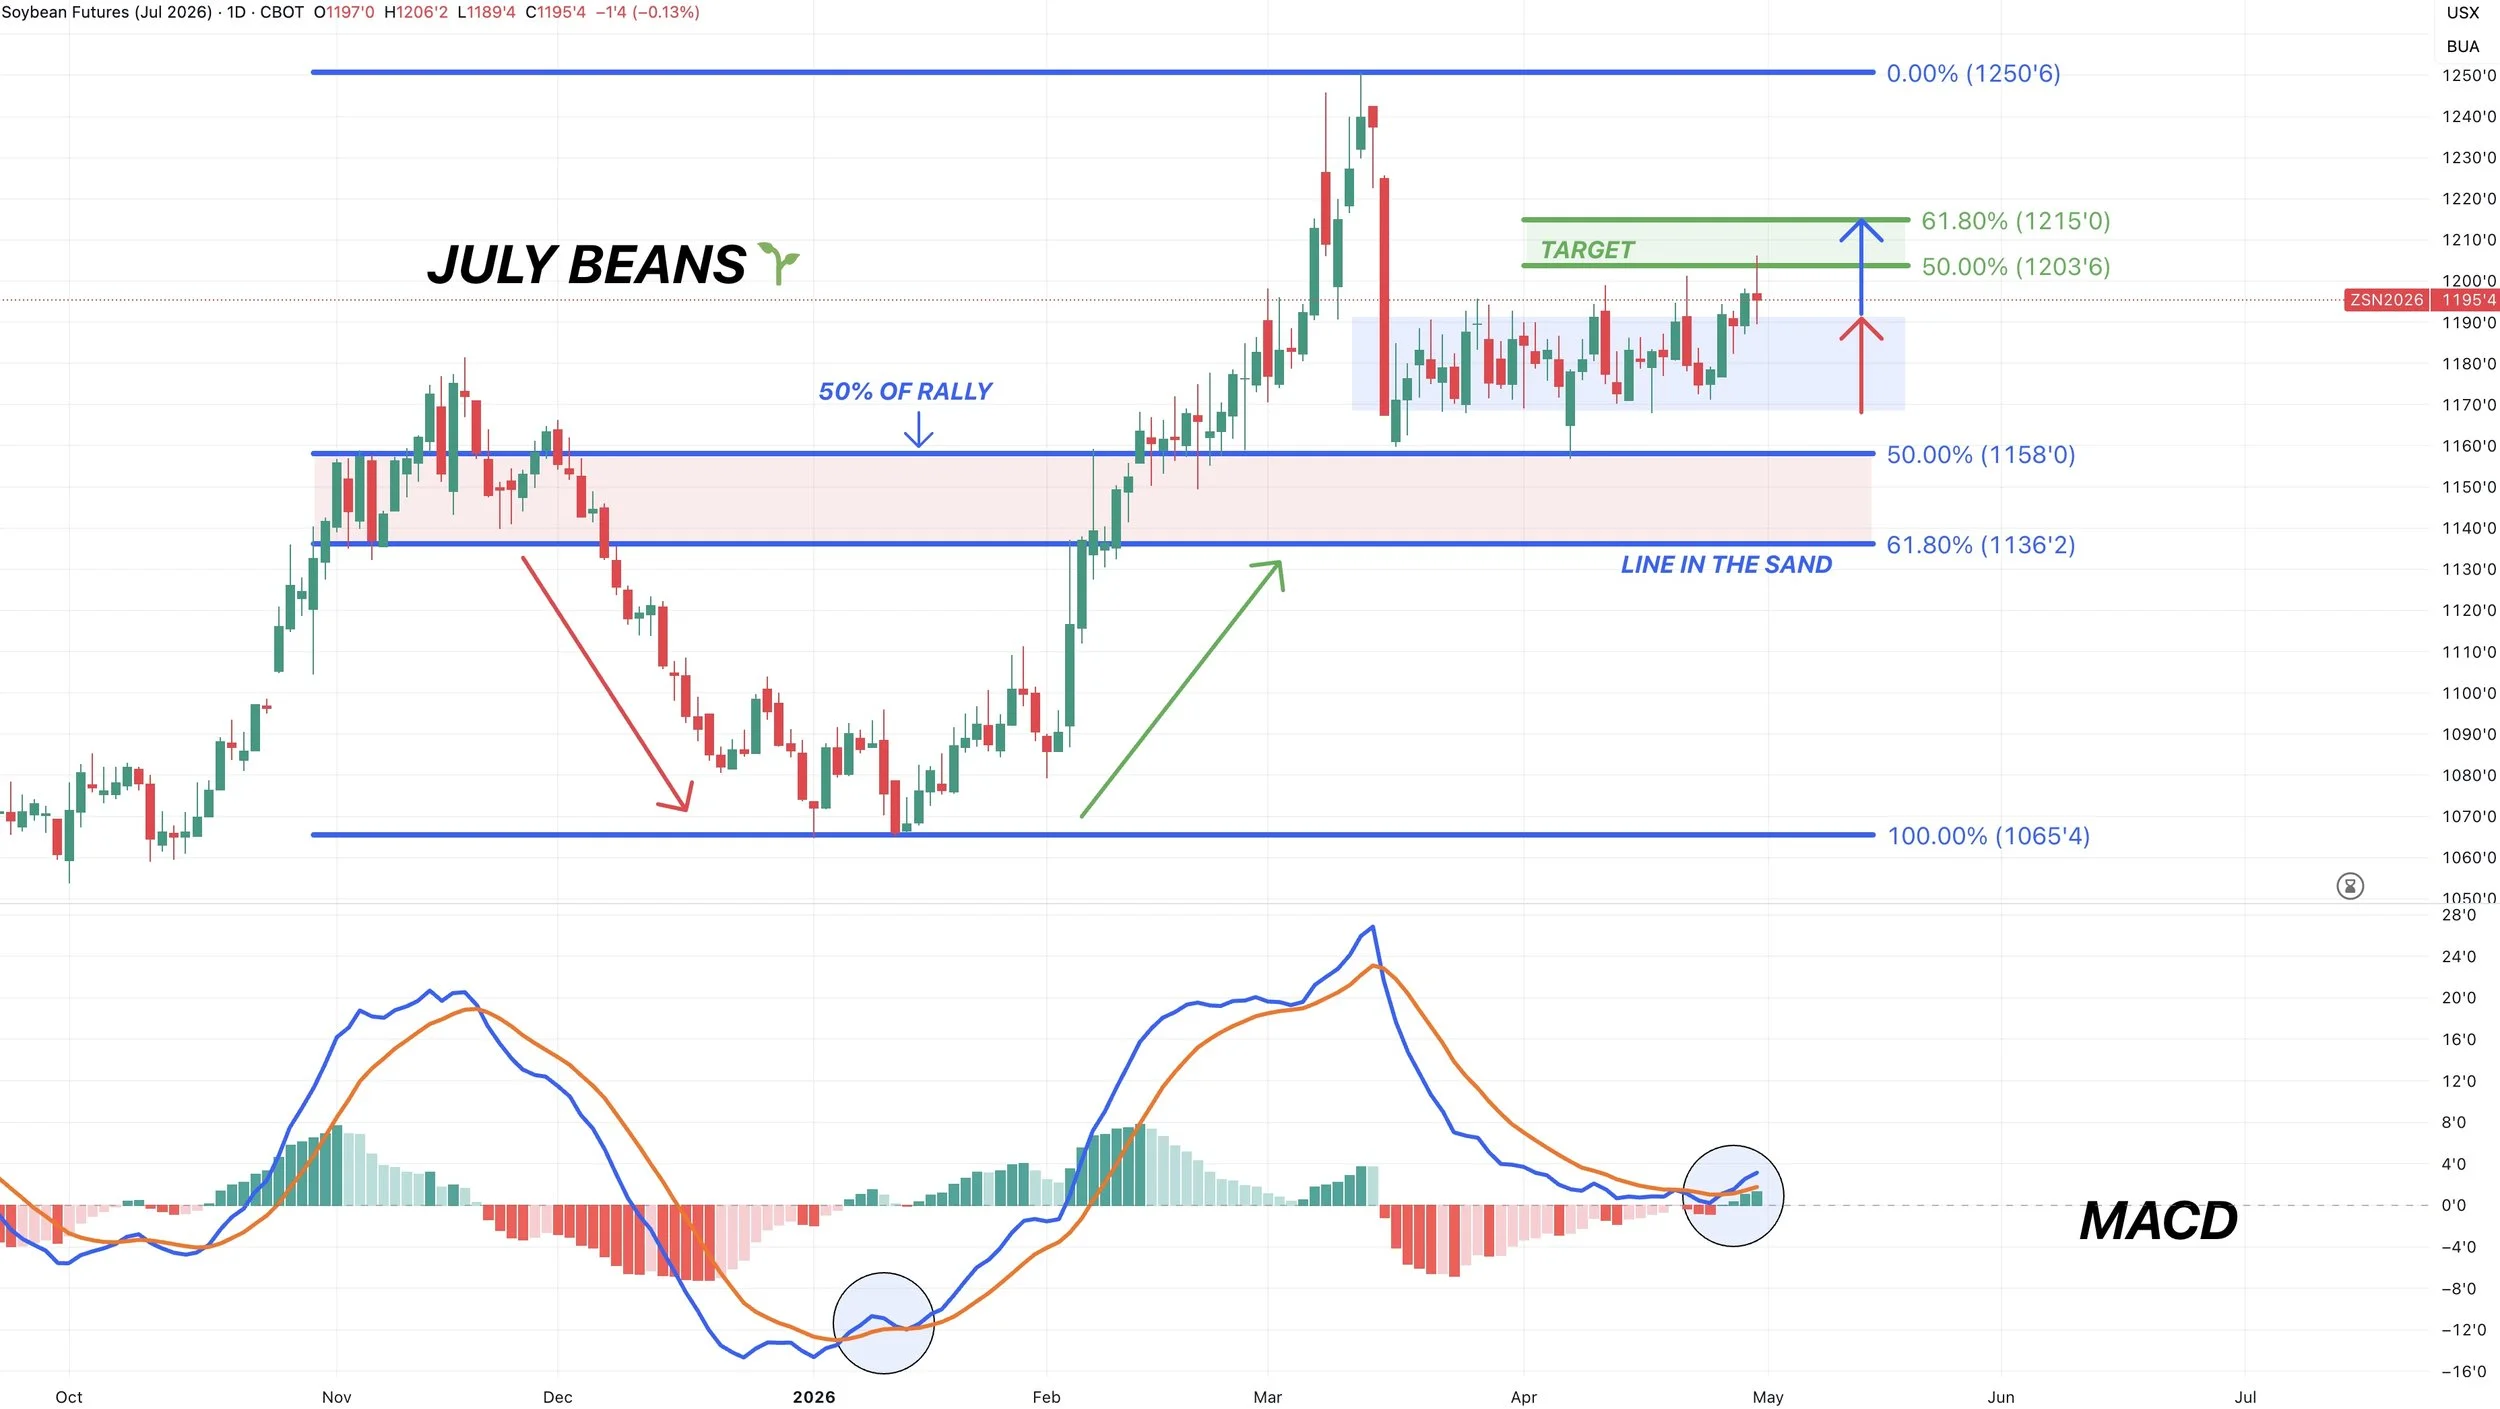
MACD Flipped Bullish:
Like I've been talking about for a few days, the MACD did flip bullish for the first time since the January lows.
This just tells us that momentum might be starting to shift higher.
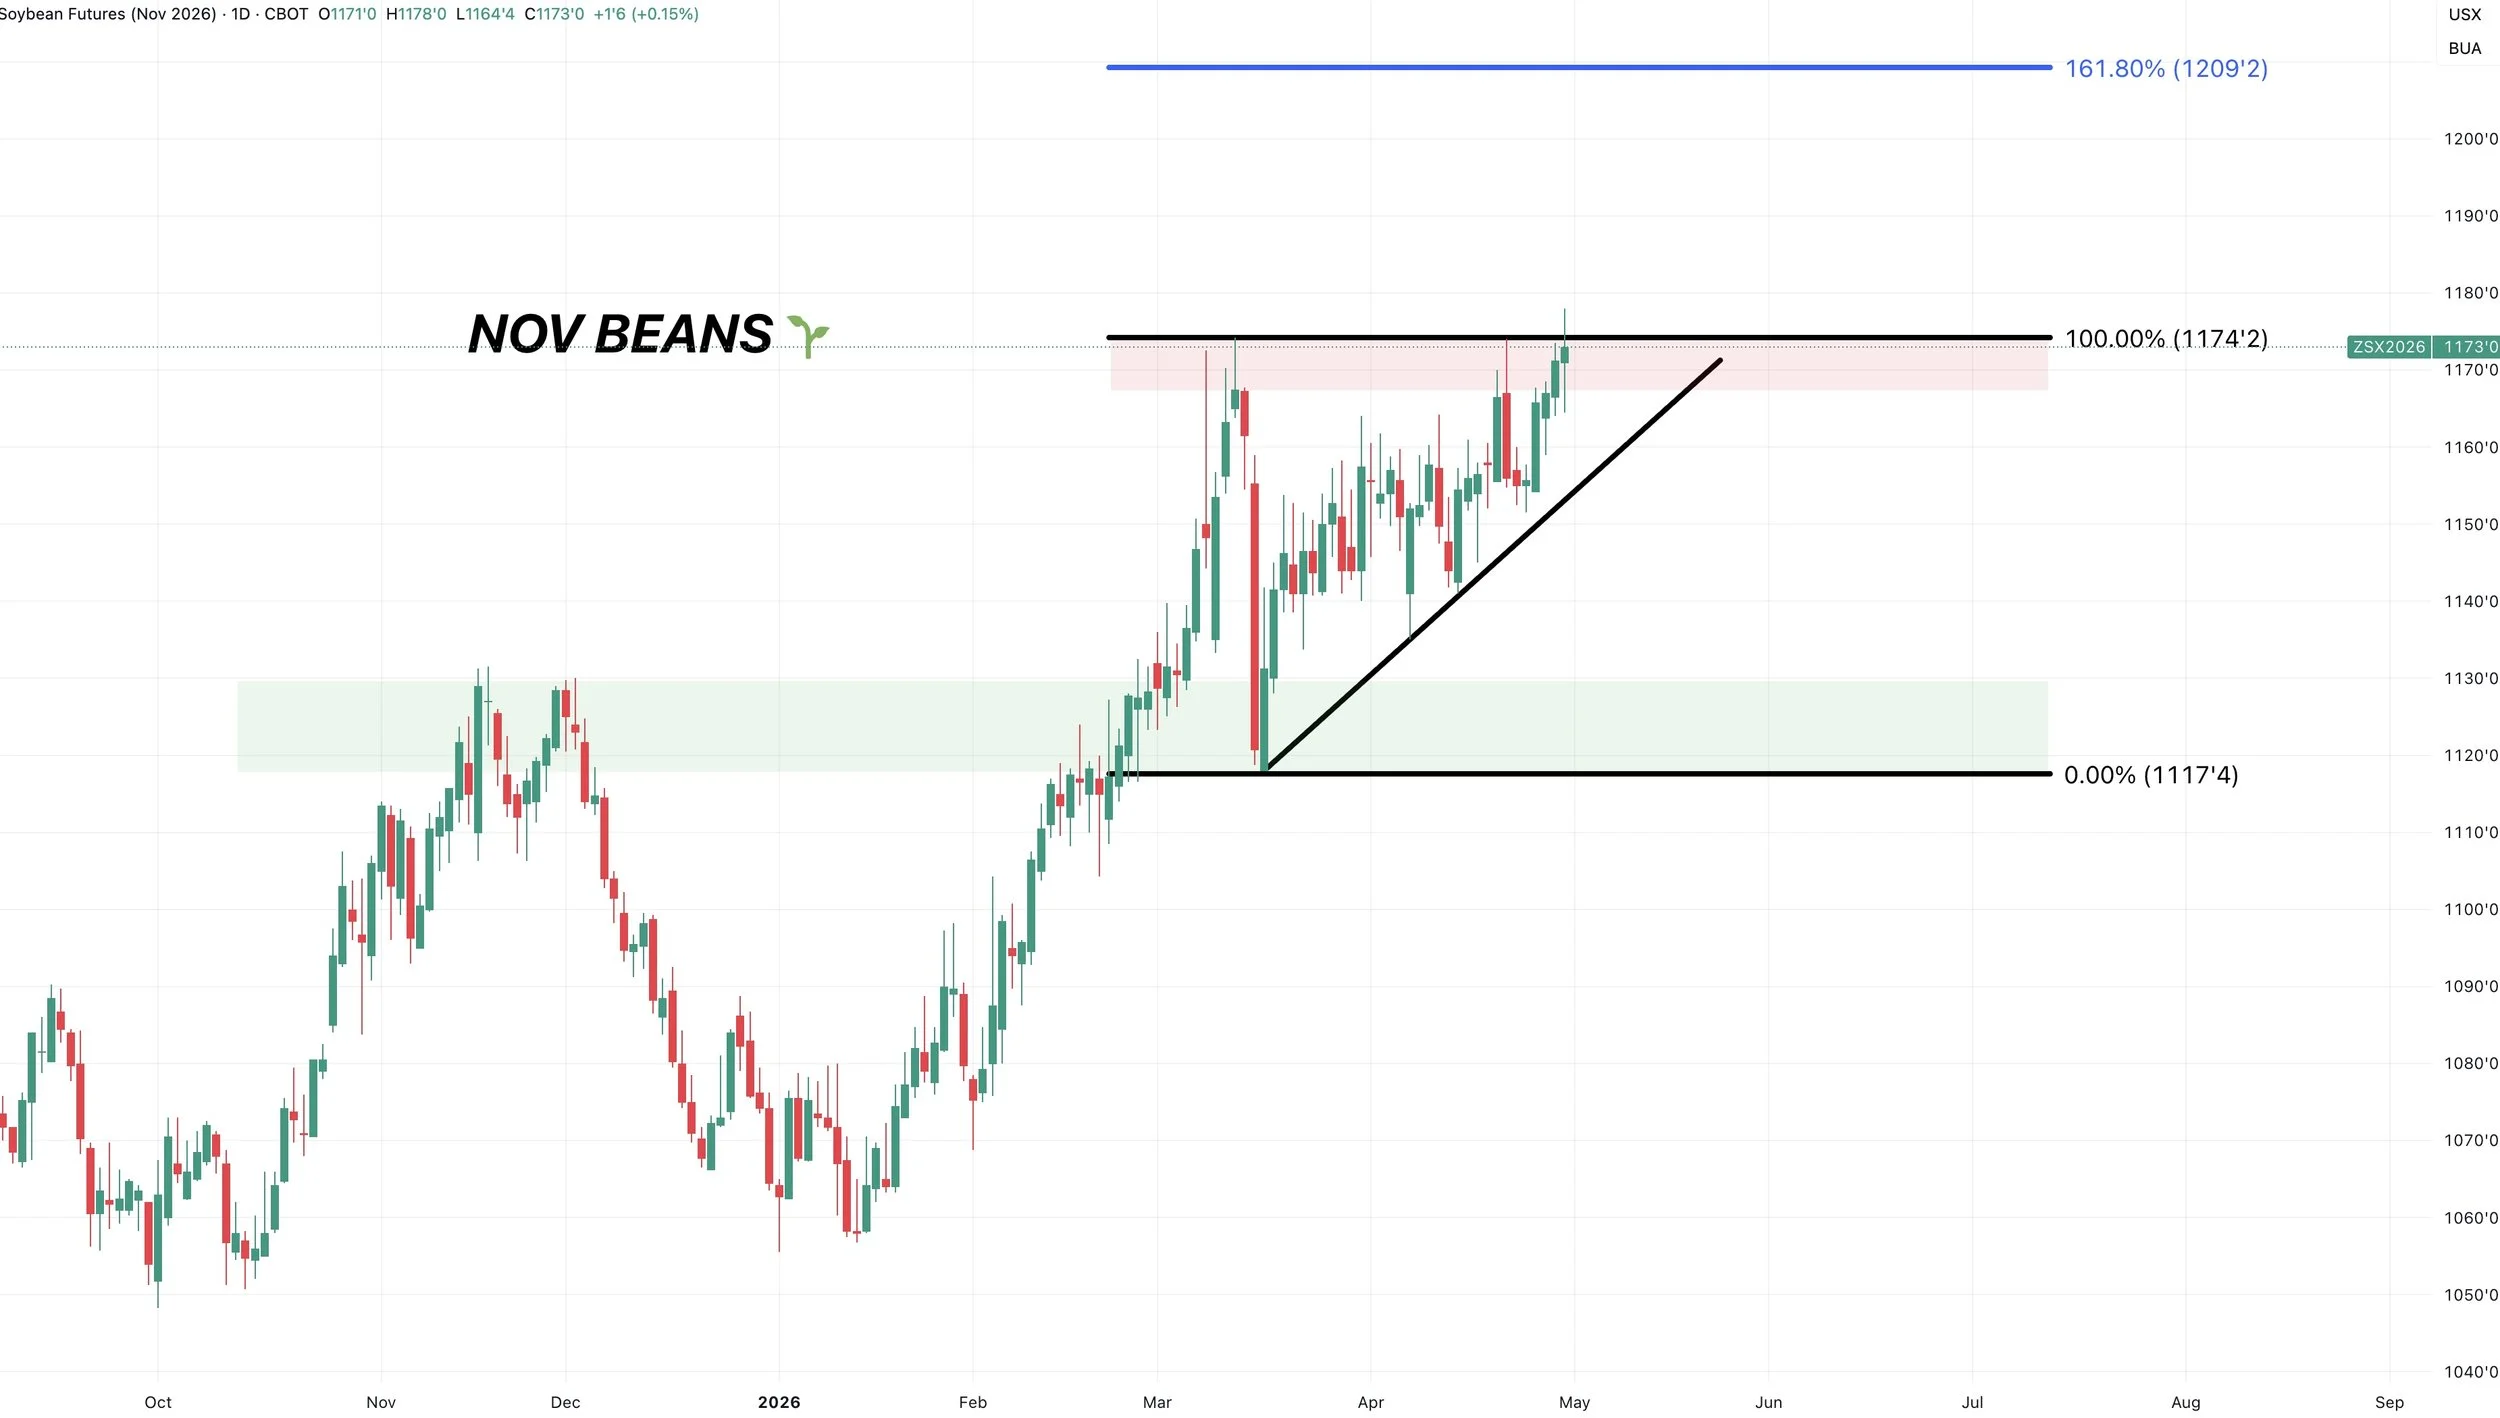
Nov Beans Chart:
Up right against those highs from March.
Since this is big resistance and the highest we've been, it might make sense to get caught up in marketing or protection if you feel like you're behind or missed out.
If we get the break out, we should get a leg higher.
But for now, it's big resistance.
Simply waiting to see if we get the break out or reject again.
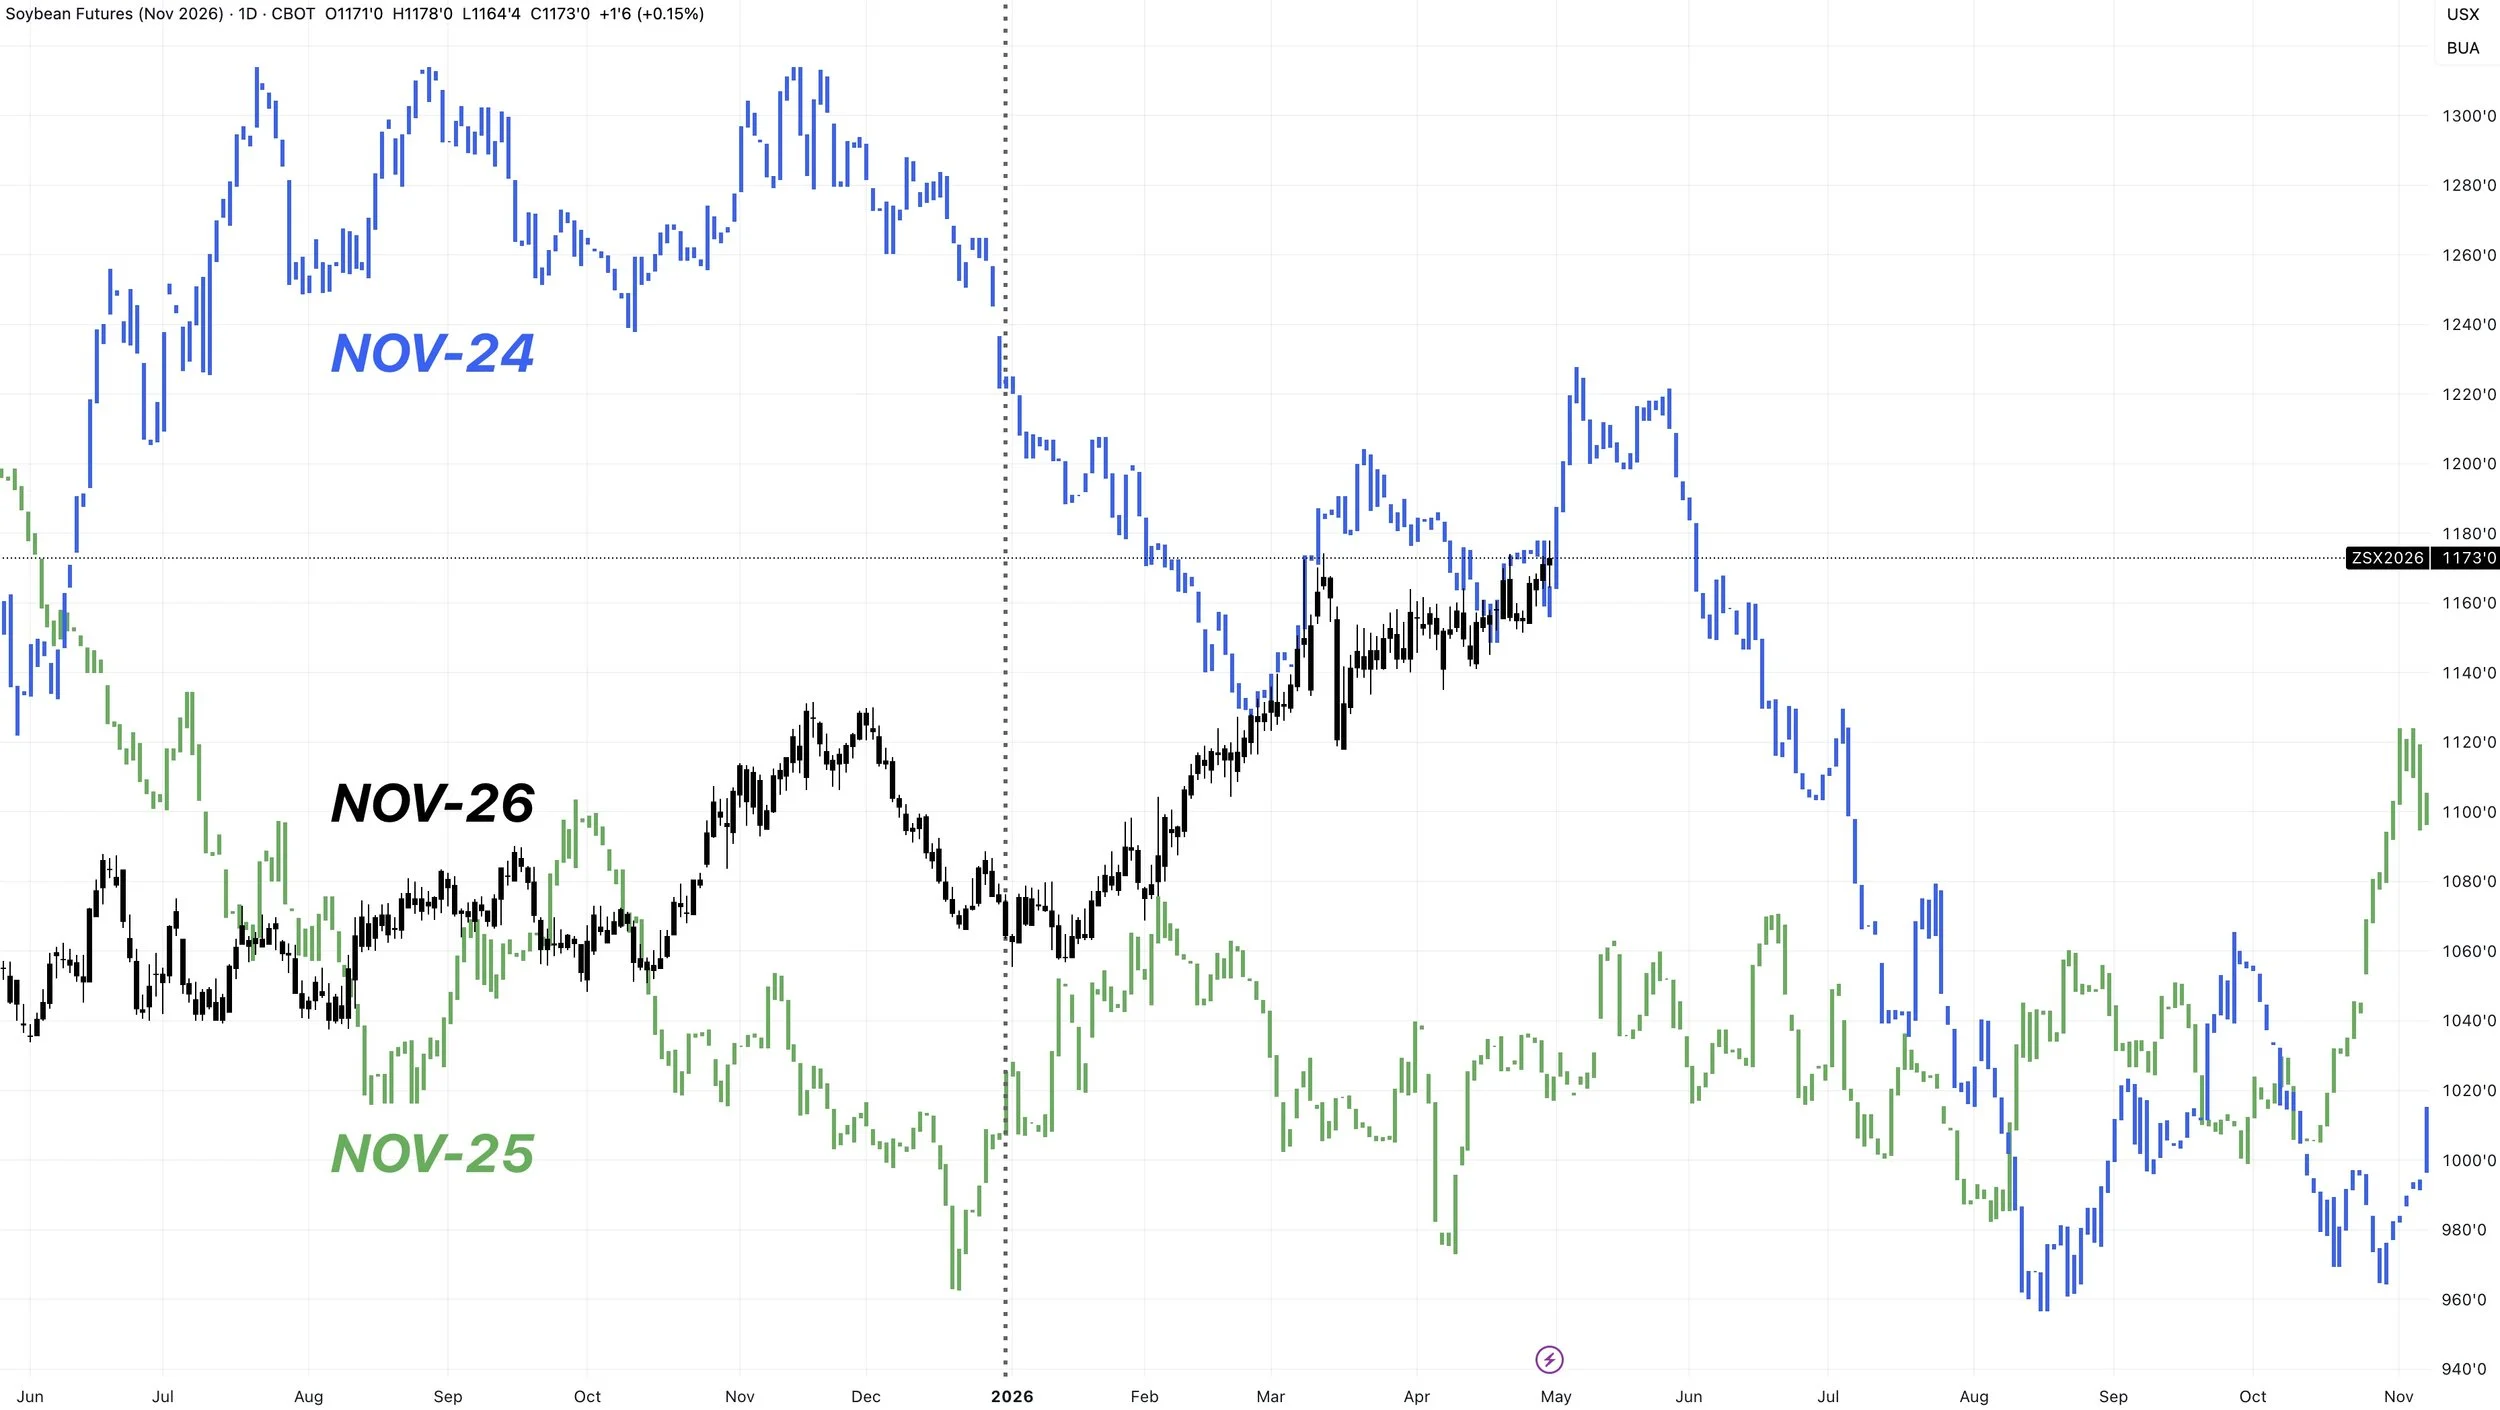
Nov Beans 2026 vs 2025 vs 2024:
How do we stack up vs the last few years?
We are higher than we were all of last year.
Getting close to those levels we saw back in 2024.
Wheat
Fundamentals:
We've already gone over how poor this US HRW crop is several times.
National ratings are one of their lowest on record, but when you simply look at the HRW states as a whole they are actually the lowest ever.
Some argue that it's just one class of wheat that's in trouble. That is valid.
Some also argue that wheat is a global commodity. Which is true.
If this drought was happening in the corn belt, you'd be looking at corn $1.00 higher. As the US is the dominant player in corn, where as the US is a relatively small player on the world wheat market.
Yes, the world as a whole has an ample amount of wheat. For now..
But you also can’t forget about the fertilizer situation.
Yes a large part of this rally is drought. But it's also due to the fertilizer story and the war.
Fertilizer is going to impact countries across the world such as Australia.
One negative thing that could happen in wheat is demand destruction.
We are starting to price ourselves out of the world market.
The US is getting expensive compared to the rest of the world due to this rally.
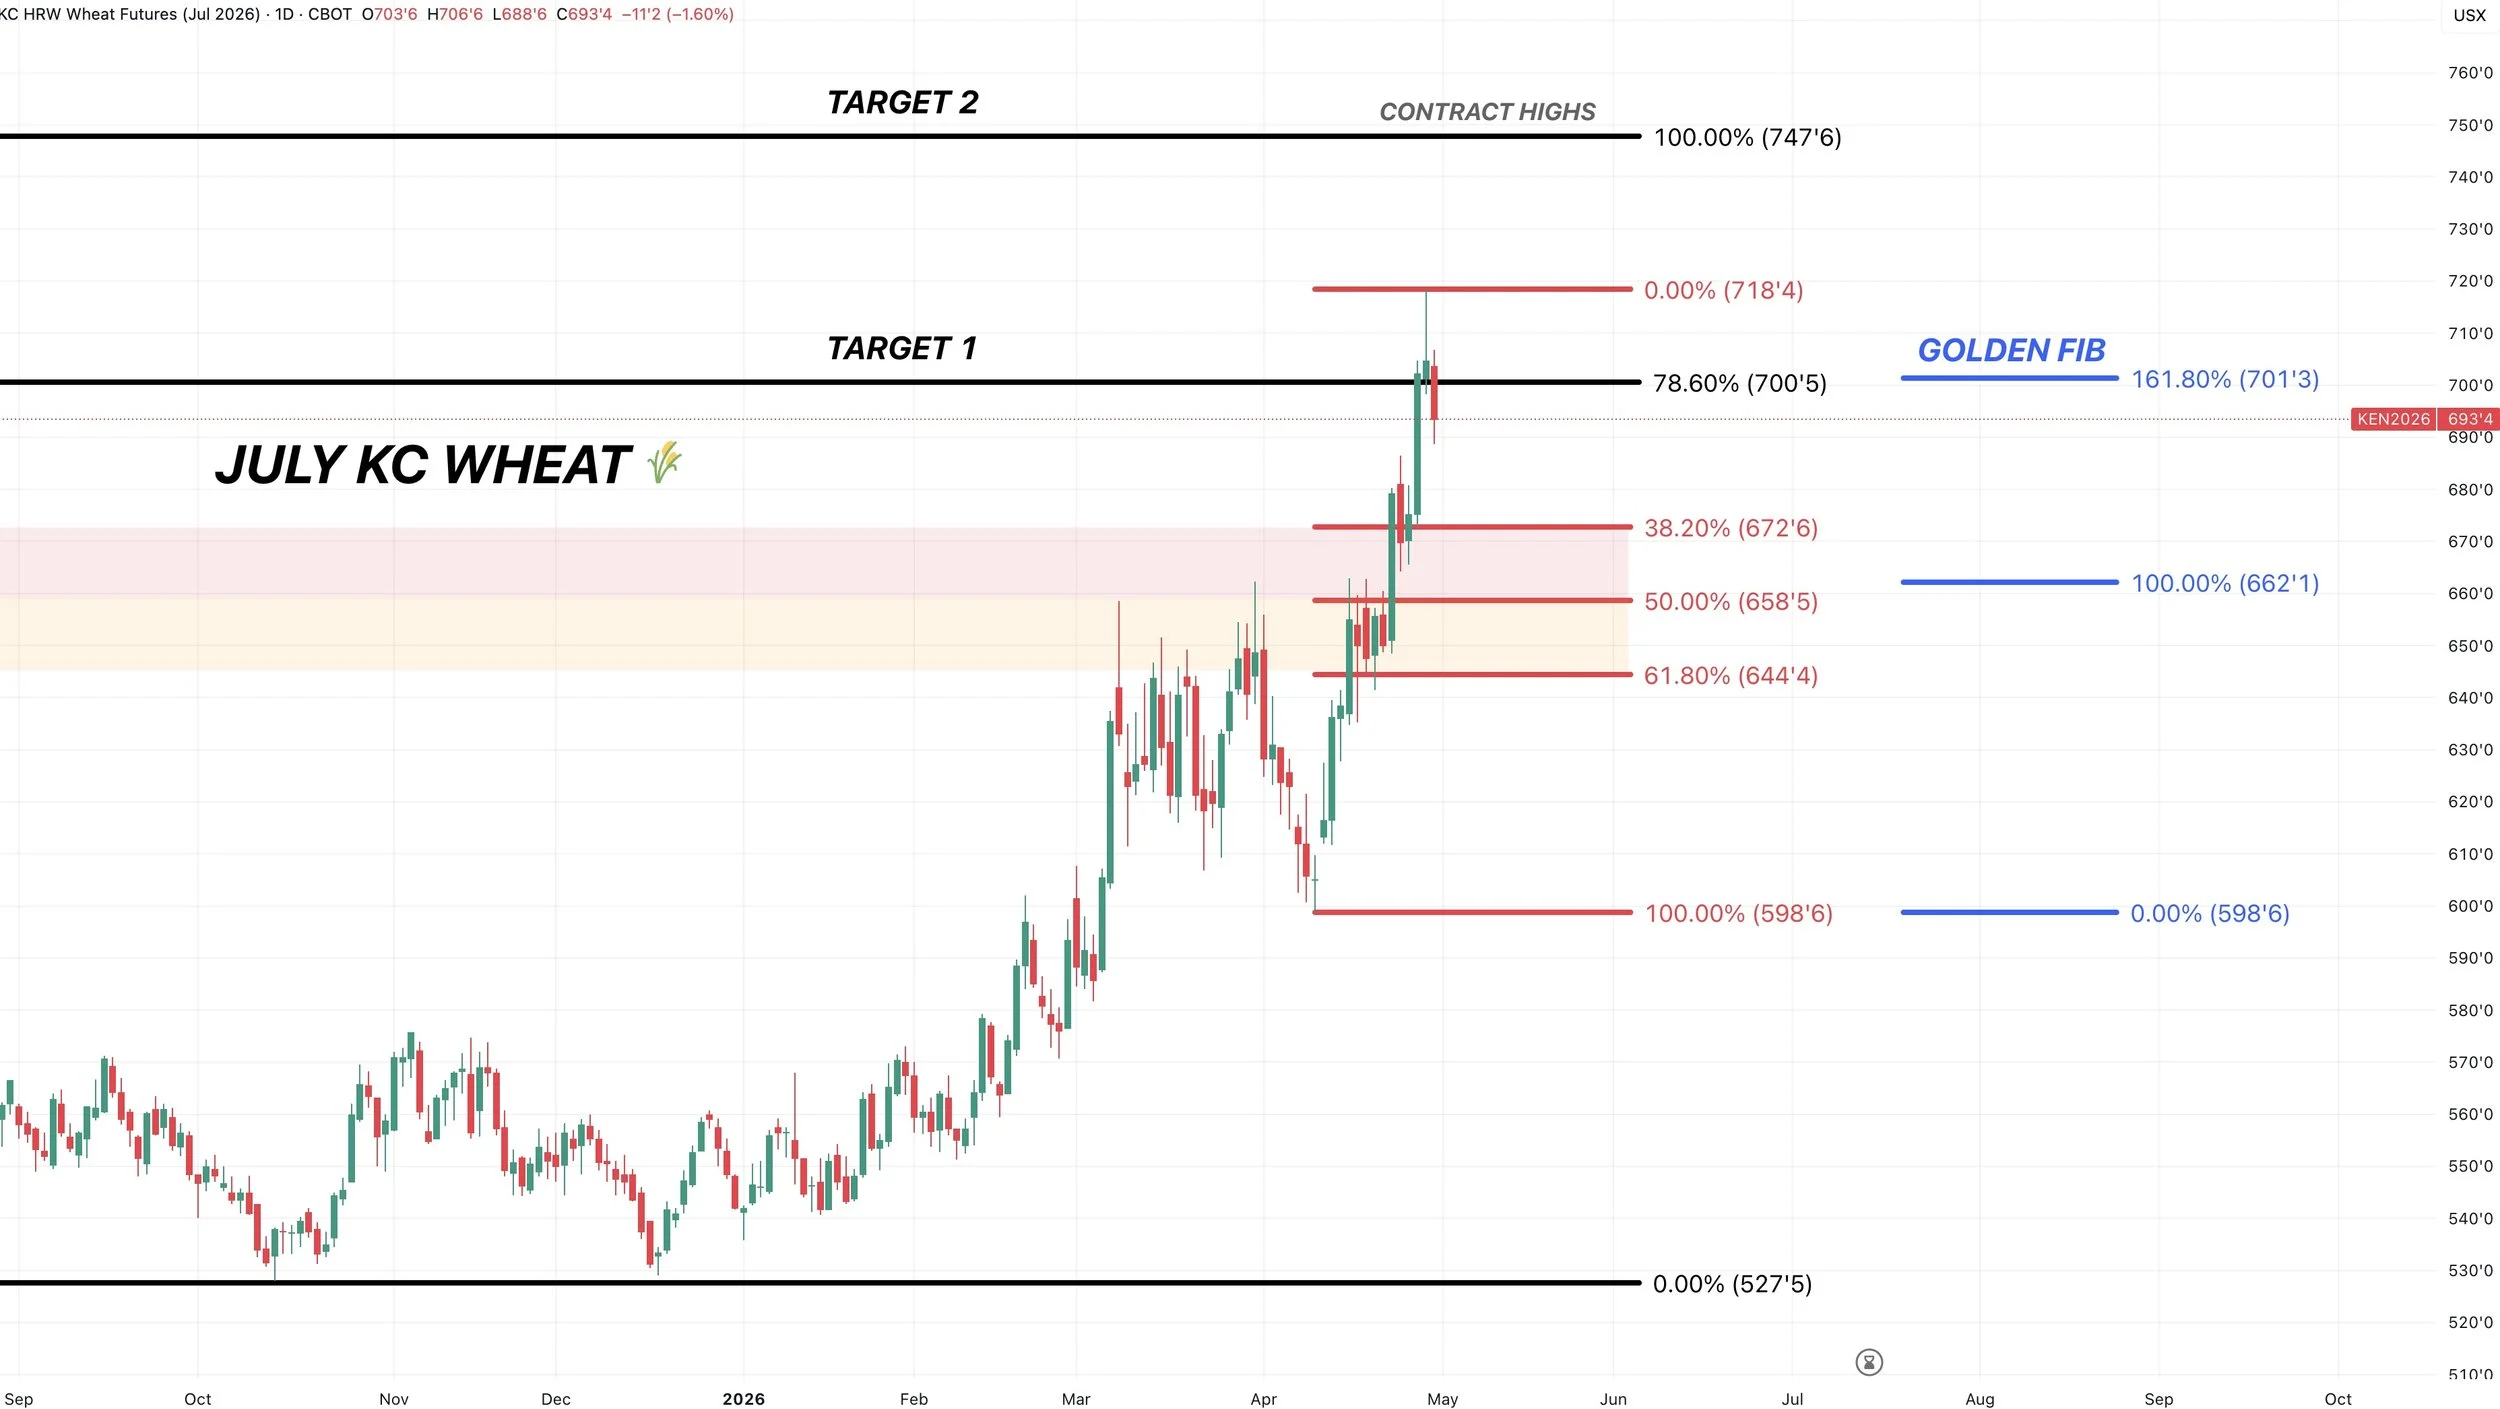
July KC Chart:
Currently struggling at that $7.00 target.
We issued that sell signal a few days ago at $7.00, which was more for those who lack storage or have hedge accounts.
Click Here for Signal
Not the best price action the last two days. As we left a shooting start yesterday and followed it up with weakness. After a 60-cent rally in a week, taking a breather wouldn’t be a surprise.
We could easily pull back another 20 to even 40 cents, and structurally the chart would still be friendly.
$7.00 is the last retracement level before contract highs. It's also the golden fib from the recent sell off up to those March highs.
If we take out this level, the next target is $7.50
Which is contract highs.
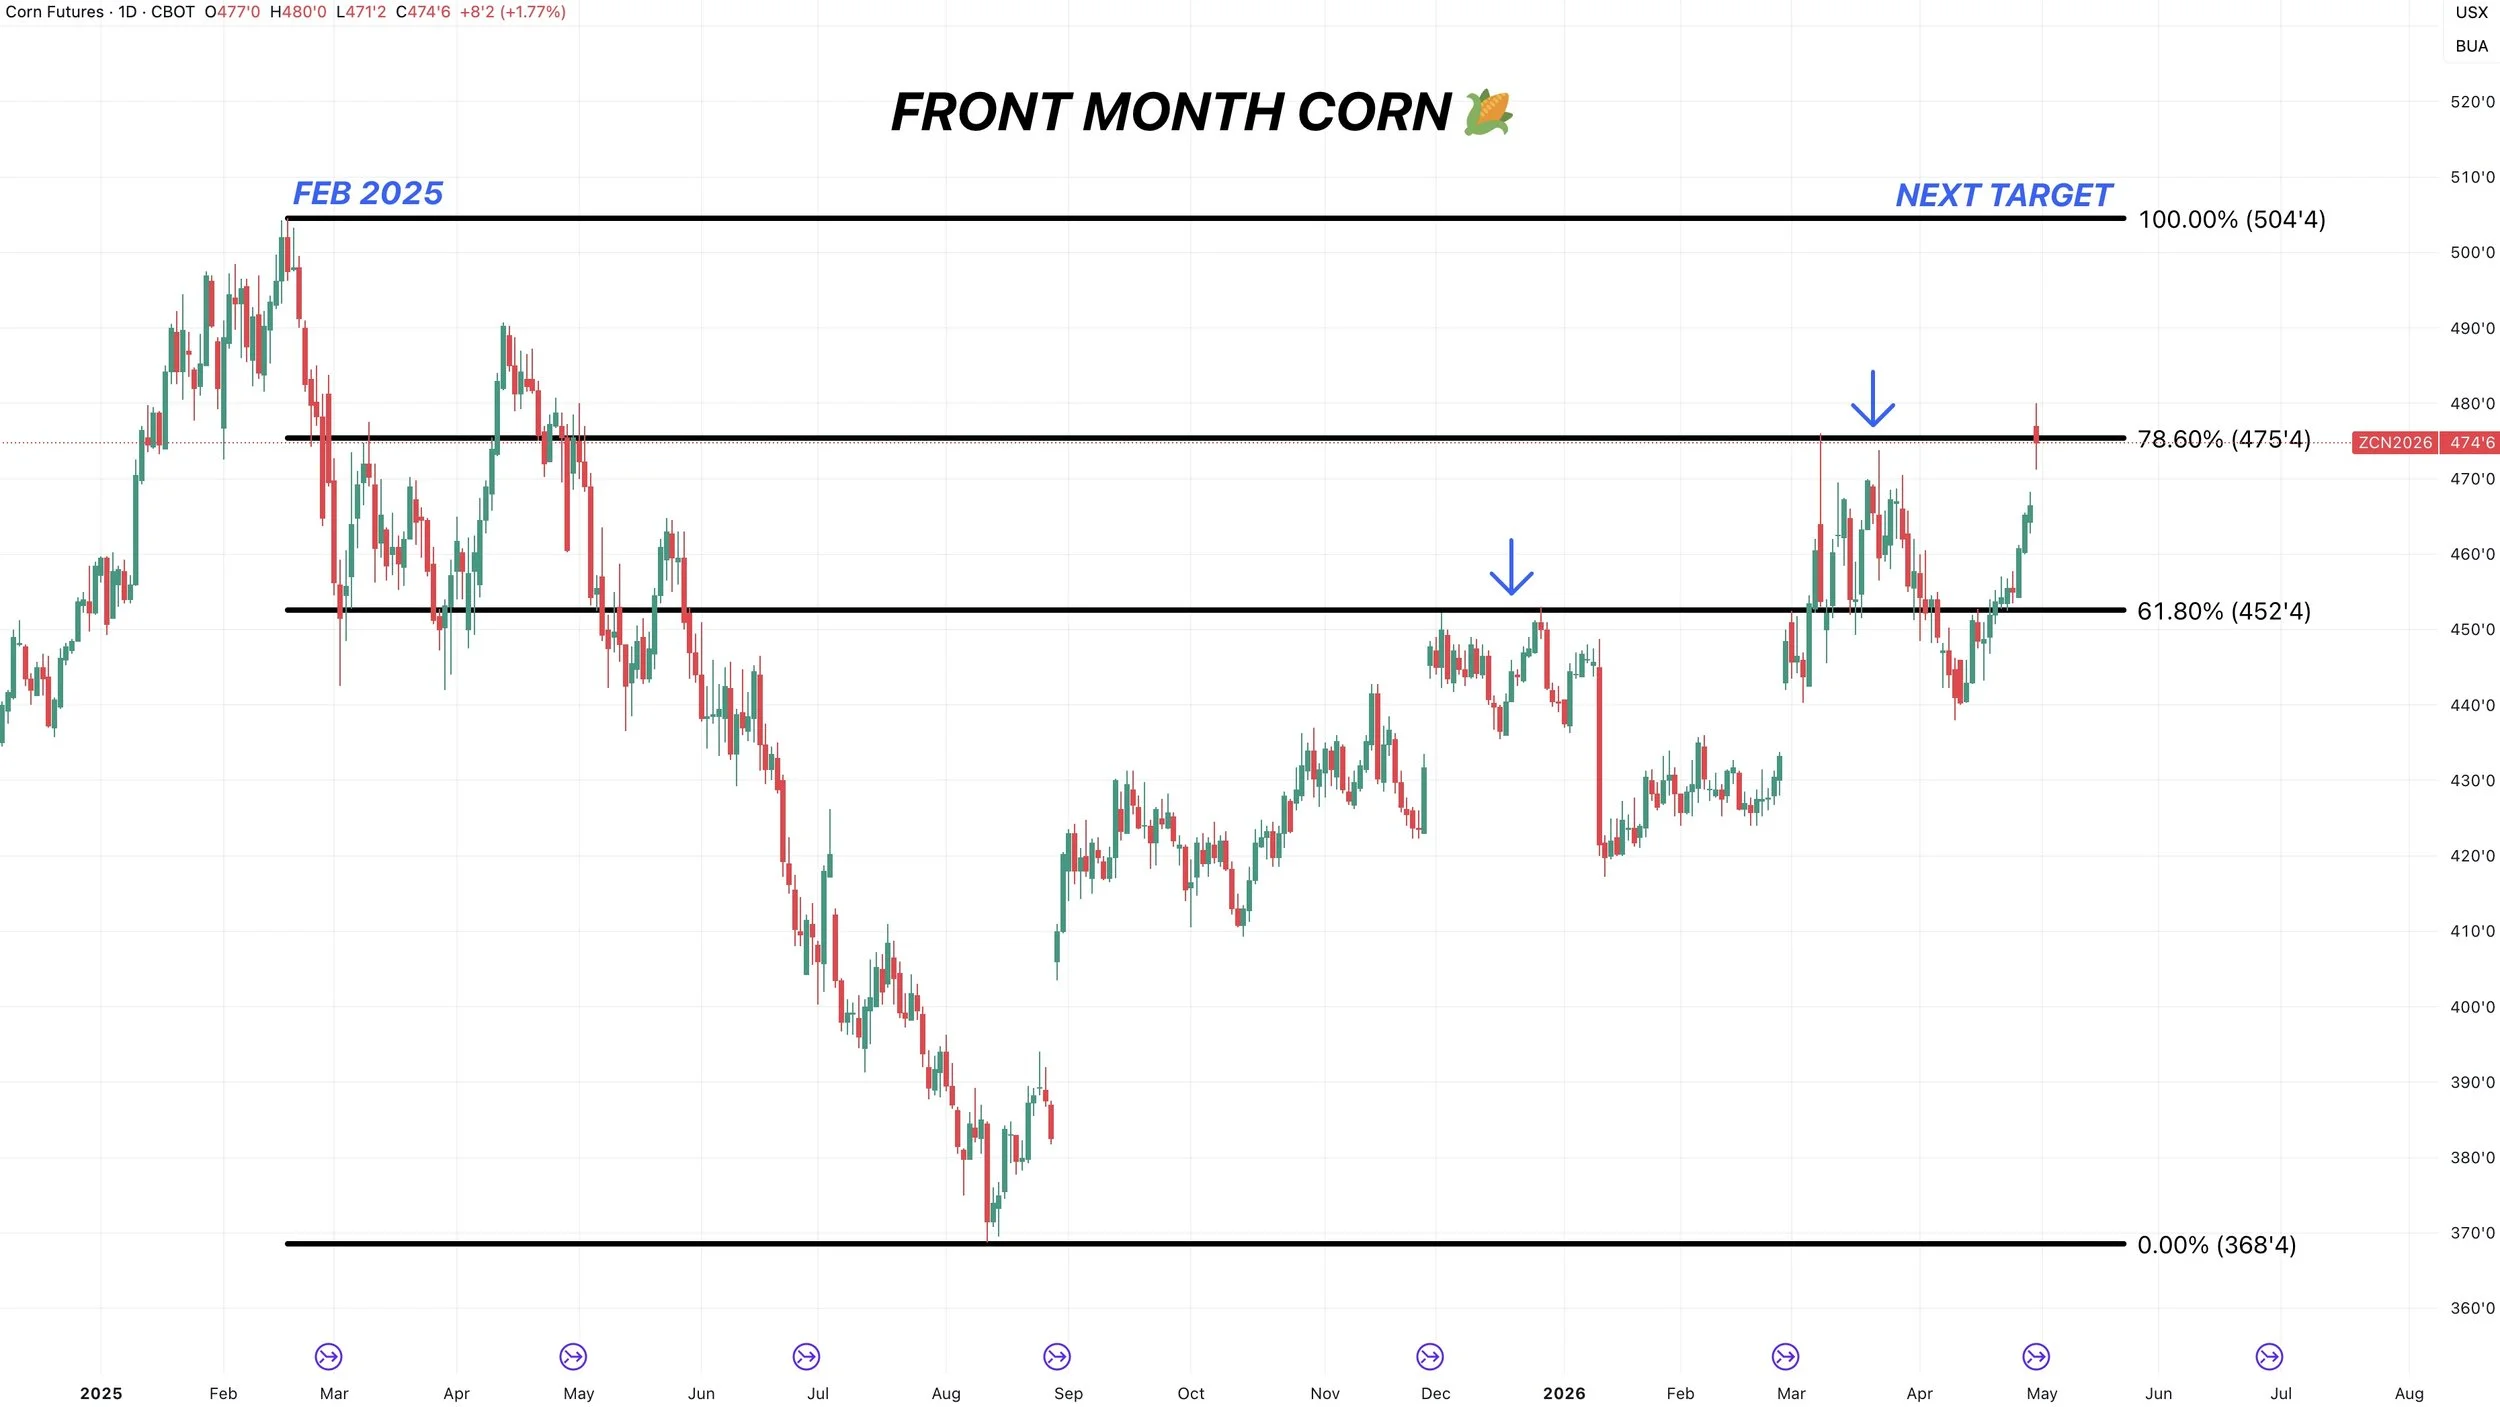
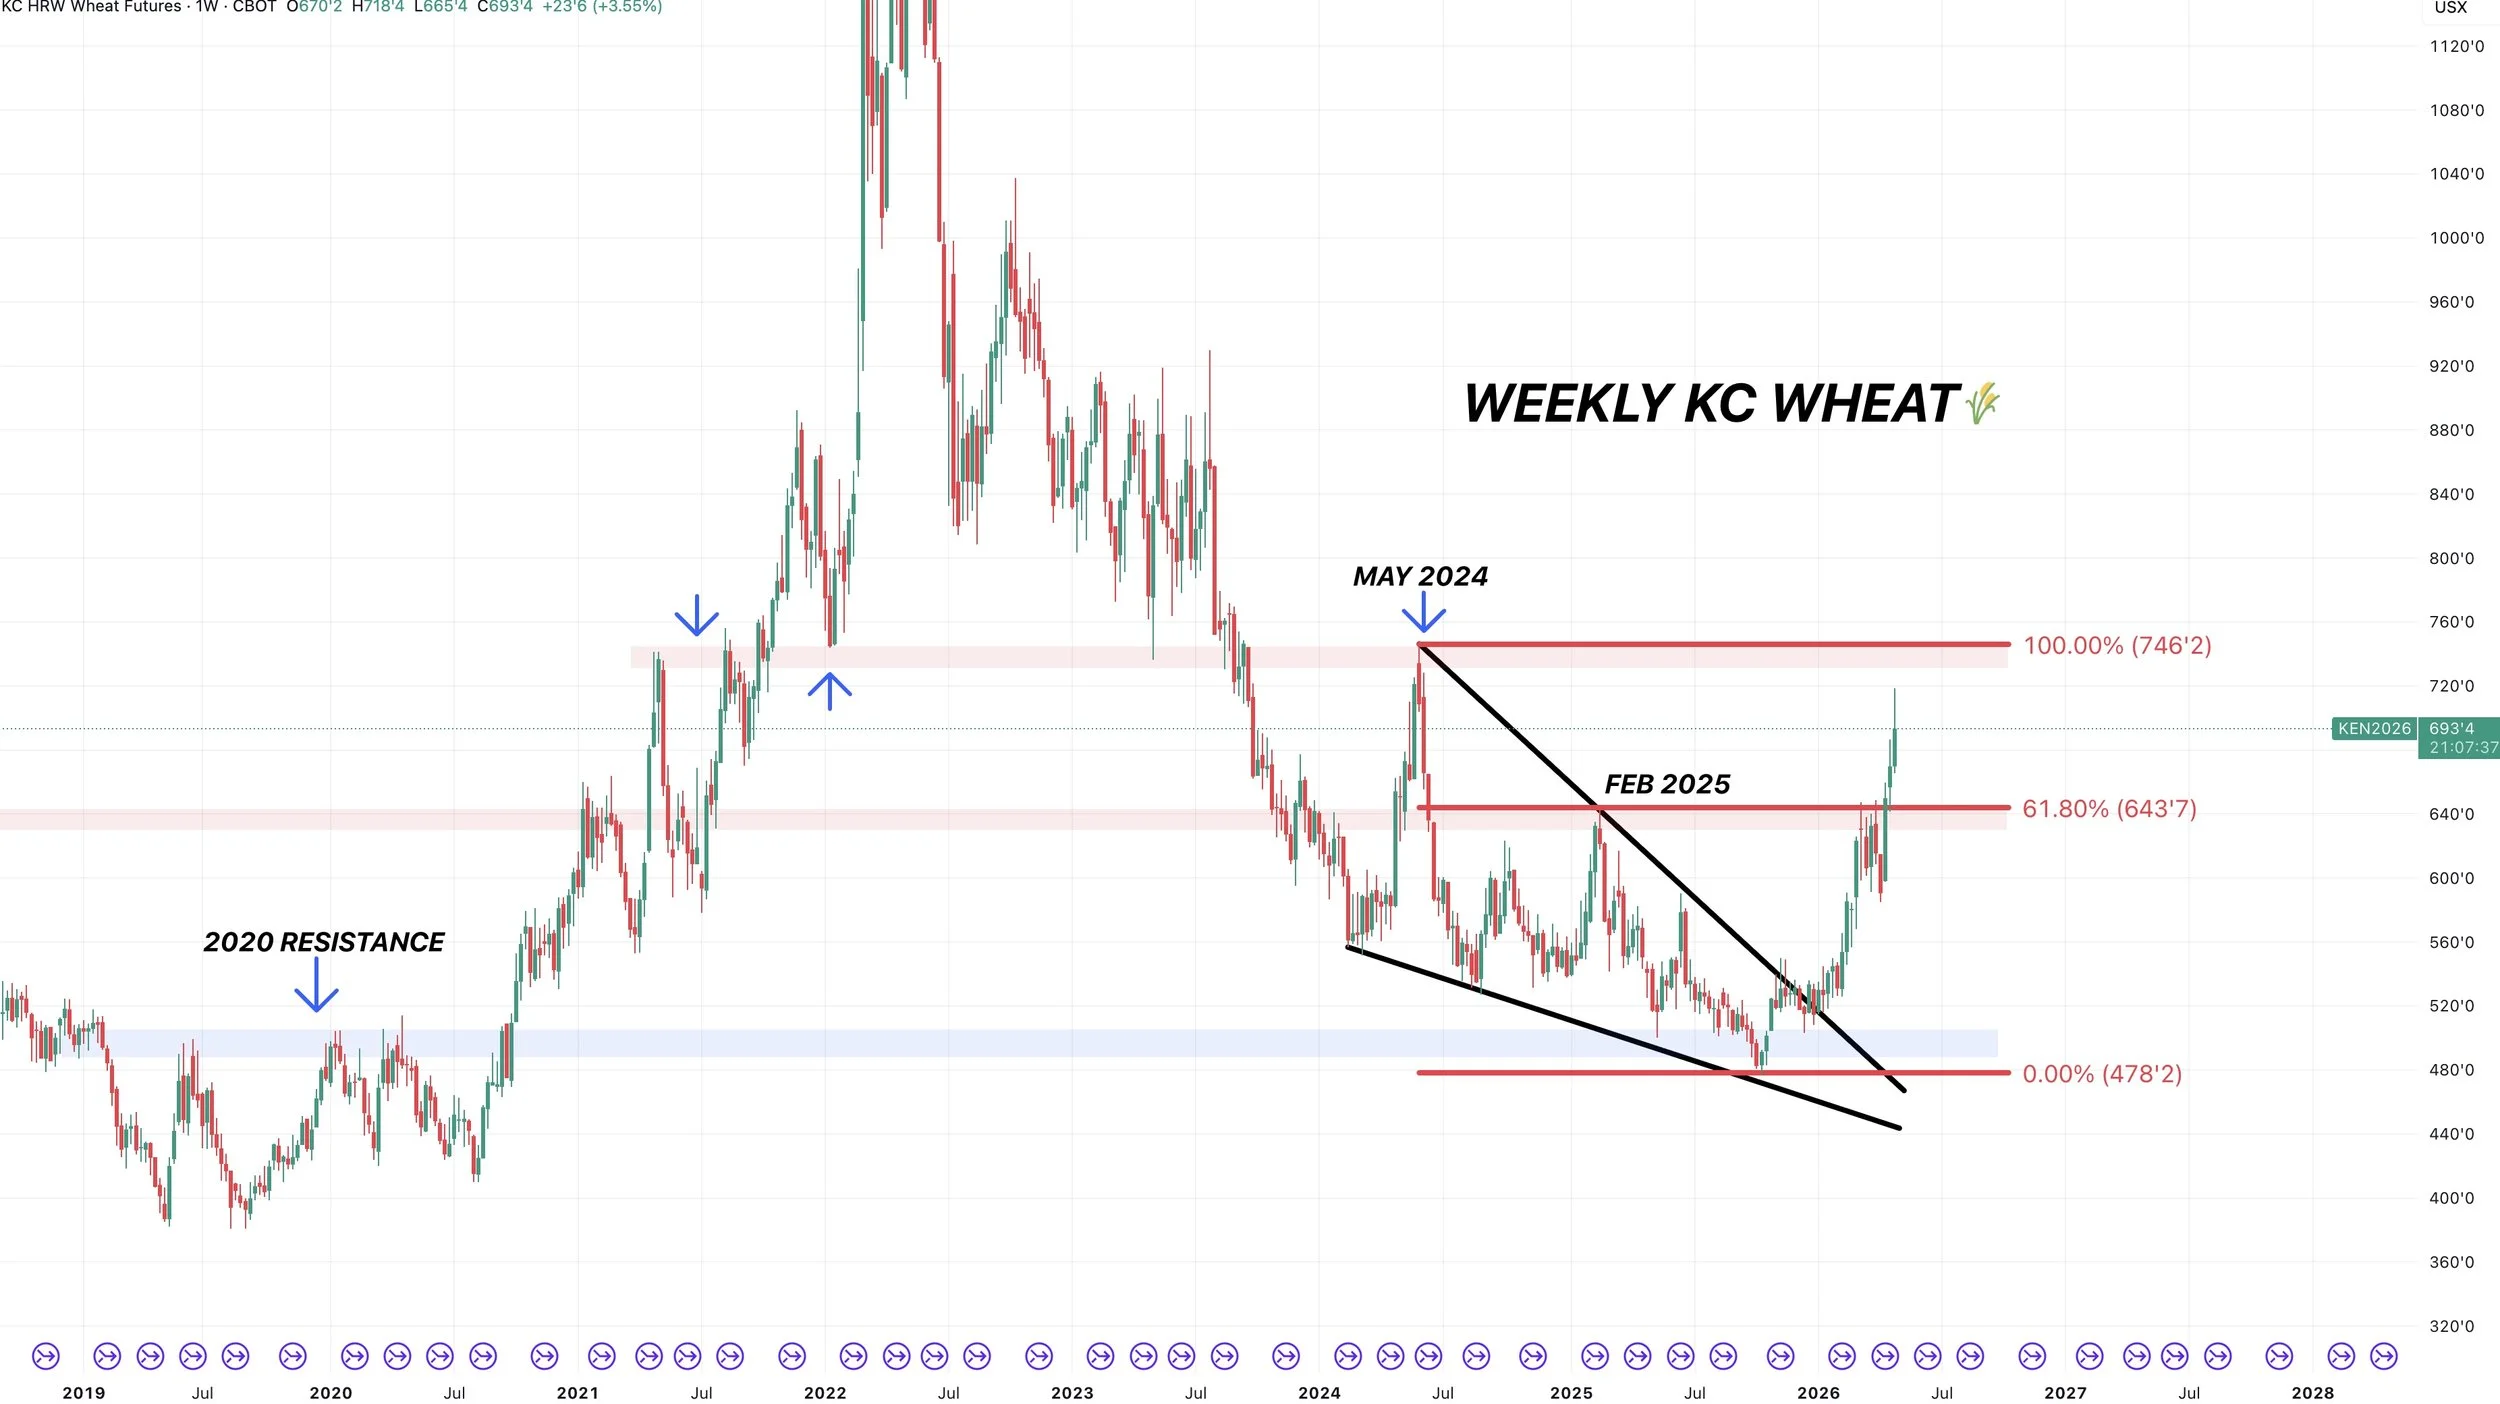
Front Month Chart:
Here is another reason $7.50 is the next target.
This is the continuous chart.
We broke above a major resistance level.
We cracked above those highs from last February. That same level was 61.8% of the highs from May 2024.
The next major resistance could be those May 2024 highs at $7.50
Long Term Trend Higher Now?
I showed these next charts earlier this week.
But I again wanted to show why I think wheat has put in a major long term low, and coulld very well have potentially shifted the long term trend higher.
That is not me saying wheat is going to $10.00 or anything like that. I am simply stating that I think the long term trend is now higher, after just having had a brutal downtrend for the last 5 years.
Here are the reasons:
The first would be that we posted our first higher high since 2022.
Every single rally for the last 4 years was a series of lower high after lower high until now.
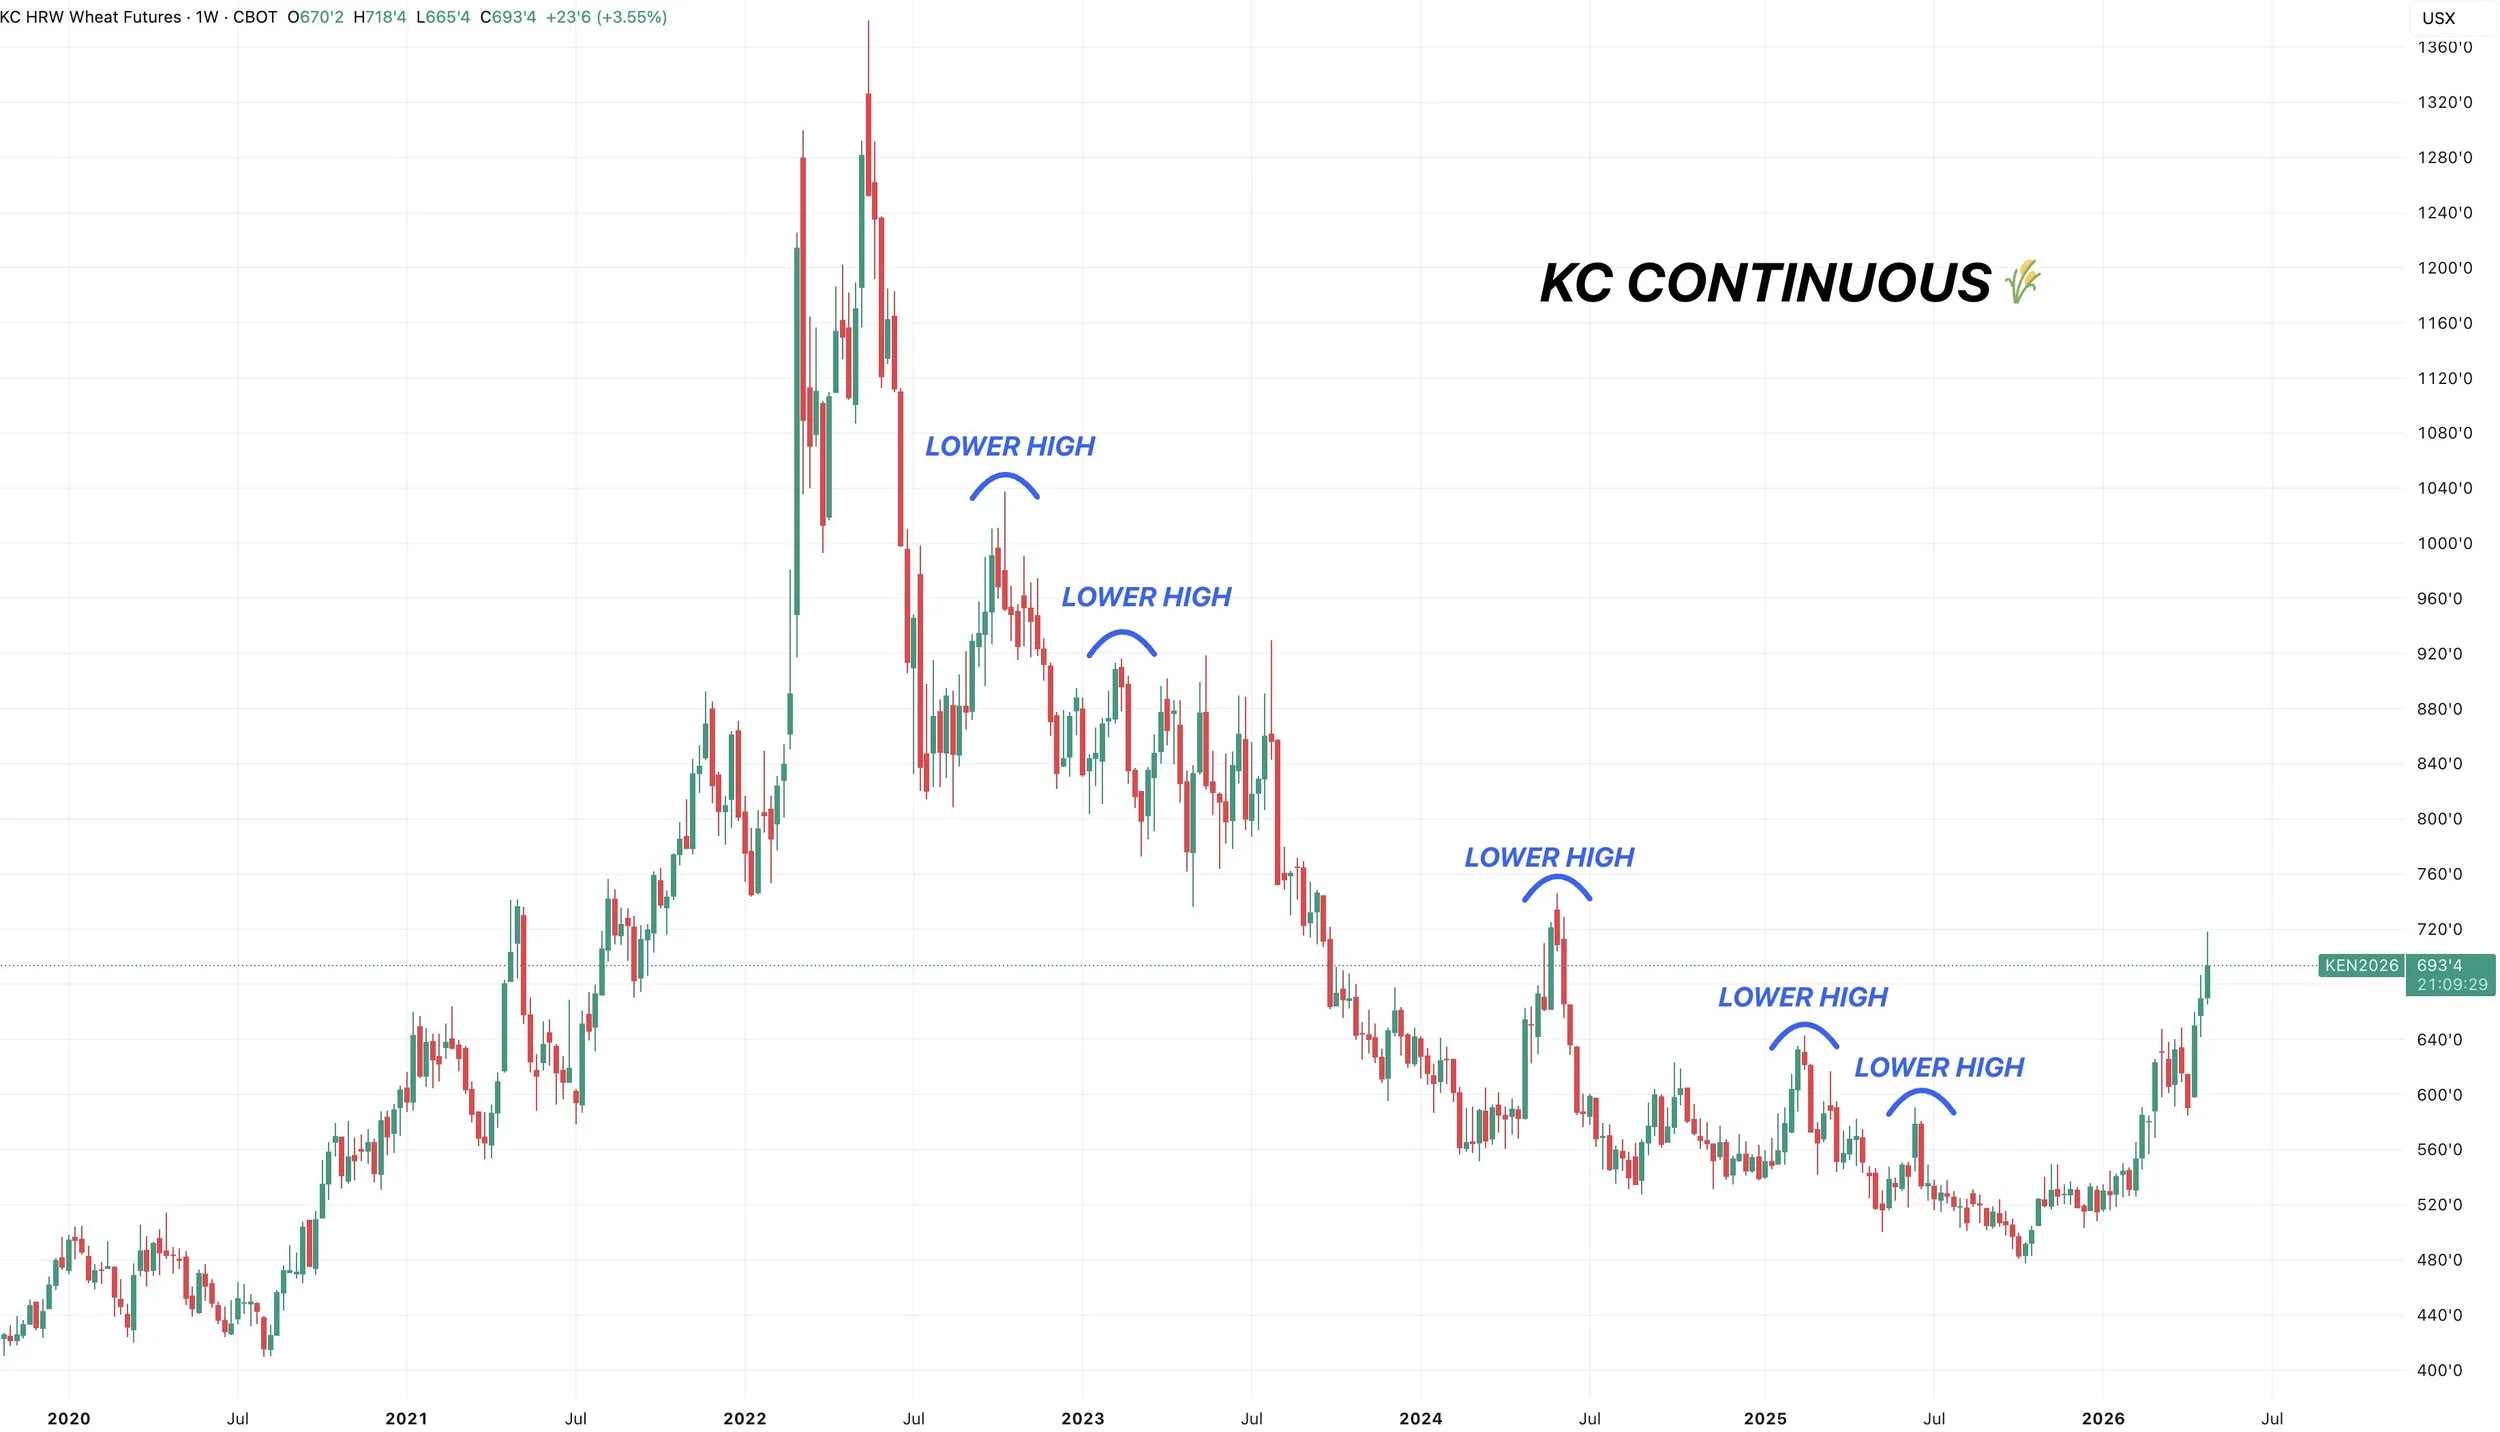
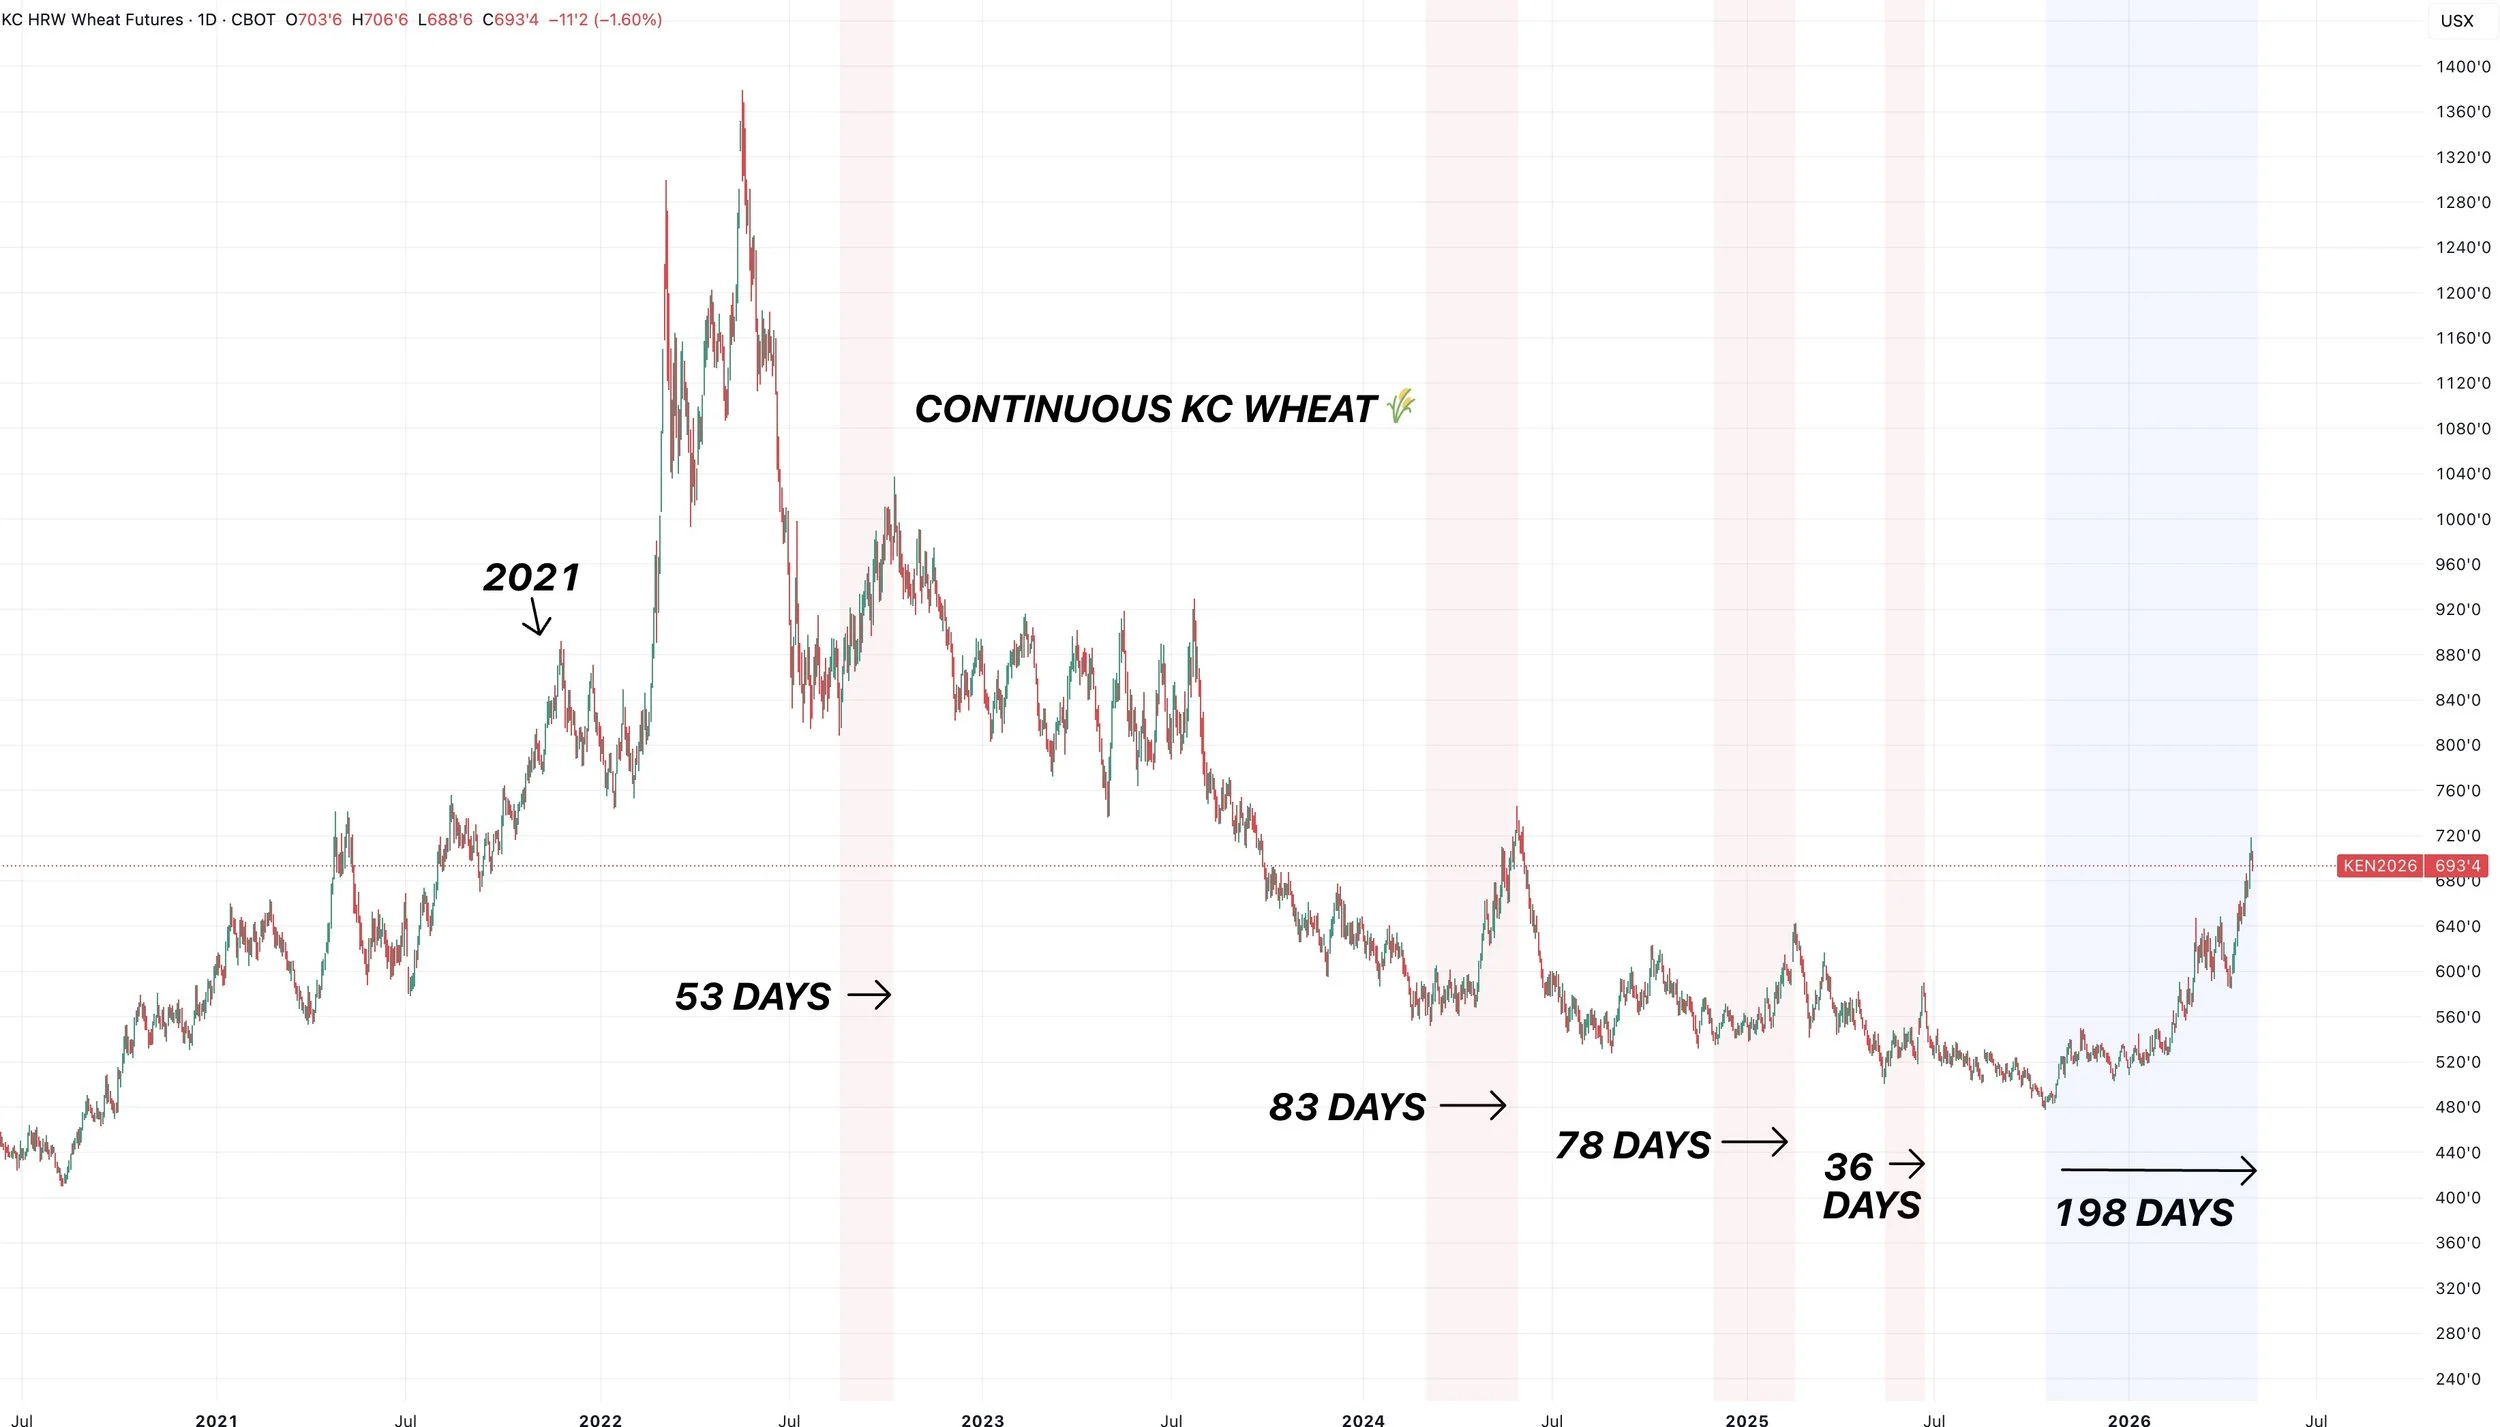
This is by far the longest sustained rally we've seen since 2022.
It is literally over double the length of the next longest one, which was back in May 2024.
This hasn’t been some random 1-2 month pop out of nowhere.
This has been a 6-month build up.
To me that seems like a change in the trend. Something we haven’t seen in 4 years.
Cattle
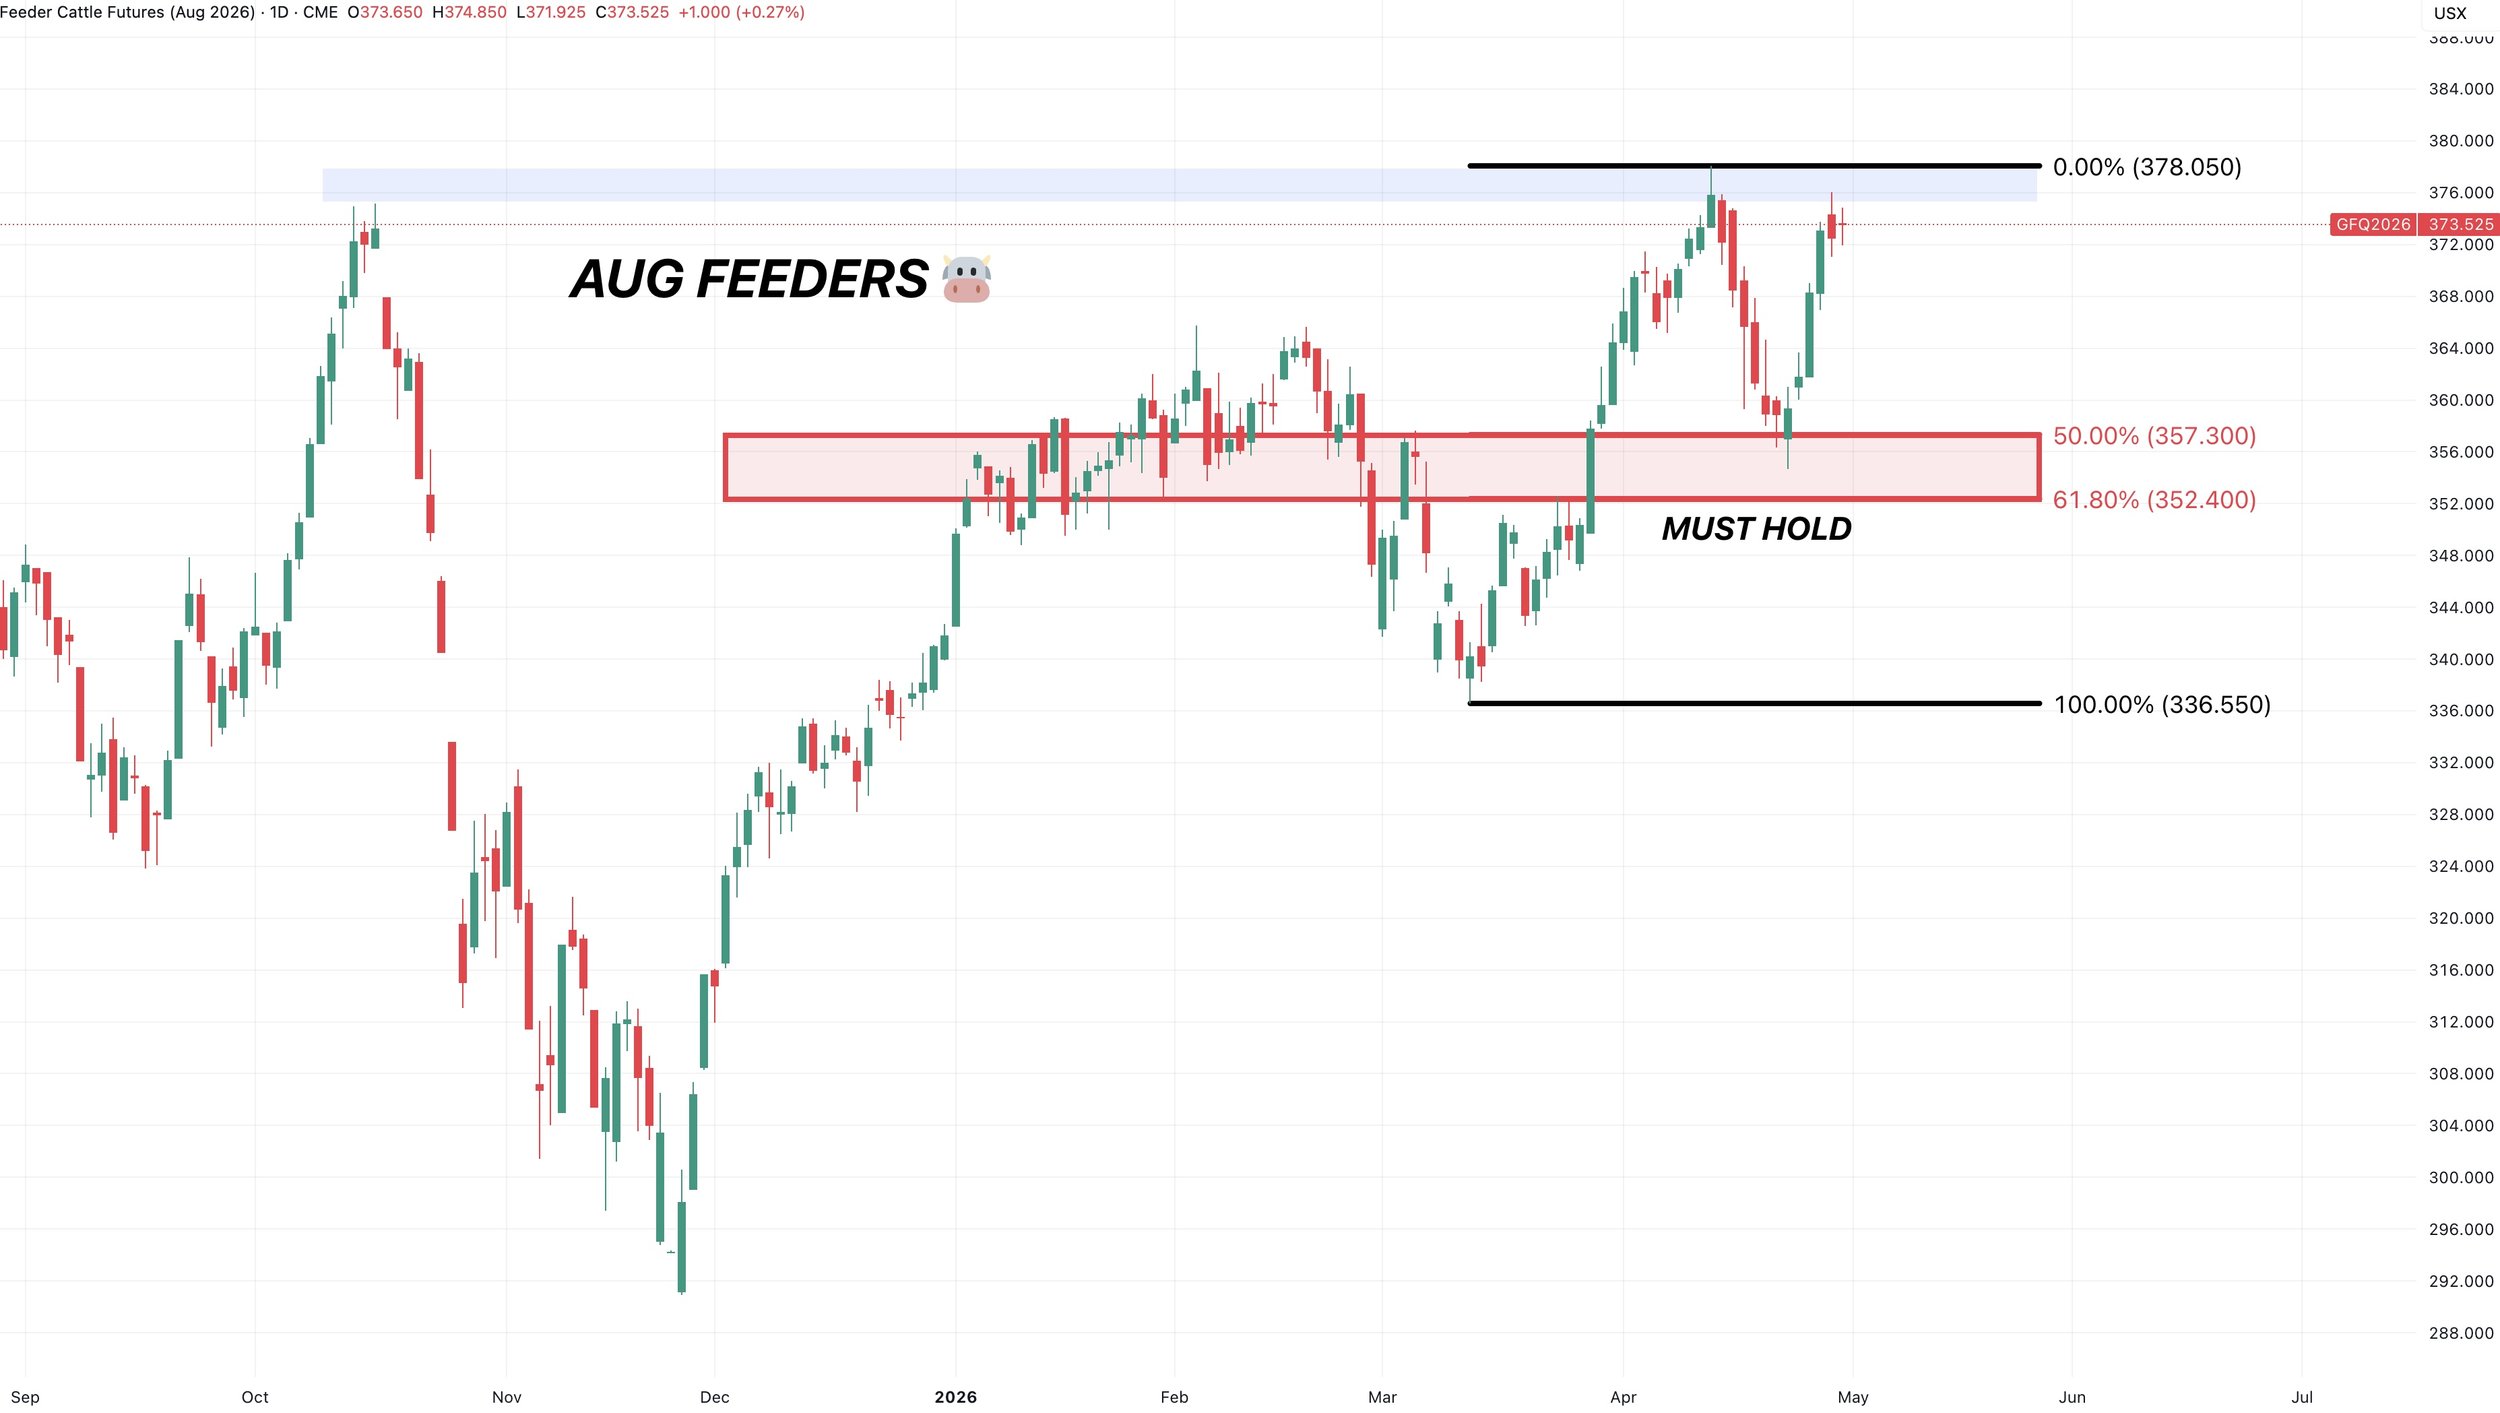
Aug Feeders Chart:
Feeders up against resistance and the prior highs.
Waiting to see if we reject here or push through.
Overall, the red box is still the line in the sand.
If you break below that, it wouldn’t be a good sign.
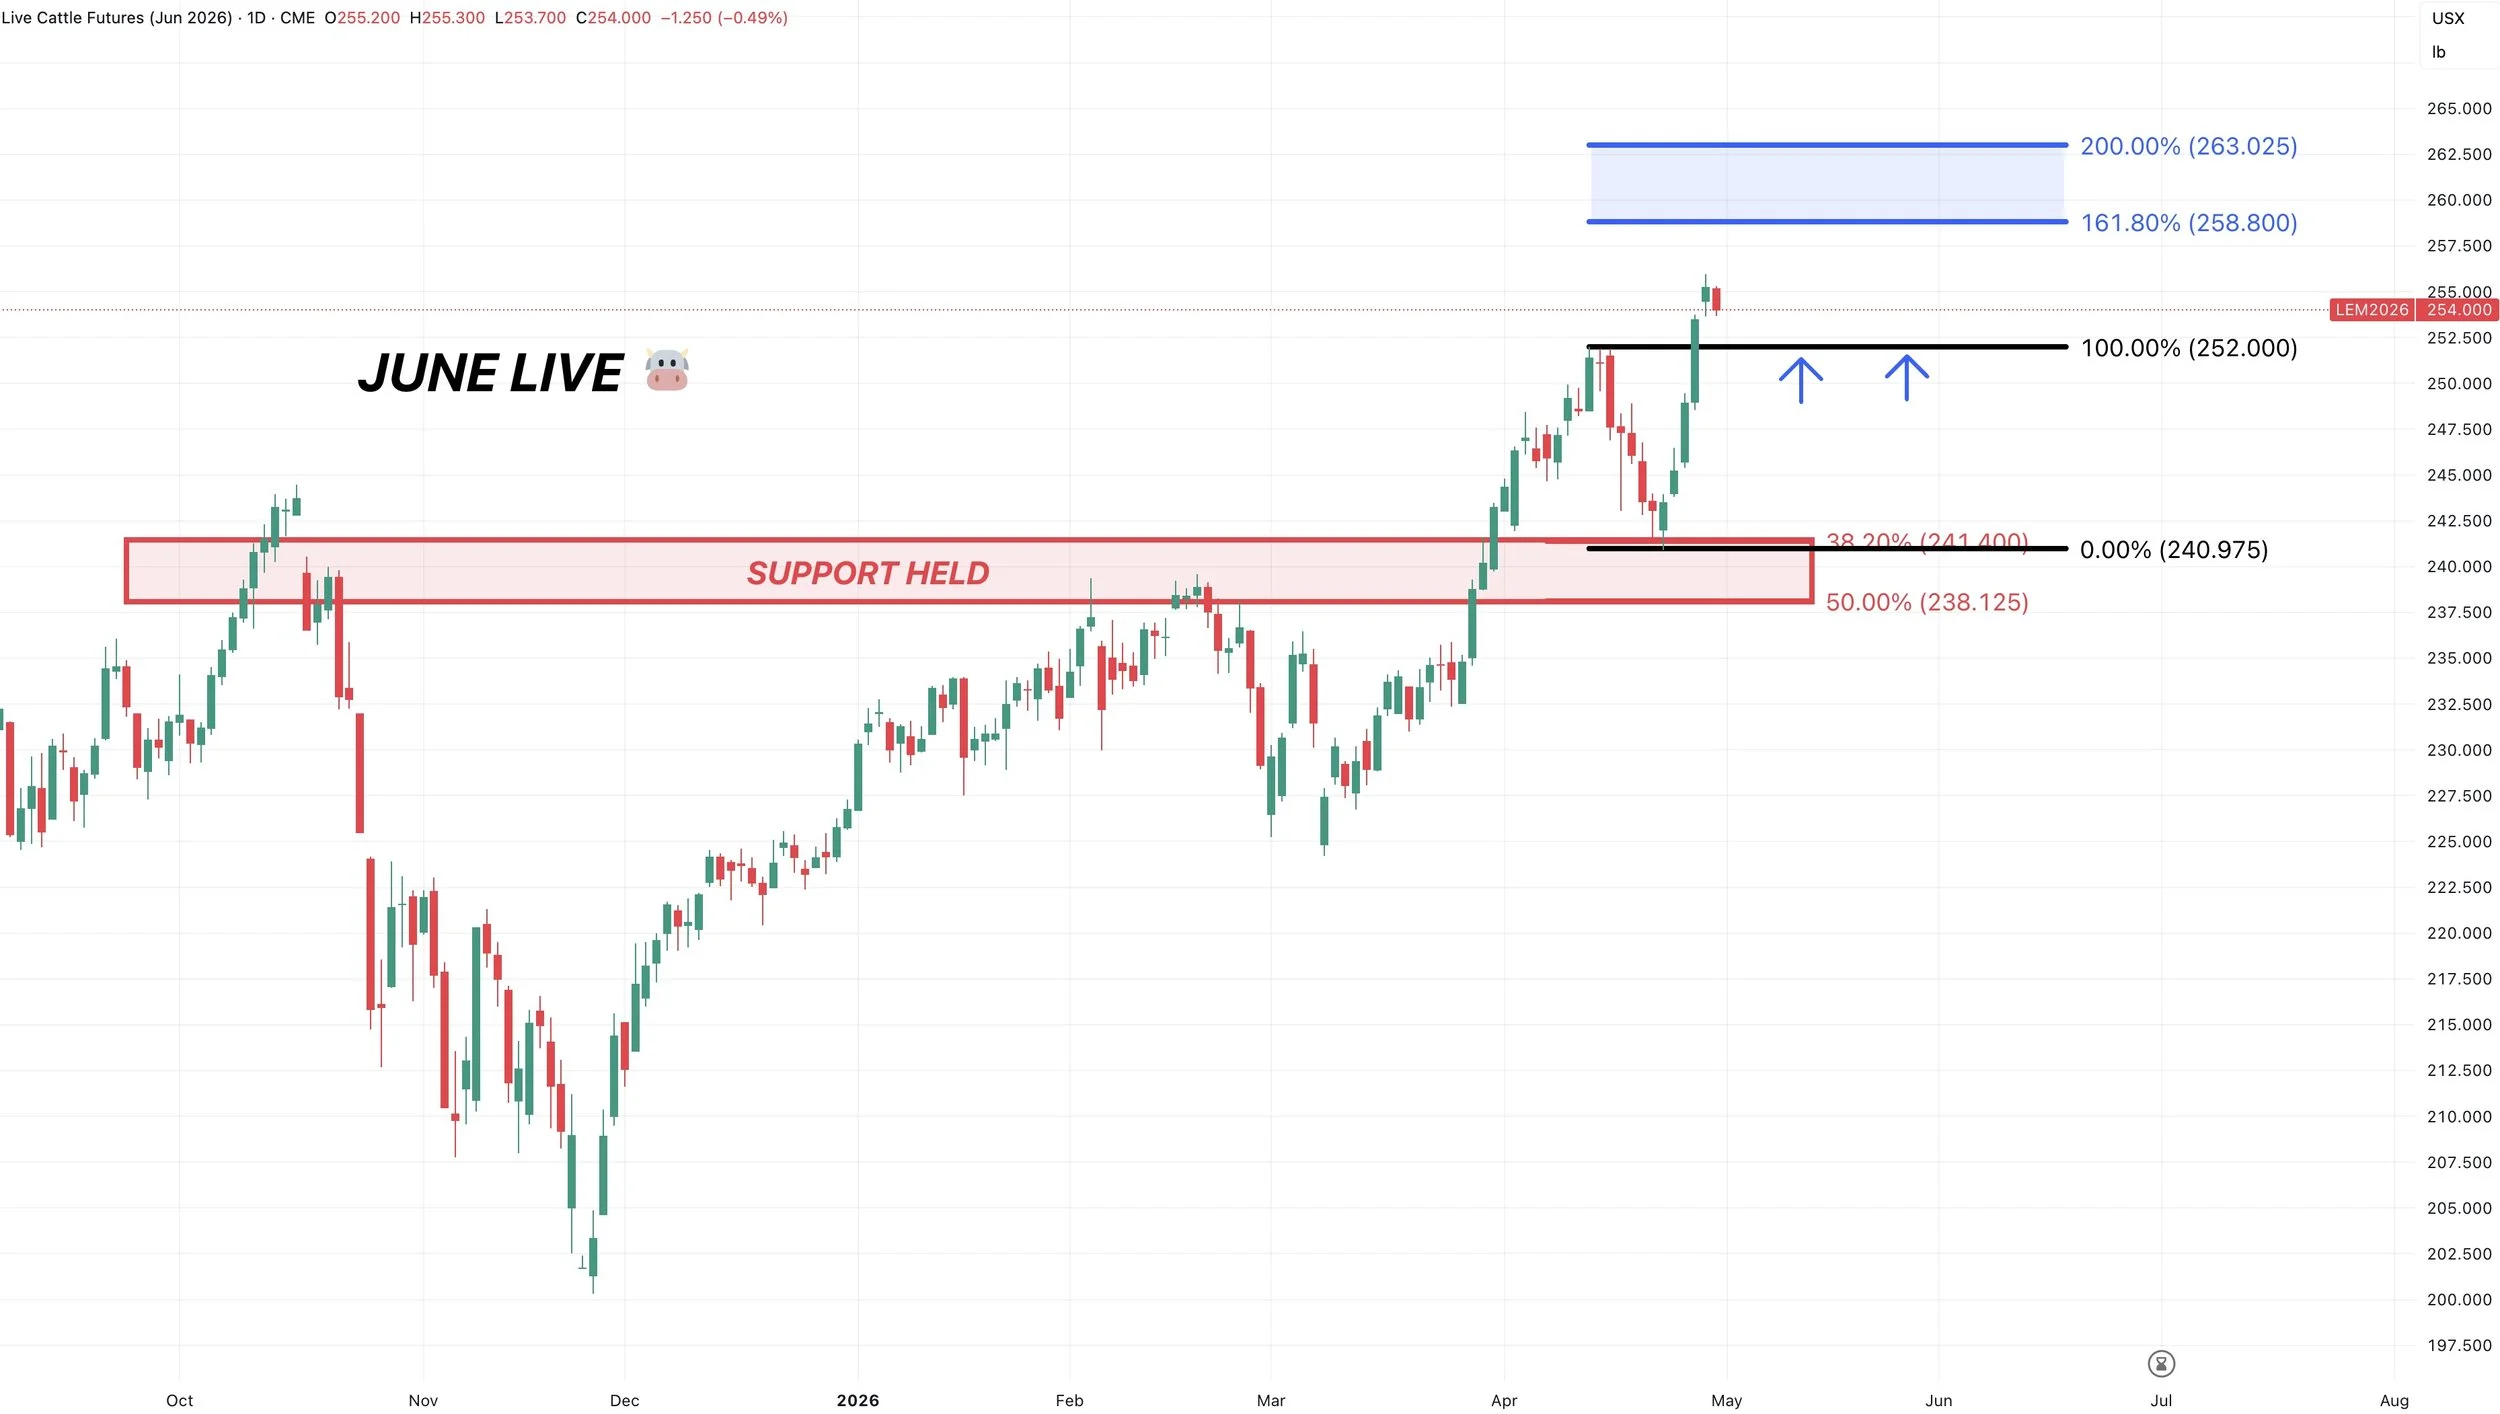
June Live Chart:
We bounced where we needed to and posted new highs.
The blue box and golden fib would be a common continuation target.
Short term would like to see us hold those April highs and turn that prior resistance into new support, to prevent us from falling back into the old range.
Want to Talk?
Our phones are open 24/7 for you guys if you ever need anything or want to discuss your operation.
Jeremey & Office: (806)484-1214
Sebastian: (605)280-1186
Email: sfrost@dailymarketminute.com
Hedge Account
Interested in a hedge account? Use the link below to set up an account or give us a call.
Recent Signals
April 28th, 2026: 🌾
KC wheat specific signal.
CLICK HERE TO VIEW
April 27th, 2026: 🌽
Corn catch up sell signal.
CLICK HERE TO VIEW
April 10th, 2026: 🌽
Corn buy signal.
CLICK HERE TO VIEW
March 19th, 2026: 🌱
New crop soybeans signal & hedge alert.
CLICK HERE TO VIEW
March 9th, 2026: 🌱
Soybeans signal & hedge alert. Sent via text.
March 6th, 2026: 🌽 🌾
Corn & wheat sell signal & hedge alert.
March 3rd, 2026: 🌽
Old crop & new crop corn sell signal & hedge alert.
Feb 26th, 2026: 🌱
Old crop & new crop beans sell signal & hedge alert.
Feb 19th, 2026: 🌾
KC wheat sell signal & hedge alert.
Feb 6th, 2026: 🌽 🌱
Old crop corn & soybean sell signal & hedge alert.
Feb 4th, 2026: 🌱
Soybean sell signal & hedge alert.
Nov 17th, 2025: 🌱
Soybean sell signal & hedge alert.