
CEASEFIRE & CRUCIAL SPOTS TO HOLD
MARKET UPDATE
No video update today, only the written version.
I attempted to record today's video several times but the software I use is down.
I will try to find a resolution for Thursday's update. I apologize for the inconvenience.
Futures Prices Close (Crude Updated @6:30pm CT)
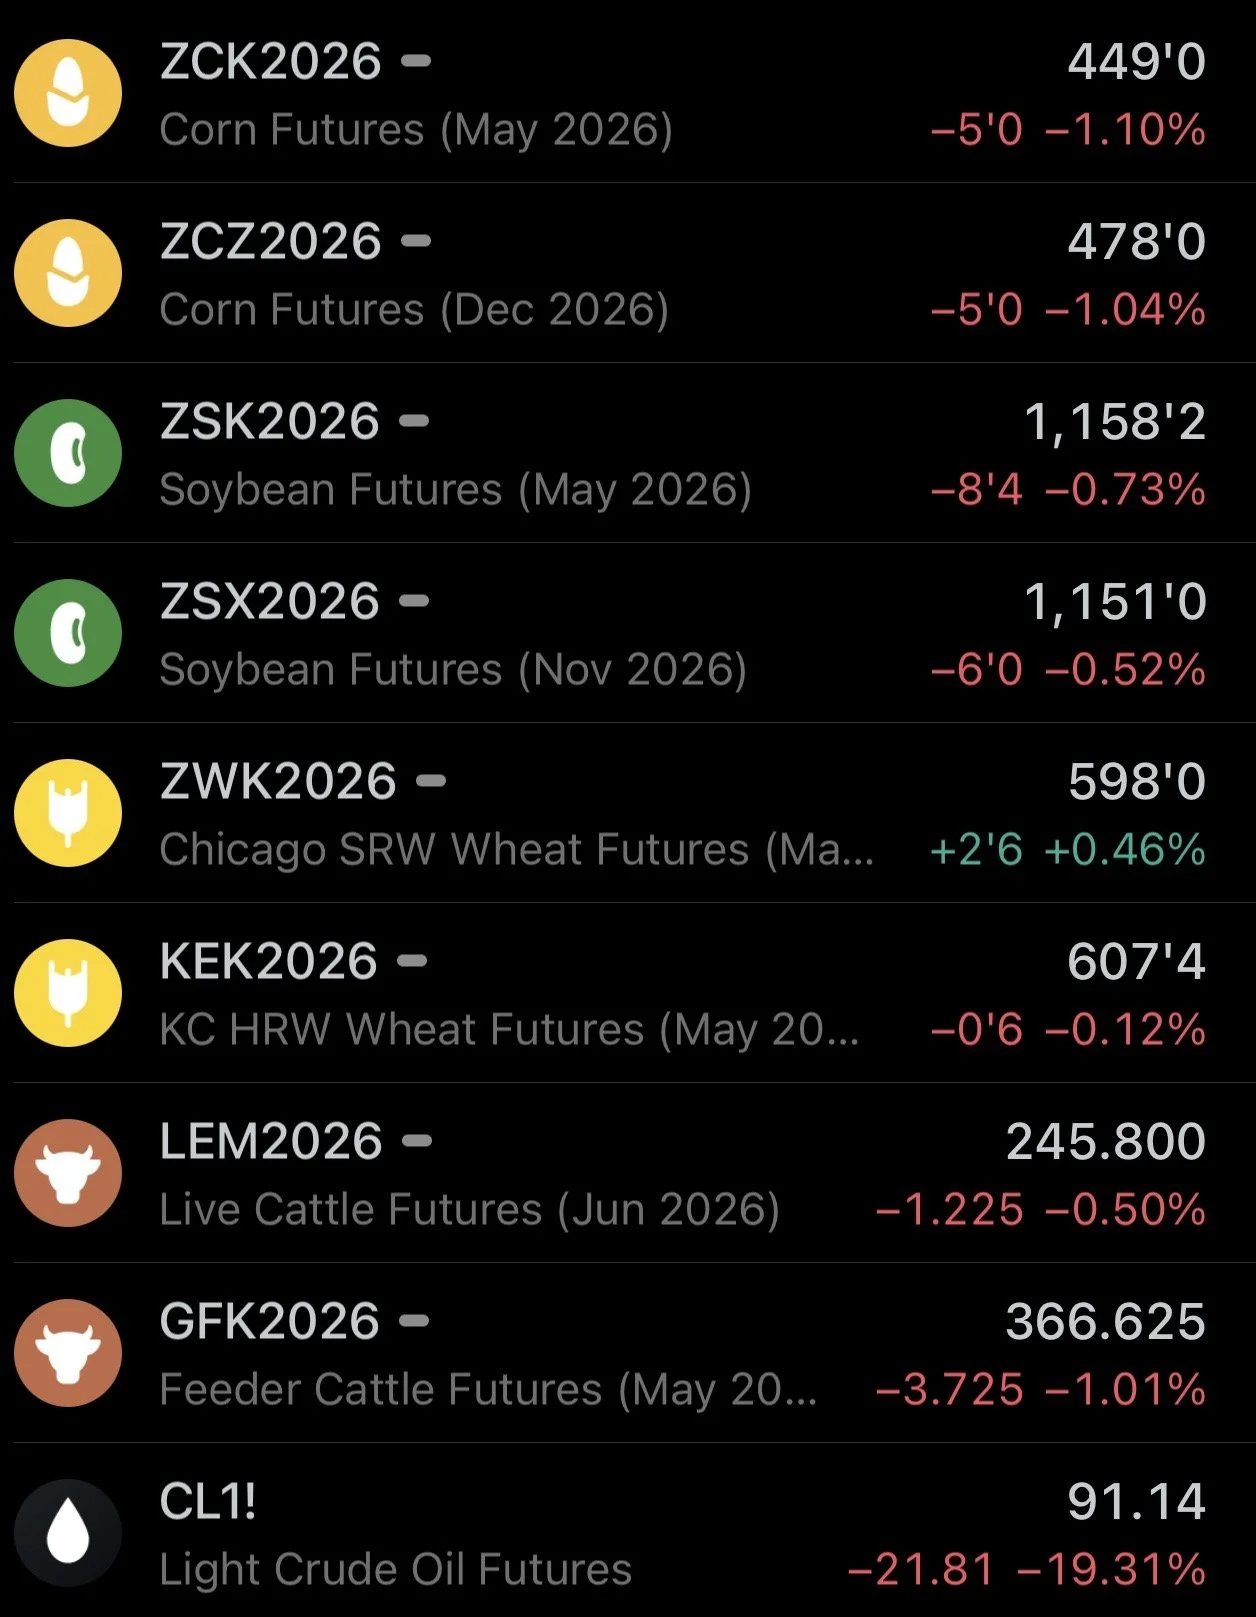
Overview
Ugly day across the board for everything.
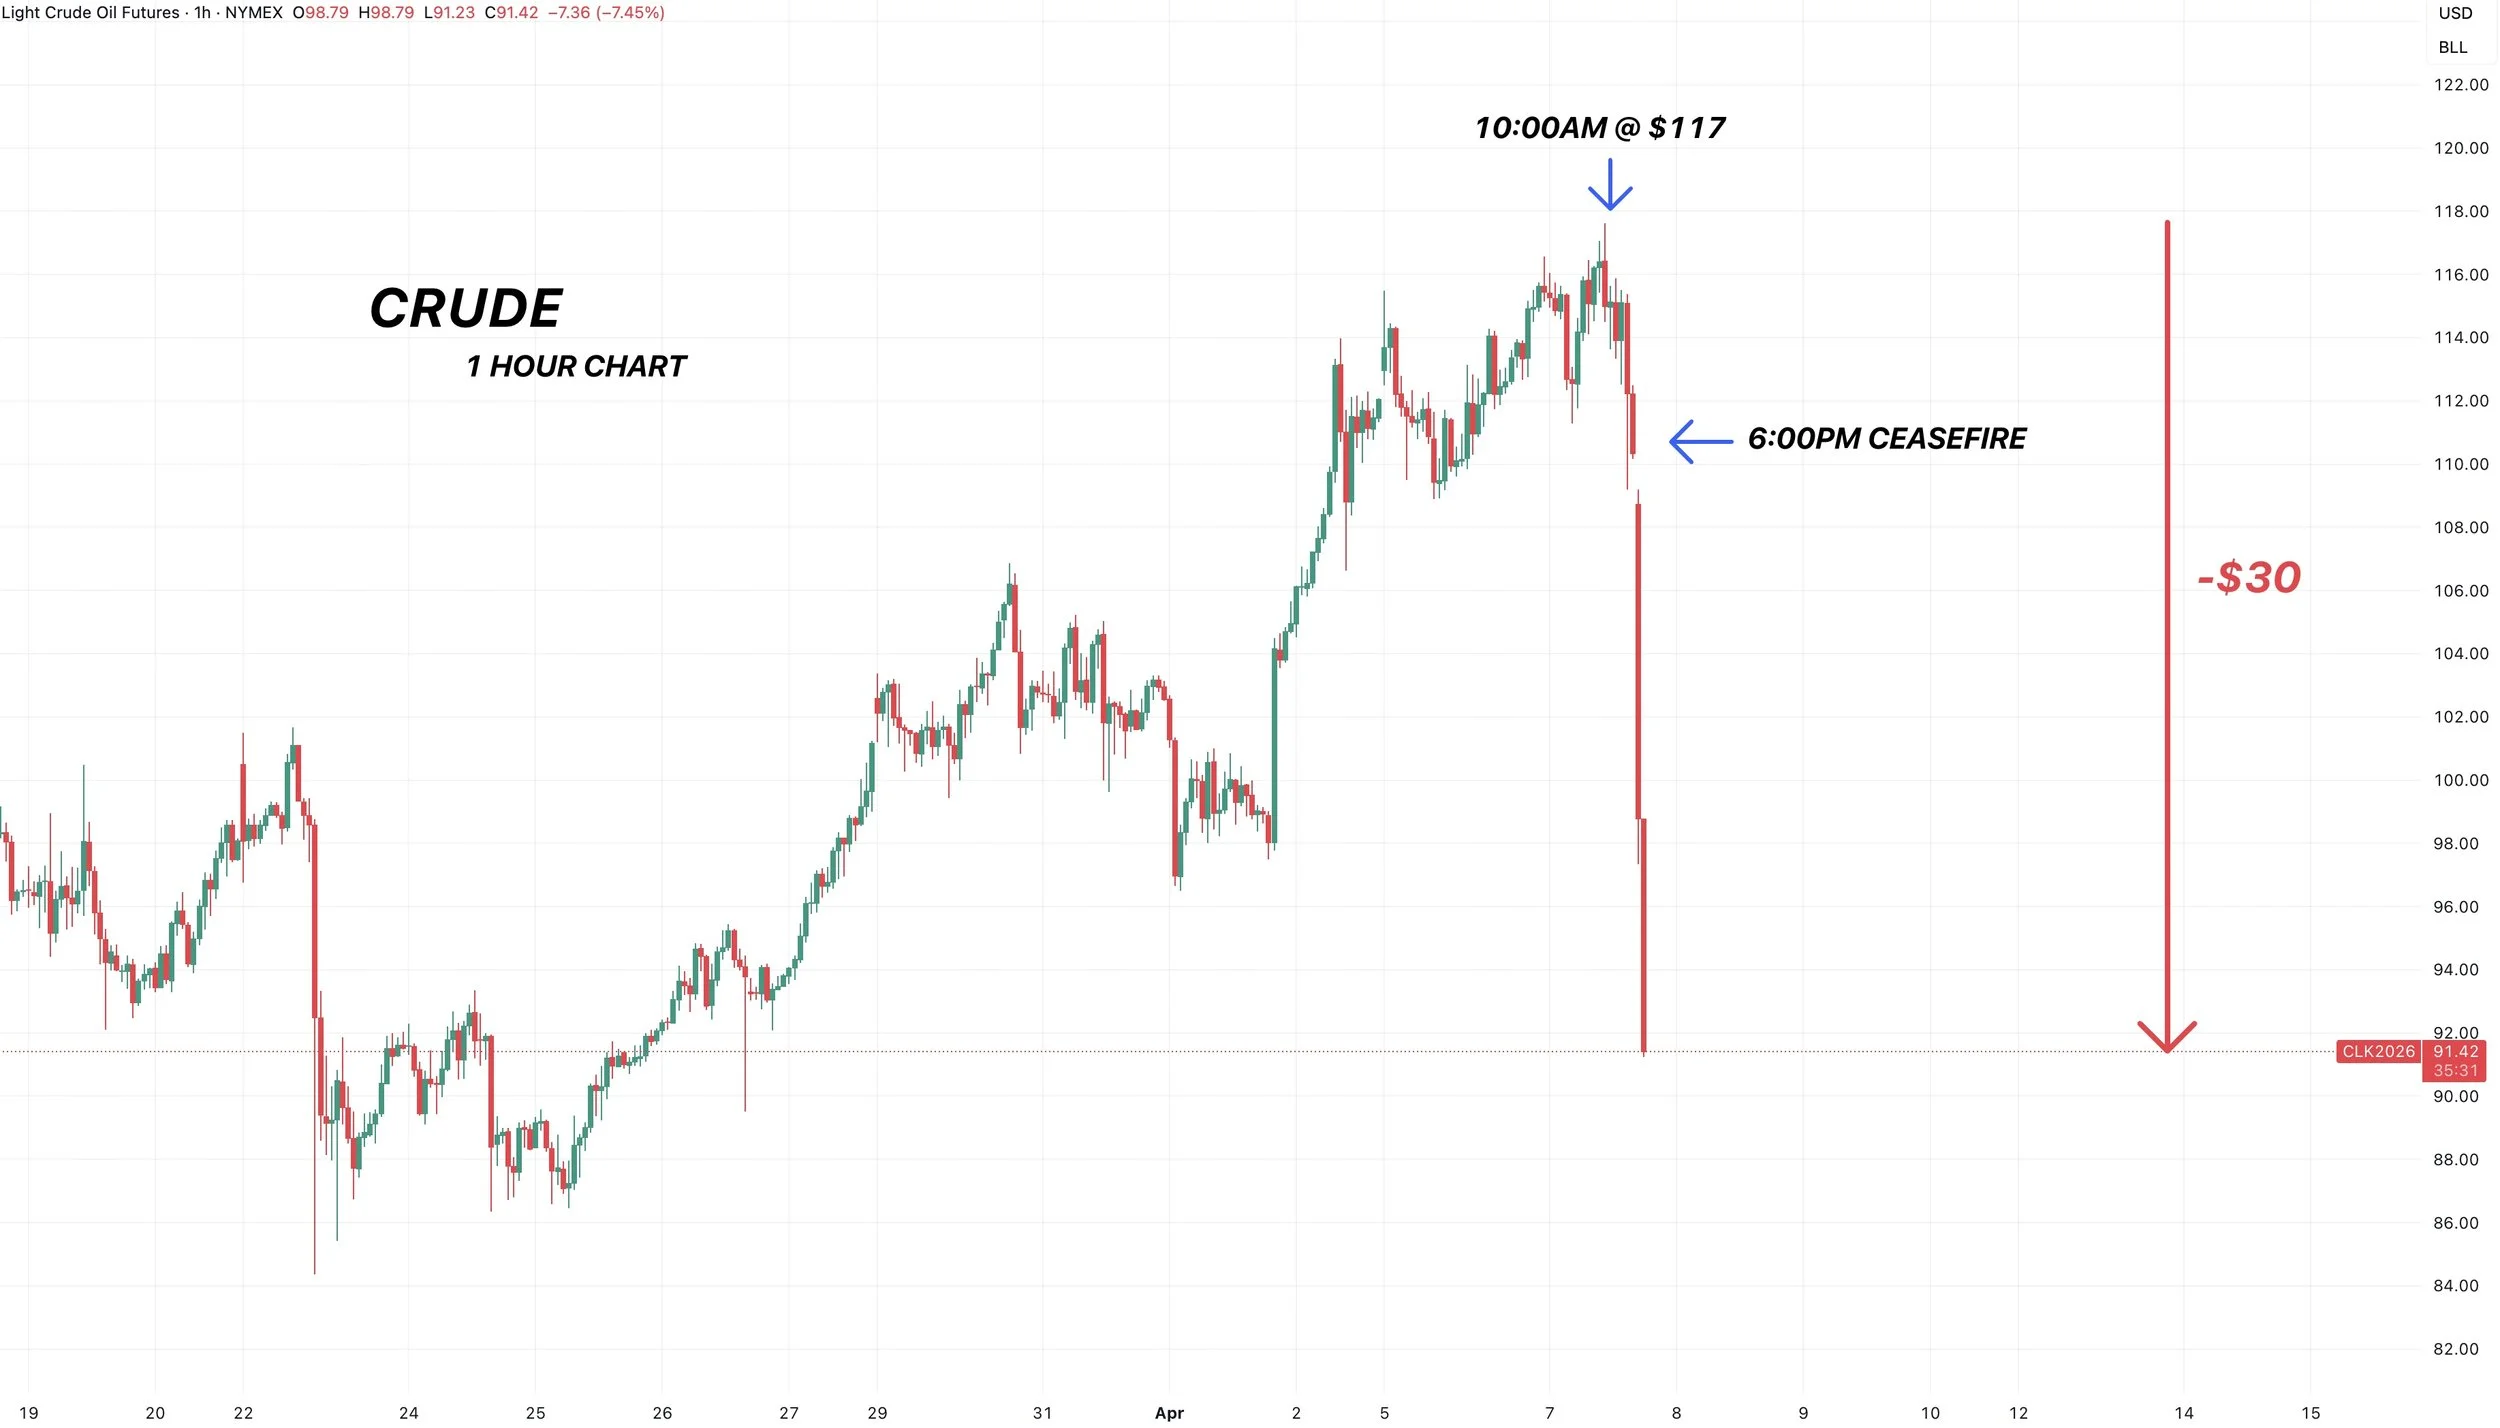
Crude oil traded nearly as high as $118 this morning.
When the grains closed it was trading around $115.
We started tanking at 6:00pm CT. As I am writing this it's trading at nearly $90 and roughly -$25 off the highs from earlier today.
That is an utterly massive swing and sell off.
Why the drop?
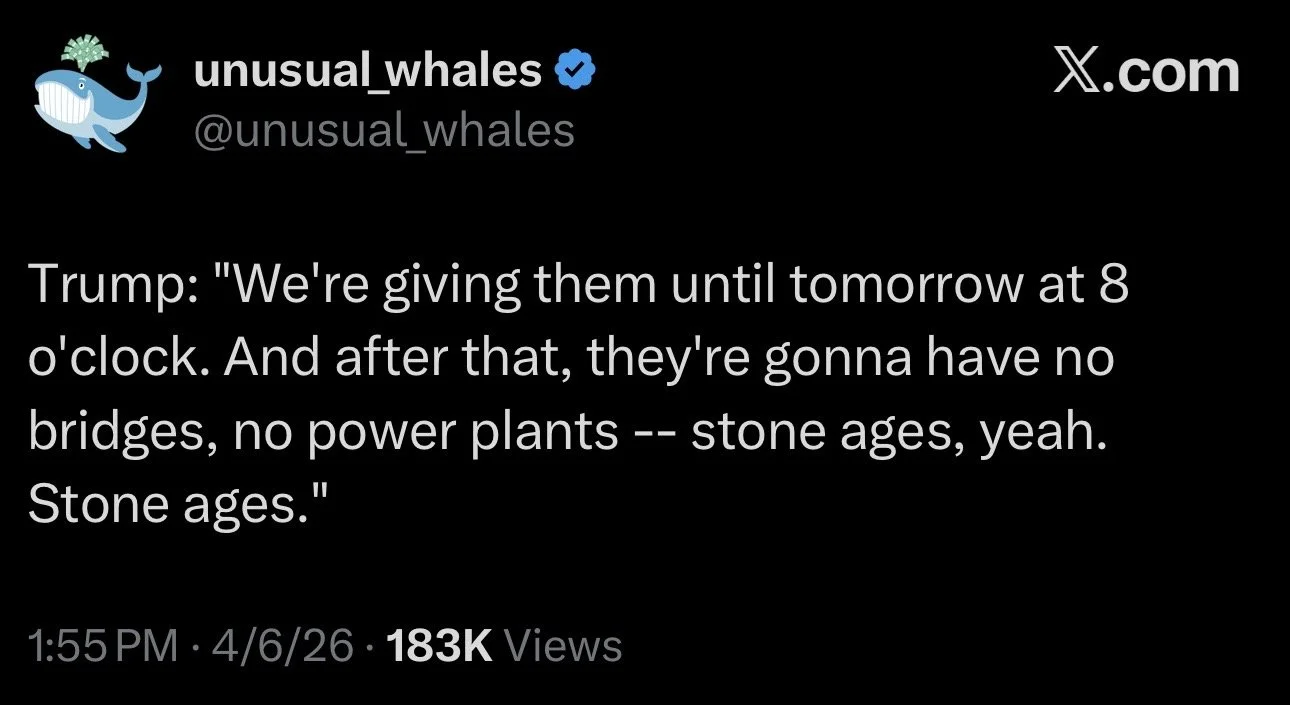
Tonight was Trump's deadline for Iran to make a make to a deal.
Yesterday he said that if they didn’t make a deal by tonight he would "send them back to the stone ages" and unleash "heavy attacks".
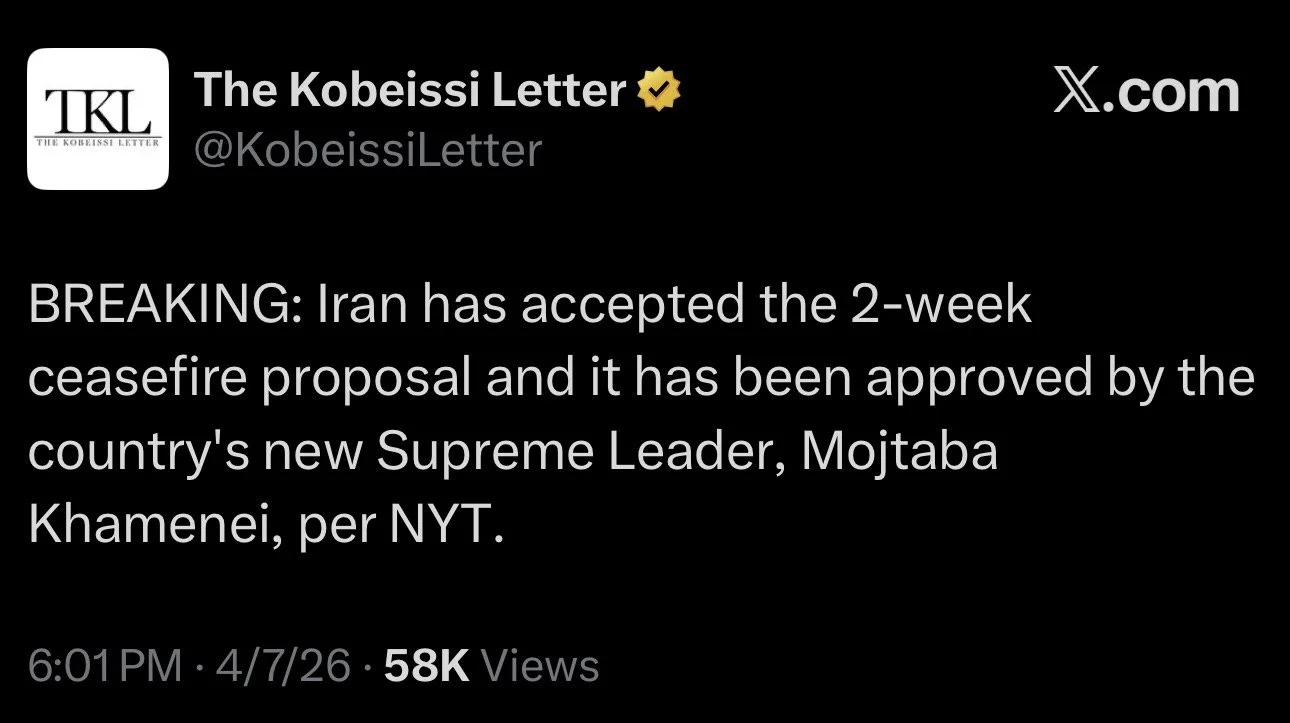
2-Week Ceasefire
Then at 5:30pm CT tonight, Trump sent a 2-week ceasefire proposal to Iran.
He said the US will suspend it's attacks on Iran for 2 weeks if Iran will re-open the strait of Hormuz.
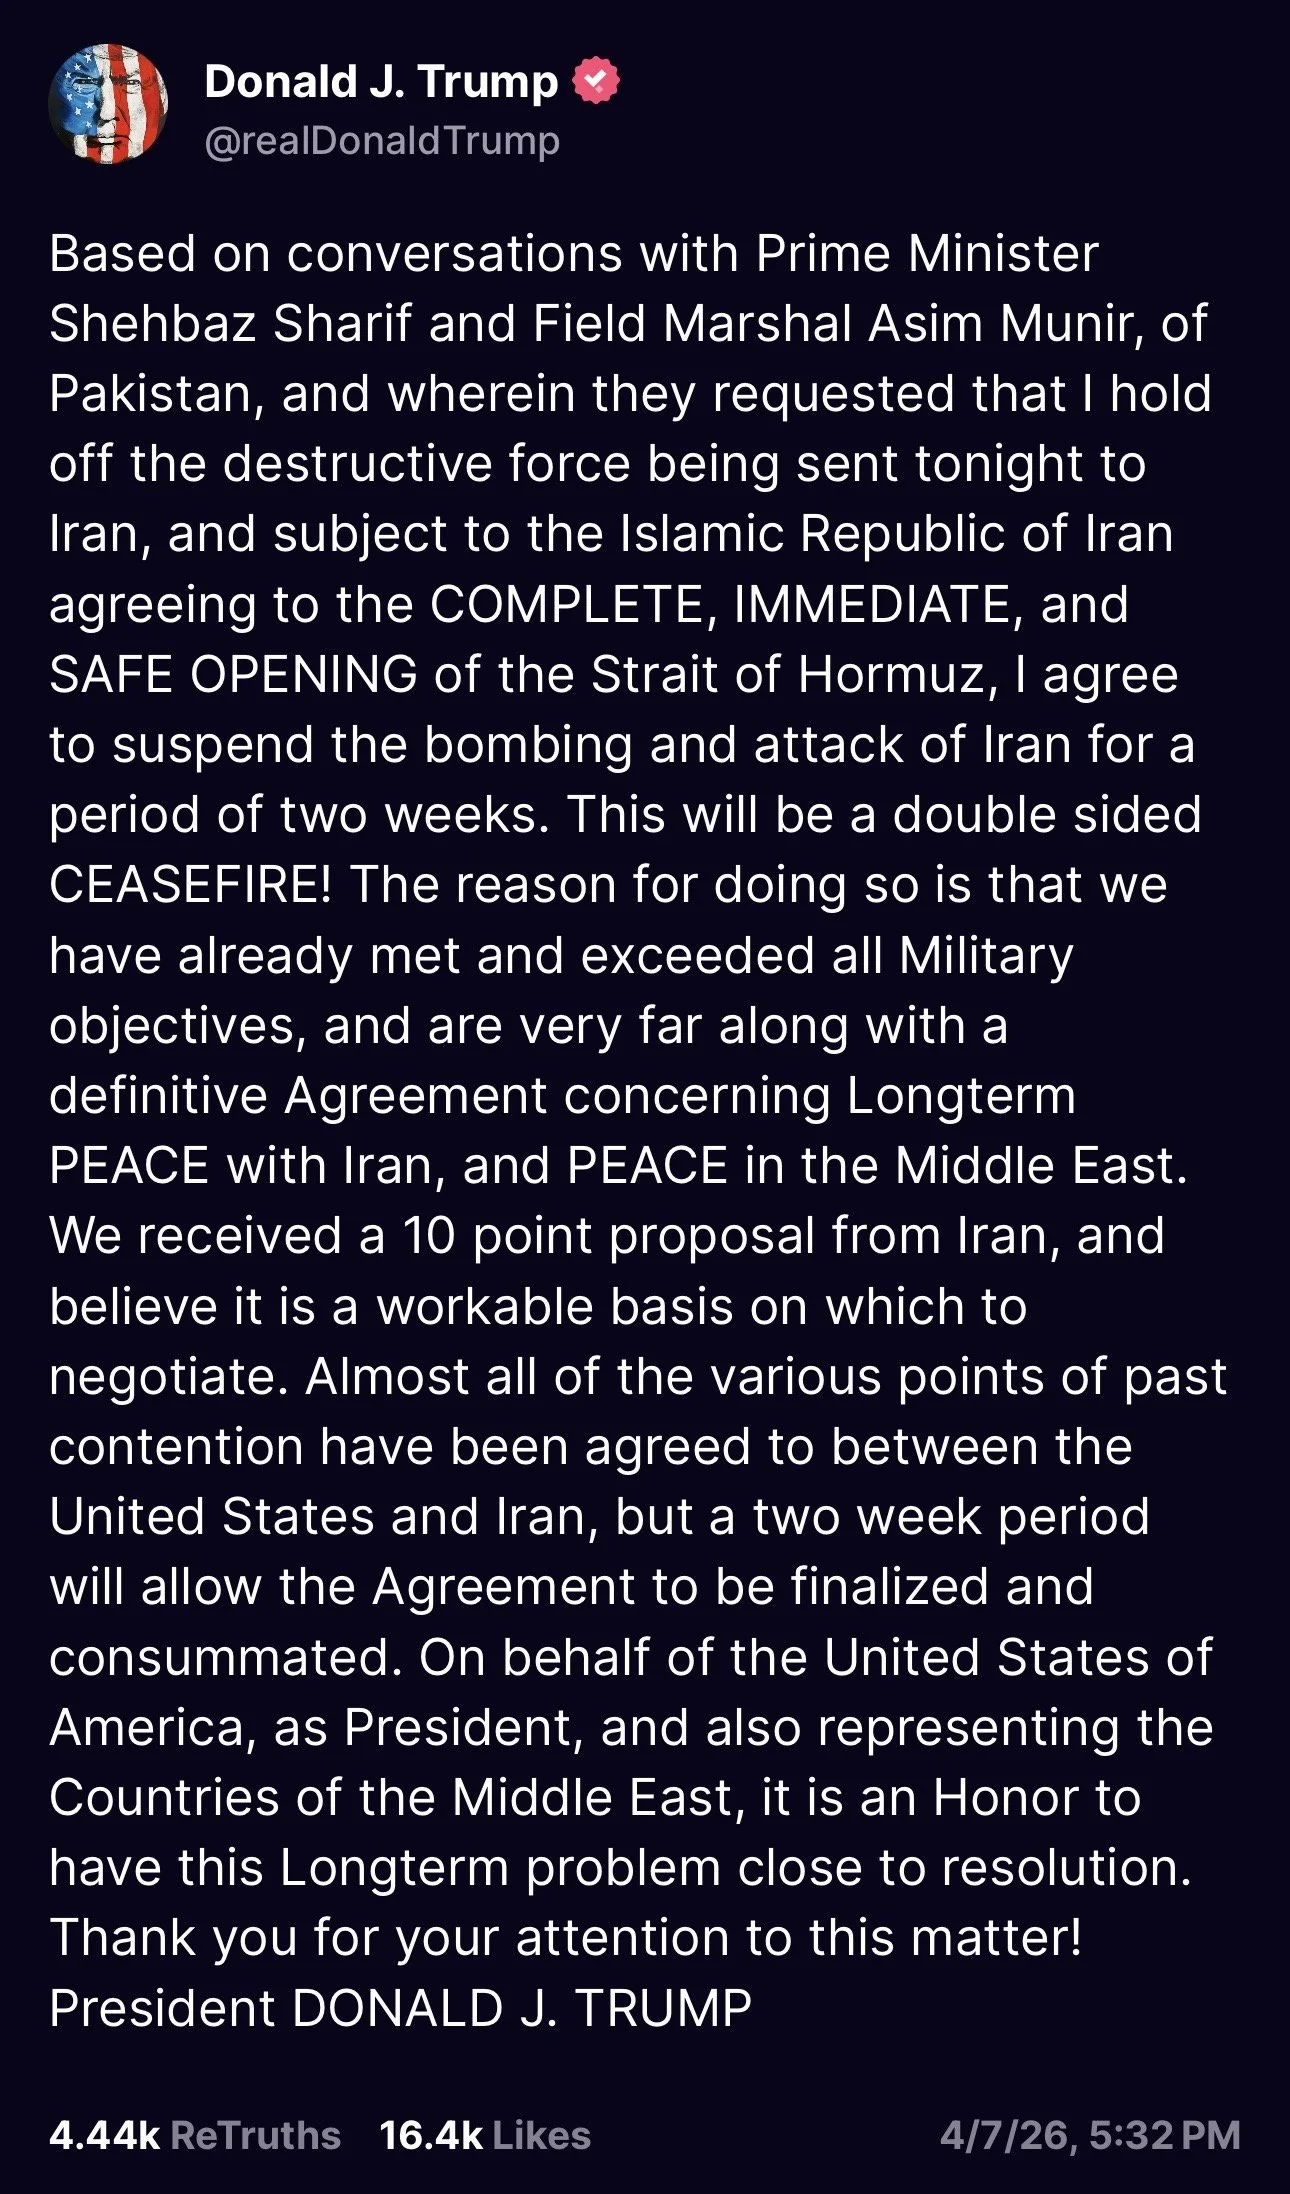
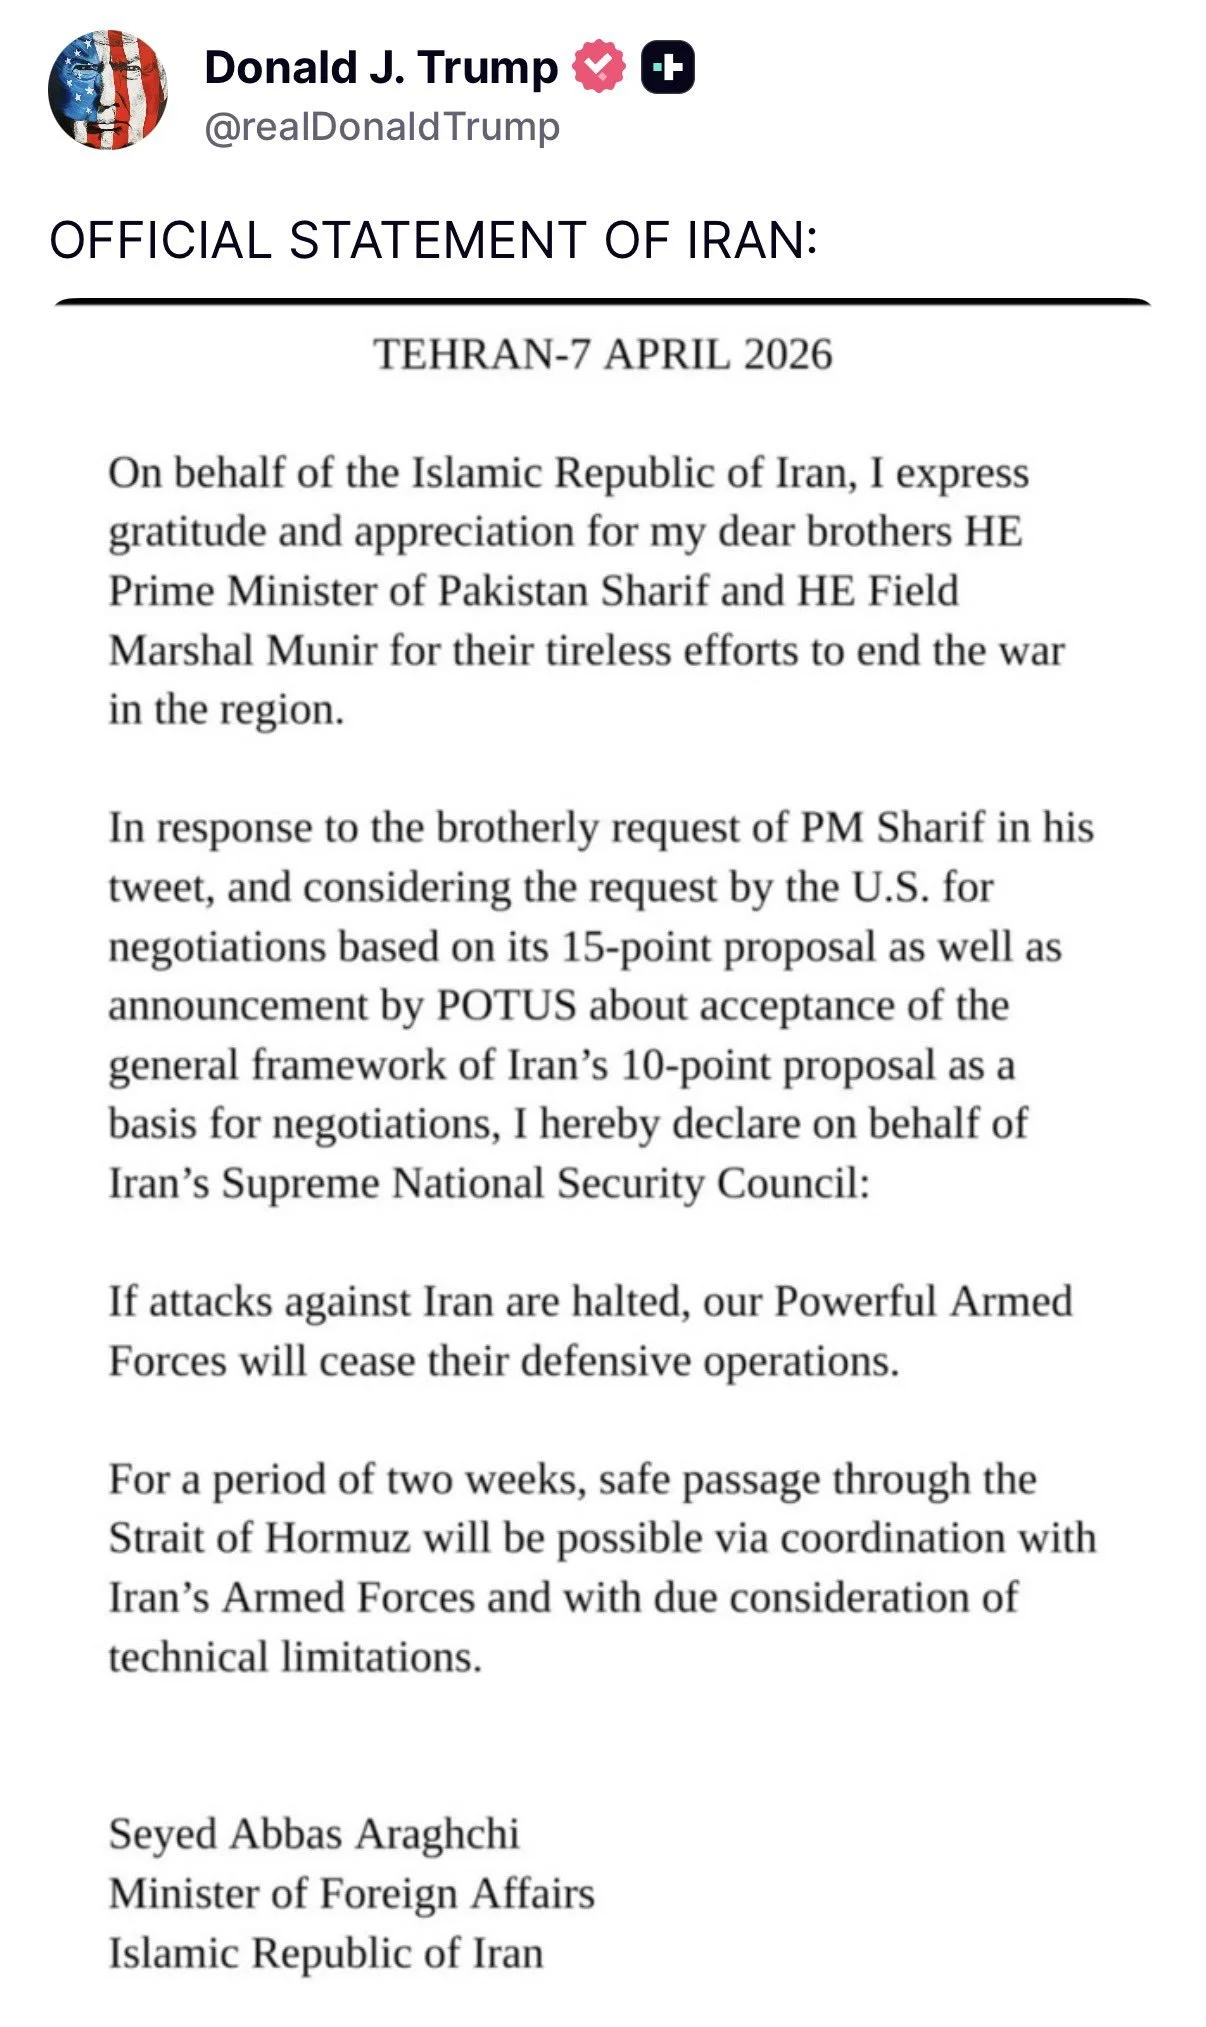
Iran then shortly accepeted the 2-week ceasefire proposal just 30 minutes later.
Here is the offical statement from Iran. They’ve agreed to re-open the strait.
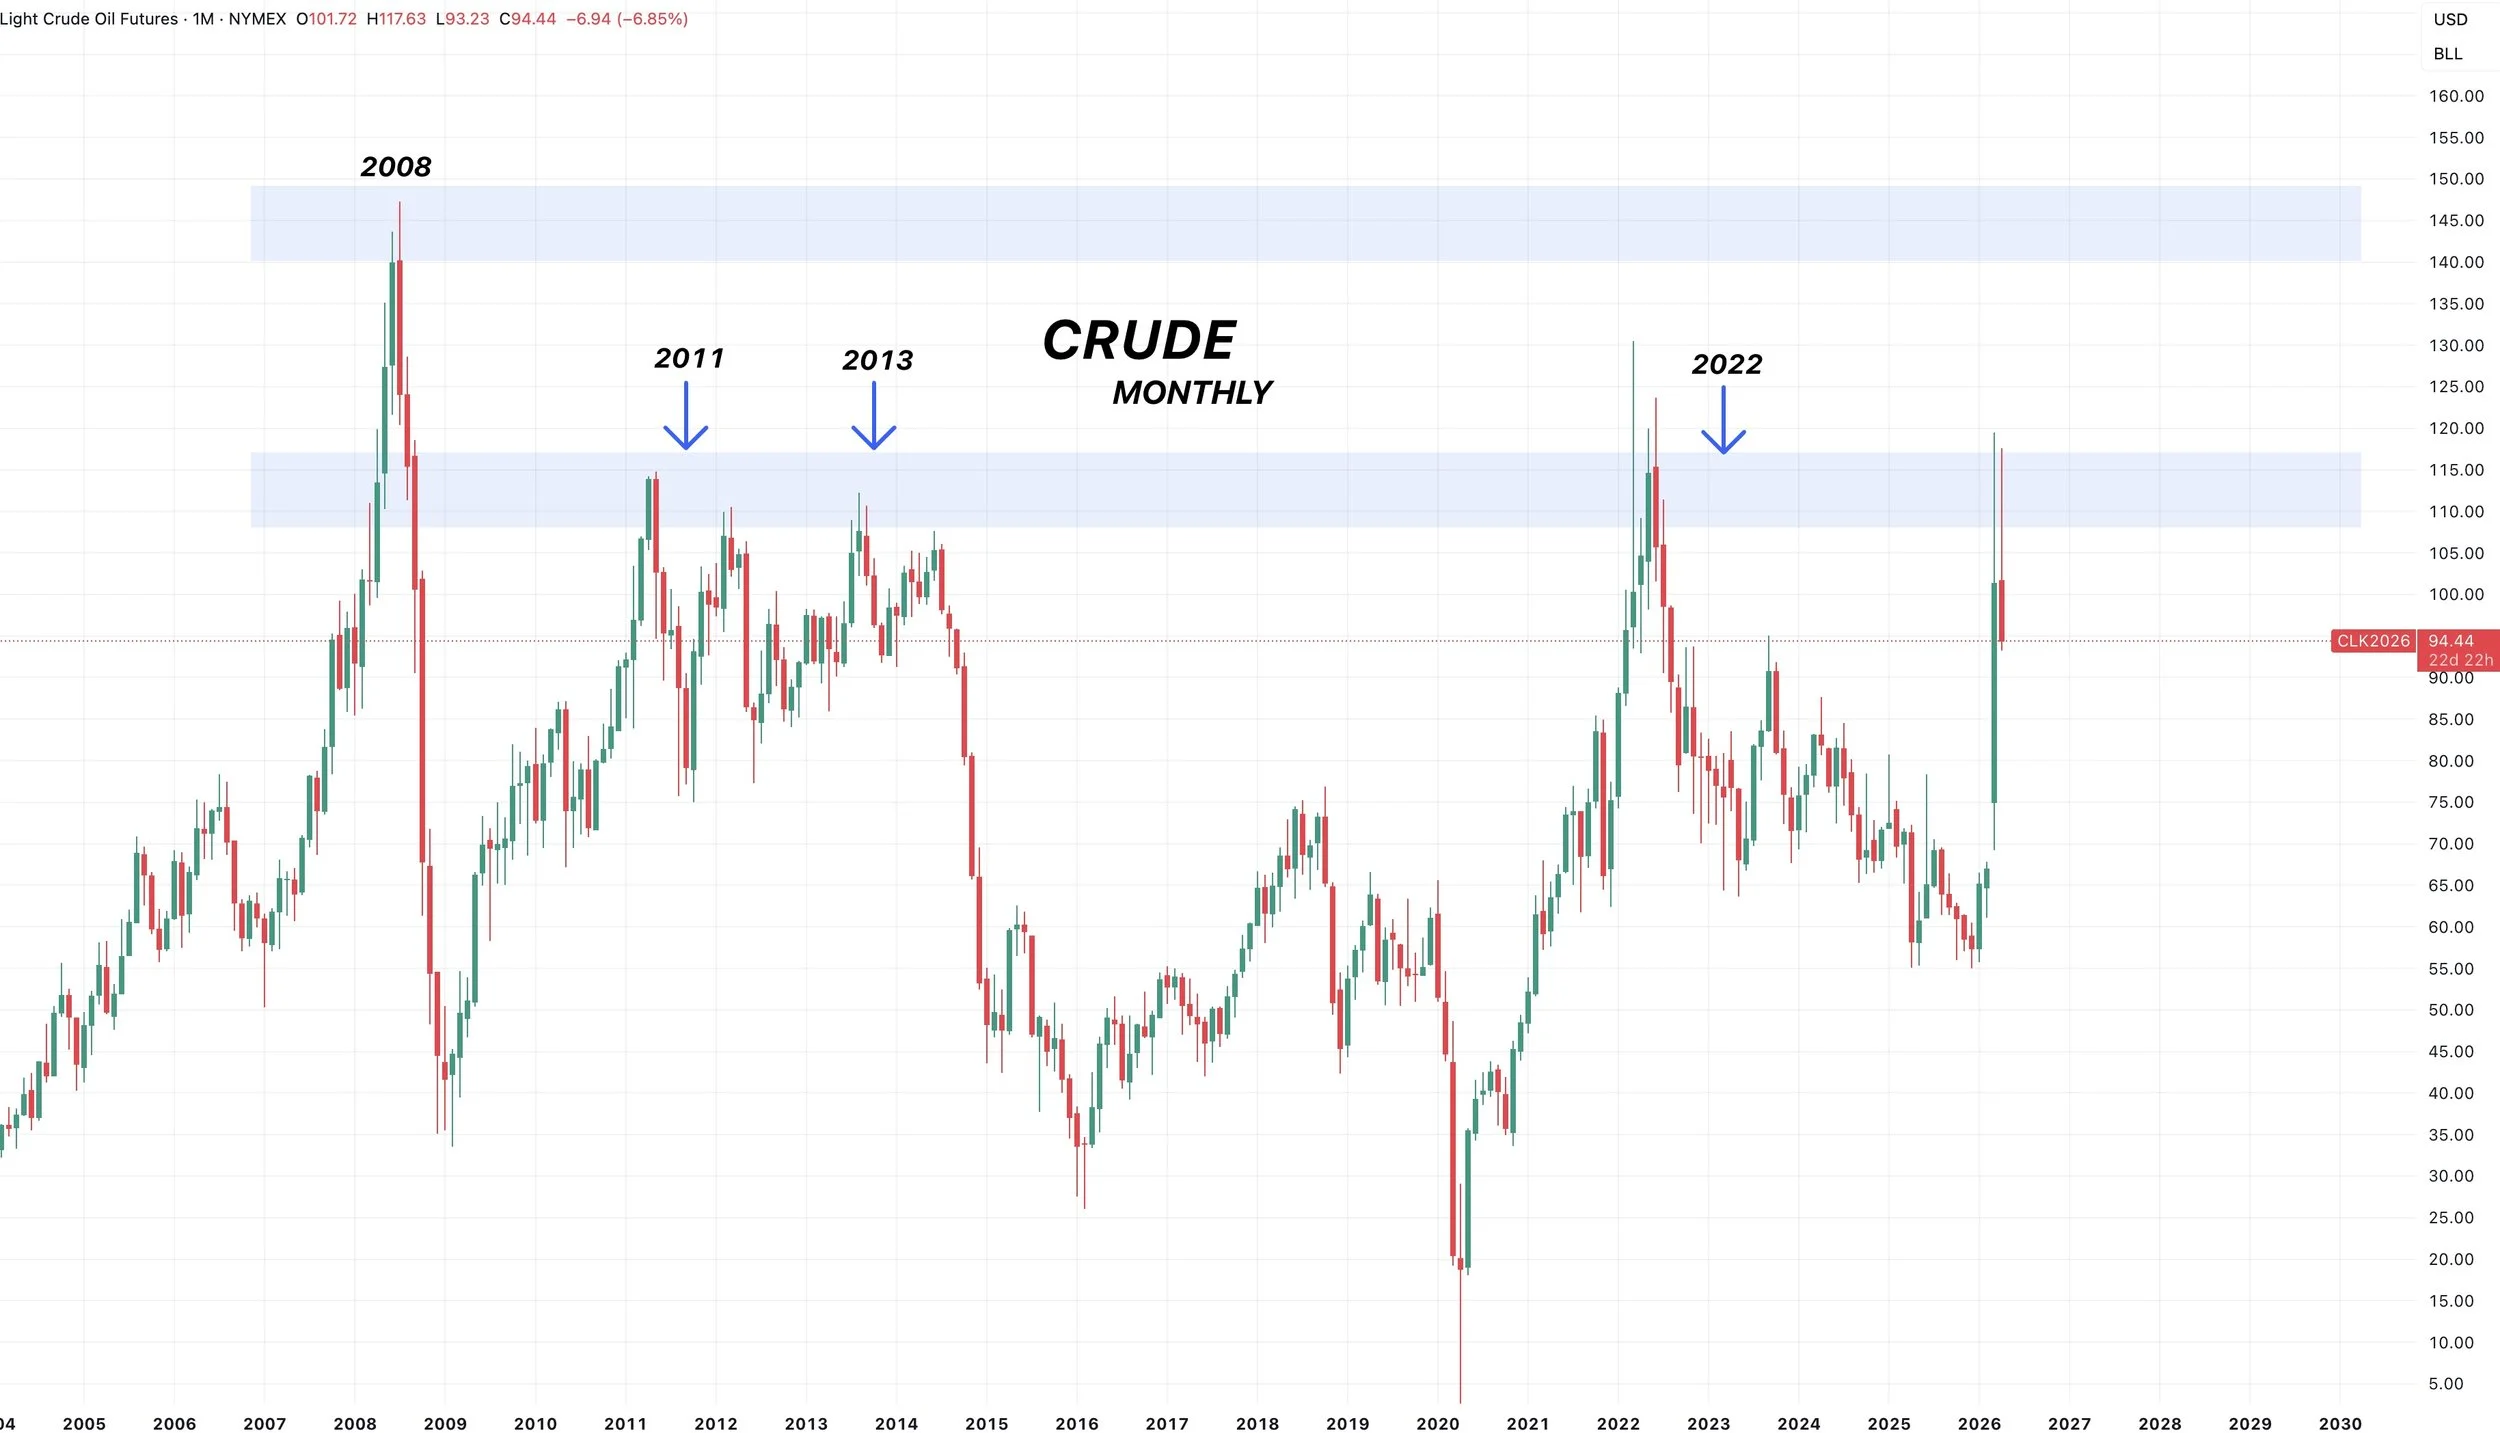
Crude Multi-Decade Resistance
Here is the monthly crude chart.
It could of course continue to run, it'll all come down to the war.
But we are sitting right at some multi-decade resistance levels. Right where it failed in 2011, 2013 and 2022.
Could Crude Stay Elevated?
Crude can absolutely push higher from here.
It's definitely possible that crude stays up here for months on end.
But for that to happen, this war would probably have to continue to drag on.
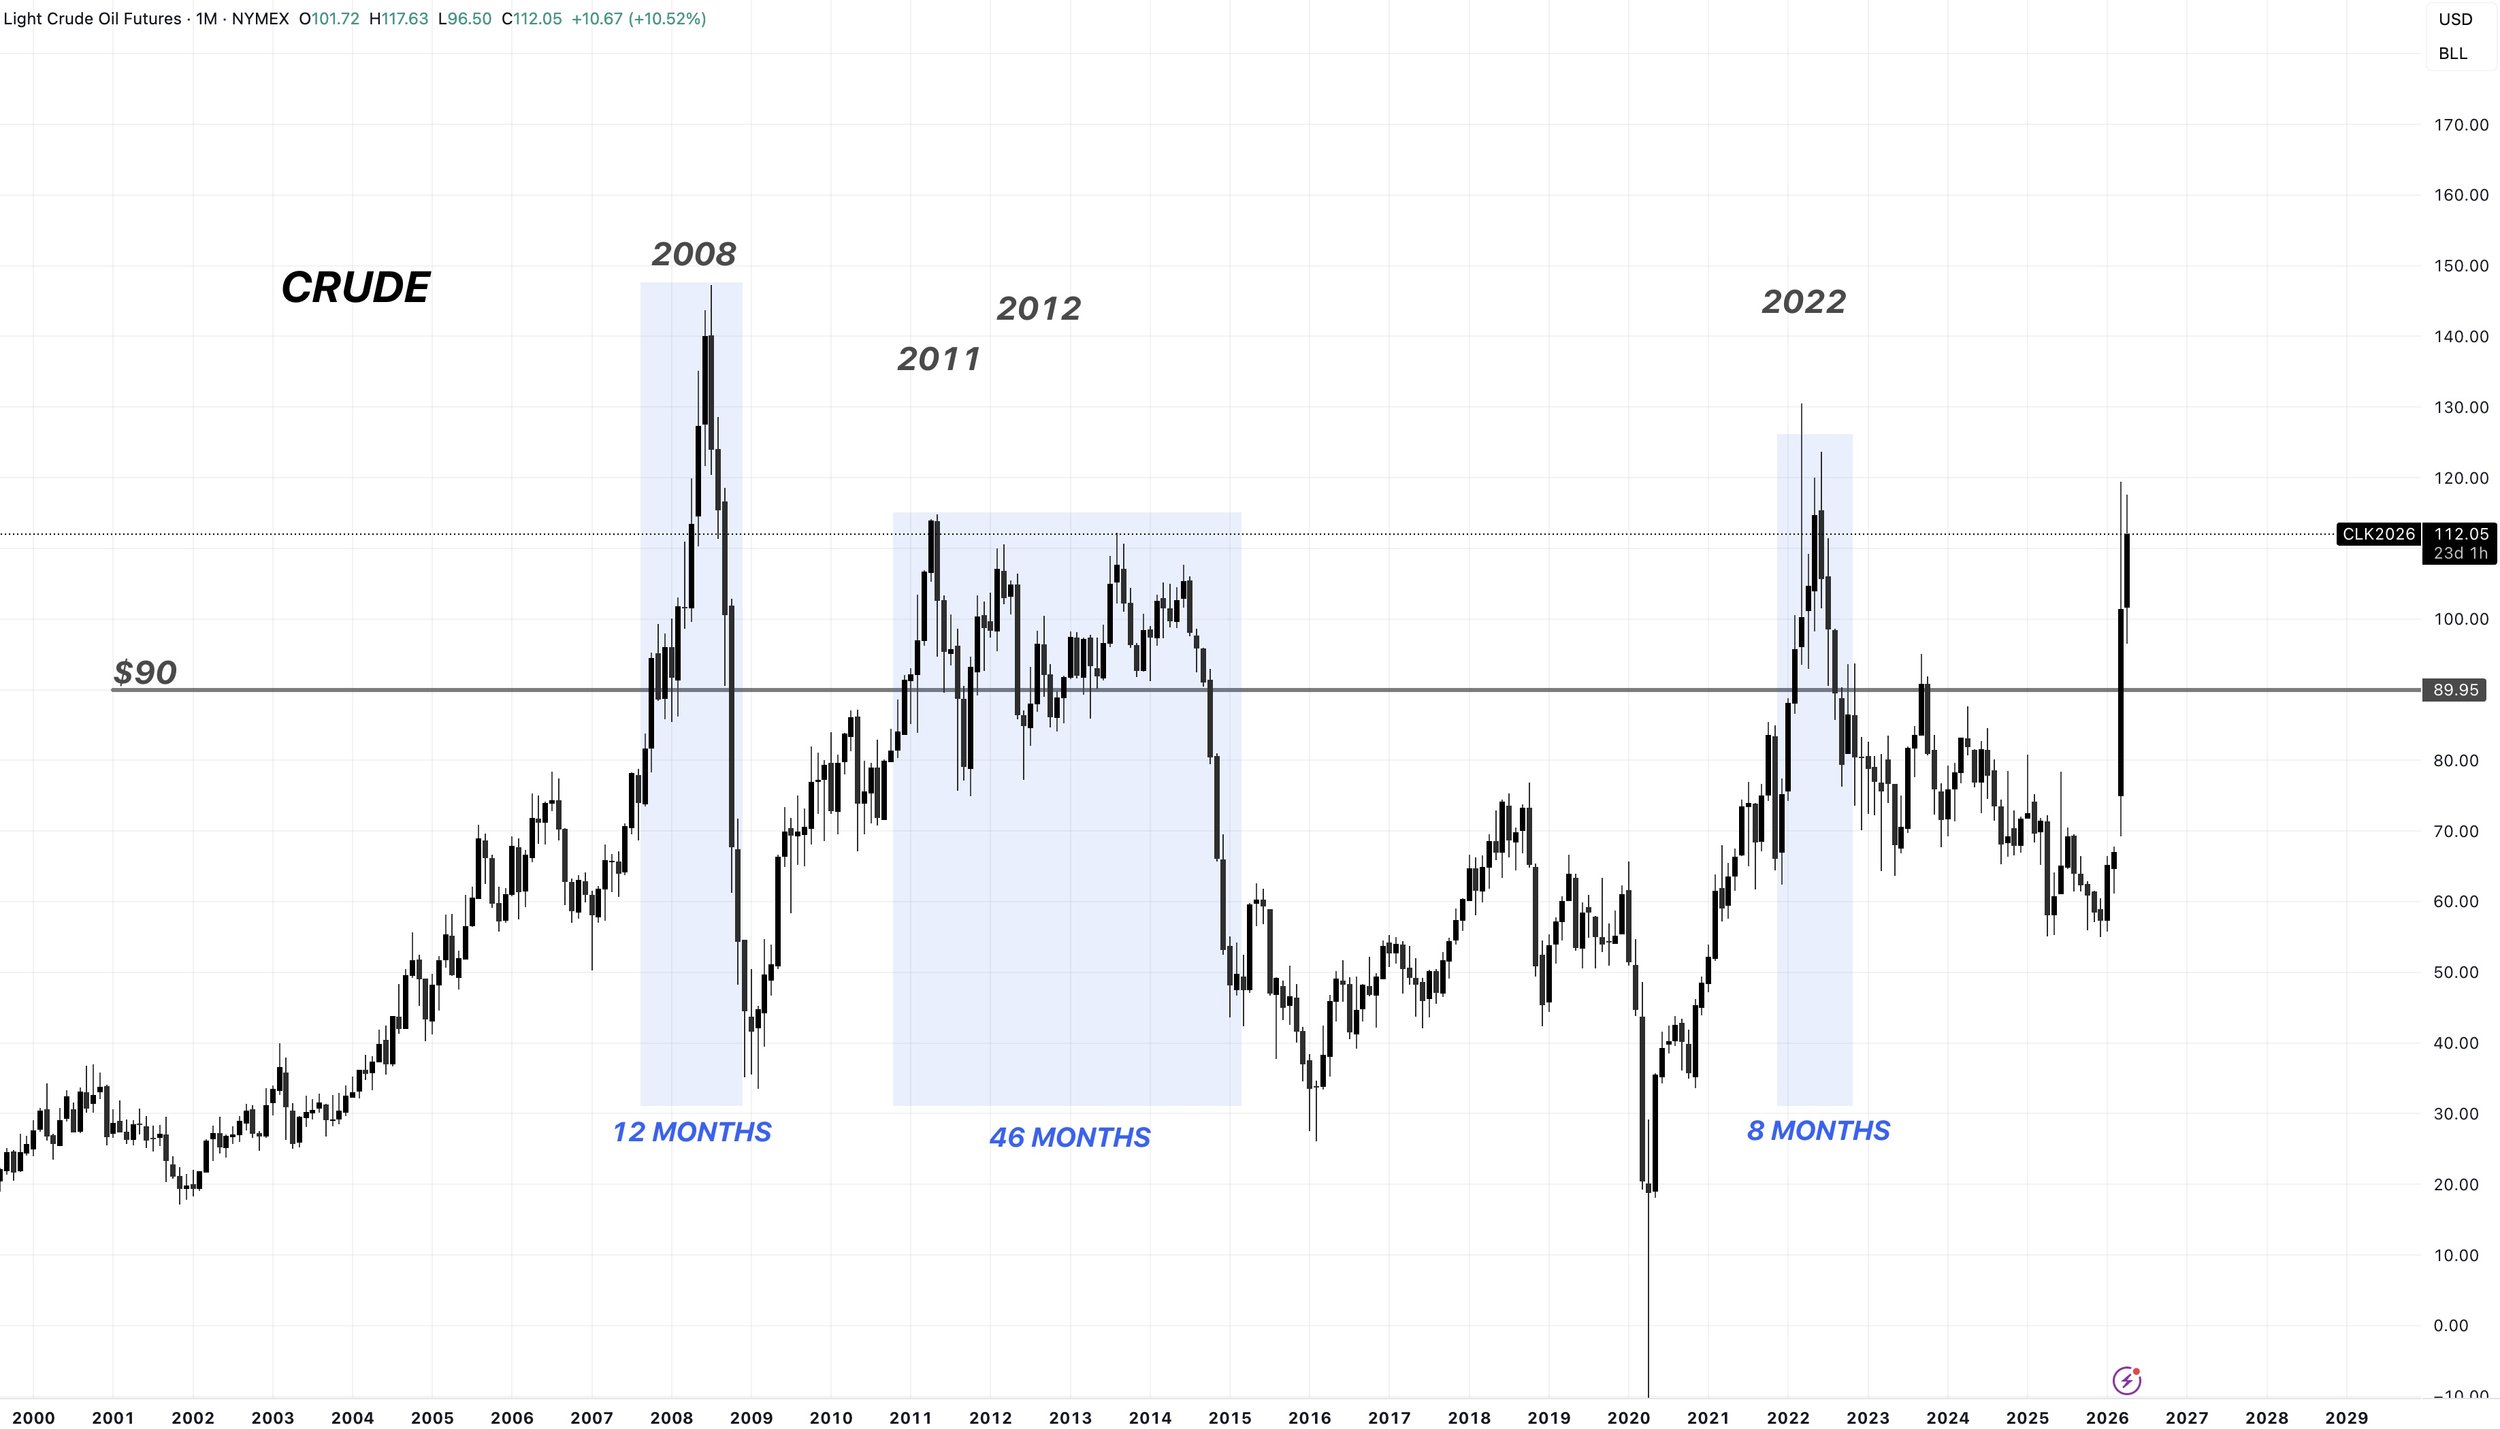
I'm still in the camp that crude isn’t going to stay above $100 for several months or years.
Every time crude ran above $90, it stayed there for months to in some cases years.
But is this time different?
Who knows, but this rally is fundamentally different than those prior.
Let's go through each of the previous rallies and what drove them.
2008:
In 2008 global demand for crude was exploding. There wasn’t enough supply to meet the demand. As a result crude stayed above $90 for a year.
2011-2014:
The rally in 2011 to 2014 was the longest crude oil rally in history, that lasted nearly 4 years.
This one happened because of a few things. We had a civil war in Libya. The US and Europe then placed sanctions on Iran which locked away more barrels. Libya and Iran were pretty much shut and there was an actual deficit in global supply.
2021-2022:
Then we have the 2021 to 2022 rally that happened post covid.
This one was due to a v-shaped recovery in demand following covid. The world was shut down for a year. Everything then opened back up and the world tried to go from 0 to 100 and couldn’t keep up with the pace.
After covid, we saw one of the fasted demand jumps in history.
Today:
That leaves us with this rally.
This one is more of a geopolitical bottleneck and logistical shock rather than a normal supply or demand shock.
We actually have one of the largest global surplus of oil in history. Outside of the strait, production in the rest of the world remains at record levels.
Now yes, production does not matter if that supply can’t reach the market with the strait being closed. The problem is 20% of the world's oil moves through there and it's blocked.
If the strait stays closed, it will continue to stay elevated, and it could snowball even further.
But if the strait re-opens relatively soon, there will still be a lot oil in the world. And this would be a logistical and geopolitical squeeze rather than a full on physical shortage of oil.
So it all really depends on how long the strait stays closed for.
Add that on to the fact that Trump has made it very clear he does not want high crude oil.
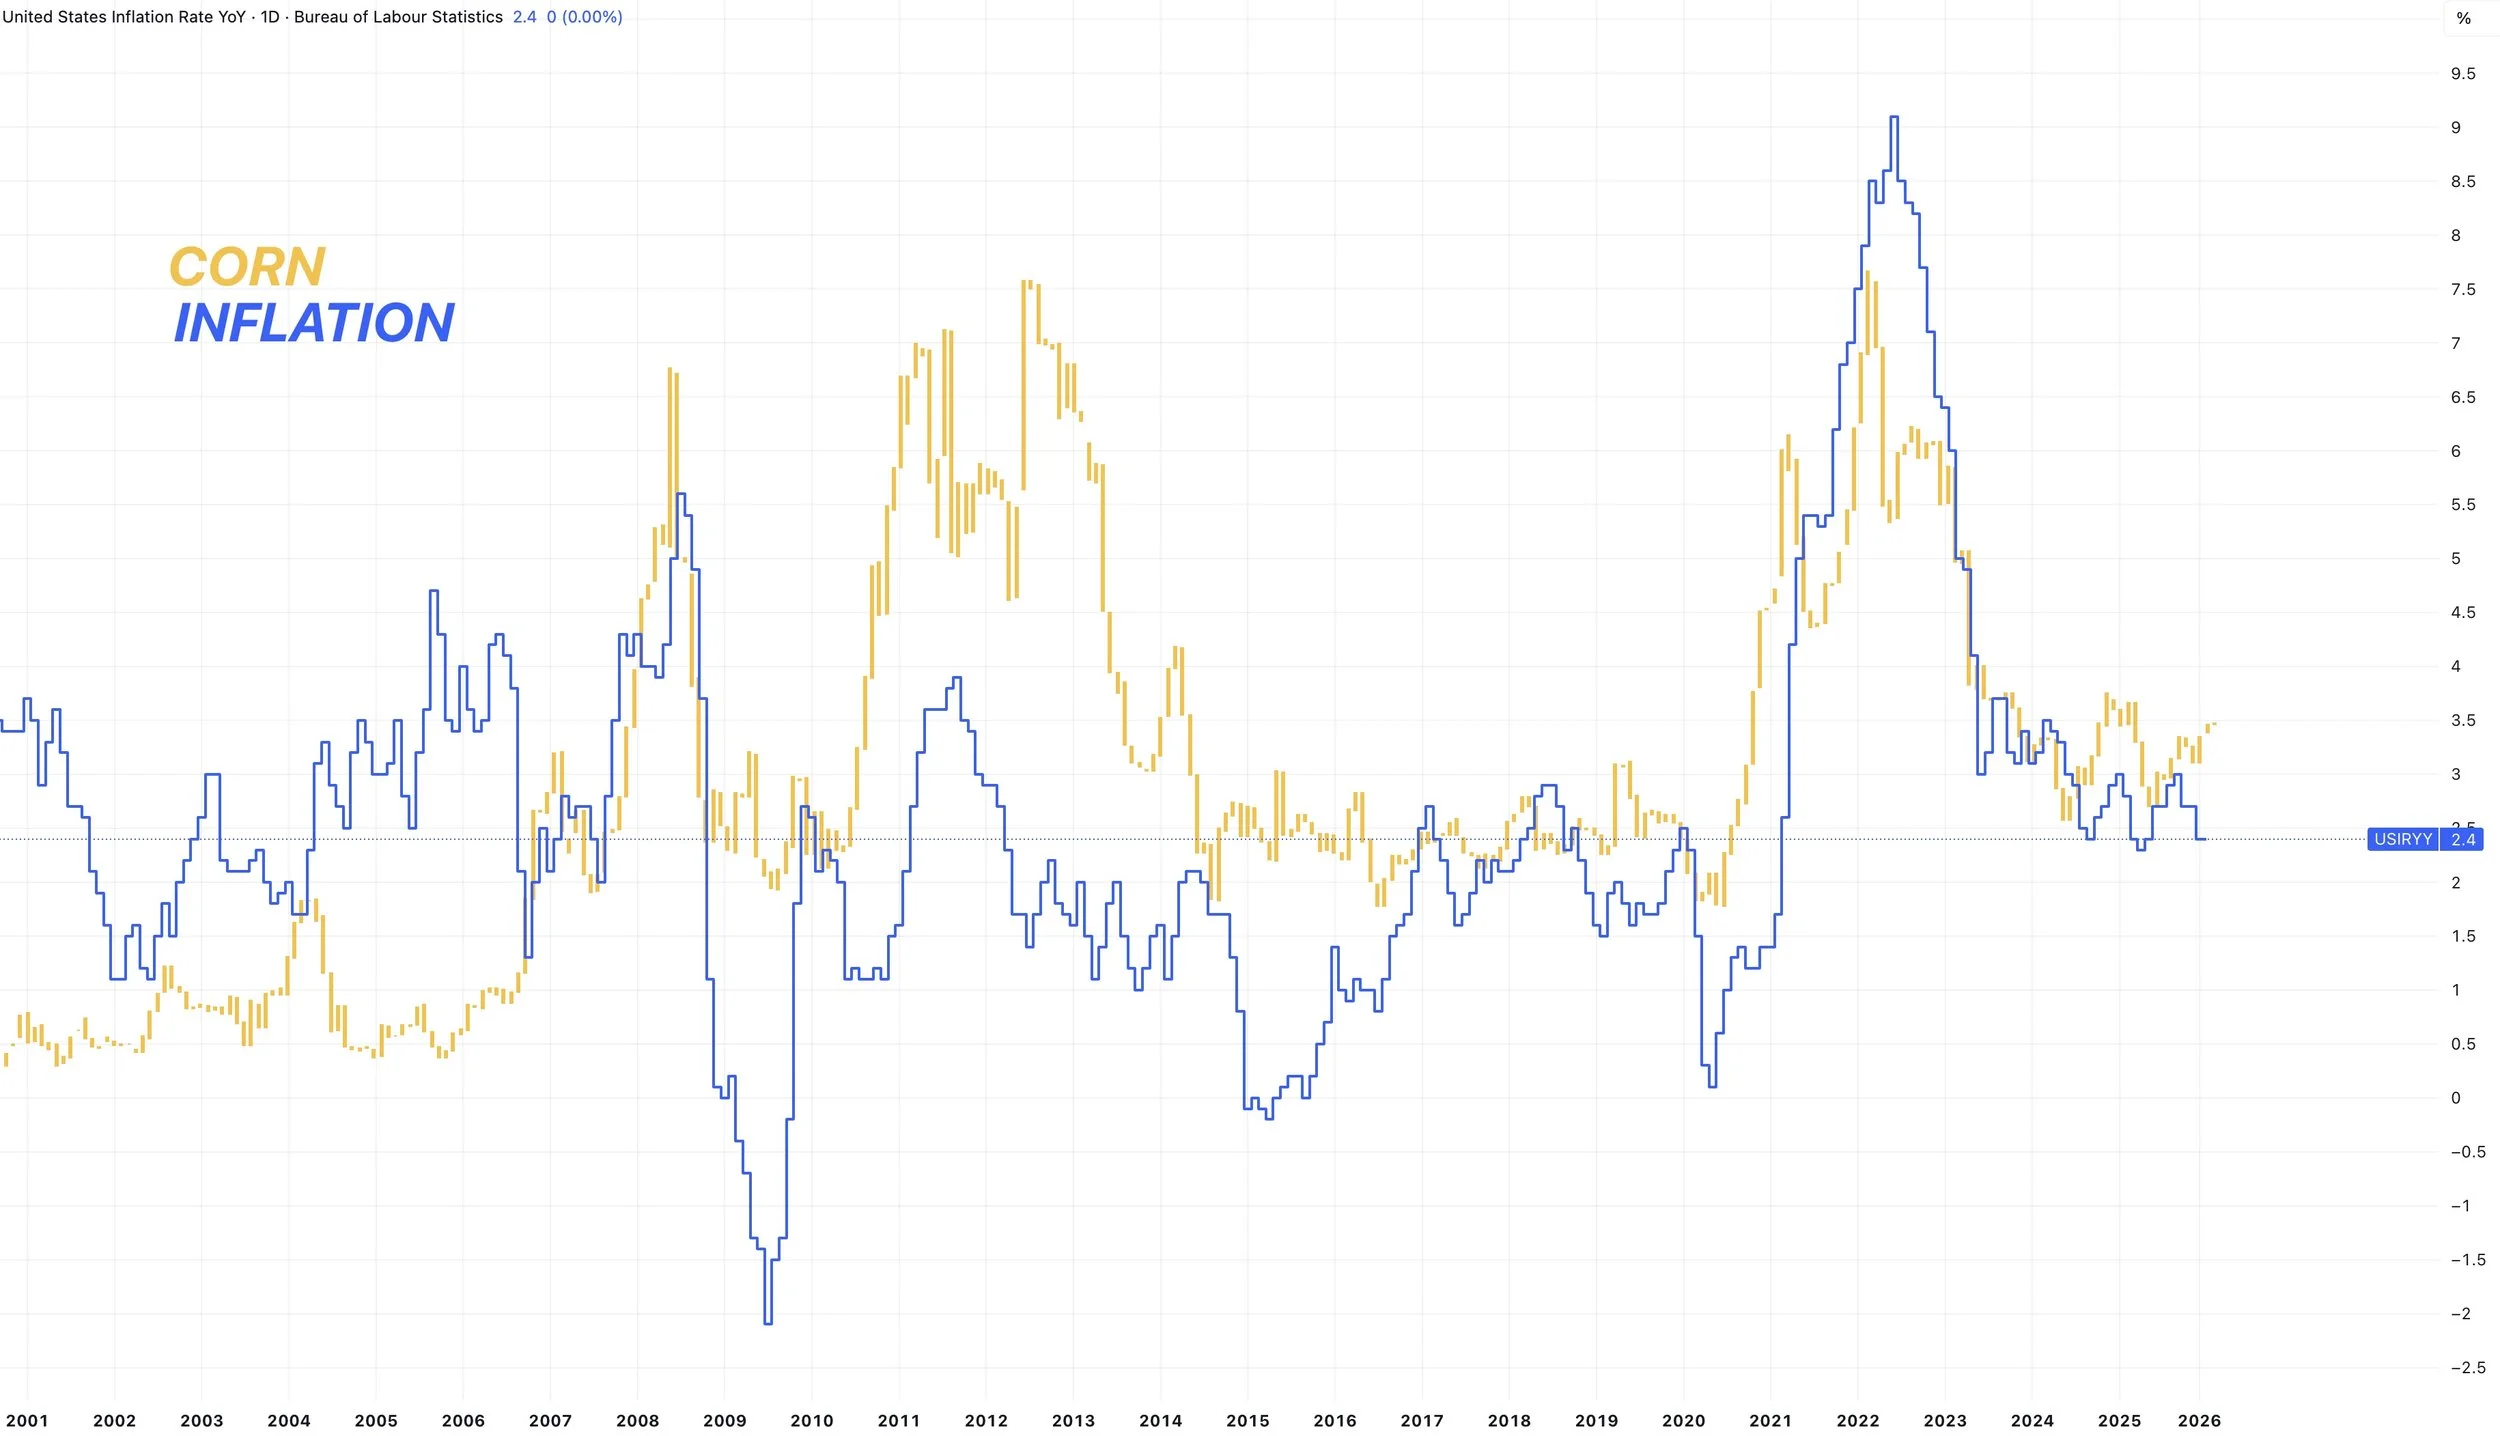
Inflation
Now the other side of this is inflation.
If crude stays high, inflation will follow. At a certain point, you could argue grains should follow eventually.
Here is corn prices compared to inflation. They tend to go hand in hand.
Every major rally has been accompanied by a surge in inflation.
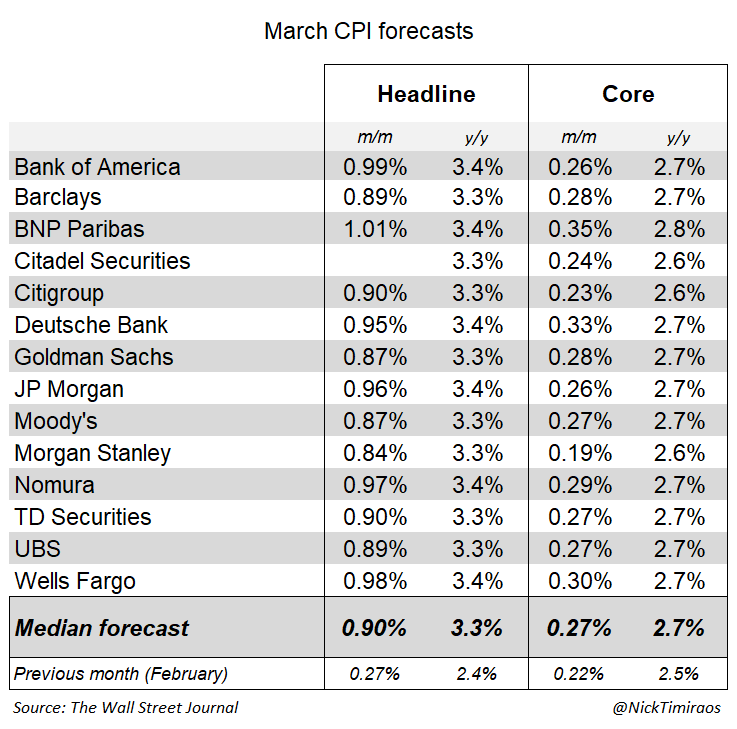
We have the March CPI data on Friday.
The rally in crude has already made a big impact.
They are expecting inflation to rise from 2.4% last month to now 3.3% due to the oil situation.
That is a sharp move and would be the highest level of inflation since late 2023 to early 2024.
It's a big if.. but if inflation continues to ramp higher, grains could be an inflation play down the road.
USDA on Thursday
We have the April WASDE report out on Thursday.
This report isn’t expected to be a big market mover at all.
Historically the April one is not.
Here are the estimates.
Corn and soybeans balance sheets are expected to be virtually unchanged, while the trade is expecting a slight cut to the wheat balance sheet.

Today's Main Takeaways
Corn
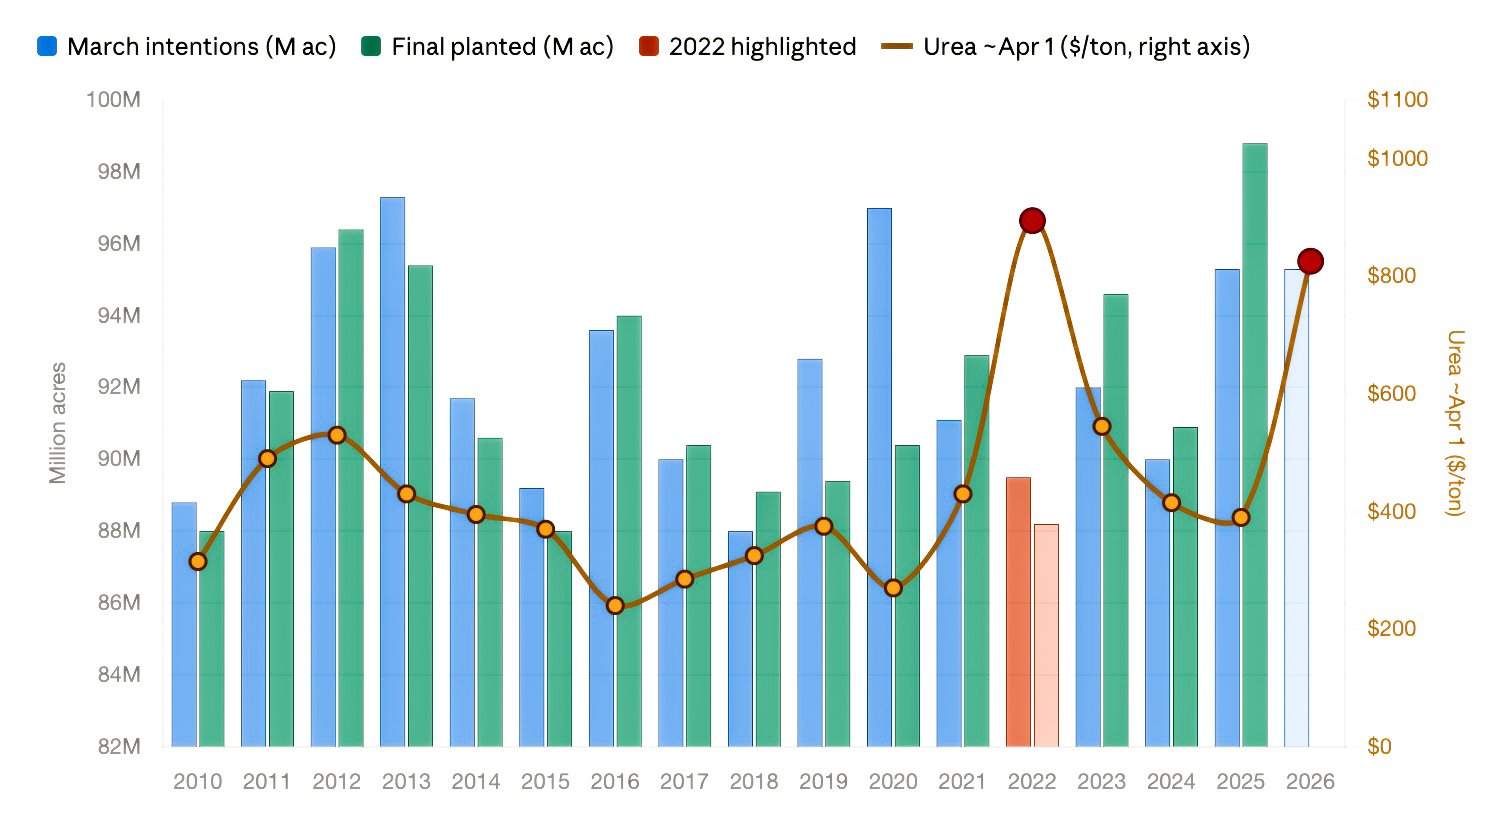
Acres:
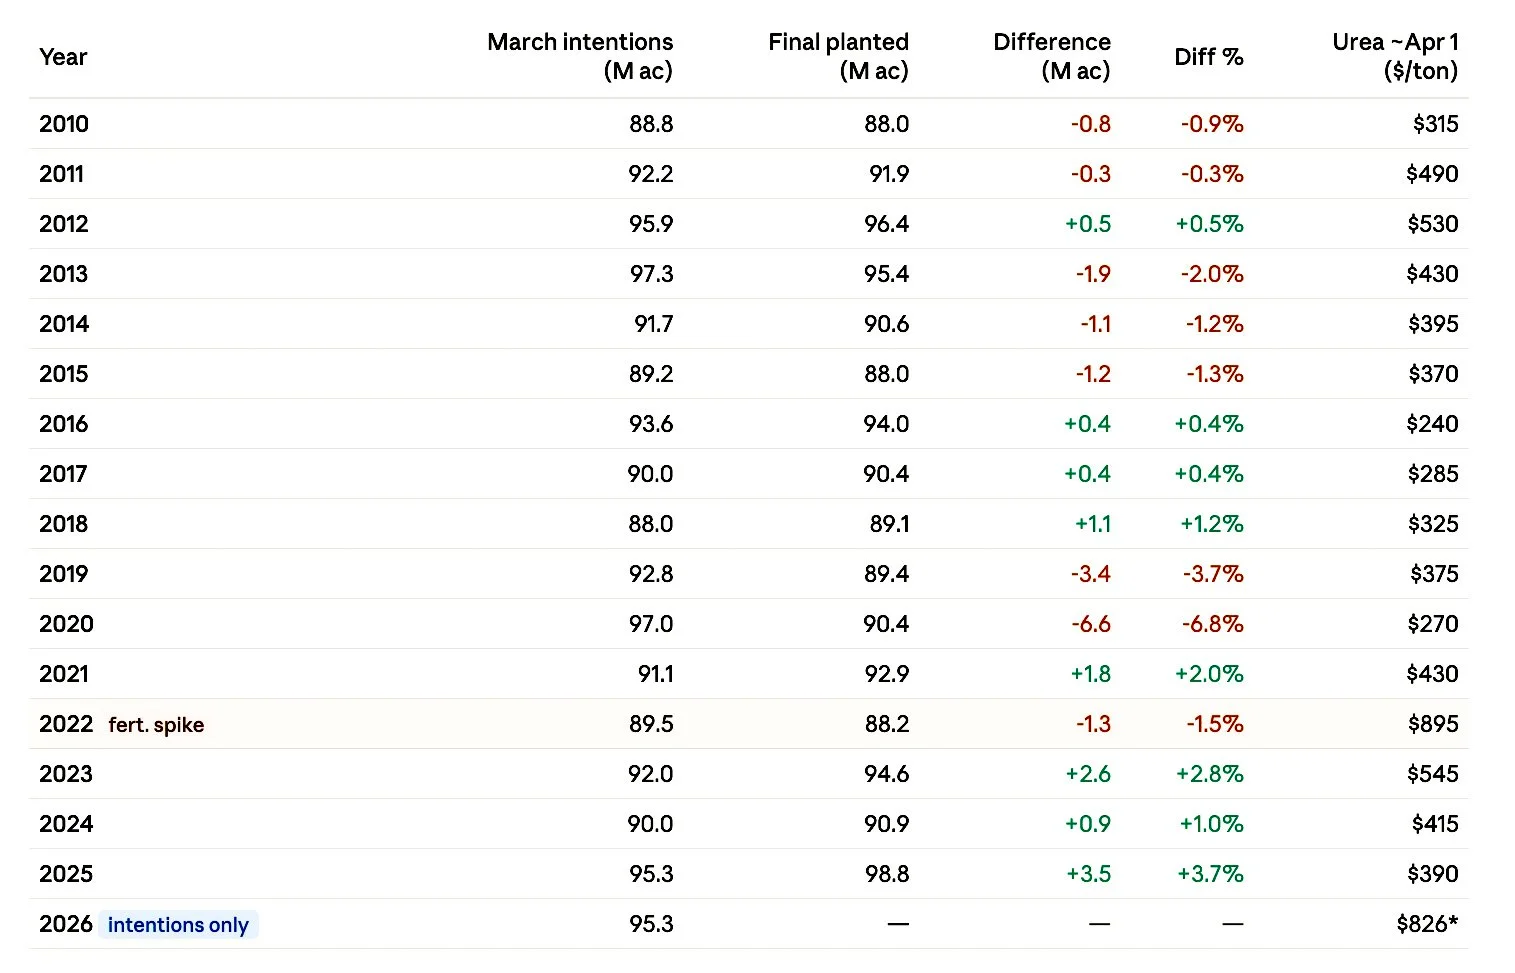
I showed this chart last week.
It shows:
March intentions acres
Final corn acres
Price of Urea on April 1st
Now normally, acres tend to increase from the March intentions to the June report.
However, last time fertilizer was this expensive, the final corn acre number did come in 1 million less than what they had in the March intentions.
My bias leans towards corn acres being too high.
The issue is that we aren’t going to get a good grasp on acres until June. This is the number we are going to be dealing with for the next few months.
Here is a table view of the data I also showed last week.
For roughly the last decade, the USDA's March number has been off by more than 1 million acres almost every single year.
So there are some clear reasons to doubt the acre number.
Corn vs Crude: Decoupling?
While crude continued to run recently, the corn market has continued to fade off the recent highs.
Corn has been lower the last 5 of 7 days.
Meanwhile crude has been higher the last 7 of 10 days.
This chart was made before crude fell apart in the night session.
Despite the recent divergence, I'd have to assume we folllow it lower tomorrow with crude down as hard as it is.
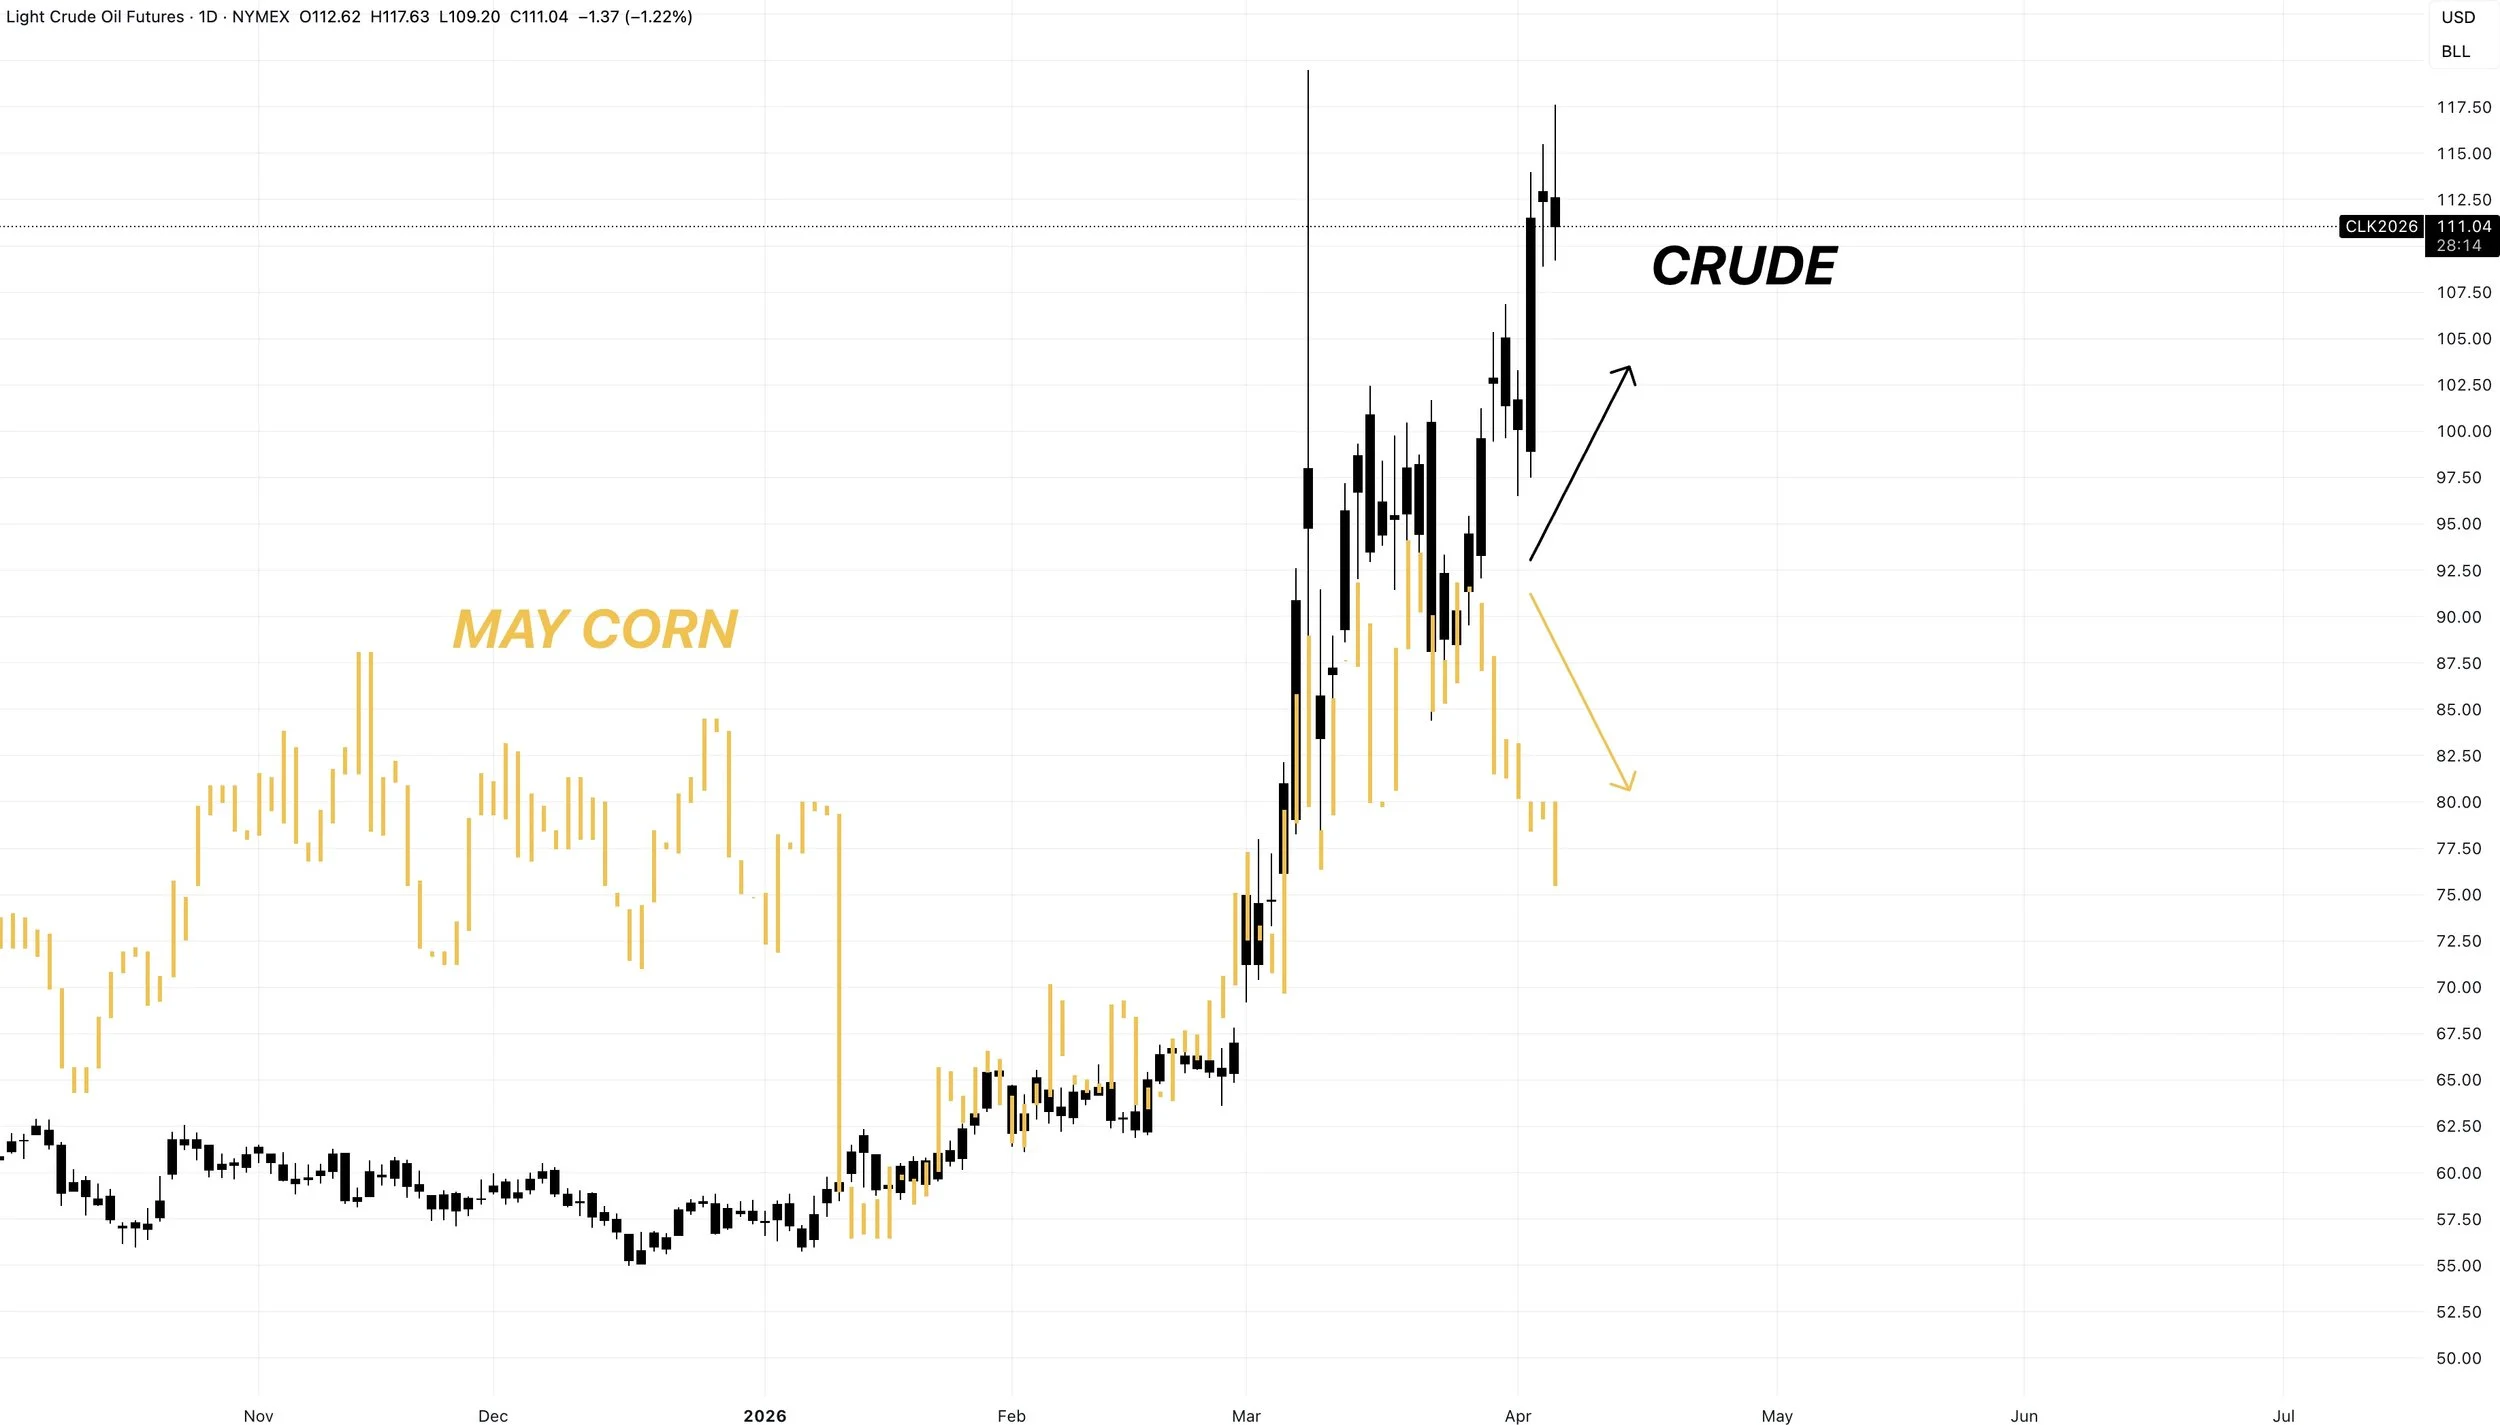
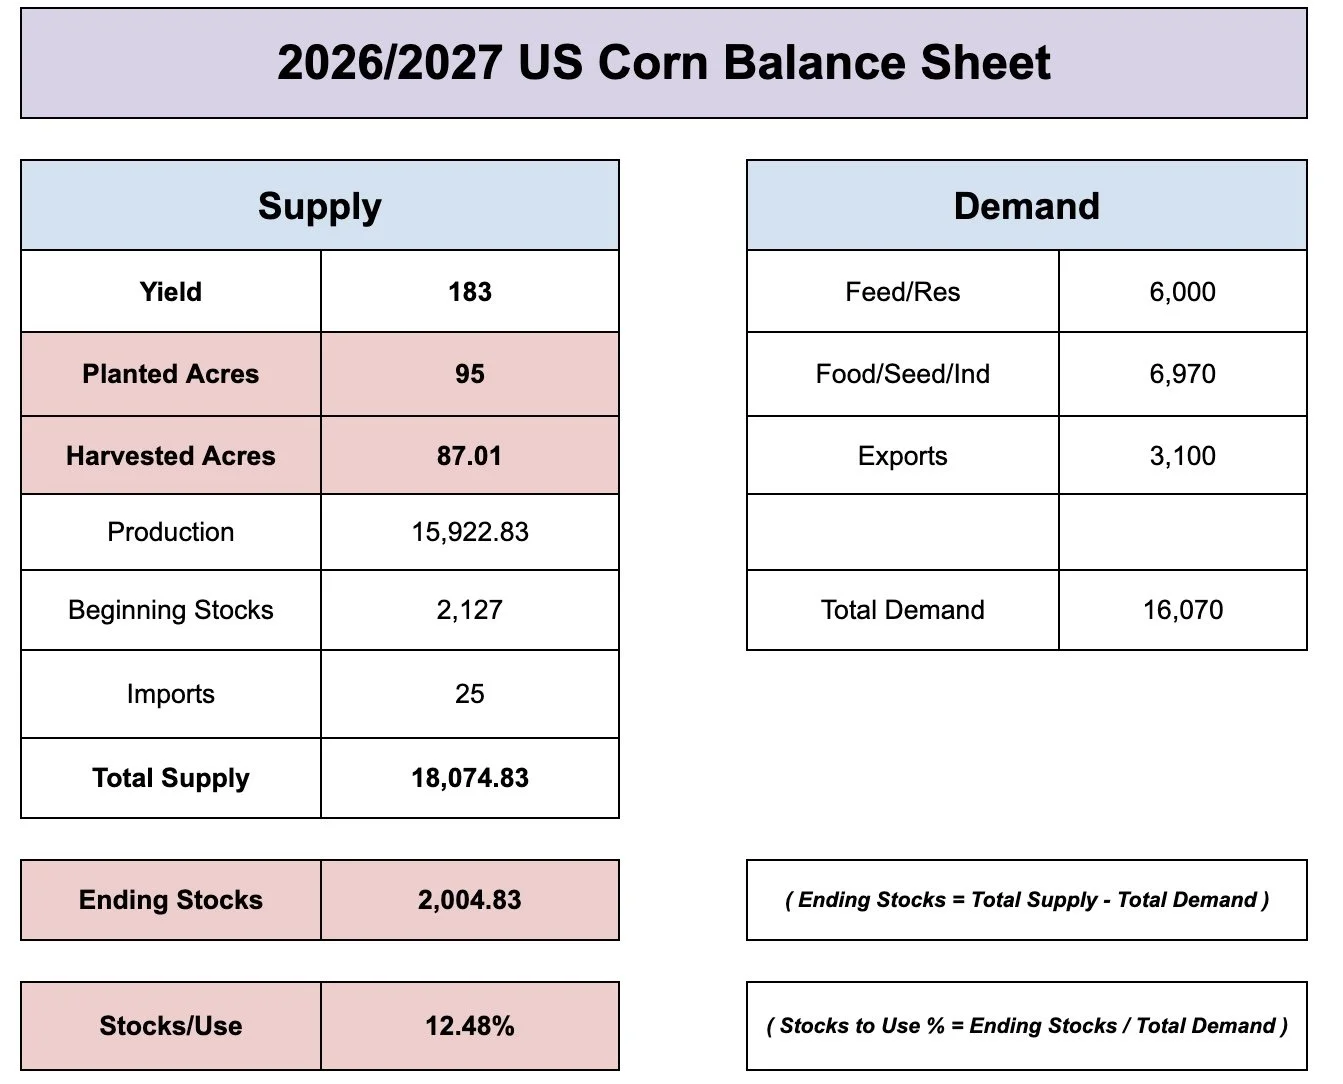
Maybe the trade has been thinking that the corn balance sheet isn’t that friendly if this war ends.
Which would be true. If you remove war premium from the equation, the corn situation doesn’t tell us that we need to go screaming higher today.
A trendline yield and 95 million acres leaves the new crop balance sheet with around a 2 billion bu carryout.
That's not bullish if it this is how it played out.
But obviously things can change fast. We have an entire growing season to get through, and I think acres are overstated to begin with.
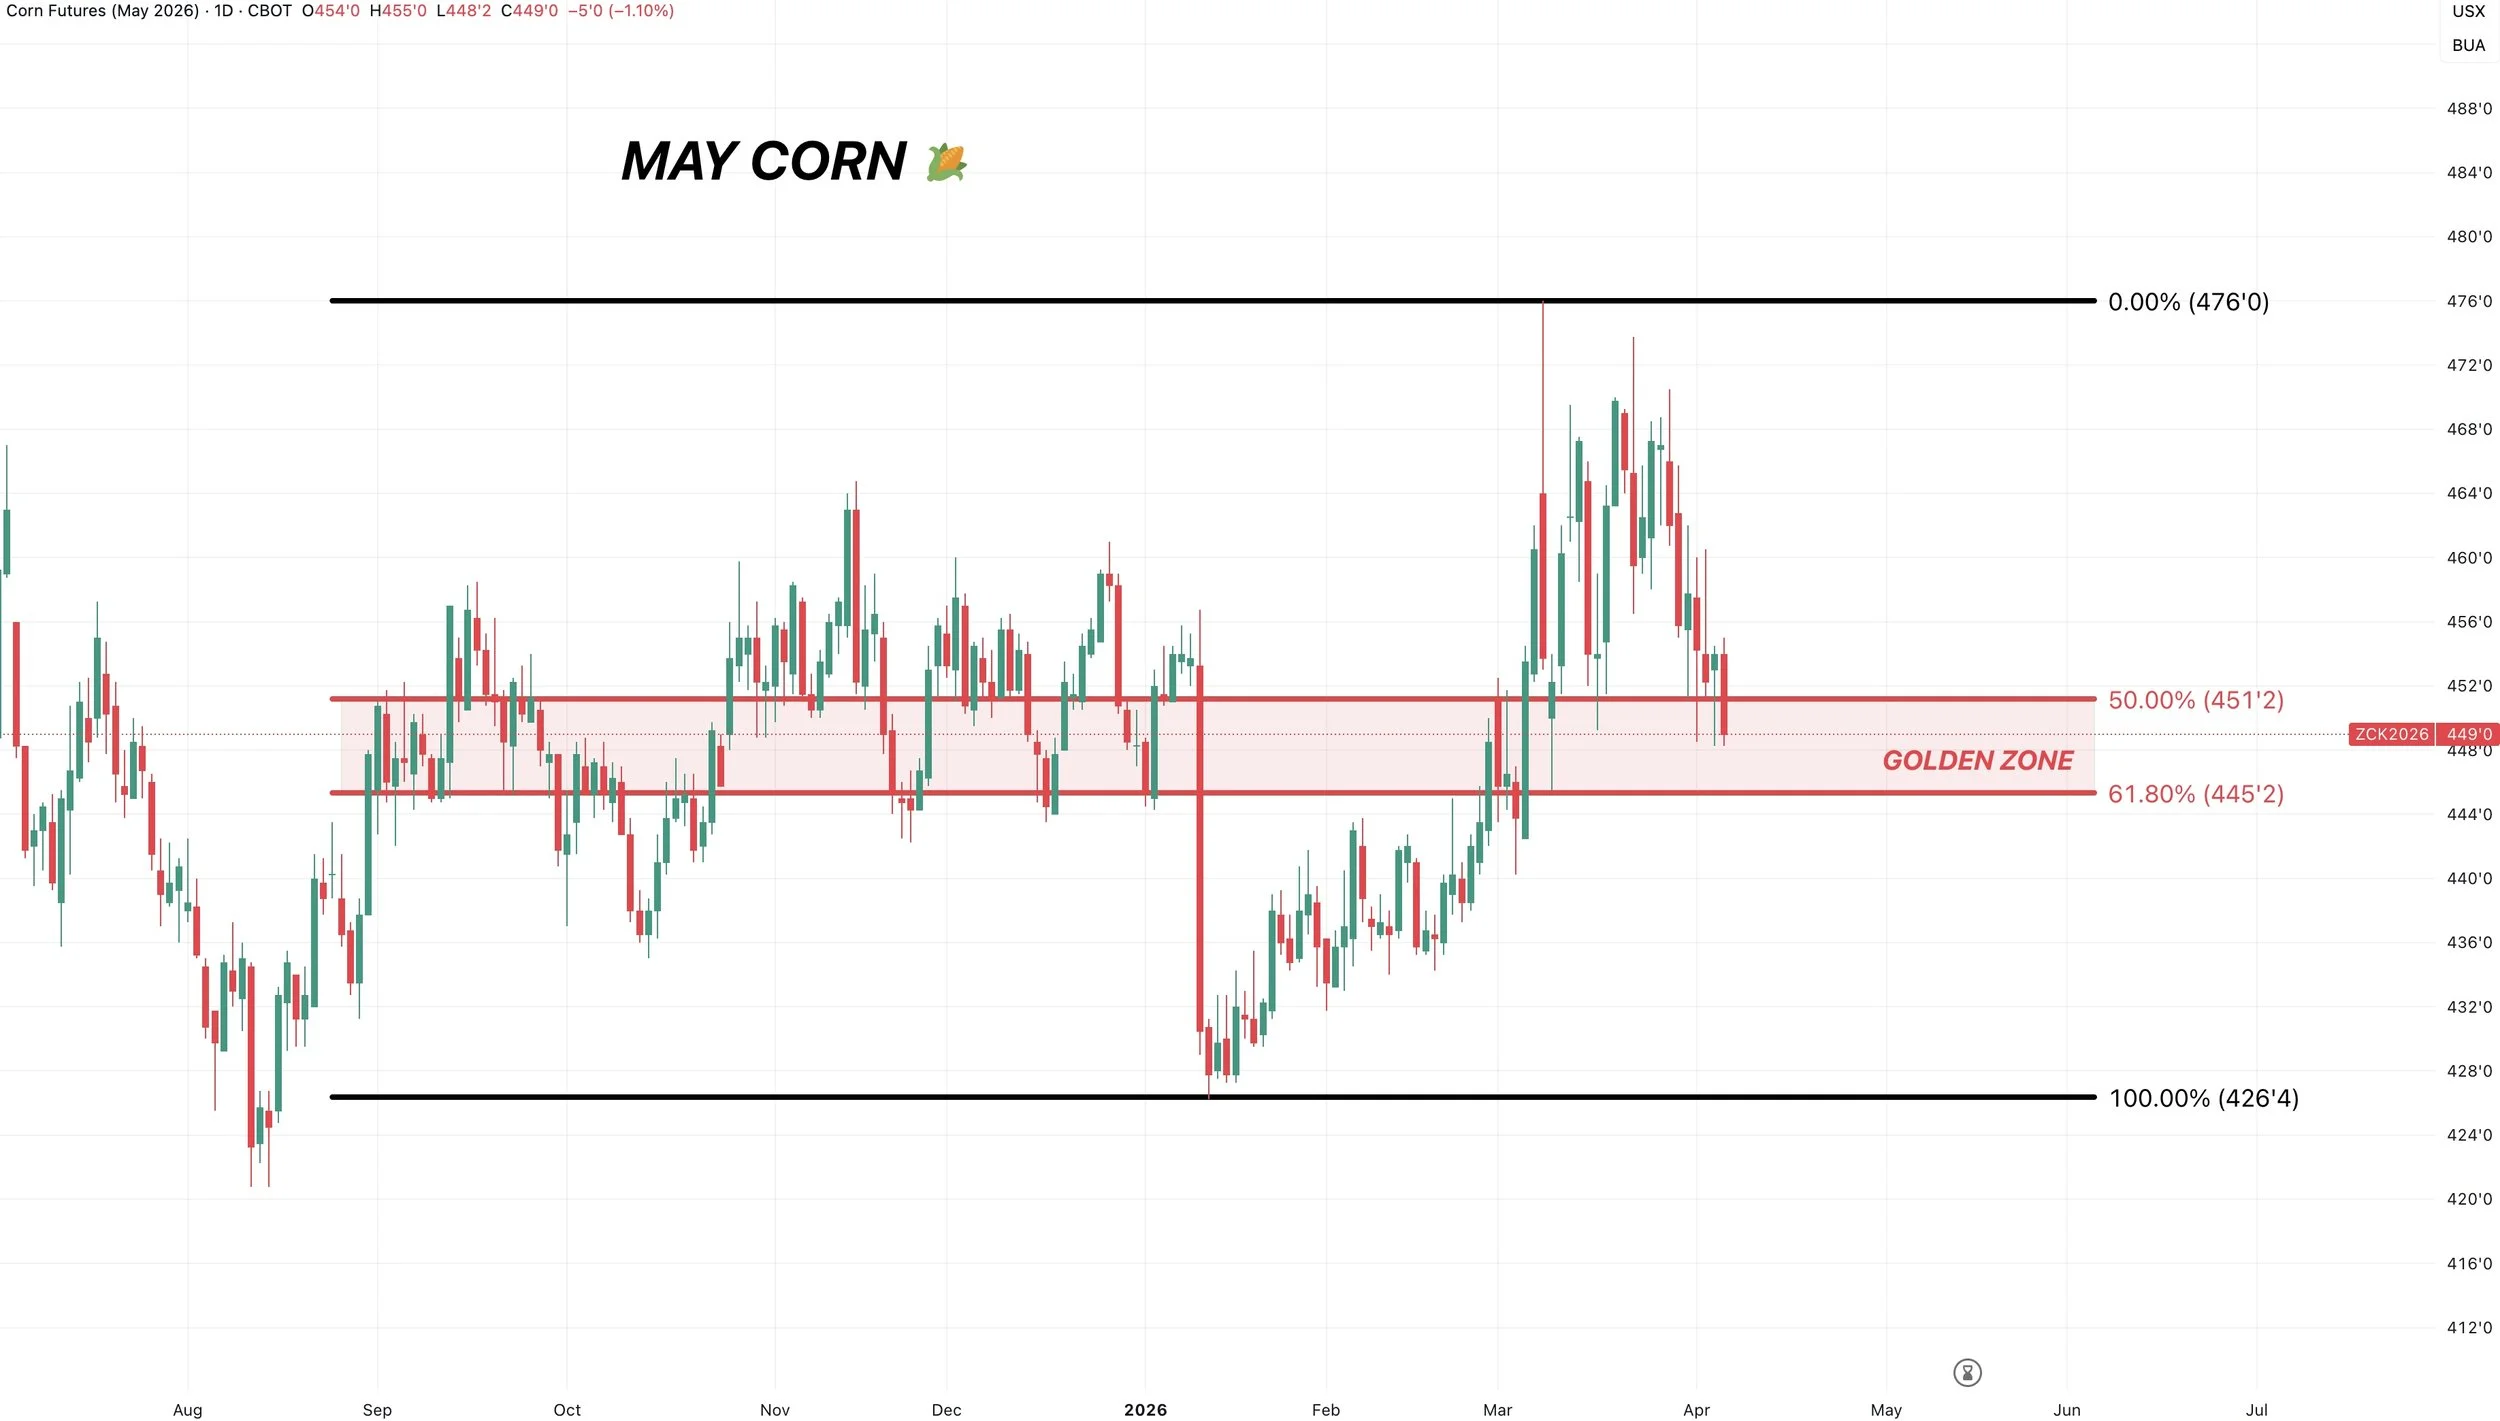
May Corn Chart:
The last few weeks I talked about wanting to reward or defend those levels, as we had some clear bearish divergence on the RSI across all corn contracts that was hinting we were starting to lose upside momentum.
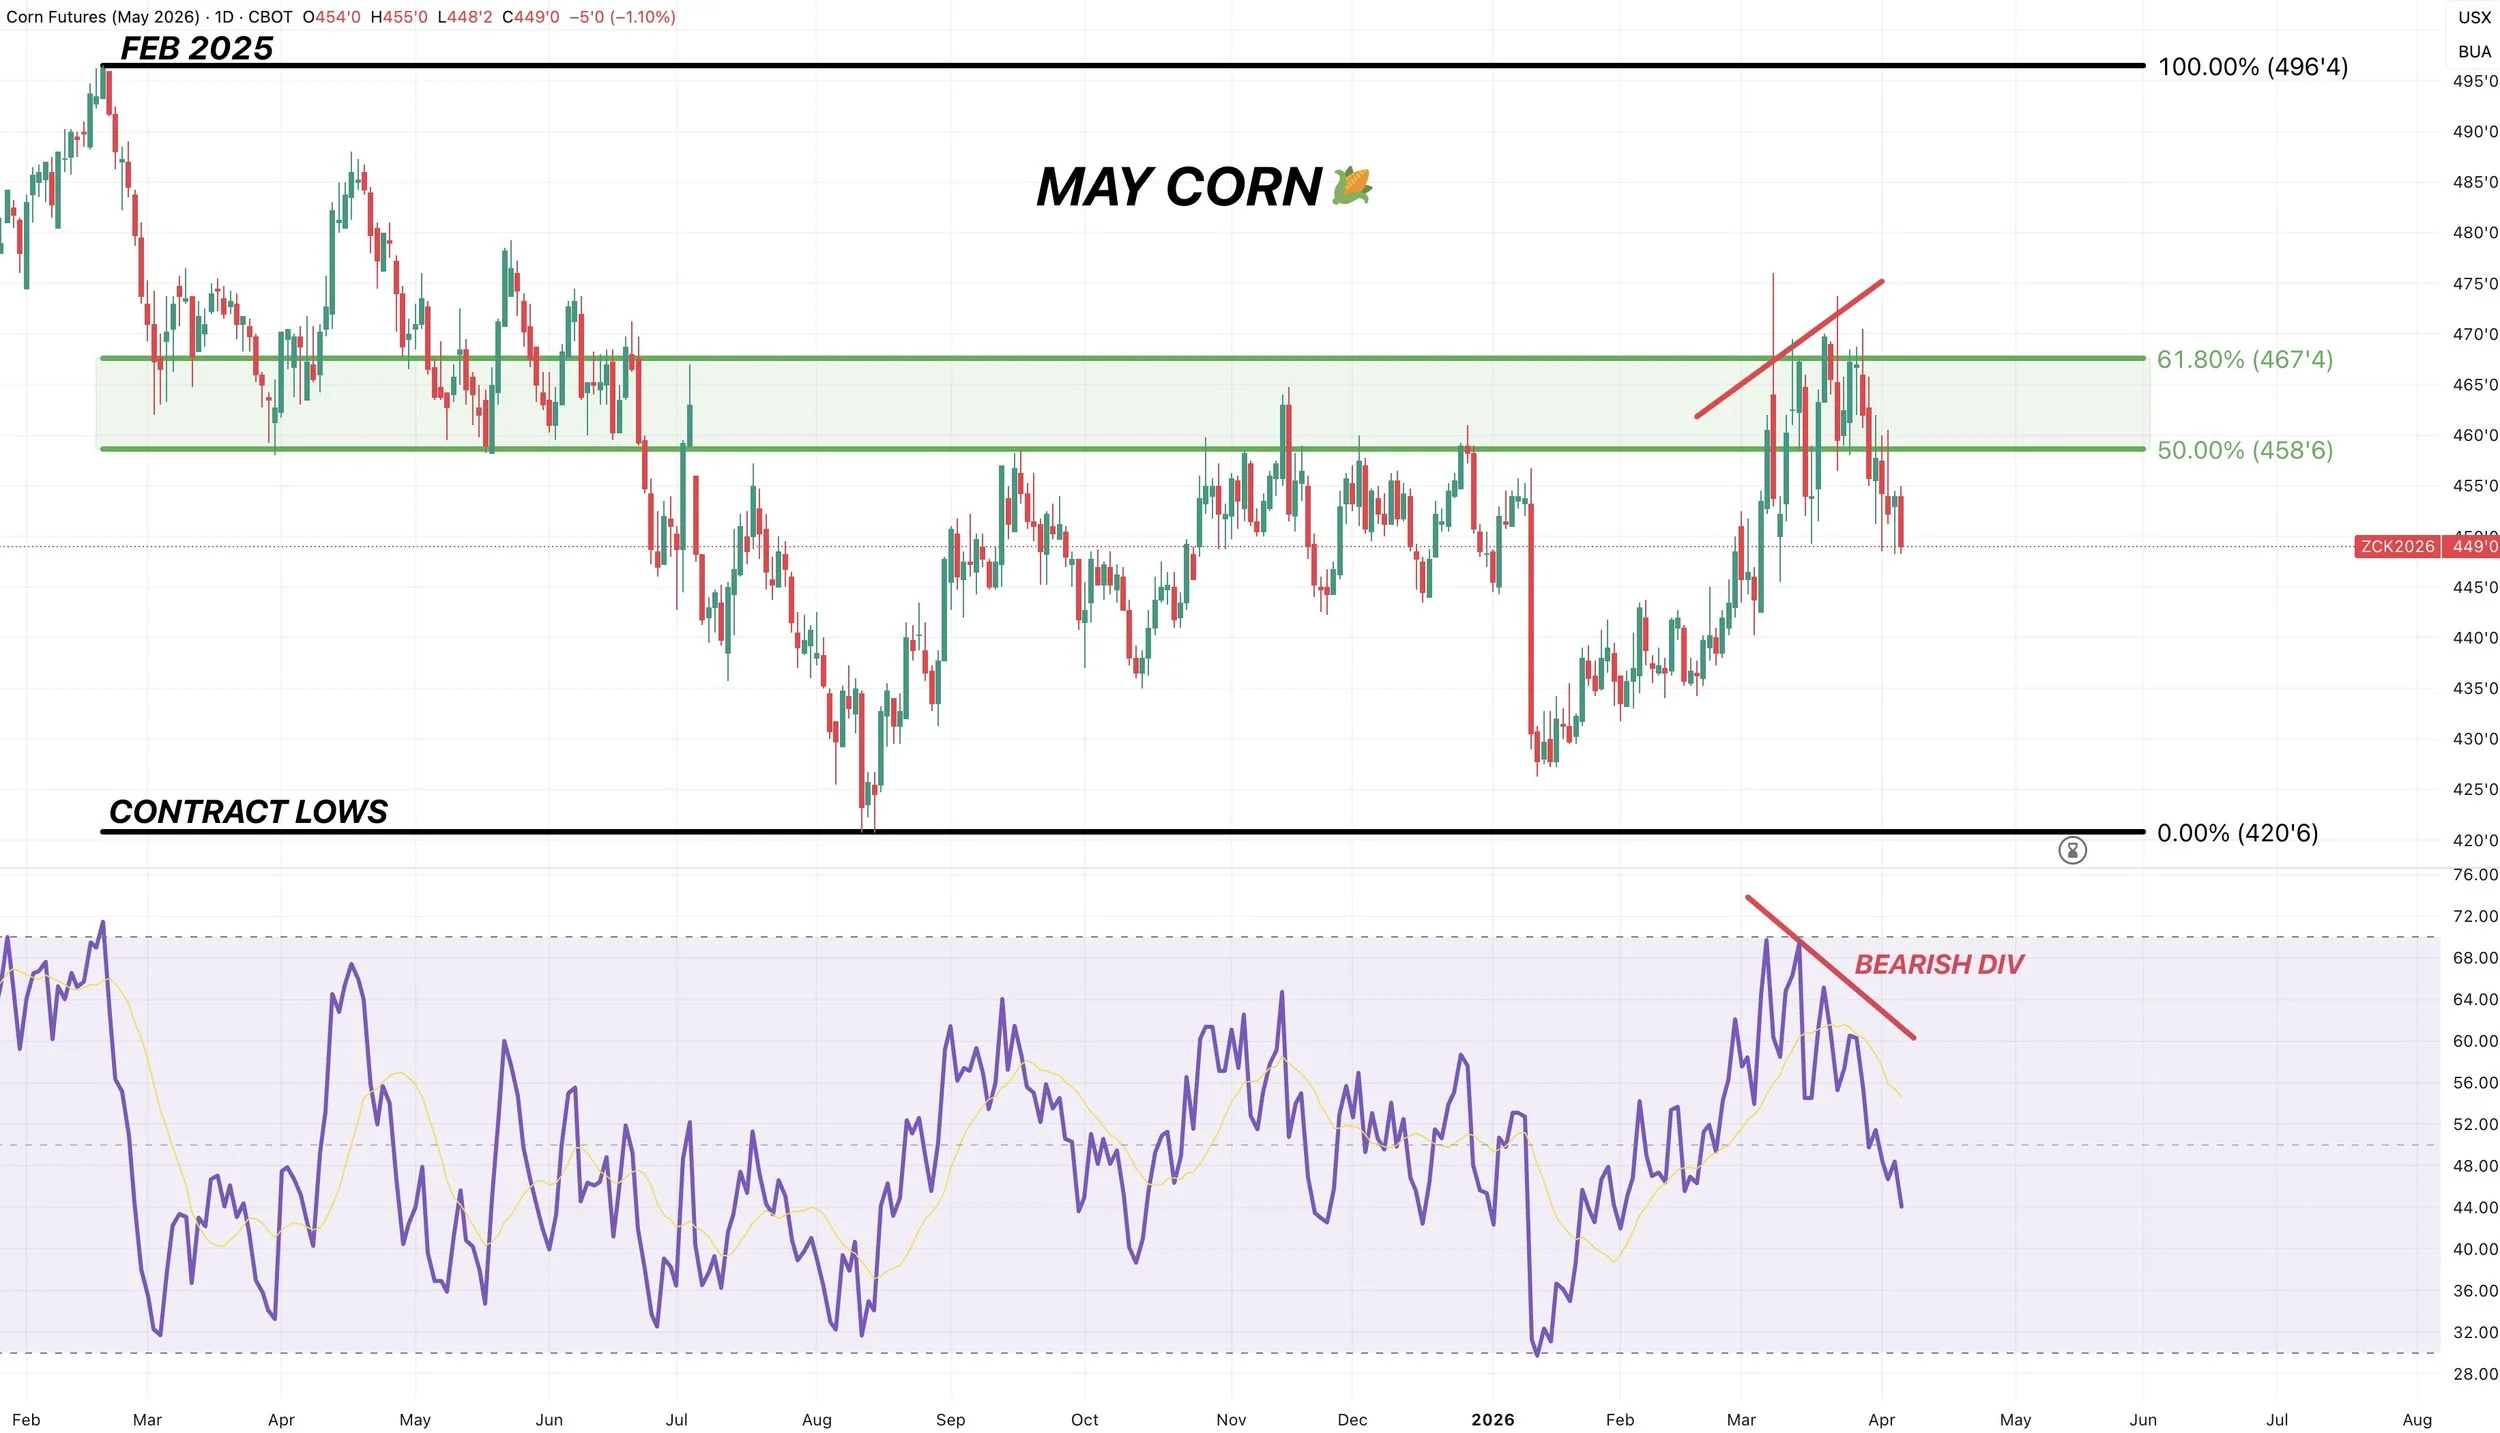
We are now firmly in the golden zone, approaching a must hold level.
$4.45 gives back 61.8% of the entire rally.
It's key support from last fall.
The golden zone is where the market makes a decision. It's either time to bounce, or it's time to roll over.
If you are going to bounce, this has to be the area to do so.
Failure to hold this $4.45 tell us this is more than just your normal correction.
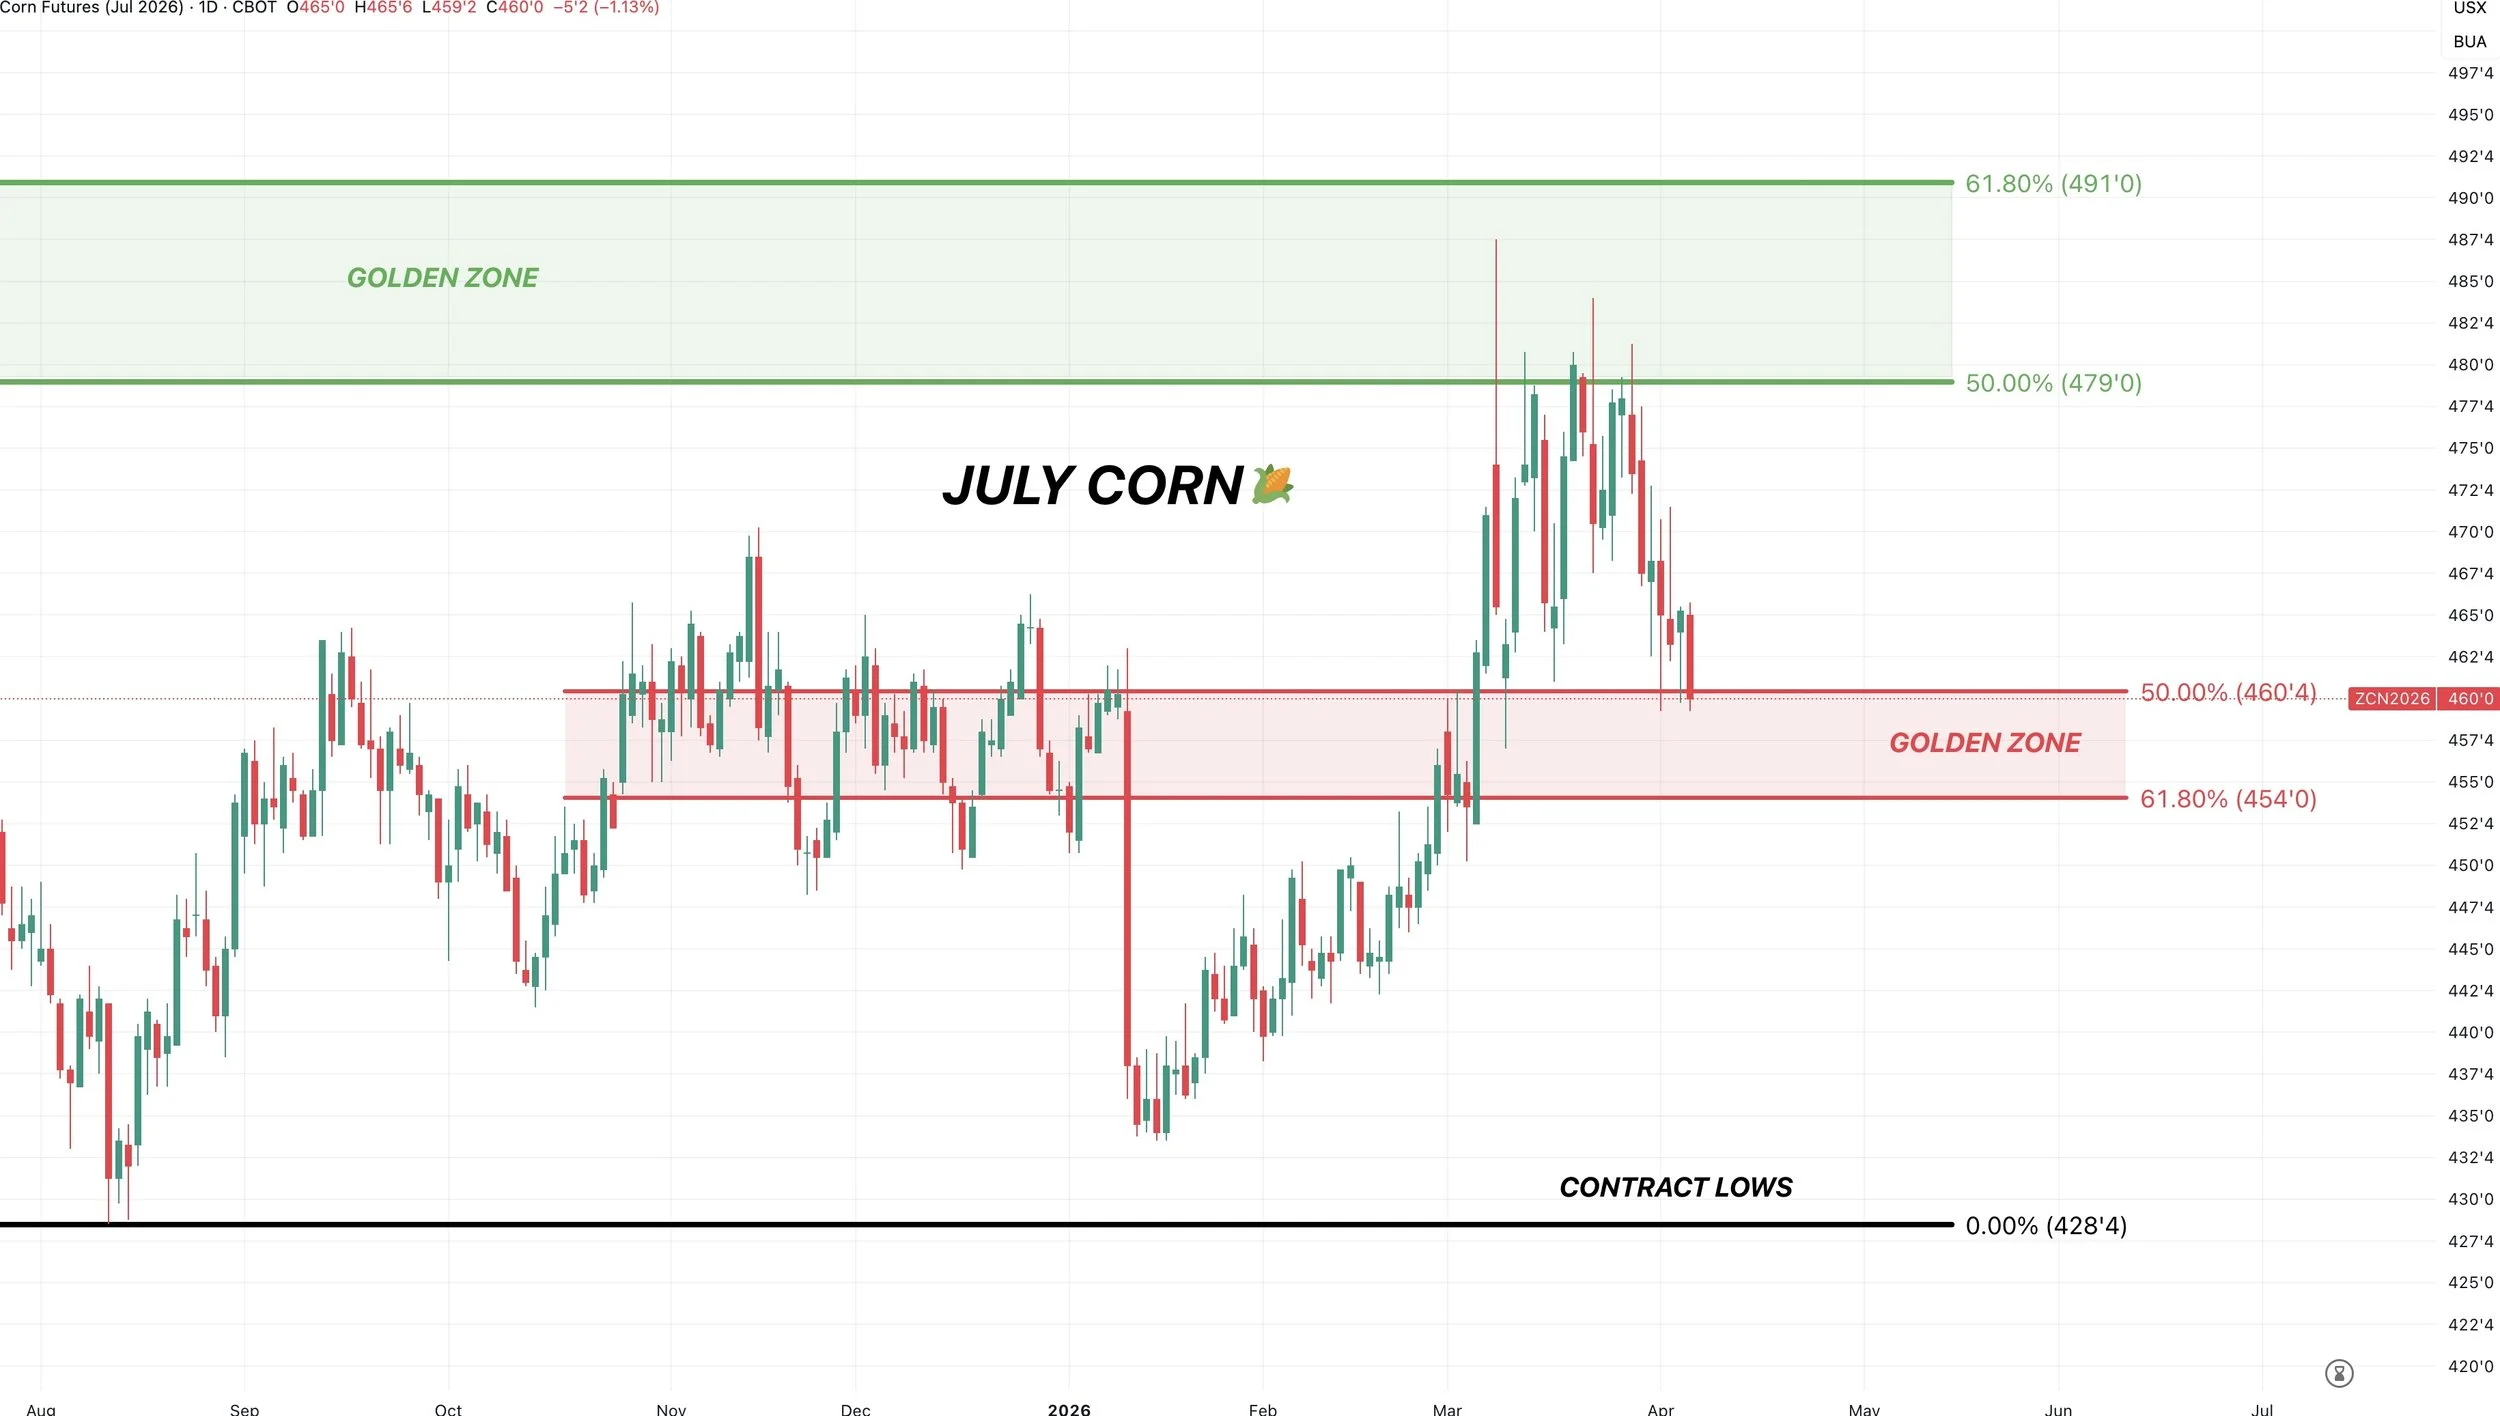
July Corn Chart:
Same story here.
Now in the golden zone where the market has a decision.
Again, if you're going to bounce this would be the area to do so.
The must hold level is $4.54 and 61.8% level.
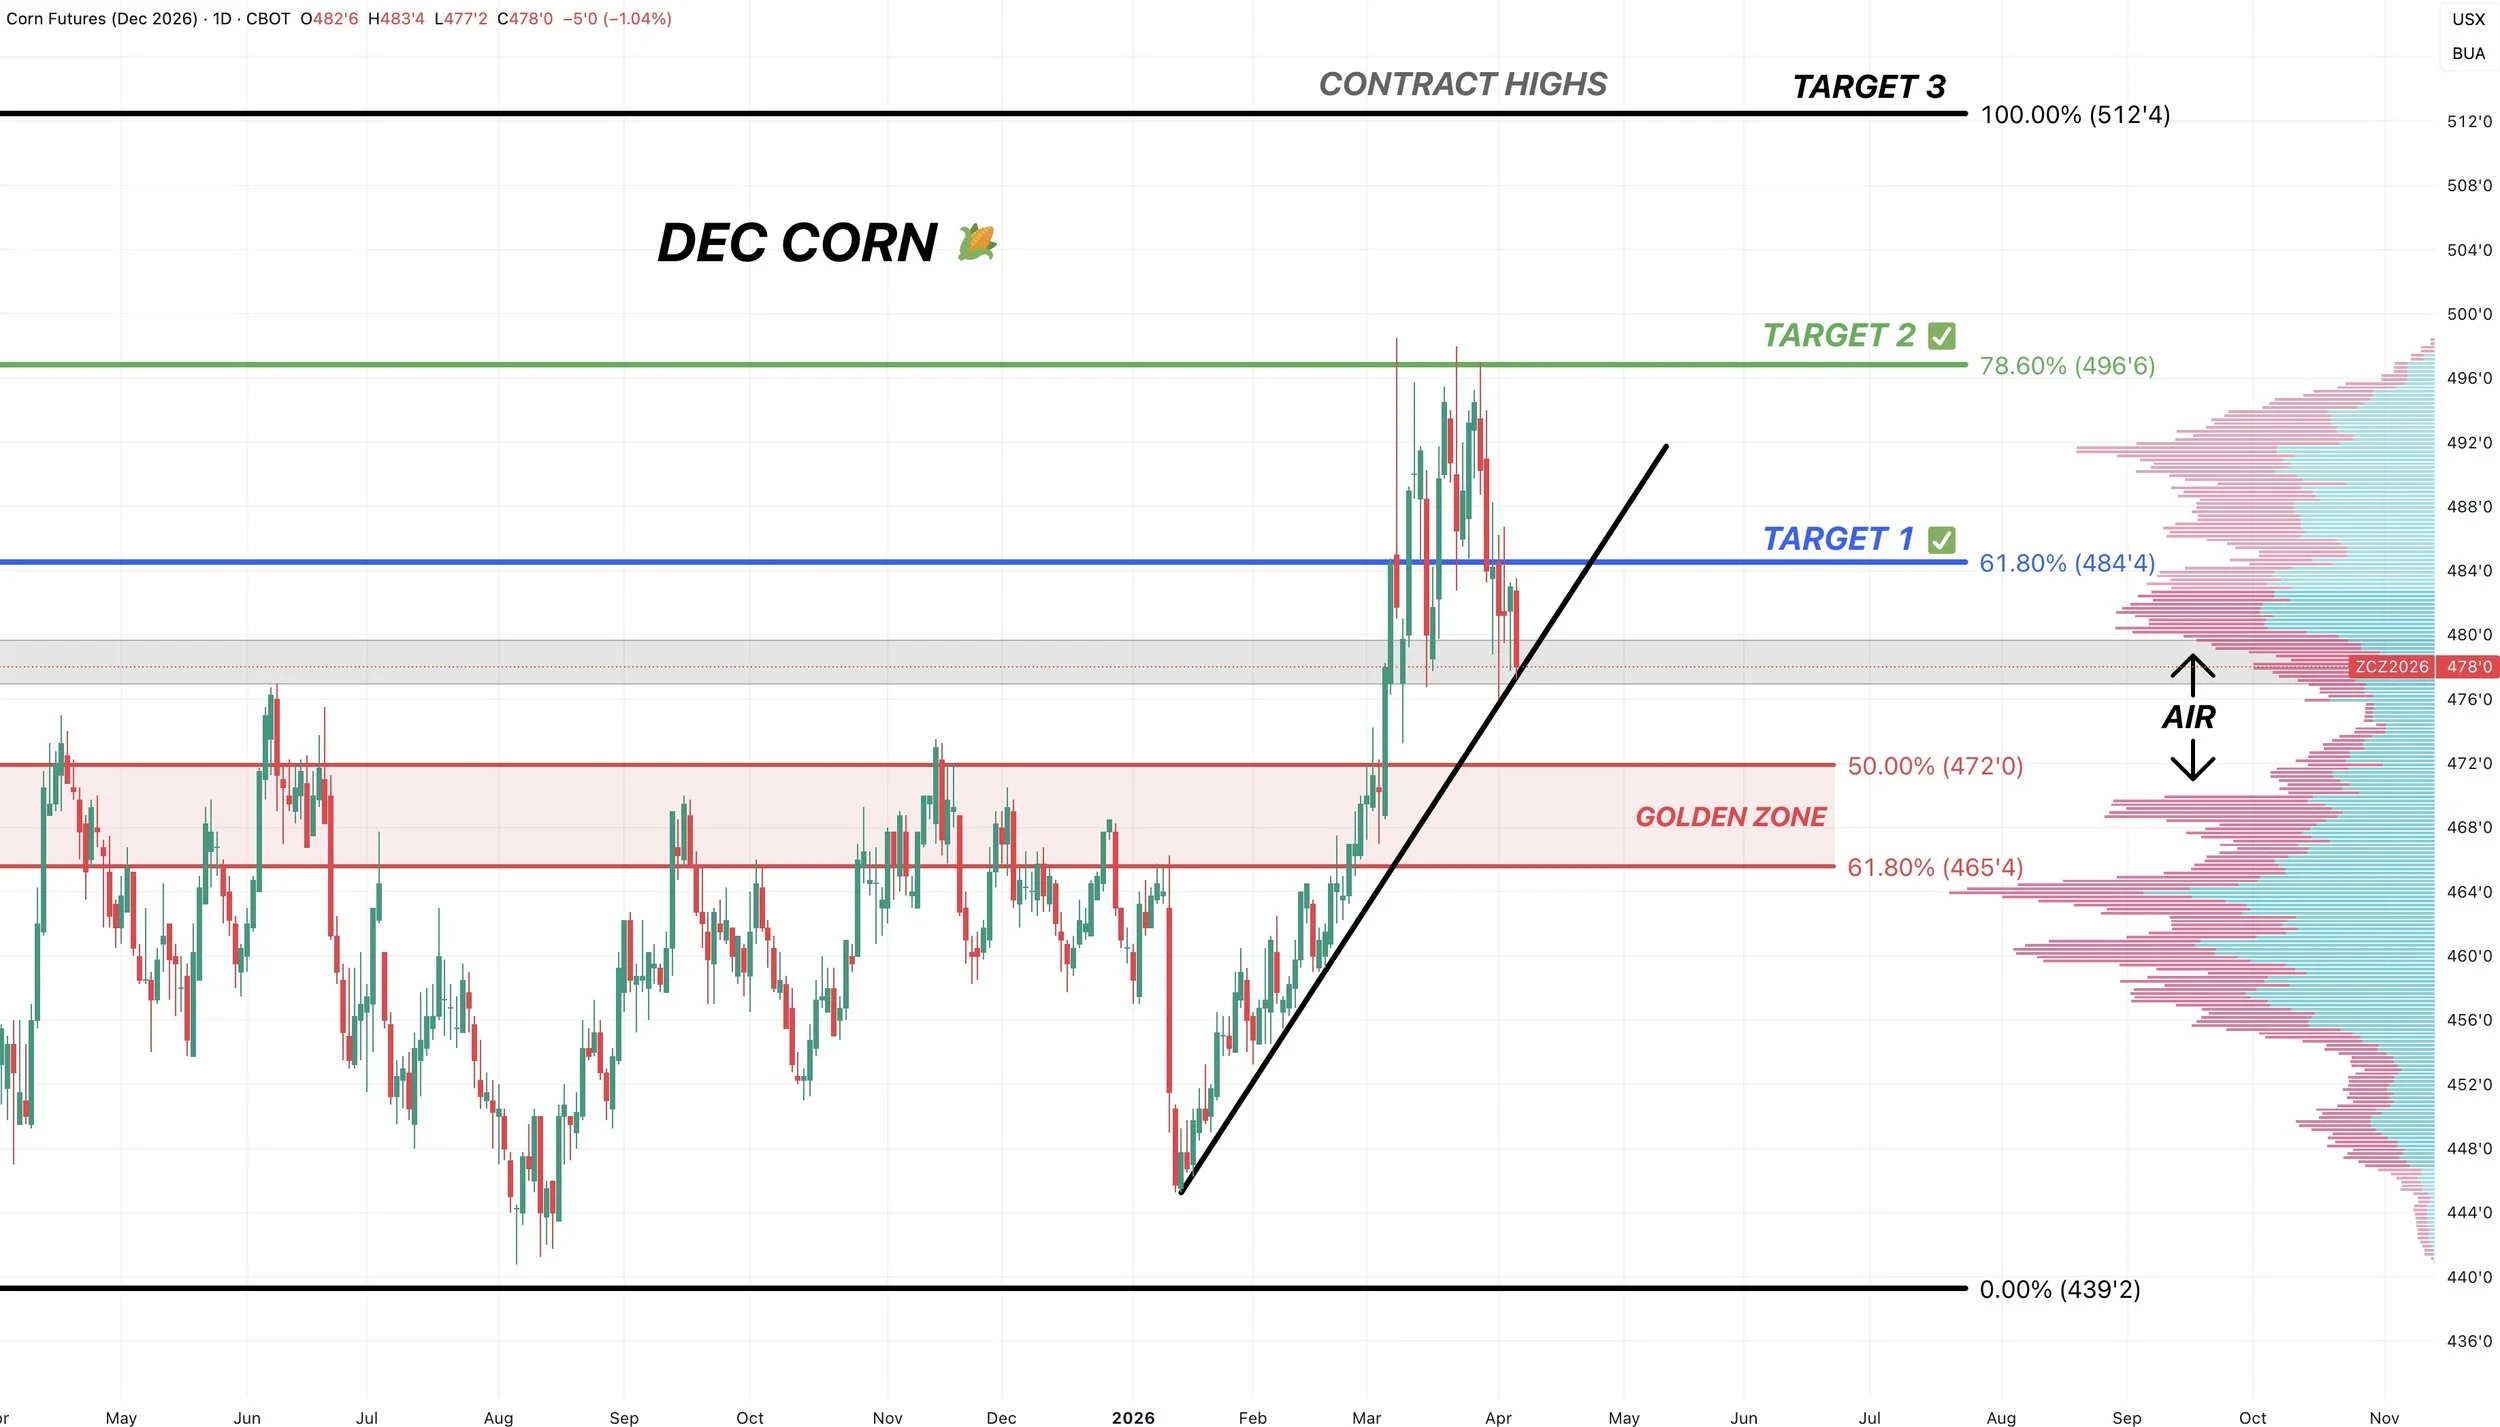
Dec Corn Chart:
Also in a pretty crucial spot.
Sitting at an area of high volume with a pocket of air below this level.
Also now hugging that trendline support we've respected for the last 3 months.
Need to bounce here or we could head towards that golden zone in the $4.65 to $4.72 range. Turning that old resistance into support.
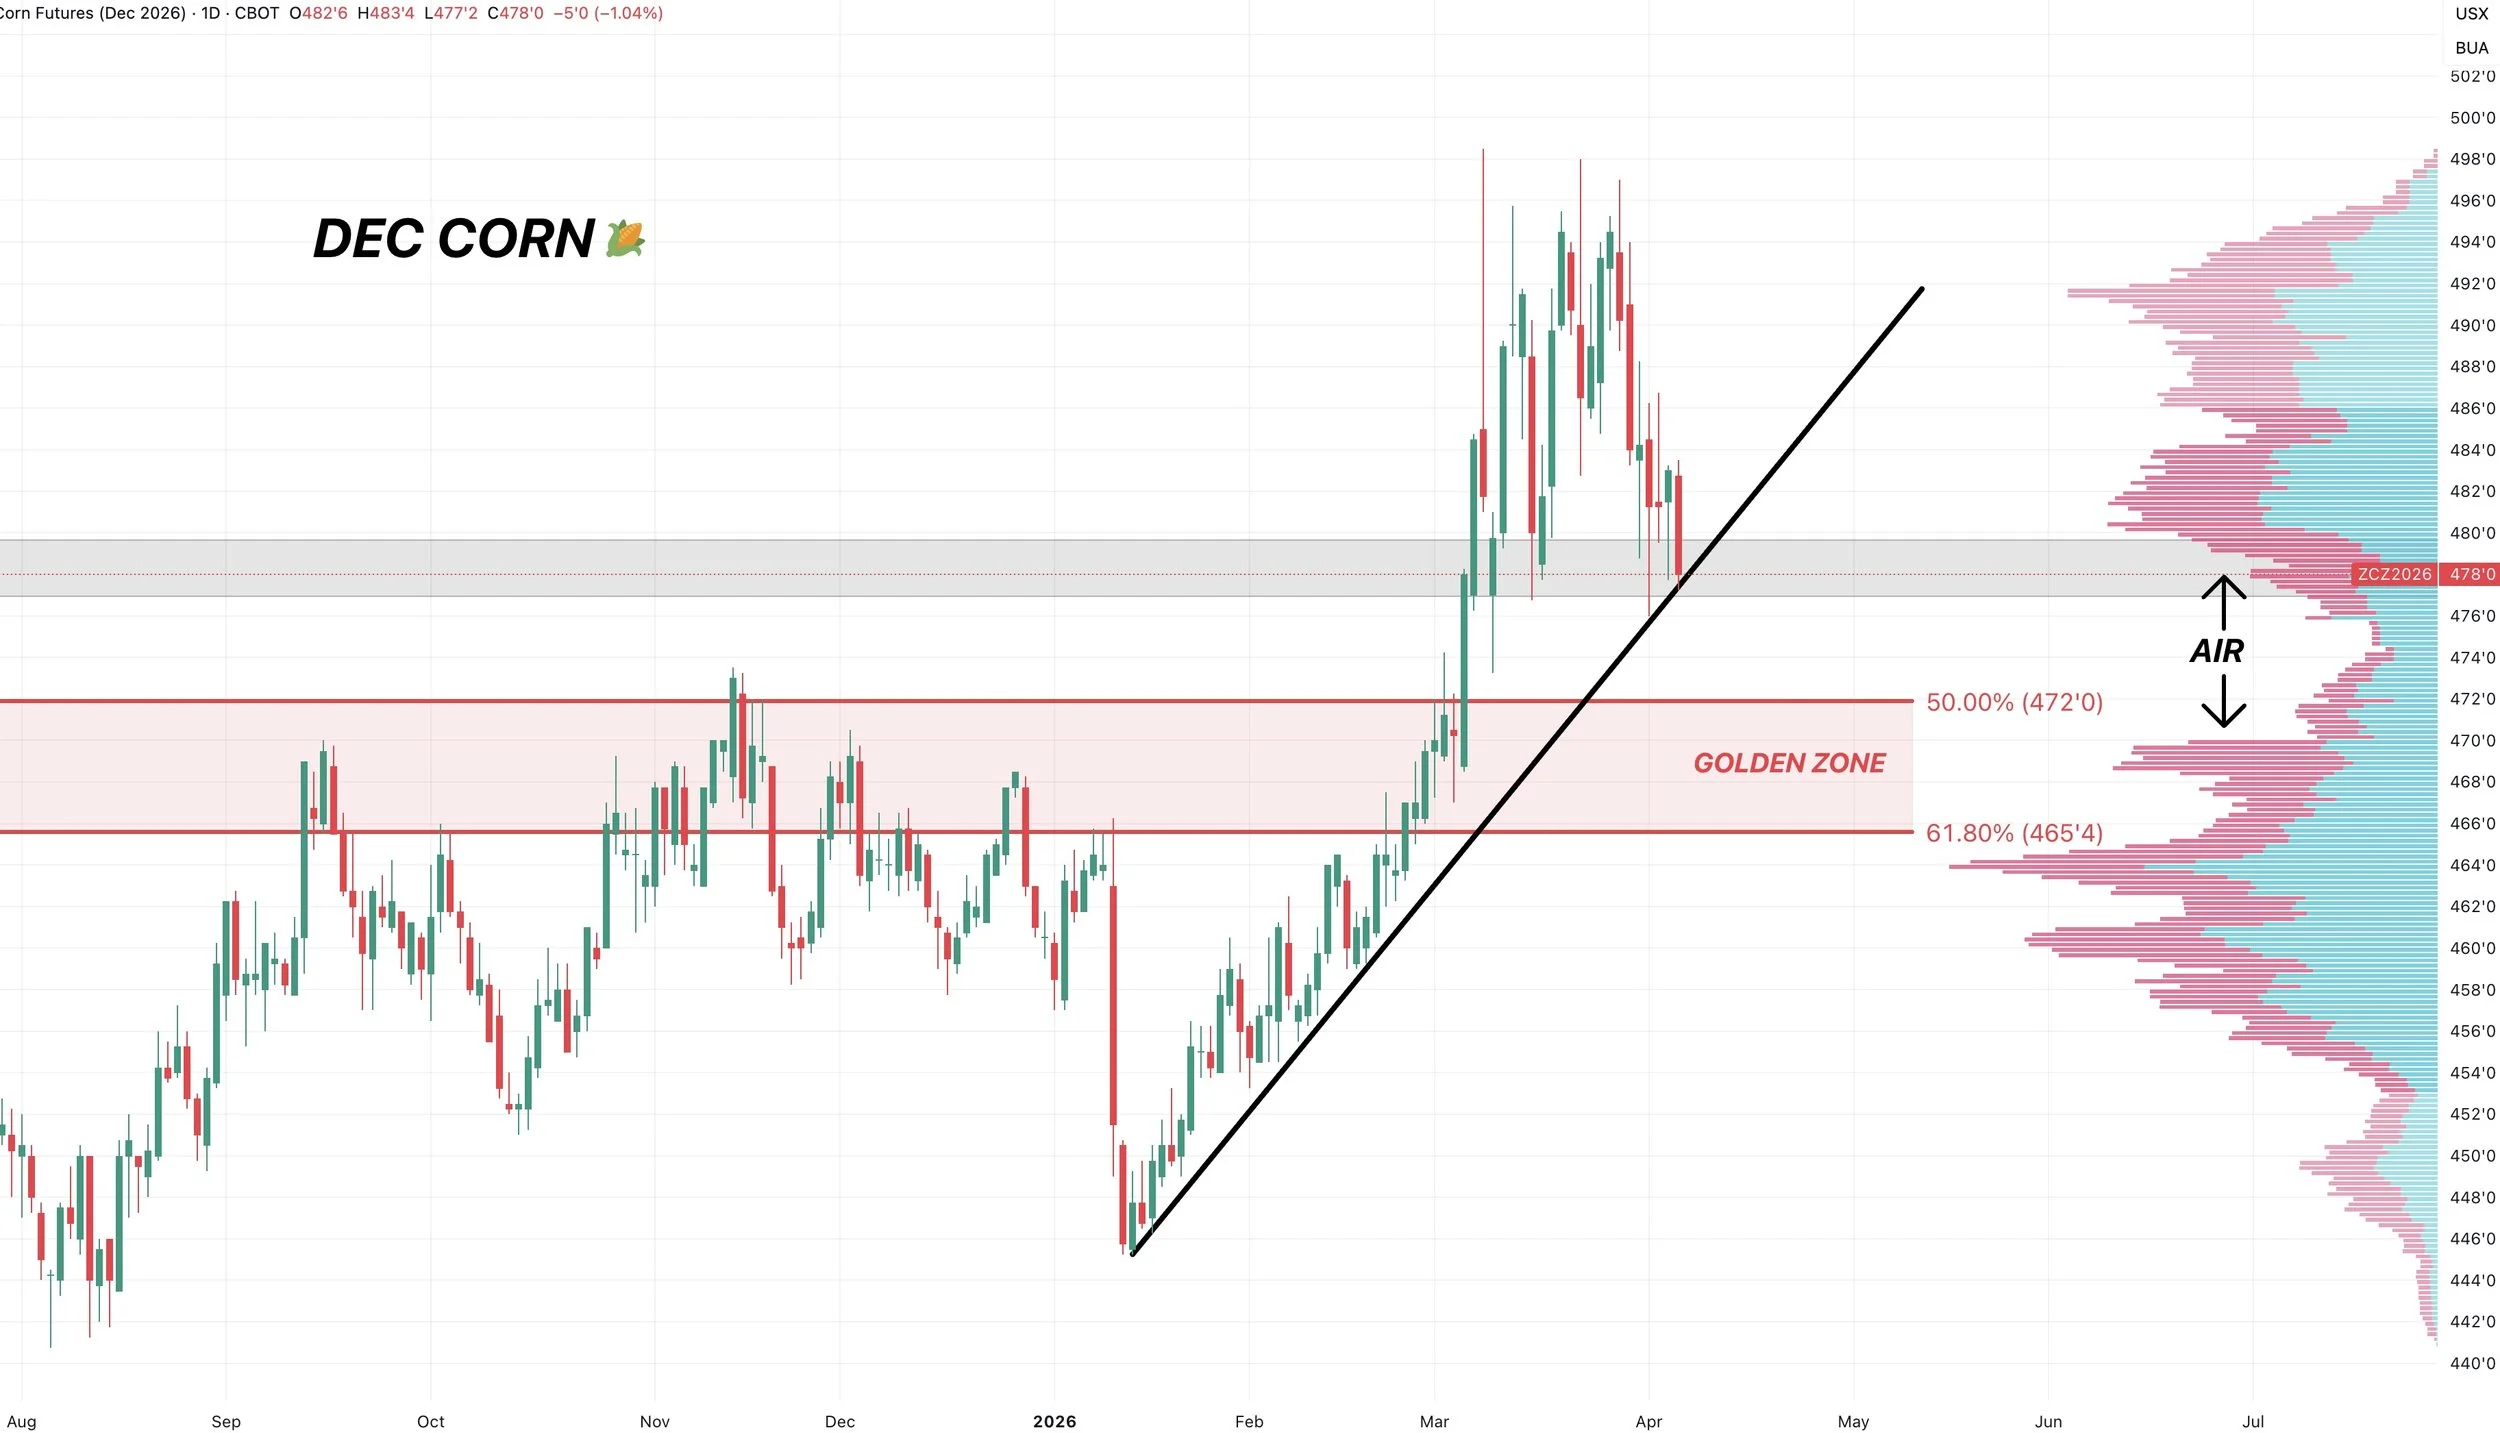
Here is a little more zoomed in view so you can see the trendline and volume gap.
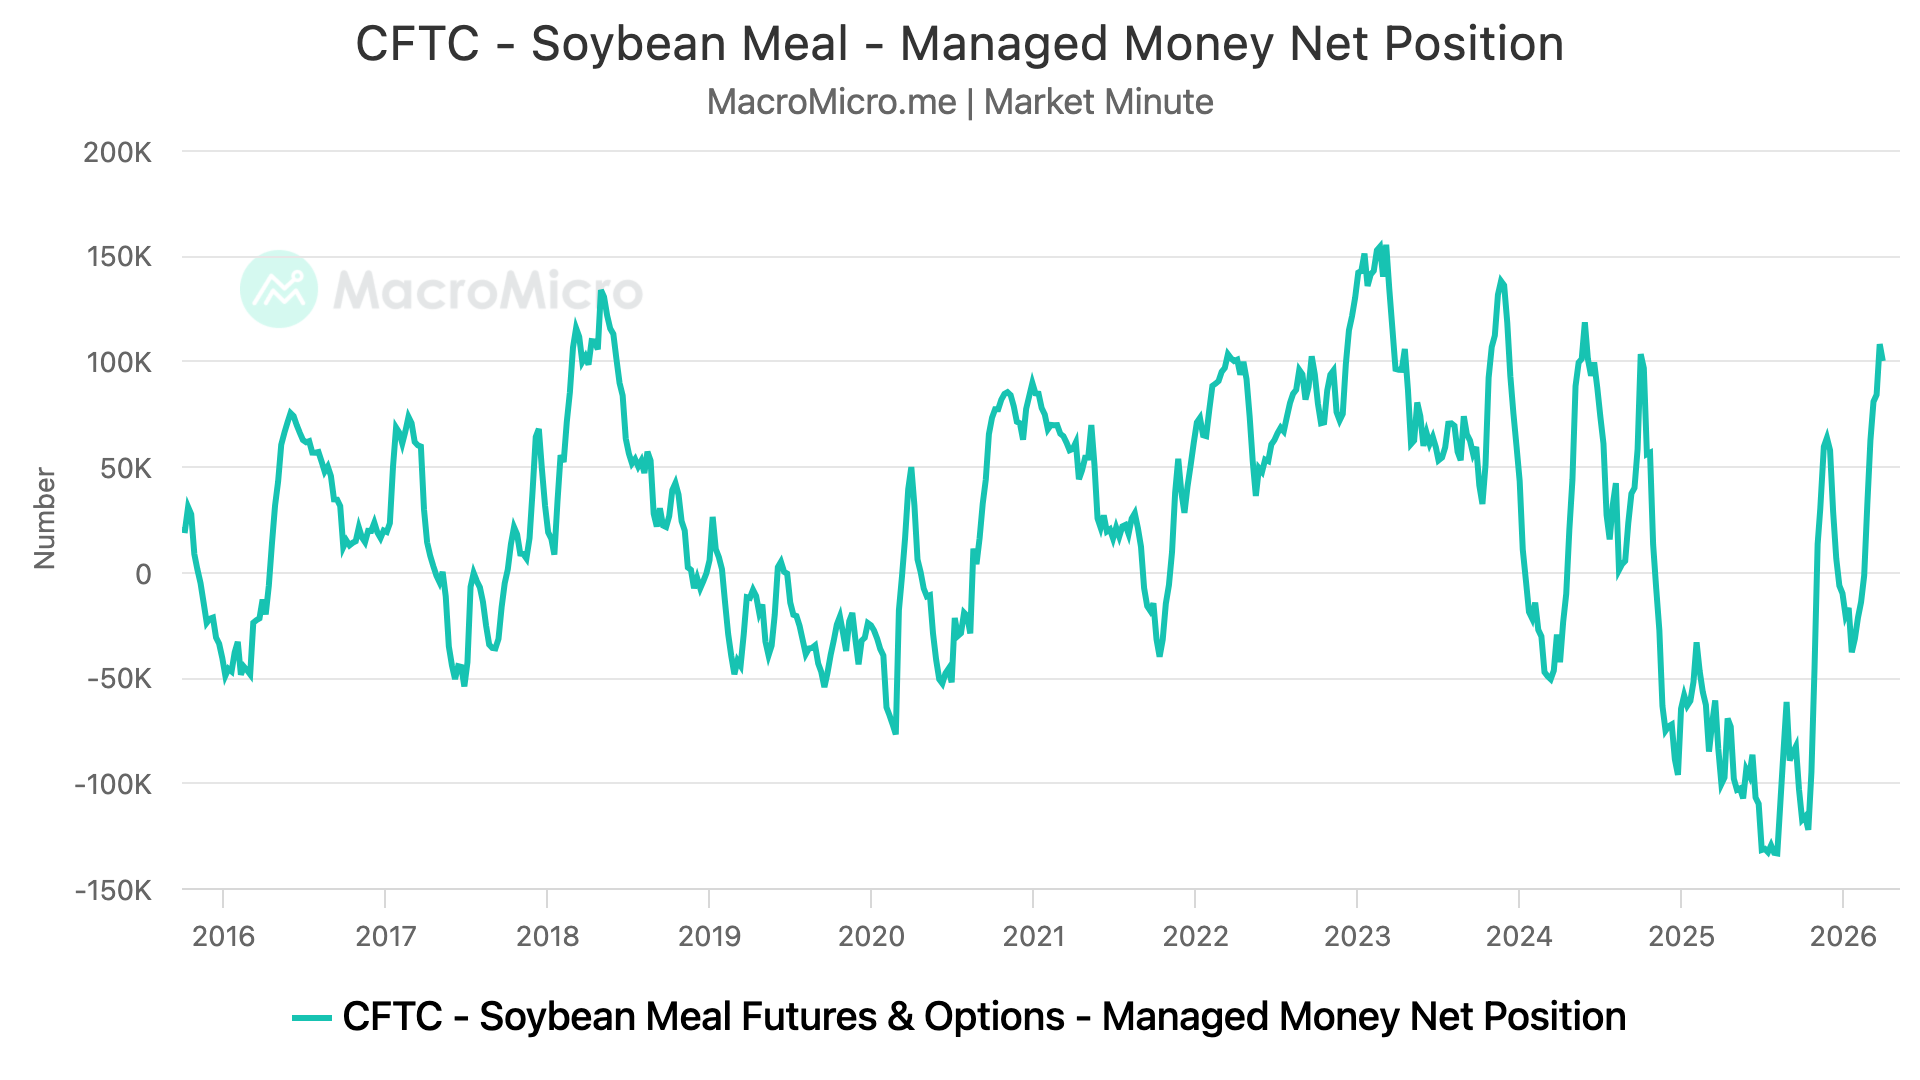
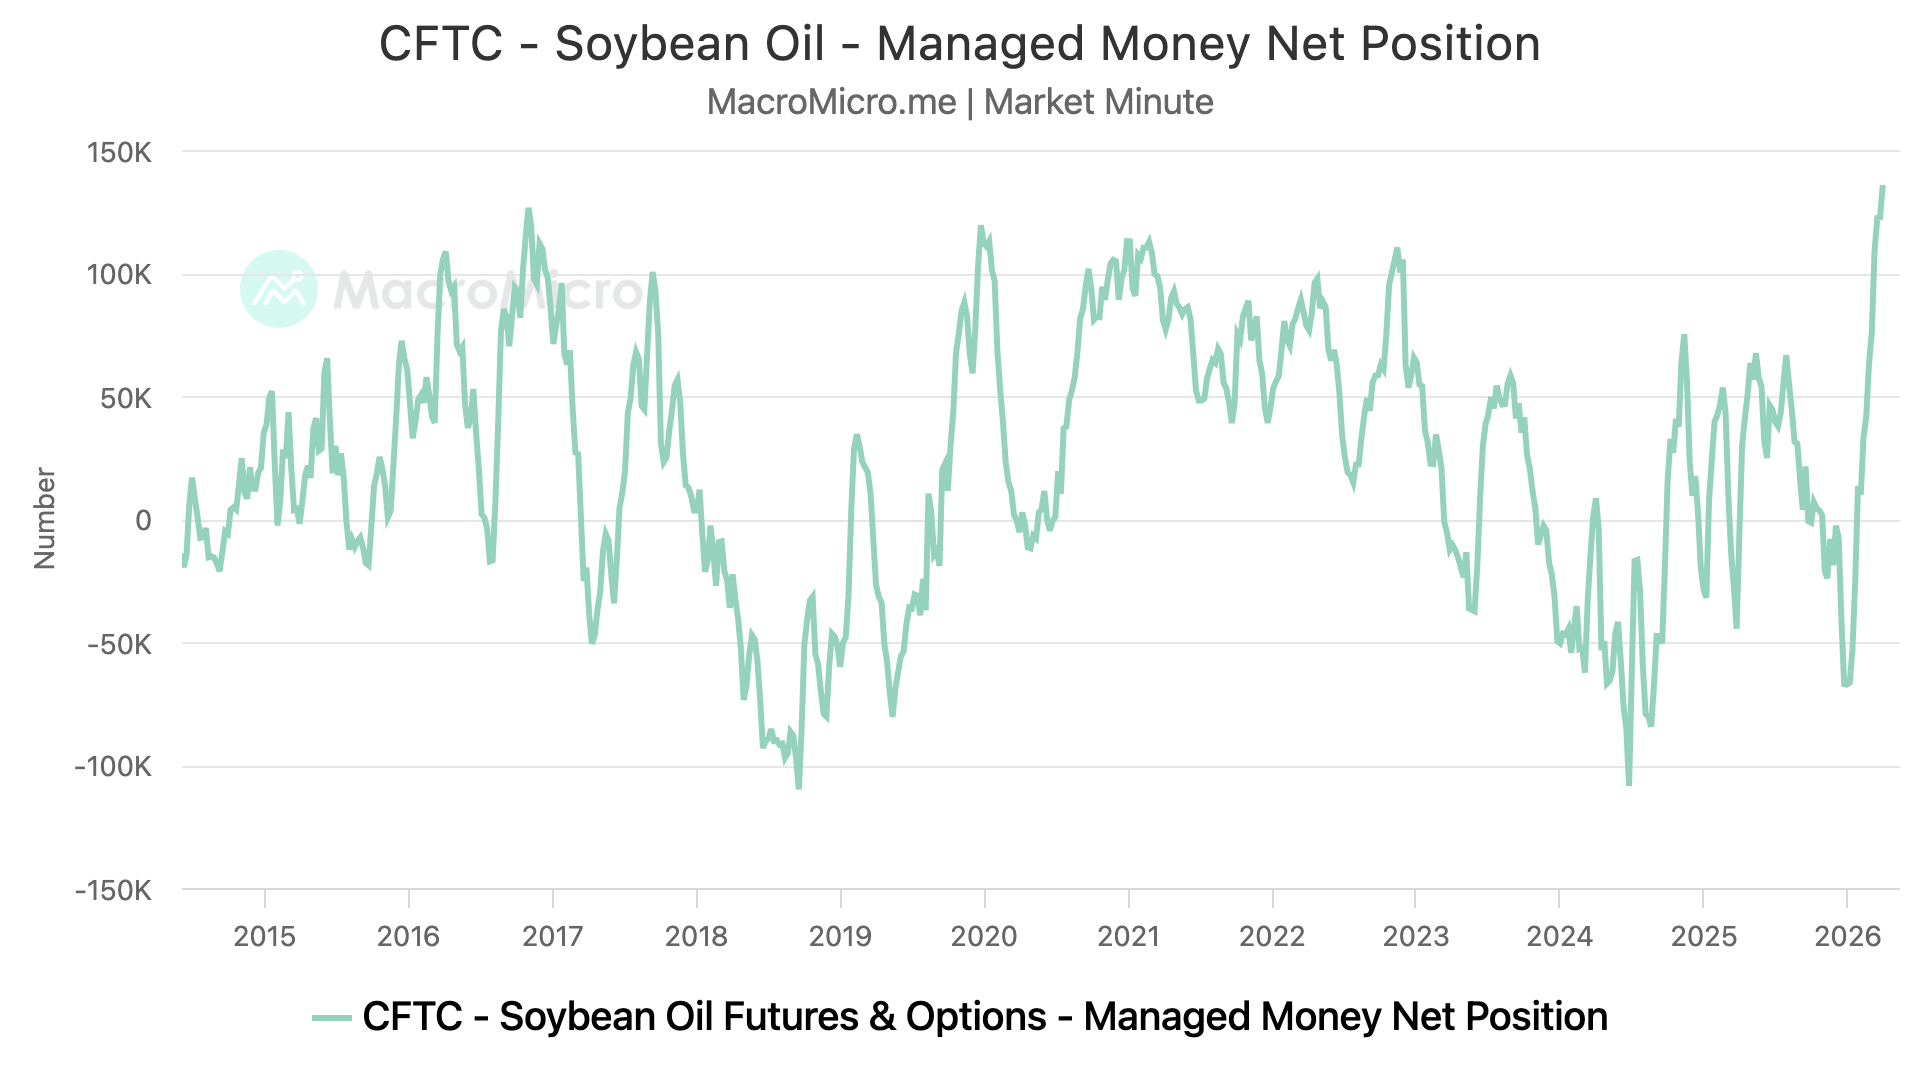
Soybeans
Not going to spend a ton of time on soybeans today, as there is a lack of fresh news.
The biggest concern has to be the funds.
I mean they are record long the entire soybean complex.
Nearly record long soybeans, meal, and bean oil.

A lot is still going to ride on China with that meeting in May.
Will they start buying some soybeans ahead of time or not?
You could argue that the sooner the war ends, the sooner China comes back to the table.
The biggest thing I'm watching right now is simply the charts.
Soybeans have been sideways for weeks and look like they're coiling up for a move here soon.
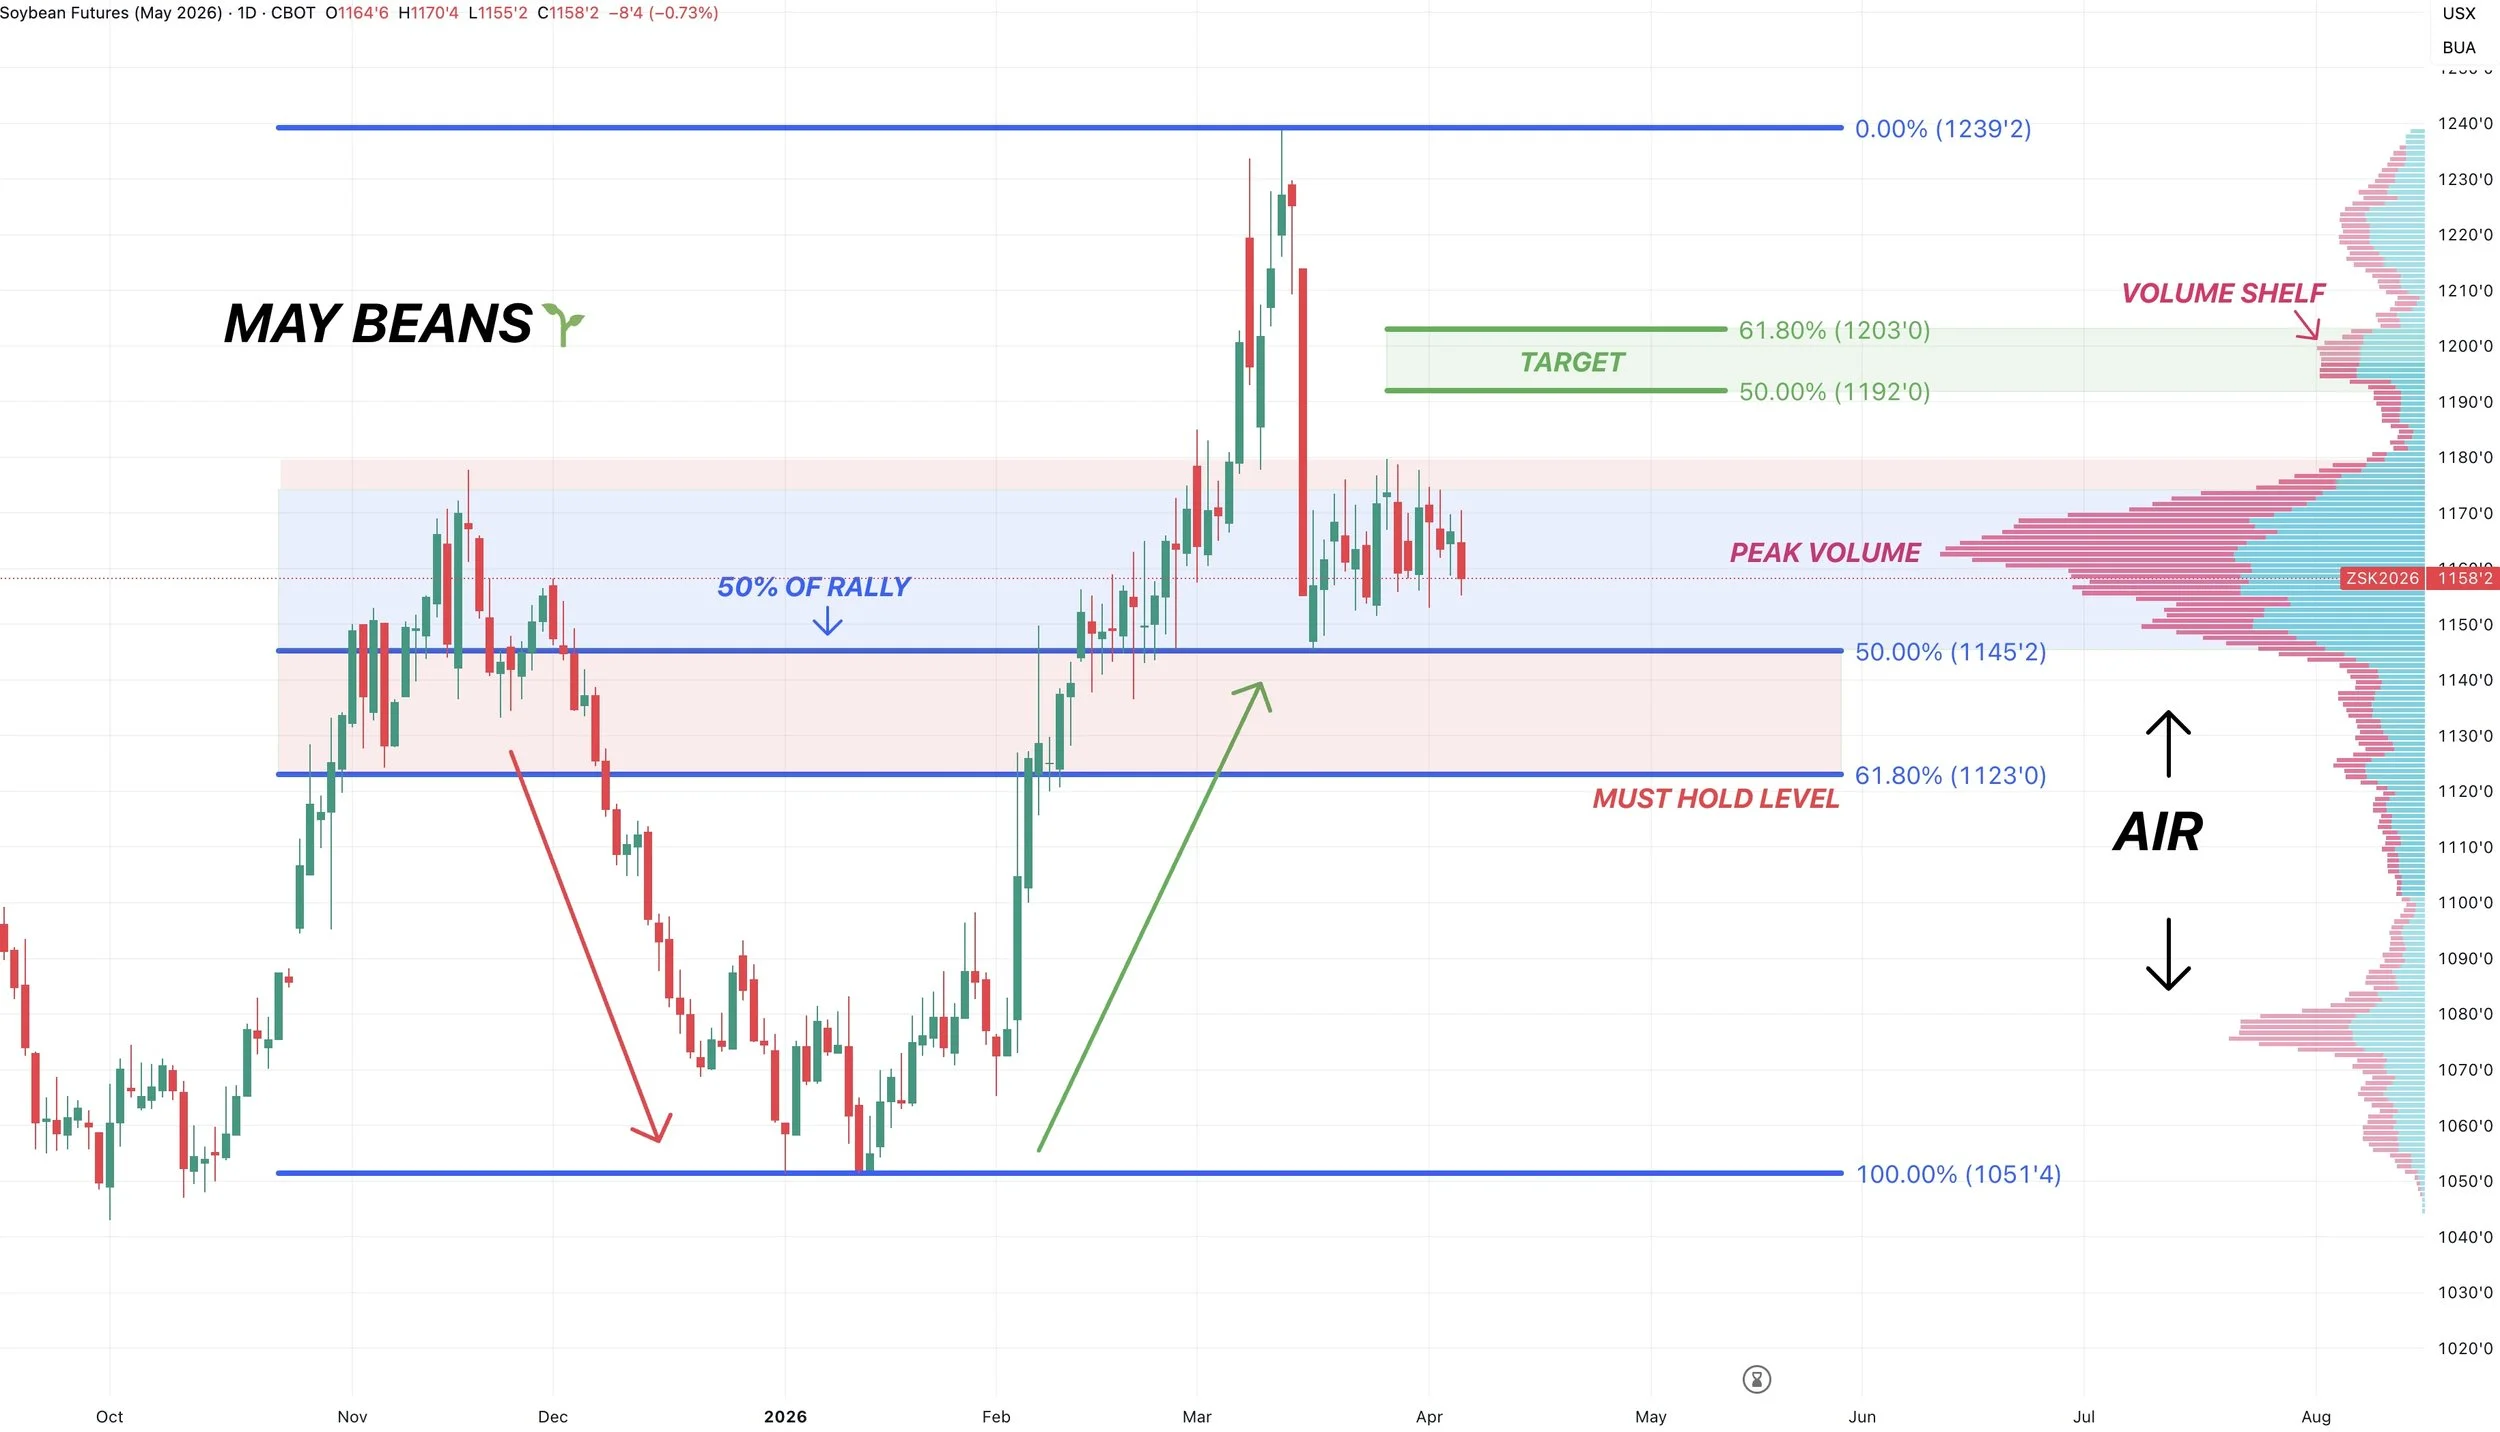
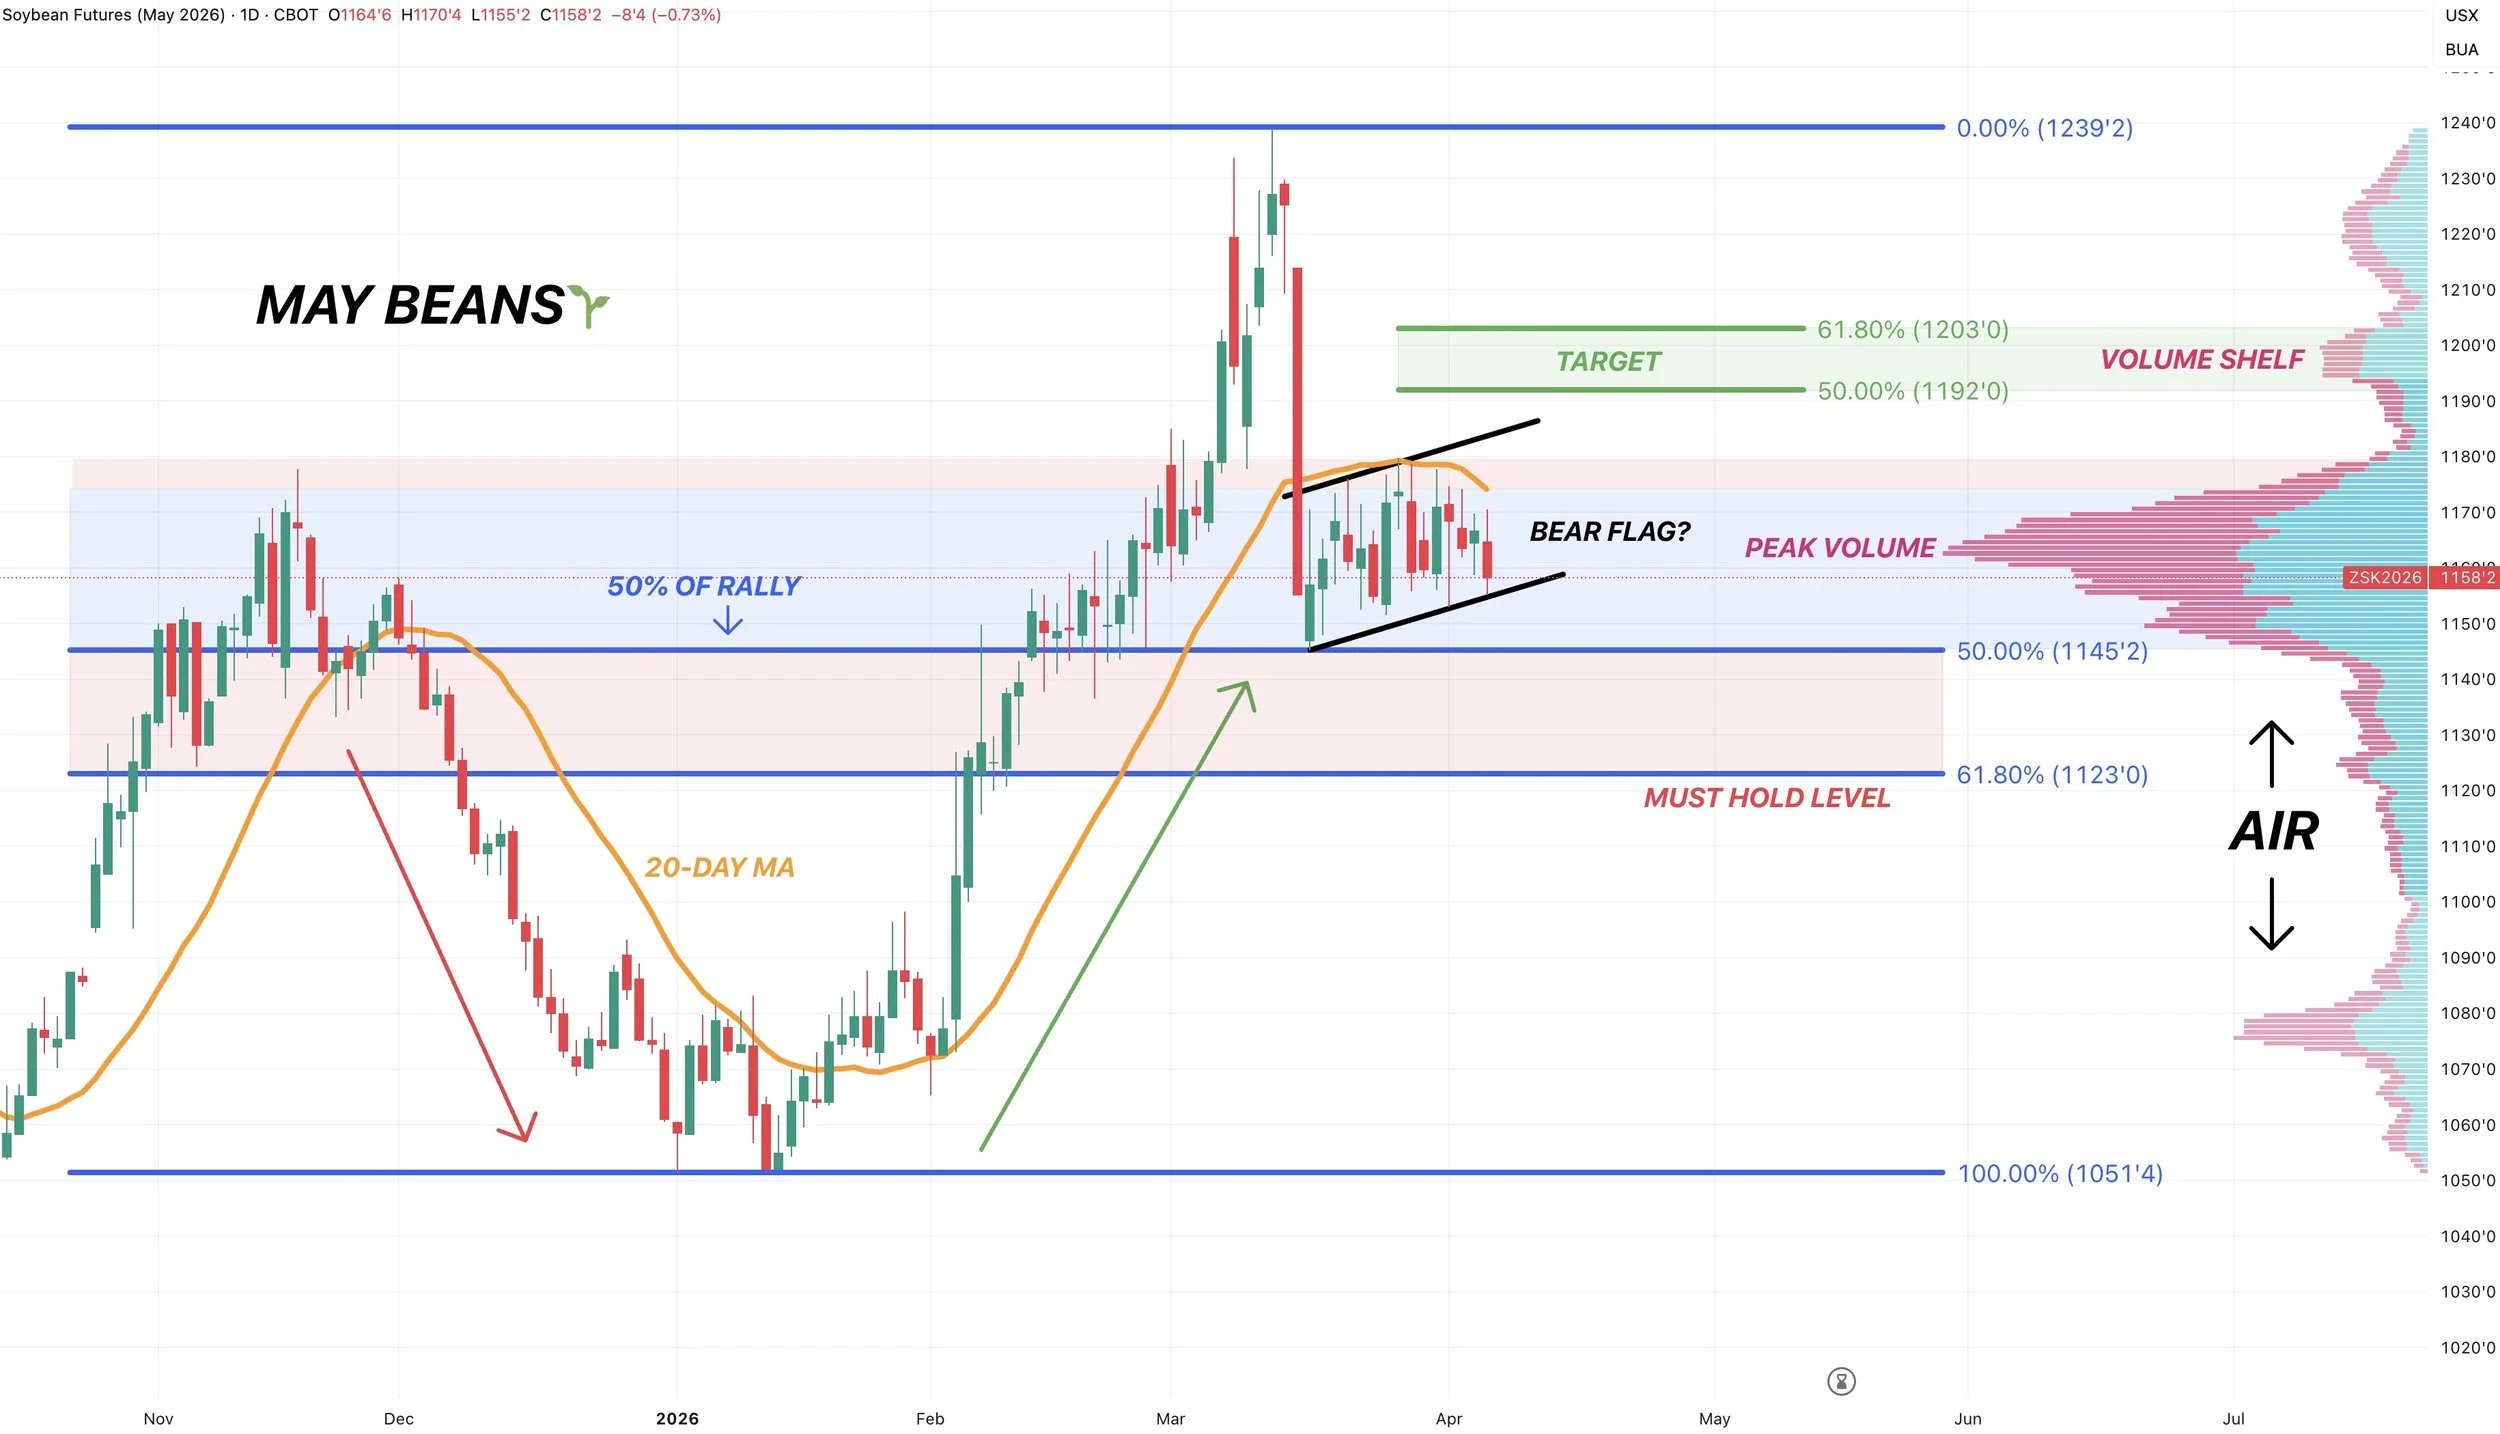
May Beans Chart:
Like I mentioned, we've been trapped in a sideways range for weeks.
Whichever direction we break out of will of course tell us what comes next.
When a market chops around in an area of high volume, it often just tells us that it is waiting for a catalyst.
We are coiling waiting for the next breakout higher or lower.
We are still sitting at an area of high volume. With no support beneath $11.45
So that is the level we still need to hold or it opens the door lower.
We do have a possible bear flag pattern here we have to be watching.
I added the 20-day MA on this chart. We've rejected it every single time on this sideways chop.
Crack above that and we should go and test $11.90 to $12.00 which would claw back 50-61.8% of the sell off.
If that comes, that will be a level to look to reward. As that is where many relief bounces can often fail.
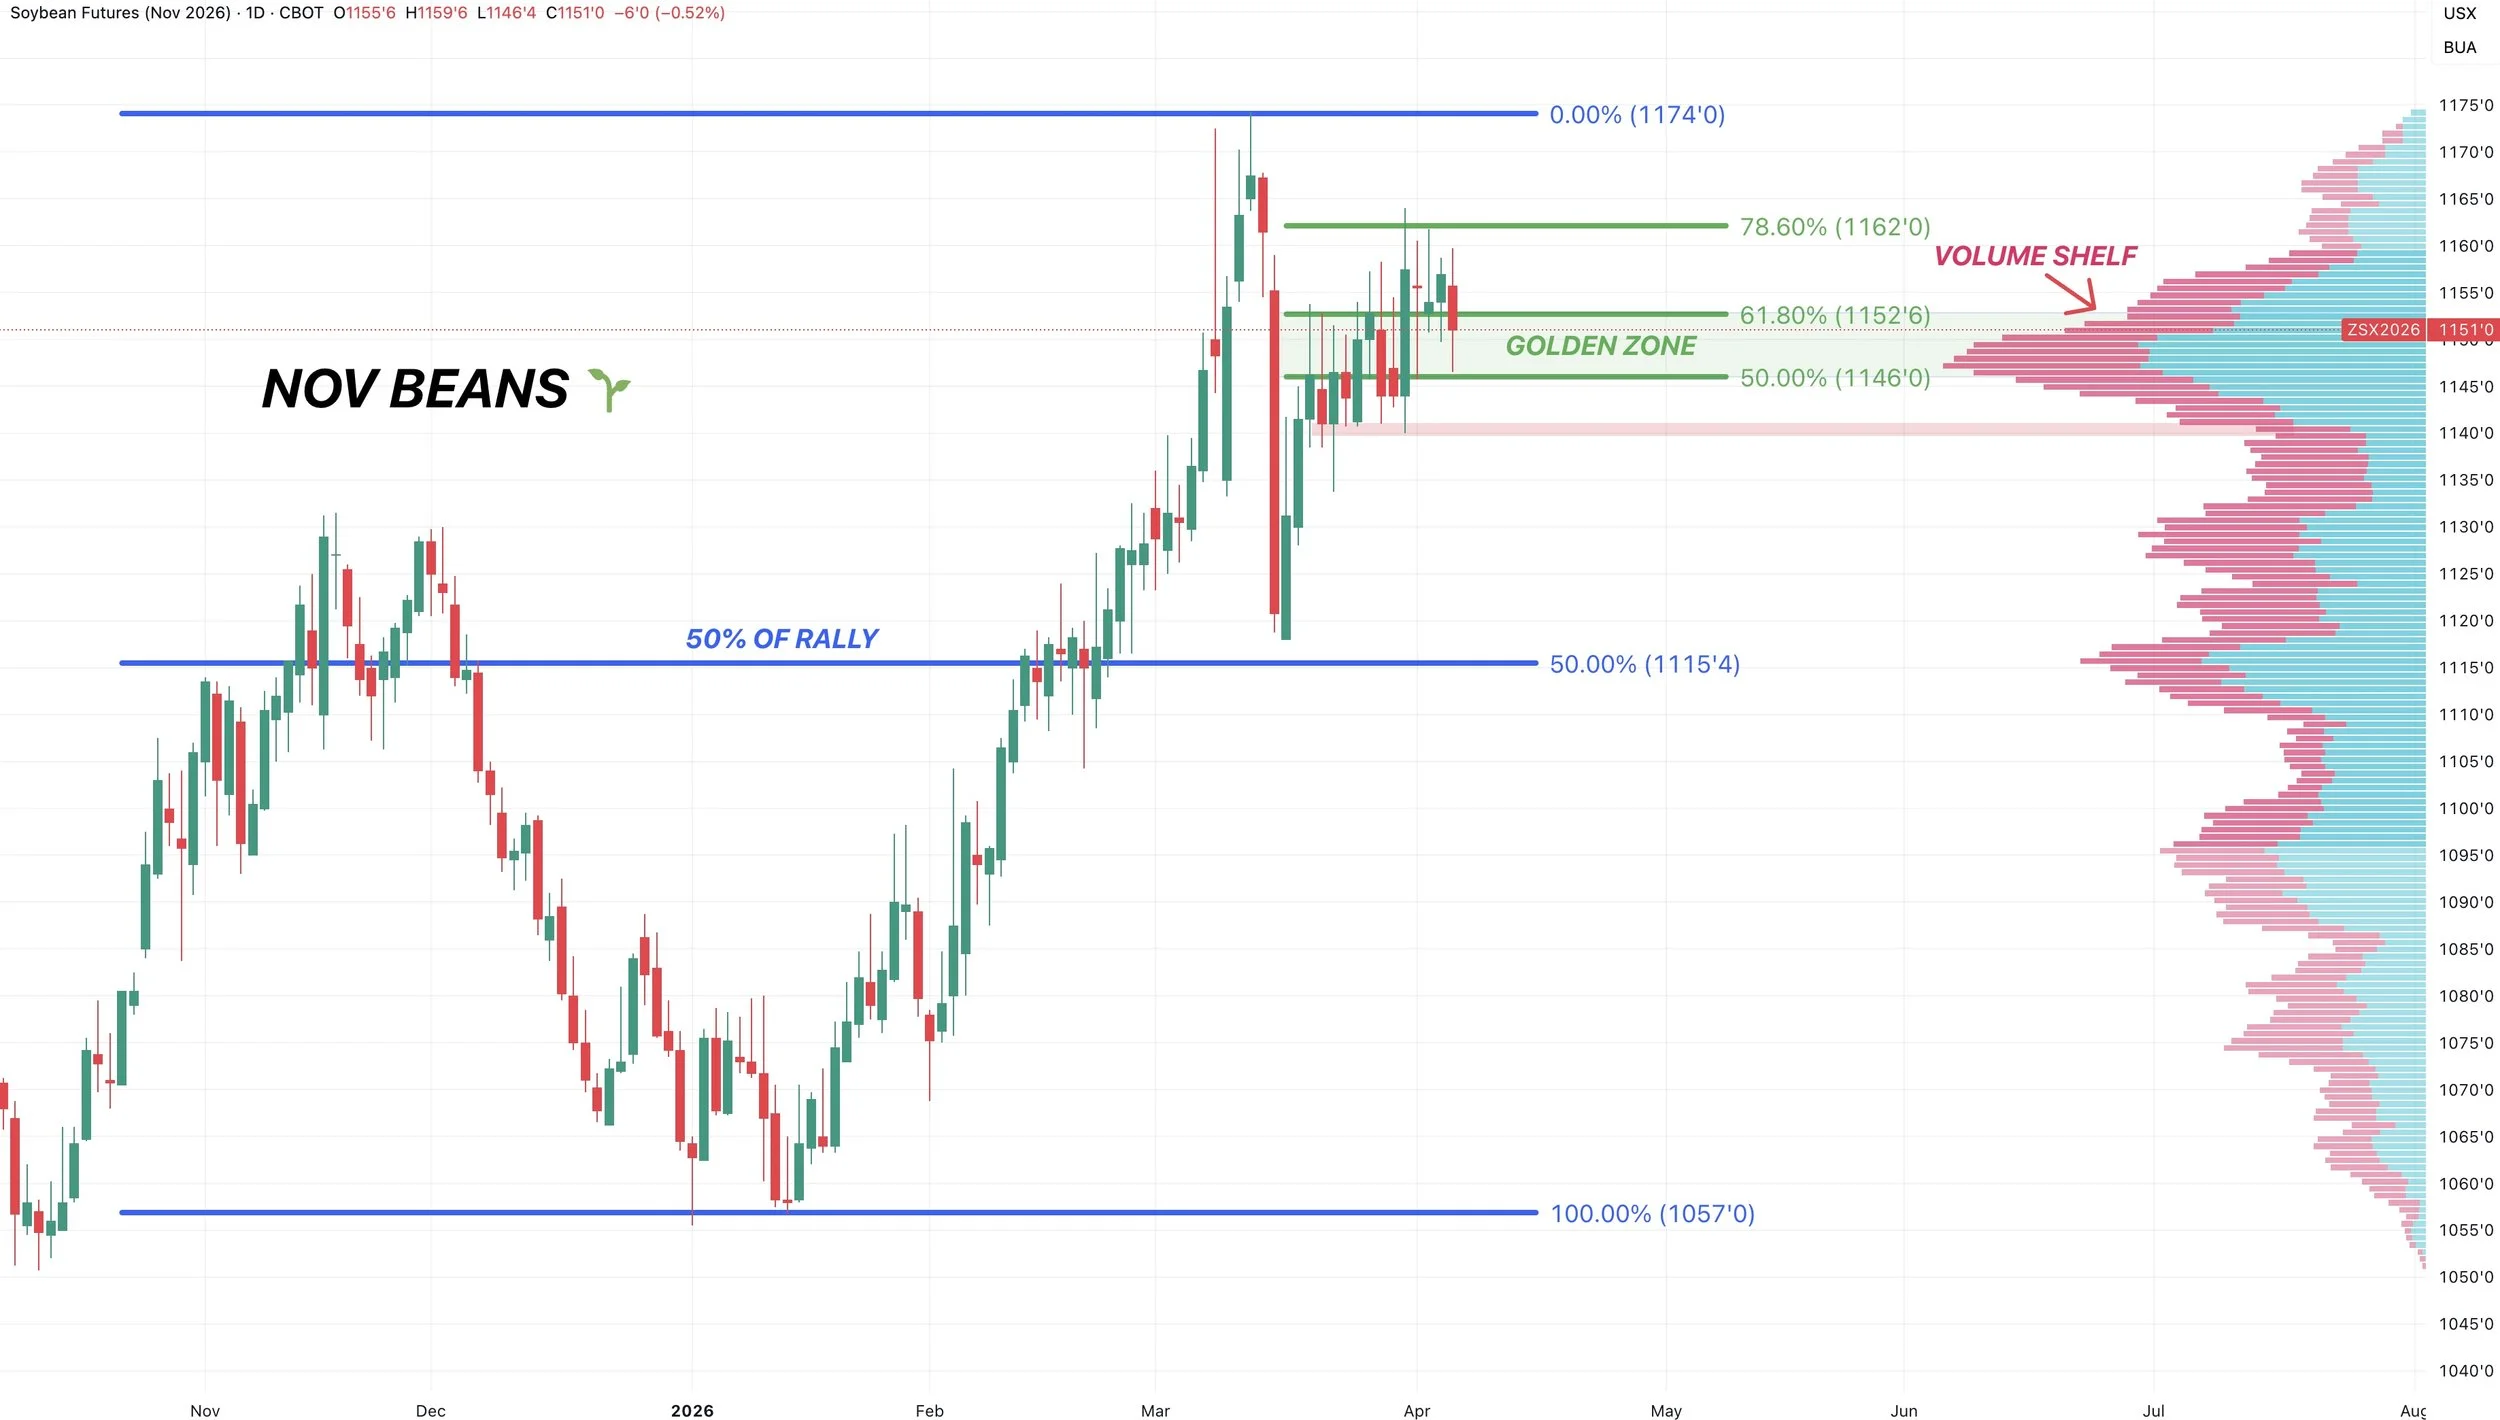
Nov Beans Chart:
New crop still near the highs.
We already rewarded this market at this level, as this is where relief bounces can fail.
Need to see us continue to hold $11.40 and this area of high volume.
Wheat
Problems in the Plains:
There are some clear concerns in this winter wheat crop.
Yesterday we saw our first round of crop ratings.
Take a look at the plains G/E rating vs last year.
National: 35% vs 48%
Colorado: 12% vs 63%
Oklahoma: 12% vs 42%
Texas: 17% vs 26%
Nebraska: 19% vs 37%
Montana: 21% vs 59%
S. Dakota: 32% vs 18%
Kansas: 38% vs 51%
Here is a chart that shows yesterday's ratings and how they stack up compared to last year and the 5-year average.
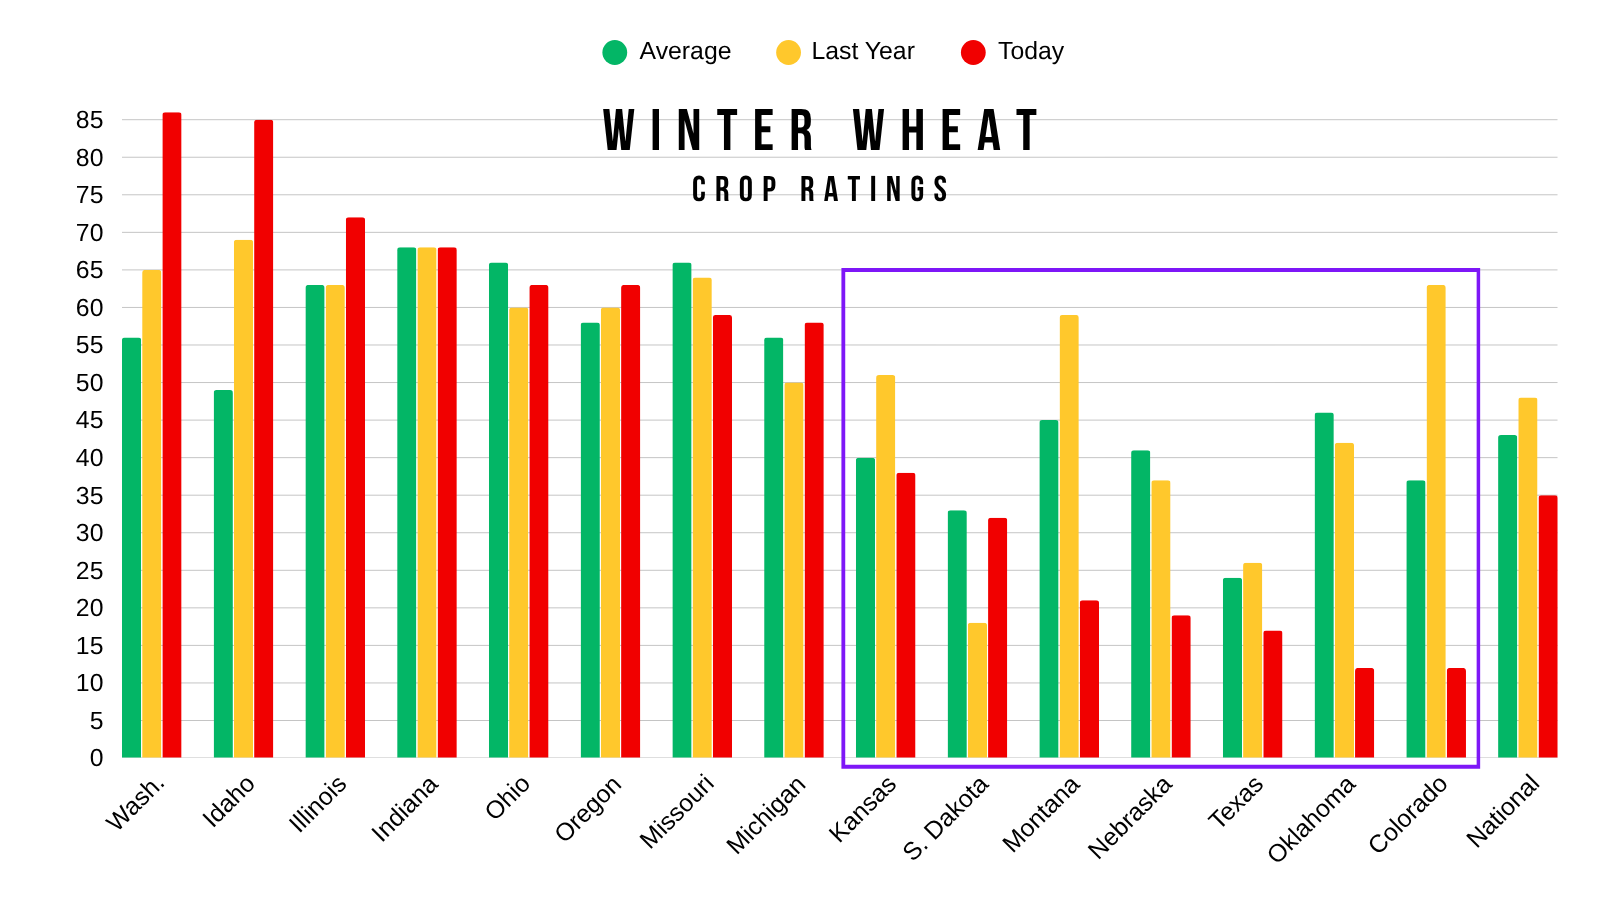
Those are some ugly starting ratings.
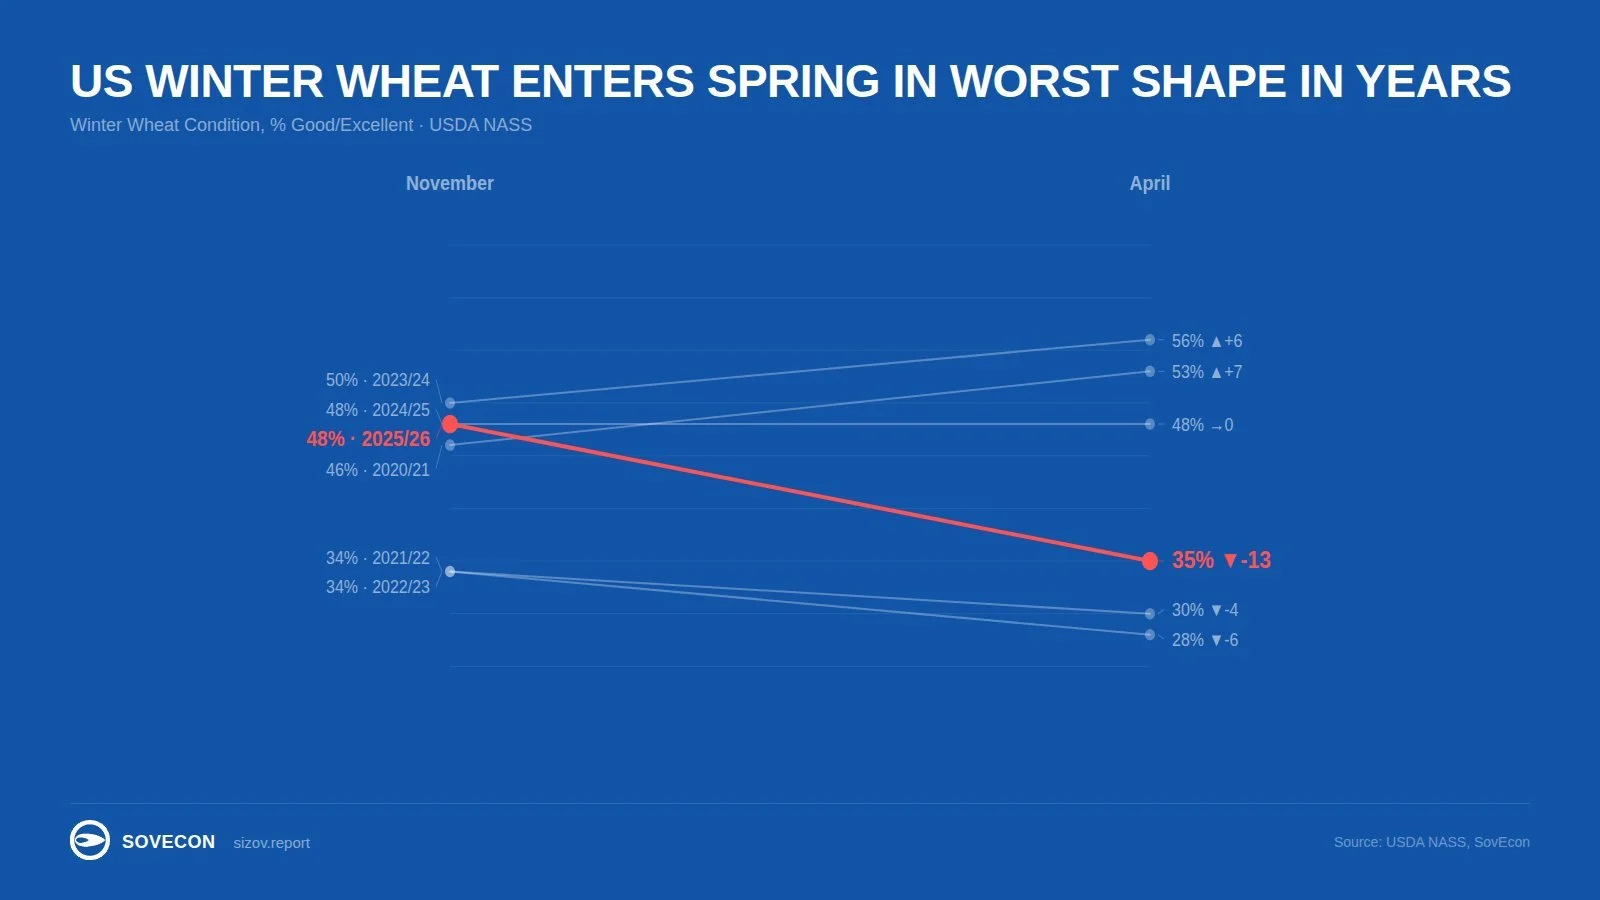
Down 13% from November.
This was the biggest drop over winter in 4 years.
We are entering spring with our worst conditions since 2023.
Here is a nice chart from Andrey Sizov showcasing that.
(Chart from @sizov_andre on X)
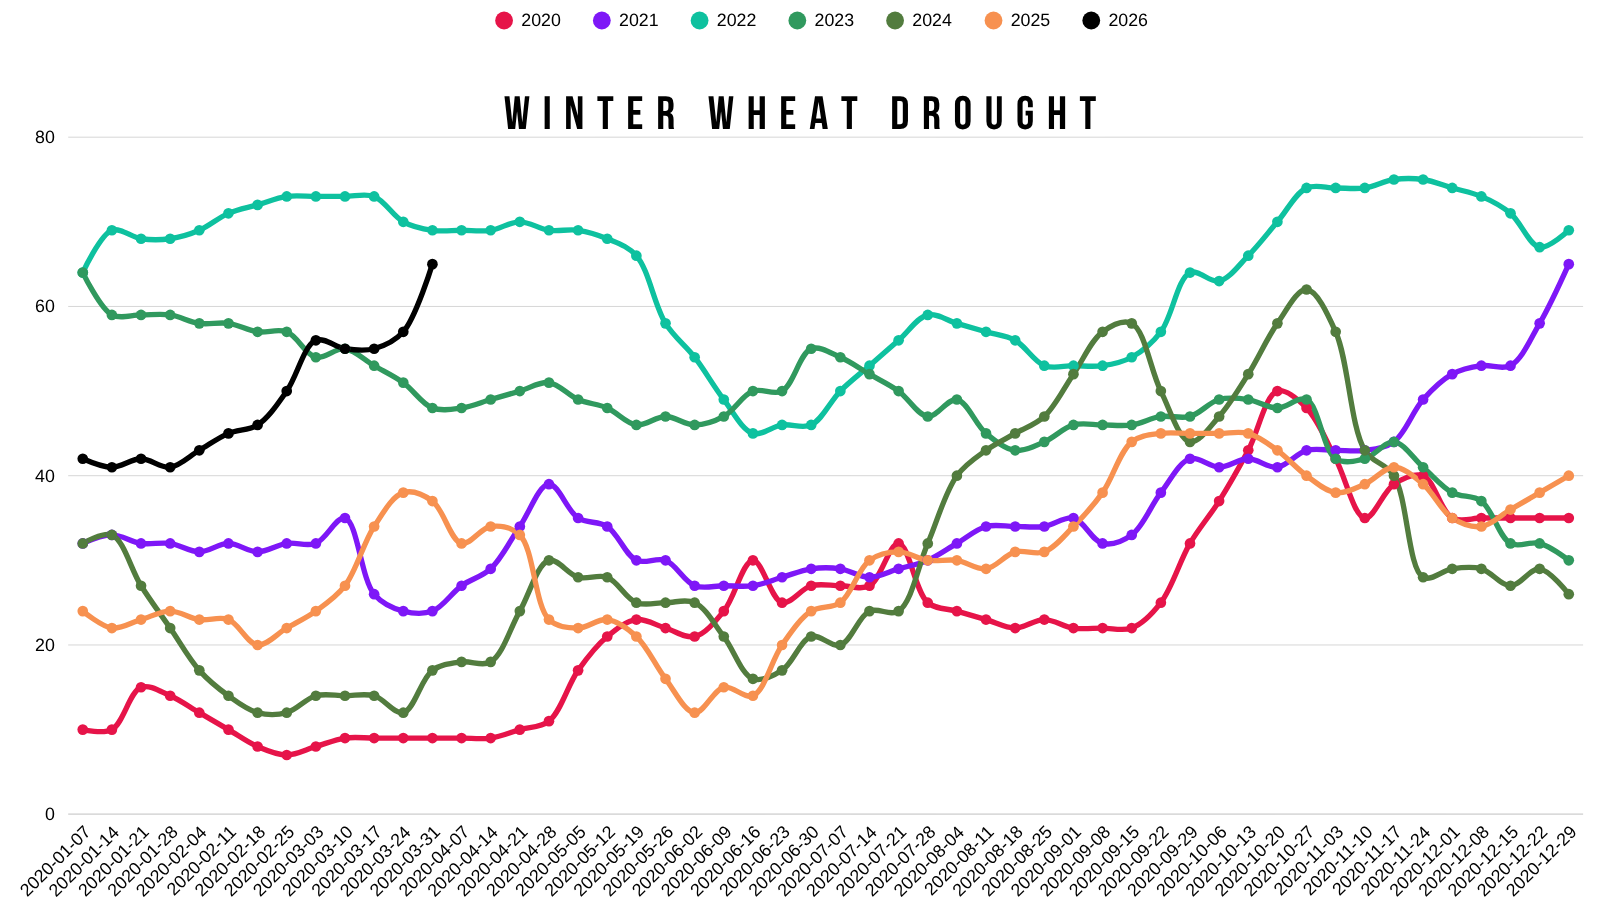
If we look at drought, it's been ramping up all year long.
Winter wheat areas in drought sit at 65%.
Which is the highest levels of drought we've seen since 2022.
Despite this.. the wheat market traded lower today.
Why?
The poor ratings weren’t a surprise to the market and the market sees rain in the forecasts.
It is called a "futures" market after all.
Given that this is one of the worst starts in years, if it starts to rain this could easily be one of the lowest ratings we’re going to see.
But it's clear the crop is going to need some rain or things could get pretty problematic.
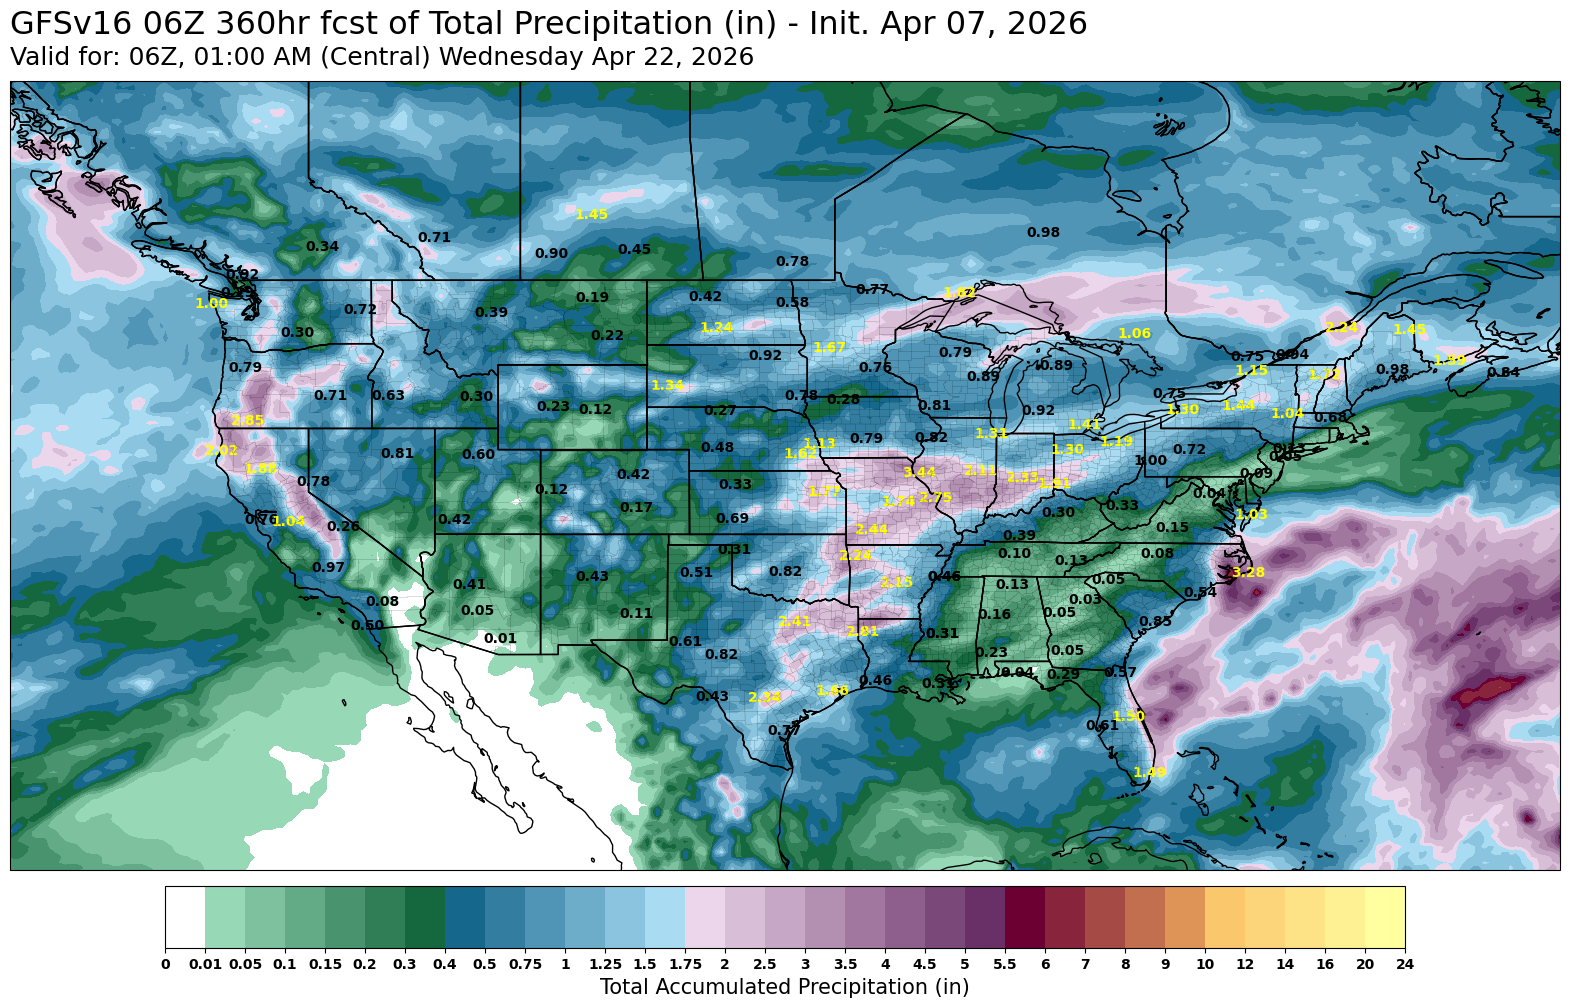
Here are the next two weeks of rain. You could argue the rains might be a little too far east.
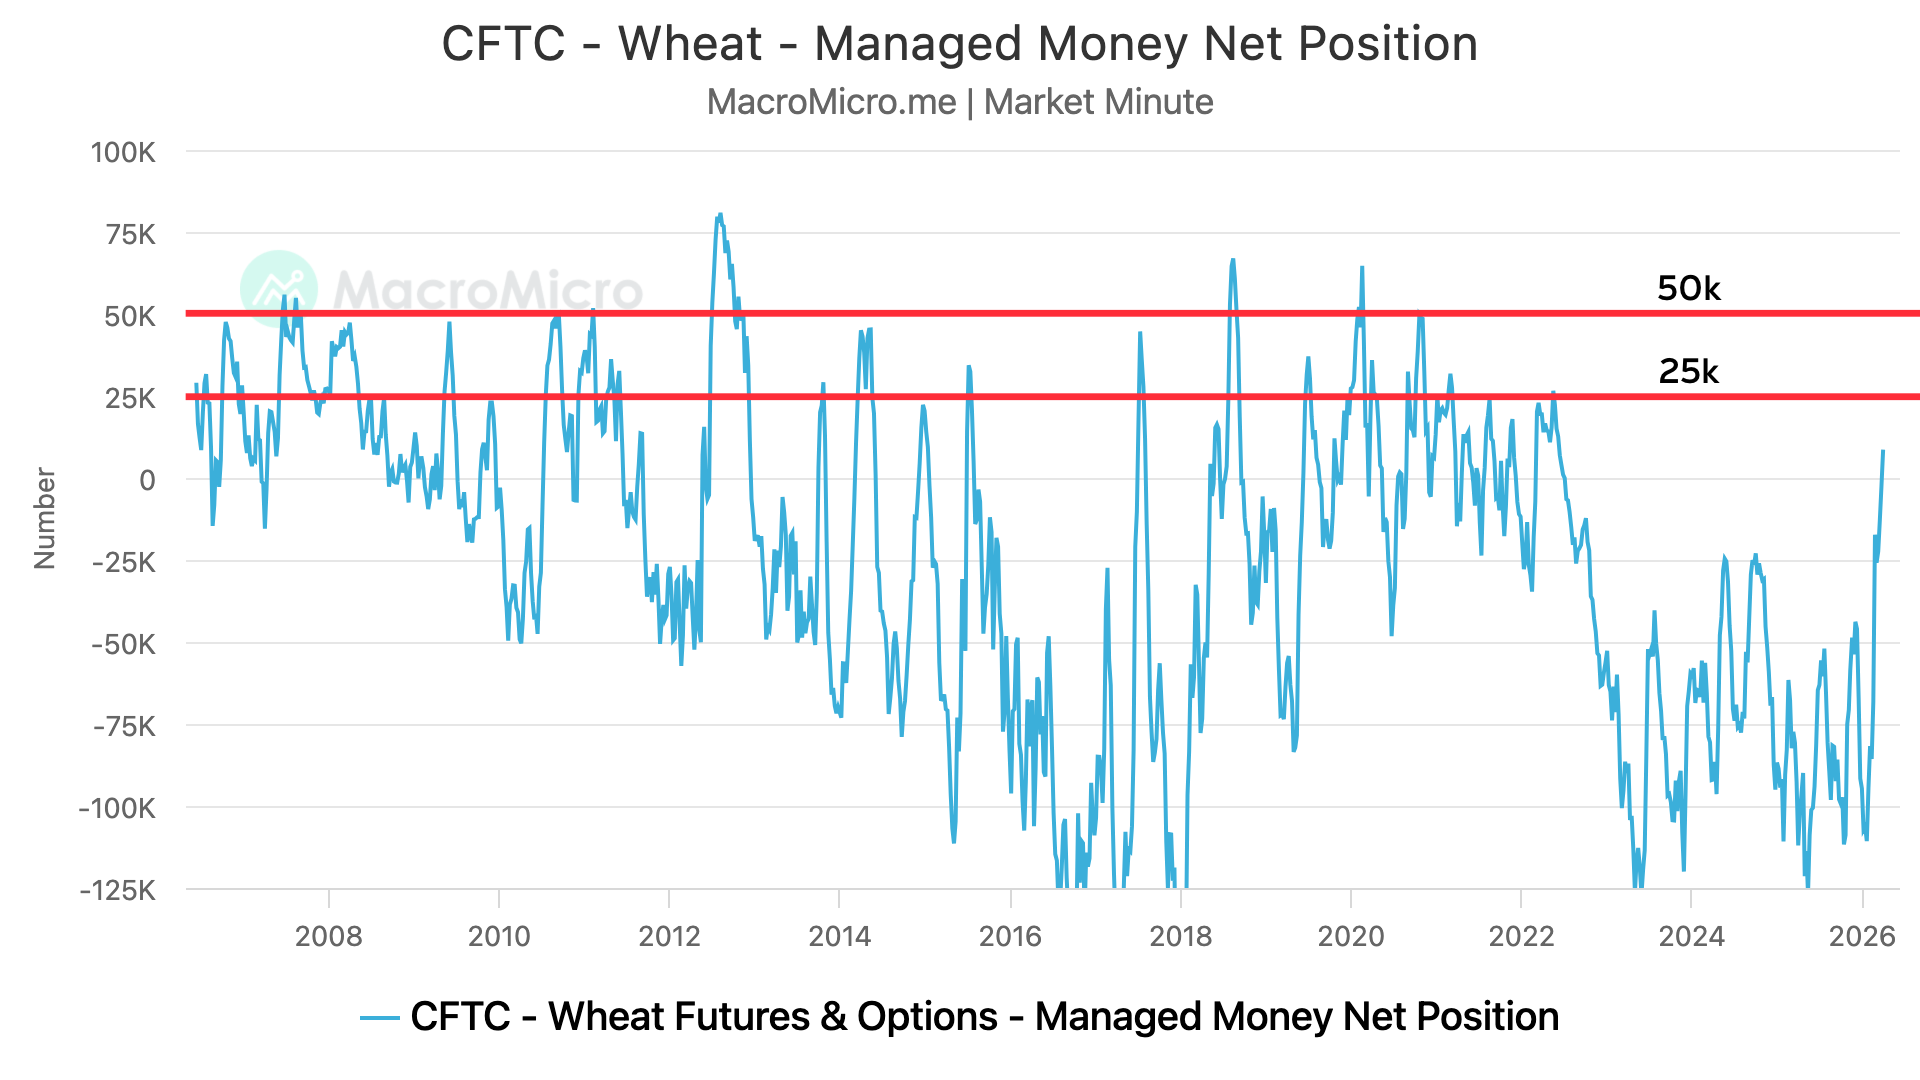
Funds Long: First Time Since 2022
The funds are actually long wheat for the first time since June 2022.
They've been short every day for the last 4 years, until now.
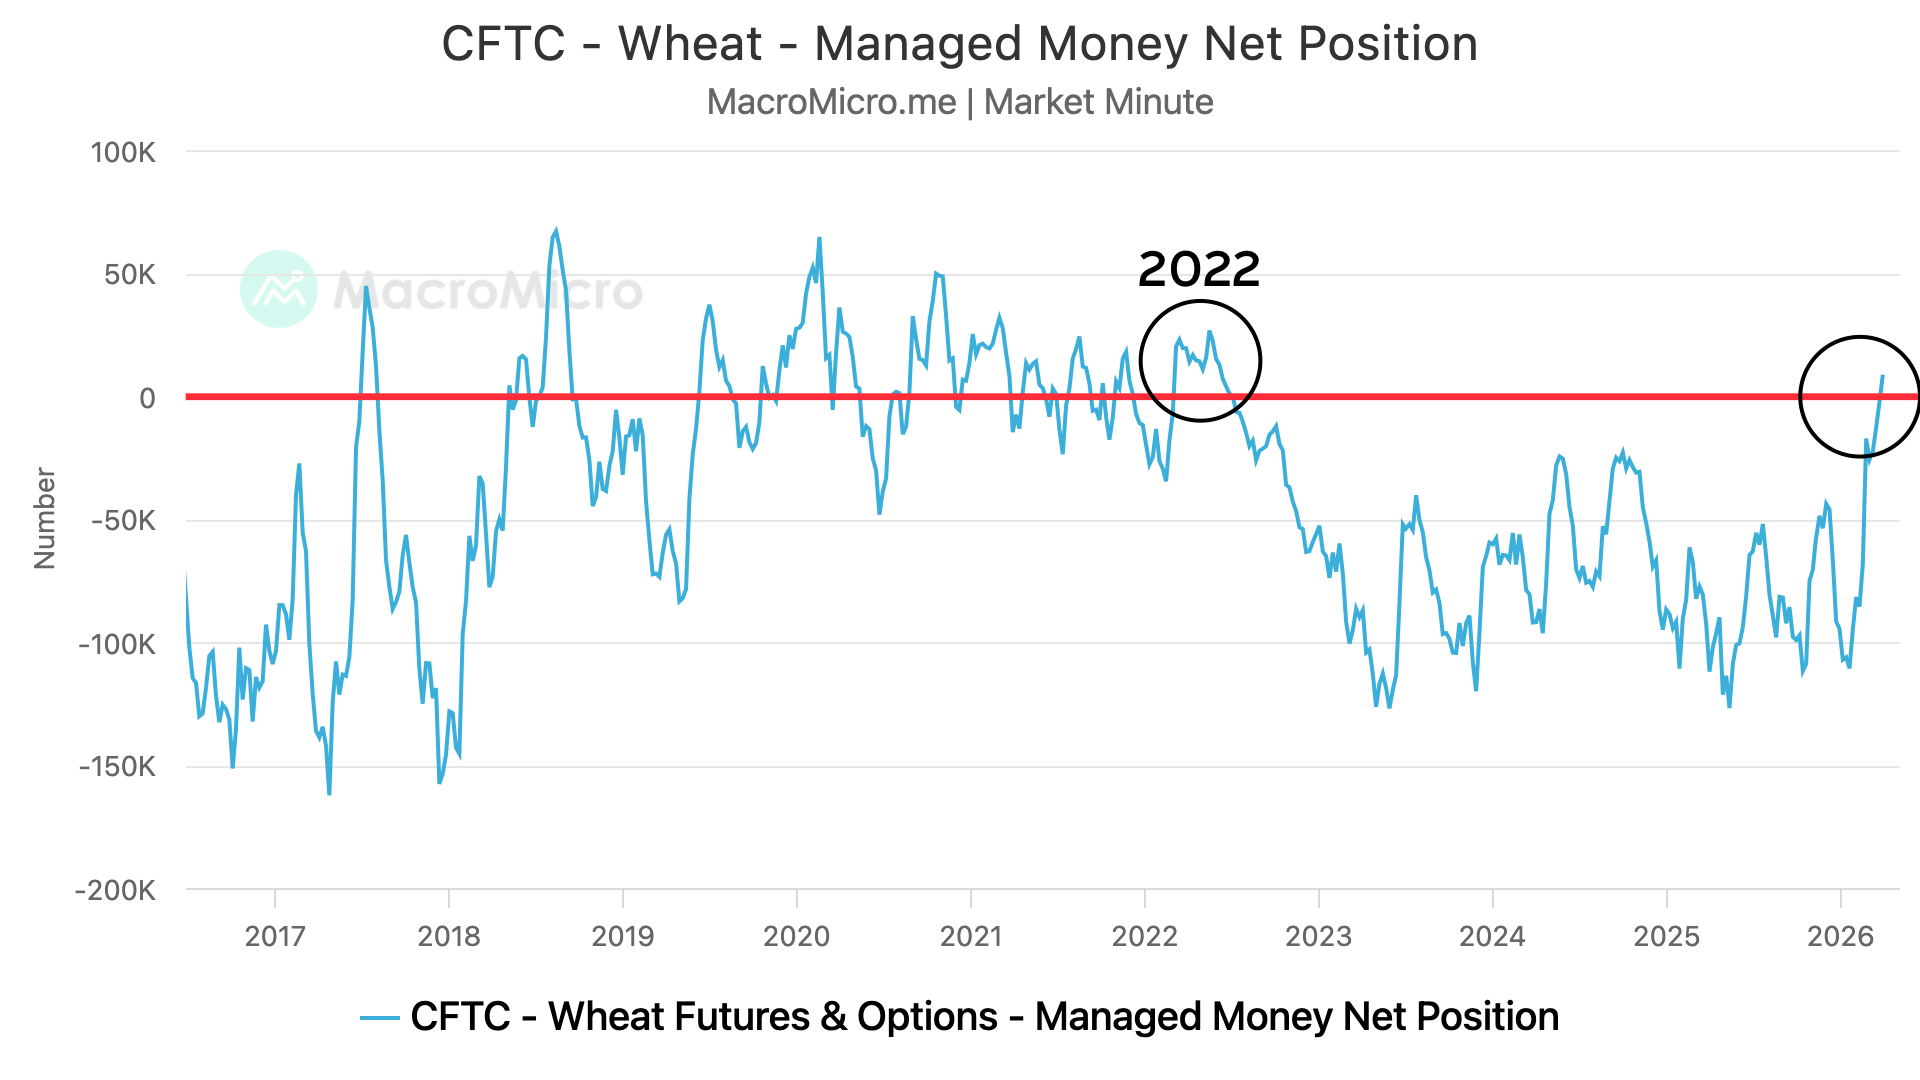
How long do the funds usually get?
Clearly, the funds are rarely long the wheat market.
When they do flip long, they usually get long at least 25k contracts.
The max they tend to get long is around 50k contracts. Which we've seen on numerous occasions. That tends to be their lid.
Right now they are long 8k contracts.
Fertilizer Impact:
When you think about high priced fertilizer's impact on planting decisions your immediate thought goes to corn.
But wheat is also highly impacted, it could have an even bigger impact given that someone around the world is constantly growing wheat.
Compared to corn, where the US dominates the global market and a large part of needs were booked before the spike in fertilizer prices.
There are parts of the world where they might not've had the majority of their needs booked before planting.
Take Australia for example.
Australia mainly grows spring wheat.
Urea prices in Australia are higher than where they were during the Russia and Ukraine war.
(Chart from @Episode3net on X)
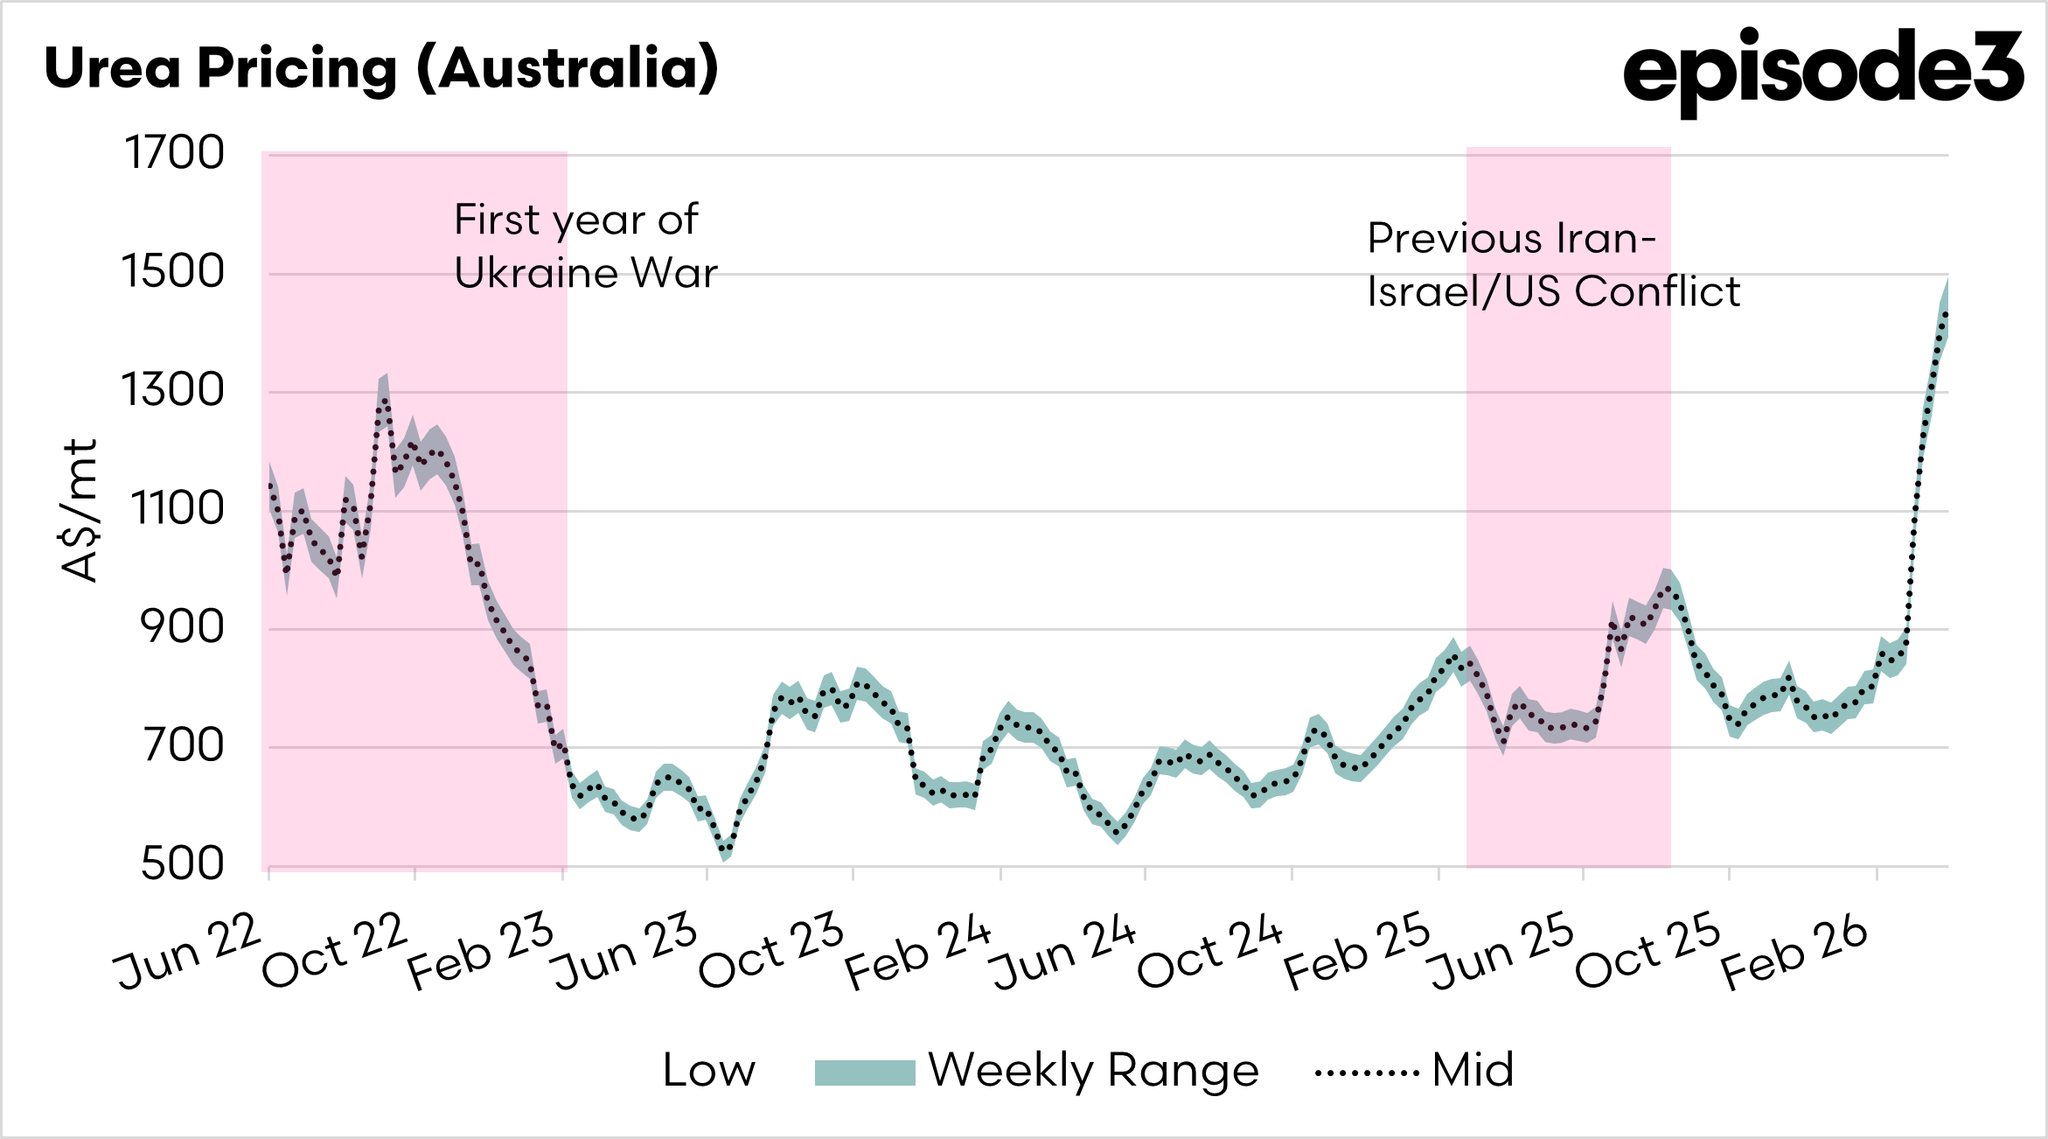
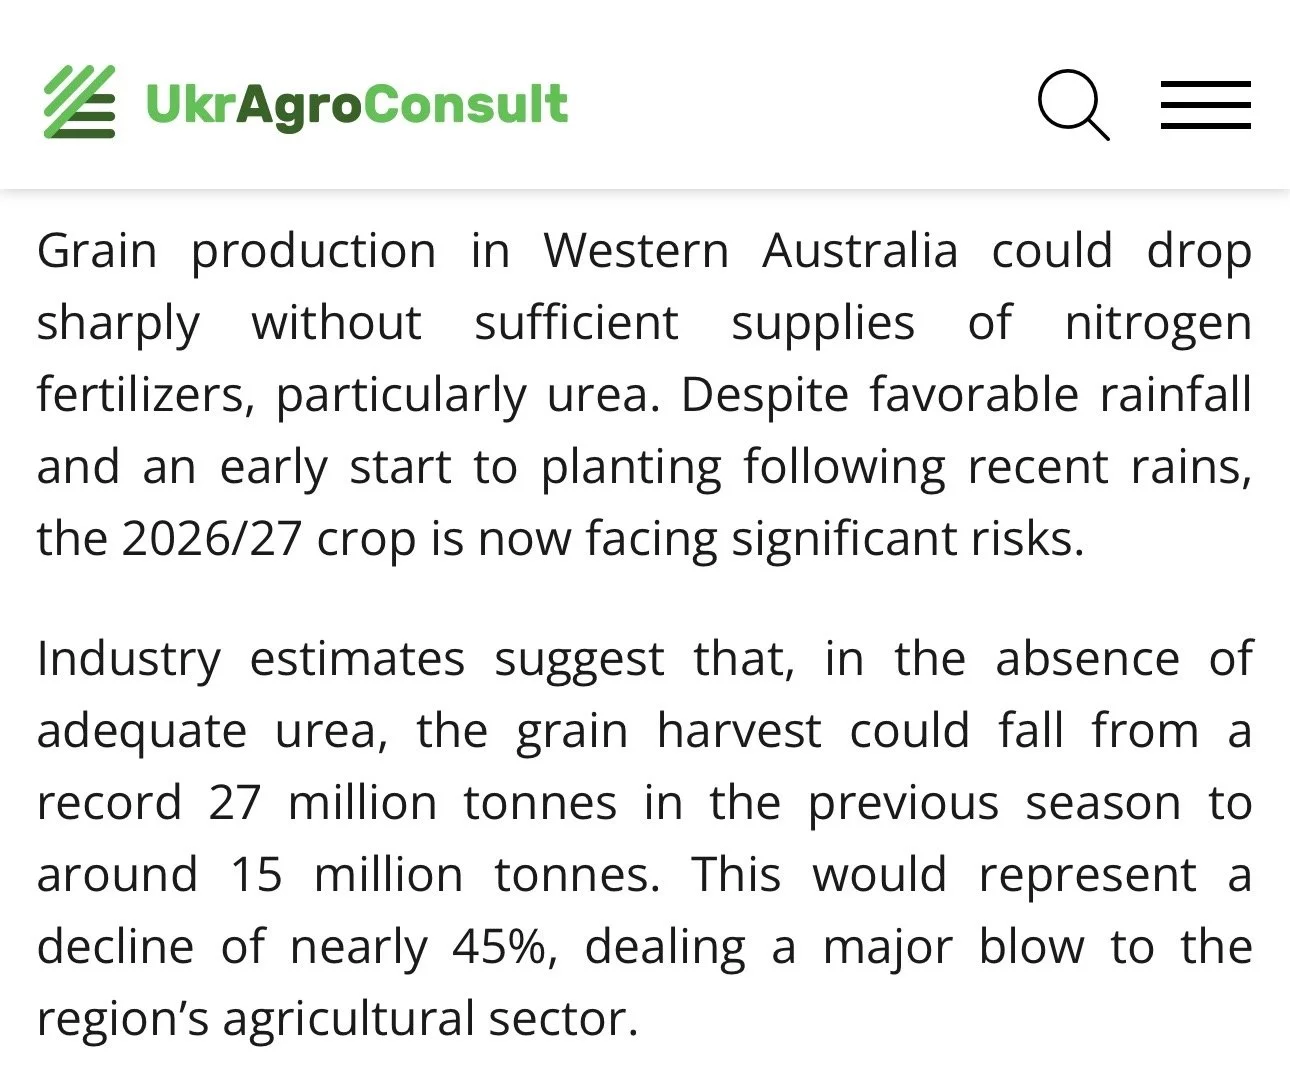
There are reports out there saying that Australian wheat areas might be down more than 10% compared to last year due to the fertilizer crisis.
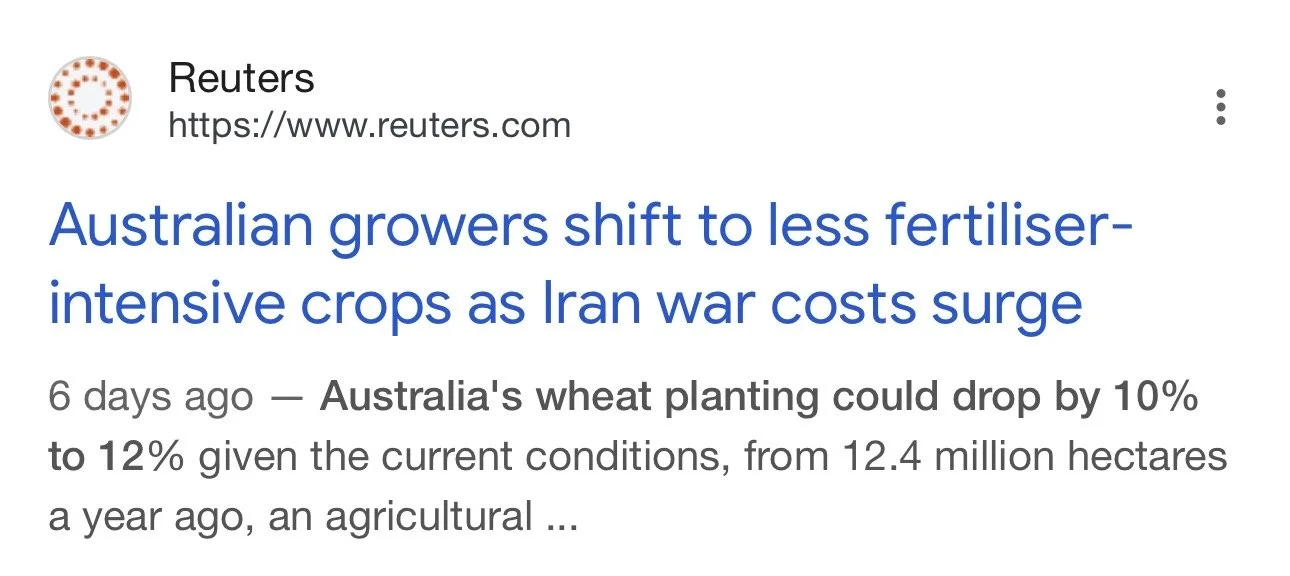
There are some other reports out there suggesting the crop could nearly be half of what it was last year.
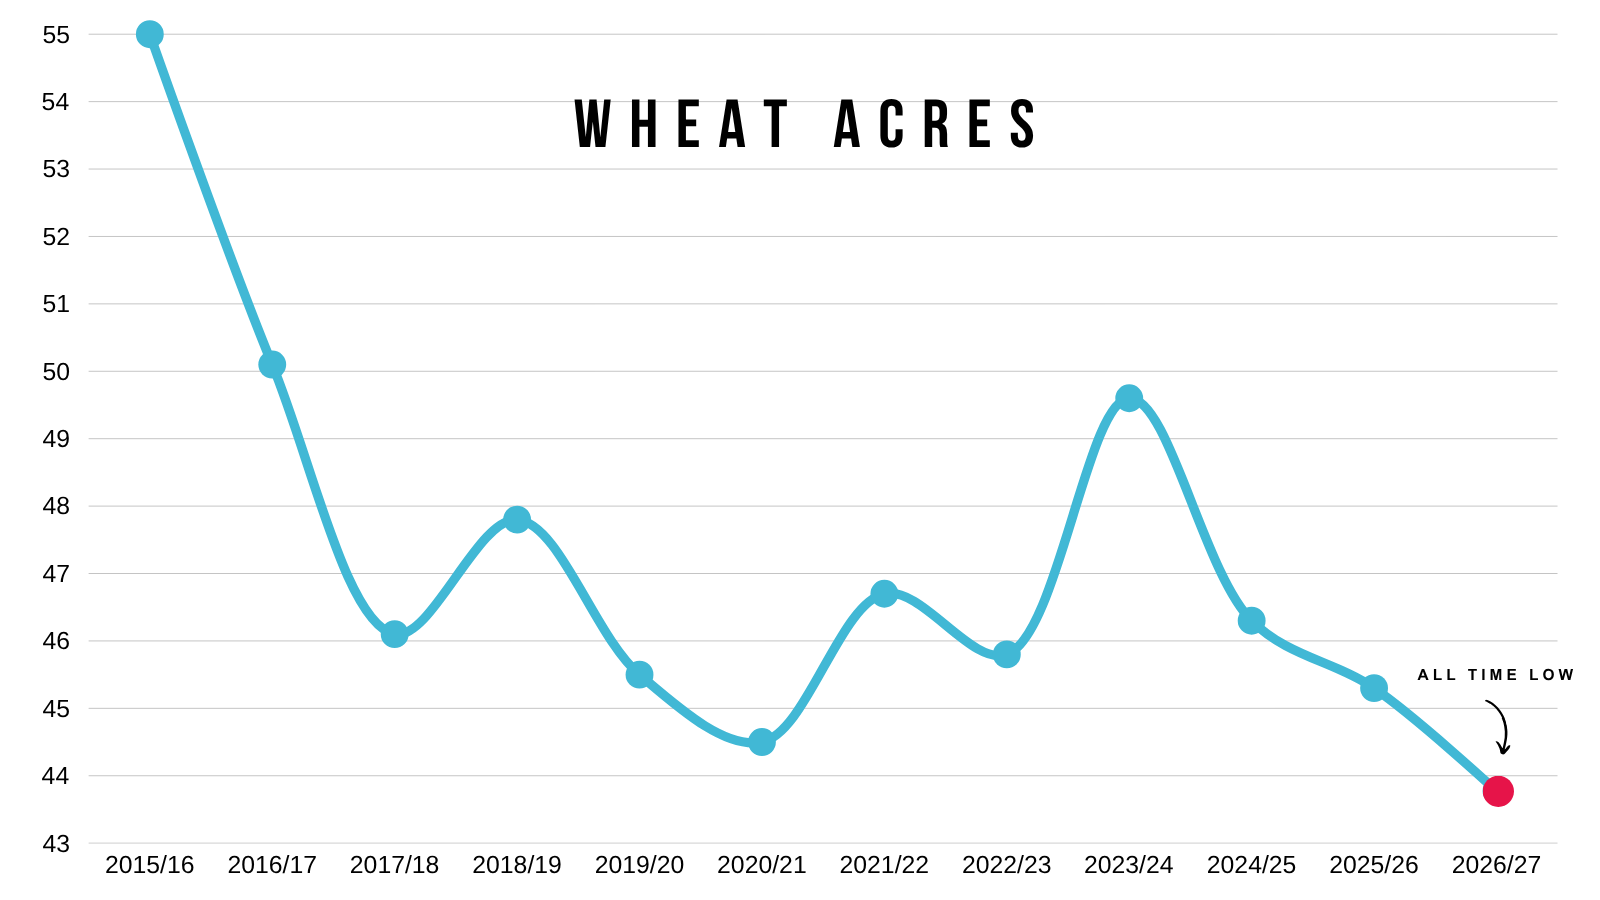
Lowest Acres All-Time:
We've already touched on this.
But wheat acres in the US are projected to be the lowest ever.
You could argue they might be even lower if we see spring wheat acres fall further due to the fertilizer situation.
Another reason to believe that the wheat market has a potential long term story going for it.
Out of all the grains, I would argue that wheat probably has the most upside "potential".
I am not saying we have to go higher at all, as a large part of this rally was driven by war premium along with some weather premium.
I am just saying that moving forward, there are some potentially friendly things going for the wheat market unlike the last few years.
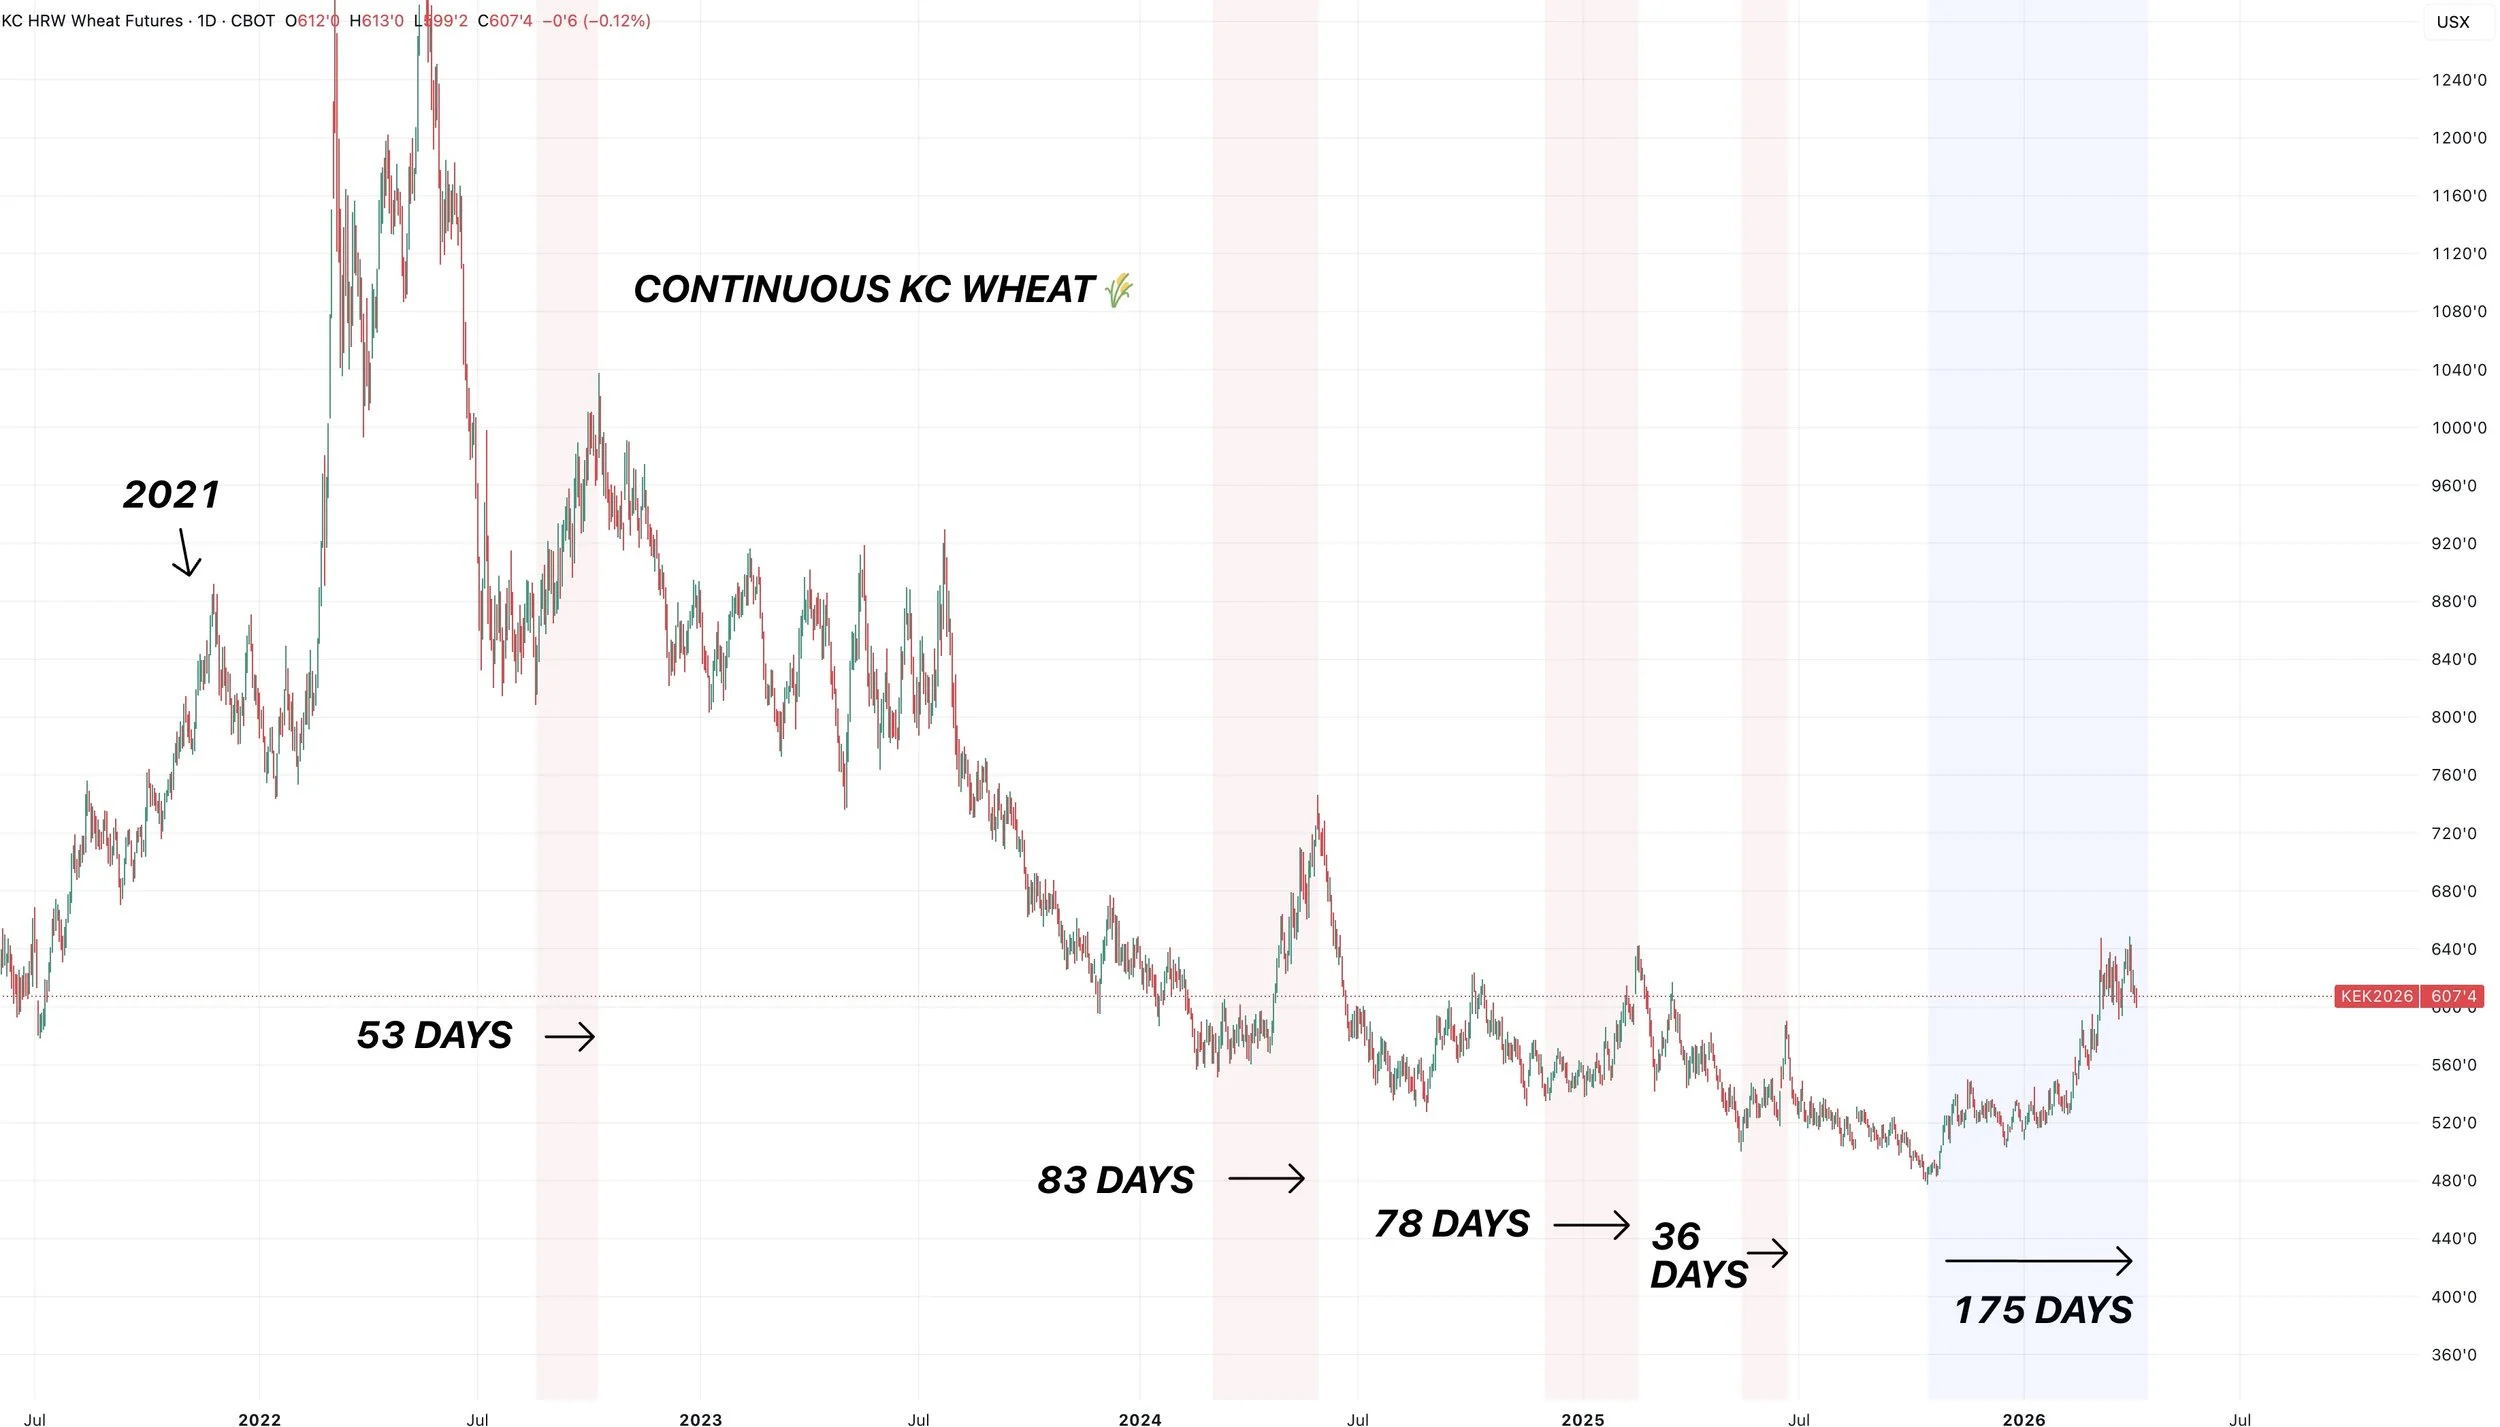
Longest Rally in 5 Years:
I mean wheat is still having it's longest sustained rally since 2021.
It's lasted around 175 days.
That is double the next closest rally we've seen over the last 5 years.
I'd call that a possible shift in the trend. Long term I think wheat put in a meaningful bottom last year.
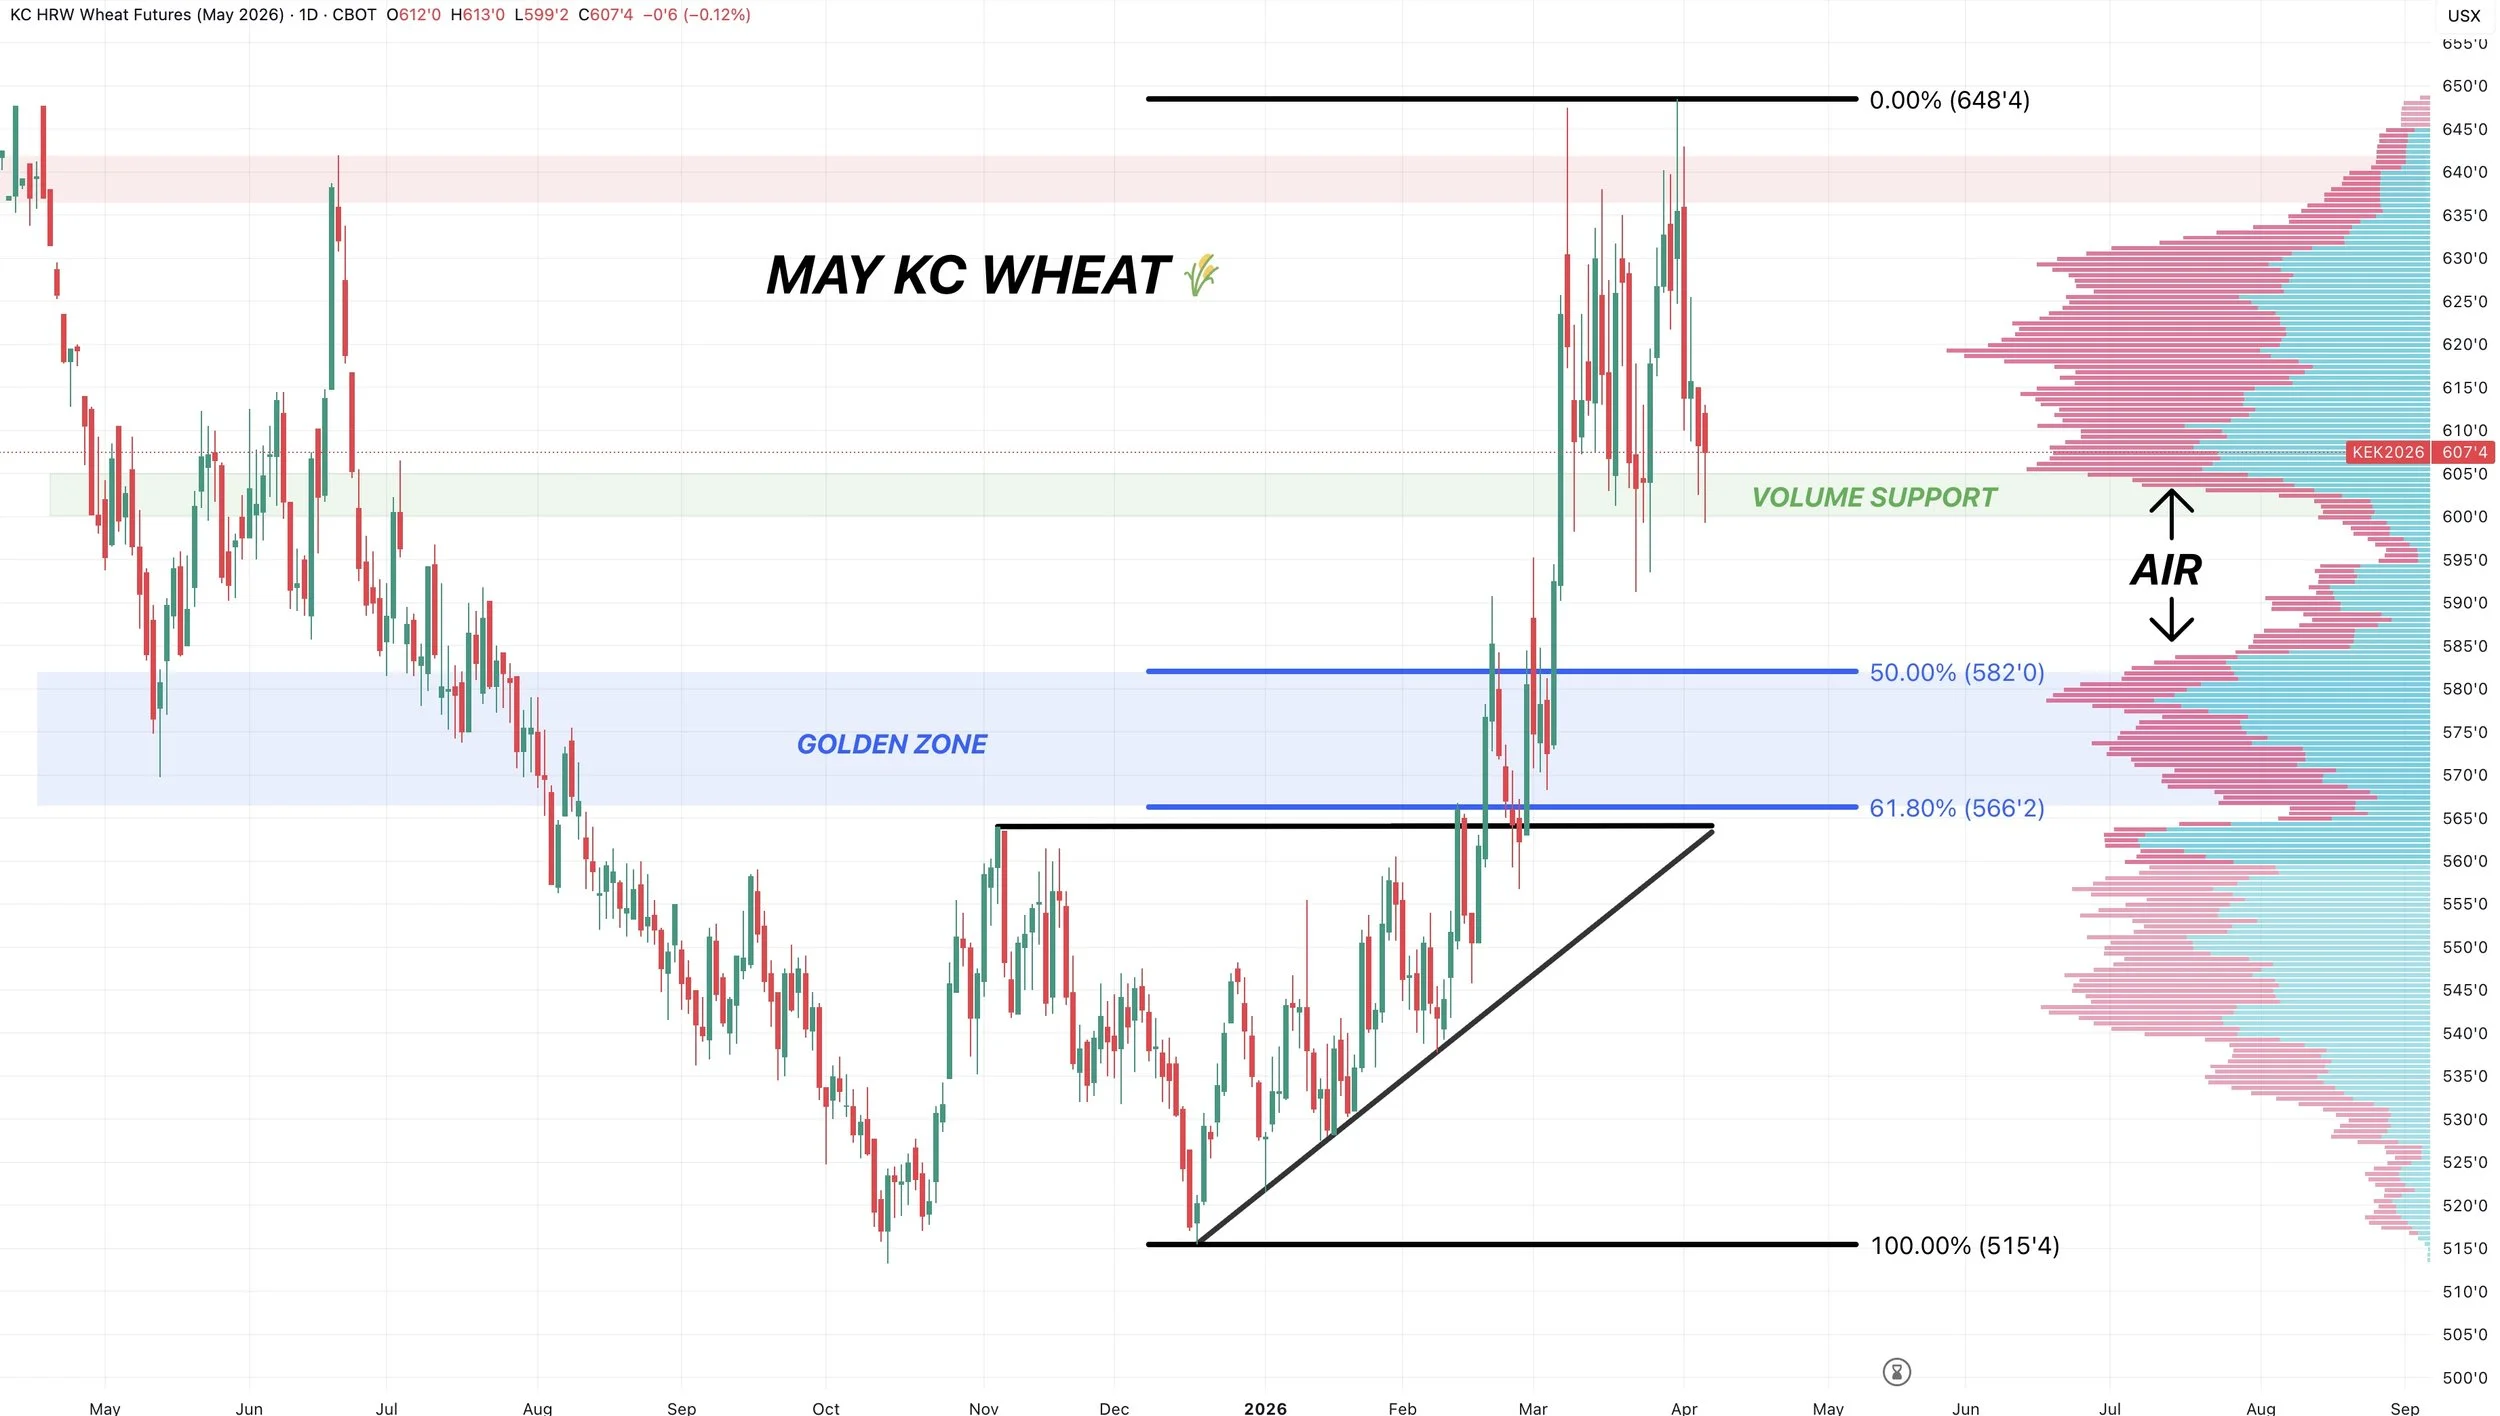
May KC Chart:
Similar to corn, we are sitting at a pretty important spot here that we need to hold on the charts.
We've continued to find life at this $6.00 level.
This is a must hold spot to prevent a leg lower.
We are sitting at an area of high volume, below $6.00 we have a large gap or air lower. As when we rallied, we created no support or resistance beneath here.
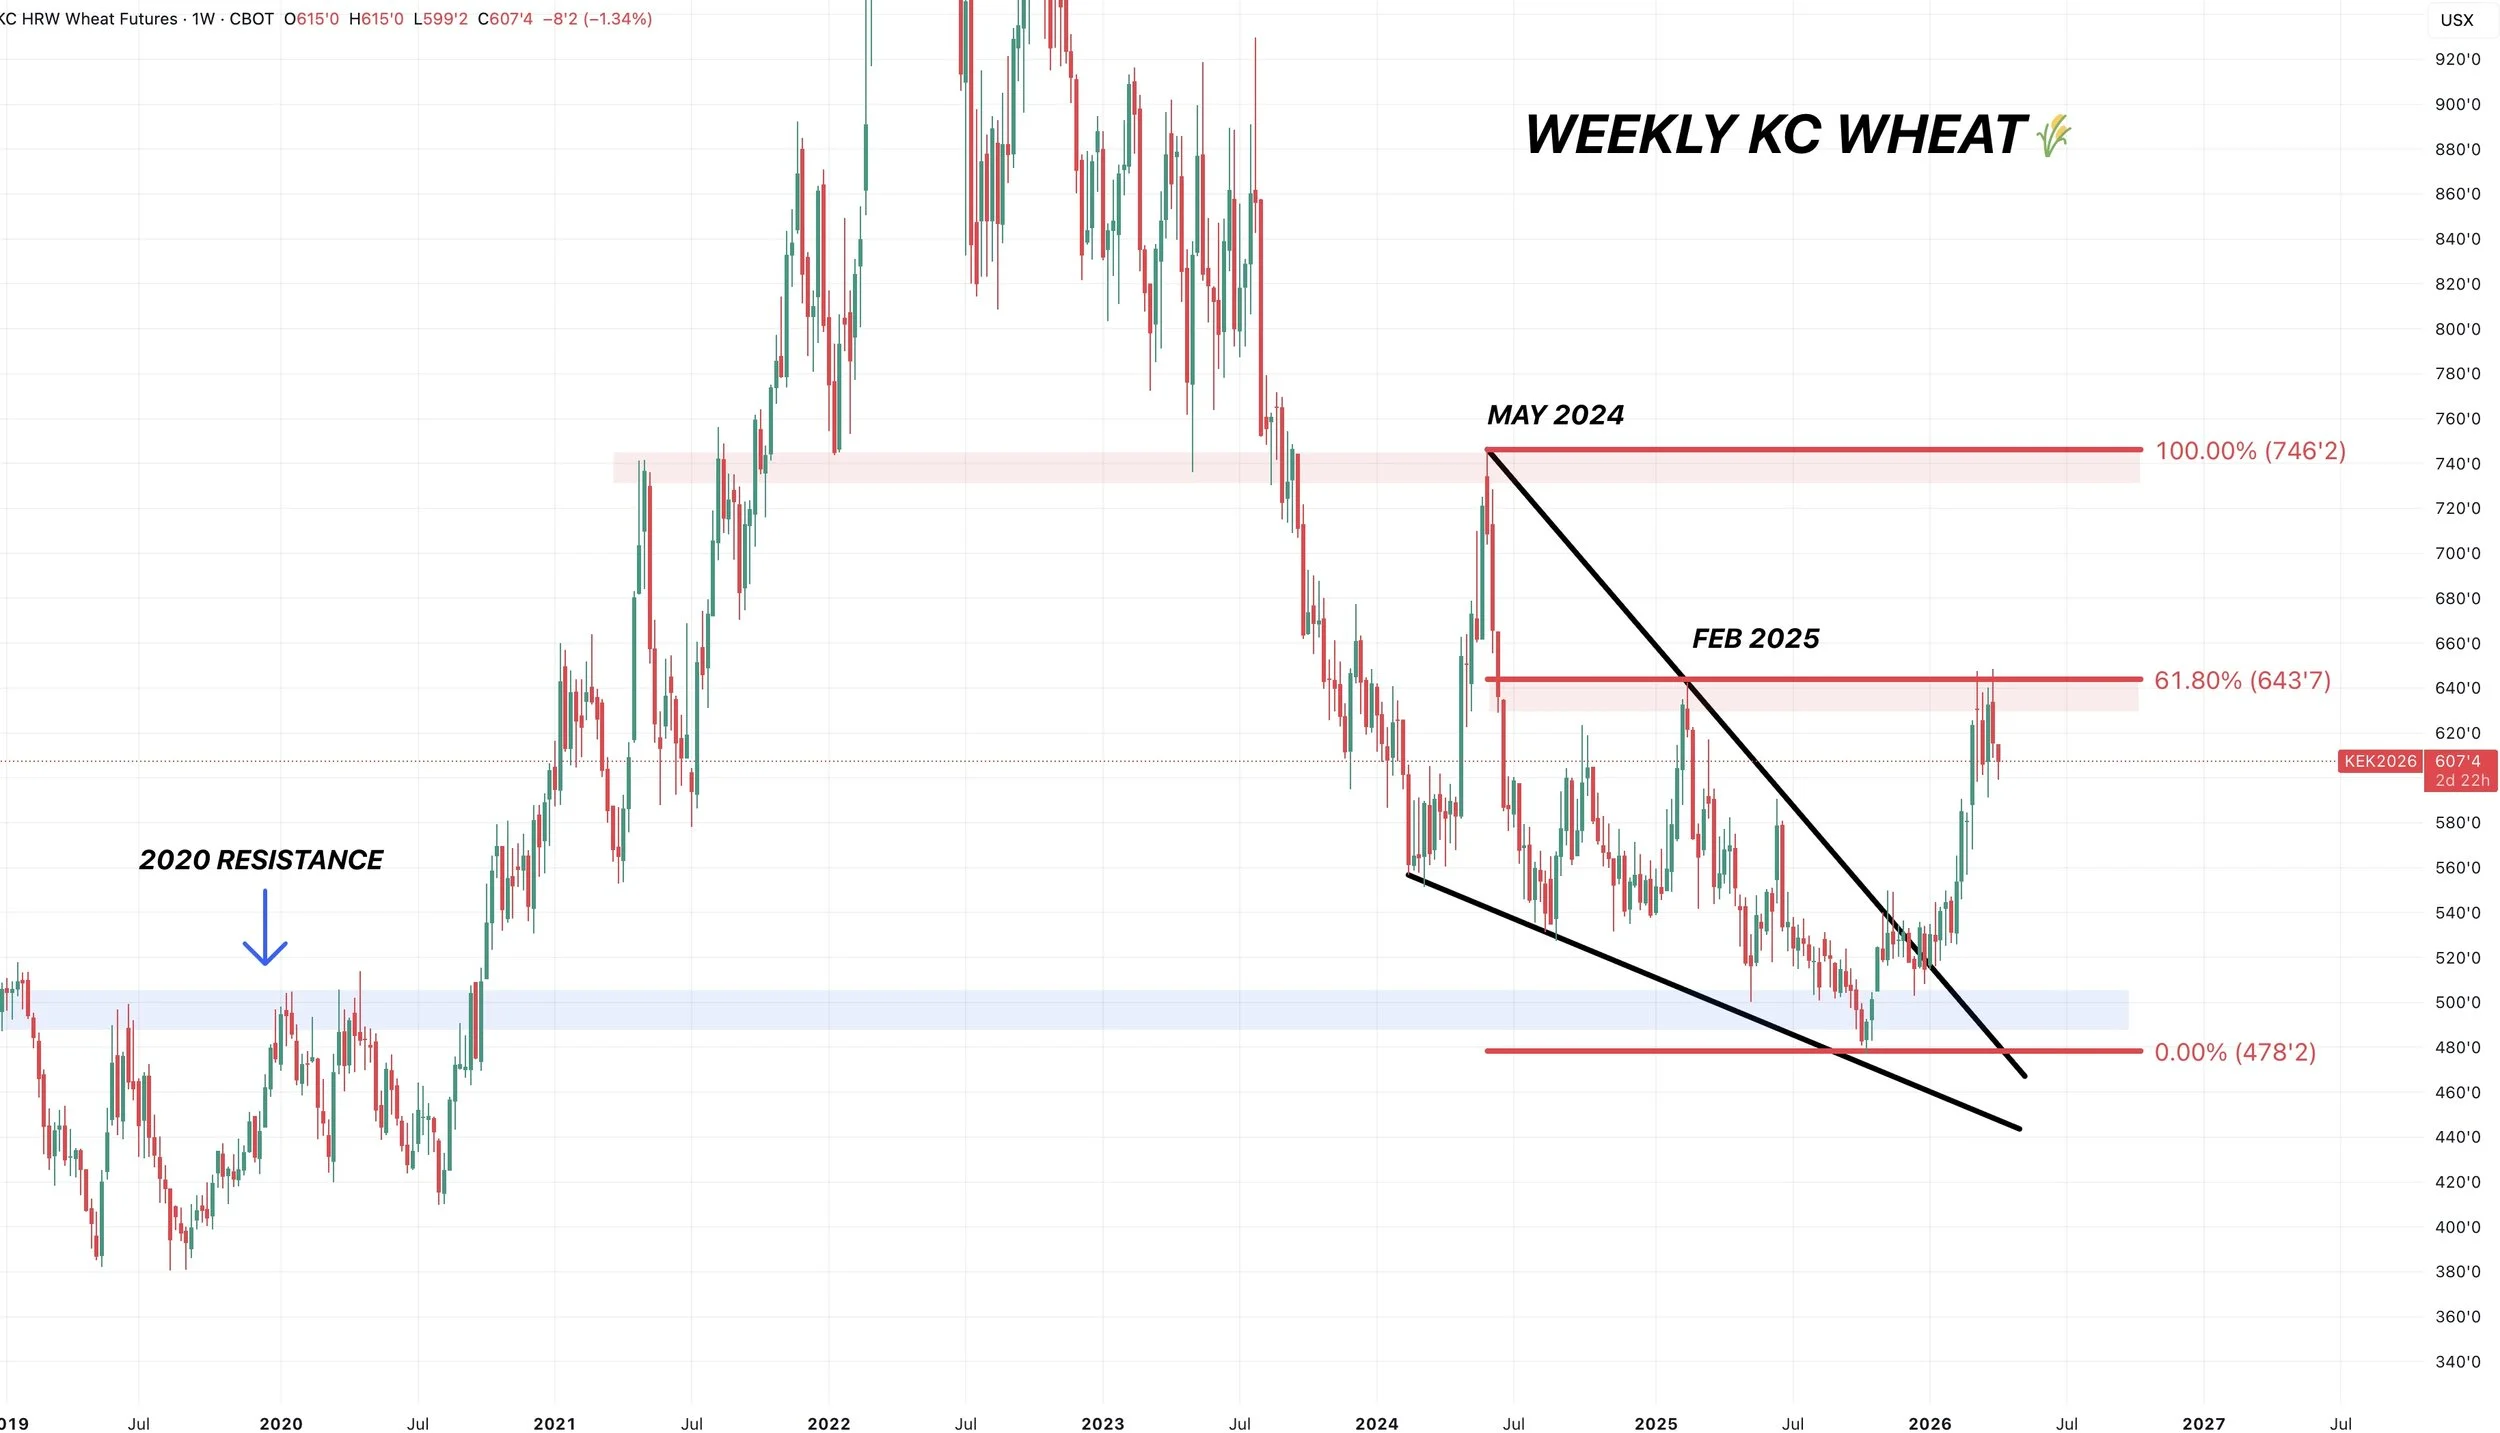
Continuous KC Chart:
I've shown this chart several times. This is the front month chart.
We failed right at those highs from Feb 2025.
That same exact level was 61.8% of the May 2024 highs.
Struggling there makes perfect sense. It's clear resistance.
But if you ever break above that level, this chart has a ton of upside potential.
Cattle
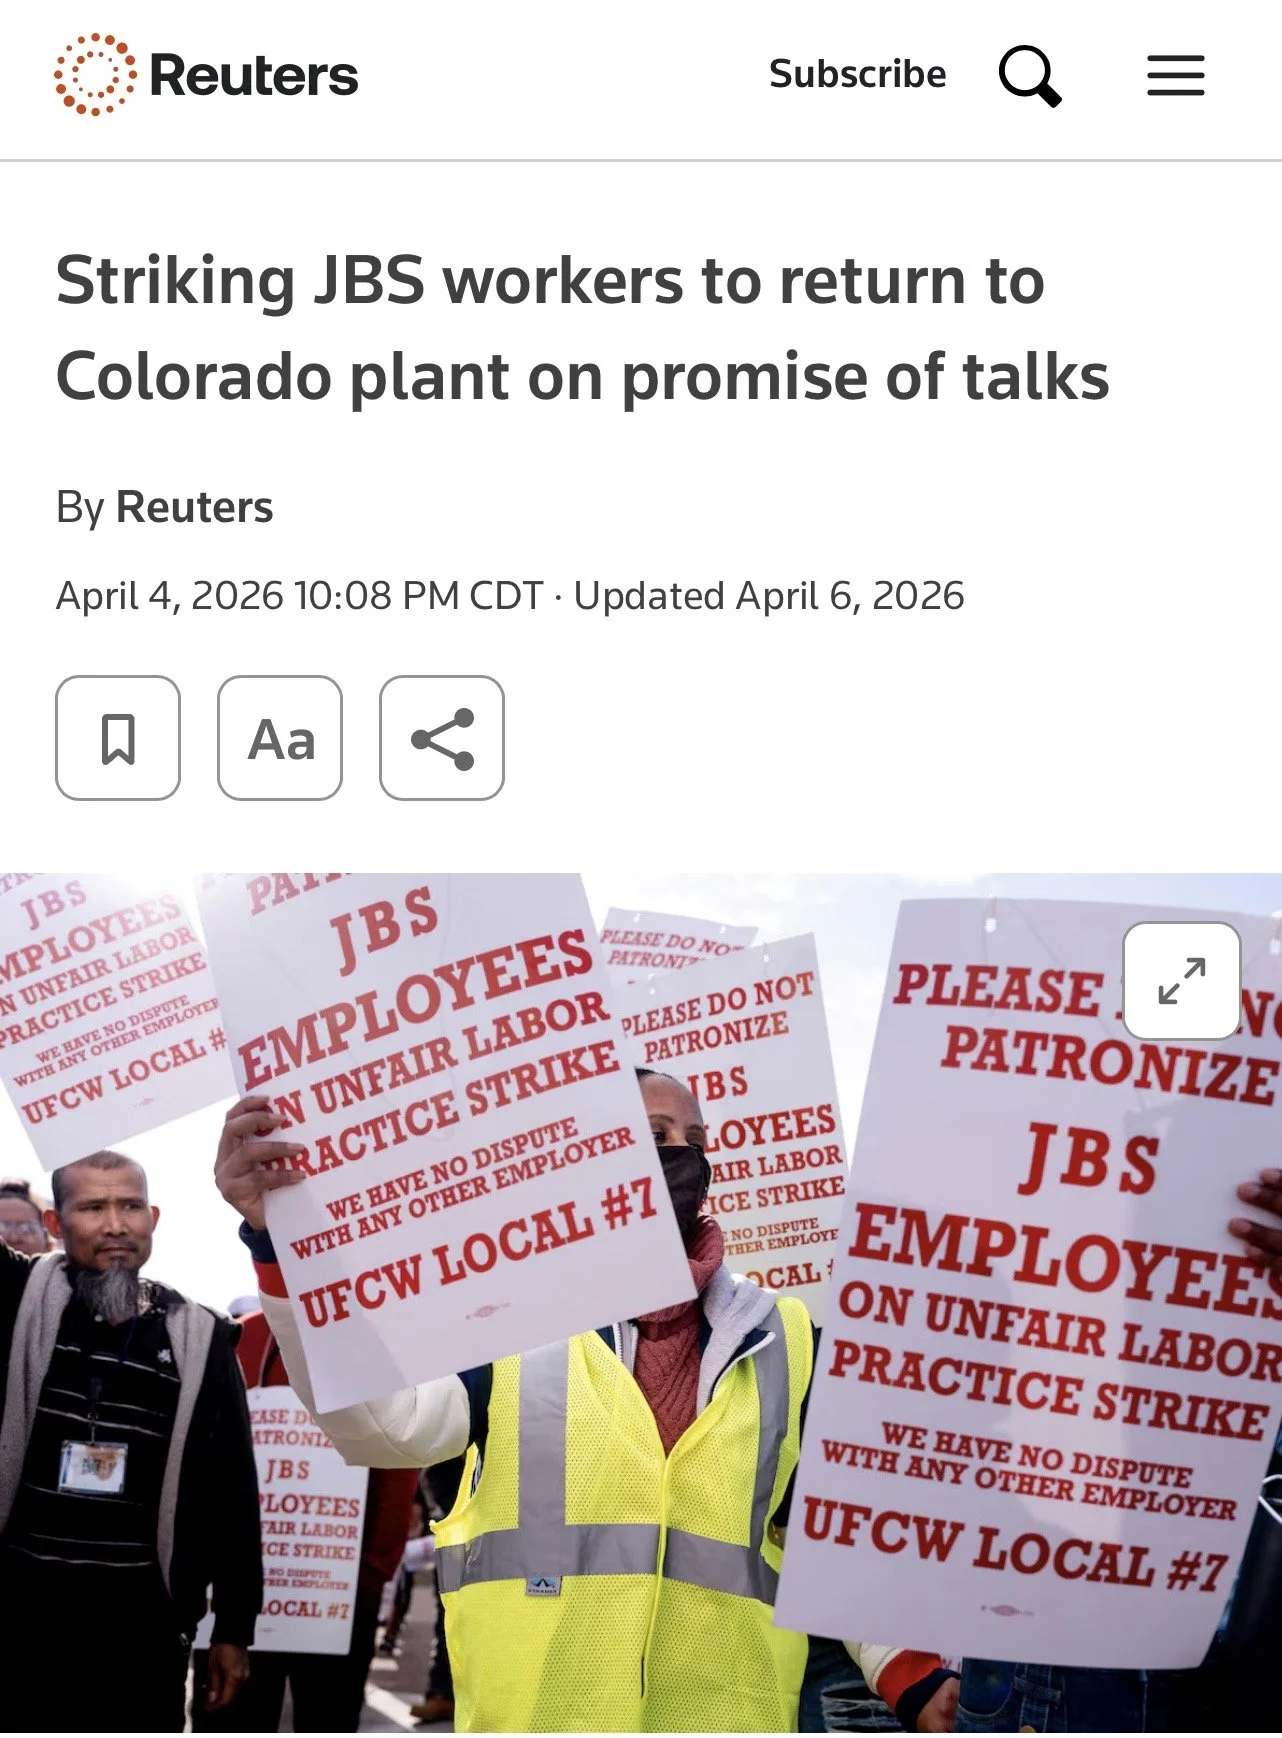
JBS Strike:
After a 3-week strike the workers have announced they would be ending the strike and have officially came back to work.
The decision came without the workers receiving a new contract, and they are still trying to push for wage increases.
This might’ve been part of the reason for the recent rally in cattle. JBS knew the strike was ending, so could’ve definitely been some insider trading.
We rallied all week before the news came out, then once the market received the news the rally paused.
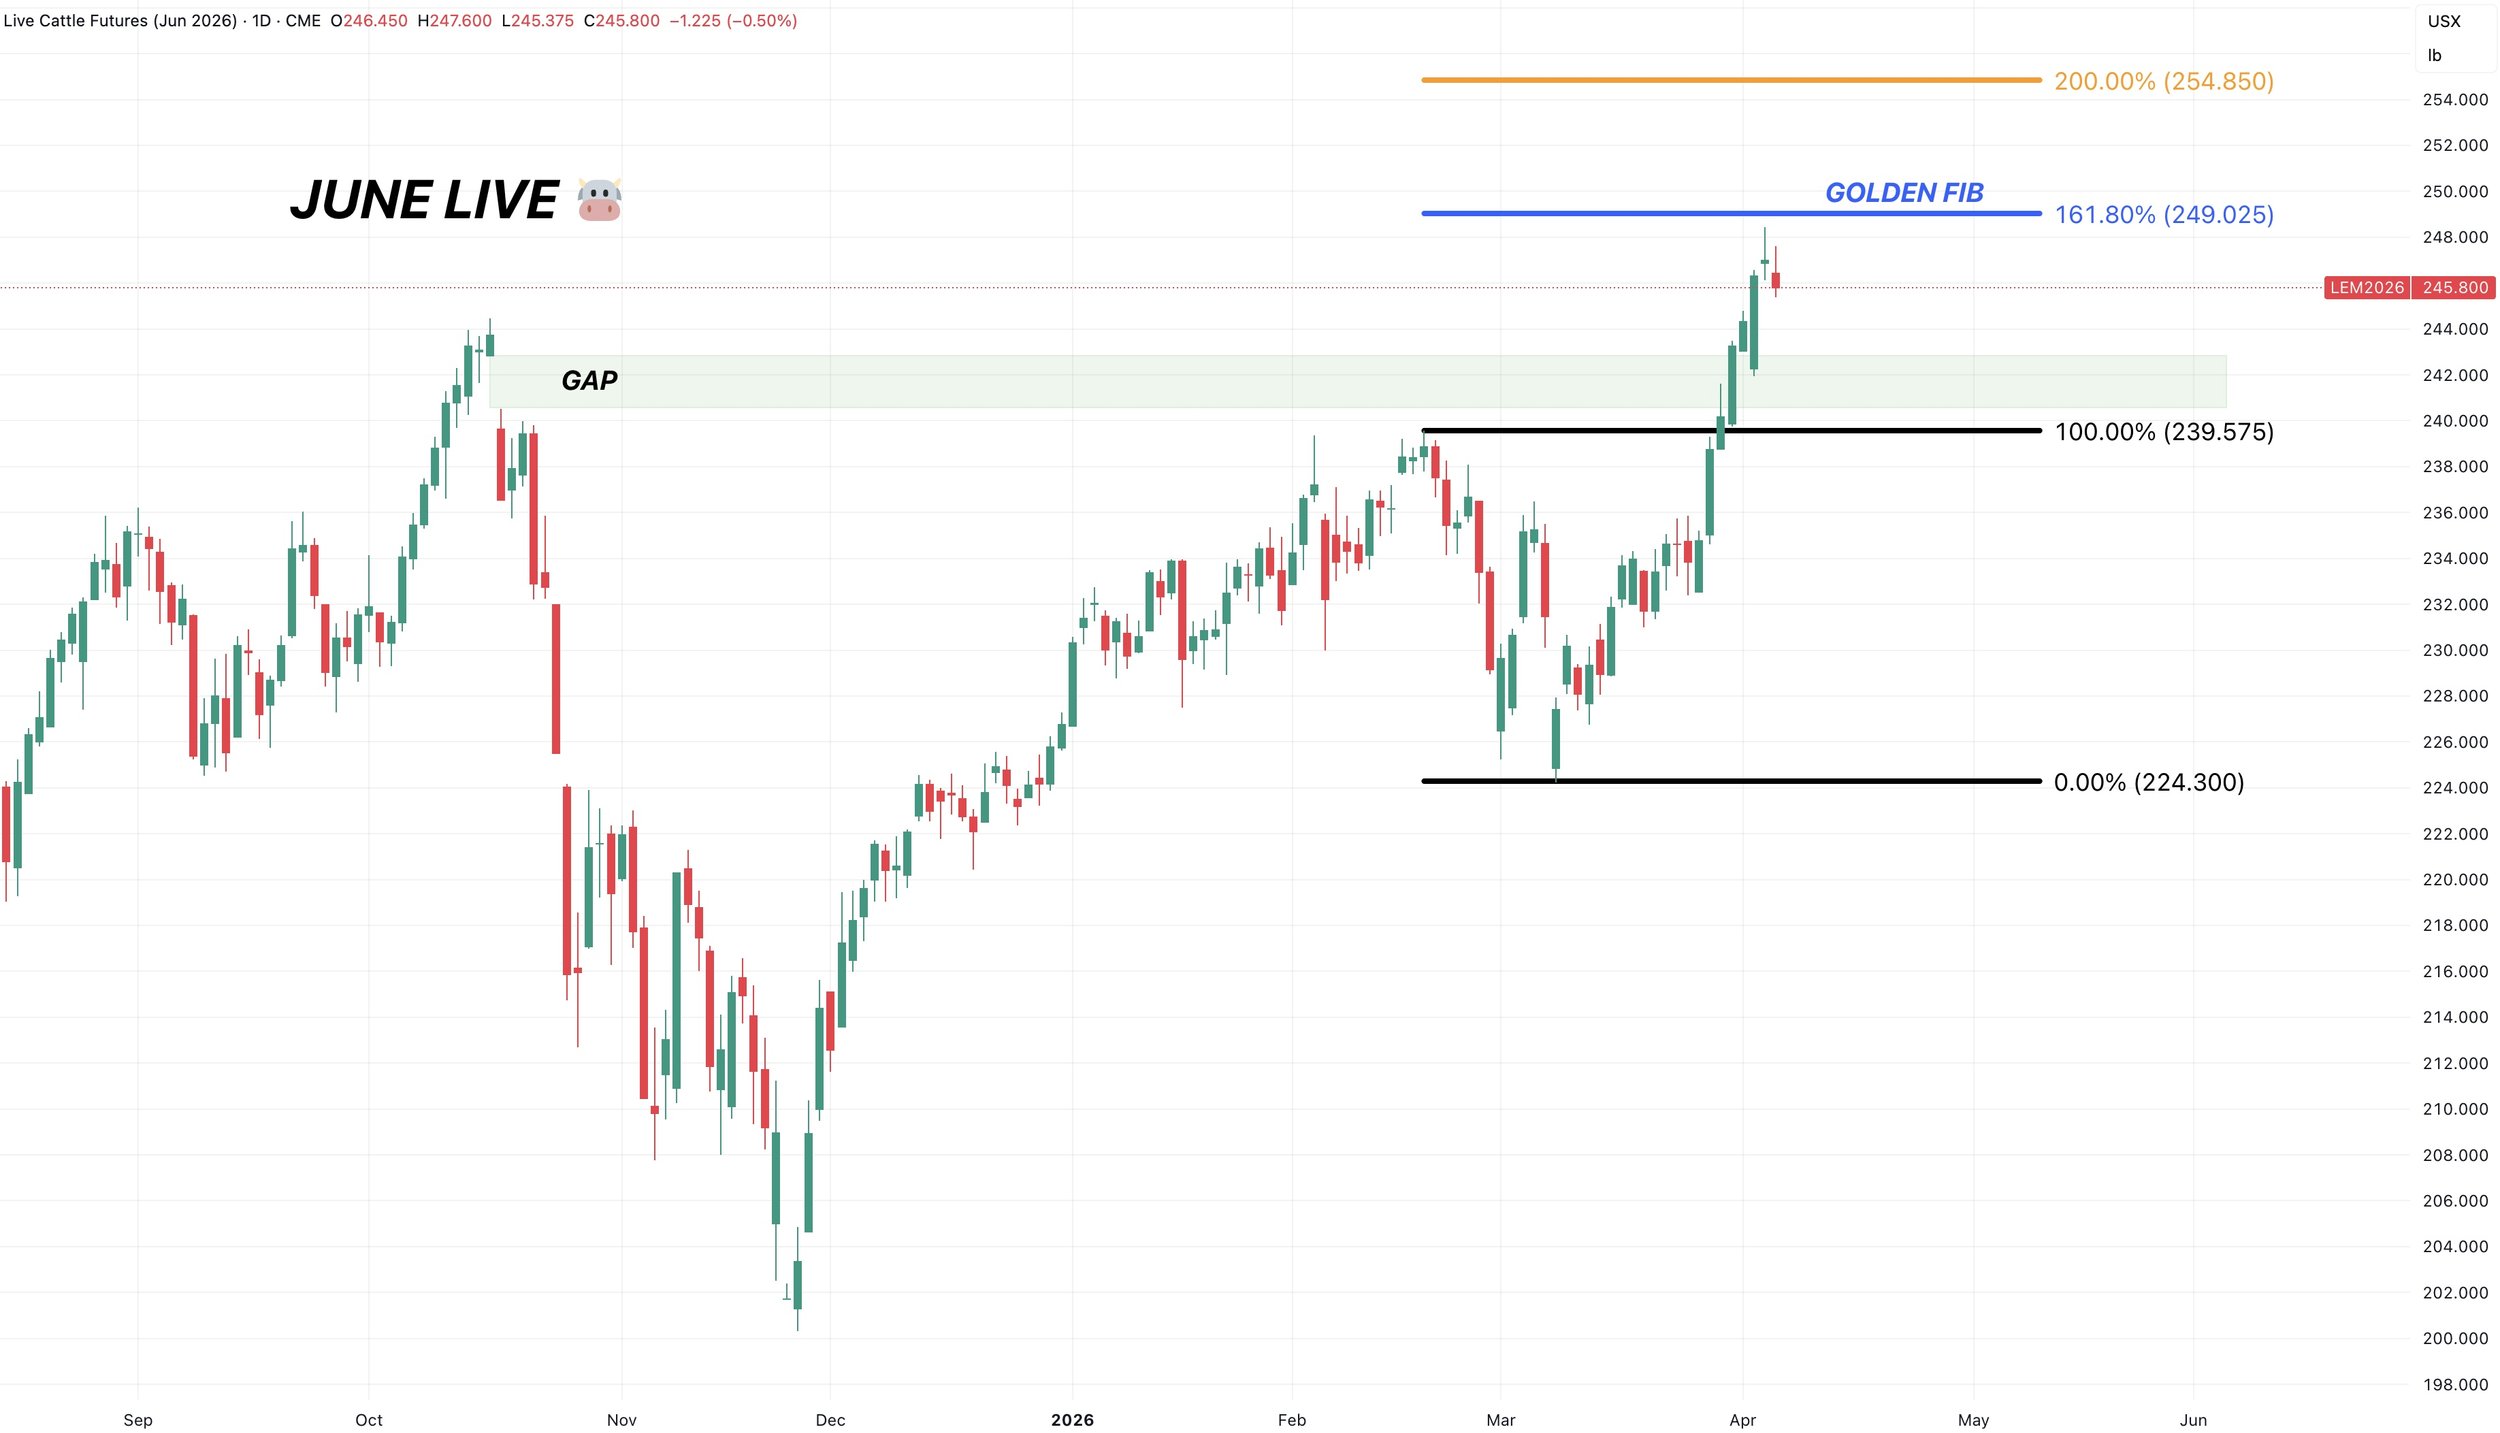
June Live Chart:
Fundamentally this market is strong.
But the last two days of price action has looked somewhat toppy here.
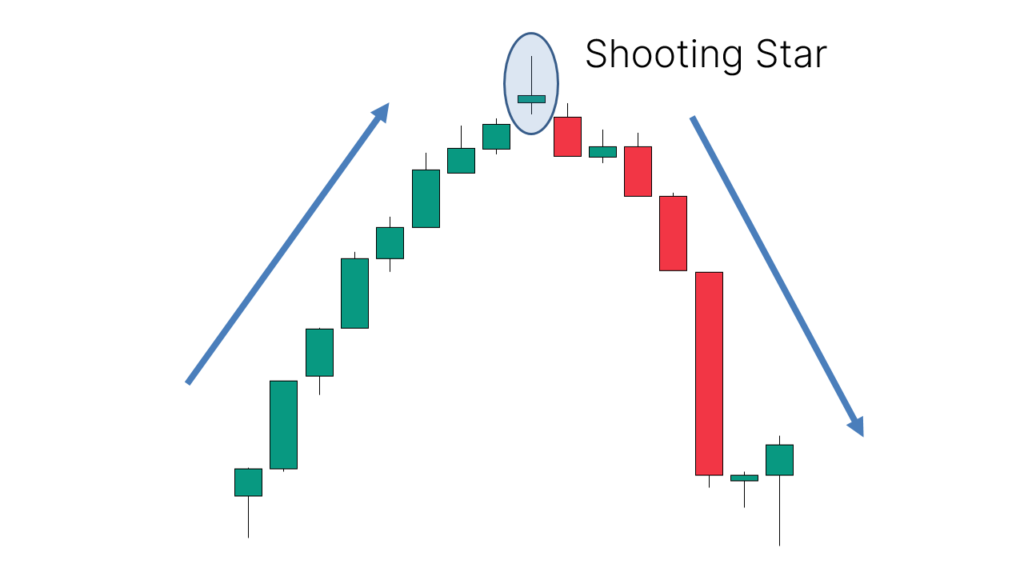
For starters, we have potential classic shooting star pattern, which is often associated with further downside.
At the same time we nearly tapped that golden fib extension target.
Which equals 161.8% of the recent lows up to those Feb highs. This is a common level for a rally to pause.
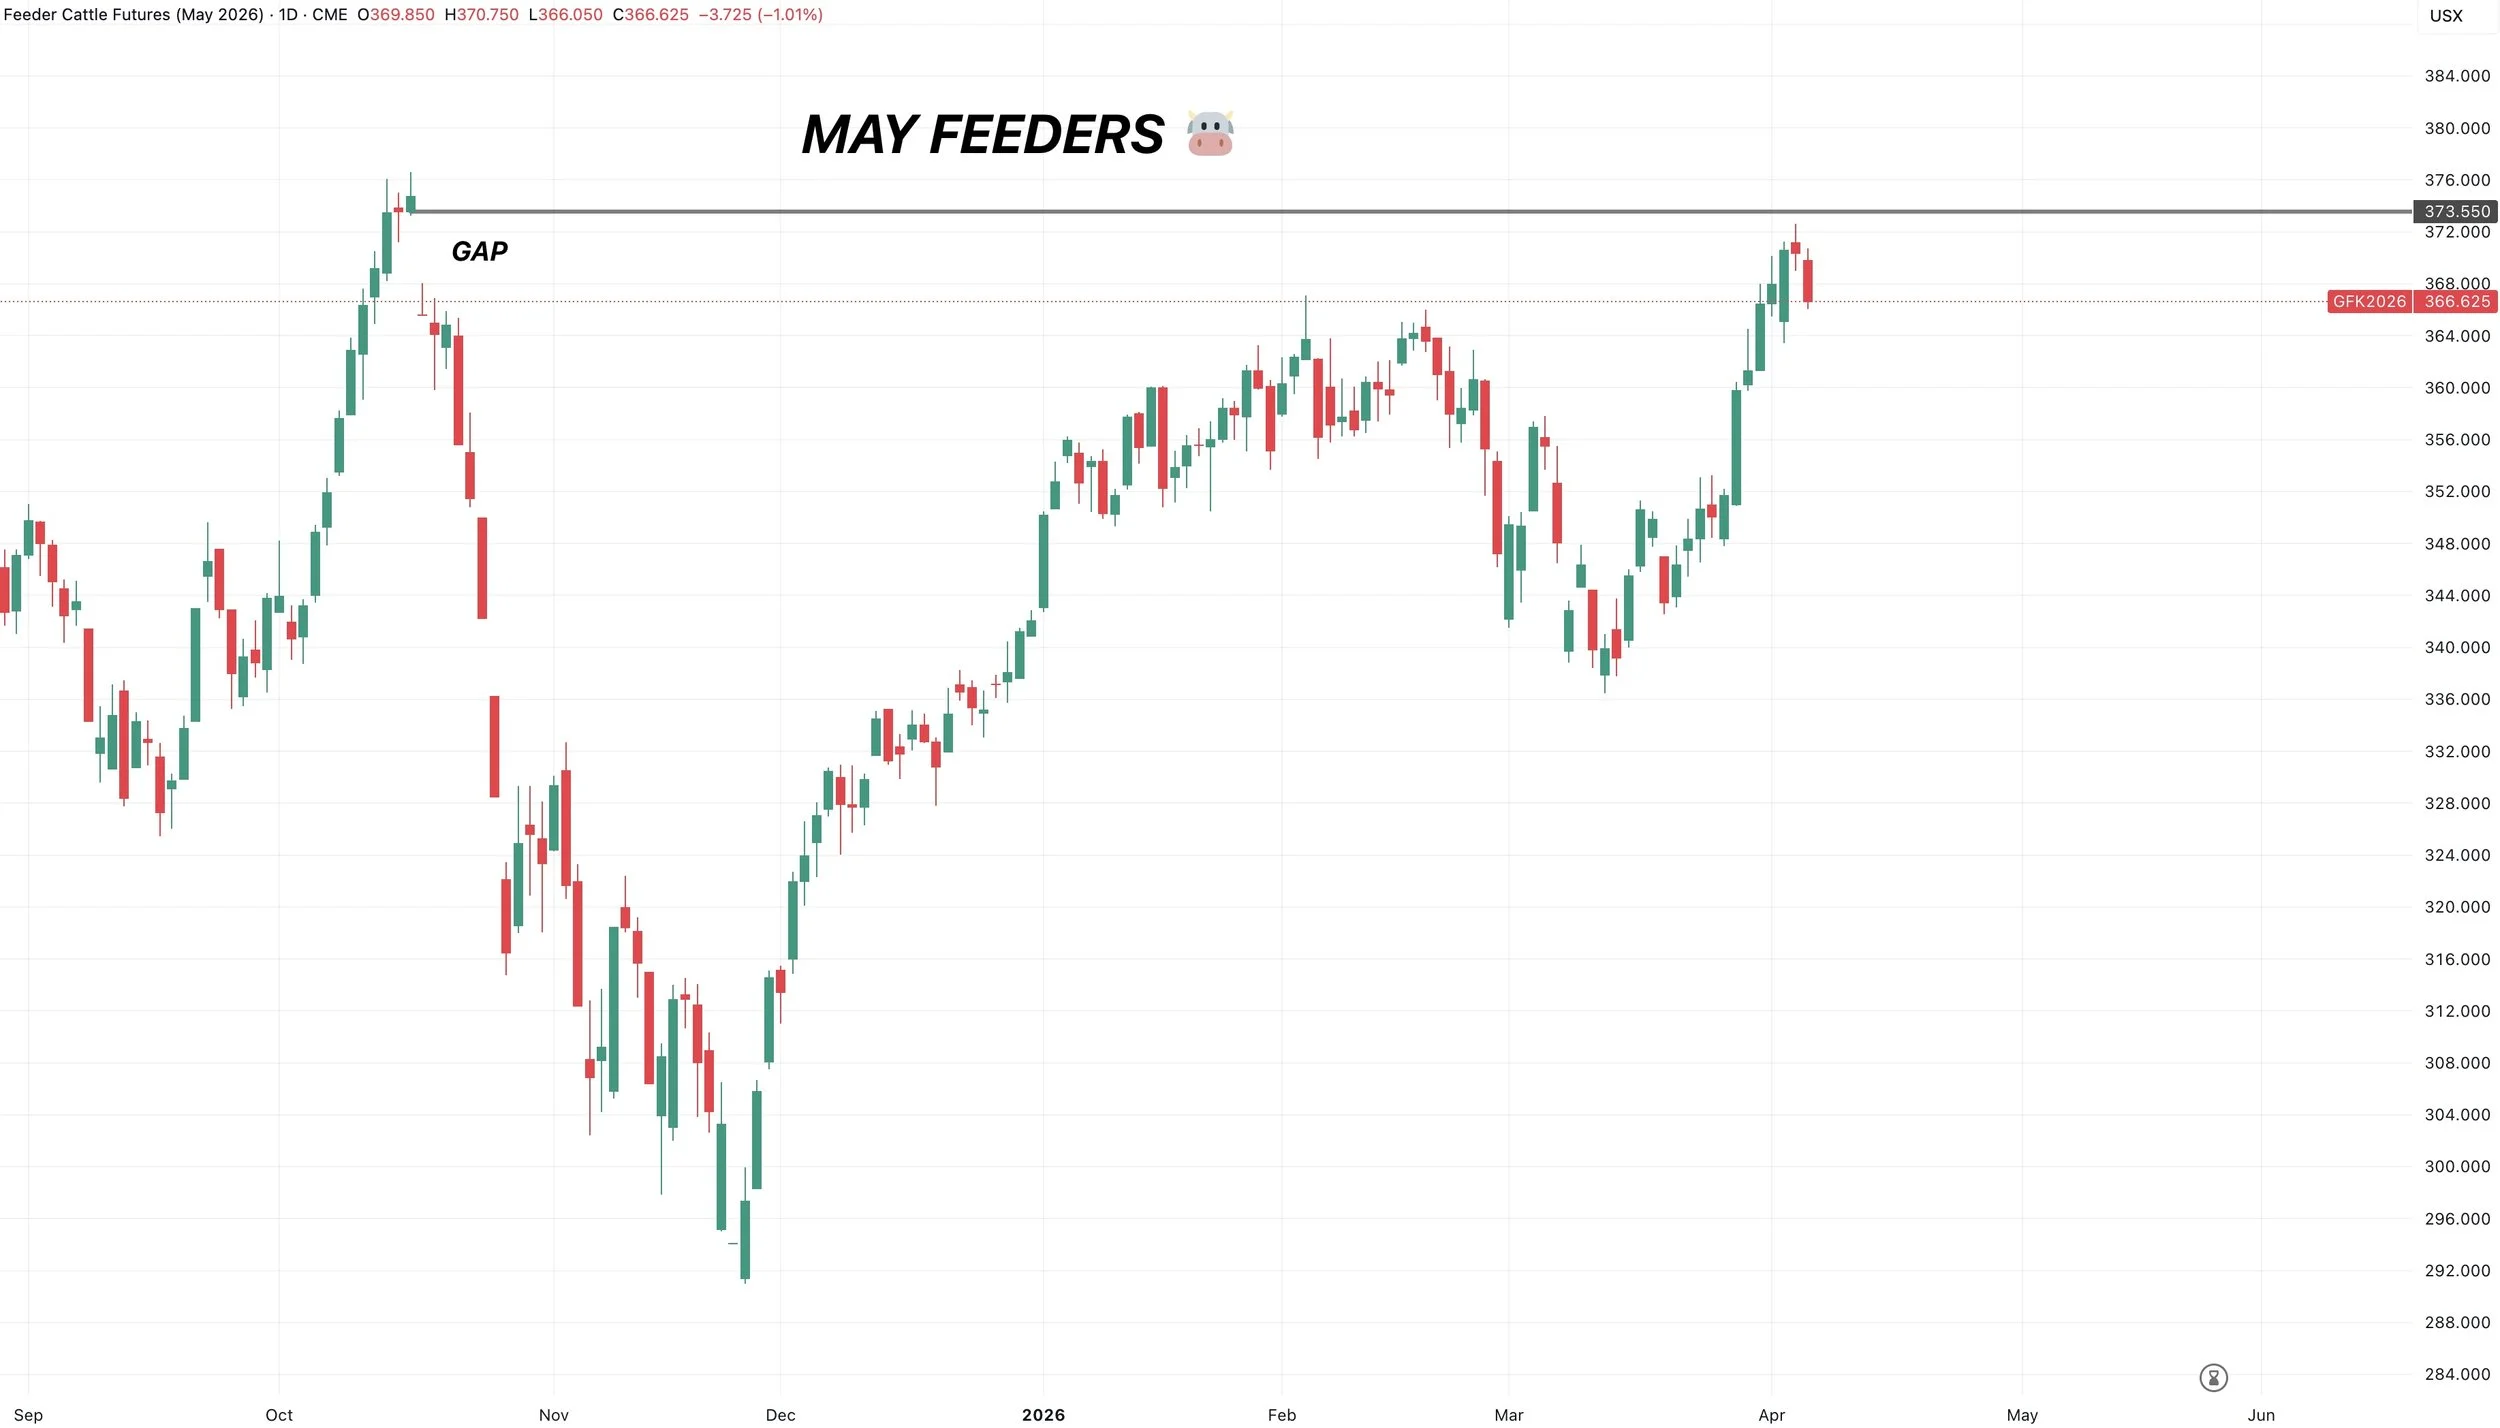
May Feeders Chart:
You also have to ask yourself why can’t feeders fill the gap?
We got so close but failed.
Just a reason to have some caution up here.
It makes sense to keep a floor under here, and I like defending these levels.
Want to Talk?
Our phones are open 24/7 for you guys if you ever need anything or want to discuss your operation.
Jeremey, Lauren & Office: (806)484-1214
Sebastian: (605)280-1186
Email: sfrost@dailymarketminute.com
Hedge Account
Interested in a hedge account? Use the link below to set up an account or give us a call.