
CRUDE SURGES. GRAINS STALL
MARKET UPDATE
You can scroll to read the usual update as well. As the written version is the exact same as the video.
Timestamps for video:
Overview: 0:00min
Corn: 1:15min
Beans: 6:50min
Wheat: 10:00min
Cattle: 12:55min
Want to talk?
Office: (806)484-1214
Futures Prices Close
Overview
The markets will be closed tomorrow for Good Friday.
Overall it was a disappointing day for the grains.
Initially we were strong overnight, but faded in today's session.
Meanwhile the cattle market continues to catch a bid.
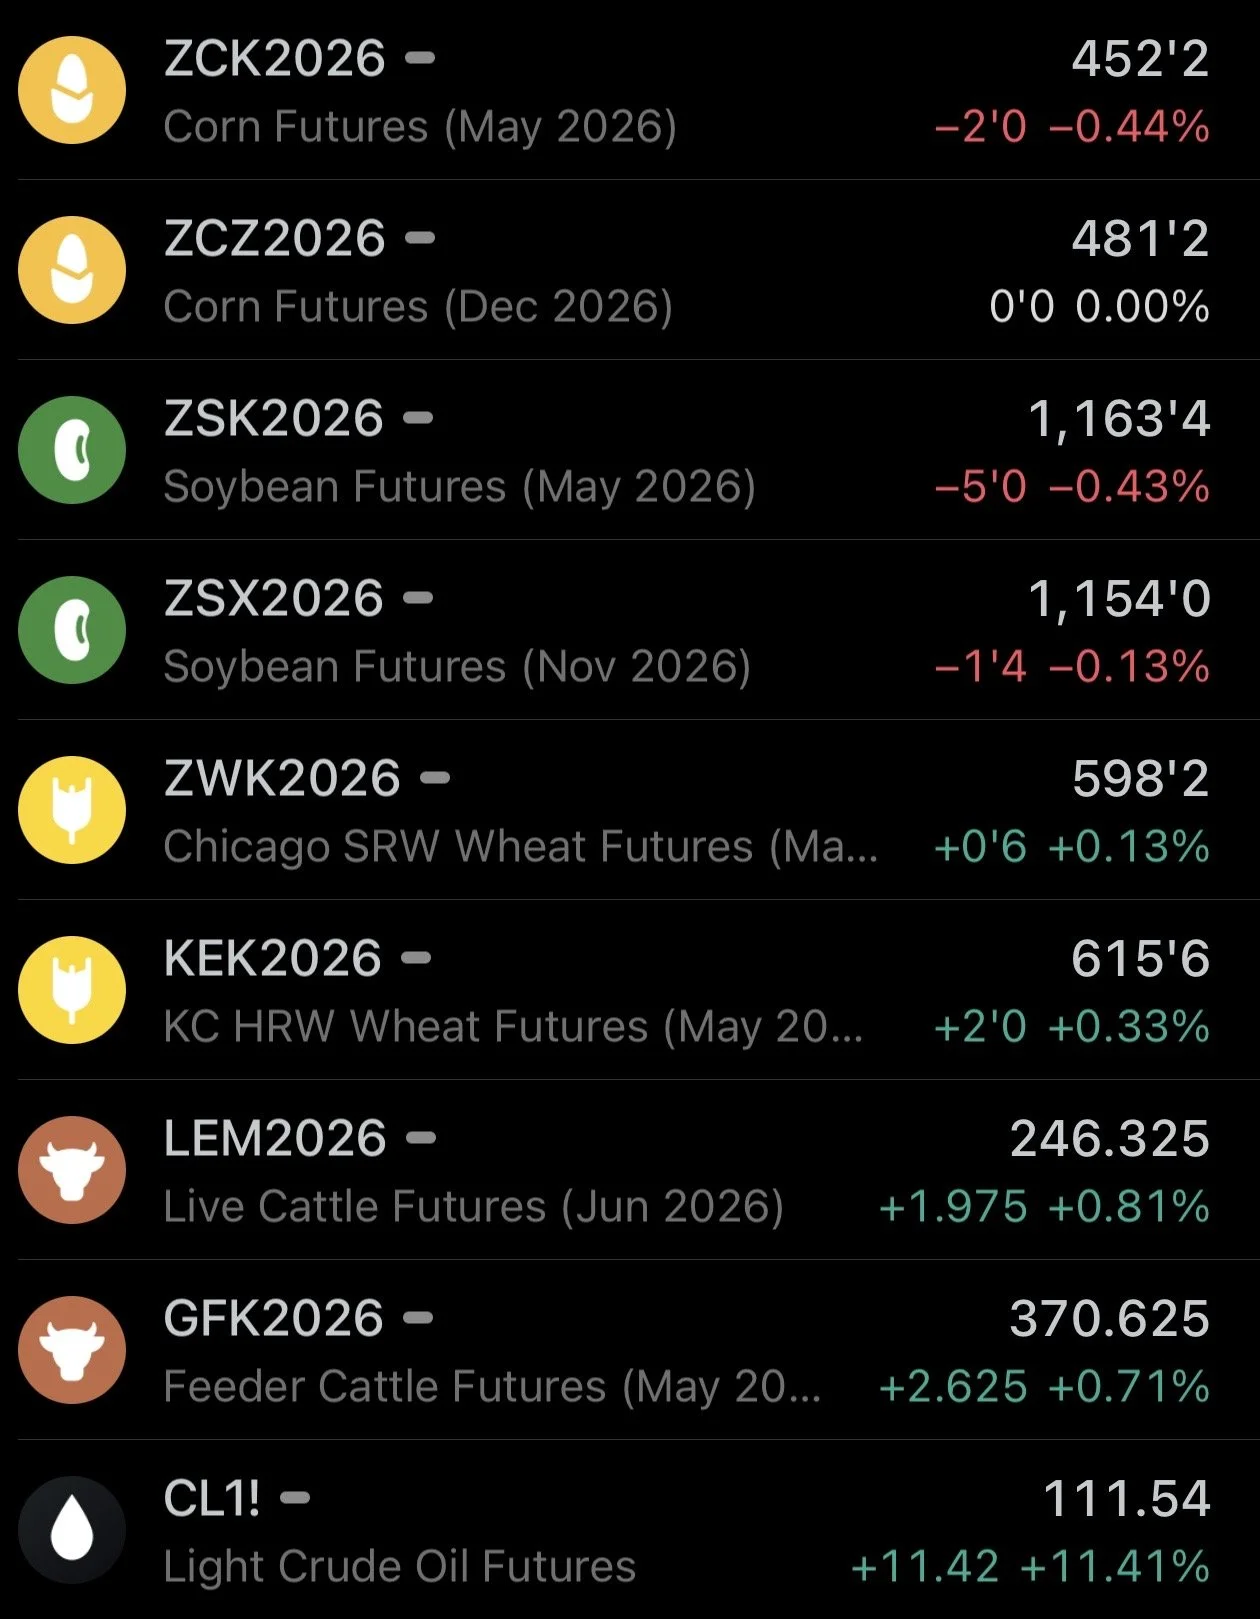
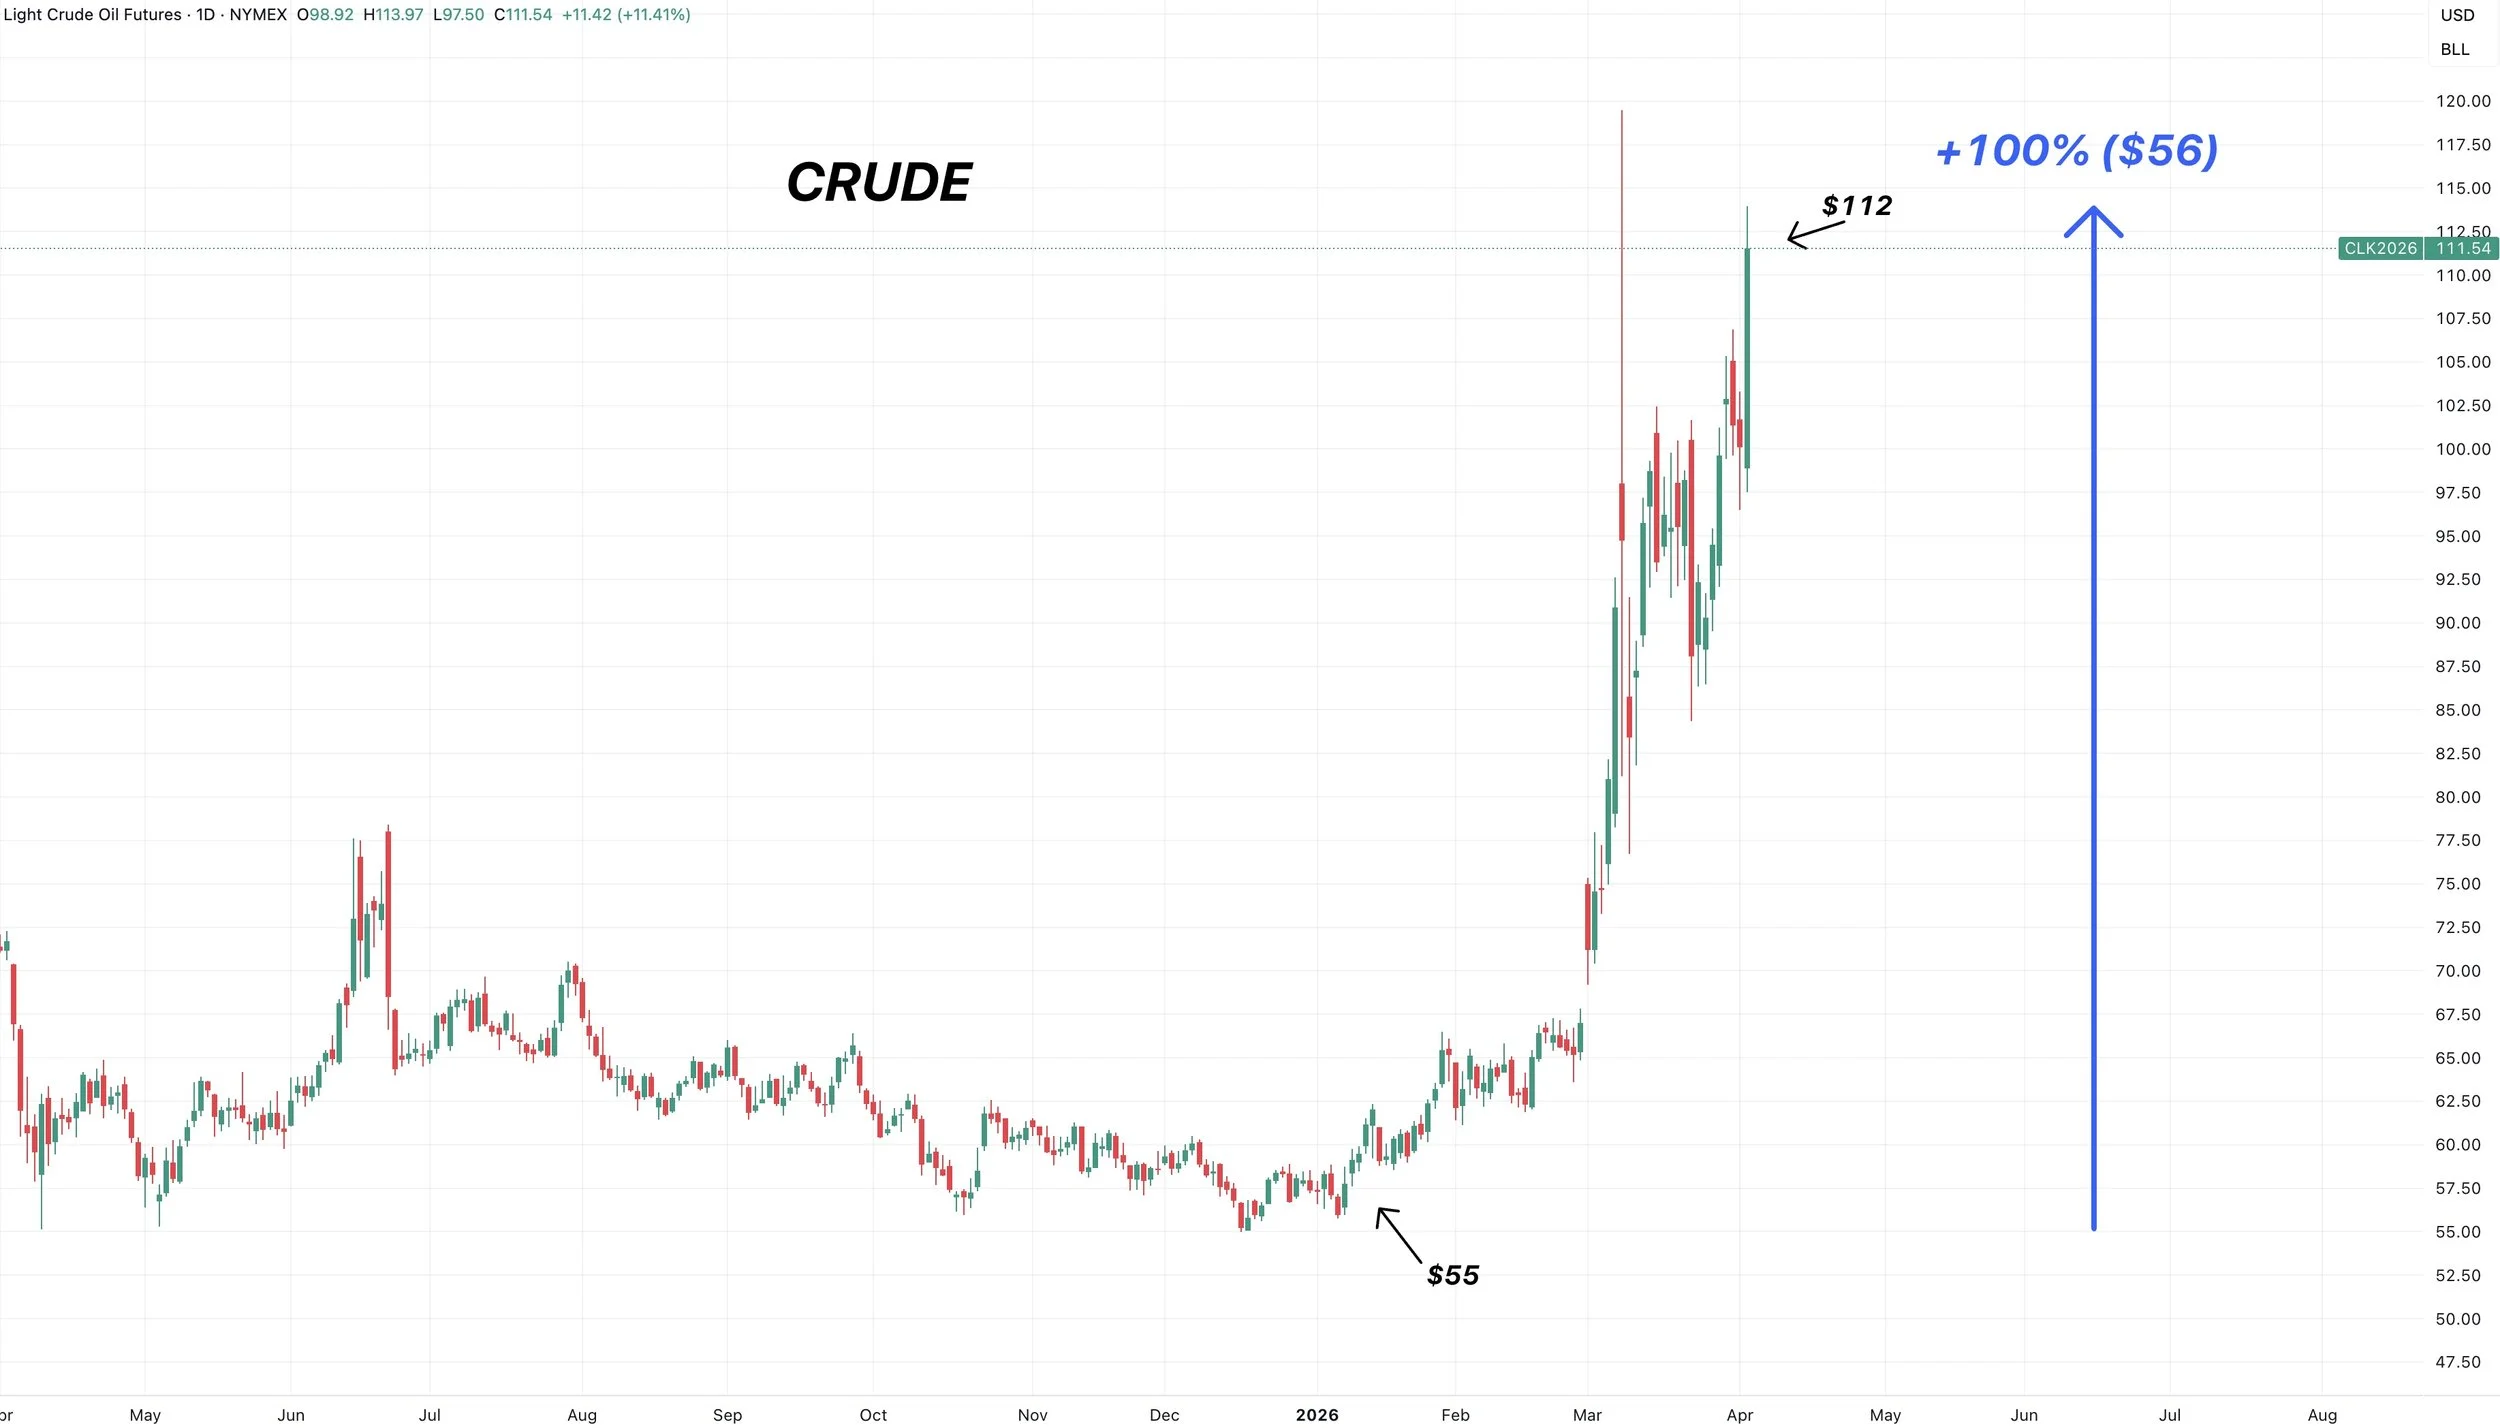
Crude oil absolutely surged today. Rallying over $10 a barrel, trading as high as $114. Posting a new high close for the move. Crude has now officially doubled since the start of the year.
Yet grains ended the day lower, which was pretty disappointing to see. As the grains have decoupled themselves from the energy markets the entire week.
Crude has been higher 6 of the last 8 days.
Corn has been lower 4 of the last 6 days.
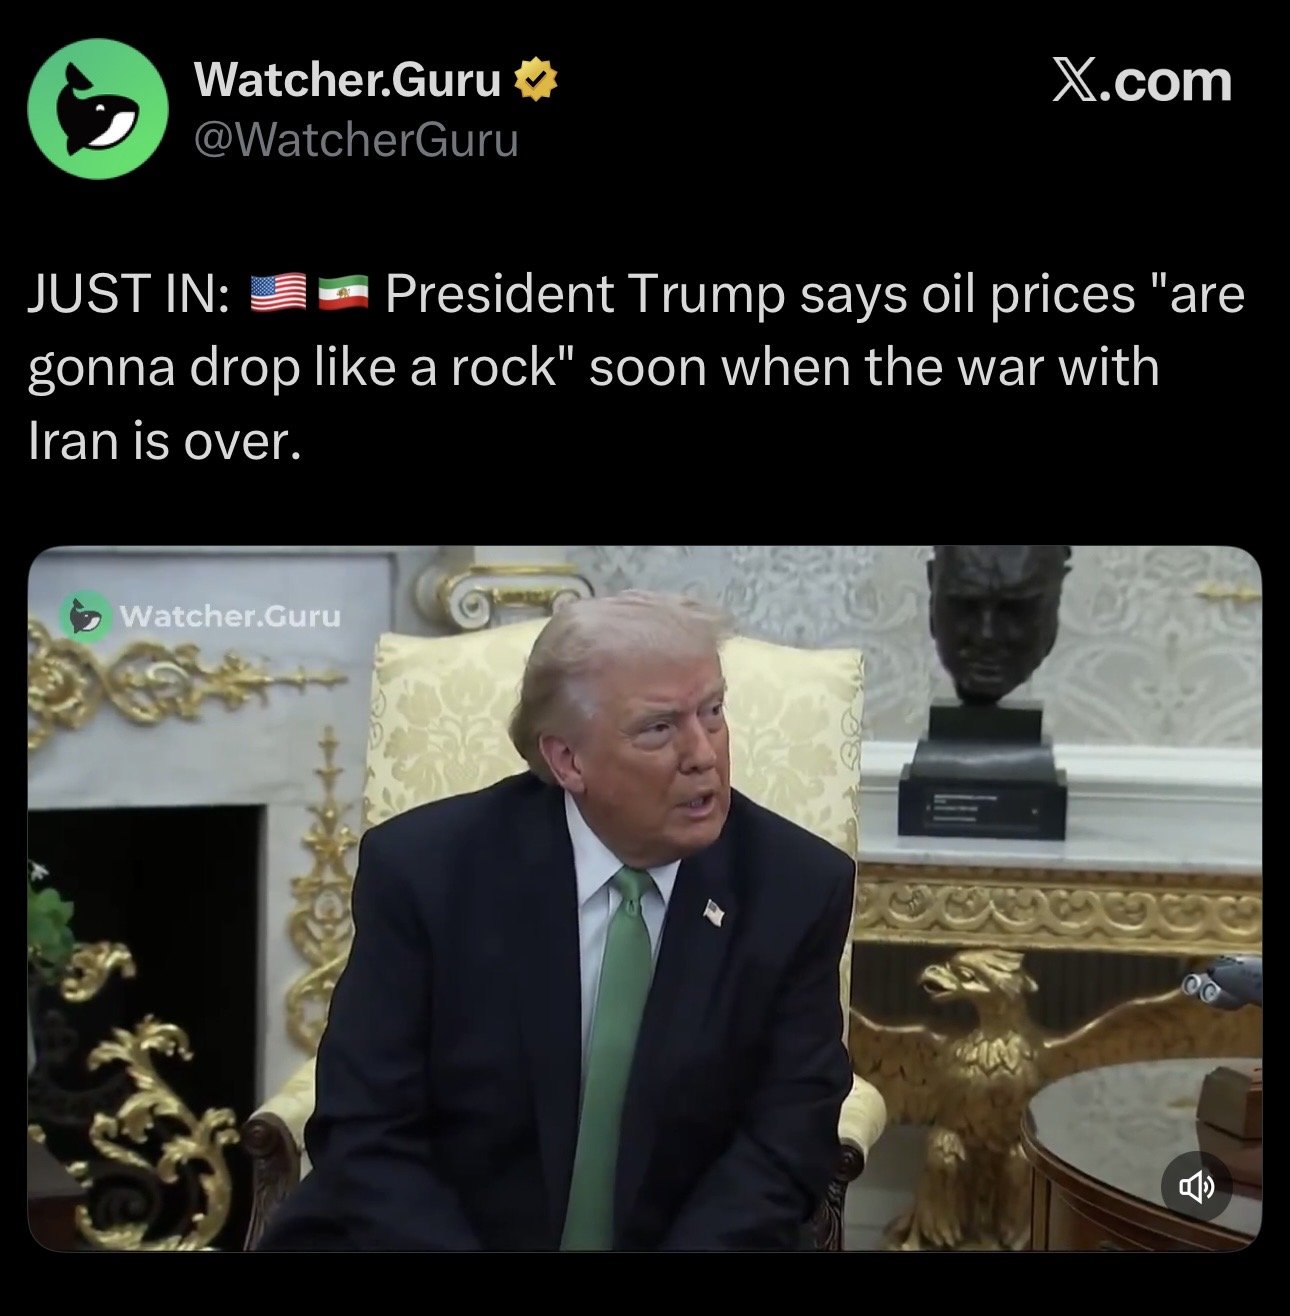
Trump Speech
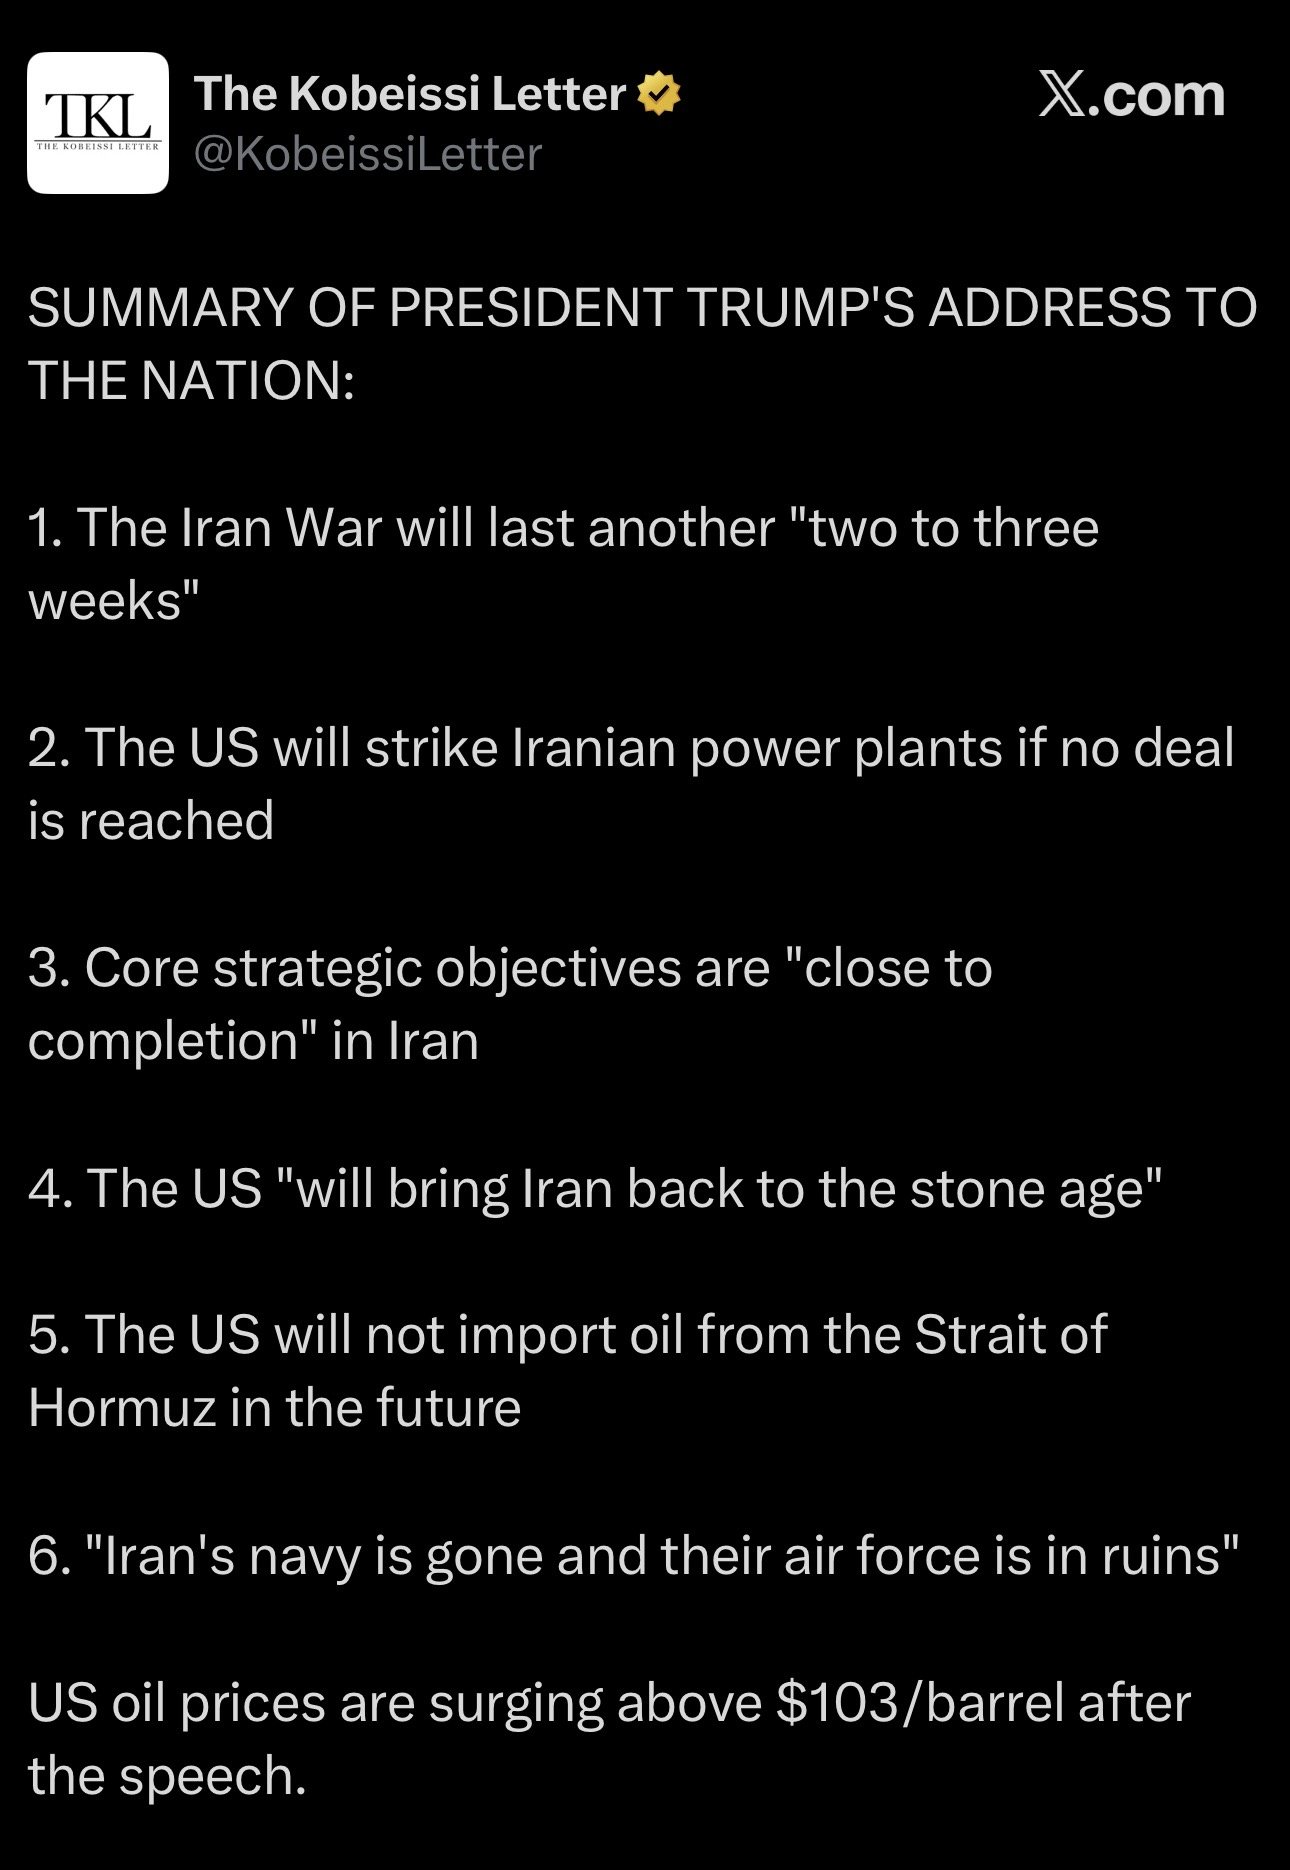
This is what had the crude market soaring today.
Last night Trump had a broadcast where he gave us an update on the Iran situation.
In all reality, he really didn’t provide anything new or shocking.
He essentially said that the war will last another 2-3 weeks.
And they will "hit Iran extremely hard" over these next 2-3 weeks.
If the US is not able to reach a deal, they will strike Iran's power plants.
Today's Main Takeaways
Corn
Acres vs Fertilizer:
Will fertilizer impact acres or not?
It's hard to definitively say, but let's look at some data.
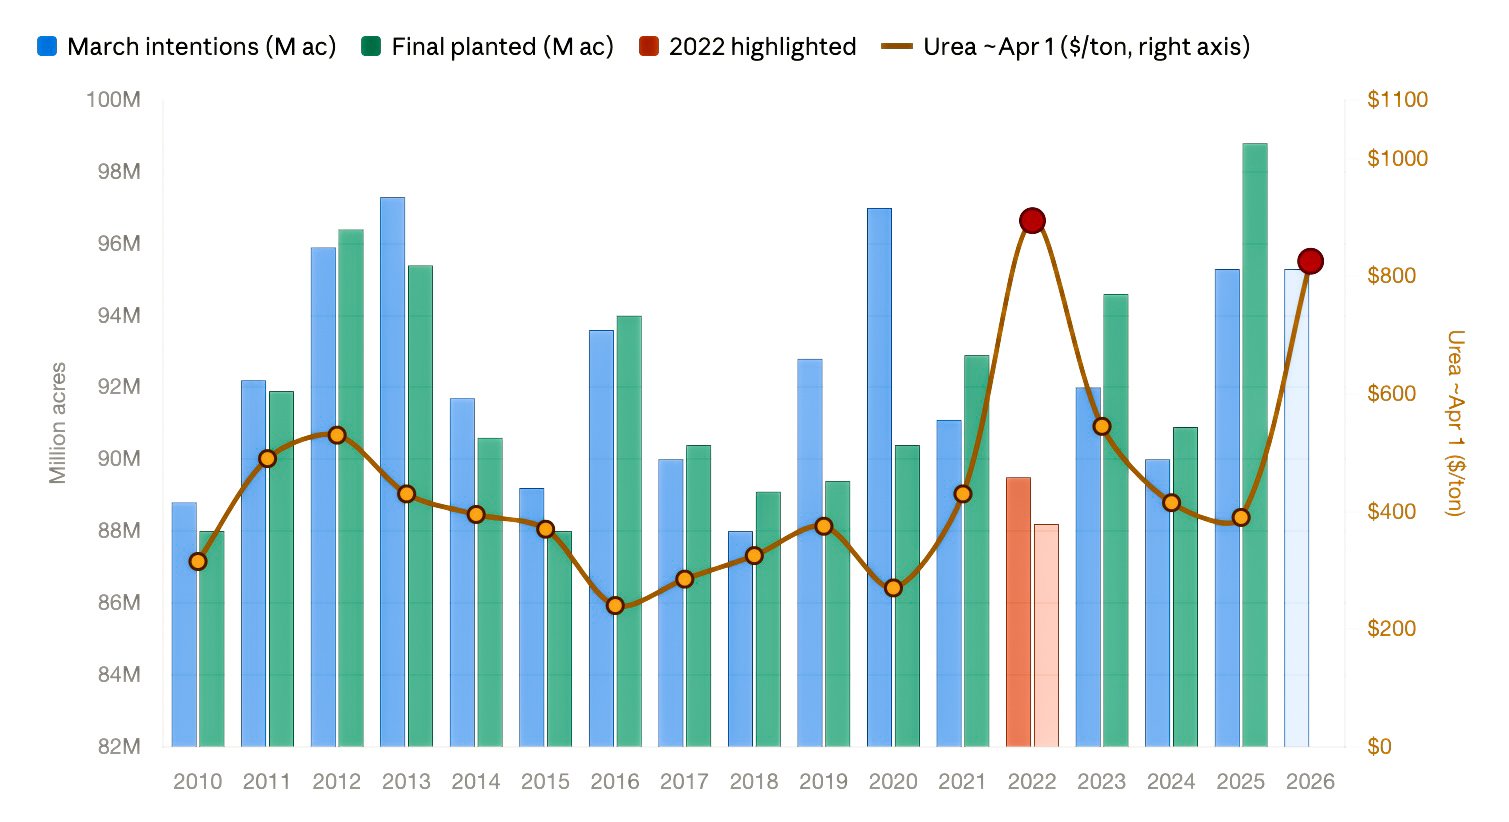
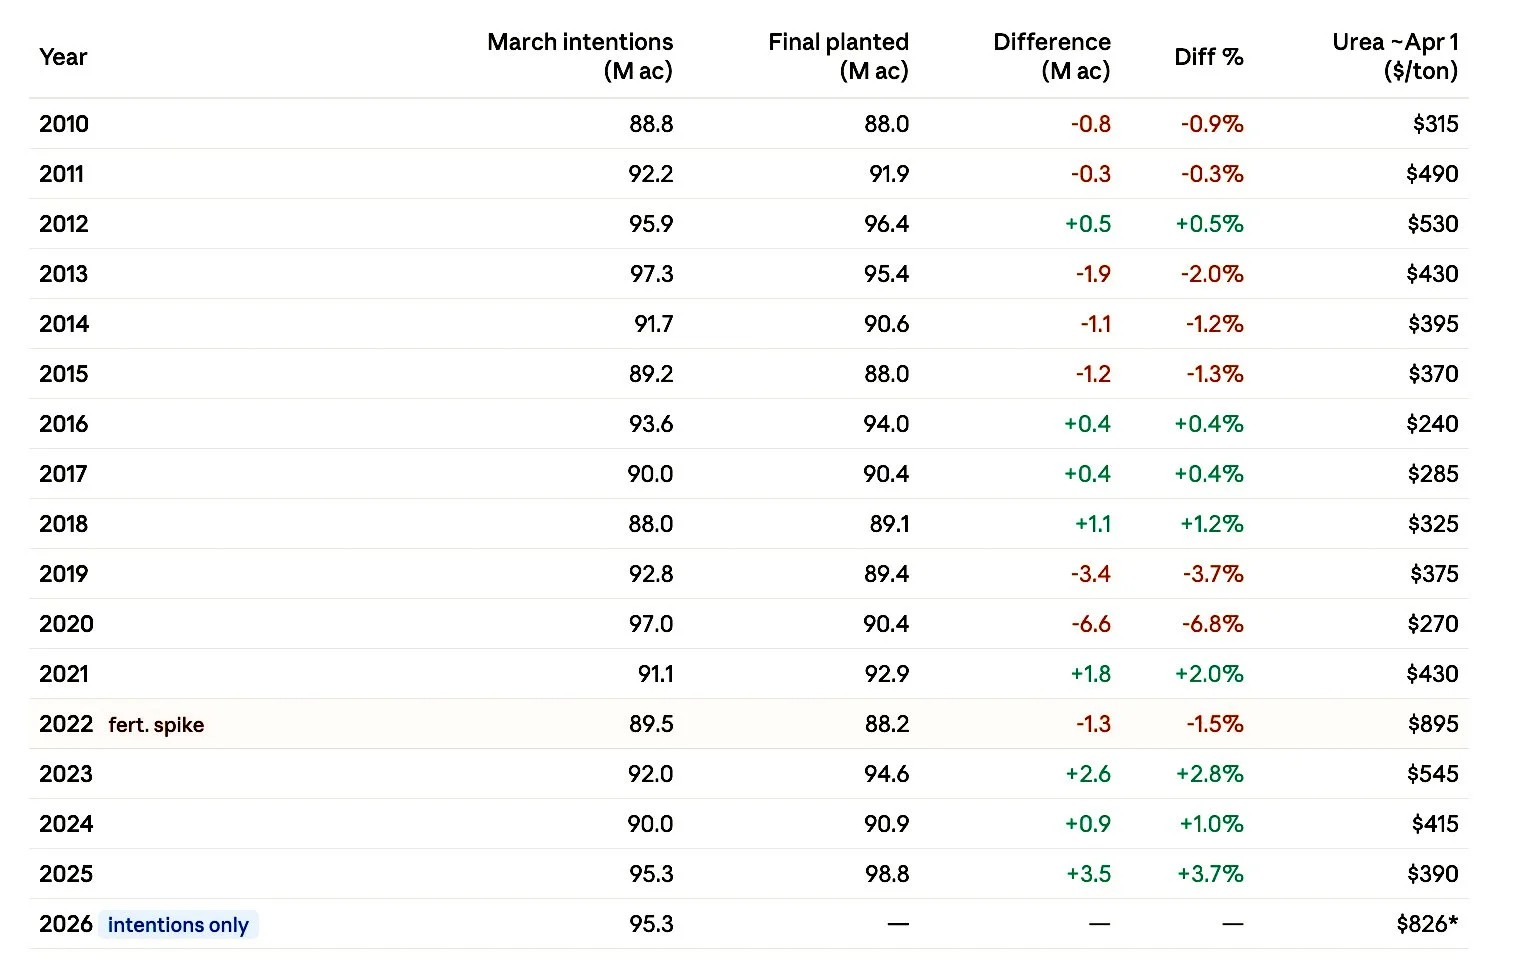
Here is a chart that shows:
March intentions acres
Final corn acres
Price of Urea on April 1st
What we do know is that the last time fertilizer was this expensive was back in 2022.
What happened to acres that year?
The final number was over 1 million less than the March intentions.
Here is a table view of the data.
The starting acres have been questionable to begin with.
The March number has been more than 1 million off the final number almost every single year since 2017.
Take a look at last year's big swing and miss as an example.
Where the final number came in 3.5 million more than March.
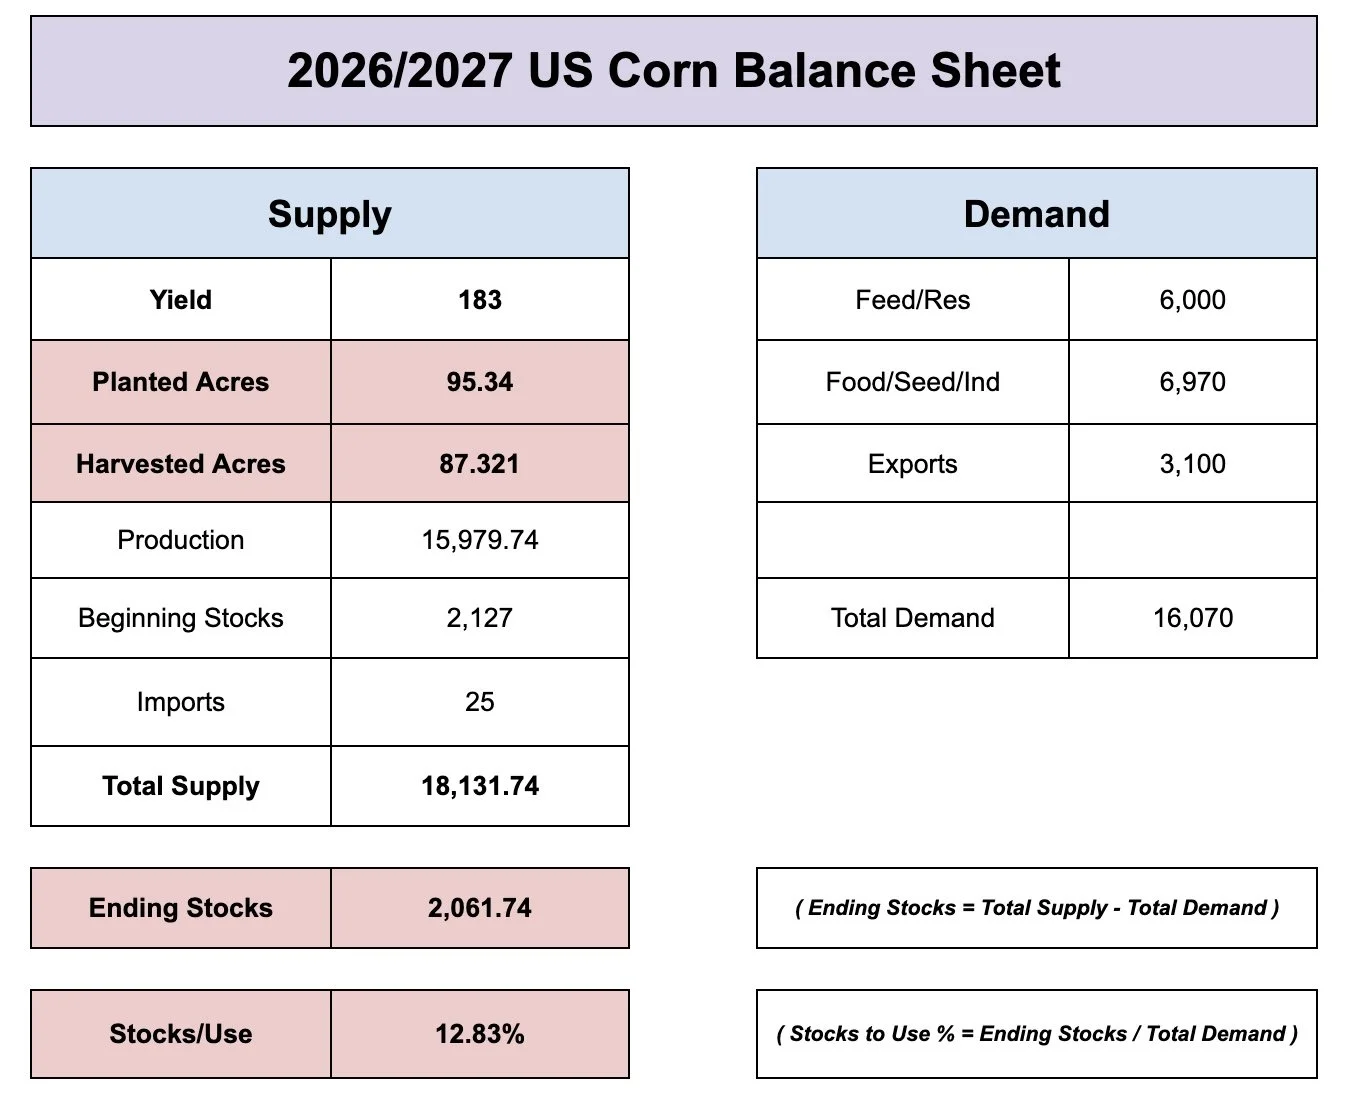
Bear Case vs Bull Case:
First for the bear case.
Let's say acres stayed at 95 million.
While at the same time, we got a trendline yield of 183.
Using the Feb outlook demand numbers, that gives us over a 2 billion bushel carryout.
That is not a bullish scenario. At all.
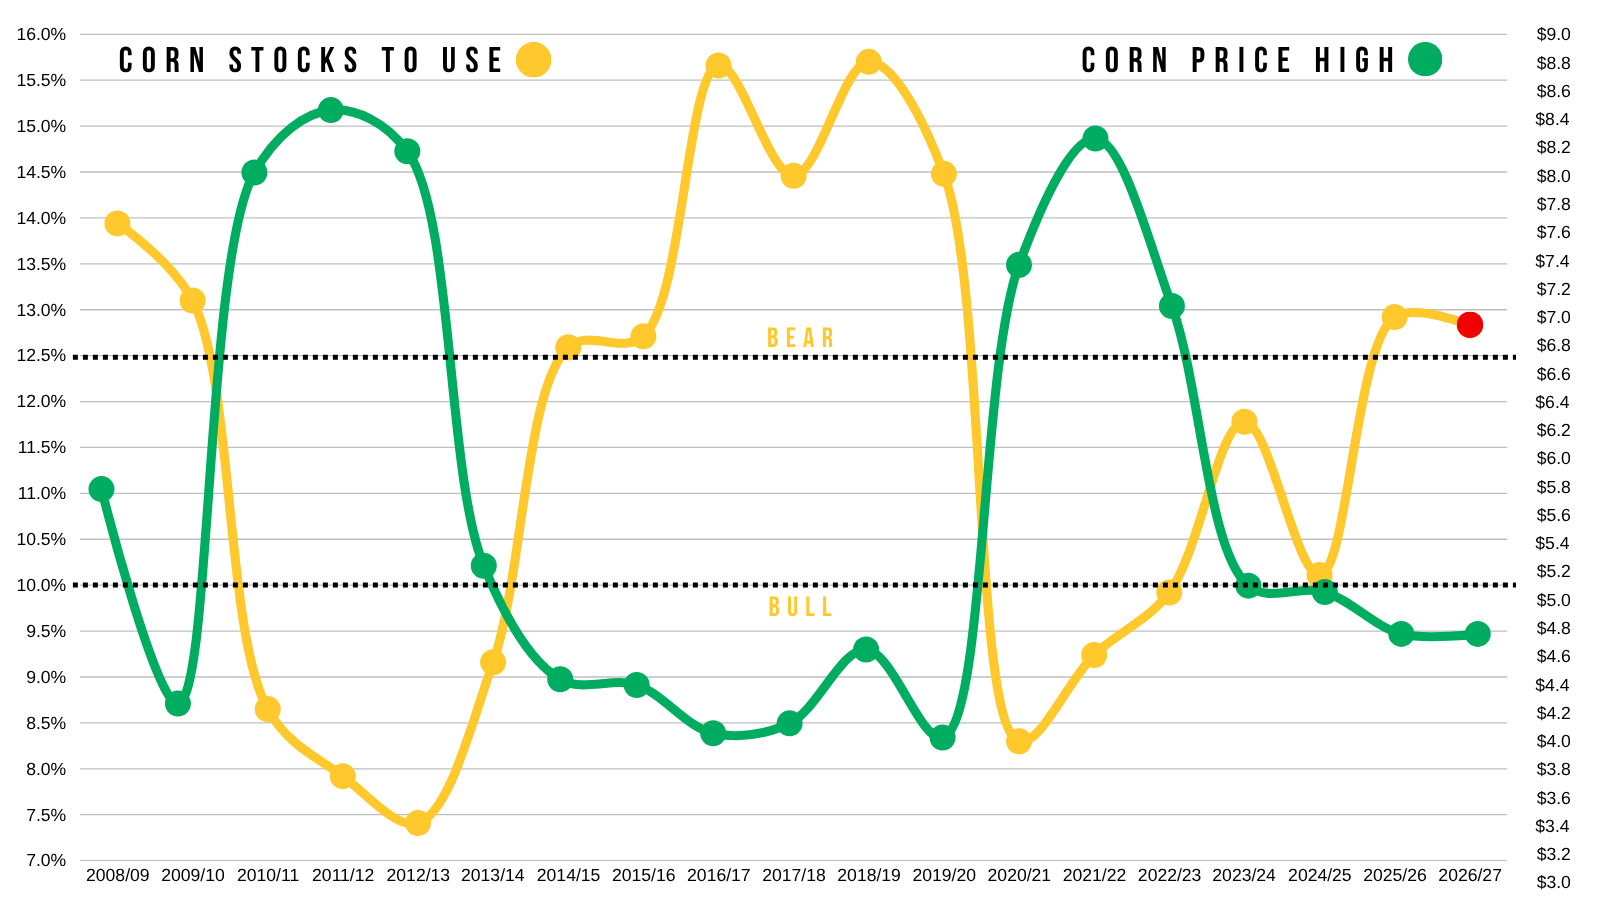
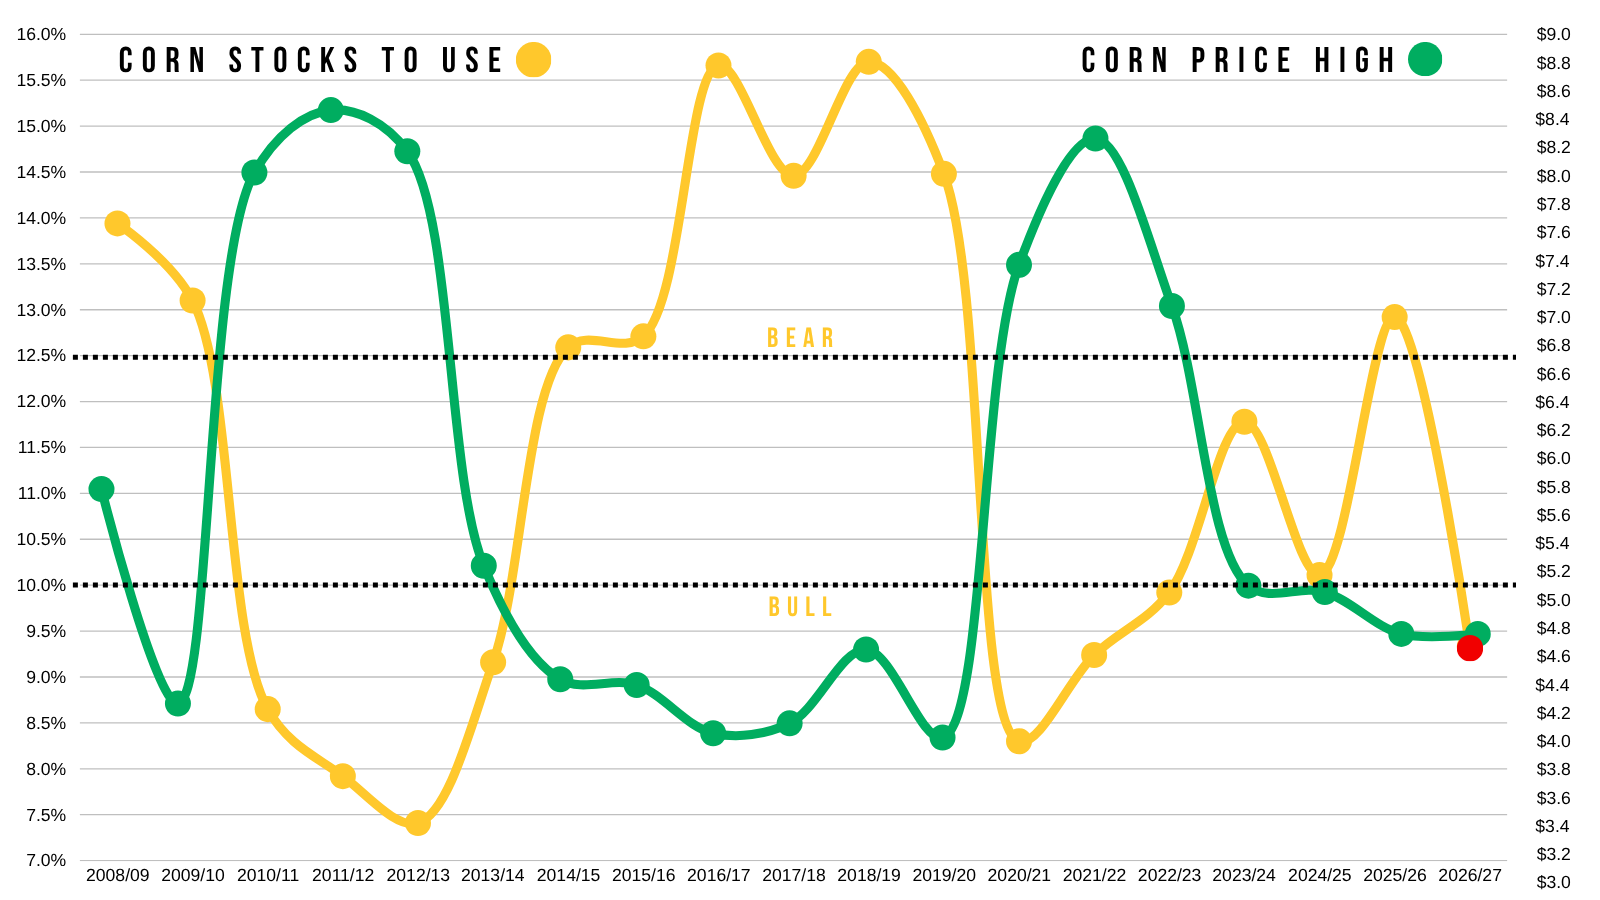
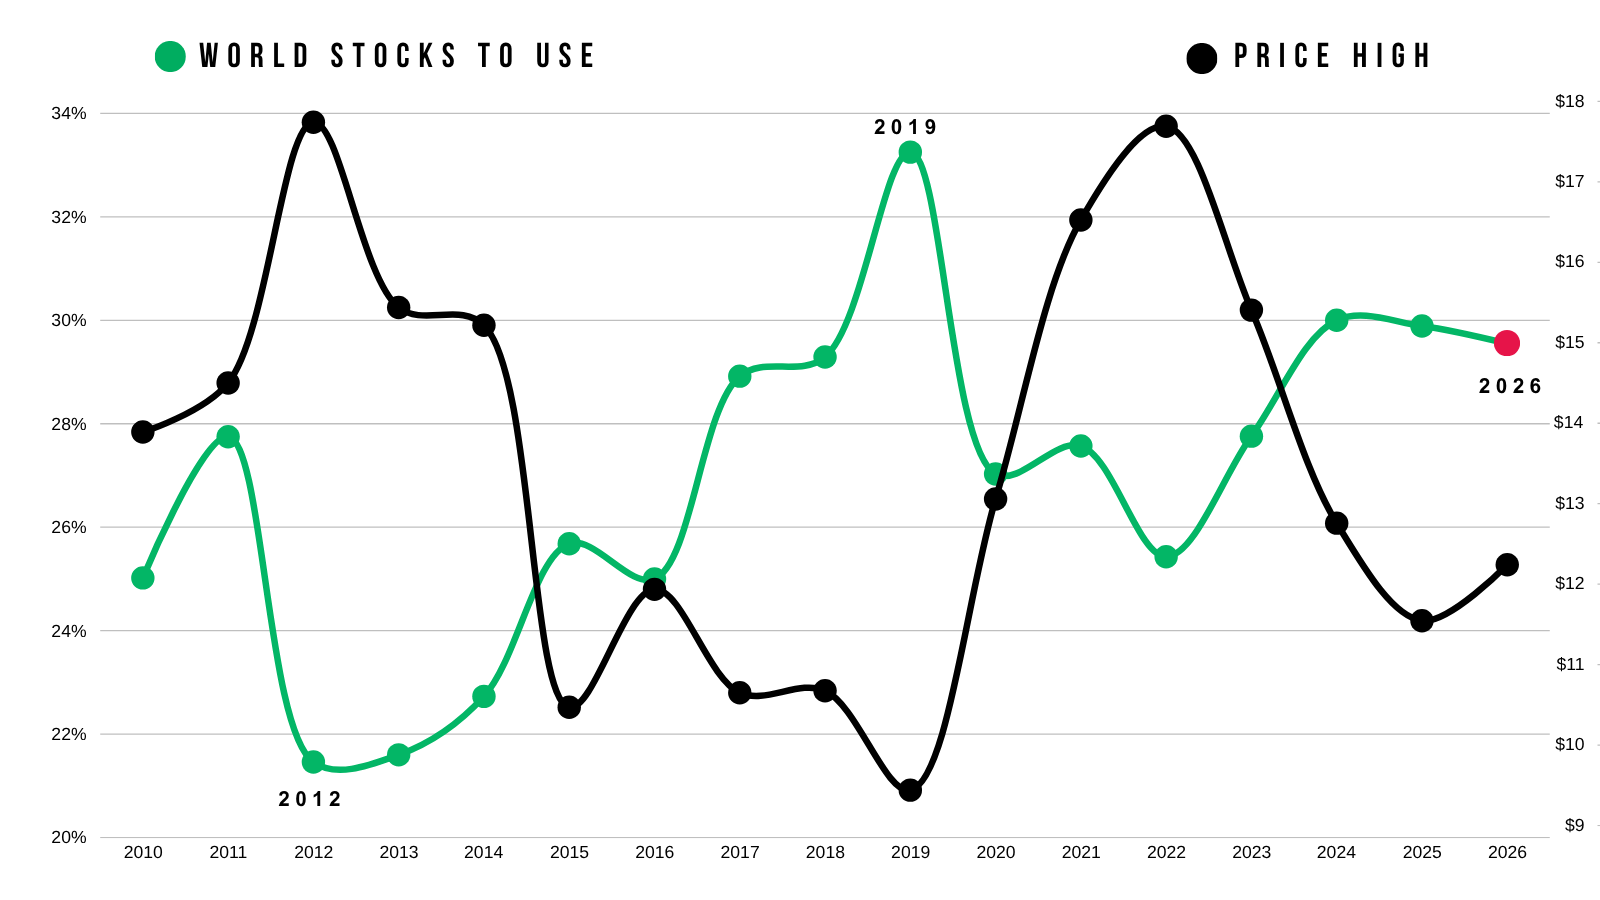
Here is what that would look like if you threw that implied near 13% stocks to use ratio on this chart that compares stocks to use vs the highest price of the year.
That is still firmly in bearish territory.
If this happened, it could very well result in us seeing somewhere in the realm of $4.00 new crop at some point if it pans out that way.
This stocks to use would be on par with plenty of other bear market years.
Now let's flip the script.
On the other side of the spectrum, this would be a pretty bullish scenario.
But would require both of the right cards to fall.
But what happens if acres are closer to 93 rather than 95?
While at the same time, we do not raise a trendline yield?
For this example let's use 93 million acres and a 181 yield.
Before touching demand (which will likely offset some of these losses), it gives you a sub 10% stocks to use ratio.
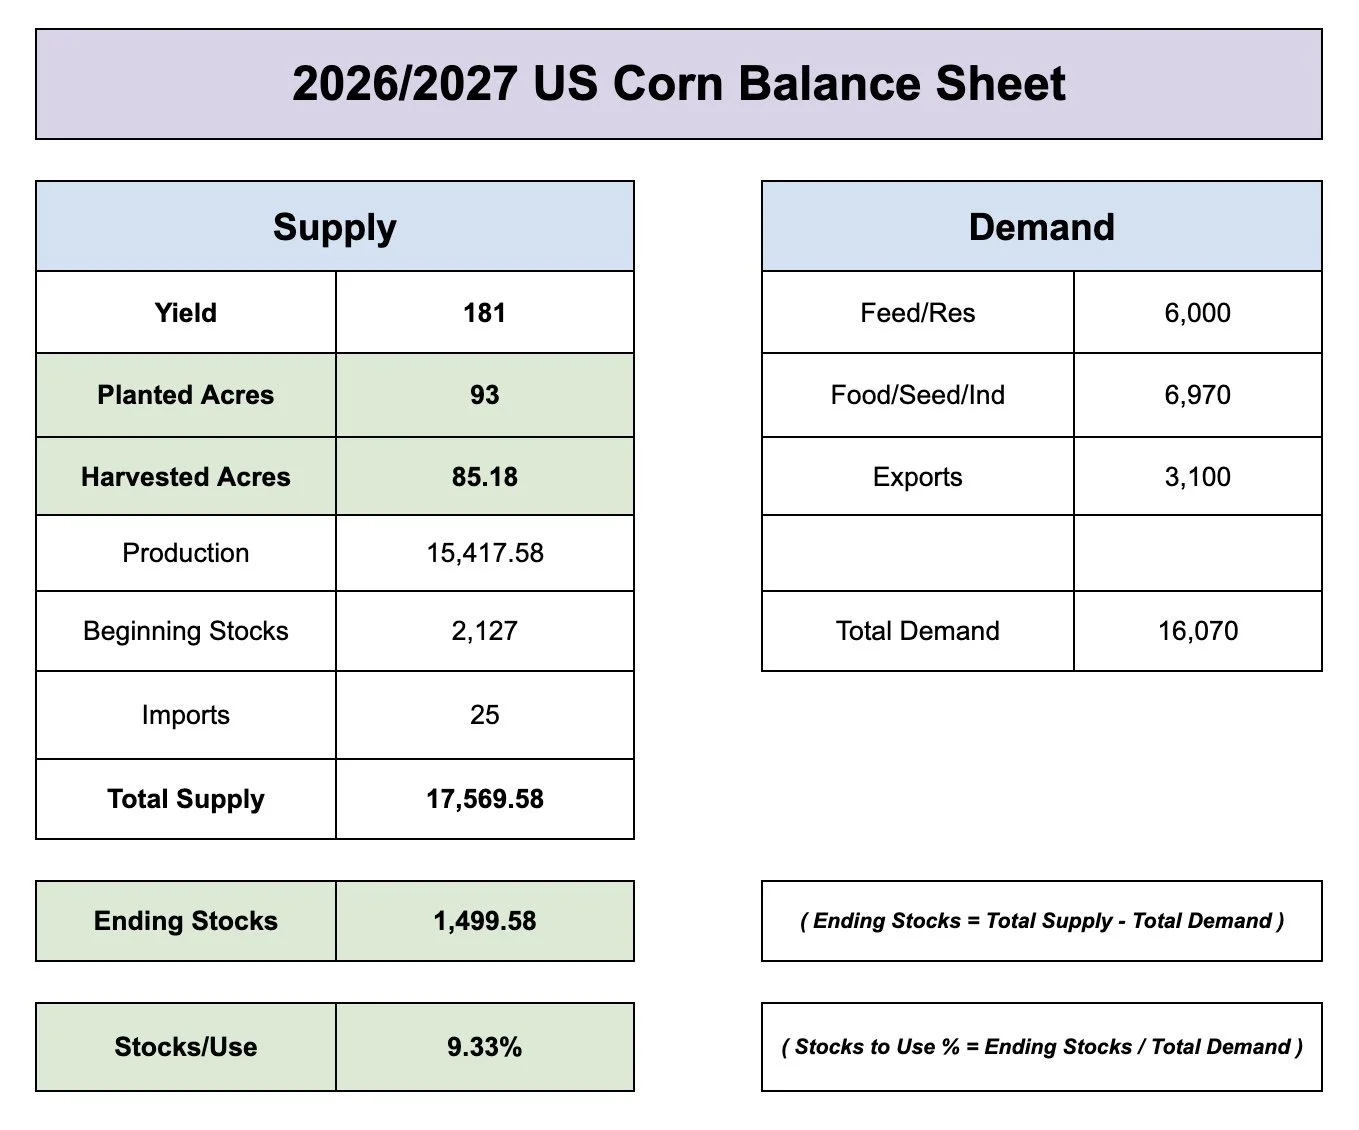
That would firmly put you into bull territory.
But again, you'd need two cards to fall right.
However, this is the acre number we are going to be using until June.
So we'll either need A) a weather scare, or B) a surprise in the final acres.
Both possible. But both unknown.
Crude: the Wild Card
The obvious wild card has to be crude oil and the war.
It sounds like the war should be over within the next month.
That has to be a concern. Given that the majority of this entire rally was simply driven by war.
The bigger question will be how does this affect crude moving forward.
If the war ends, I am sure we will get an intial knee jerk reaction lower.
But have the impacts on supply been enough to keep crude elevated above $80 for an extended period of time or will we go right back down?
If the war ends, will the strait remain closed for a while or not?
Trump has flat out stated that crude will "drop like a rock" when this war is over.
If this has already caused enough disruption to result in crude staying above $80 for a while, it will cause inflation.
Trump does not want this to happen and will do anything he can to keep oil and inflation low.
But they go hand in hand. High crude raises the costs of everything.
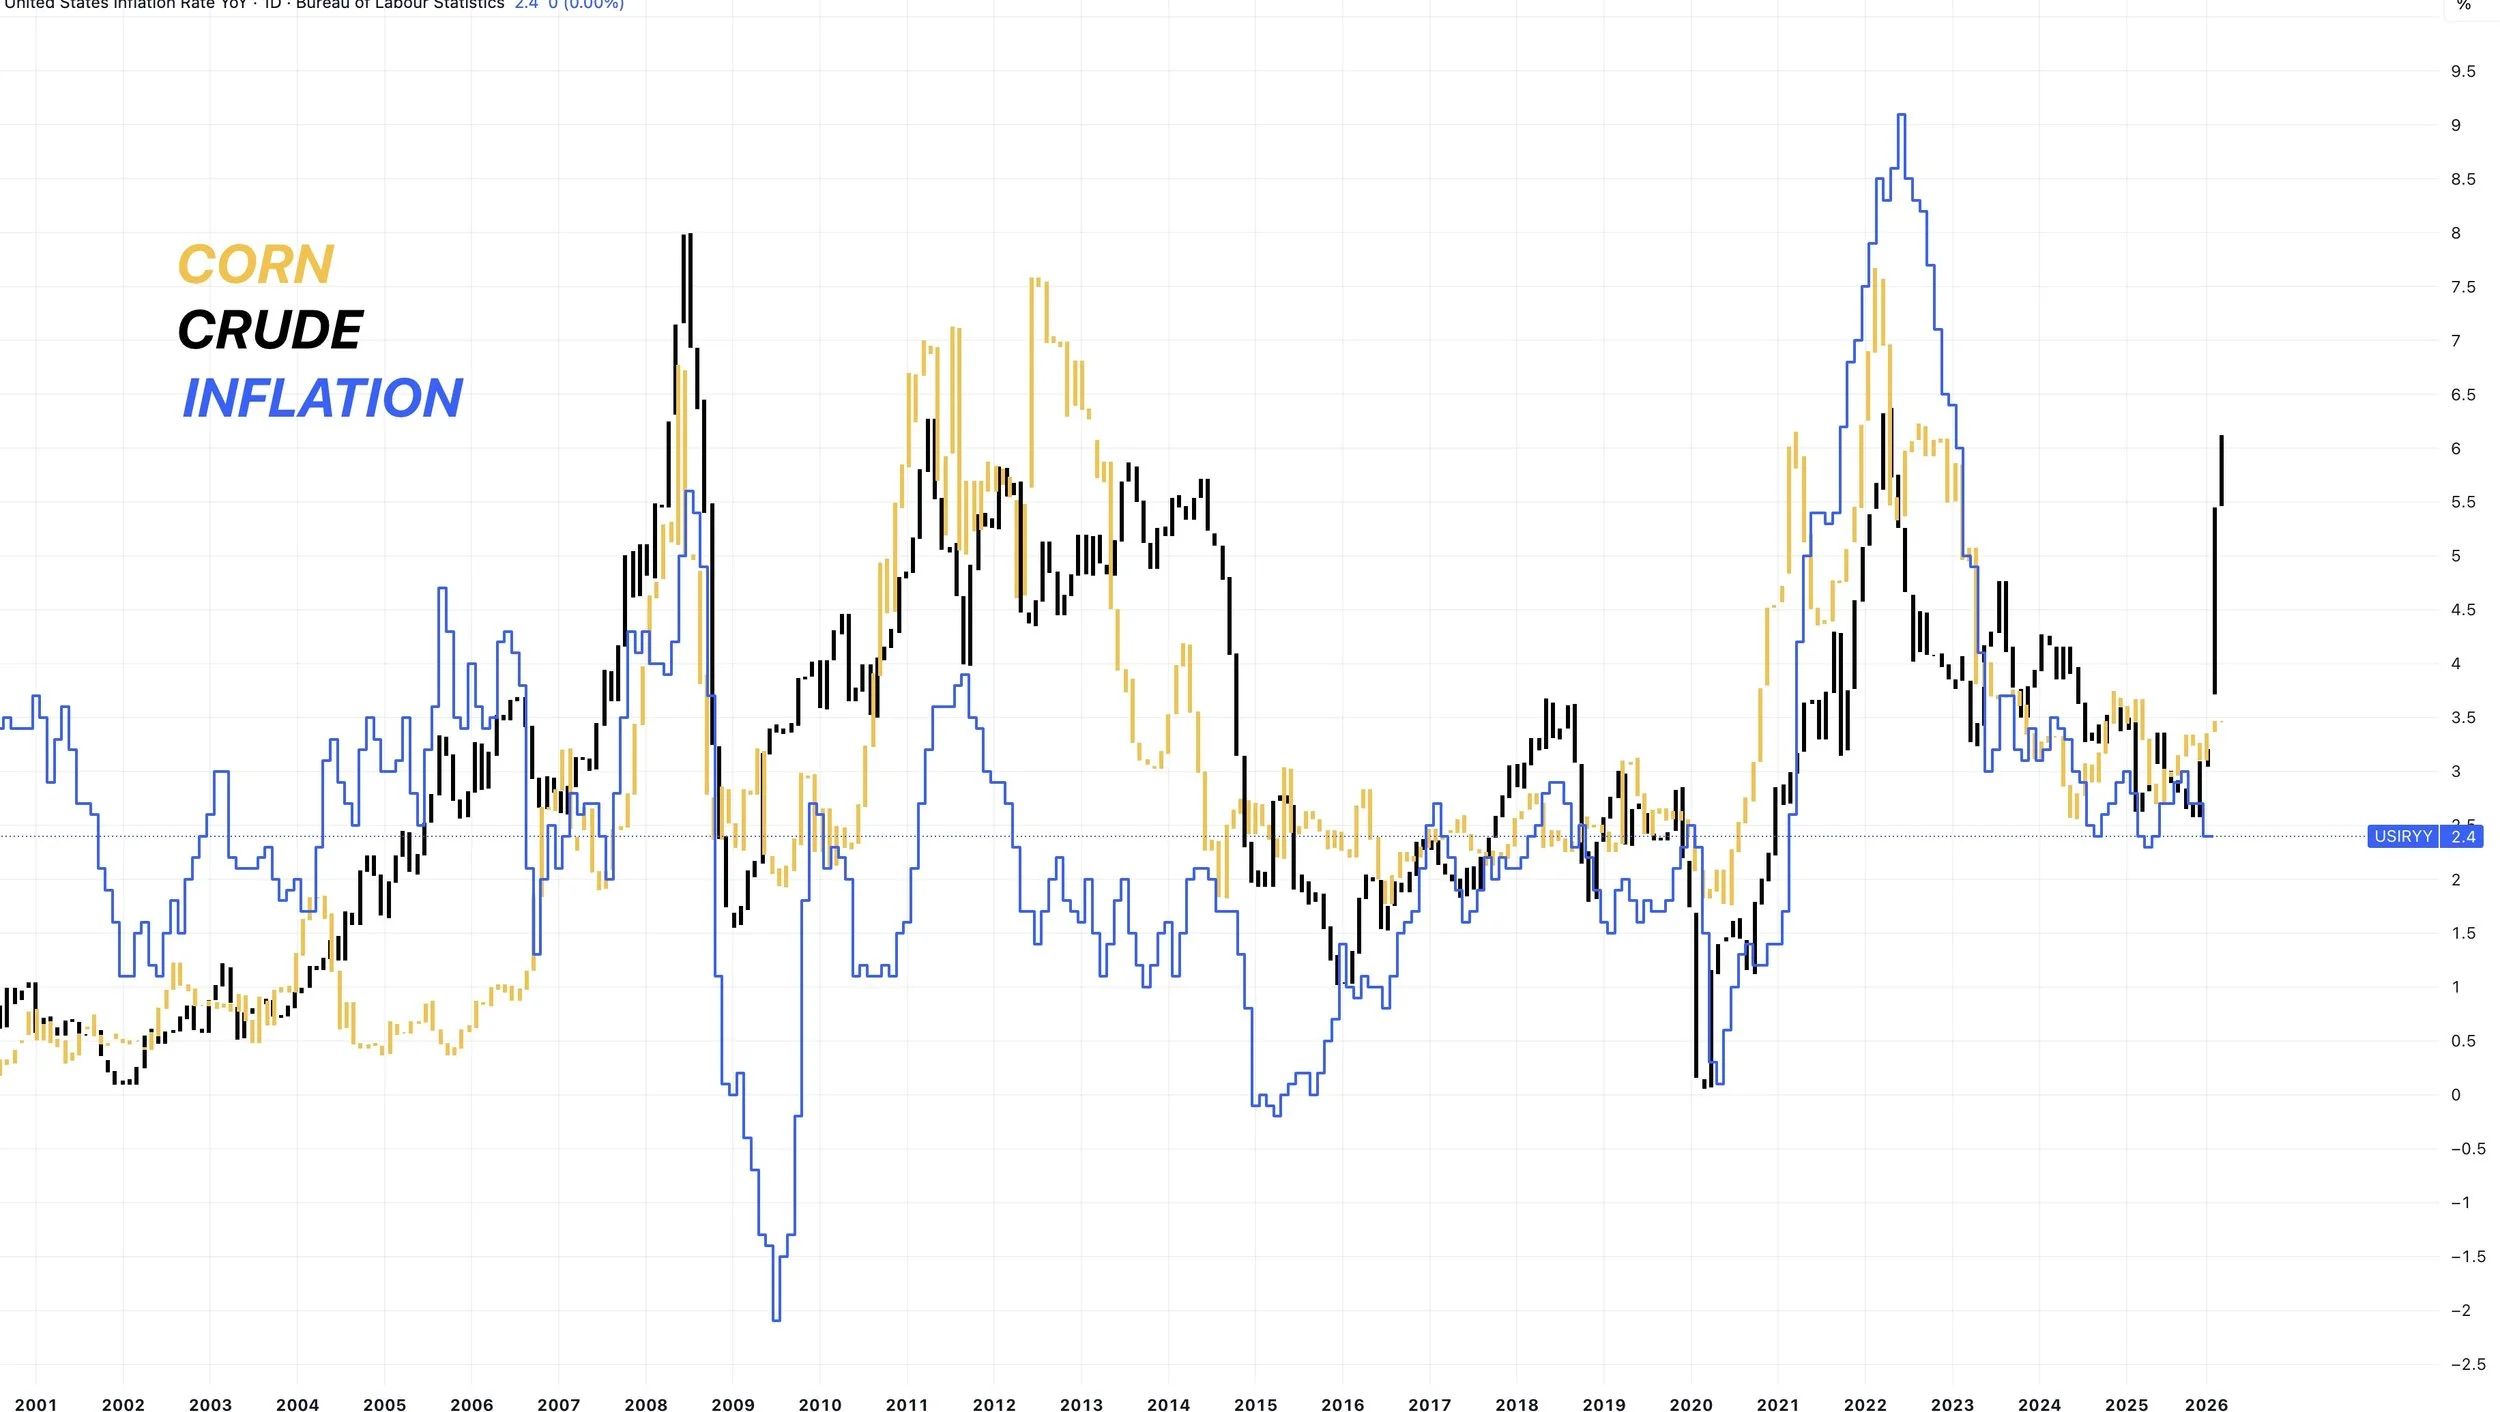
Inflation is typically bullish for grains.
Here is a chart that compares crude to the rate of inflation, along with corn prices.
You can’t deny the correlation.
So if.. crude stays high. You would have to assume it's at the very least a supportive factor for corn.
You could also argue that at a certain point, grains and commodities as a whole could become an inflation play.
If crude stays up here, you could argue that the balance sheets wouldn’t matter a whole lot.
For now, macro headlines and the war will likely be the driver until we start getting into planting.
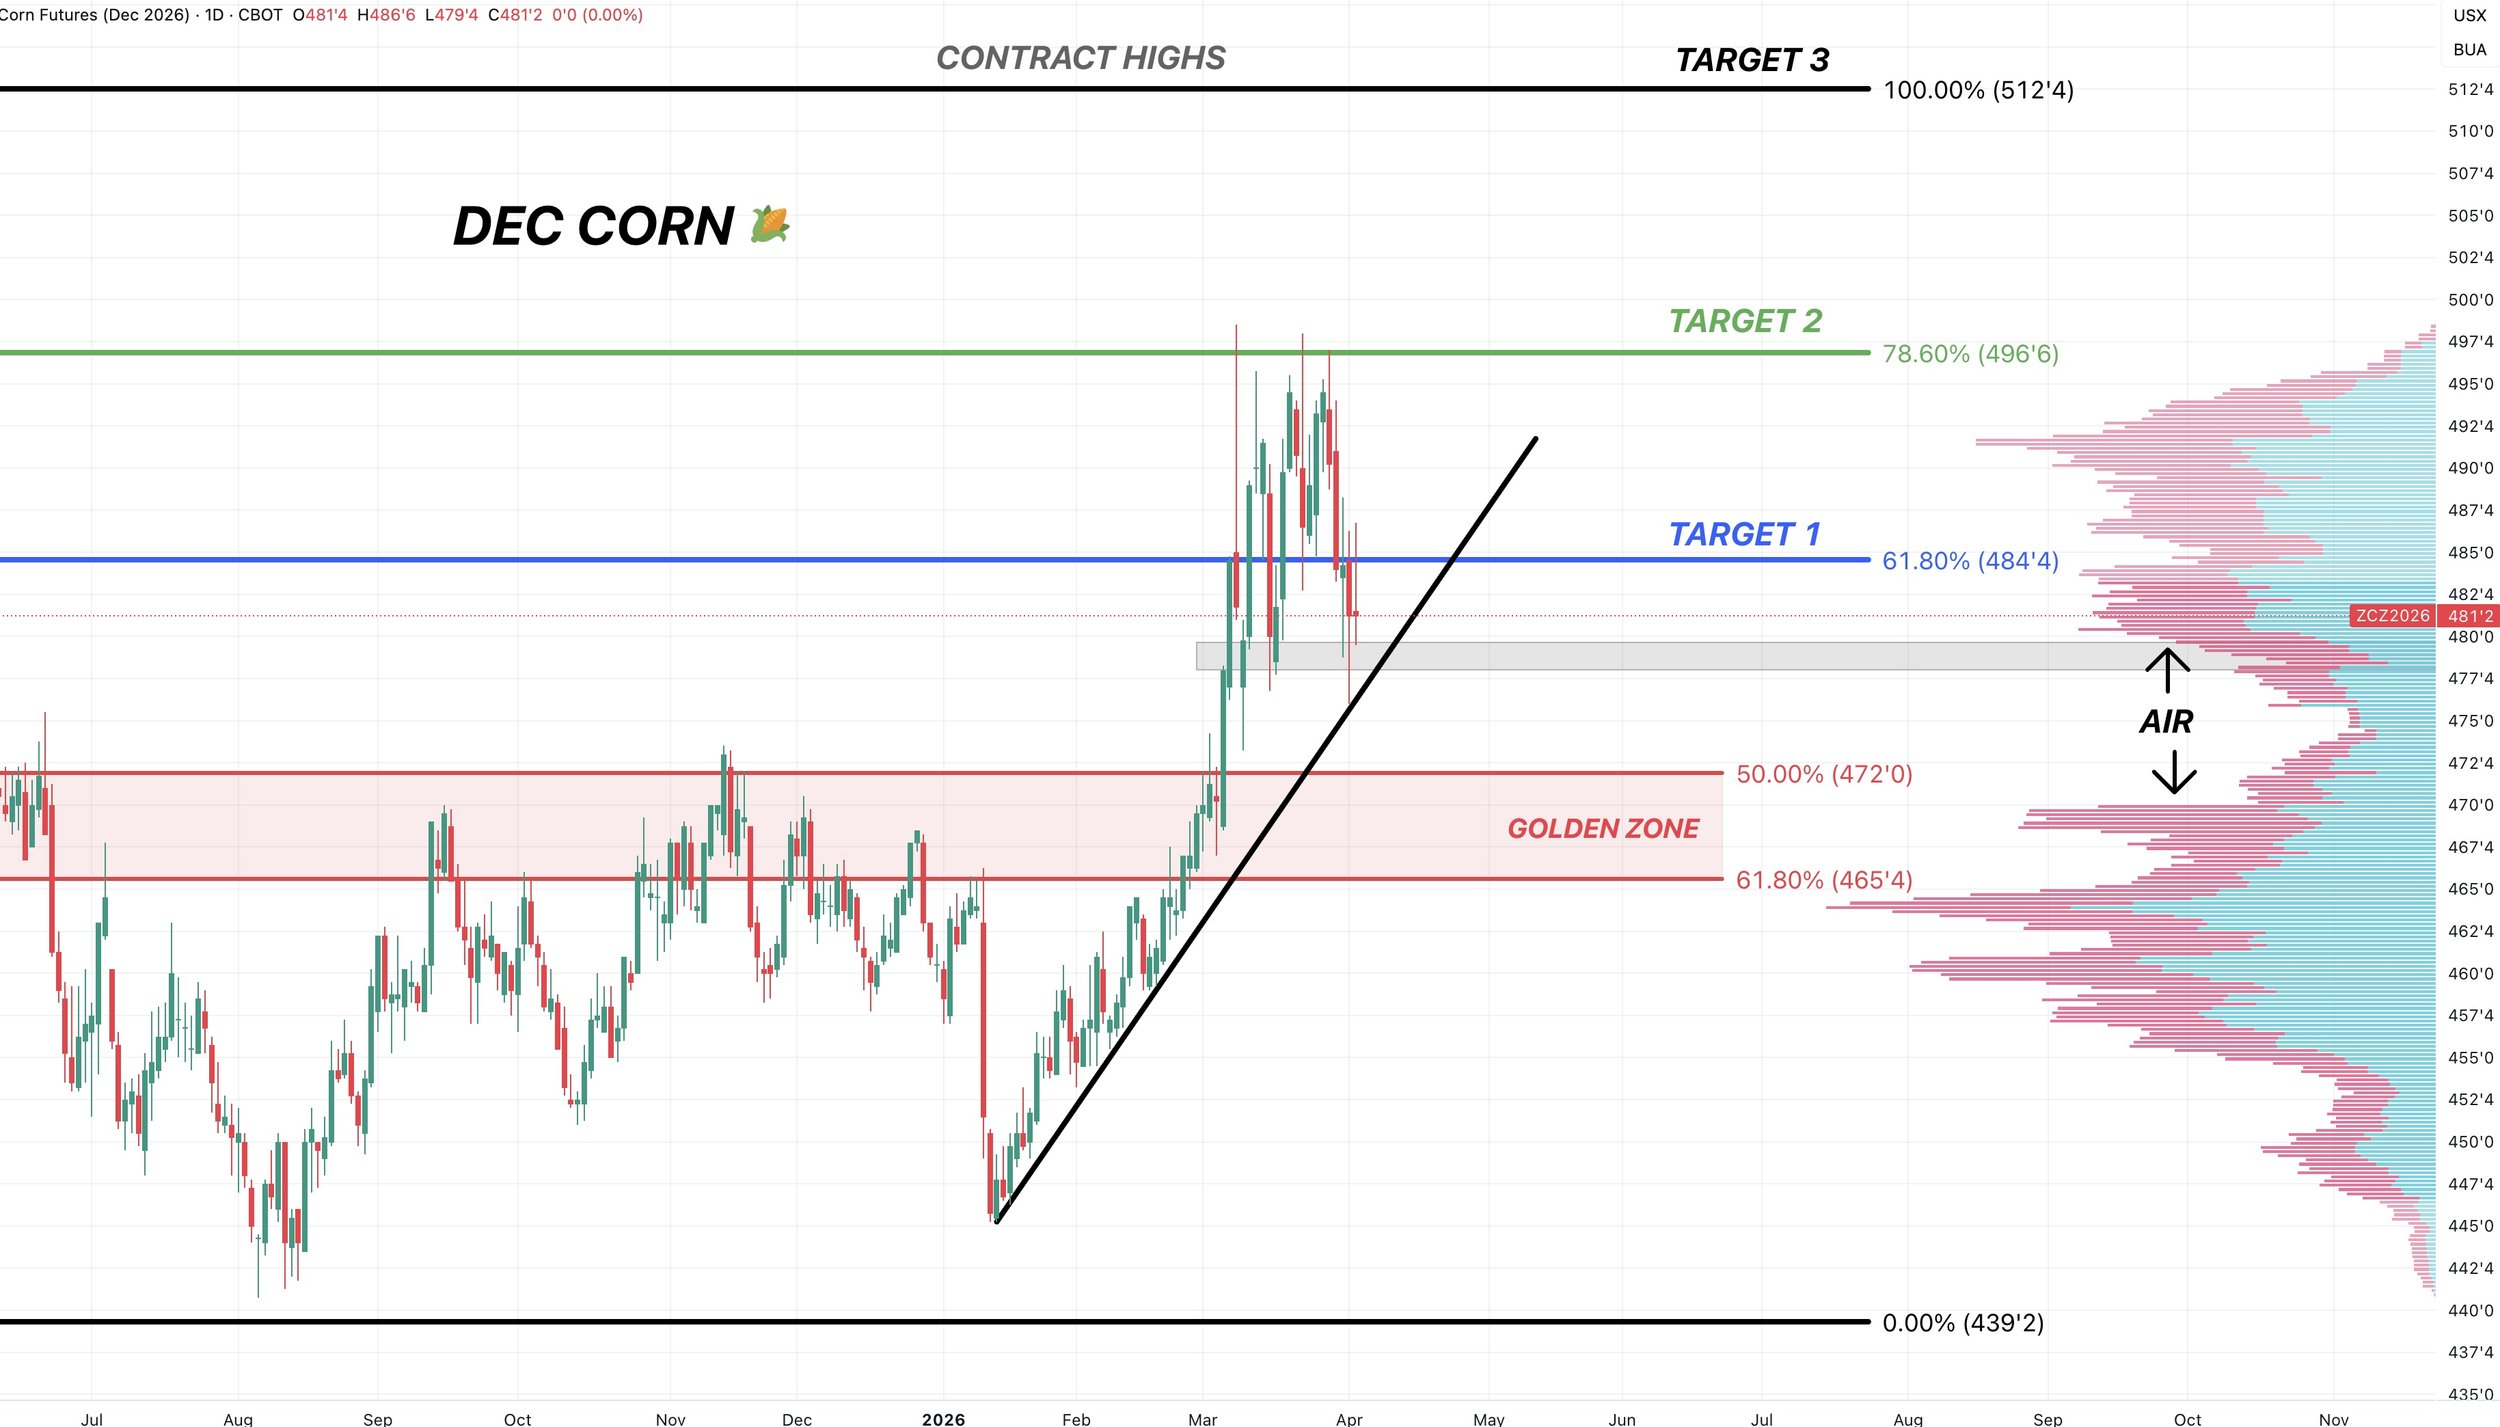
Dec Corn Chart:
Bulls want to see us hold this $4.78 range.
Along with this potential uptrend support we have.
Failure to hold could result in us coming down to the golden zone. Which would re-test those old highs.
We are also sitting at an area of high volume. The next area of high volume below us lines up with that golden zone as well.
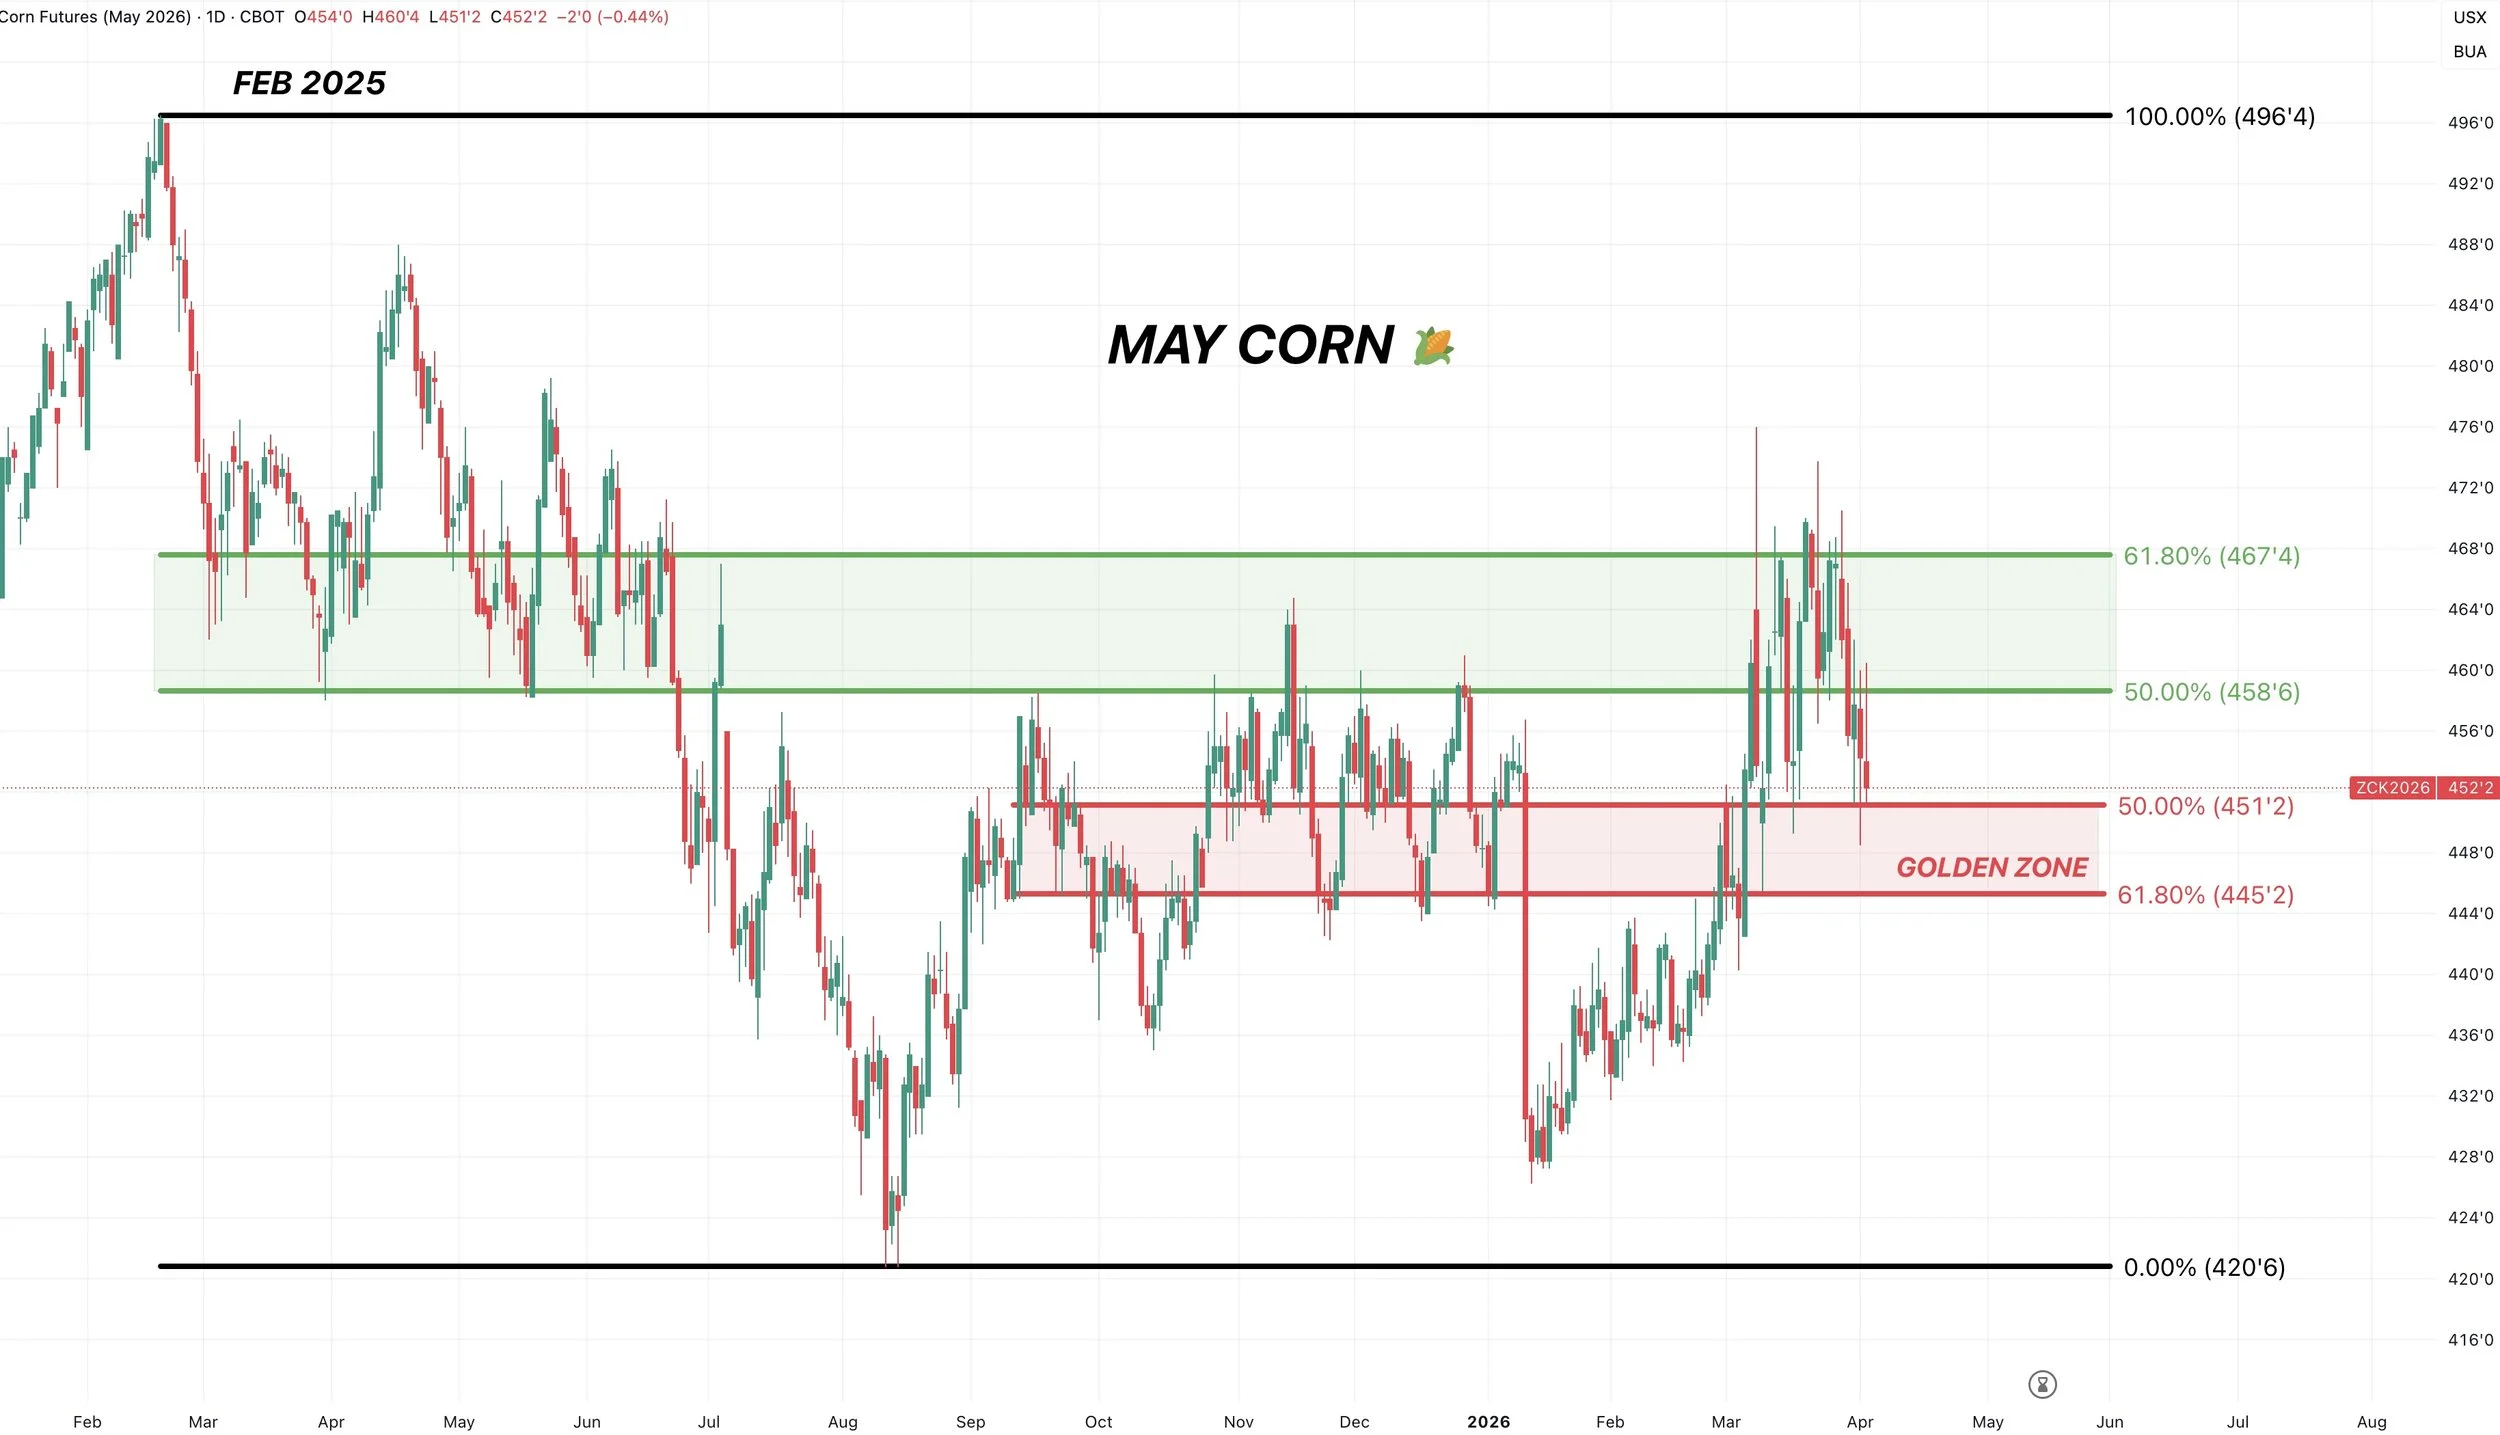
May Corn Chart:
Rejected the golden fib from contract lows up to the Feb 2025 highs.
The trend remains higher as long as we hold the red box.
This red box is where the market makes a decision.
It tells us whether this is simply a normal correction, or if this market is starting to roll over.
This box would be considered a buy area and where we would expect a bounce.
$4.45 is the must hold level. It's 61.8% of the rally. It's also key support from fall.
Losing that level would not be a good sign.
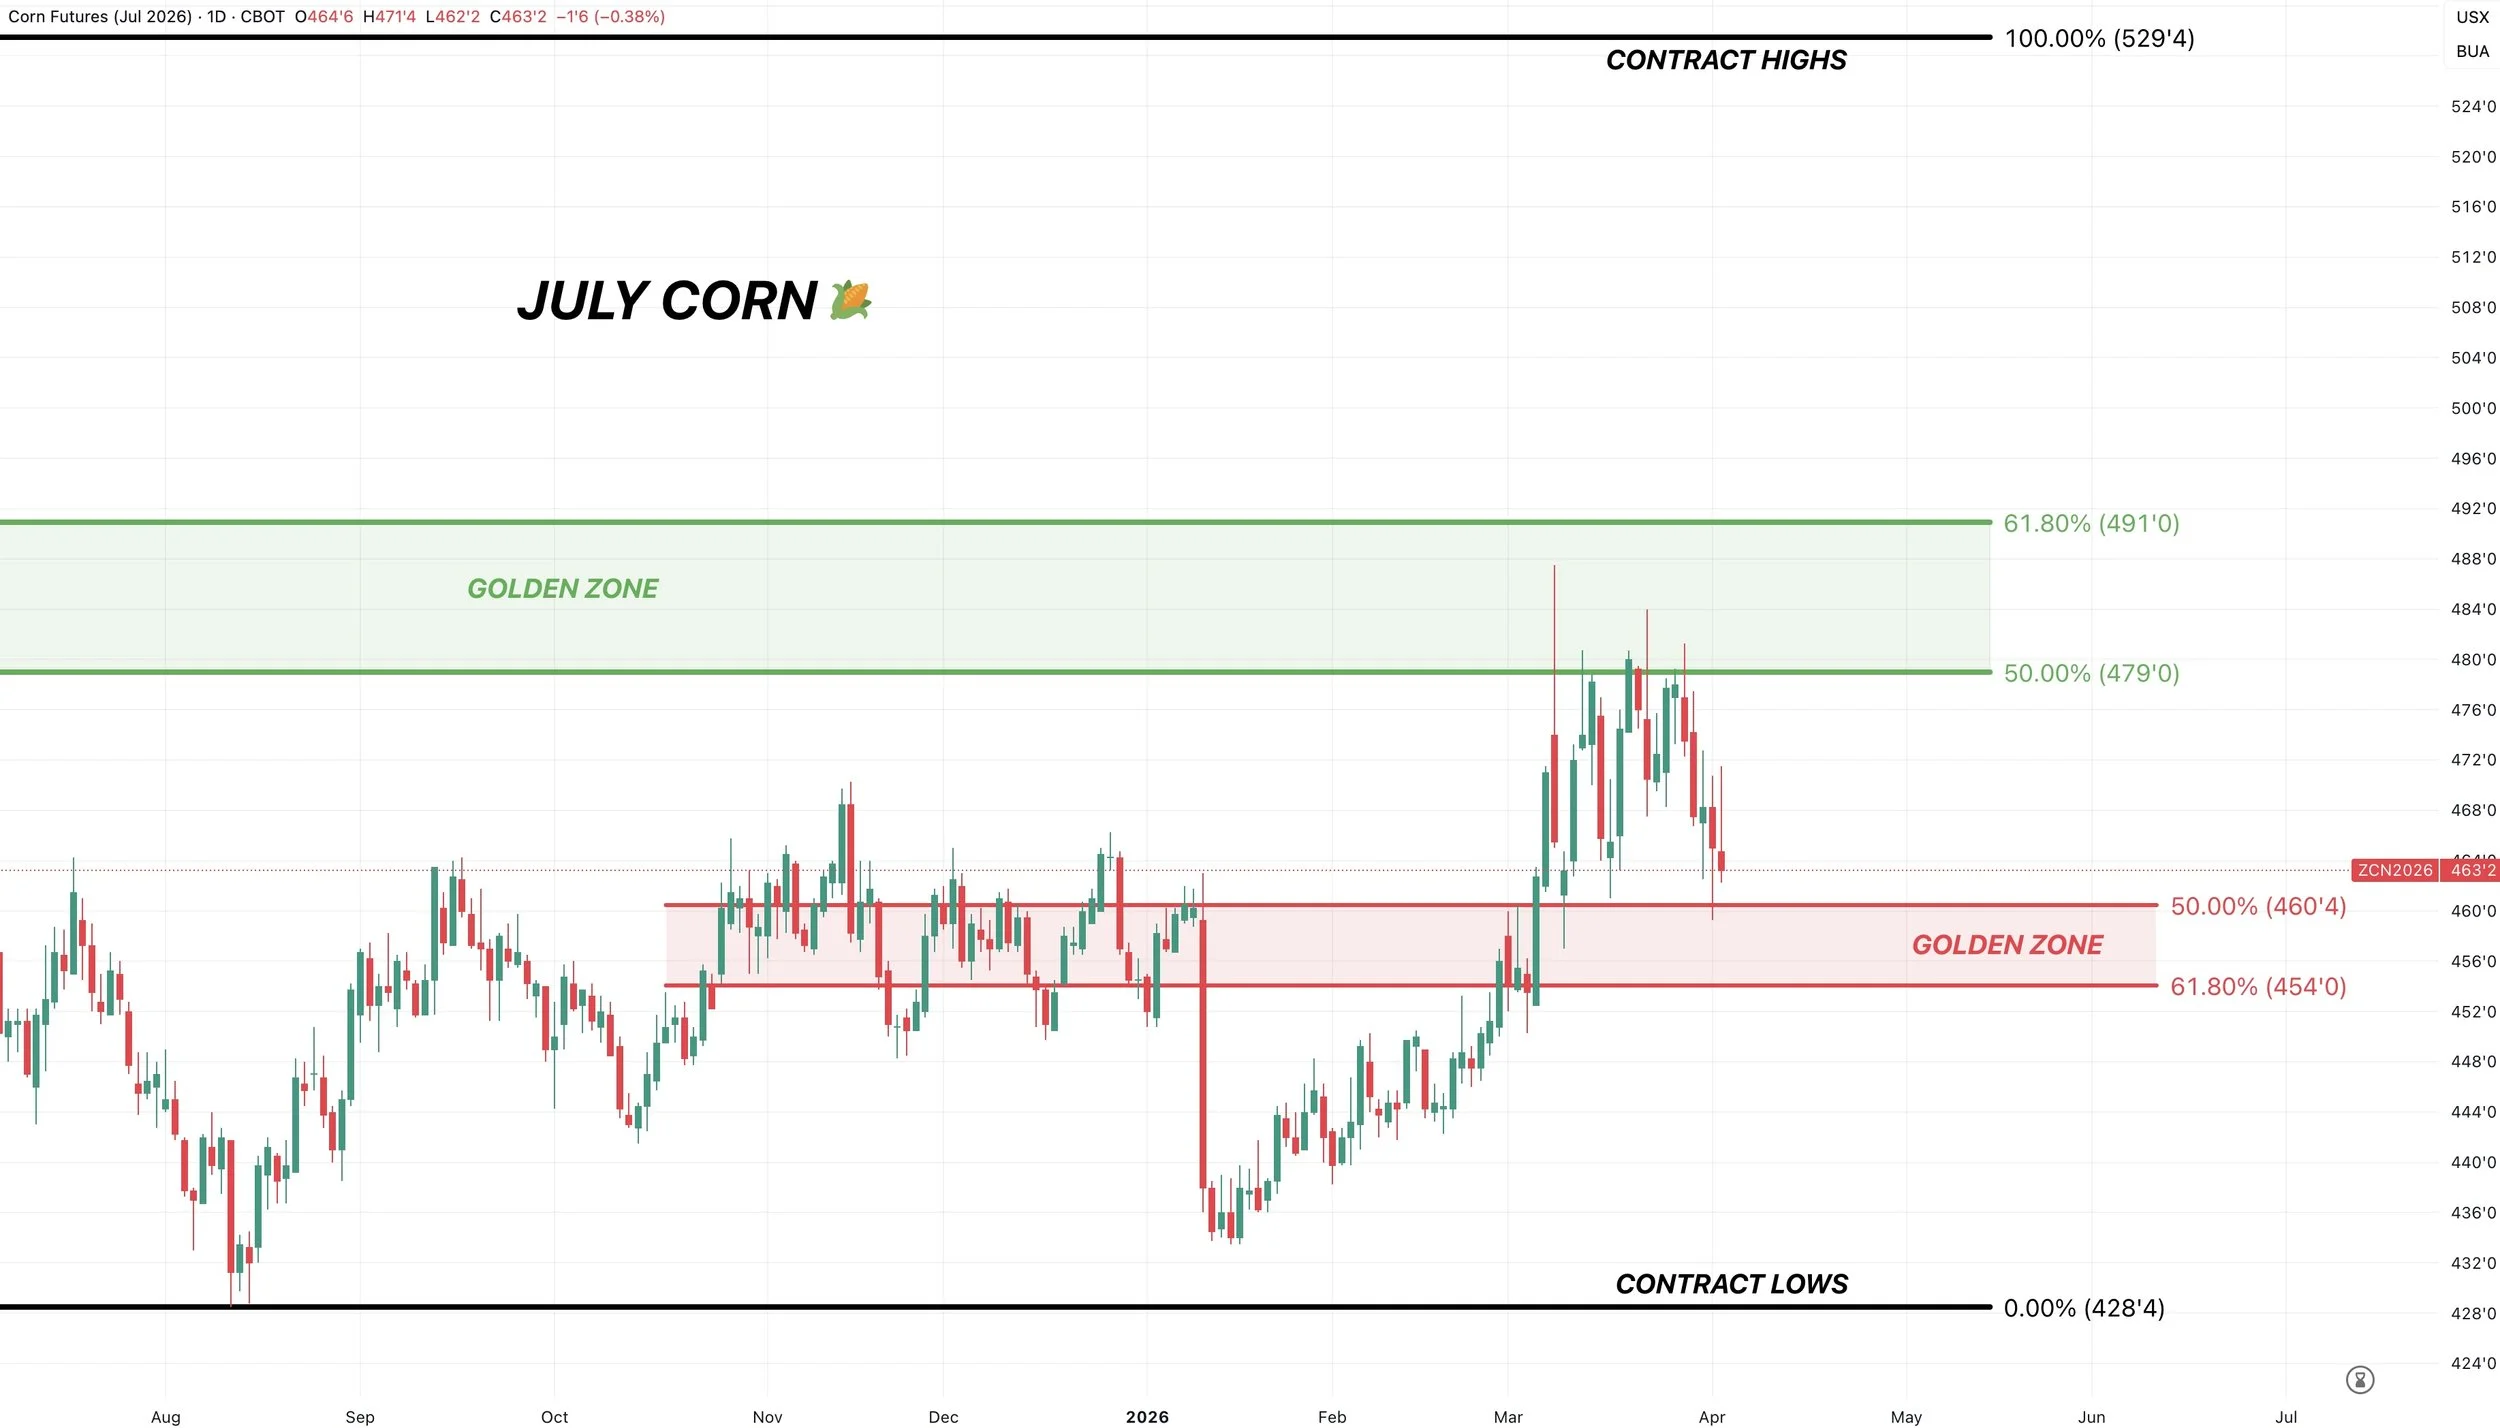
July Corn Chart:
Similar set up to May.
We failed after clawing back 50% of the contract highs.
Now approaching the golden zone to the downside.
This box is where we'd expect us to bounce.
$4.54 is the must hold level.
Soybeans
Soybeans have been completely sideways since that limit down move a few weeks ago.
That China meeting in May is still expected to happen.
We have yet to see China buy any new crop soybeans.
Normally, they would've already bought some by now.
They promised they are still going to be that buying 25 MMT of new crop.
The concern has to be old crop. If they don’t end up buying any old crop, you would argue that the USDA's old crop export number is going to need to come down.
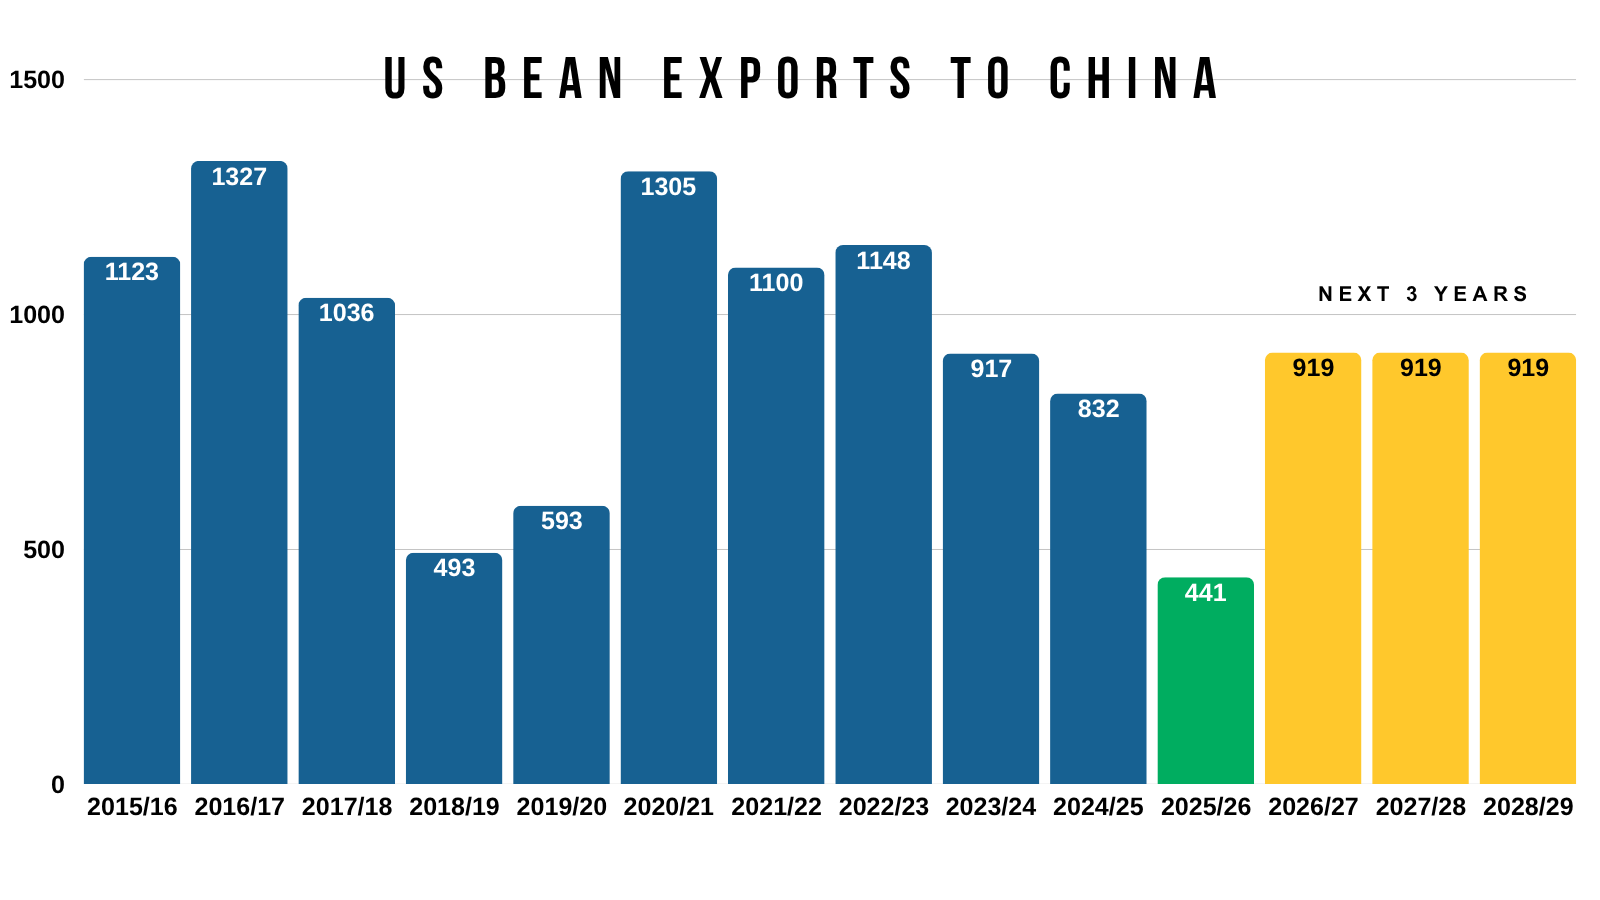
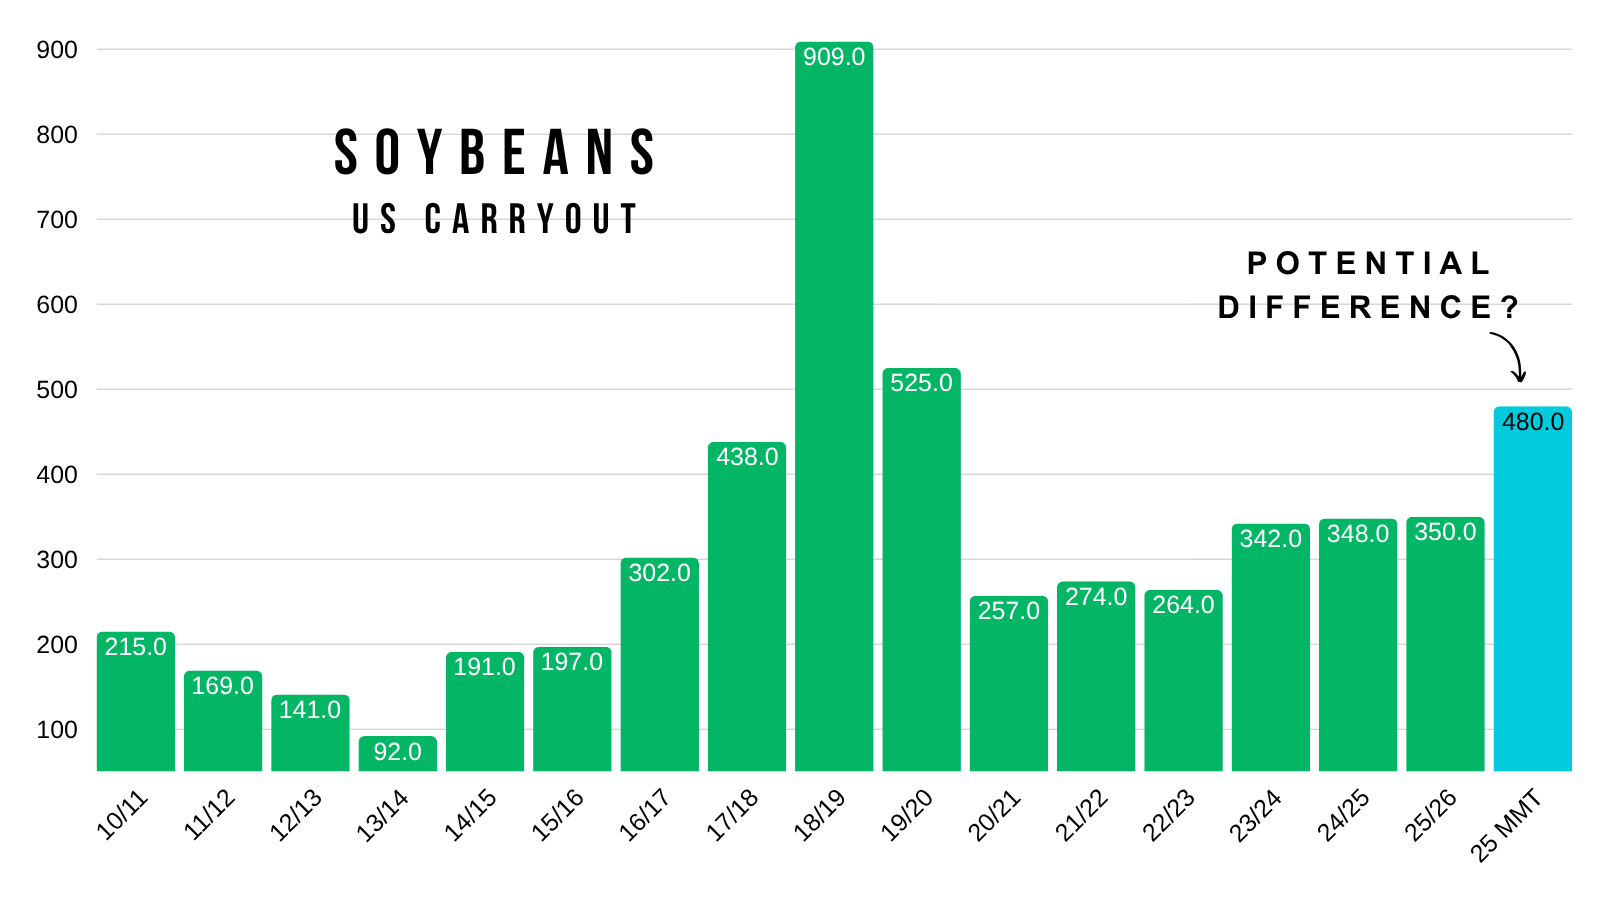
If China does wind up living up to their promise to buy 25 MMT of new crop beans, that's around 450 million bushels of extra demand that old crop didn’t have from China.
Old Crop Bought: 12 MMT (440 million bu)
New Crop Promise: 25 MMT (920 million bu)
Difference: 13 MMT (480 million bu)
That would be more than the entire US carryout.
It's not quiet that simple, as I'm sure we'd kill plenty of demand to non-China destinations etc.
If China buys, the world isn’t losing any soybeans either. They are simply changing hands. So it doesn’t change the world balance sheet.
And that 25 MMT of soybeans would only be roughly in line with what they bought in 2023 and 2024.
But the potential story might be in new crop if China opts to not buy anymore old crop. The market and everyone currently believes they won’t be.
Hence why price action in new crop has acted far better.
The market thought they buying old crop, so the market removed that premium.
China is still going to be one of the biggest factor in deciding if soybeans have further upside or not, aside from a growing season problem of course.
Brazil's got a record crop, but the market knows that and it's old news.
We do also have the fact that we are going to be planting plenty of more acres this year compared to last year. Which is a bearish item.
I mean the world situation in soybeans doesn’t scream we have to go tremendously higher either.
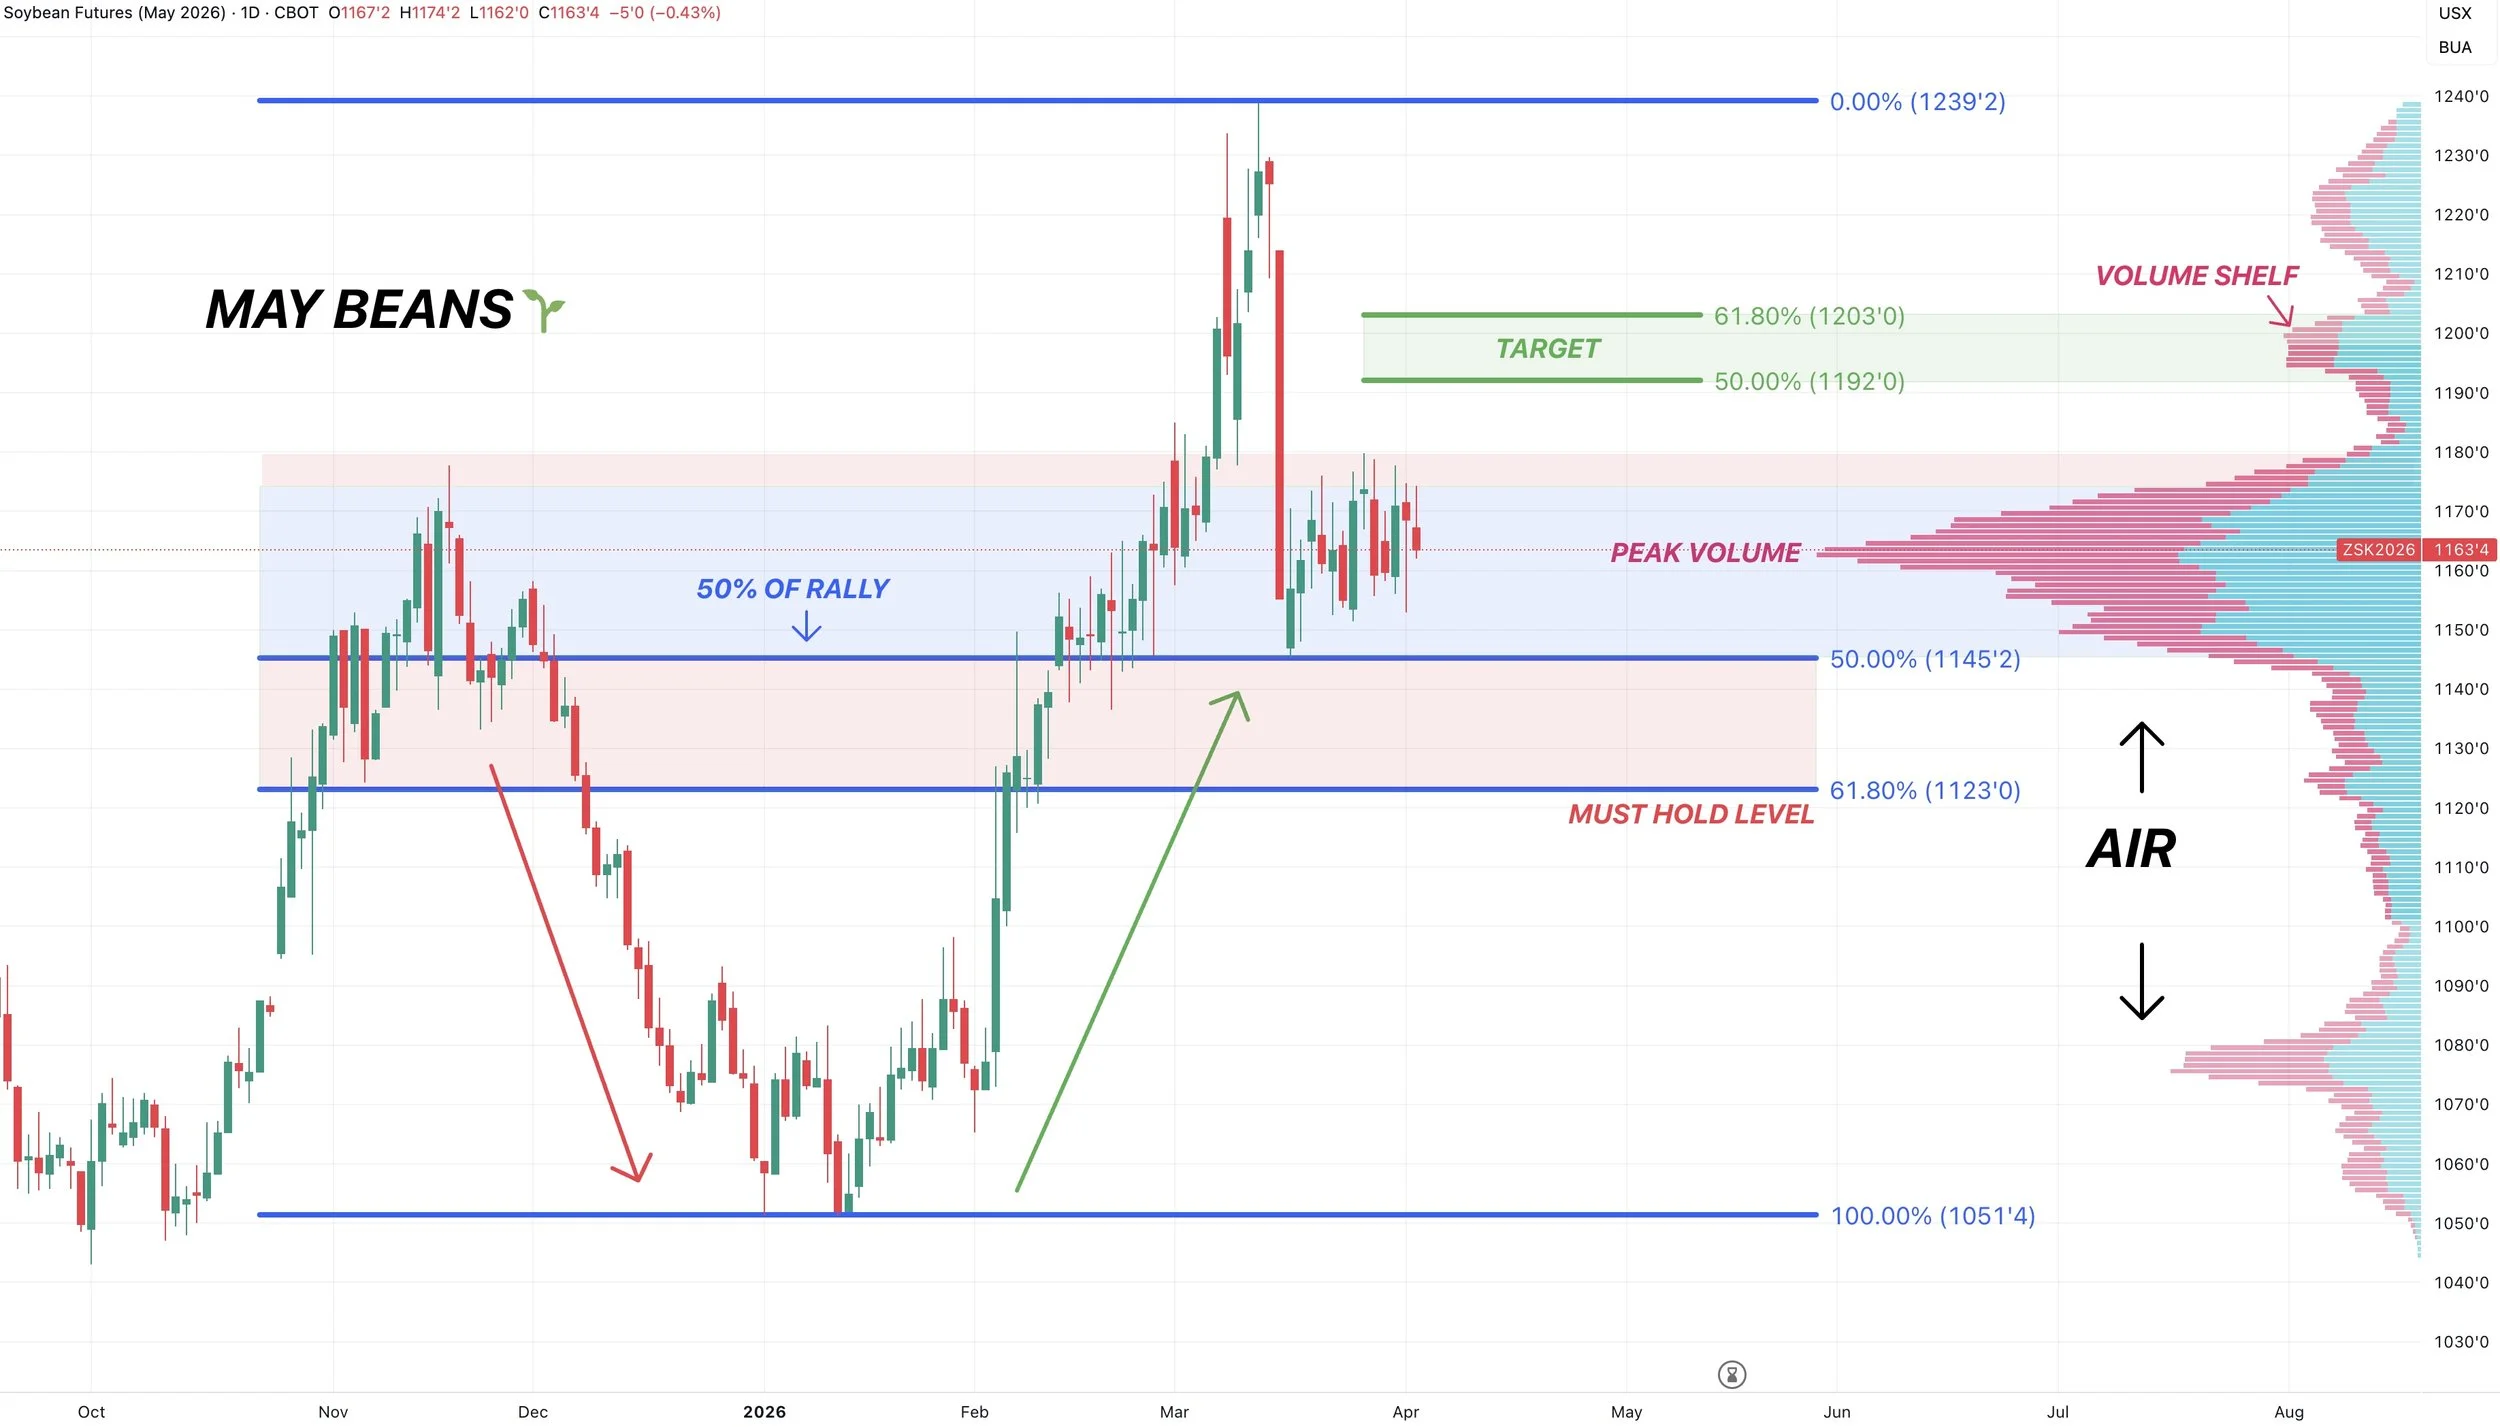
May Beans Chart:
Really just going to let the charts tell us where we are going from here.
We've been trapped in a 20 to 30 cent range for two weeks.
Whichever direction we break out of will of course tell us what comes next.
If we break above this recent range, we could look for a move towards $11.90 to $12.00 otherwise known as the golden retracement zone.
To the downside, we are still holding this area of peak volume after giving back 50% of the rally.
It still makes sense to carve out a bottom here, but if we fail to hold $11.45 it will probably cause at least a drop down to $11.23. As there is virtually zero support beneath here.
If we failed to hold $11.23 that would be a bad sign, and potentially open the door a lot lower.
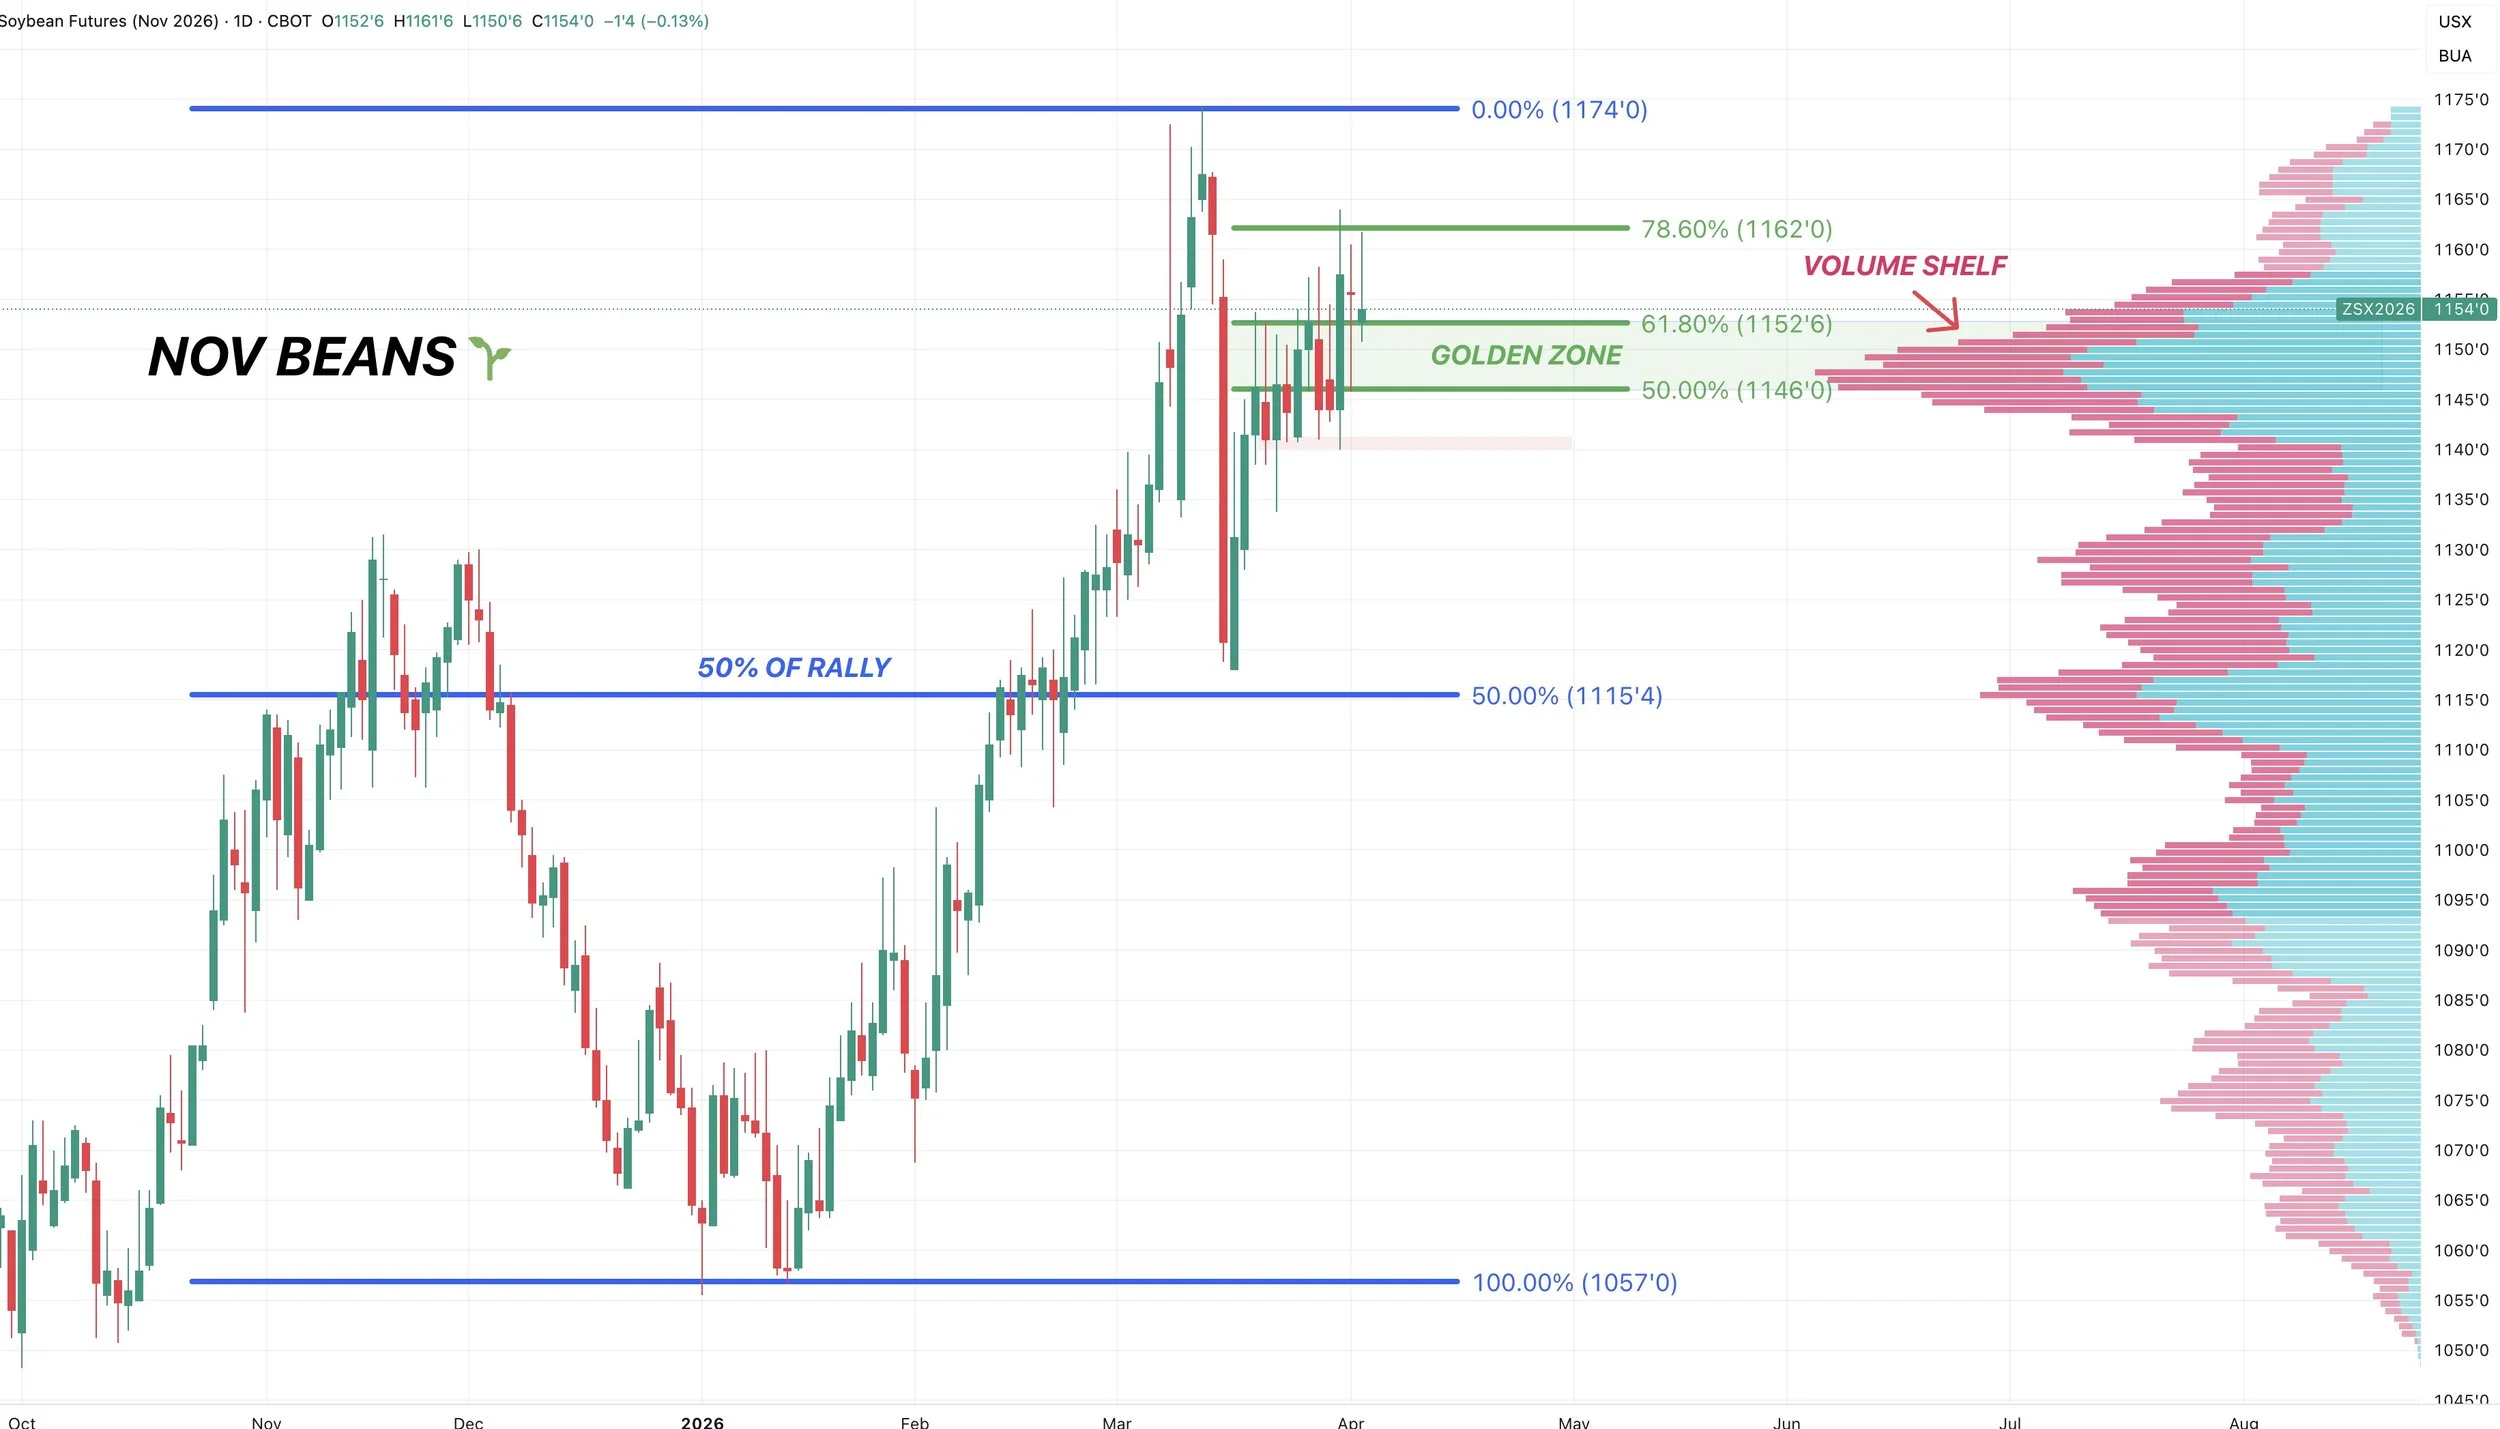
Nov Beans Chart:
New crop has out performed old crop by a mile.
New crop is right near contract highs.
Still hovering right around this golden zone, so far rejecting off the 78.6% retracement.
We already rewarded this market at this level, as markets can tend to struggle in this golden zone area.
Now waiting to see if we can go and post new highs or fail here.
Wheat
Drought Concerns:
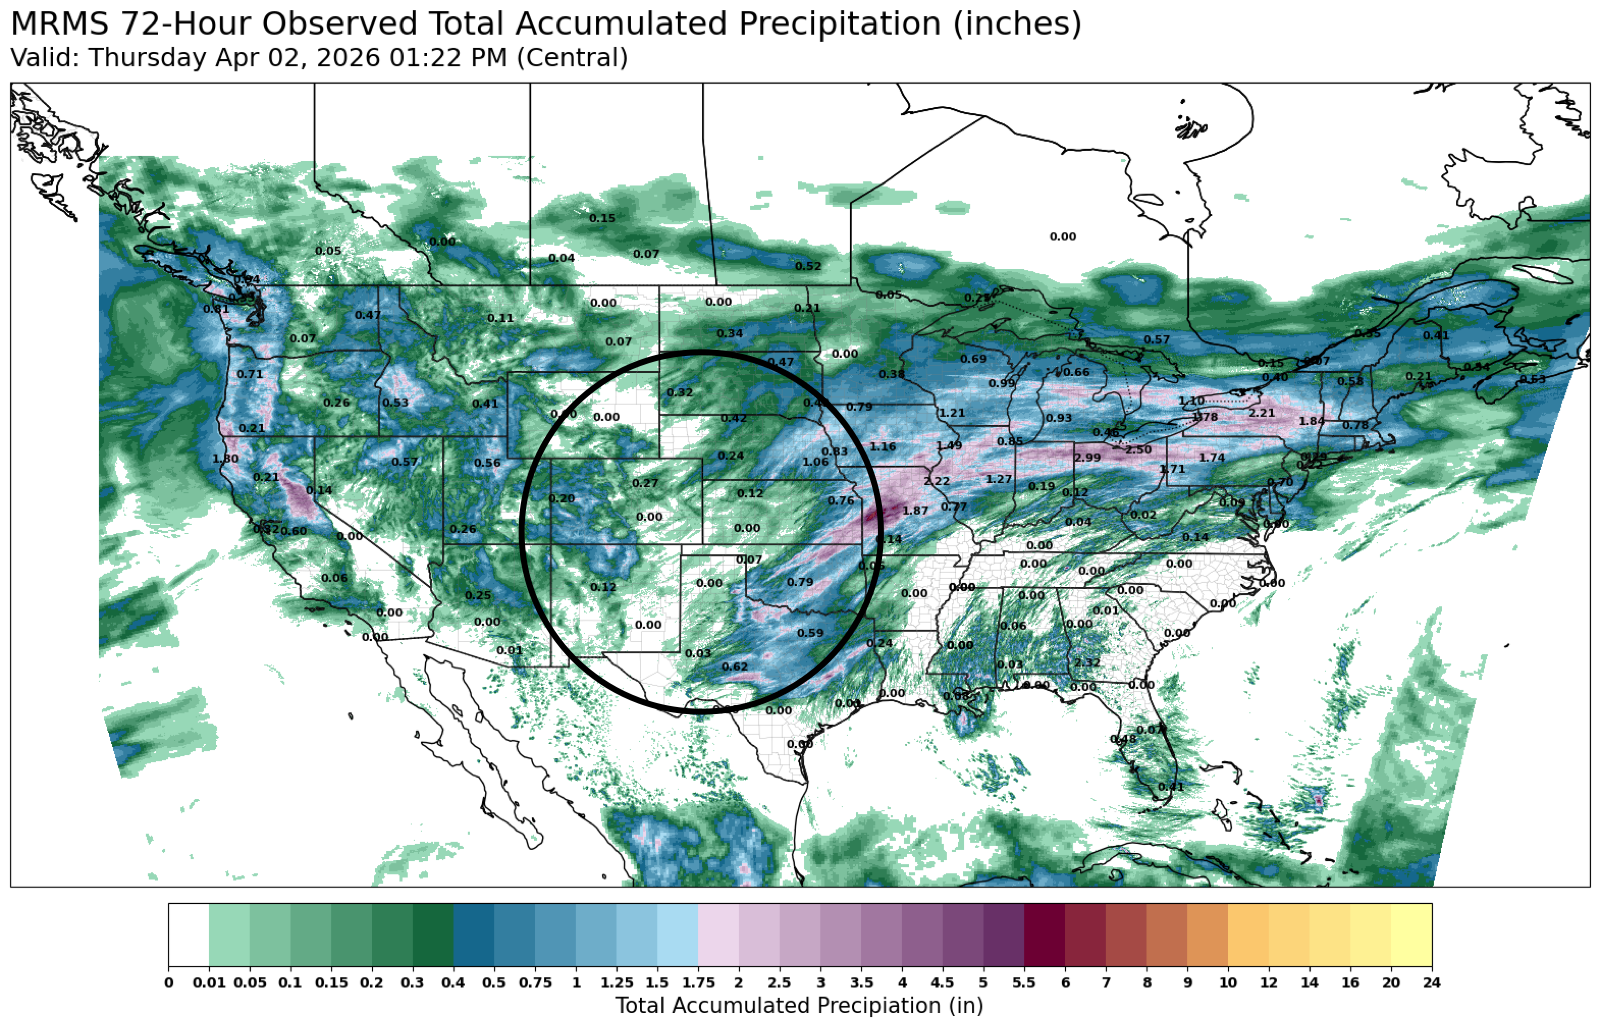
The wheat market is still dealing with a weather story.
It seems like some of the weakness yesterday was due to some rains along with the forecasts.
Here is the last 3 days of precip.
The area that missed out?
Pretty key winter wheat growing region.
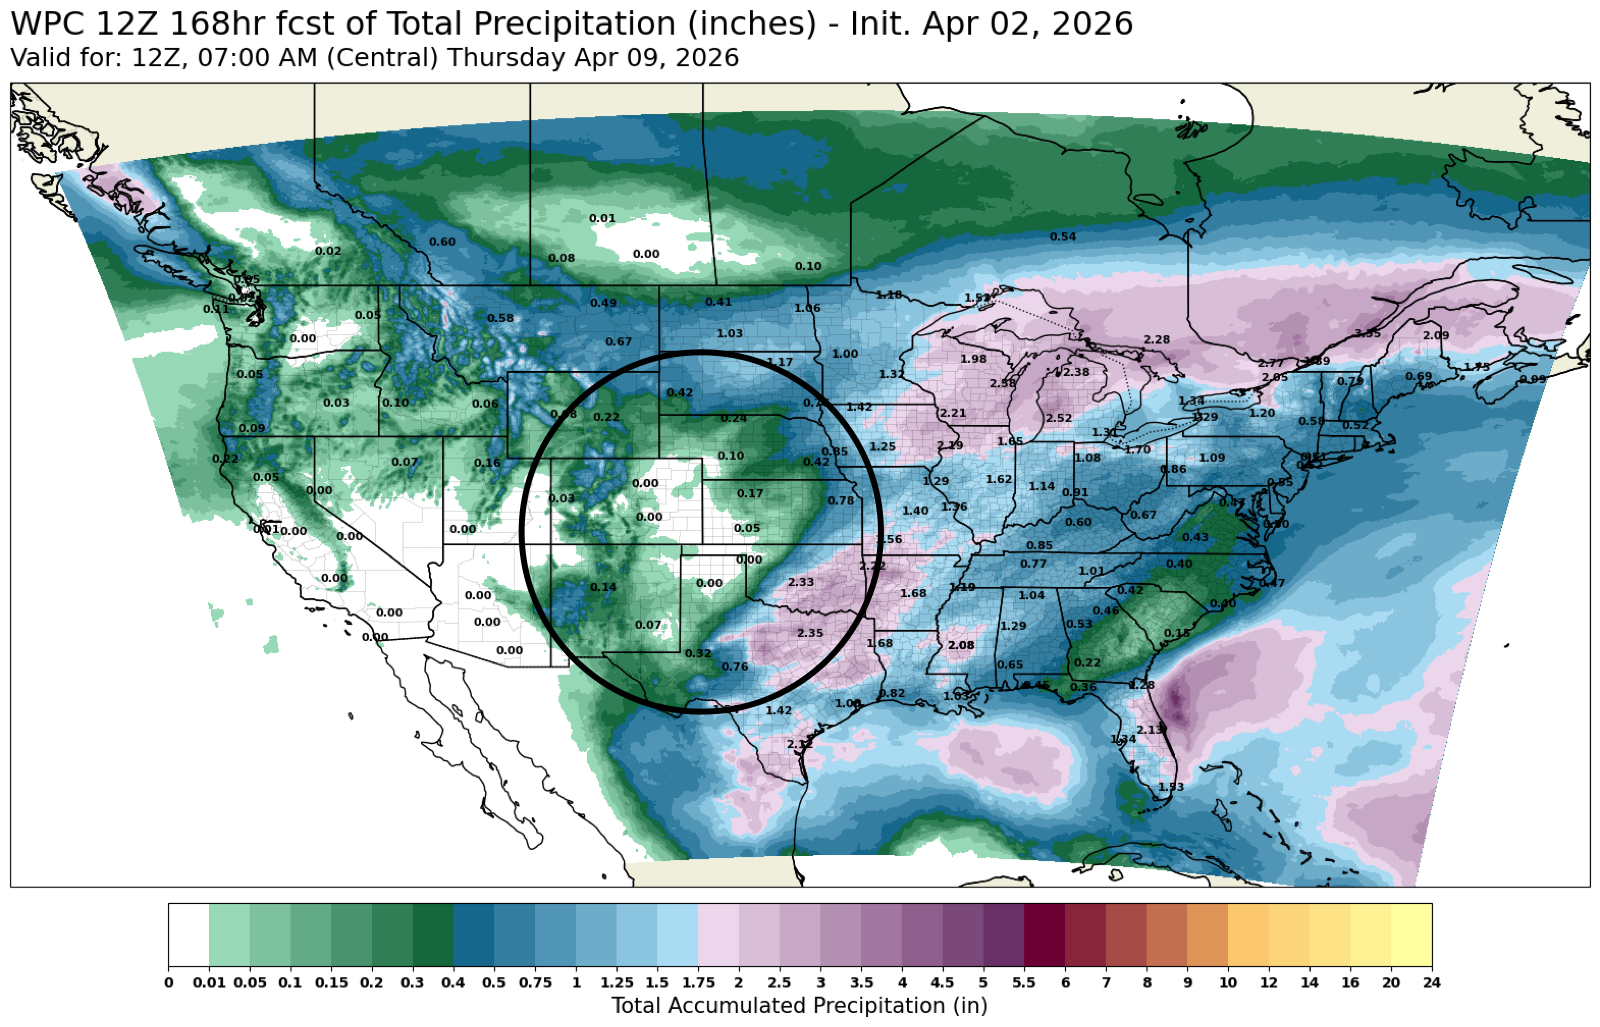
Here is the forecast for the next 7 days.
Rains expected across the corn belt.
Areas expected to miss out?
Once again some key winter wheat regions.
Maybe the algos just saw some rain in the forecasts so they decided to hit the sell button.
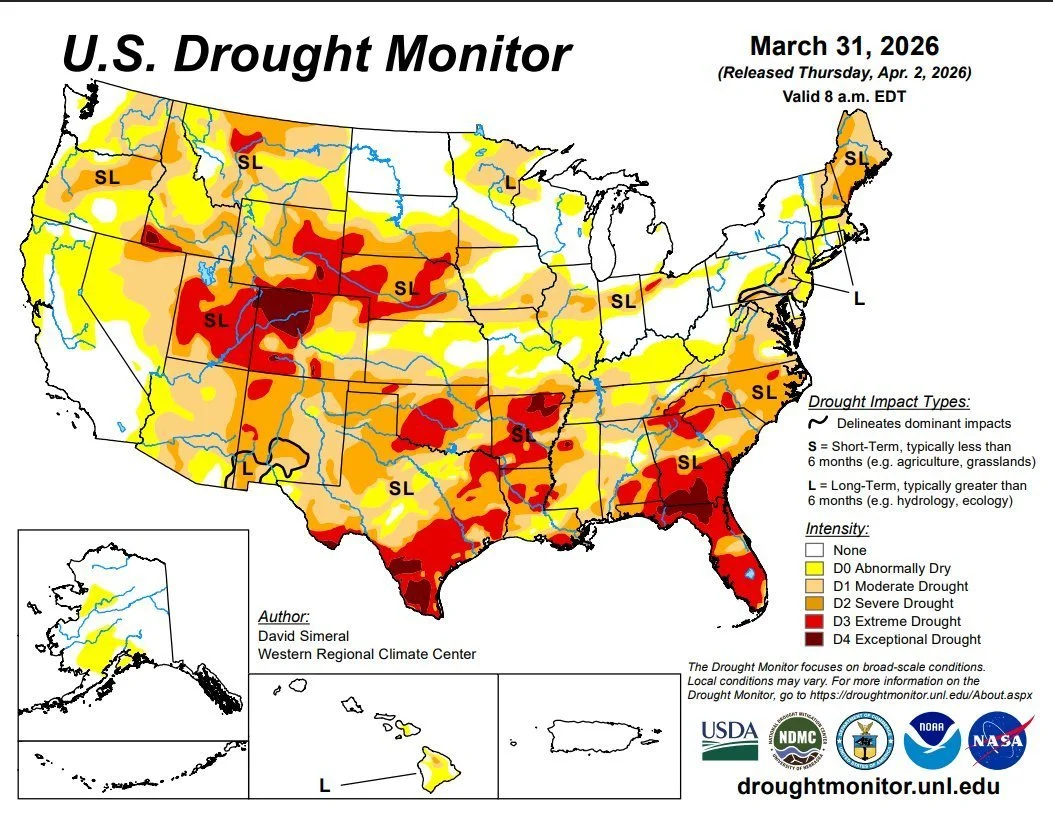
Here the current drought monitor.
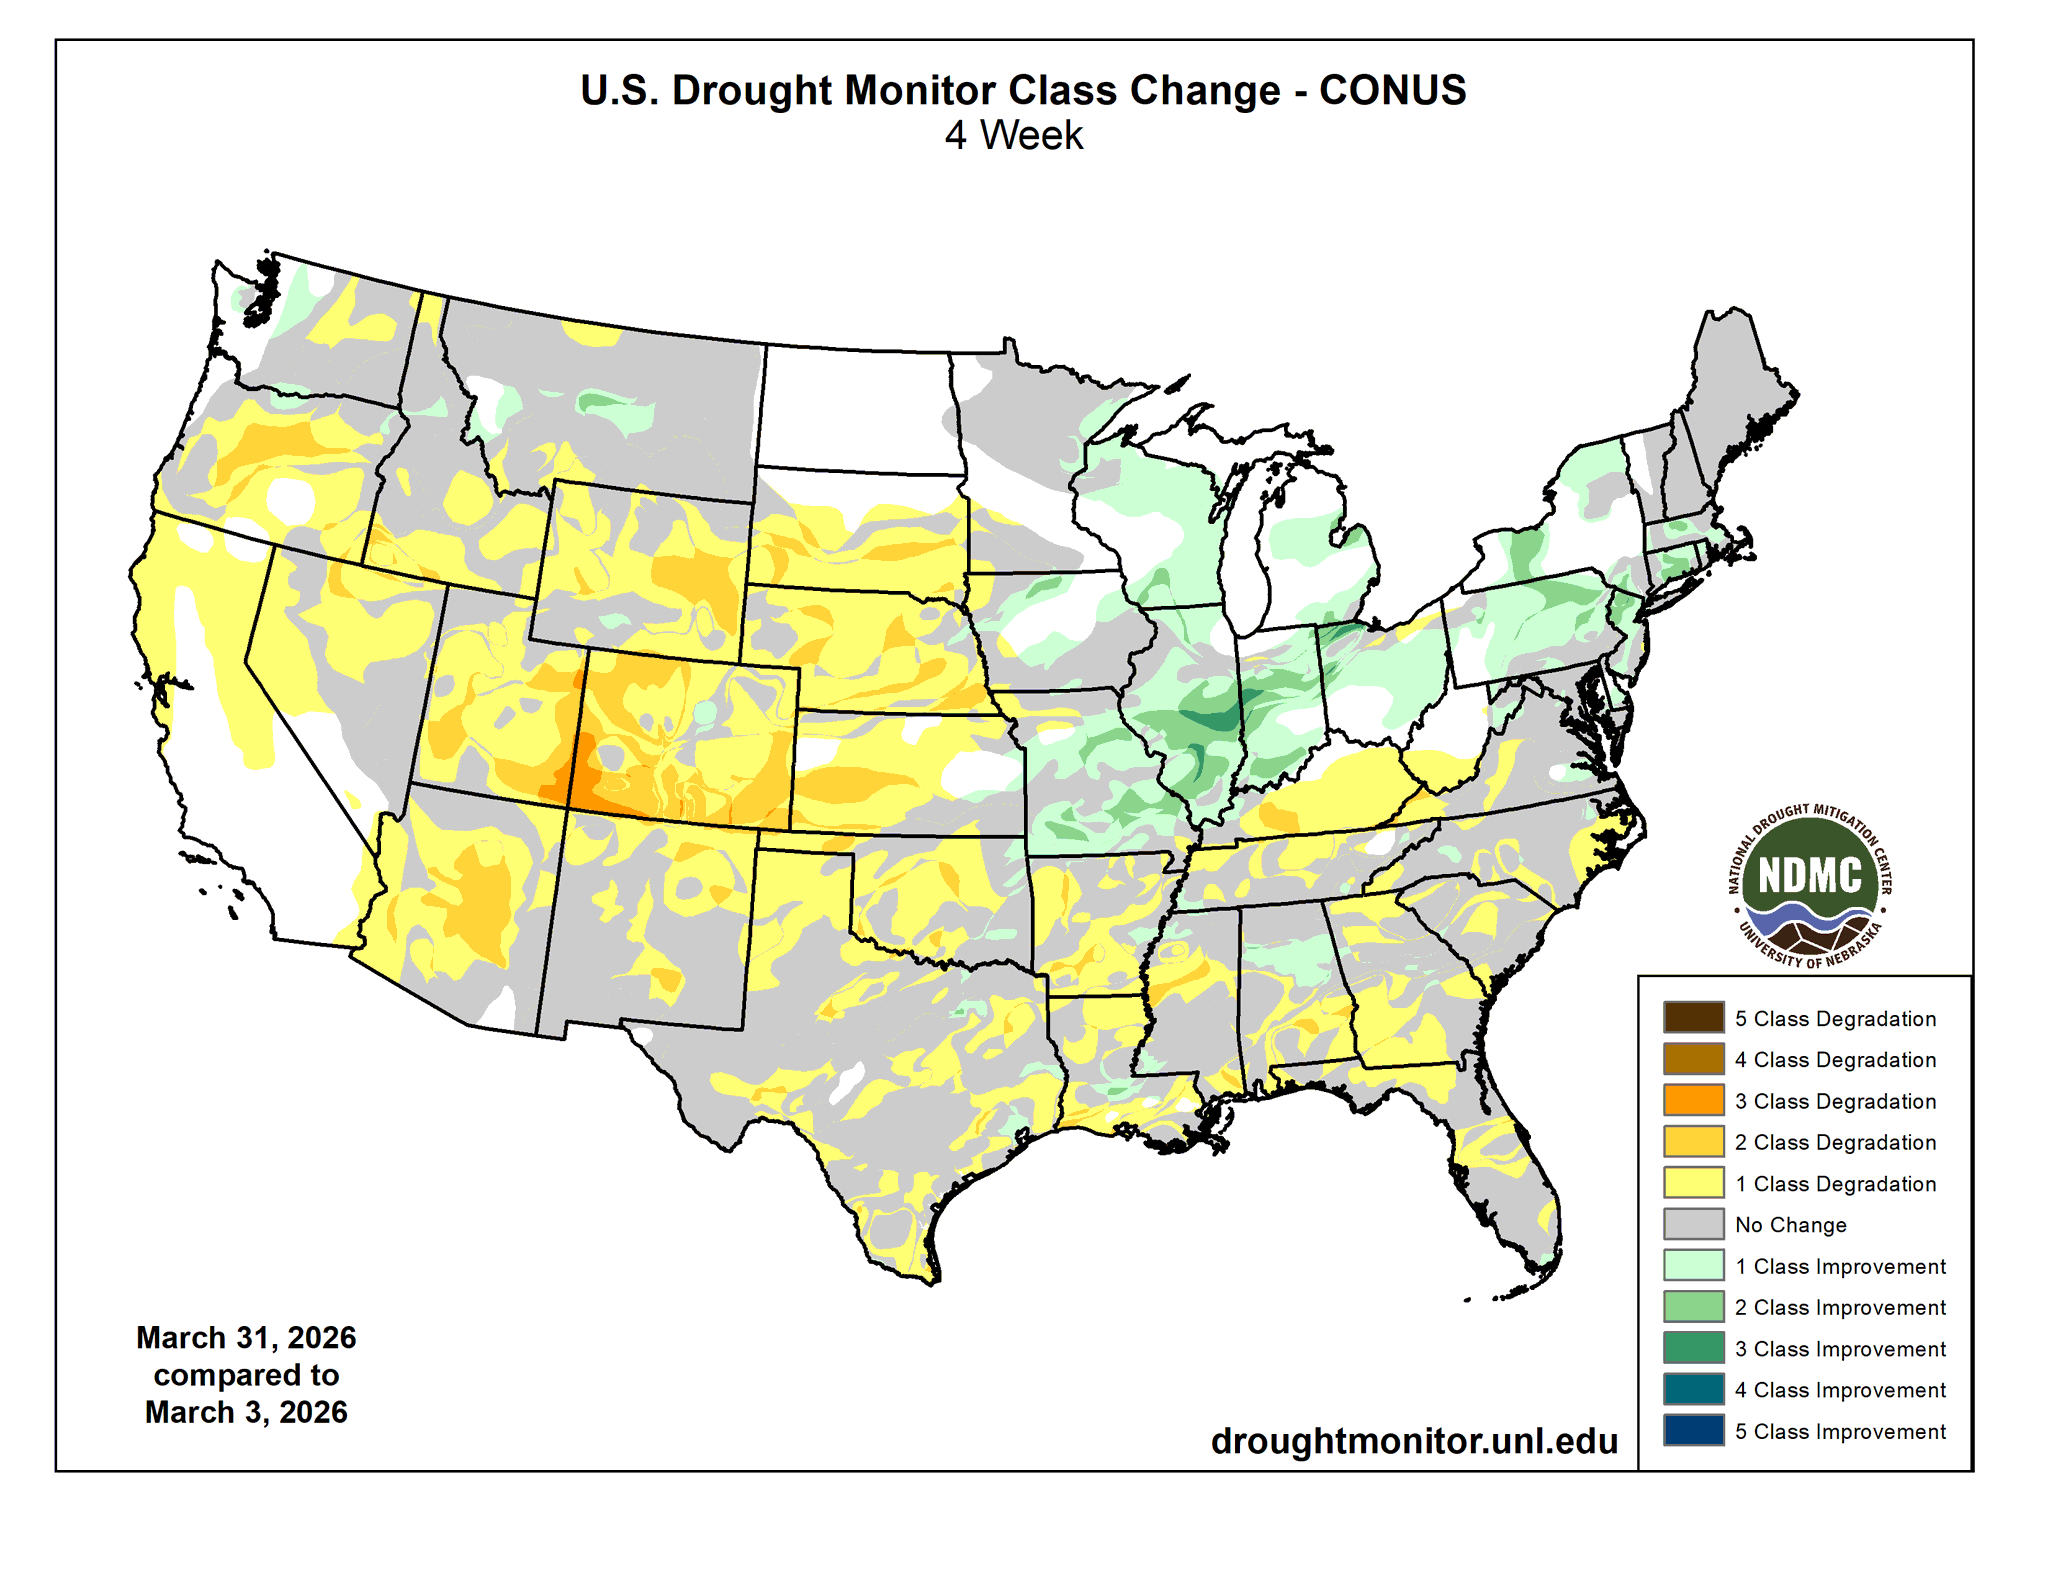
Here is how it's changed the last month.
Some clear drought is starting to develop in the plains and in the western half of the states.
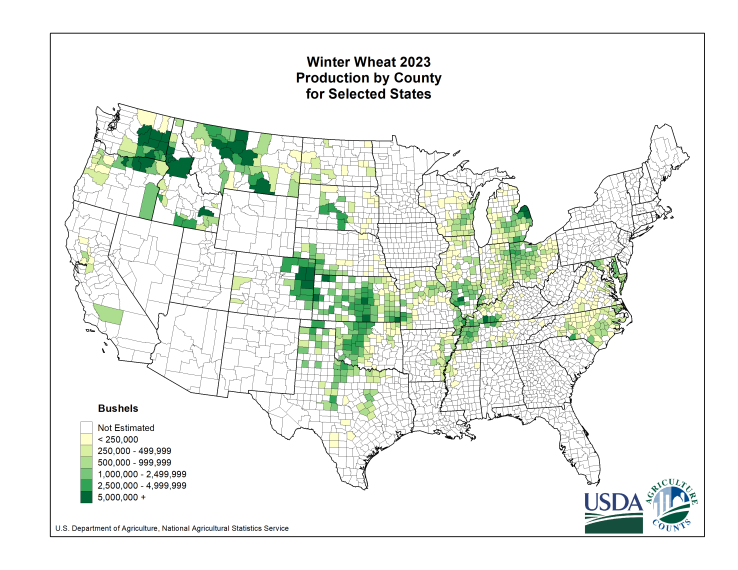
Here is a map of winter wheat production by county for reference.
Again, that is a pretty key growing region.
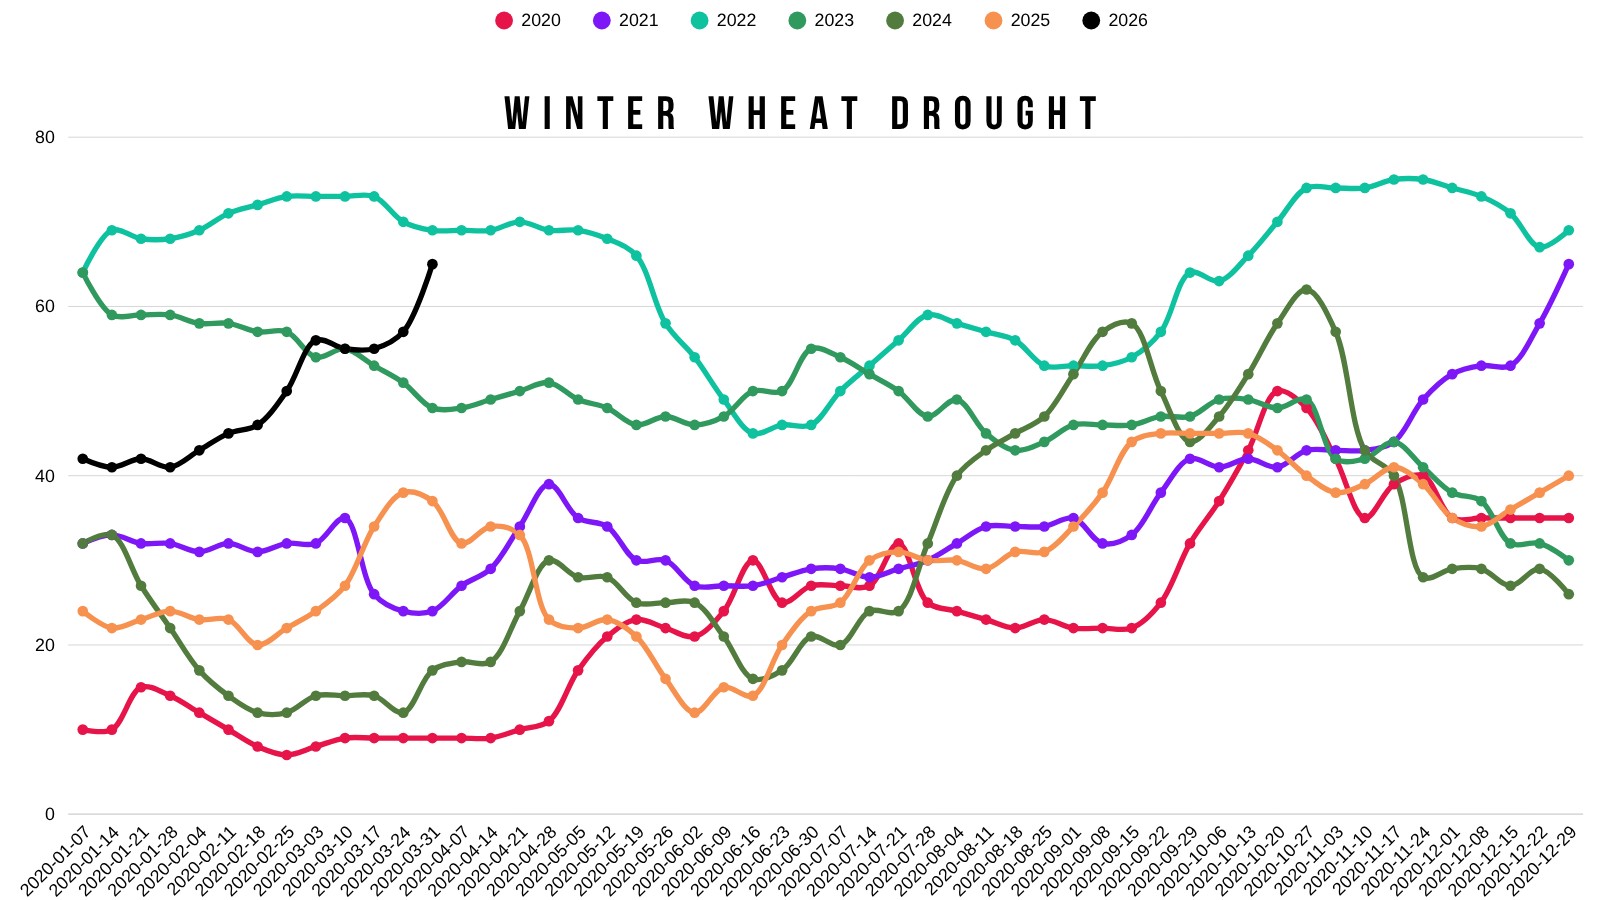
Areas in Drought:
Winter wheat areas in drought have shot up over the last few months.
Jumping to 65%.
This would be the highest since 2022.
Crop Ratings:
Let's take a look at a few states. Specifically those in that area that has been missing rain.
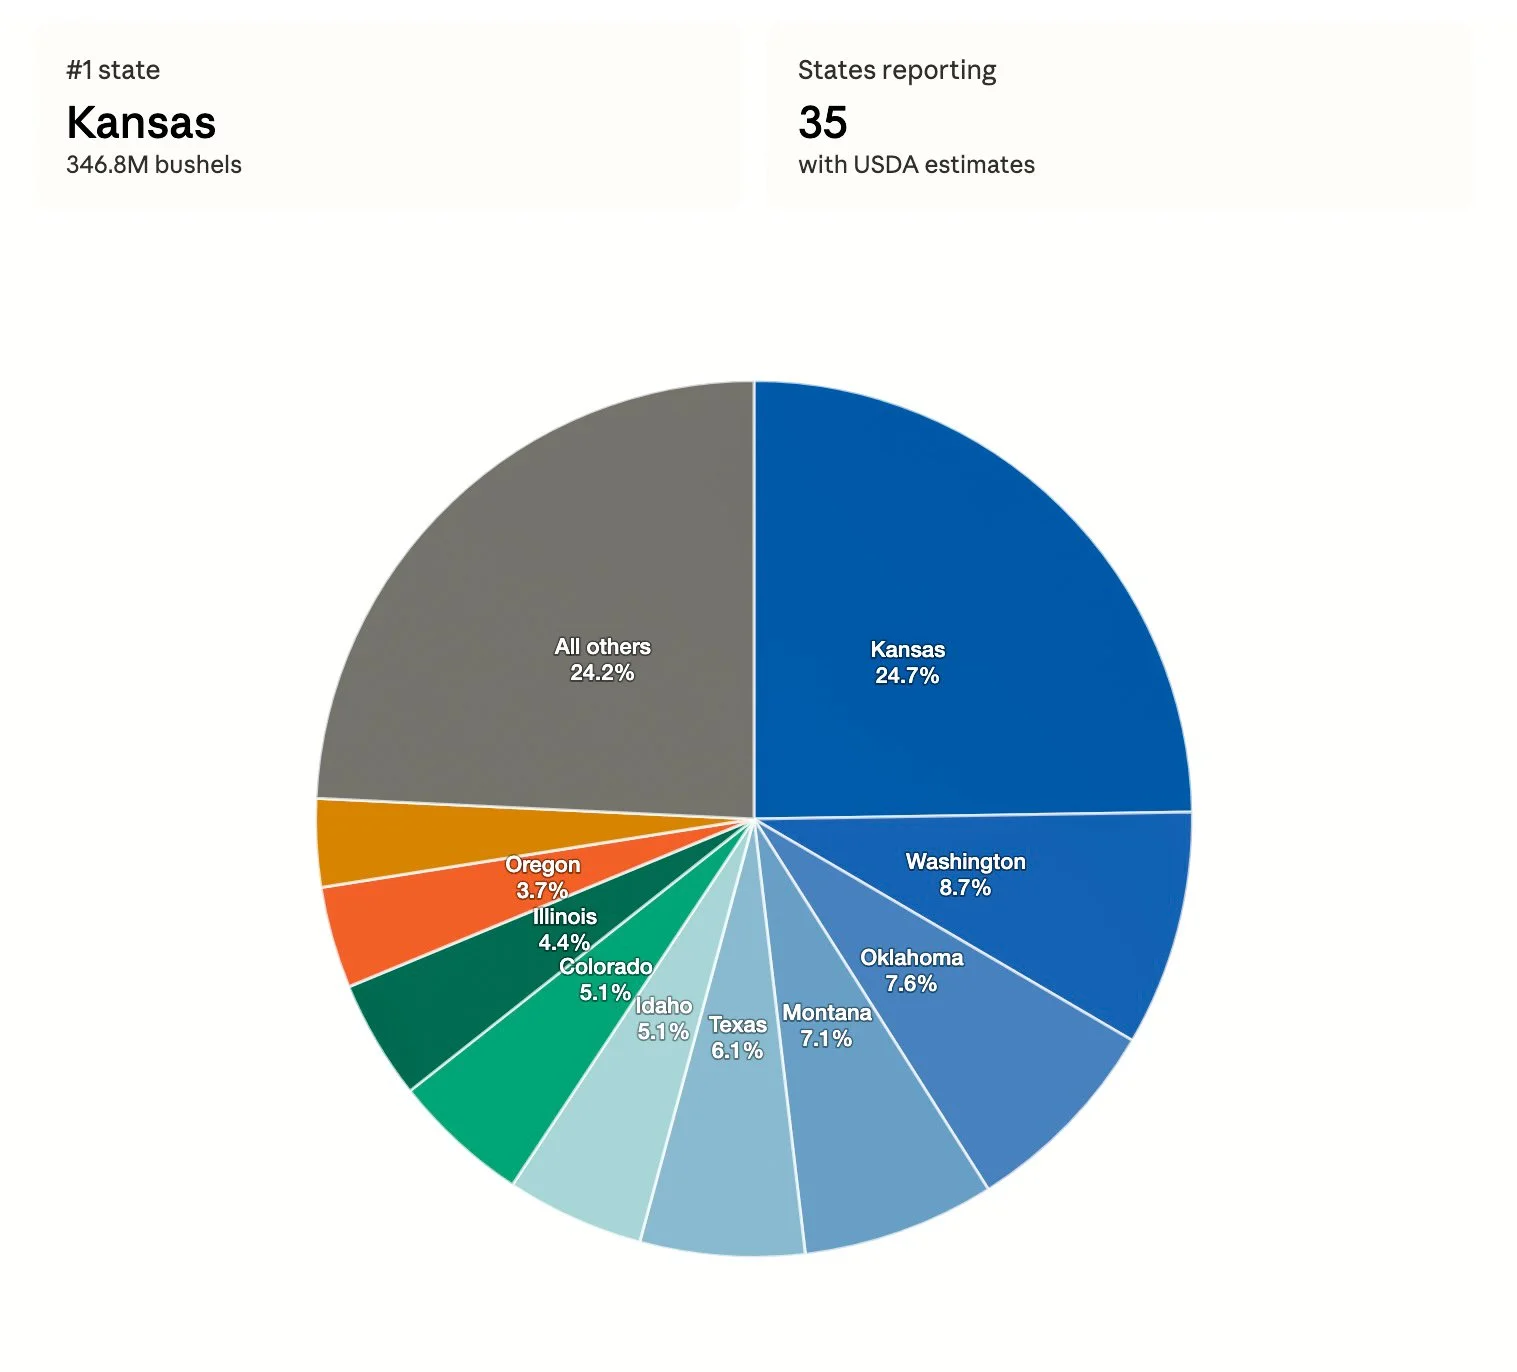
Here is winter wheat production broken down by states.
Kansas alone accounts for 1/4 of all winter wheat production.
Kansas, Oklahoma, and Texas combine for roughly 40% of all winter wheat production.
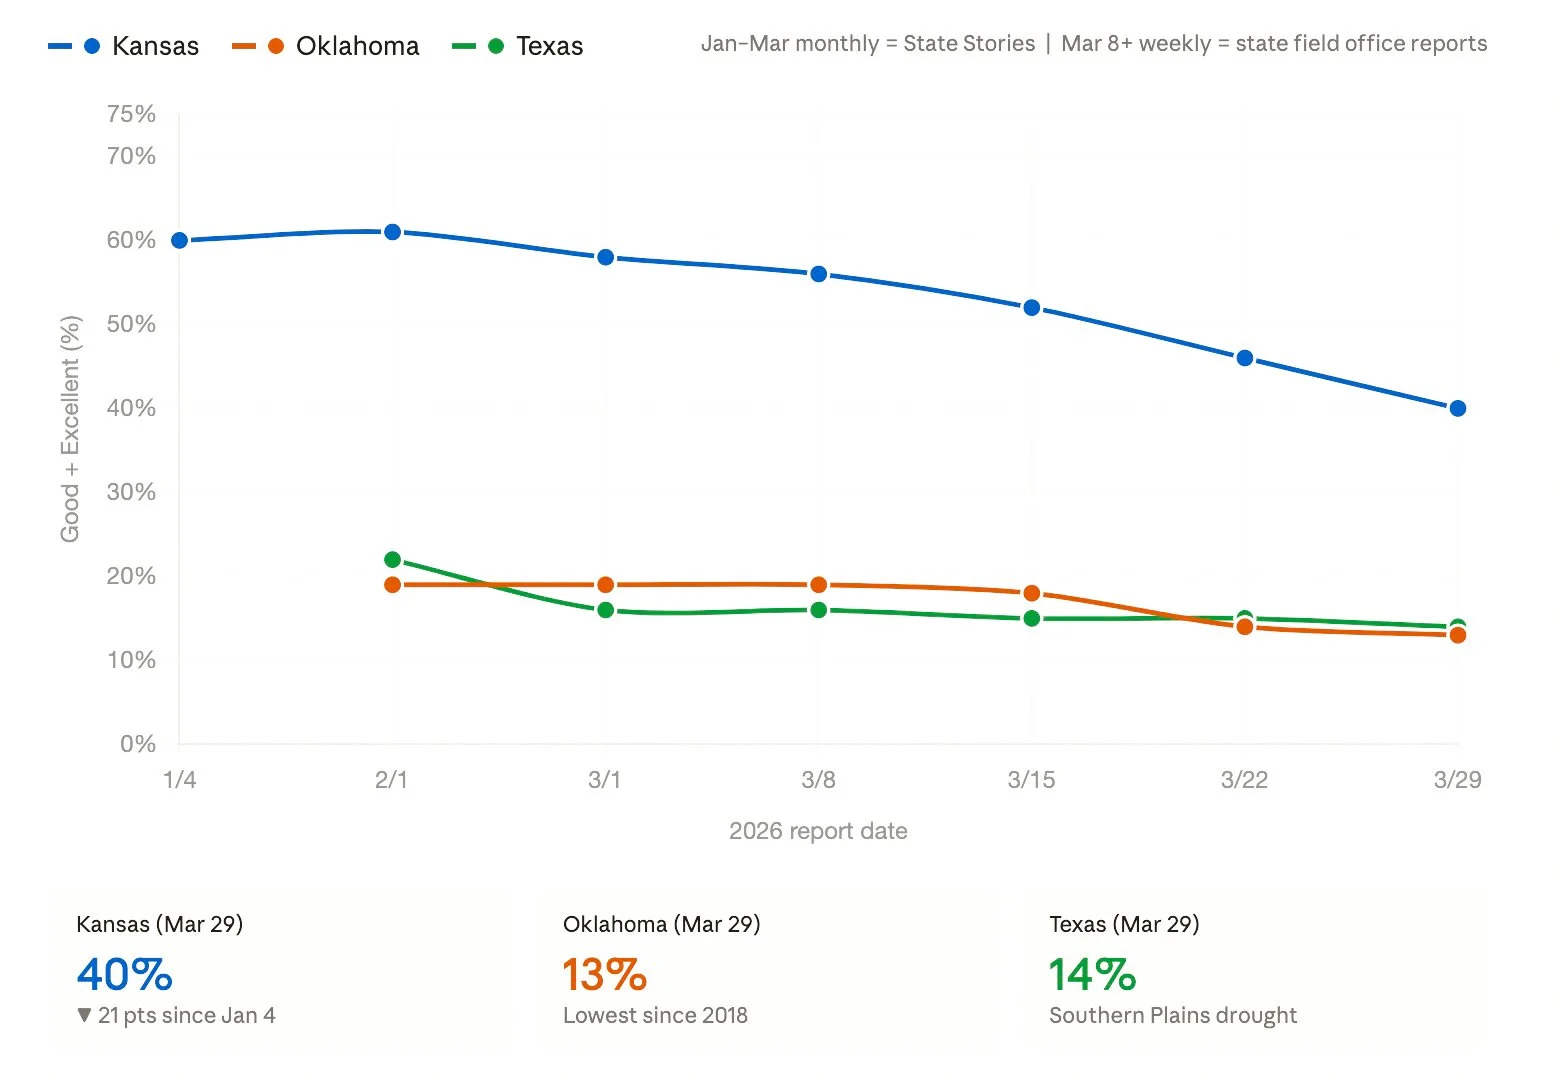
Here are the crop ratings for those 3 states.
Kansas is rated 40% G/E. Down from 46% last week.
Oklahoma is rated 13% G/E. That is the lowest since 2018.
Texas is rated 14% G/E.
So there could definitely be some concerns.
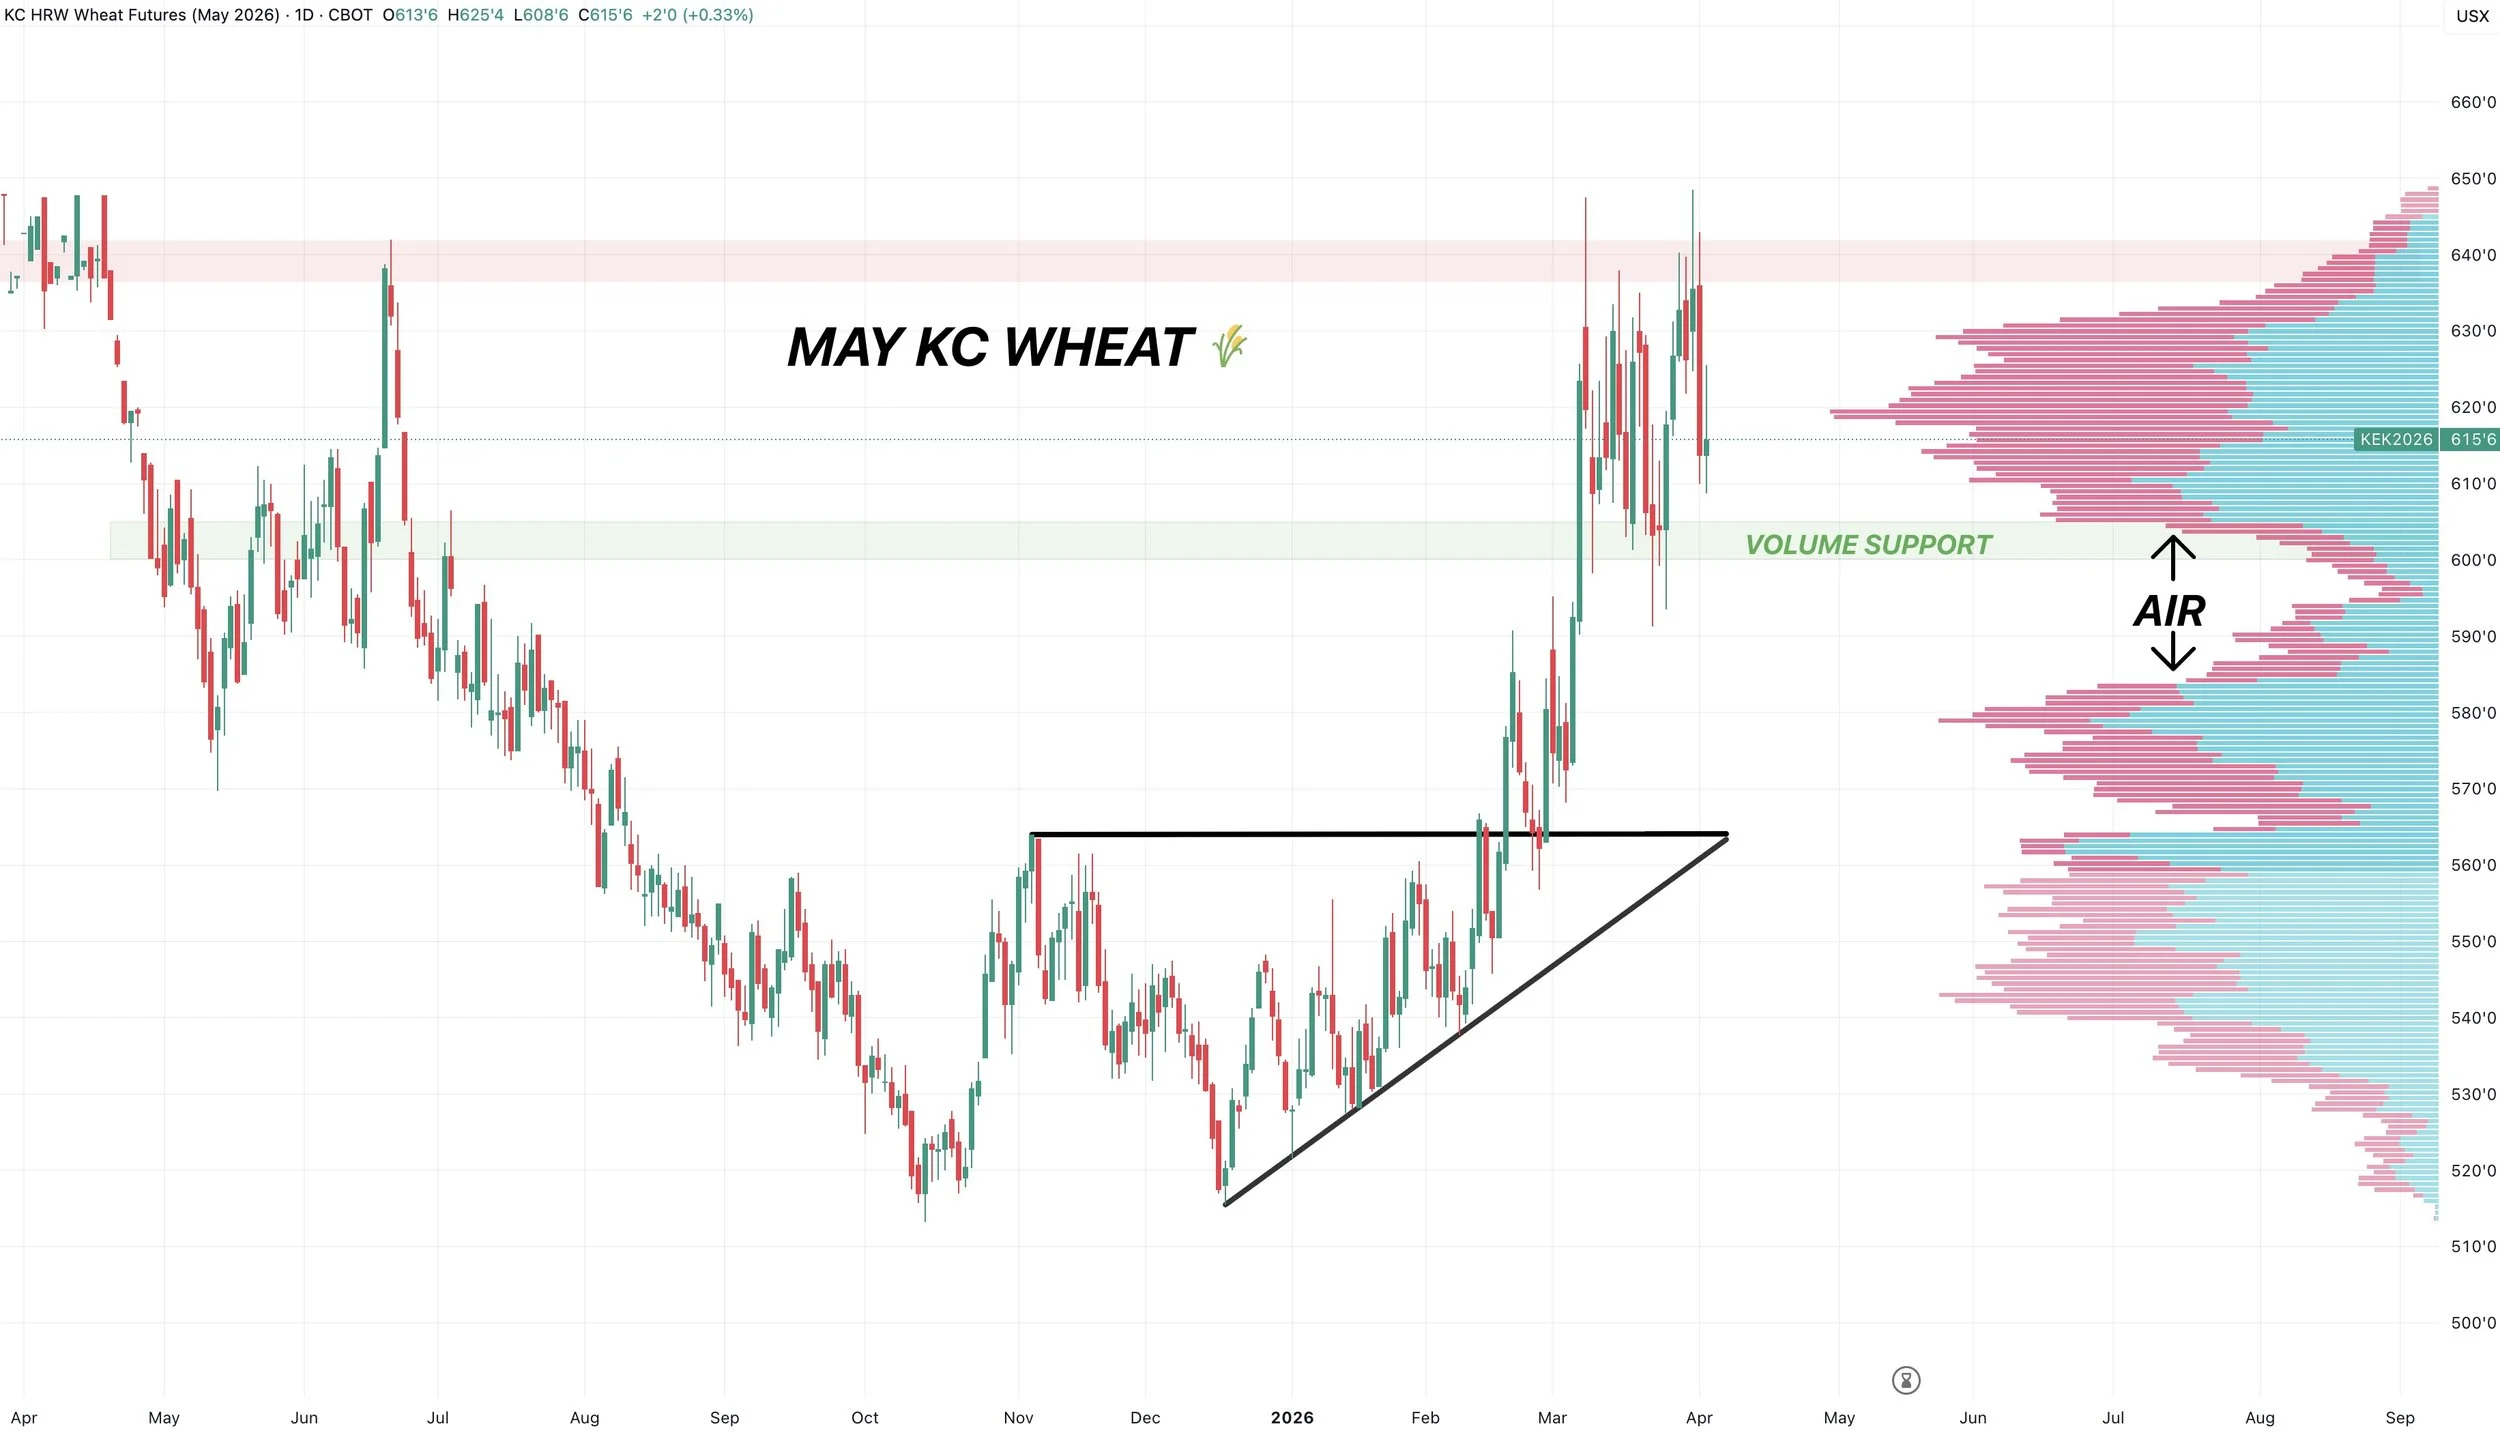
May KC Chart:
We had a failed breakout on Tuesday across the entire wheat complex, which was disappointing.
But the charts aren’t broken.
We're still sitting in a massive sideways choppy market.
The key support we want to hold is $6.00
There is very little support beneath there, and could trigger a sizeable leg lower.
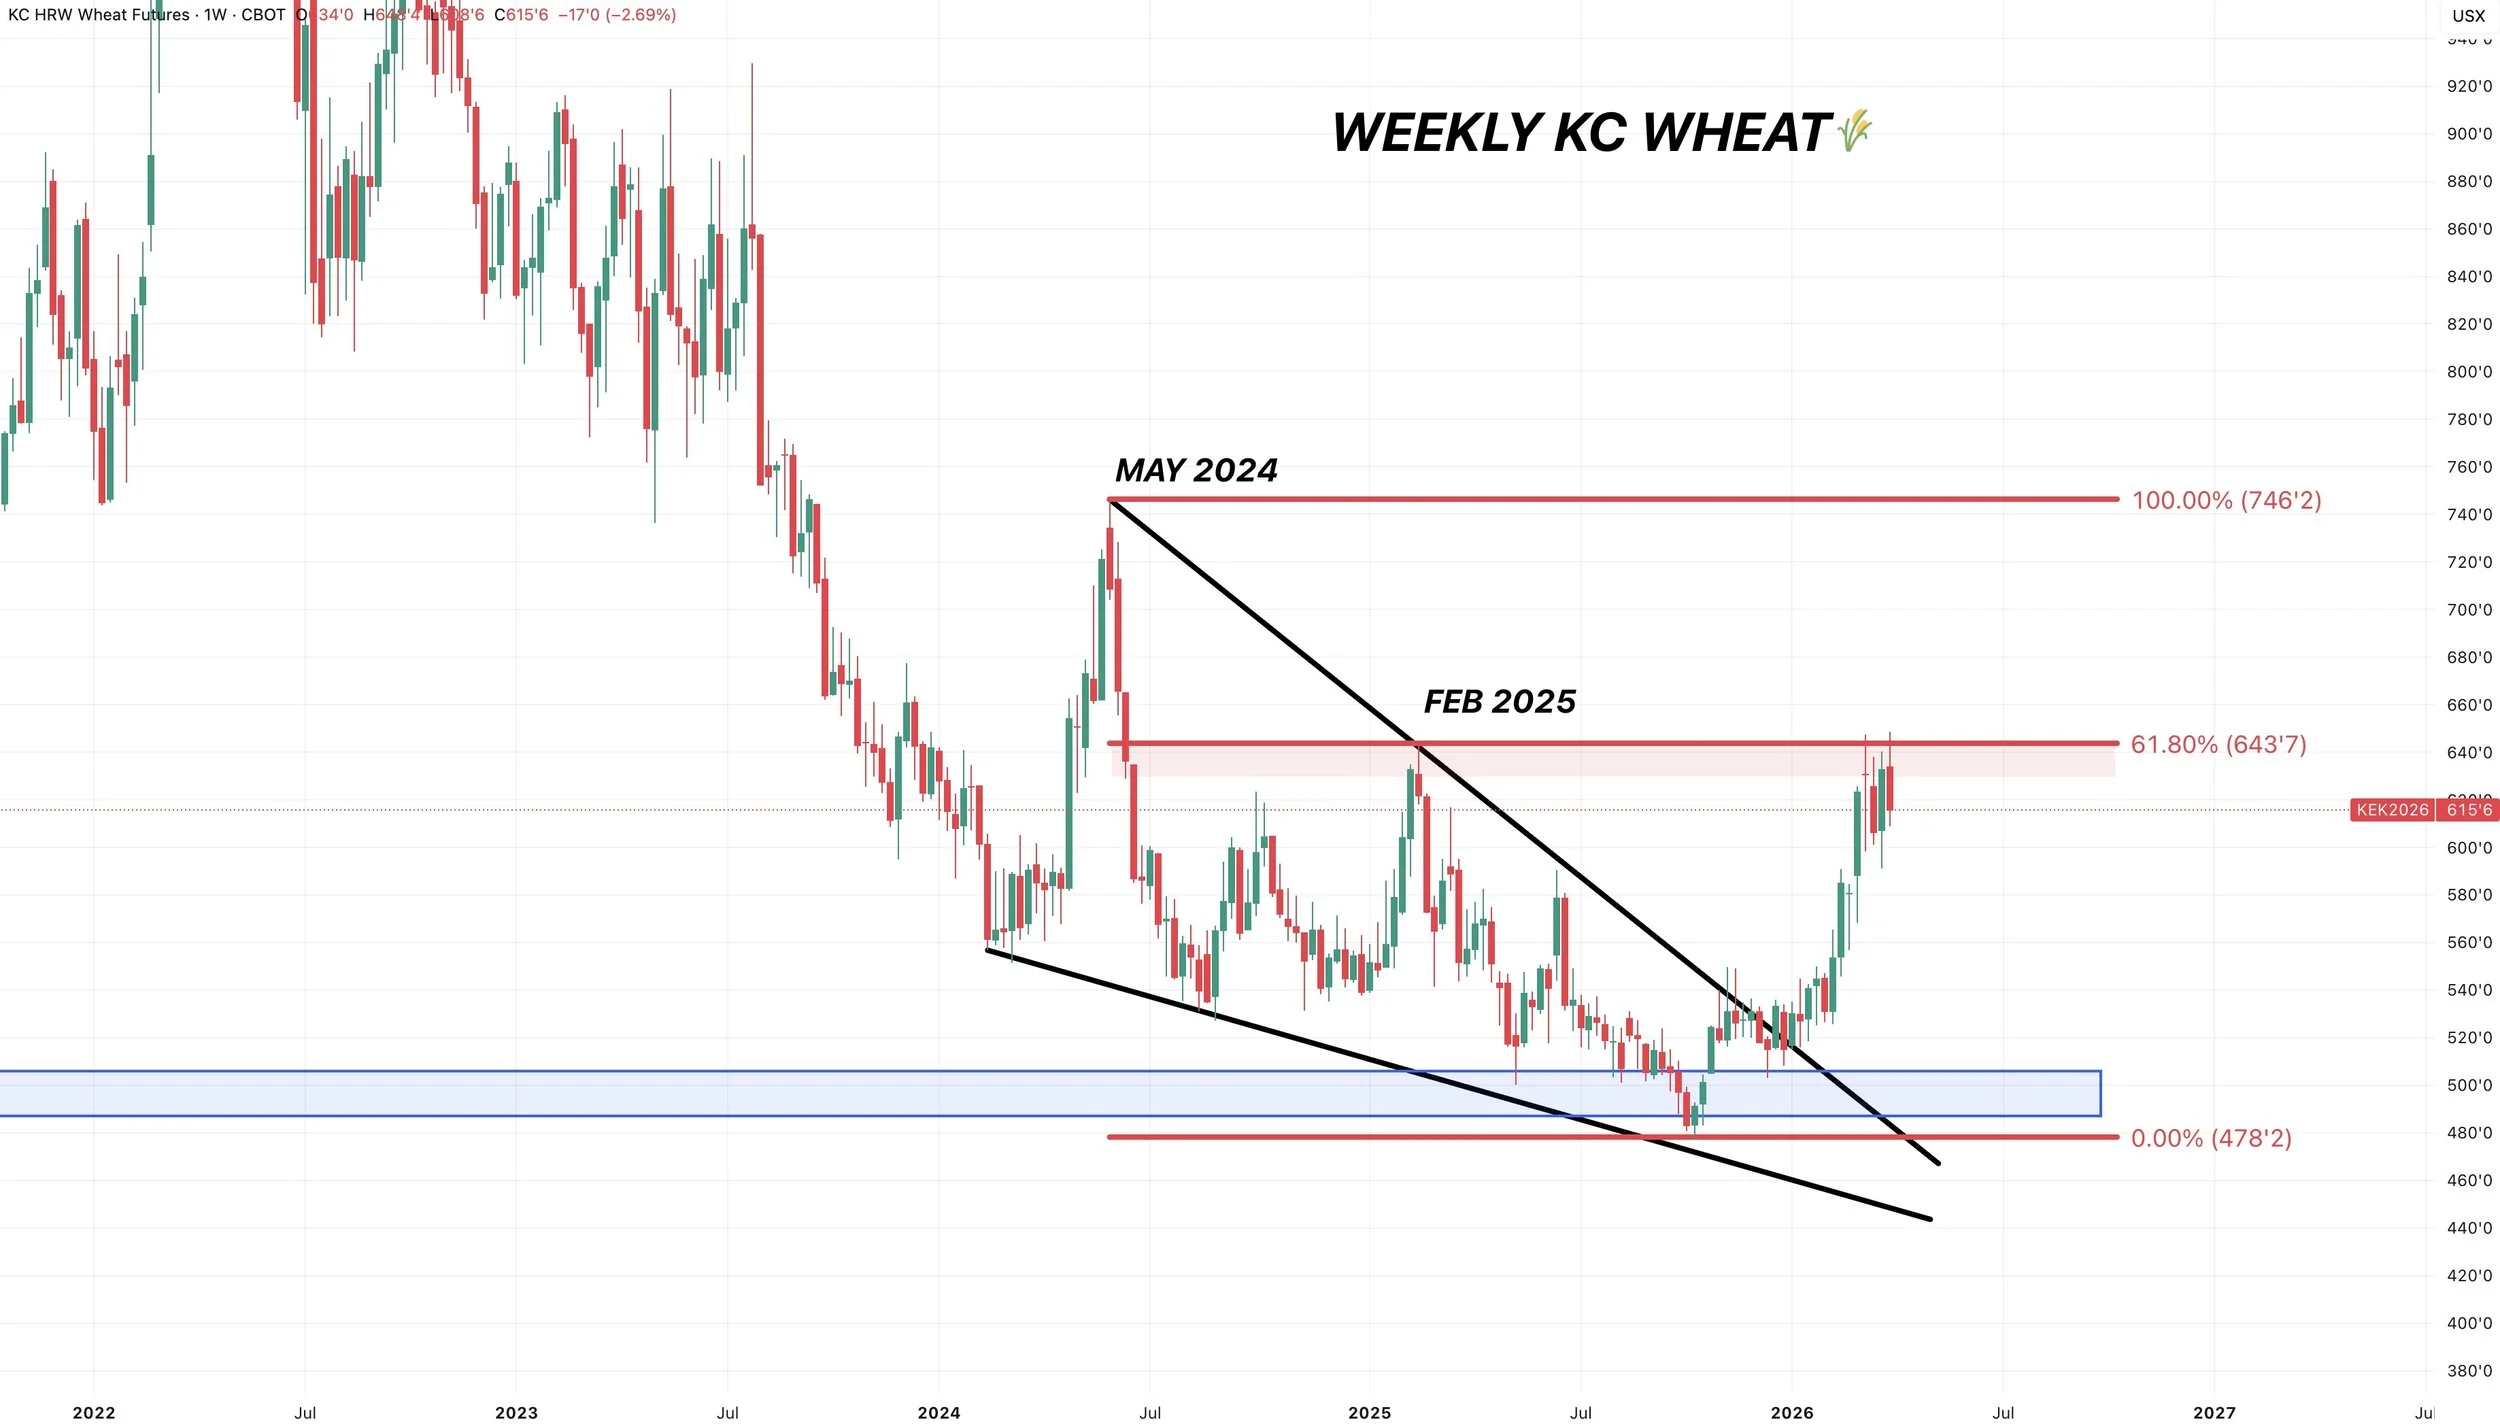
Continuous KC Chart:
Taking a bigger picture approach.
We are right up against those Feb 2025 highs.
This is also 61.8% of the May 2024 highs.
This is still some big resistance hence why we already took some risk off at these levels a few weeks ago.
But if you take out this level.. we could open the door a lot higher and have room to run.
Cattle
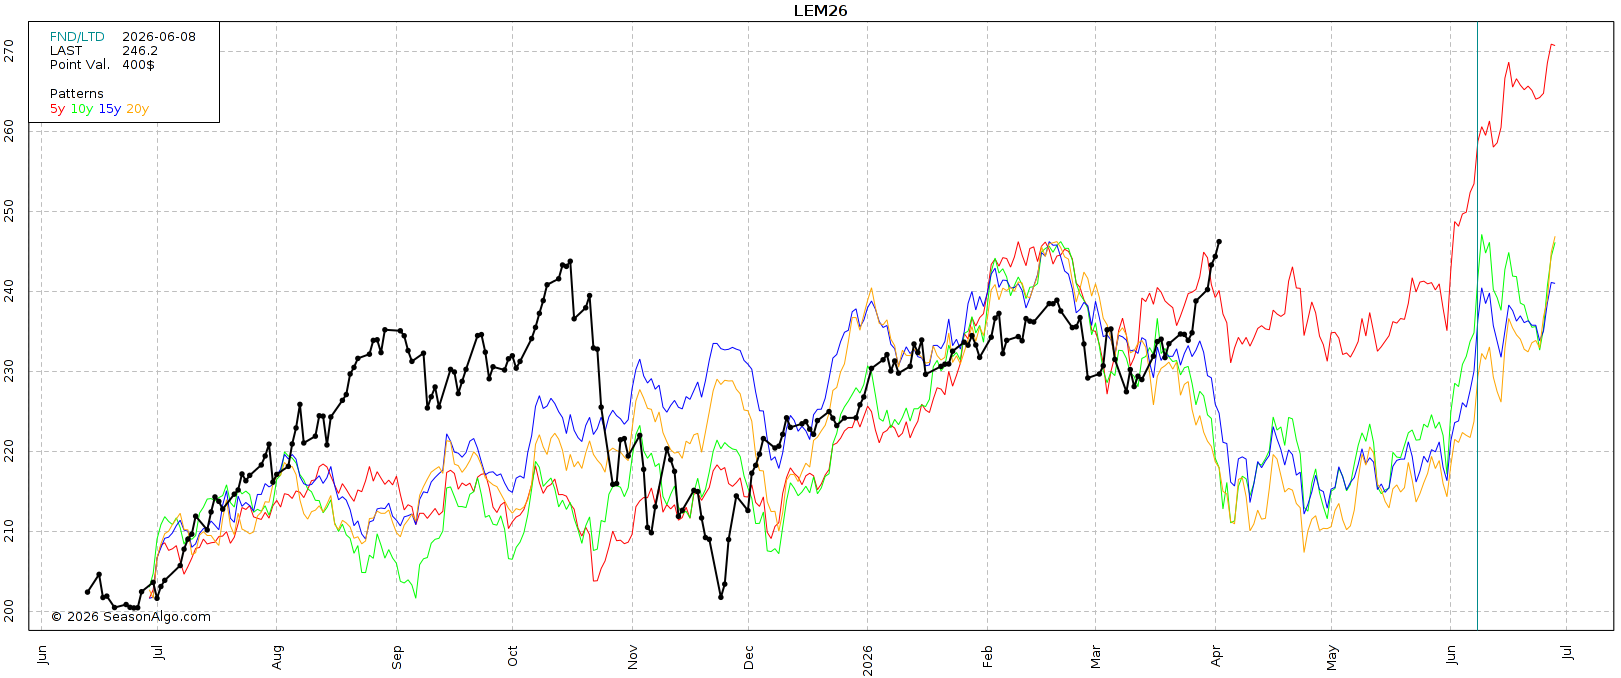
Seasonals:
I did want to mention that seasonally the cattle market tends to struggle until that May time frame. Before ramping higher in the summer.
But seasonals don’t always work, they especially don’t have to work in a bull market.
June Live
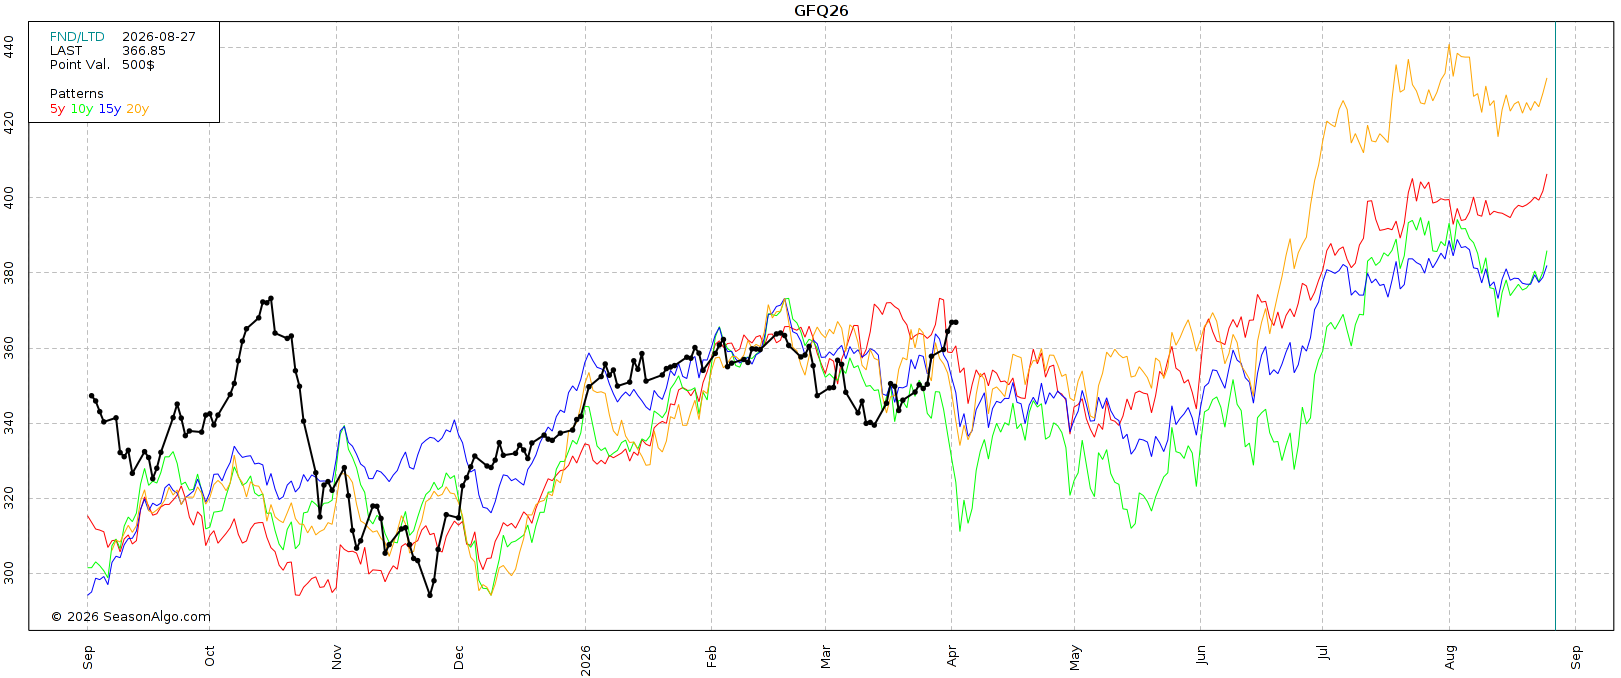
May Feeders
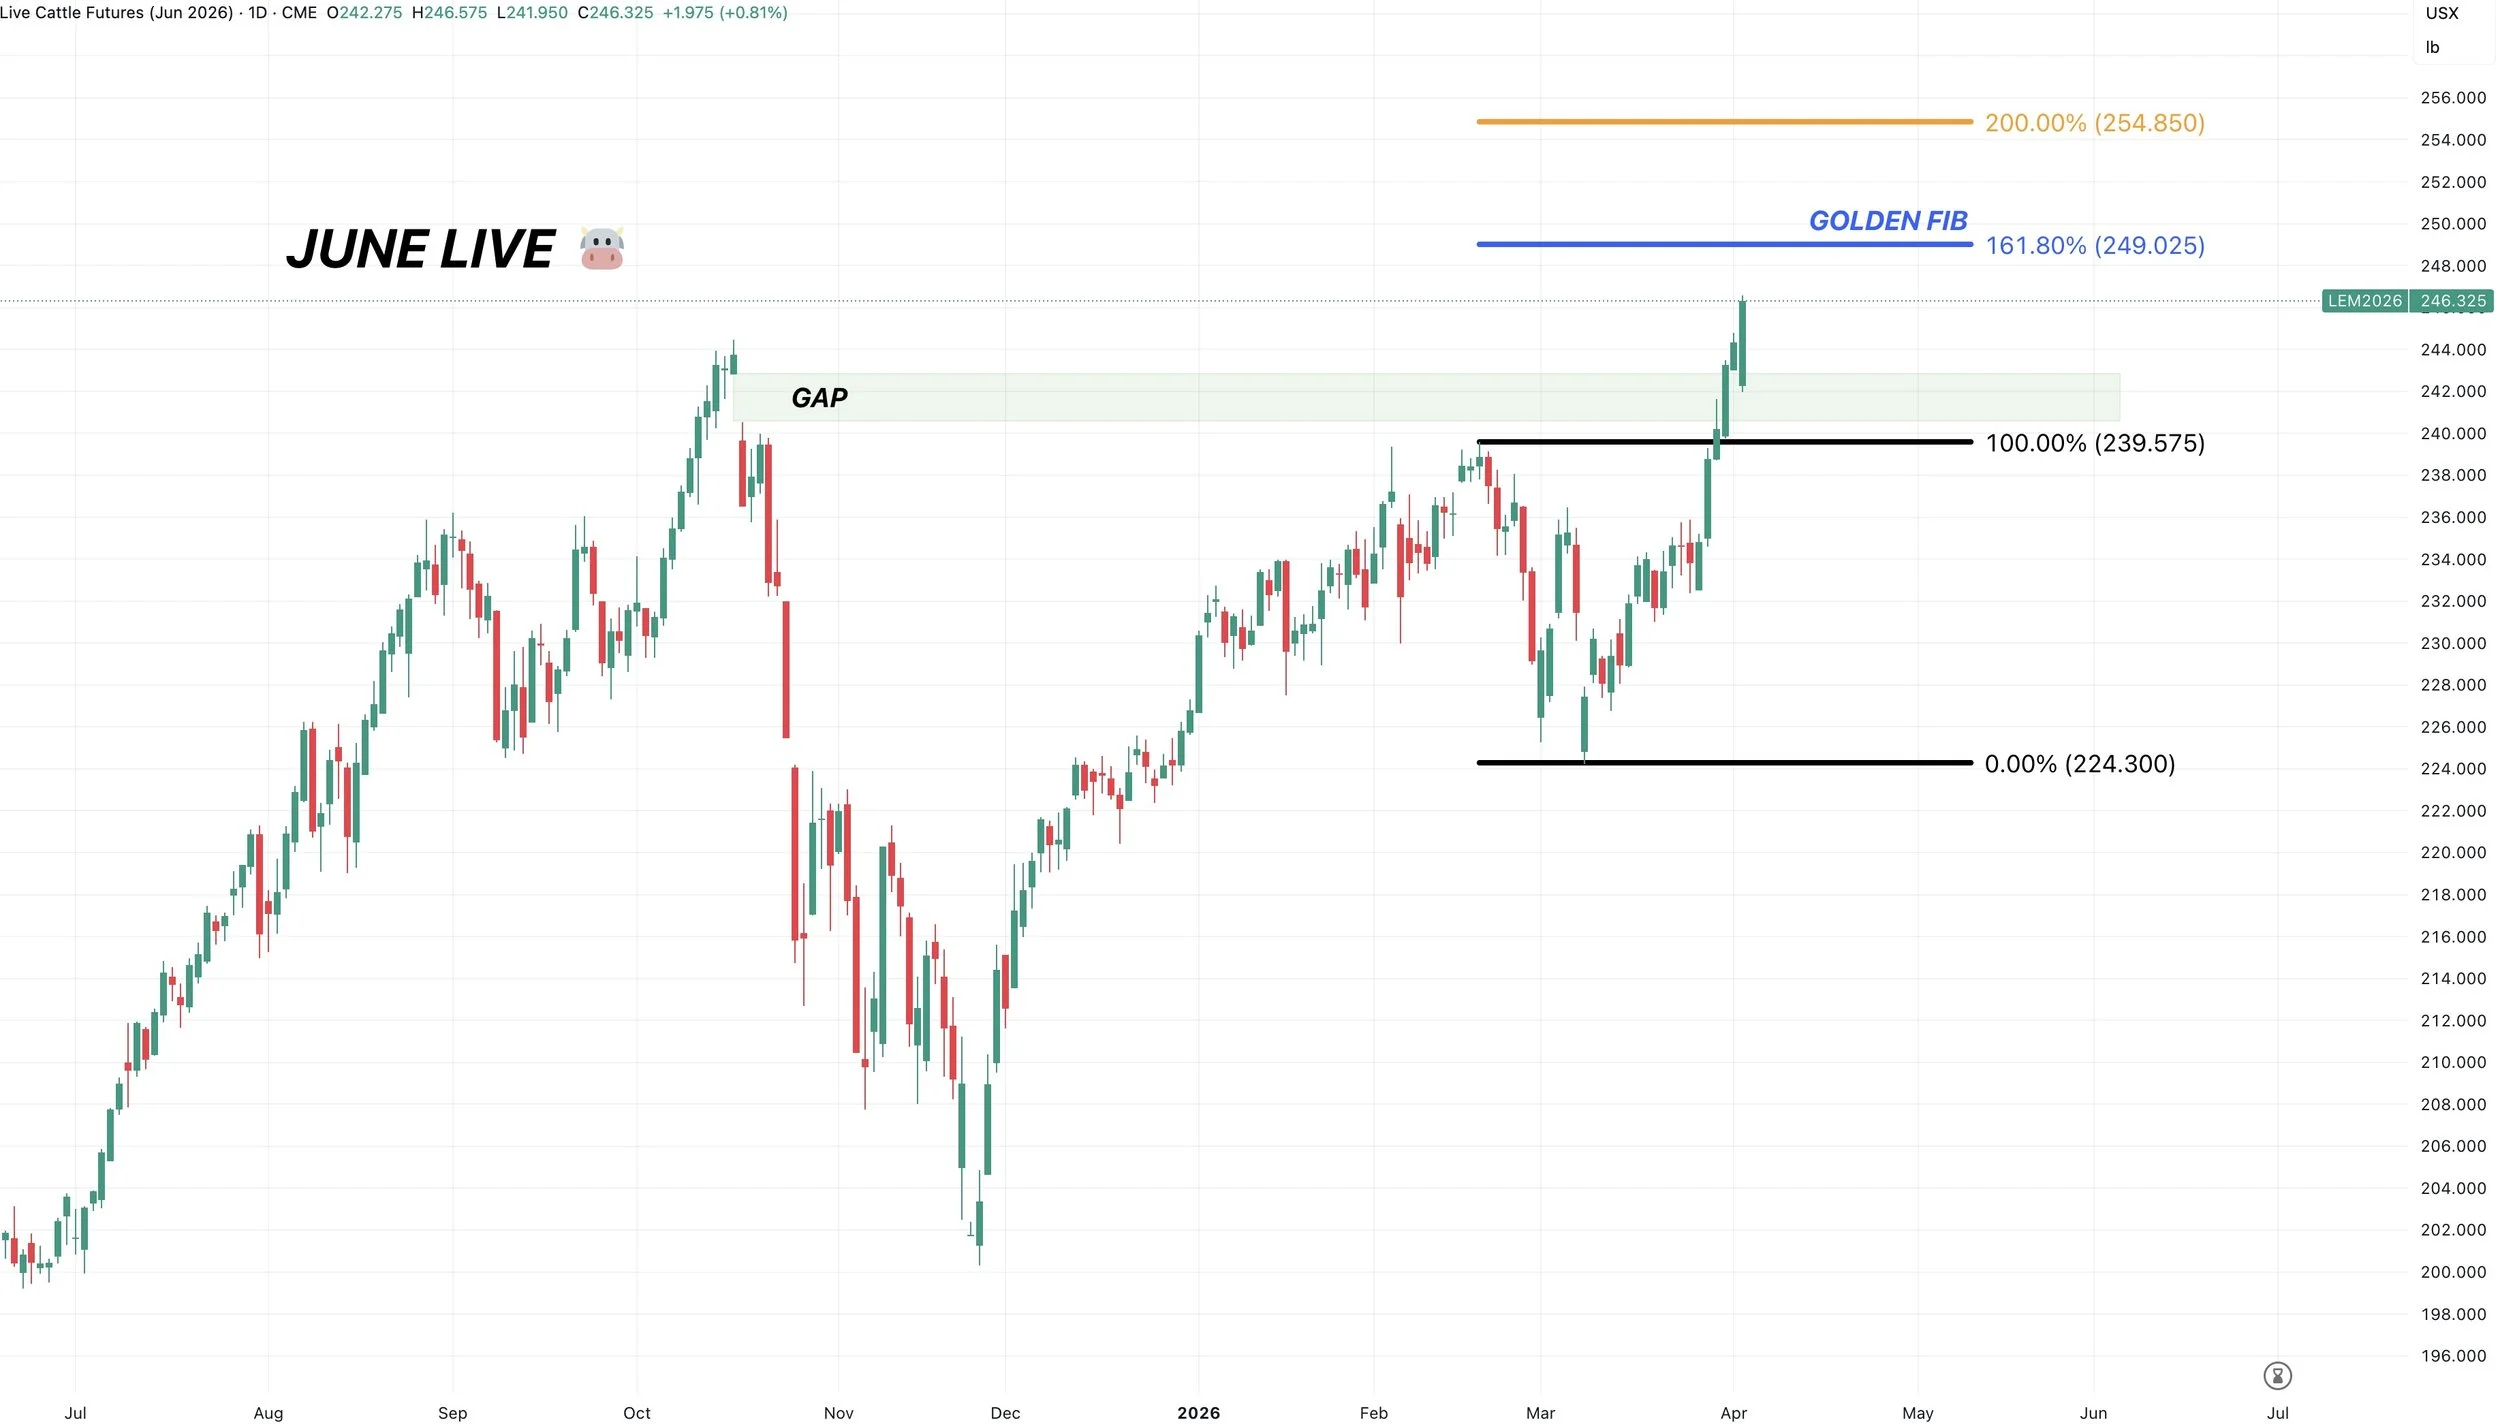
June Live Chart:
Cattle continues to run.
I'm not even sure the exact reason why the market has caught a bid the way it has, but the price action is impressive.
Live cattle posted fresh contracts highs.
The golden fib extension from the recent sell off sits at 249.
Which means that 249 equals 161.8% of the recent lows up to those February highs.
Charts look good, but I still want to keep a floor under this thing.
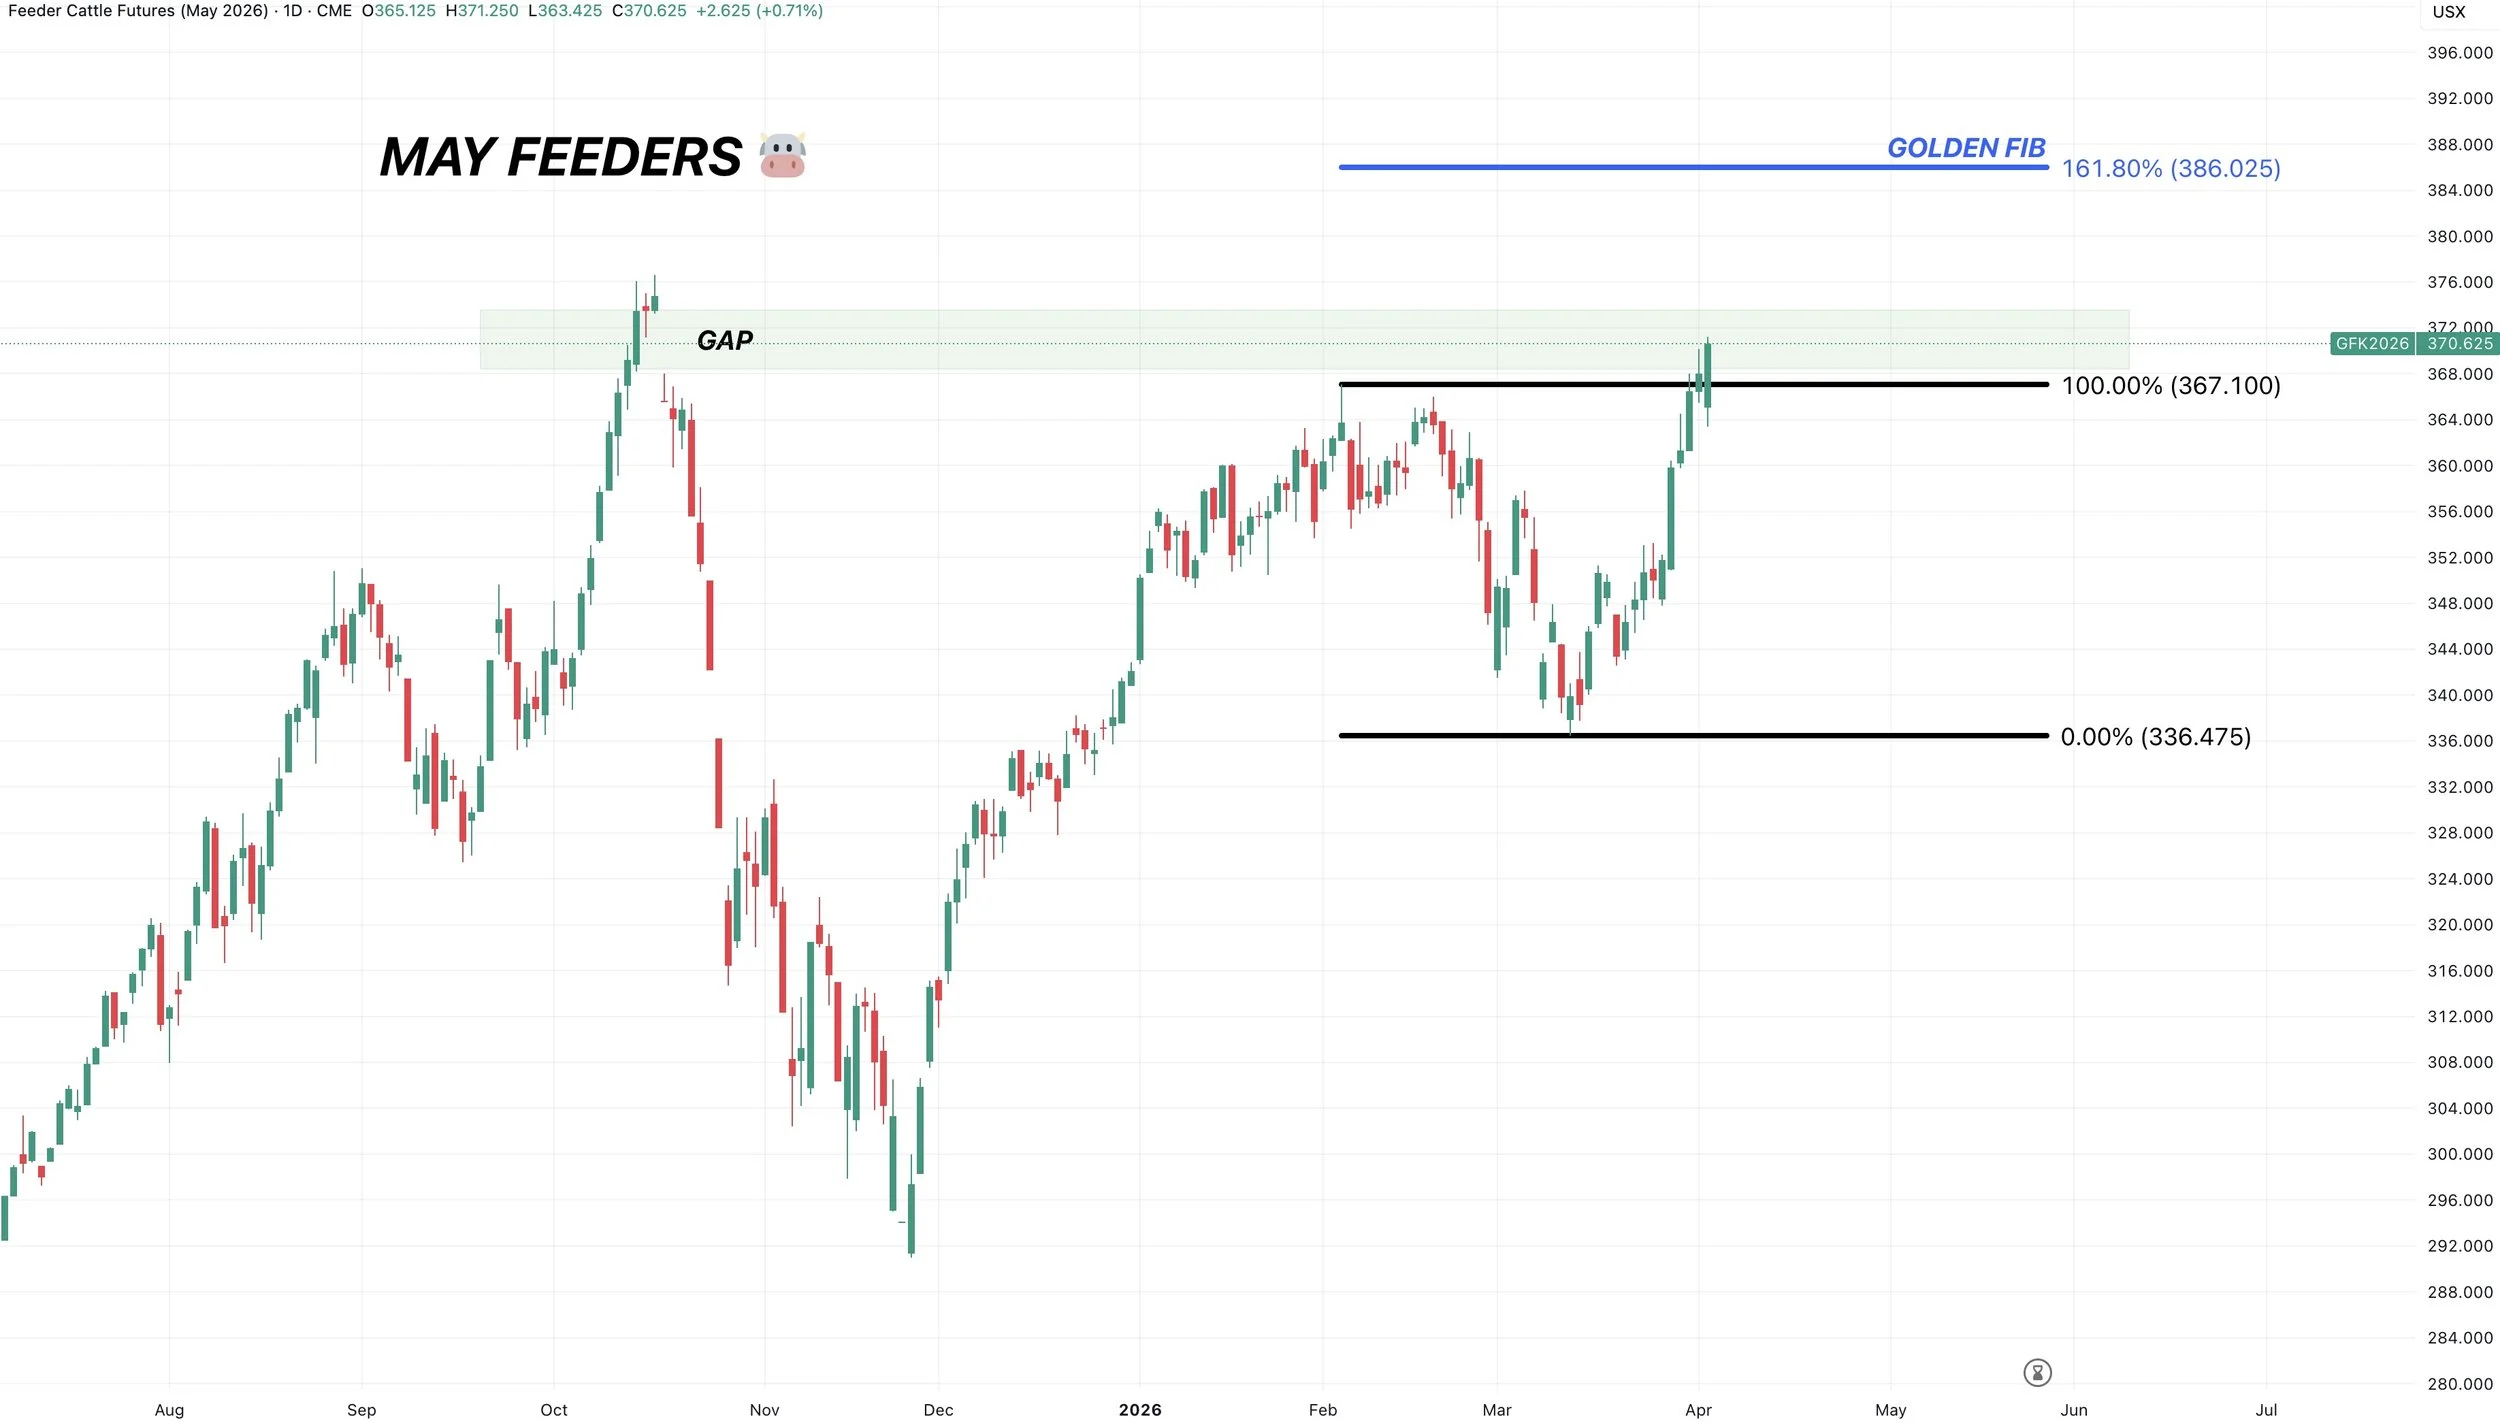
May Feeders Chart:
Approaching that gap from October.
June live cattle's chart looks better as we posted new highs and have a clear breakout.
The golden fib extension on this contract sits at 386.
Want to Talk?
Our phones are open 24/7 for you guys if you ever need anything or want to discuss your operation.
Jeremey, Lauren & Office: (806)484-1214
Sebastian: (605)280-1186
Email: sfrost@dailymarketminute.com
Hedge Account
Interested in a hedge account? Use the link below to set up an account or give us a call.
Recent Signals
March 19th, 2026: 🌱
New crop soybeans signal & hedge alert.
CLICK HERE TO VIEW
March 9th, 2026: 🌱
Soybeans signal & hedge alert. Sent via text.
March 6th, 2026: 🌽 🌾
Corn & wheat sell signal & hedge alert.
March 3rd, 2026: 🌽
Old crop & new crop corn sell signal & hedge alert.
Feb 26th, 2026: 🌱
Old crop & new crop beans sell signal & hedge alert.
Feb 19th, 2026: 🌾
KC wheat sell signal & hedge alert.
Feb 6th, 2026: 🌽 🌱
Old crop corn & soybean sell signal & hedge alert.
Feb 4th, 2026: 🌱
Soybean sell signal & hedge alert.
Nov 17th, 2025: 🌱
Soybean sell signal & hedge alert.