
WHEAT LIMIT UP. RUSSIA RALLY
MARKET UPDATE
You can scroll to read the usual update as well. As the written version is the exact same as the video.
Timestamps for video:
Russia & Weather: 0:00min
Long Term Trends: 2:50min
Corn: 5:05min
Bean: 12:15min
Wheat: 16:10min
Cattle: 17:40min
Want to talk?
Office: (806)484-1214
Want full access to every daily update & signal?
Futures Prices Close
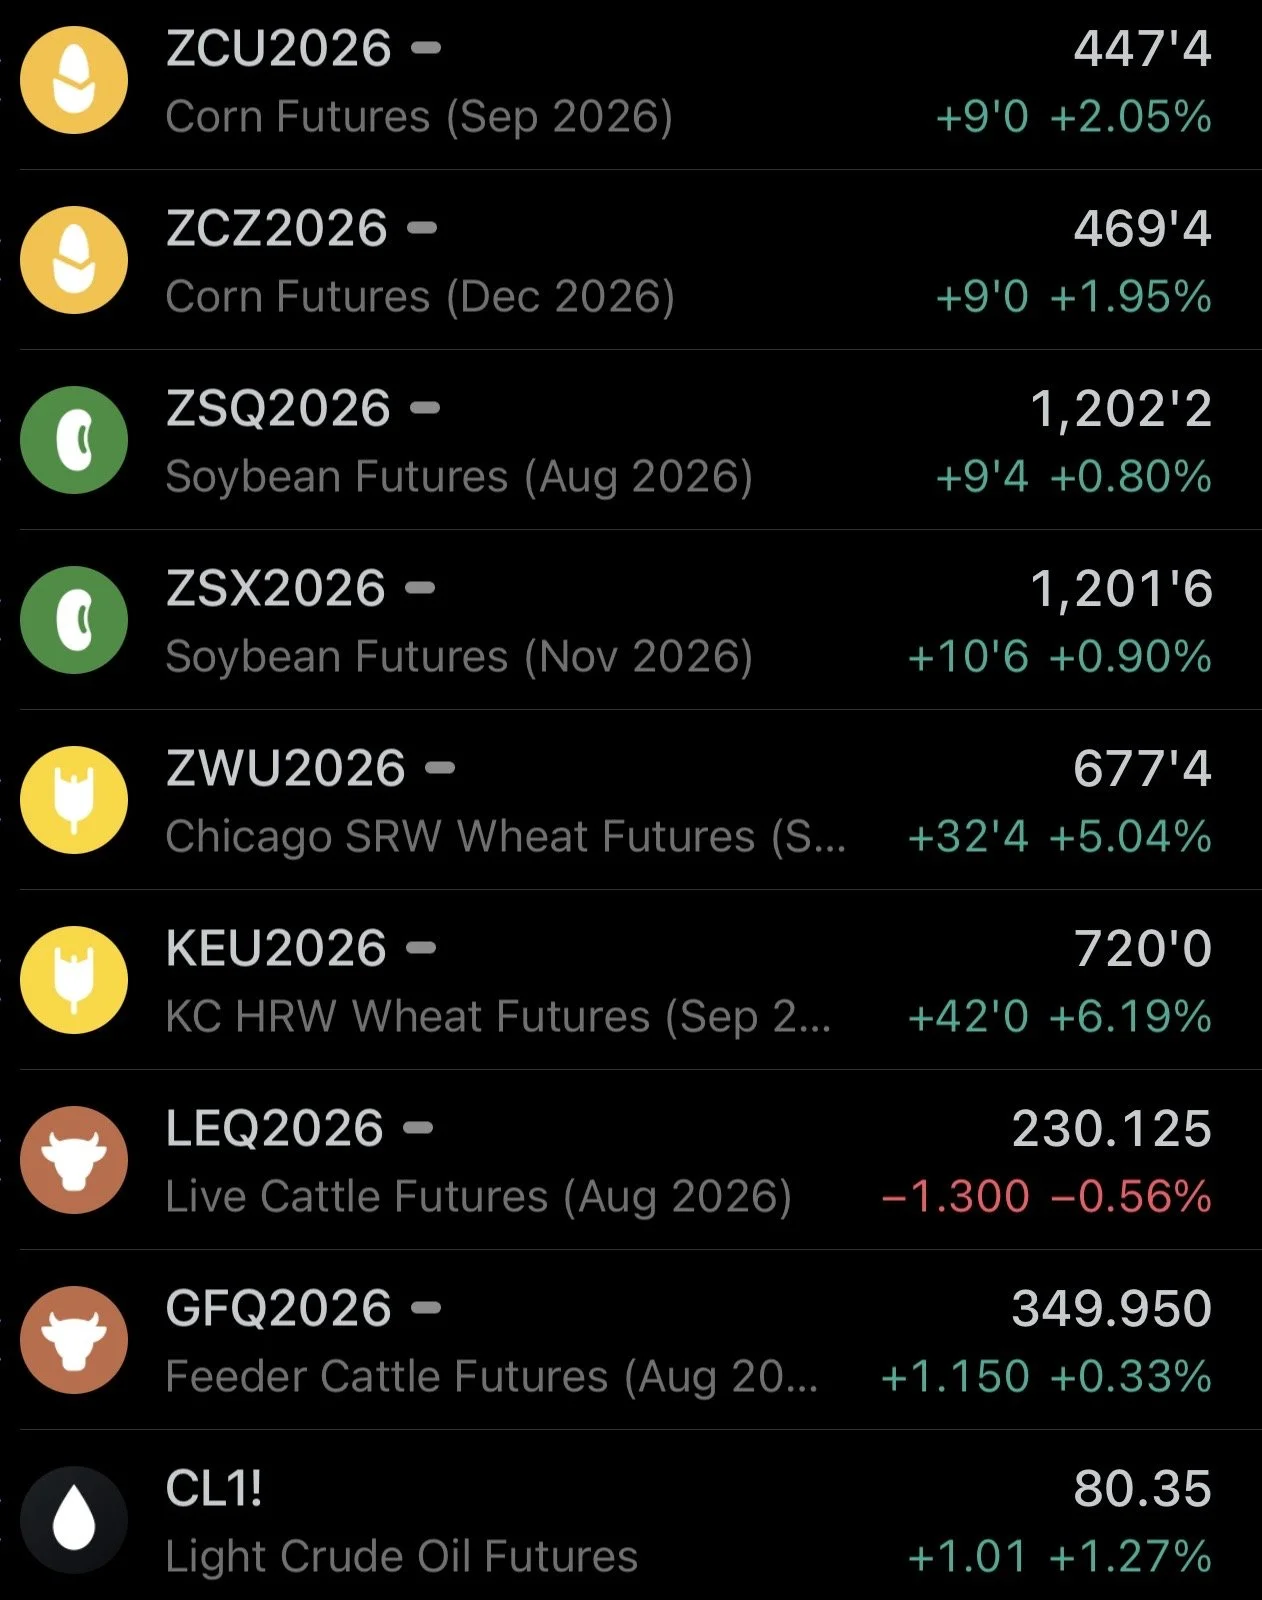
Overview
Great day for the grains today, with wheat leading the charge. As KC wheat traded limit up today.
Why the rally in wheat?
This isn’t a weather rally. Wheat carried corn and soybeans today. So today's strength in corn and soybeans had nothing to do with weather and everything to do with wheat.
The strength is coming from news out in the Black Sea.
Russia News
The Kerch Strait has been shut down.
Last week, reports were saying that it was going to re-open this week. However, there is some speculation that it could last over a month.
This is important if it stays closed because this Strait handles 1/3rd of Russia's wheat exports.
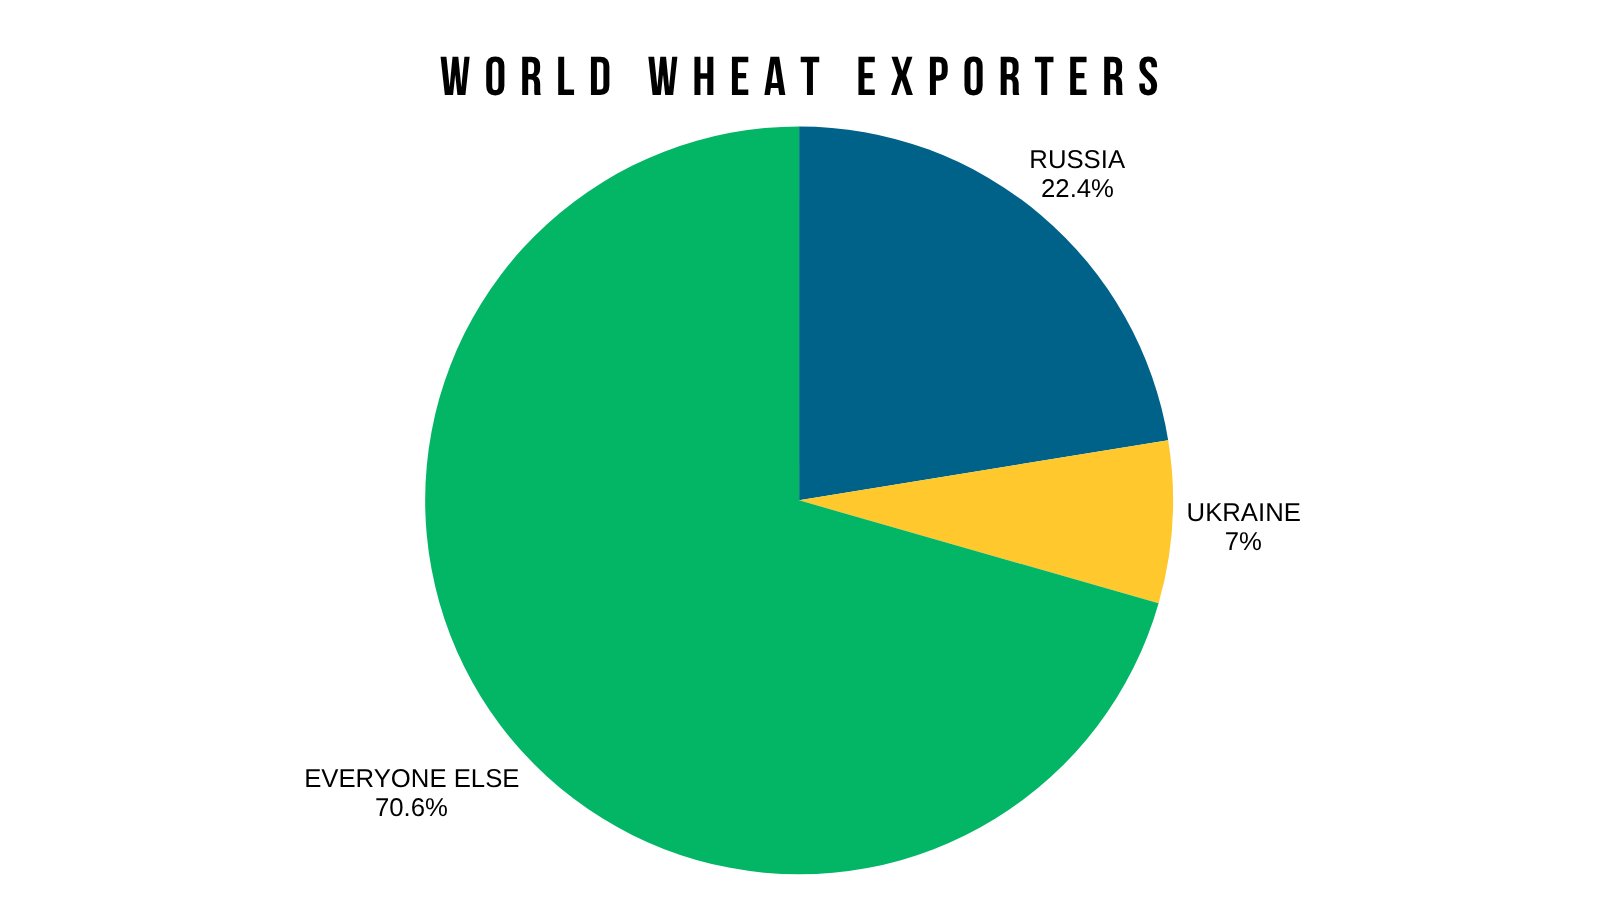
Russia is the world's largest wheat exporter.
Russia and Ukraine account for 30% of the world's wheat exports.
So if the world's largest exporter is unable to export 1/3rd of their wheat to the rest of the world, that becomes a big problem.
And the market is starting to price in the chances of Russia's exports being restricted.
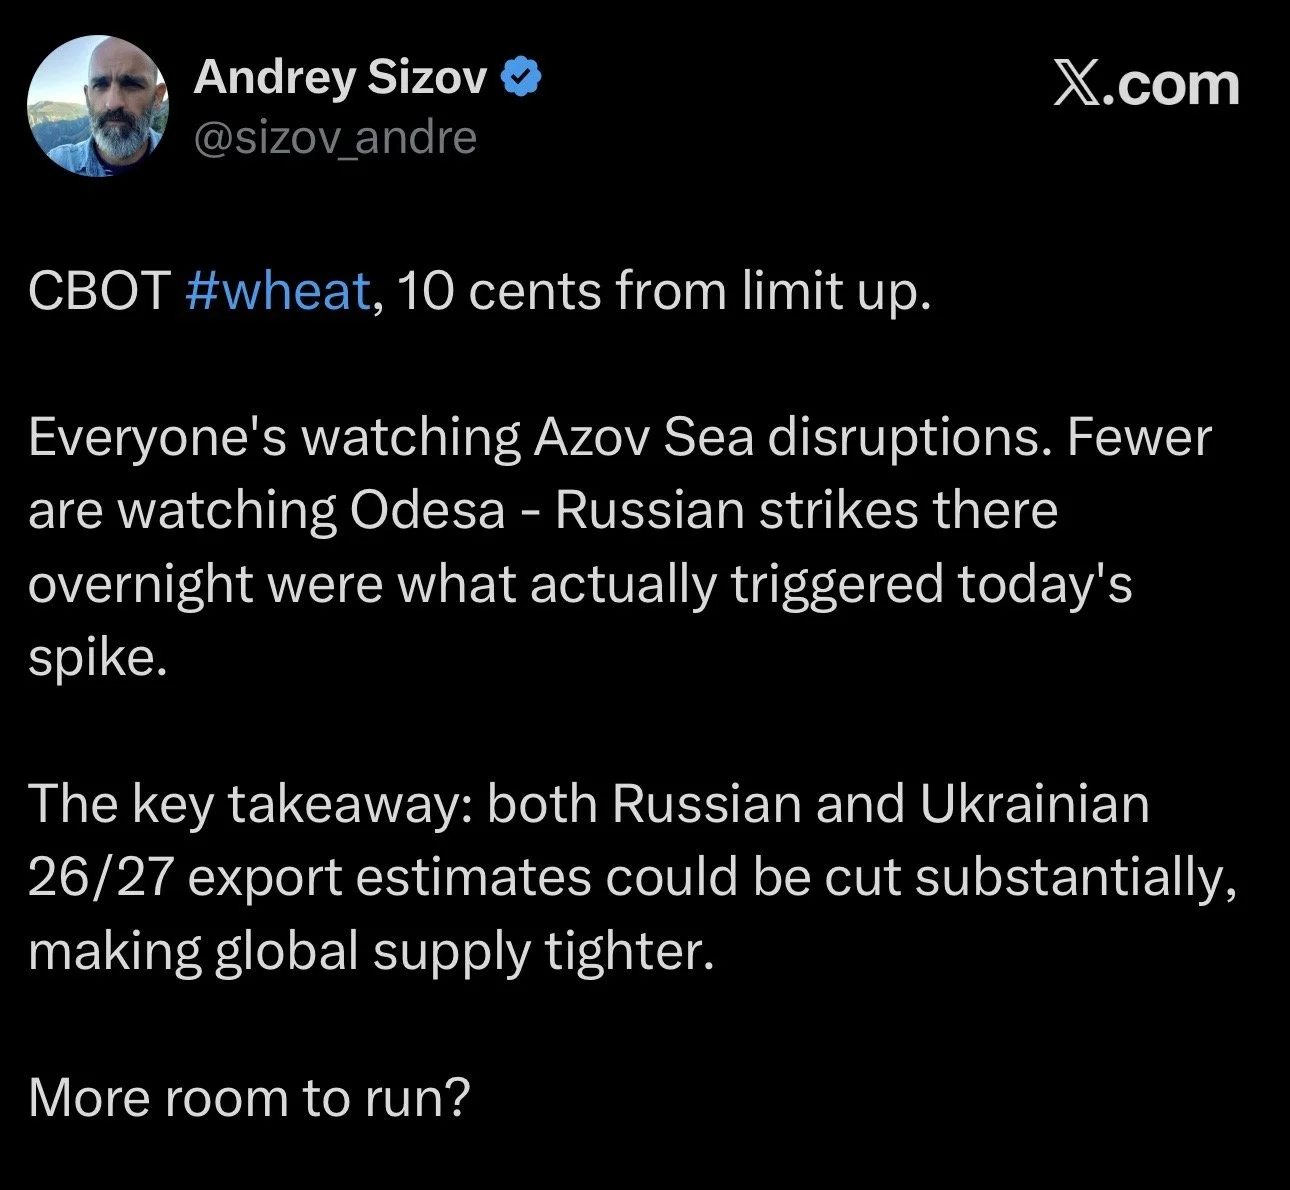
The even bigger news and reason for today's rally was likely due to Russia and Ukraine are going back and forth on attacking each others ports. As last night Ukraine attacked ships in the Black Sea and Russia responded with attacks on Odesa.
The thought process here is that if they continues to attack ships, the Strait is going to remain closed and ships aren’t going to travel through if there is on going attacks.
I am far from a Black Sea expert, and I do not know how long this will last.
But if this situation continues for, let's say, a few months, it could make a massive impact on the global wheat story and balance sheets.
So the million dollar question is how long will the situation last?
We all know what happened to crude oil when the Strait of Hormuz in the Middle East got closed for months.
If it wasn’t for this news, corn and soybeans wouldn’t have traded as high as they did today at all.
Soybeans specifically were trading quiet a bit lower overnight.
As the forecasts did cool down.
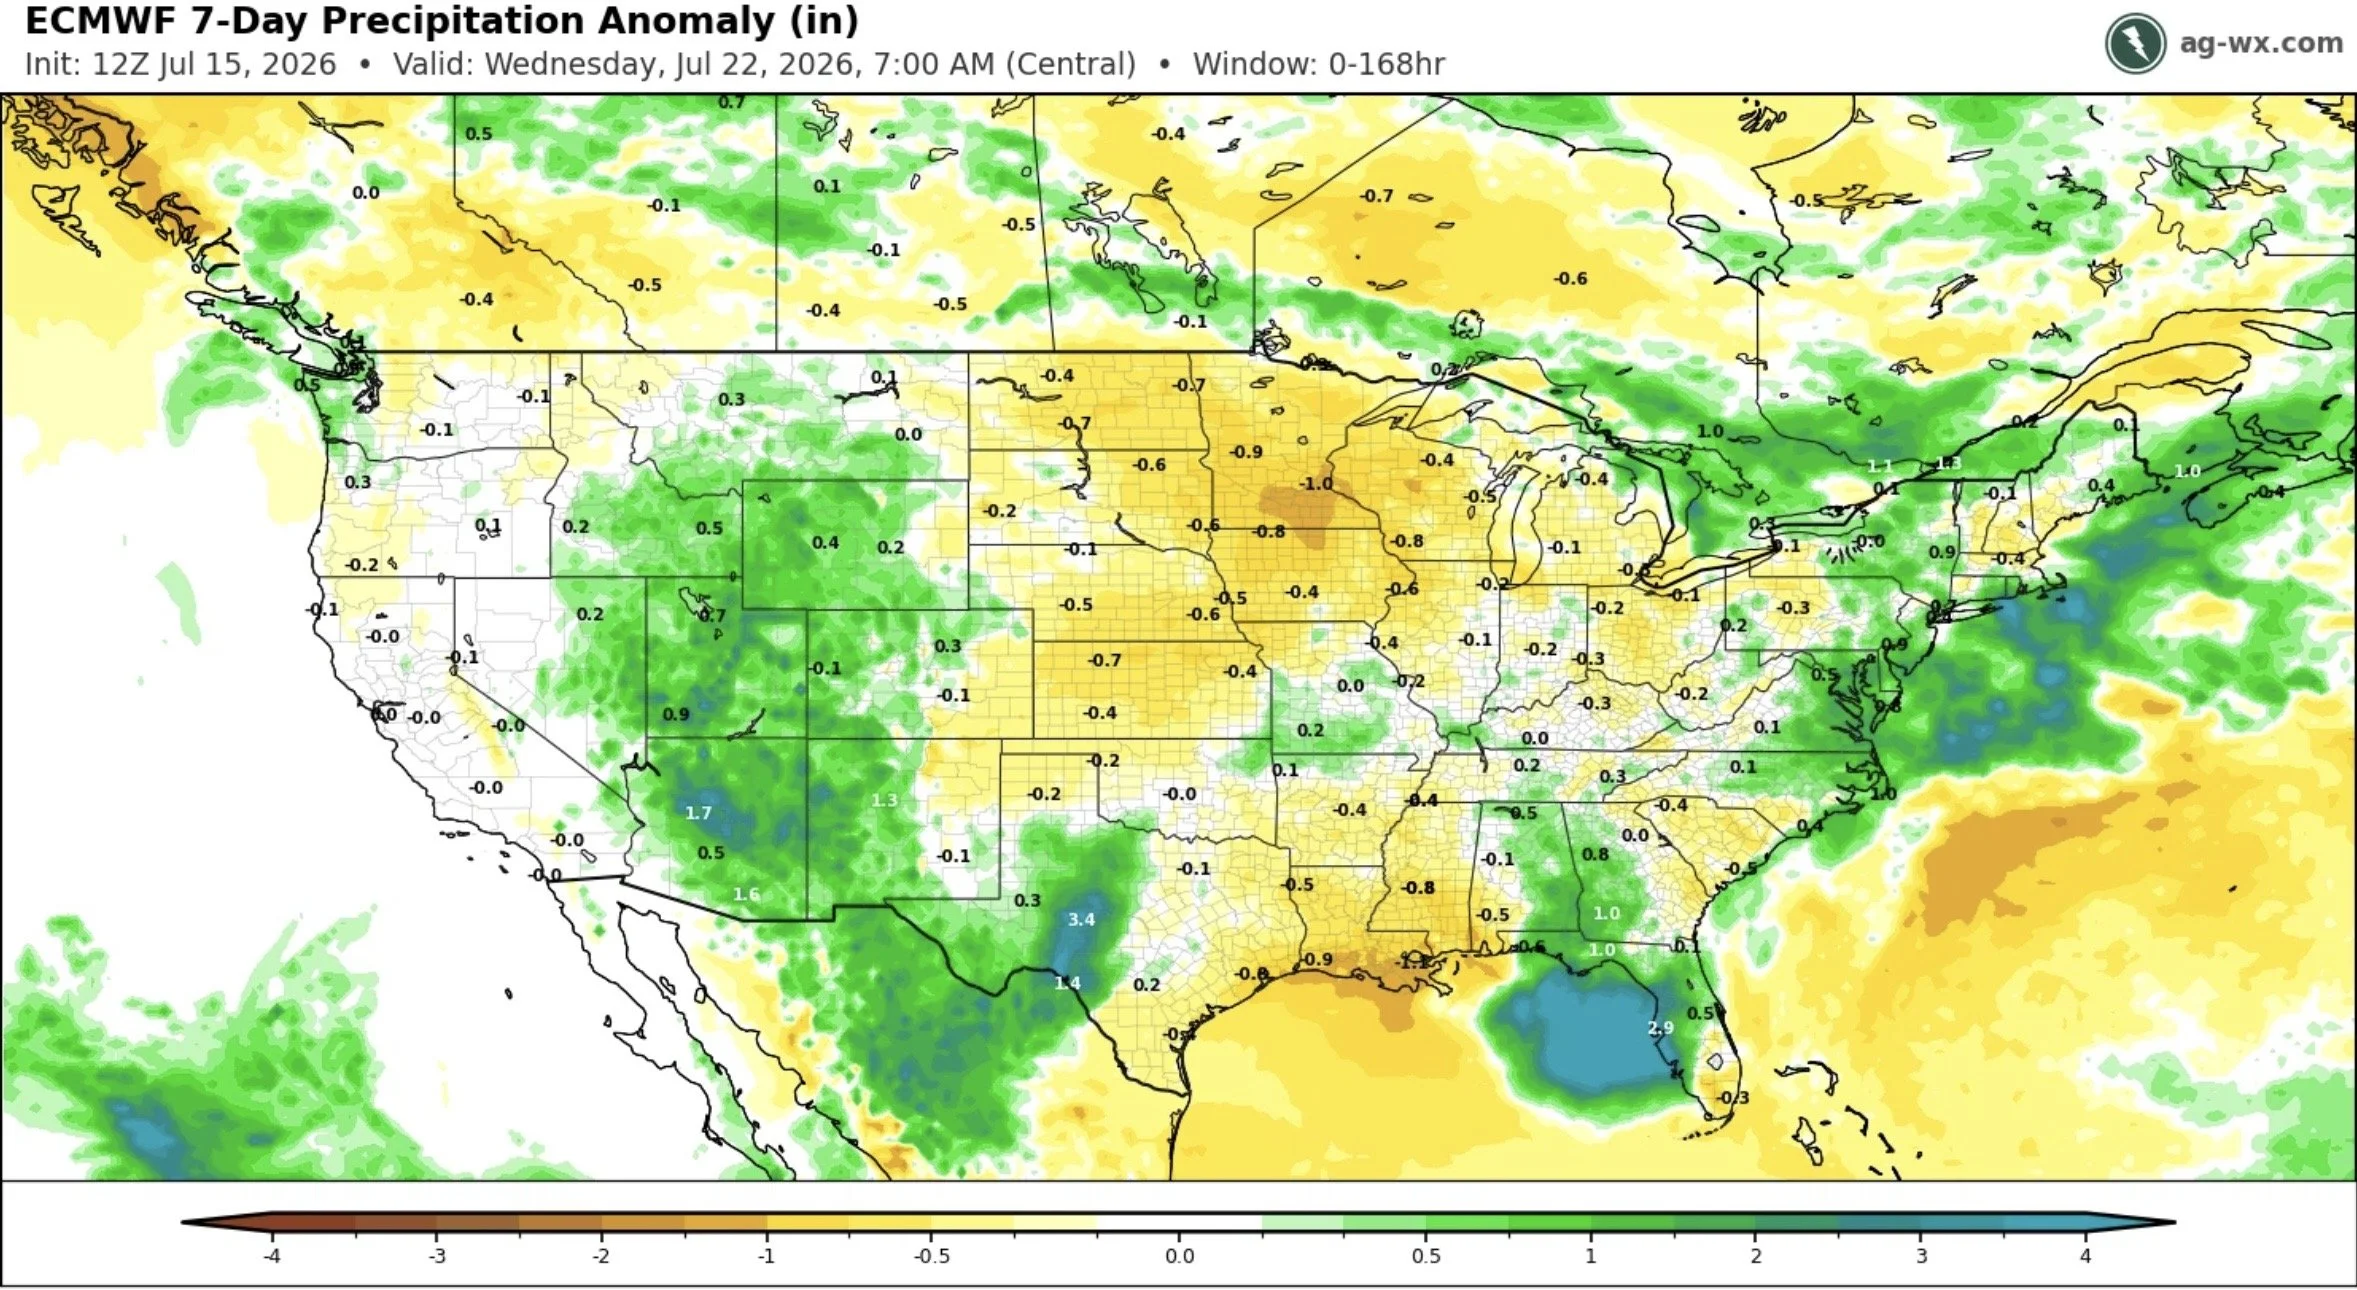
Here is the dailly temp anomaly for next Wednesday. The entire corn belt is expected to be cooler than normal.
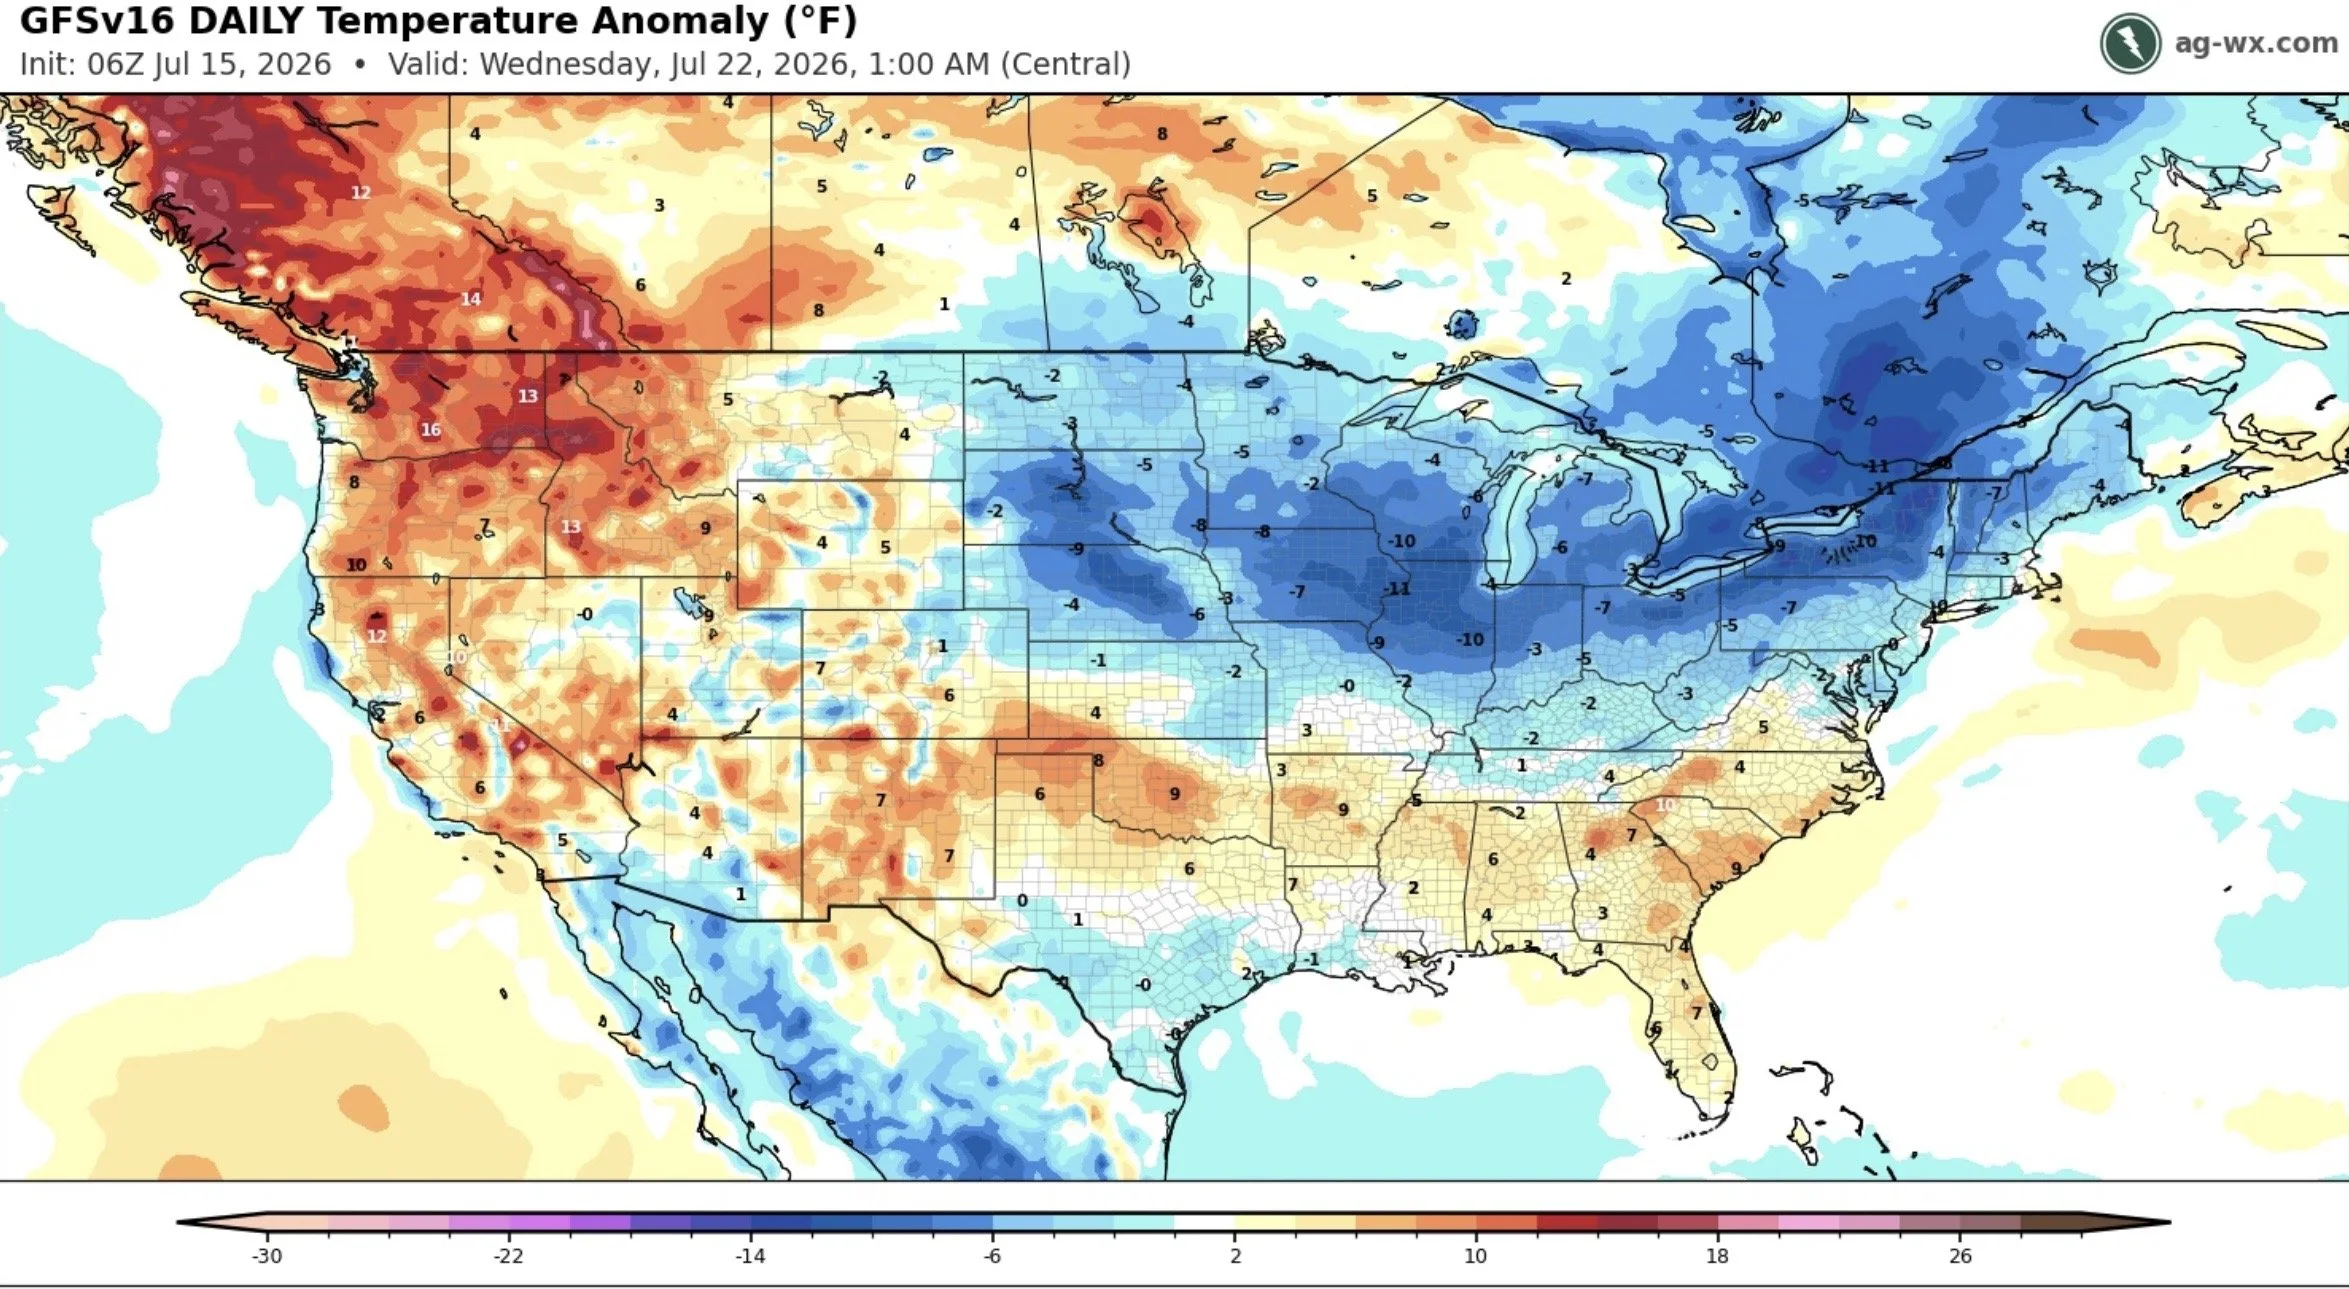
The next week looks dry.
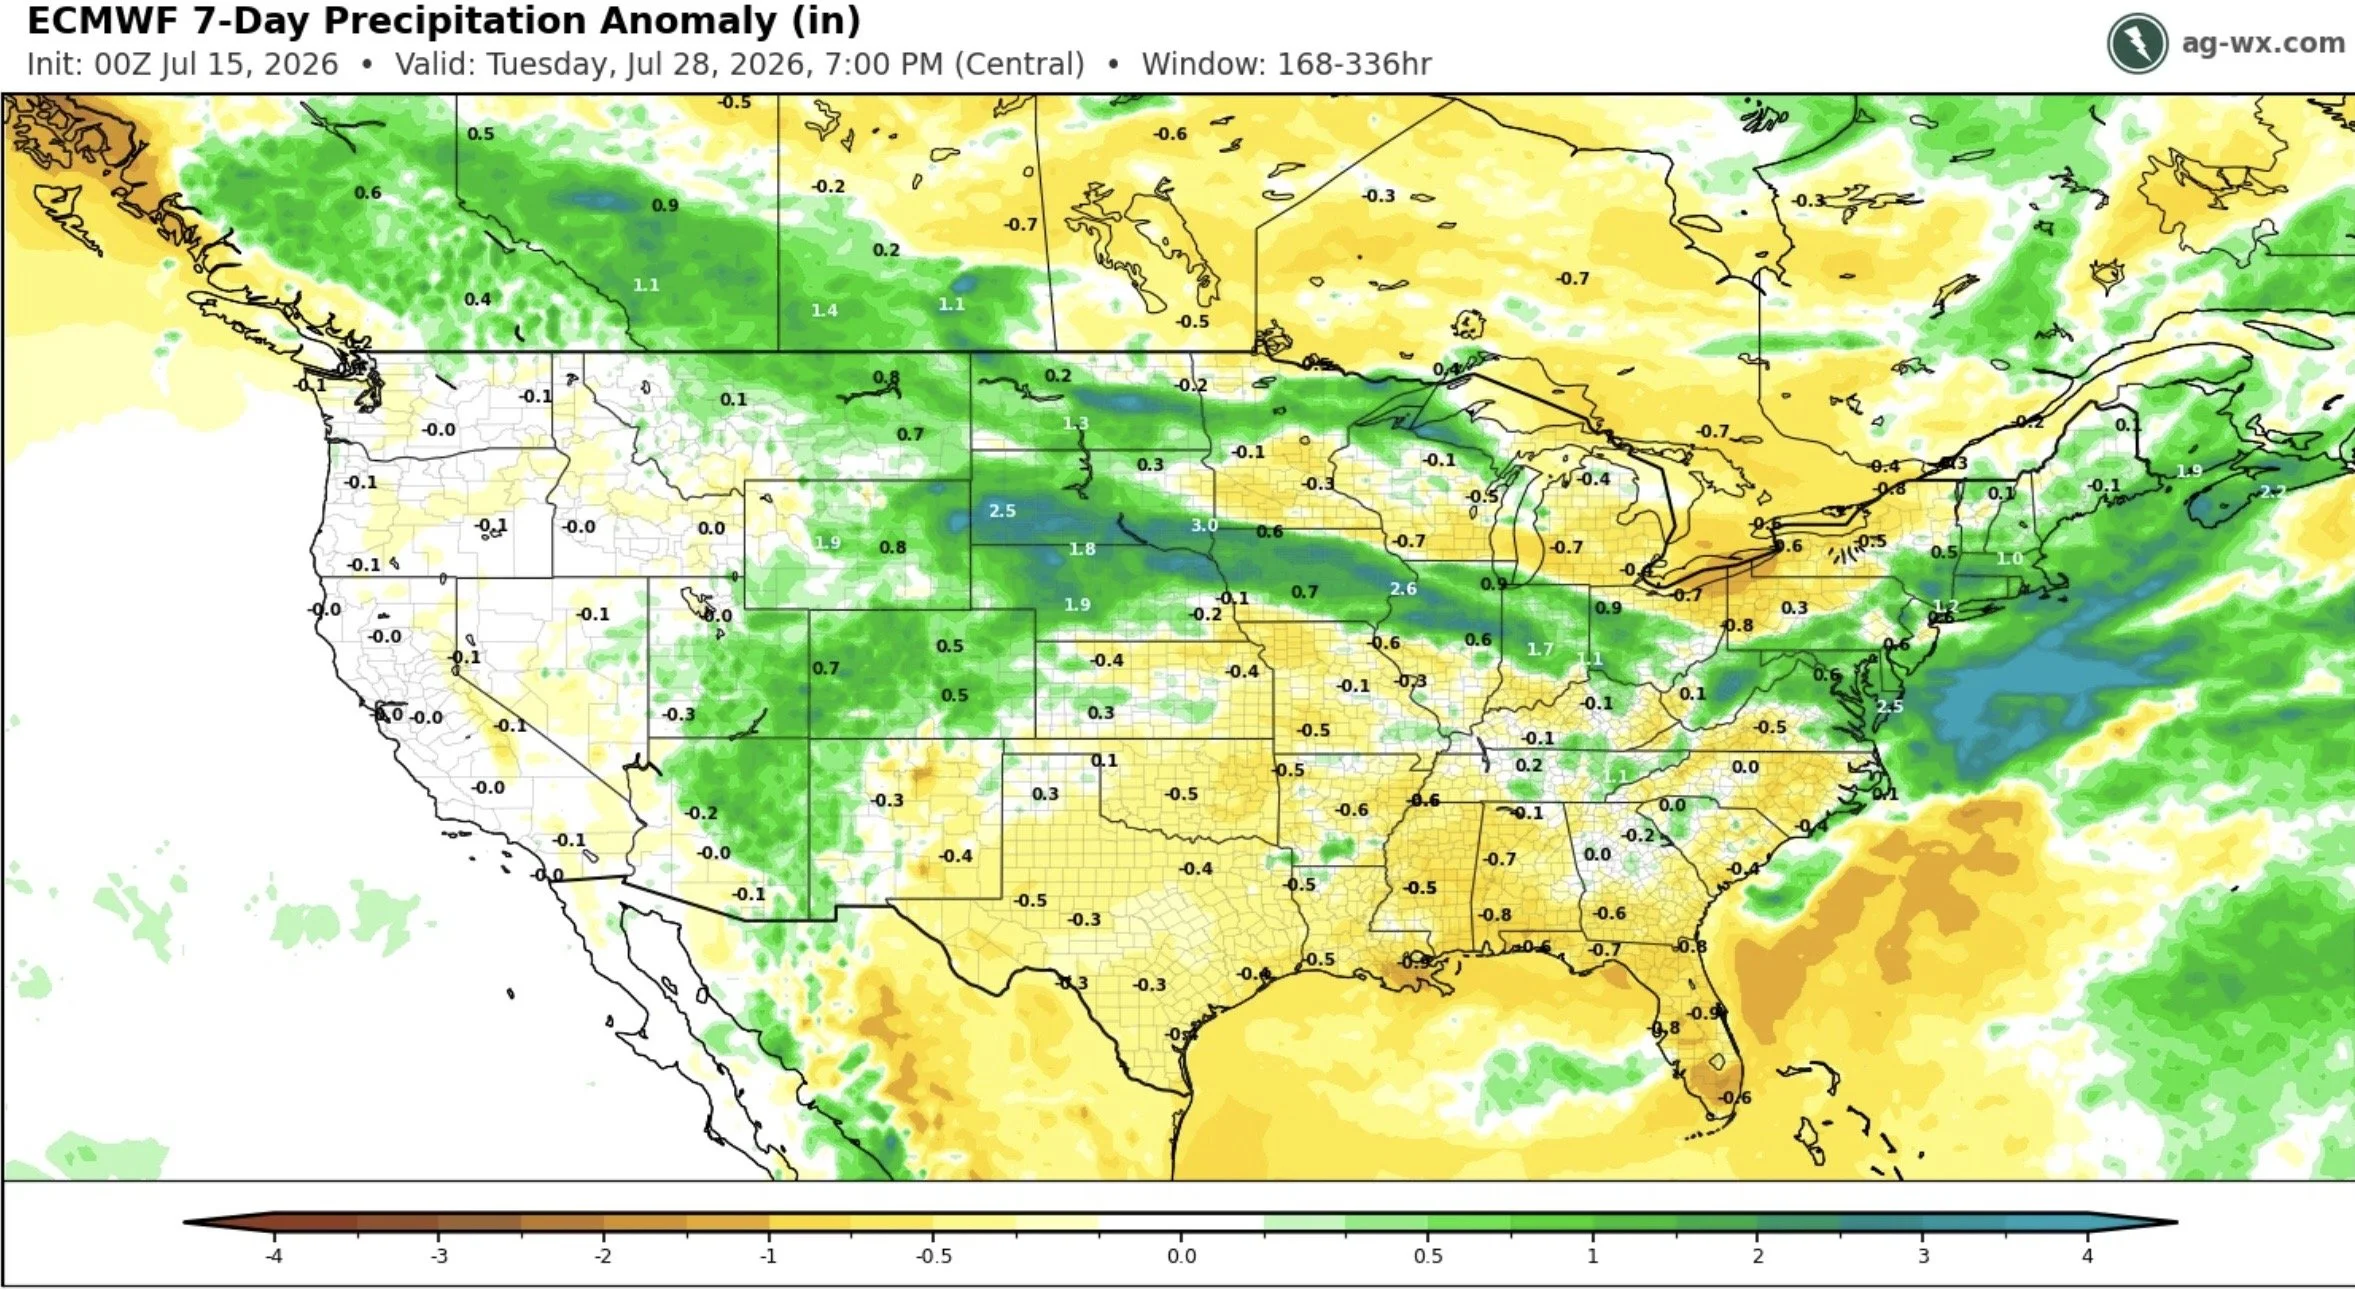
However, there is rain in the extended forecasts. For 7-14 days out.
0-7 Days
7-14 Days
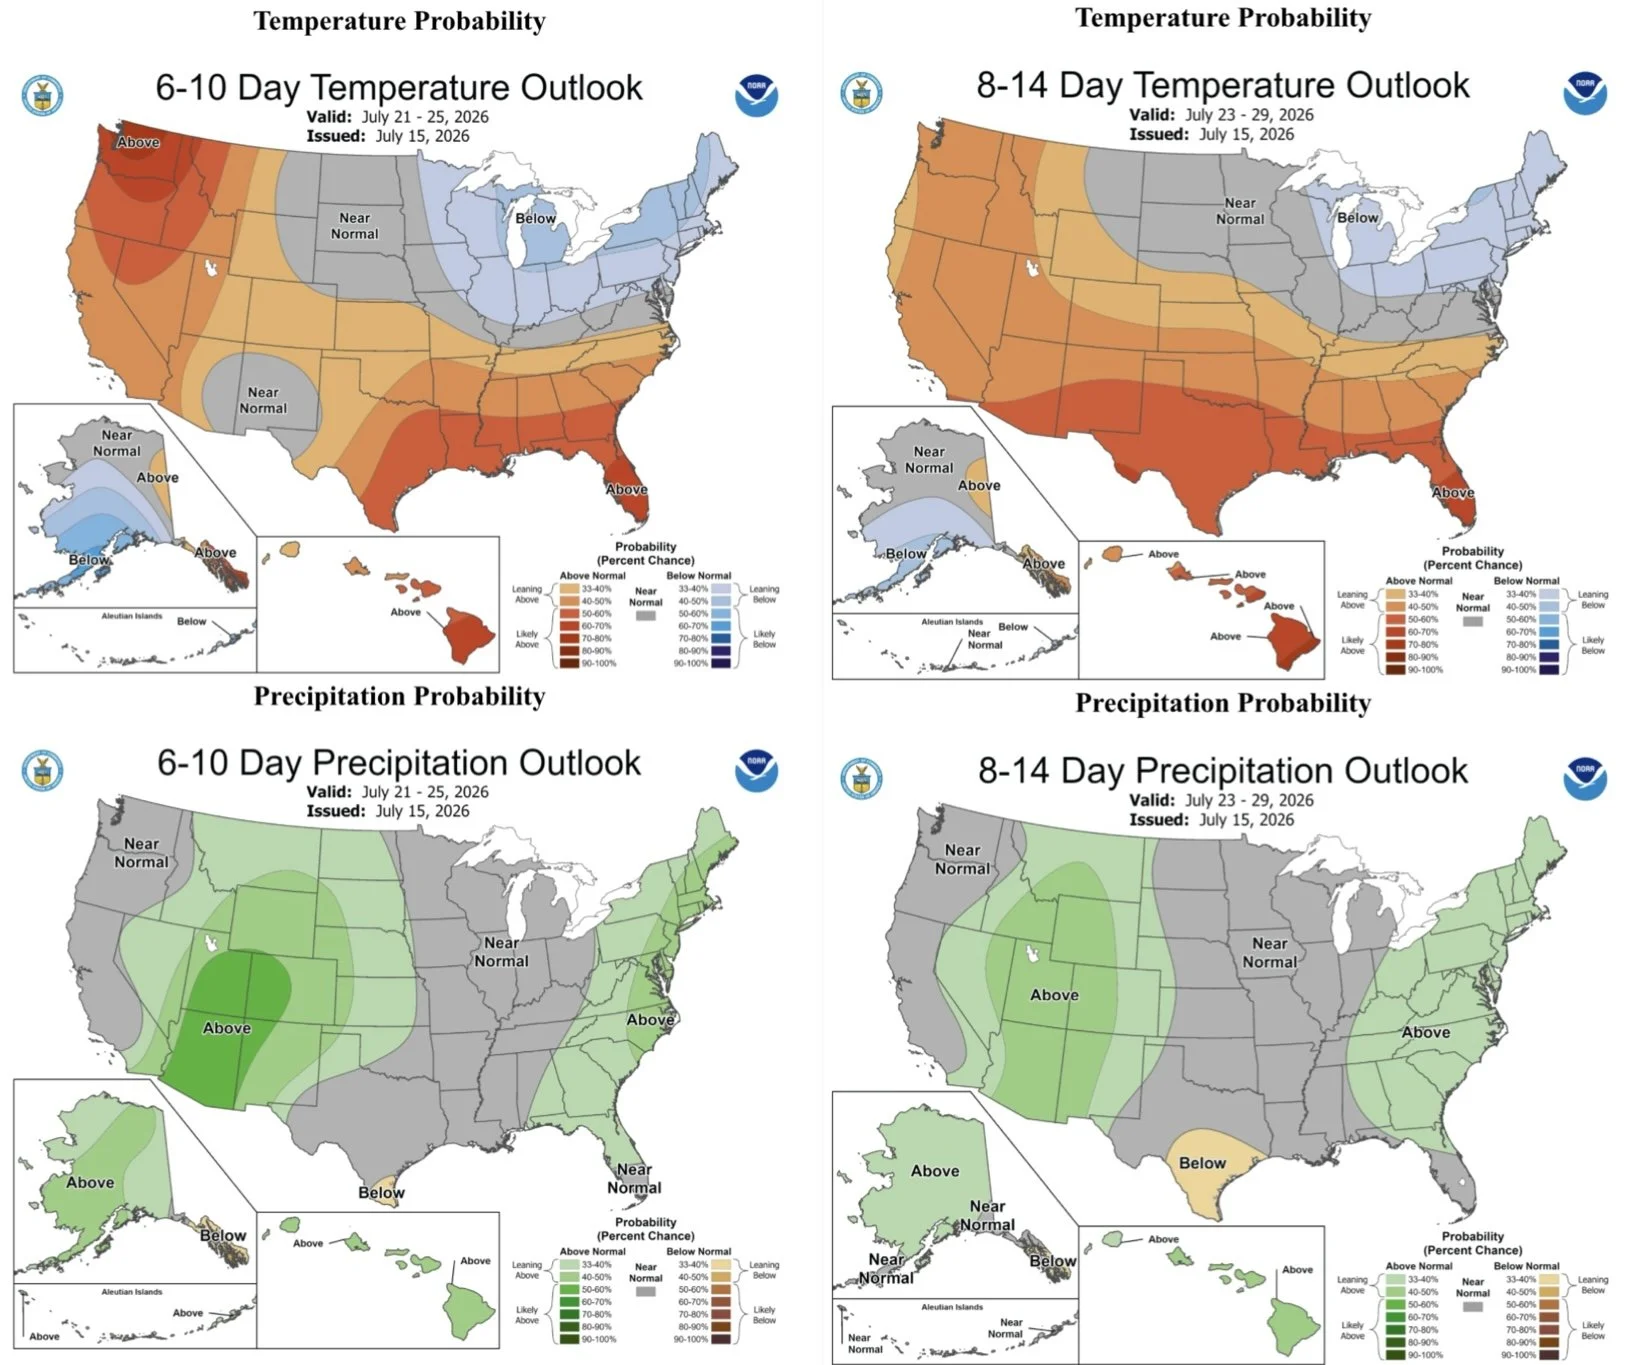
Here is the NOAA 6-10 day and 8-14 day outlooks.
So weather doesn’t look extremely threatening right now.
However, if wheat continues to rally.. it's hard to bearish anything related.
Even if weather isn’t scary. If wheat leads the way higher, the rest of the grains will likely follow suite.
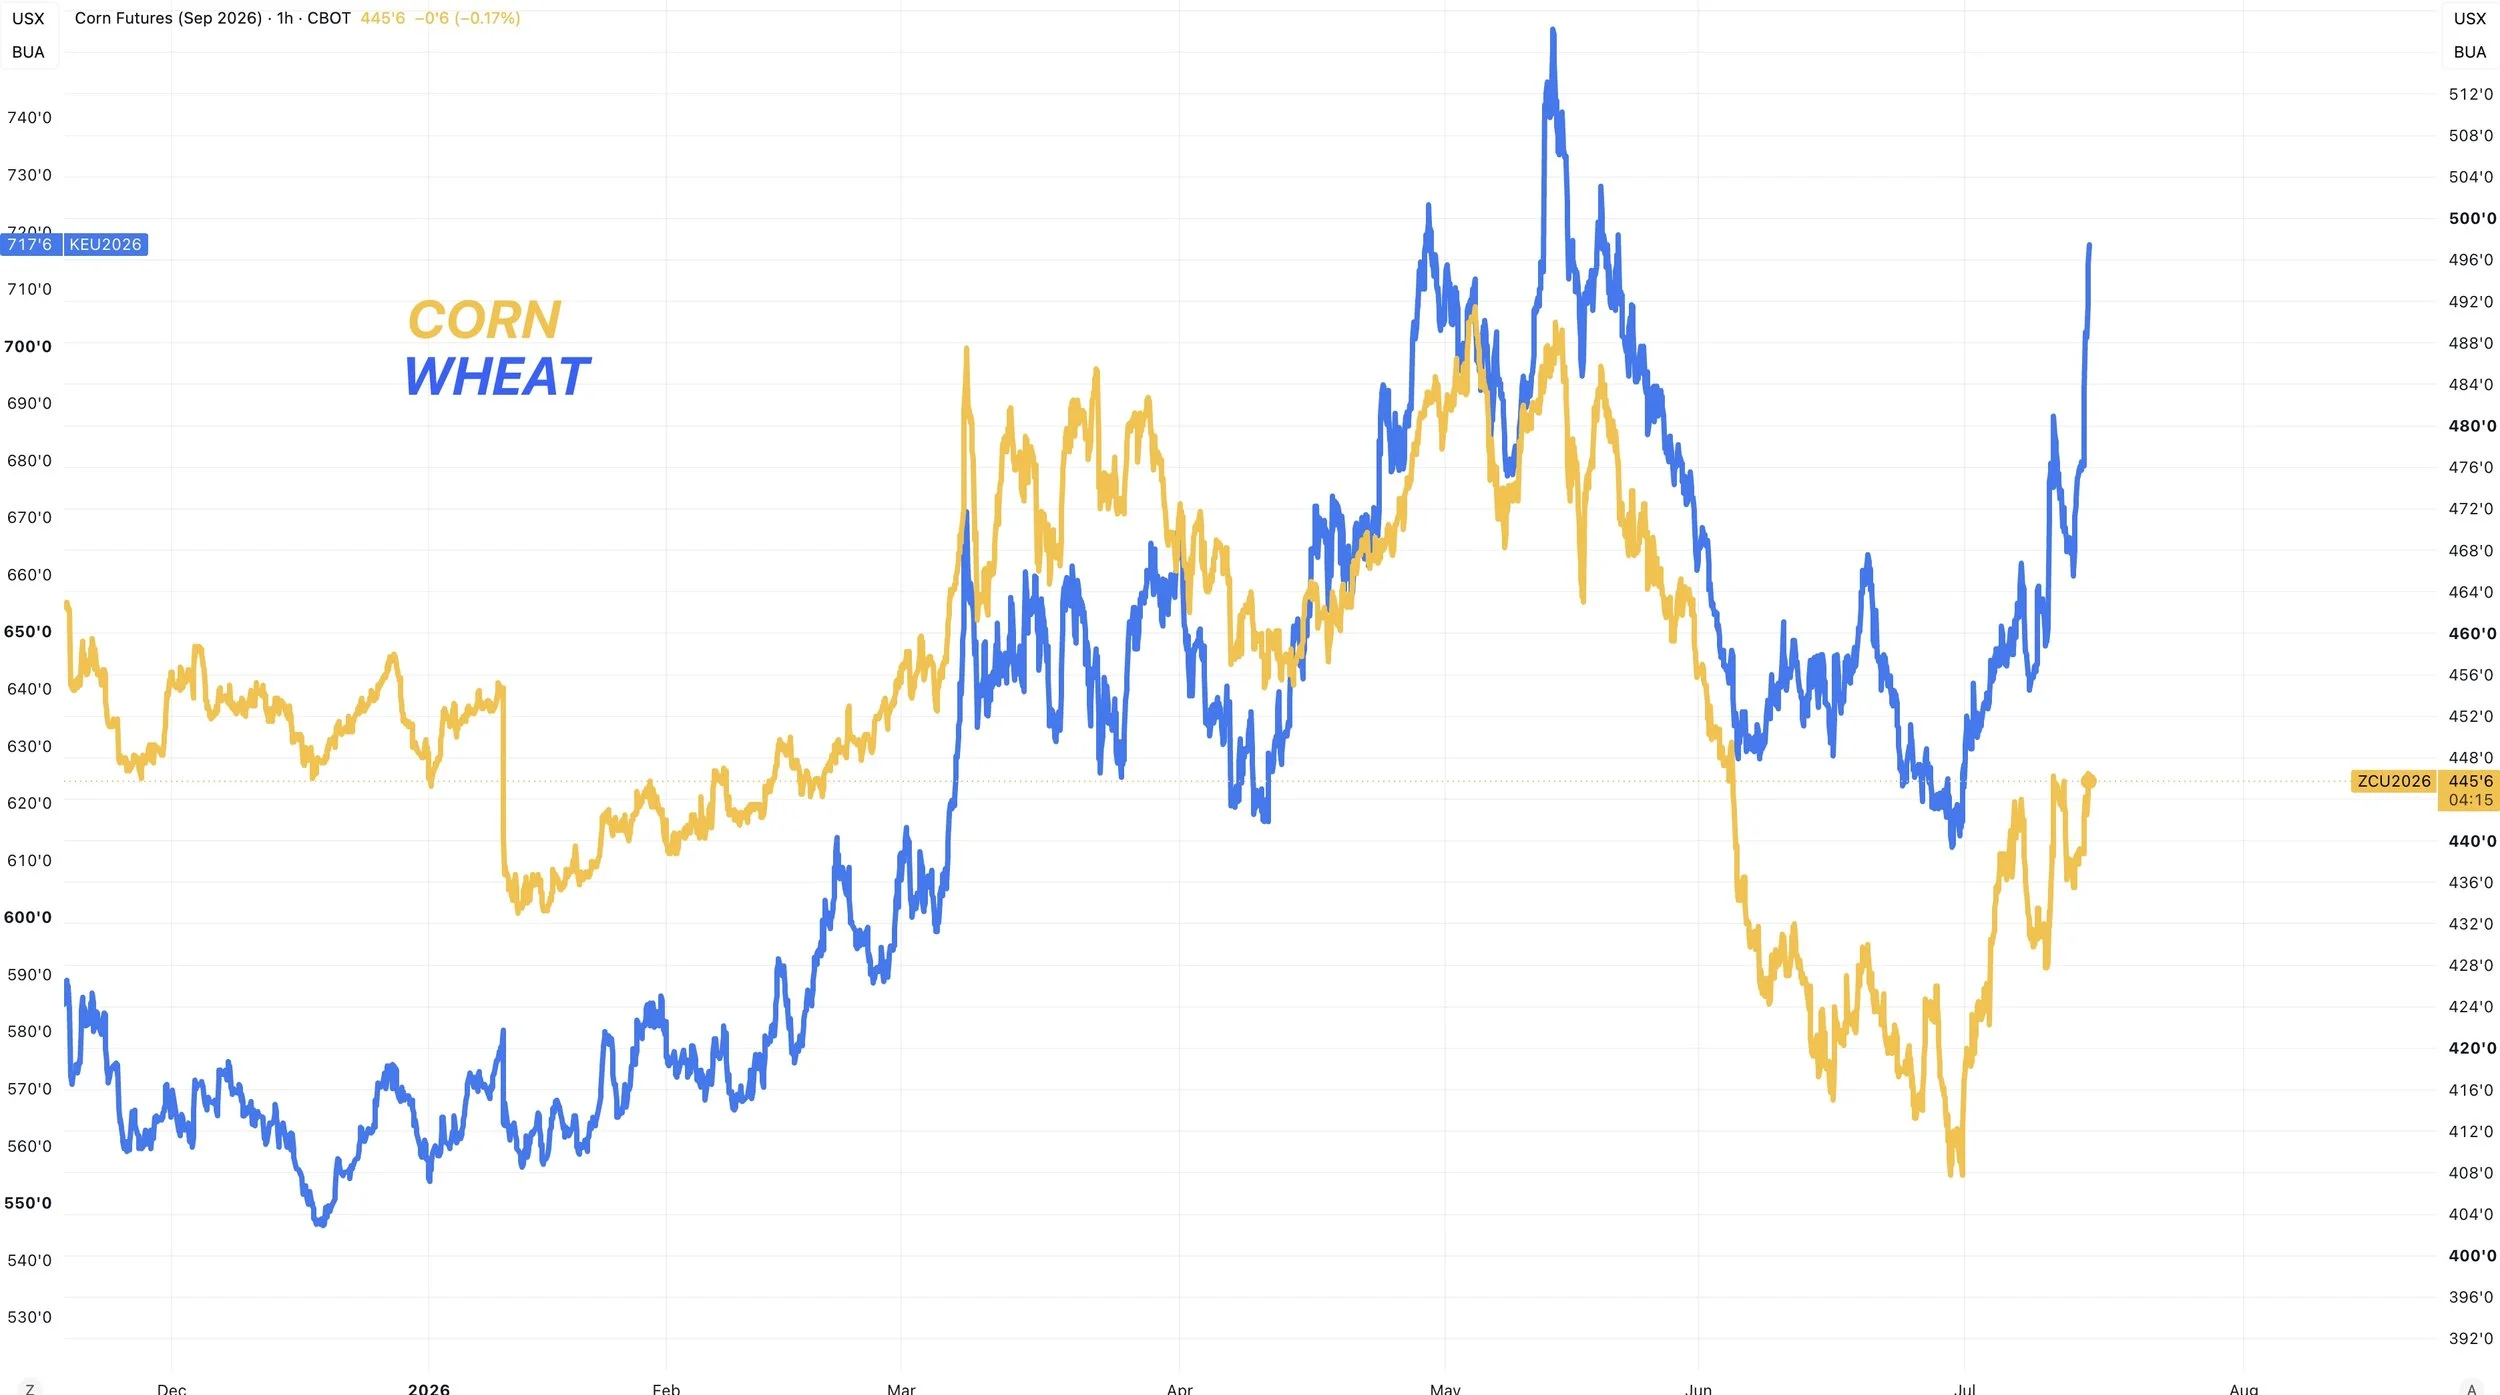
Here is a chart comparison of corn and wheat just for reference.
They do directionally tend to move in tandem.
Wheat can often be a leader when it comes to moves both to the upside and downside.
Long Term Structure
The next thing I wanted to look at today is whether the long term structure across the grains is higher or lower. So let's zoom out on the charts.
Wheat:
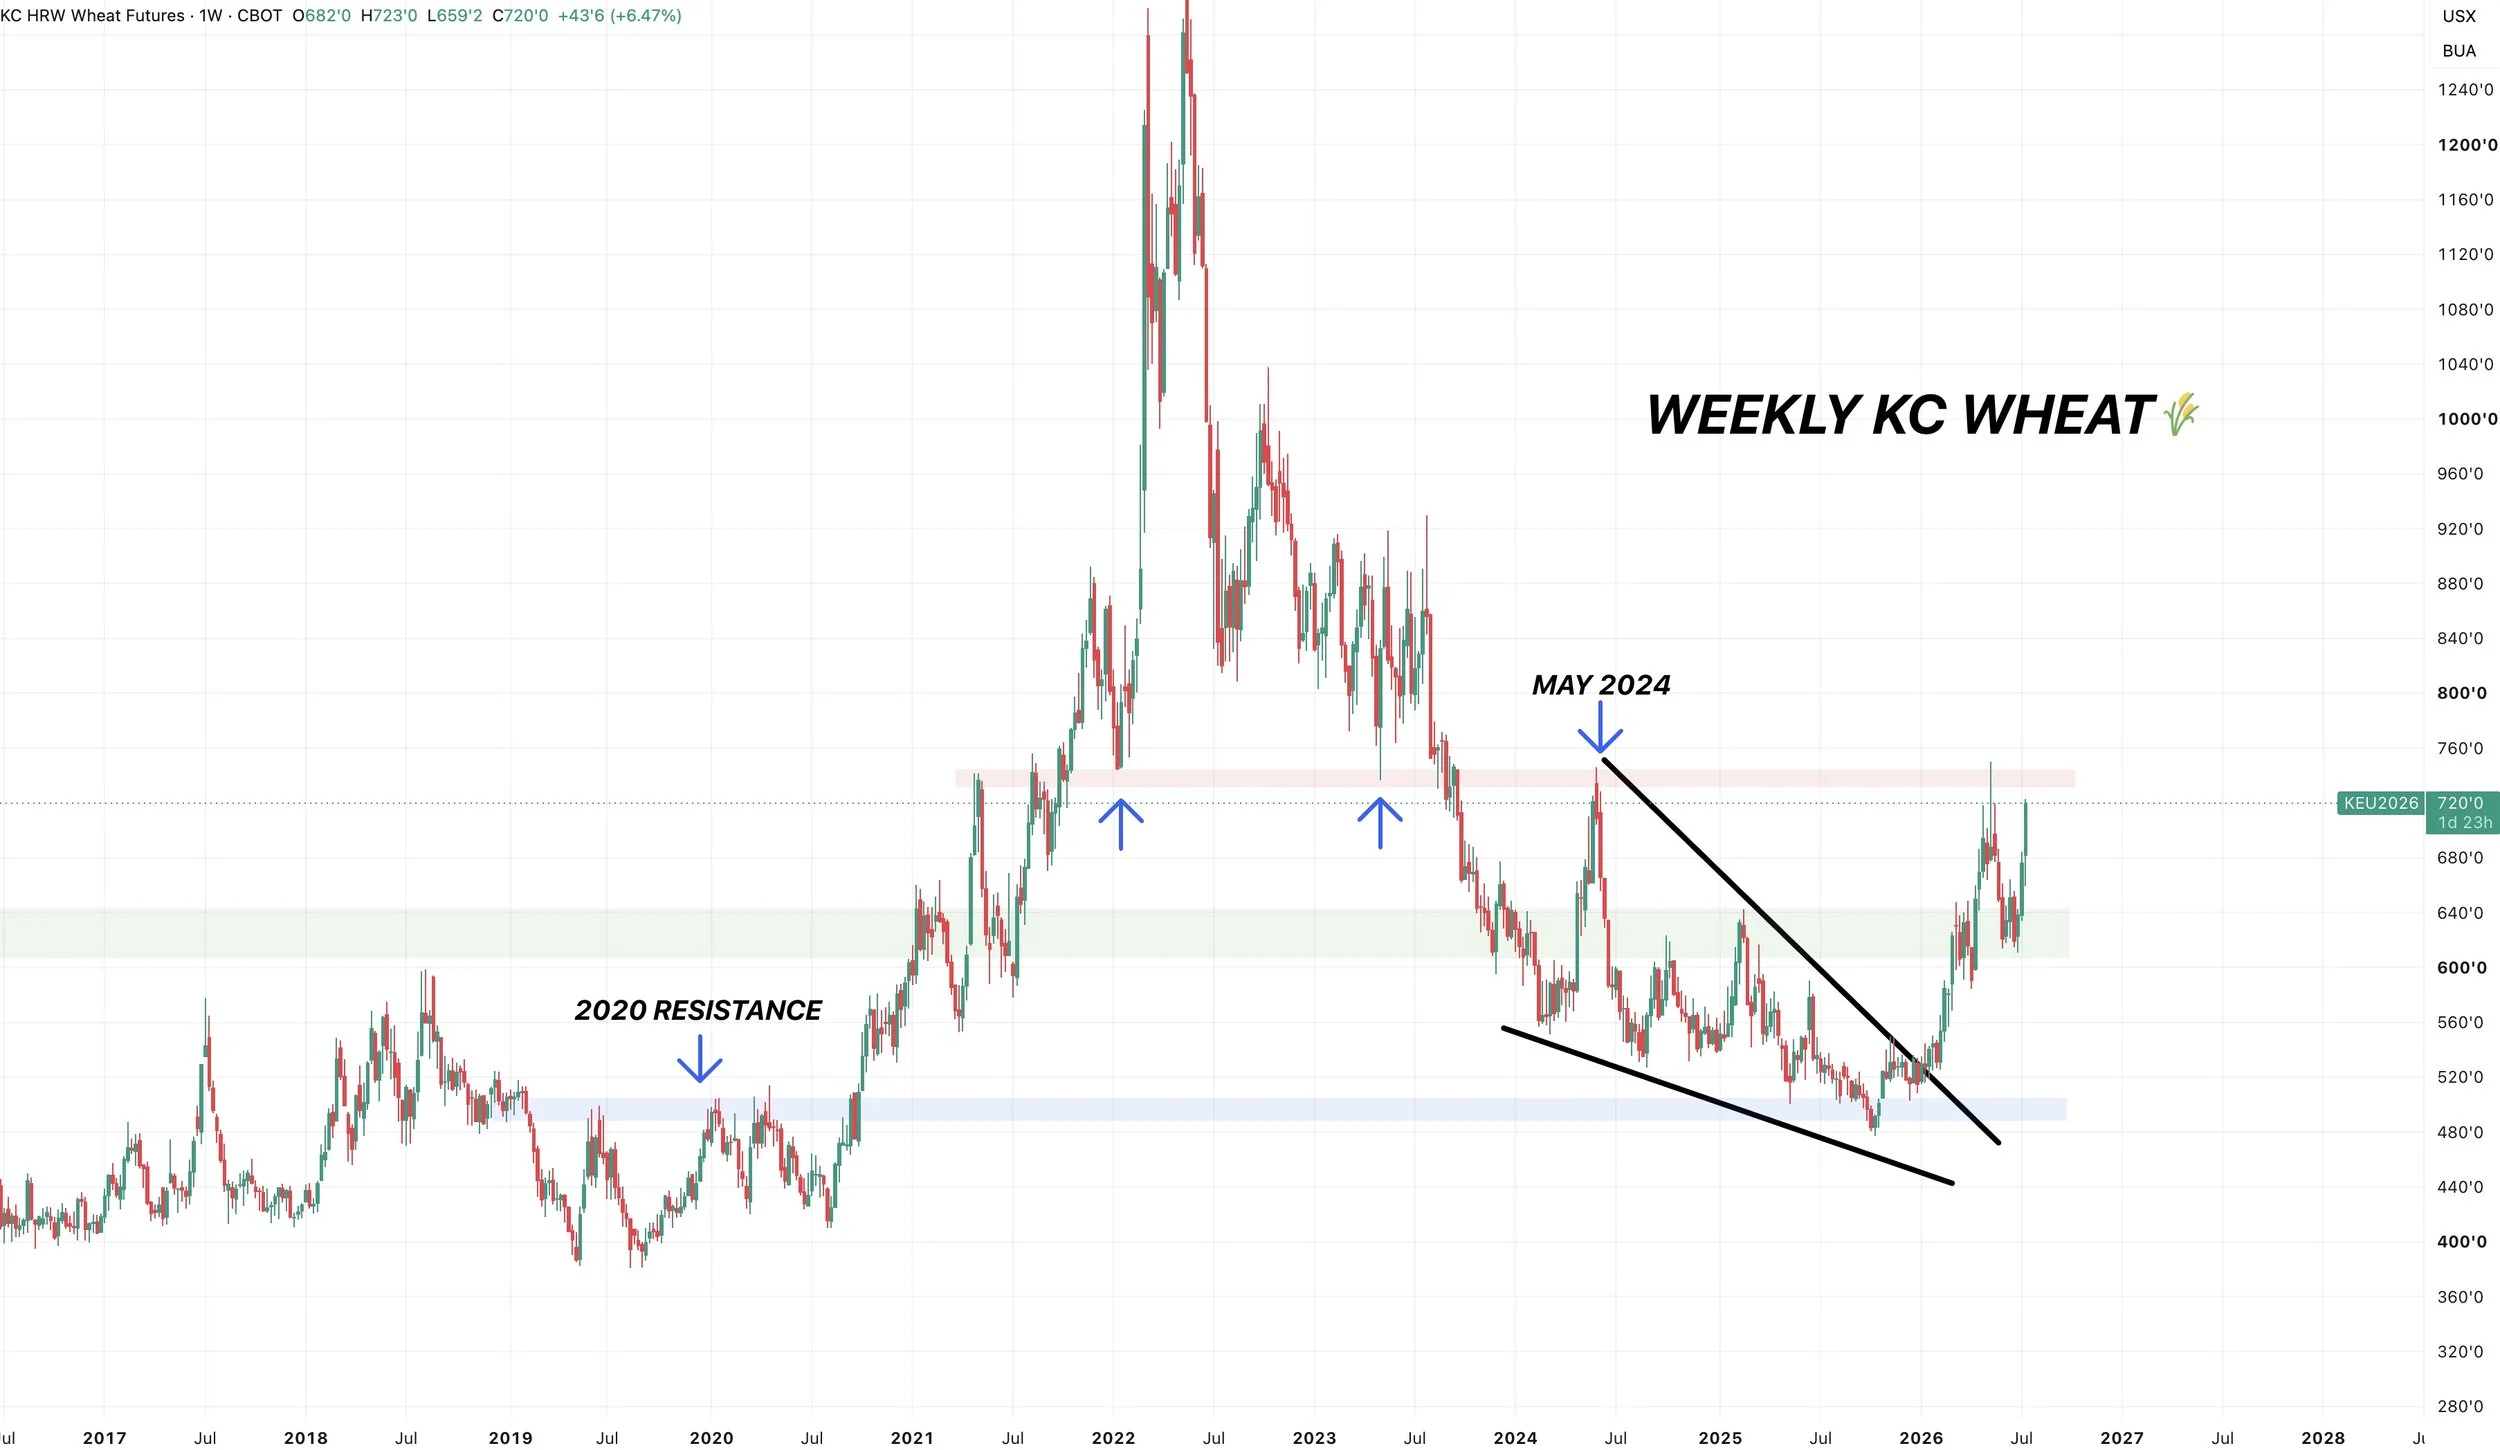
First for wheat.
This chart does not look bearish to me and the overall trend is higher.
As I've talked about for several months, I think the wheat market has posted some major long term lows last year.
This is the first real rally we've seen during this entire bear market.
If you take out those recent $7.50 highs, there really is plenty of upside potential here.
That level is the recent highs, it's the highs from May 2024, it's the lows from 2022, and the highs from 2021. So it's a key level.
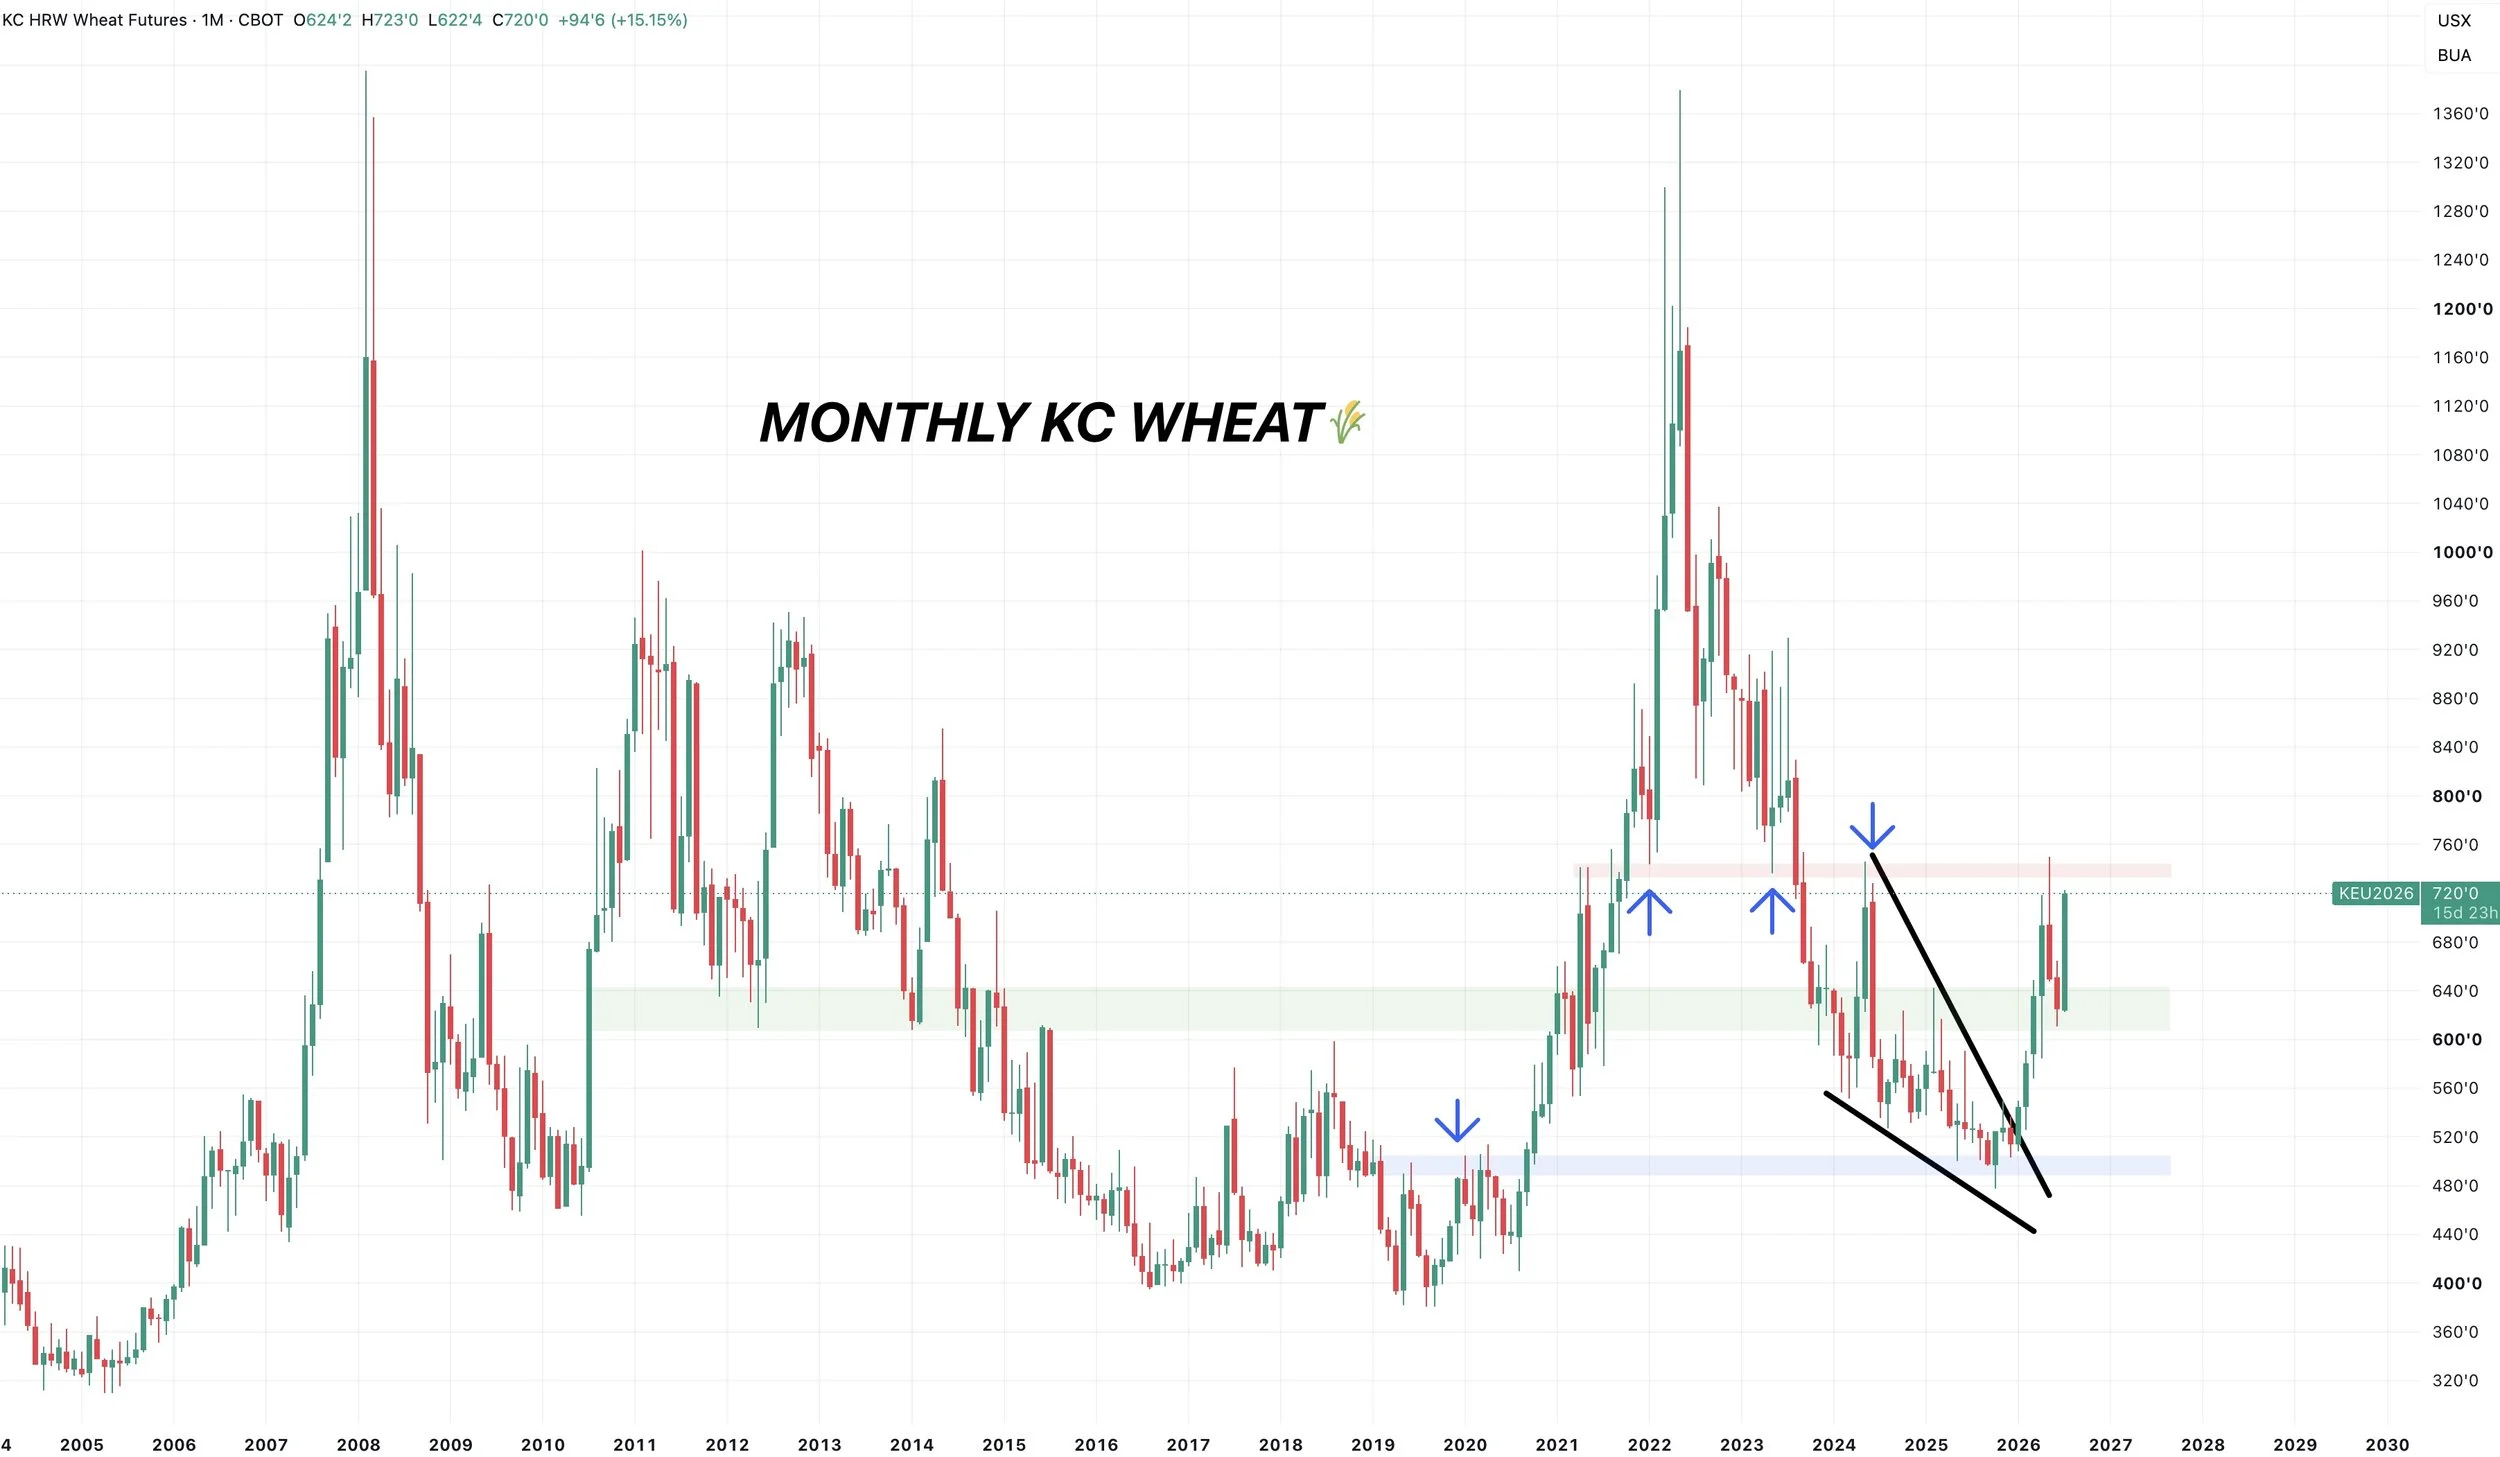
Here is the monthly chart to give you another perspective.
Again, there is upside potential if we ever break above those highs.
Soybeans:
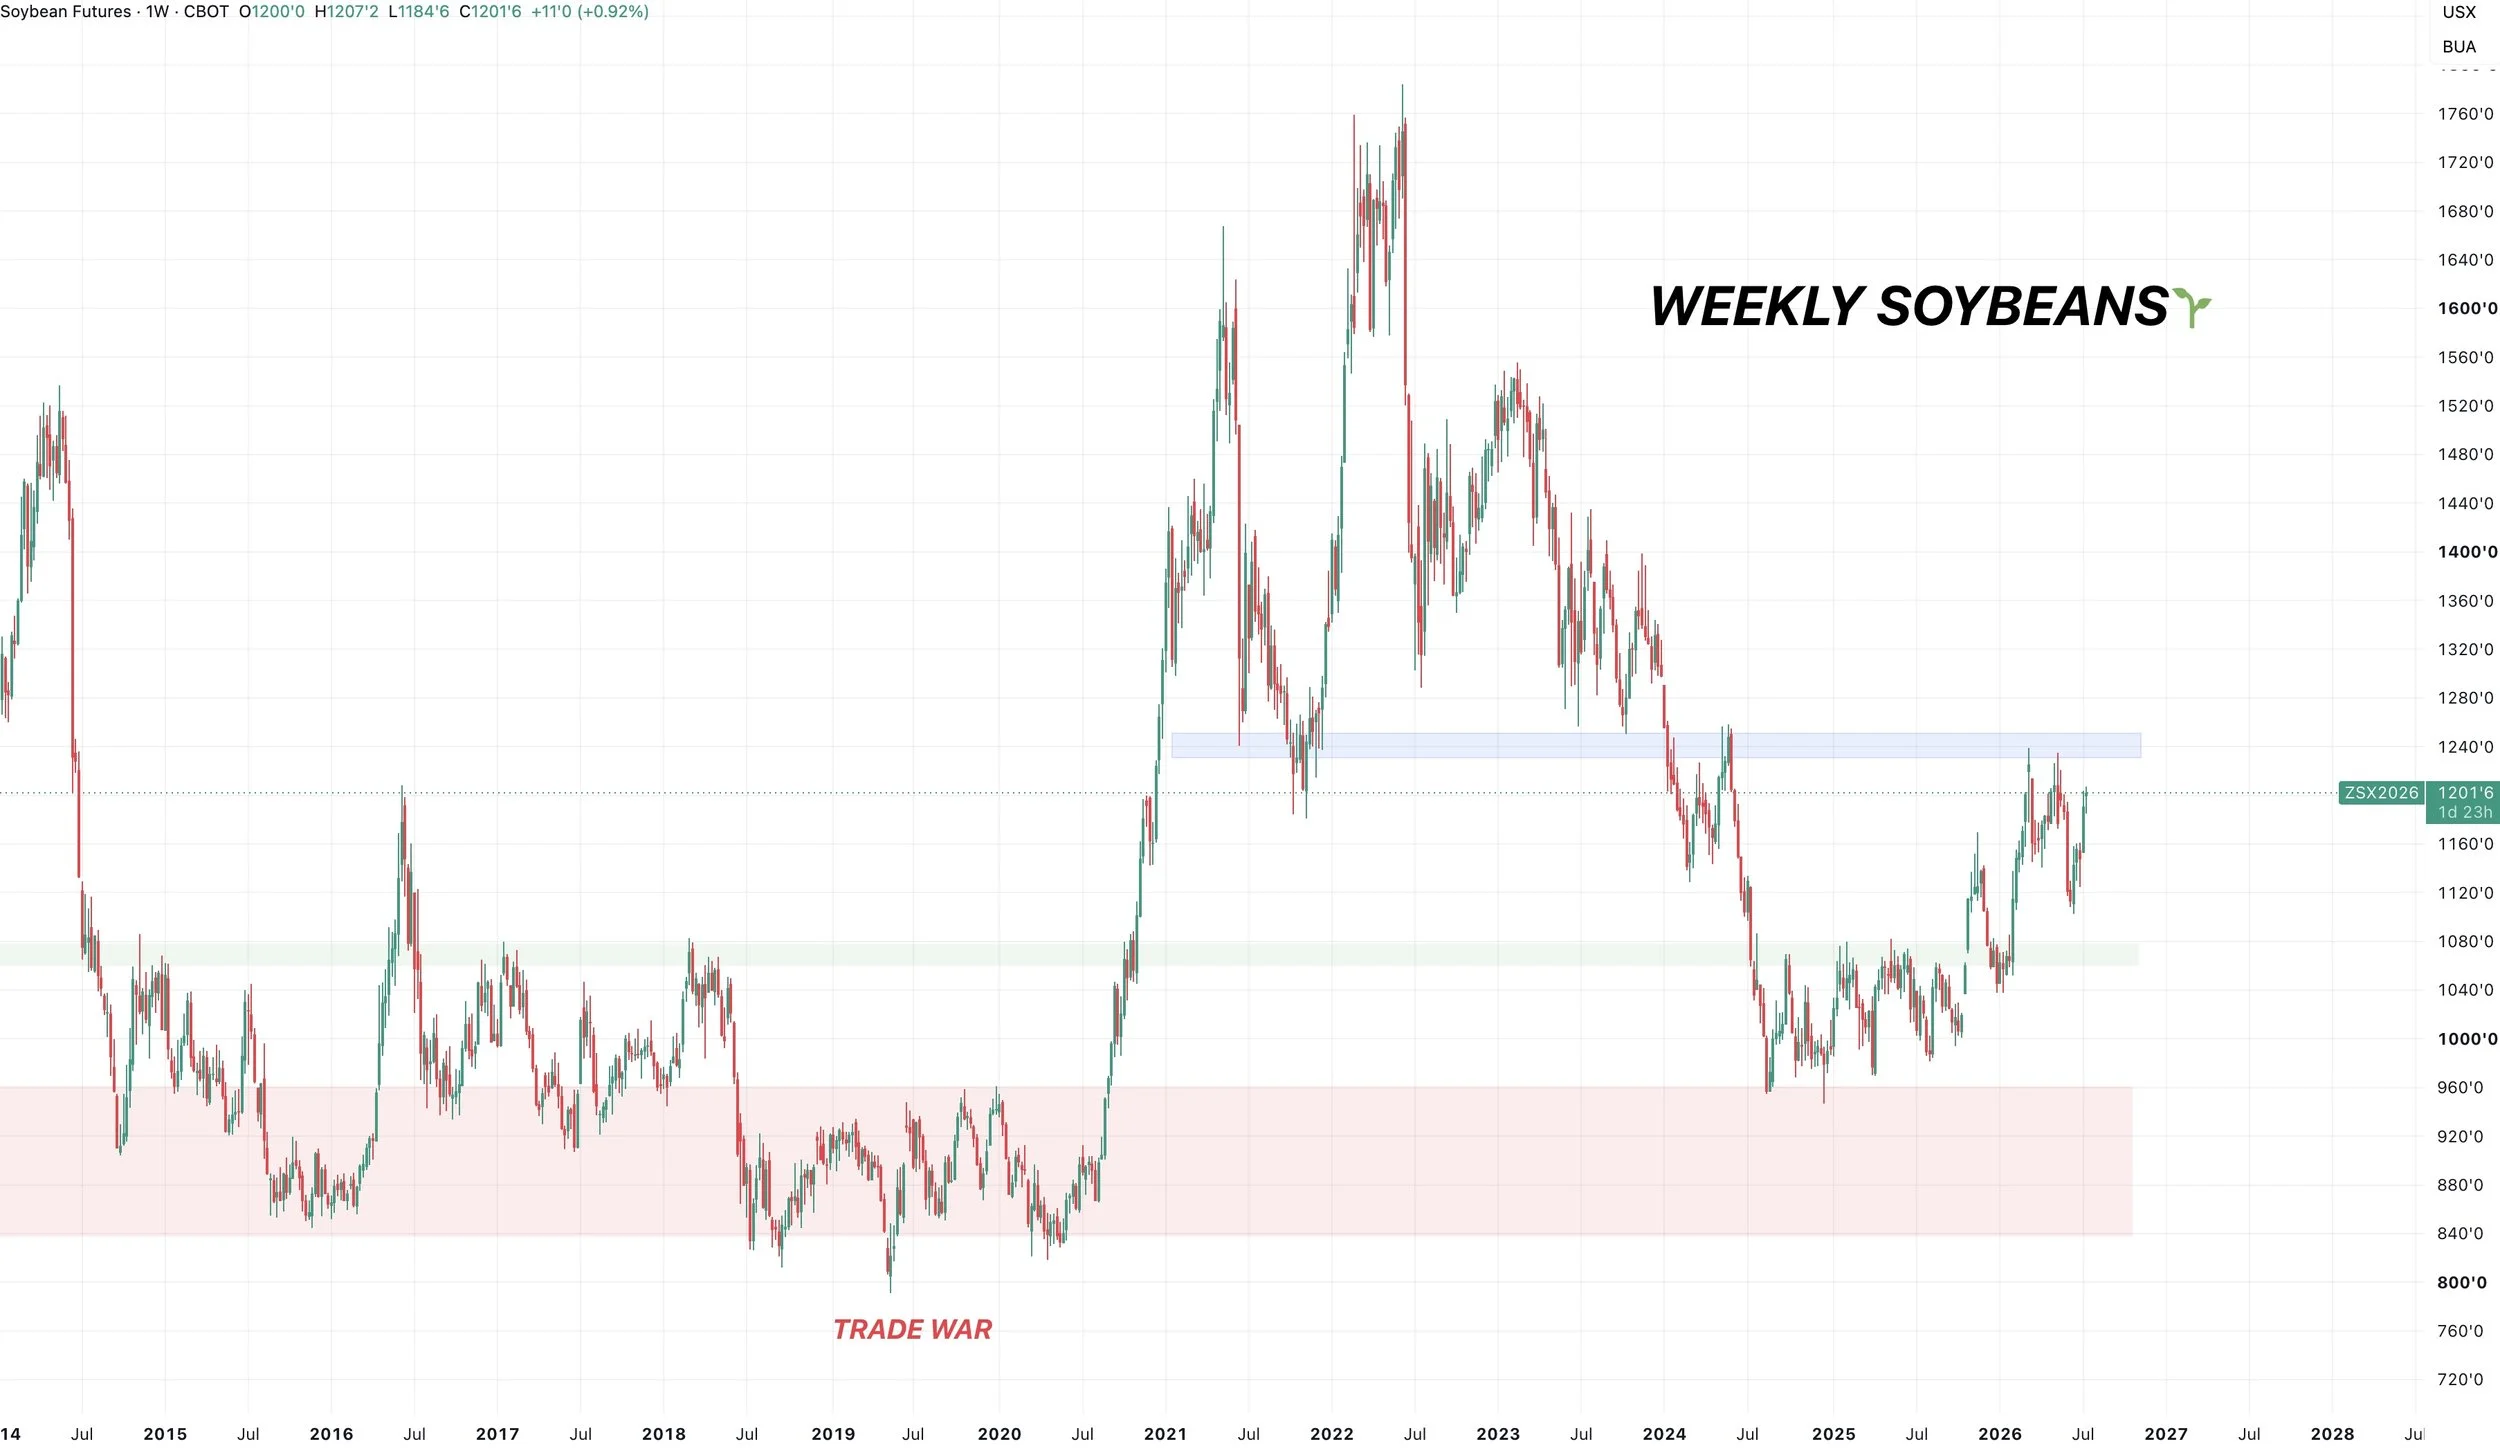
Next for soybeans.
This chart is also not bearish when taking a long term approach.
We have posted what looks like some long term lows.
Finding our bottom right at the highs from the trade war.
We've printed our first set of higher highs the entire bear market. We have a healthy trend higher. We are well above where we were last year.
If we take out those recent highs, there is plenty of upside potential here as well.
It's where we recently topped. It's also the highs from 2024 and lows from 2021.
Corn:
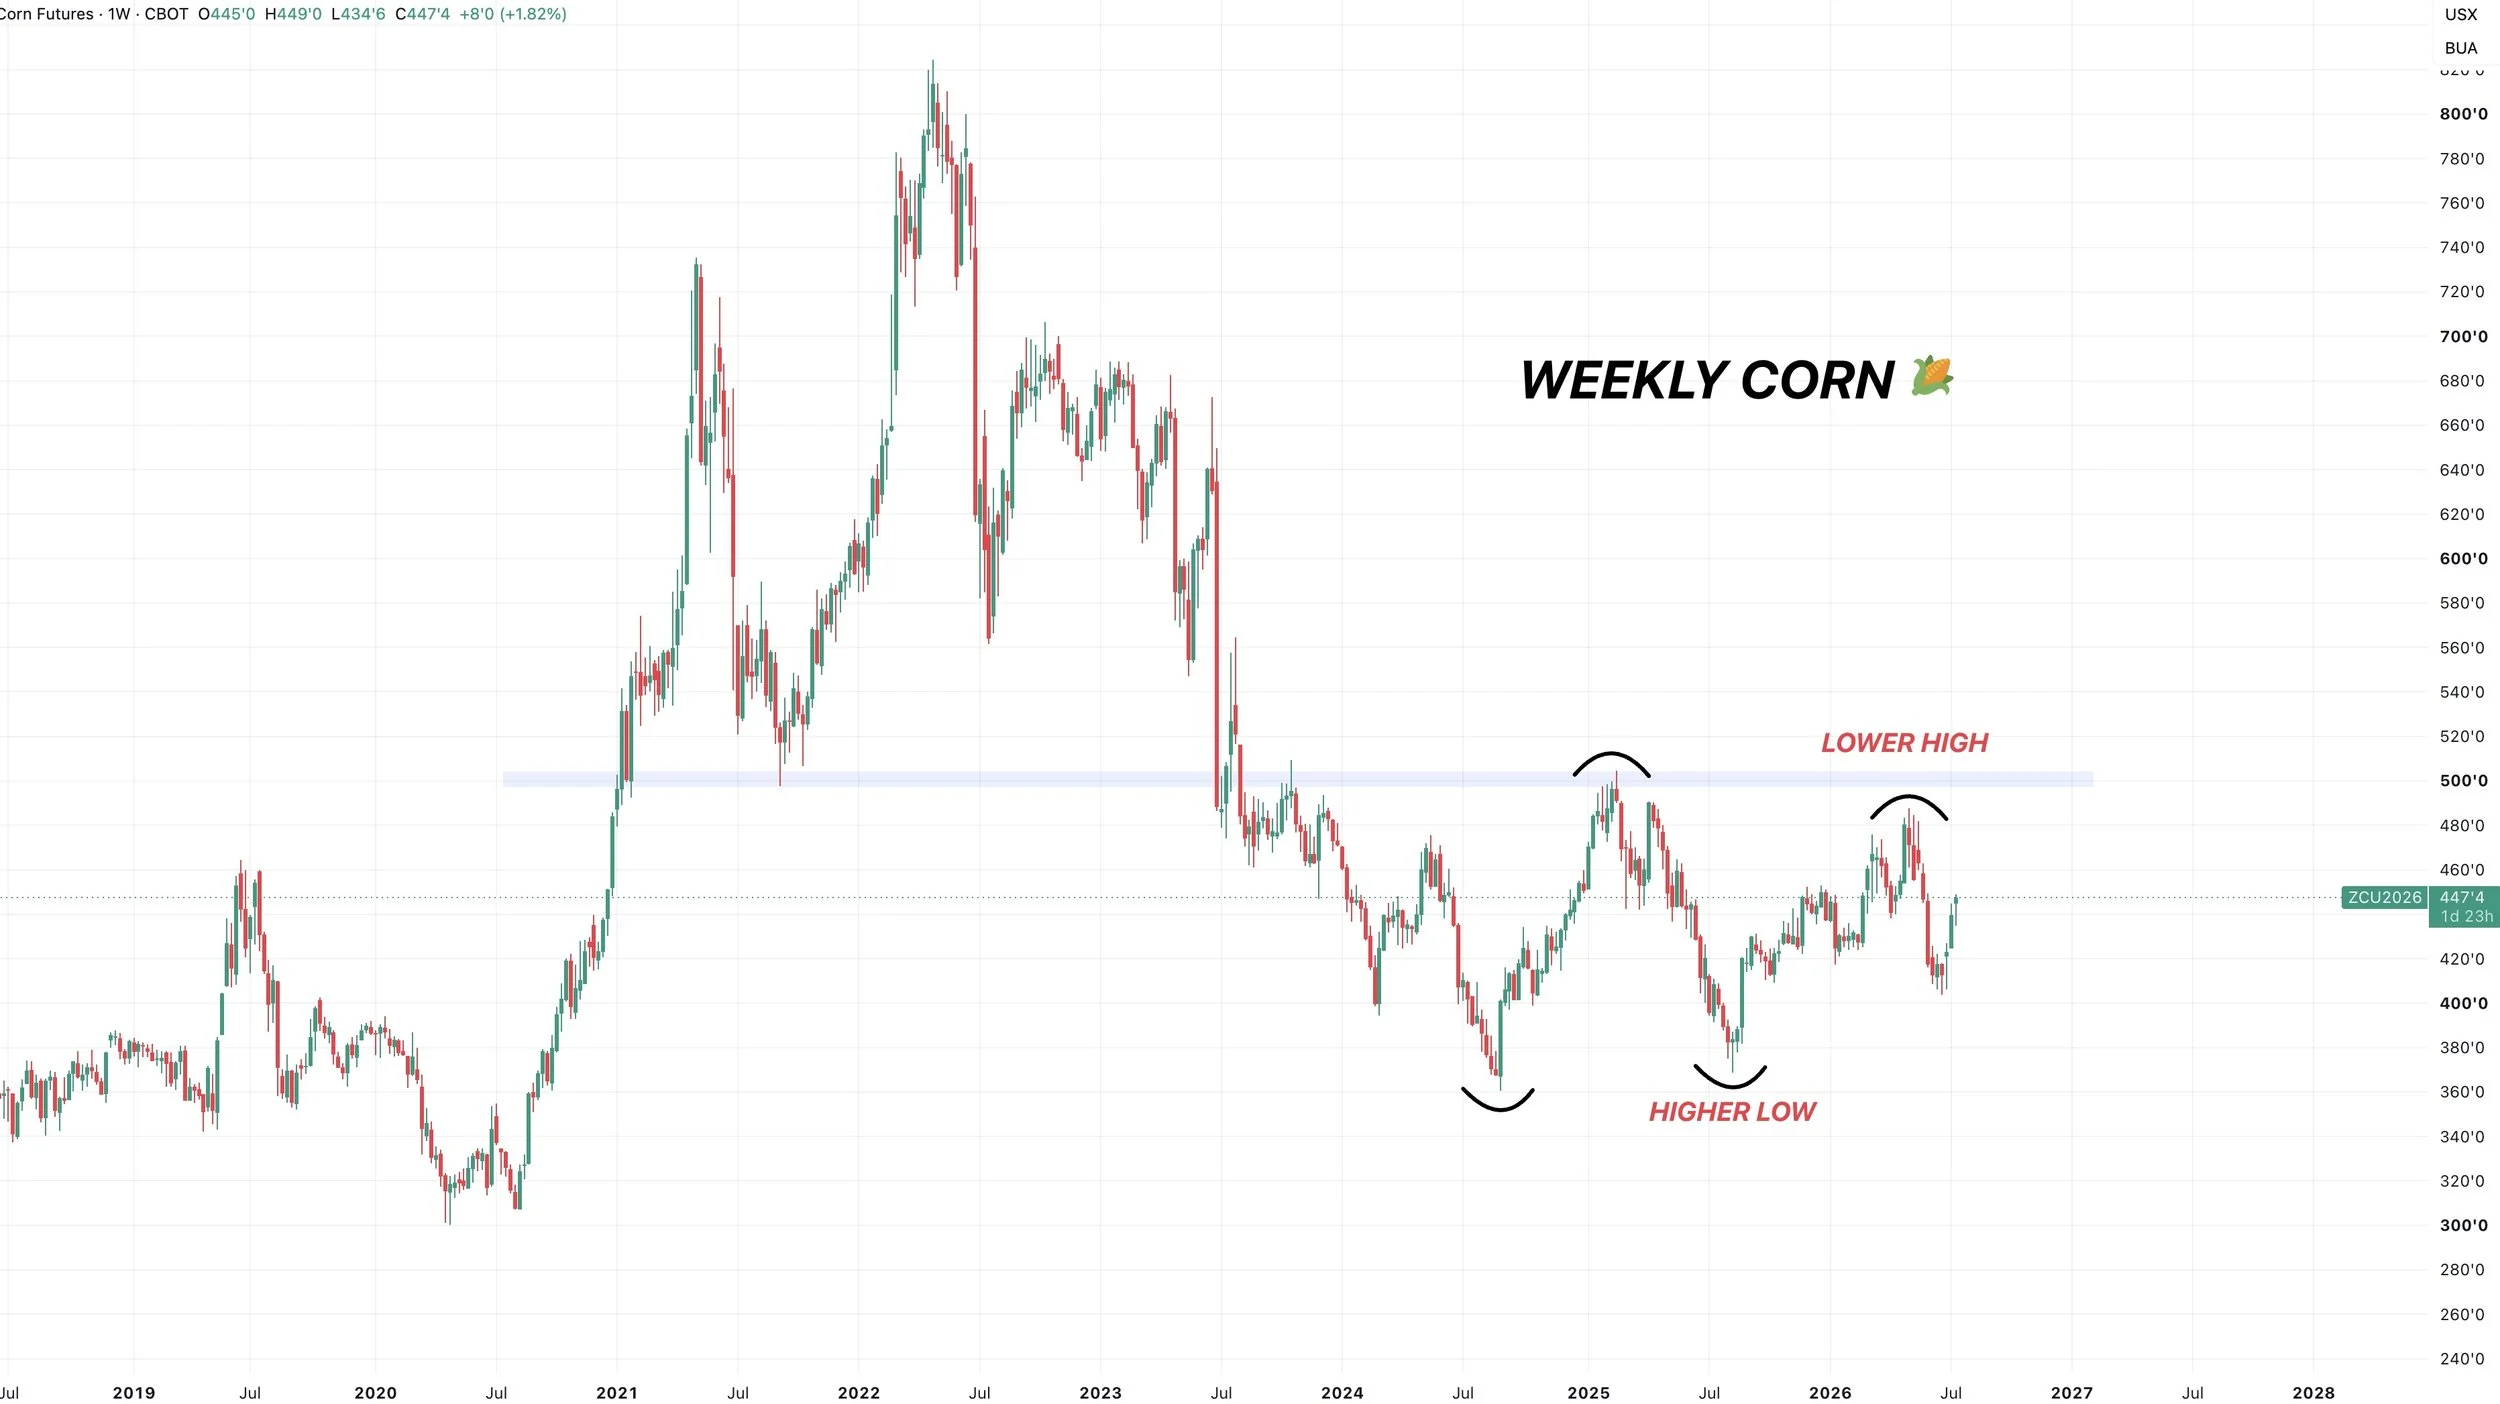
Lastly for corn.
This is the only one who has not fully entered into what I would call a long term uptrend.
Unlike in both wheat and soybeans, we have not yet posted a higher yet.
Last year we posted a higher low, but this year we also printed a lower high.
The high this year, was lower than the high last year.
However.. if corn takes out $5.00 it would look like the big picture trend is offically higher and would offer plenty of upside potential long term.
That is where we topped out last year. It's also exactly where we bottomed back in 2021.
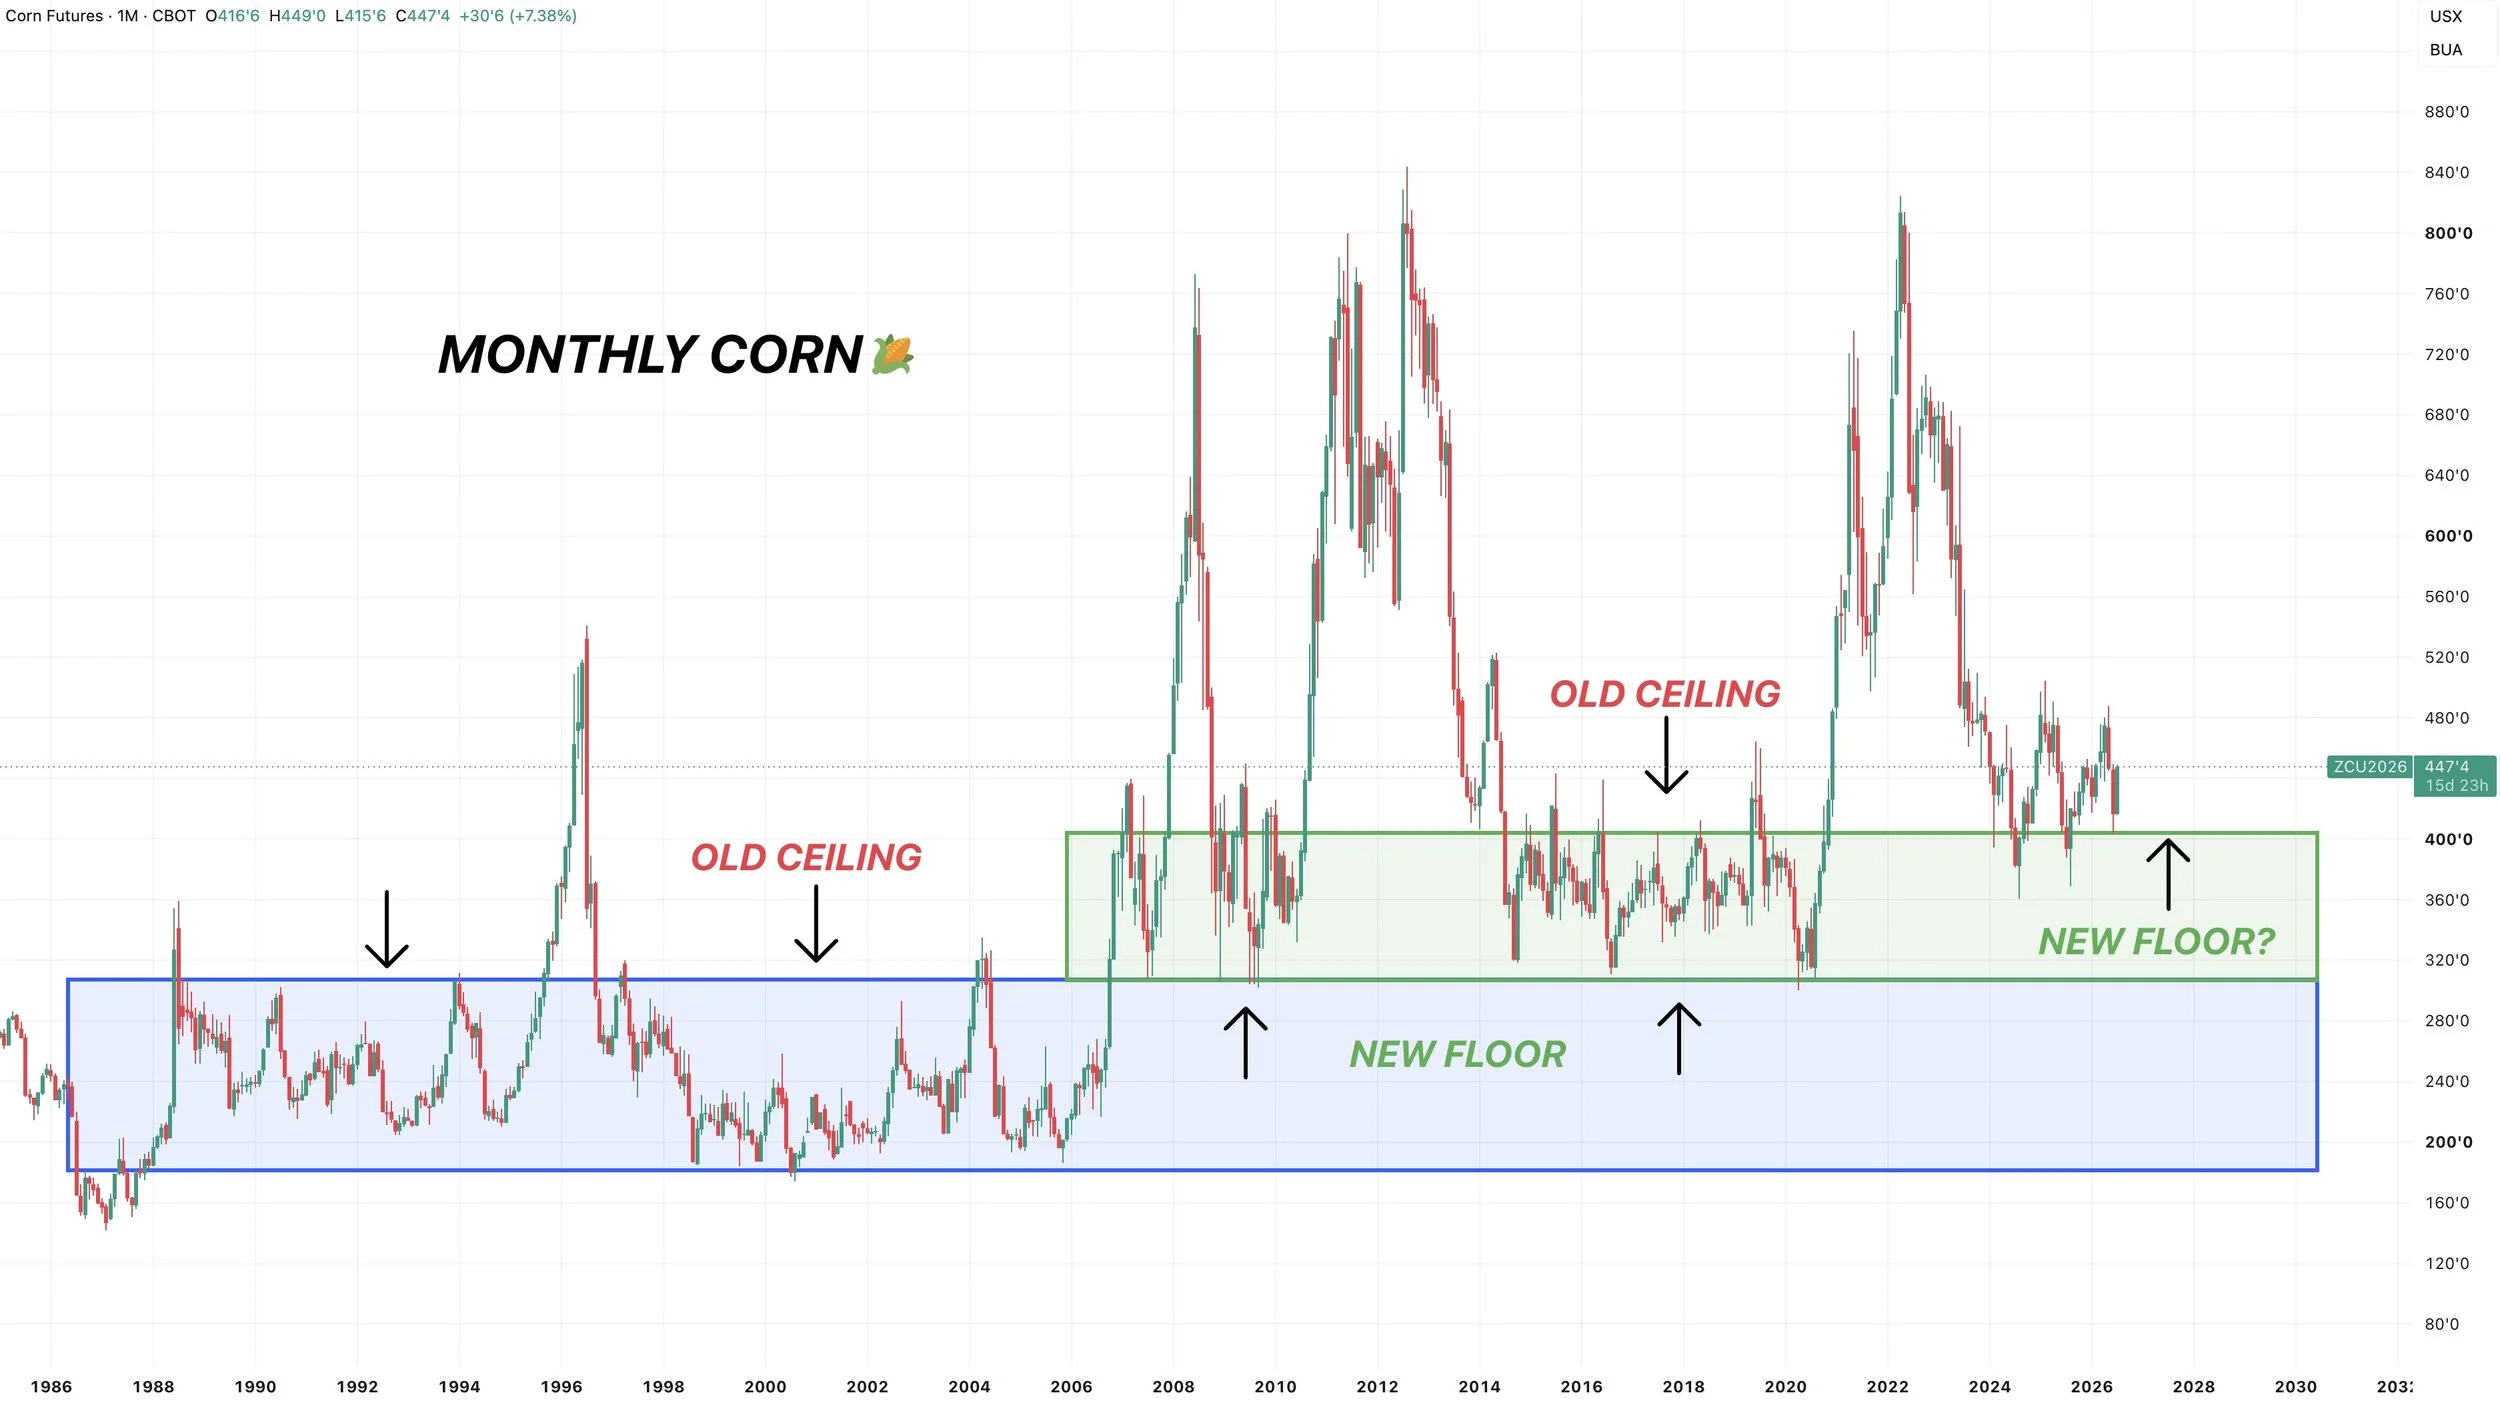
If we zoom out further. I do think we have a new long term floor around $4.00 or so.
Which was our ceiling during the 2014 to 2020 bear market.
Similar to how our ceiling in the 90's to 2000's became our new floor after breaking the range.
Today's Main Takeaways
Corn
Seasonally, the corn market tend to be weak heading into harvest.
If wheat continues to rally, and this Russia story continues, no that won’t matter.
However, it is still a reason to be cautious if you are someone who knows you have to move stuff off the combine etc.
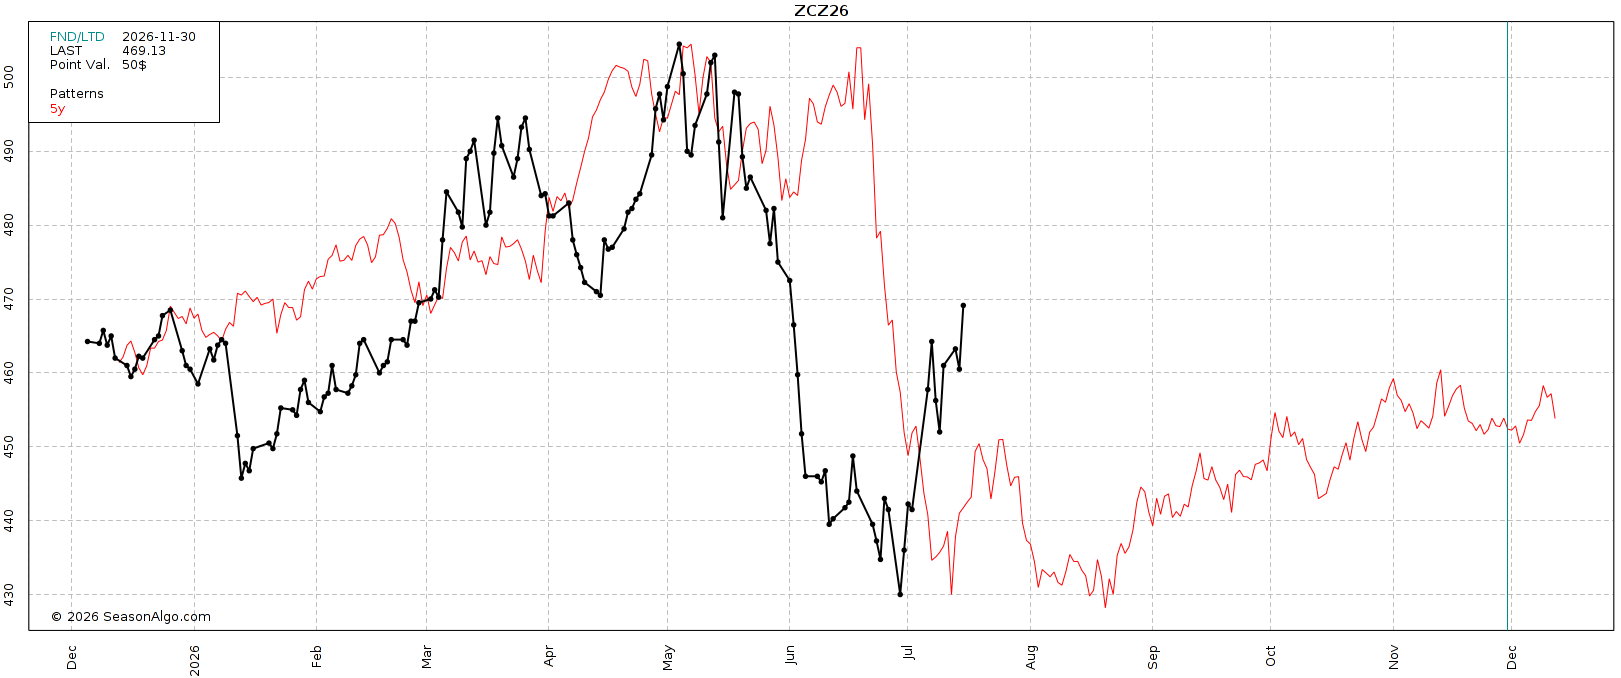
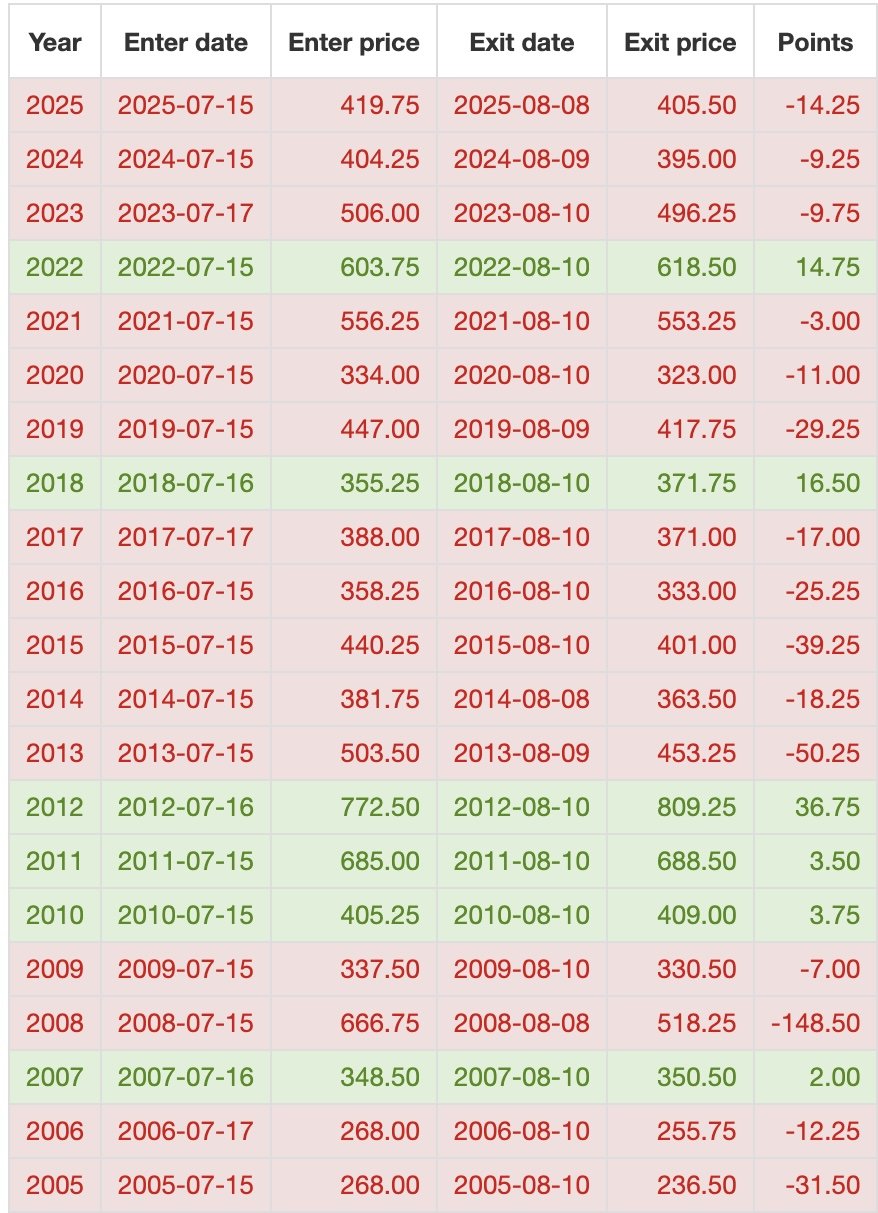
From today's date by August 10th, we have been lower the last 11 of 13 years.
Seasonals are not fortune tellers nor perfect. There are endless factors.
It's just something we want to keep in mind if you are someone who is in that situation where you need to be more aggressive or proactive due to lack or storage or cash flow etc.
We prefer to use puts as it allows you to keep your upside open while locking in a worst case scenario.
If you want to talk about your specific situation give us a call or text.
Office: (806)484-1214
Short term I am cautious. As weather looks like it's going to cool down and seasonally we do still head lower over the next month or so.
But maybe wheat can save the day. As if wheat keeps going higher, I can’t imagine corn goes lower.
Long term I am bullish.
I am talking late this year and into next year. I think there is definitely a possible story.
I shared this chart the other day as well as on social media.
It shows our stocks to use ratio vs front month corn's highest price of the year.
I threw on last months stocks to use in red, and the updated stocks to use in yellow.
The USDA just put our new crop stocks to use ratio at 11%.
To get corn above $5.00 and into bull market territory, that needs to drop down to 10% or lower.
Which is what happened the last two bull markets.
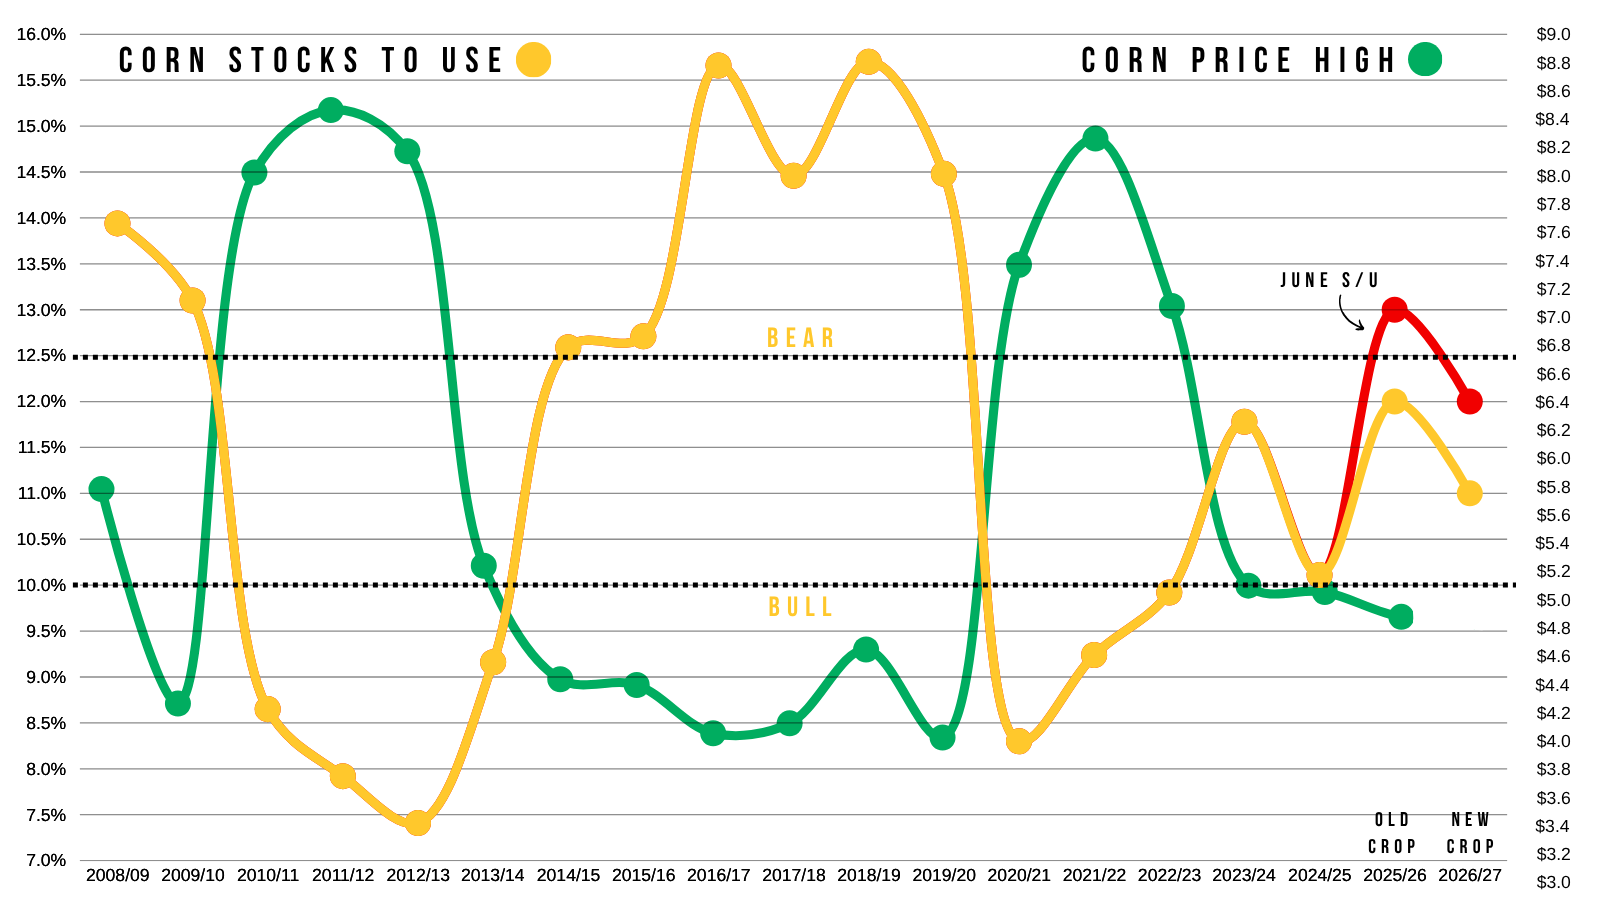
An 11% stocks to use is not "bearish" but it's not "bull market bullish" either.
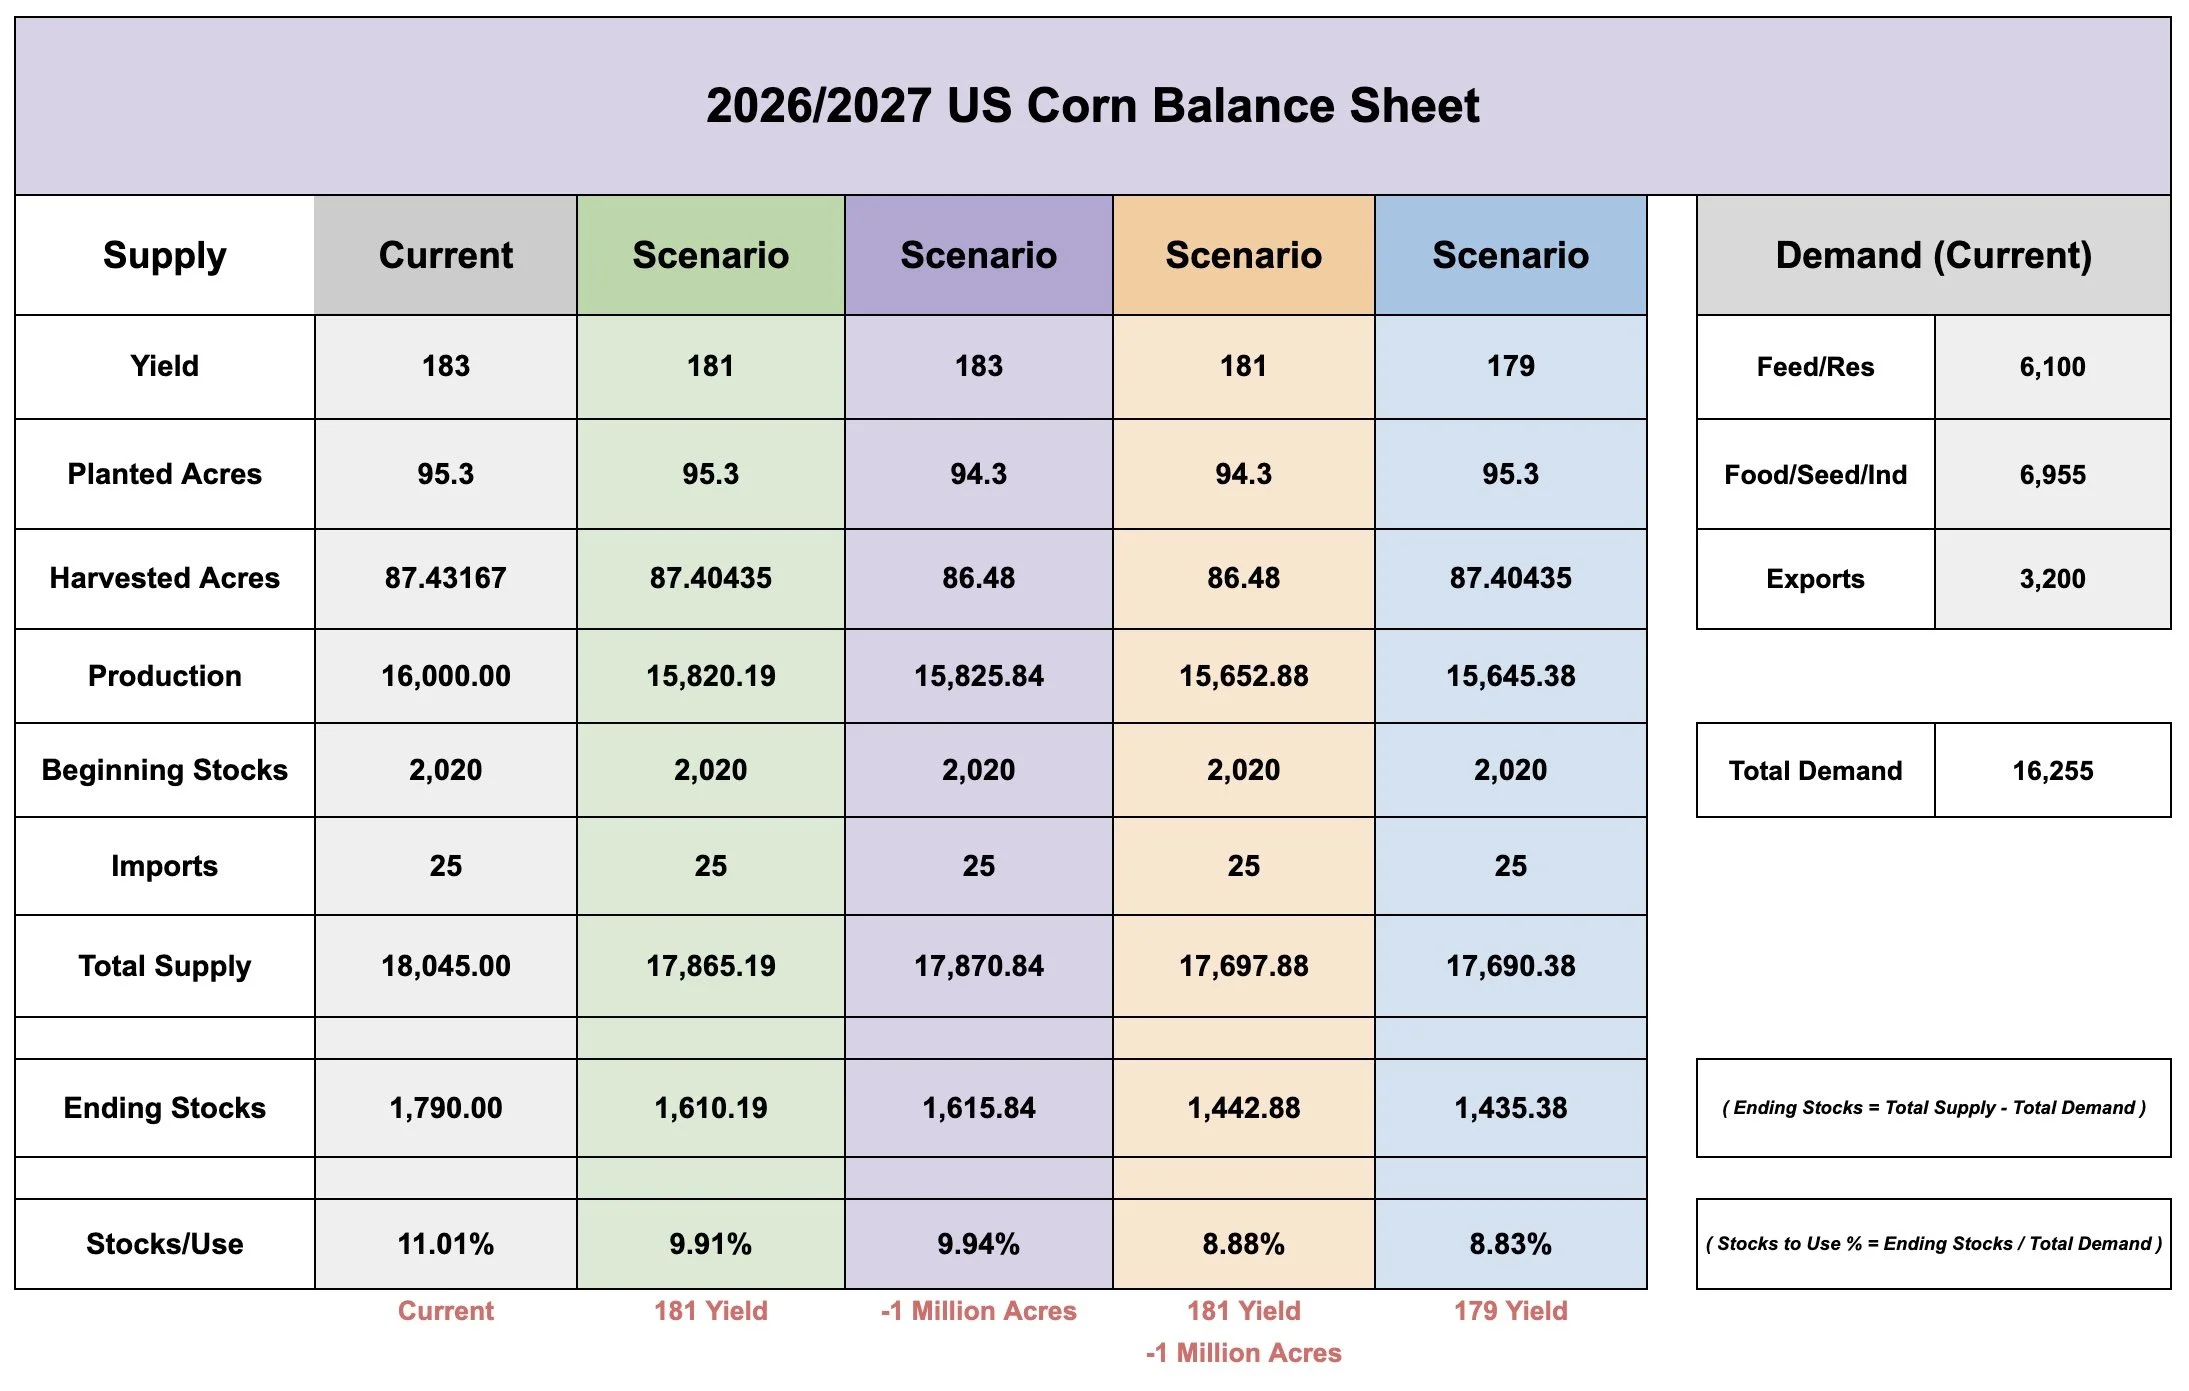
However, that 11% stocks to use is WITH a 183 yield and 95.3 million acres.
Both. Not one or the other.
If we even slightly lose one or the other, the situation in corn actually becomes very compelling and potentially very tight.
Just look at some of these scenarios.
Without Changing Demand:
181 Yield + 95.3 acres = 9.90% S/U
183 Yield + 94.3 acres = 9.90% S/U
181 Yield + 94.3 acres = 8.90% S/U
179 Yield + 95.3 acres = 8.80% S/U
There are a lot of possible path ways for corn to reach closer to a 10% stocks to use.
So that is why new crop corn has potential.
The fertilizer situation hasn’t completely vanished either.
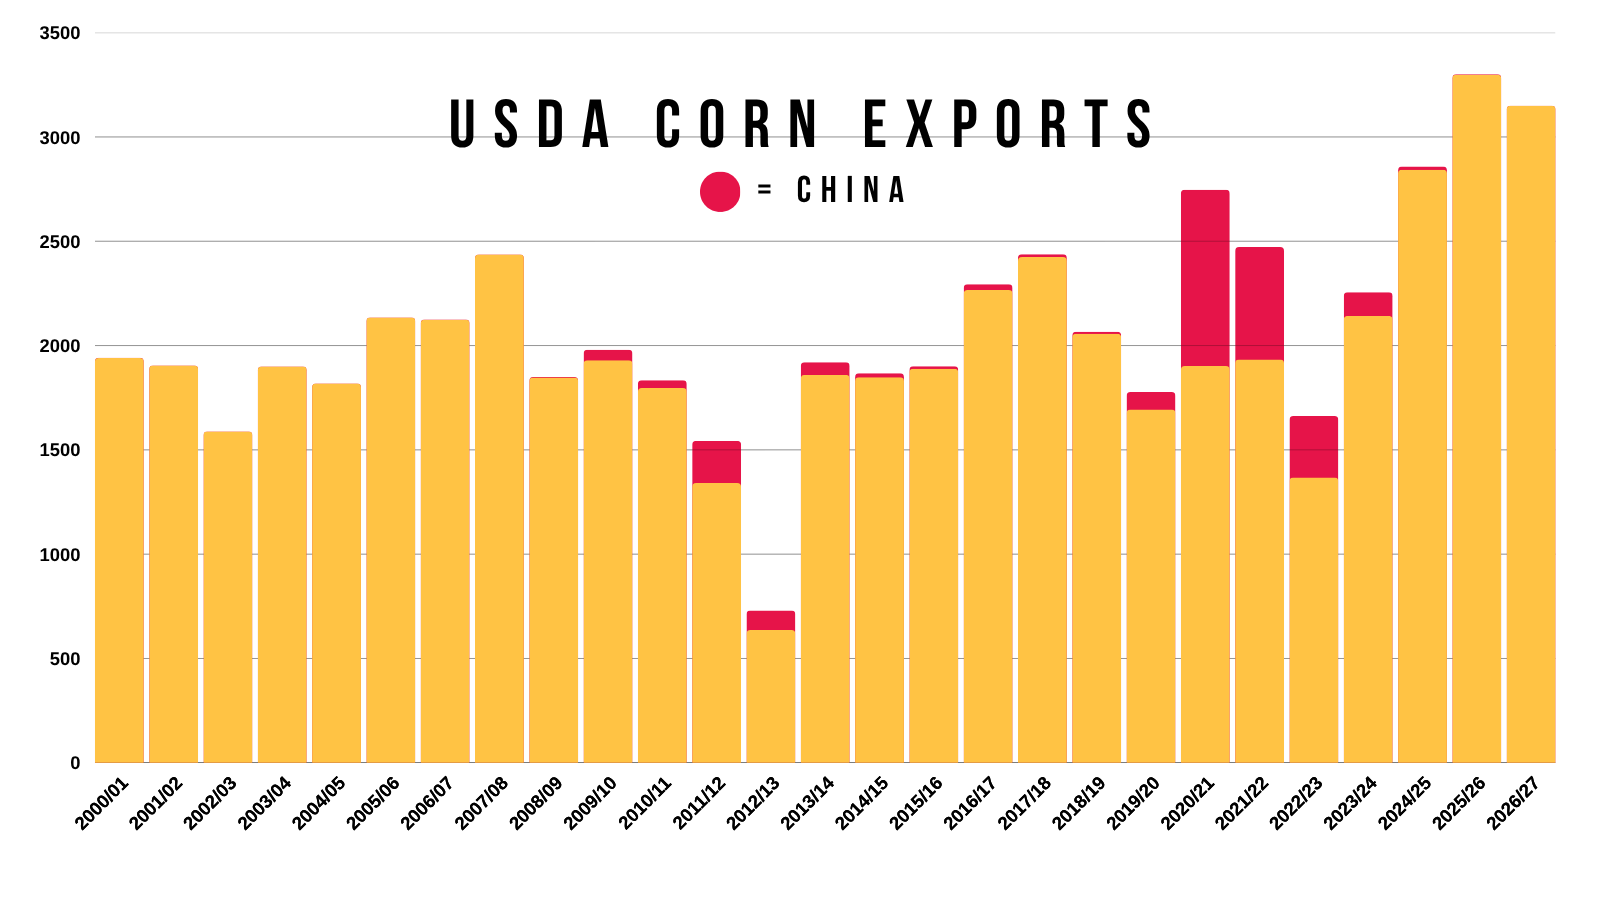
Not to mention the high probability of China buying corn at some point.
When demand is already the best it has ever been, without a penny of China business.
The point is, there are a lot of possible friendly wild cards long term for the corn market.
Short term, none of these really matter.
For us to go higher right now and heading into harvest, we'd need to see wheat continue to rally off the back of this Russia story, weather flip hot and dry, or China to step in and buy corn right now.
Let's not forget the world situation continues to dwindle.
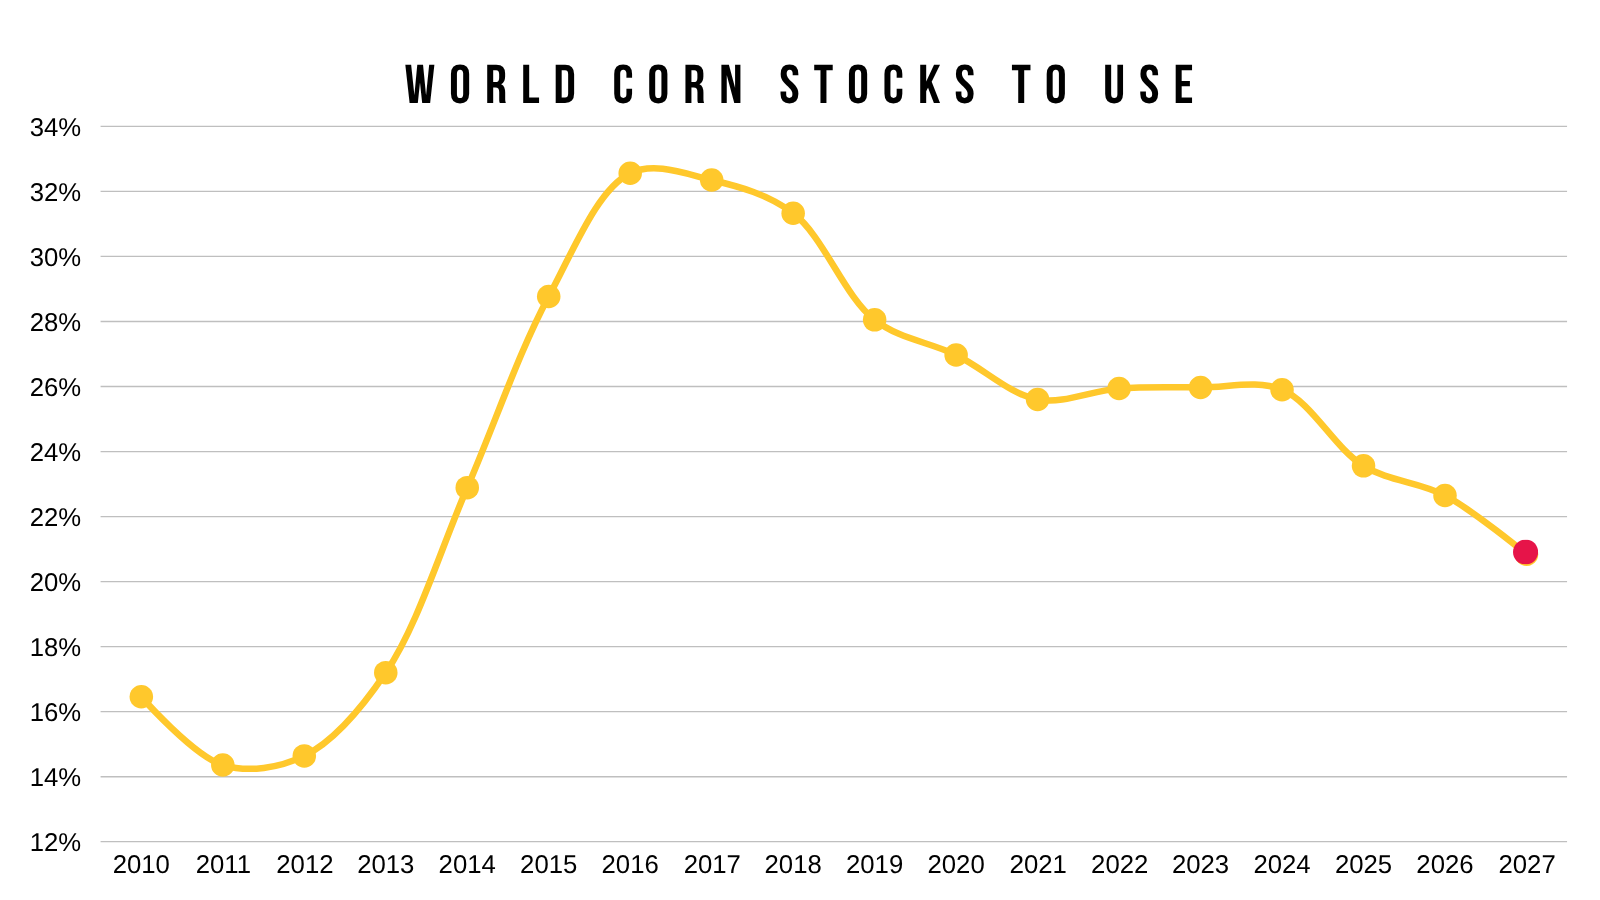
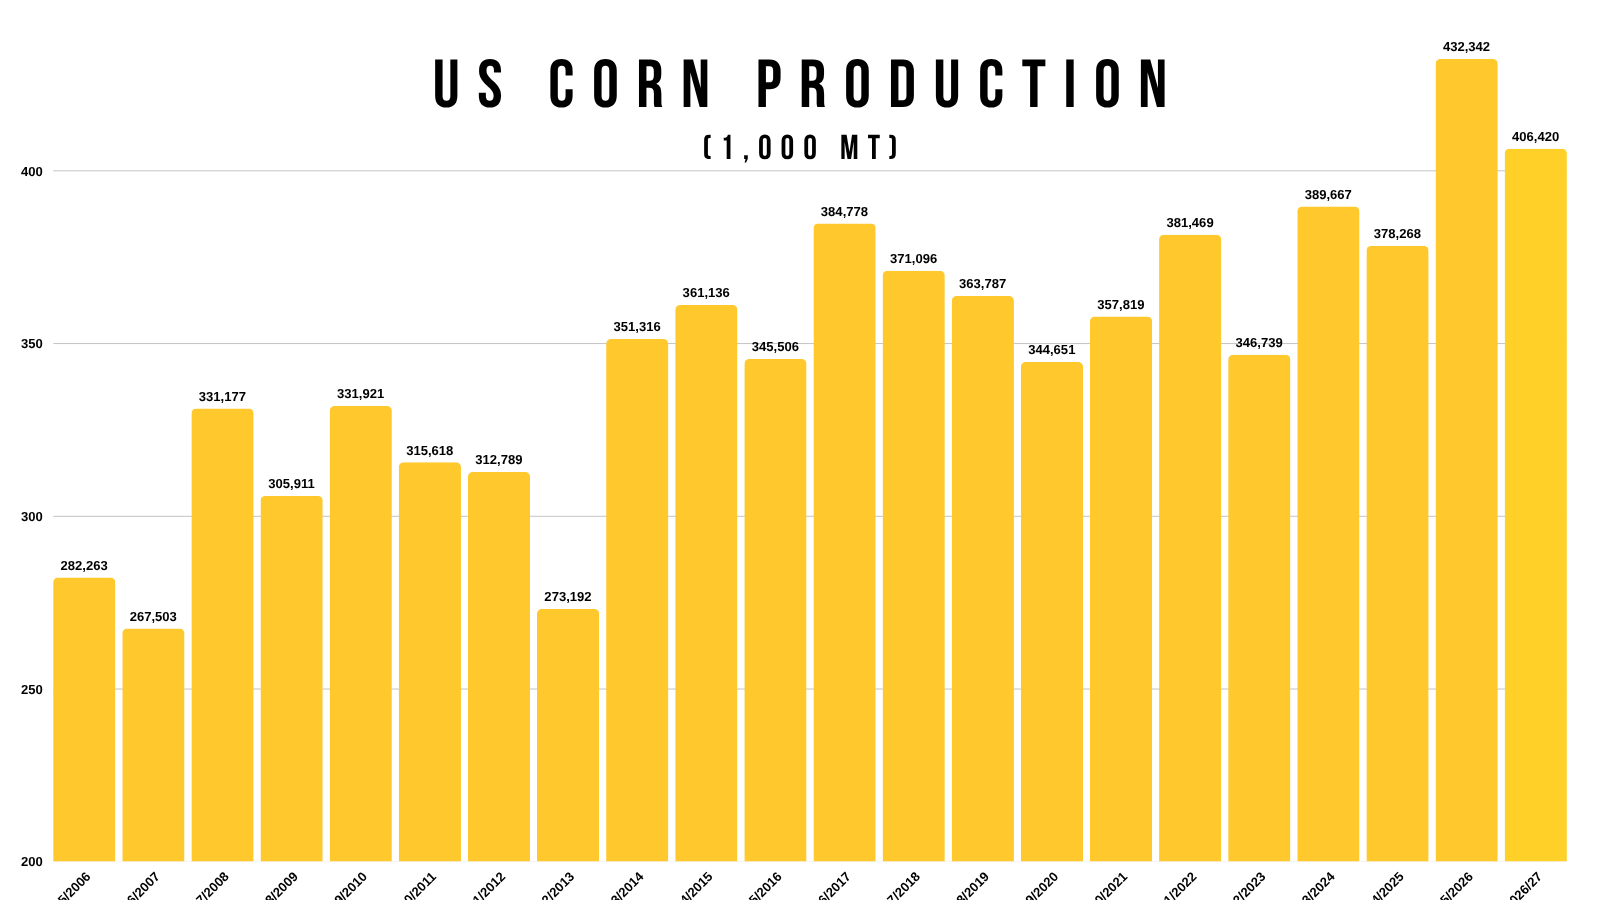
This is with several years of record crops out of the US and big crops out of Brazil.
If that is with record crops, what would it even take for the world to start gaining excess supply?
Can you imagine what would happen if the US did not have a bumper crop?
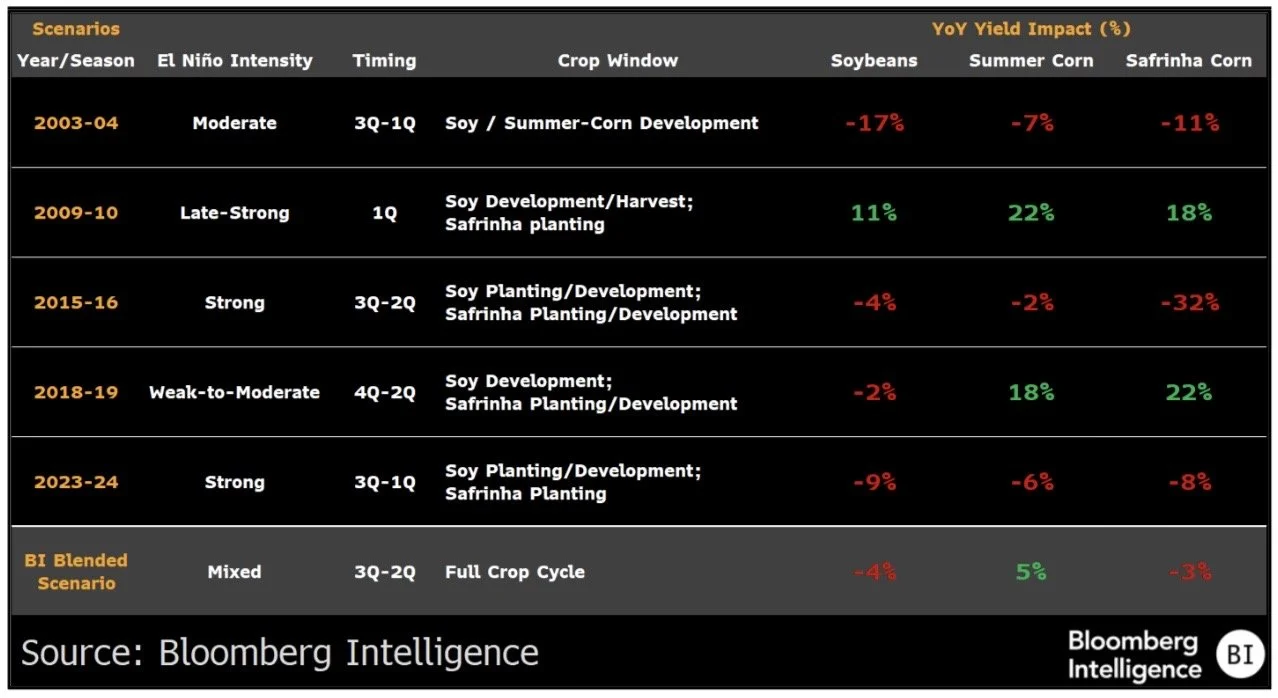
I saw this interesting chart from Bloomberg that shows past El Nino's impacts on Brazil production.
El Nino's tend to have a negative effect on production. Especially soybeans.
So that's another possible friendly wildcard for later on in corn as well as soybeans.
Along with the question marks surrounding how fertilizer is going to impact Brazil production already.
So yes, there are several possible bullish wild cards. They just don’t have to happen right now.
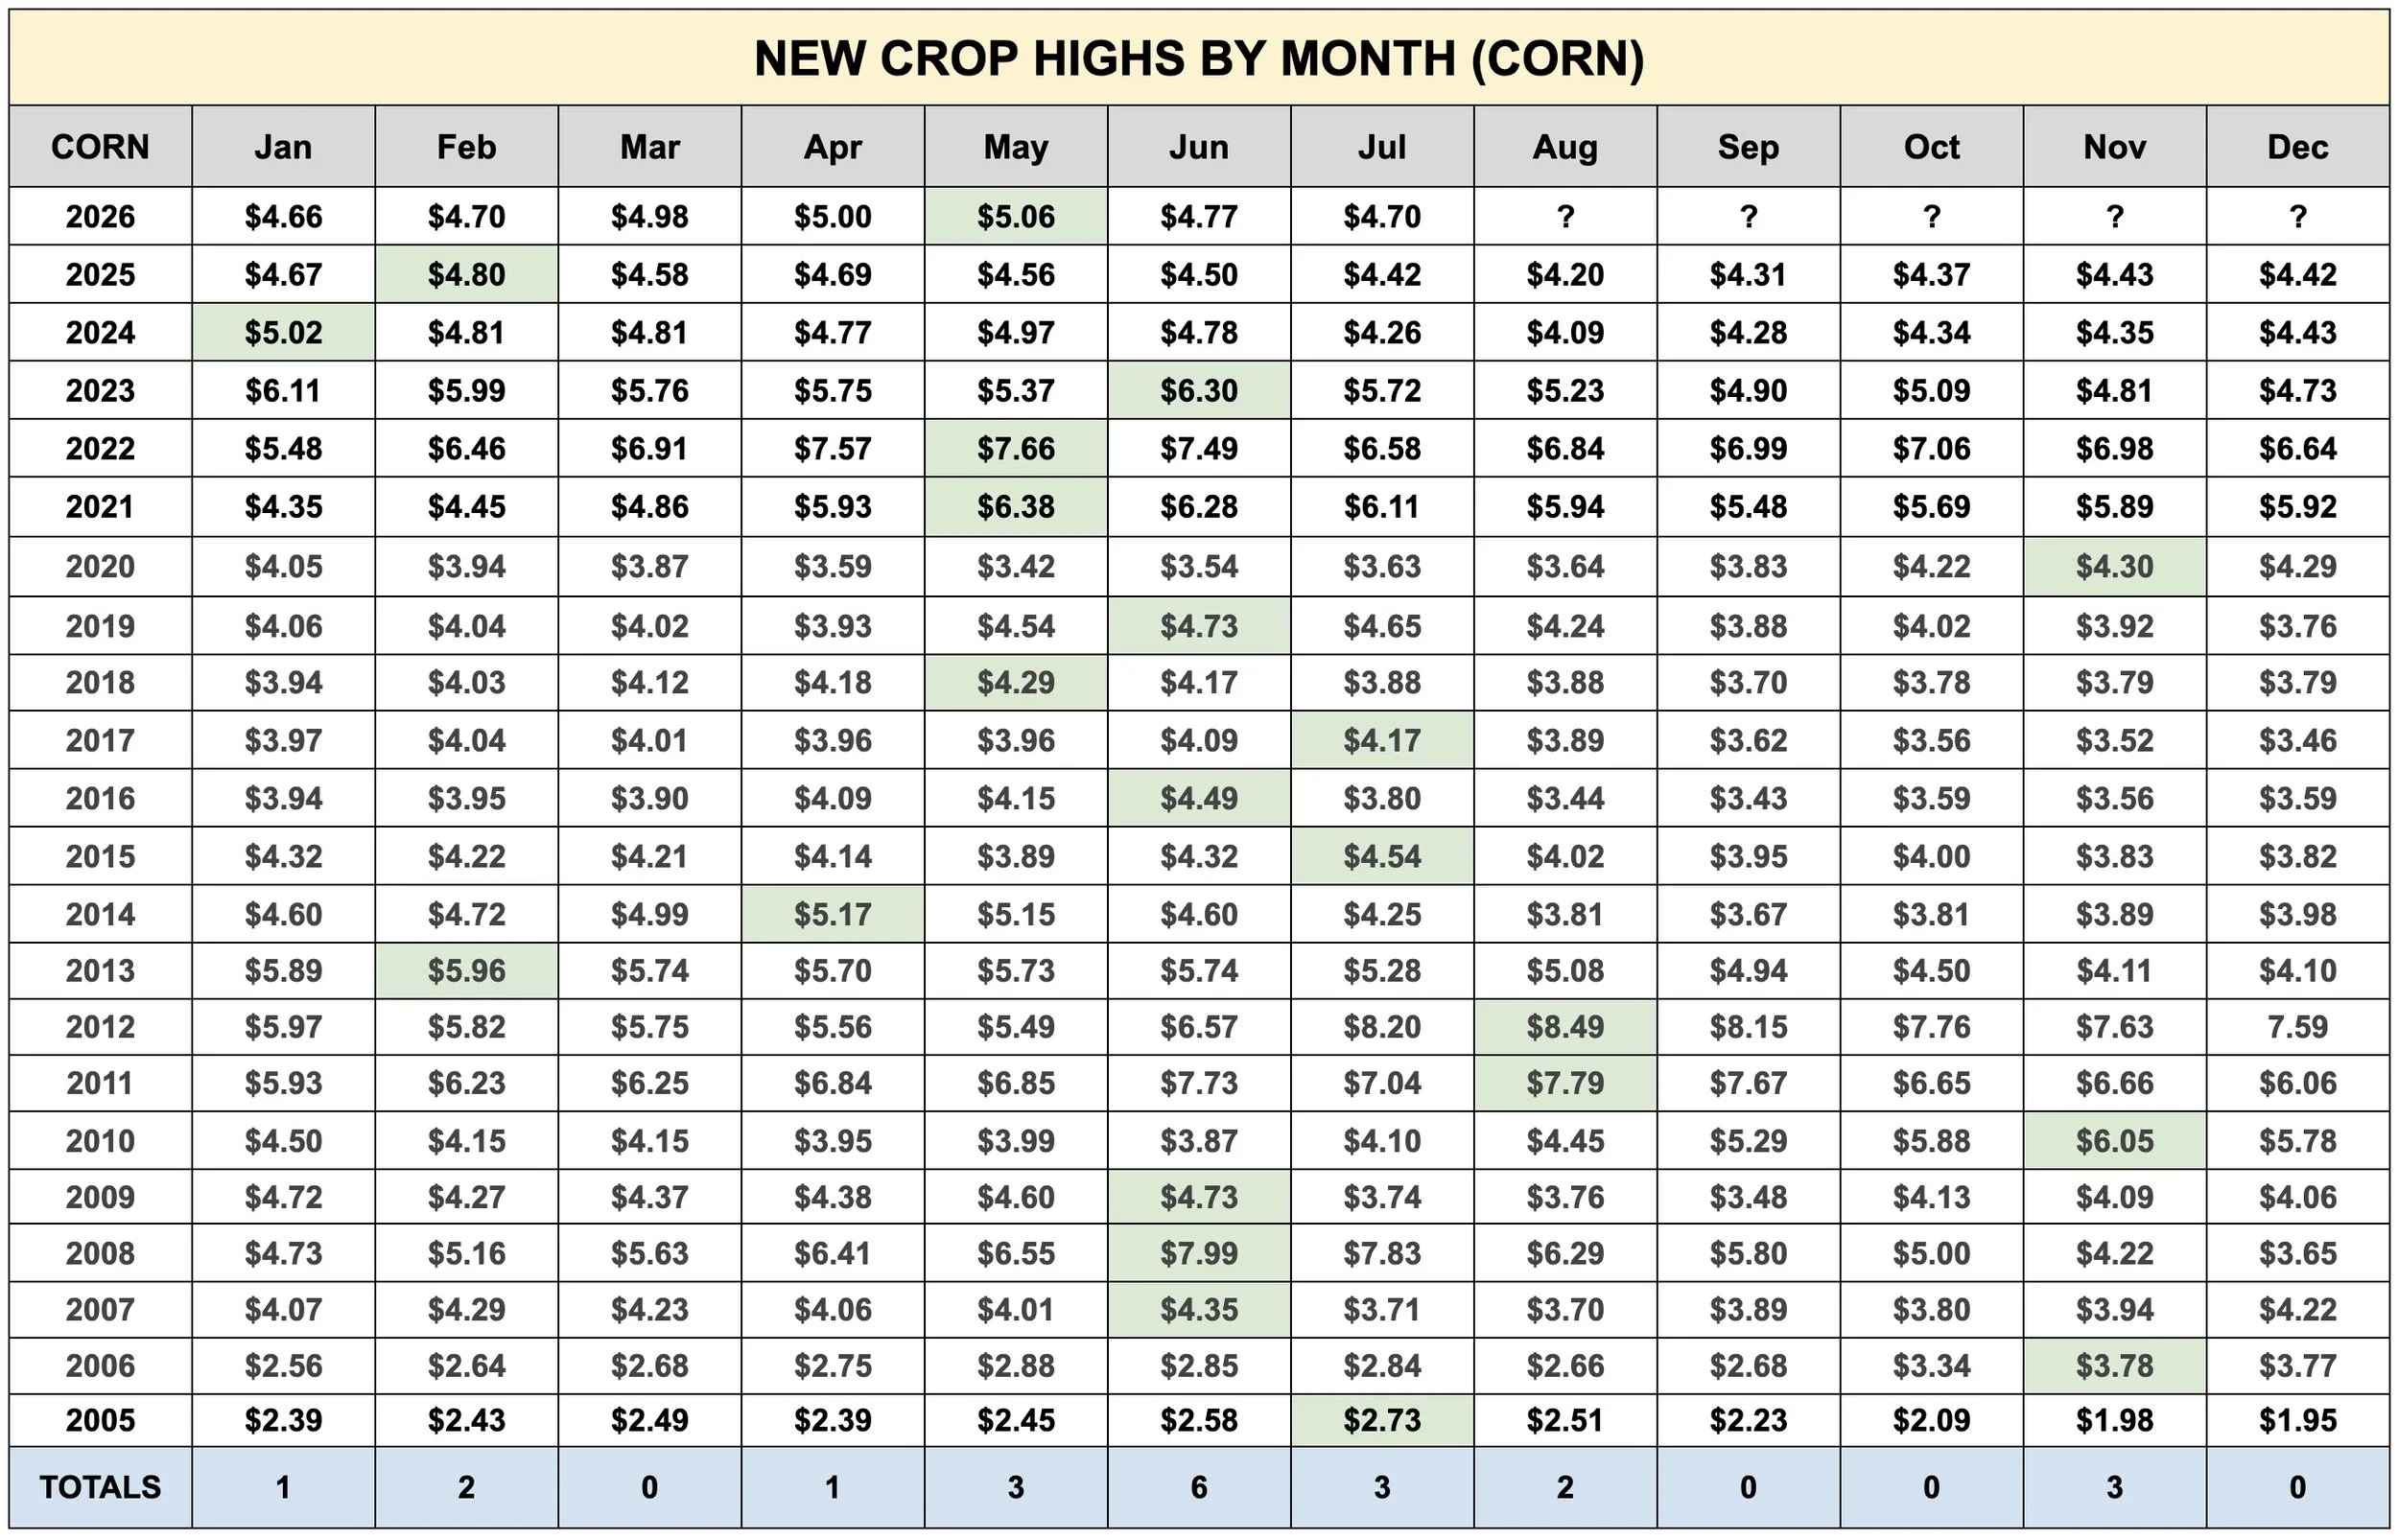
What's a possible sign of a bull market?
One common theme we've seen over the last few bull markets is that in the year prior we posted our highest price for the year at the end of the year.
Strength then continued.
Which is something we saw in 2010 and 2020.
It's only a small set of data, but something to keep in mind if we ever post new highs at the end of the year.
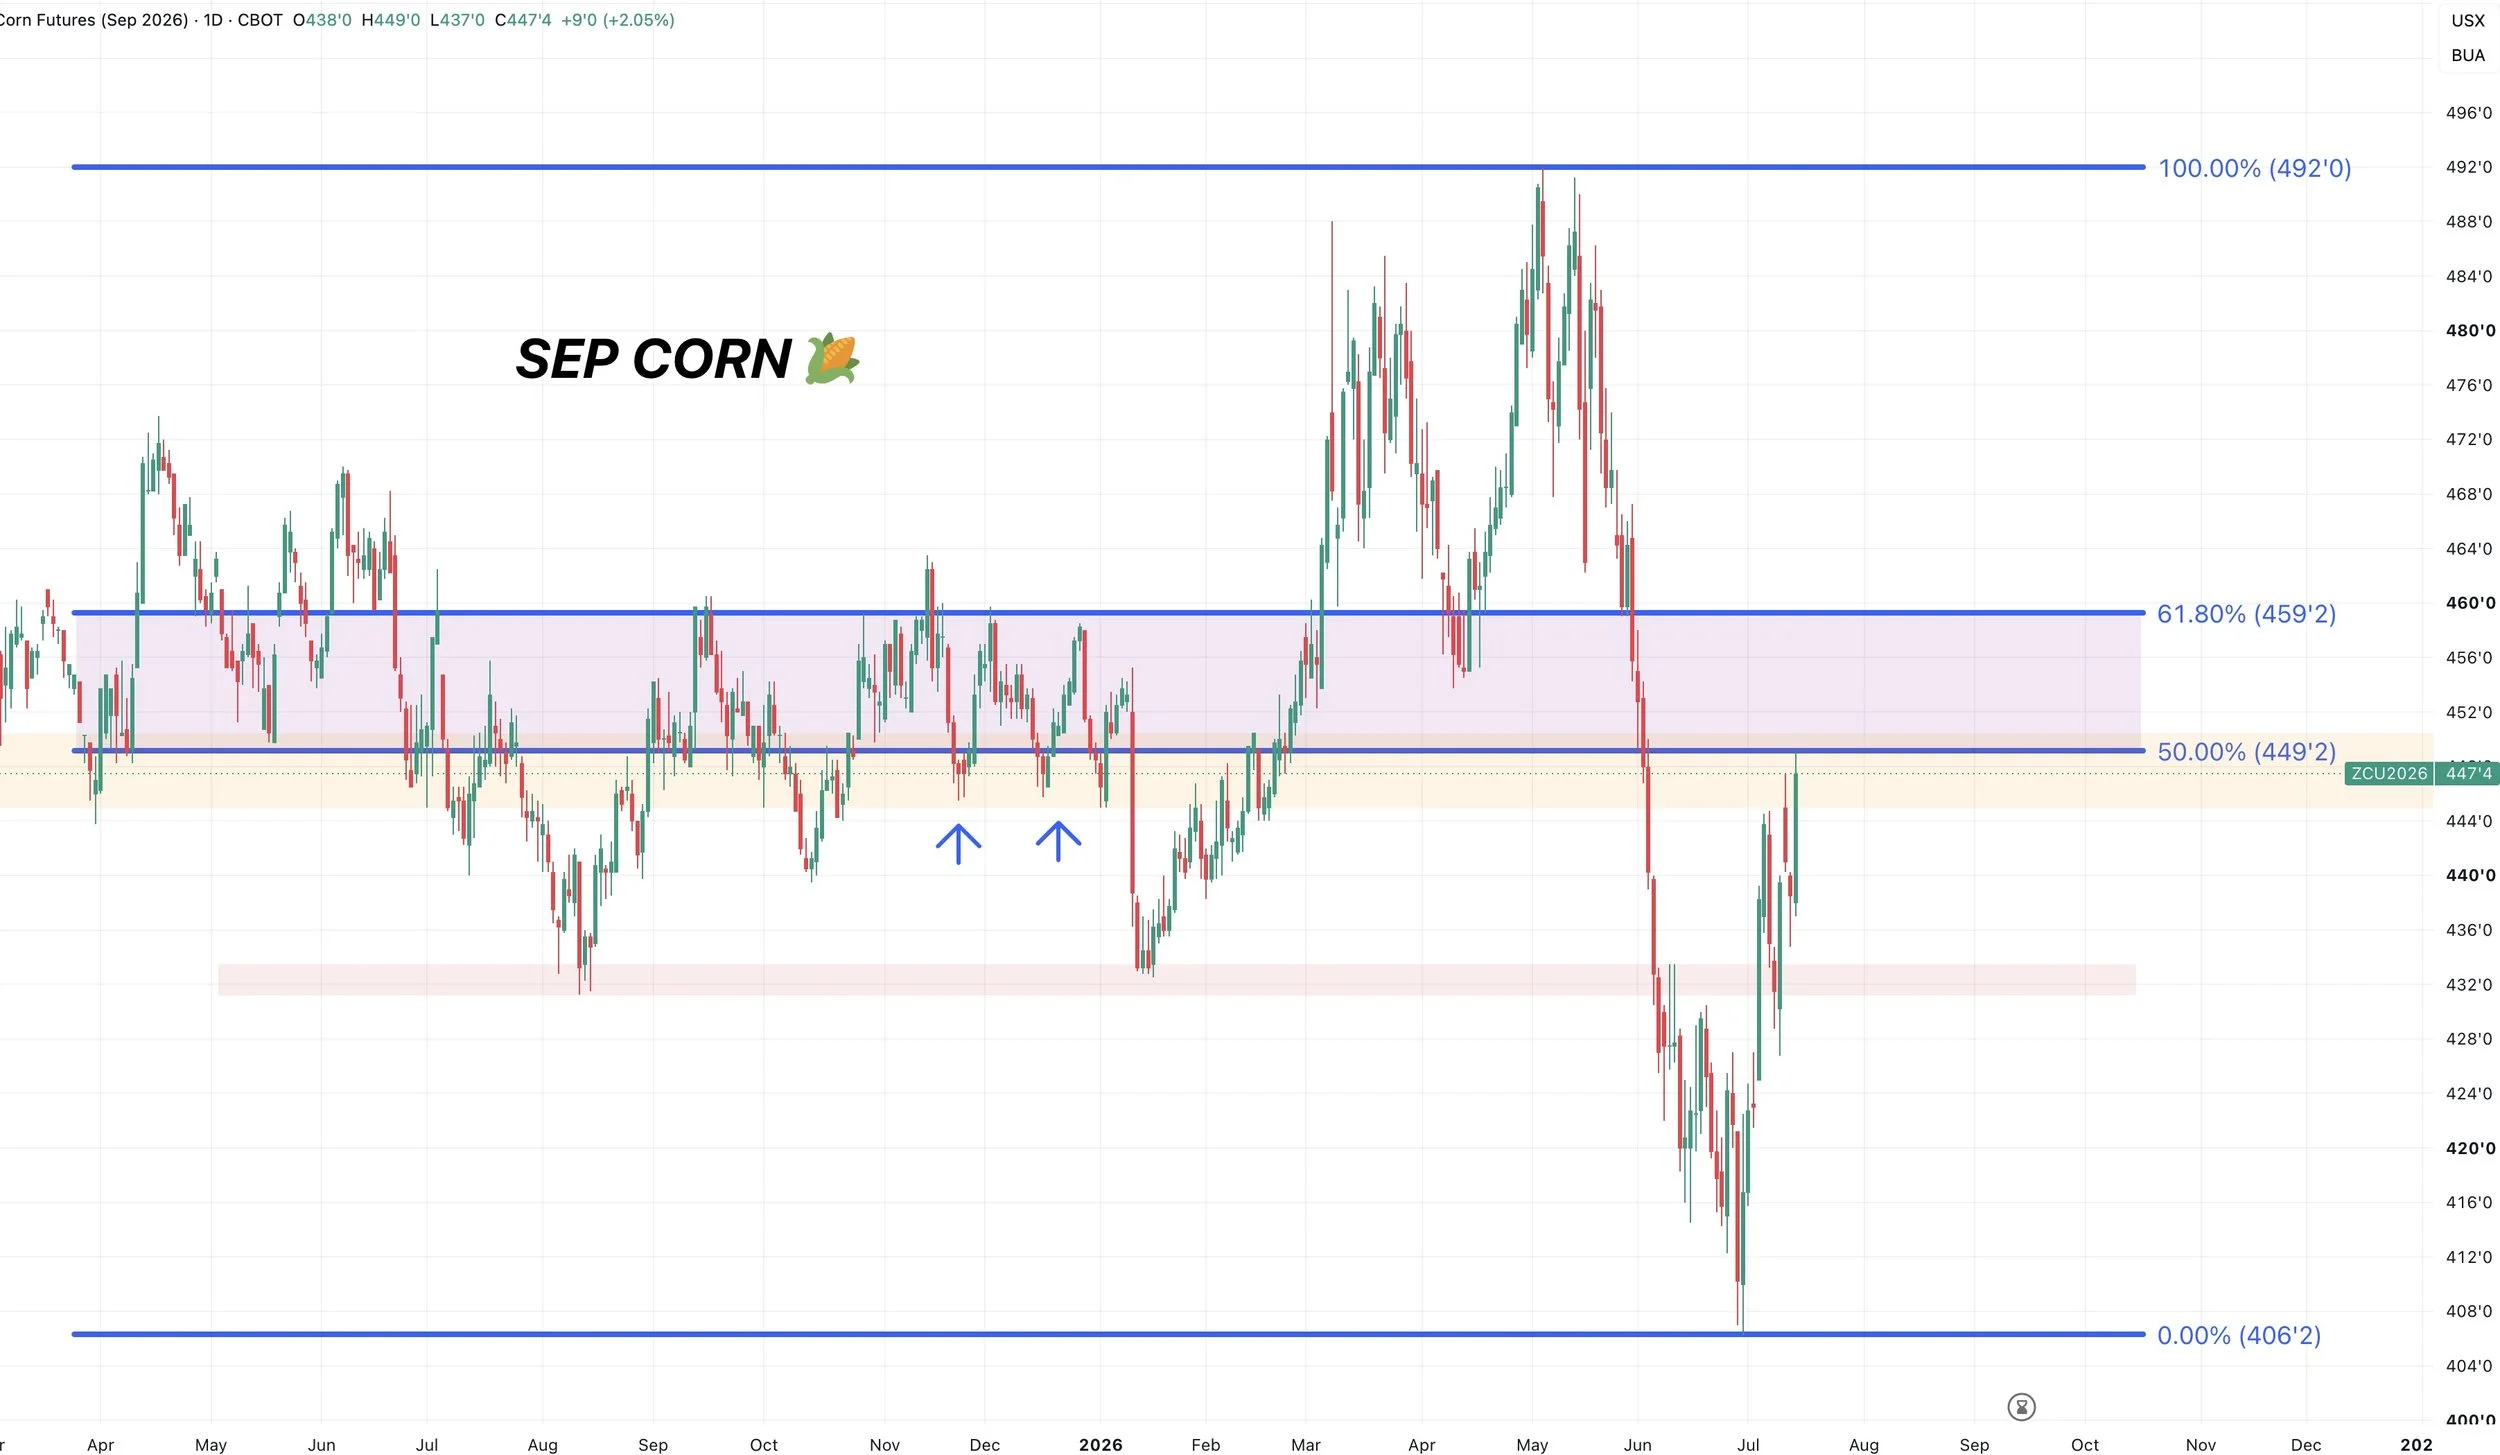
Sep Corn Chart:
After we gapped open higher on Monday morning, we did issue a sell signal and hedge alert. More so for those who are either behind or have to move stuff off the combine etc.
Link to Alert: Click Here
We are back up near those highs from Monday morning.
We are still battling that old key support from last year. Which can offer resistance.
We also tagged the 50% retracement to the highs.
If we are able to break above these highs, the next point of interest is going to be the 61.8% level at $4.59. Which also happens to be old resistance from last year as well.
If a rally is going to stall, this is called the golden zone for a reason. It's where rallies can commonly stall.
This move is seen as a simple corrective bounce unless you break above the golden zone.
With that, doing something if you need to do something makes sense at these levels.
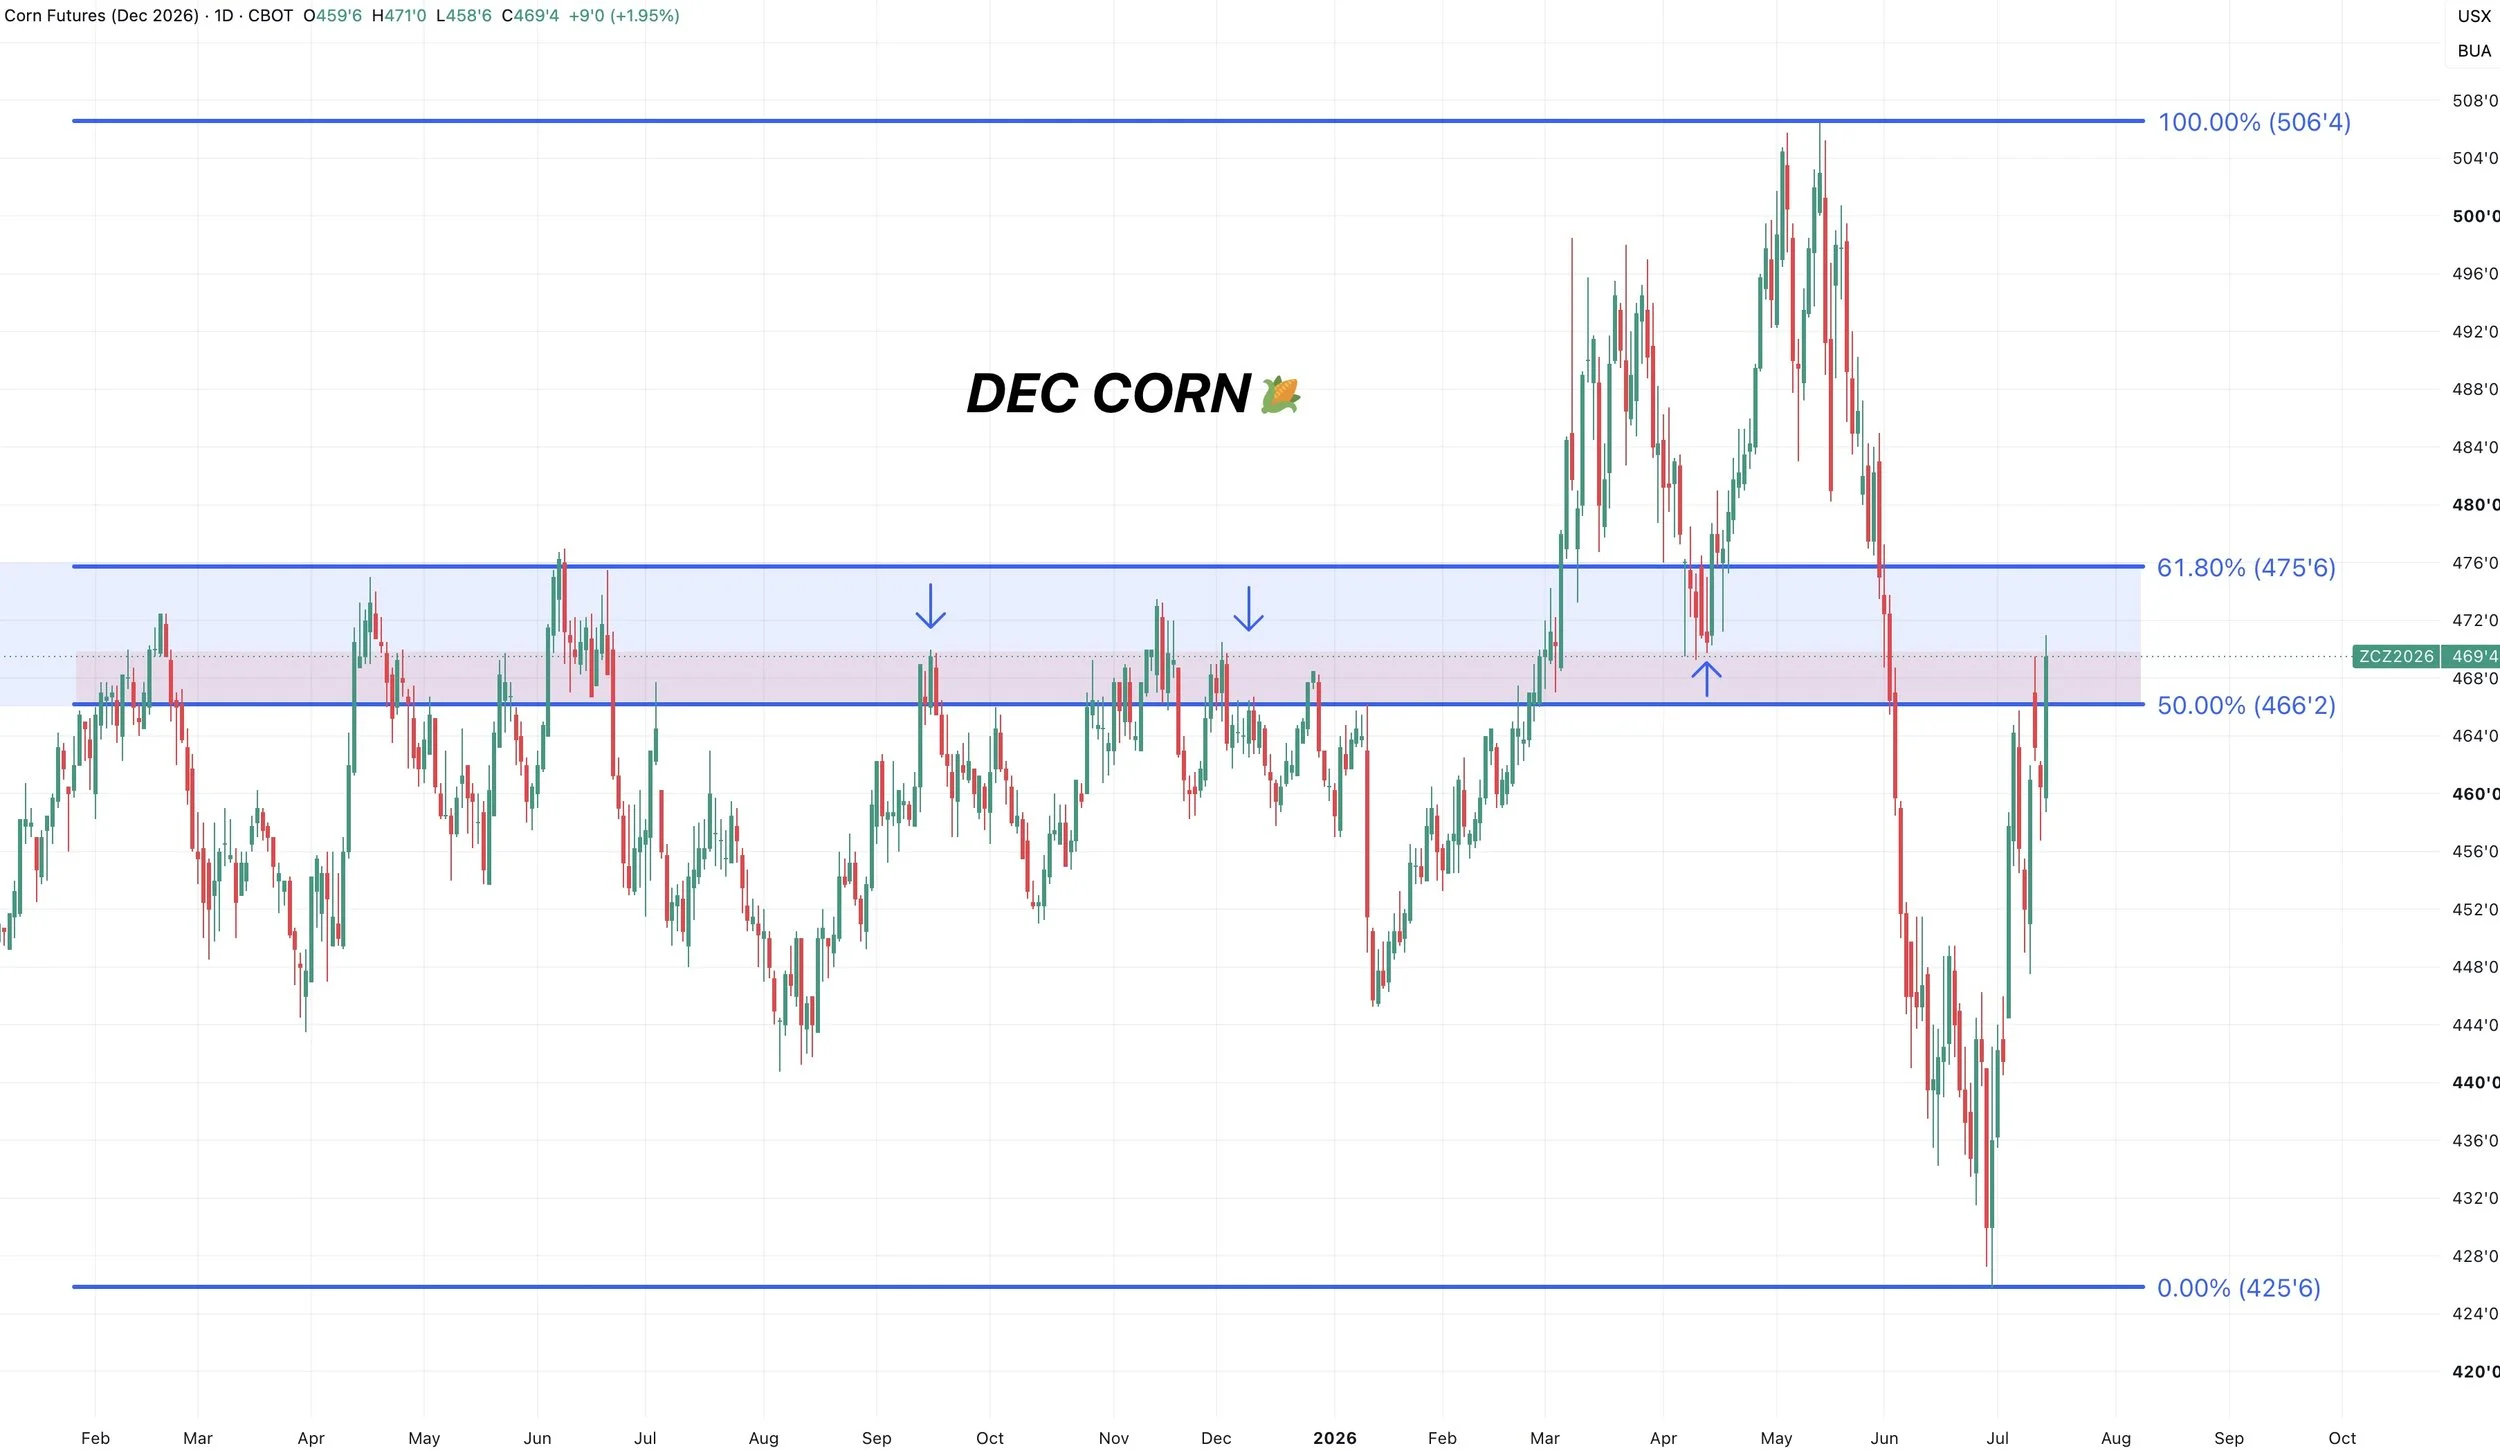
Dec Corn Chart:
We are right back at the recent highs from Monday morning.
This is still a very key level.
It's right where we bounced in April. It's also right where this market failed to break through on several attempts last year.
We are the golden zone. Which claws back 50-61.8% of the entire sell off. This is where the market often makes a big decision. It usually decides if this is just a corrective bounce or not.
Overall, the trend does still remain lower and this is viewed as a corrective bounce unless we are able to close and get a full break above $4.75
Which claws back 61.8% of the entire sell off.
If you break above that level, then things get pretty interesting.
So again, those that are in a situation where you cannot afford to be patient, we like defending this level.
If you are someone who has plenty of storage and doesn’t have to move anything, we do not mind being more patient at all. As I do see long term potential in new crop.
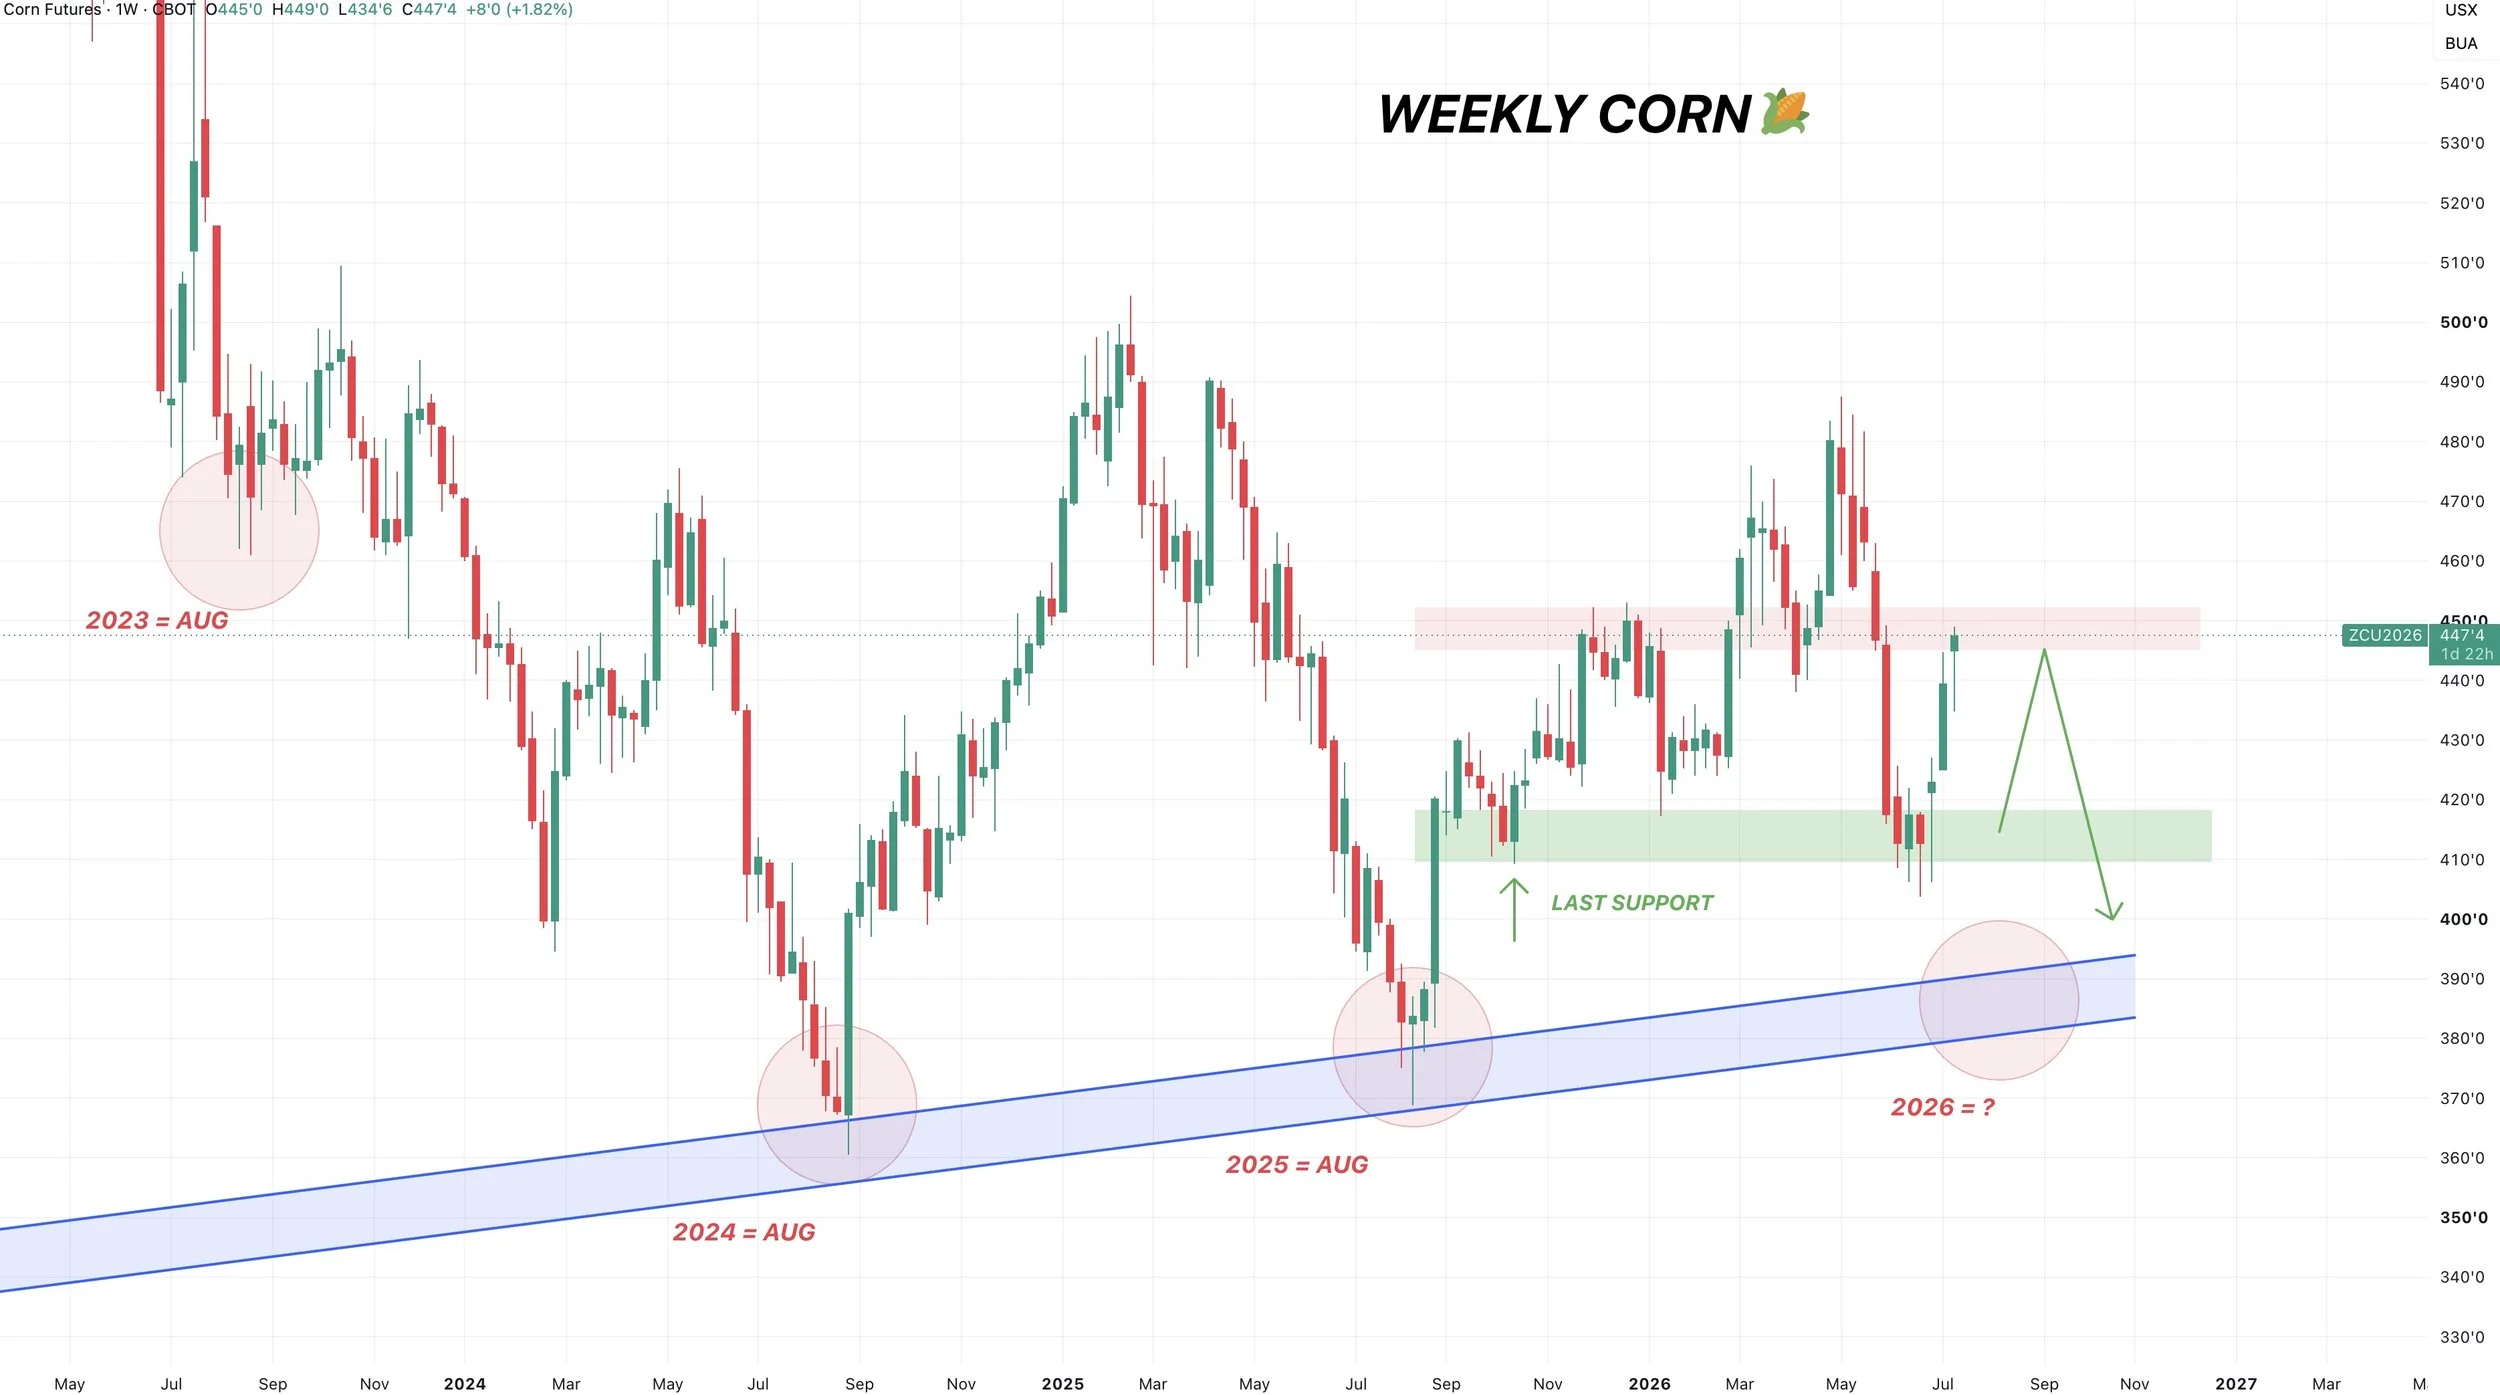
Continuous Weekly Chart:
This chart is also still right up against some possible resistance after finding some life right where we needed to at that last level of support.
Now we are battling the highs from last year and lows from April.
I am still not ruling out posting new lows going into harvest. Obviously it doesn’t have to happen.
It's largely going to now depend on this whole Russia situation. Along with weather and China of course.
If the Russia situation gets worse or China buys corn right now. The lows could very well be in for the year.
If this Russia situation is just another war rally that gets sold, the forecasts look non threatening, and China waits to buy until around harvest time. The lows don’t have to be in yet.
Soybeans
Seasonally, soybeans also tend to be weak heading into August.
Before then getting another rally later in the year.
Here is the 5 and 10 year patterns.
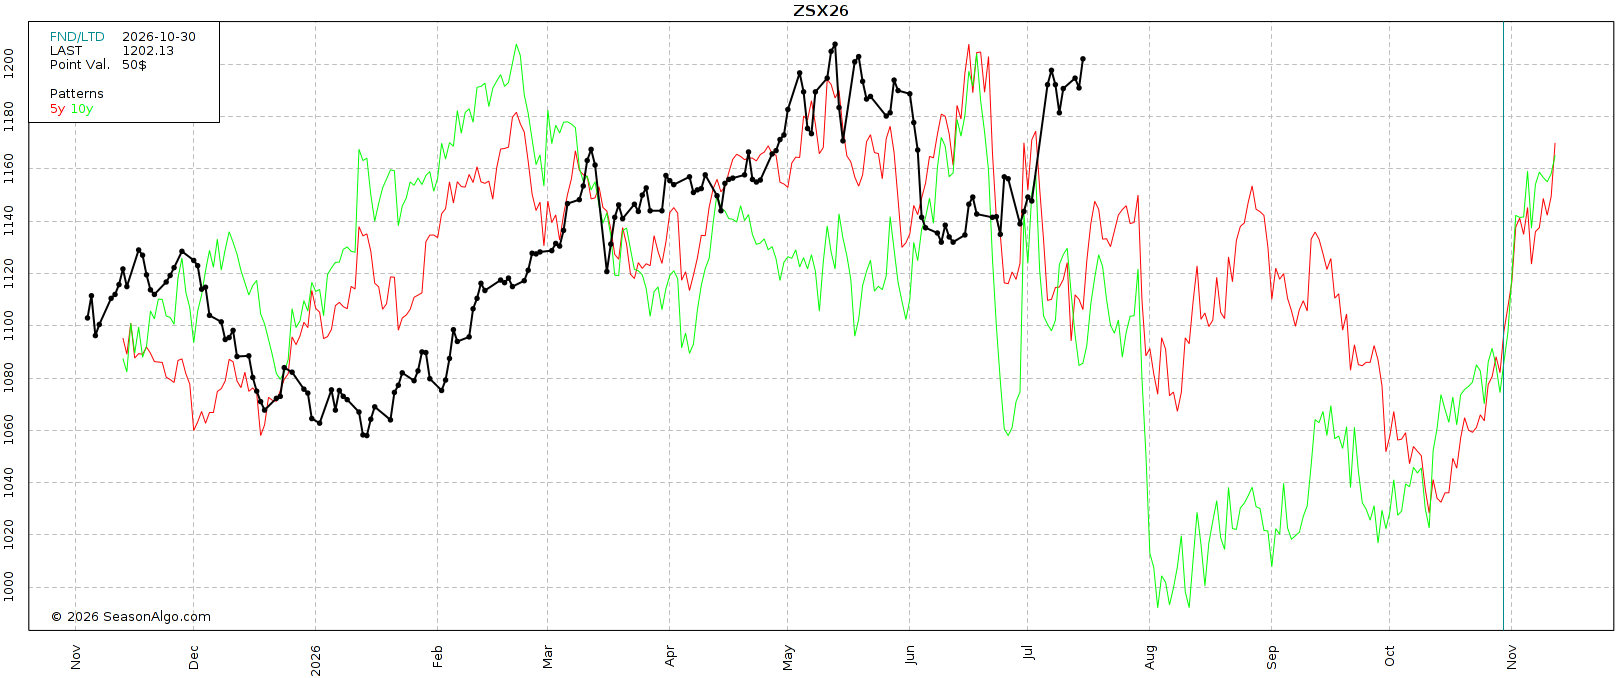
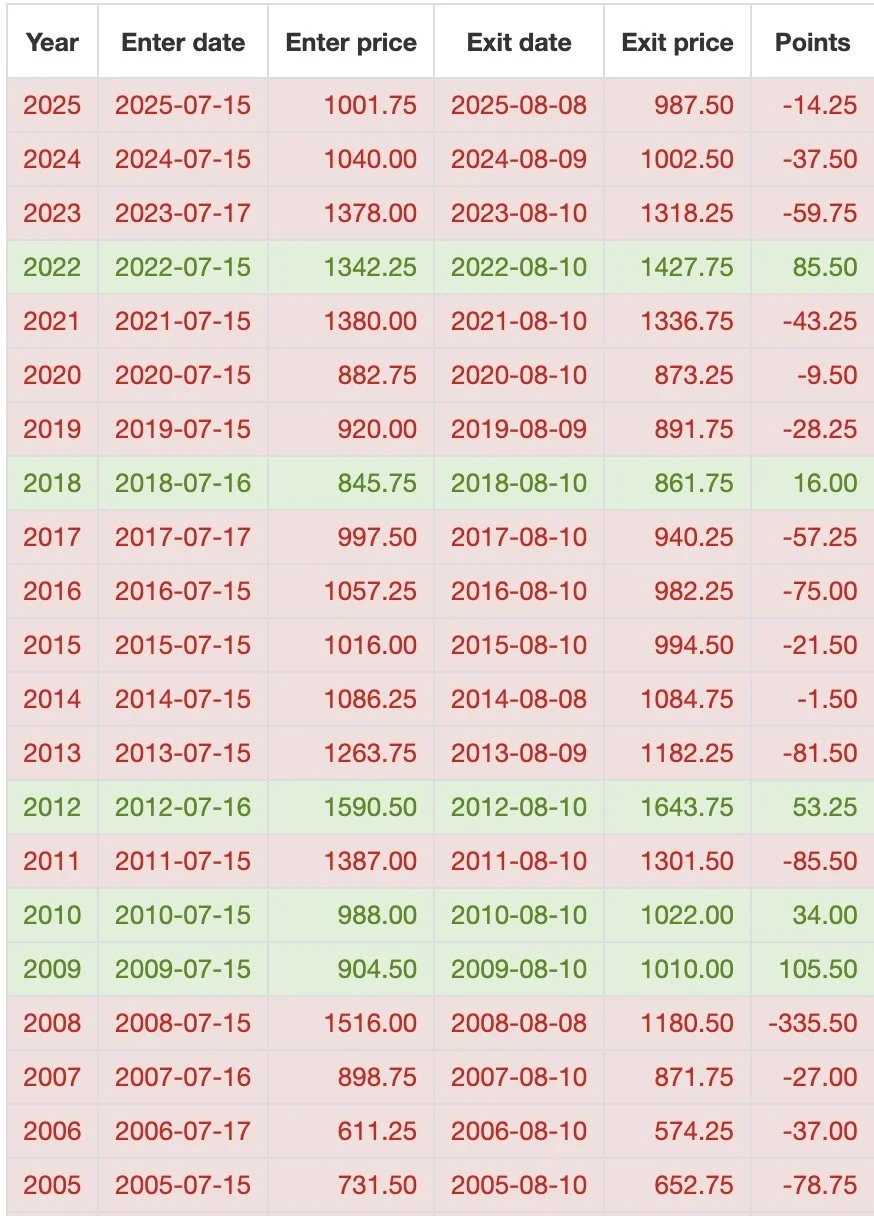
From today by August 10th, we have been lower the last 11 of 13 years.
So I do think that warrants some caution up here near the highs.
As I've talked about countless times, and like in corn.
There is absolutely zero room for error on the soybean balance sheet.
So long term, that's your story.
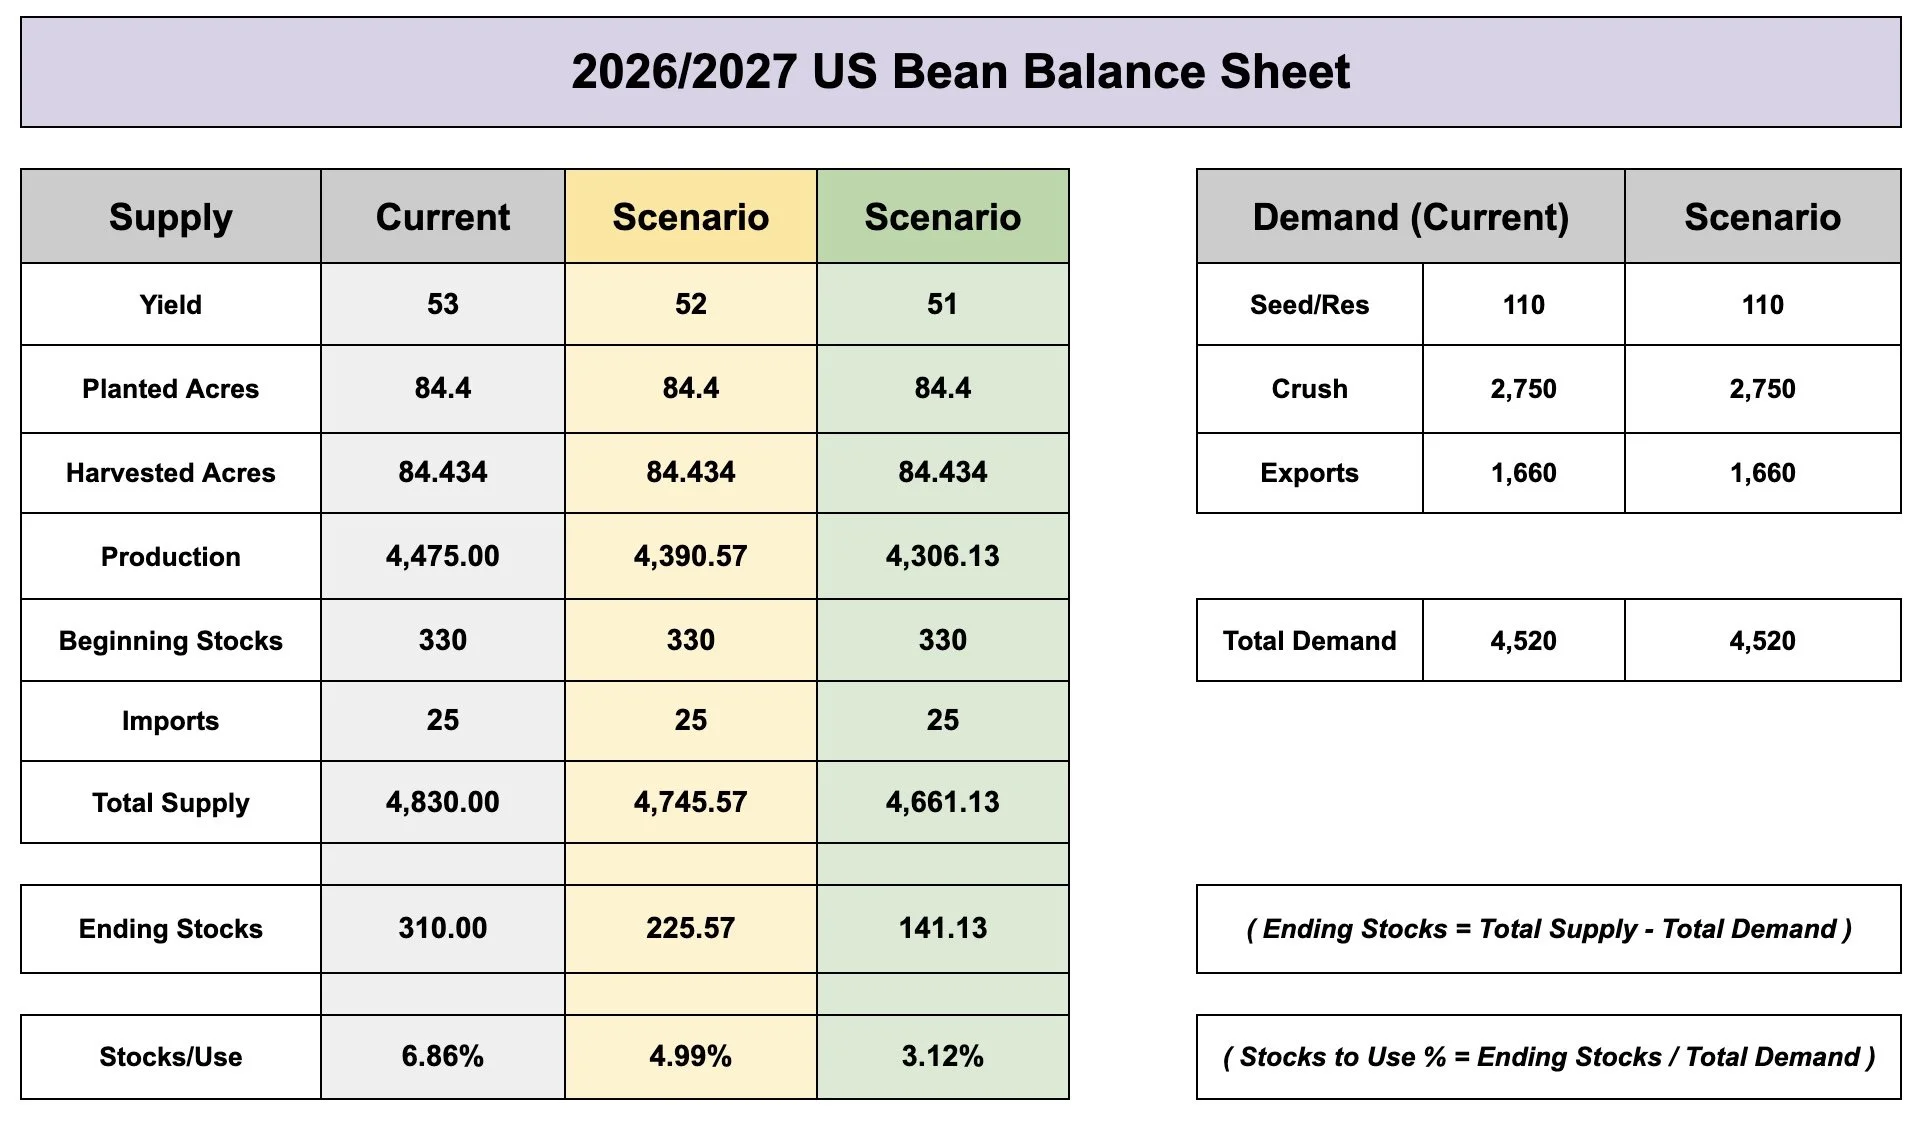
Just for reference, without changing demand:
53 bpa yield = 310 carryout
52 bpa yield = 225 carryout
51 bpa yield = 140 carryout
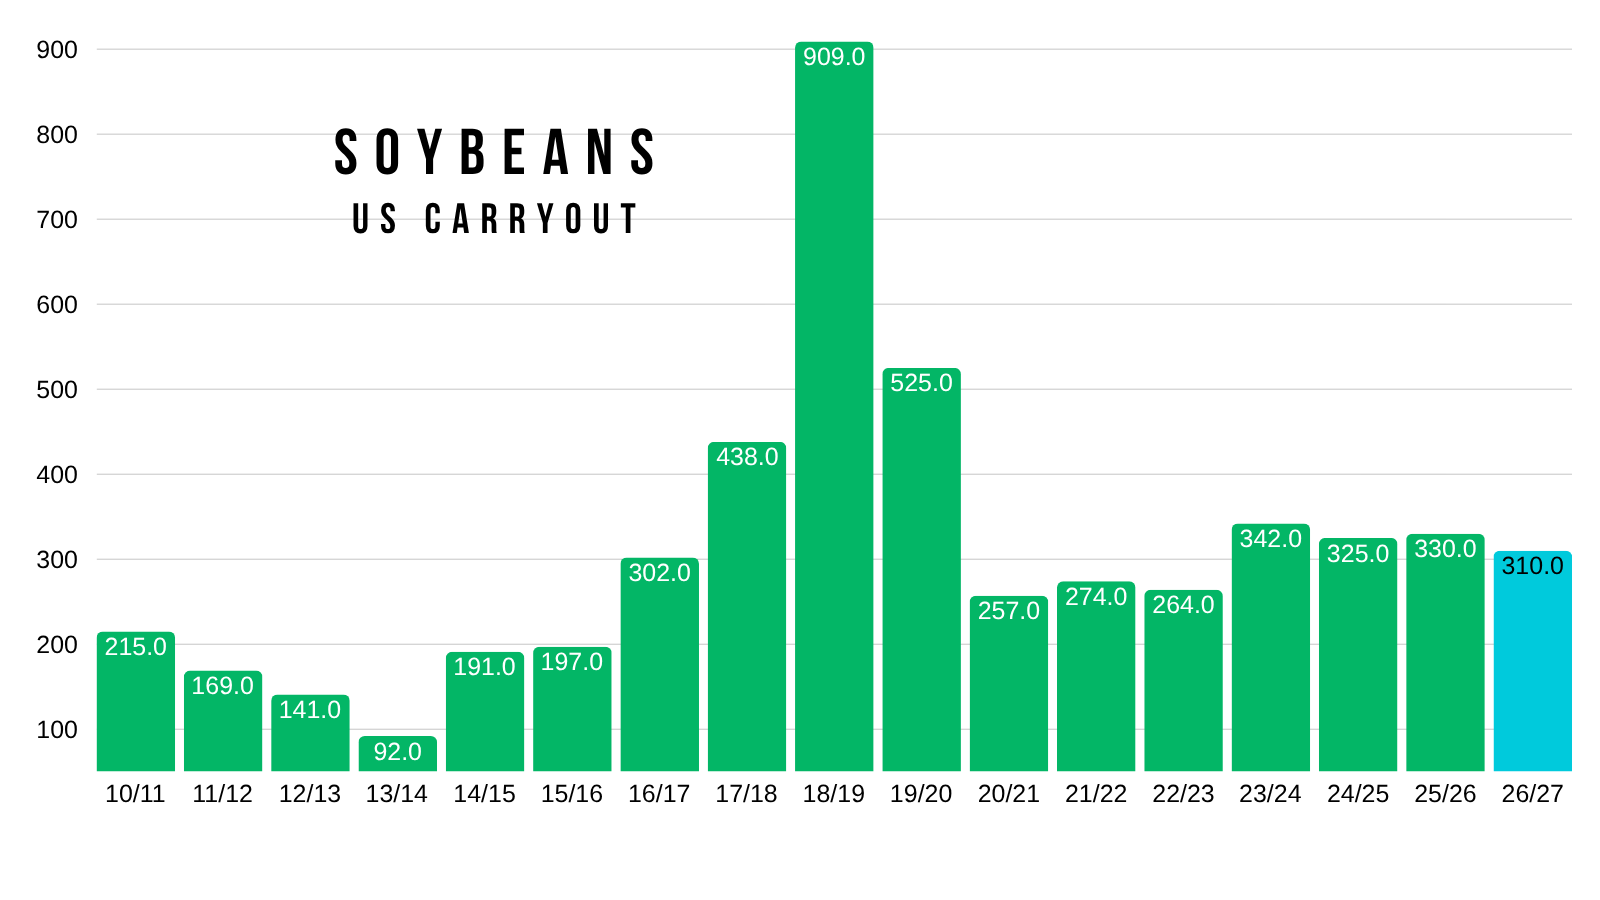
We haven’t seen a sub 300 carryout since the bull market years.
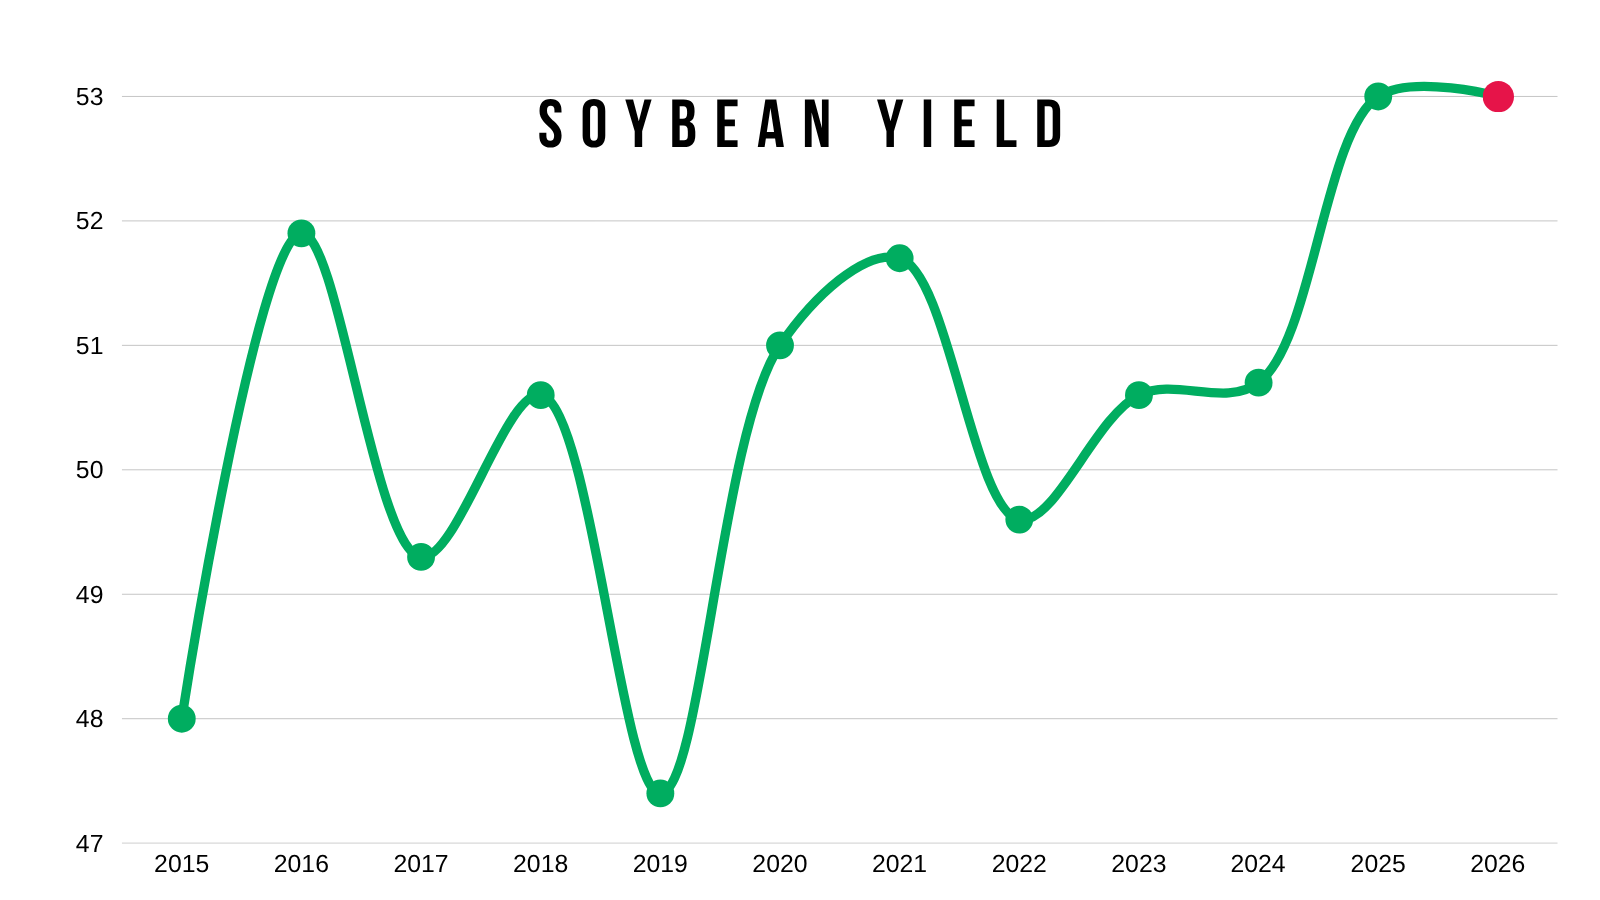
I wouldn’t say a 53 bpa yield is guarenteed either.
It's been a long time since we've seen back to back record yields.
Before last year, the last time we saw a record yield was 2016. I then took until 2025 to break it.
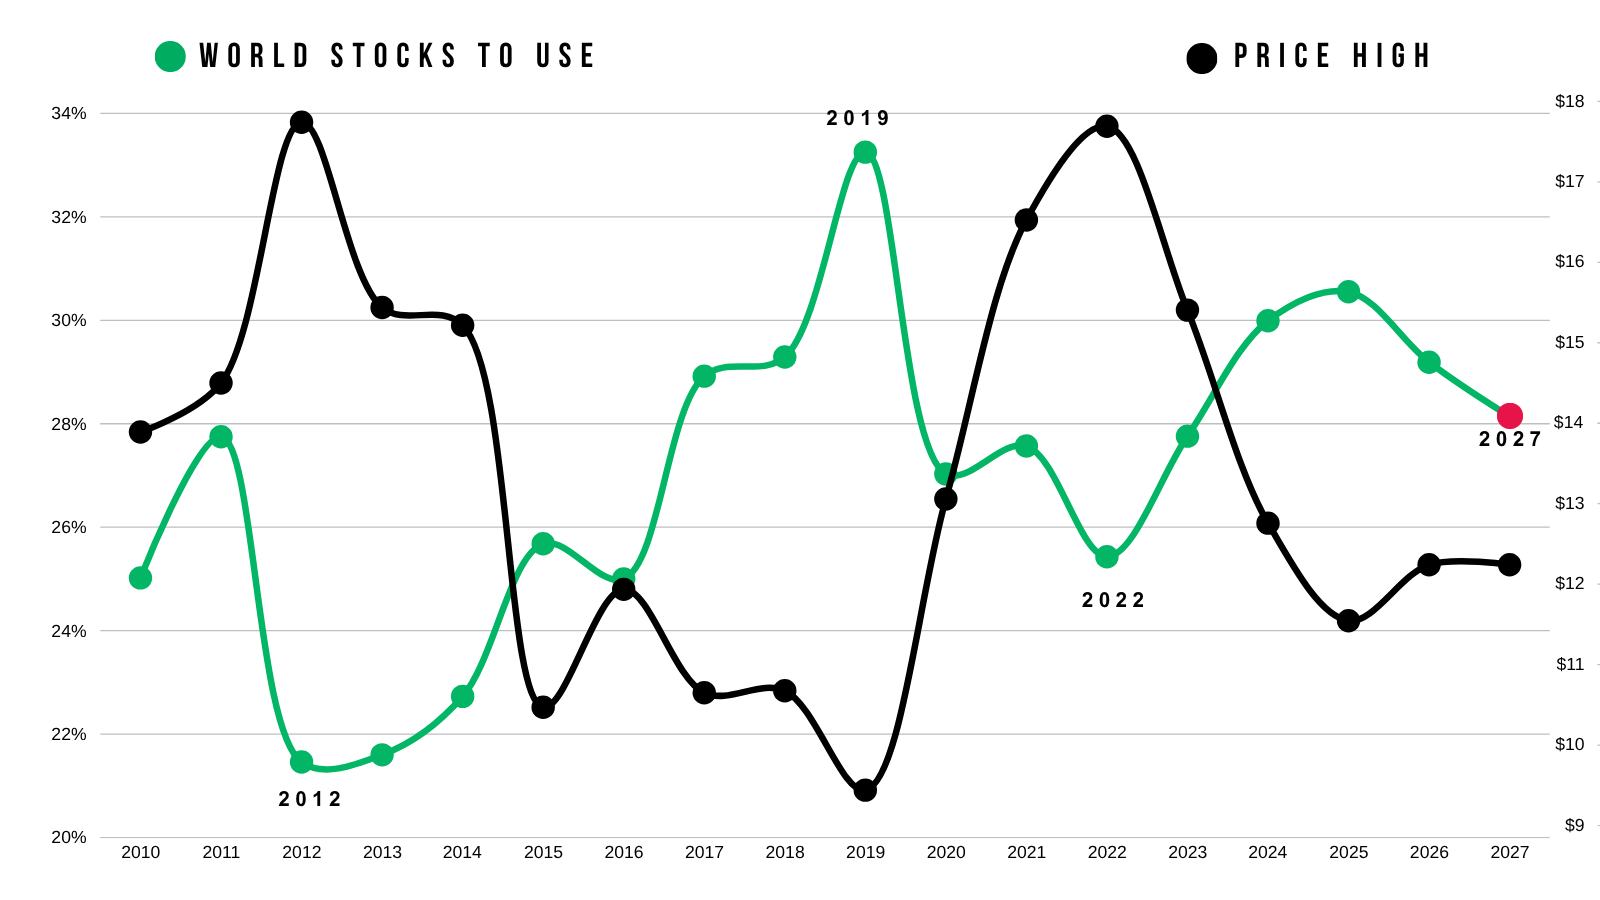
Here is the world stocks to use ratio vs soybeans highest price of the year.
There is a clear correlation here.
A lose world situation leads to low prices. A tight world situation leads to higher prices.
Prime examples are 2019 and 2022. The difference between a bear market and bull market.
If you want a really bullish market, you might need to see the world situation tighten up.
It's not currently as tight as 2022, but it's gotten a lot tighter the last few years.
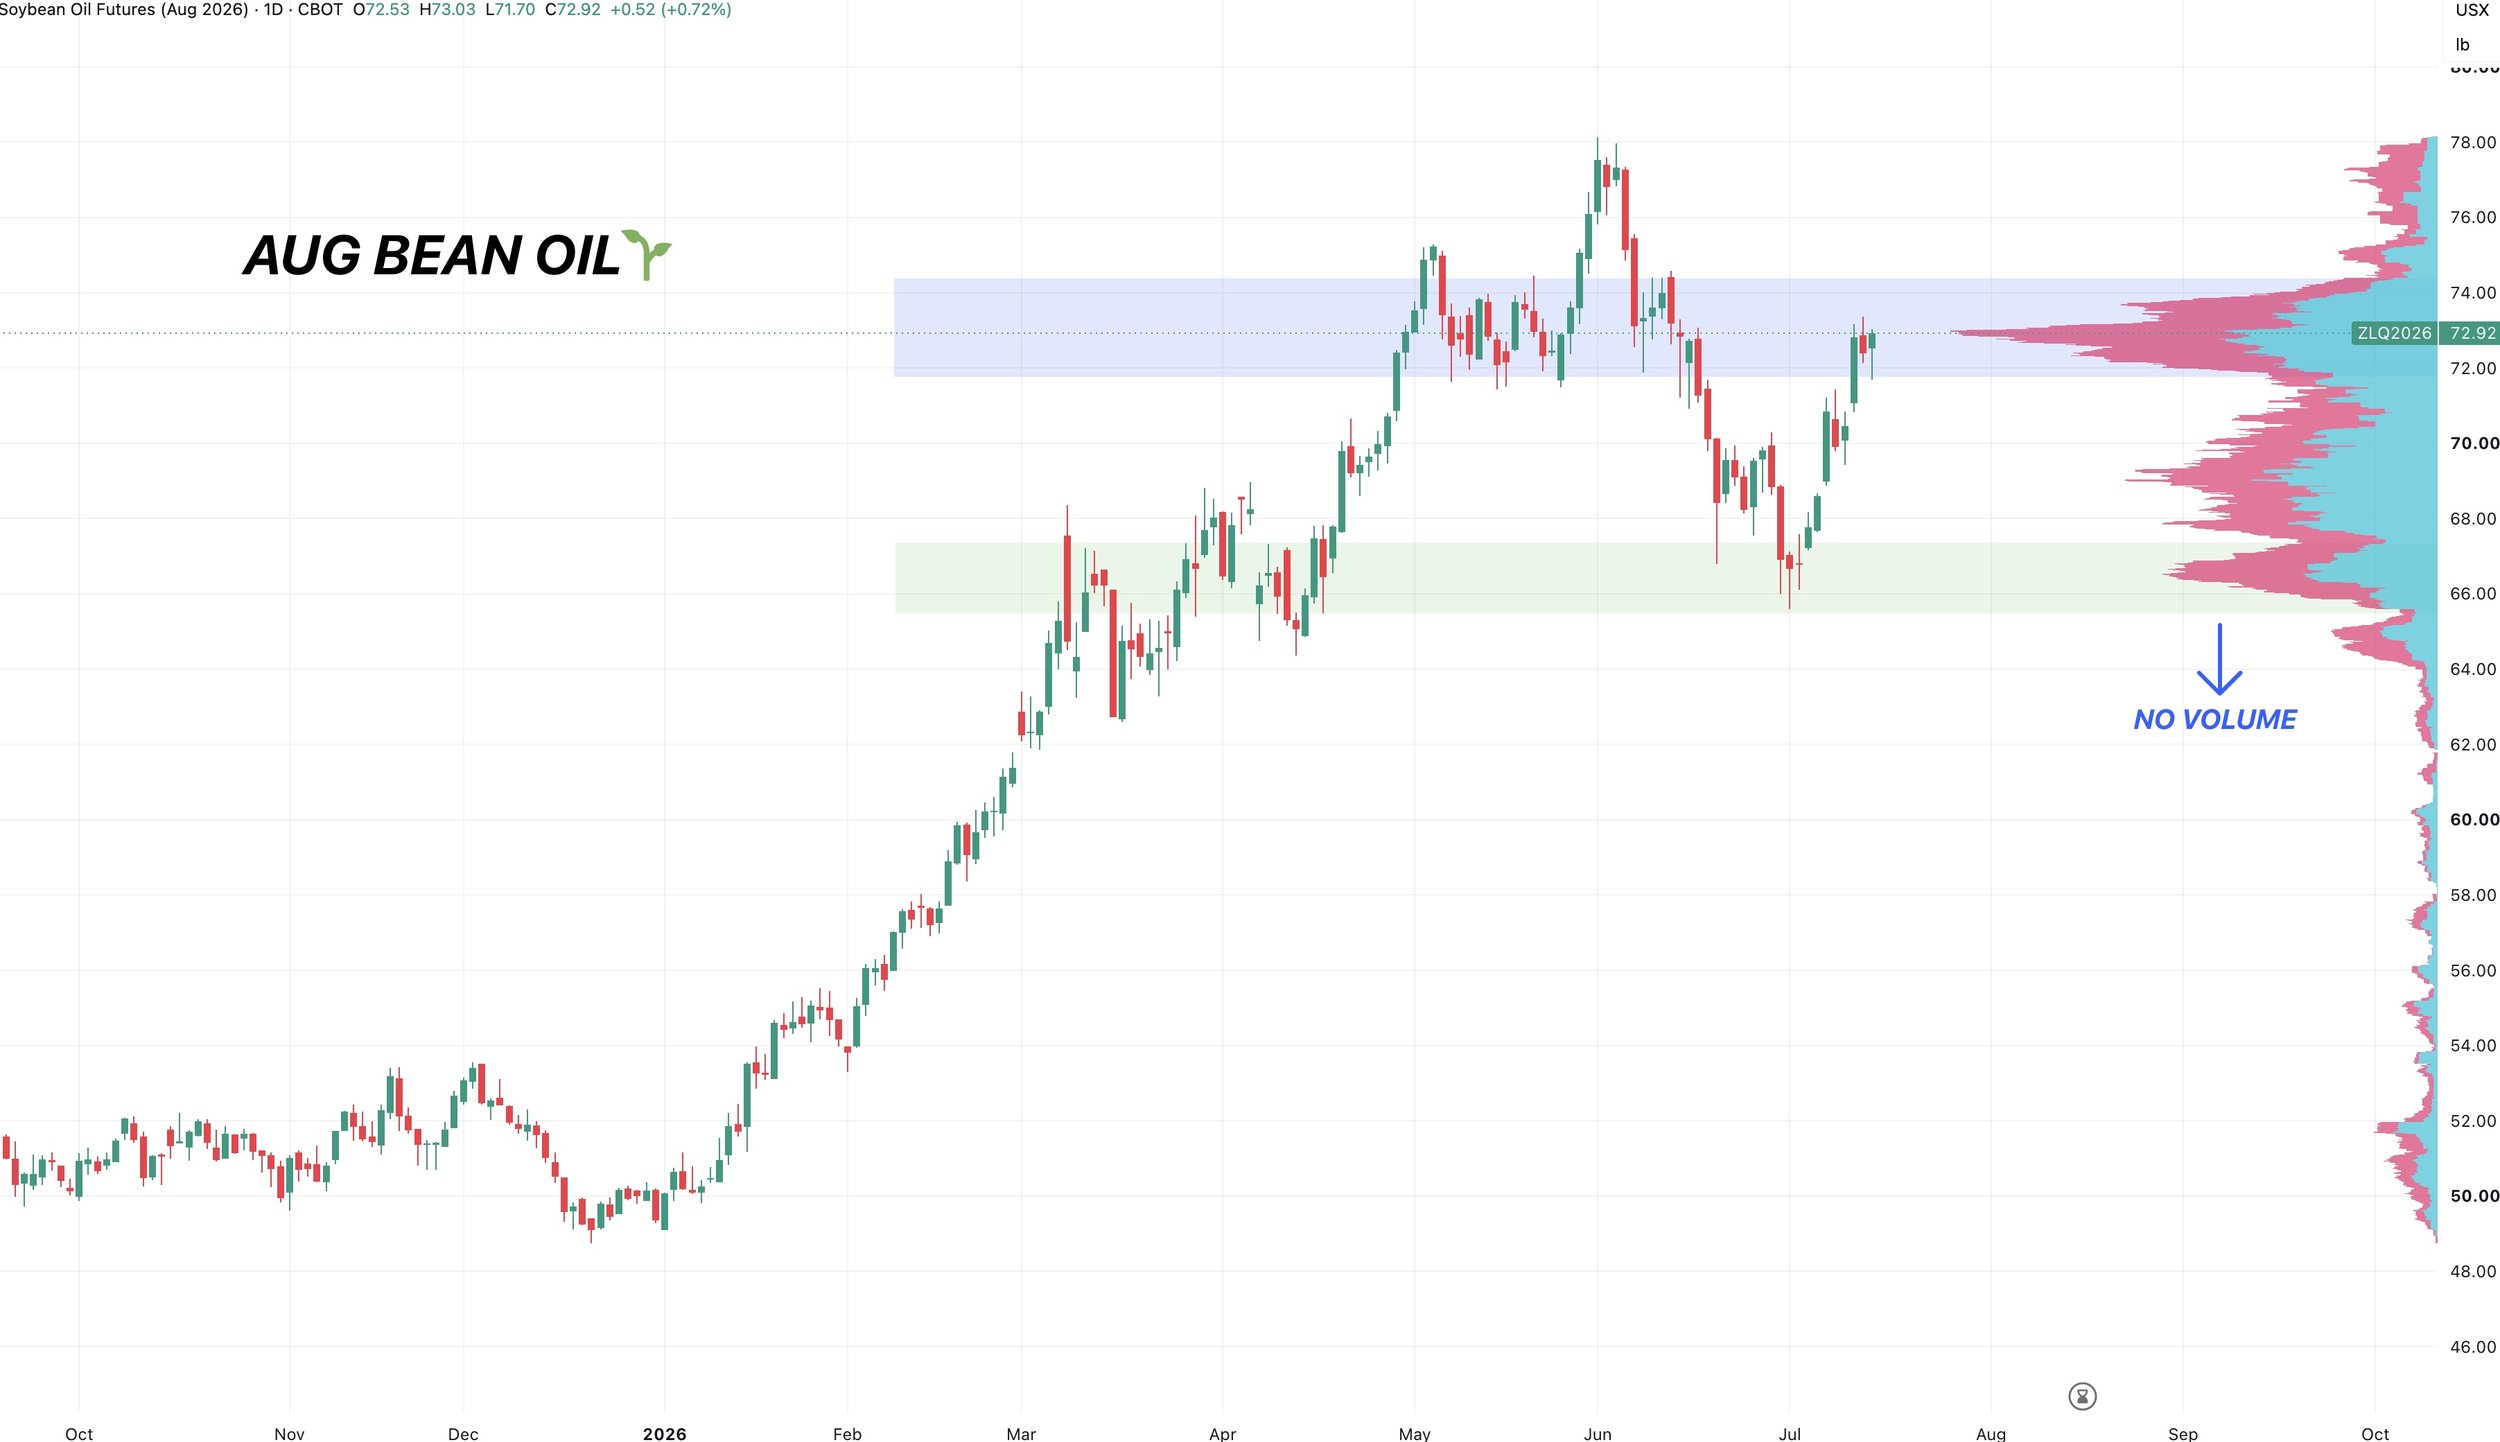
Aug Bean Oil Chart:
The funds continue to put their money where they mouth is in the soybean complex.
Bean oil continues to find support where it needs to.
I don’t see the funds getting short soybeans until bean oil breaks down and gives them a reason to.
Currently it's right sitting right in this volume shelf after finding support right where it needed to.
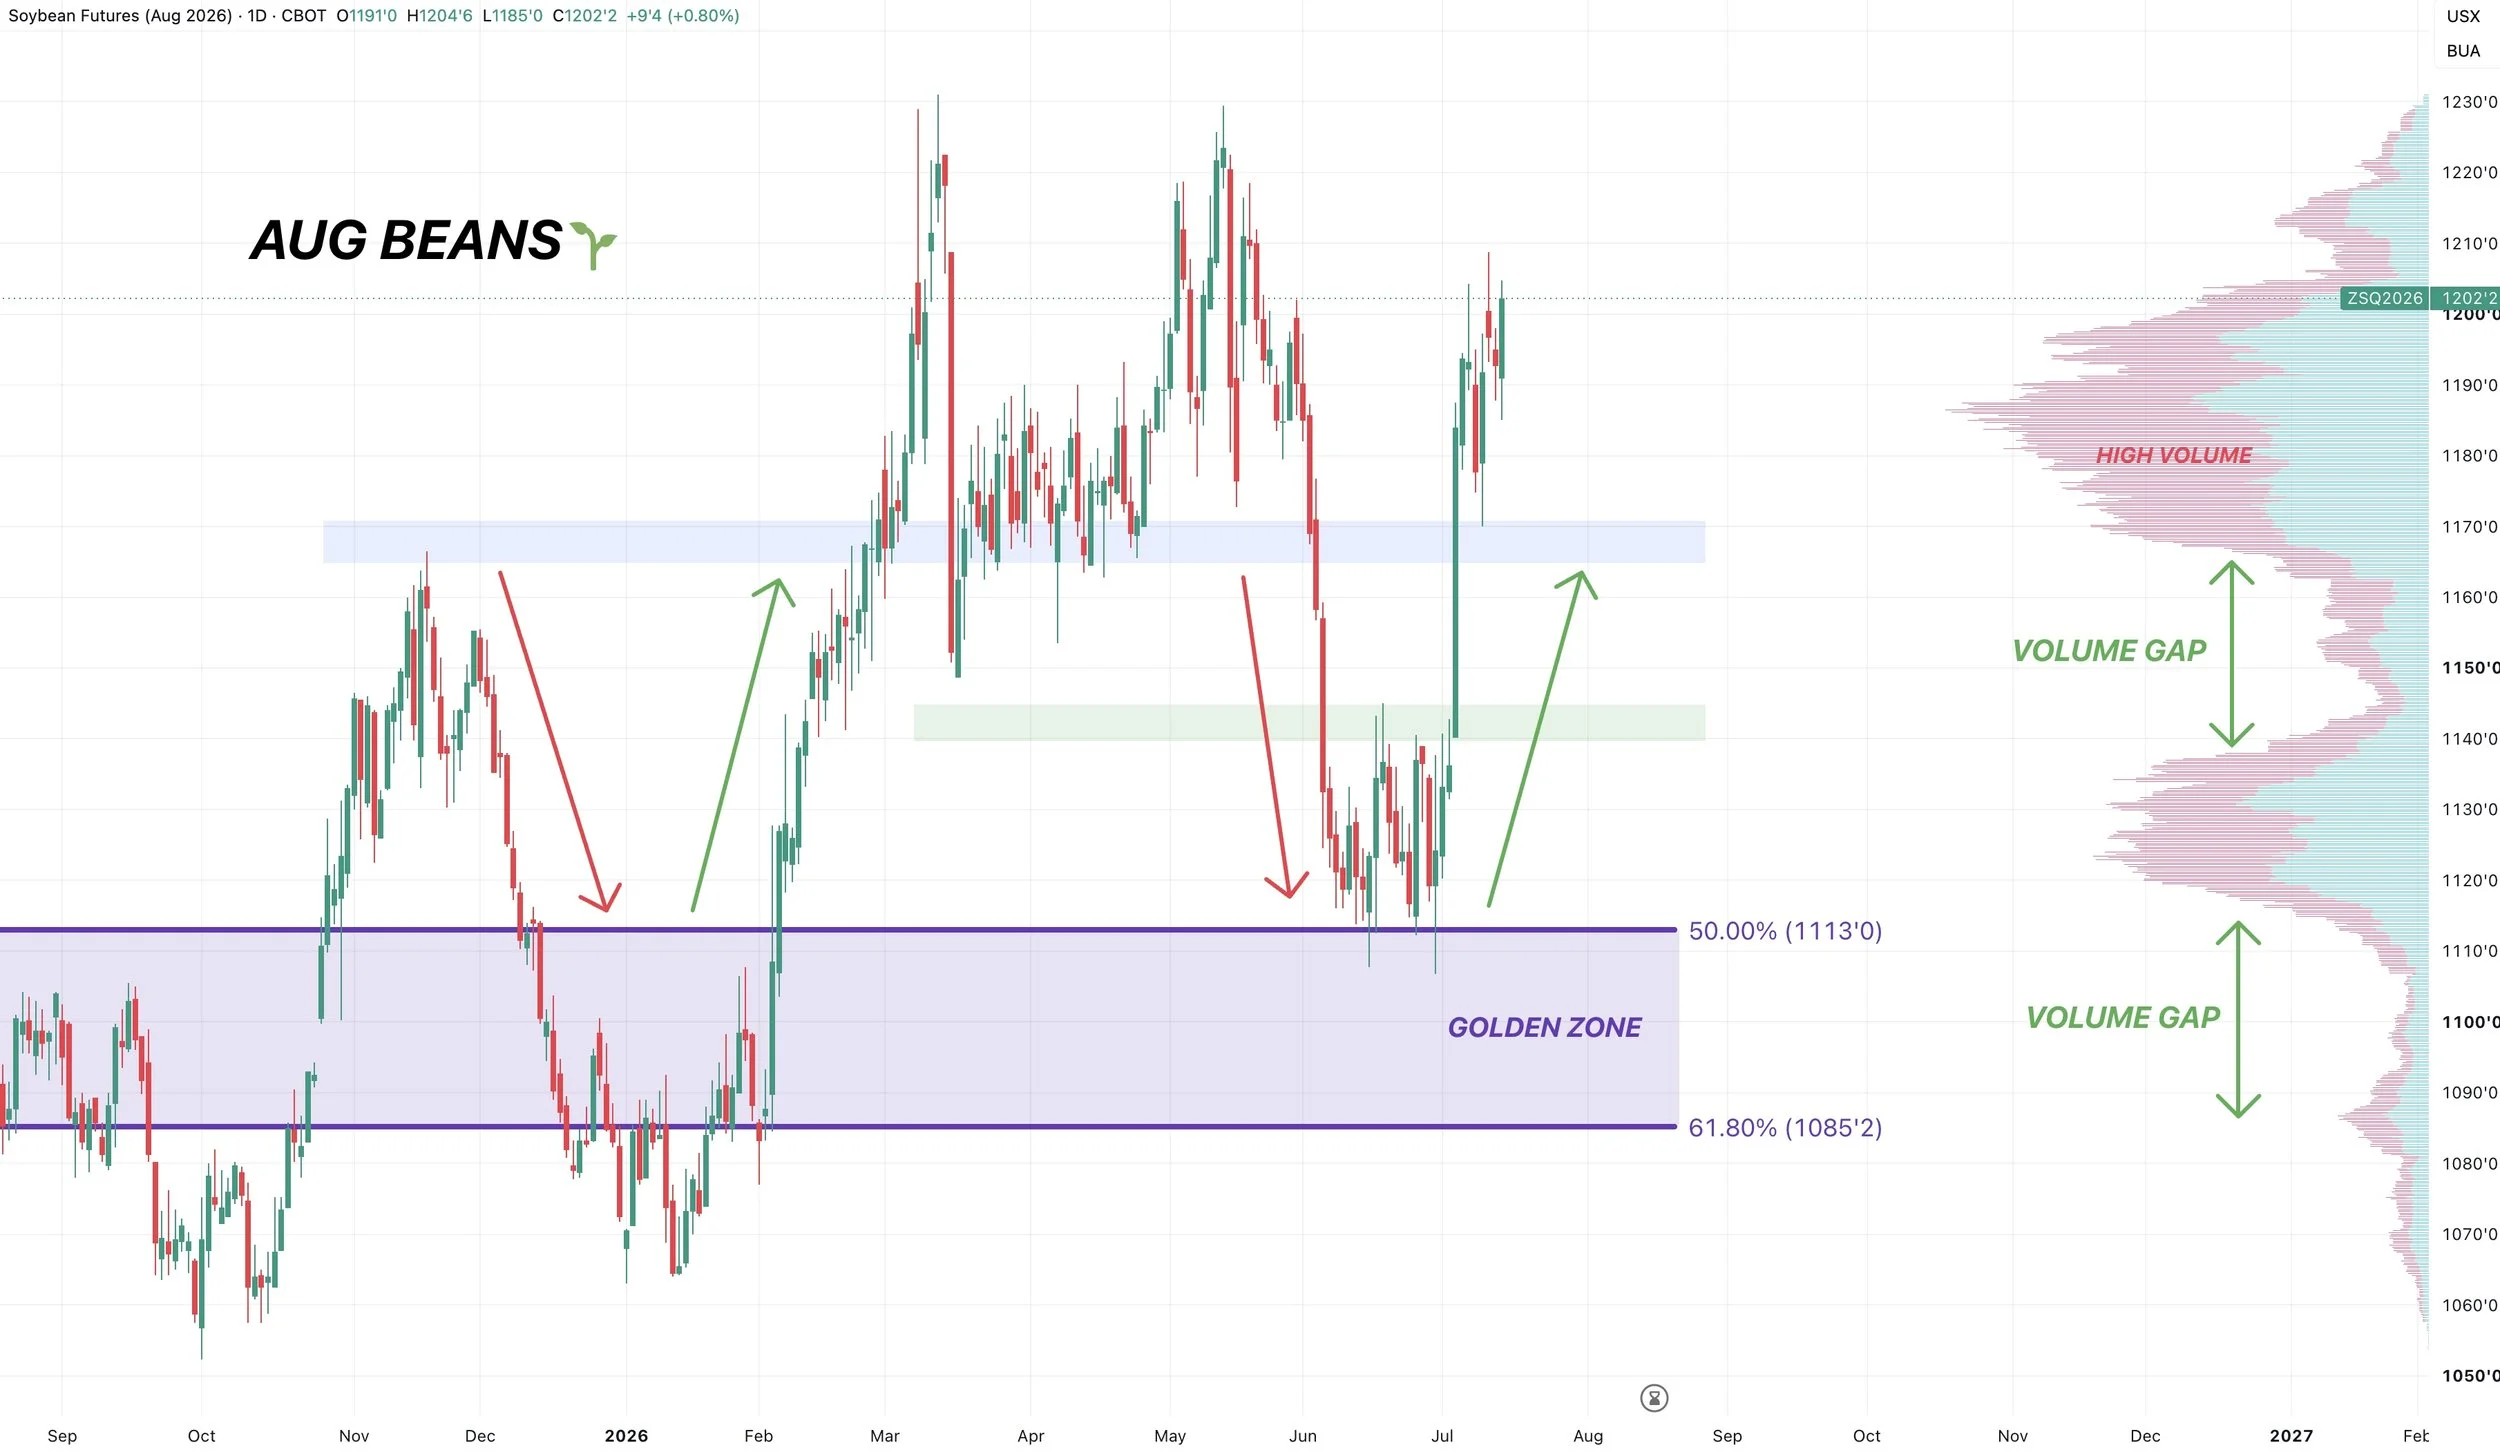
Aug Beans Chart:
We got our first close above $12.00 in both contracts since May.
Currently still chopping around in this are of high volume.
If we are able to take out Monday's highs, then the next test is really going to be the double top from March and May.
Overall bulls simply want to hold the $11.65 level. As below there, there is a gap of air to the downside.
Everytime we've traded in that volume gap we have ran right through it.
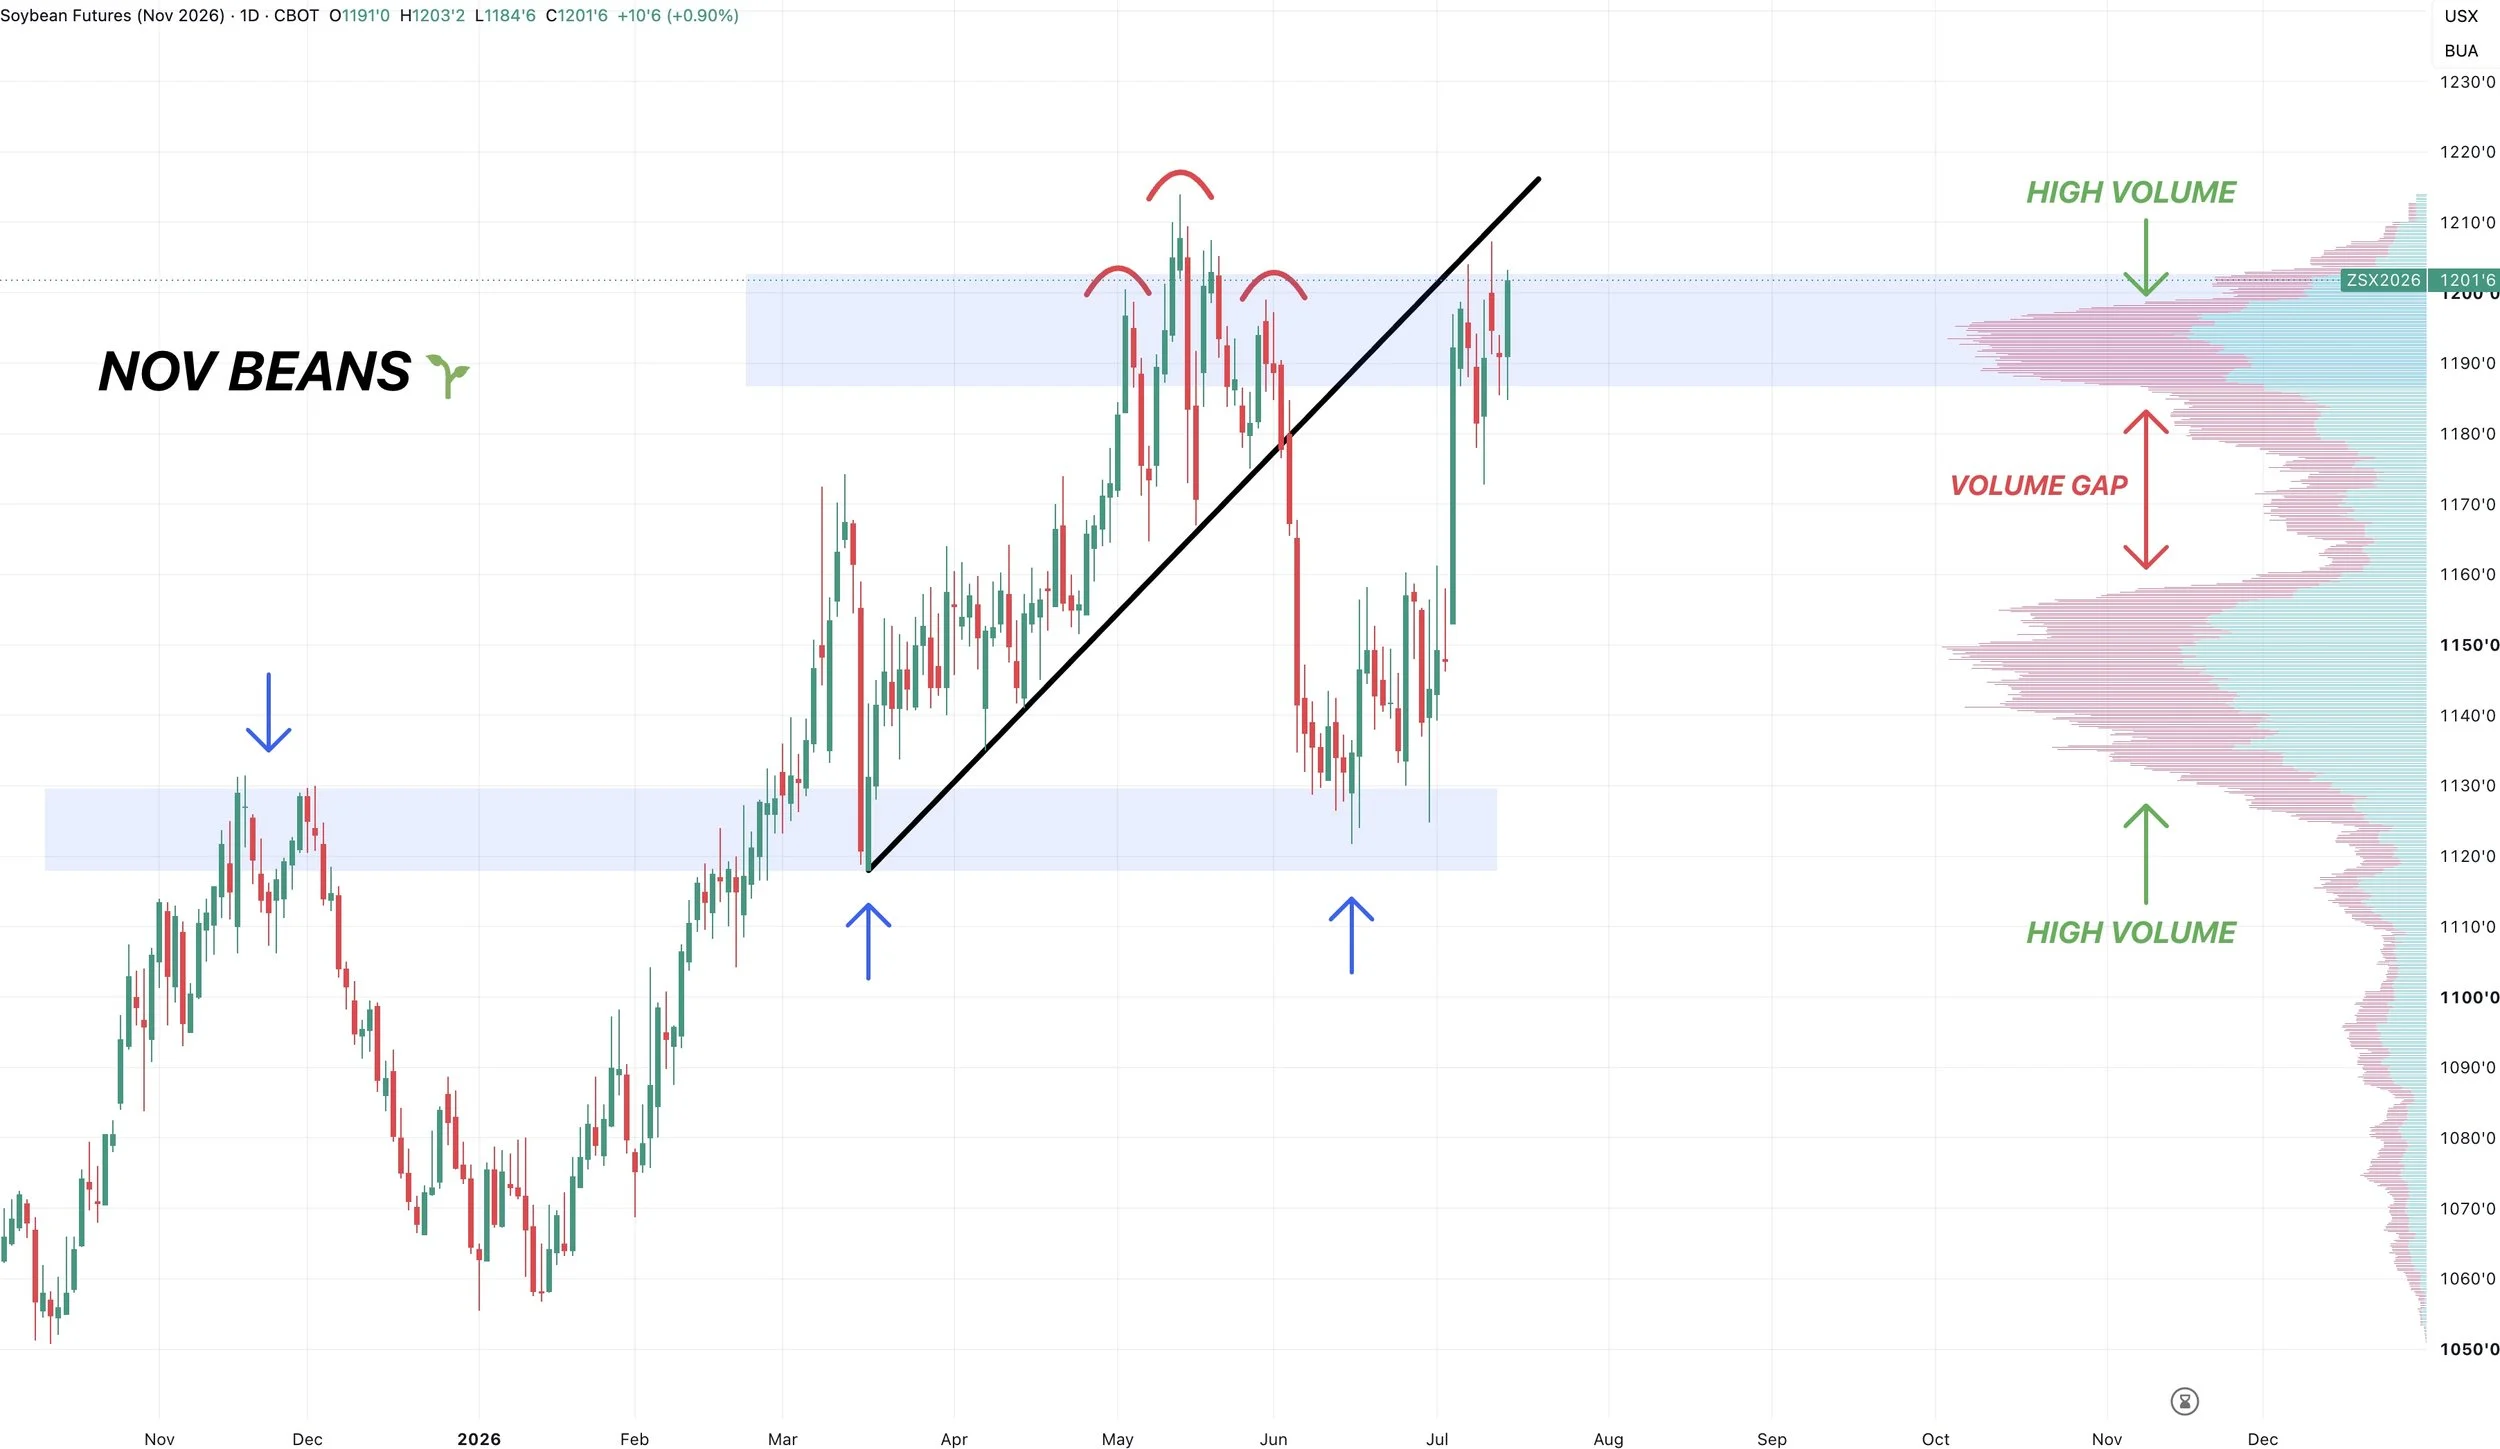
Nov Beans Chart:
Still hovering around this area of high volume near those May highs.
If we fail here, there is a gap of air to the downside.
On the other hand, if we are able to bust above the May highs, there is room to run.
Essentially in no mans land here waiting for direction.
Last week we had that sell signal up at these levels.
We do still like defending these levels if you have not. Sitting at our highest levels we've had all year once again.
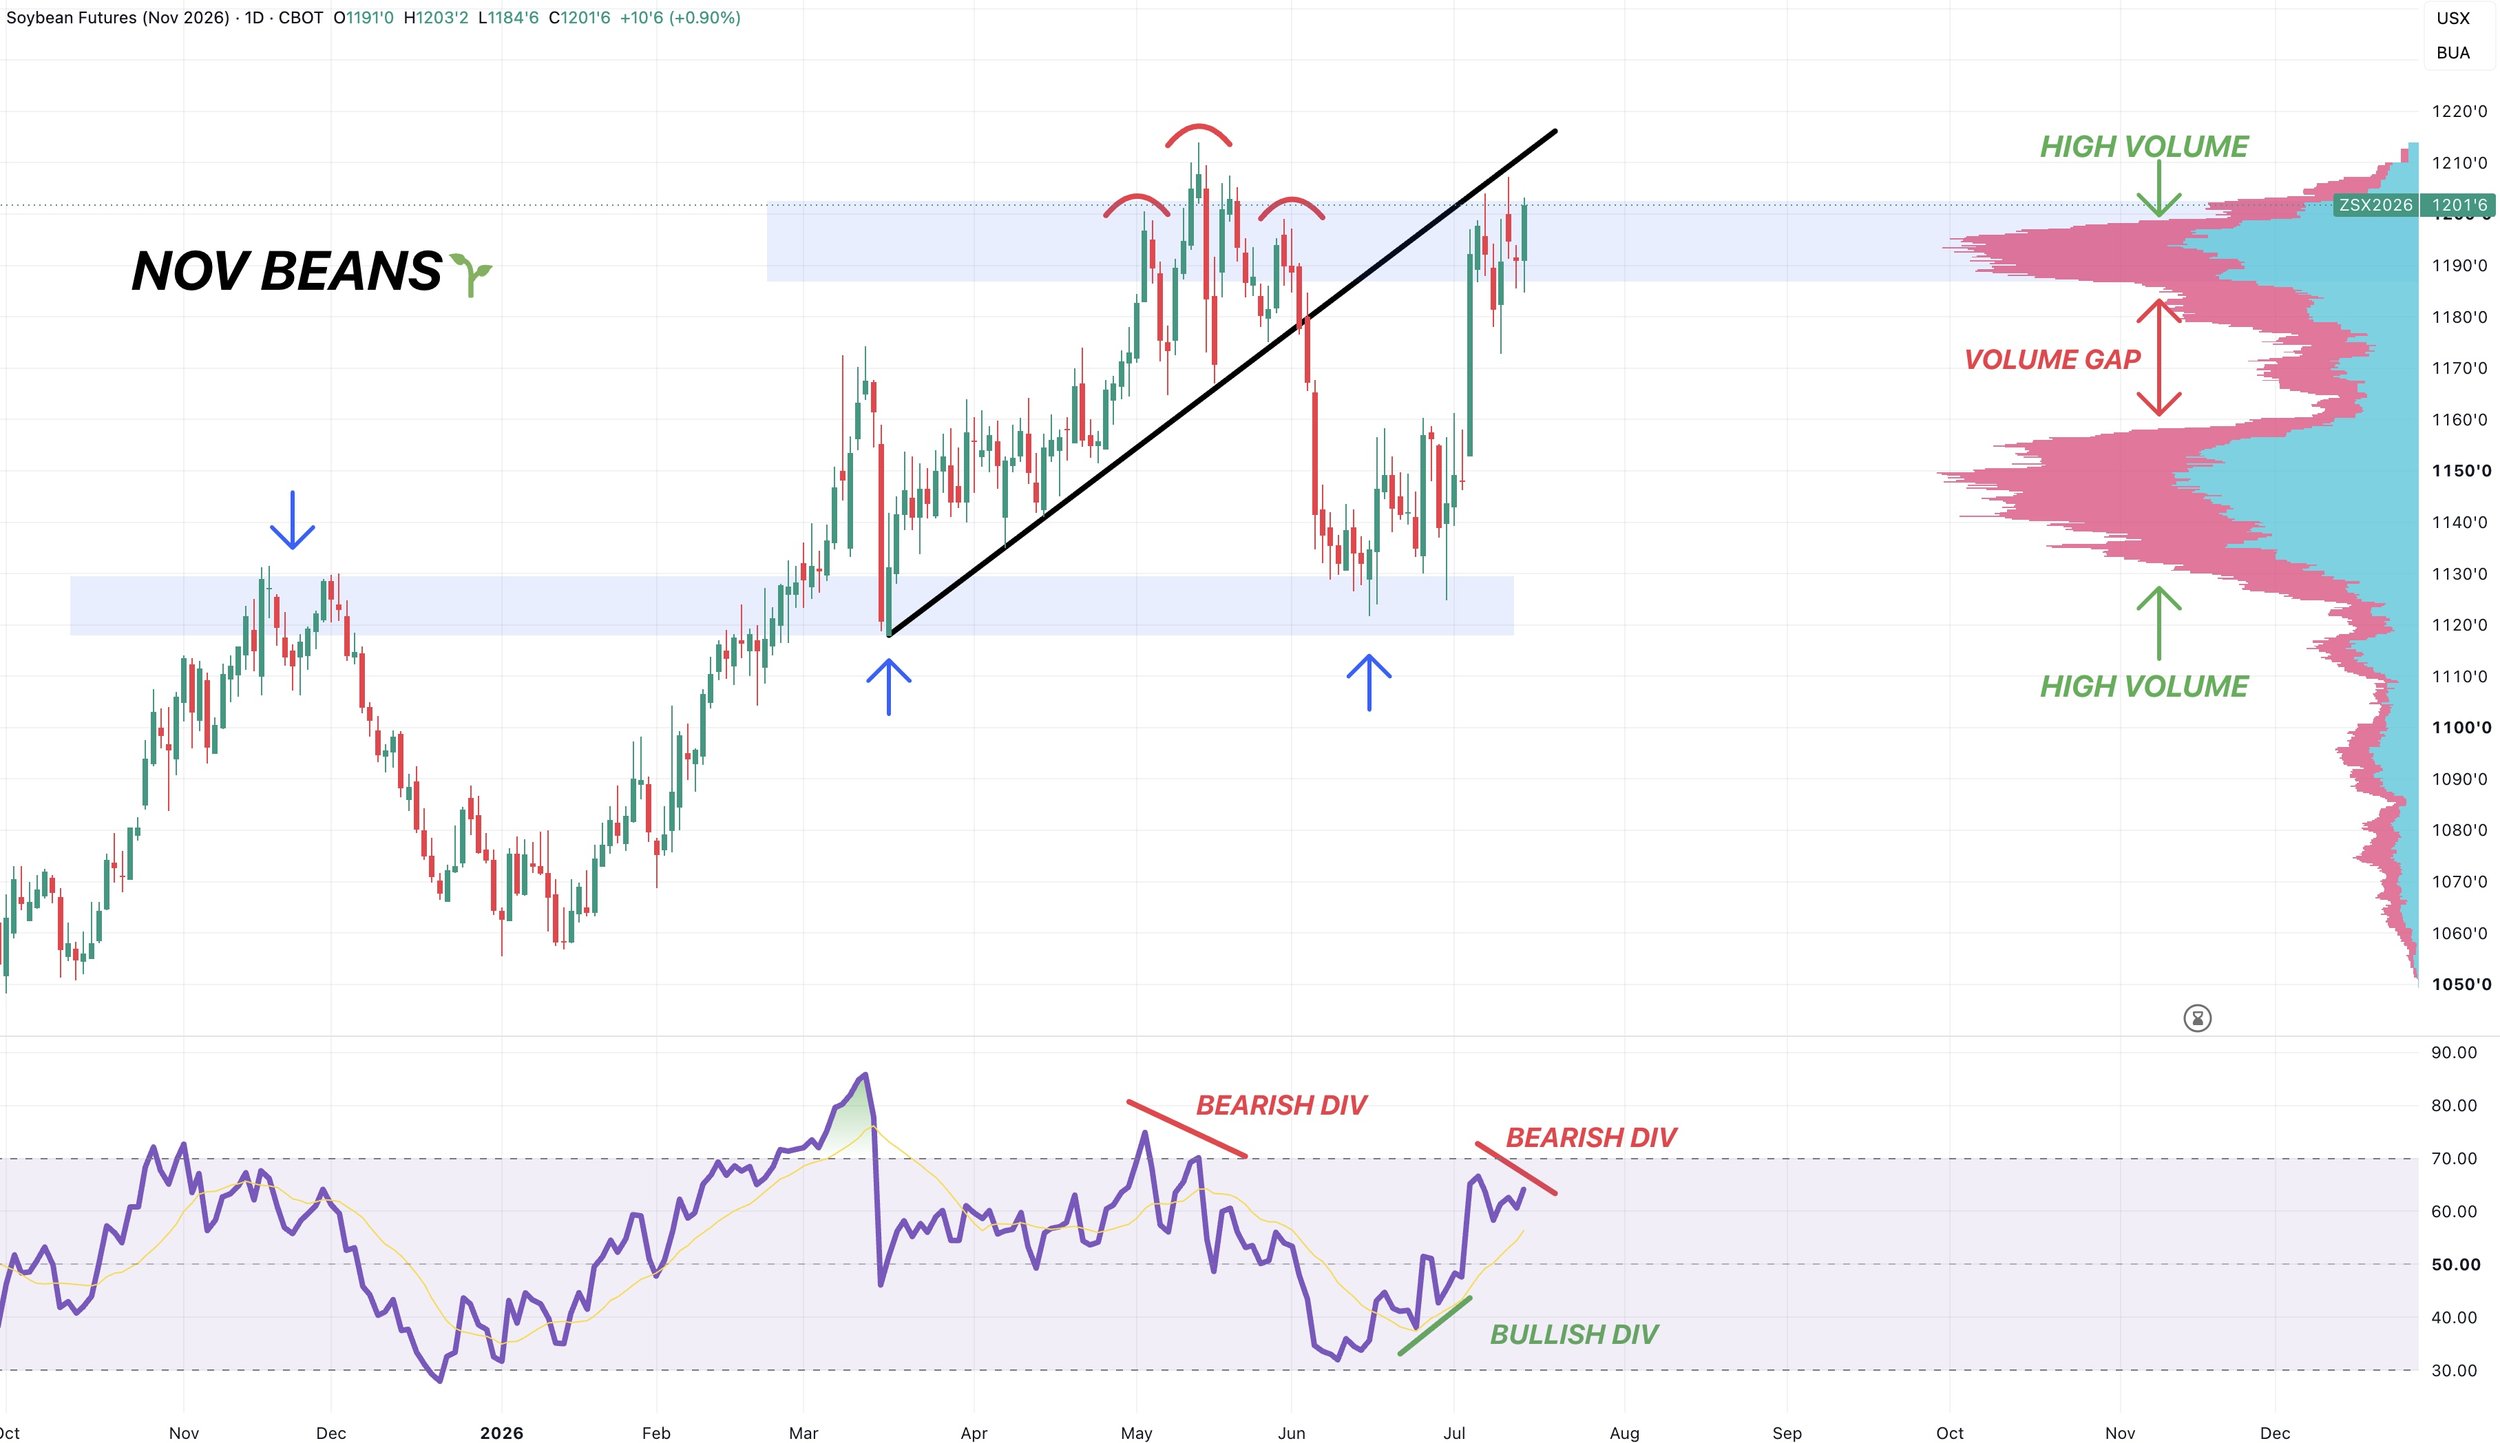
One reason I am slightly cautious short term up at these highs is that we do have some potential bearish divergence on the RSI.
Prices made new highs. The RSI did not. Which can be a sign of weakening momentum.
Possible Long Term Target:
Here is a possible long term bull case scenario target if we are able to post new highs.
No this does not have to happen. But is possible if things start to turn really bullish.
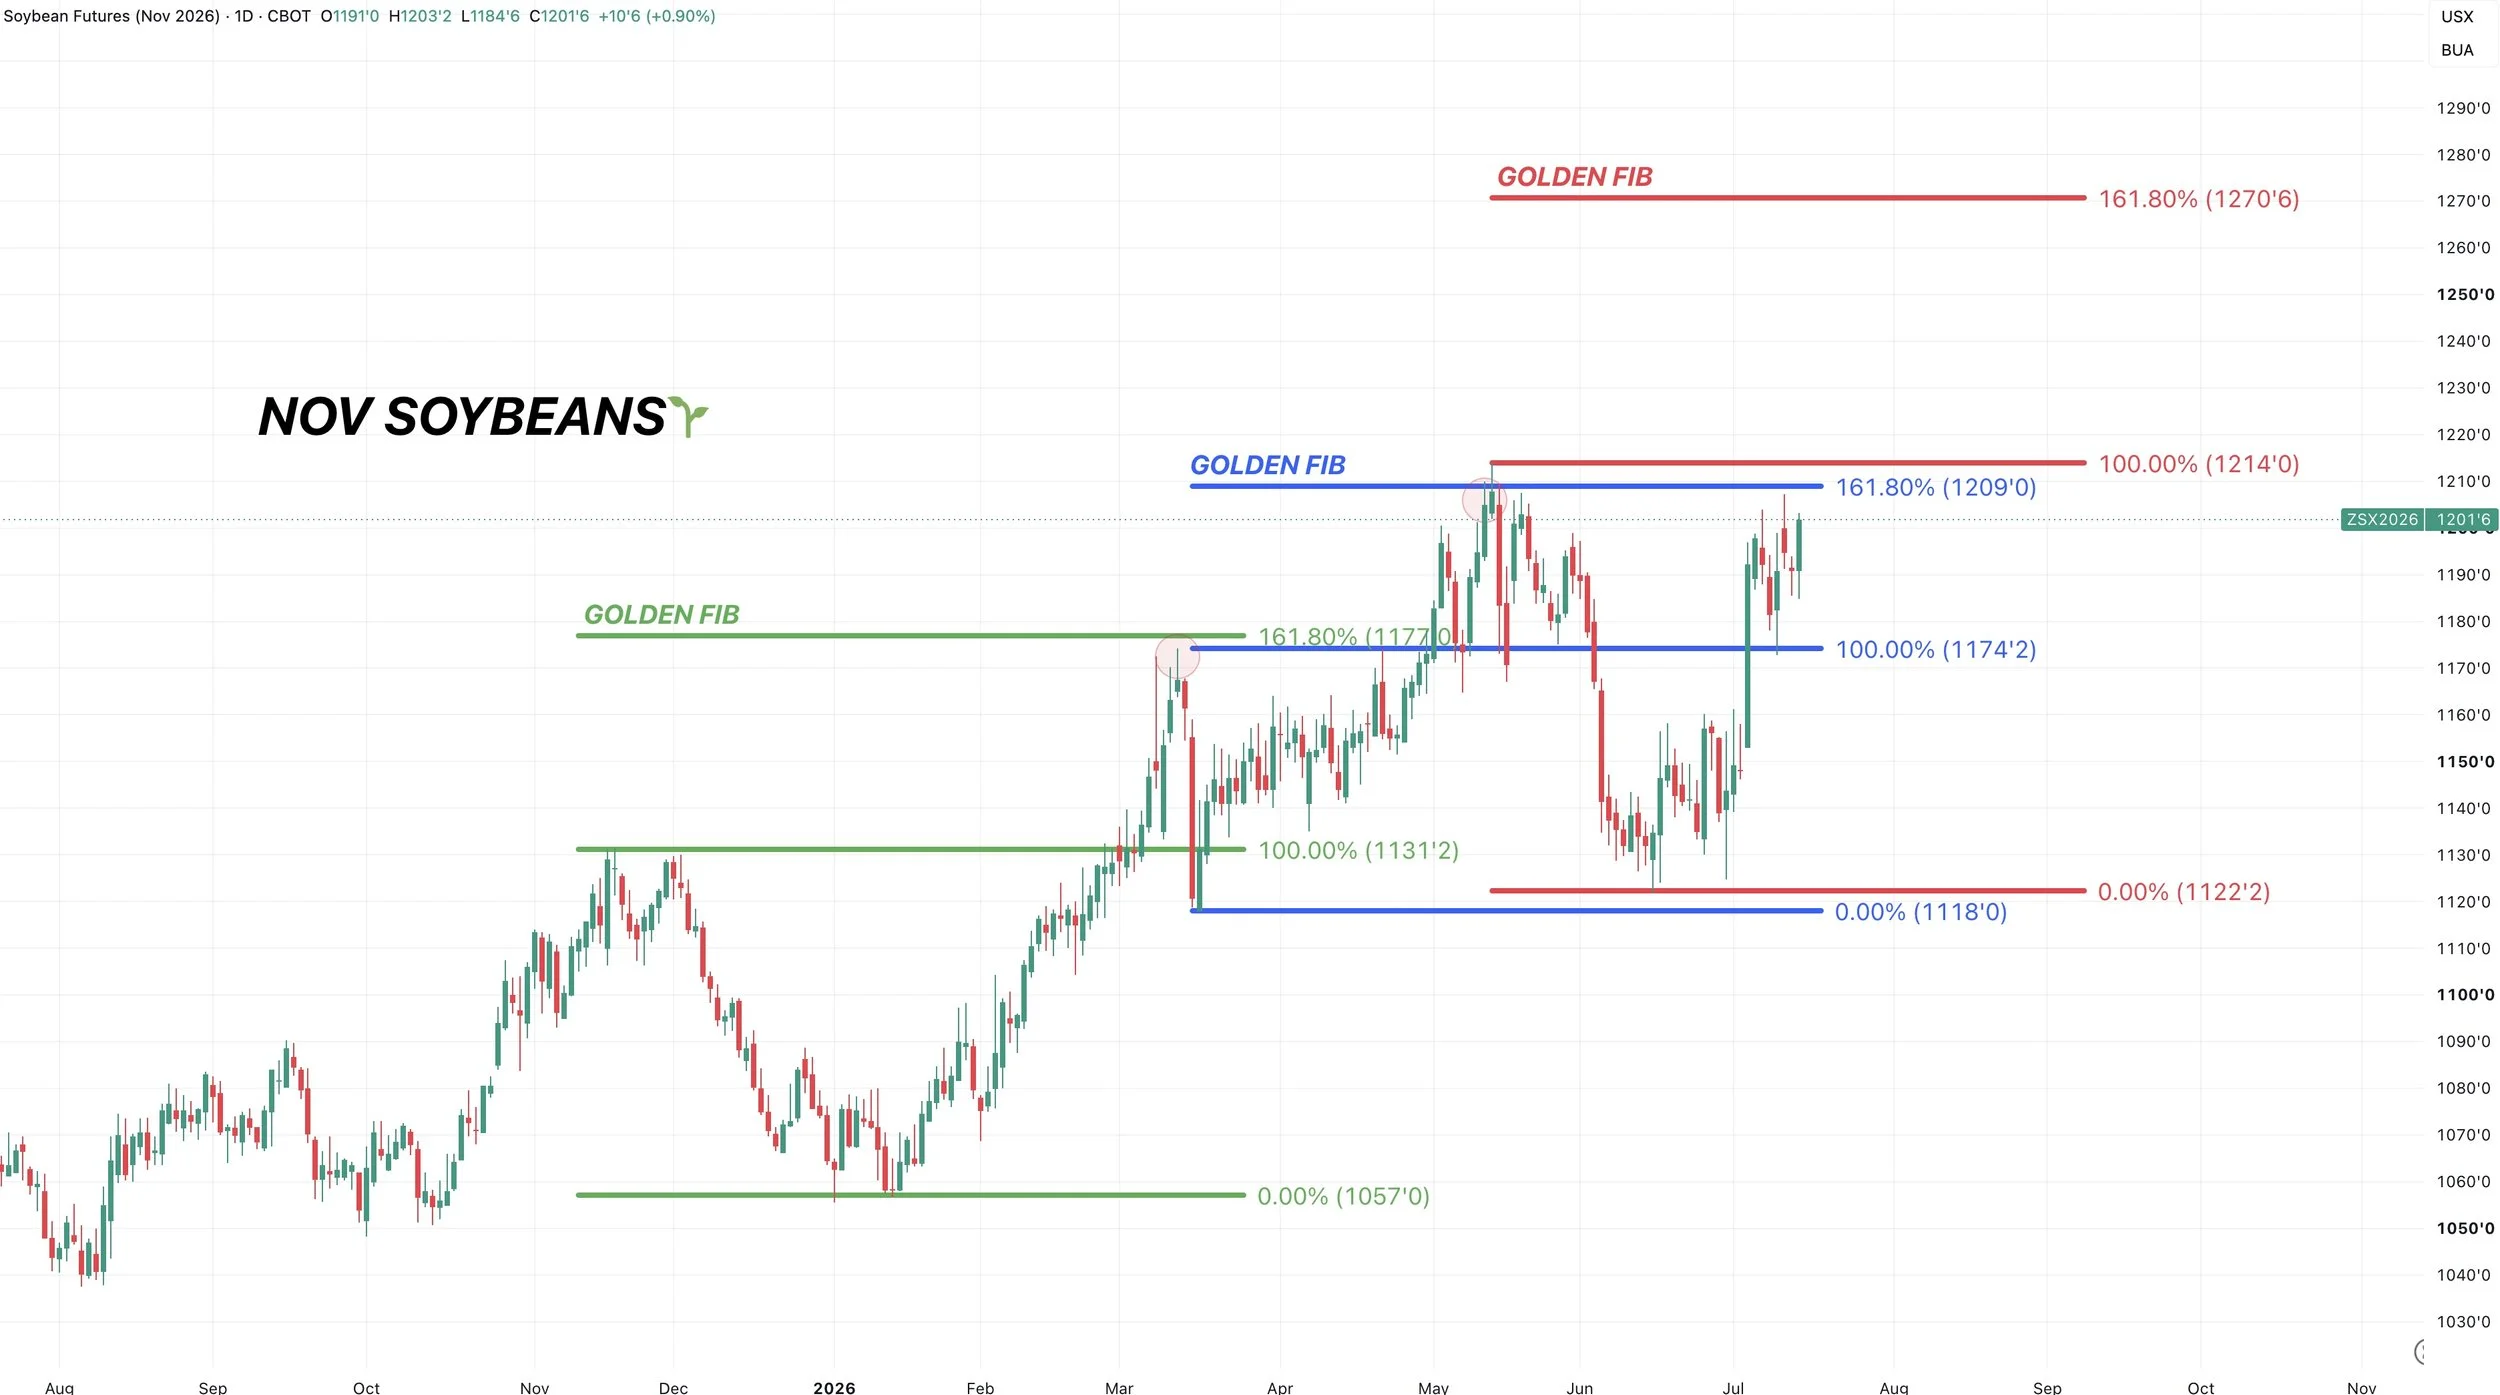
The golden fib (161.8%) of the recent lows up to the May highs comes in at $12.70
Interestingly enough, the last two highs were marked by the golden fib from the previous rally.
The highs in March and the highs in May.
If this chart is hard to follow along, basically you take the previous low up to the previous high, then 161.8% of that move is the golden fib.
So the March highs were 161.8% of the Jan lows up to the Nov highs from last year.
The May highs were 161.8% of the March lows up to the March highs.
Wheat
No one knows exactly how long this Russia event is going to last.
If it only lasts a week, it might not be a big deal. It could just be another one of those war rallies that gets sold.
But if Russia's exports get restricted for a month or two, it could have pretty major impacts on the wheat market. As a result, we could expect wheat to head higher.
Accompany that with some declining crops in Europe and the worst US crop of all time, and you have yourself a possible story.
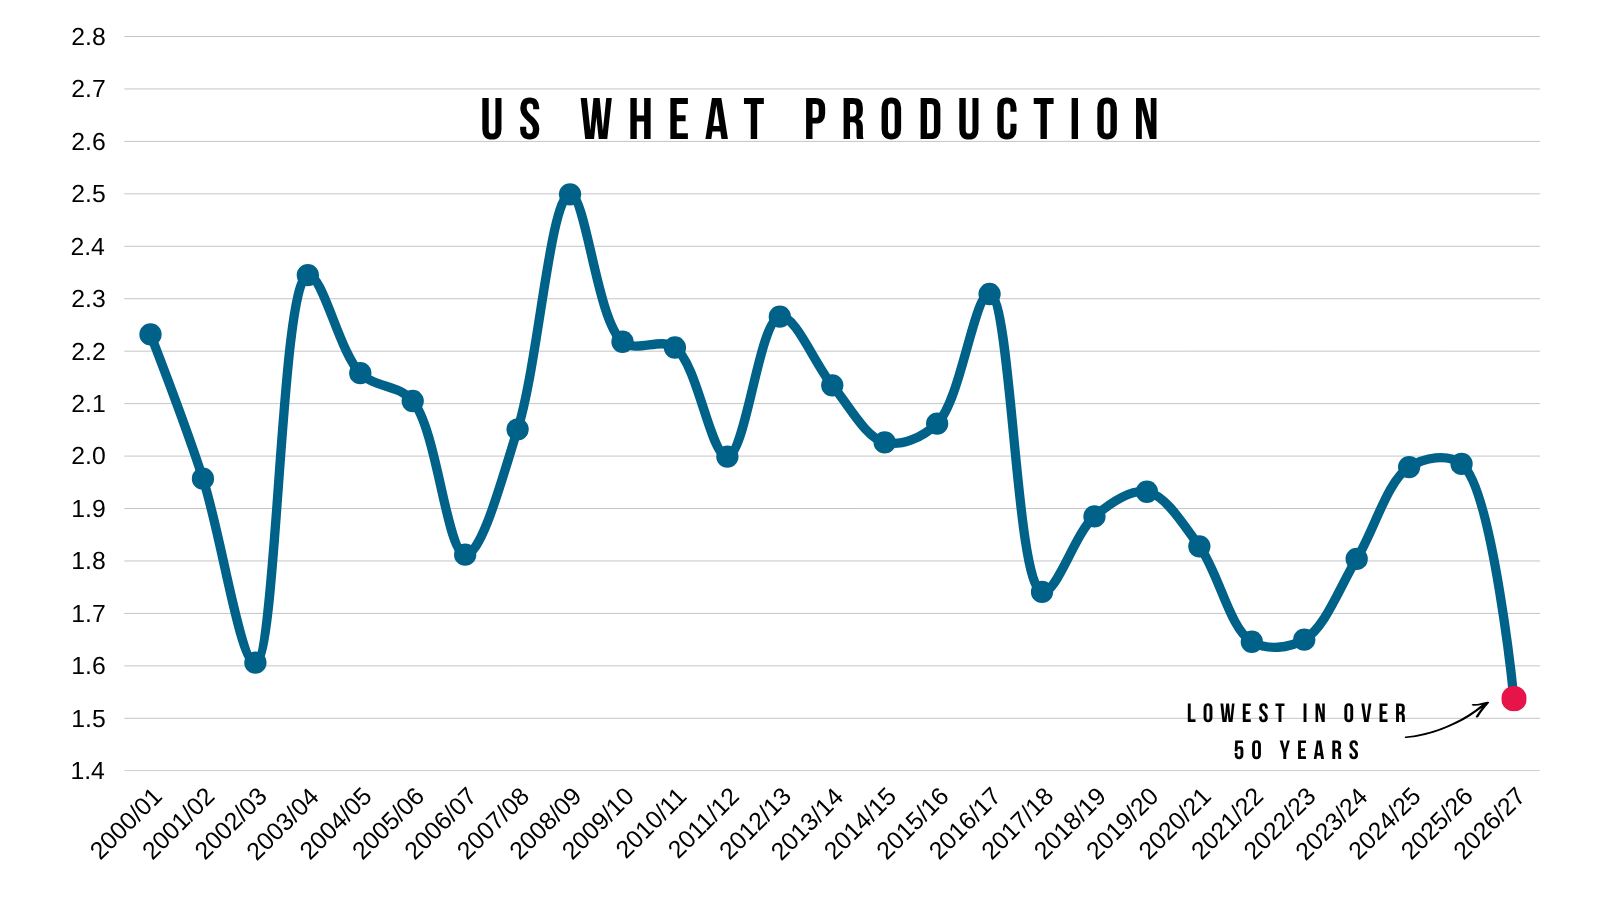
Long term we also have the lingering impacts from fertilizer.
When wheat sold off, everyone was simply saying that wheat is a global crop. So the US drought didn’t matter that much.
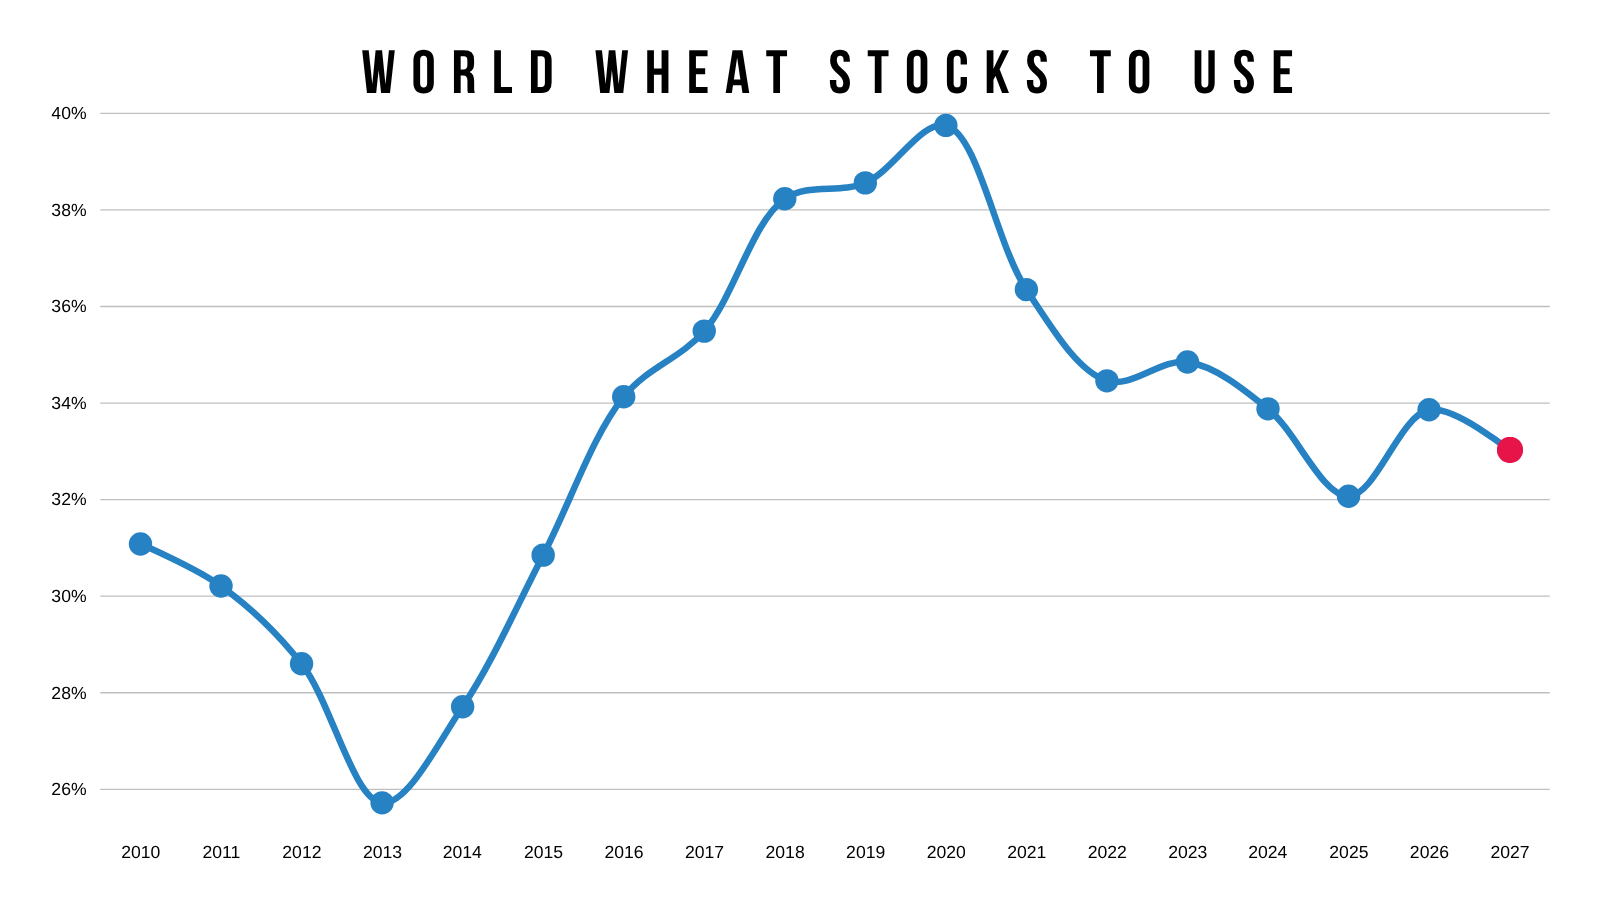
Which is a valid arguement. However, look at the world wheat situation.
It's actually been getting tigher.
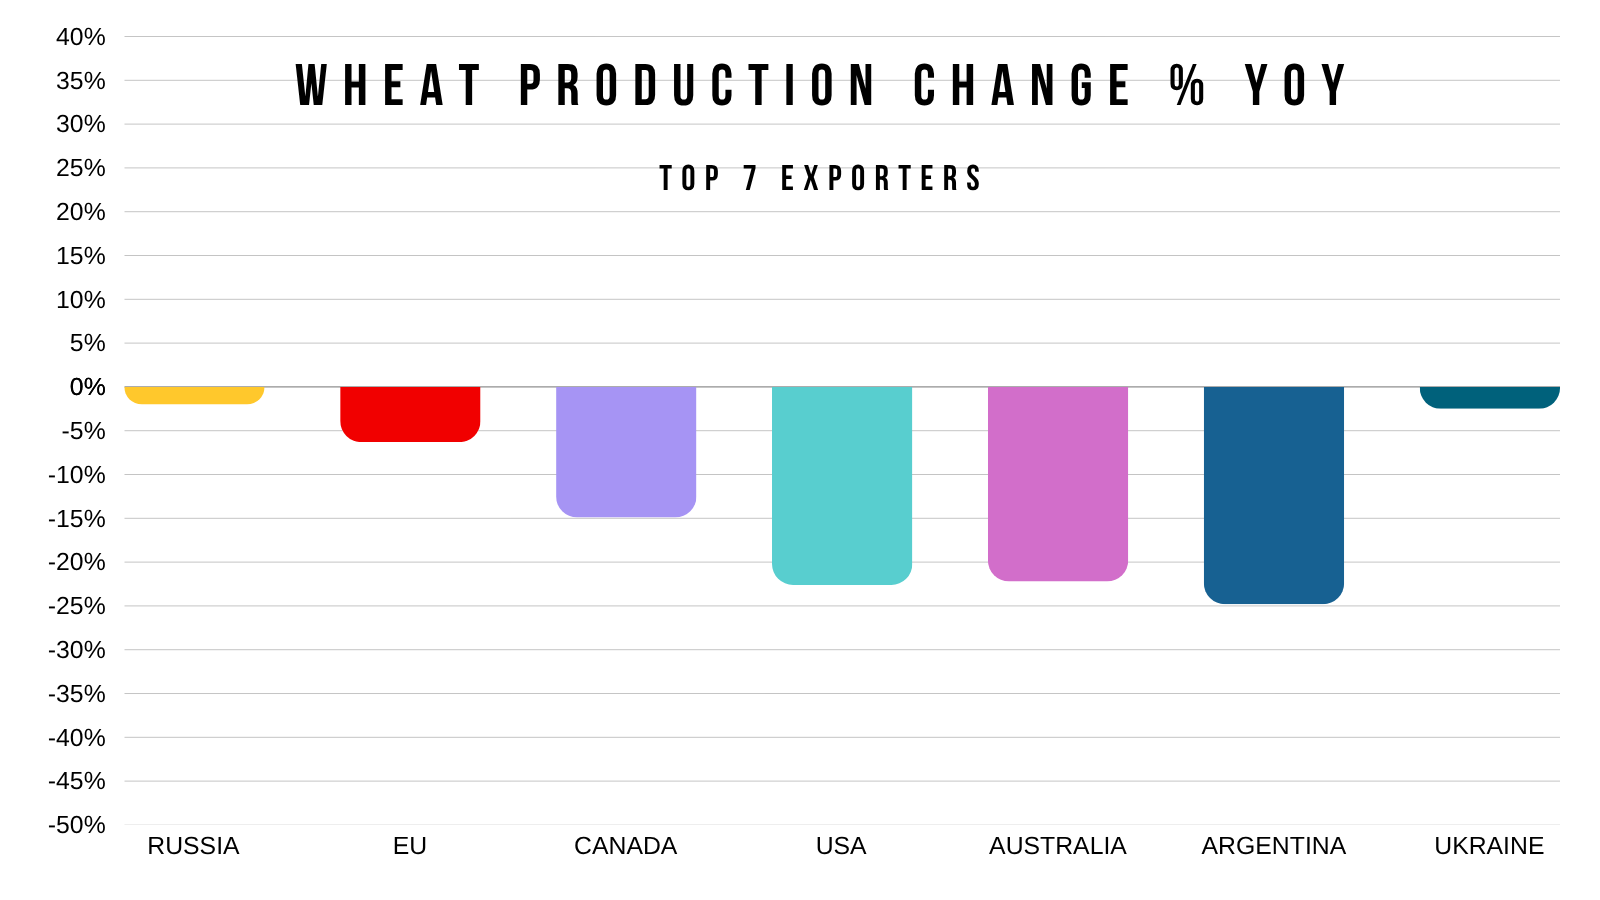
The USDA is already expecting every major exporter of wheat to produce less wheat than they did last year.
With 4 of the top exporters seeing a double digit decline.
Imagine what happens if Russia's exports get restricted.
So I think wheat has plenty of potential long term.
But short term it's really going to come down to how long this Black Sea event lasts or doesn’t last.
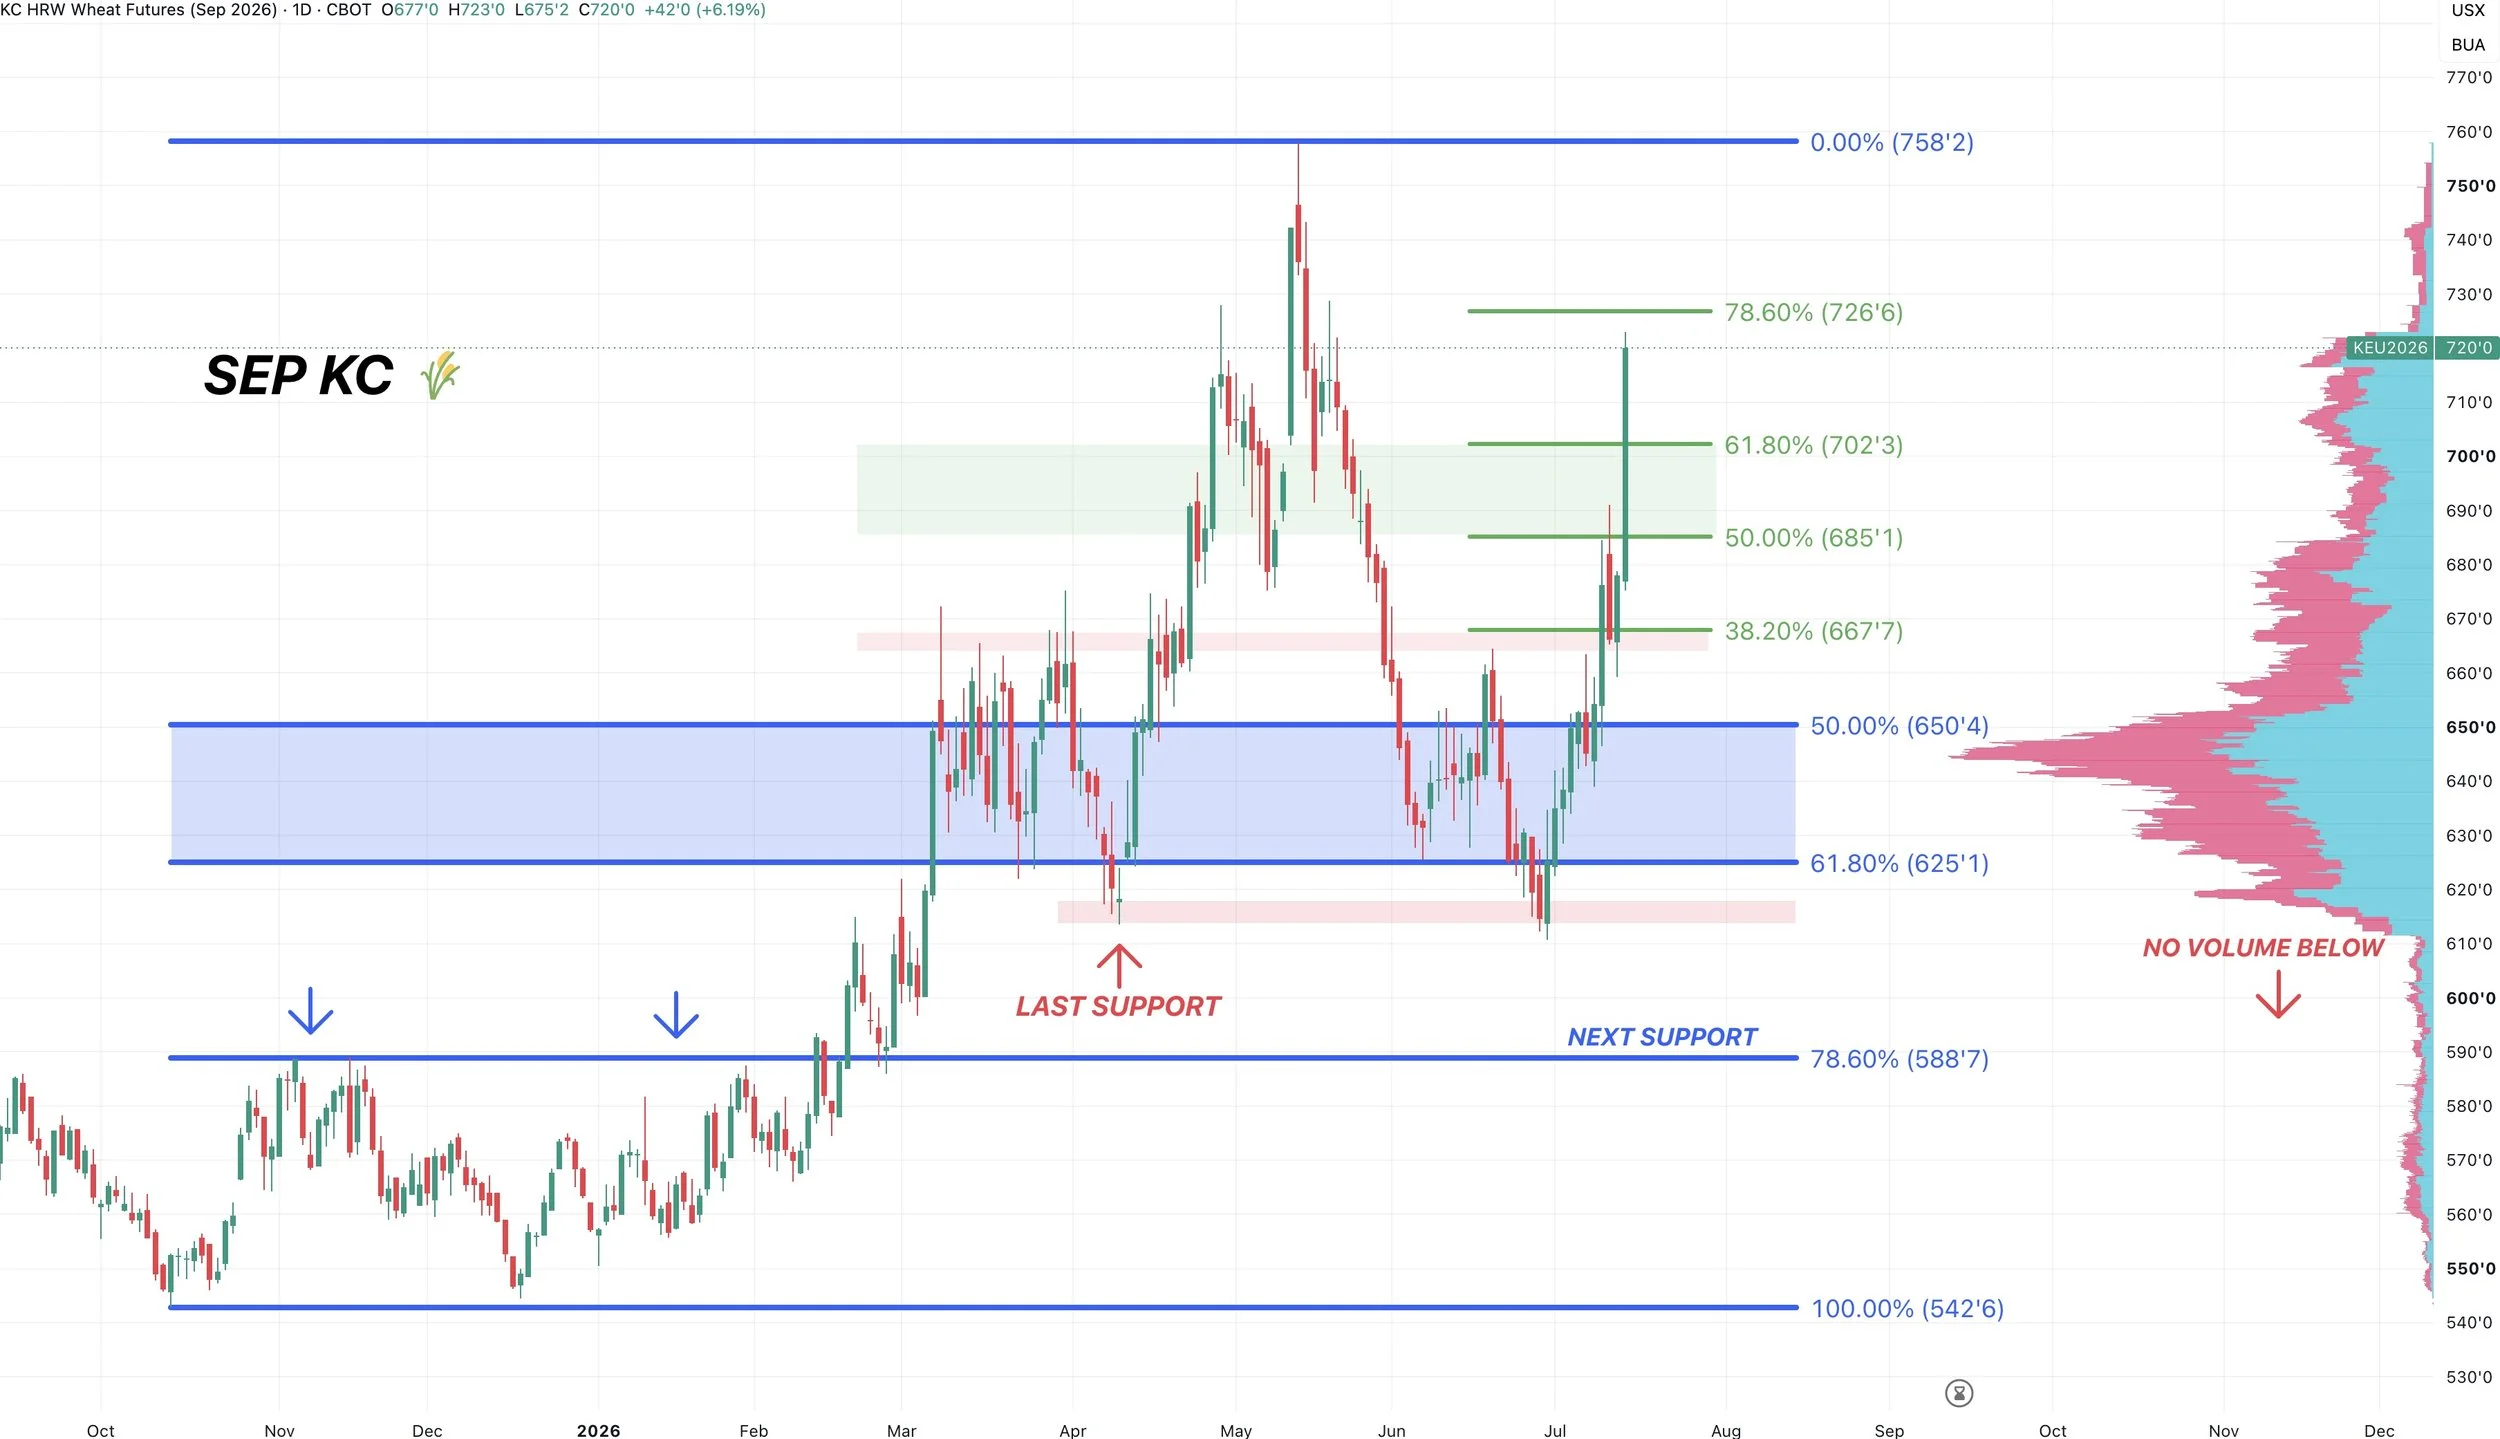
Sep KC Chart:
Today we had our 3rd highest close of the year. After trading limit up.
KC wheat broke above that golden zone. Which is a good sign, as it opens the door to challenge the highs.
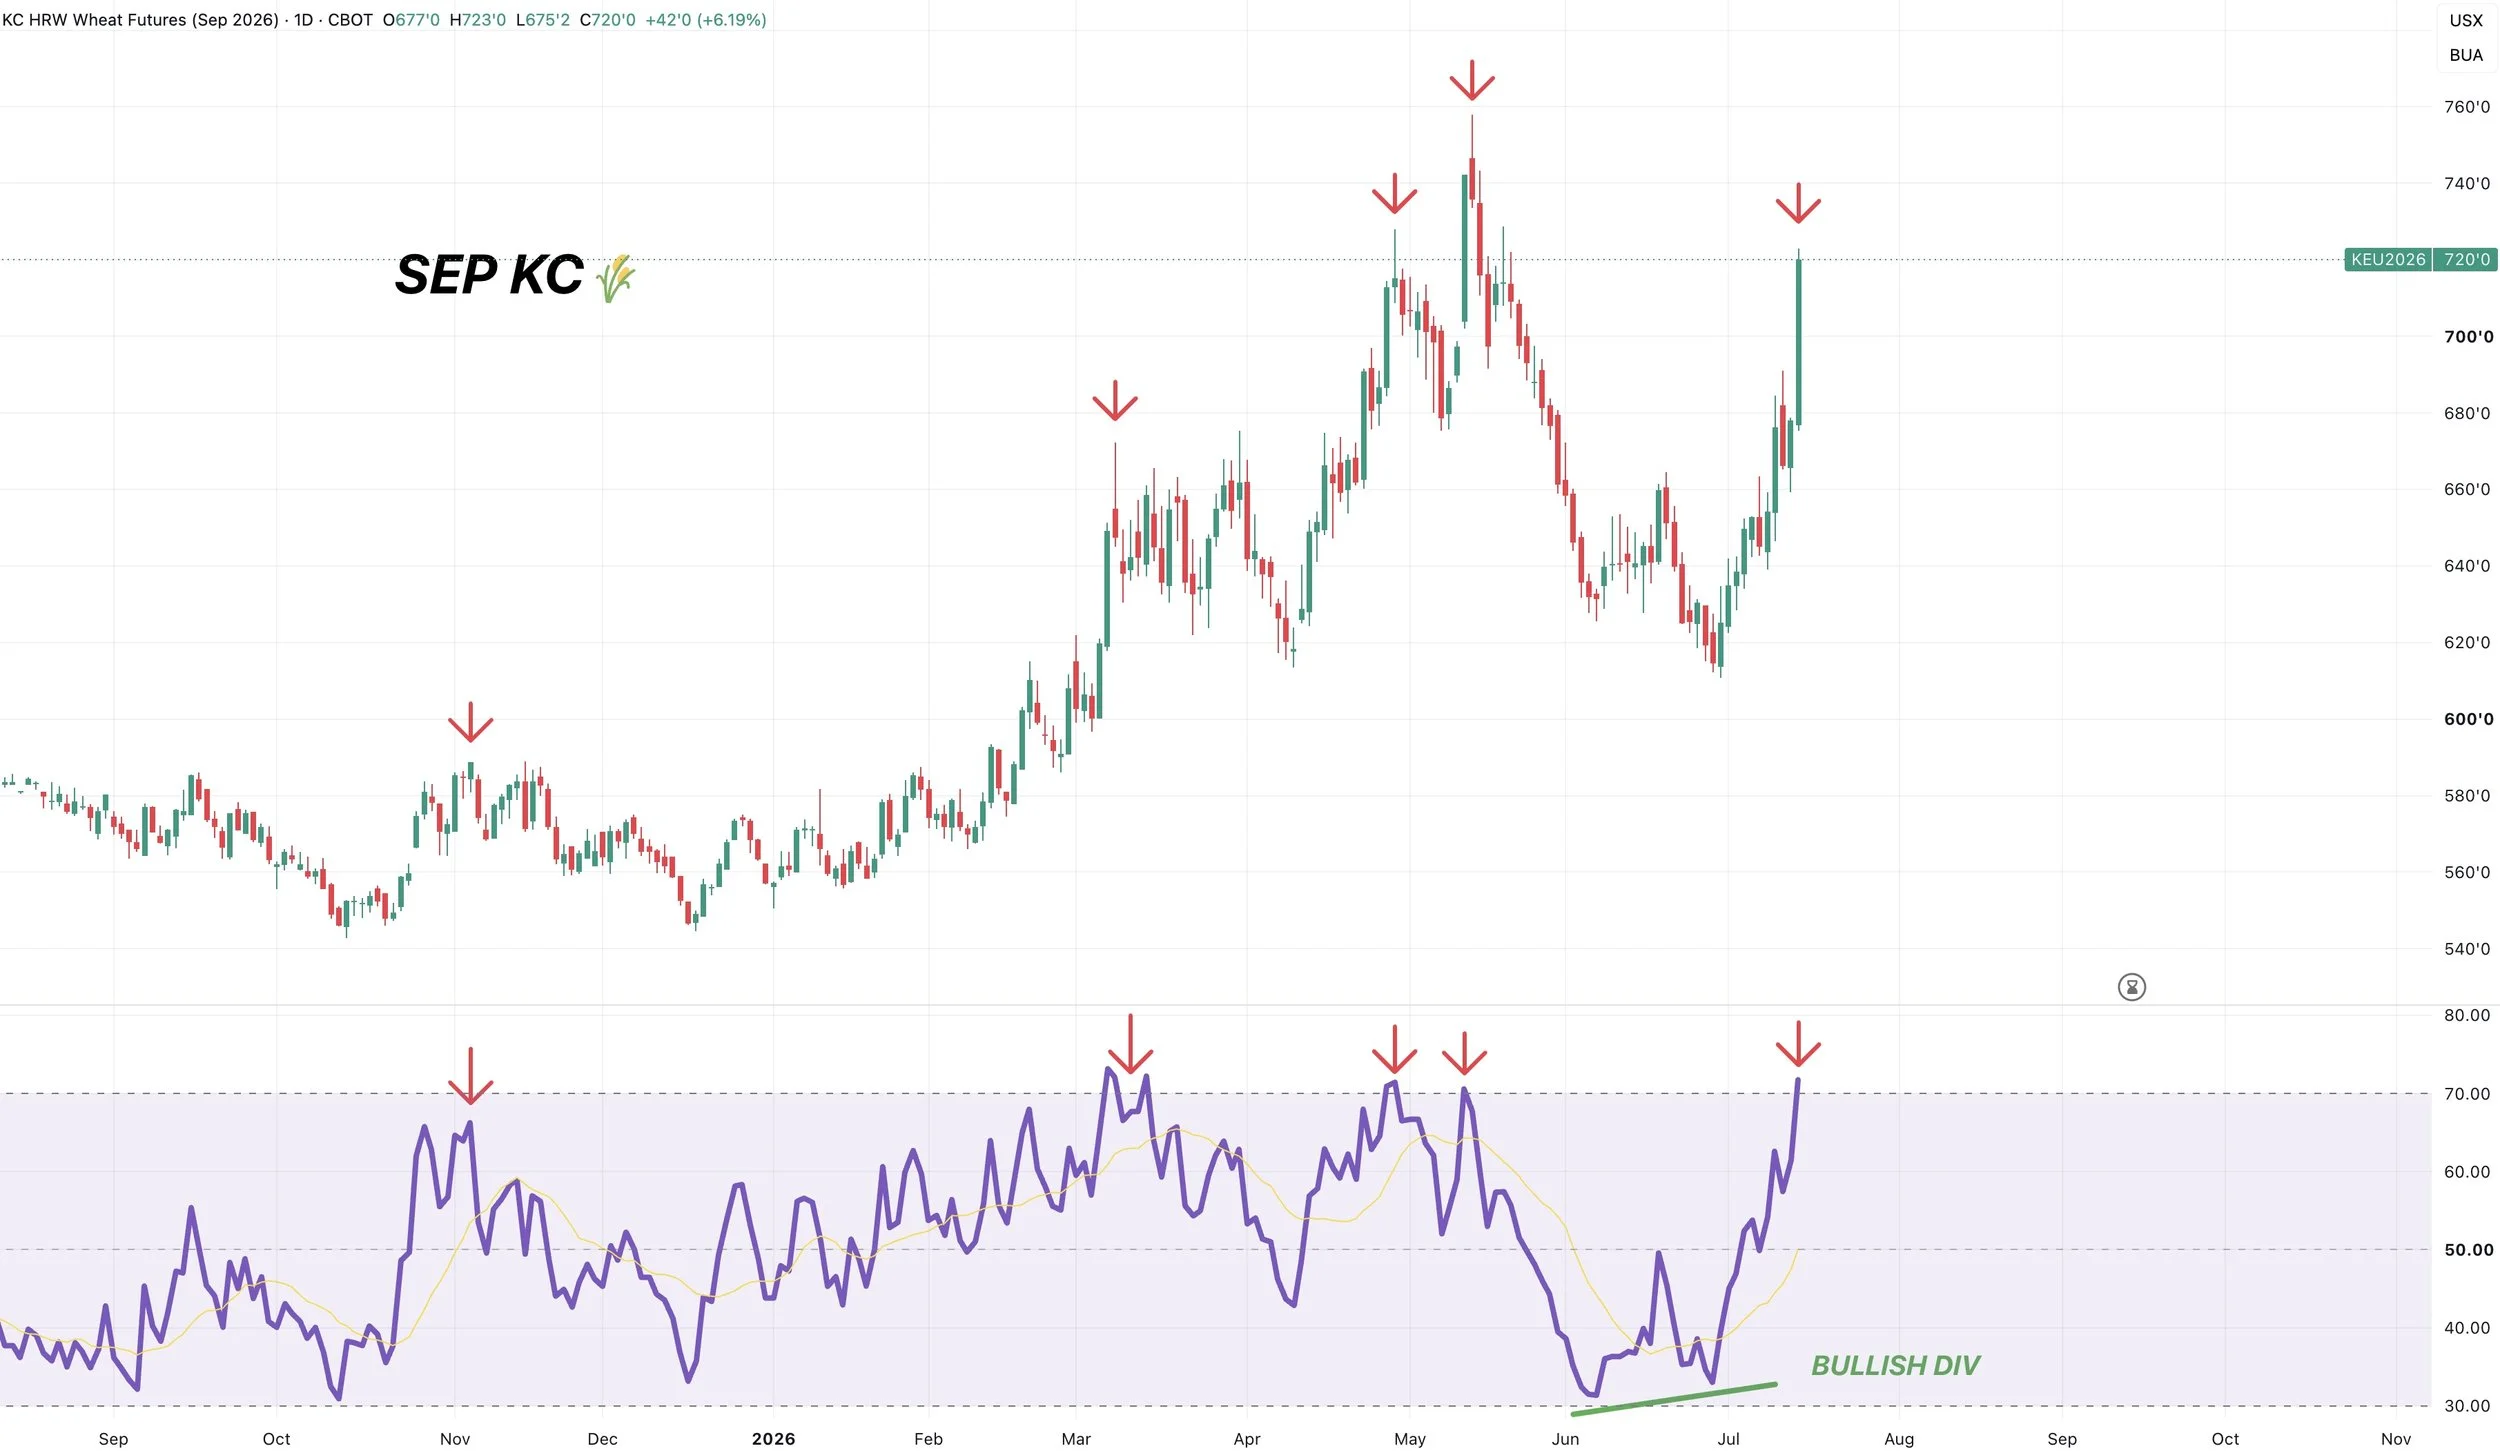
Something to note is that we are getting pretty overbought.
This doesn’t mean you can’t keep going higher.
But means it might make sense to protect these levels if you have to move wheat, and we could be due for a pullback soon.
Cattle
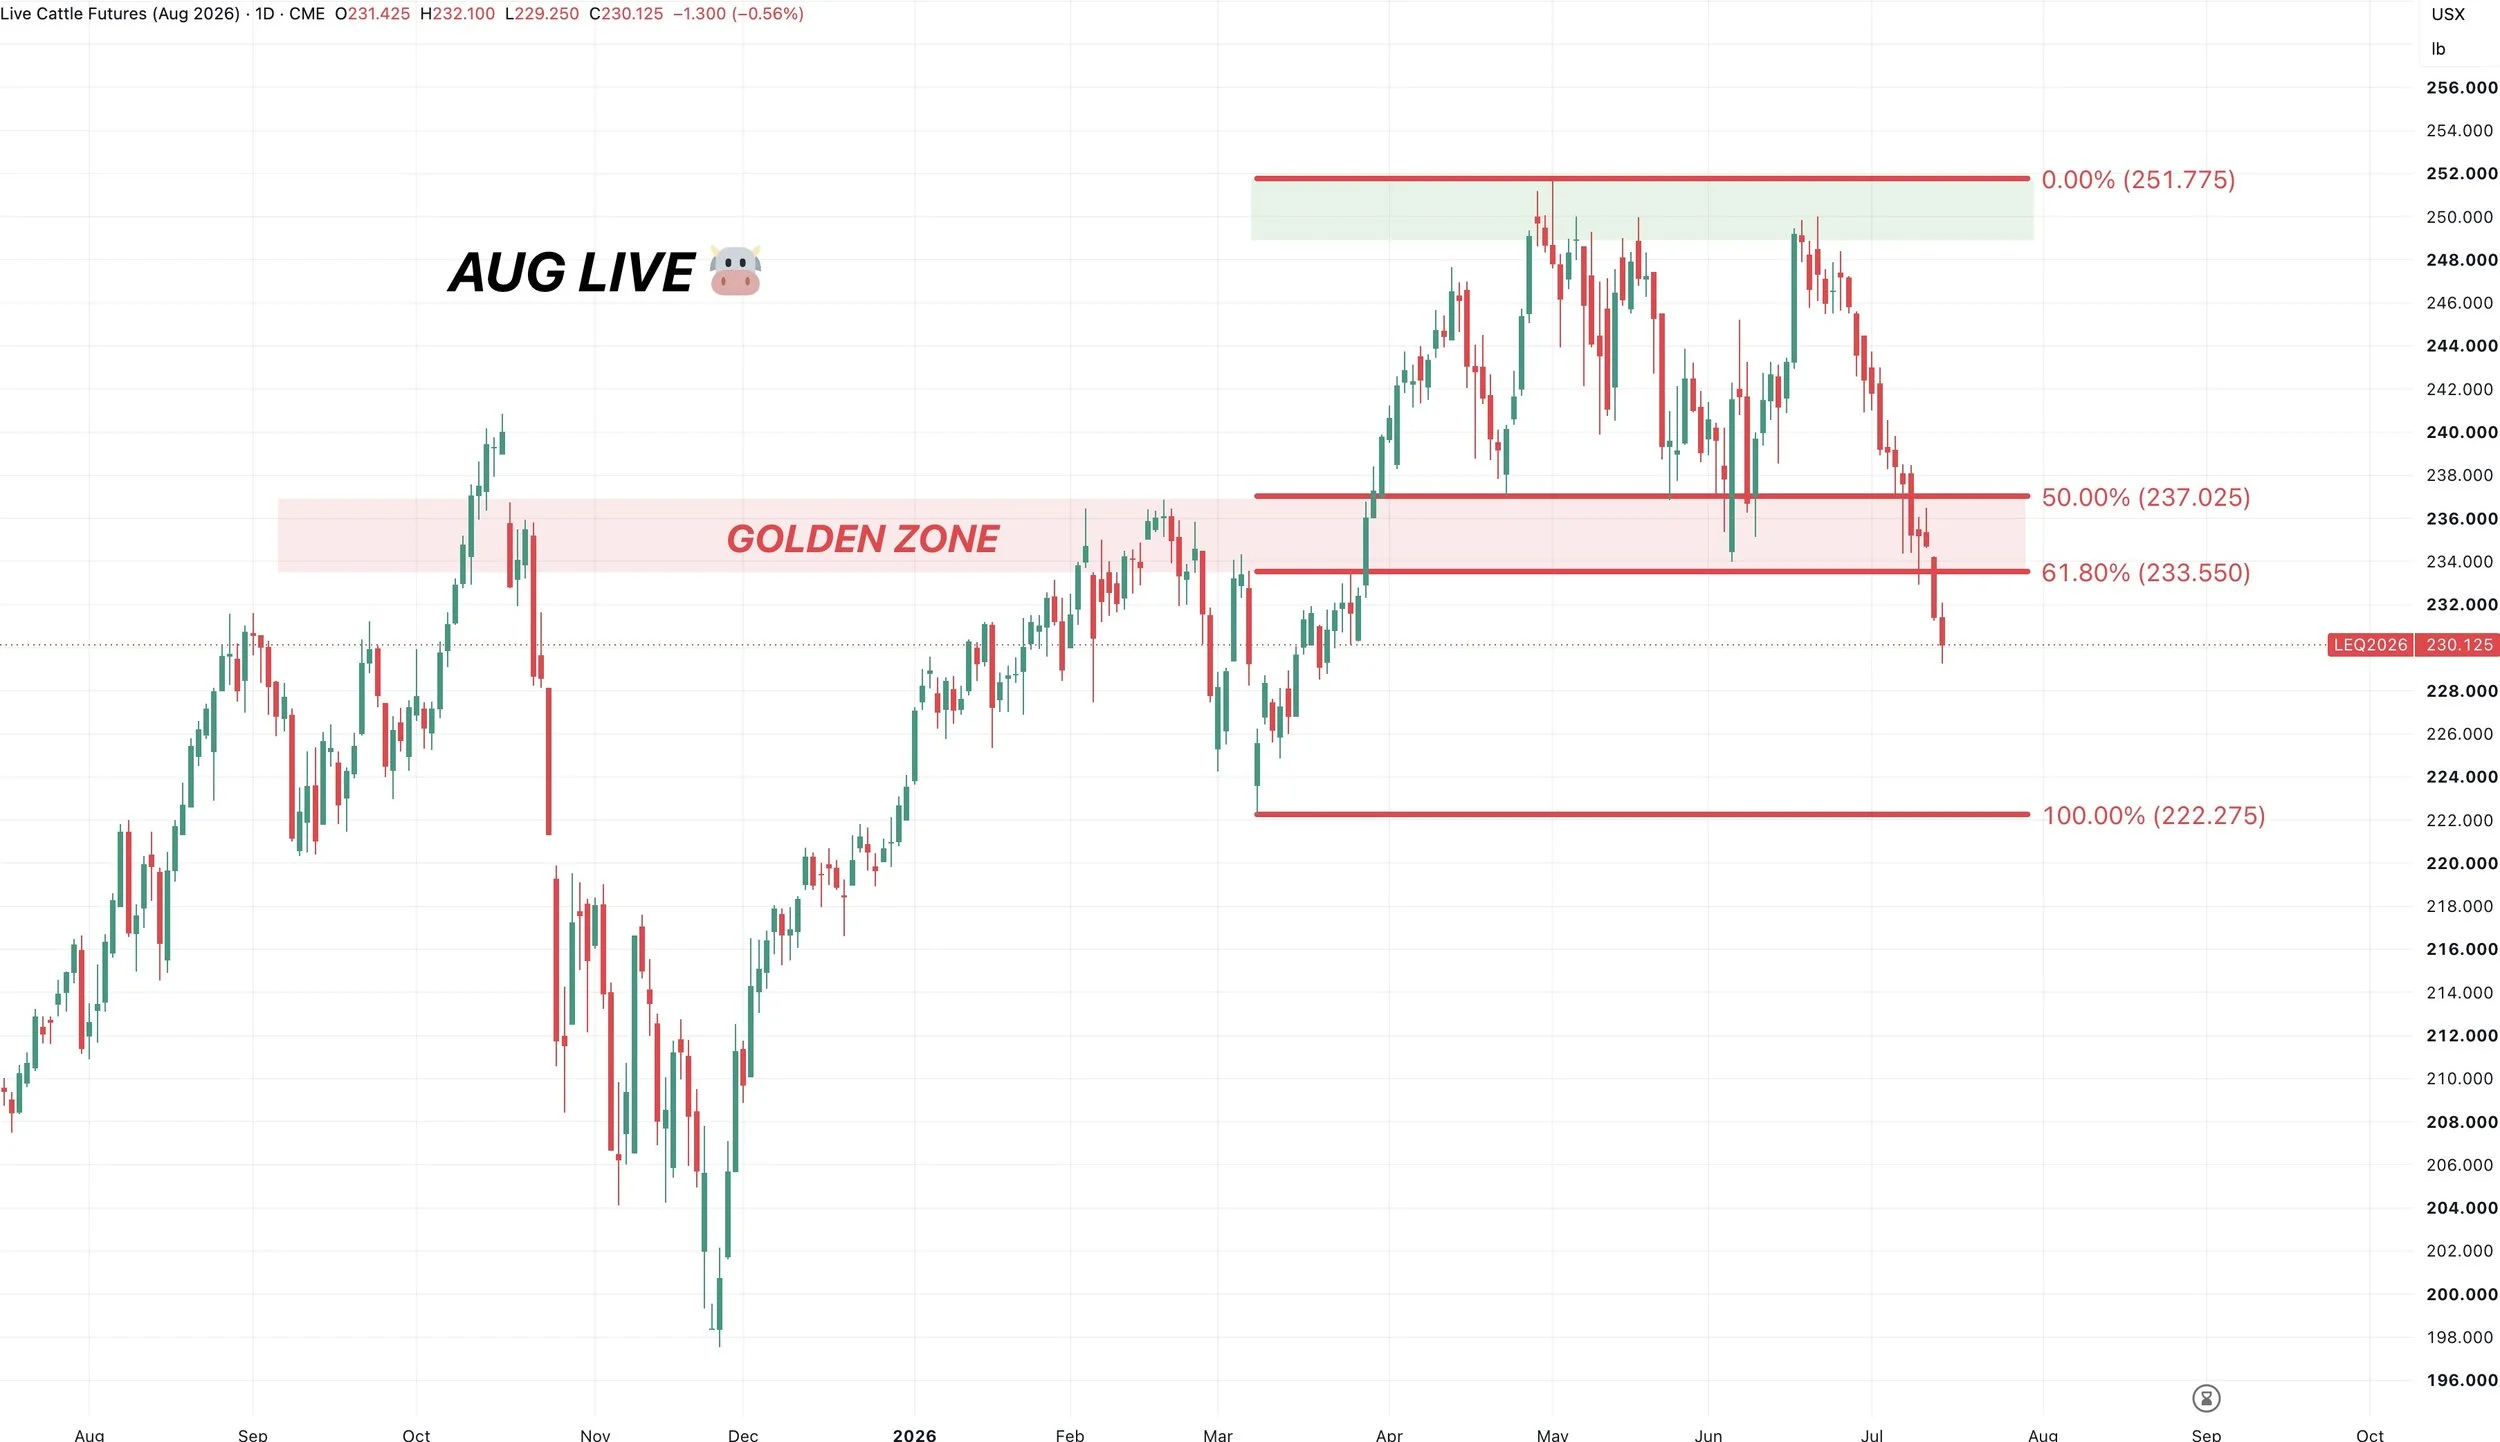
Aug Live Chart:
Cattle is not looking very good.
Live cattle has been lower for 13 DAYS IN A ROW.
We broke some major support. The golden zone down to the March lows.
That same level was the lows from June and highs from February. So clearly not a great look as it opens further downside.
However, we are getting pretty oversold so could be due for a dead cat bounce soon.
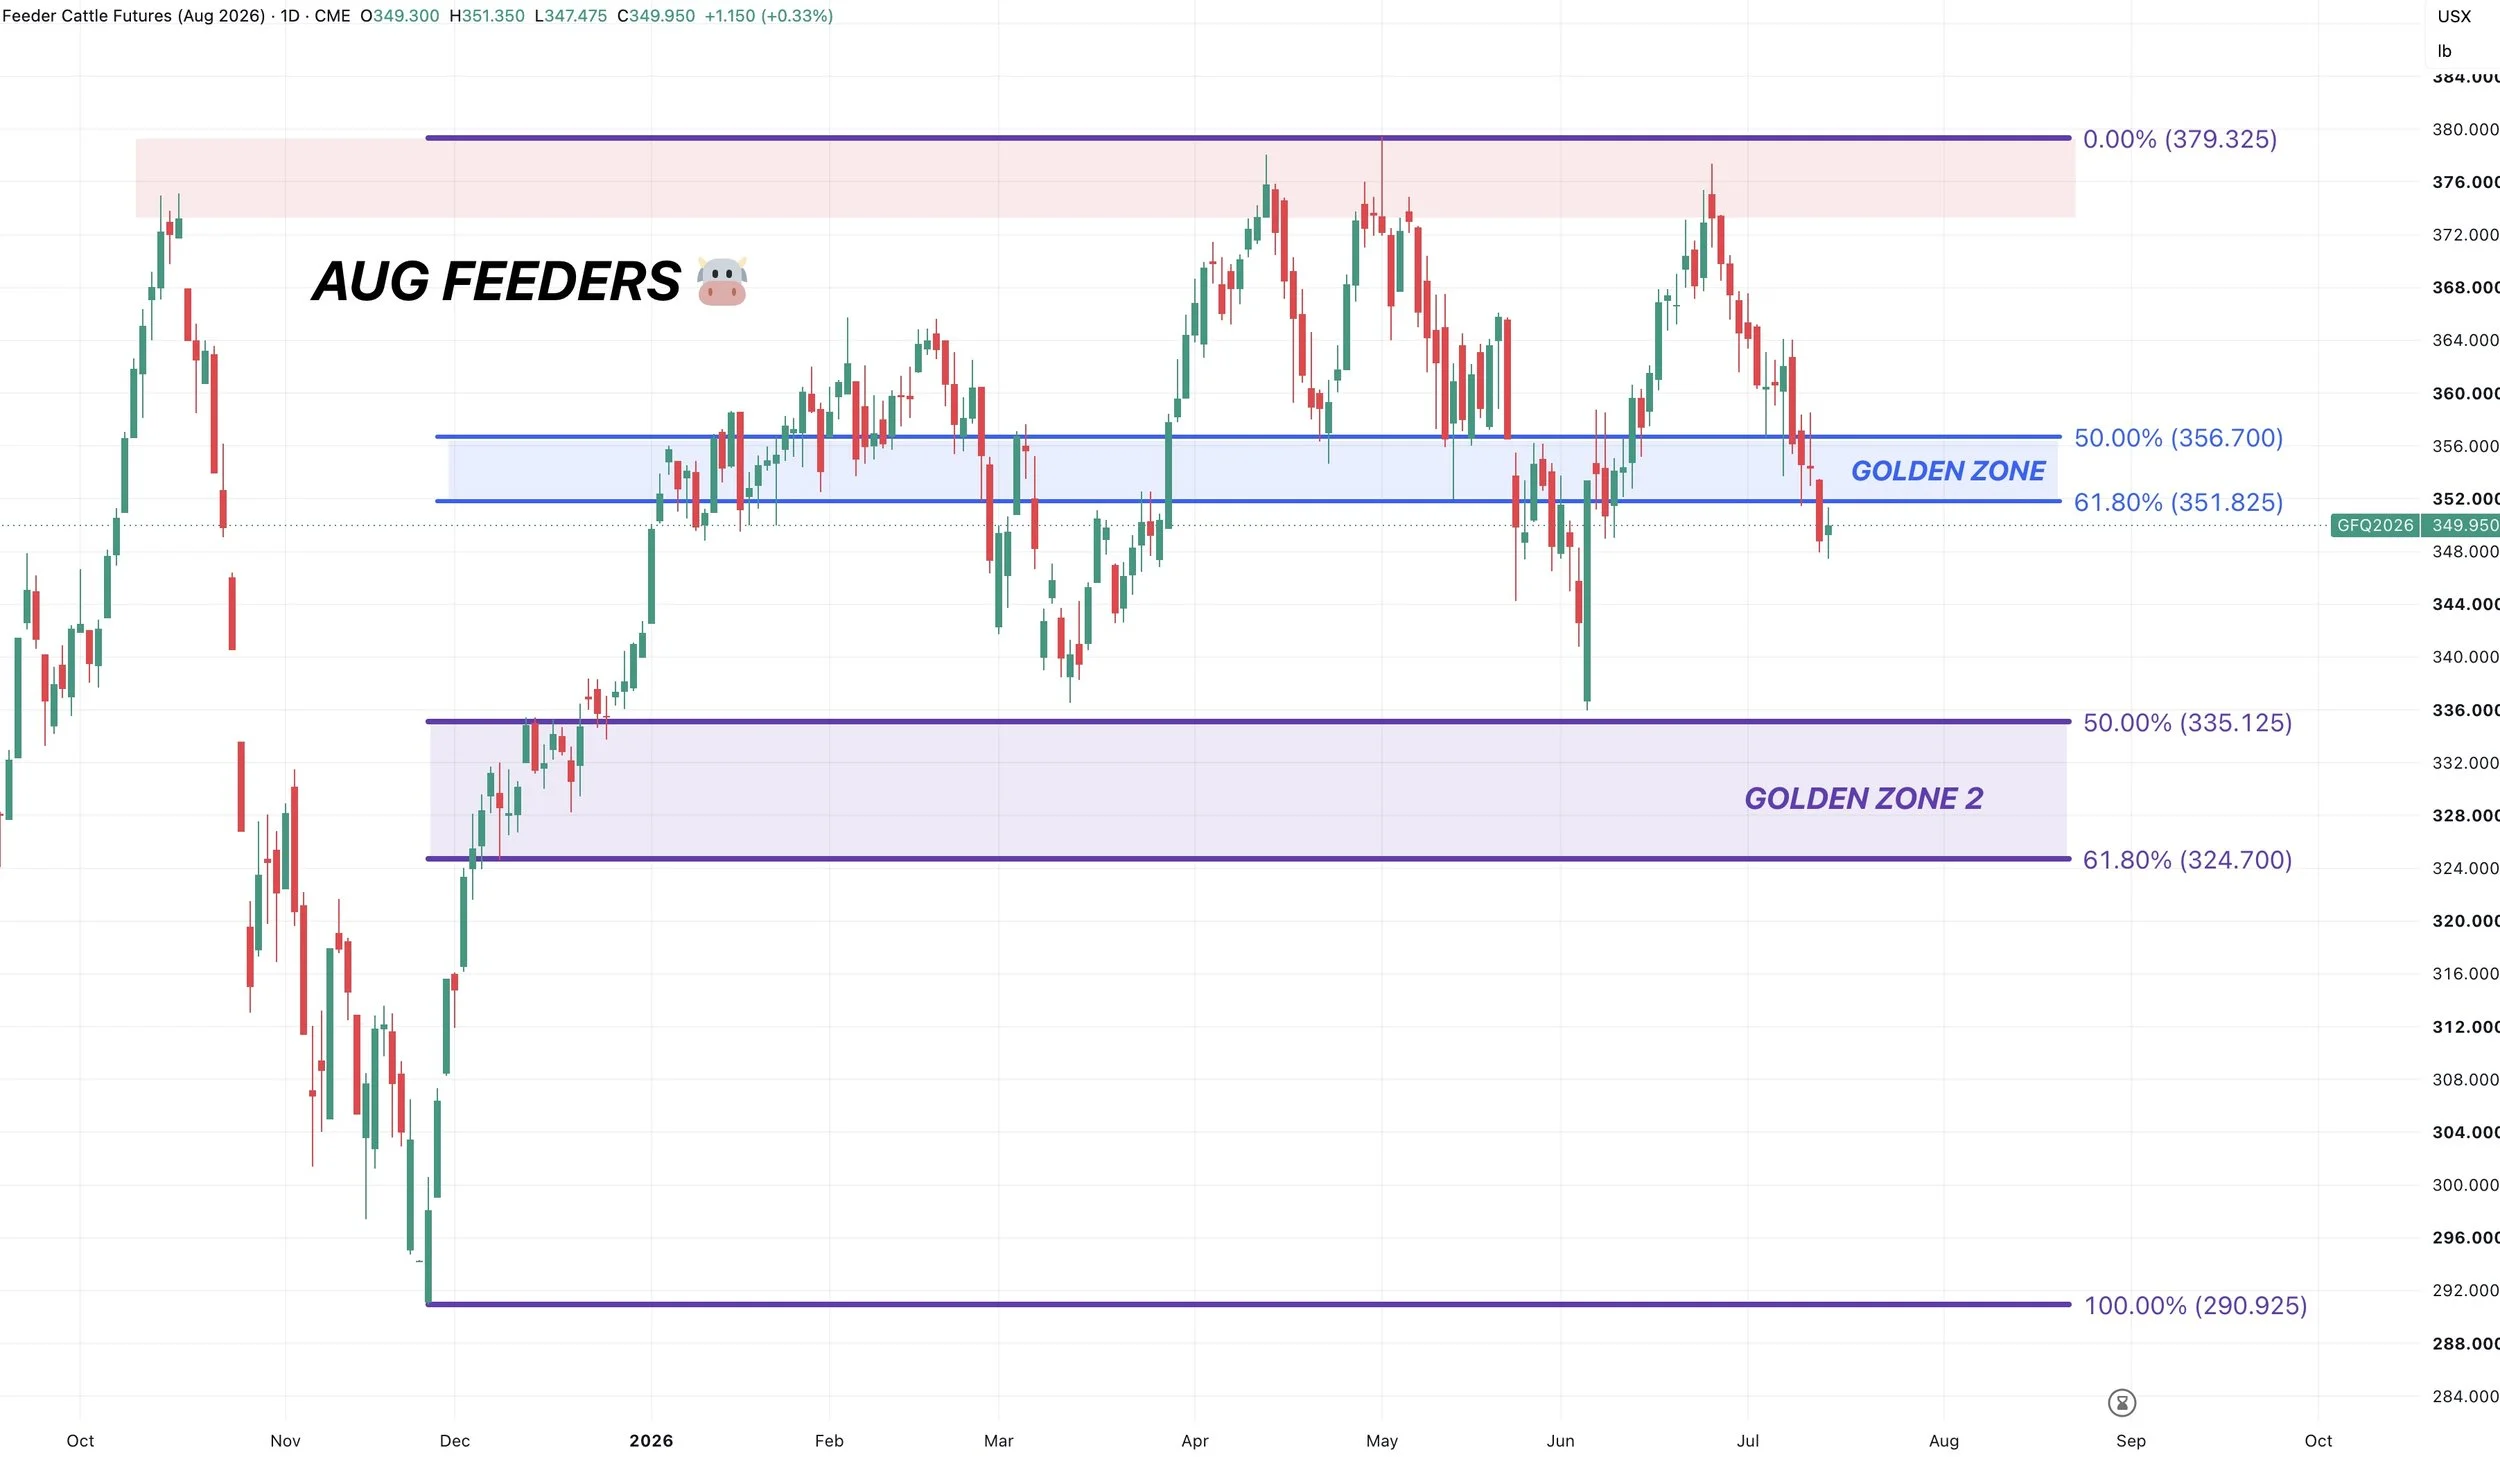
August Feeders Chart:
Feeders have held up slightly better than live, but also broke some key support.
The golden zone down to the June lows.
Which opens up further downside potential.
Want to Talk?
Our phones are open 24/7 for you guys if you ever need anything or want to discuss your operation.
Jeremey & Office: (806)484-1214
Sebastian: (605)280-1186
Email: sfrost@dailymarketminute.com
Hedge Account
Interested in a hedge account? Use the link below to set up an account or give us a call.