
CORN NEW YEARLY HIGHS. PRO FARMER 173 YIELD
AUDIO COMMENTARY
Corn posts new highs for the year
Reversals on the cattle charts
Friendly cattle on feed after Trump comments
Pro Farmer says 173 corn yield
Largest difference between tour & USDA ever
Funds long large amount but room to buy
Pro Farmer increased bean production
What to do if you are oversold?
Market doesn’t believe we have huge crop
Can sell $6-7 corn calls for decent money
China buying a lot of soybeans
Corn been straight up since USDA report
This market is largely led by demand
Making new highs when usually make lows. Counter seasonal rallies can be pretty powerful
Great opportunities for protection here
We want to ride the wave higher via options
Do not want to gap higher then close lower
Pro Farmer vs USDA data below audio*
Listen to today’s audio below
Want to talk?
Office: (806)484-1214
Get Every Update + Alert
TOUR VS USDA DATA
Pro Farmer: 173.2
Aug USDA: 180.7
Difference: -7.5
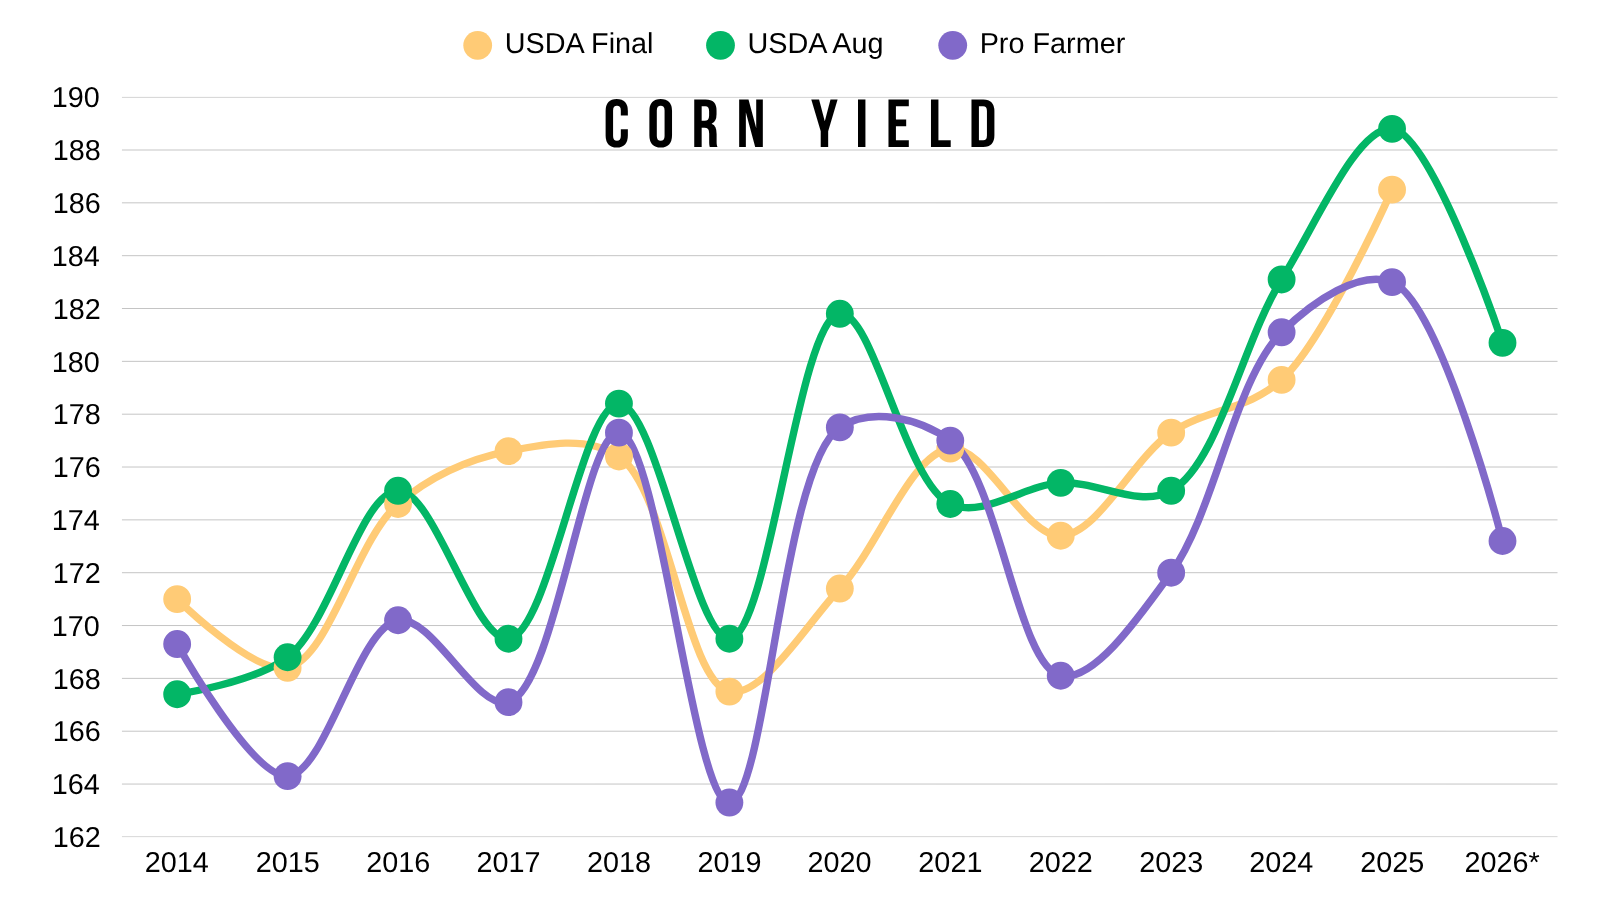
Below is a graph that shows the last several year’s difference from the tour vs the final USDA.
Simply by looking at the graph, the tour has a tendency to be lower than final yield, but does that tell the whole story?
Make sure to keep scrolling as we dive deeper into this data.
The last chart I show has the most data and breaks it all down.
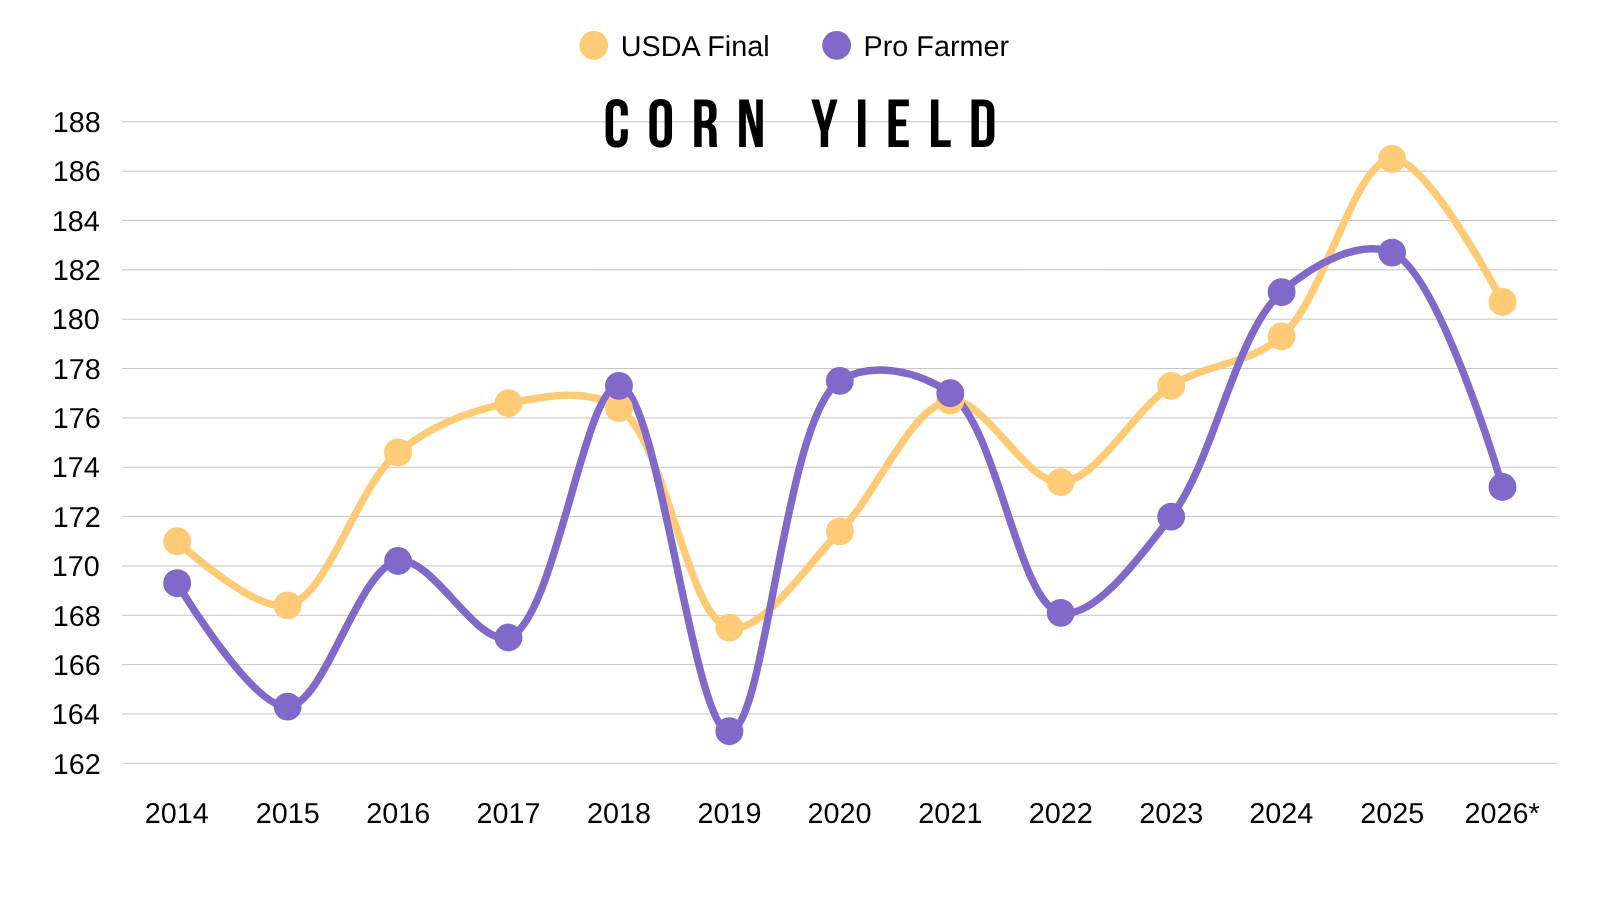
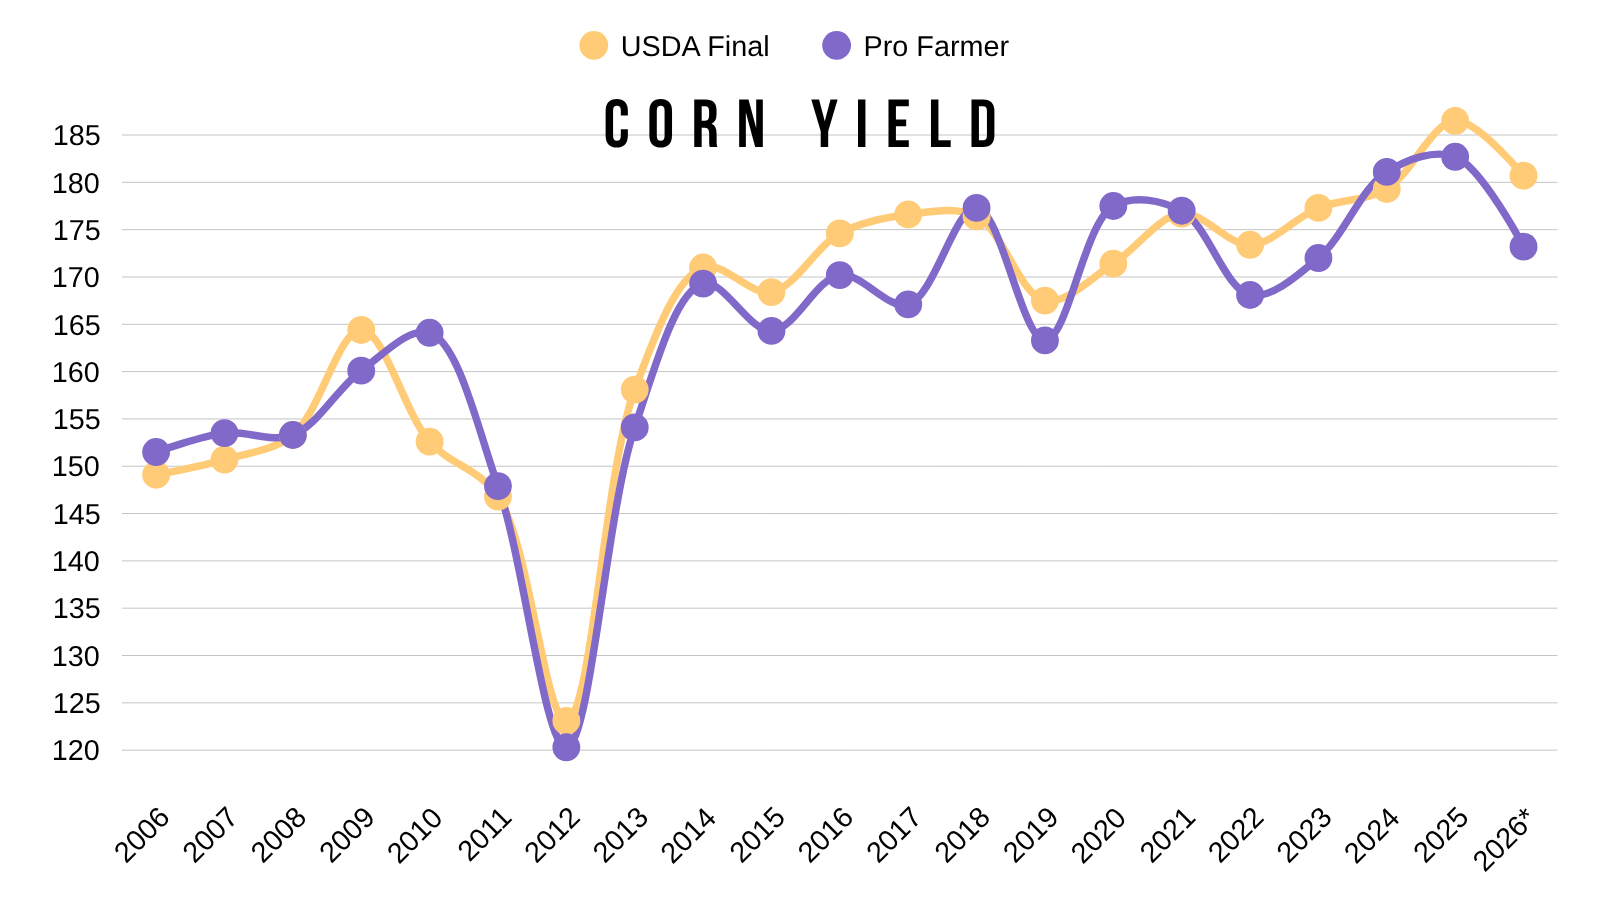
This graph shows the last 20 years of the tour vs final USDA.
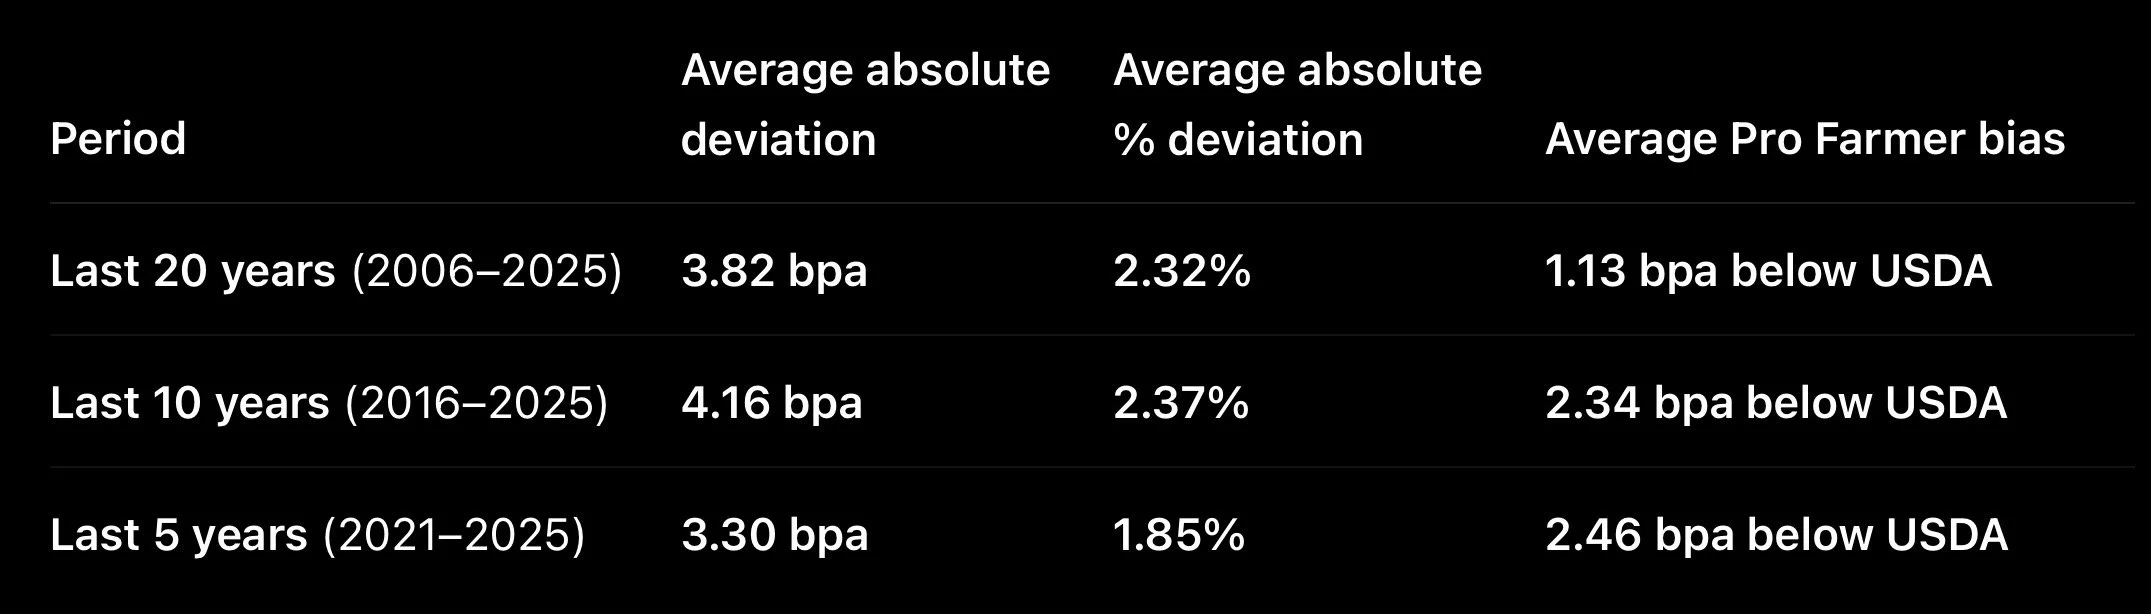
Average Deviation: Tour vs Final USDA
Here is a chart that shows the data for the last 20 years and how far off the tour has been from the final USDA.
Over the last 20 years, the average deviation has been around 3-4 bushels higher or lower when compared to the final USDA.
Over the last 10 years, Pro Farmer has on average came in 2.5 bpa lower than the final USDA.
Tour vs Aug USDA vs Final USDA:
Since 2014, the tour has correctly pointed in the direction of where final yield came in compared to August in all but two years.
The two years it was wrong on the direction were 2017 and 2023.
Pro Farmer’s 173.2 is -7.5 bpa below the USDA’s 180.7
That would be the largest difference between the tour and the Aug USDA in at least a decade.
Here are some other years where Pro Farmer was more than 5 bpa below the Aug estimate and what happened to final yield.
2019:
Tour -6.2 bpa below Aug USDA
Final USDA was -2 bpa below Aug USDA
2022:
Tour was -7.3 bpa below Aug USDA
Final USDA was -2 bpa below Aug USDA
2025:
Tour was -6.1 bpa below Aug USDA
Final USDA was -2.3 bpa below Aug USDA
So each time the tour has been this far below the USDA’s August number, the final yield has came in lower than in August.
But the final yield did not come all the way down to the Pro Farmer numbers.
Take a look at 2019, 2022, and 2025 on this table for reference.
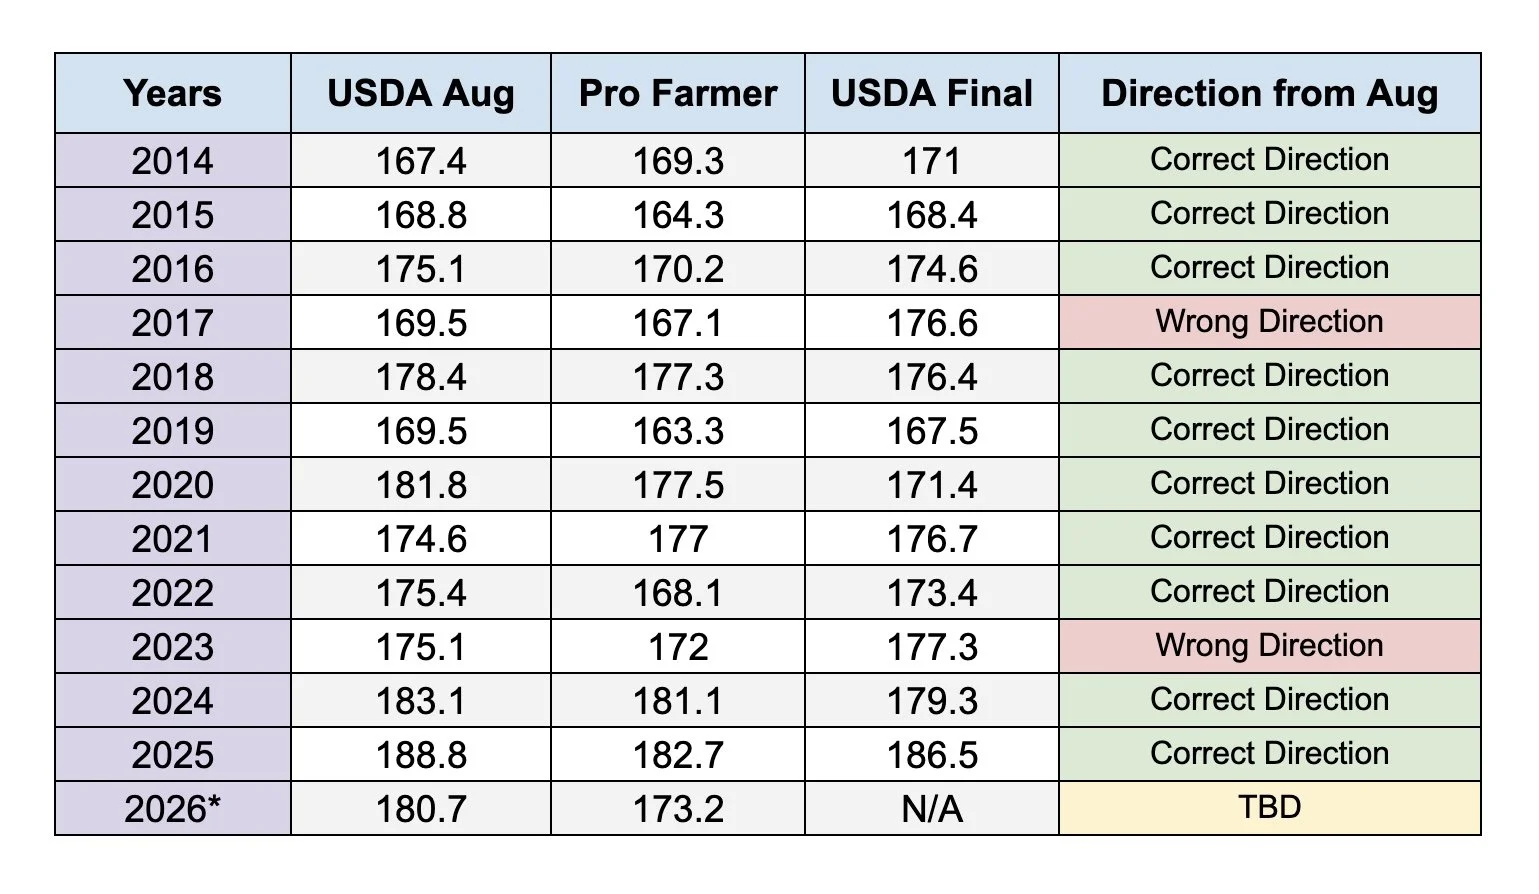
Here is the tour vs Aug USDA vs final USDA chart.
Want to Talk?
Our phones are open 24/7 for you guys if you ever need anything or want to discuss your operation.
Jeremey & Office: (806)484-1214
Sebastian: (605)280-1186
Email: sfrost@dailymarketminute.com
Hedge Account
Interested in a hedge account? Use the link below to set up an account or give us a call.