
MARKET UPDATE
You can scroll to read the usual update as well. As the written version is the exact same as the video.
Timestamps for video:
USDA: 0:00min
Corn Charts: 9:45min
Bean Charts: 12:30min
Wheat Charts: 14:45min
Cattle Charts: 15:30min
Want to talk?
Office: (806)484-1214
Don’t miss our next sell alert or future updates
Futures Prices Close
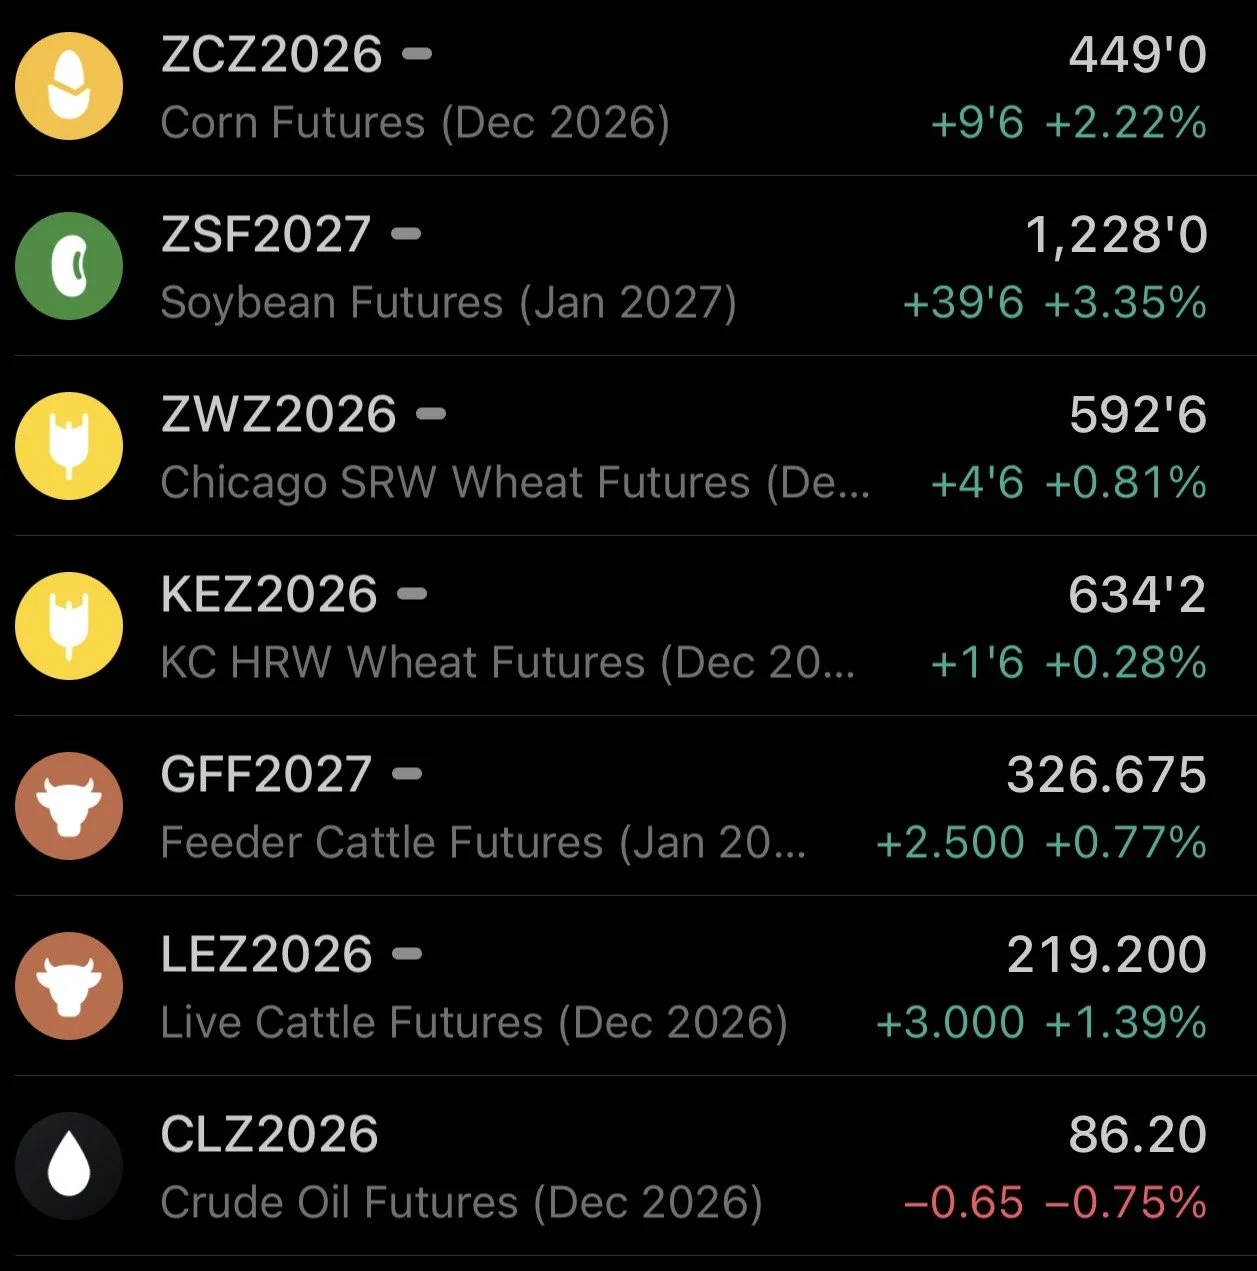
Overview
Amazing day for the grains, as the USDA finally gives the market a friendly surprise for a change following the last two brutual reactions in September and October.
As grains and cattle all closed higher across the board.
Soybeans were up nearly +40 cents. Today was soybeans' 2nd best day of the year, only behind the Monday after the 4th of July weekend.
Let's get right into the report.
USDA Report
Before we break down what the report means for the future, let's get into the numbers.
Corn:
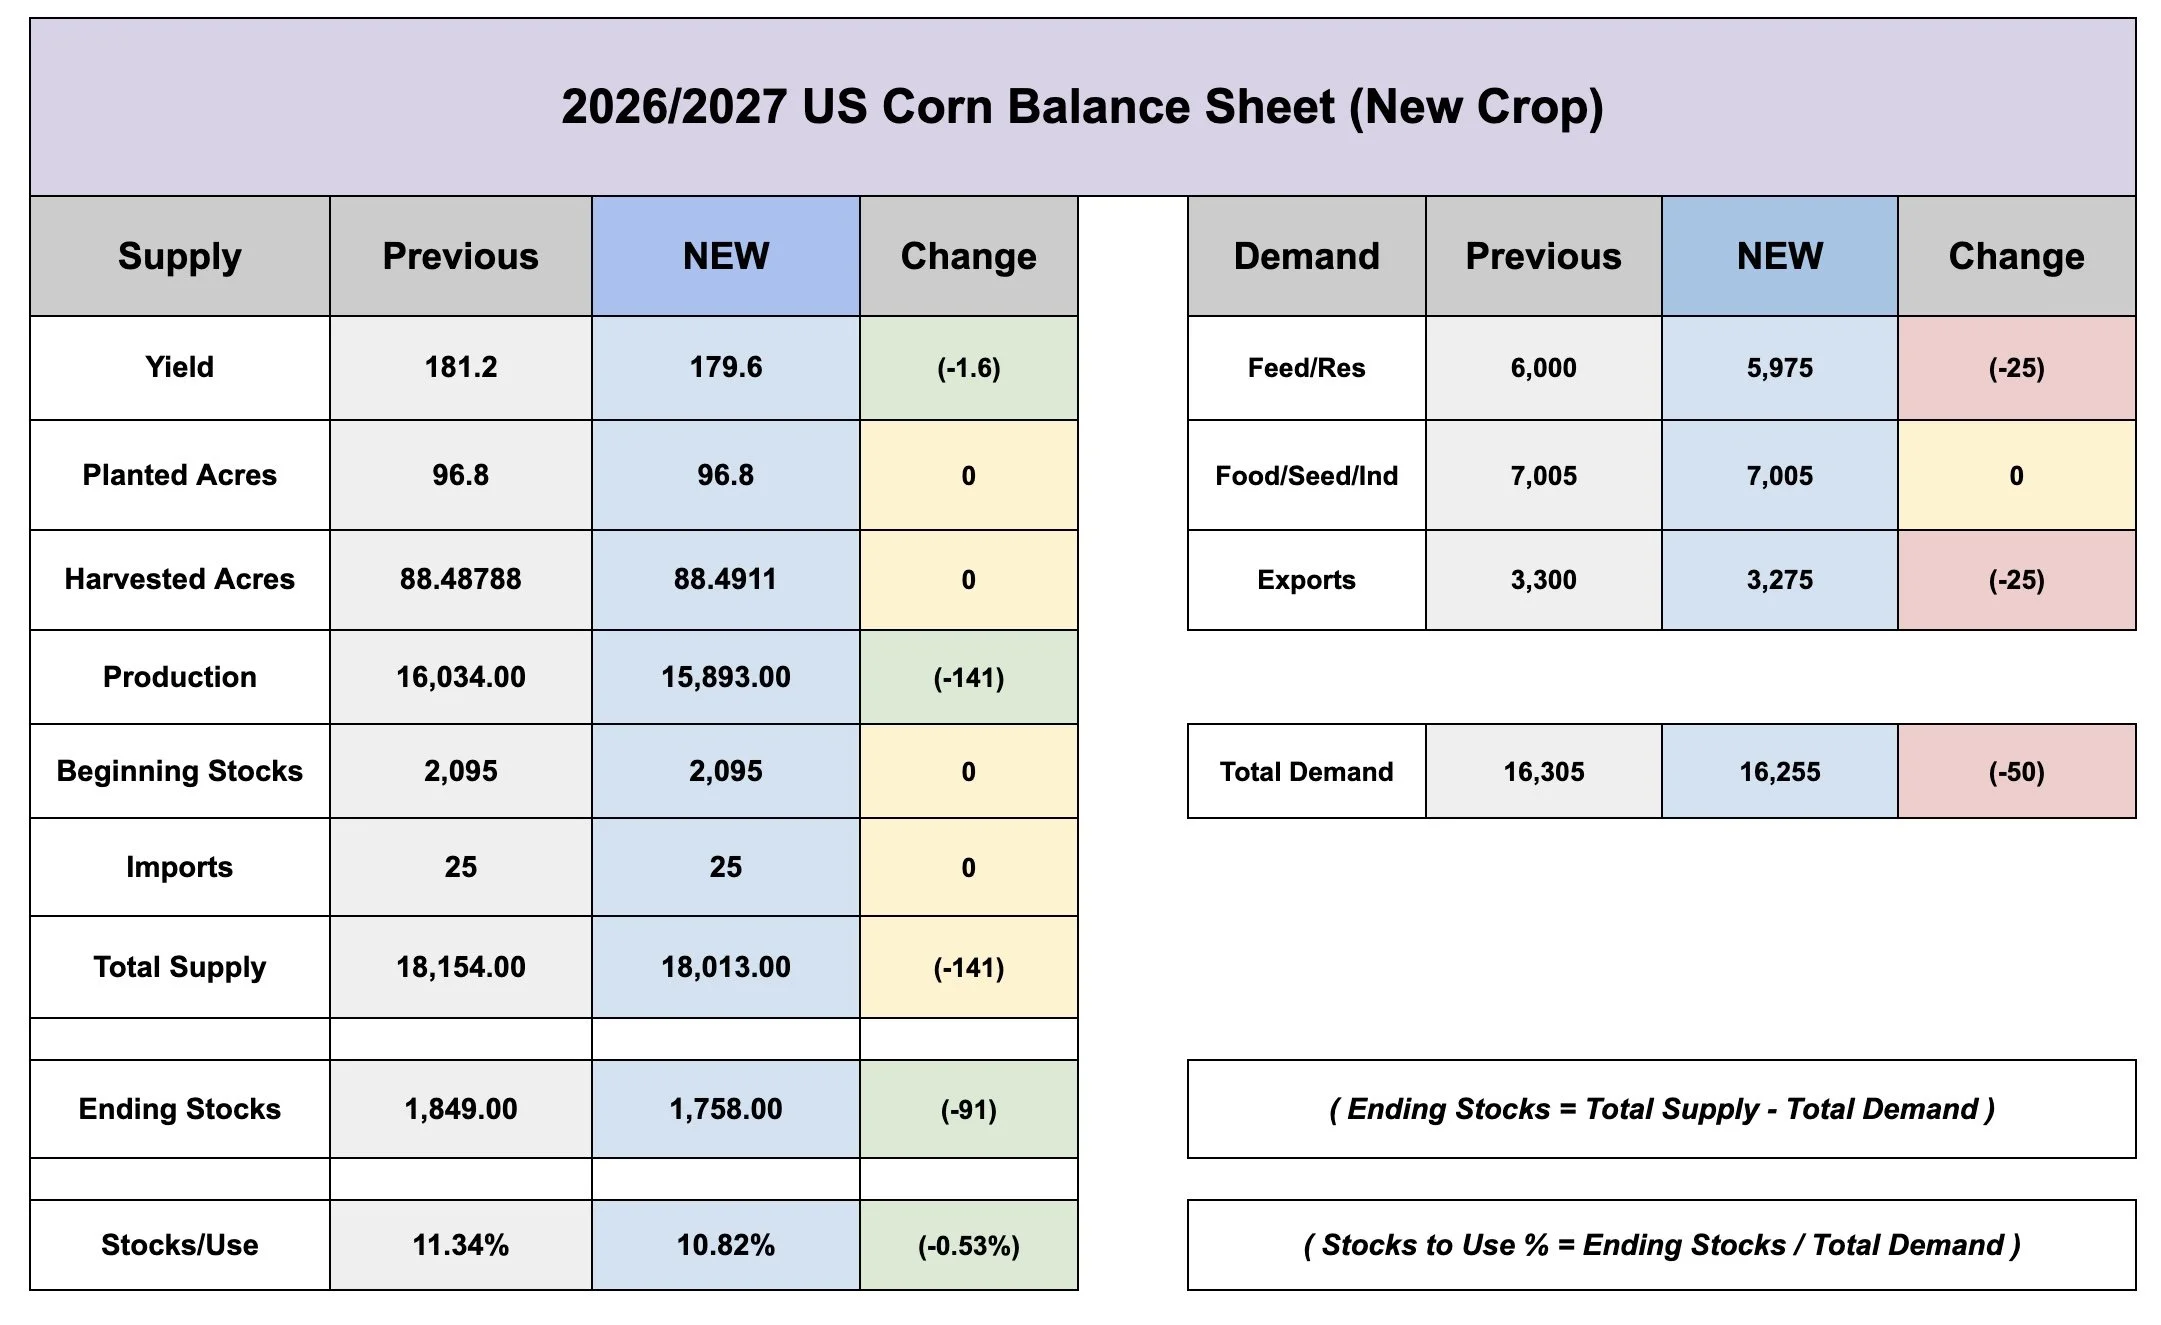
Yield came in at 179.6 bpa. Which was a -1.6 bpa cut from last month's 181.2.
This number surprised low. As the average trade guess was 180.3
As a result carryout also surprised low. Coming in at 1.758 billion bu, which was well below the trade guess of 1.840 billion.
So definitely a friendly report for corn.

Here is what the USDA actually did to the balance sheet.
The cut to yield resulted in production dropping by -140 million bu.
However, the USDA then offset some of the production losses by cutting our demand.
They trimmed our exports by -25 million and our feed demand by -25 million, for a net loss of -50 million on the demand side.
The net impact on the balance sheet was a carryout that was -90 million tighter than last month.
Our stocks to use went from 11.34% down to 10.81%.
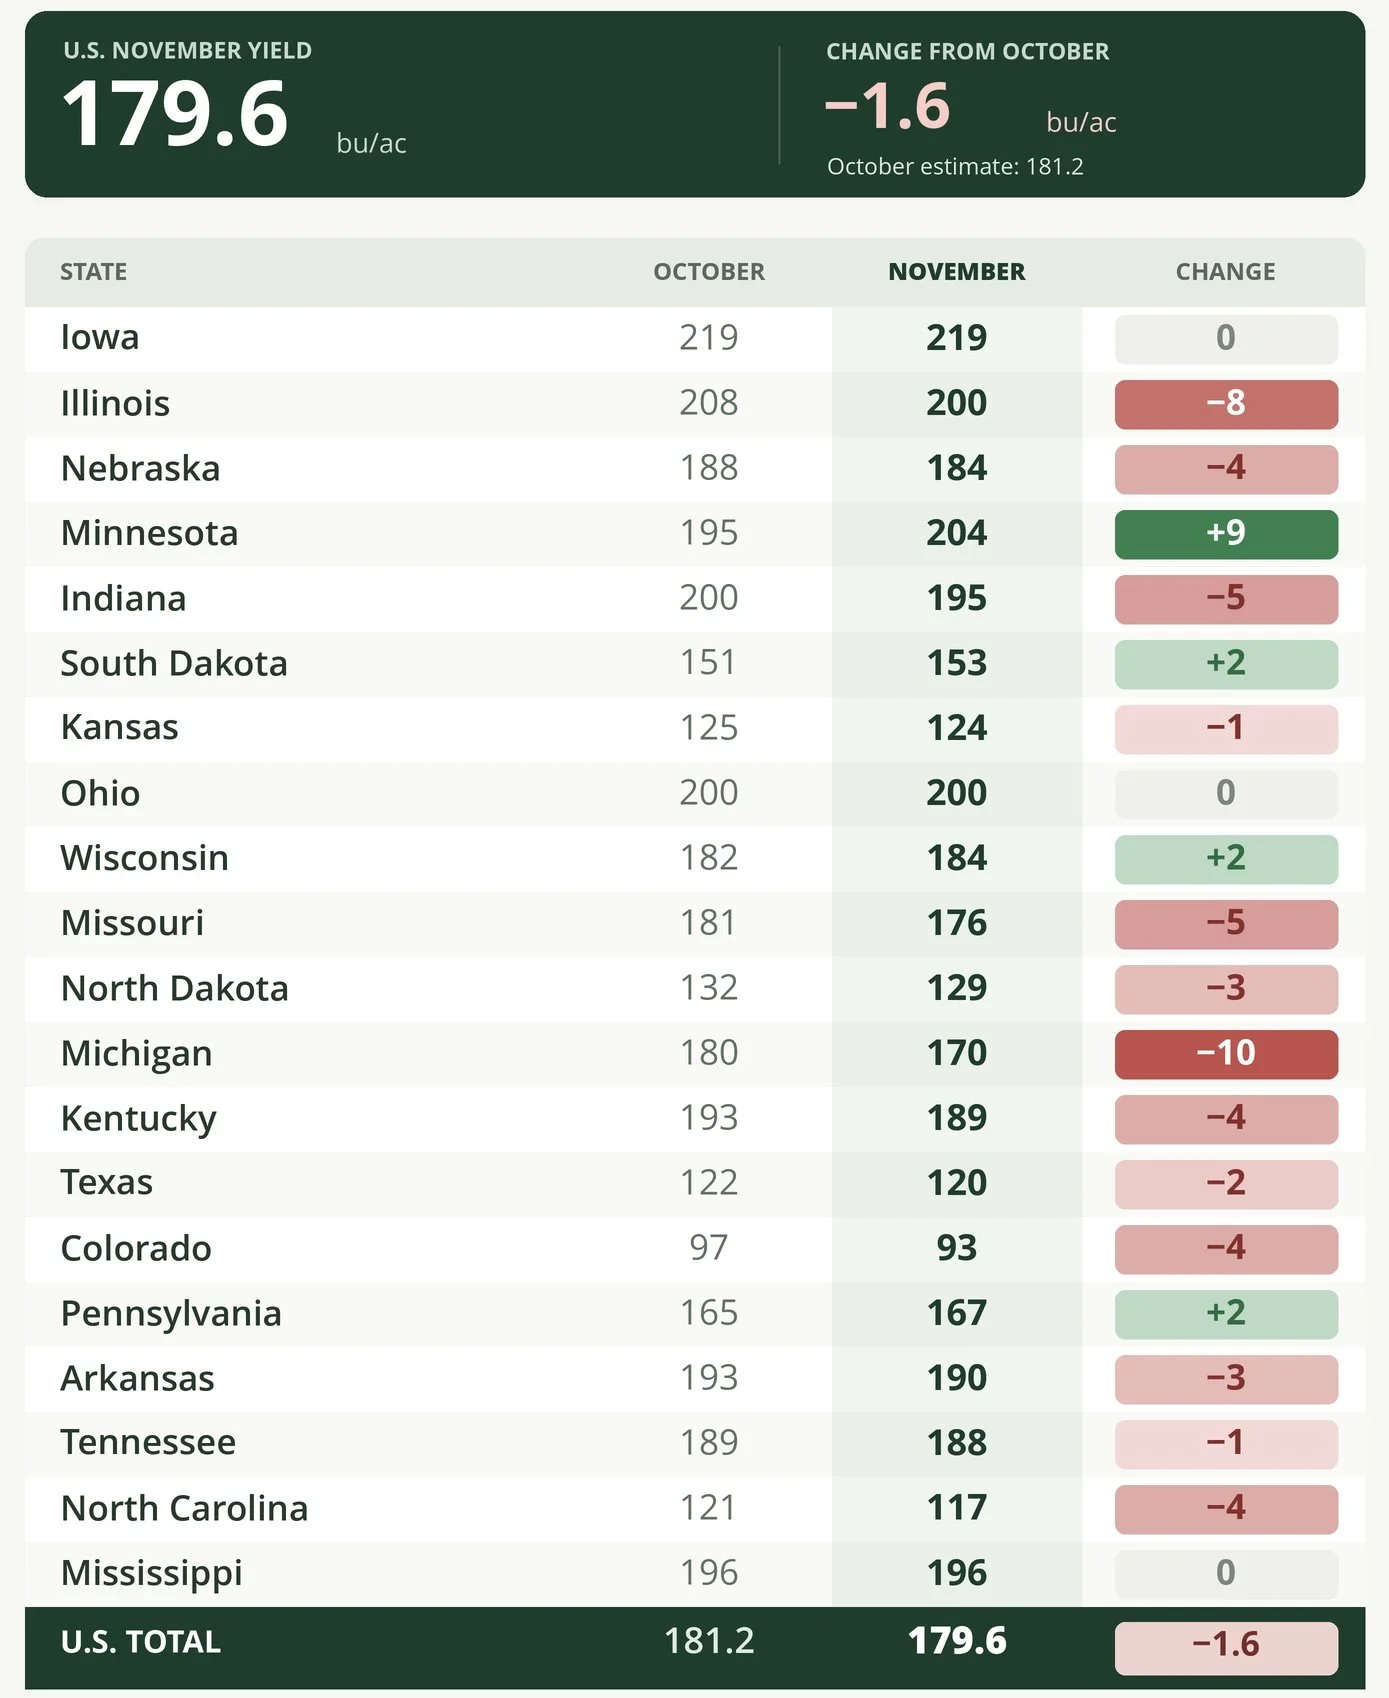
Here is the state by state yield changes.
We saw a huge jump in Minnesota.
But Illinois, Indiana, and Nebraska all saw large cuts.
They left Iowa unchanged. Iowa has a good crop, but you do still have over 1/4th of the crop in the field and that number would be +8 bpa above the last record. So could argue it seems a little high.
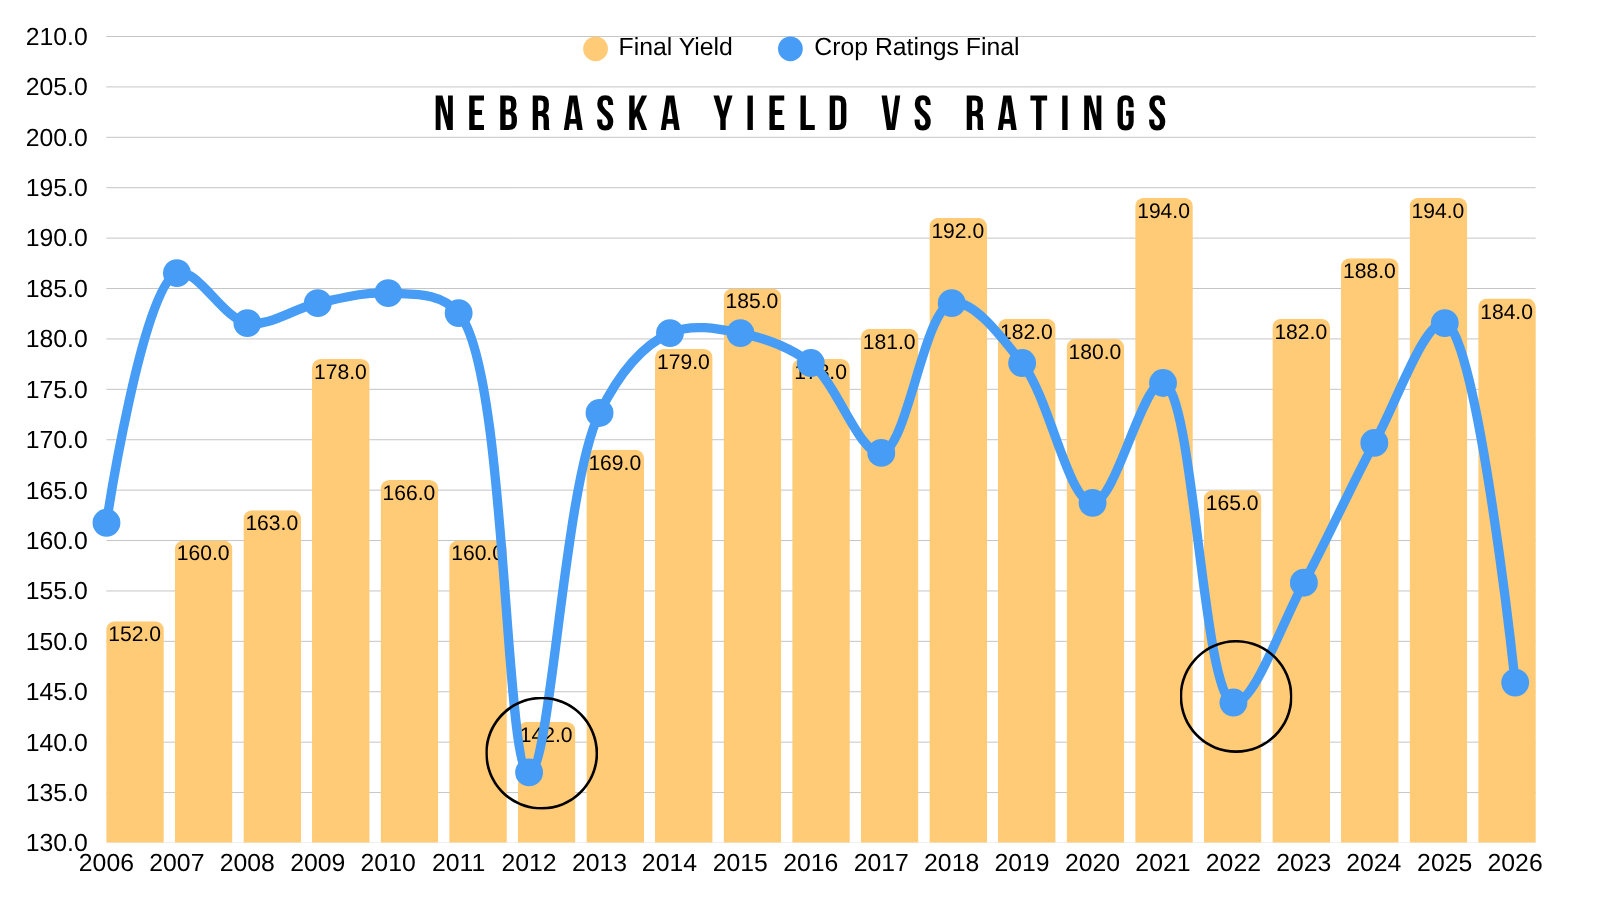
You could also argue that Nebraska may still be too high.
Crop ratings aren’t perfect, but this year clearly stands out when you compare ratings to yield.
The last two times we saw ratings tank like this, yield followed suit.
Soybeans:
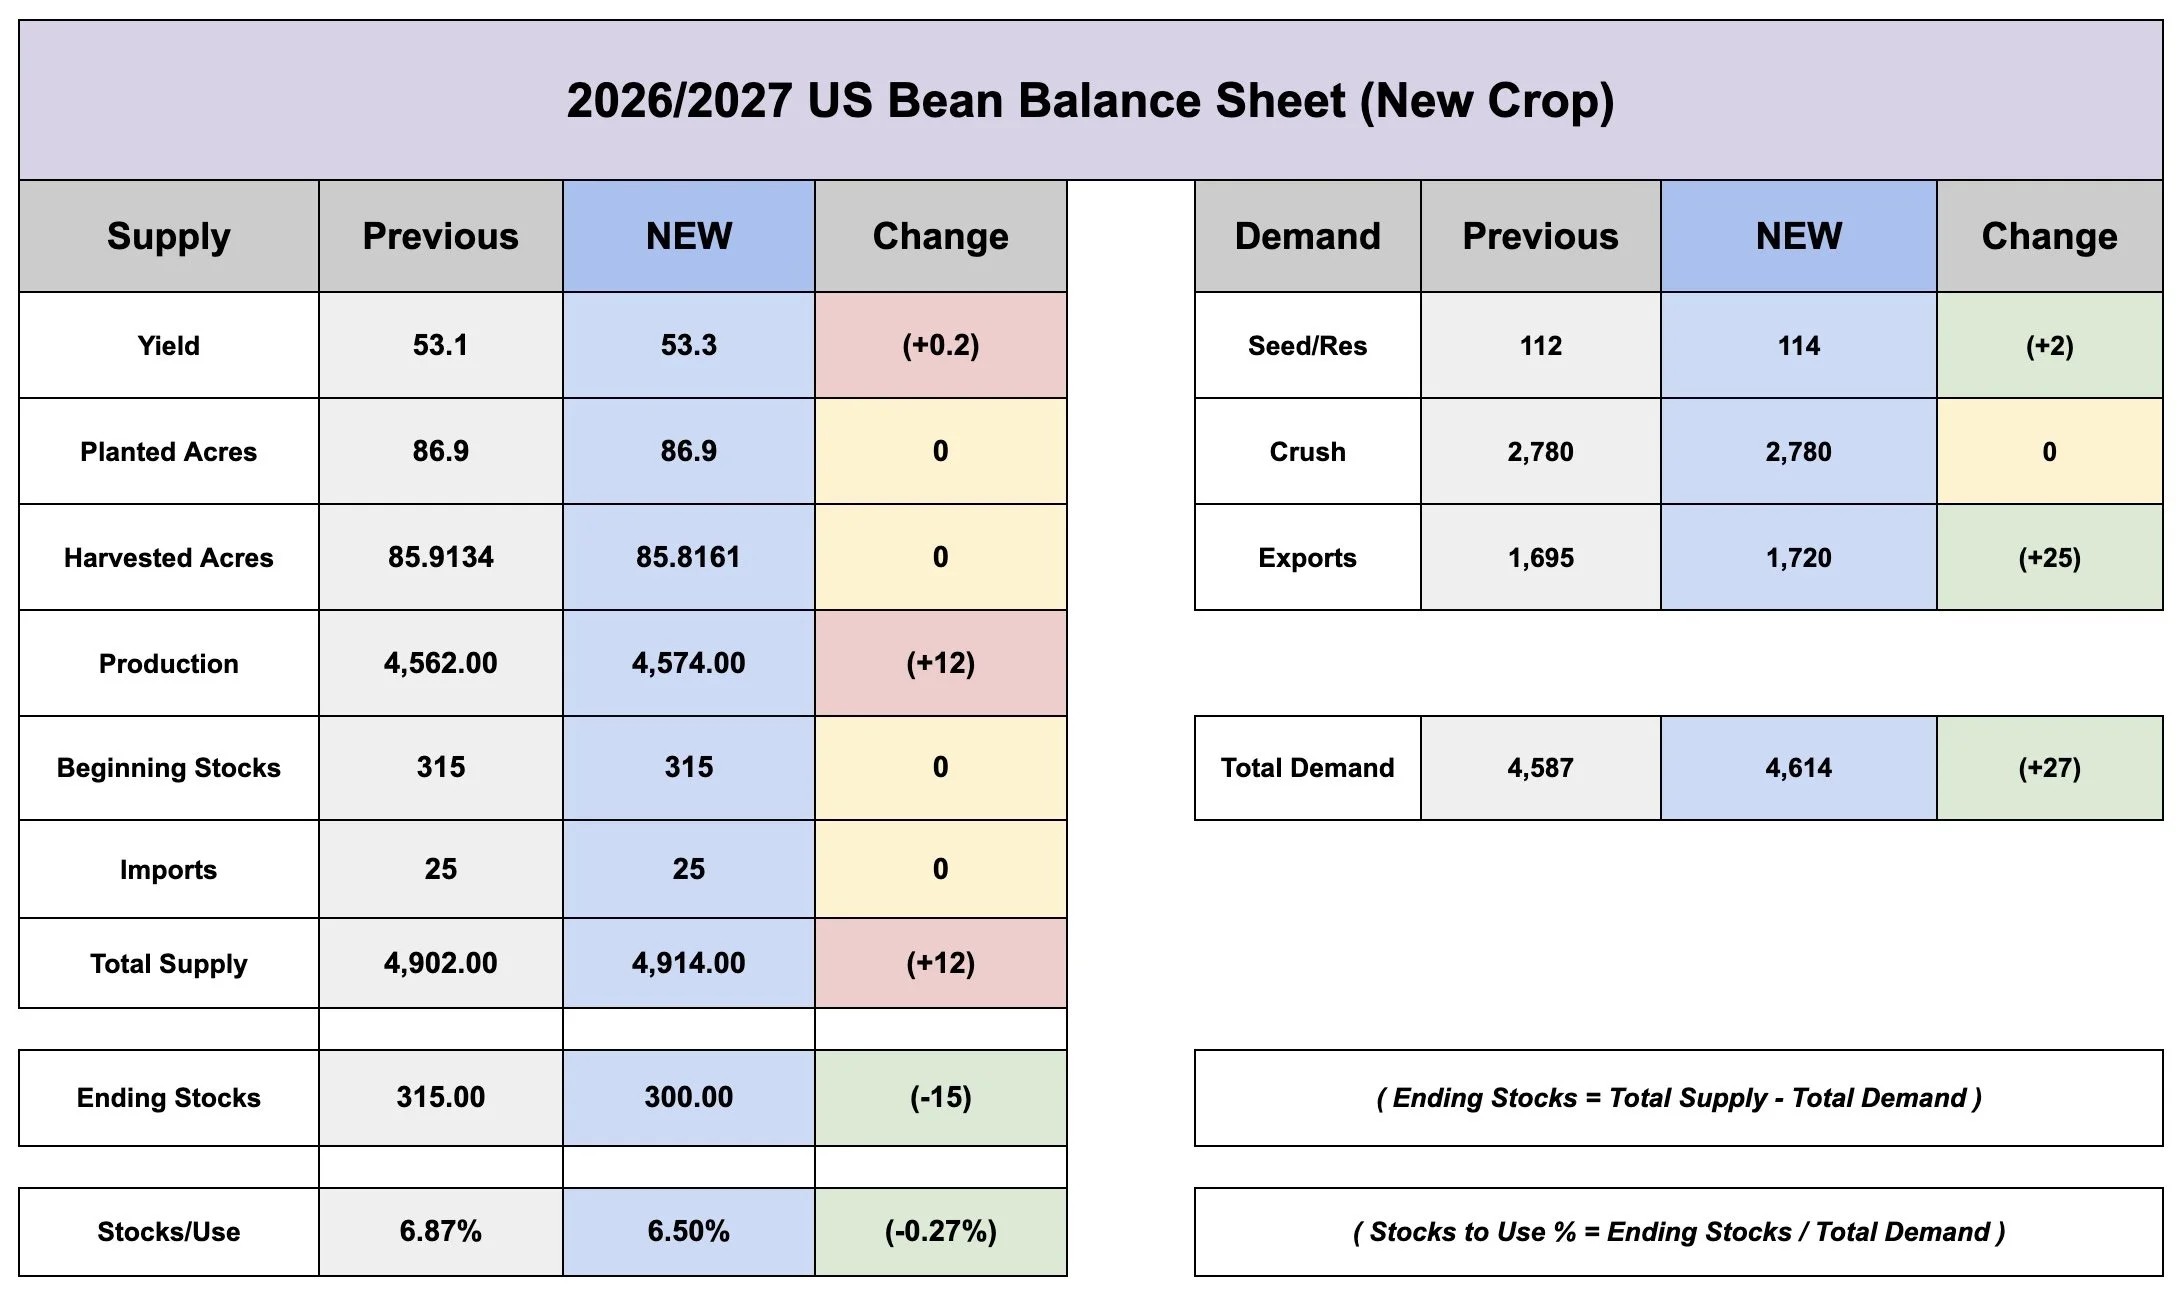
Yield came in at 53.3 bpa. Which was up +0.2 bpa from last month.
However, this increase was smaller than the trade was expecting. As the trade was expecting a larger bump in yield.
The market was probably trading a yield in that 54 to 55 bpa range. So very friendly surprise today seeing it only raised slightly.
Our carryout came in at 300 million. This was down from last month's 315 million. But the number was so bullish because the trade was expecting carryout to rise and come in at 330 million instead. So it was way below what the trade was expecting.

Here is what the USDA actually did to the soybean balance sheet.
The increase in yield resulted in supply increasing by +12 million bu.
However, like we talked potentially happening last week, the USDA offset the yield increase by increasing our demand.
Except the increase to demand, more than offset the increase in supply.
As they bumped our exports by +25 million bu.
As a result, the carryout dropped -15 million and came in at 300 milllion.
You could absolutely argue that these exports are going to need to be raised even further, potentially by a decent amount more. This market might need to ration more demand.
So even if yield ends up coming in higher in January like everyone expects, a large part of it could very well be offset with extra demand.
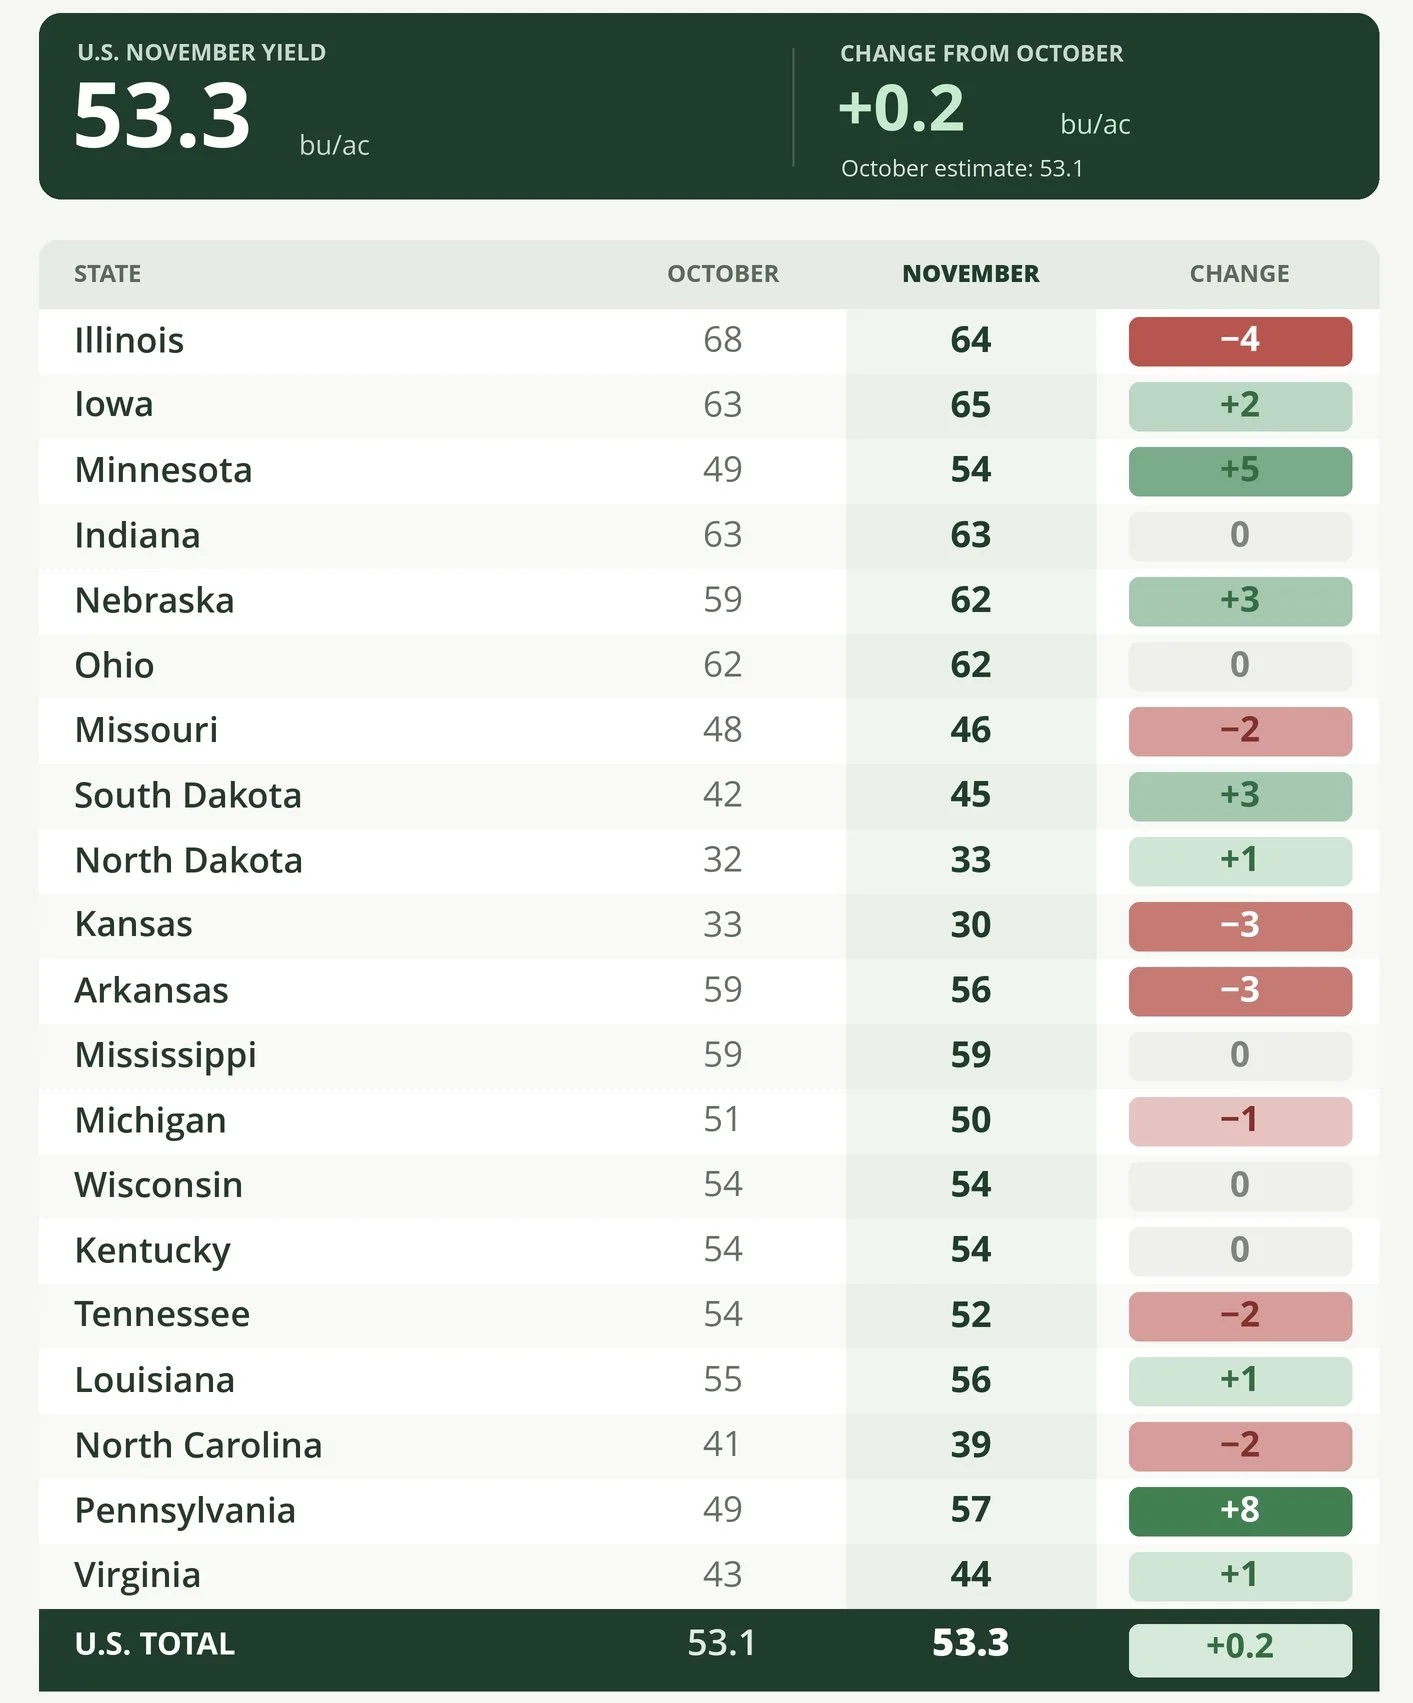
Here was the state by state changes.
Iowa, Minnestoa and Nebraska were all raised.
However, Illinois came down which is the top bean grower.
Wheat:
Corn and soybeans were the high ticket items in today's report.
Wheat was really a non-event on the US side as expected, because this report does not include any production changes to wheat.
Carryout saw a small increase, but that number was slightly below the trade estimates.
The world numbers however did come in well above the estimates as Argy and Australia saw some production bumps.

How Friendly was this Report?
Let's get into what these numbers mean moving forward.
First let's look at corn.
Our stocks to use dropped by a decent amount.
Moving from 11.3% to 10.8%.
This number is still not considered "bull market territory" as it's still above 10%. But this number is clearly less bearish than what the USDA just had us at.
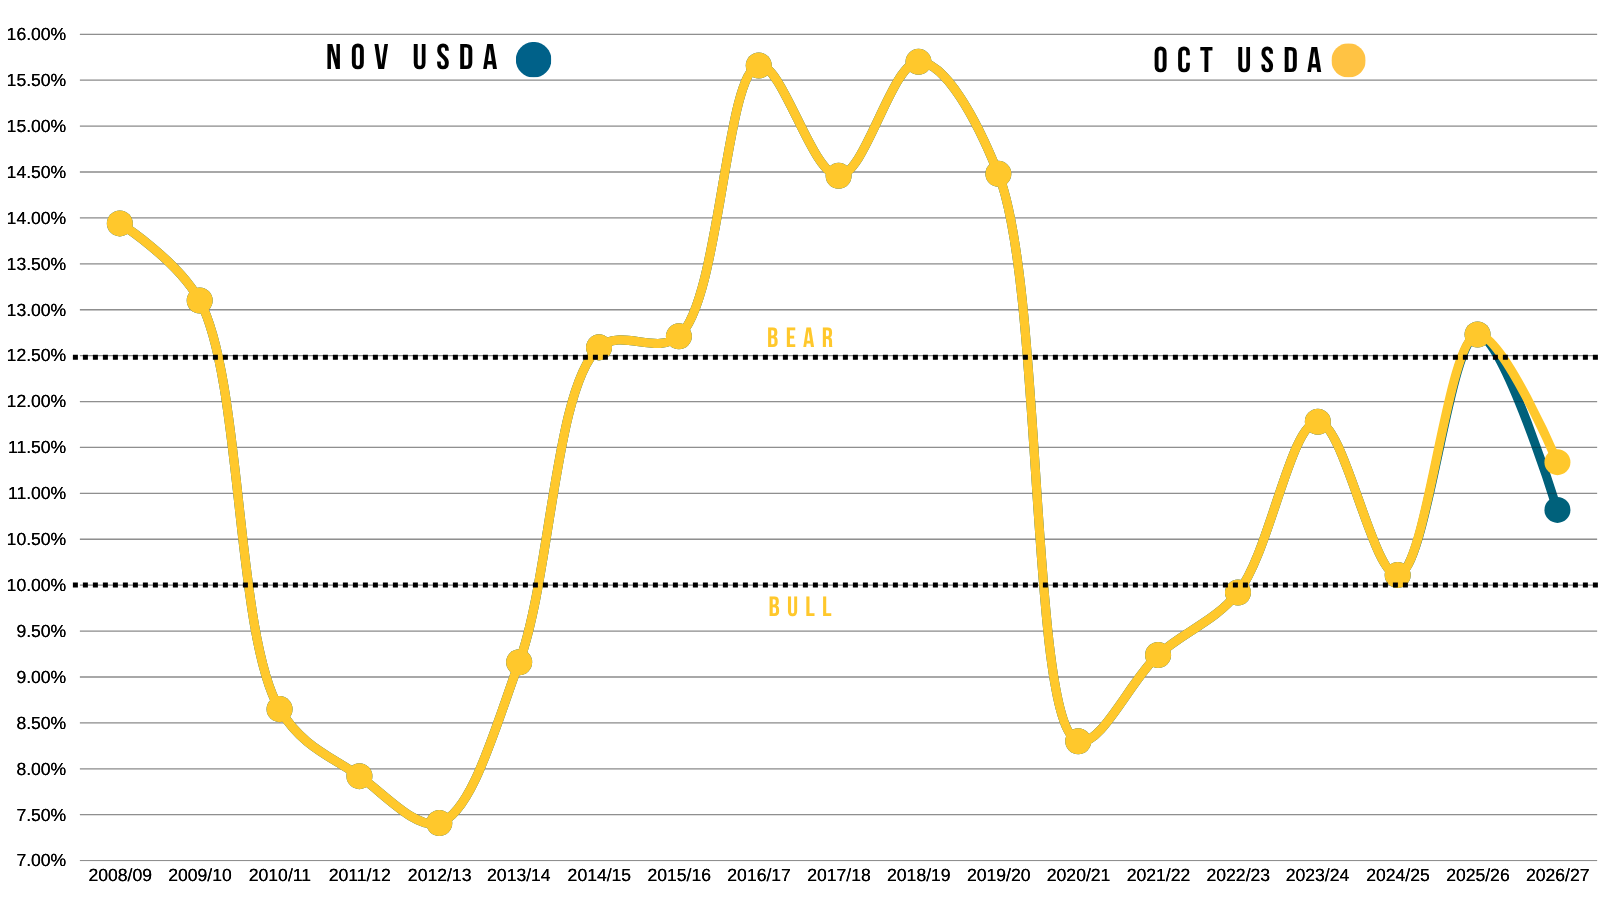
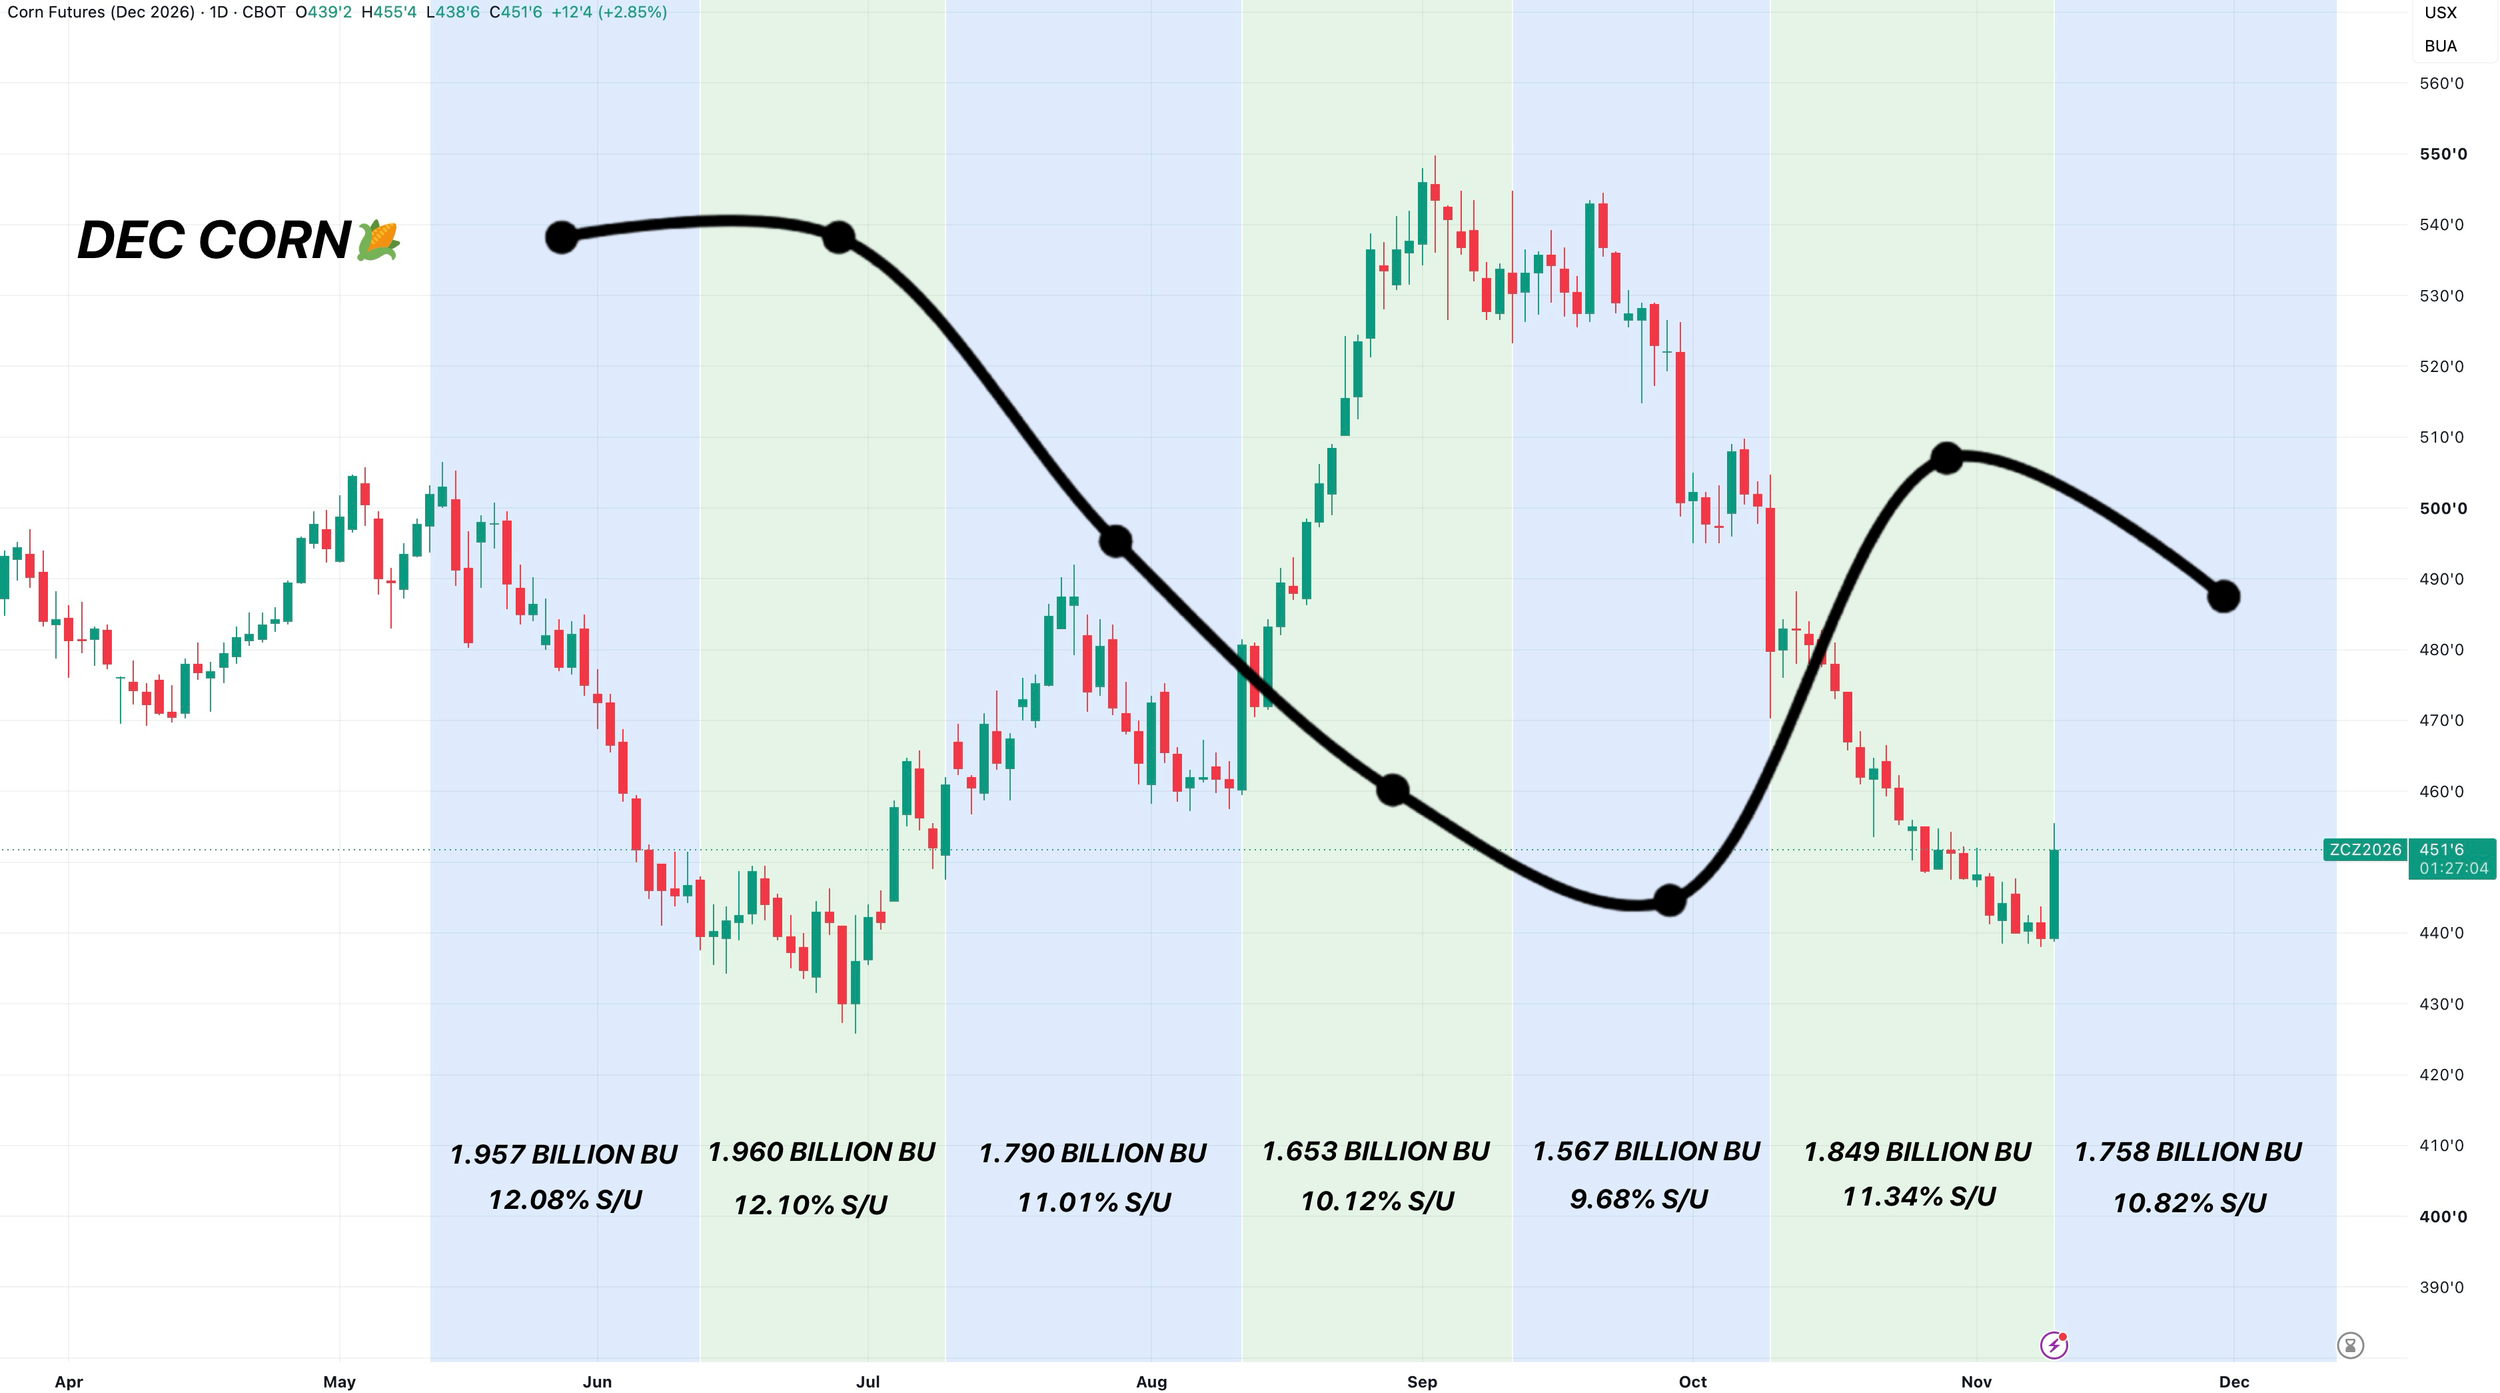
Here is a chart that outlines where our stocks to use ratio was for every WASDE report this year, and highlights the time frame from that report.
10.8% is not nearly as tight as the 10.1% we saw back in August or 9.7% we saw in September.
But this is still tighter than every other month outside of those two.
The last time corn was down at these levels, we were trading a 12% stocks to use and near 2 billion bu carryout. Both of which are far larger than we got today.
So it's probably fair to argue that corn is undervalued down here.
We just spent the last 2 months pricing in a bigger crop. I'd say it's been priced in. And now, the market might need to unwind some of the pricing in it just did.
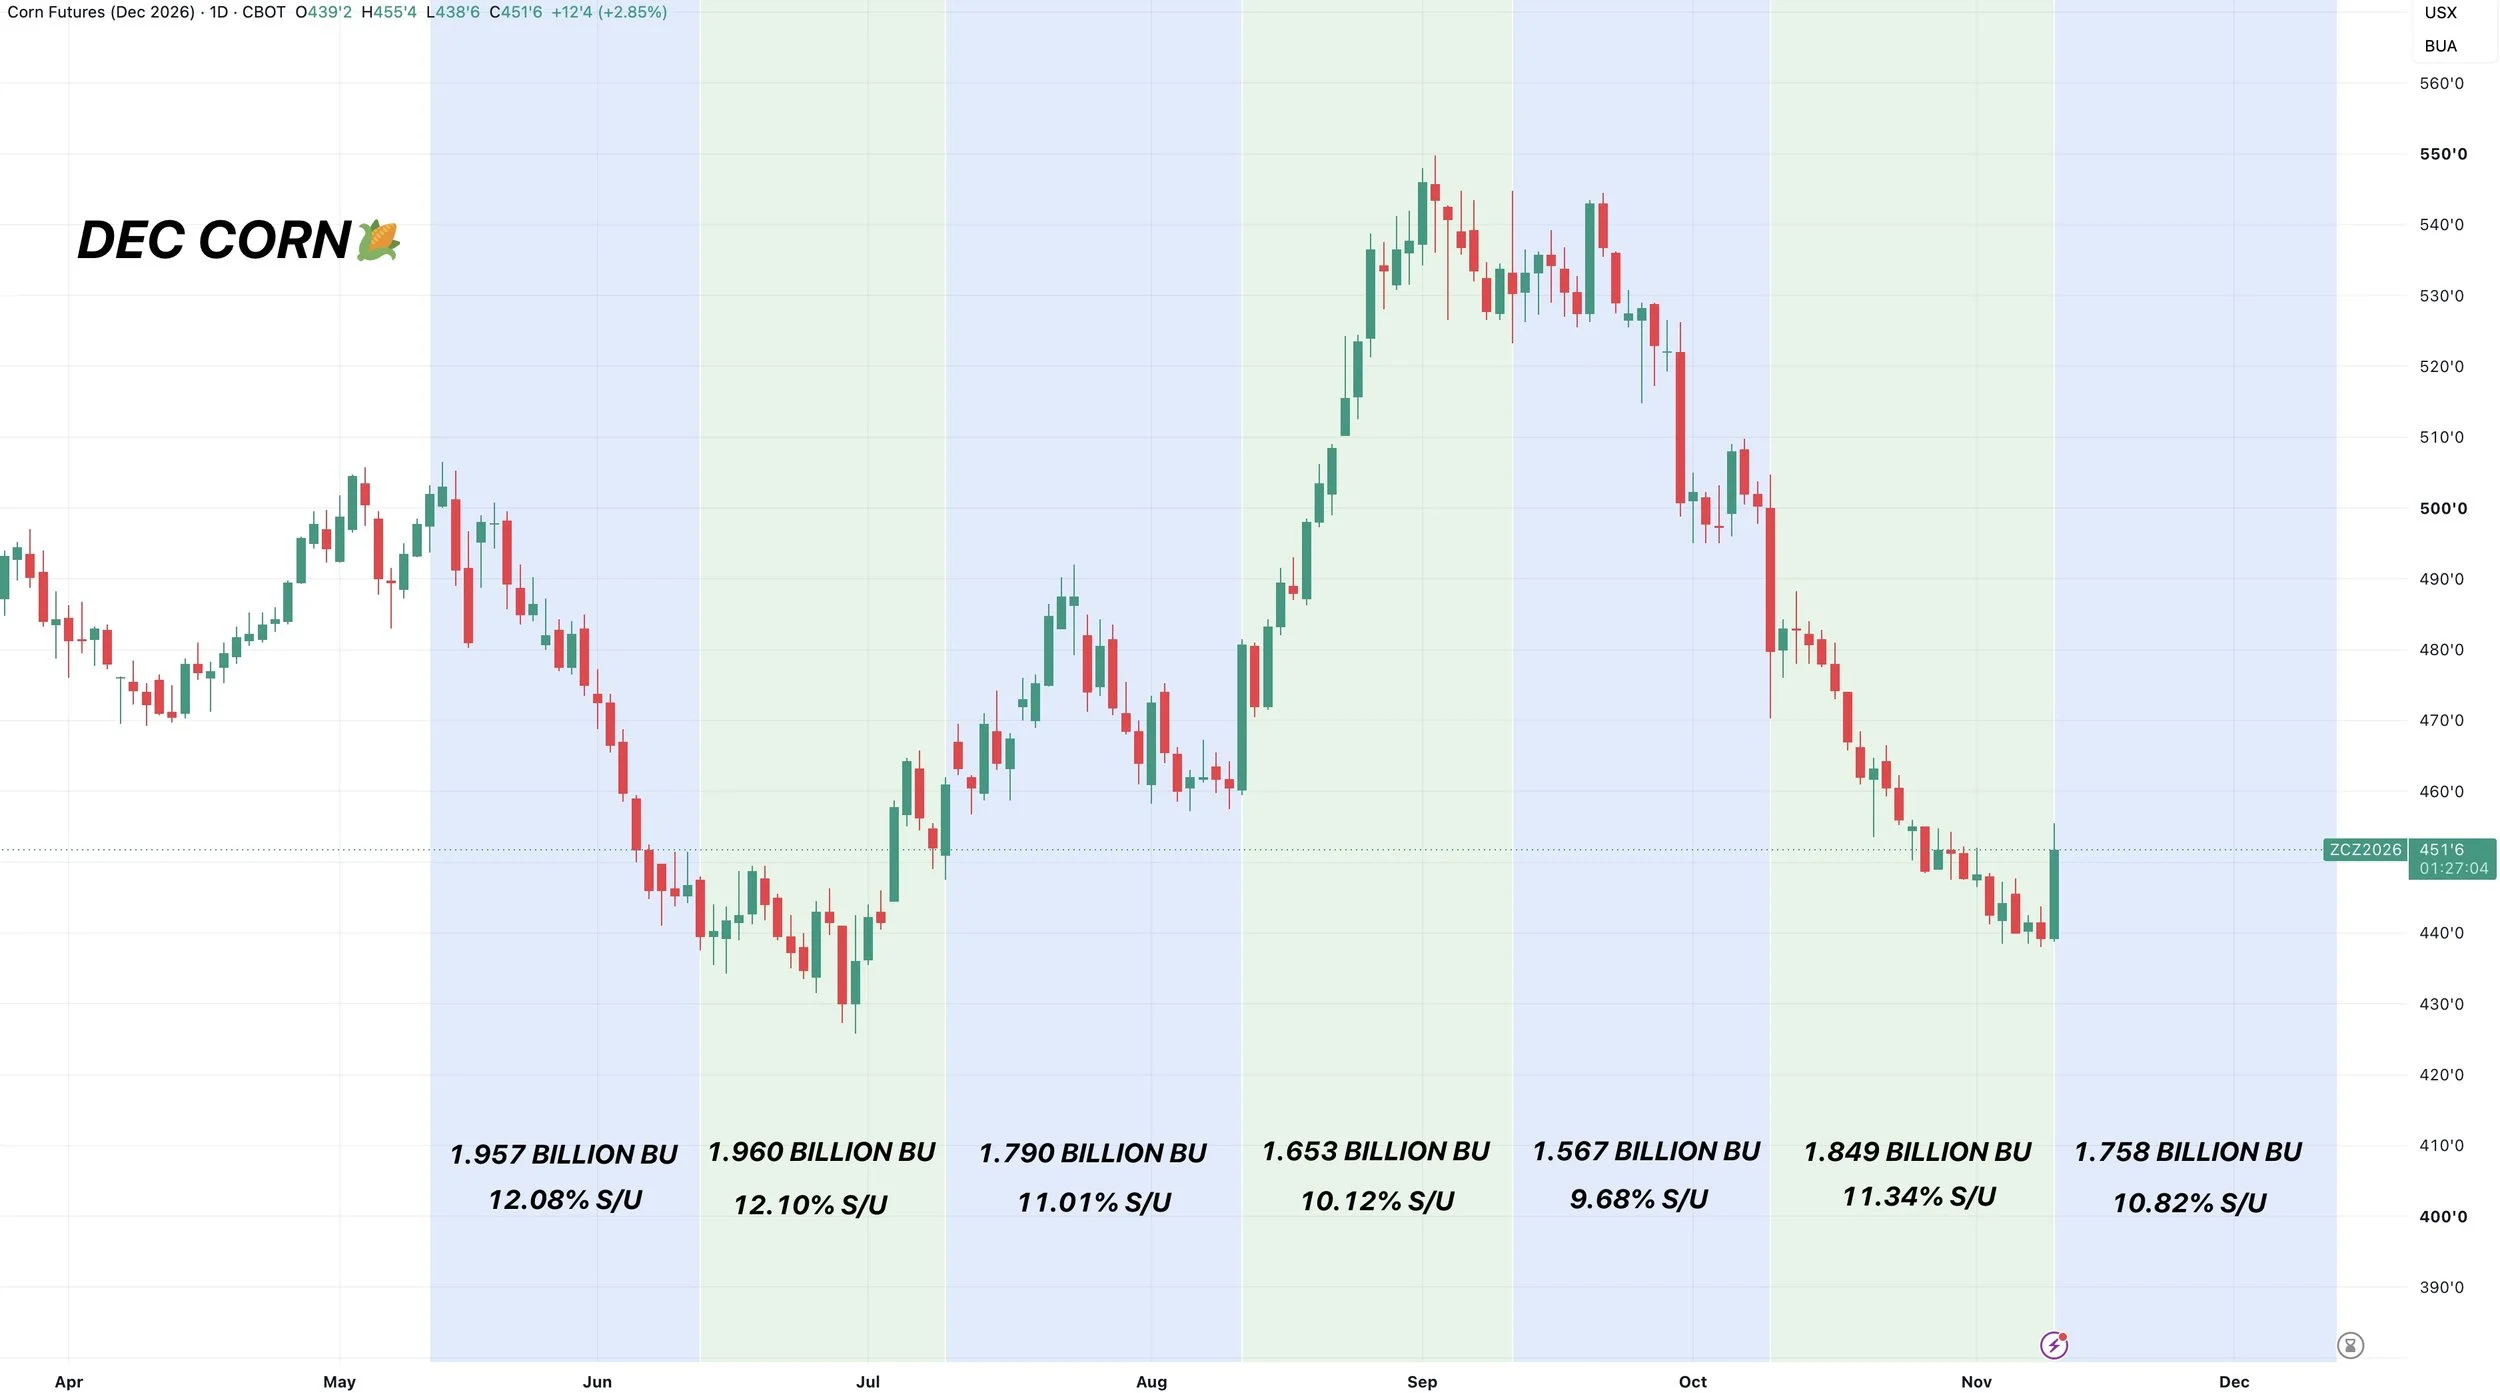
Here is another way to look at it.
This is that same chart, but I threw the stocks to use ratio on top.
Again, the only time frames the S/U was tighter was after the August and September reports.
The balance sheet is still tighter than it was the last time corn traded down here.
Here is a yield visual on how the USDA has changed yield this year.
They bumped it by +2.7 bpa last month.
They cut it by -1.6 bpa this month.
We're only a bushel higher than that September estimate now.
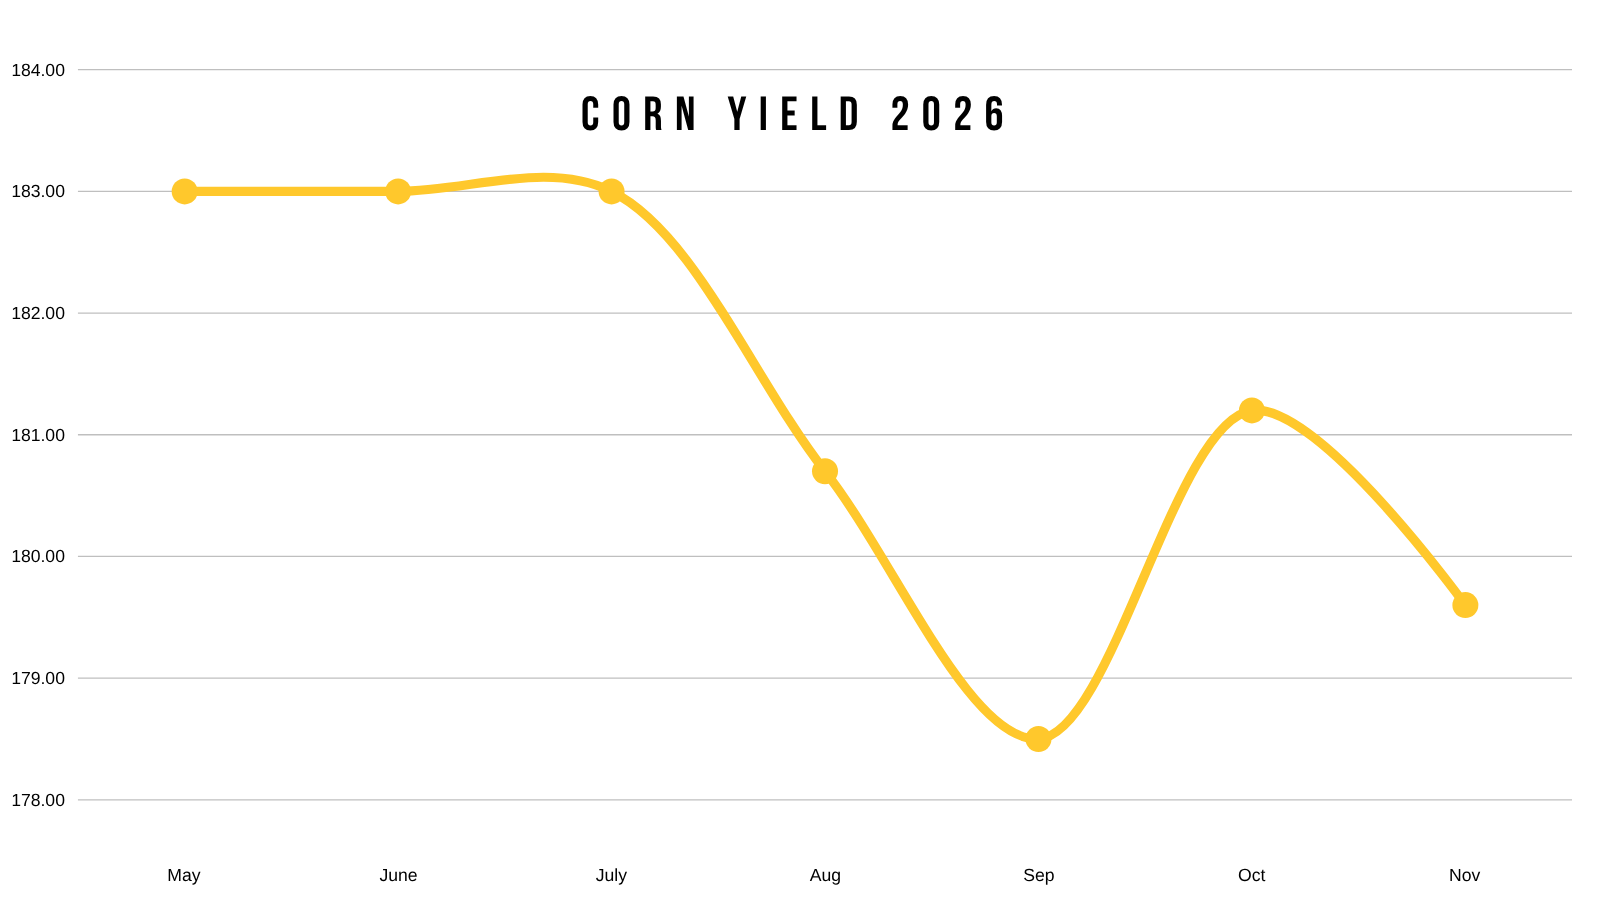
We will see what the USDA does in January. It does feel like corn yield could still come down a little further from here.
The December report is usually not a big market mover and they don’t change production.
But corn could very well be starting to put together a story for next year.
Which no, will not matter today, but is definitely something to keep in the back of your mind later on.
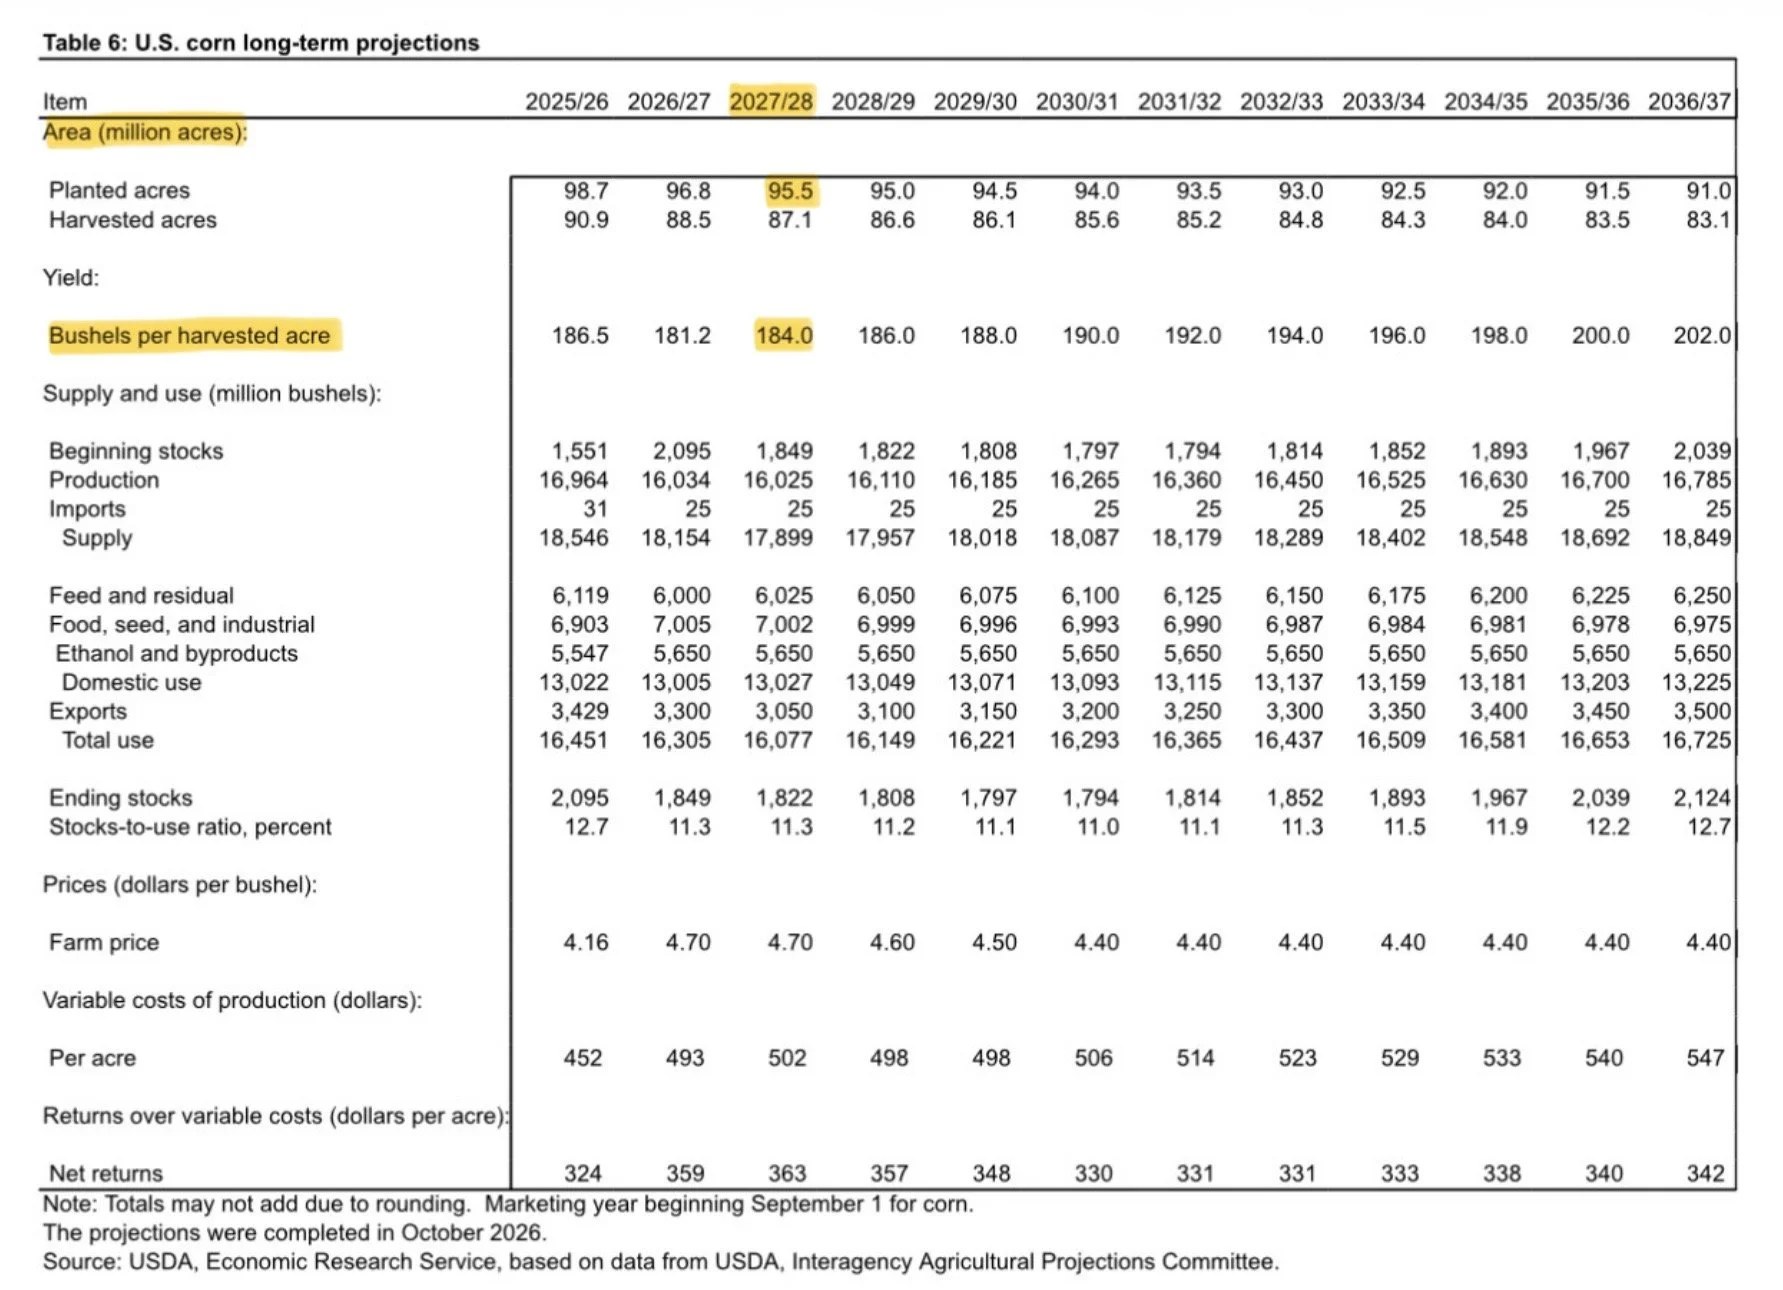
The USDA just put out some baseline projections for next year.
They have corn acres down another -1.3 million next year. Along with a 184 yield.
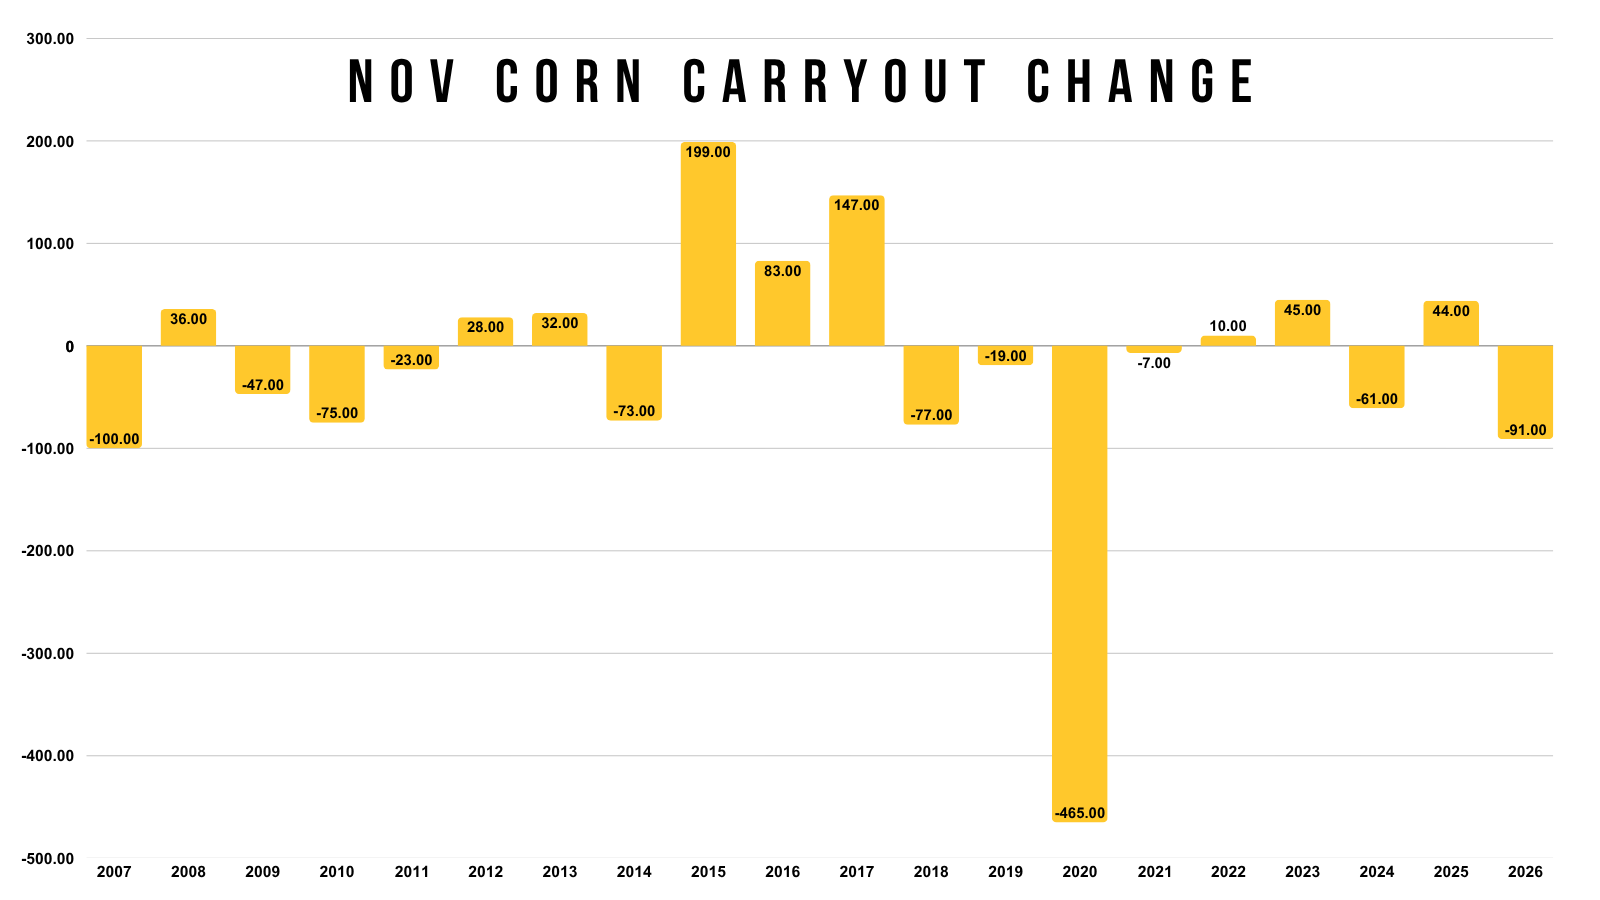
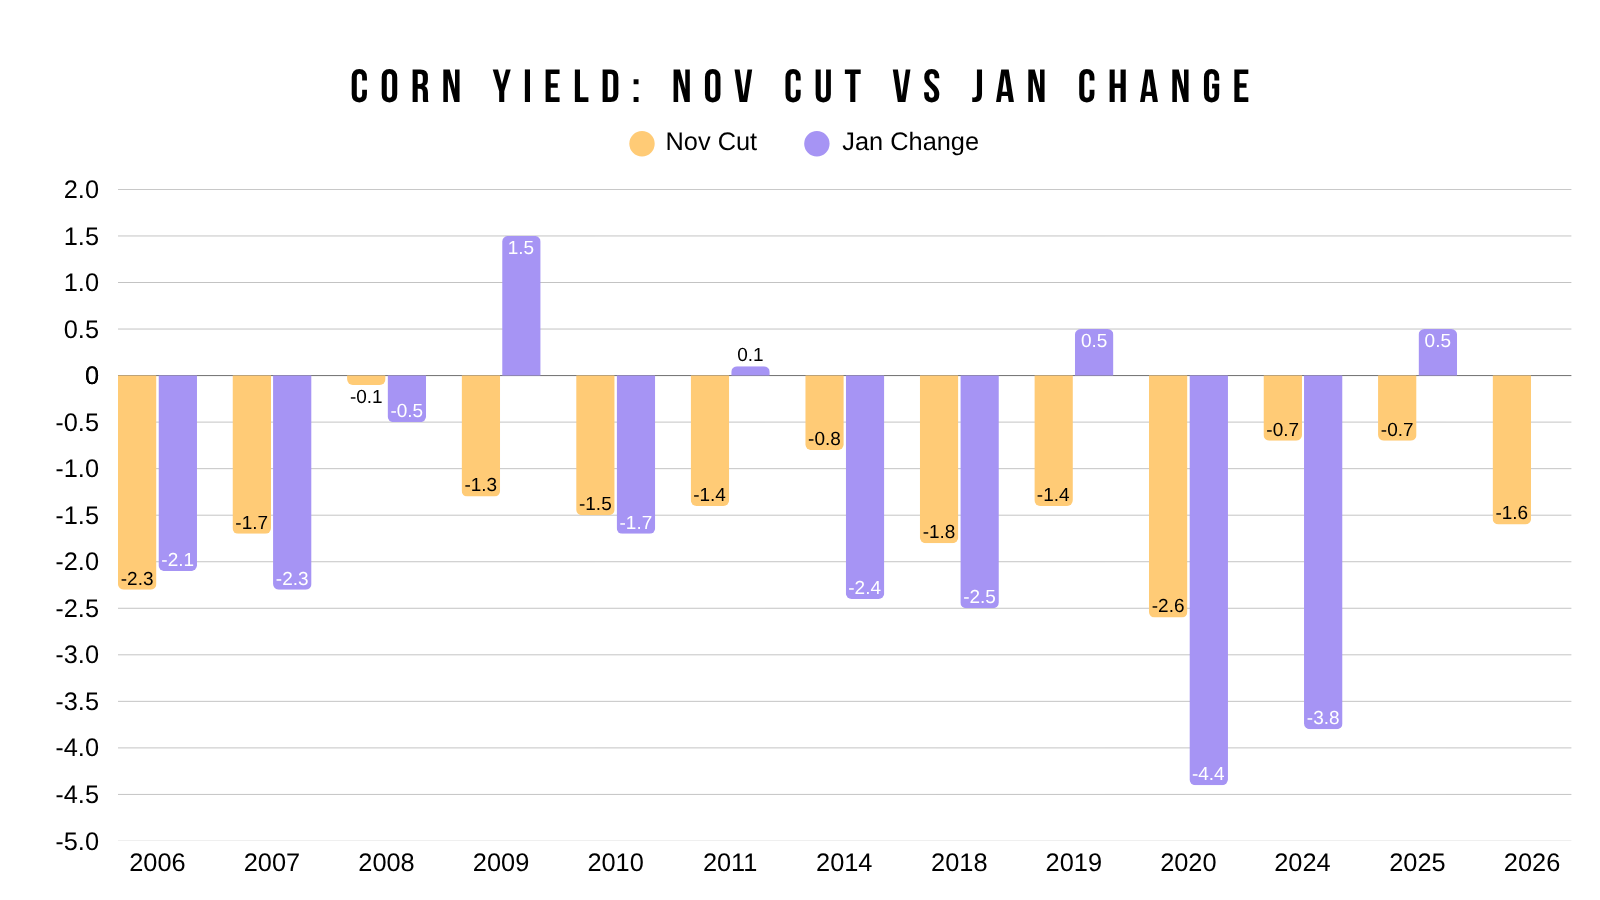
If we look at the past carryout changes for this report.
This was actually one of the friendliest November reports we've seen.
The only other years we saw a bigger drop in carryout was 2020 and 2007.
I mean carryout did just come in -100 million below what the trade was expecting. So to me, that means we already priced in a more bearish scenario than we now have.
I'd like to think this finally stops the bleeding in corn and gets the funds to take their hand off the sell button.
Here is some other data.
The USDA has cut yield in November 12 times.
In 8 of those 12 they also lowered the yield in January. On average they lower it 1.4 bpa.
Now let's look at soybeans.
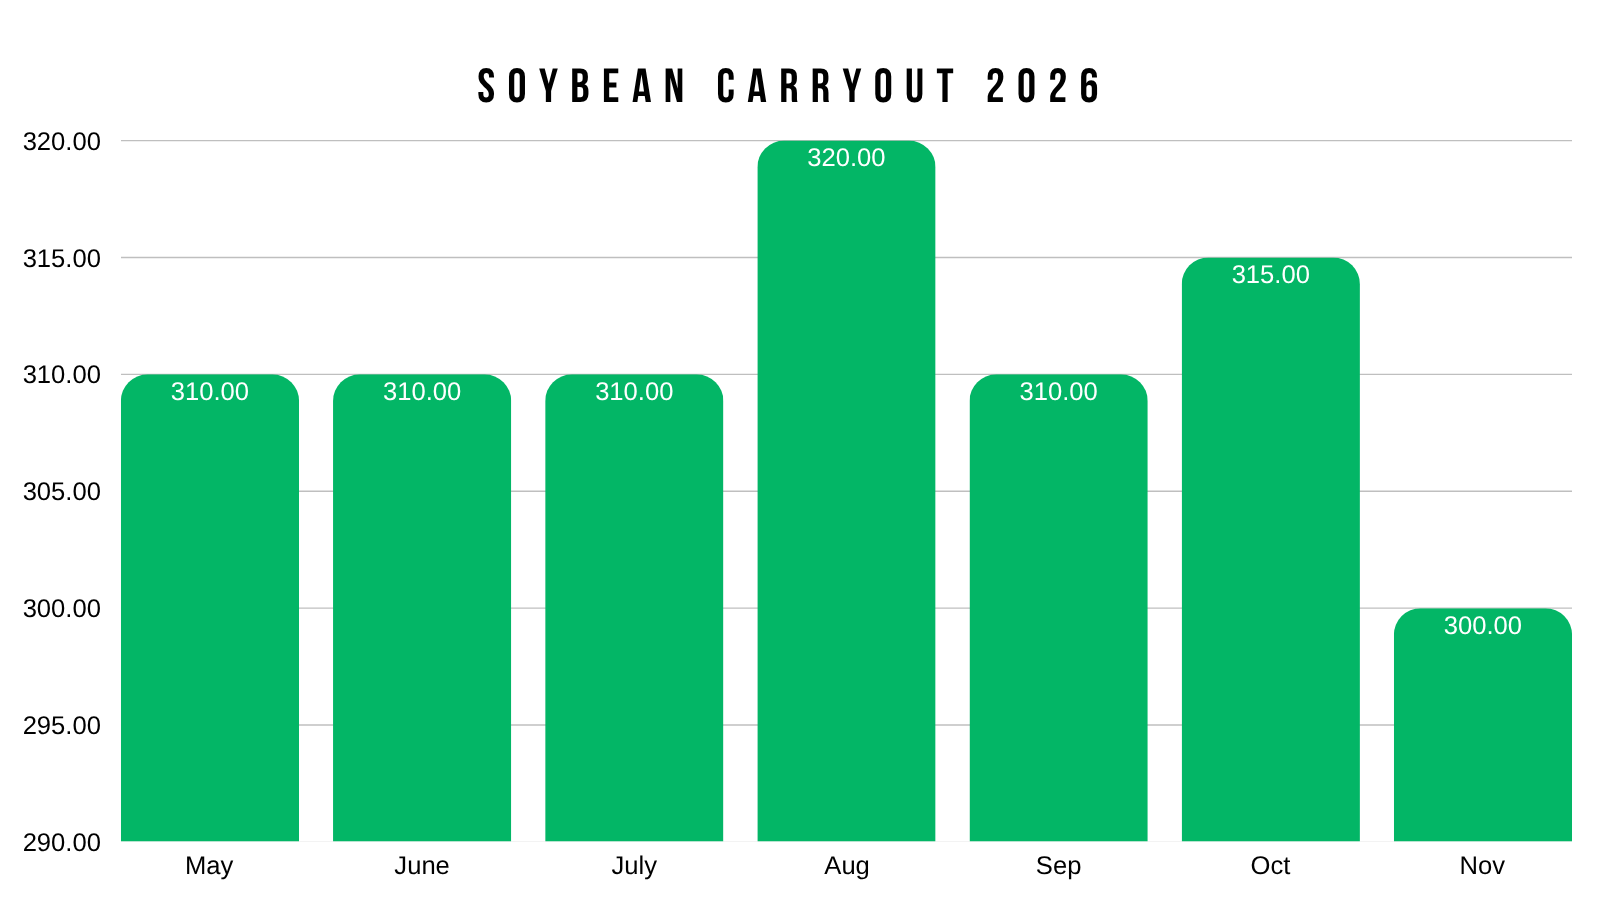
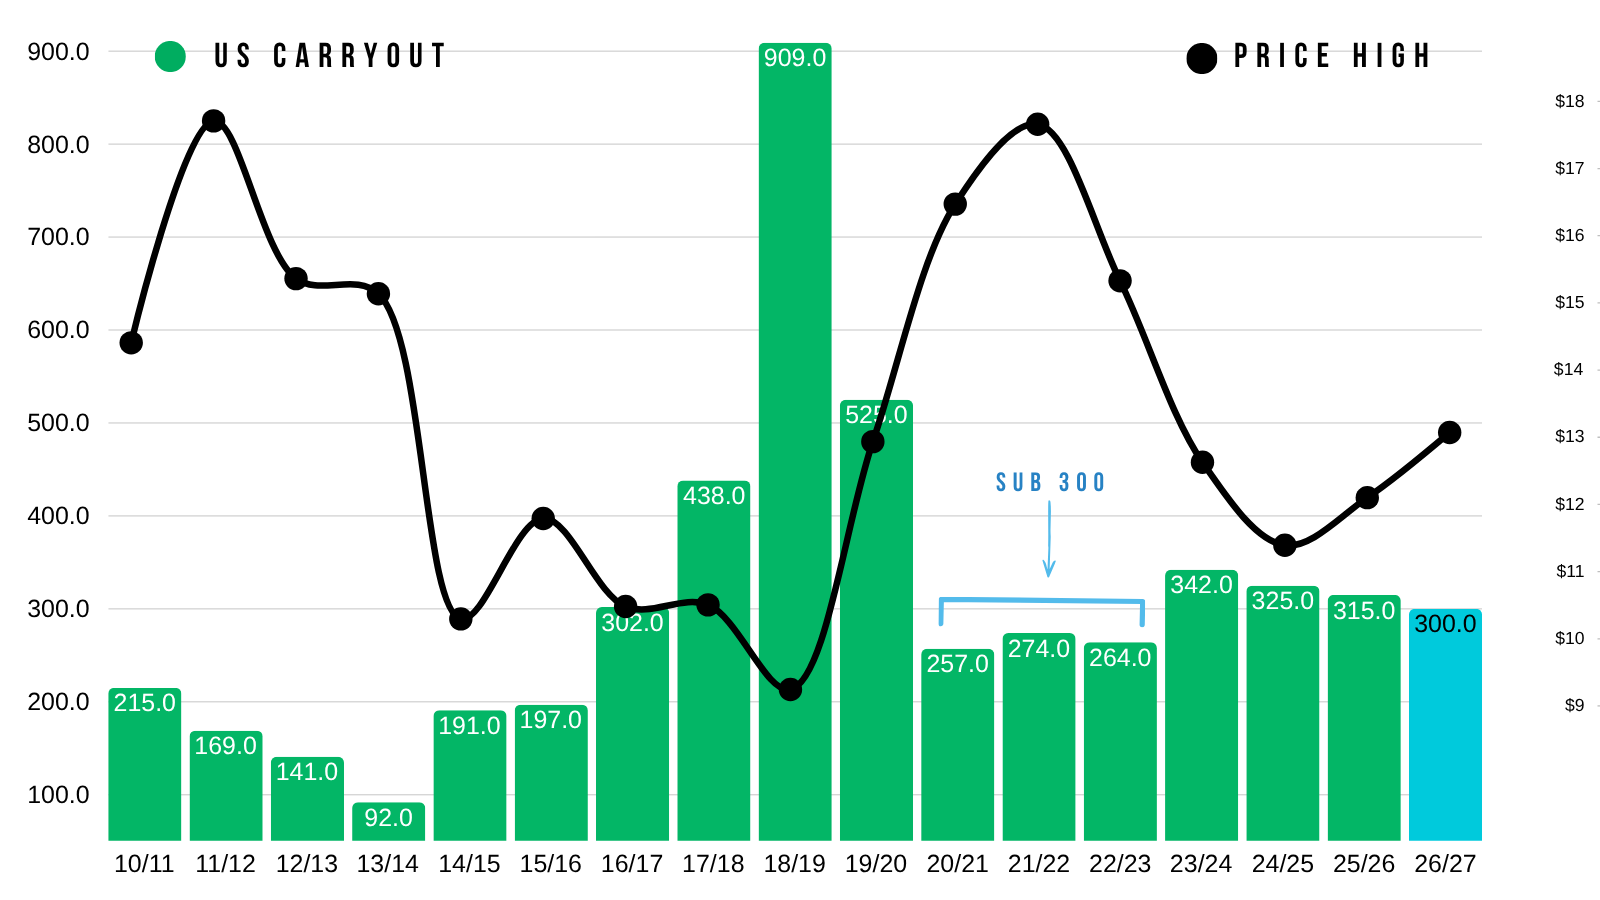
Our carryout just came in at 300 million.
This would be the smallest carryout we have seen this year.
Yet.. prices are well below the recent highs.
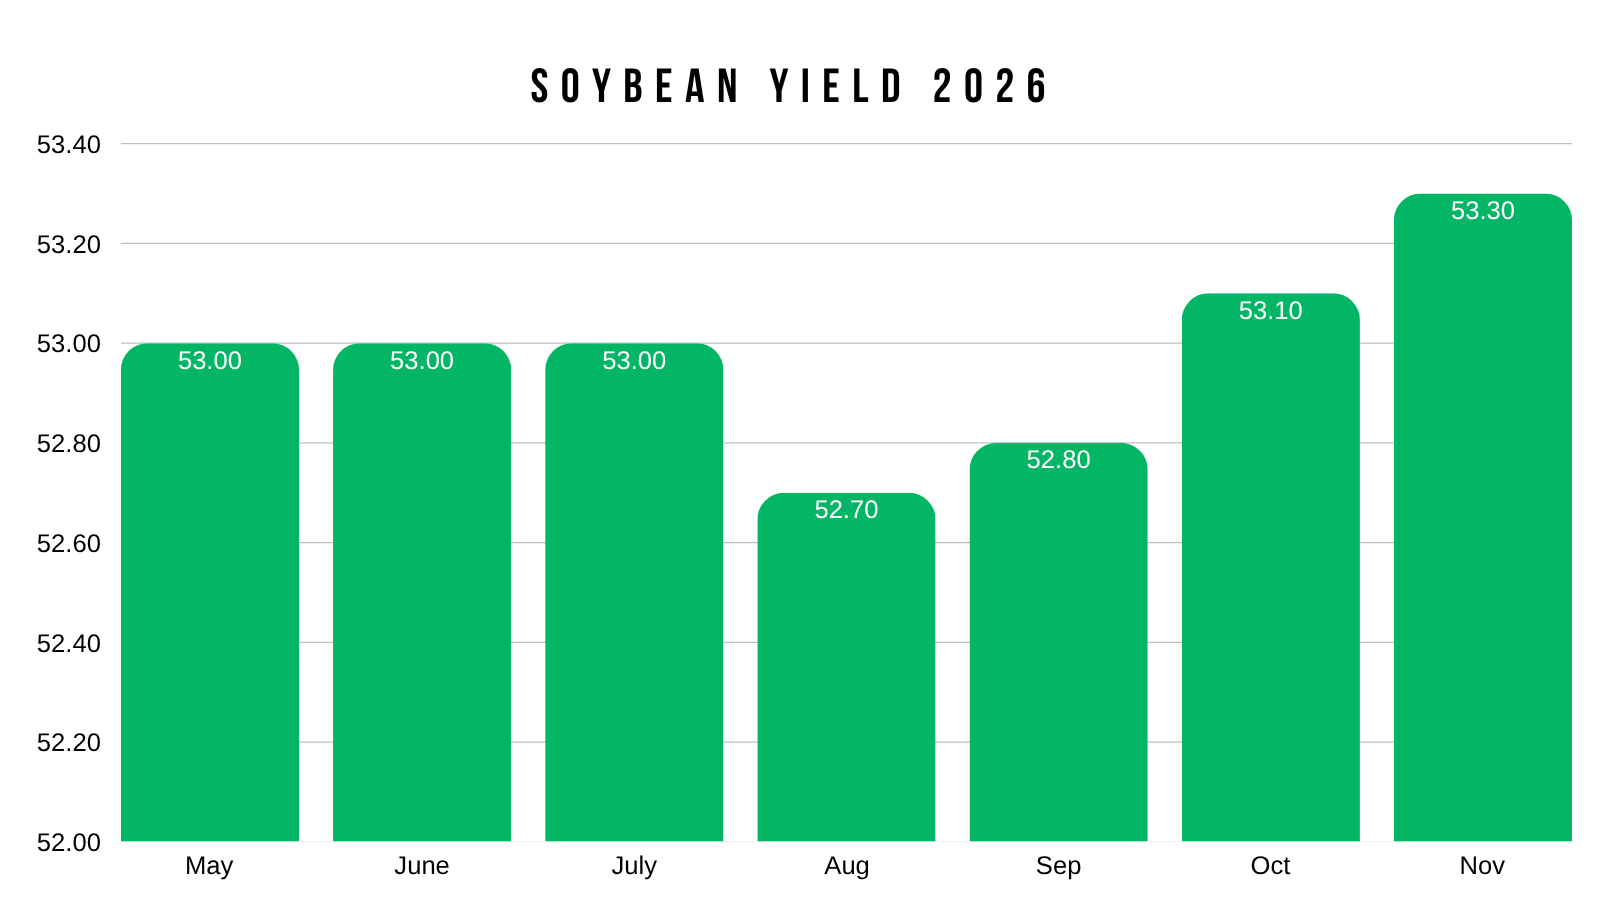
At the same time, this report also gave us our largest yield print of the year.
Yet.. the balance sheet has continued to get smaller.
Why?
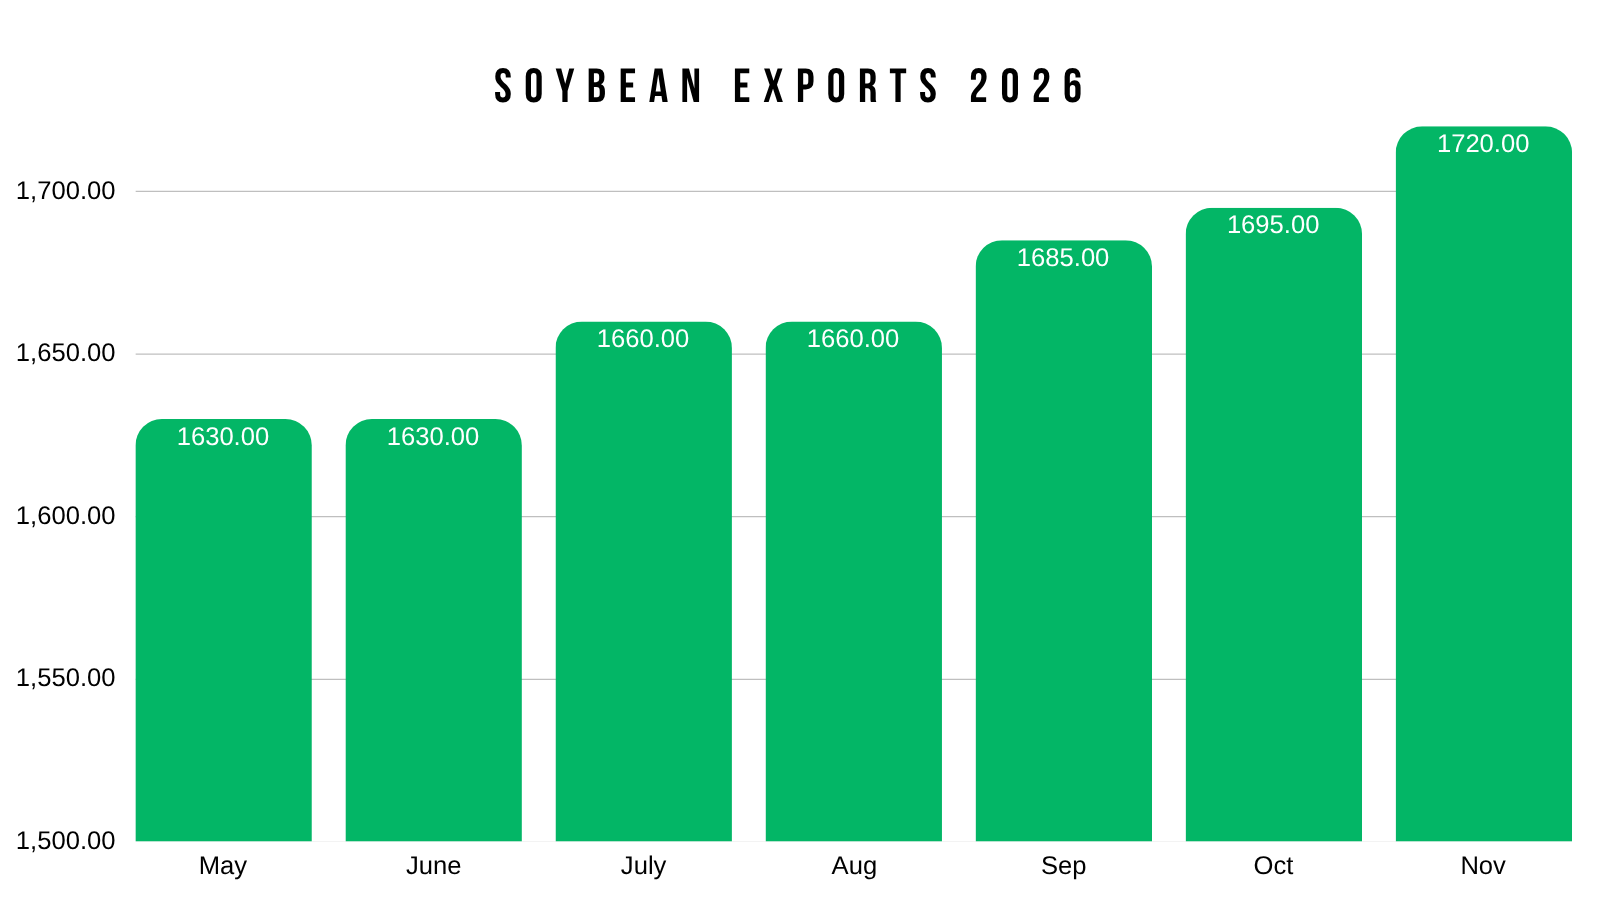
Because demand is just that impressive.
Exports alone have ate up +90 million bu on the balance sheet since the start of the year.
They've continued to steadily increase, and I would argue they continue to do so.
The US balance sheet is not a perfect way to gauge the fair value of soybeans, given it's more of a global crop compared to corn. And the US is not the leading soybean grower like in corn.
However, we have a carryout of 300 million.
Historically, the last time we fell below 300 million was the bull market.
The world balance sheet might be a better way to get a grasp on the overall value of soybeans considering the US is not the #1 player in town like we were years ago.
There is a decently high correlation between soybean prices and the world story.
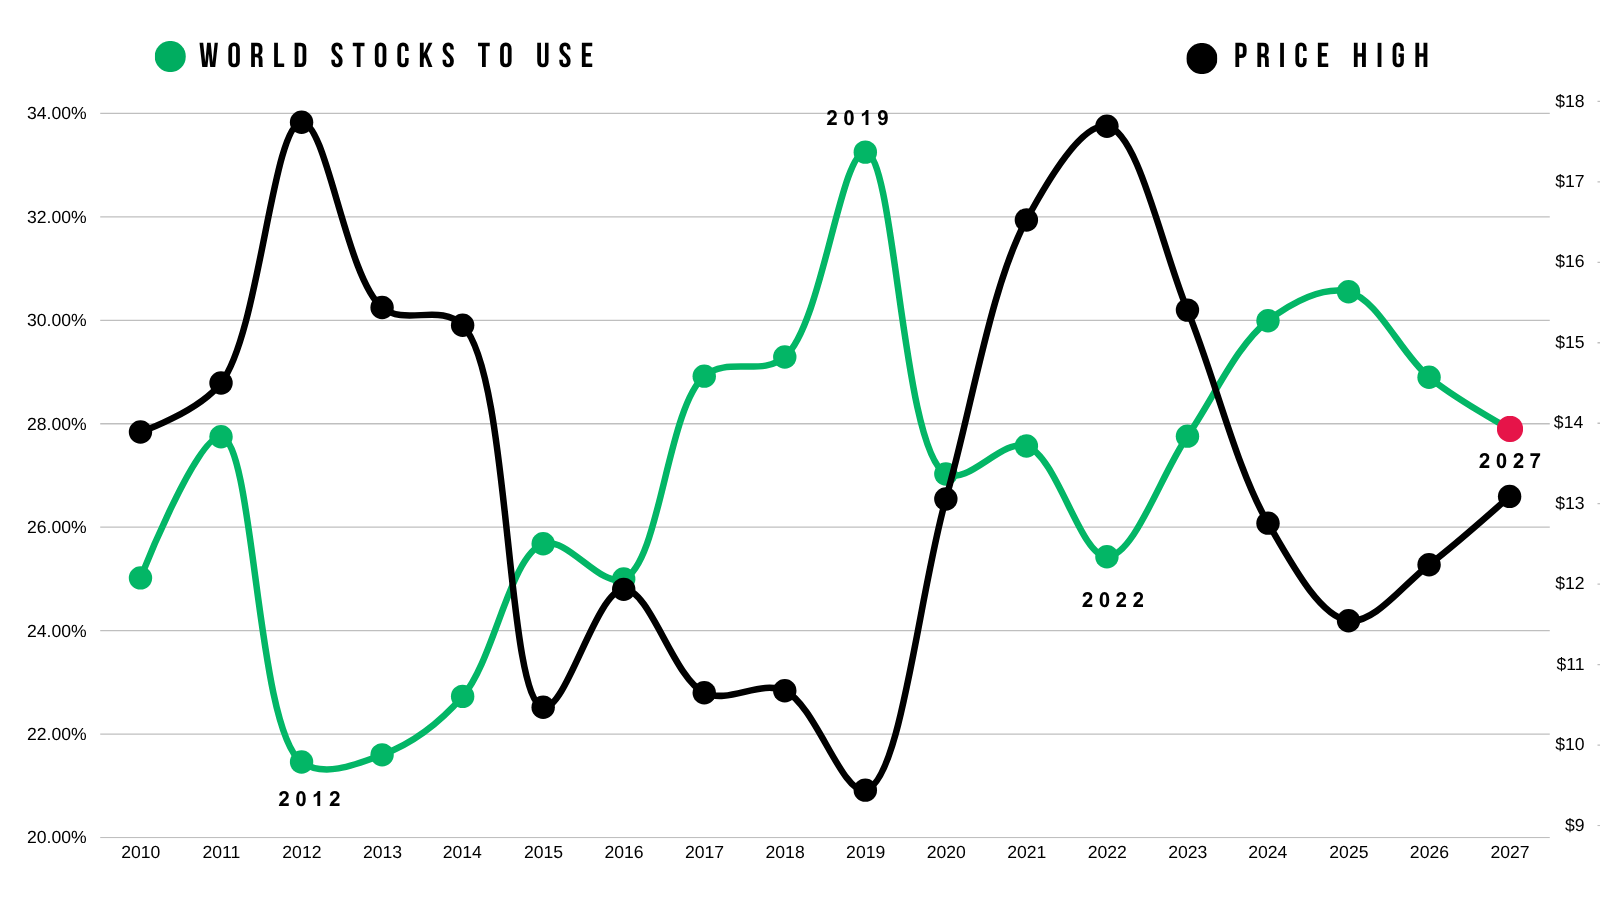
The world situation continues to get tighter.
This is despite a record crop in the US.
Despite Brazil continuing to put out record crops.
It's the tightest it's been in the last several years.
The tightest since 2022.
The Super El Nino and Brazil weather is obviously going to be a big driver for this market. Which is a story for another day, and I think things could potentially be impacted down there..
But the point is that the world cannot afford a hiccup in Brazil.
The record crops are not enough for this world situation to grow.
What do you think happens if the world's biggest producer even has a small issue?
This chart showcases this example. You can see the record crops, yet the balance sheet is shrinking.
The funds are still long beans for a reason. I think they at least want to see how the Brazil weather season shakes out before puking out of their longs.
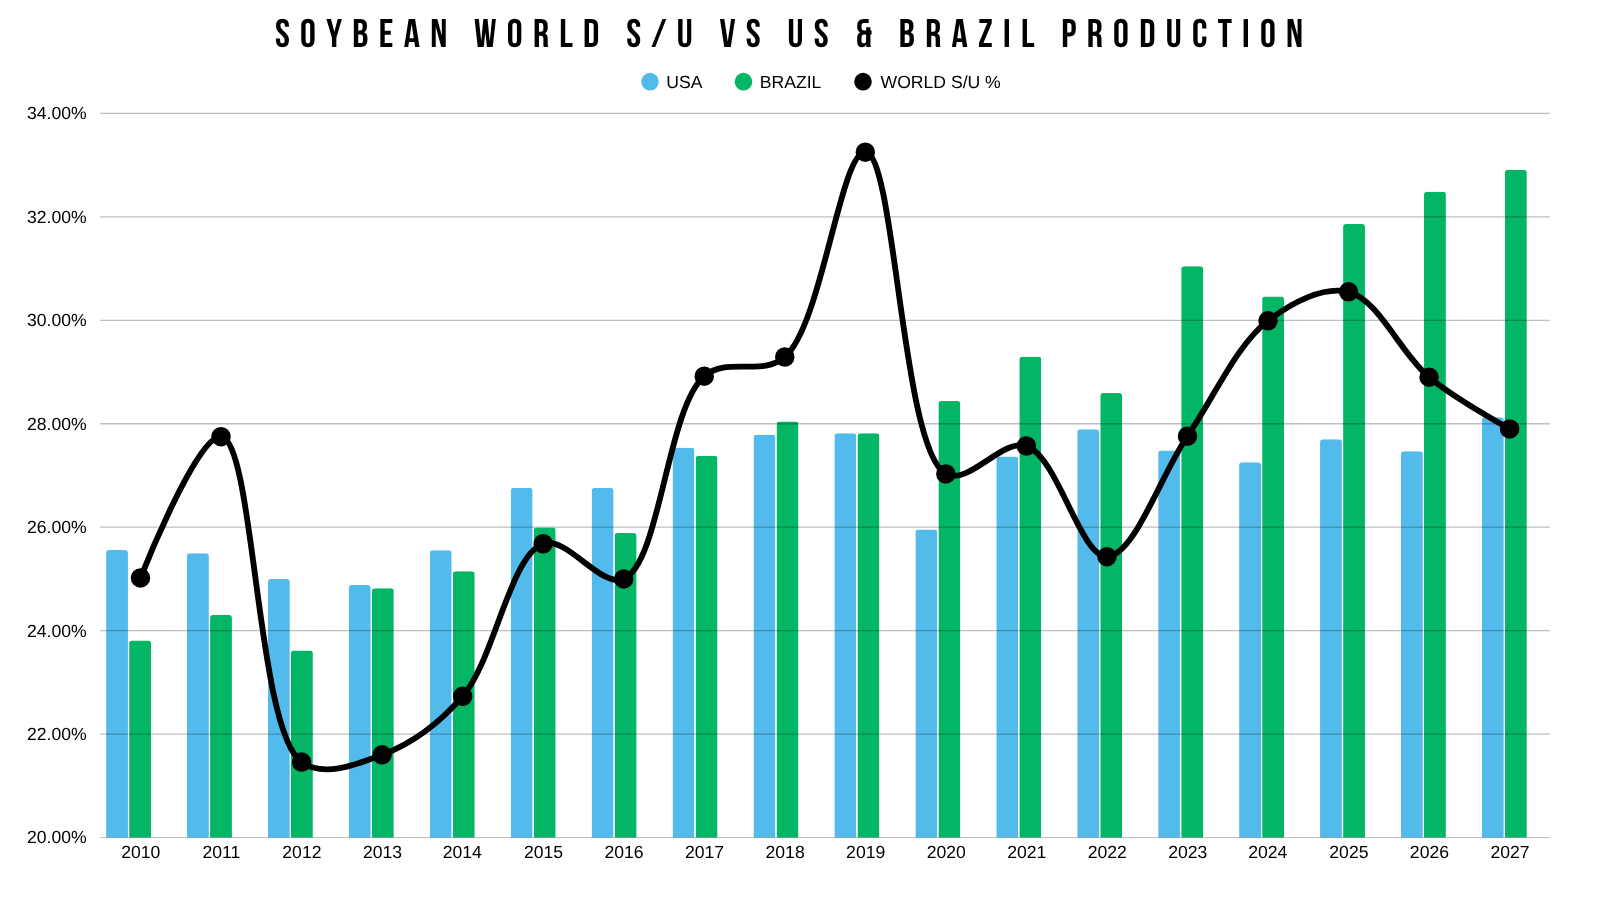
Chart Breakdowns
Corn
USDA Pivots:
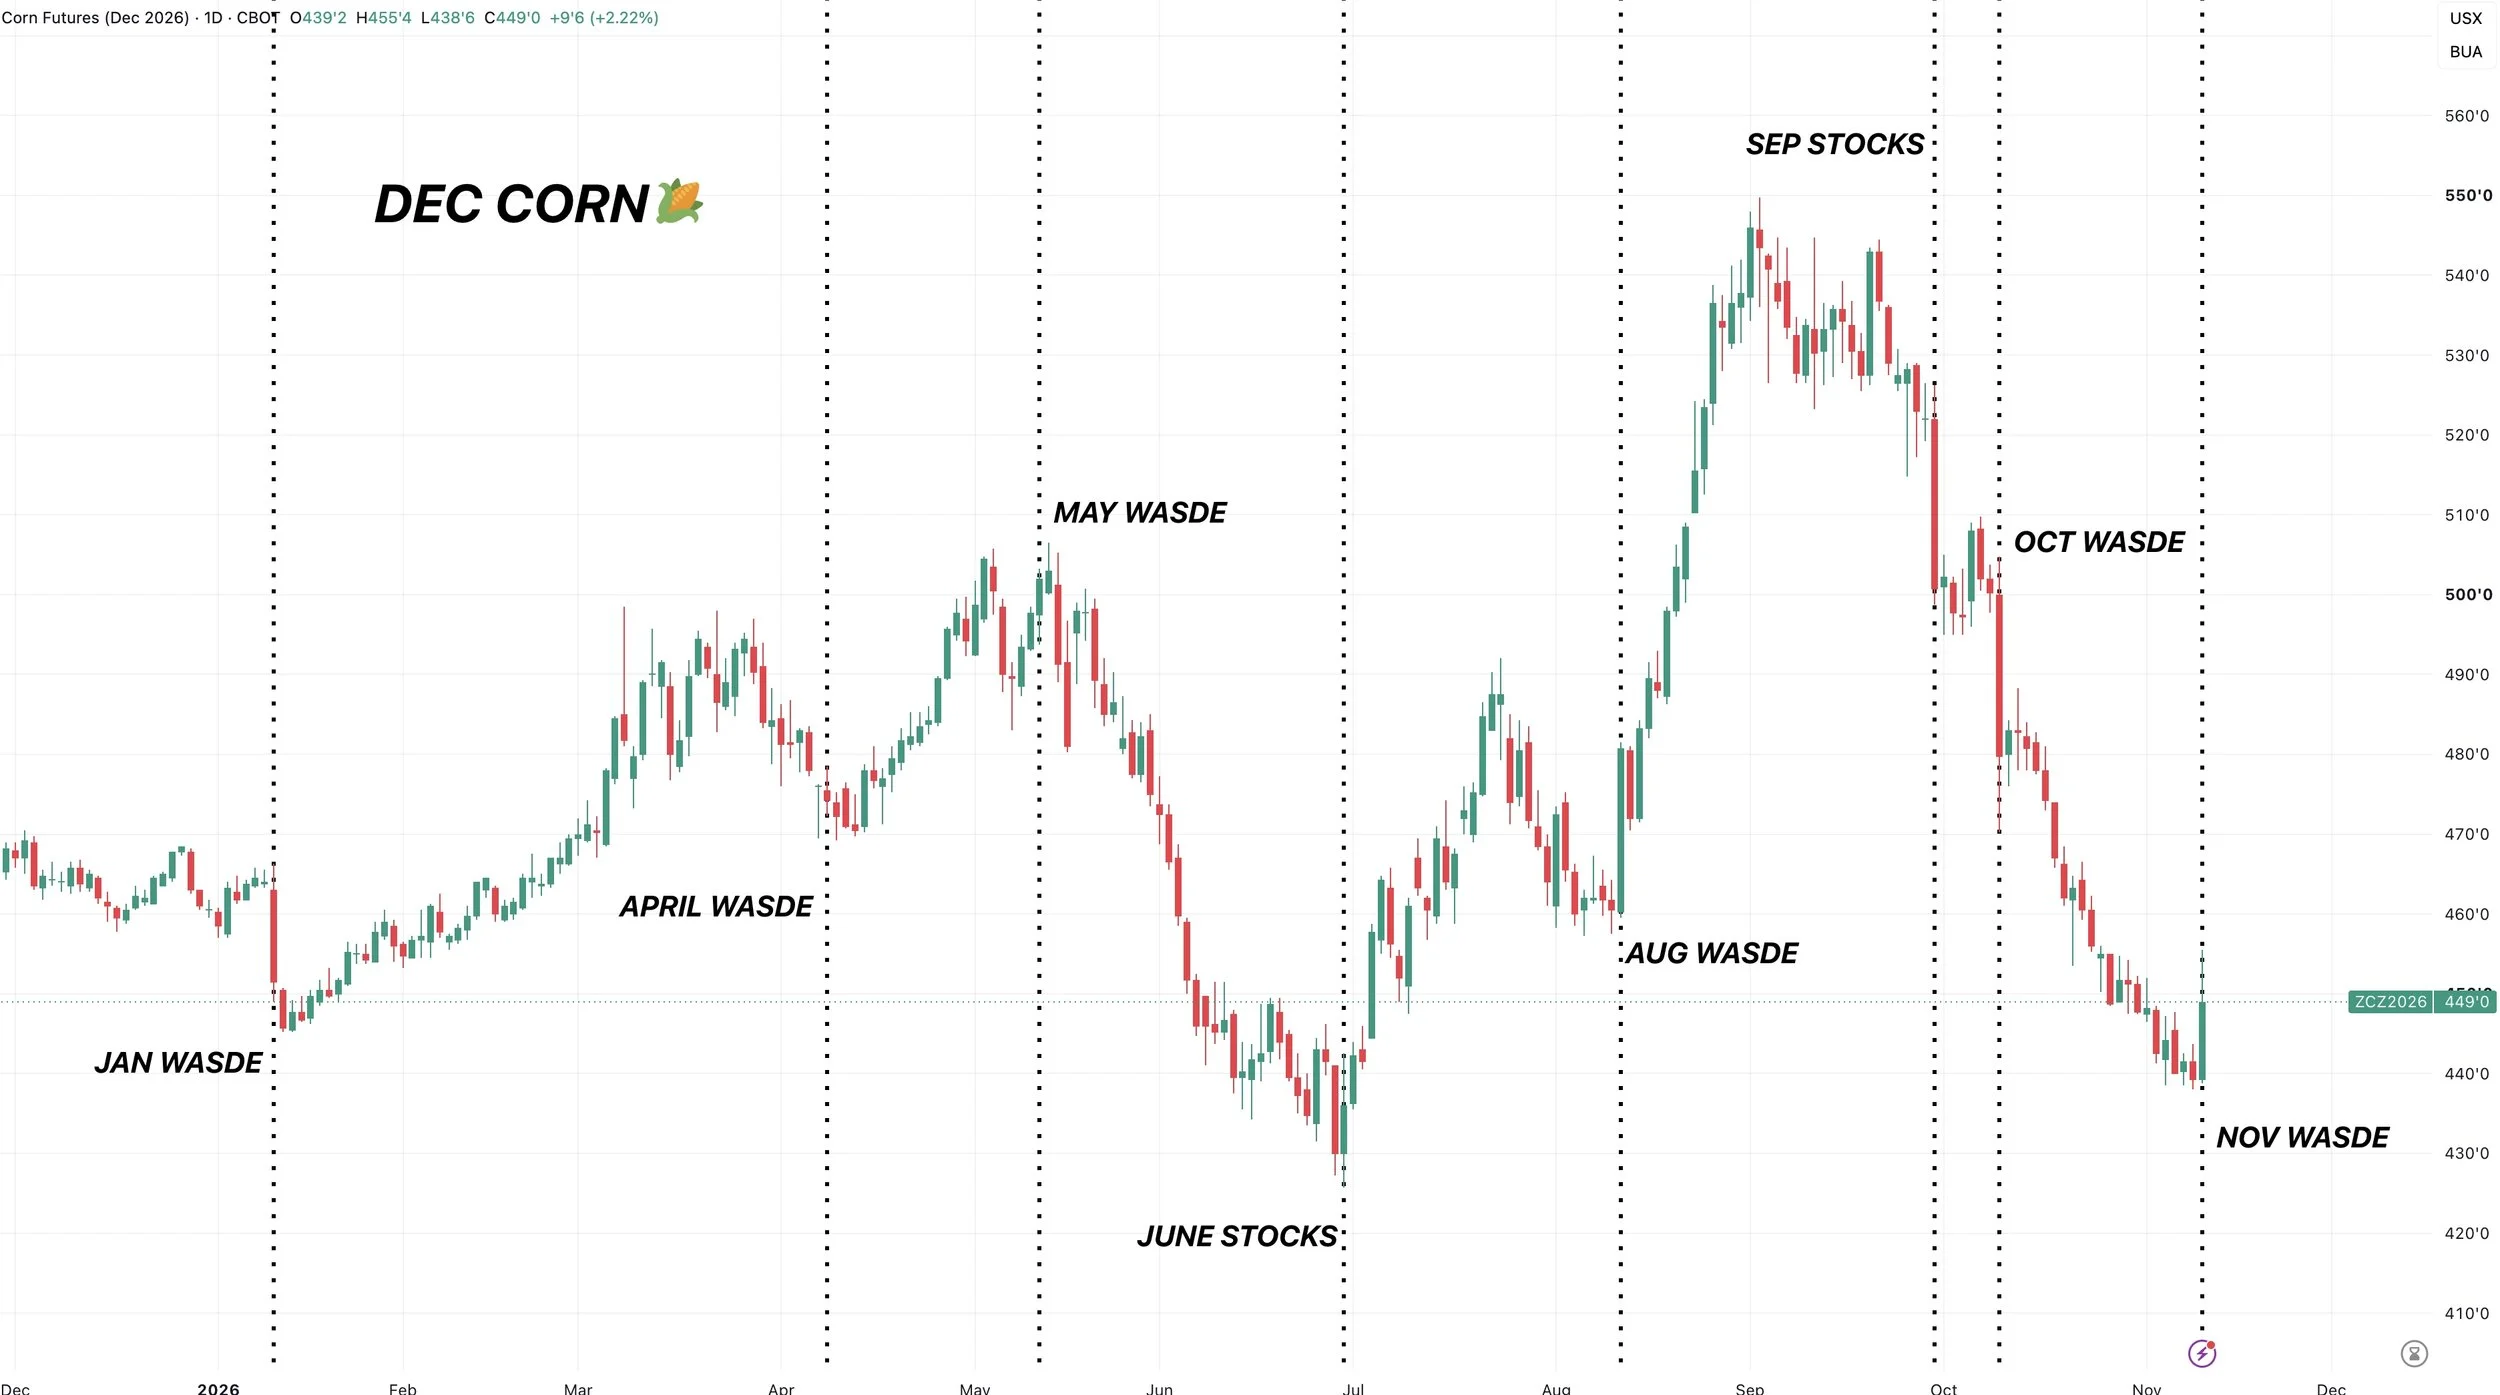
Like we mentioned last week, USDA reports have marked countless turning points in this market this year.
We bottomed after Jan WASDE.
Bottomed after April WASDE.
Topped after May WASDE.
Bottomed on June stocks.
Bottomed on Aug WASDE.
Fell apart on both the Sep stocks and Oct WASDE.
Maybe this market is finally able to bottom now, as we just spent the last two months pricing in a bigger crop.
Along with the fact that I'm sure the farmer is going to be pretty disengaged for the rest of the year.
If you notice, corn has not spent really anytime at all this year trading sideways. We are either running higher or falling apart.
I don’t think this fresh data from the USDA suggests prices need to get cheaper from here.
Dec Corn Chart:
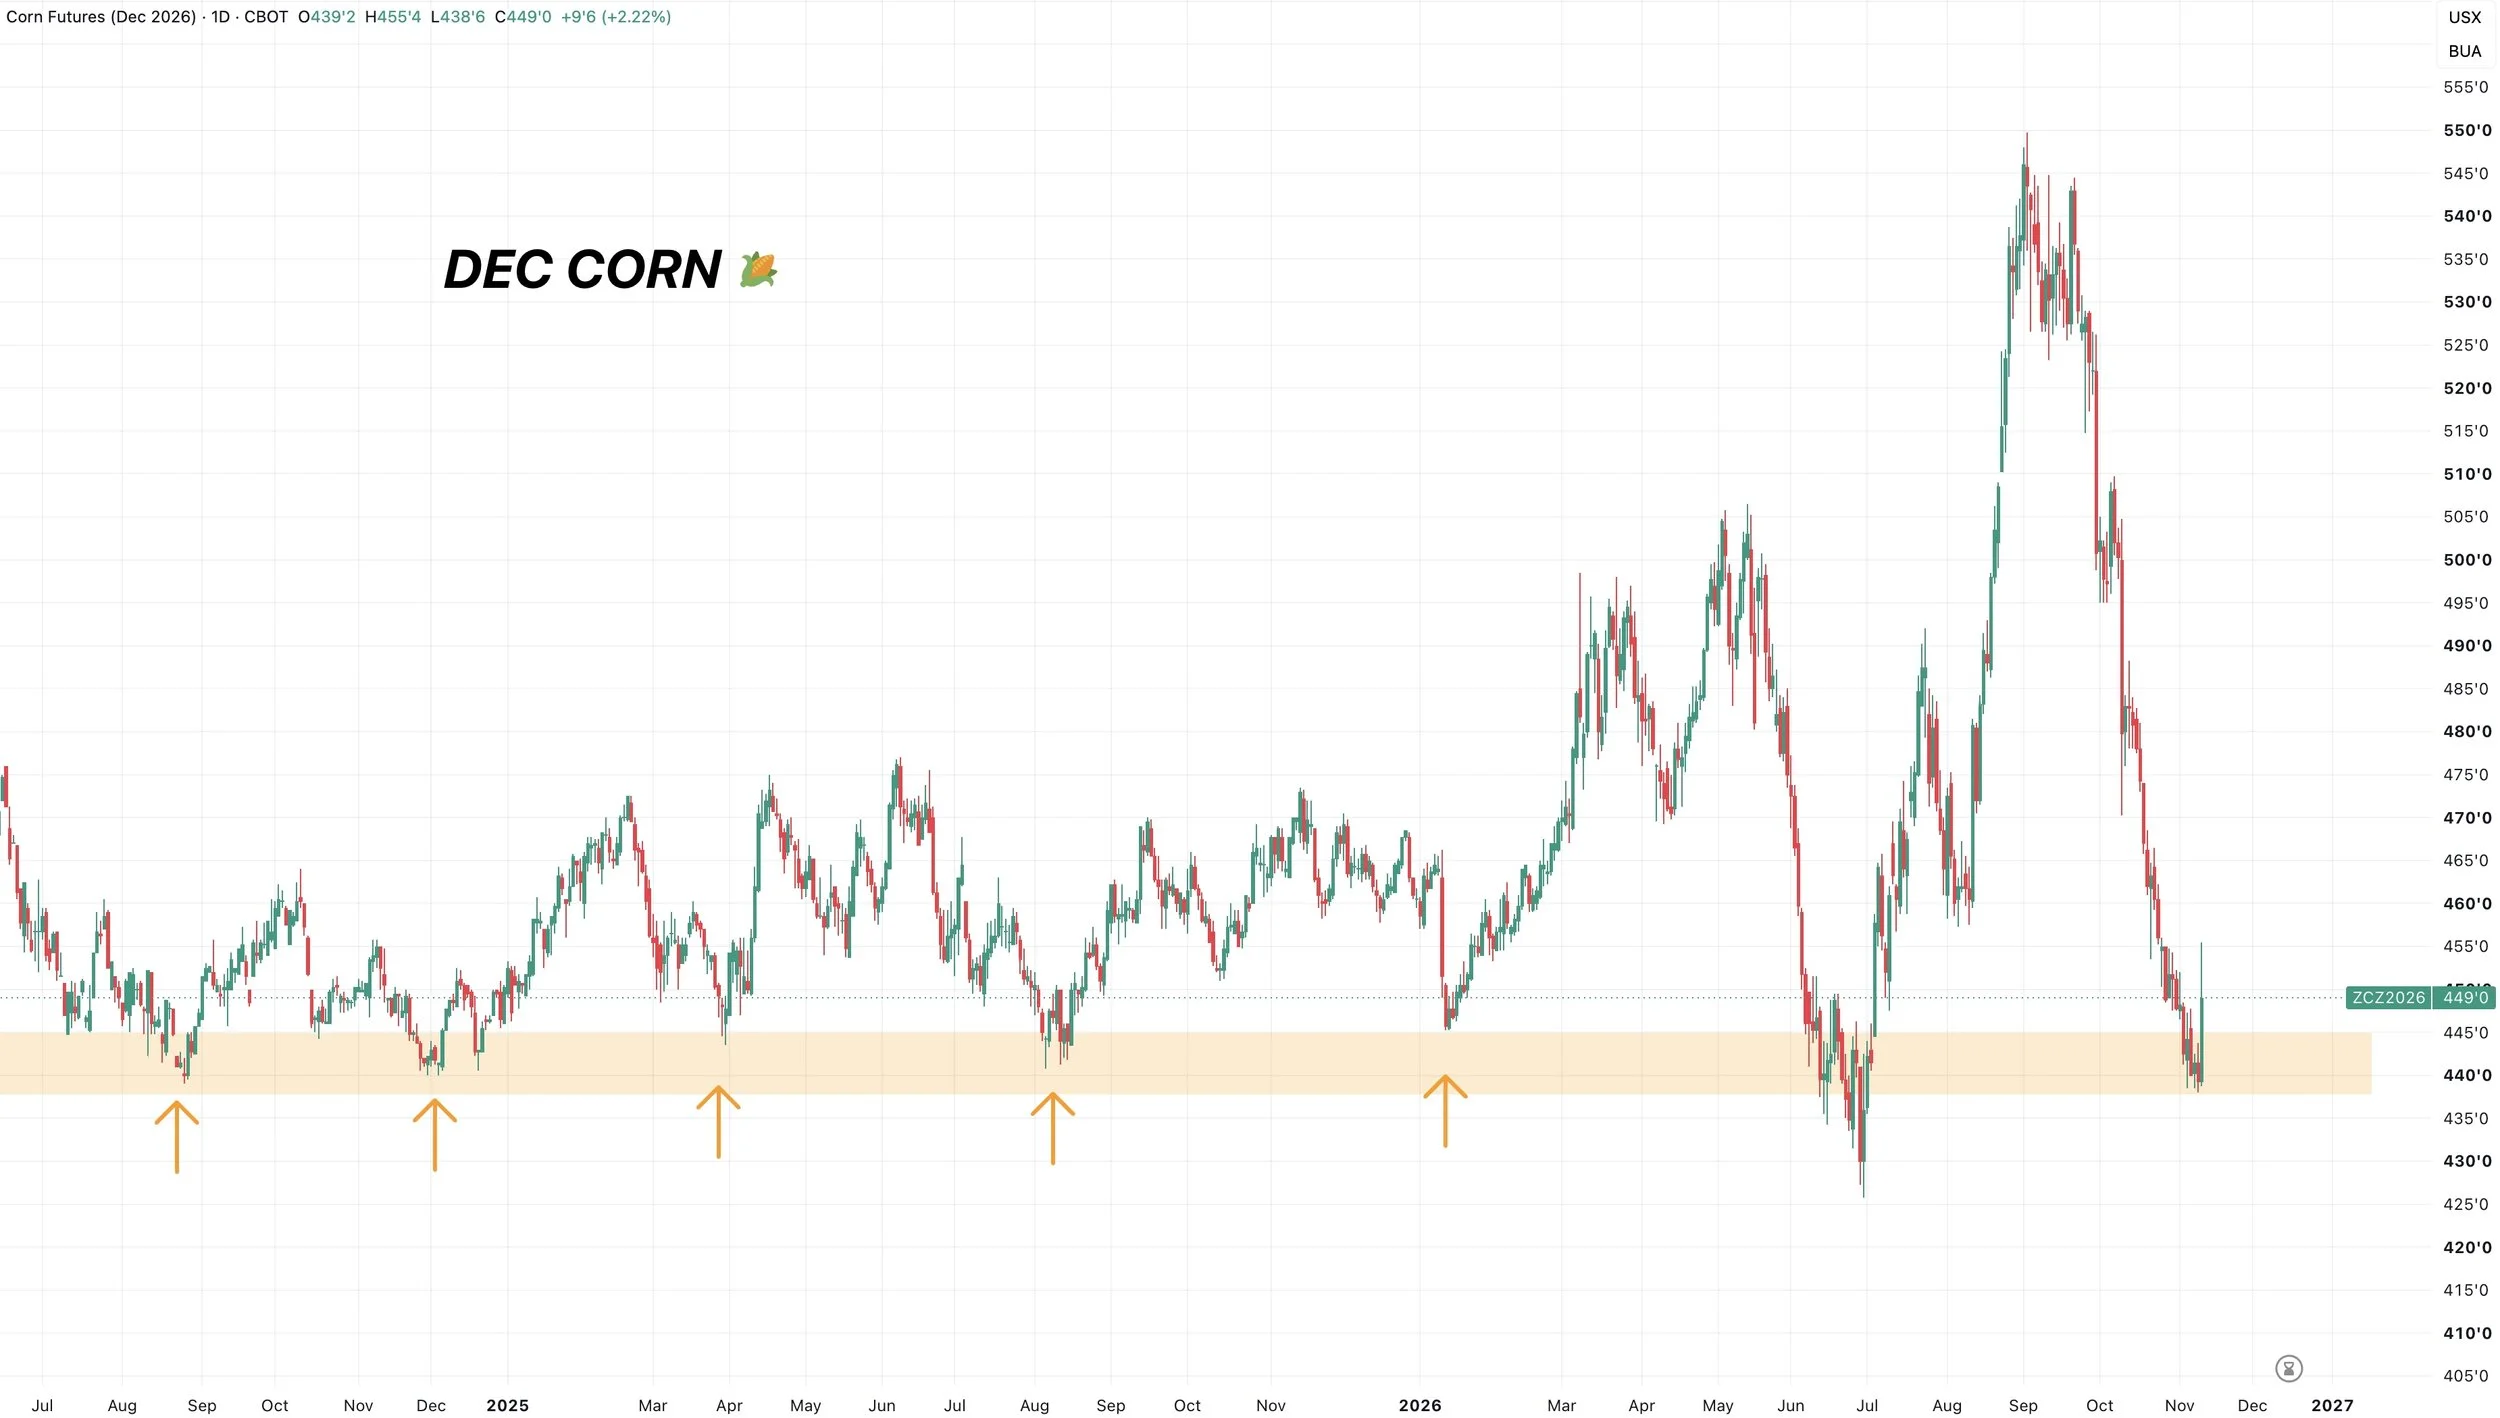
We bounced right at this $4.40 to $4.45 range we've been talking about.
The last support before contract lows.
Corn has bottomed in this range on 5 separate occasions.
So finding a bottom here yet again looks promising.
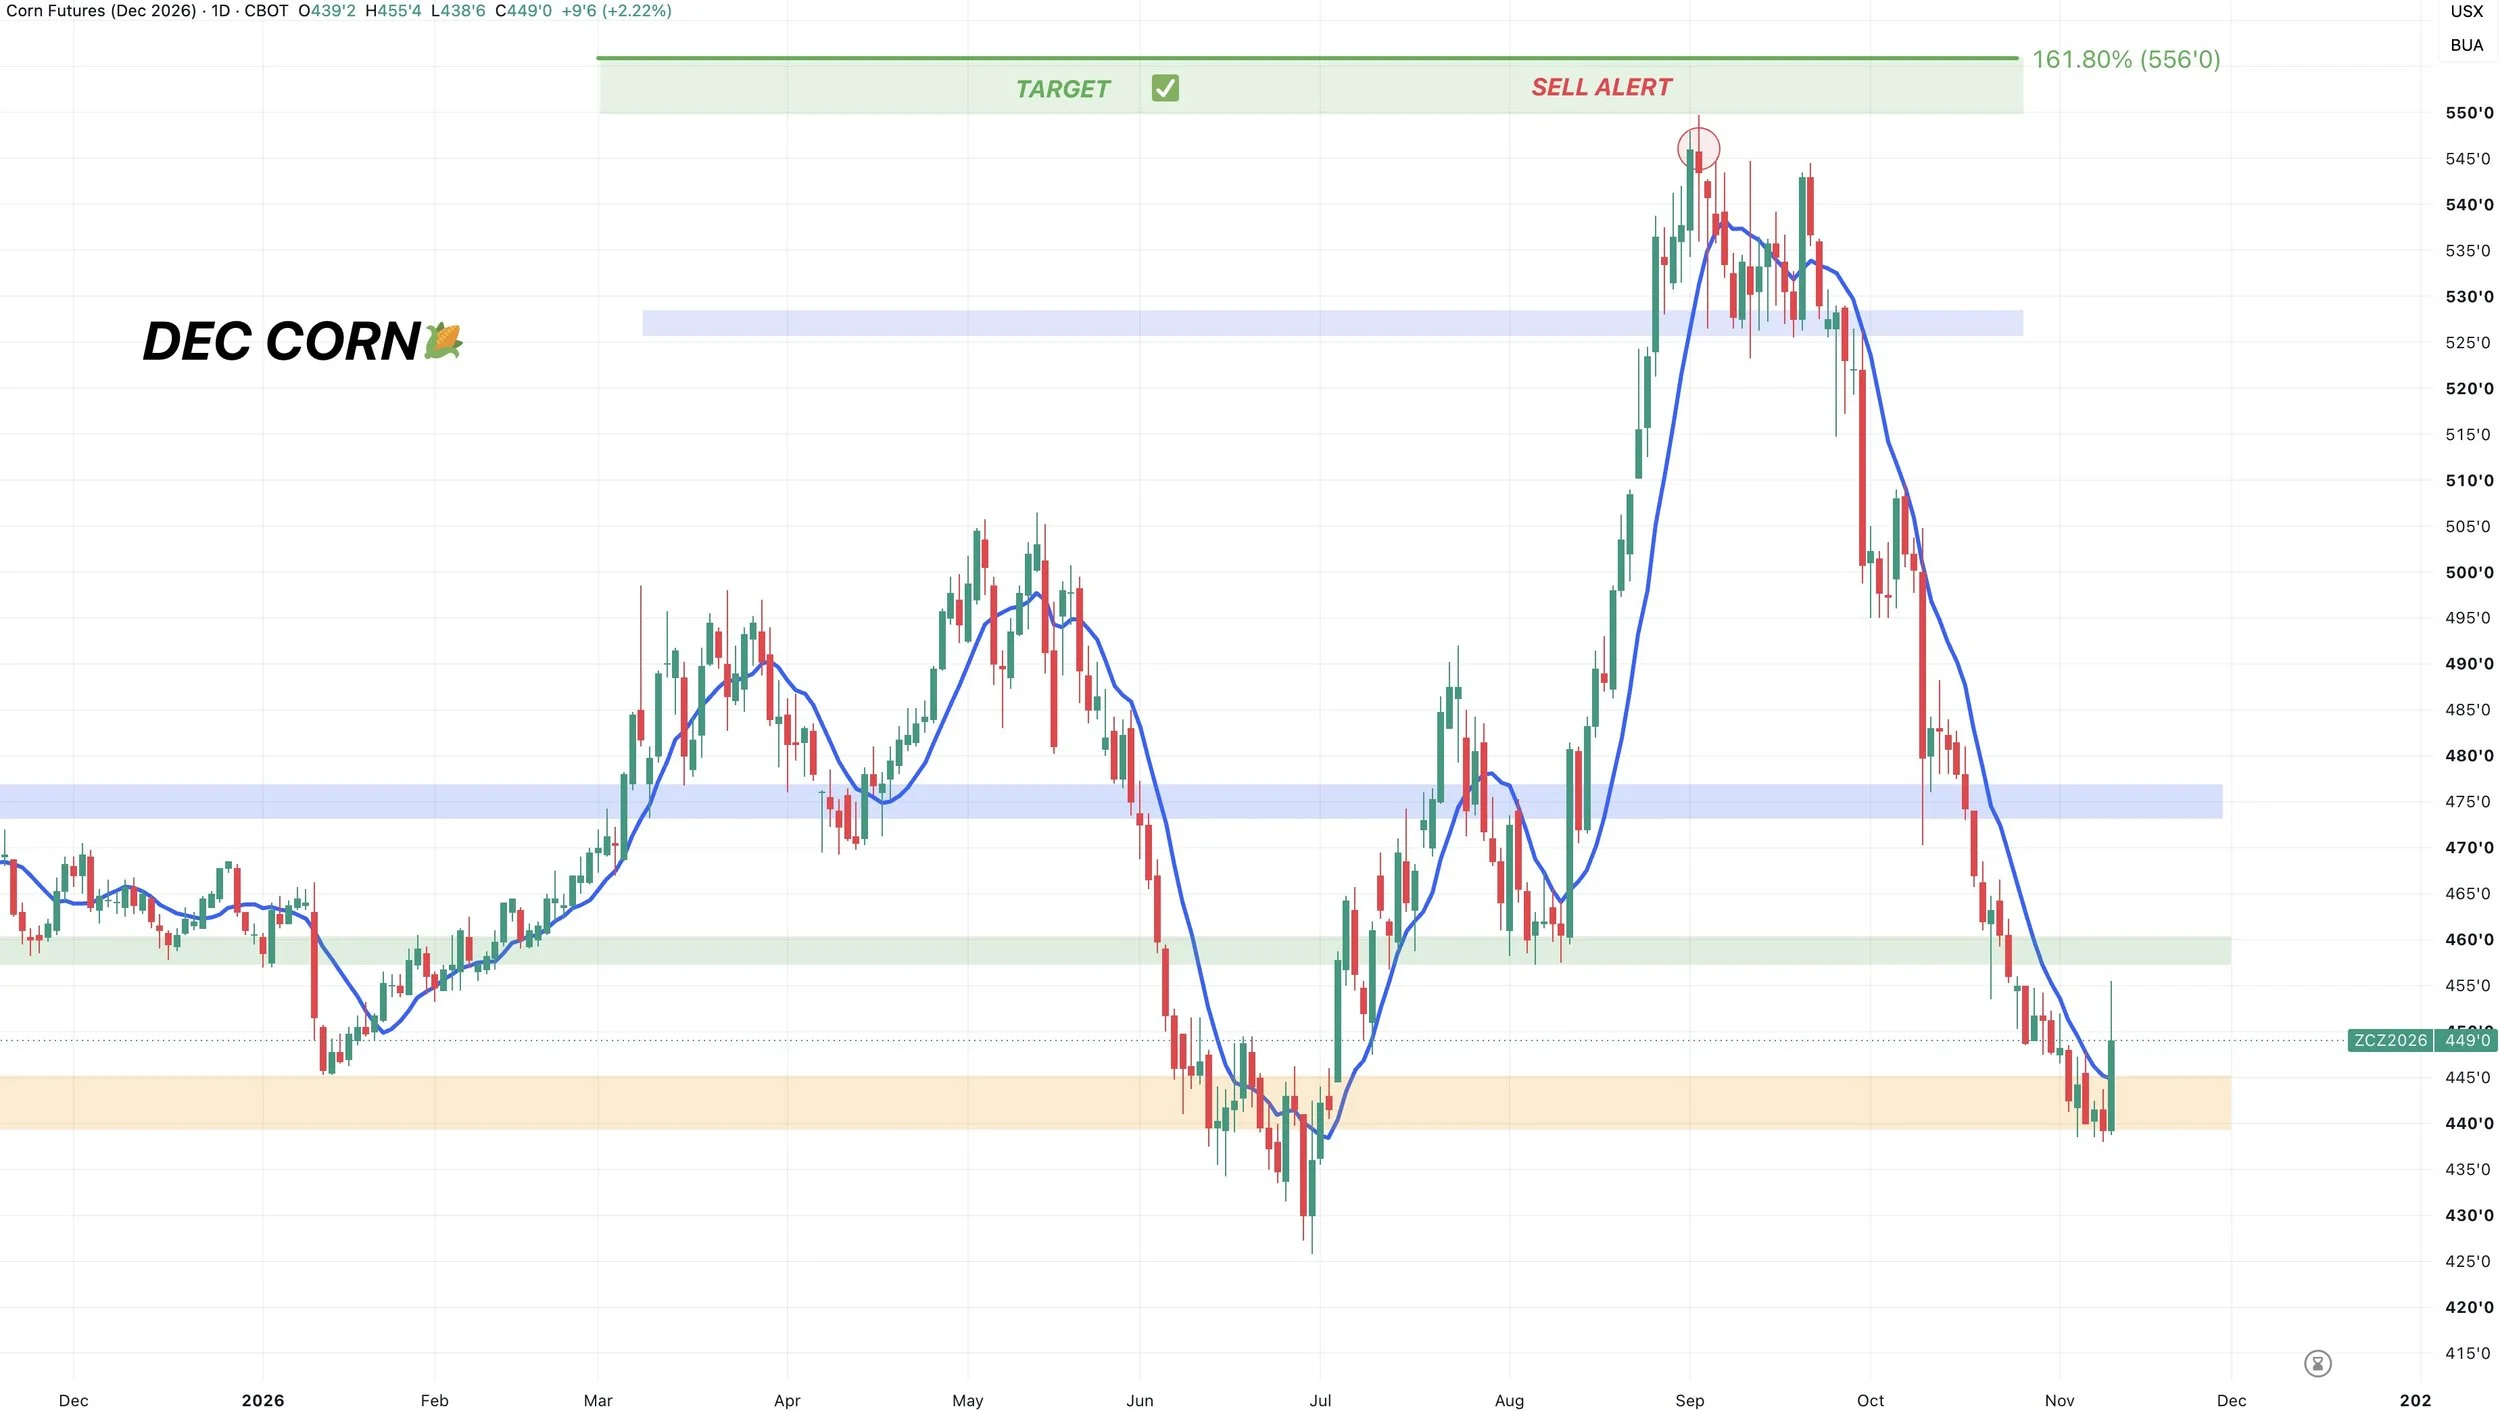
9-Day MA:
During uptrend, a market tends to stay above the 9-day MA. During downtrend, we tend to stay below it.
We just got our first close above it since all the back in September.
Another positive sign.
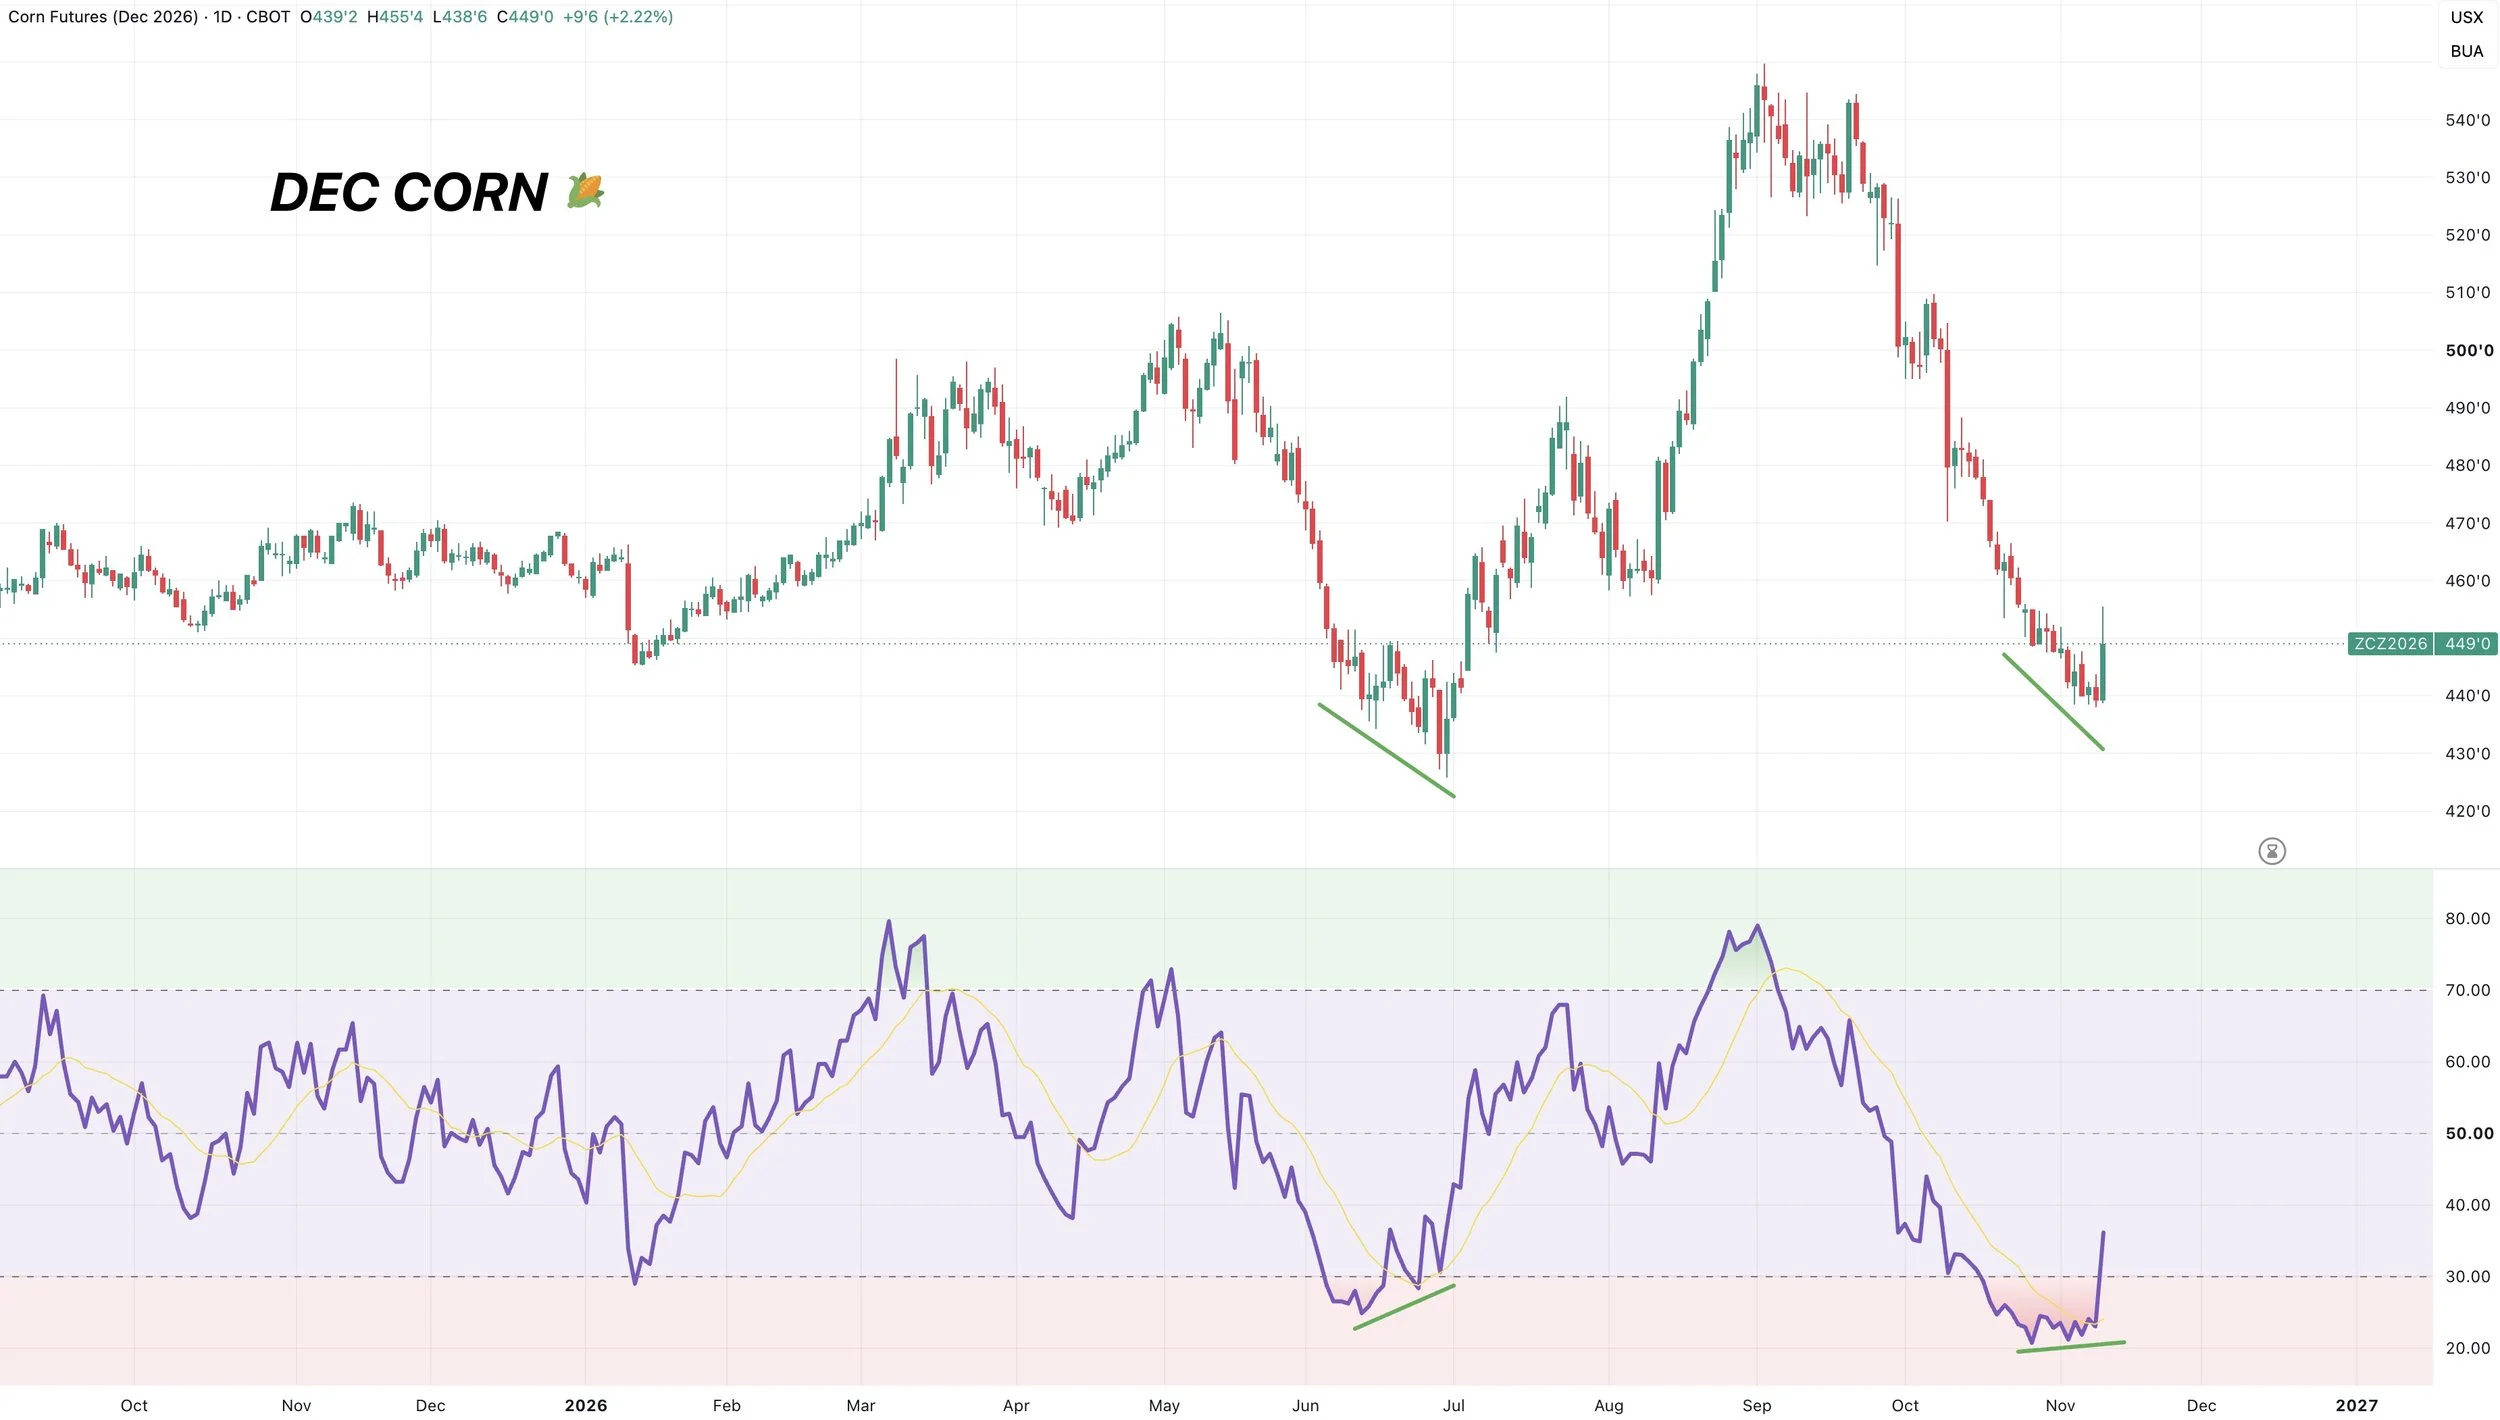
RSI:
The potential bullish divergence on the RSI has been something we have been watching for a long time.
And it looks like it's unfolding now.
The last few sessions, prices were making new lows. The RSI was not.
This gives more confidence that this was indeed the bottom.
The last time we saw bullish divergence, we printed our June lows. Which also came after a positive USDA report.
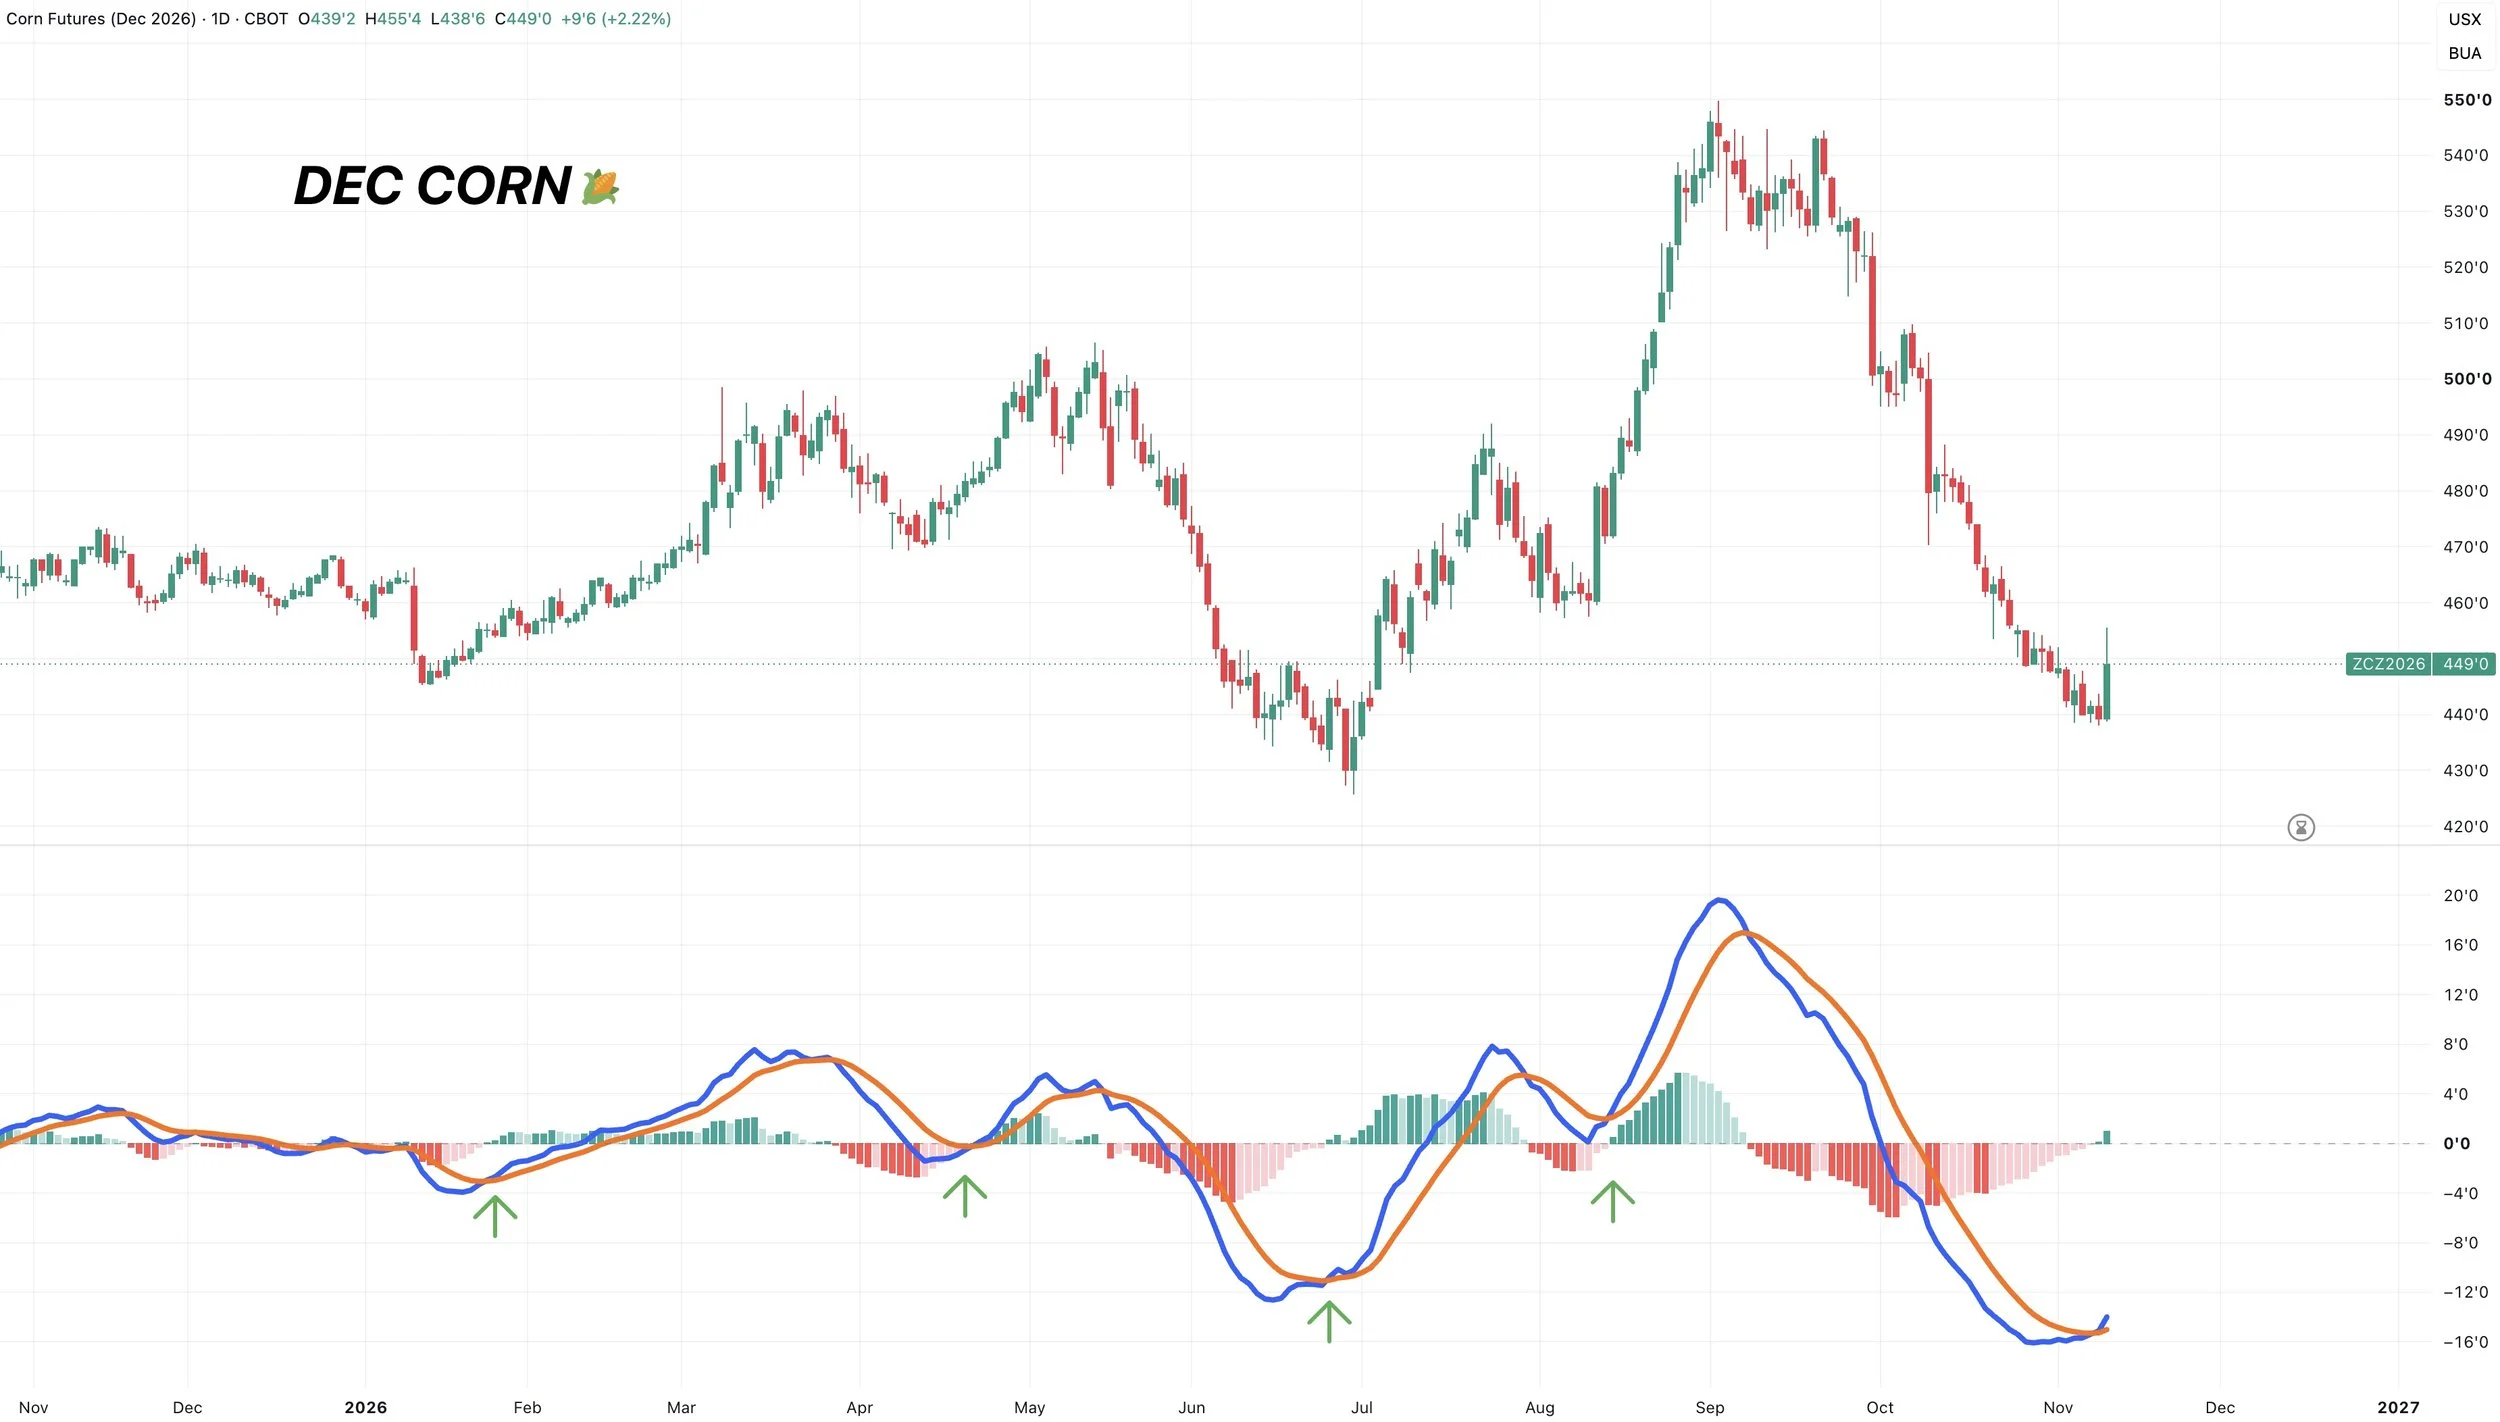
MACD:
The MACD has only crossed bullish 4 times this year.
Each time a rally followed.
It offically crossed bullish yesterday, suggesting the momentum is attempting to shift higher.
Another positive sign from here.
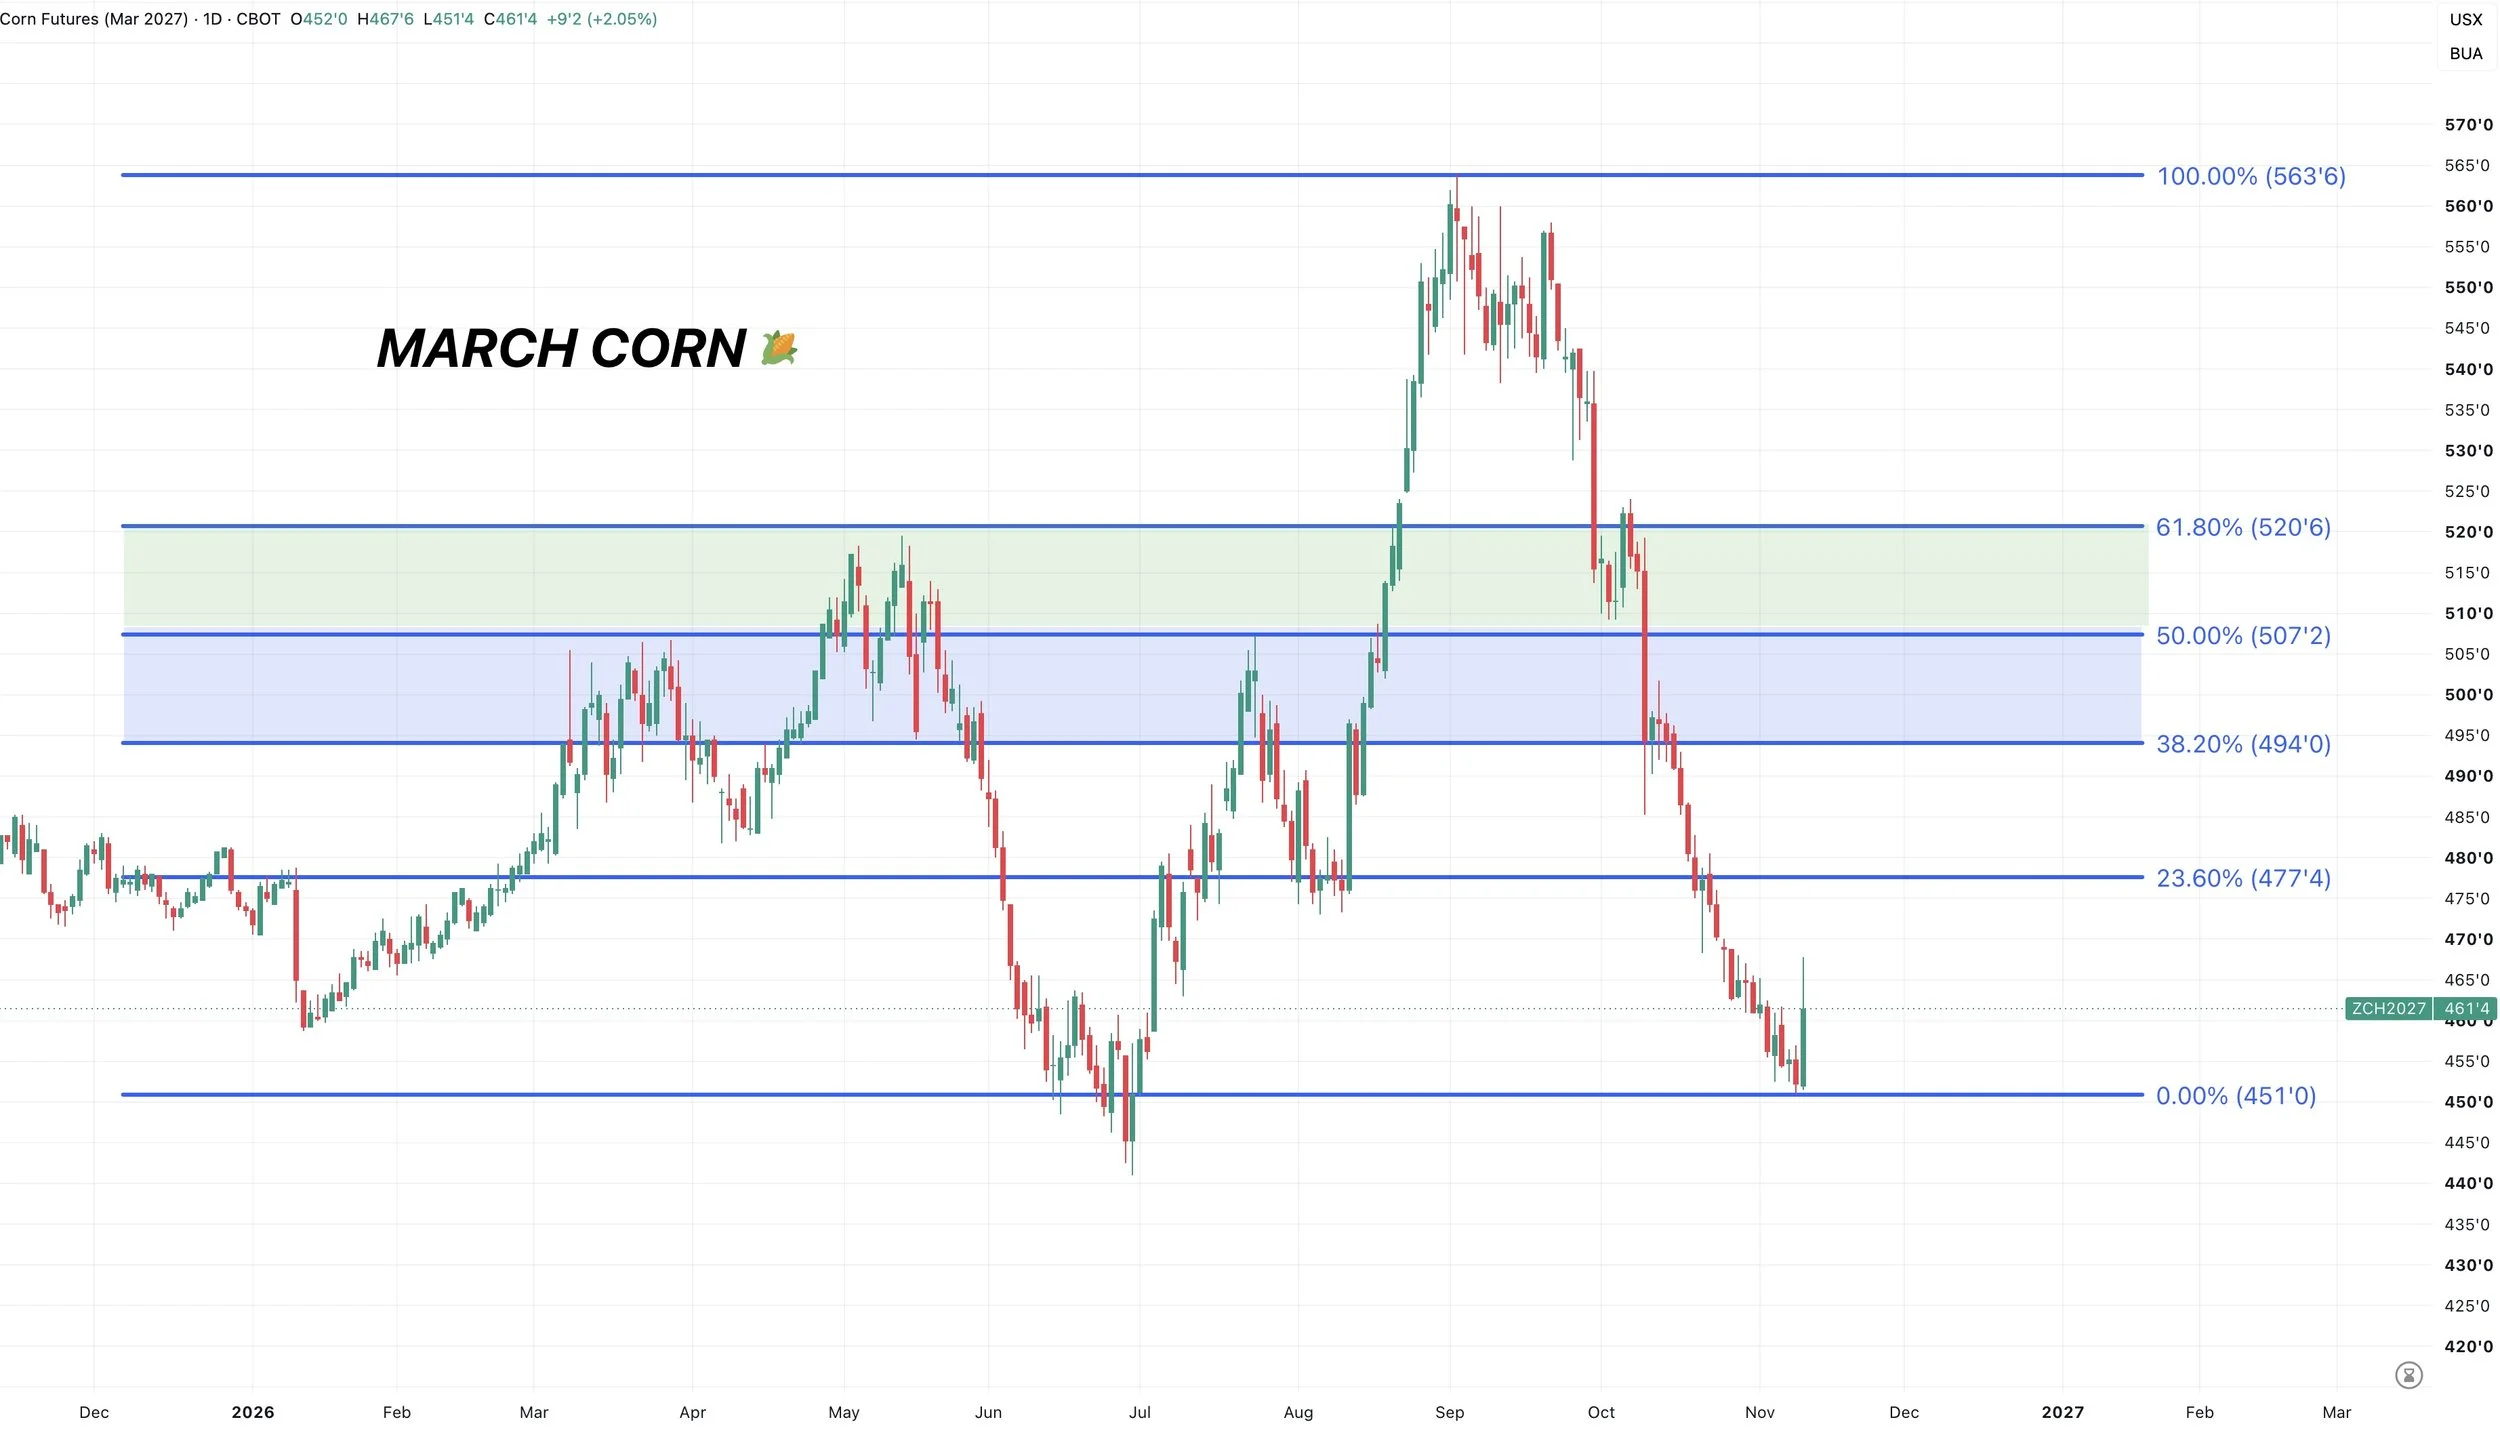
First upside target:
Let's look at March corn, as there might not be enough time for Dec to put together this monster size of rally.
If today was the bottom, the first big point of interest is going to be $4.94 to $5.07
That's going to claw back 38.2% to 50% of the entire melt down.
That also happens to be those highs from earlier this year.
Seems like a tall task today, and might take a few months to play out. But for now, that's the level I am watching.
Soybeans
Jan Beans Chart:
We held right where needed to. Posting a double bottom.
Bouncing right off those August lows and the next level of support after failing to hold those May highs.
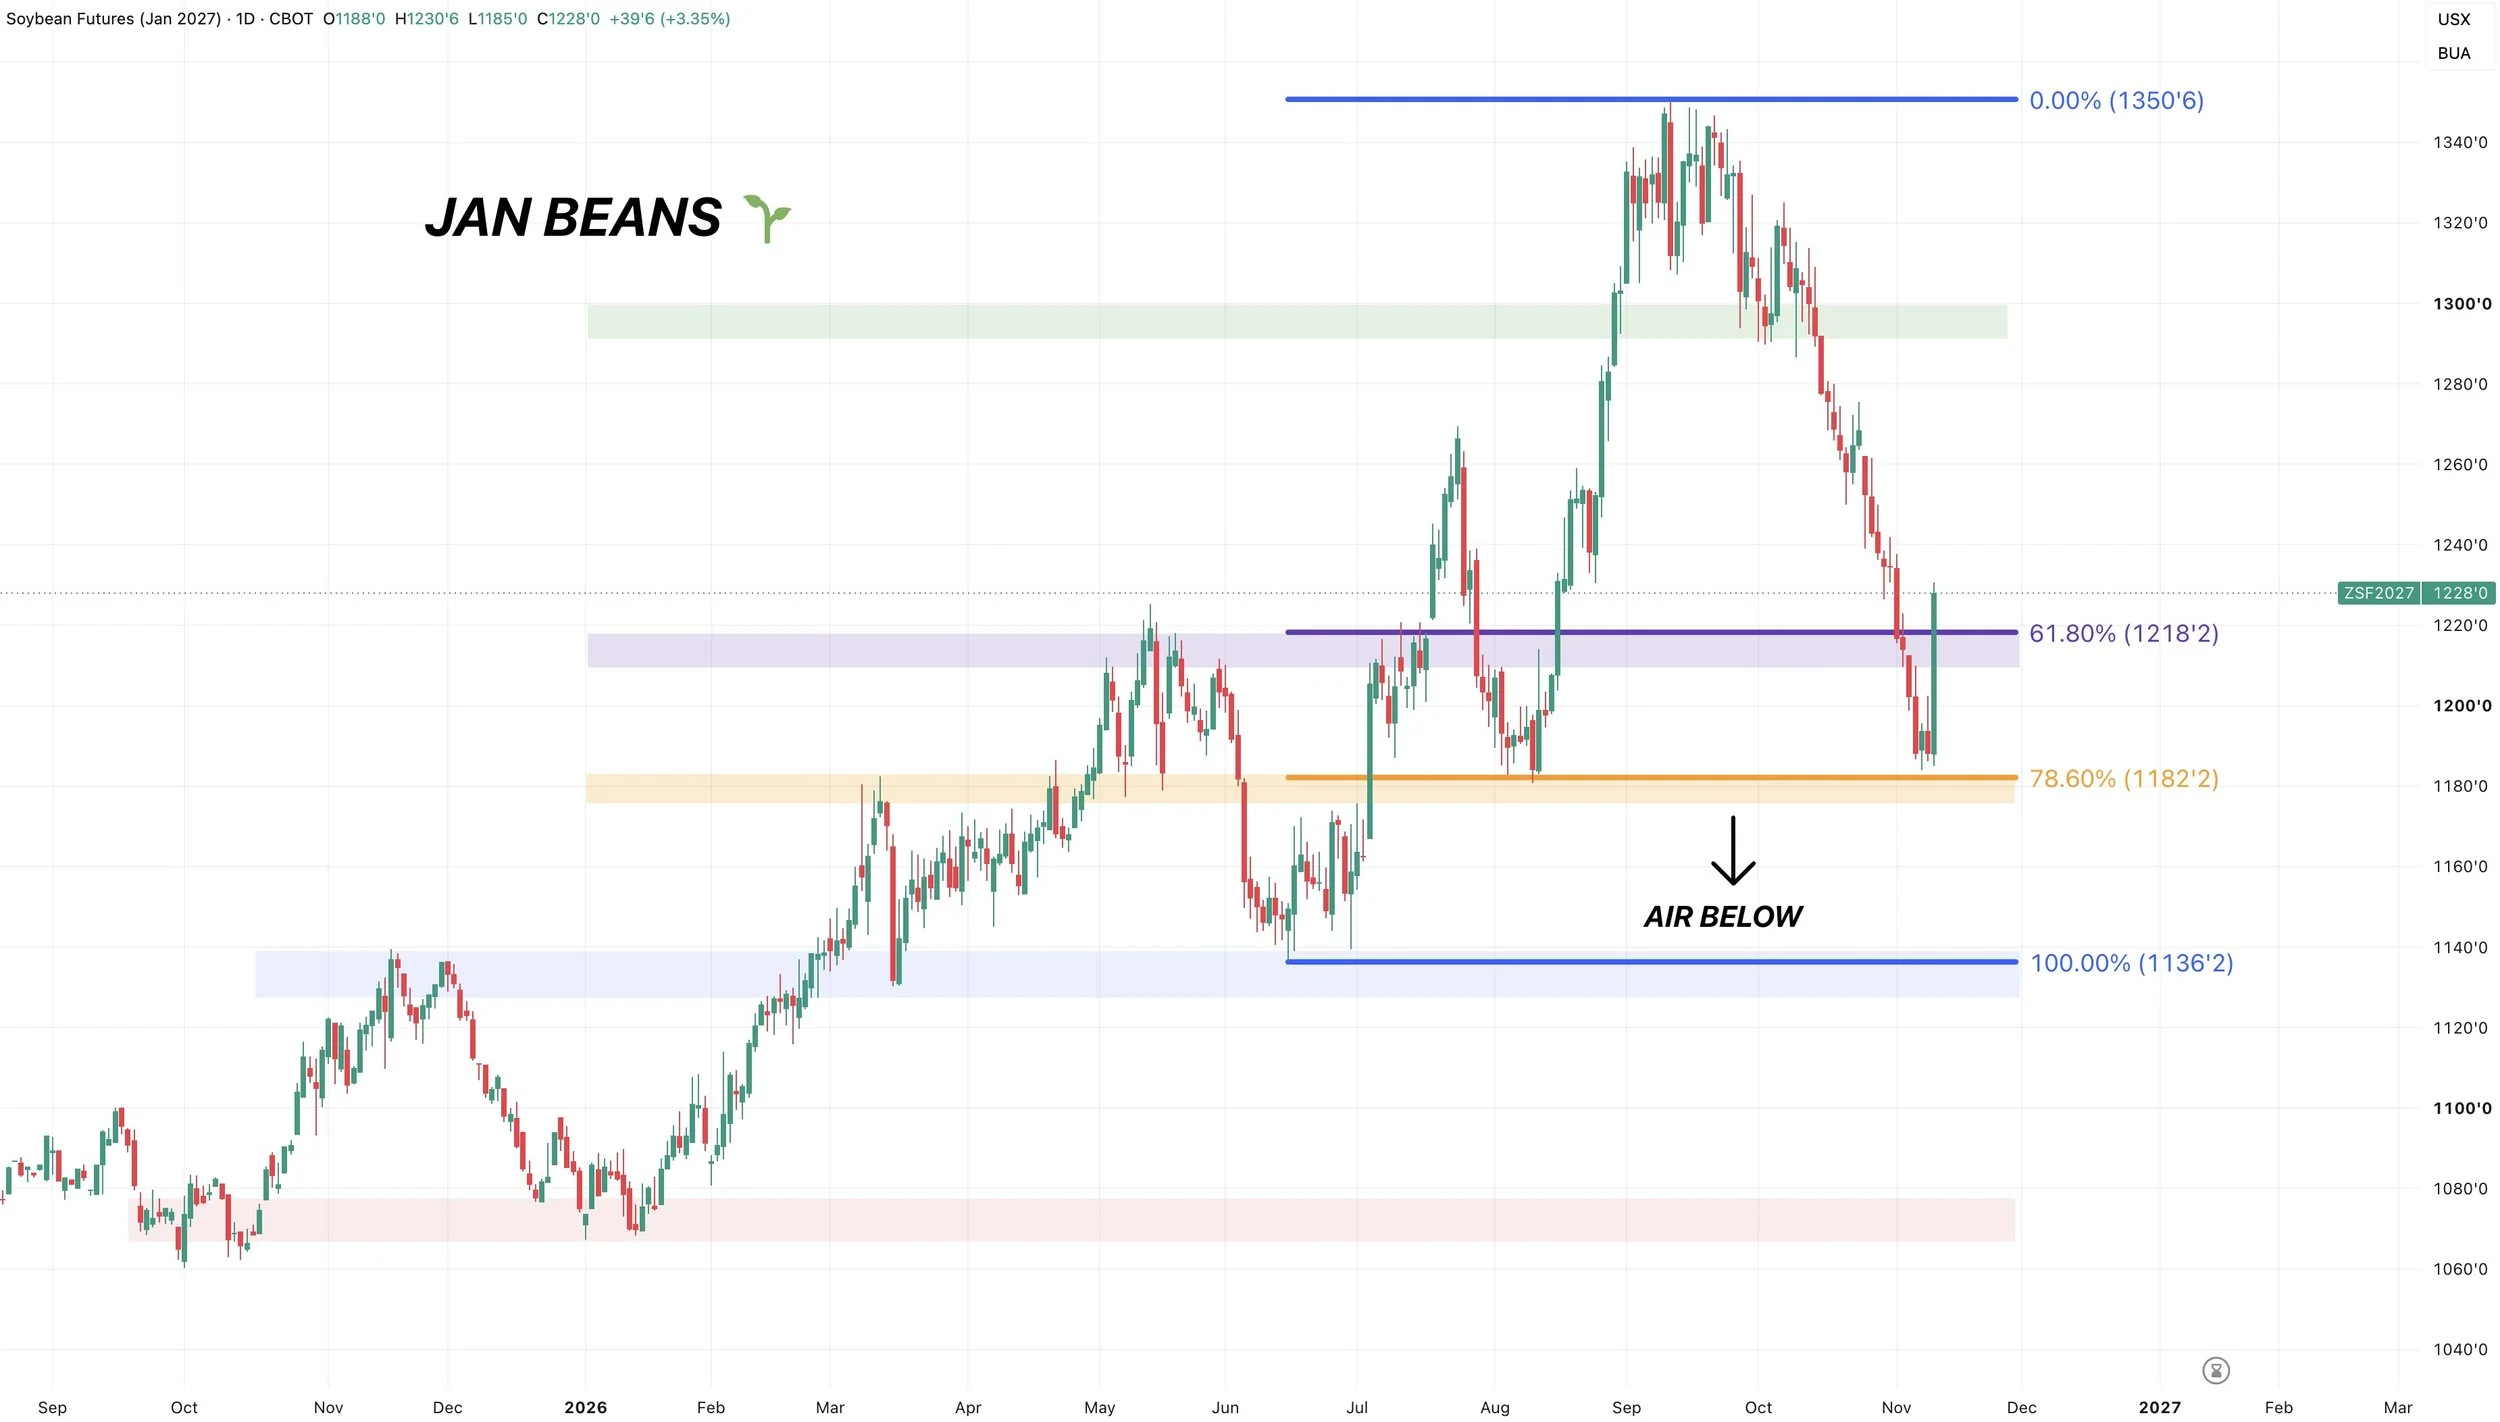
We have the MACD curling higher and looking like it's going to cross bullish.
The last two times, it did result in a decent rally.
We also have the RSI breaking out of the downtrend it's been trapped in.
So the chart looks good and I'd like to think we get further upside.
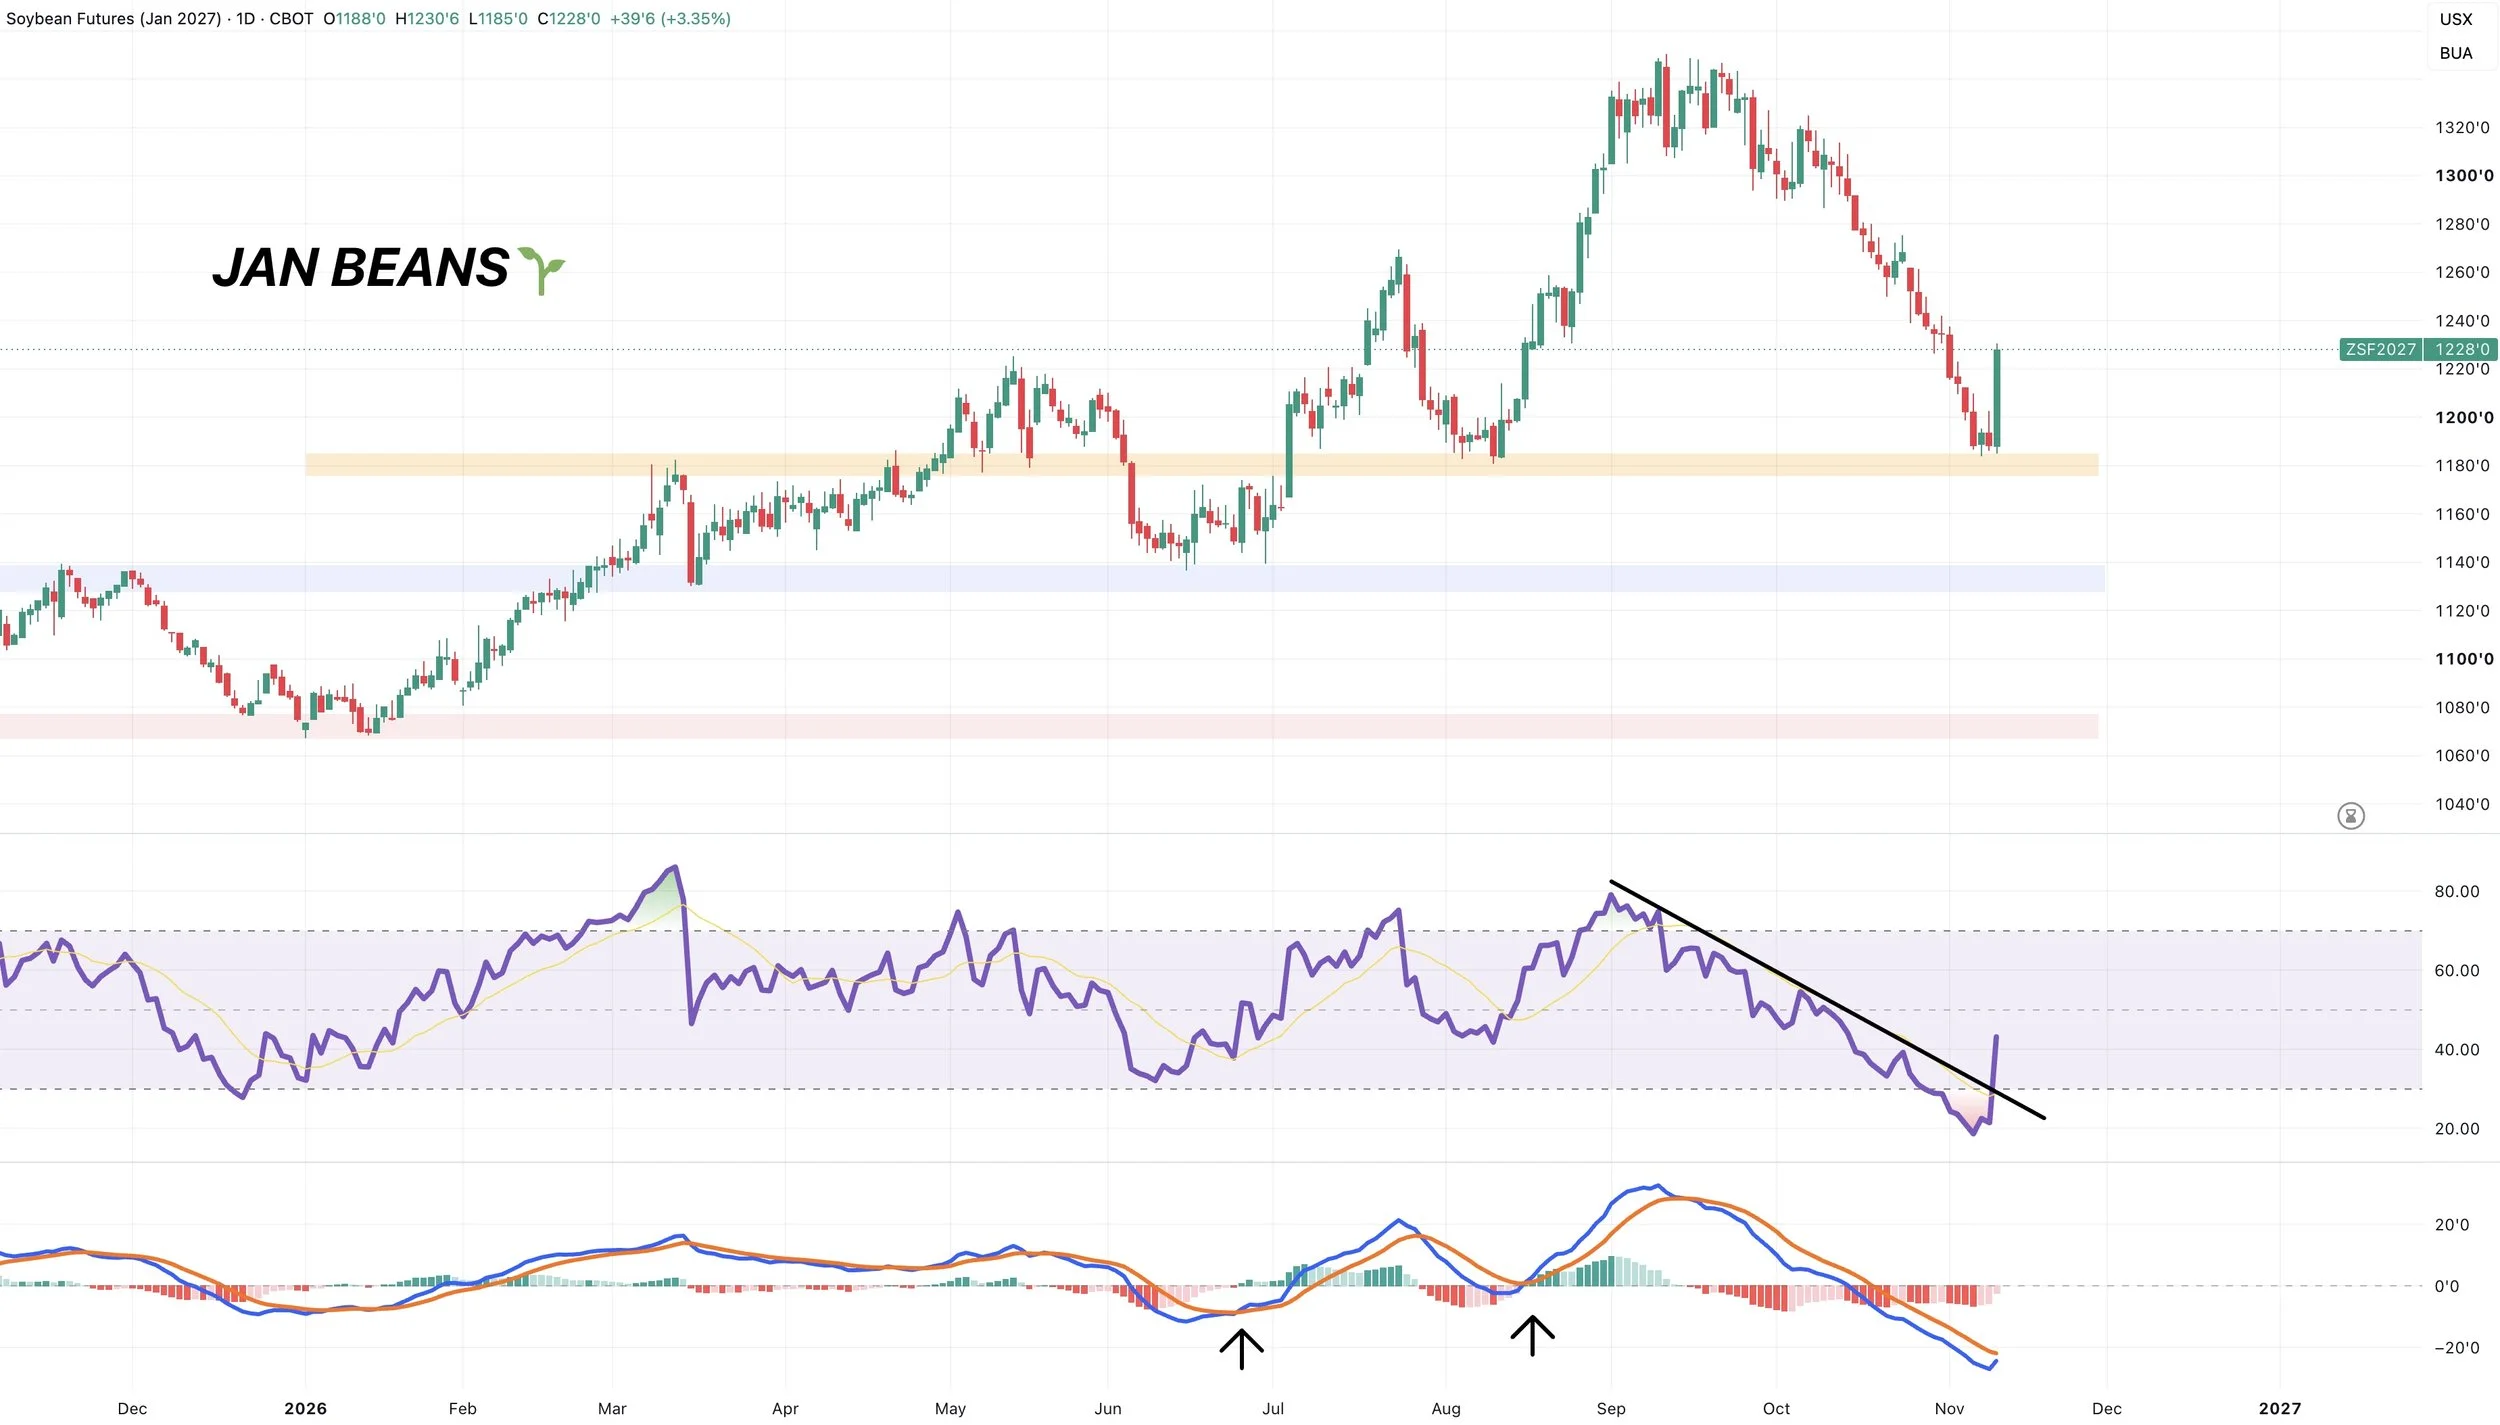
I fundamentally think soybeans have plenty of upside.
The next big point of interest I have my eyes on for now is going to be the golden zone up to the recent highs.
Those July highs also happen to come in right at that 50% level.
The bottom of that old range from the highs comes in at that 61.8% level.
If this is just a relief bounce, that is a common area to fail.
If you take out that level, we probably go on to post new highs at some point.
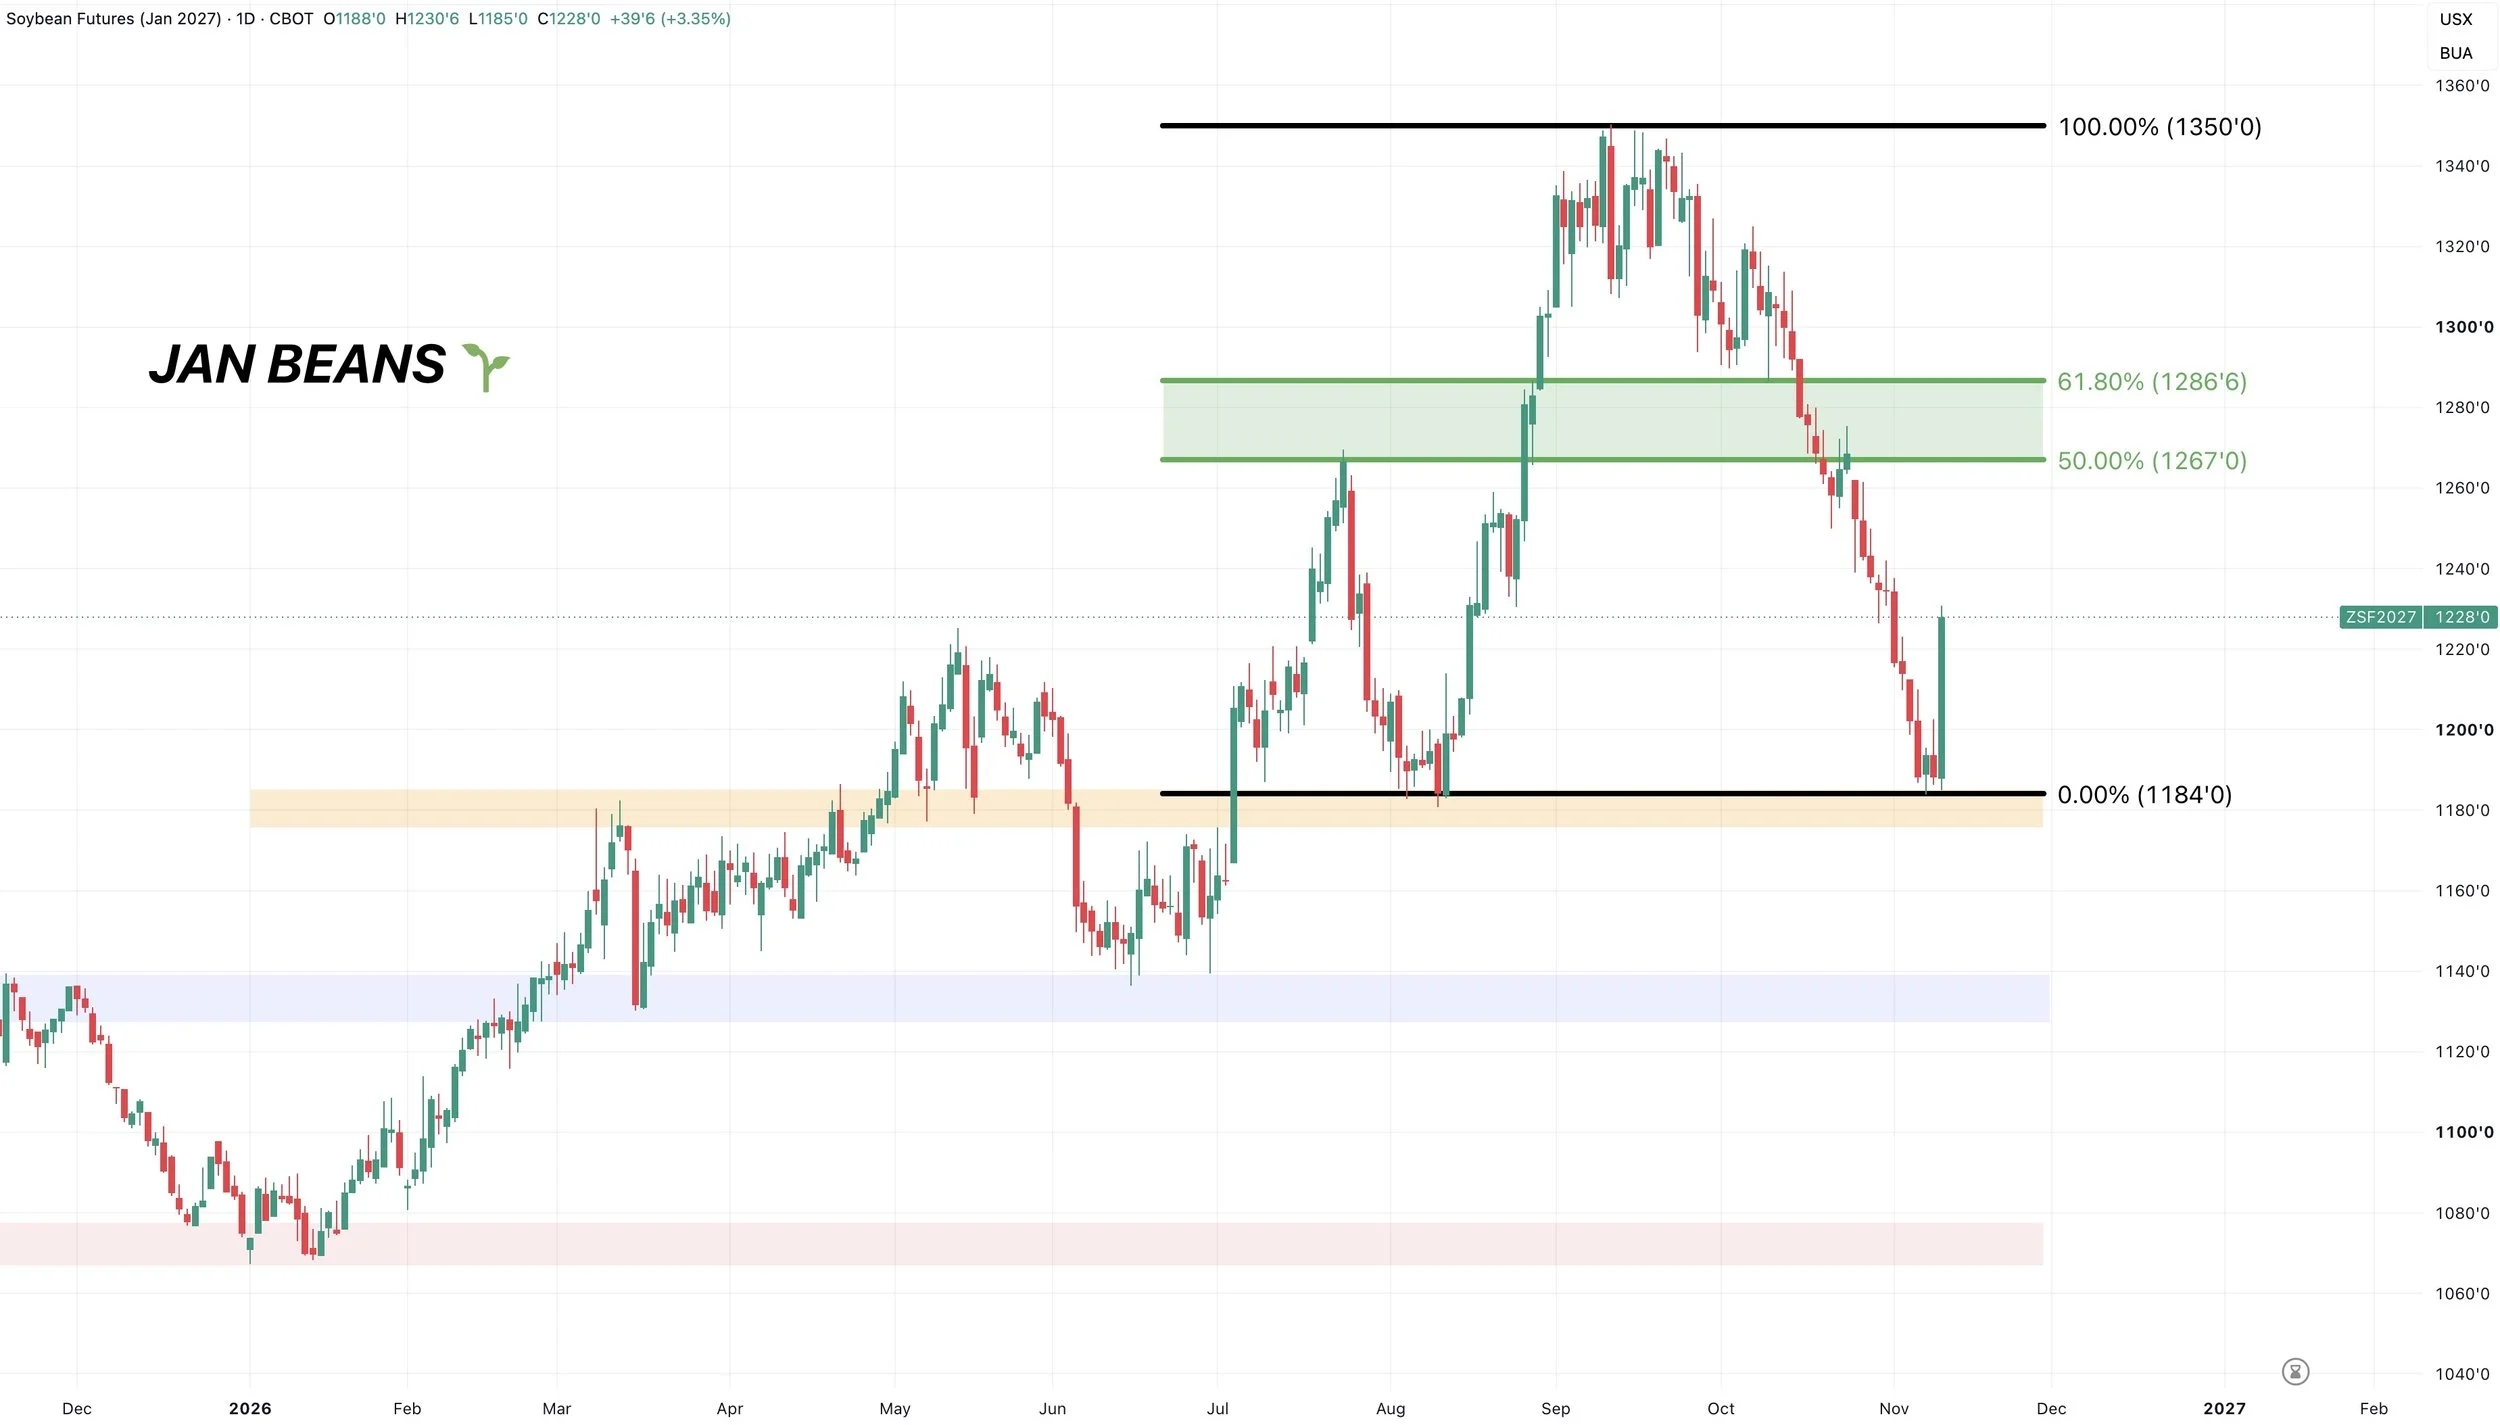
If you zoom out, there is still nothing bearish about soybeans.
We still have a very clear trend that says higher for now.
I think we have a very solid shot of taking out those highs at some point next year.
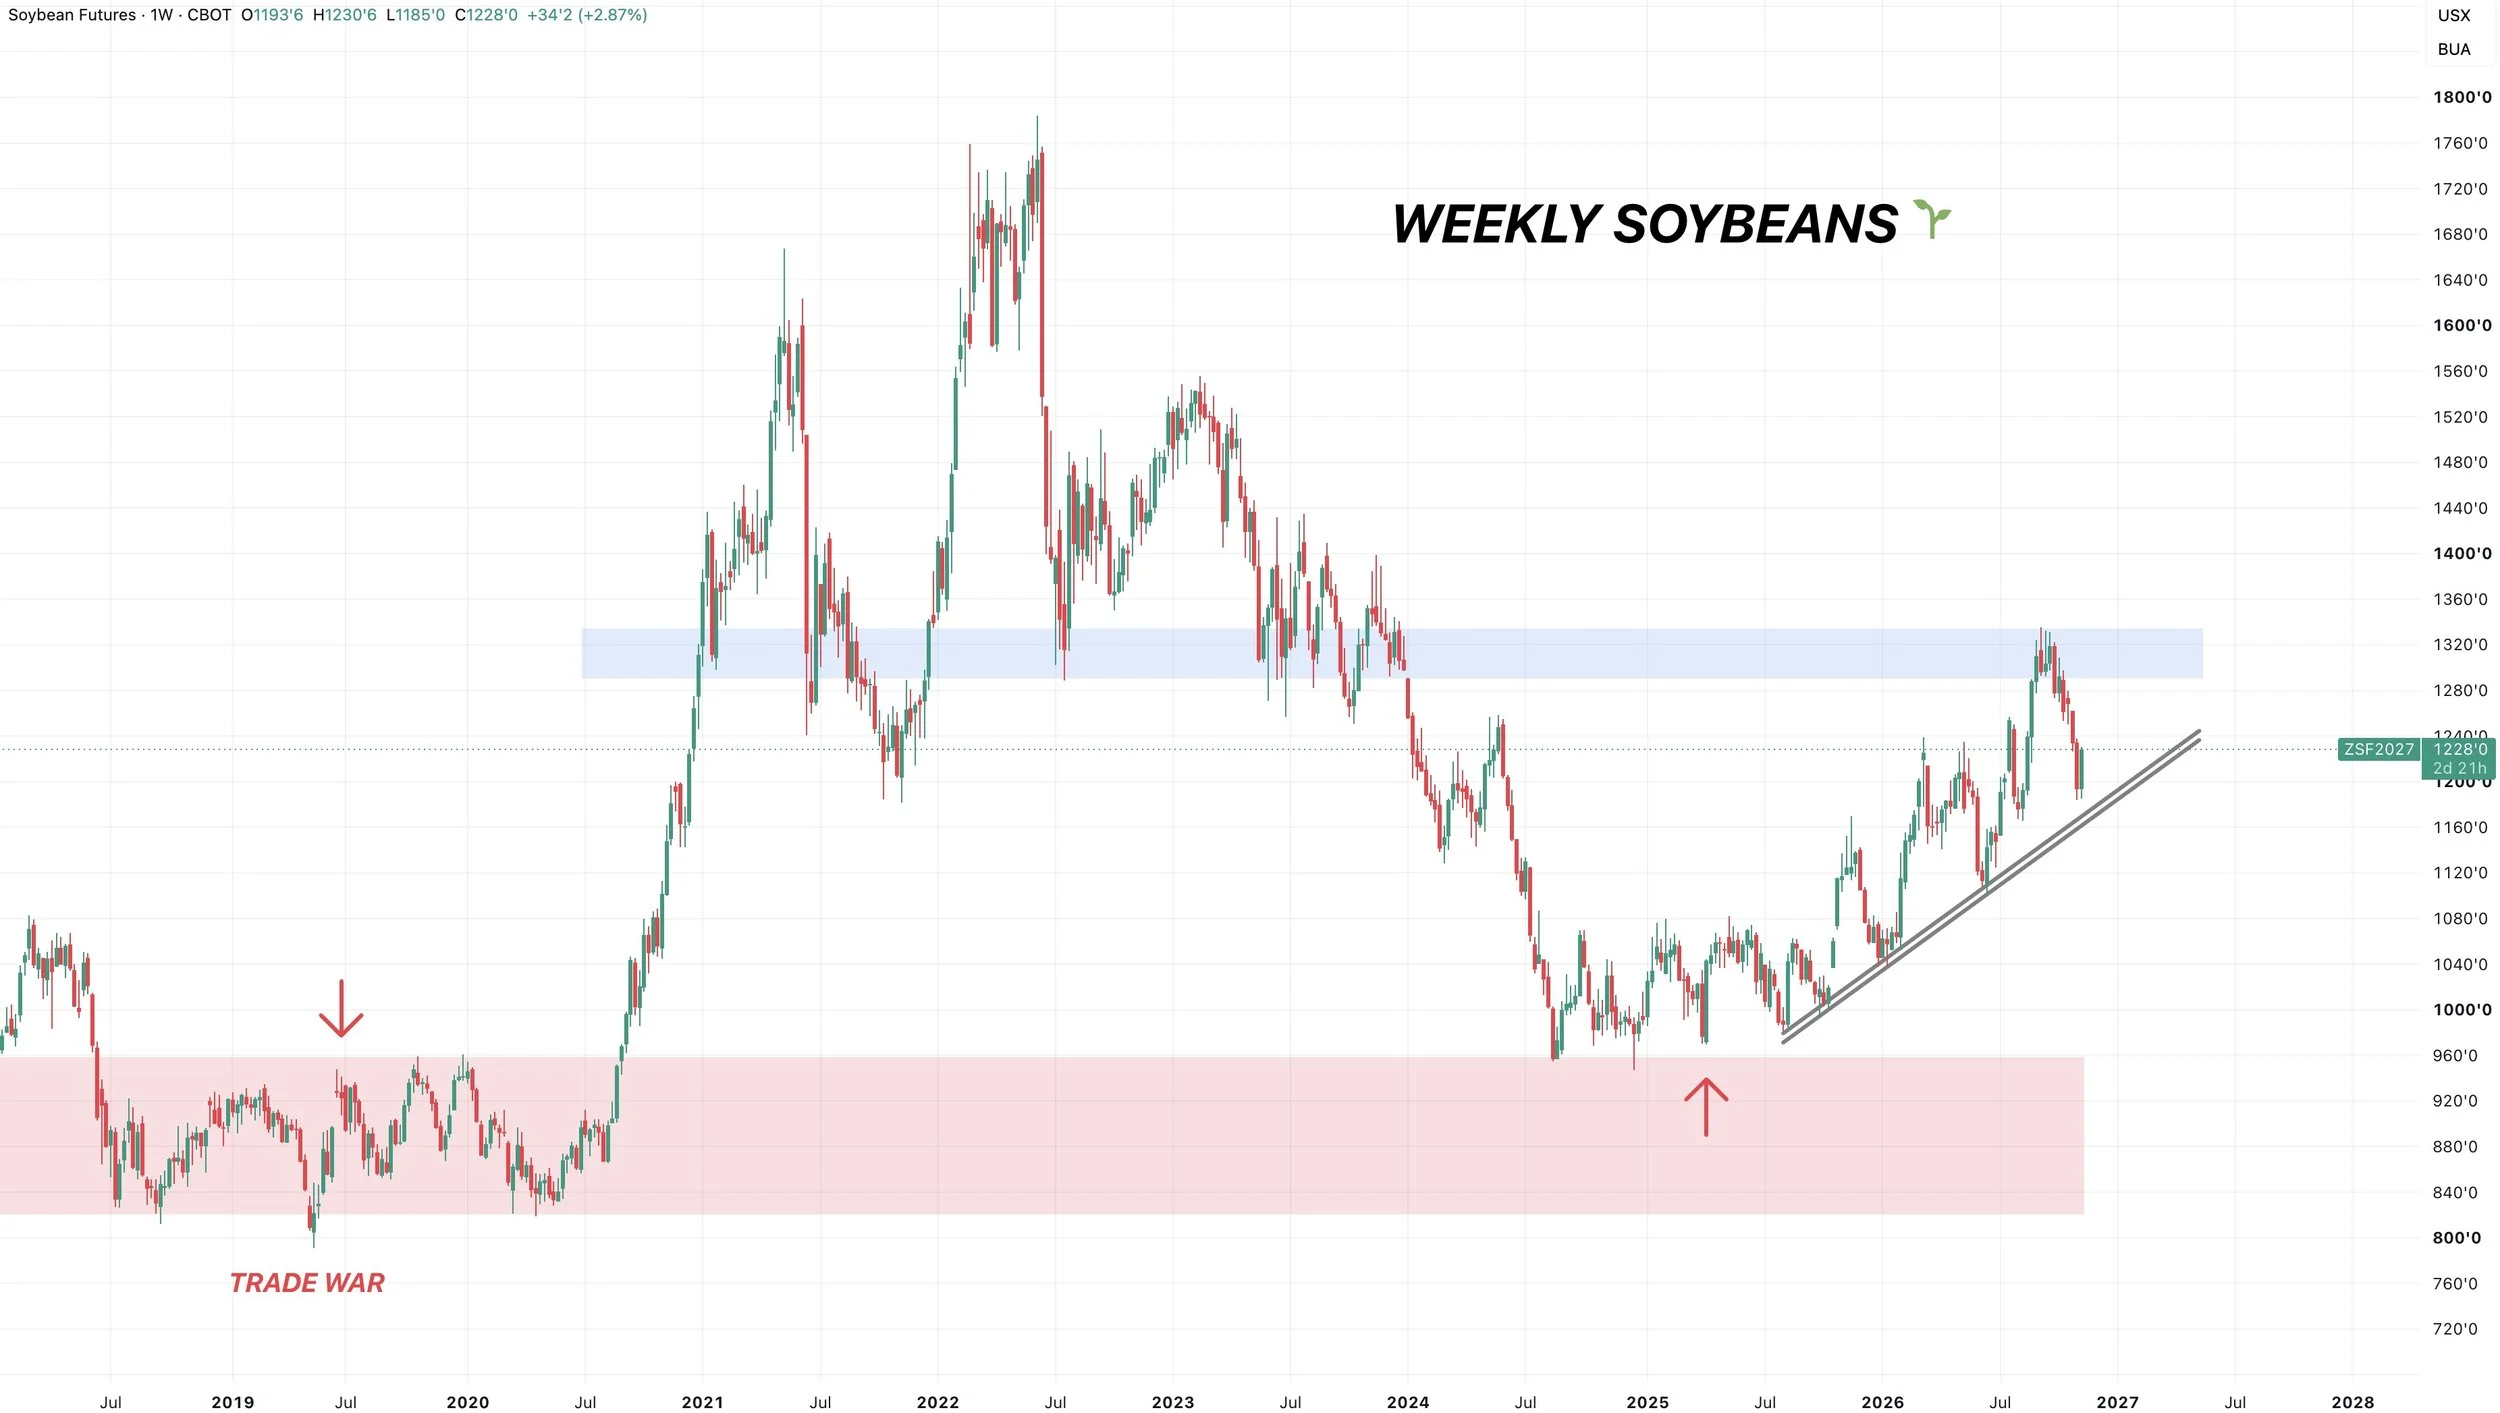
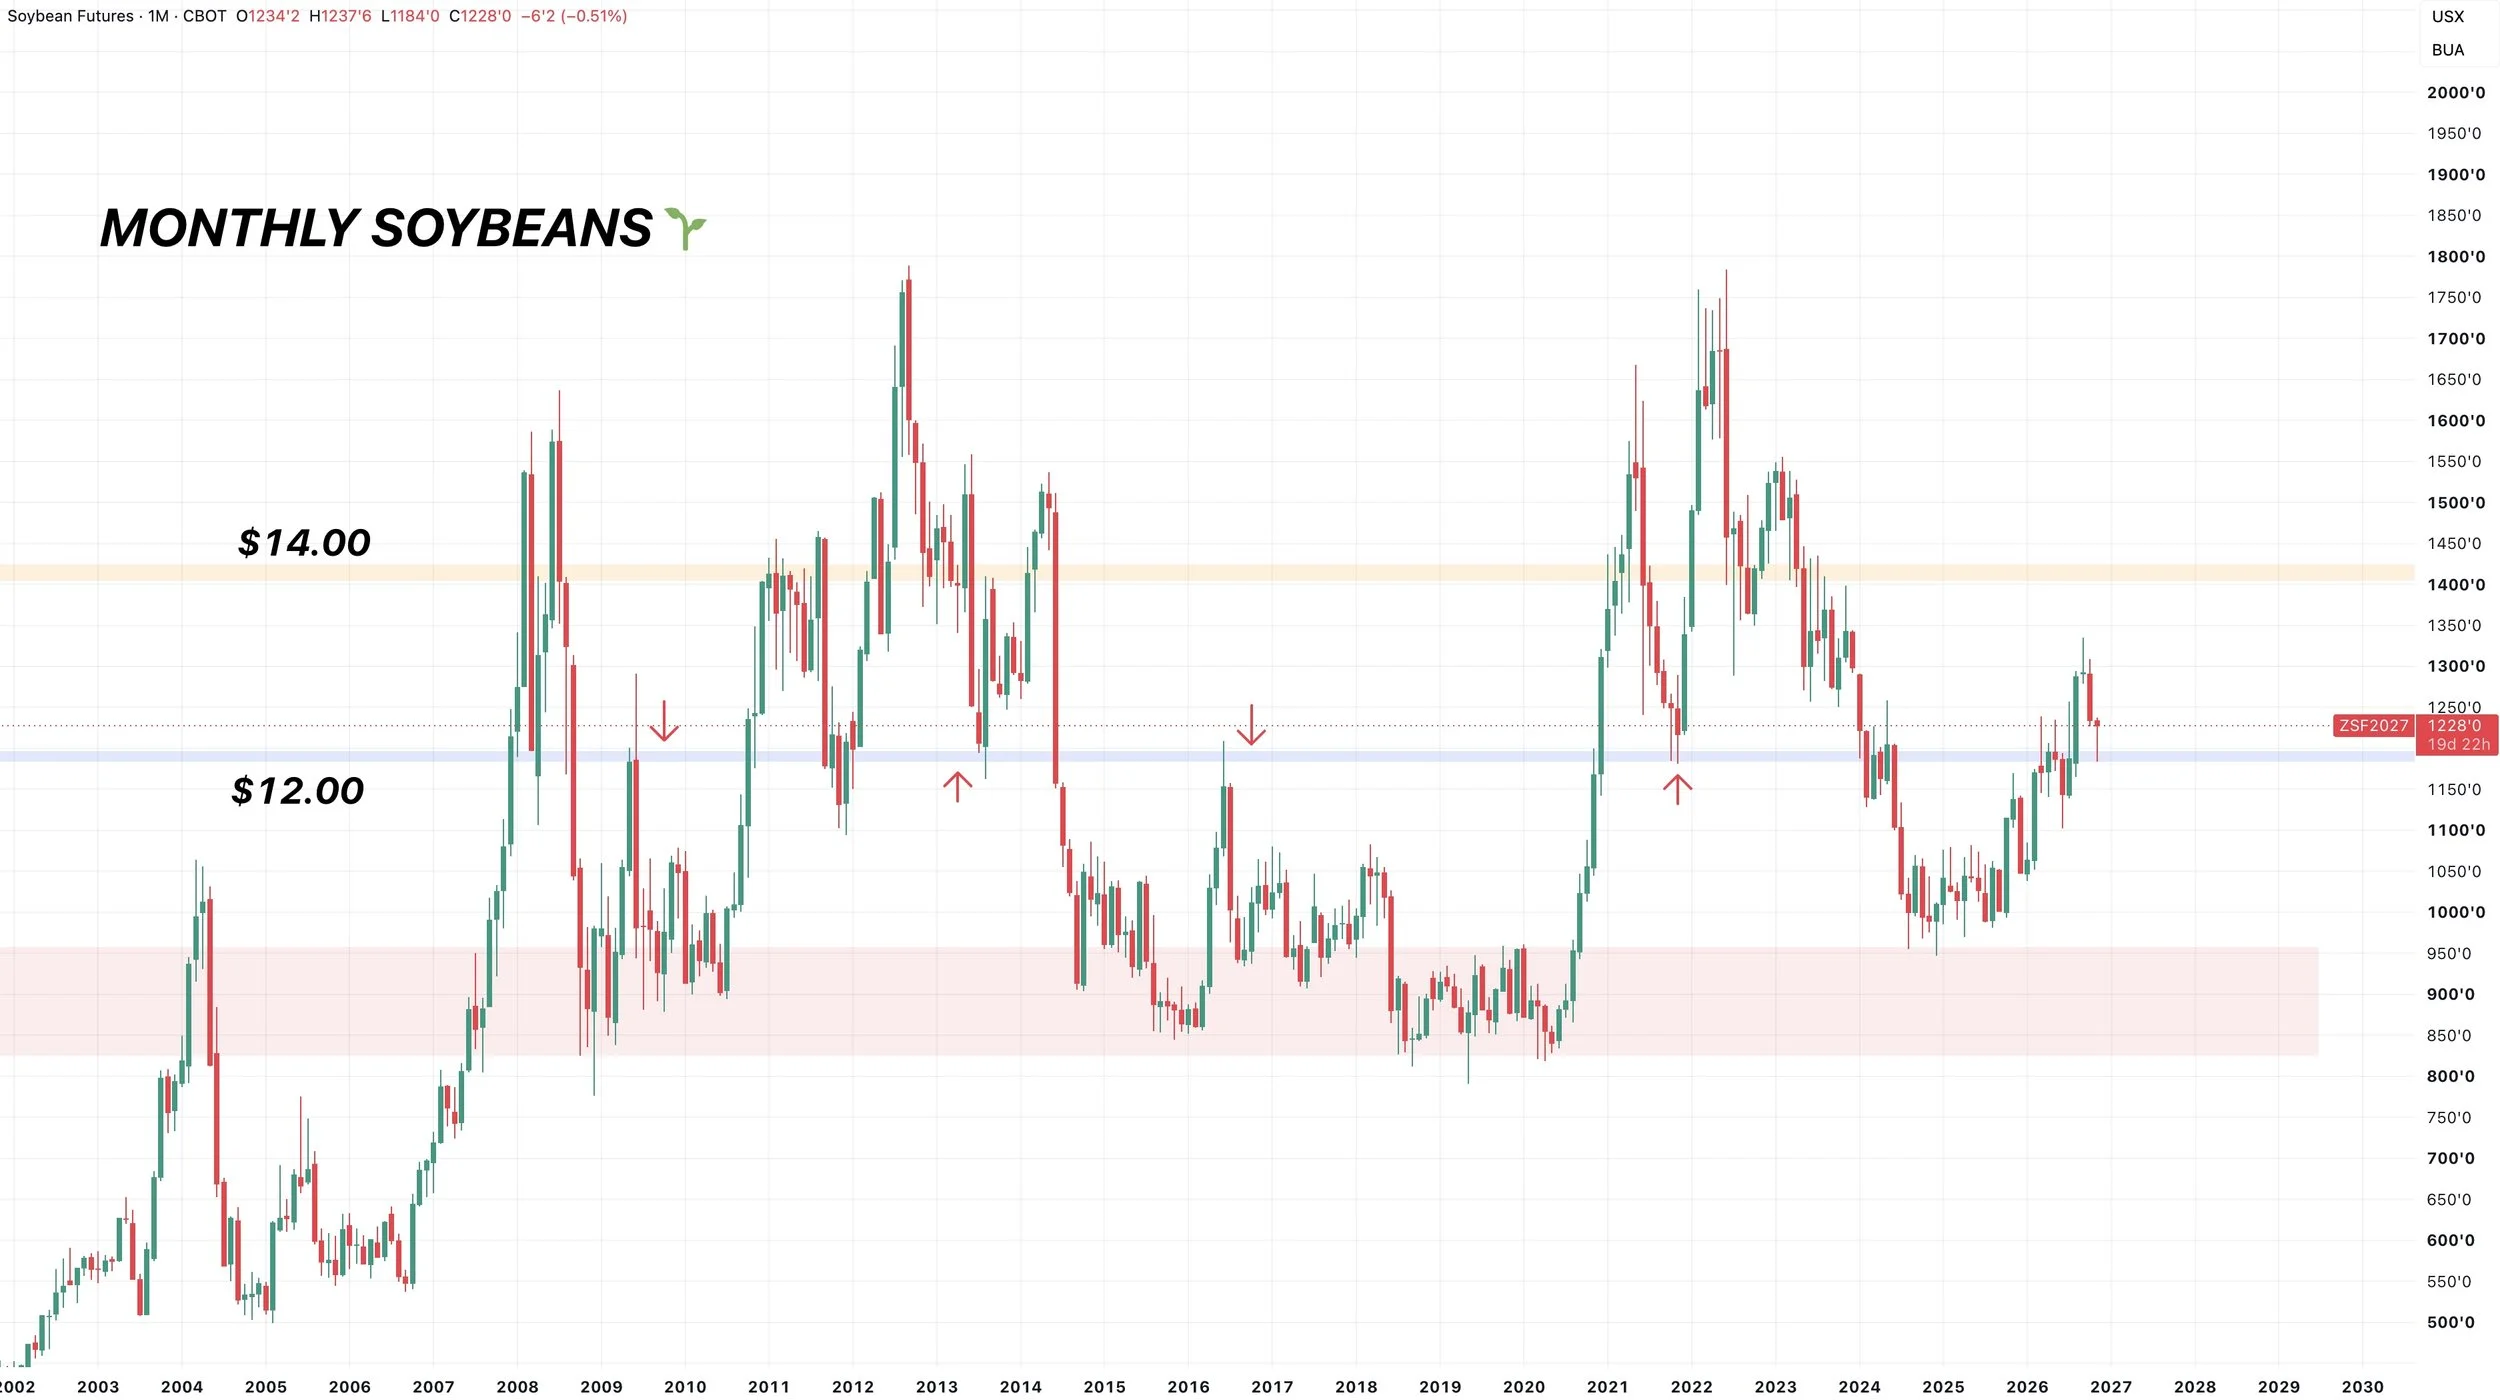
It's still early in the month, but we have a pretty nice monthly candle going for us.
It looks like a re-test of $12.00 was a simple S/R flip on the high time frames.
Dec Meal Chart:
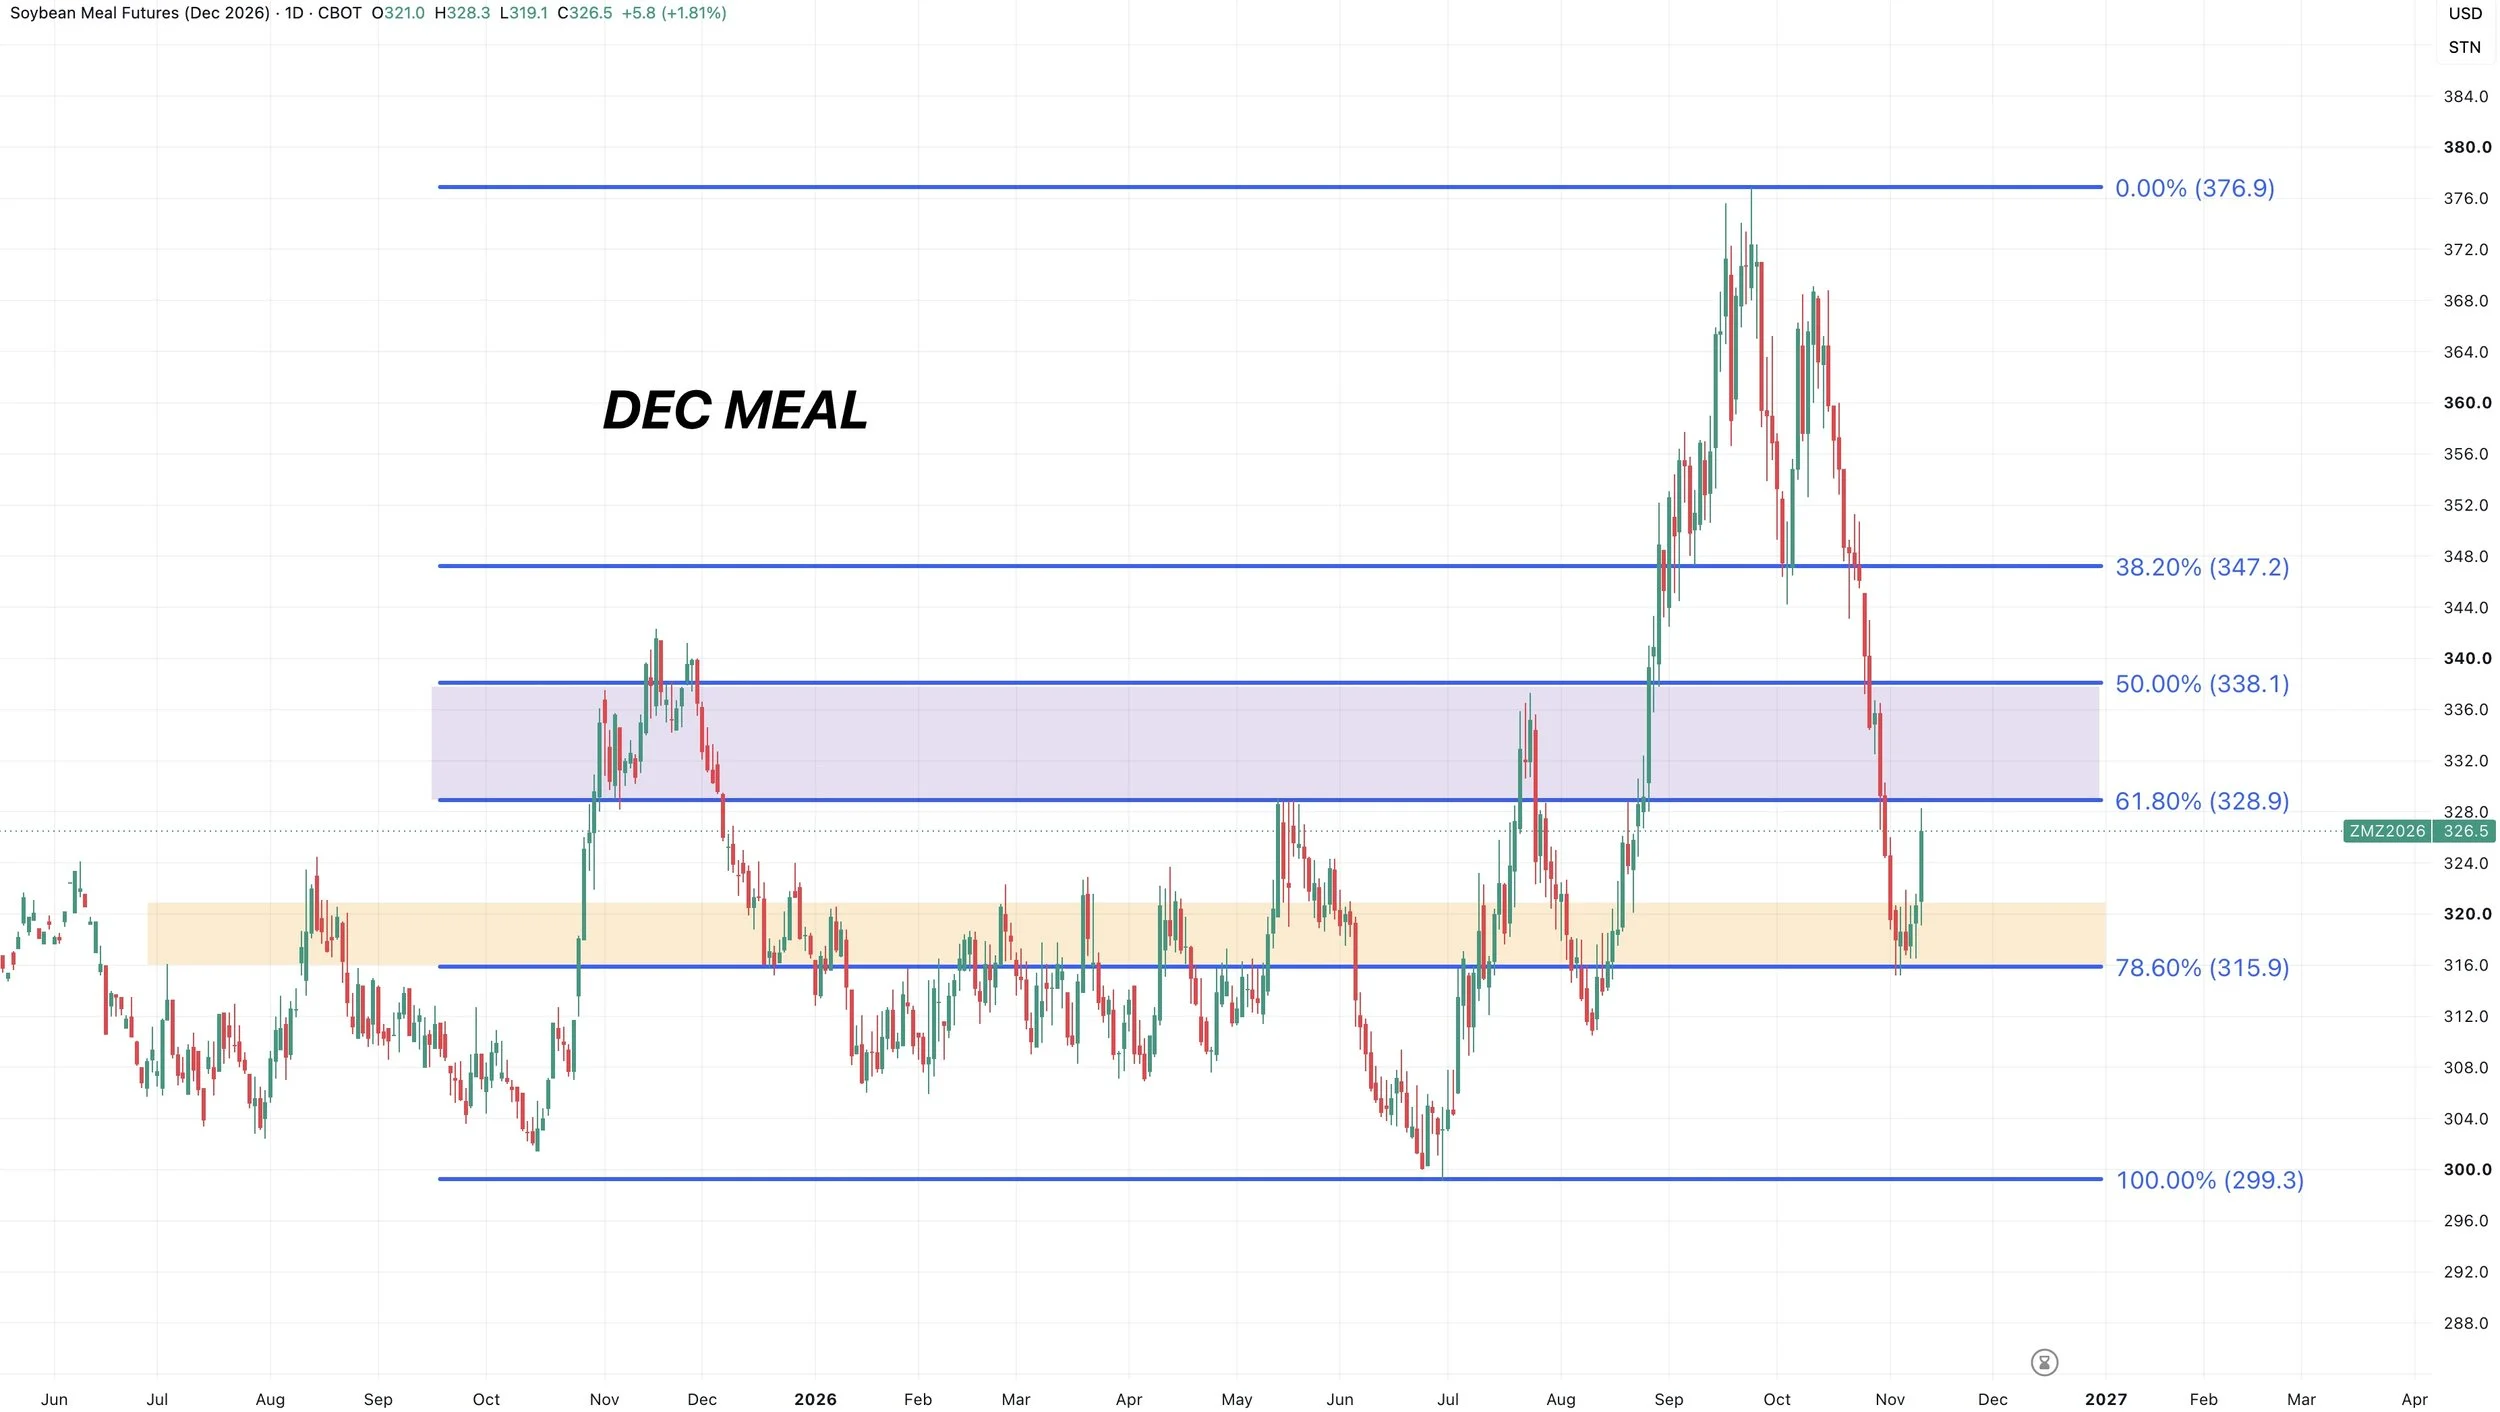
Meal also bouncing right off that support we've been talking about.
We failed to hold the golden zone. So we came down to the test the 78.6% level. So far seeing a nice reaction there.
Front Month Meal Chart:
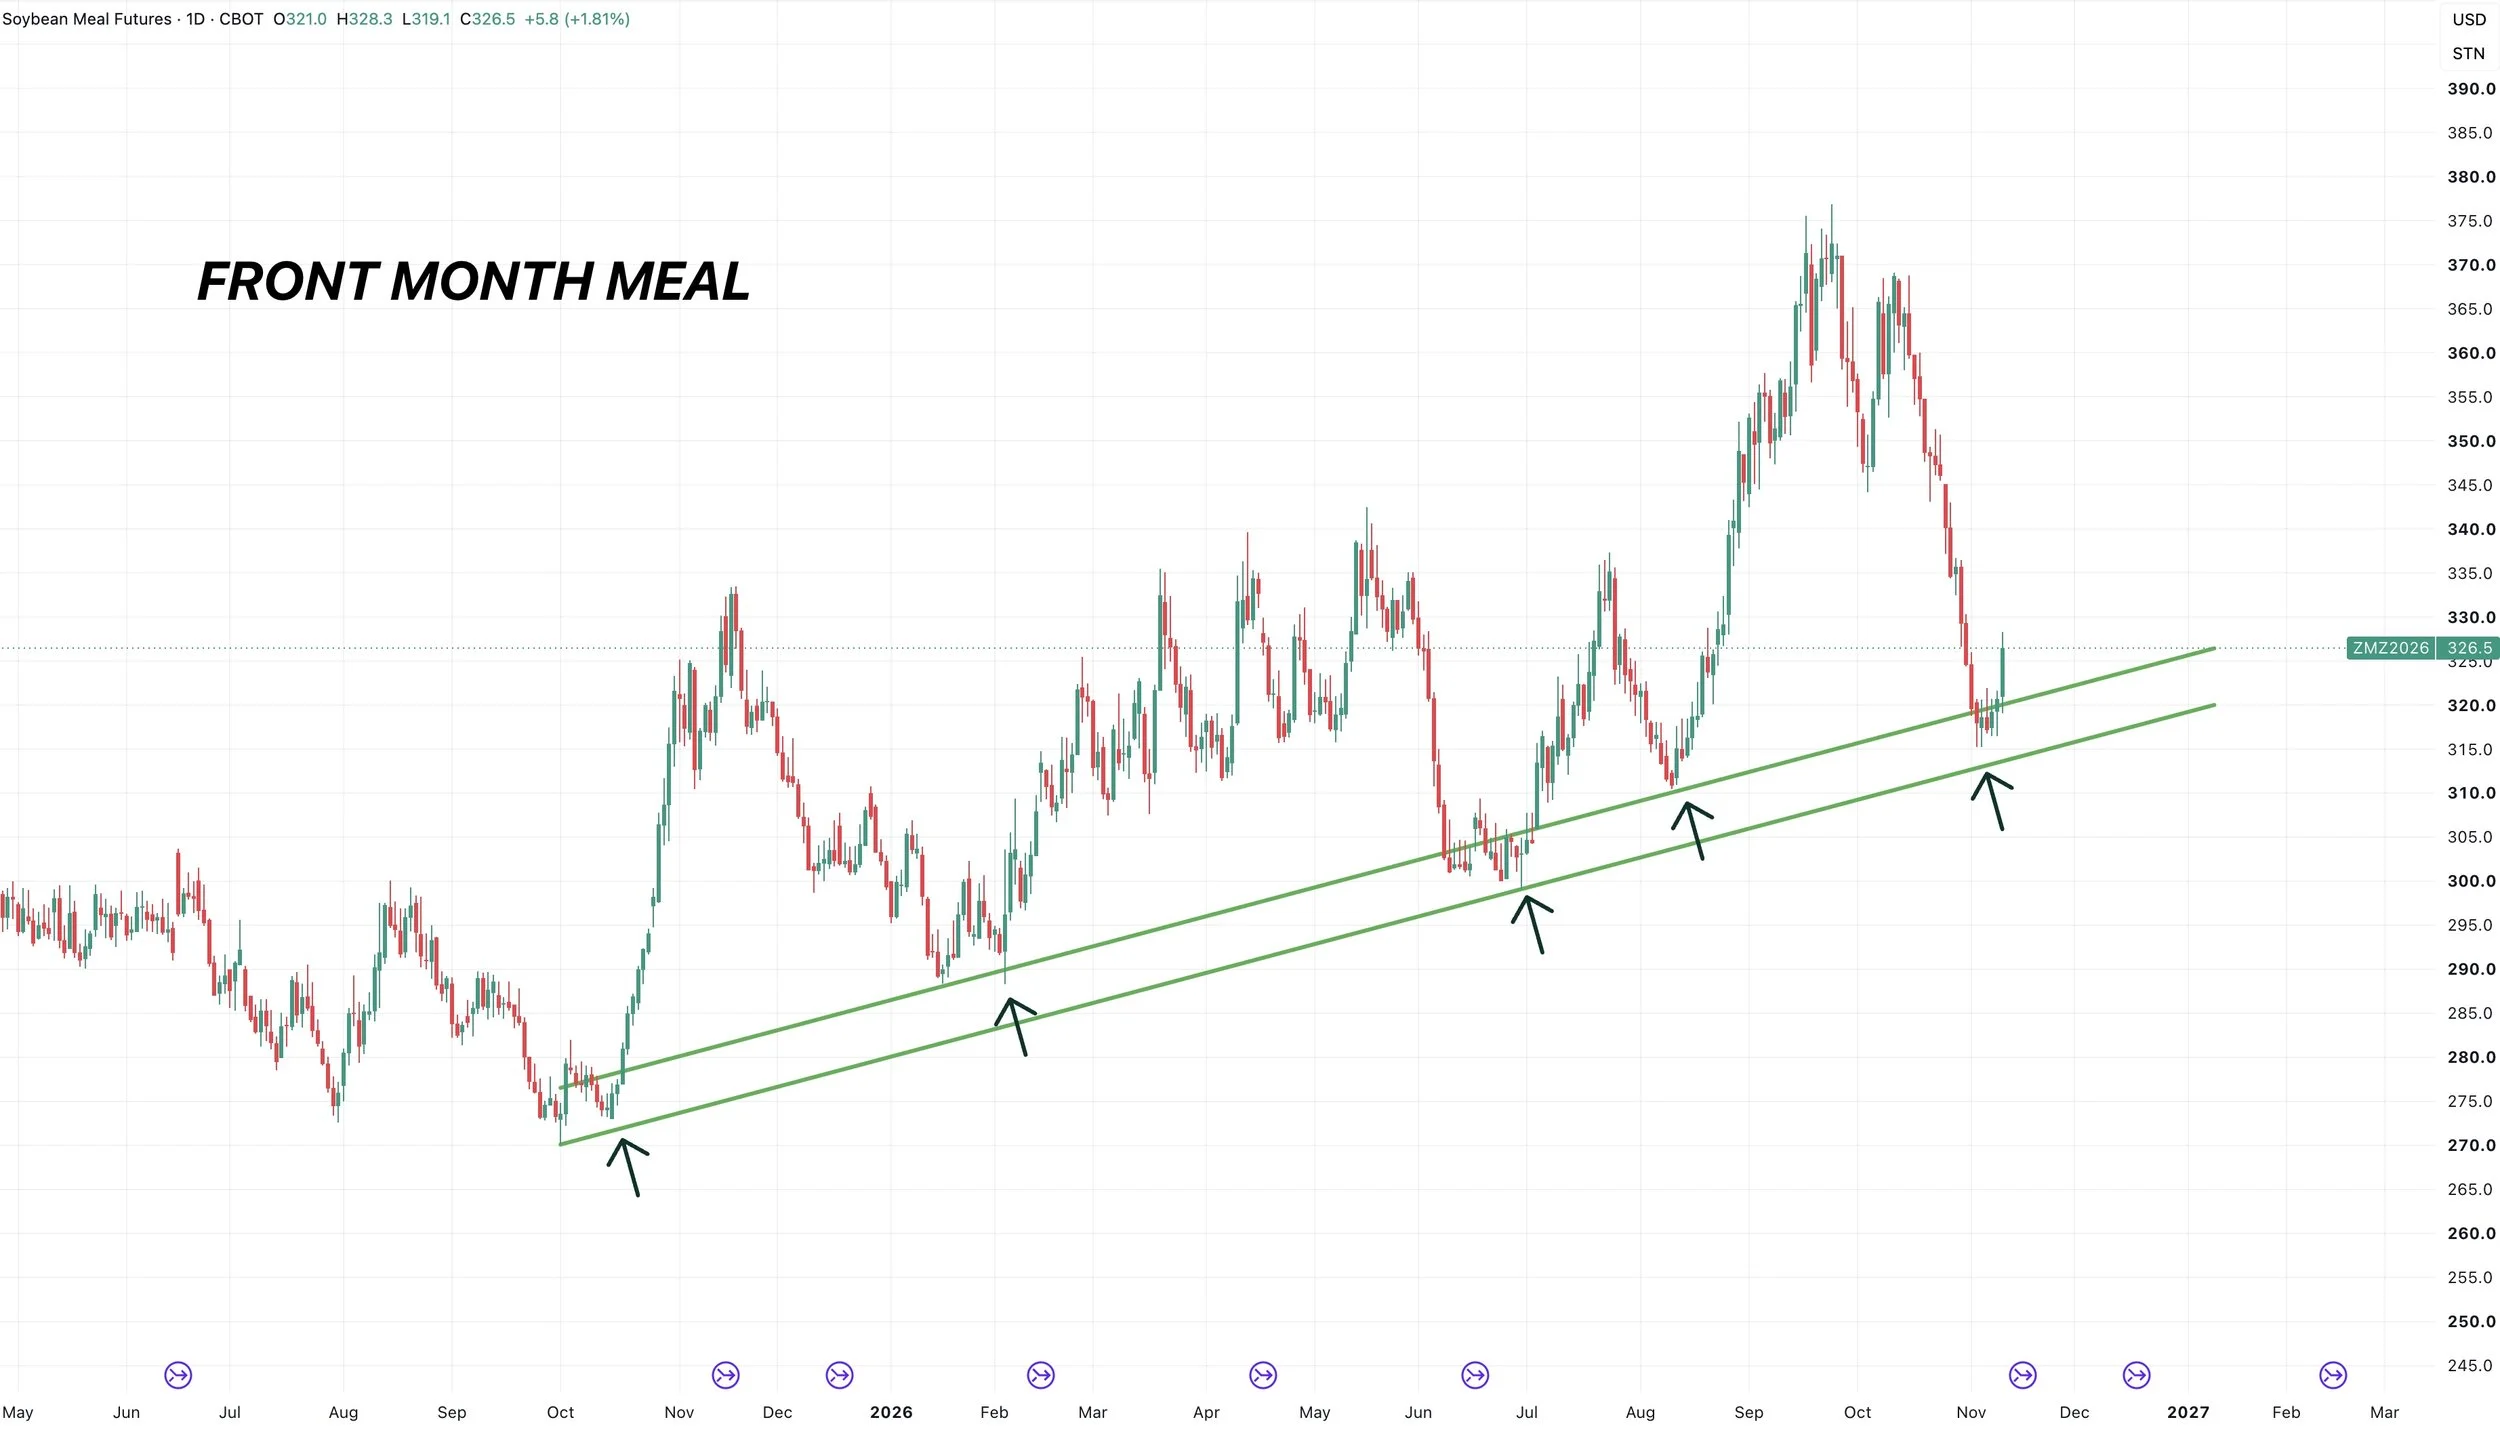
This also just so happens to be some trendline support on the front month contract that has marked countless bottoms for this market.
Bean Oil:
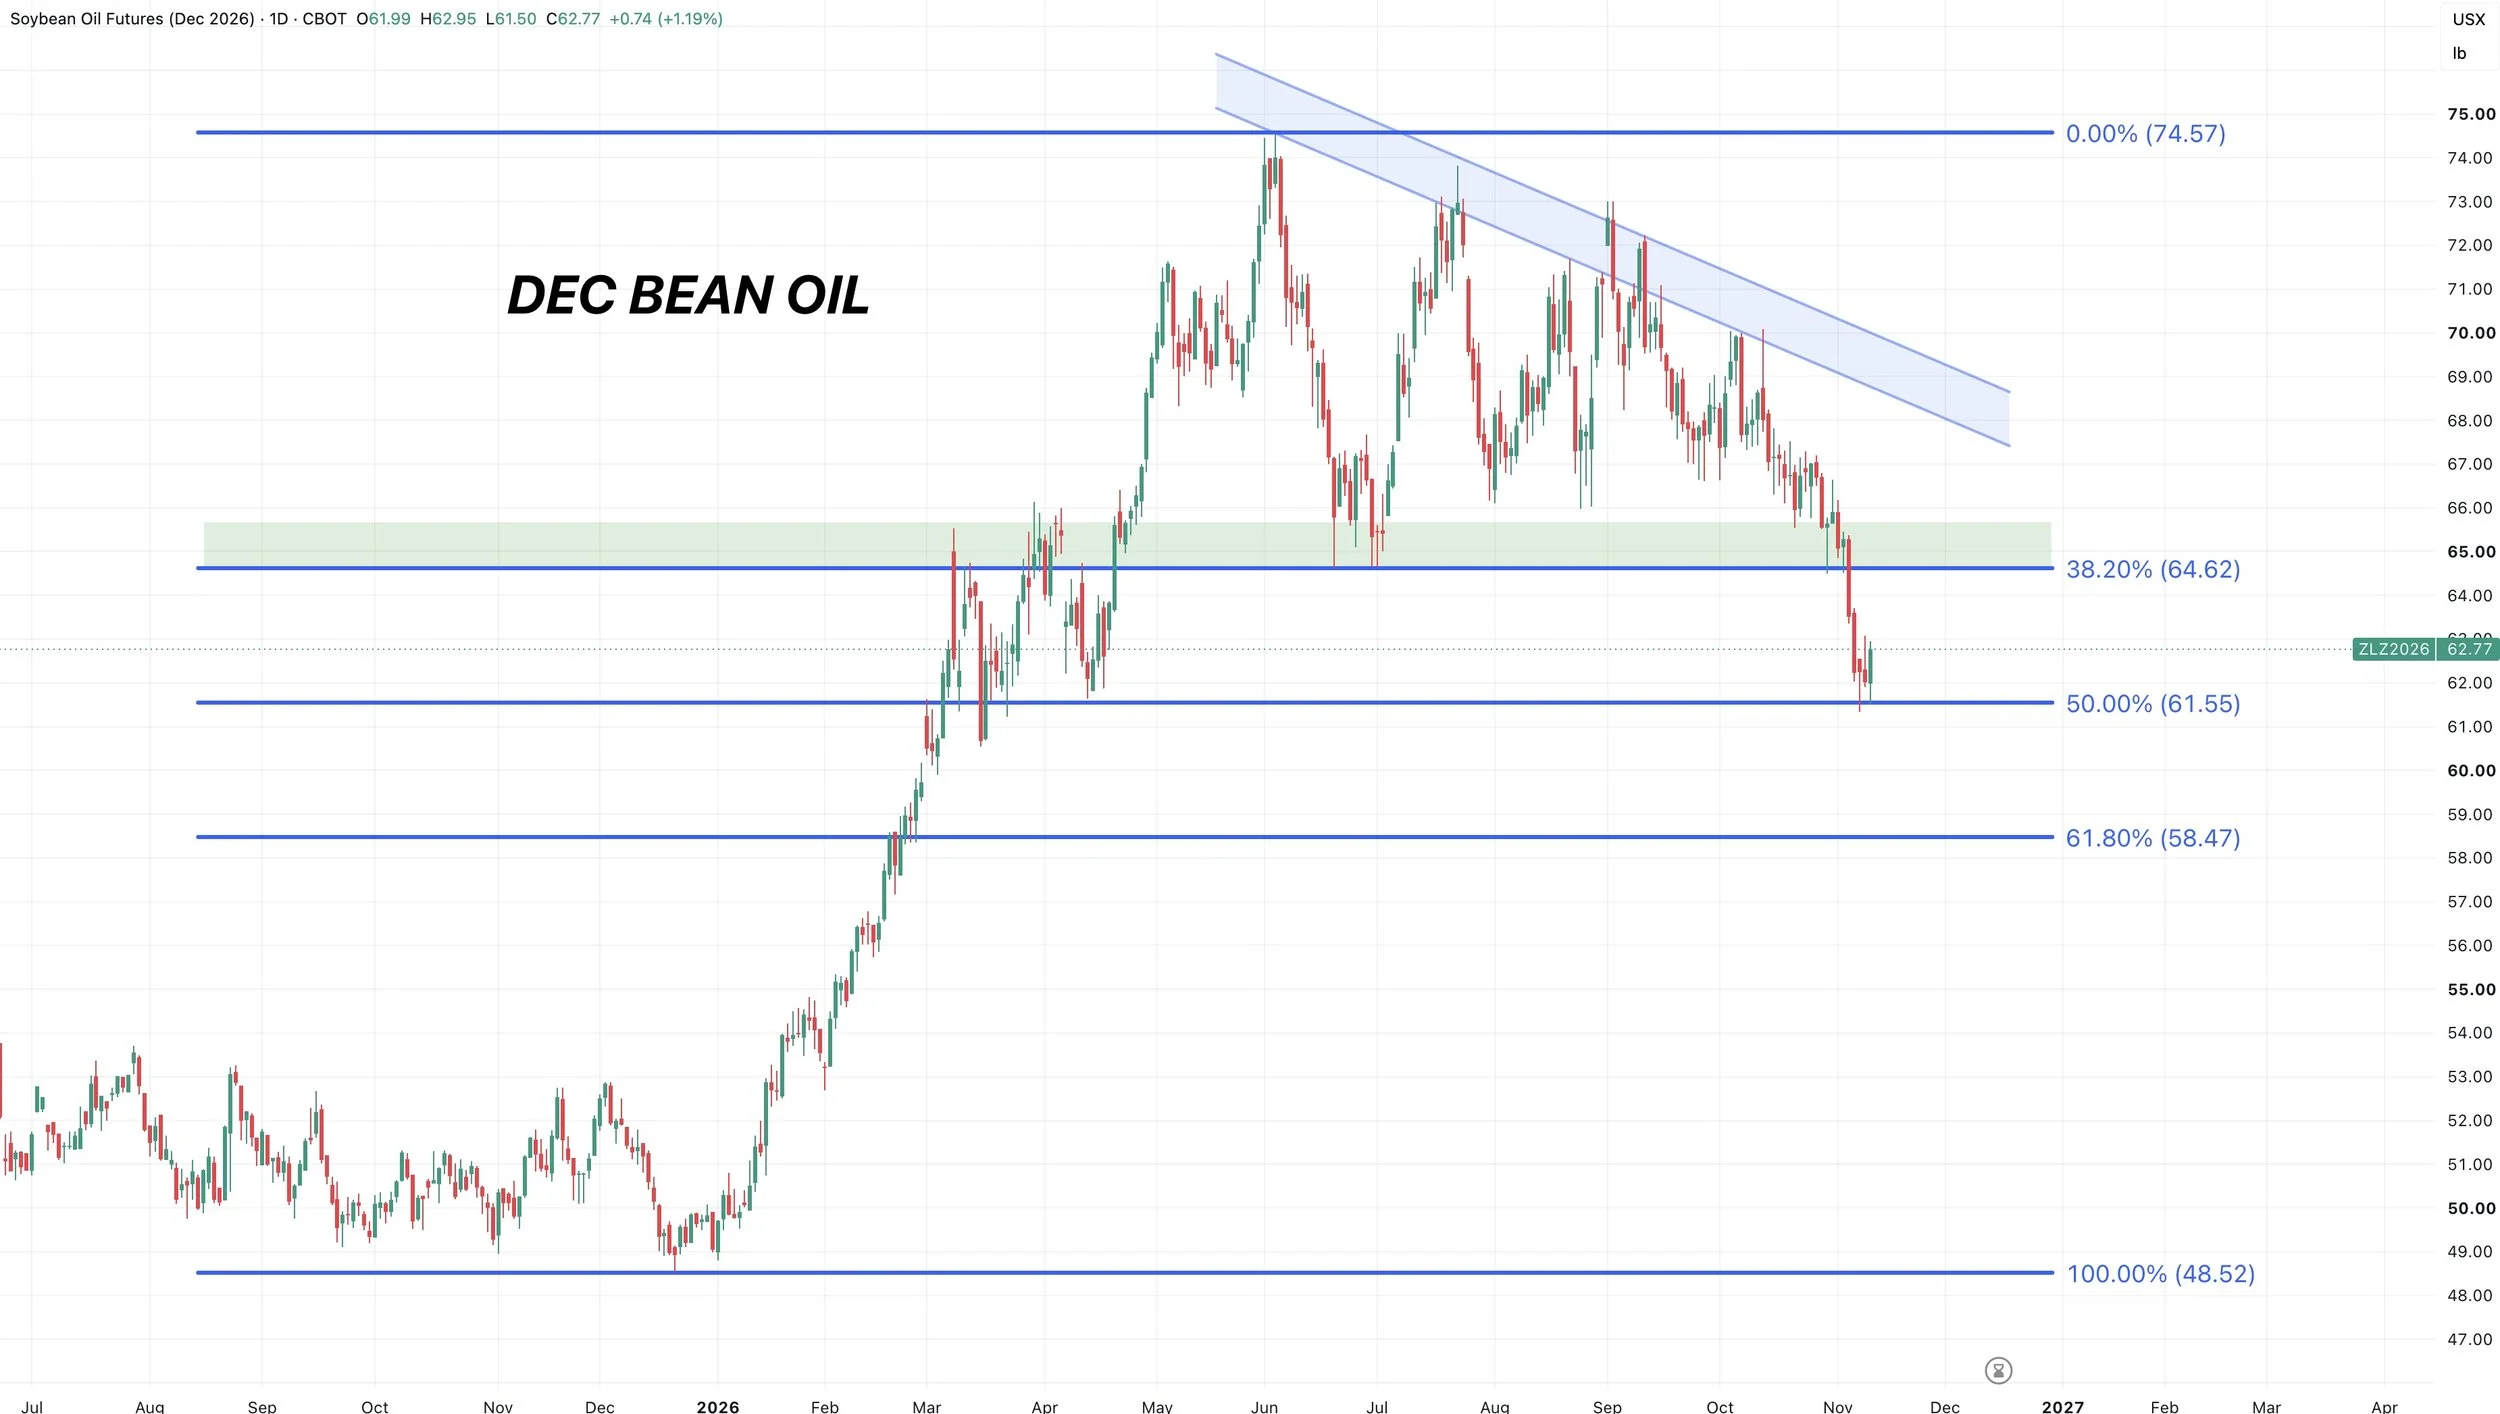
Bean oil also bouncing at support like the rest of the soy complex.
We failed to hold the bottom of the yearly range we had held all year long. Which was also 38.2% of the entire rally.
As a result we came down and tested the 50% level and that range from spring.
Bulls want to continue to hold here or there is plenty of air to the downside.
But for now, it looks like the entire soybean complex is finding life where it needs to which should be supportive for soybeans if we continue to hold.
Wheat
Dec KC Chart:
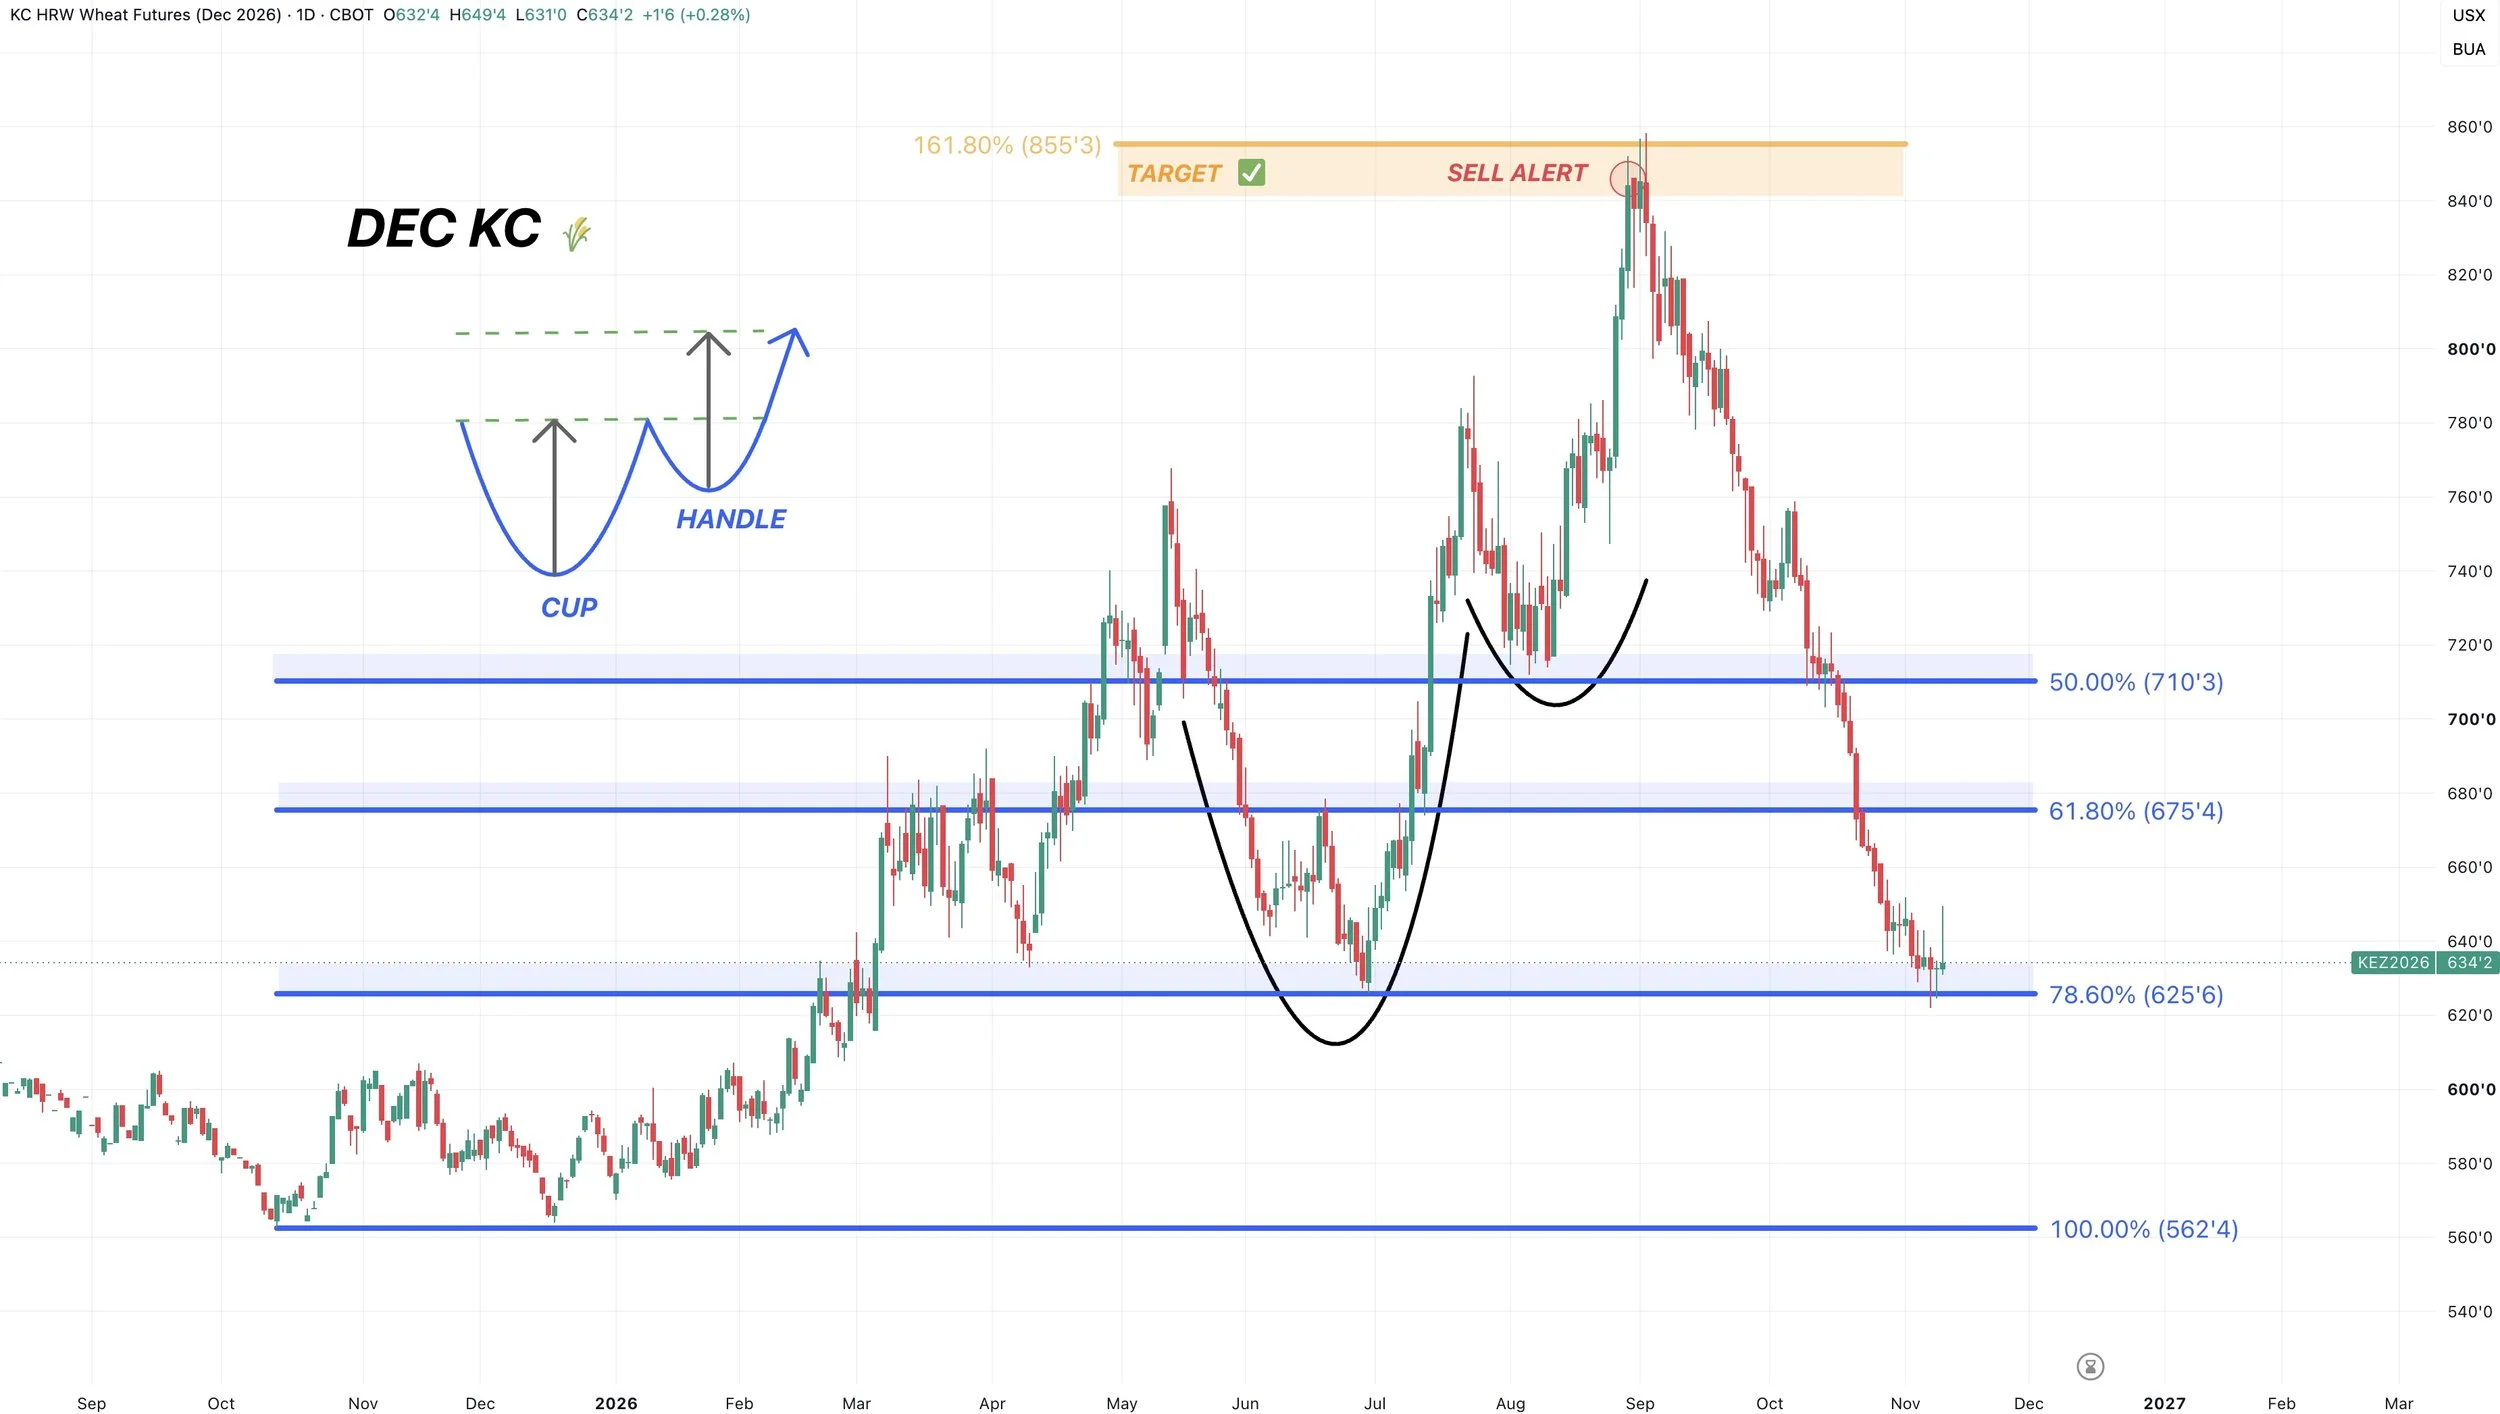
Wheat did not have a bullish report like corn and soybeans did.
However, wheat is still sitting at some key support.
This is still KC's last support before contract lows.
It's the last retracement, having given back 78.6% of the entire rally from contract lows to contract highs.
This is also the summer lows.
Bulls need to hold this area to prevent this market from further falling apart.
RSI & MACD:
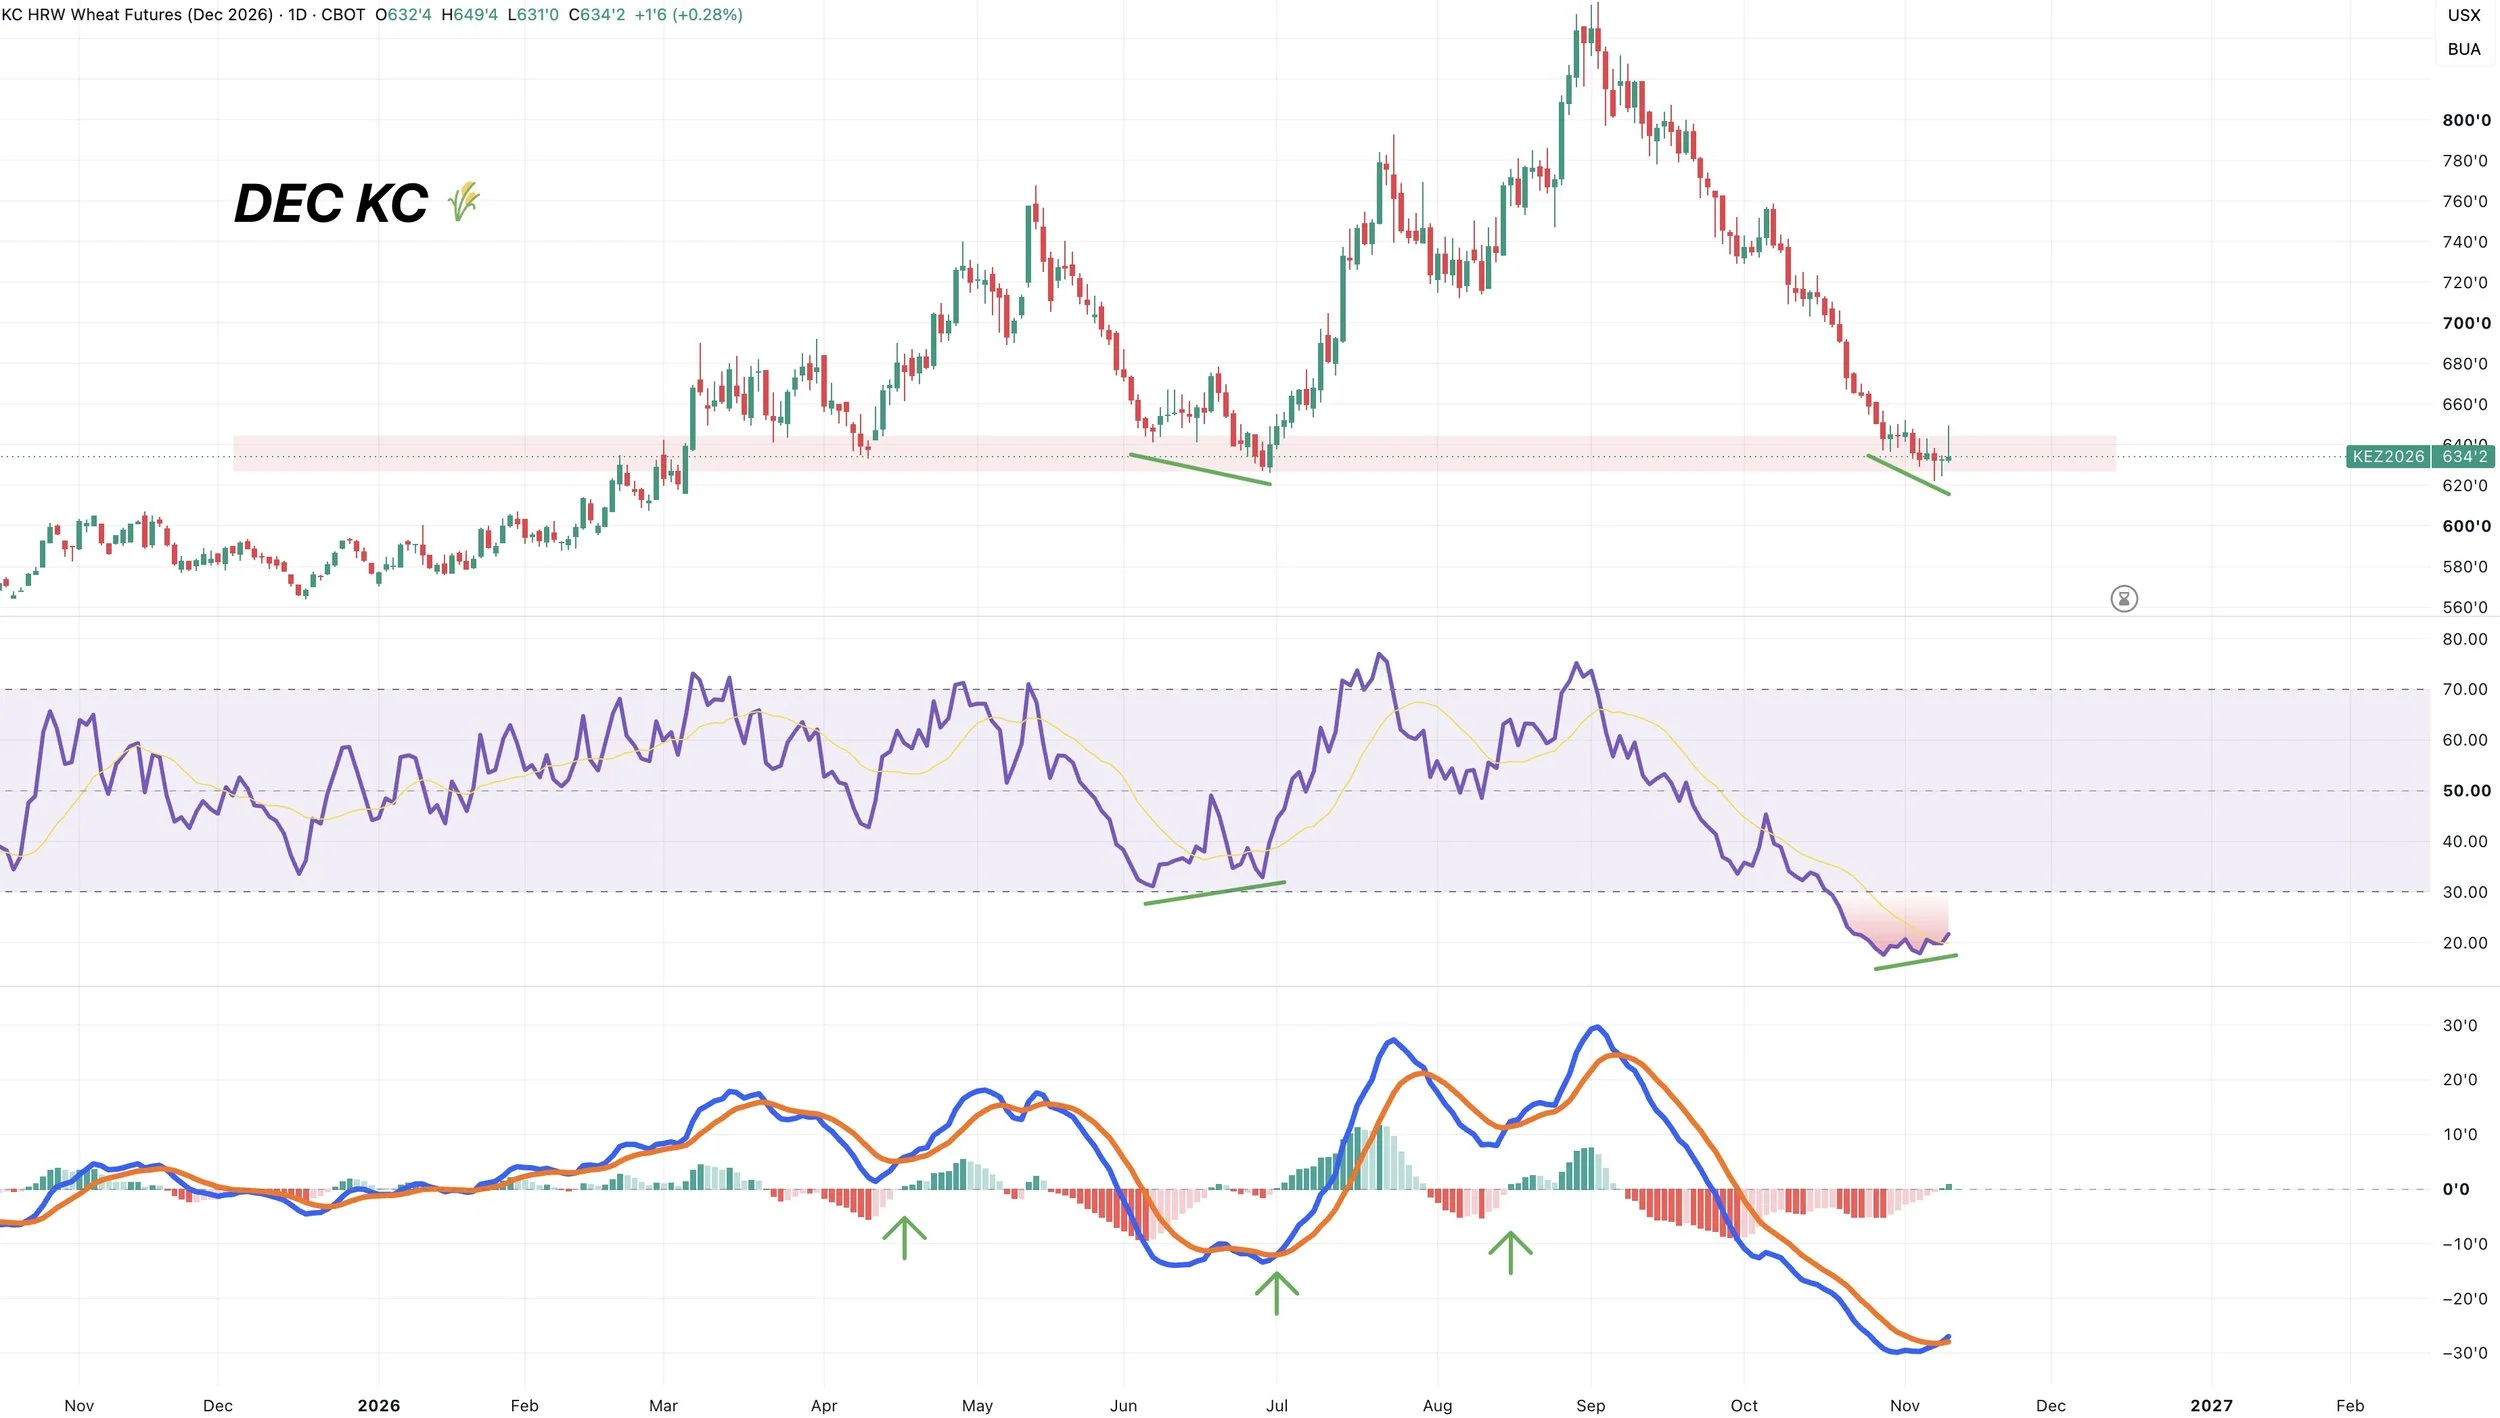
The indicators are still showing some signs of life.
We have bullish divergence on the RSI. Last time we saw that was the summer lows.
The MACD just crossed bullish for the first time since that August rally.
Both are positive signs for a potential bottom.
Cattle
Jan Feeders:
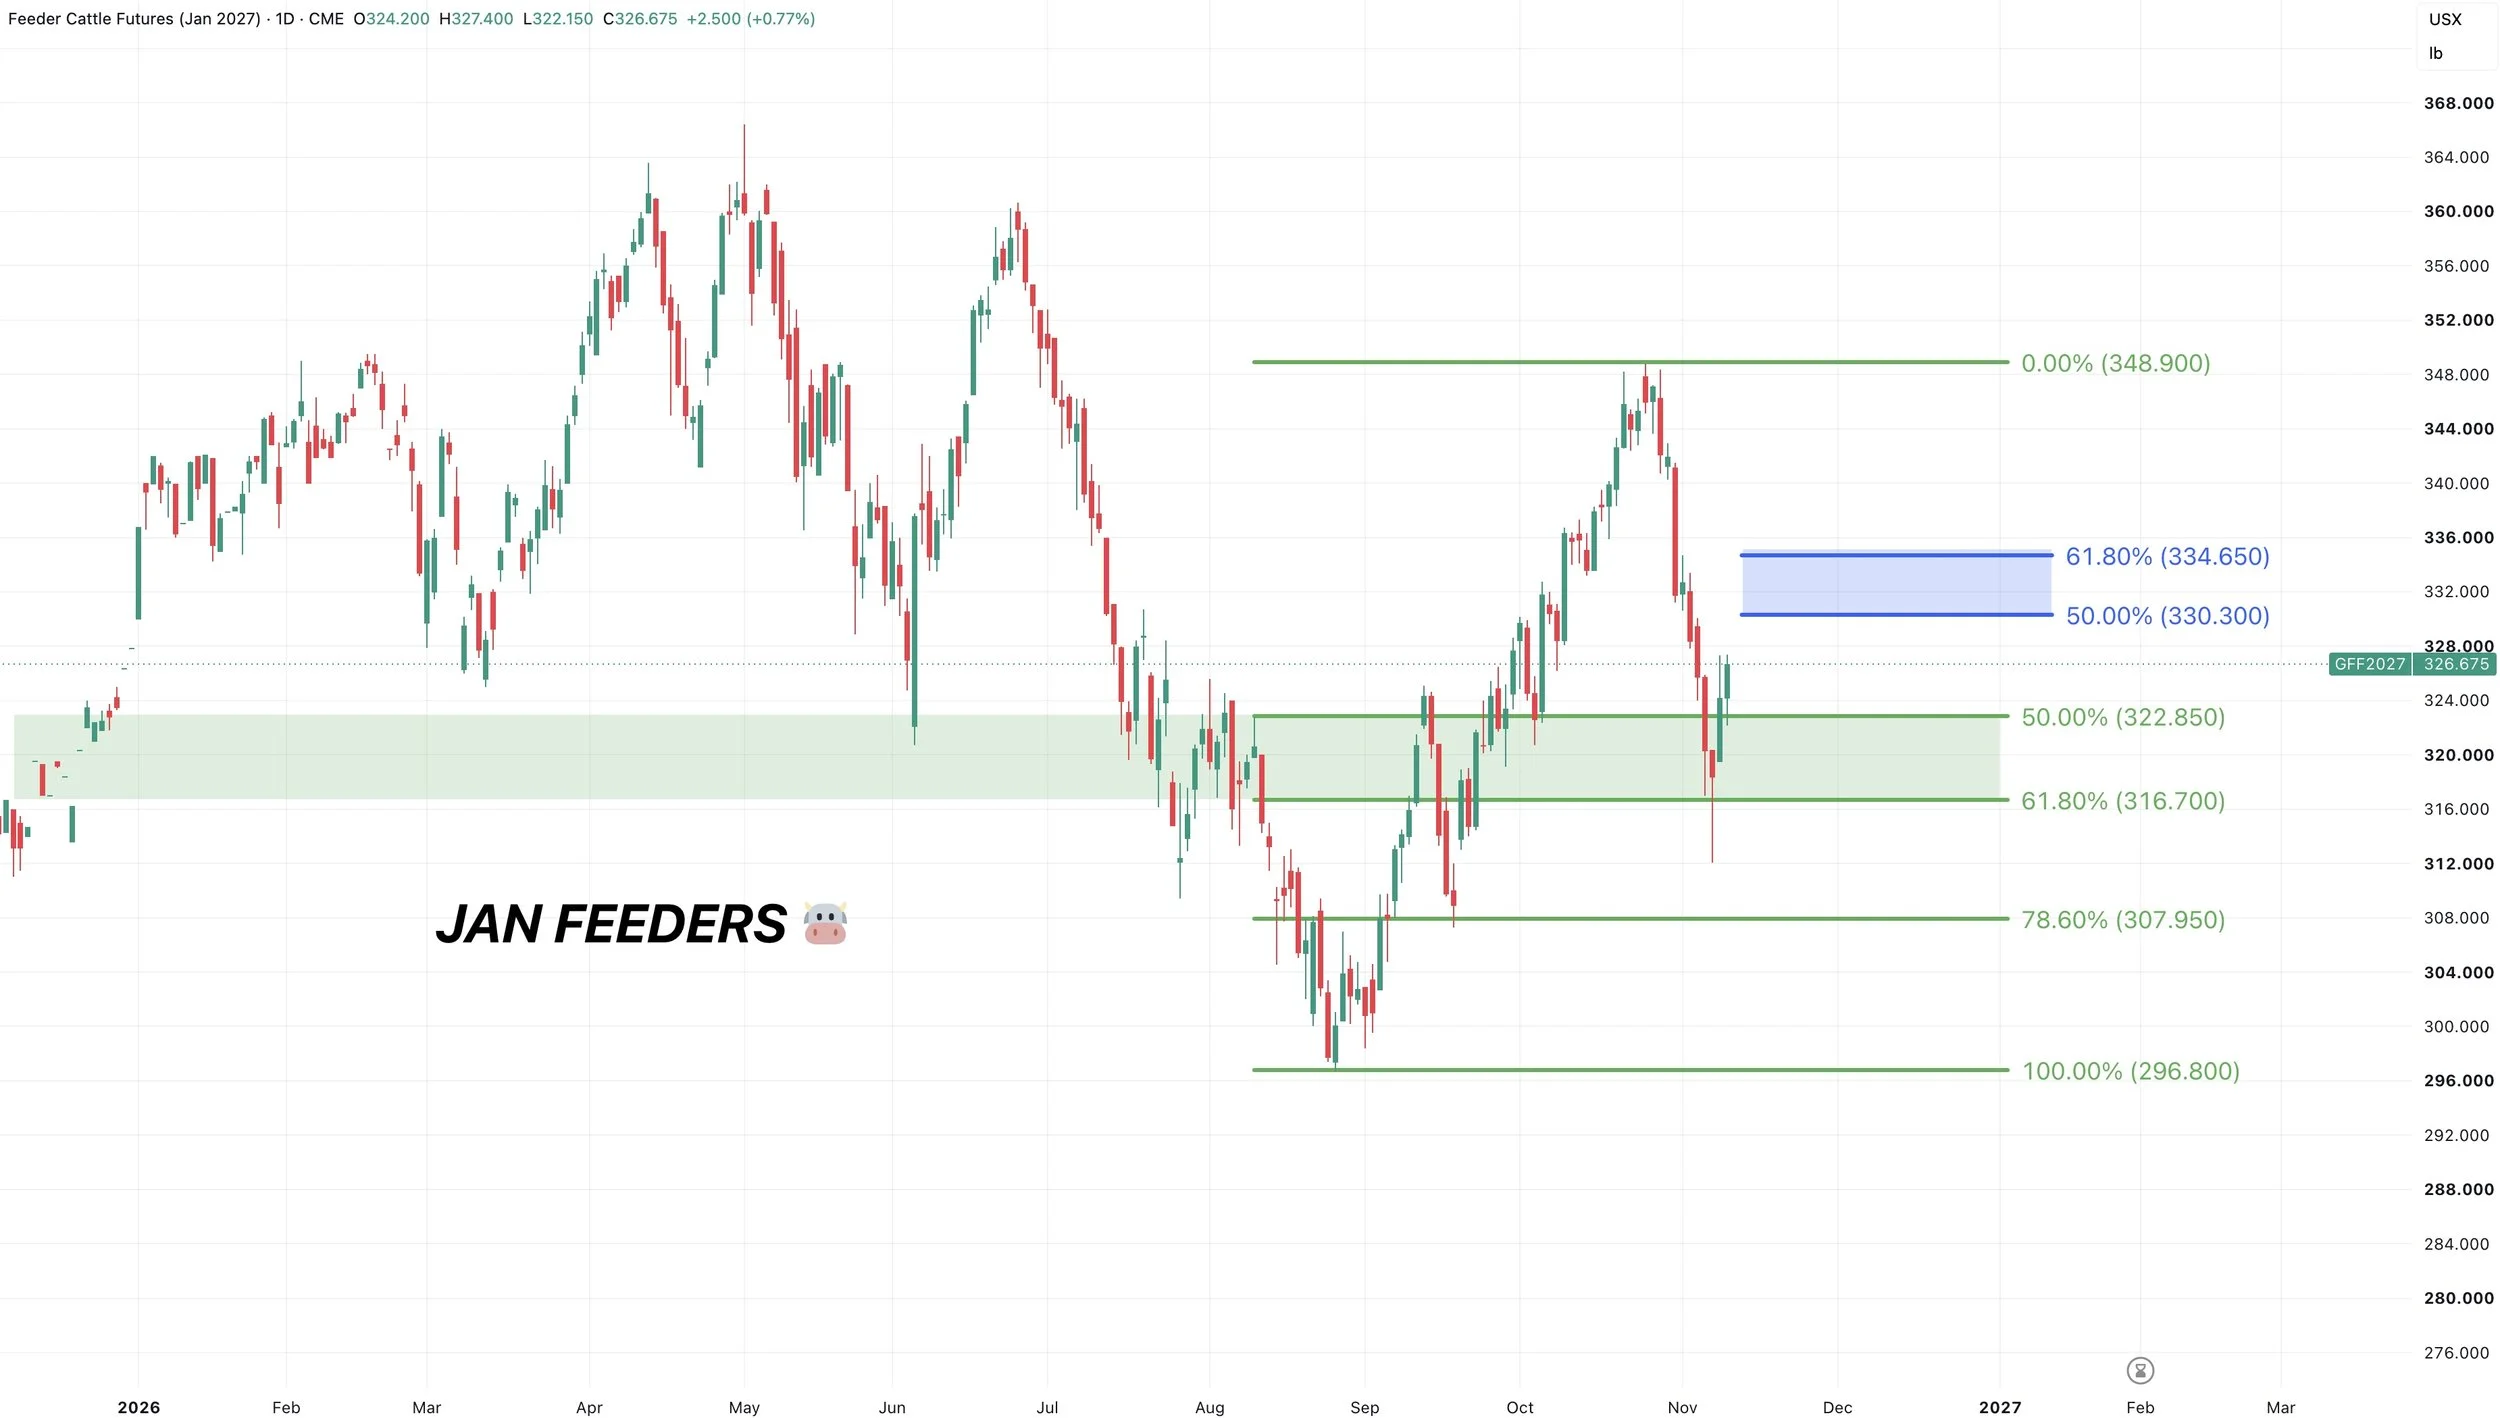
Impressive action in cattle the last few days following the nasty sell off.
Feeders held right where they needed to. Holding that golden zone after giving back over 61.8% of the entire rally.
Now we are nearing a point of interest to the upside. If this is simply a dead cat bounce, a common area to see the bounce stall would be 330.30 to 334.65. As that claws back 50-61.8% of the sell off.
So that is going to be the next area I am watching to de-risk further, following our sell alert up towards those recent highs.
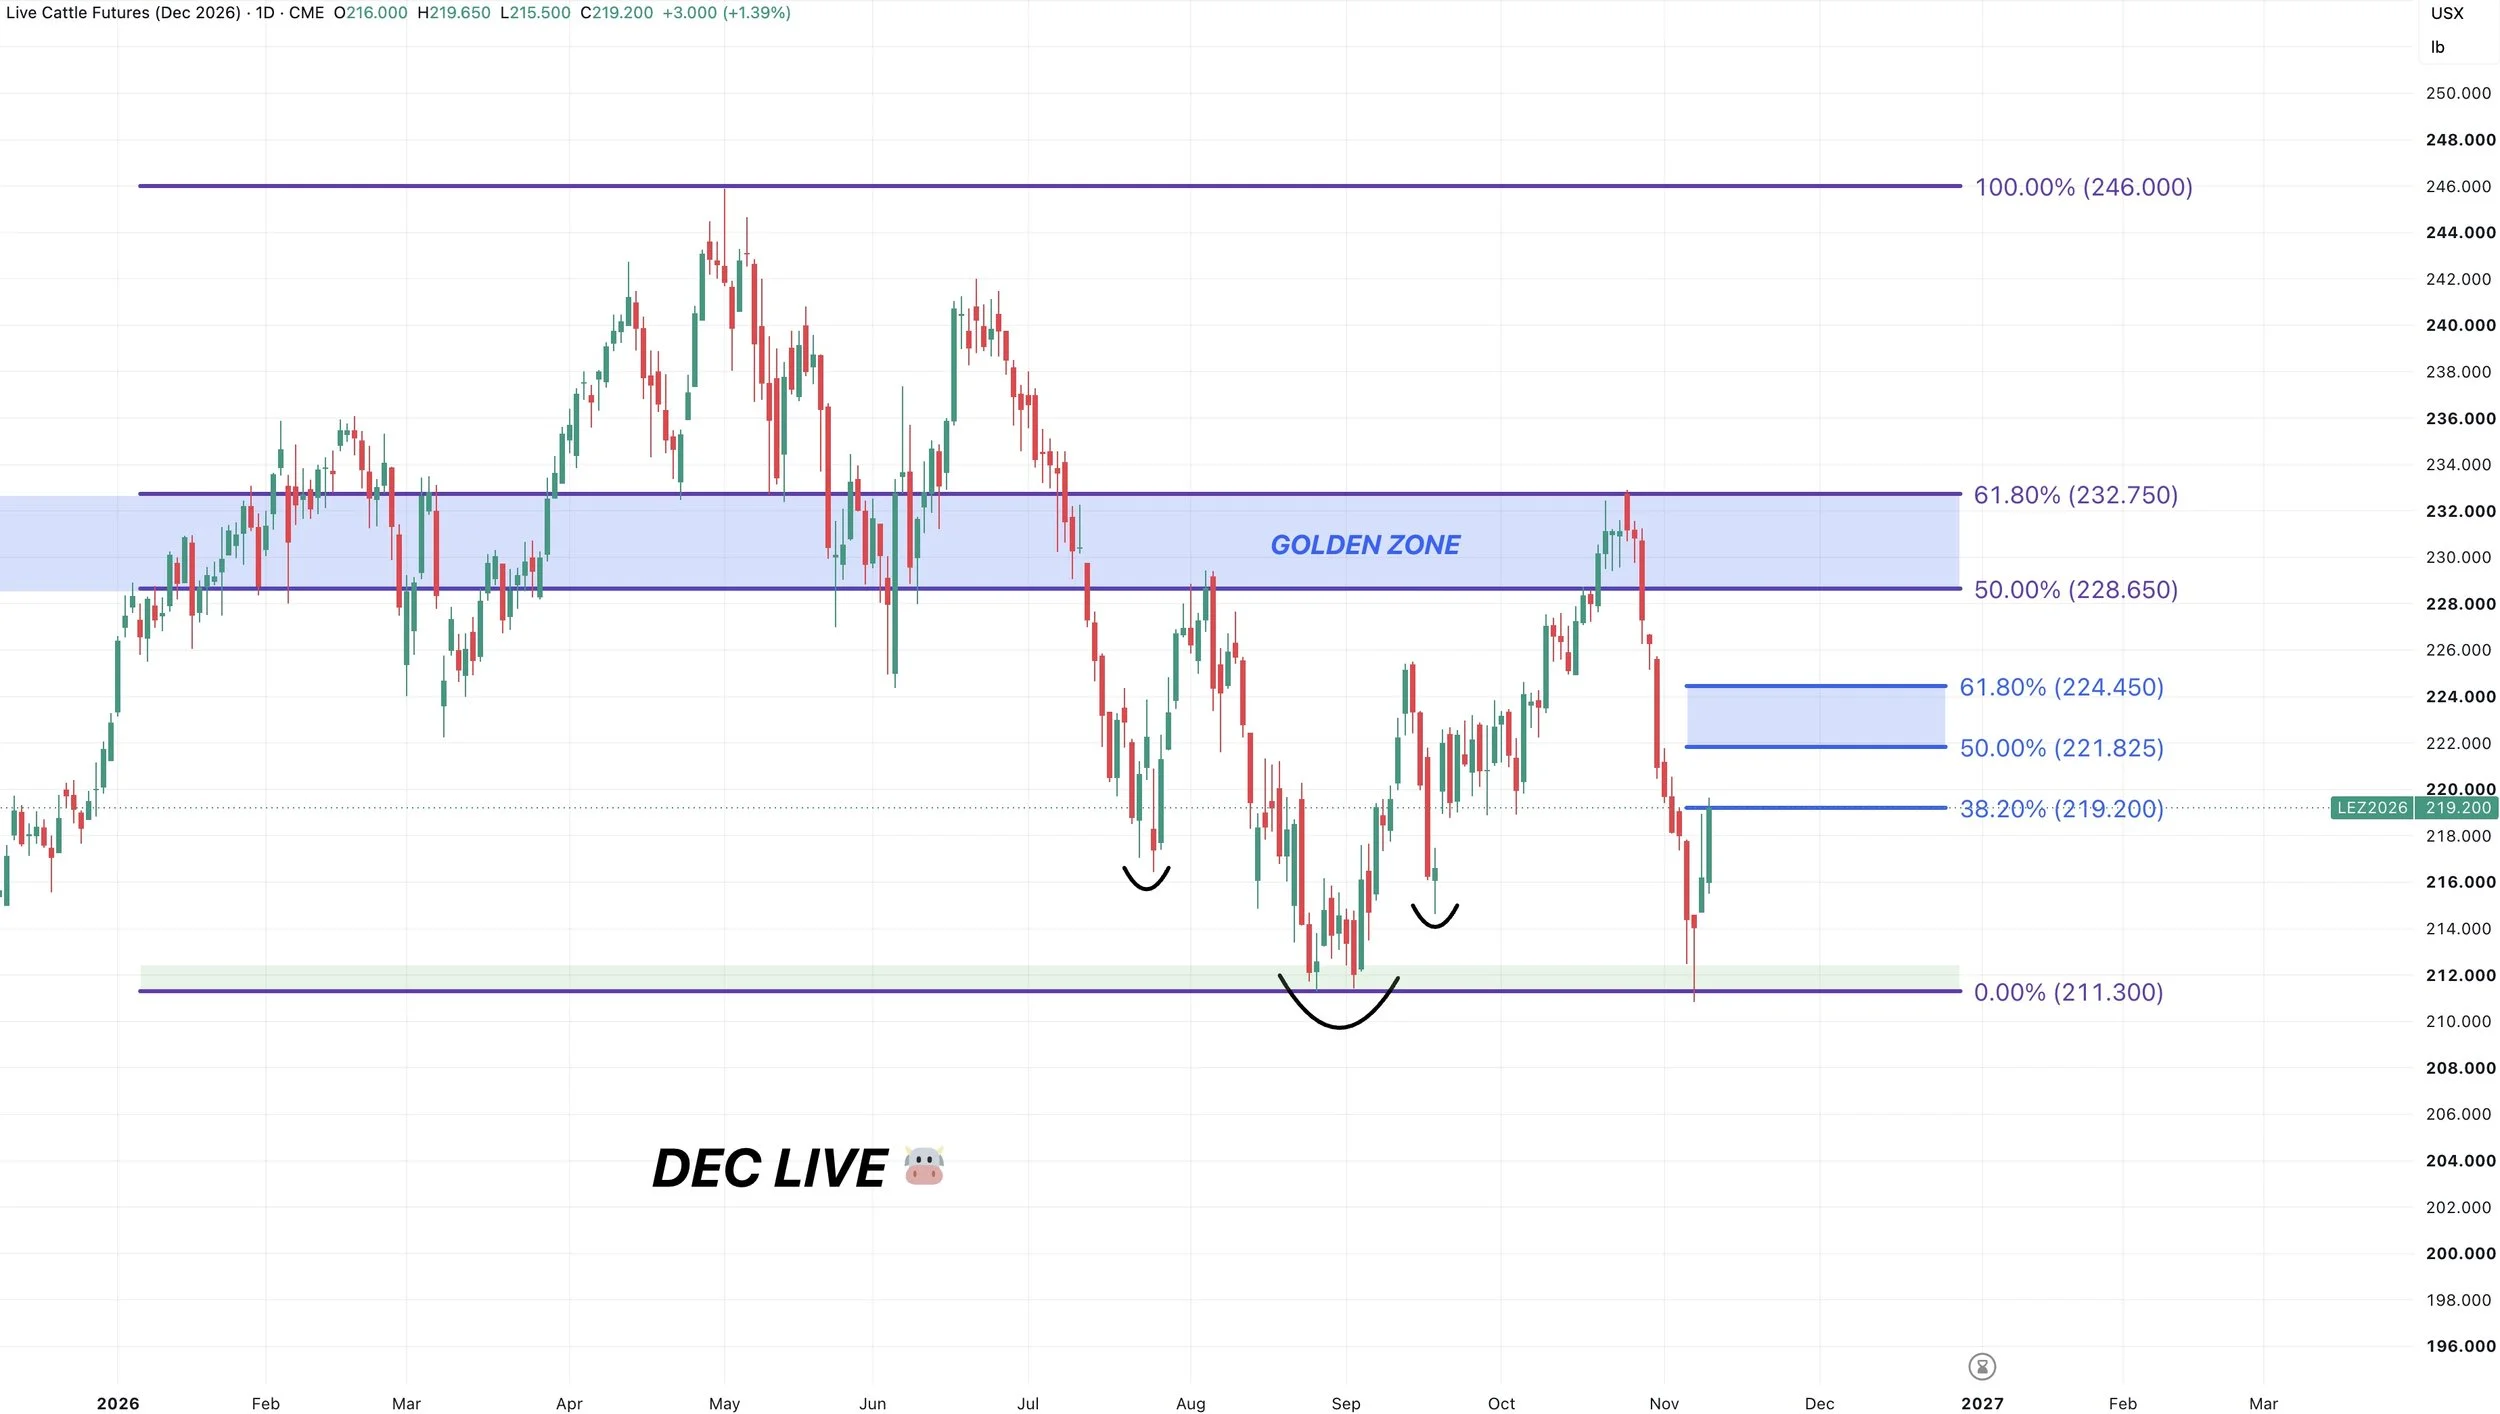
Dec Live Chart:
Live cattle swept those August lows and performed a liquidity sweep.
Now seeing a nice bounce.
Since we had that sell alert up inside that golden zone up to the May highs, the next area I am watching is going to be that 221.8 to 224.4 range.
Which claws back 50-61.8% of this sell off. If this is just a dead cat bounce, that is the most common area for the bounce to end.
Want to Talk?
Our phones are open 24/7 for you guys if you ever need anything or want to discuss your operation.
Jeremey & Office: (806)484-1214
Sebastian: (605)280-1186
Email: sfrost@dailymarketminute.com
Hedge Account
Interested in a hedge account? Use the link below to set up an account or give us a call.