
2024 VS 2025 YIELD & DRY FINISH
MARKET UPDATE
You can scroll to read the usual update as well. As the written version is the exact same as the video.
Timestamps for video:
USDA & 2024 vs 2025: 0:00min
Corn: 5:00min
Bean: 7:10min
Wheat: 12:10min
Cattle: 13:25min
Want to talk about your situation?
(605)295-3100
Harvest sale ends this weekend
Since your free trial has ended, this will be the last week you receive our updates or signals. Lock in this offer for full access
Futures Prices Close
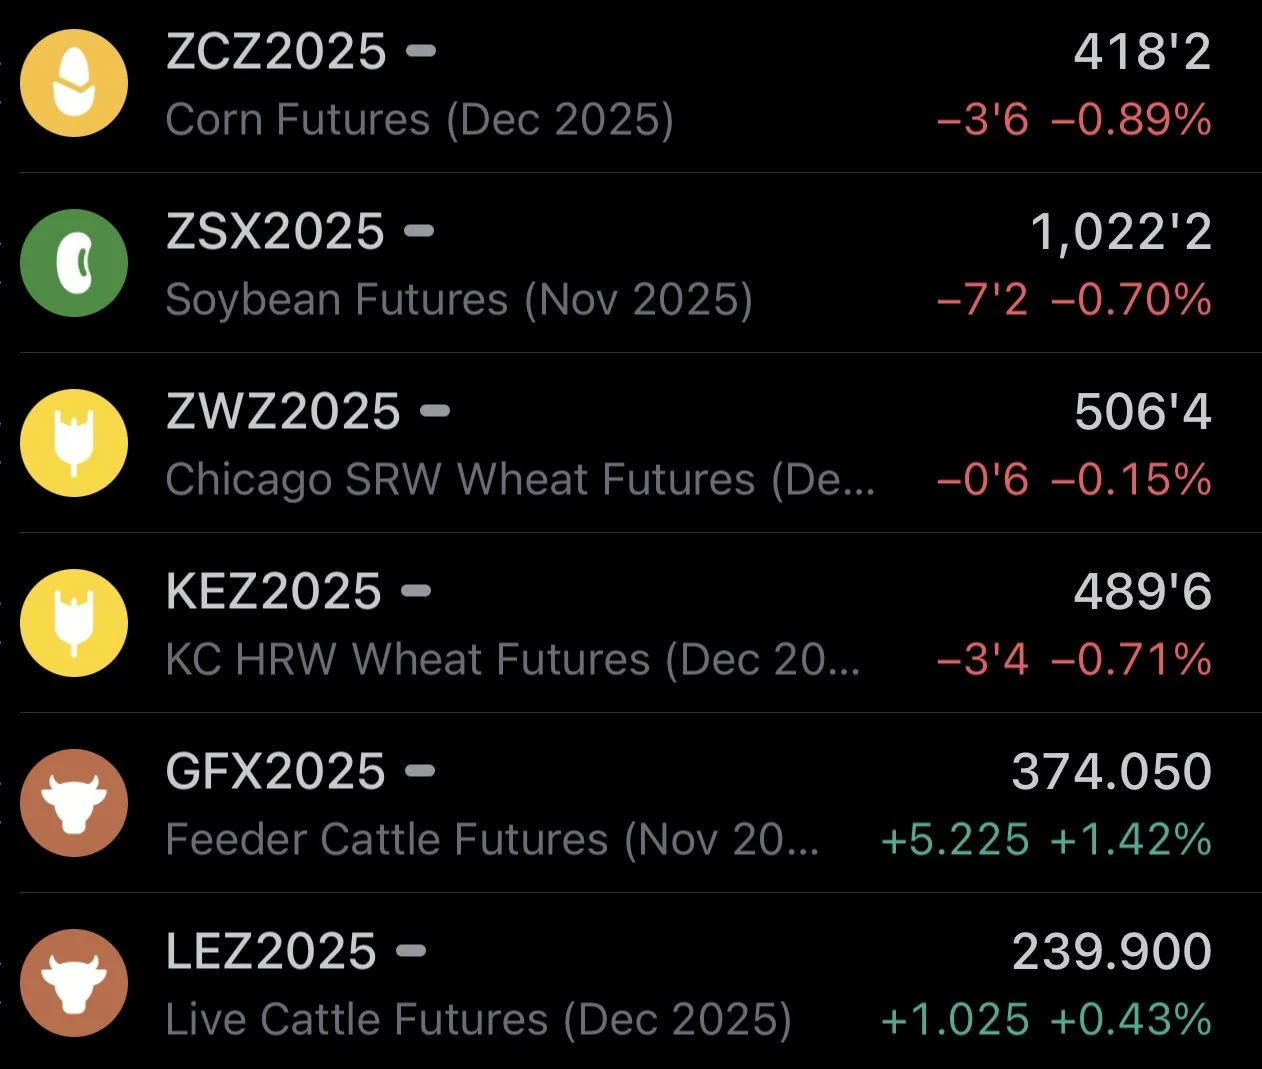
Overview
Grains mostly lower across the board with soybeans leading the way lower after rejecting off of a crucial spot we've been talking about.
The cattle market continues to soar, as feeder cattle is approaching our target which we'll talk about later.
Today was supposed to be the October USDA report. Since the government is shutdown we didn’t get it.
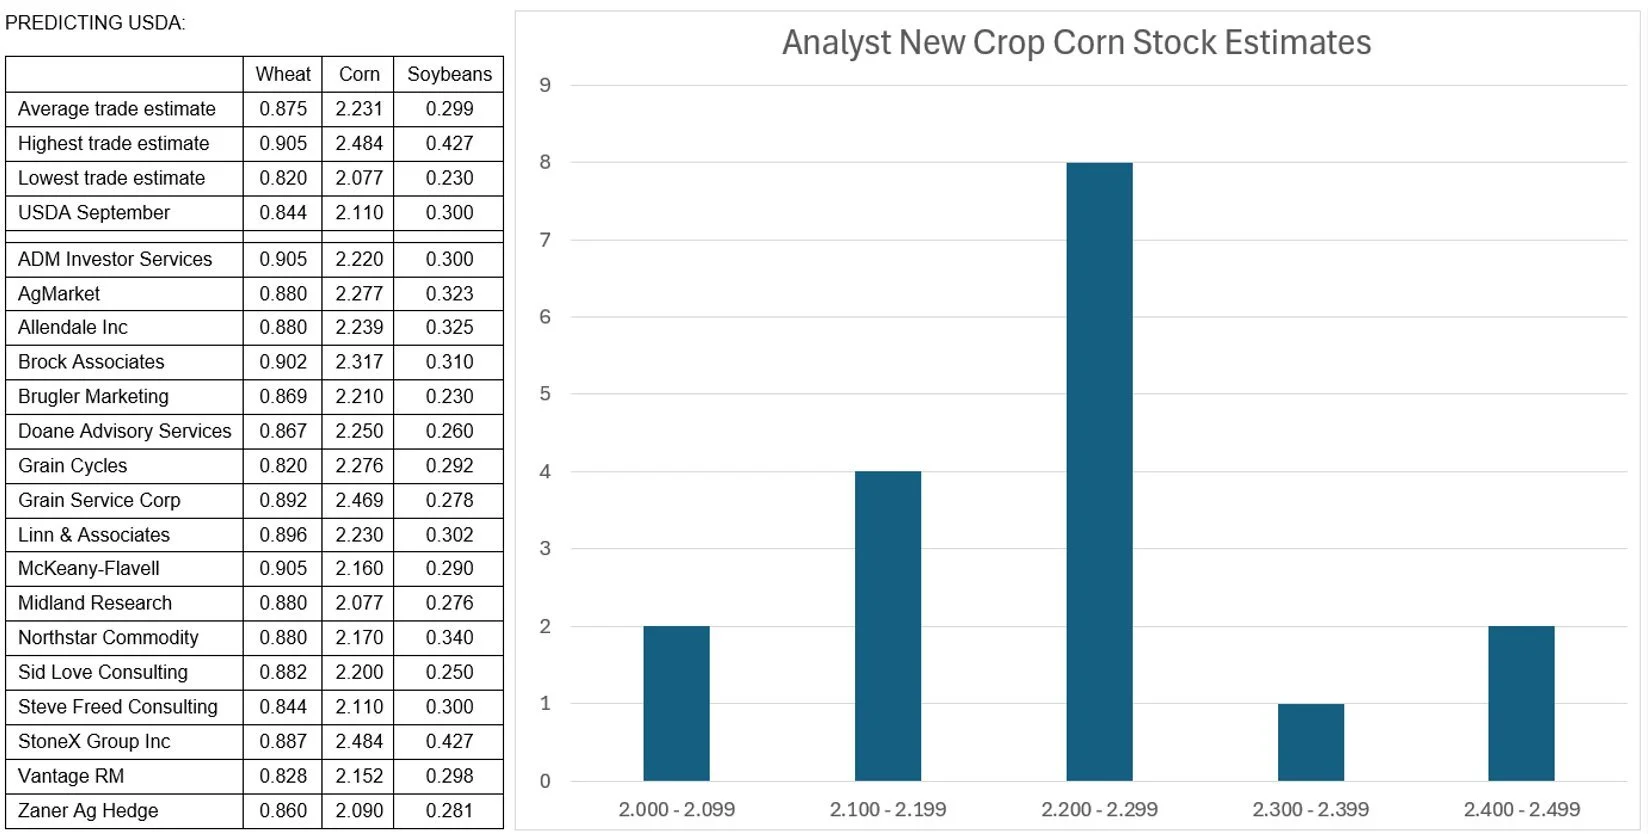
So let's just quick go over what the analysts were expecting the USDA to say.
I showed these on Tuesday, but wanted to add a little more context. These numbers are not necessarily where they see the crop, it is what they think the USDA is going to say.
Yield
Last month’s yield was 186.7 for corn.
17 of the 18 analysts guessed that yield would be down from last month.
The only one who did not, said it would be left unchanged.
9 of the 18 said it would be less than 185.
9 of the 18 said it would be more than 185.
2 of the 18 said it would be less than 184.
For an average guess of 185.
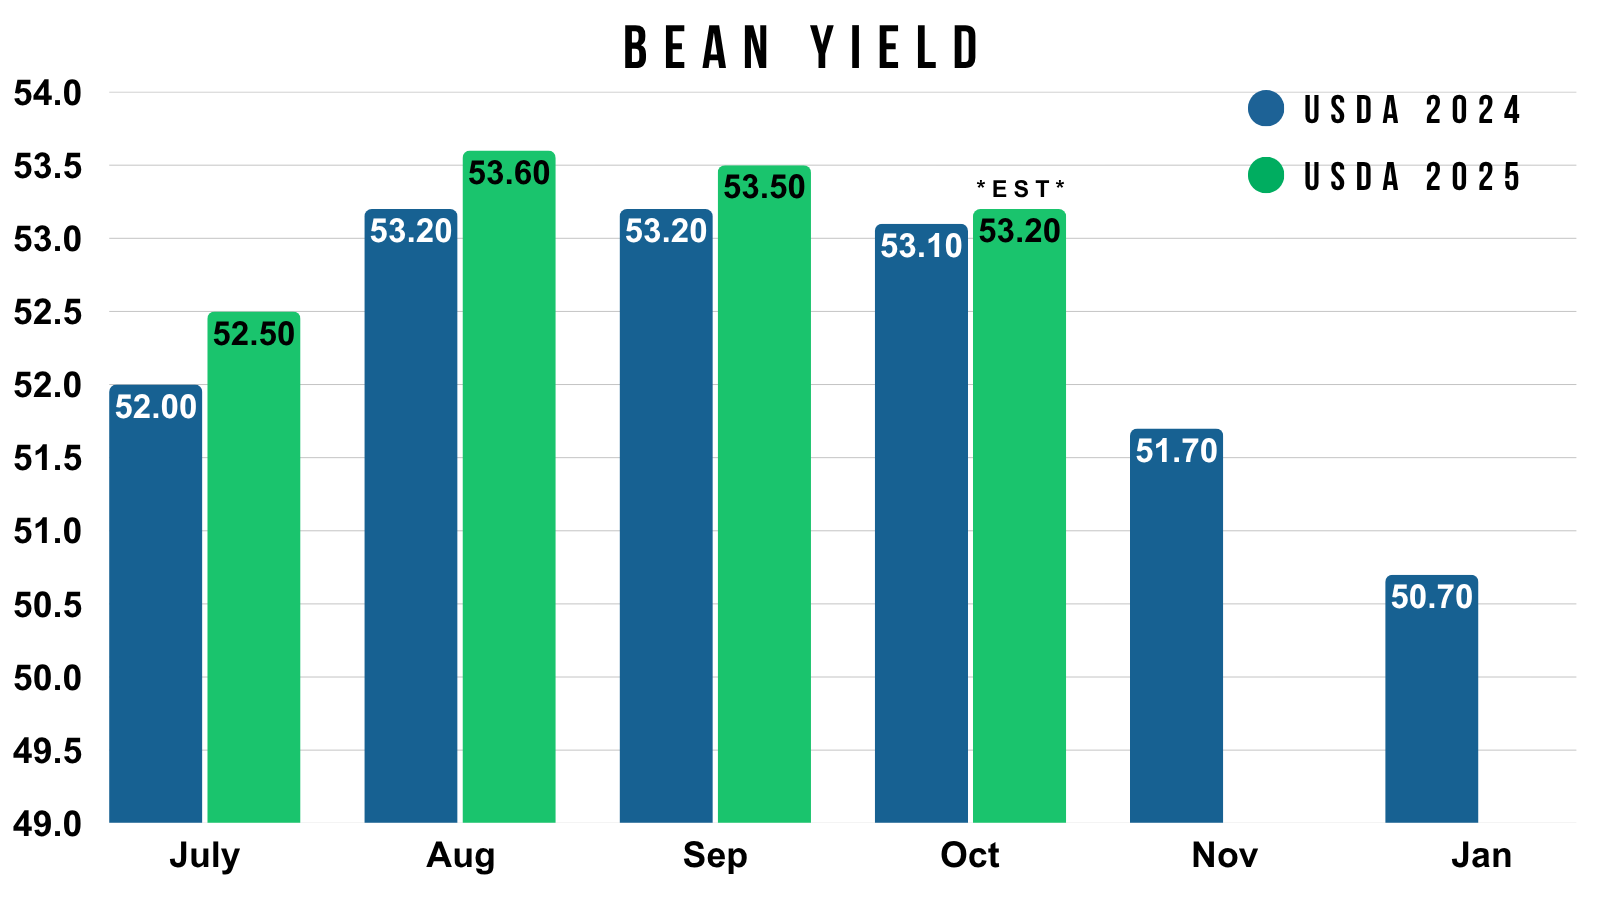
Soybeans are little different story. Despite the dry finish, analysts haven’t budged on their numbers. They still see yield being 53.2, which is just slightly smaller than last month's 53.5.
Chart from Allendale

Yield 2024 vs 2025
Now let's compare this year to last year.
Here is the USDA's estimates for this year and last year.
Last year, the USDA had a 183.8 yield in the October report.
We ended at a 179.3 come January.
In August, this crop was projected far bigger than last year. But now in October, that margin is noticeably smaller.
We've had a similarly dry finish to this year like we saw last year.
Just for an example, last year the USDA dropped yield by -4.5 bpa from October to January.
If we saw that same decline this year, it would peg yield at 180.5. Bigger than last year, but certainty well below 185.

Last October, the USDA pegged soybean yield at 53.1
Which is very close to this year's analysts' estimates of 53.2
Last year yield dropped to 50.7 come January.
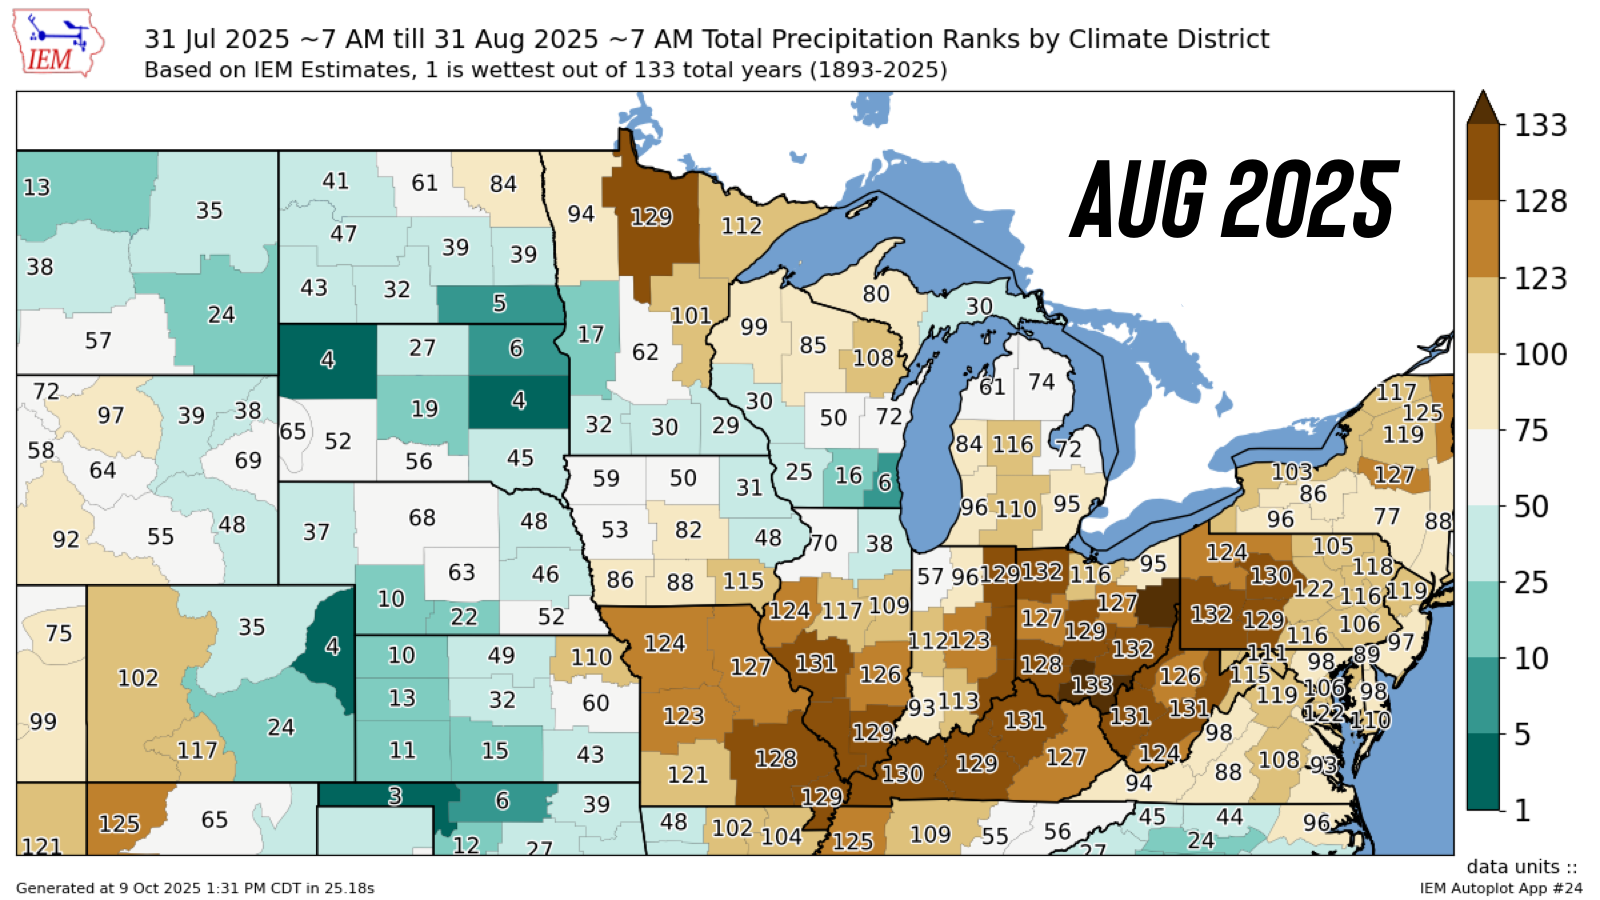
Dry Finish 2024 vs 2025
Both this year and last year featured a dry finish.
But just how similar or different were the dry finishes?
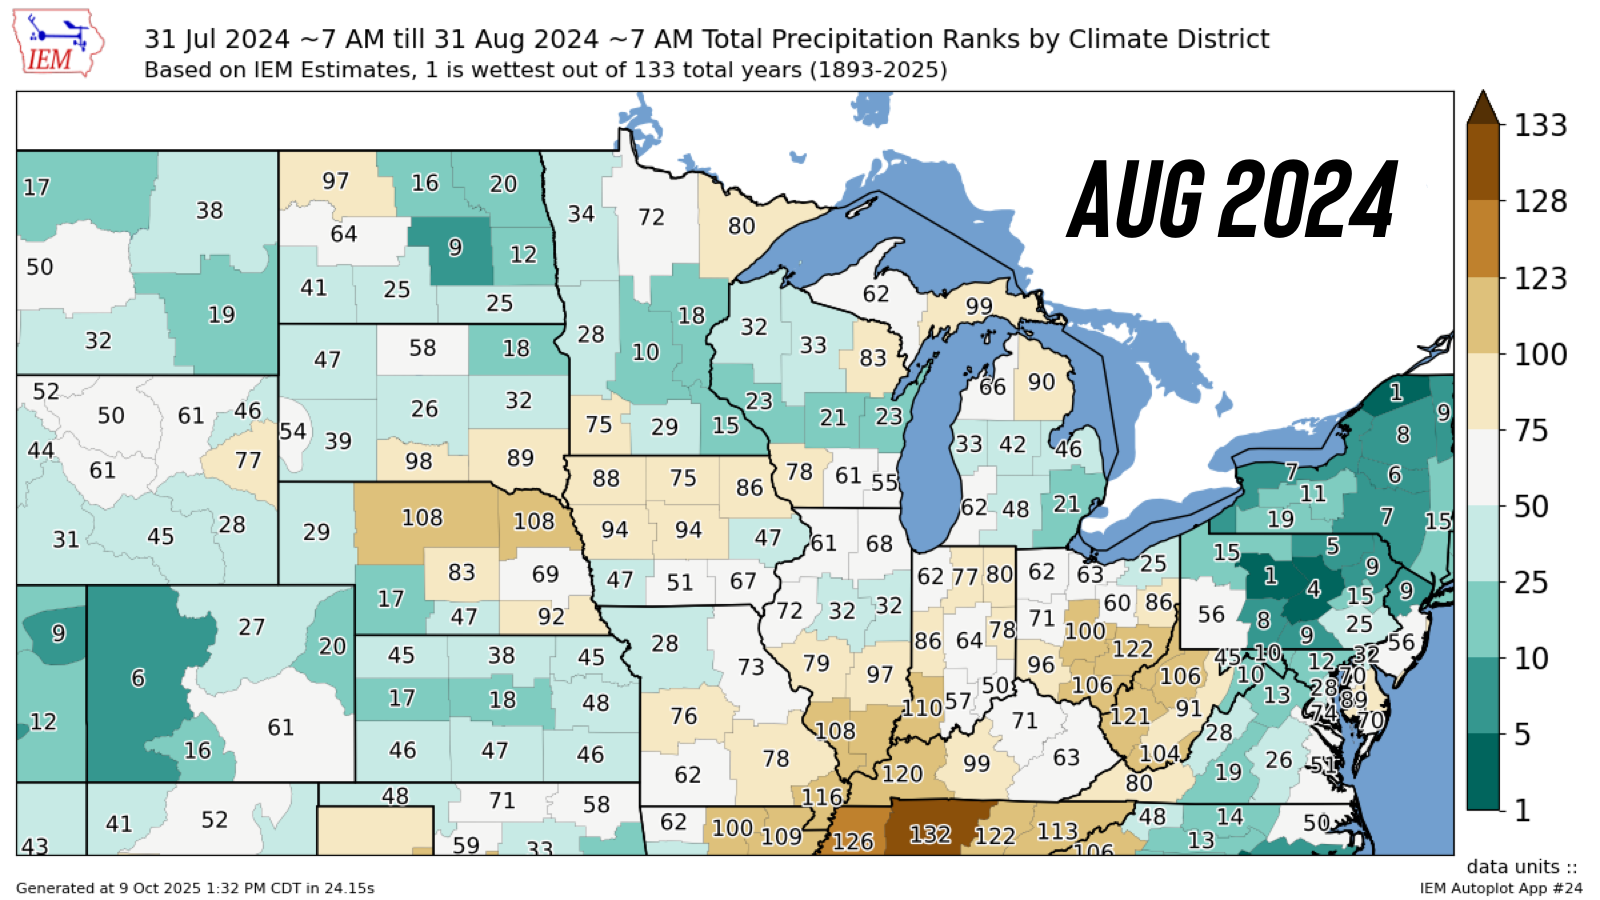
First for August.
2025 was a lot drier especially in the southern and eastern corn belt. Meanwhile, August wasn’t particularly all that dry in 2024.
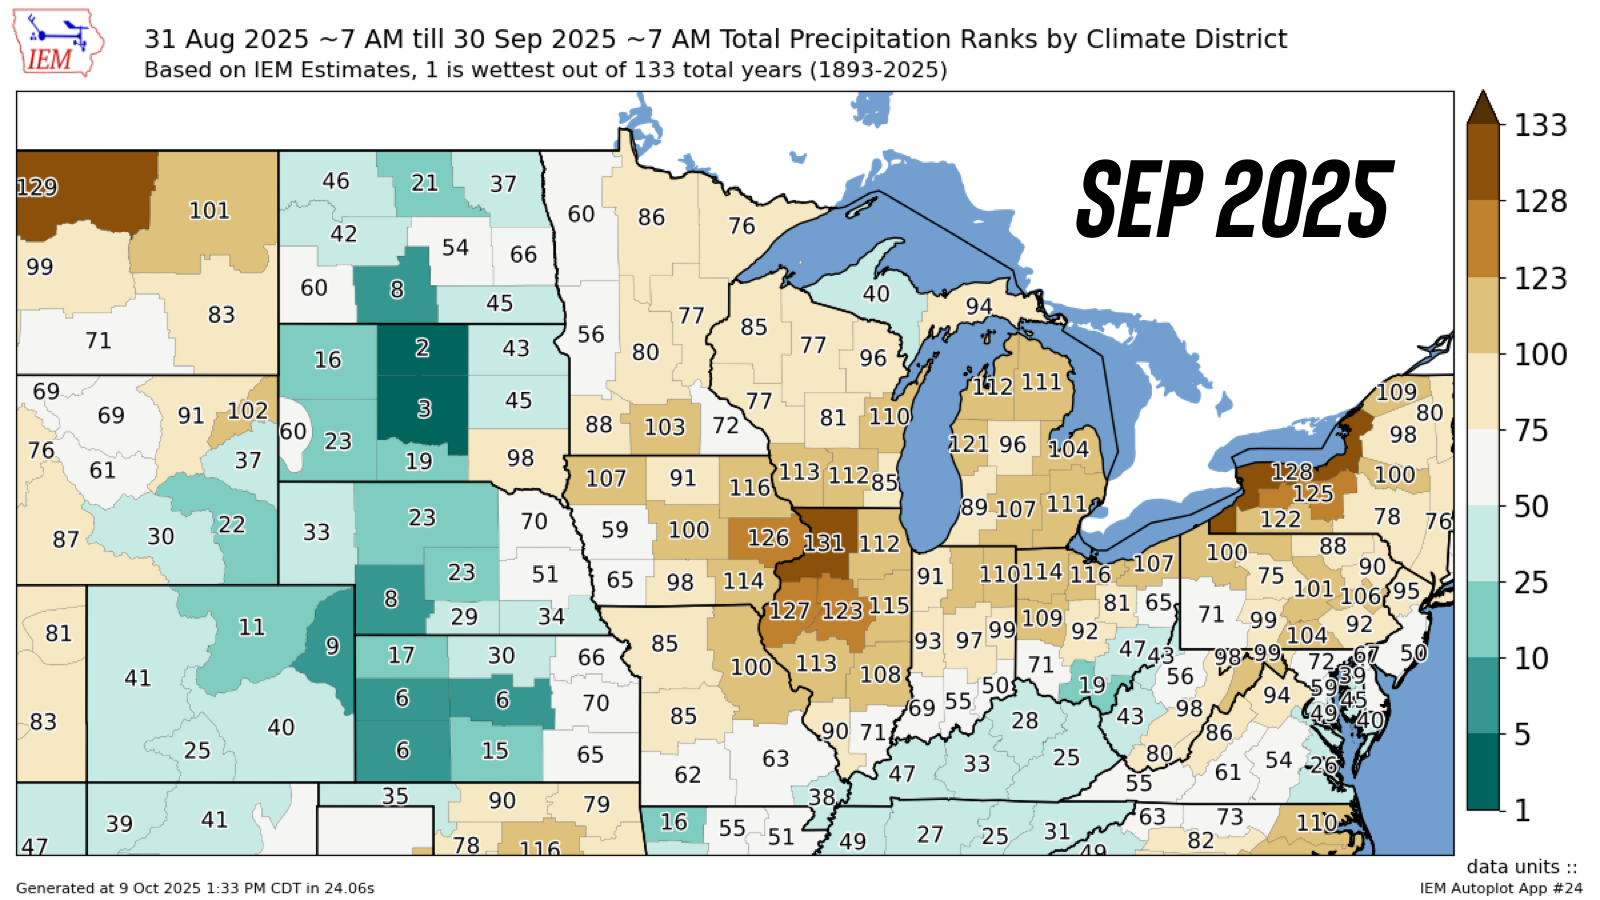
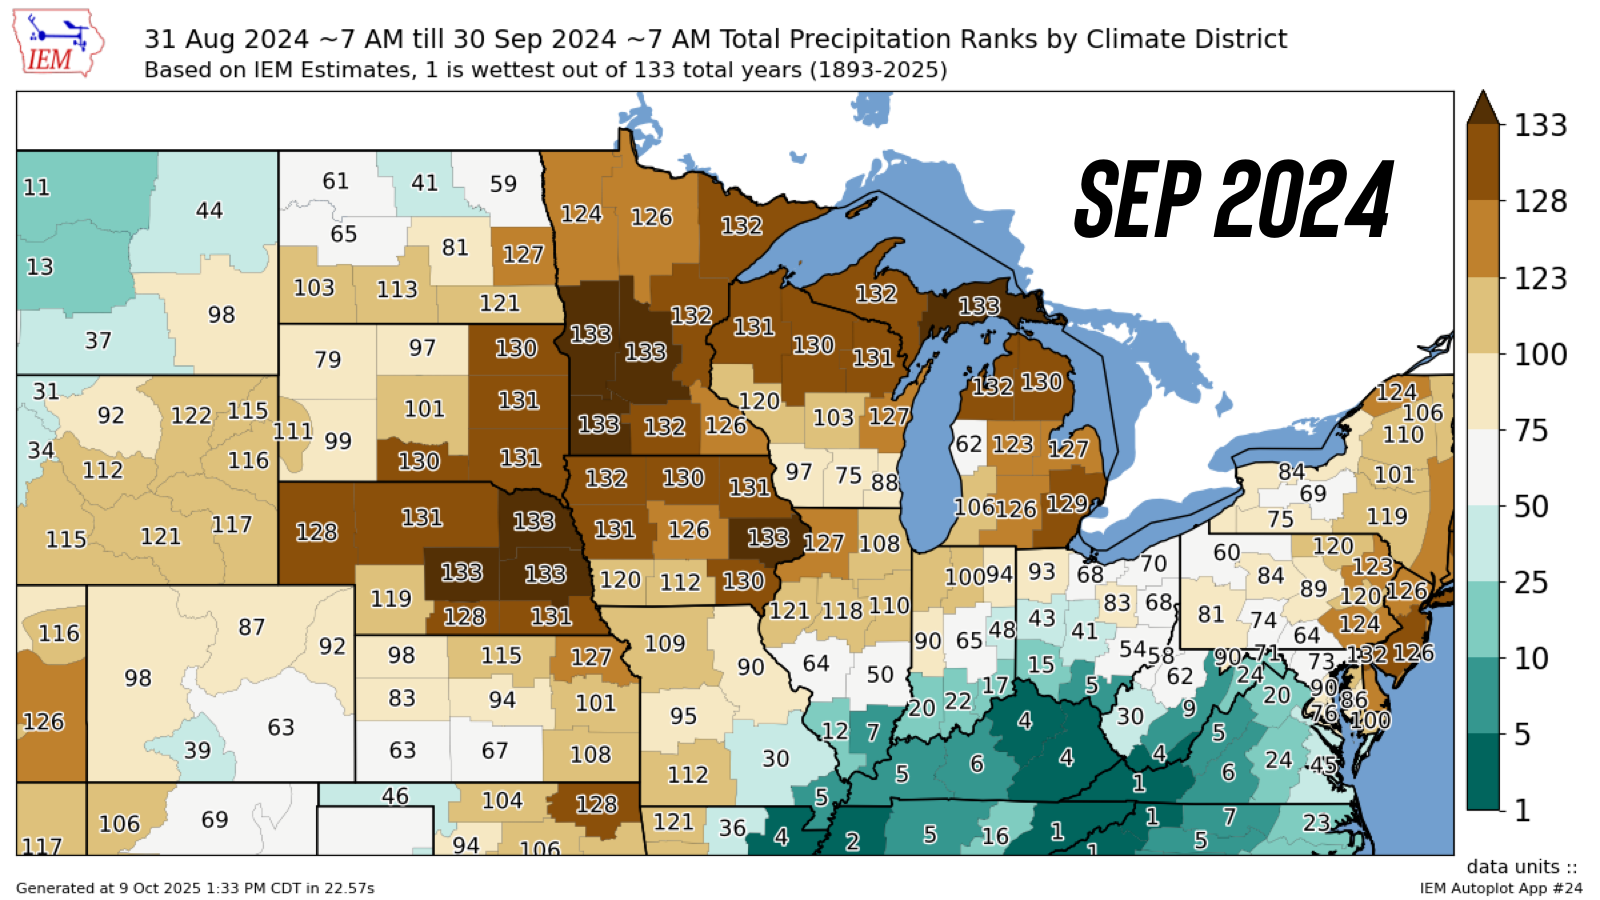
Next for September.
Both were dry. However, 2024 featured some extreme dryness in the western and northern corn belt.
With areas of Iowa, Nebraska, South Dakota, and Minnestoa all seeing one of the driest Septembers of all time.
2025 on the other hand was dry from everywhere west of Iowa, but wasn’t "record" dry.
Unlike in 2024, areas such as South Dakota were very wet in 2025.
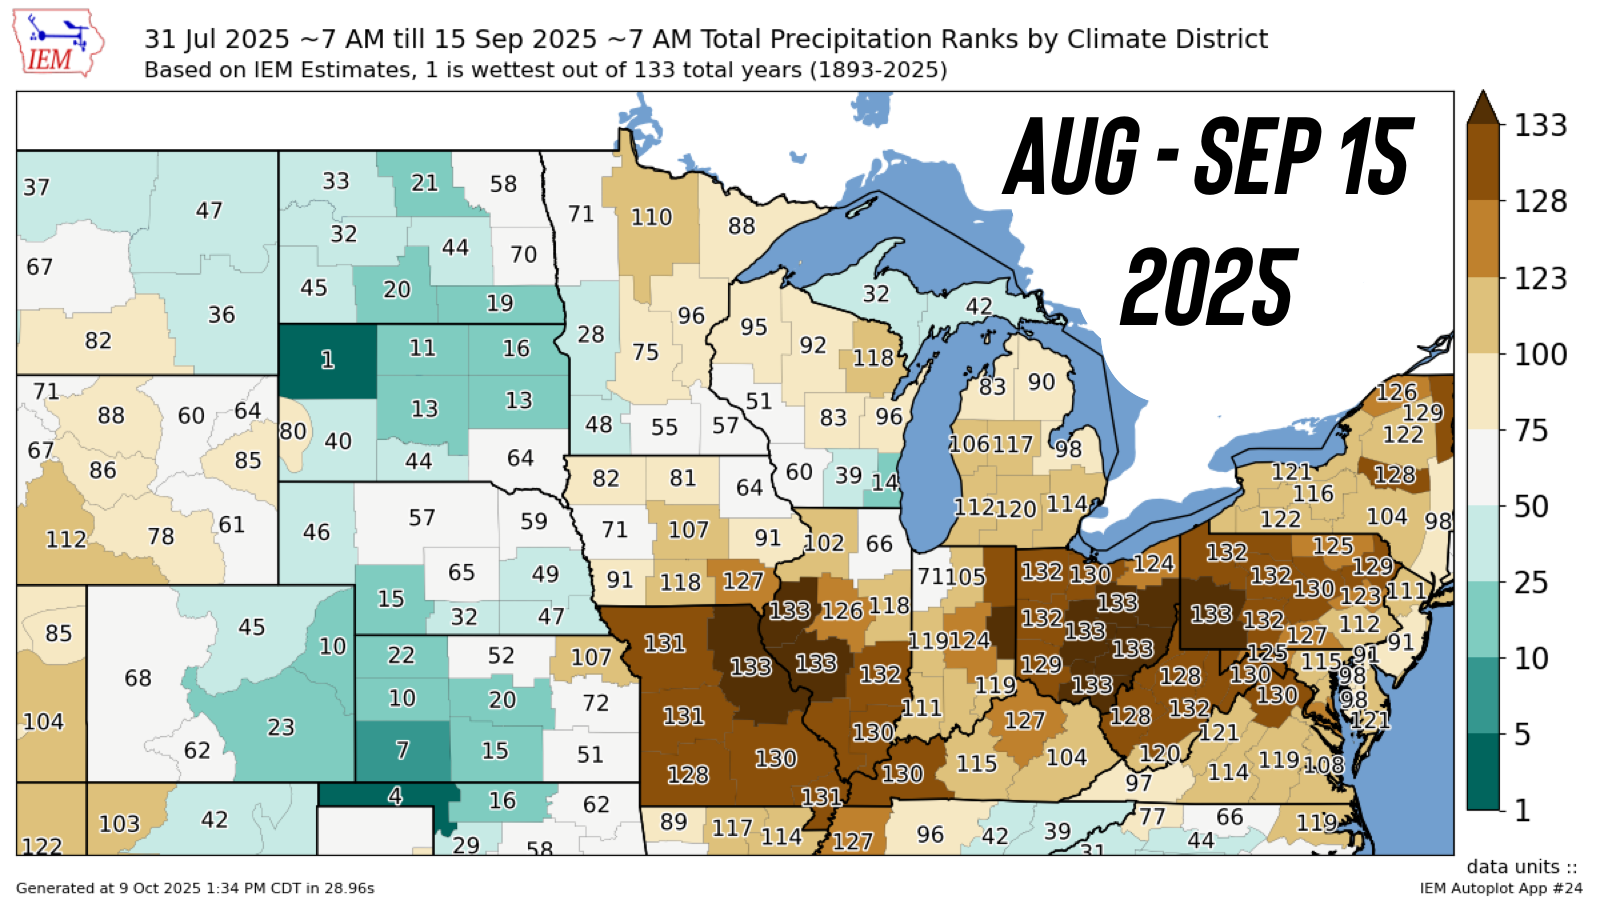
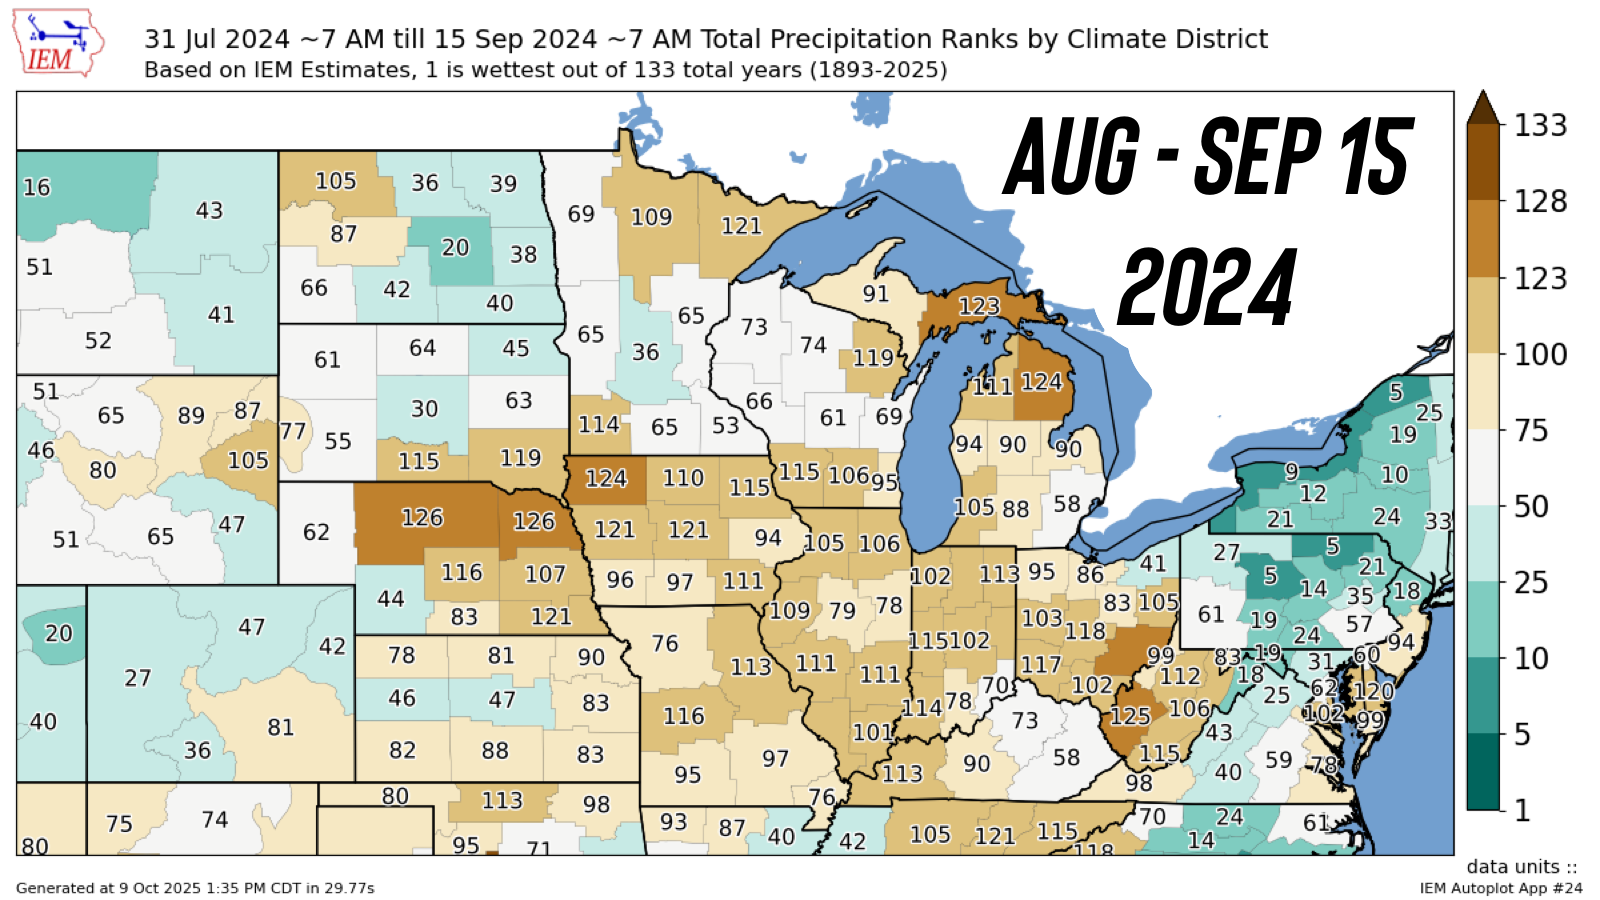
Lastly, here is August 1st through September 15th.
2024 was more widespread dryness.
But for 2025, many of the areas that were dry experienced record dryness.
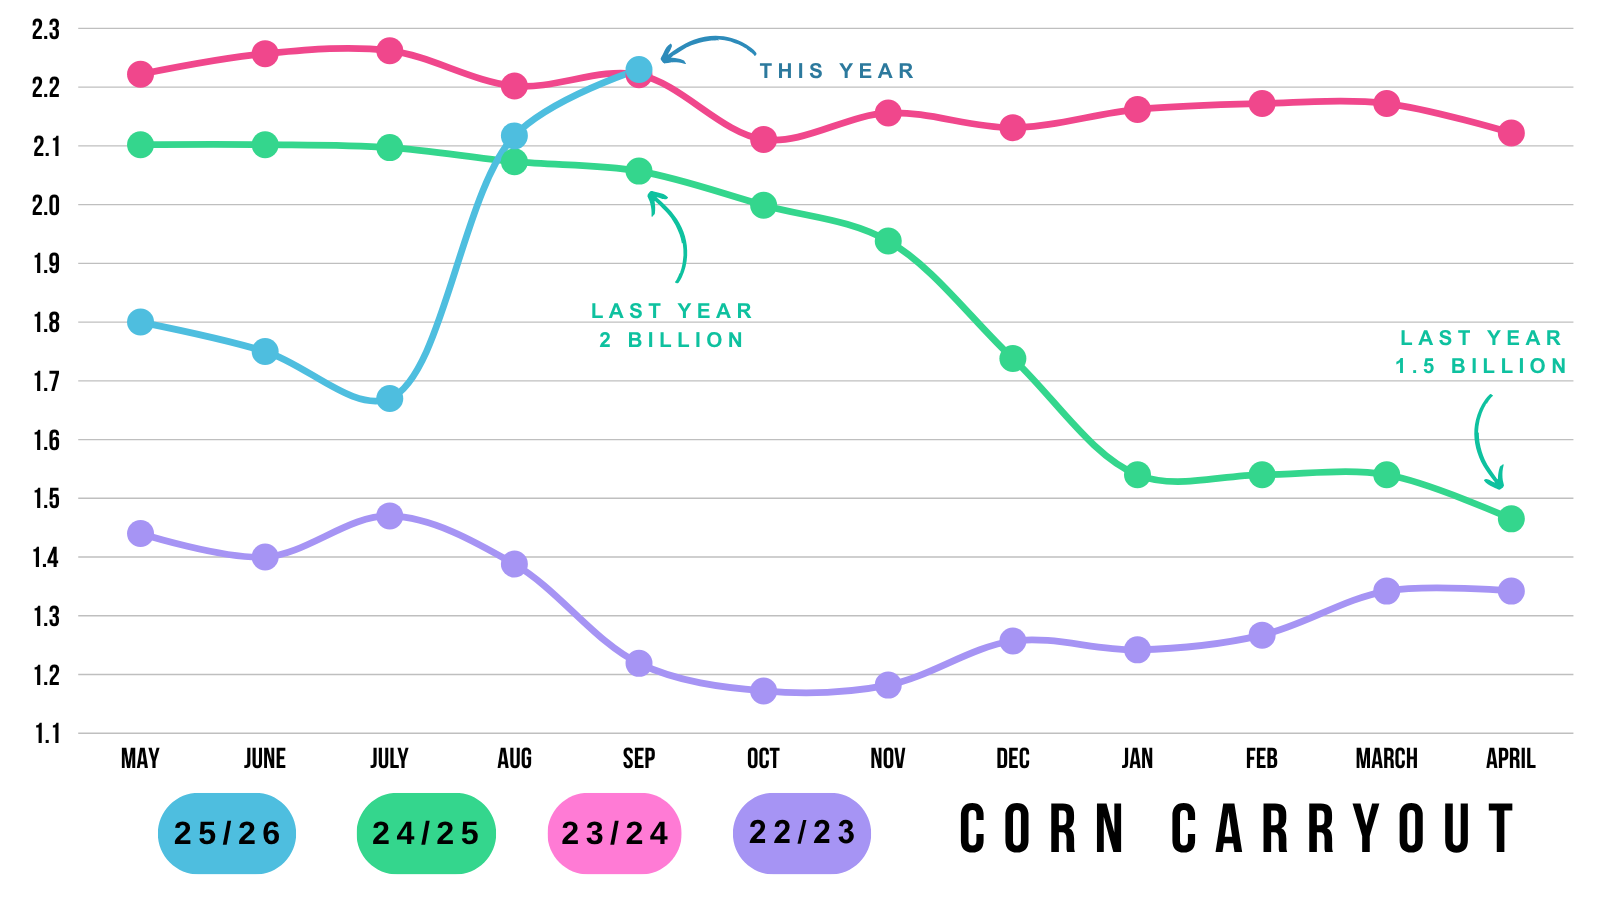
Carryout
Jumping back over to the USDA analyst estimates.
Corn Carryout: 2.231 (2.110 in Sep)
Bean Carryout: 0.299 (0.300 in Sep)
Wheat Carryout: 0.875 (0.844 in Sep)
Even though yield was expected to come down, corn carryout is expected to go up by a little more than +100 million bushels.
This is because in the quarterly stocks report, when the USDA dropped our old crop feed demand by -200 million. That extra 200 million was automatically carried over to the new crop balance sheet.
Soybean carryout was unchanged, so analysts weren’t expecting the USDA to cut into the export numbers yet.
Chart from Allendale
If you want to compare where this 2.23 billion bushels would rank vs other years.
It would be the highest since the trade war.
Last October, our carryout was 2.0 billion.
It ended up at 1.53 billion.
Today's Main Takeaways
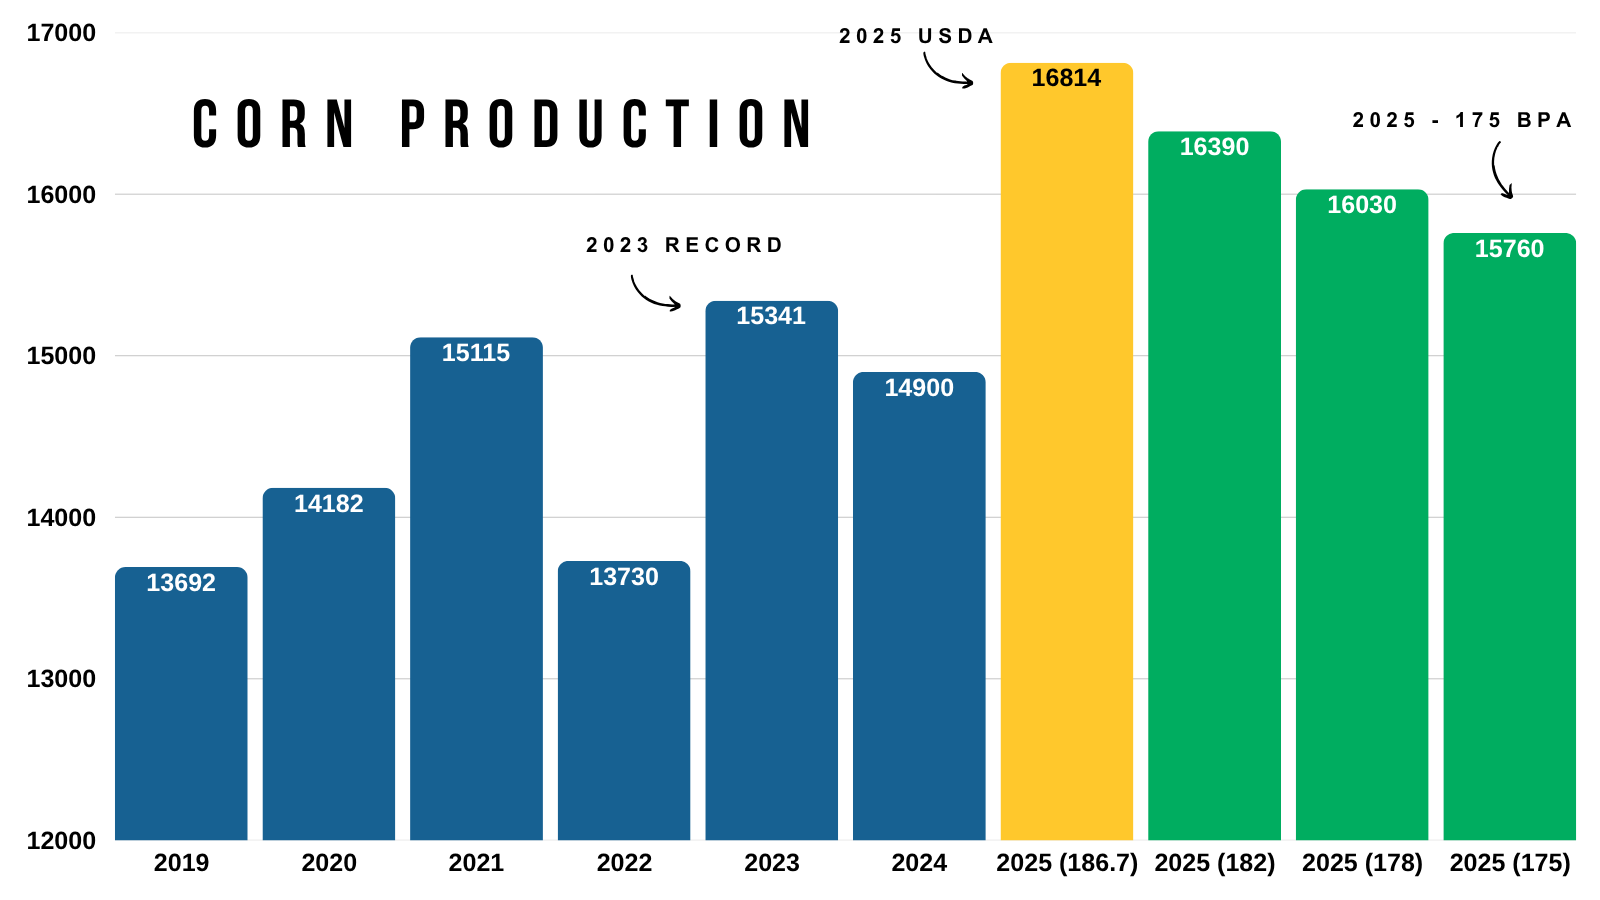
Corn
Fundamentals:
On one hand, it is hard to get overly bullish the corn market.
We have record acres.
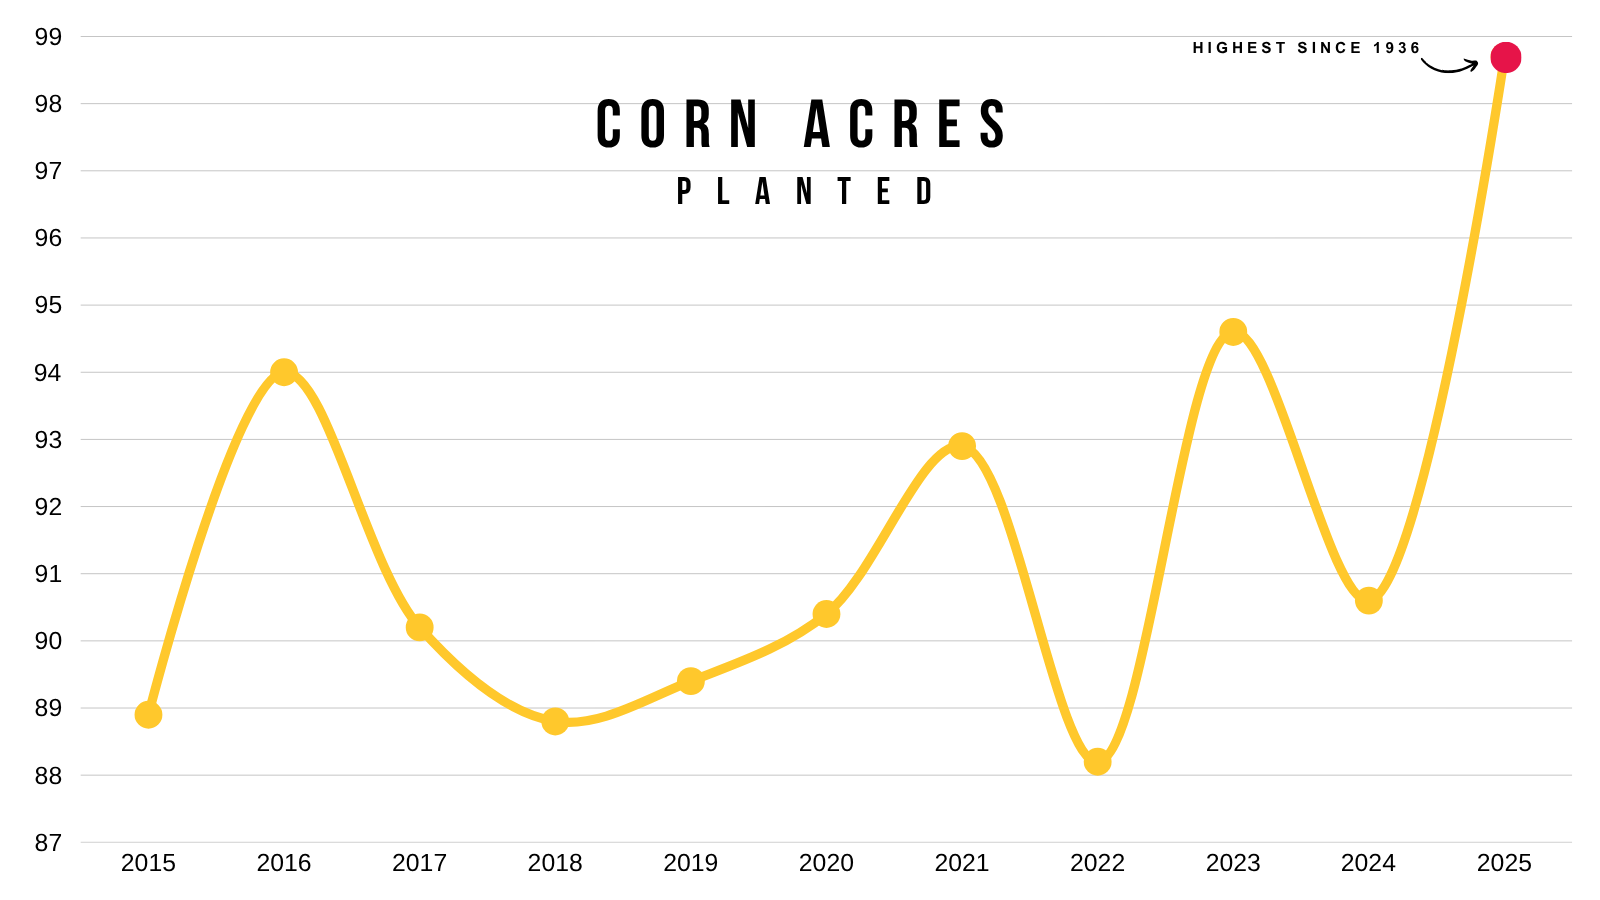
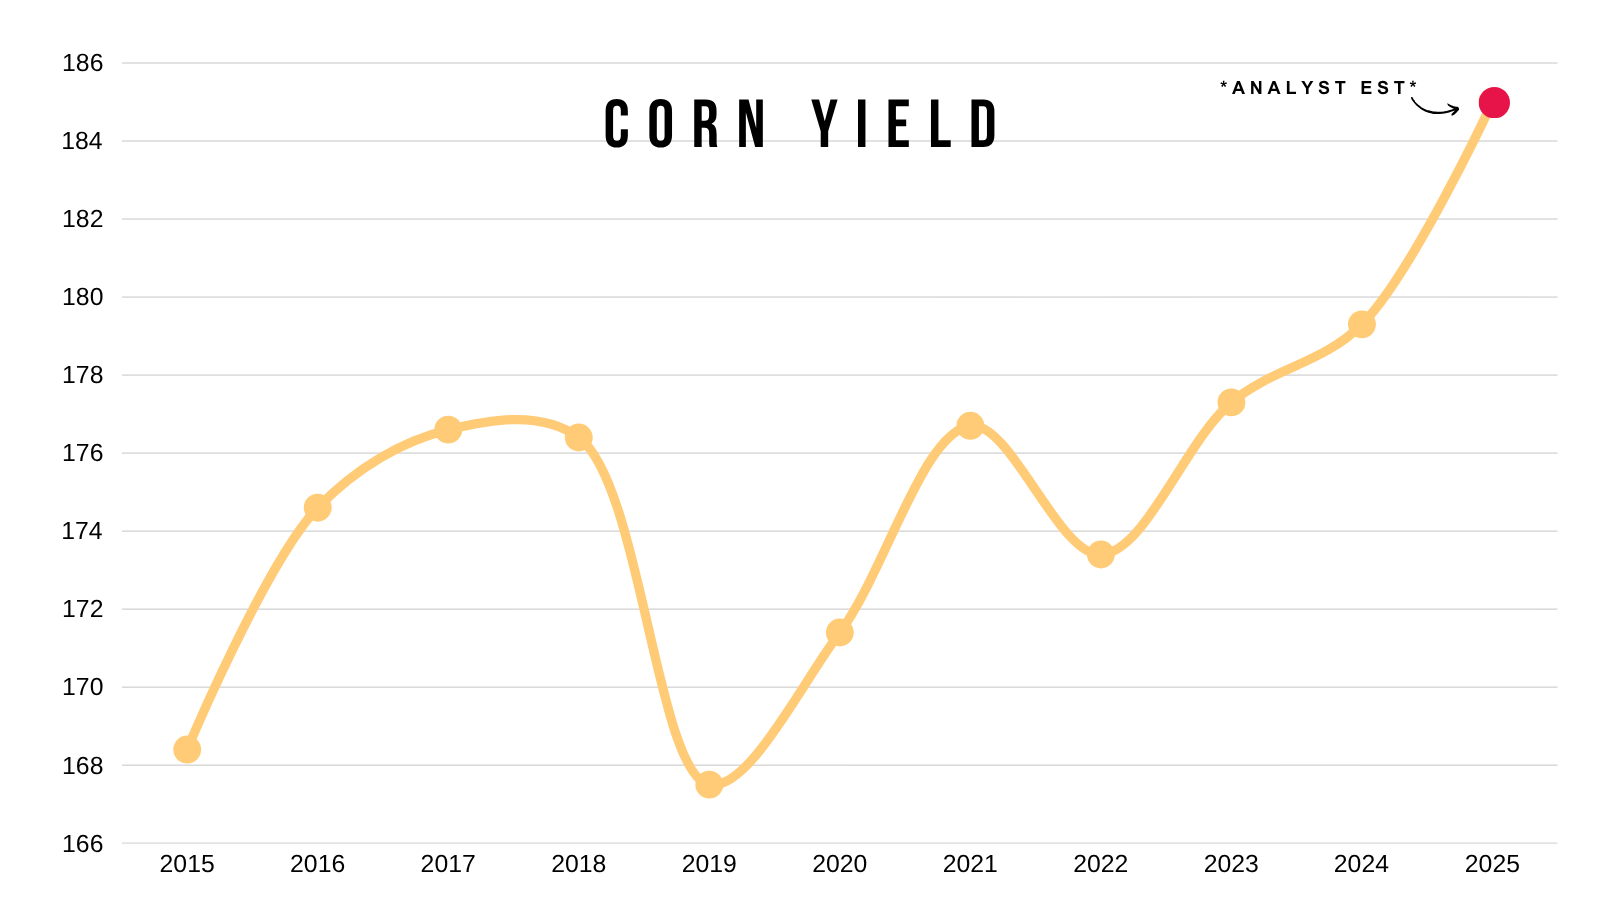
Yield is projected to be a record.
+6 bushels higher than last year's record.
Record yield and acres result in record production.
I'm talking over +1 billion bushels higher than the previous record.
Even if yield fell to 175, it would still be a record.
However, the market has already digested a lot of this.
There is a reason we tanked this summer.
The market was looking at a near 189 yield and record acres.
We still have record acres, but yield is closer to 180 than 190 now.
I mean earlier this year when we posted those harvest lows was about as bearish of a scenario you could possibly paint in the corn market.
The day the USDA added +1 billion bushels of supply to the balance sheet via extra acres, marked the exact bottom in this market and we've traded higher since.
Do I think corn is magically going to rally to $5.00 relatively soon?
No of course not. At the same time I can’t get overly bearish knowing we've already priced in some of the most bearish scenarios.
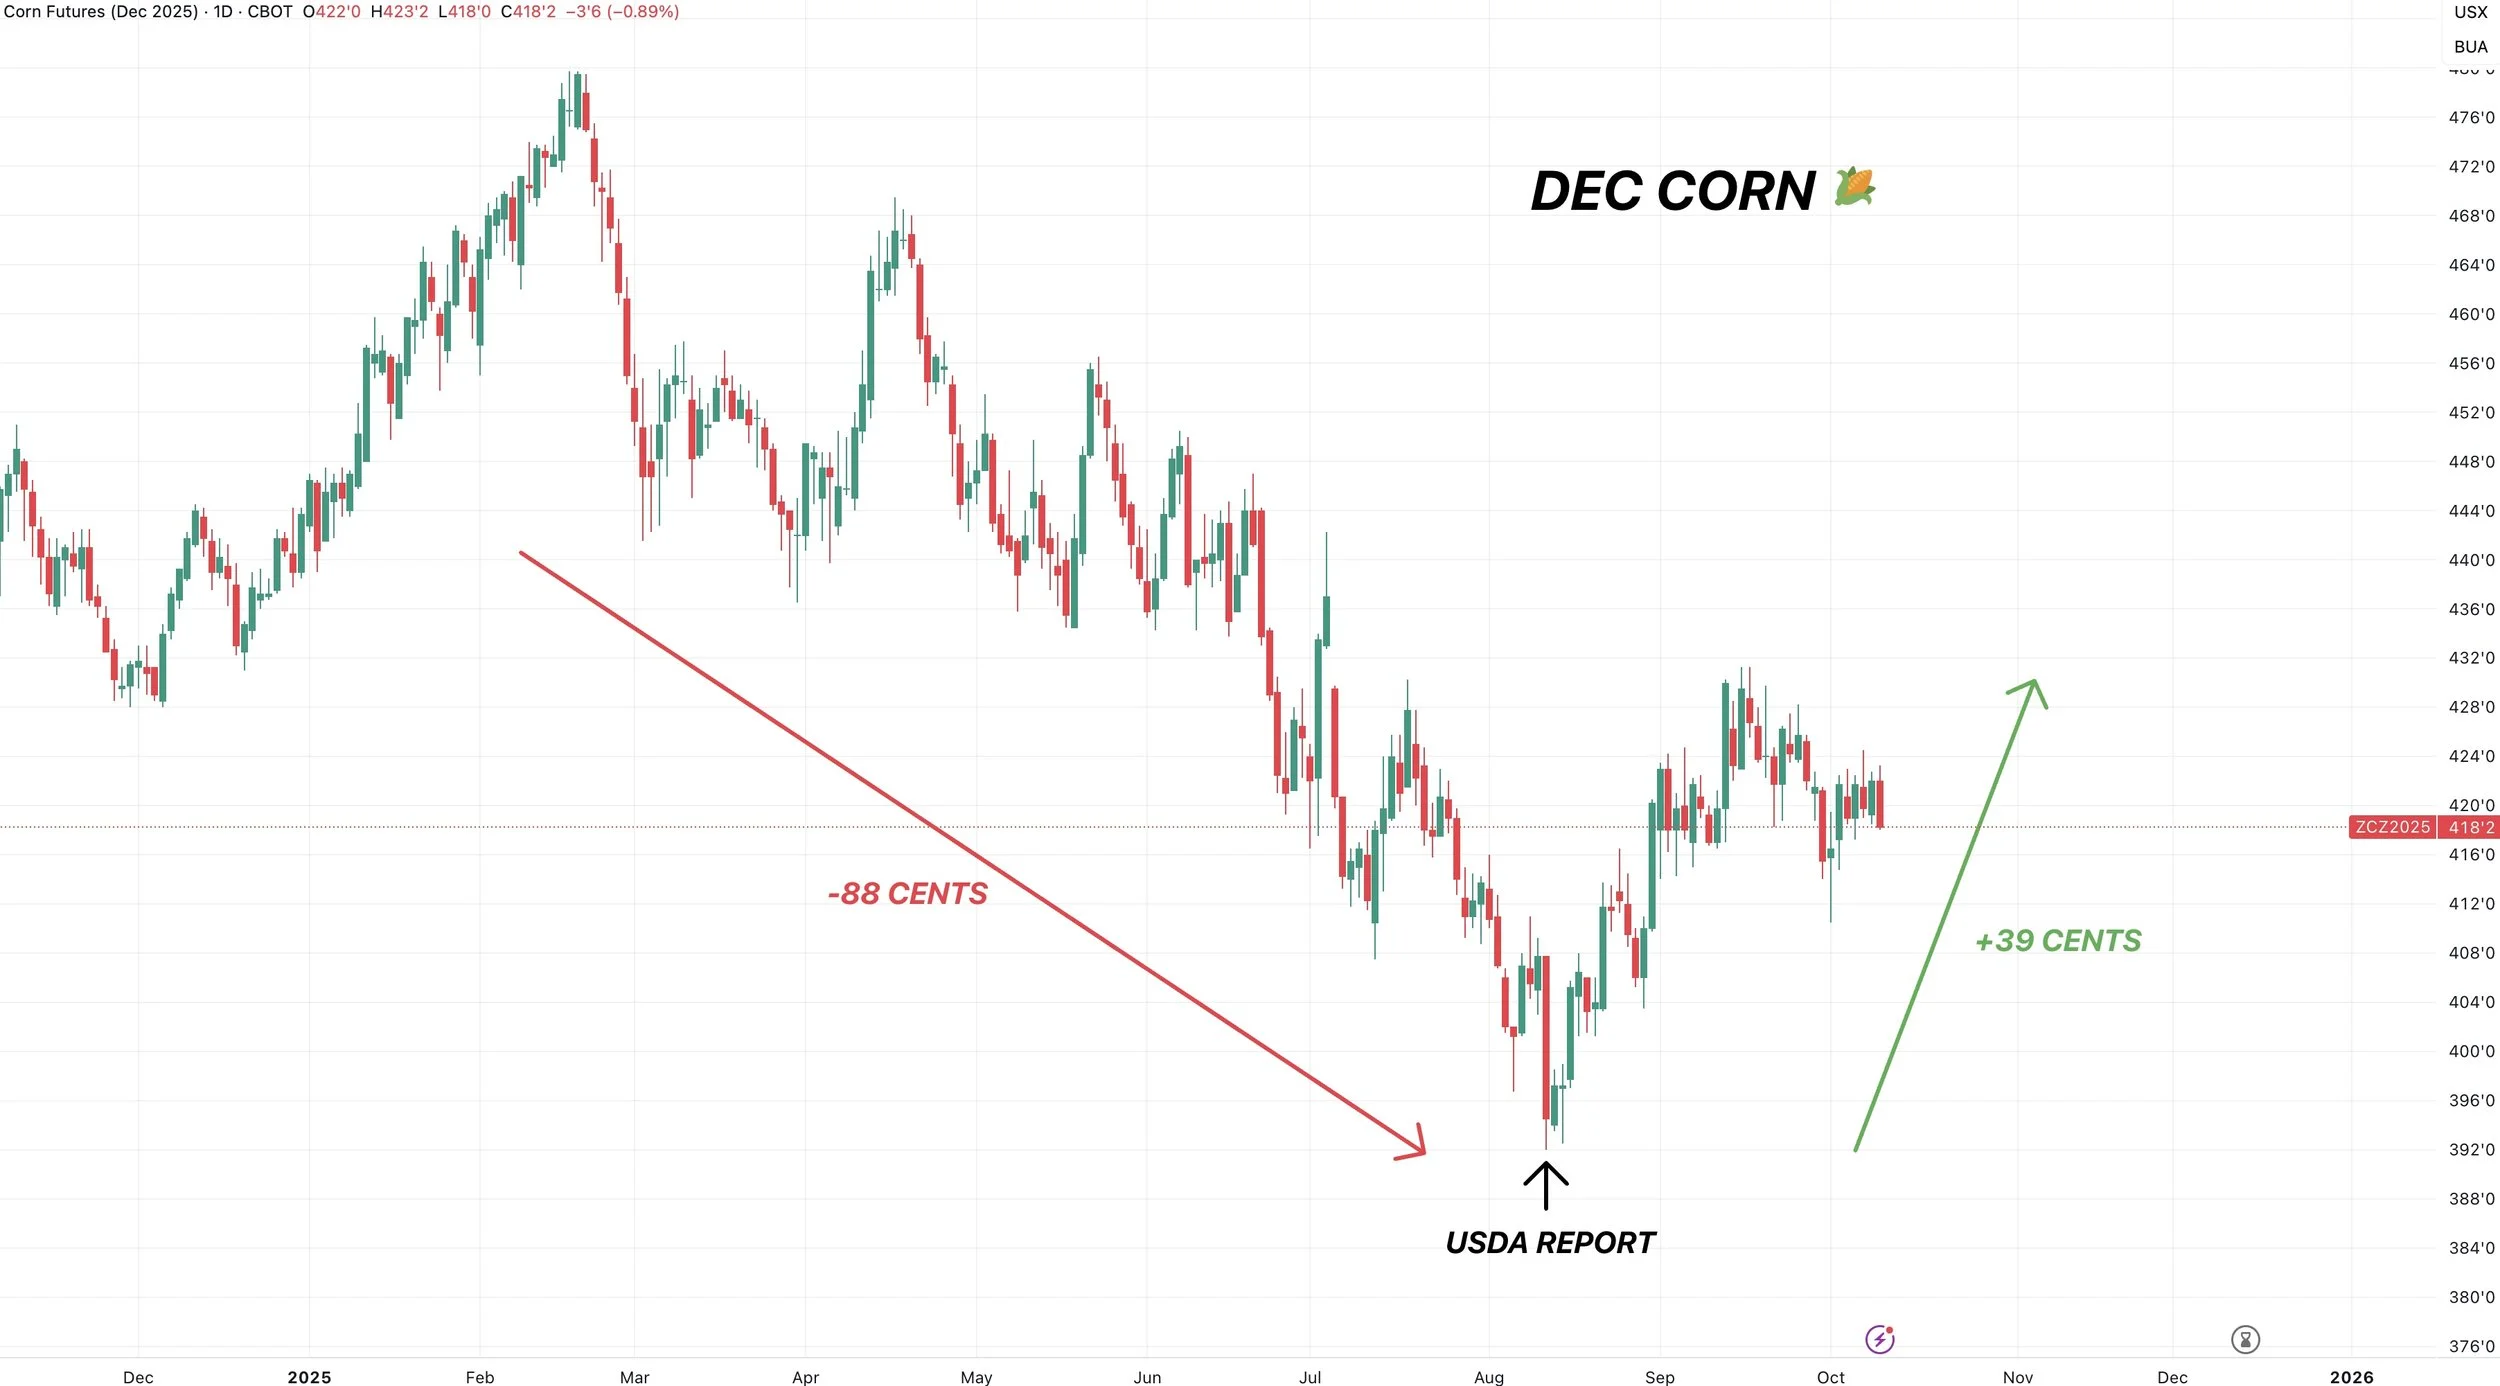
This corn market has battled bearish surprise after bearish surprise and is still +30 cents off the harvest lows.
I still think those harvest lows will be the lowest prices we'll see.
Yield is getting smaller from here.
We have a demand monster offsetting that record production.
Despite the demand monster, the ample supply will keep a lid on this market. But the record demand should keep a floor.
Ultimately, we could see this market trend sideways for the time being. But we'll be prepared when the market offers an opportunity.
Technicals:
Dec corn still battling this downtrend resistance.
The must hold spot is the 50-61.8% retracement of the entire rally off contract lows. Which we have already bounced off of once.
We've traded essentially sideways all week in an extremely small range.
Upside target is still $4.35

Soybeans
Fundamentals:
The most interesting thing about the soybean market the last few days is basis and the spreads.
Basis has been firming in a lot of areas despite the fast paced harvest.
When basis is up sharply before a fast harvest is over, a lot of times something bigger than harvest simply coming to an end is taking place.
Who knows what it is. Usually, basis doesn’t lie.
If we look at the spreads, they are spiking as well.
Now at their narrowest levels since the 4th of July.
Some are speculating that since the government is shutdown, China is buying some of our soybeans under the rug. But we don’t know for sure yet, but seeing basis improve and spreads firming both hint that it’s possible.
They did it during the last shutdown which was also smack dab in the middle of the last trade war.

Could Brazil cover all of China's needs if they don’t want any US soybeans?
Here is a great chart from Susan of NoBull Ag that show cases exports and imports for the US, Brazil, and China.
Last trade war, Brazil could not entirely cover China's needs.
However, right now Brazil's exports are nearly on par with China's imports.
So theoretically, yes Brazil could keep China covered.
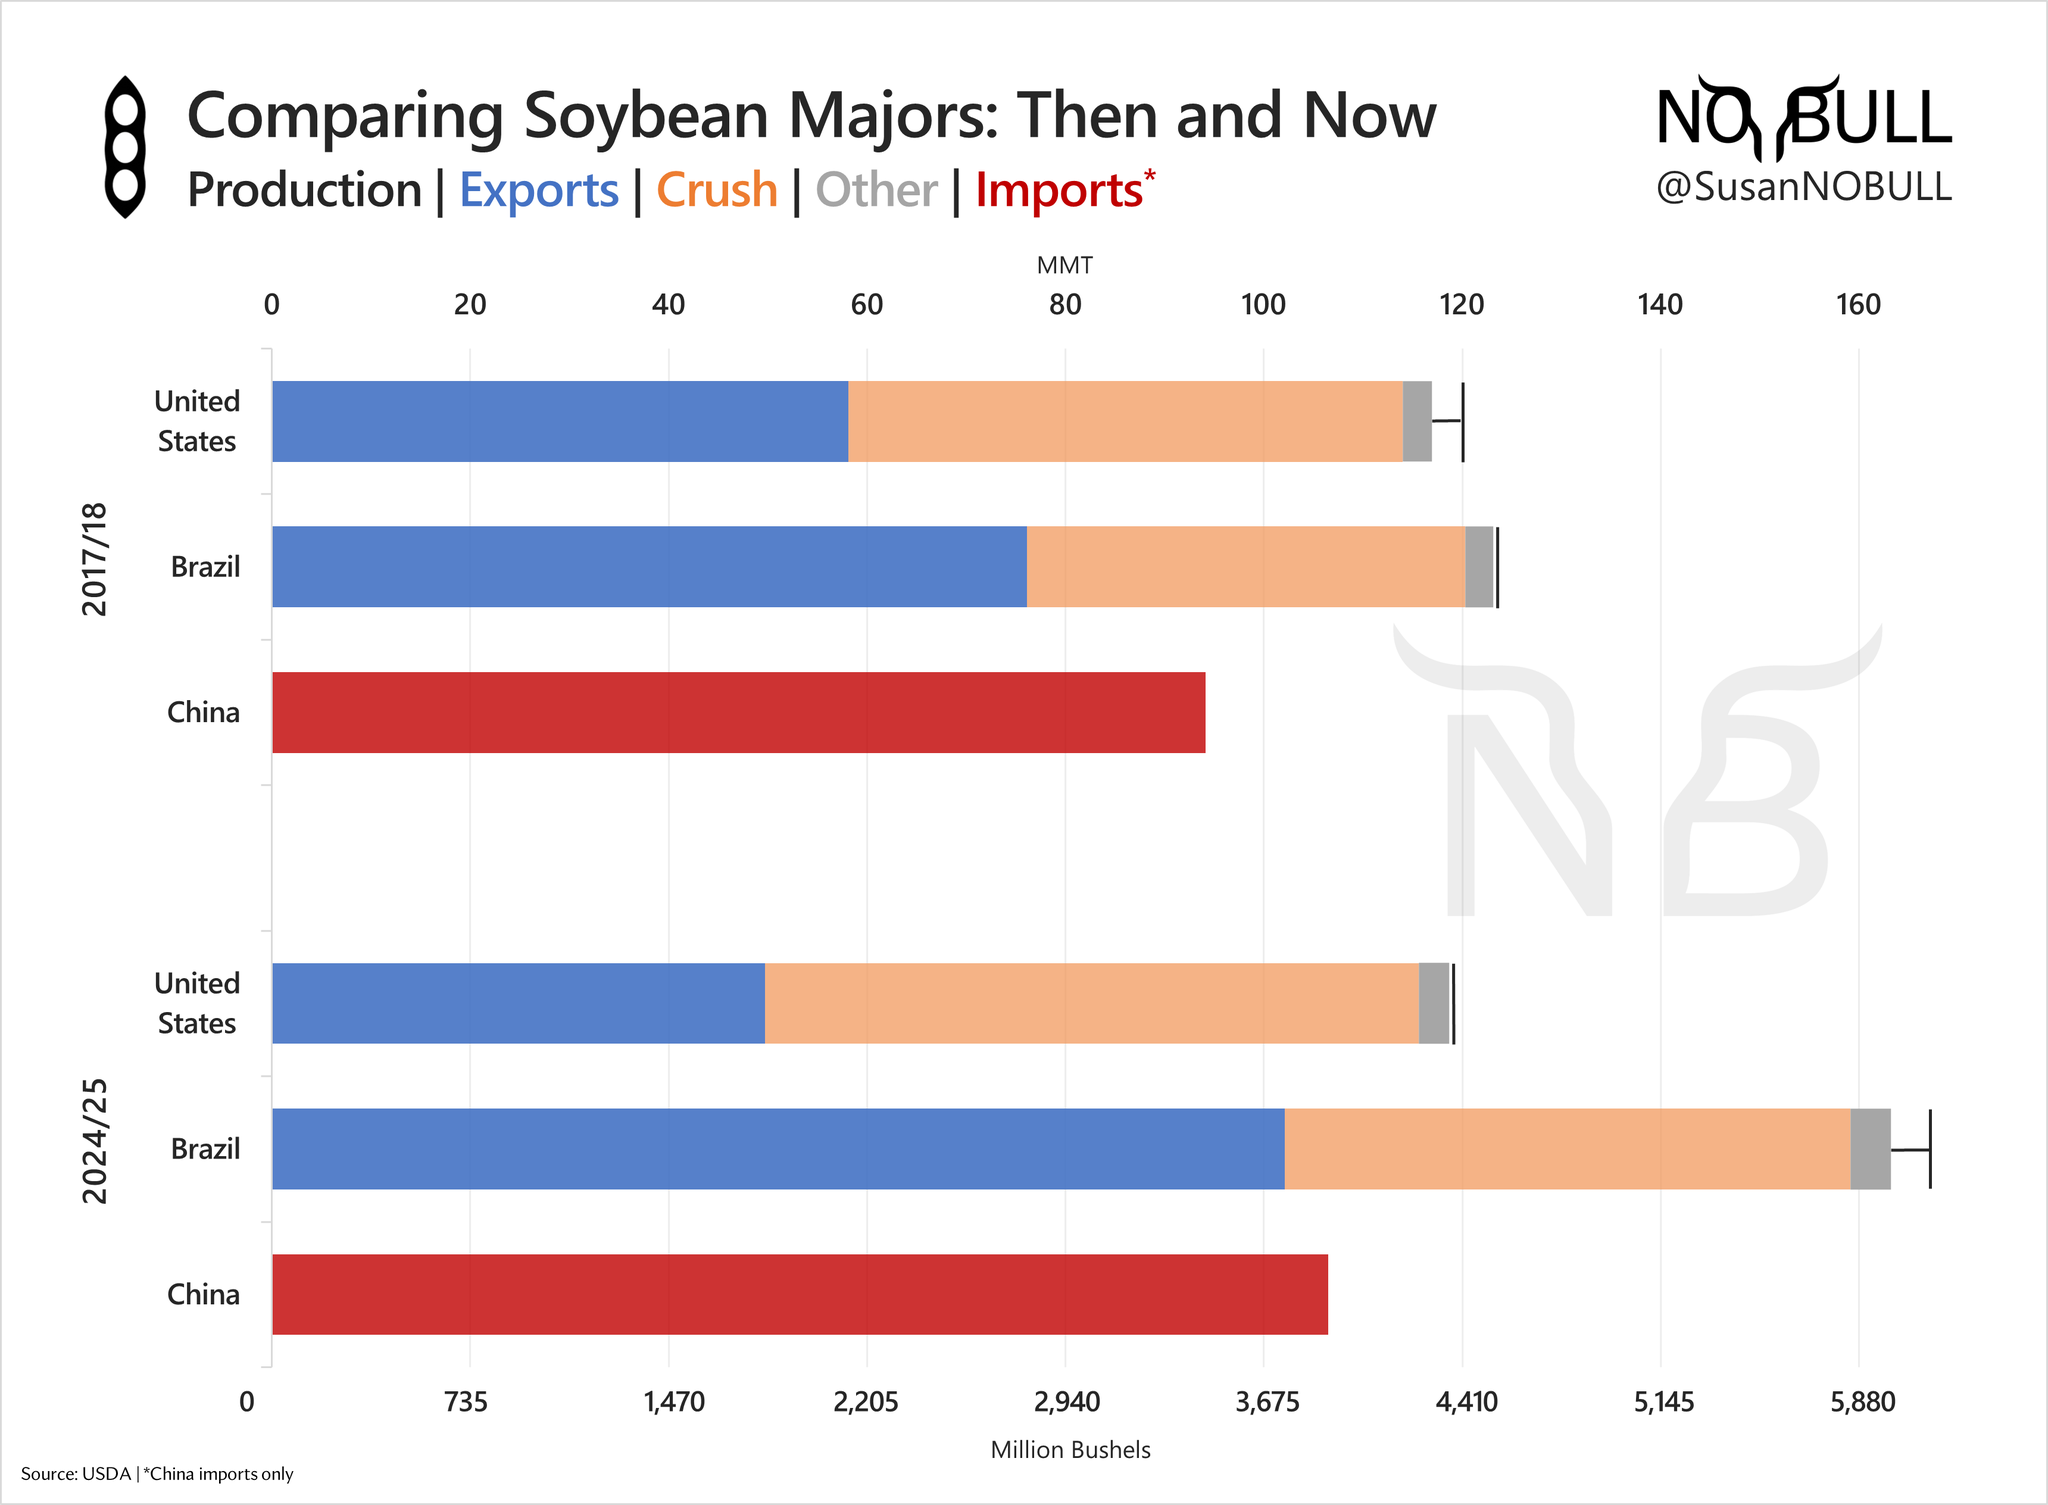
However, you do have to keep in mind that Brazil is coming off of back to back record crops.
What happens when they run into a hiccup?
They wouldn’t be able to keep China covered.
Let's say China wants to only go through Brazil for as long as possible. At some point, when they run into a production issue they'll be forced to come to the US. Whether that happens this year or not, they will run into a scare eventually.
They still have to grow a crop this year.
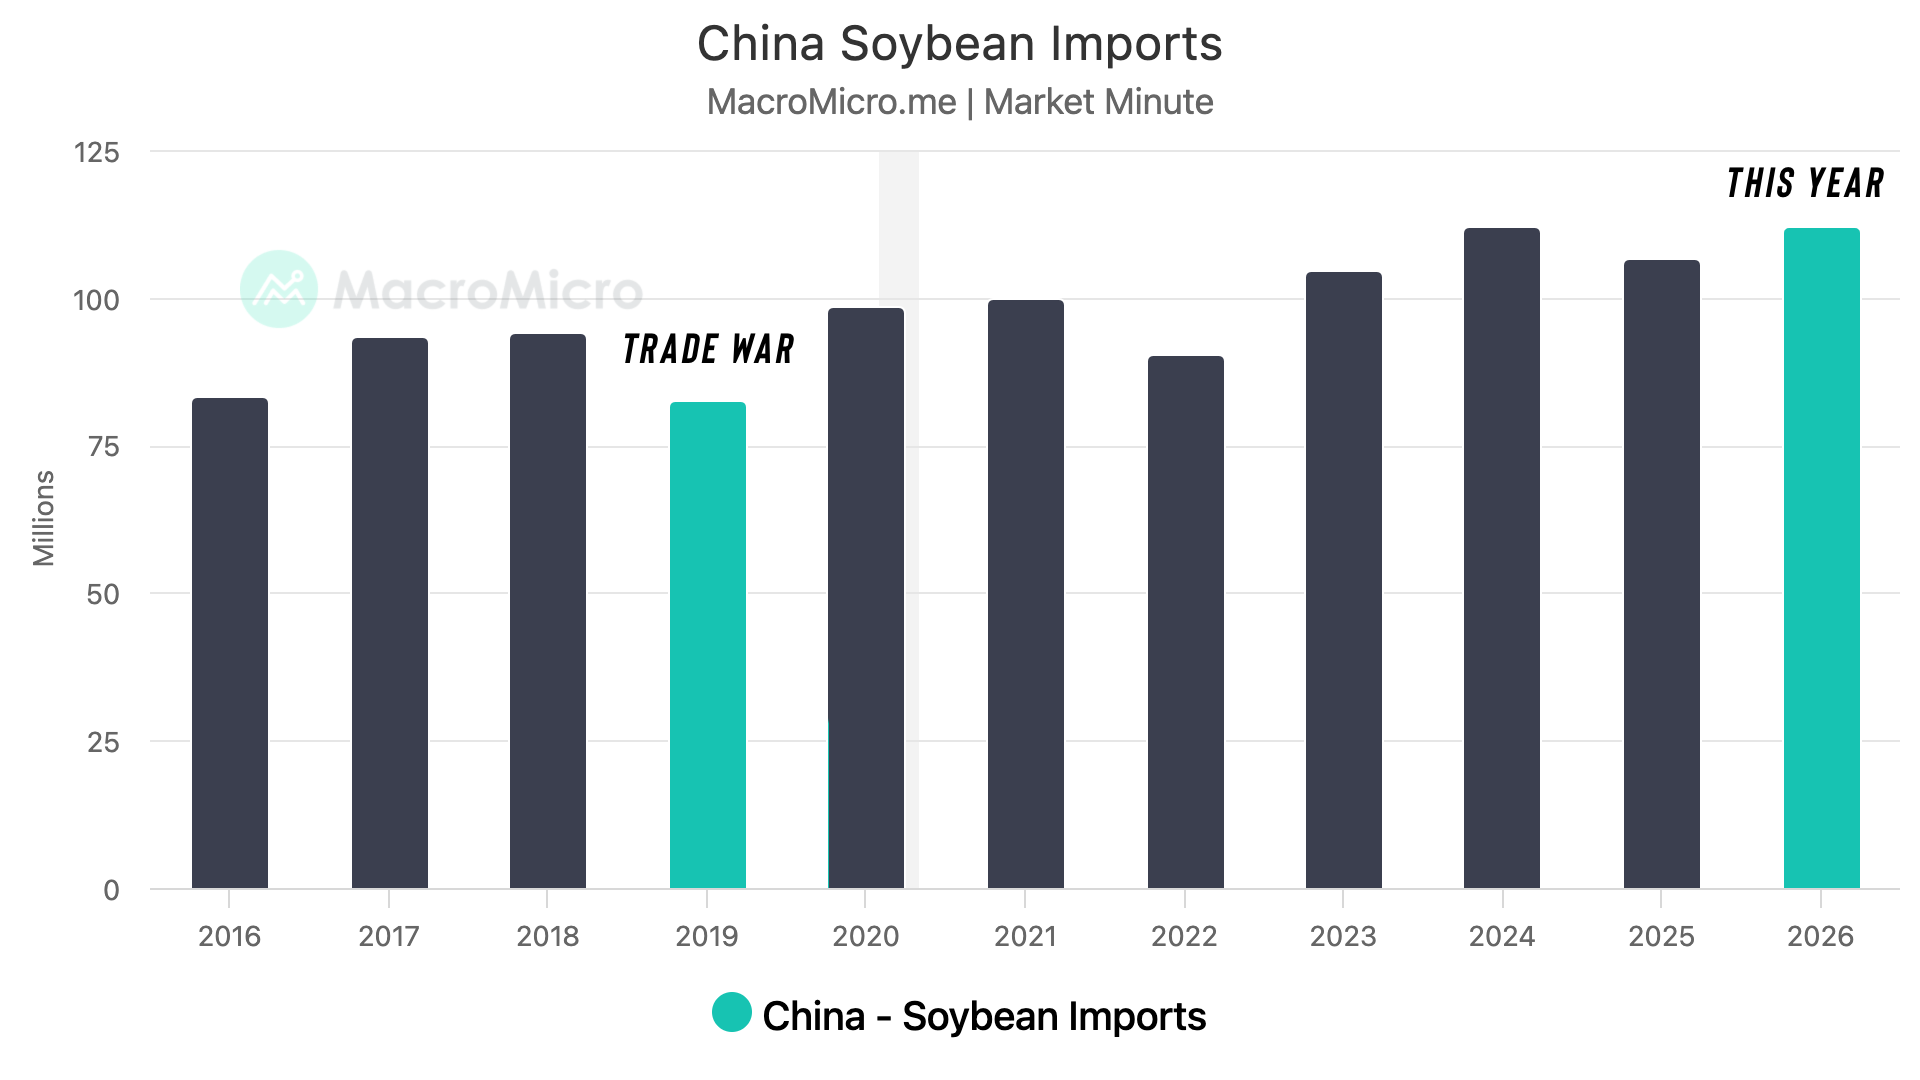
People don’t talk about this enough when comparing this trade war to the last one.
Last time, China was dealing with issues of their own. They had african swin fever that dismantled 40-50% of their hog herd.
As a result, China soybean imports were down hard year over year. Their need for soybeans simply wasn’t there.
Compared to this year, China's soybean imports are record high. So they need soybeans.
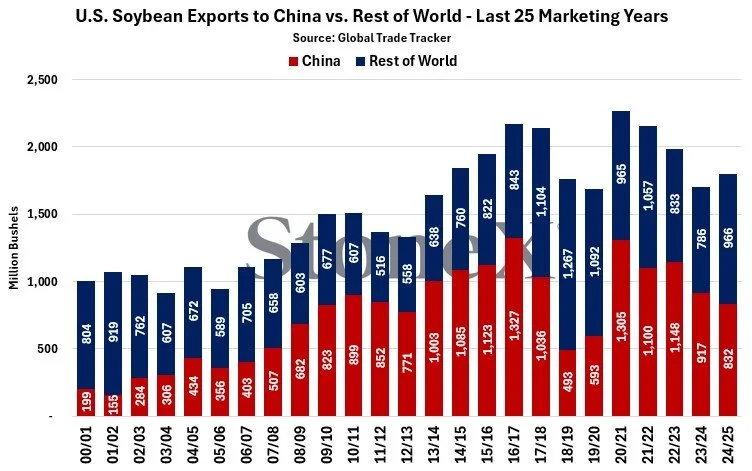
Here is a visual from StoneX that shows US soybean exports to China vs the rest of the world.
Currently, our export projections are almost already as low as they were during the last trade war.
The difference is that last trade war, the rest of the world made up for a big chunk of the lost business.
This Year: (Million Bu)
China: 832
World: 966
Last Trade War: (Million Bu)
China: 493
World: 1,267
Compared to last trade war, our projections for exports to China are currenlty +340 million higher this year. Yet China has not bought a single bushel yet (that we know of).
Now let's just say that we export the exact same amount of soybeans to China this time.
But the rest of the world doesn’t pick up any slack.
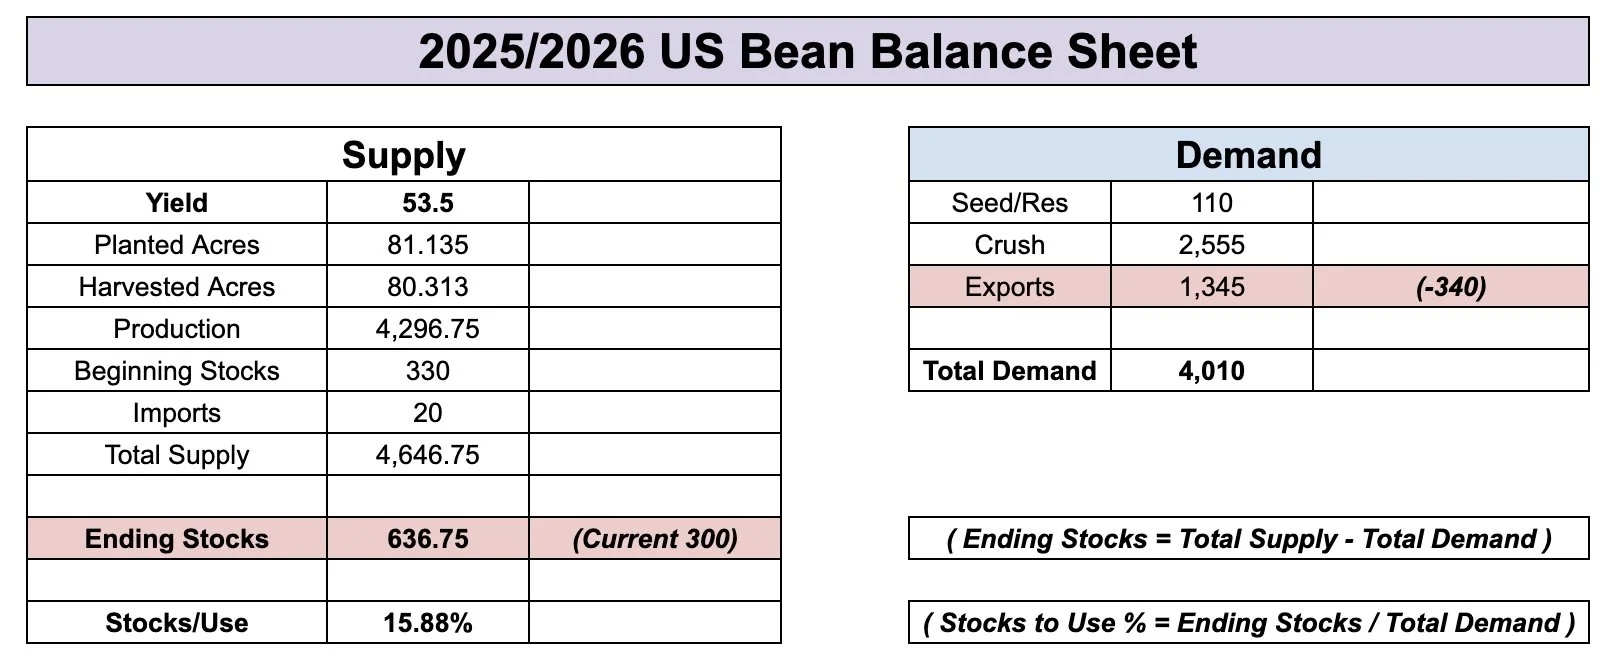
That would bump our carryout by +340 million.
Completely doubling our carryout. So that is the concern.
Here is the balance sheet if you drop exports -340 million.
To completely offset that loss in exports, you would need to see yield fall all the way down to 49.5
Here is the balance sheet if you drop exports while lowering yield to 49.5
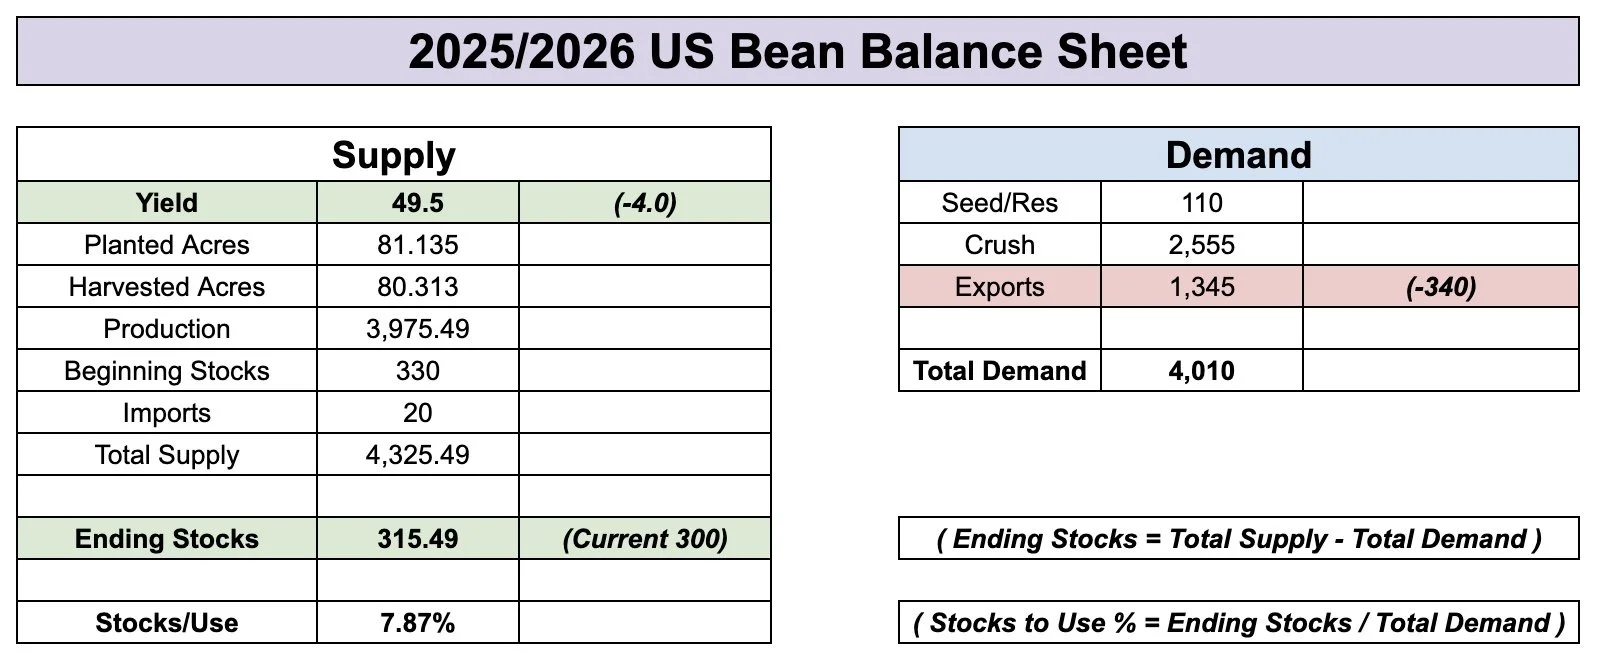
Bottom line, yes export demand is a concern.
But this trade war isn’t the same as the last one.
The market has been well aware that China isn’t buying soybeans, yet we are still hanging in there.
We are not trading anywhere close to where we were last trade war.
At the same time, I have to imagine yield is not +2 bpa higher than the previous record.
There are plenty of unknowns in this market, but we are one trade deal away from a completely different market.
With South America's weather season right around that corner that can spice things up as well.

Technicals:
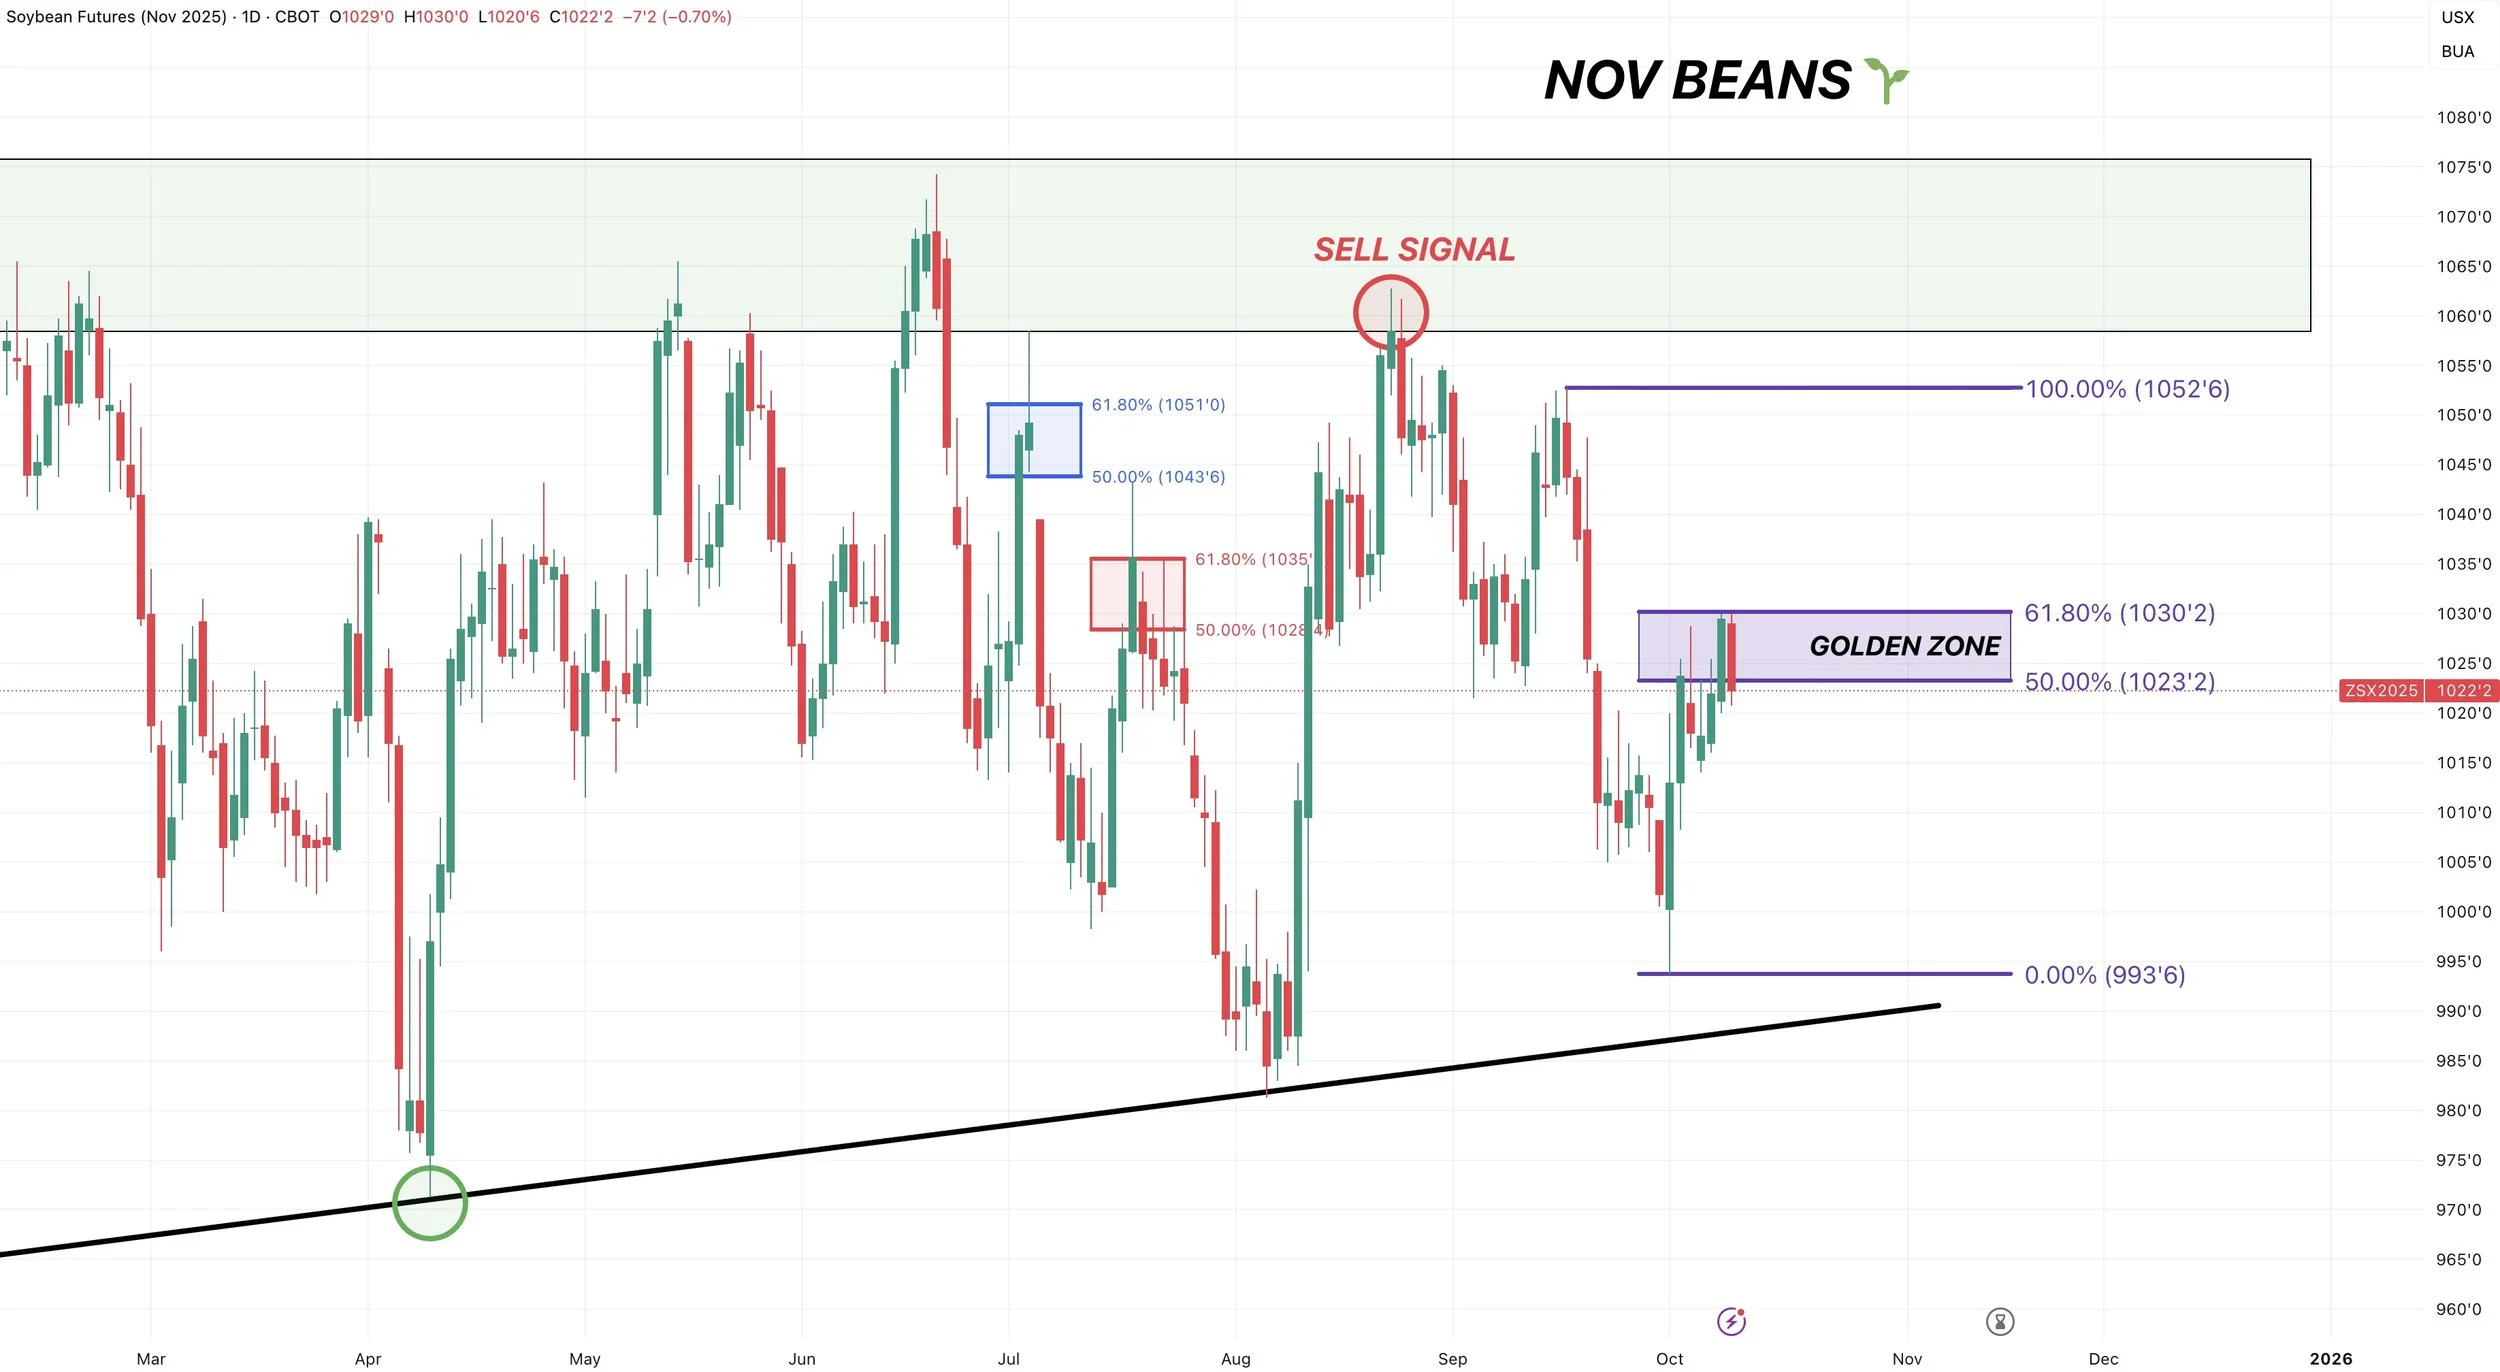
I have talking about been this $10.30 level for a while.
Today we rejected exactly off of it.
As we reclaimed 61.8% of the sell off.
A rejection or break above this level is where we find out if this is simply a relief bounce, or if this is the start of a larger rally.
If we are going to reject, it would be right here. So far, that is exactly what we are doing.
The 61.8% level is the most common spot for a relief bounce to fail at. Both the summer bounces failed at that level before ultimately heading lower.
You need a break above this purple box to say the bottom is in. As more often than not, if you break above that level, it is an indication we are headed higher.
Until then, the risk is lower.
Wheat
Fundamentals:
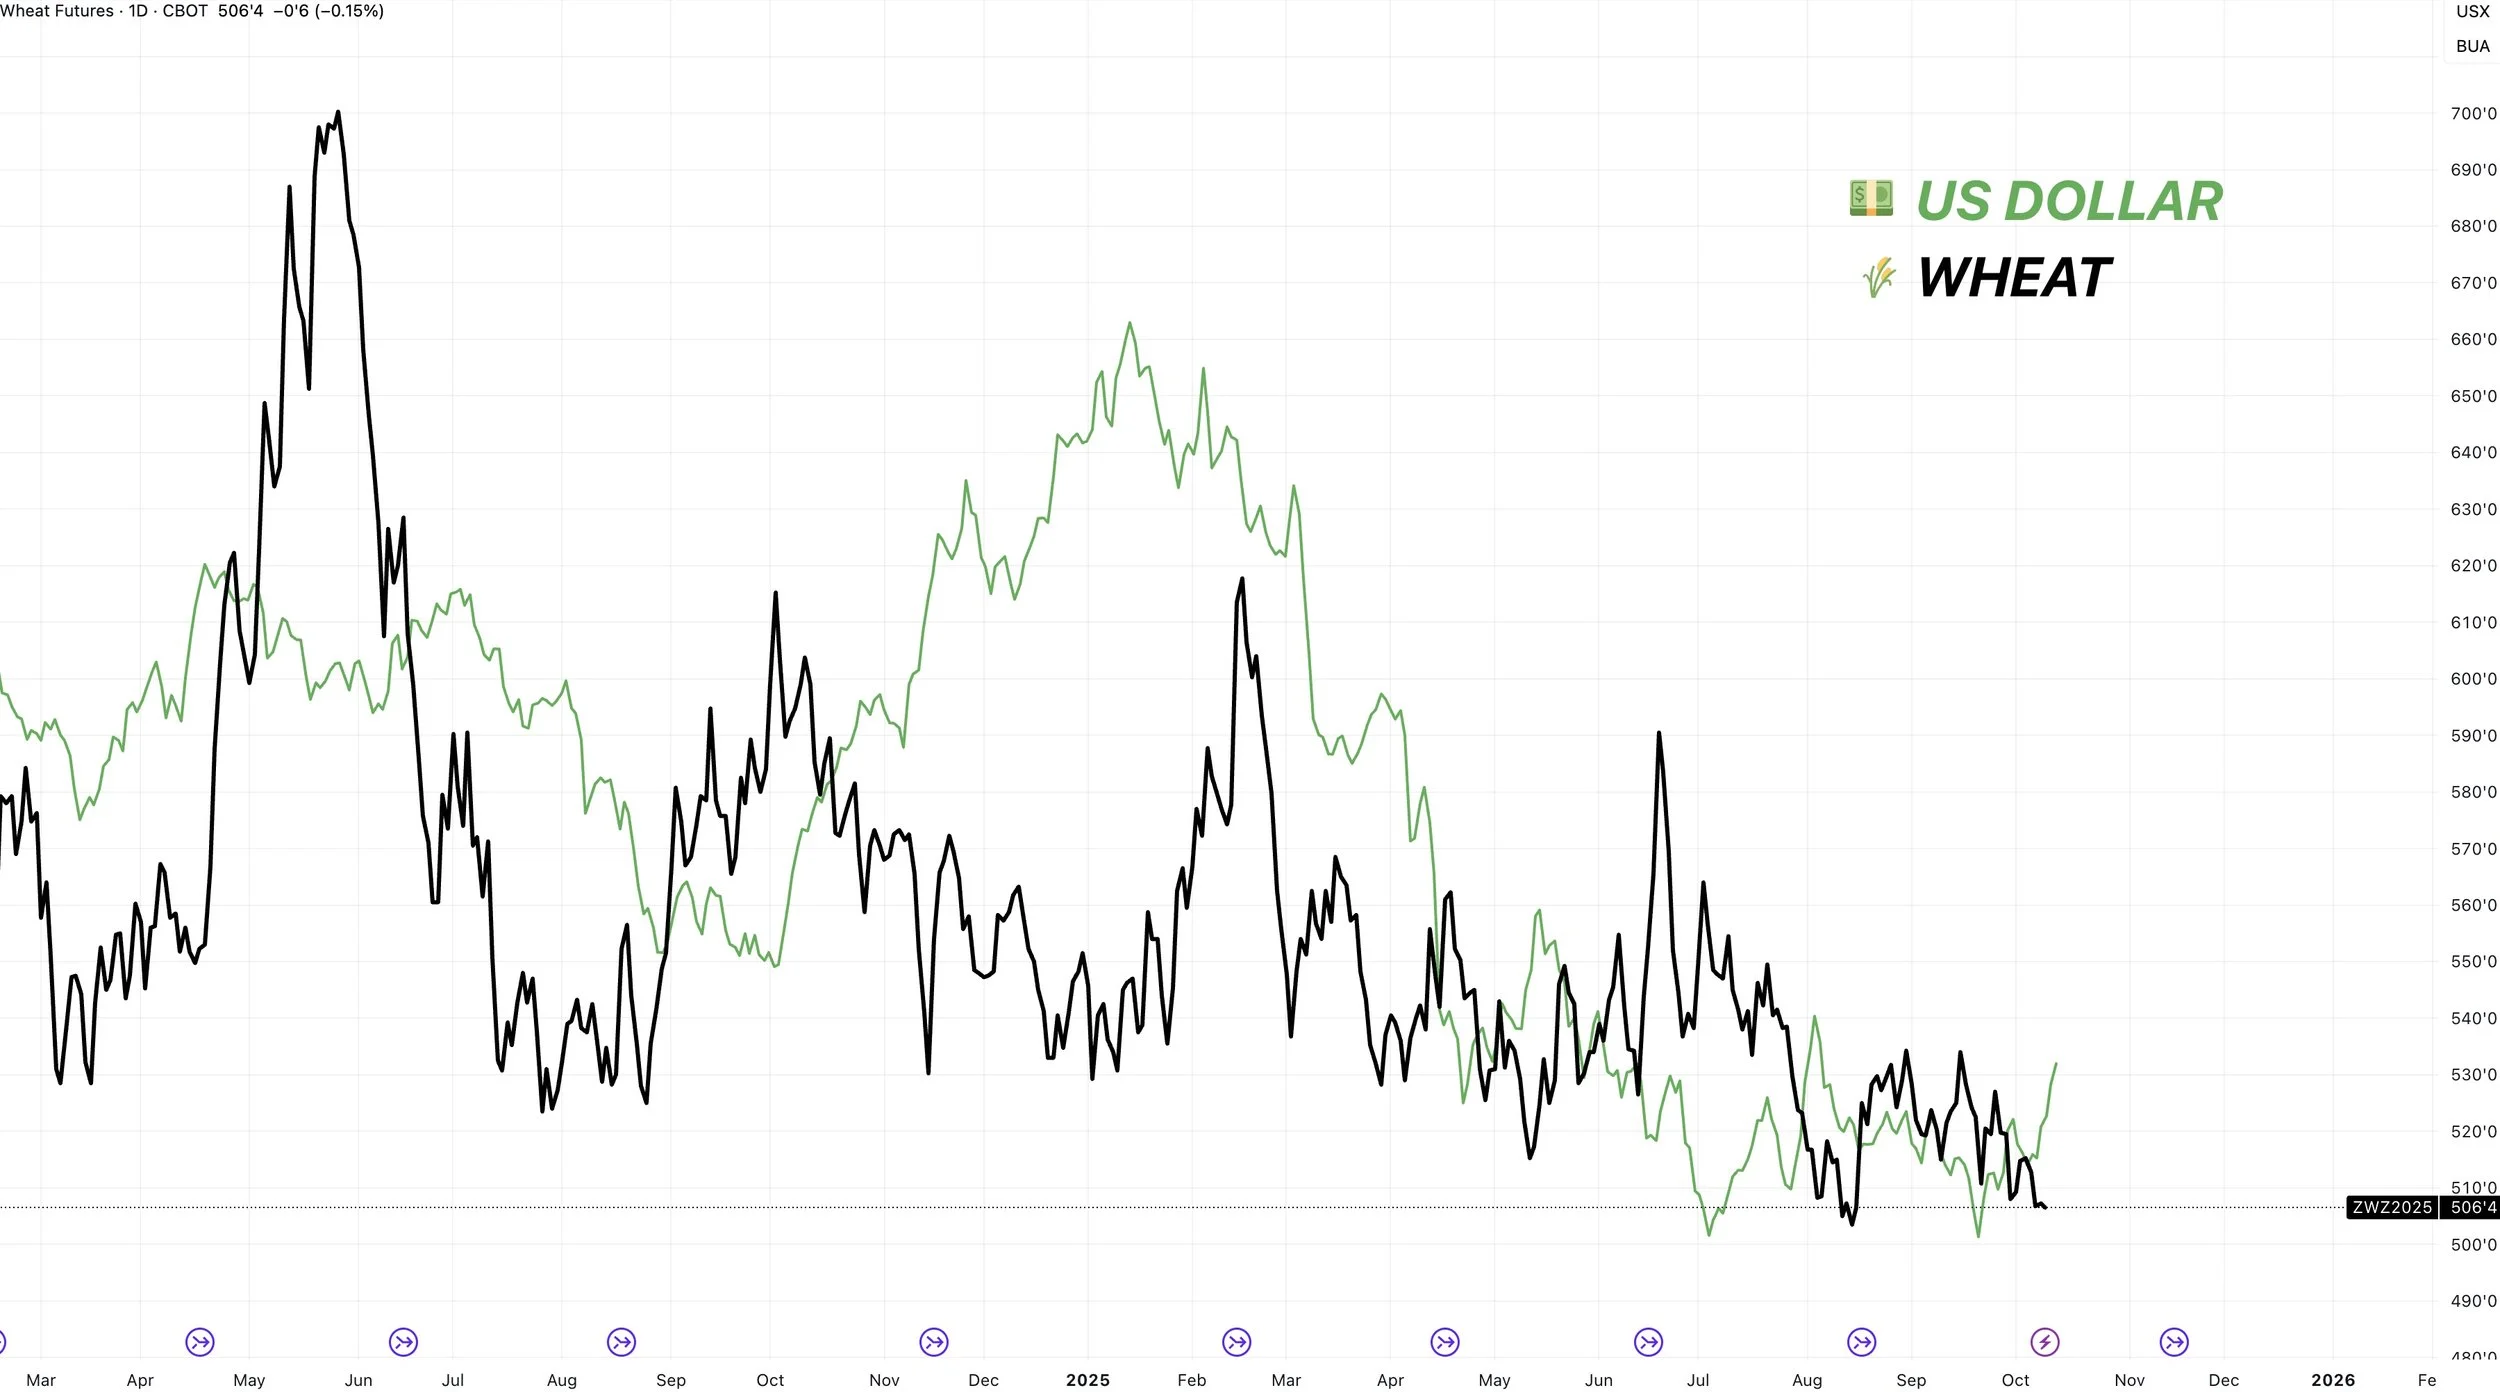
The US dollar hit a 9 week high today.
Some claim this is the reason for the recent weakness in wheat.

Yes, a stronger dollar is not helpful for exports.
But the dollar is still down hard this year.
The wheat market is also down hard this year.
I still don’t think there is a real correlation between a strong dollar and weak wheat (vice versa).
If there was actually an inverse trade between the two, wheat should be a lot higher. But it is not.
Here is a chart that shows the dollar vs wheat.
The US dollar is down -10% this year. Wheat is down -8%.
Nothing else to add to wheat today.
Just have to remain patient and wait for an opportunity.
Dec Wheat Technicals:
Still sitting at the bottom of this wedge.
Need a breakout to get excited.
My bias still leans higher as I think the breakout eventually comes.
If we get the break out, I think we have room to run to $5.45.

Dec KC Wheat Technicals:
Same story with KC.
Getting awfully tight in this wedge. Coiling for a move.
If we get the breakout, first target is $5.35

Cattle
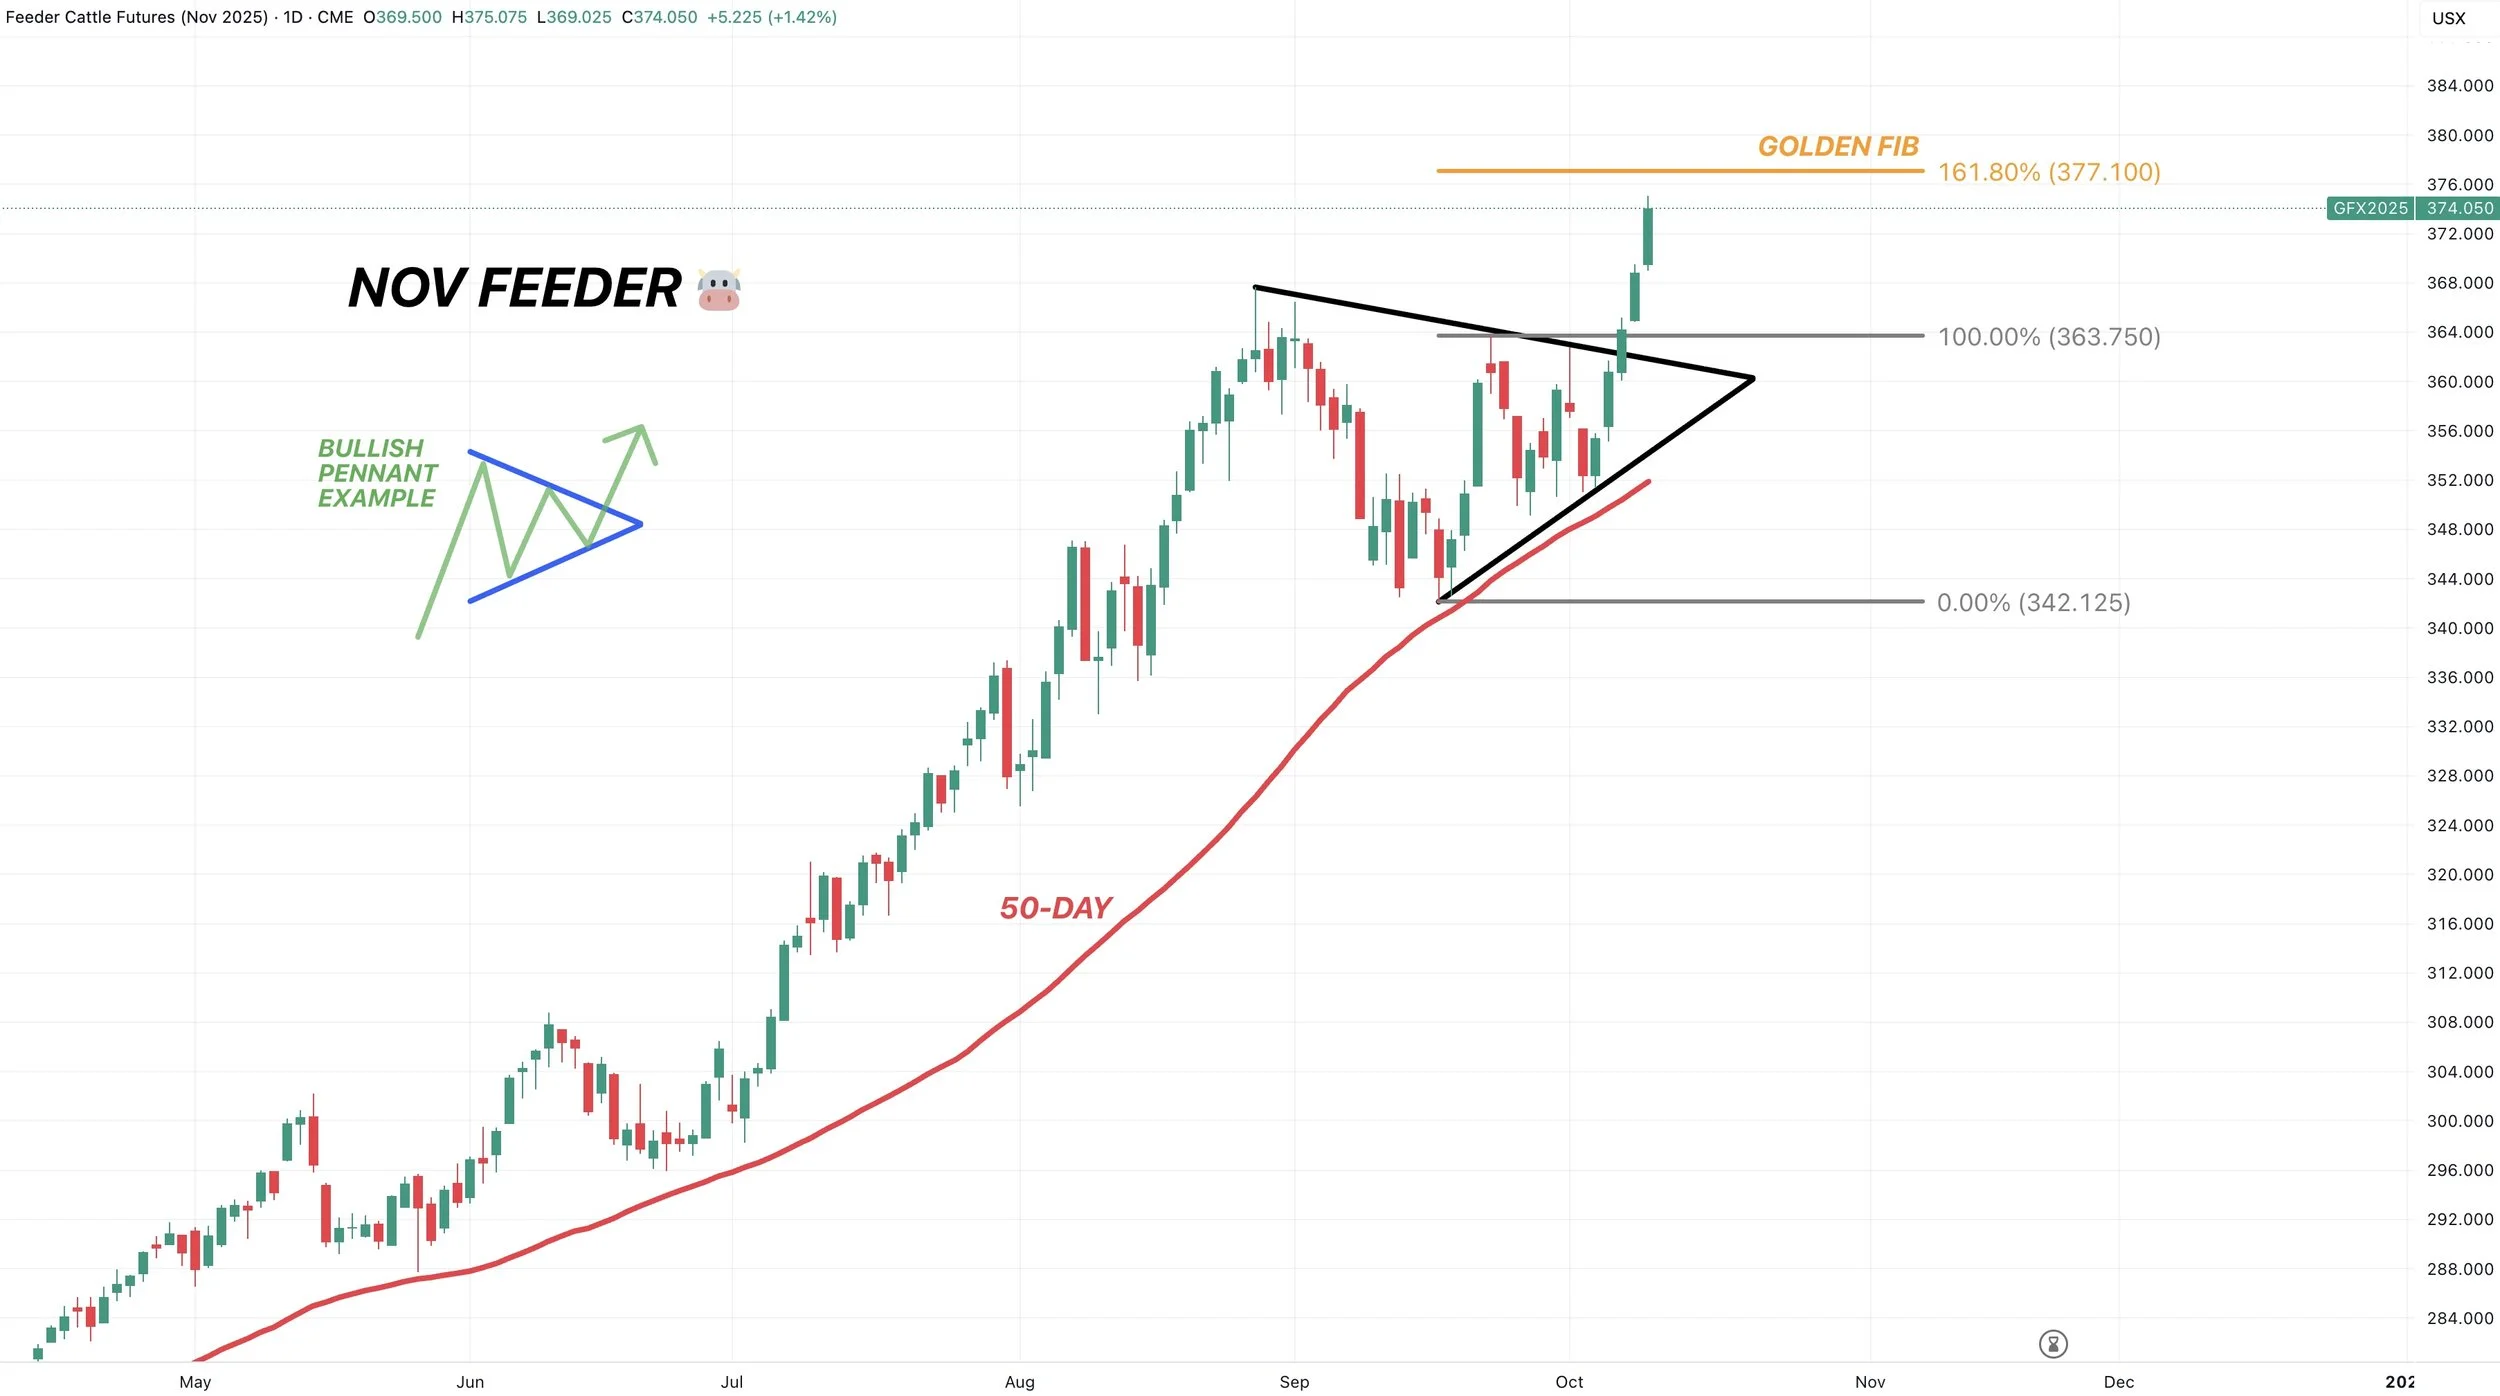
Oct Feeder Chart:
We got the pennant breakout.
I have a target of 377.
That is the golden fib from the bottom of the pennant up to the late Sep highs. Which means this rally equals 161.8% of that one.
That is a common spot for a 2nd rally to pause.
I would get serious about managing your risk up here and I will potentially be sending out a hedge alert very soon as we are approaching that target.
Anywhere between here and that target is a great spot to de-risk in my opinion.
As always, we prefer puts, not futures in this market. We are in a bull market. Simply trying to short this market with futures is a good way to get margin calls. We simply want to manage our risk with puts for most.
Call or text us if you have specific questions: (605)295-3100
Big picture, the 50-day MA is going to be your warning sign that this market is ready for a real correction. If that ever breaks, it could open the floodgates lower.
We are also showing bearish divergence on the RSI.
Prices made new highs. The RSI did not.
Another reason I want to start getting serious about managing my risk up here.

Dec Live Cattle:
Live cattle has not yet got the breakout feeders have.
Right up against some trendline resistance.
If we get the break, we could potentially go for new highs.
To the downside, biggest thing to watch is the 50-day MA. It's been a floor the entire bull run.
If we alert a hedge alert in feeder, it will also be for live cattle. As they closely follow each other even if one happens to be outperforming.

Past Sell or Protection Signals
Aug 22nd: 🌱
Soybean sell signal & hedge alert.
July 31st: 🐮
Cattle sell signal & hedge alert.
July 10th: 🐮
Cattle sell signal & hedge alert.
CLICK HERE TO VIEW
June 5th: 🐮
Cattle sell signal & hedge alert.
June 2nd: 🌾
MPLS wheat sell signal.
April 10th: 🌽
Old crop corn sell signal.
March 19th: 🐮
Cattle hedge & sell signal.
Feb 18th: 🌽 🌾
Old crop KC wheat & old crop corn signal.
Jan 23rd: 🌽 🌱
Corn & beans old crop sell signal.
CLICK HERE TO VIEW
Jan 15th: 🌽 🌱
Corn & beans hedge alert/sell signal.
Jan 2nd: 🐮
Cattle hedge alert at new all-time highs & target.
Dec 11th: 🌽
Corn sell signal at $4.51 200-day MA
CLICK HERE TO VIEW
Oct 2nd: 🌾
Wheat sell signal at $6.12 target
Sep 30th: 🌽
Corn protection signal at $4.23-26
Sep 27th: 🌱
Soybean sell & protection signal at $10.65
Sep 13th: 🌾
Wheat sell signal at $5.98
May 22nd: 🌾
Wheat sell signal when wheat traded +$7.00
Want to Talk?
Our phones are open 24/7 for you guys if you ever need anything or want to discuss your operation.
Hedge Account
Interested in a hedge account? Use the link below to set up an account or shoot Jeremey a call at (605)295-3100.