
TOTAL CHART BREAKDOWNS & TARGETS
MARKET UPDATE
Will you seize the next opportunity..?
Don’t miss our next sell signal.
You only get a fraction of our daily updates.
You can scroll to read the usual update as well. As the written version is the exact same as the video.
(I do suggest watching todays video as it might give a better understanding of the charts)
Timestamps for video:
Quick Overview: 0:00min
Corn Charts: 1:20min
Soybeans Charts: 5:30min
Wheat Charts: 9:15min
Want to talk about your situation?
(605)295-3100
Futures Prices Close

Overview
Today we are mainly going to do a deep dive on the technical charts, as fundamentally there isn’t anything new.
The markets are simply seeing technical selling as we hit resistance on the charts like we talked about happening late last week.
The market has now digested and rebounded since the intial trade war fear.
Now just in a waiting time game as focus starts shifting to mainly weather and of course potential trade war deals.
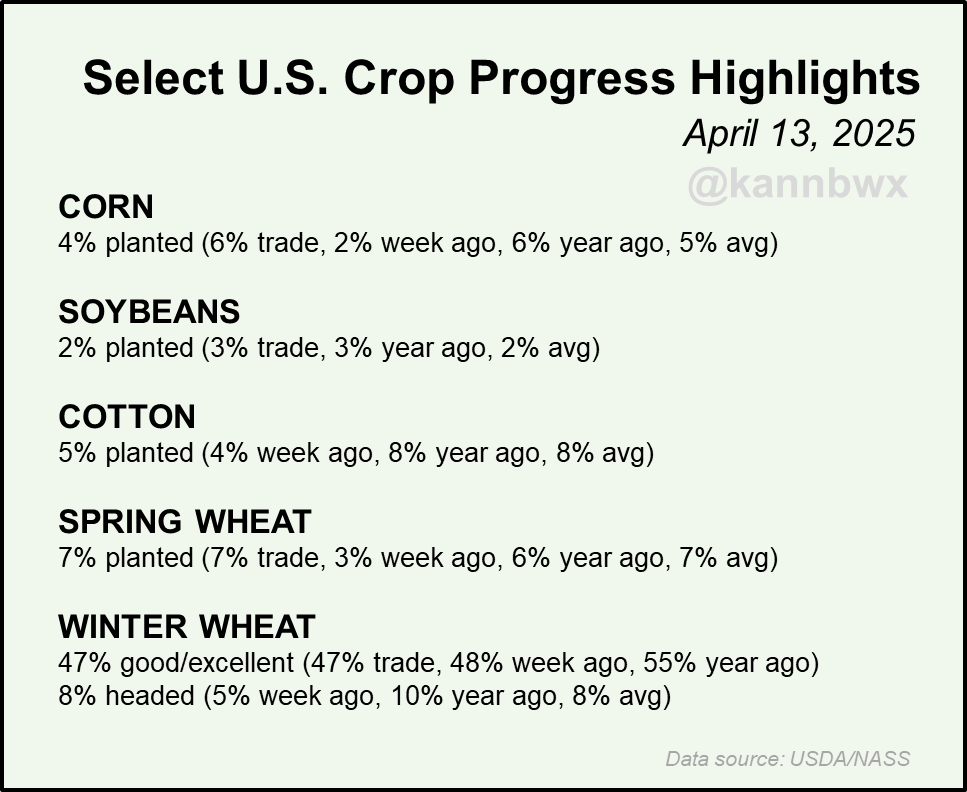
We did have planting progess out yesterday.
Corn planting came in slower than the estimates and slower than last year. But it is still too early to get a good grasp on it or say we'll have a delayed planting story. So nothing to write home about.
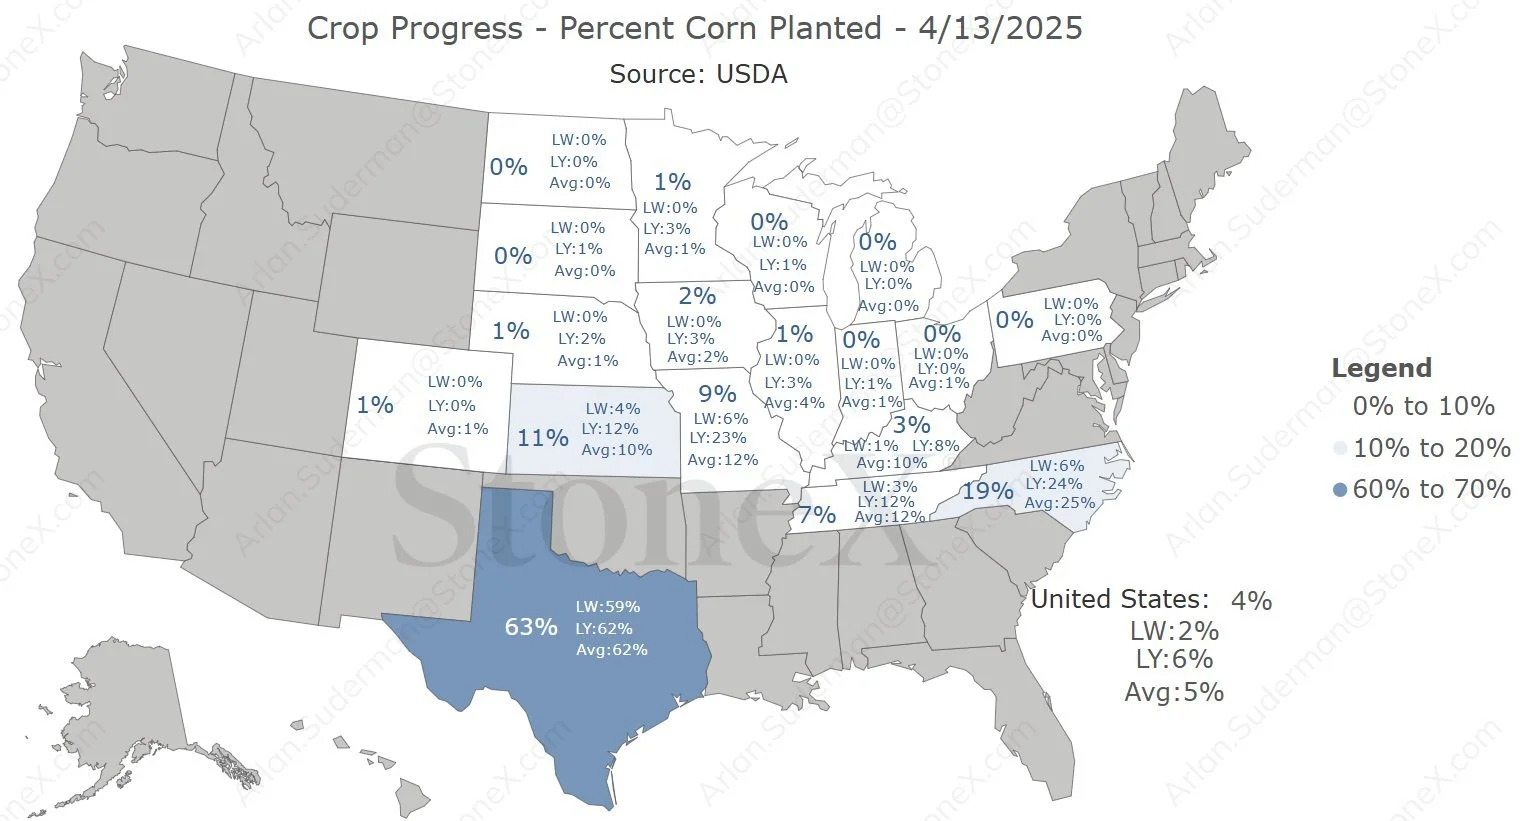
Chart from Karen Braun
Corn Chart from StoneX
Before we jump into the charts, one thing I did want to go over is the corn funds.
The last time corn was at this price level back in February, the funds were long around +370k contracts of corn.
They are now long +54k contracts.
Which means the last time corn was at this level.. the funds were long +300k more contracts than they are today.
Meaning they have more room to buy now compared to early February, despite prices being at the same level.
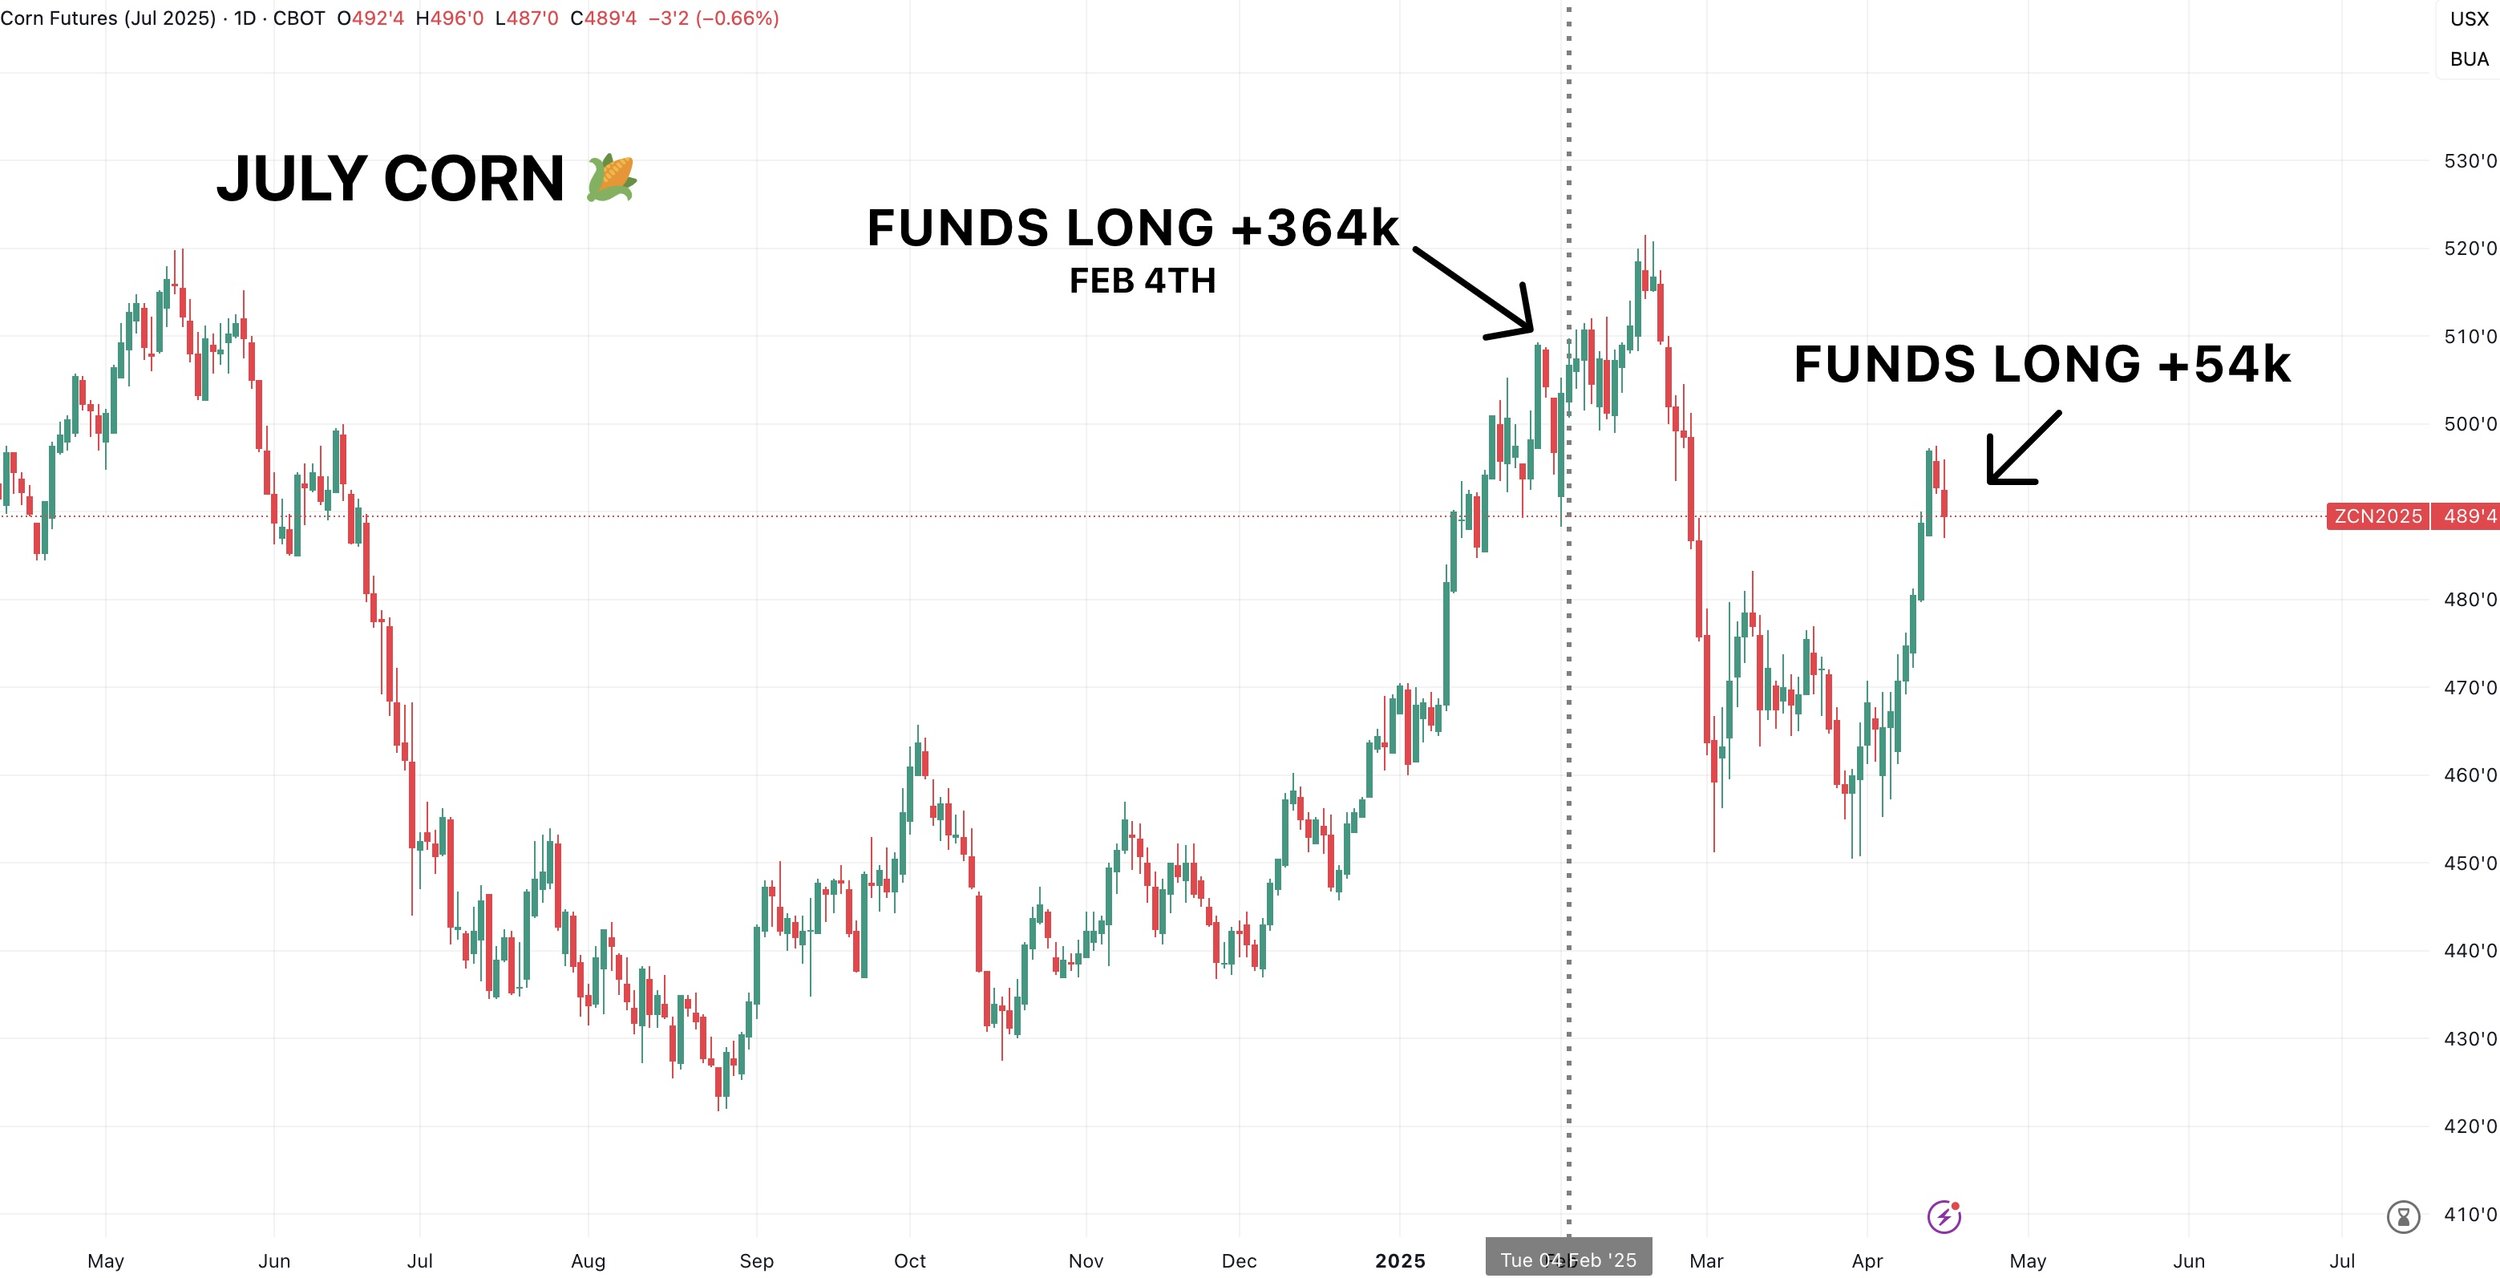
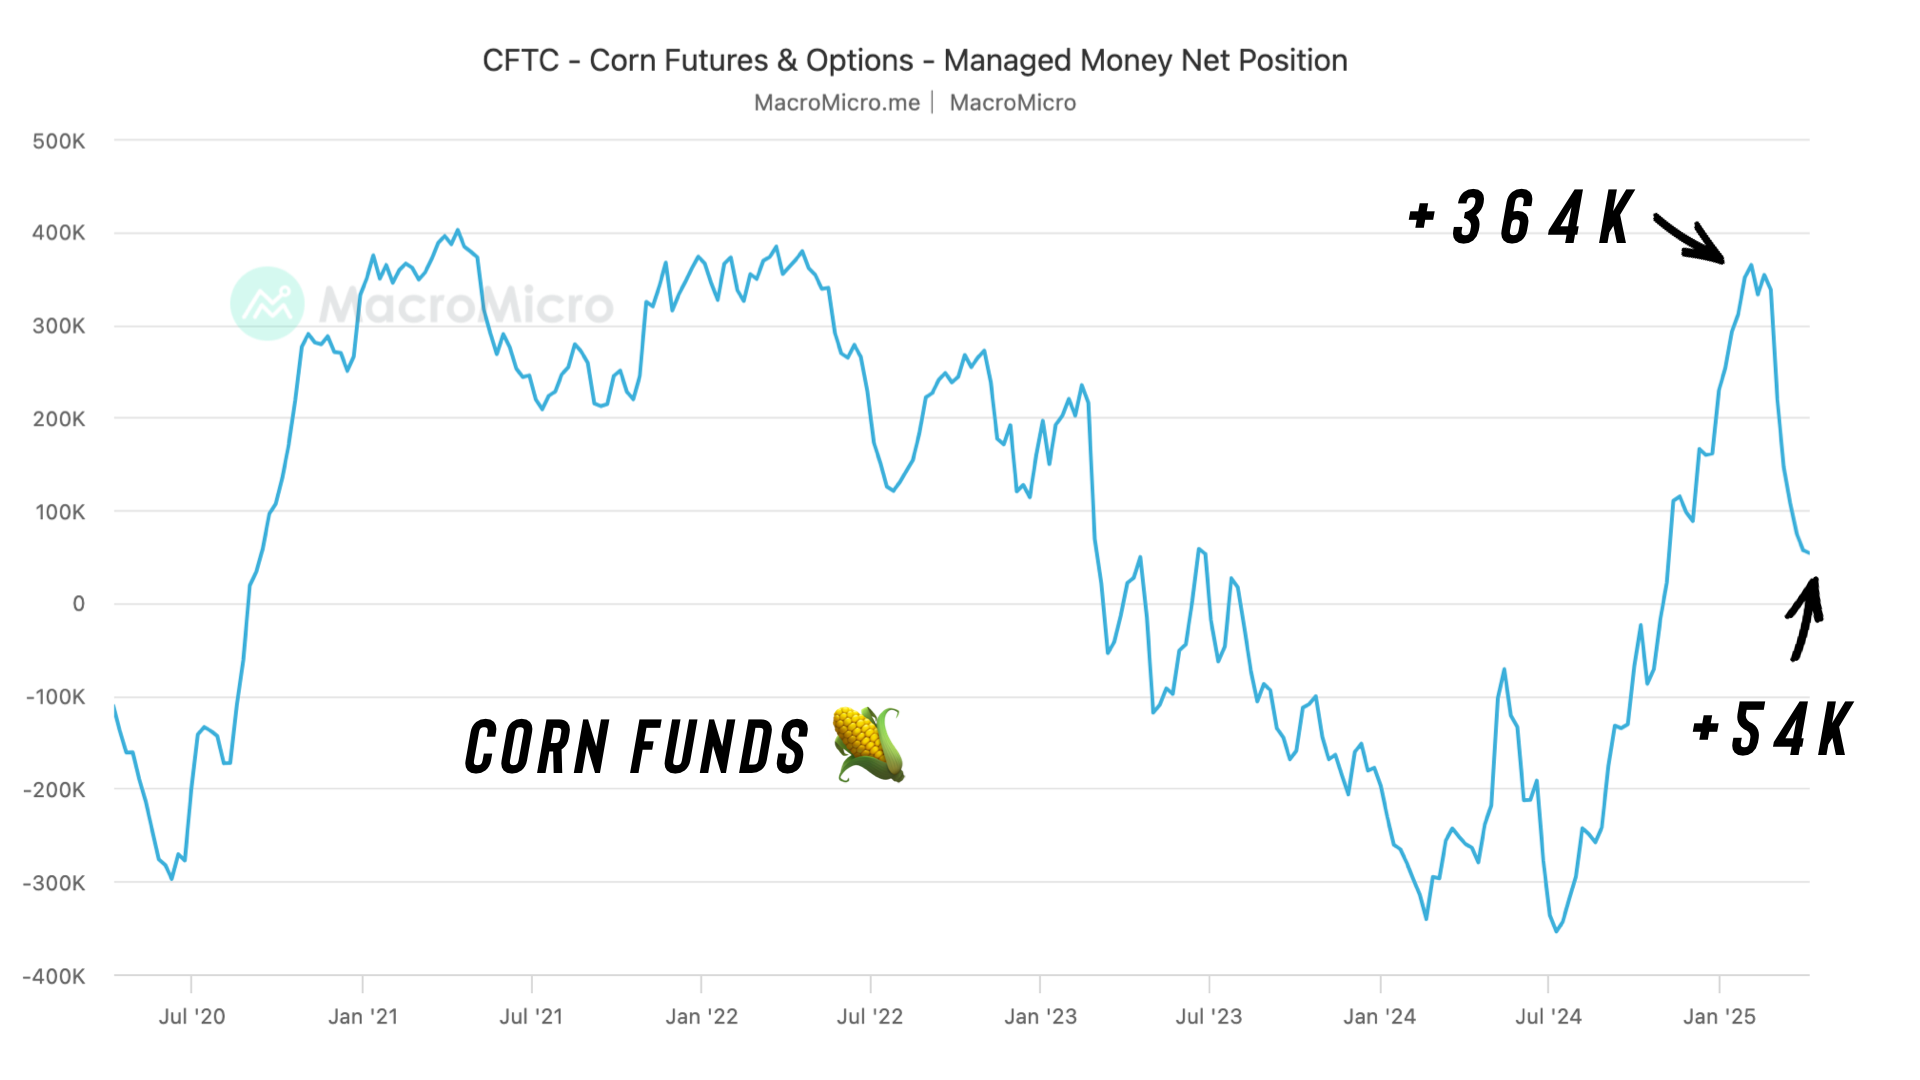
Chart Breakdowns
Corn
To end last week we put out an old crop sell signal due to hitting my short term target.
When we hit a target, it usually means it is a good spot to take risk off the table.
This signal was mostly for those that need to move corn in the next 45 days or were undersold/uncomfortable.
How did we identify this target?
So far corn is taking a break exactly where we said it should last week.
Rejecting right off the 61.8% retracement of the entire sell off from those Feb highs.
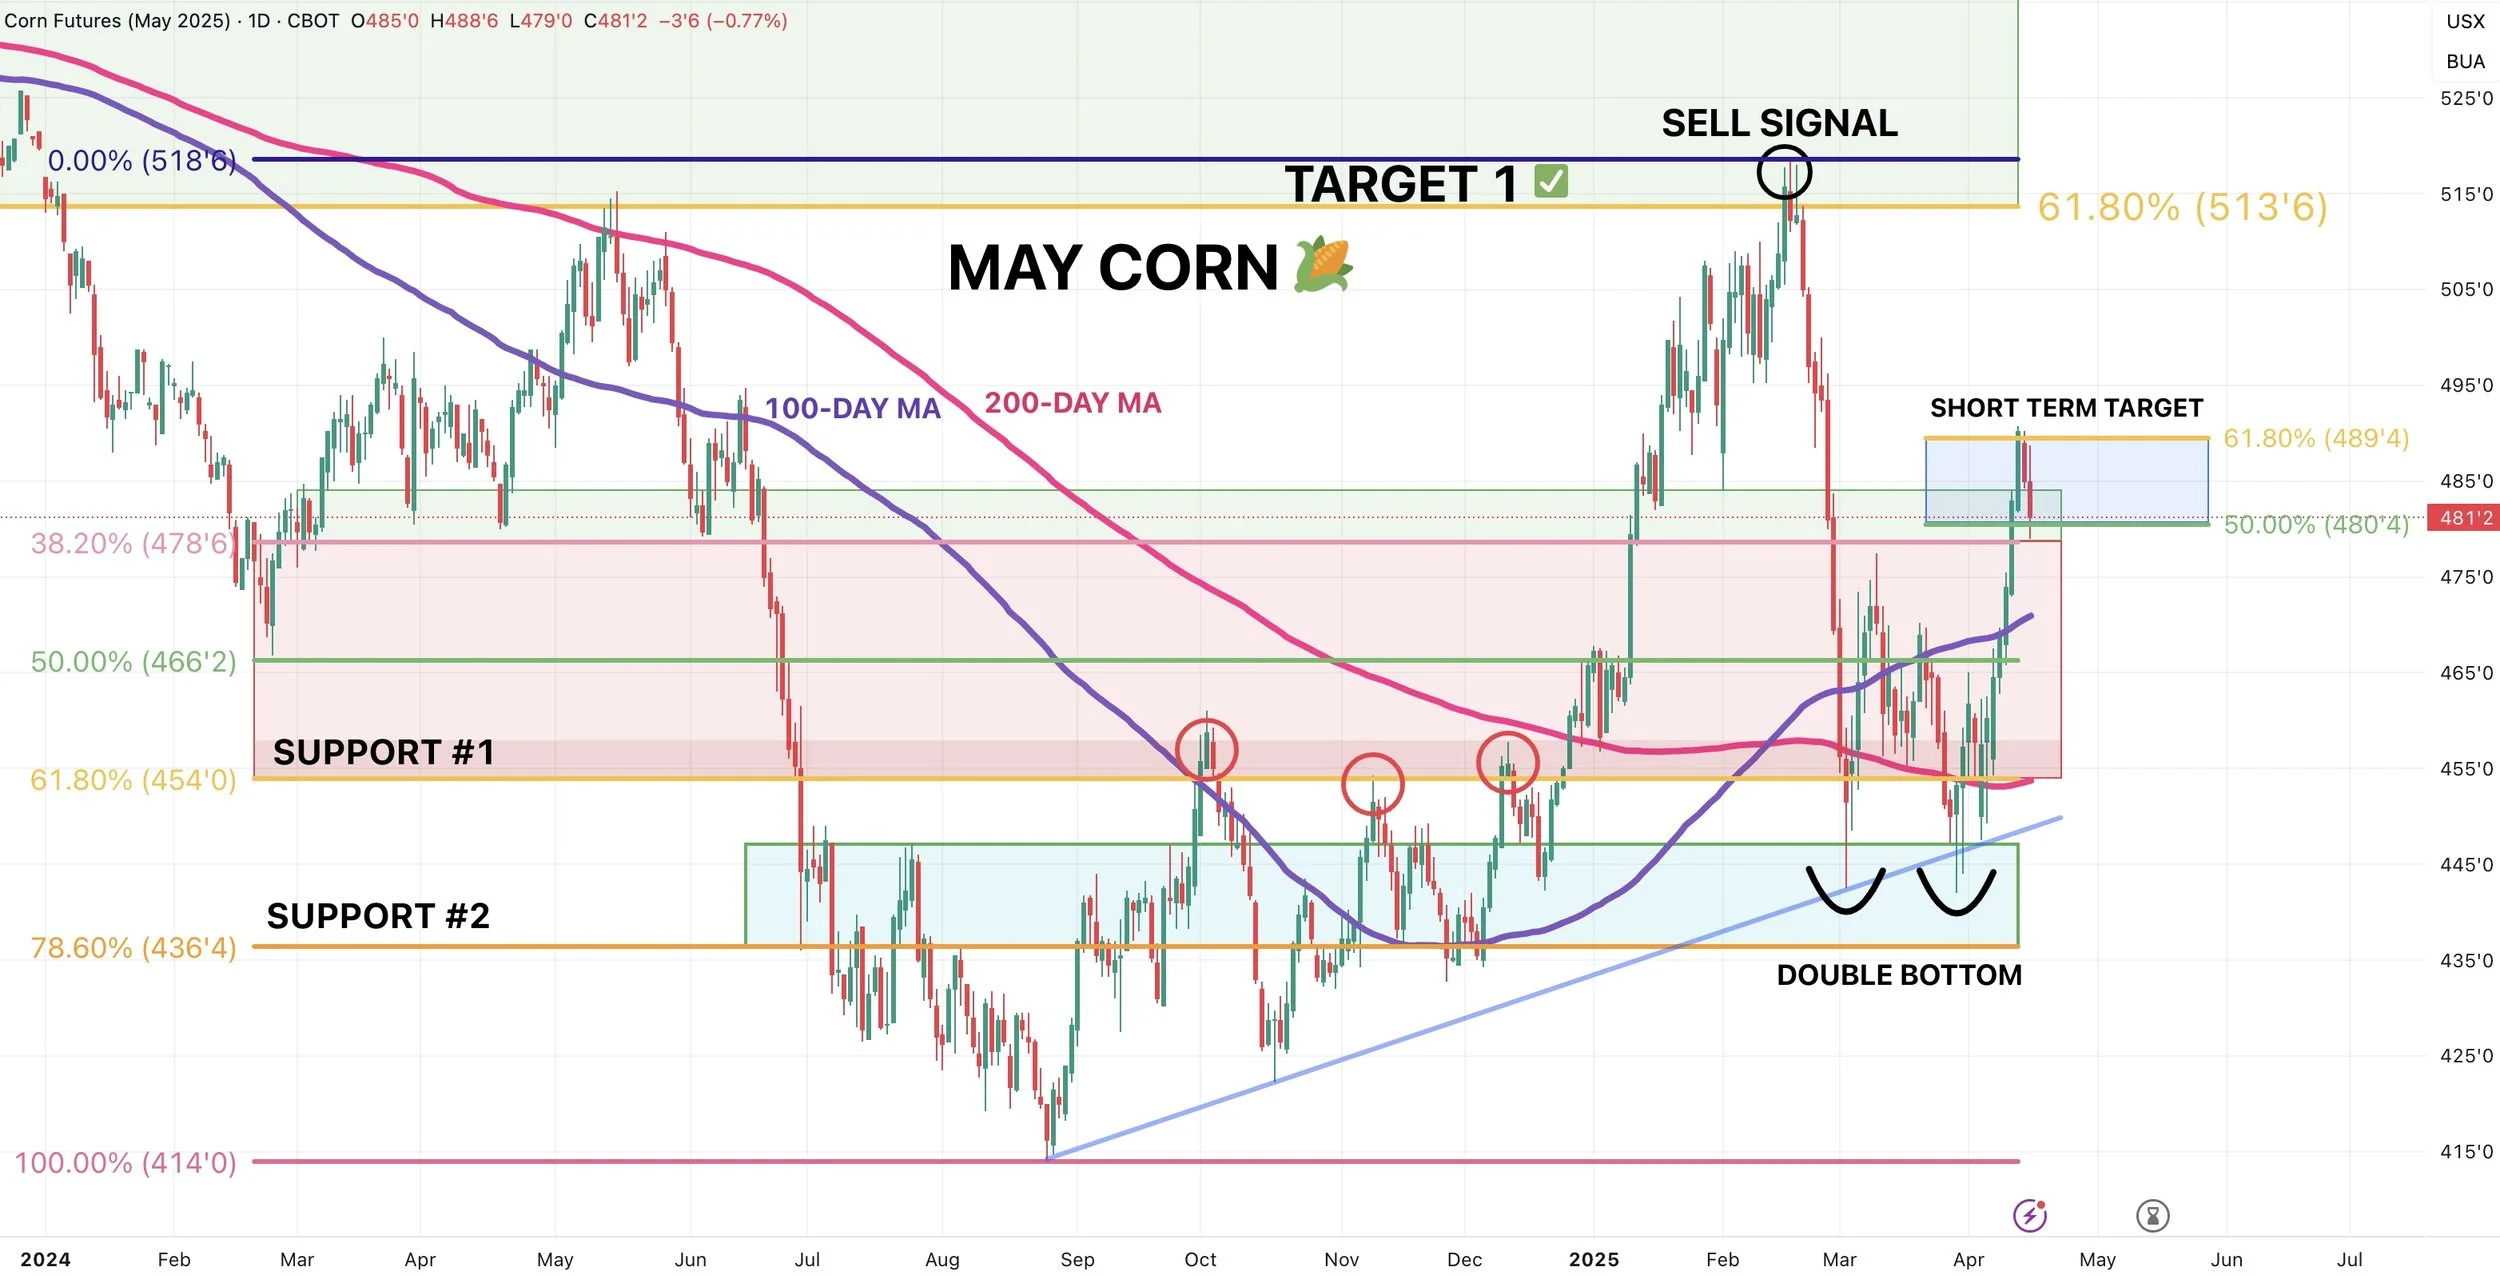
Now what?
(From now on I will be showing July corn instead of May, as it is now the most heavily traded contract)*
We are now back above that key support level from last spring. Bulls ideally hold that level.
If that level does not hold, we will likely drop down to that blue box ($4.69 to $4.75) which gives back 50-61.8% of this recent rally.
My personal opinion is that we hold here and continue to build a base of support, as I do not think a move back down there would be justified.
We got a +95 million acre print and a trade war, that wasn’t even enough to spook the corn market.
Next Target:
We hit my first short term target of $4.86 to $4.94
Next big target is $5.21 to $5.26
Why?
$5.21 is the highs from February.
$5.26 equals 161.8% of this recent rally from $4.50 to $4.97.
This is known as the "golden fib extension". As it is the most common level for a 2nd rally to hit.
(How the math works: 47 cent rally X 161.8% = 76 cents. Then you add 76 cents on top of $4.50 which gives you $5.26)

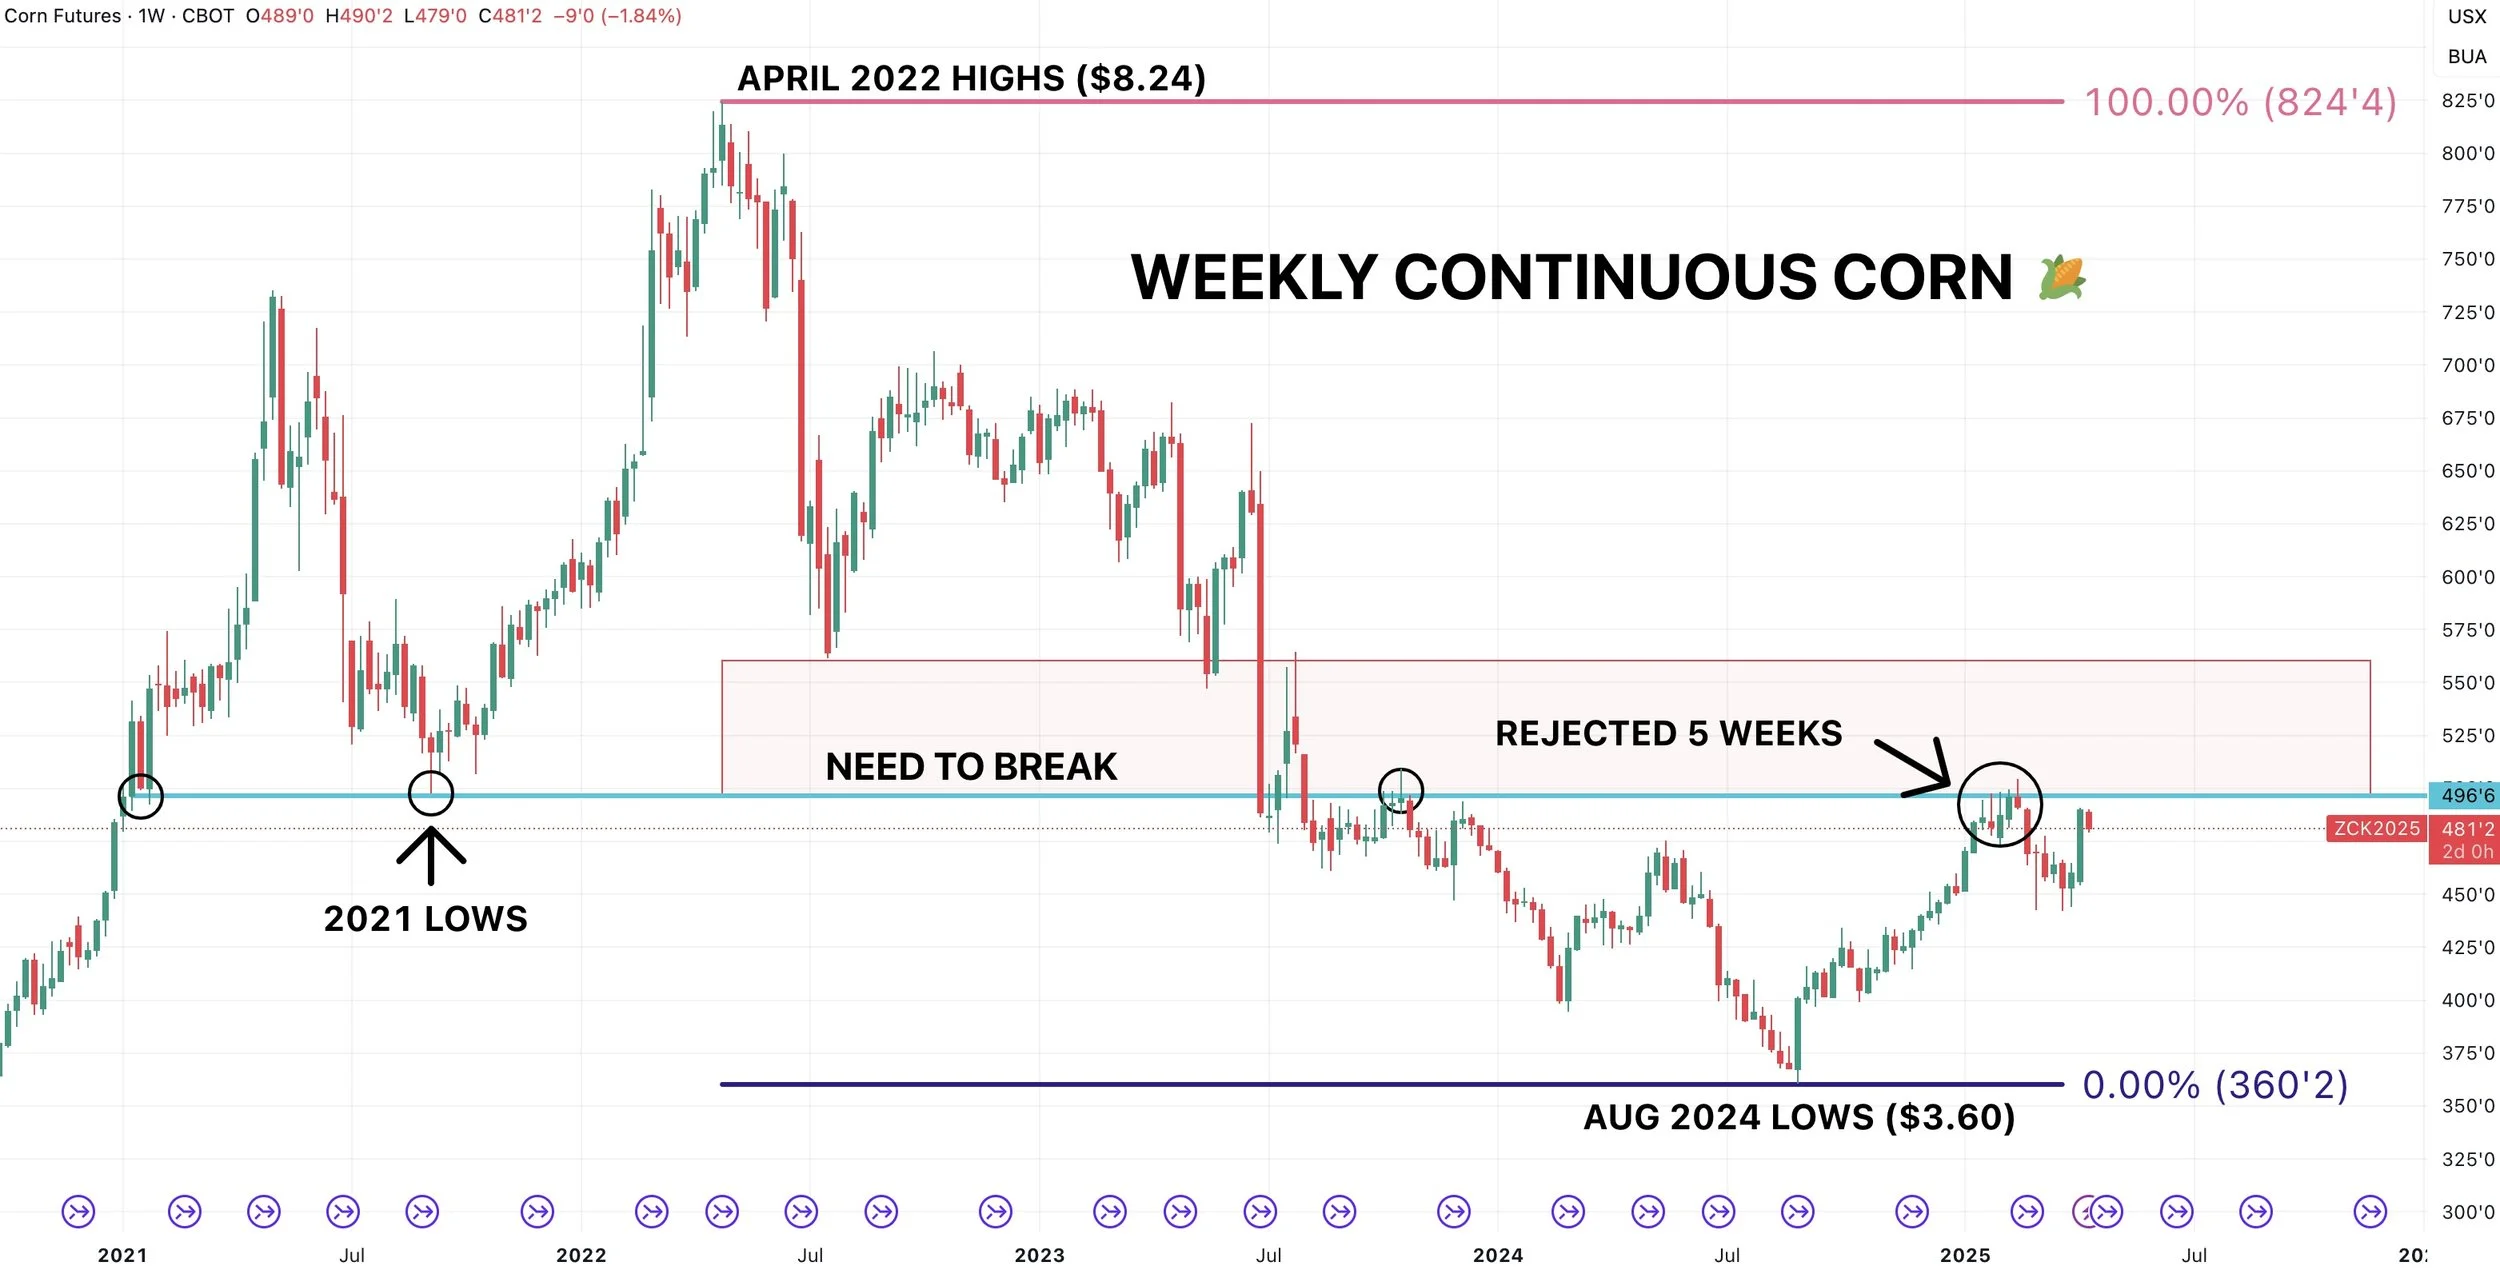
Here is a weekly view of corn.
Last week corn posted it's largest weekly gain in 693 days (since May 2023).
A breather after that size of a move is completely normal, healthy, and expected.
$4.97 is the big hurdle bulls need to climb.
We rejected that level for 5 straight weeks back near the Feb highs. It was also a pivotal spot several times like in 2021 where it marked our absolute lows.
If corn busts this level, there is simply not much resistance to the upside. So it should spark a leg higher.
(Interesting thing to note: Altough July corn is not yet front month corn and not shown on this weekly chart, it also rejected right at $4.97 on Friday).
New Crop Dec Corn:
Just like in old crop, Dec corn also exactly hit that short term target box we had been sharing the last several weeks.
This level gave us back 61.8% of the sell off (again most common level).
The was also exactly our lows from February 2024. (old support is now resistance).
This is why a breather here short term makes sense.
Next Target:
$4.84 to $4.85
$4.84 gives us back 78.6% of the May 2024 highs (we already hit the 61.8% at $4.72 back in February. As that was our target back then and where we took some risk off the table).
$4.85 is 161.8% of this recent +30 cent rally from $4.37 to $4.67 (again, the golden fib extension).

Soybeans
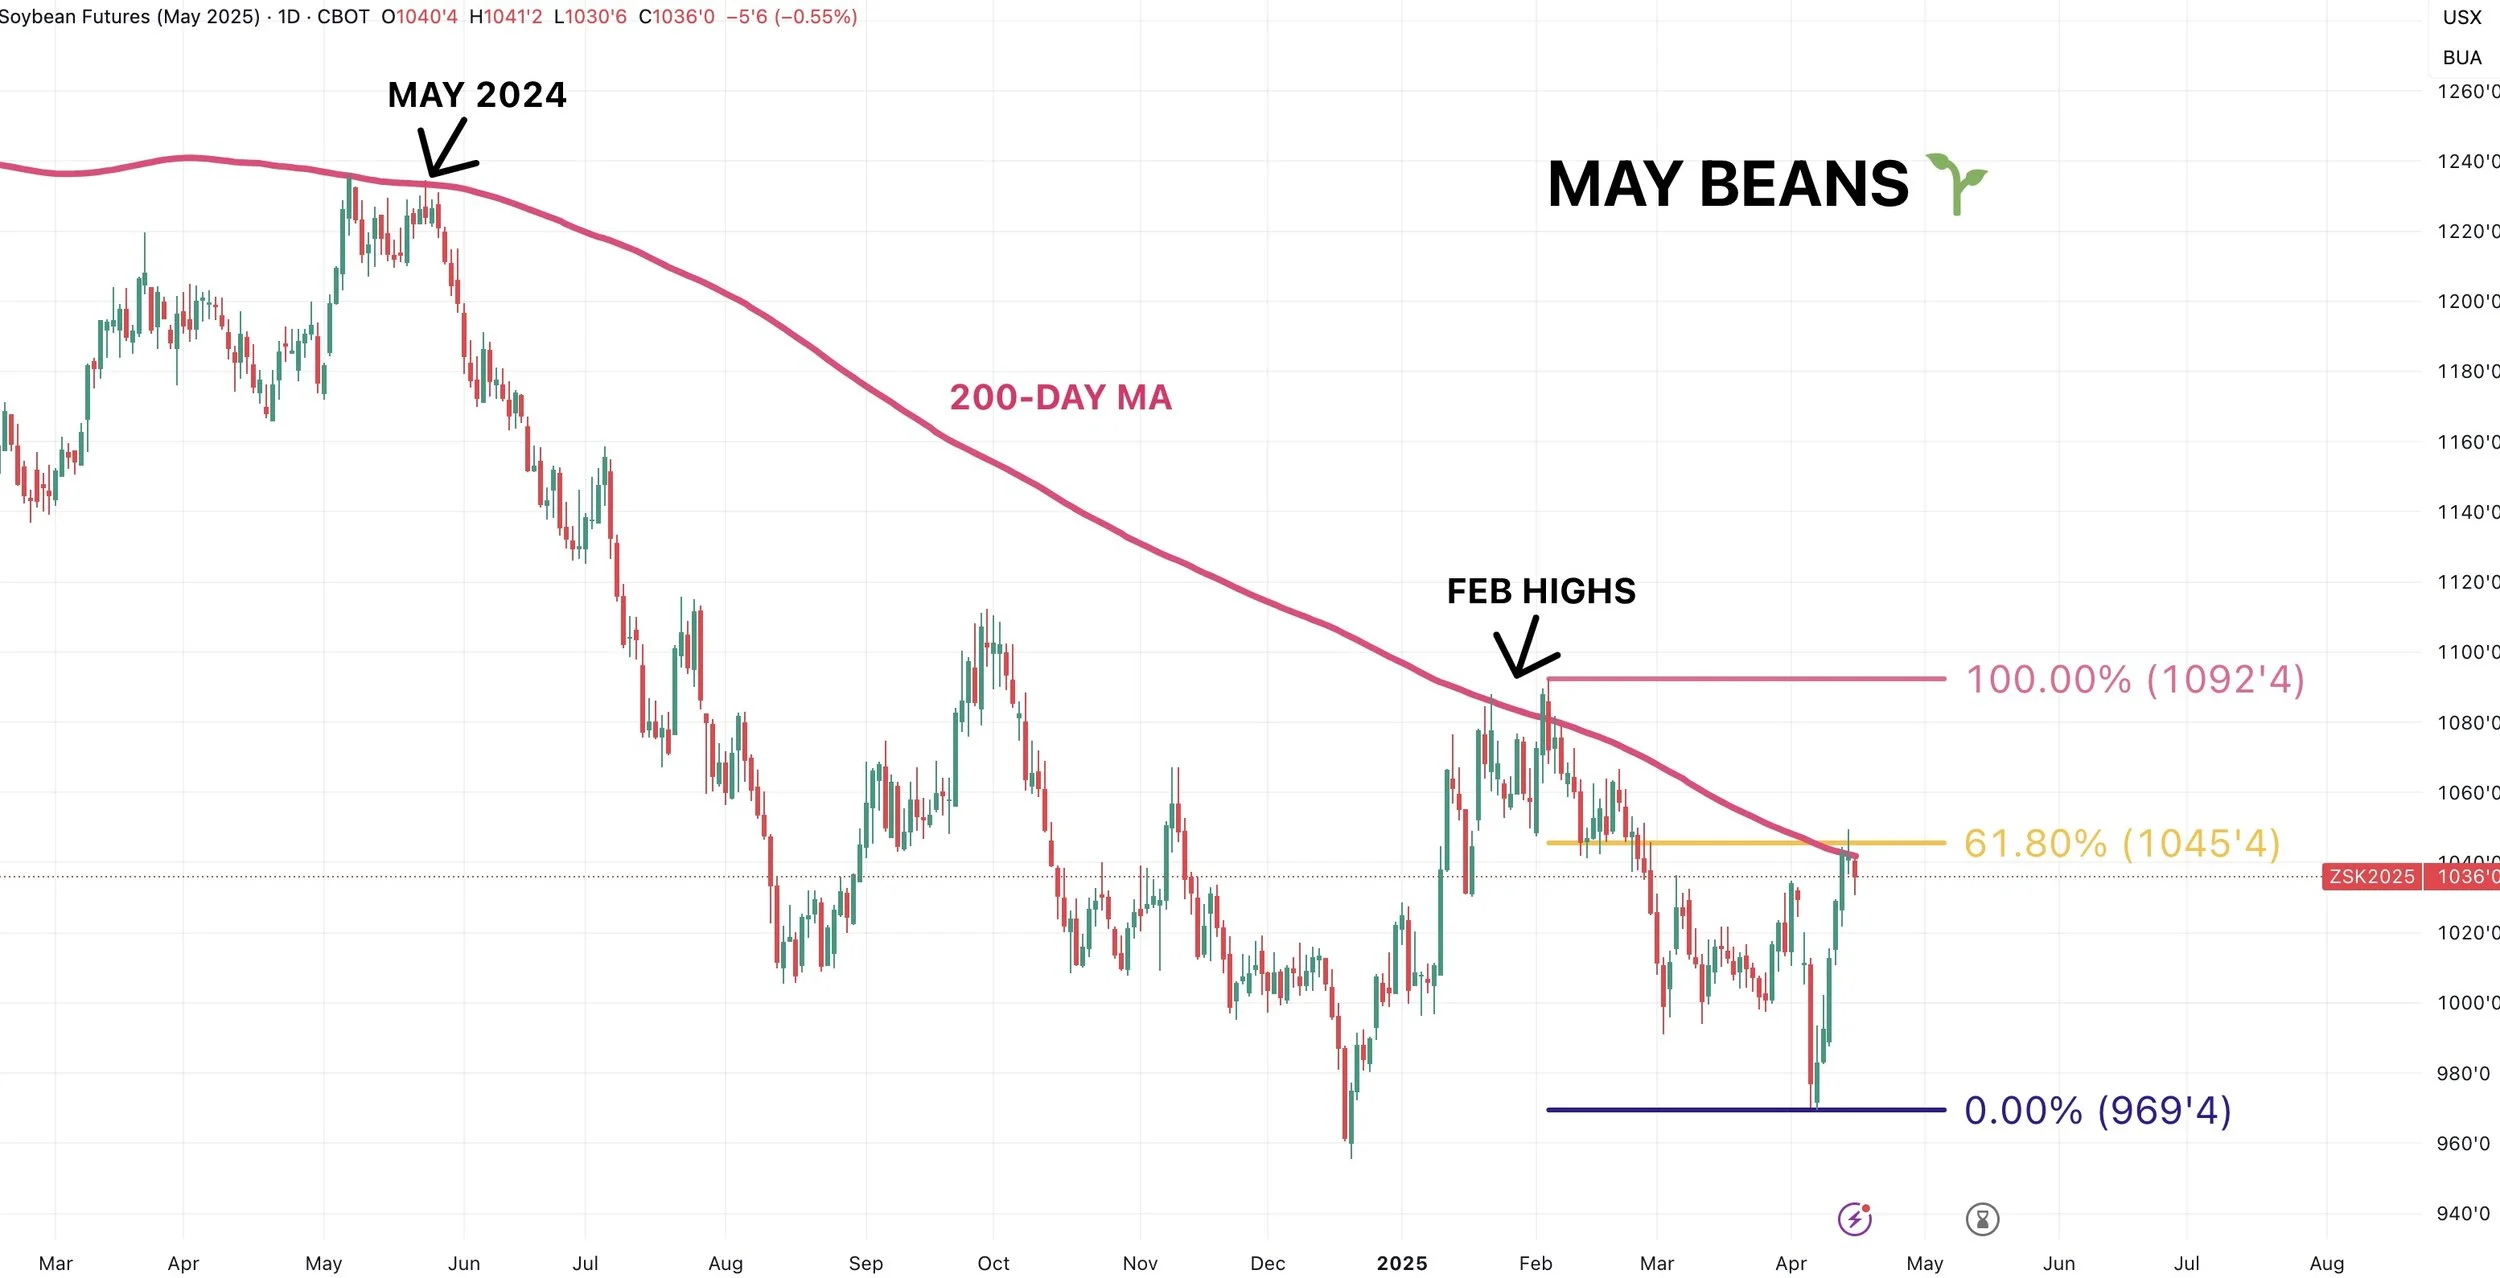
Soybeans momentum is pausing just like we talked about the last few days.
Why it made sense to pause here:
Beans perfectly rejected right off the 61.8% retracement level of the recent Feb highs.
The 200-day MA also just so happened to be sitting here as well.
Soybeans have not closed above the 200-day MA since 2023.
It marked our exact highs in February as well as May 2024.
Eventually, if we break above it, it should bring on some fireworks given how strong of a lid it has been. But it made sense this is where we would stall out for now.
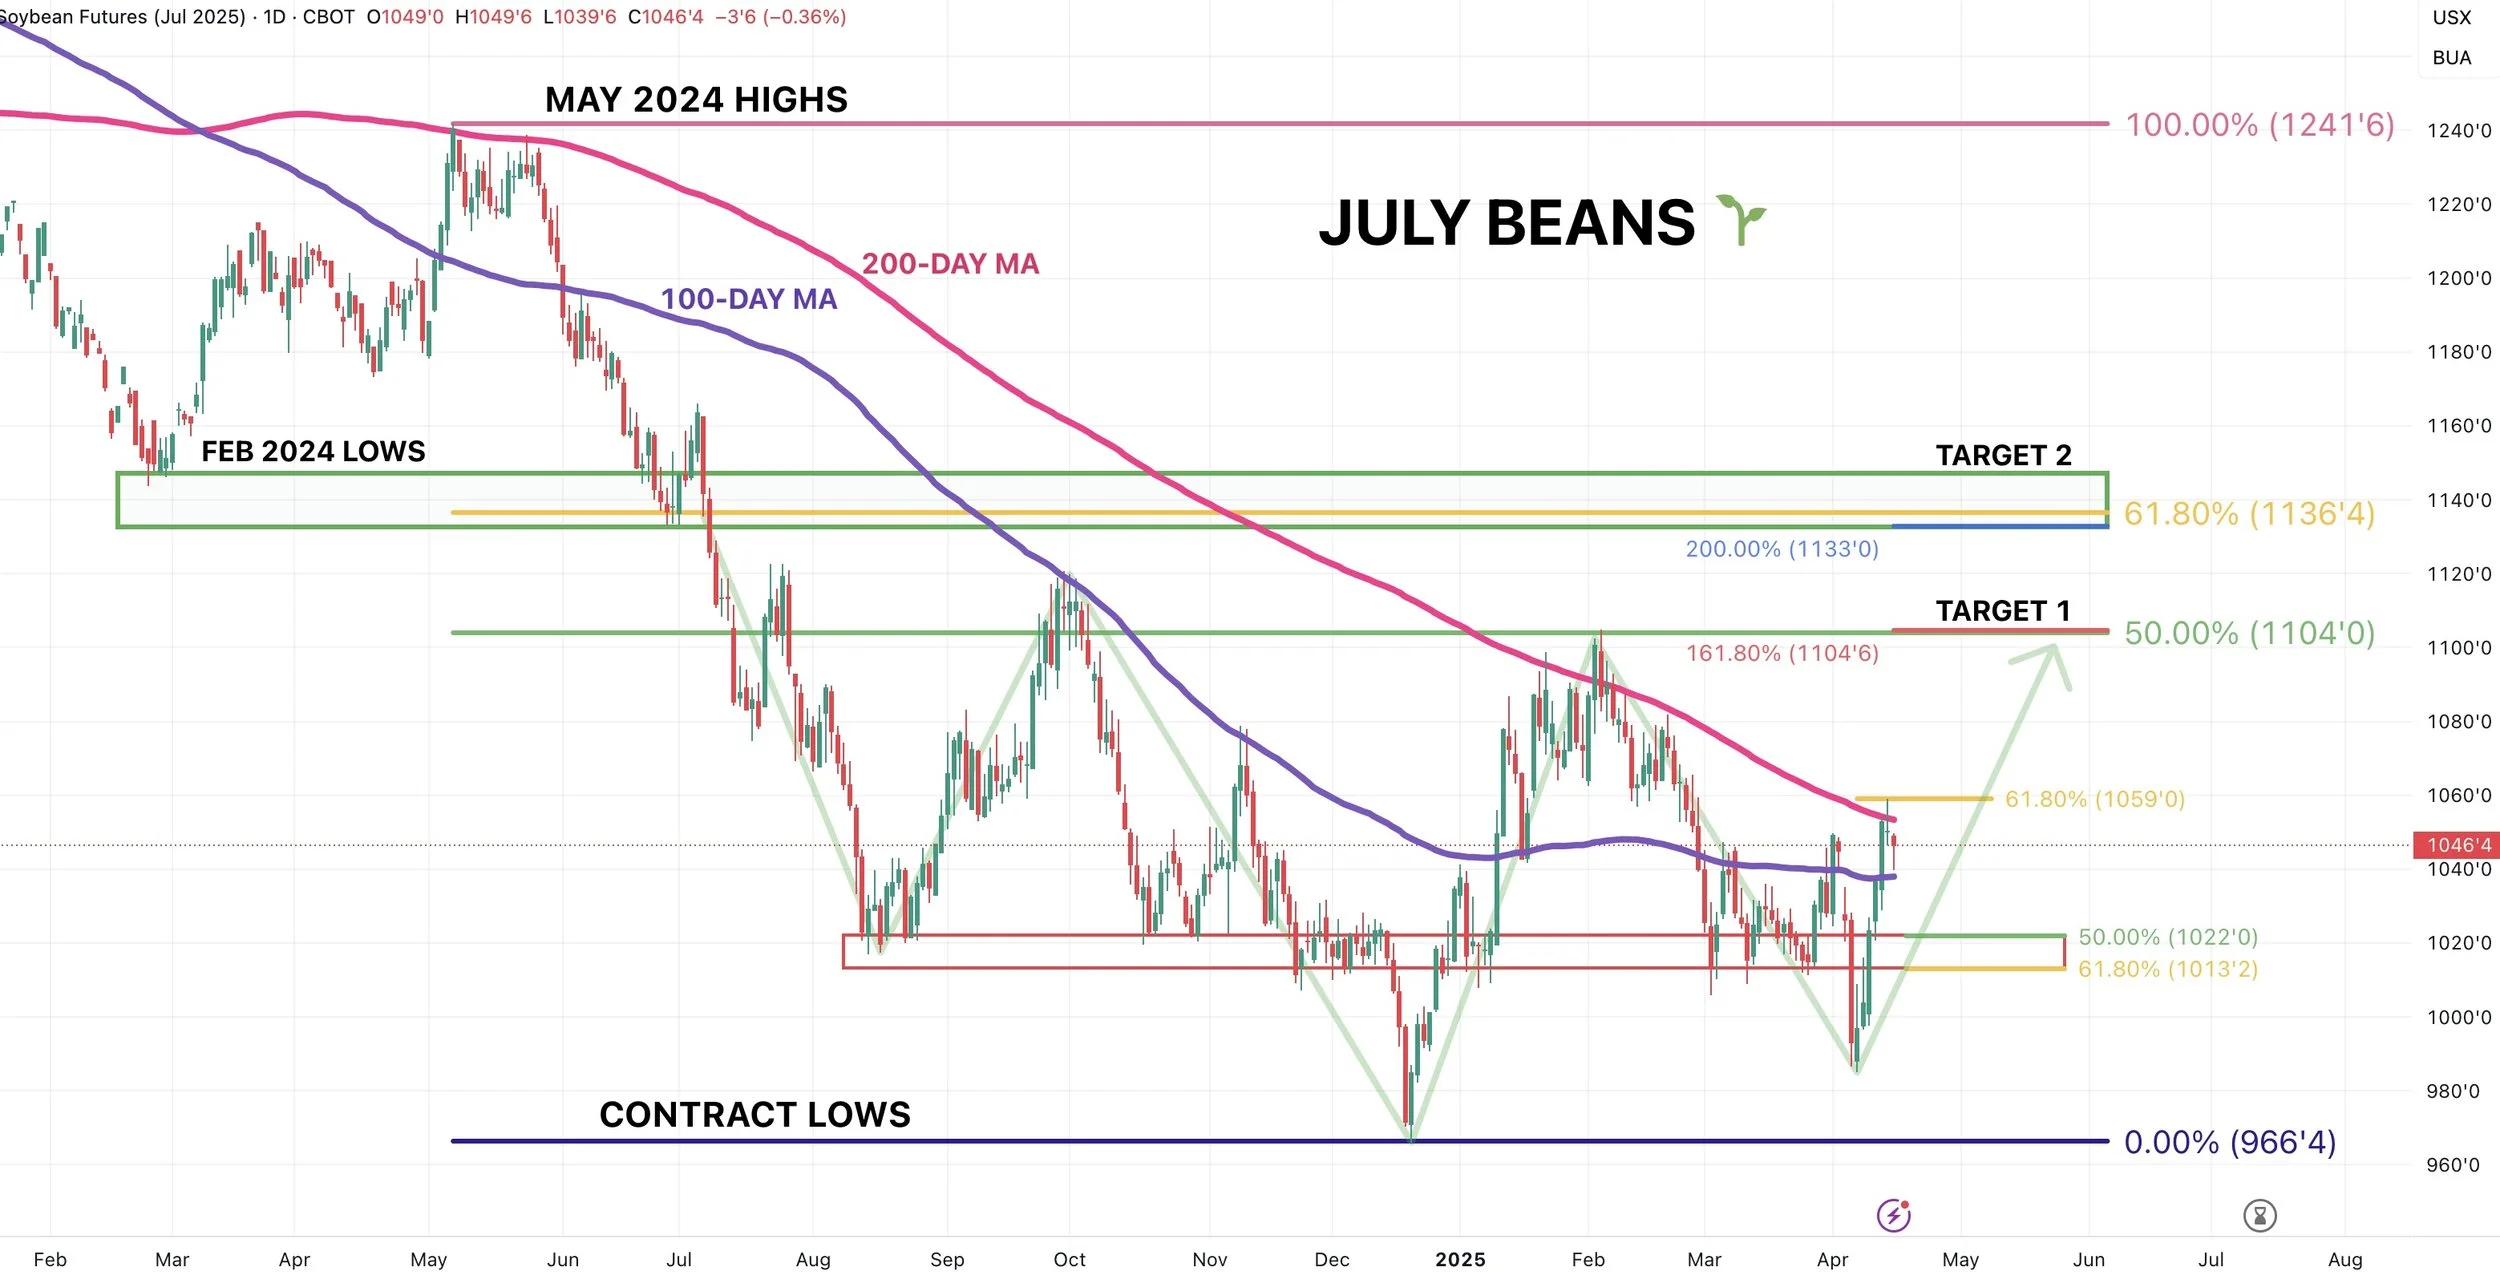
Next Targets:
Target #1)
$11.04
This gives us back exactly 50% of those May 2024 highs.
This is exactly where we topped out at recently in February.
It is also 161.8% of this recent +70 cent rally. (golden fib extension)
Big Picture Target #2)
$11.33 to $11.43
This is a slightly broader target as there are a few points of interest.
$11.33 is 200% of this recent rally from $9.85 to $10.59 (this is the 2nd fib extension after the 161.8%)
$11.36 gives us back 61.8% of our May 2024 highs.
$11.43 is our lows from February 2024.
Short term, bulls ideally hold the 100-day MA (purple line).
If not, a drop back into that red key support box would not be shocking nor damage the charts, as that would be a standard correction of 50-61.8% of the recent rally.
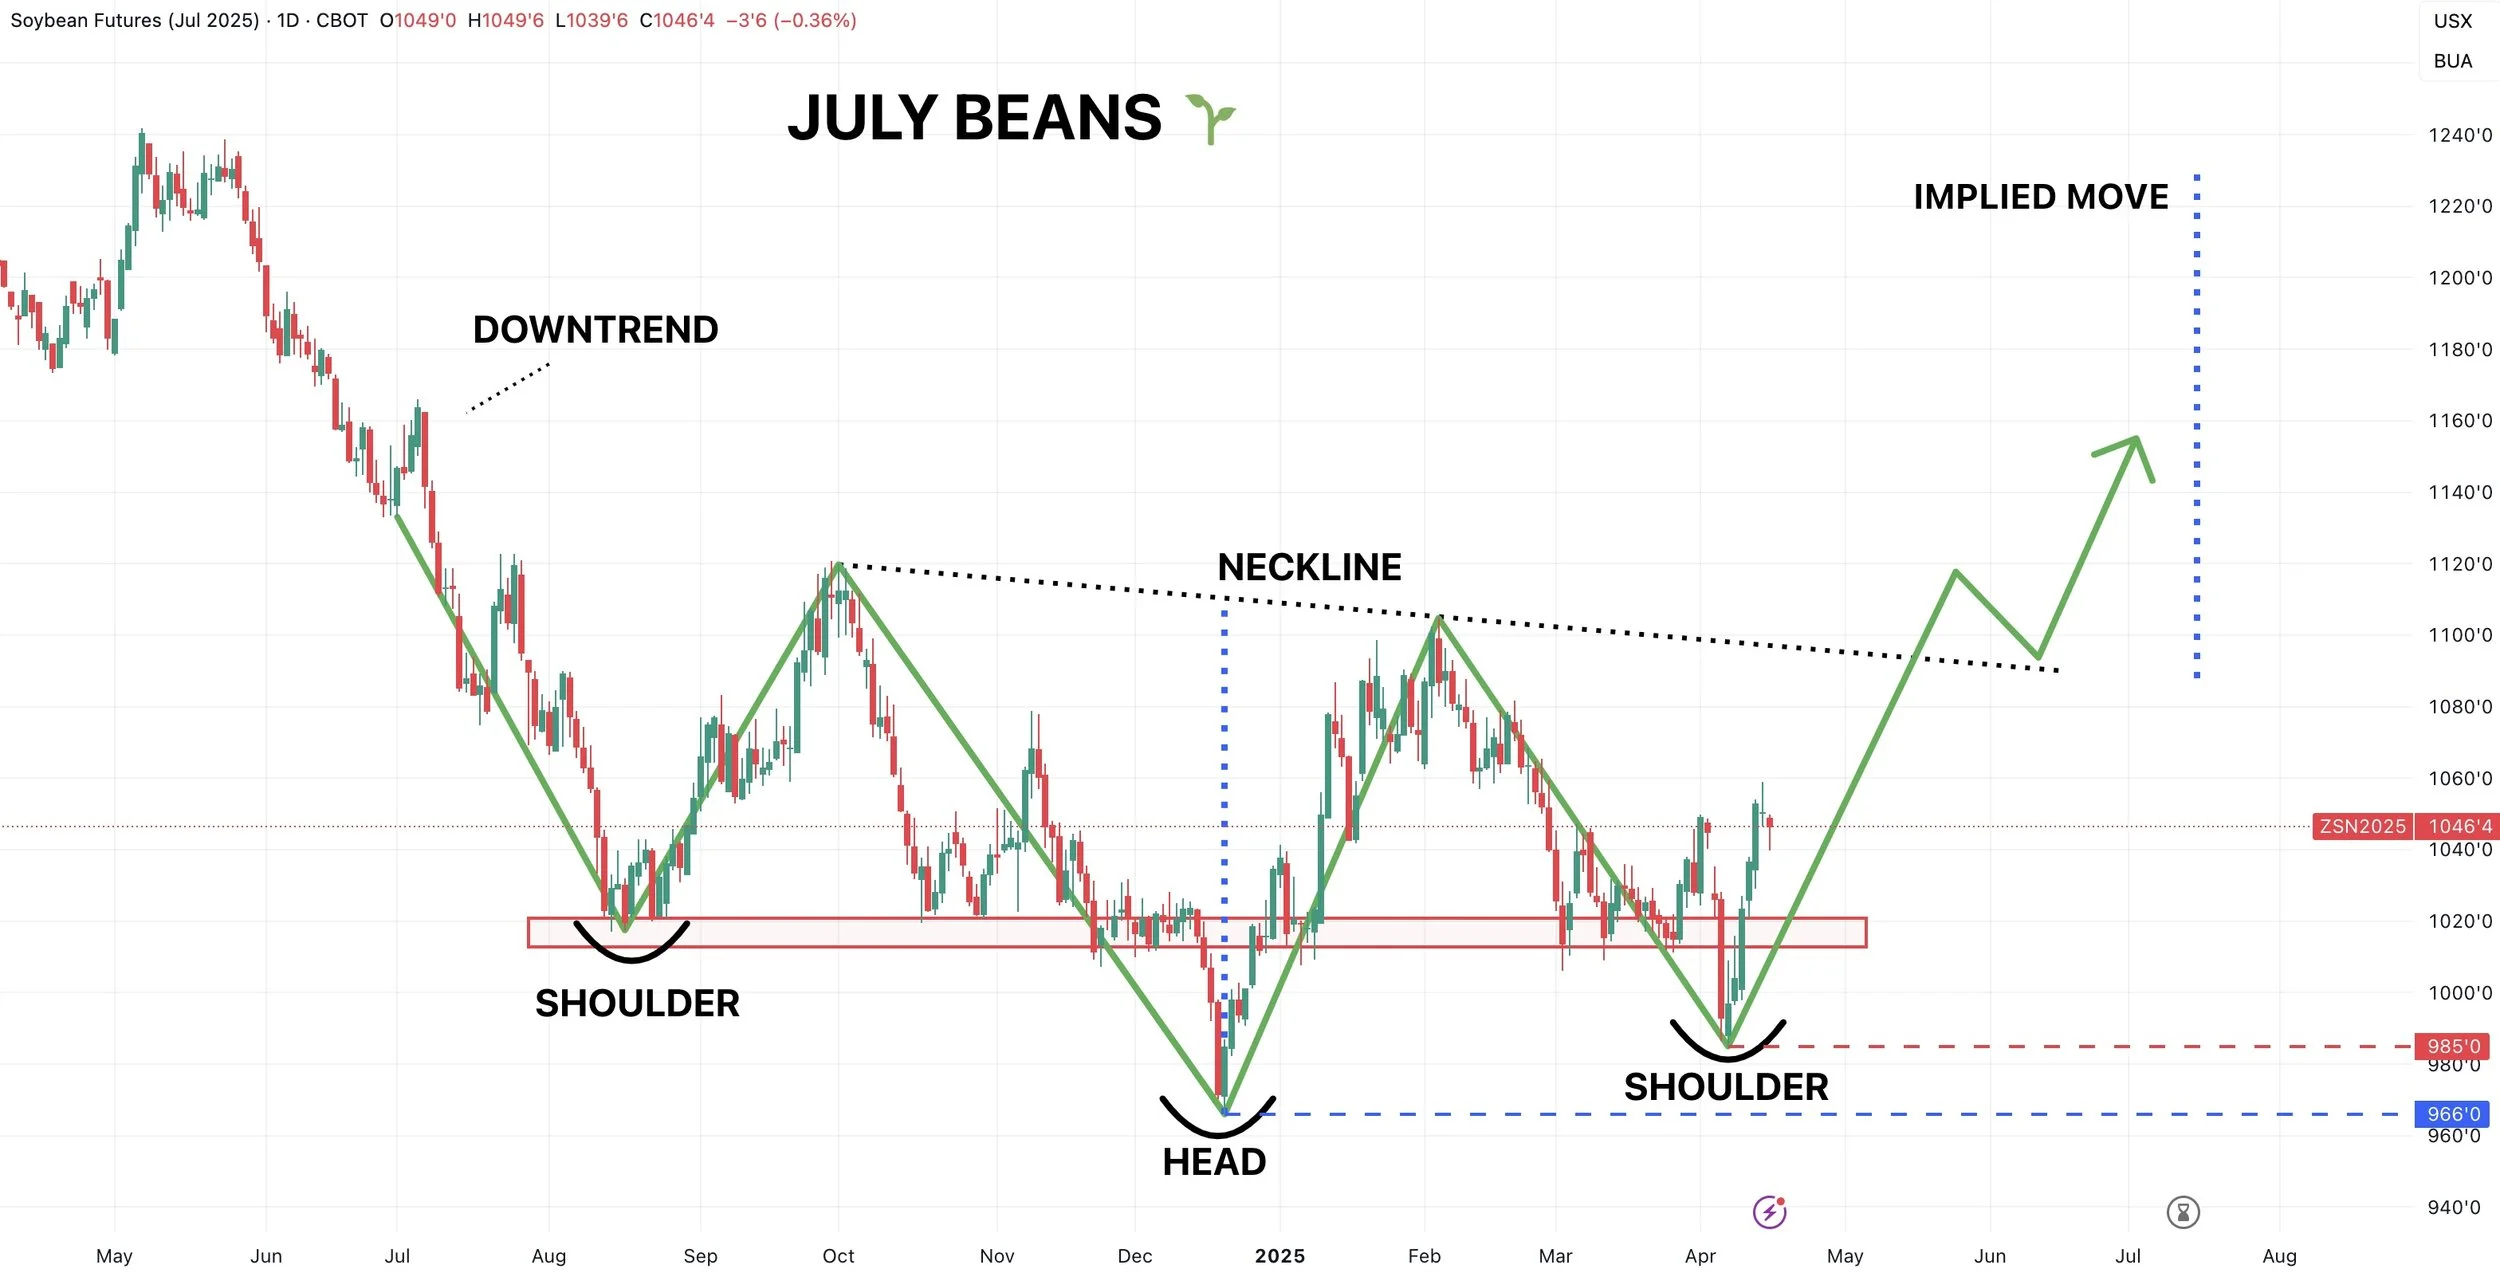
We do still have this inverse head & shoulders pattern in play for both old crop & new crop.
The implied move for this pattern is over $12 for old crop beans and $11.80 for new crop beans.
I think new crop beans could have a shot at this given the fundamental story, with less acres etc. But it is tough to think old crop beans will have enough strength to pull it off.
Nonetheless, it is a bullish pattern whether the implied move hits or not.
A break above the neckline in either should result in a leg higher.
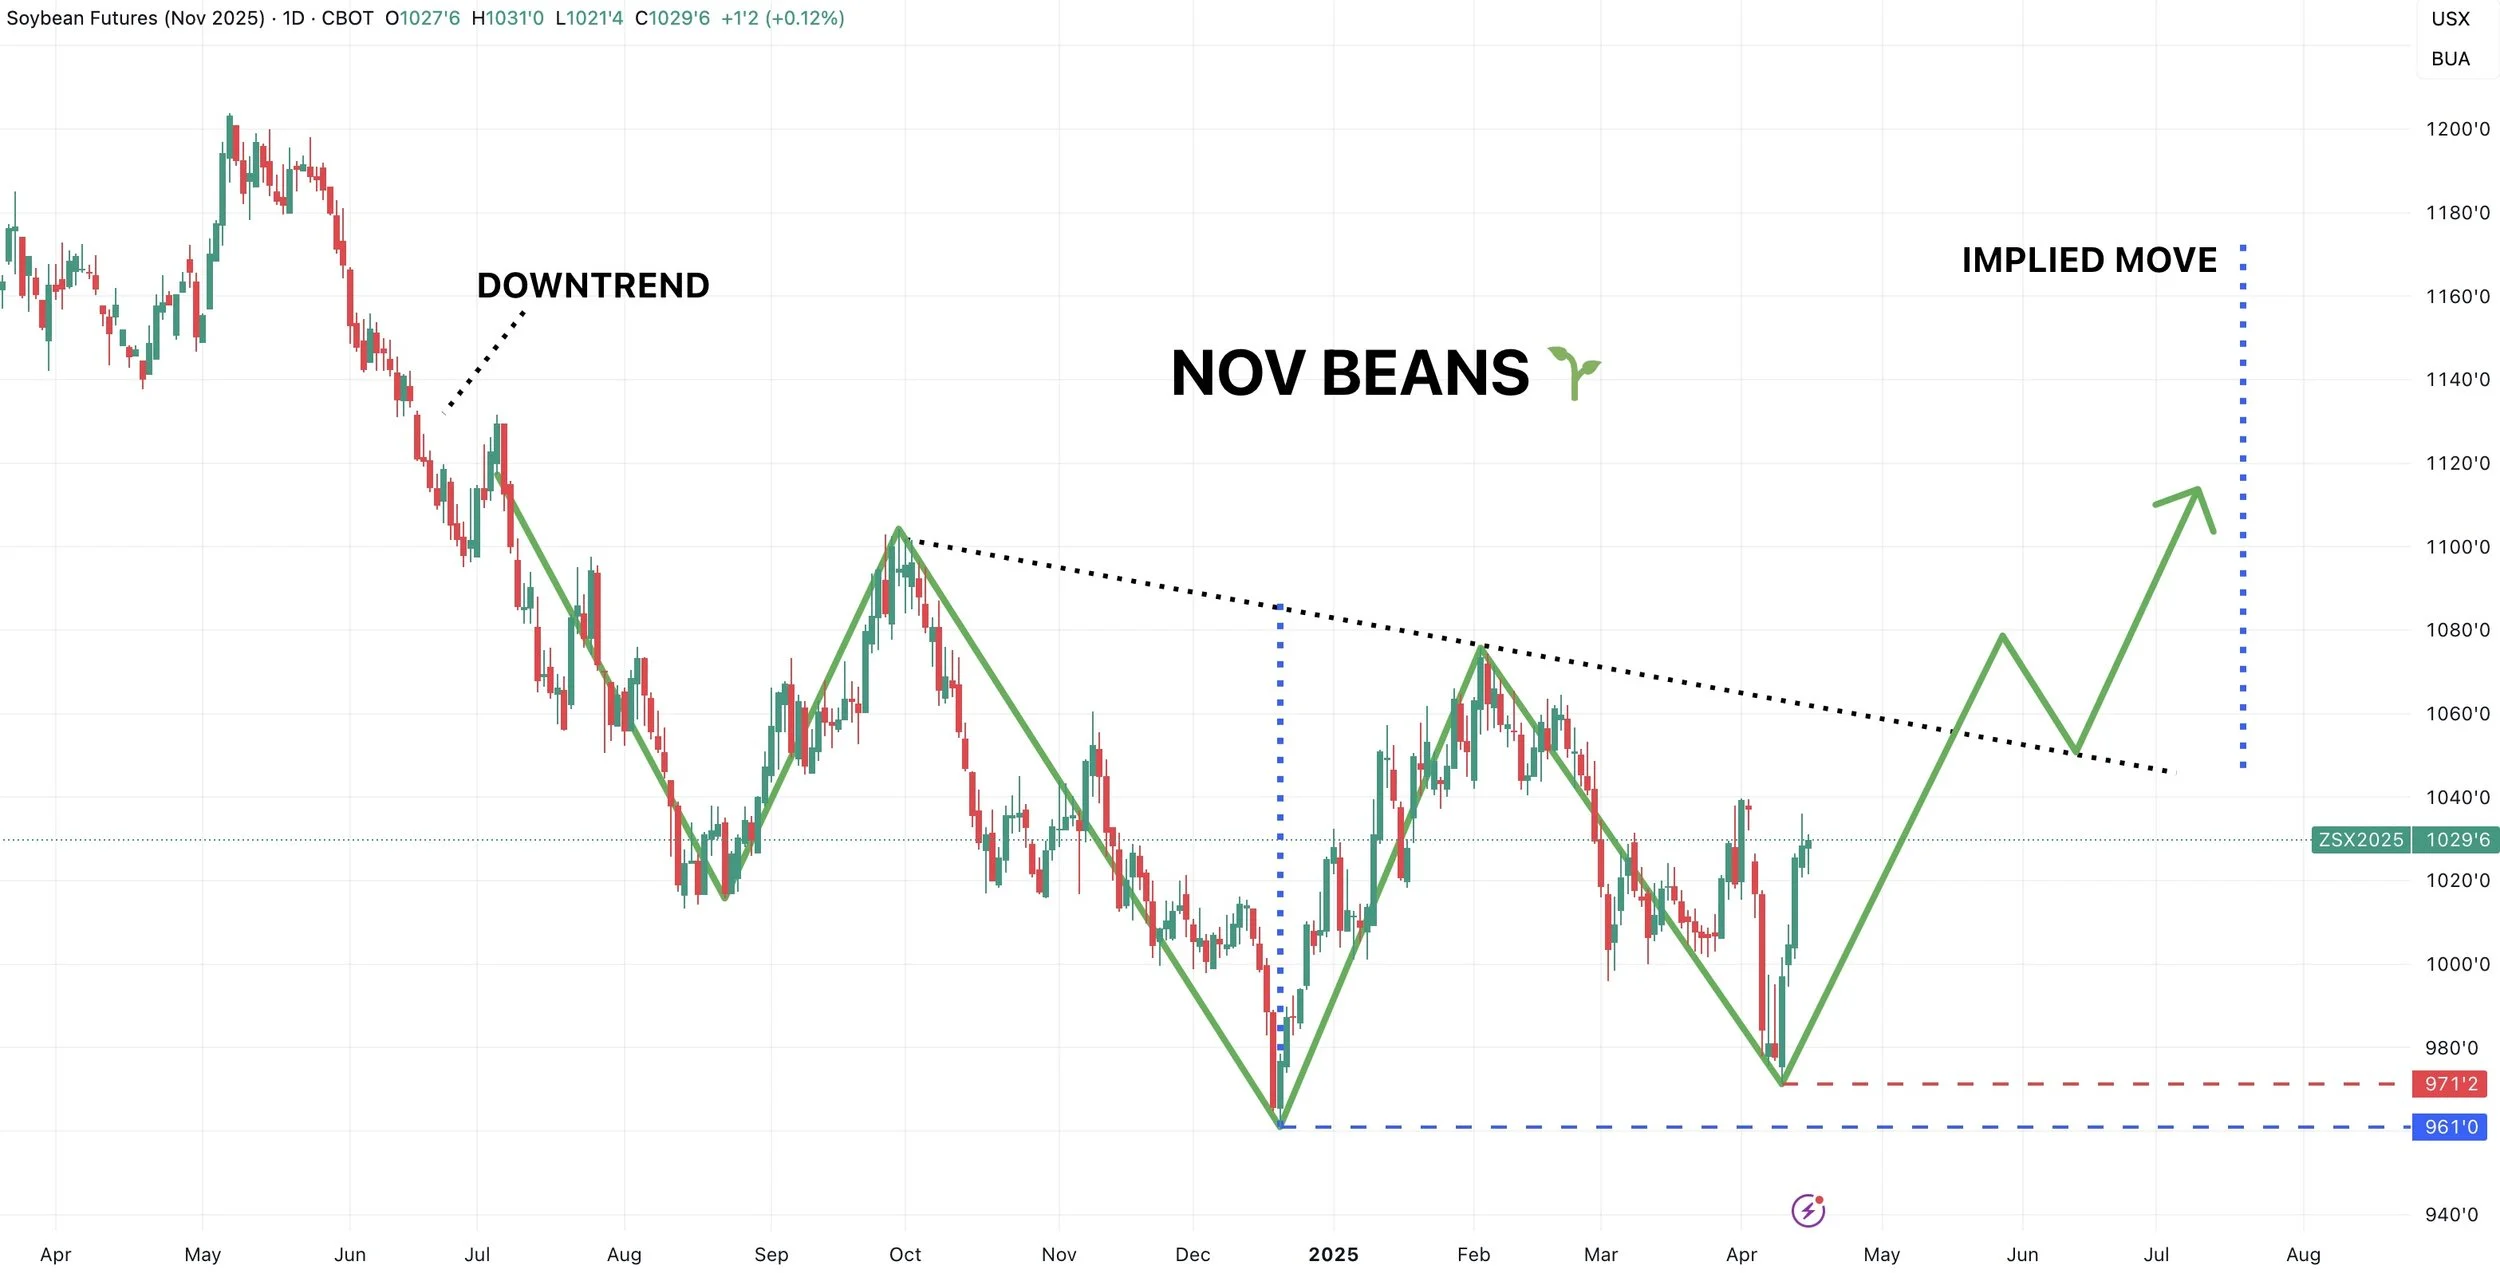
New Crop Nov Beans:
Just like in corn & old crop beans, Nov beans too exactly rejected off the 61.8% retracement up to the Feb highs.
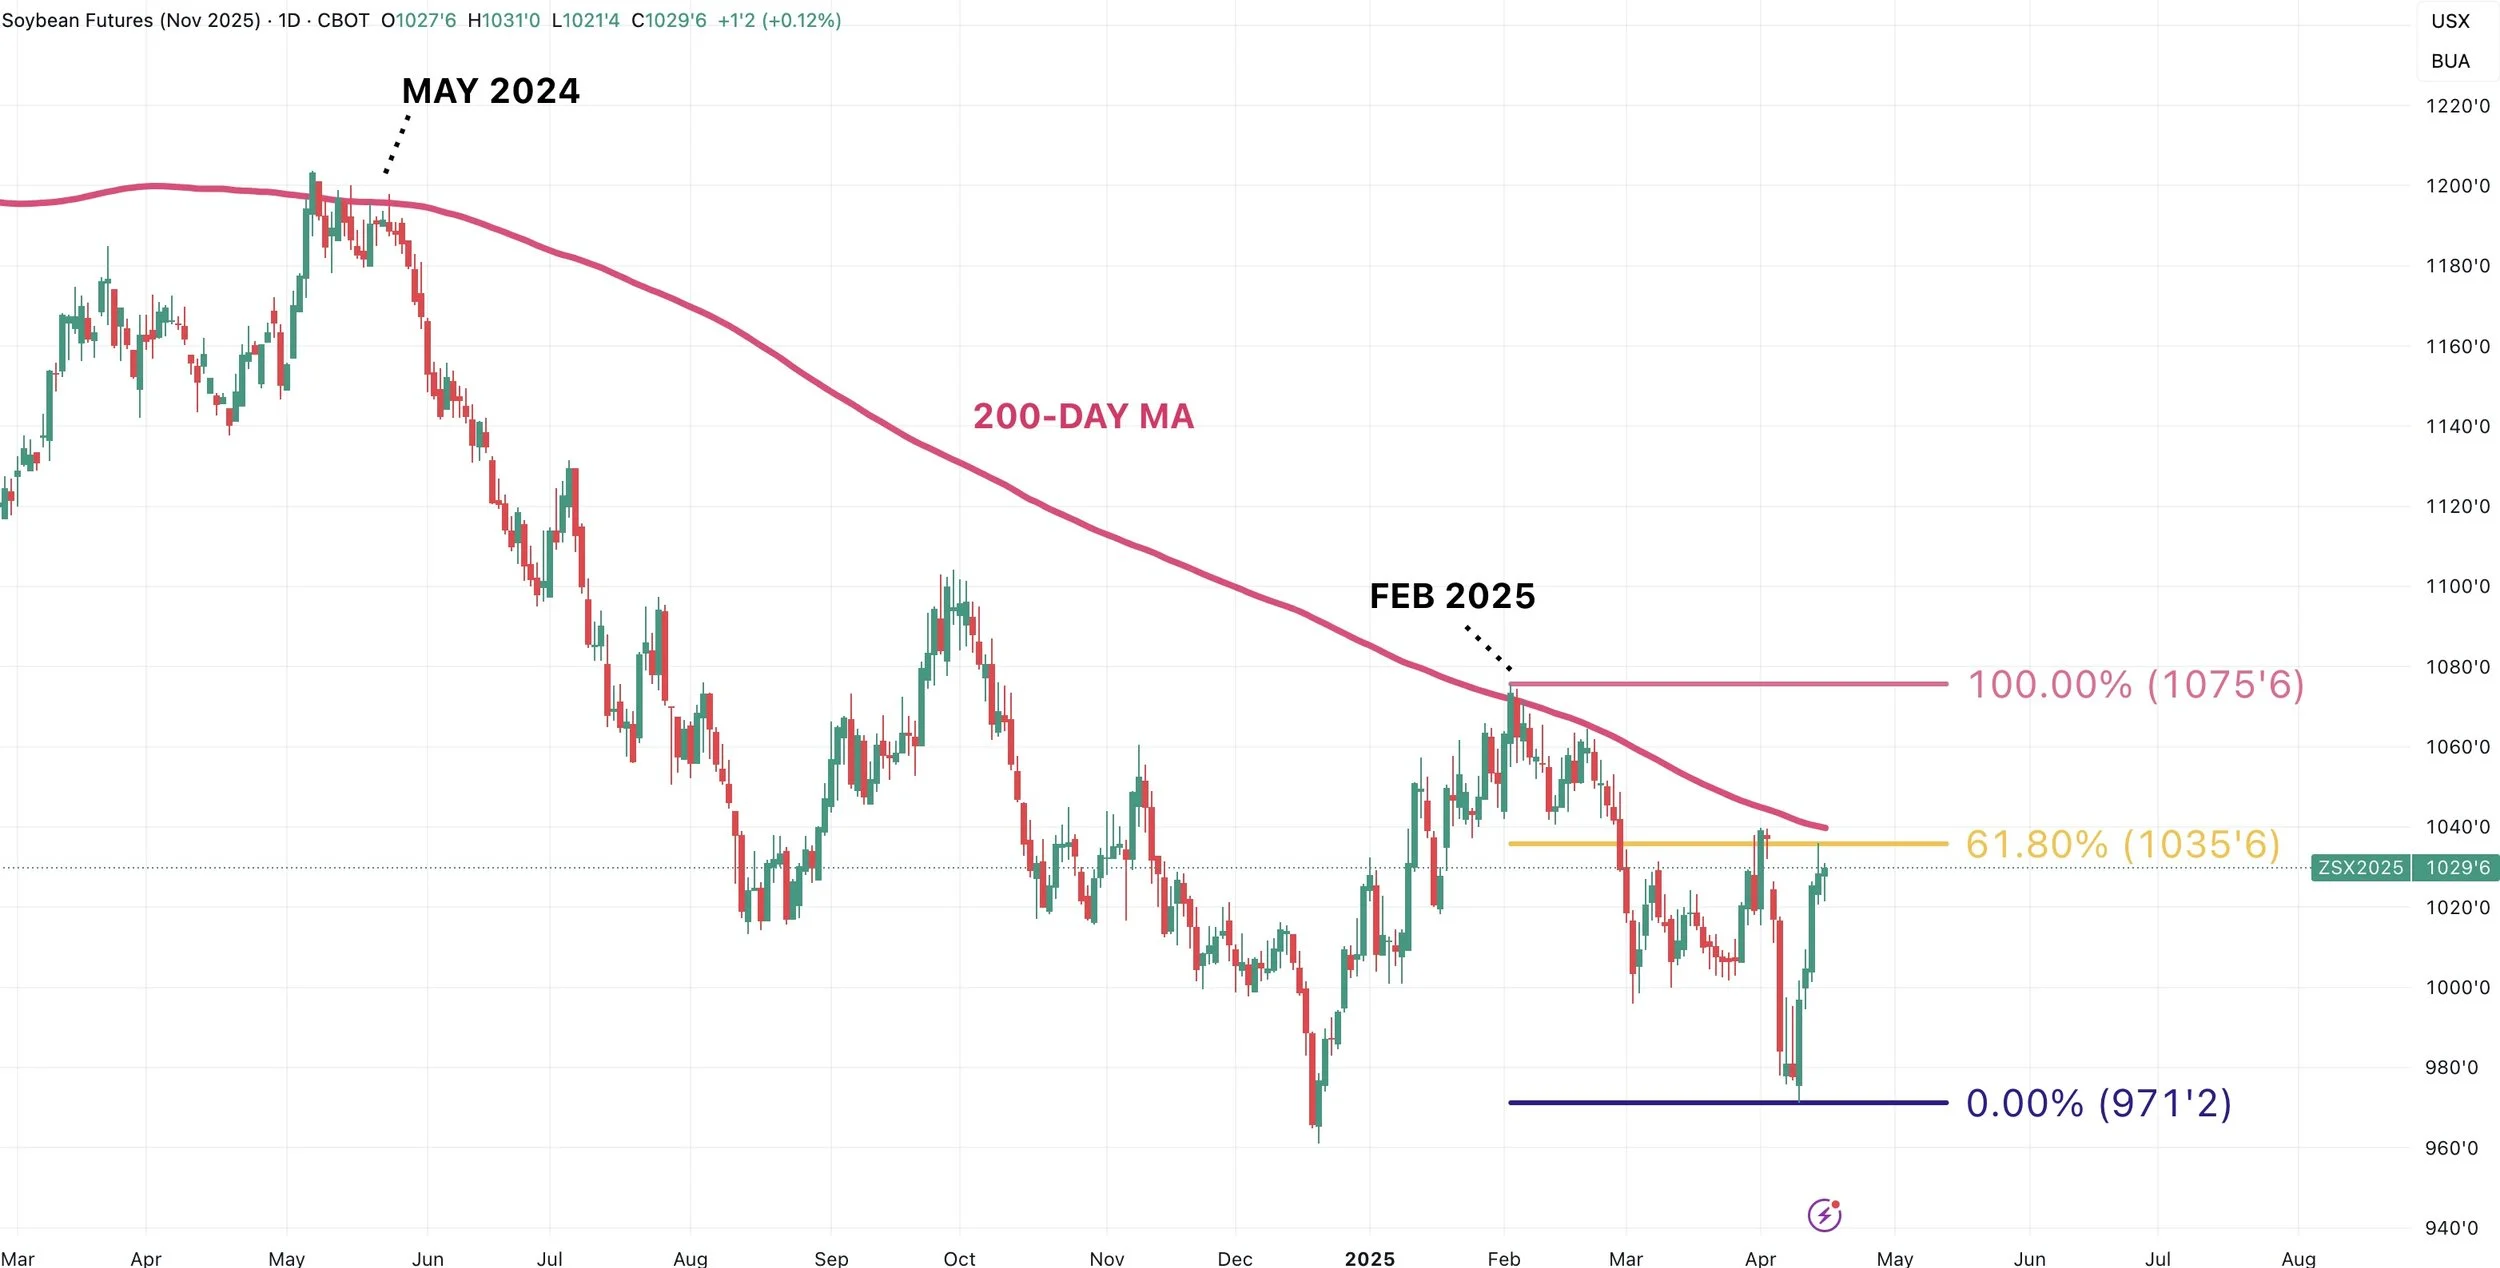
We are also right under the 200-day MA which has acted as a massive lid for Nov beans just like it has for old crop beans.
Next Targets:
Target #1)
$10.76 to $10.82
$10.82 is 50% of the May 2024 highs
$10.76 is our recent highs from February and just happens to also be the 161.8% fib extension from this recent rally.
Bigger Picture Target #2)
$11.11 is 61.8% of the May 2024 highs. This is also just under our lows from February 2024.

Wheat
Not much to update on the wheat charts as they are still hovering near the lows.
However, both Chicago and KC wheat are still holding support.
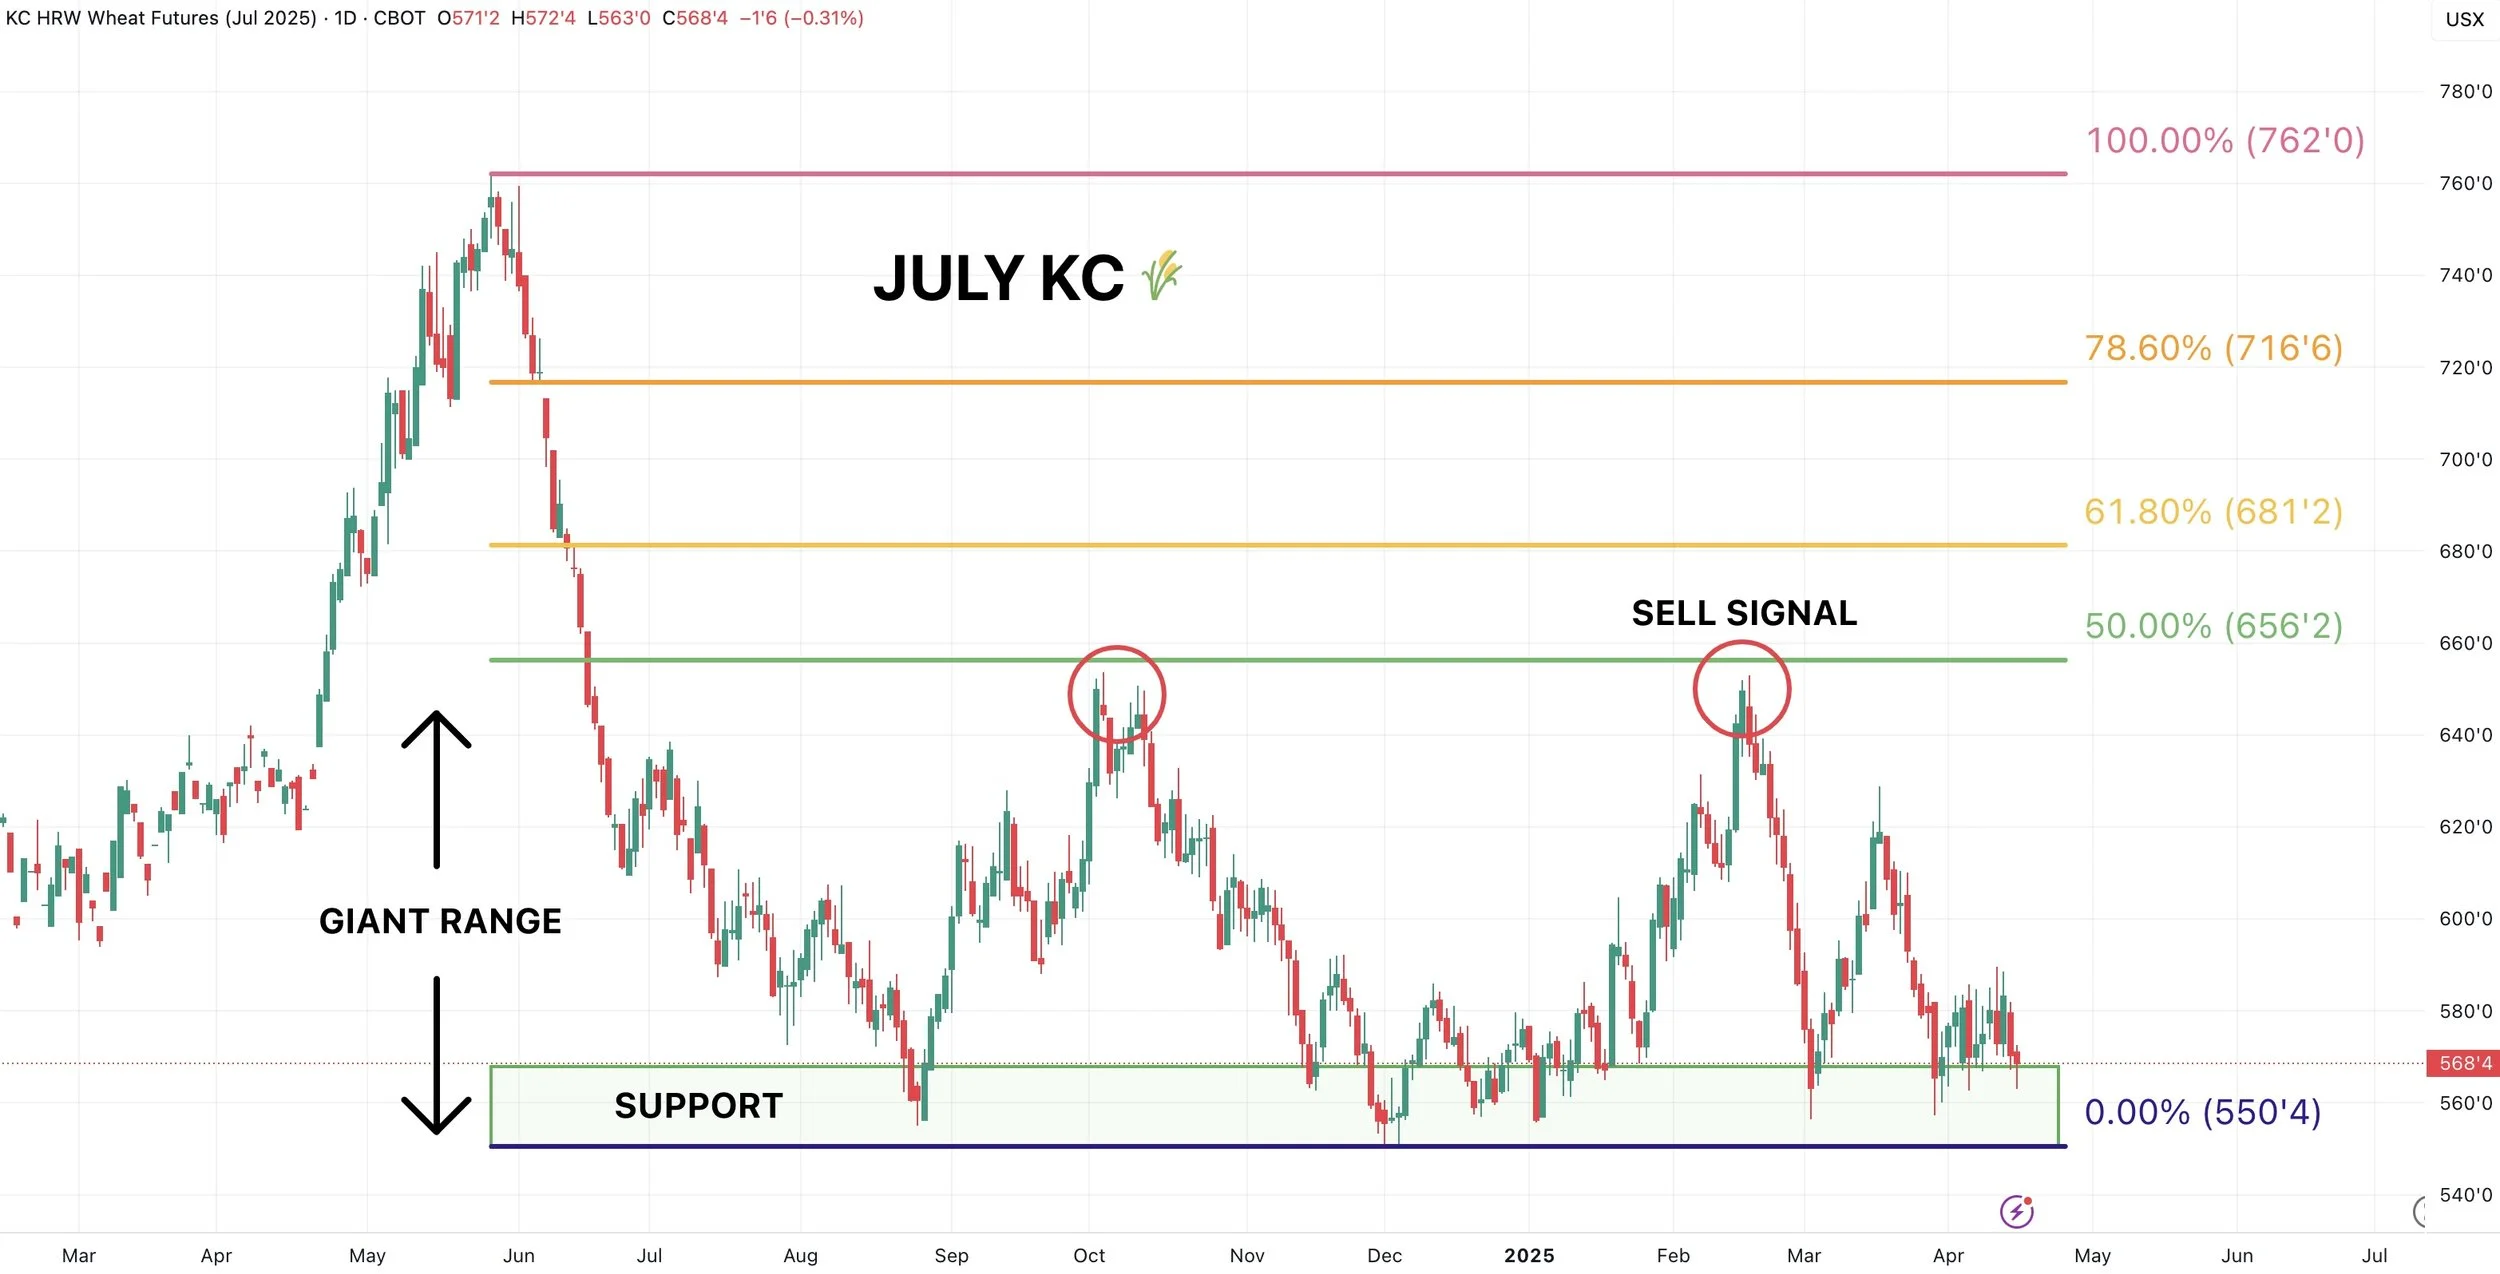
July KC Wheat:
We have held this support since August.
Nothing changes as long as we continue to do so.
Next spot to look to de-risk is going to be the top of the range once again.
Break above those Oct and Feb highs of $6.53 then it should spark a leg higher. But until then, that is the next upside objective.
July Chicago:
Trapped in a downward channel.
Holding where it needs to this far.
Next upside objective is the top of the channel.

Past Sell or Protection Signals
We recently incorporated these. Here are our past signals.
April 10th: 🌽
Old crop corn sell signal.
March 19th: 🐮
Cattle hedge & sell signal.
Feb 18th: 🌽 🌾
Old crop KC wheat & old crop corn signal.
Jan 23rd: 🌽 🌱
Corn & beans old crop sell signal.
CLICK HERE TO VIEW
Jan 15th: 🌽 🌱
Corn & beans hedge alert/sell signal.
Jan 2nd: 🐮
Cattle hedge alert at new all-time highs & target.
Dec 11th: 🌽
Corn sell signal at $4.51 200-day MA
CLICK HERE TO VIEW
Oct 2nd: 🌾
Wheat sell signal at $6.12 target
Sep 30th: 🌽
Corn protection signal at $4.23-26
Sep 27th: 🌱
Soybean sell & protection signal at $10.65
Sep 13th: 🌾
Wheat sell signal at $5.98
May 22nd: 🌾
Wheat sell signal when wheat traded +$7.00
Want to Talk?
Our phones are open 24/7 for you guys if you ever need anything or want to discuss your operation.
Hedge Account
Interested in a hedge account? Use the link below to set up an account or shoot Jeremey a call at (605)295-3100.
Check Out Past Updates
4/14/25
TECHNICAL SELLING IN GRAINS
4/11/25
SPECIFIC GRAIN MARKETING DECISIONS
4/10/25
USDA REPORT. HOW THIS IMPACTS CORN
4/9/25
TARIFFS GIVE. TARIFFS TAKE
4/8/25
CORN’S DIVERGING STRENGTH
4/7/25
SOLID PRICE ACTION DESPITE OUTSIDE FEAR
4/4/25
CORN PRICE ACTION SPEAKS VOLUME. ANY HOPE LEFT FOR SOYBEANS?
4/3/25
WHAT IS LEFT FOR CORN BEARS? TRADE WAR: CHARTS HOLDING SUPPORT
4/2/25
SHOULD UNKNOWNS KEEP A FLOOR UNDER GRAIN PRICES?
4/1/25
HOW DO ACRES IMPACT FUTURE OF THE GRAINS?
3/31/25
USDA REPORT: NOW WHAT?
3/28/25
ALL EYES ON USDA
3/27/25
PRE-USDA POSITIONING. DON’T GIVE GRAIN AWAY
3/26/25
HISTORY OF MARCH INTENTIONS. SOYBEANS UNDERVALUED?
3/25/25
6 DAYS UNTIL MAJOR USDA REPORT
3/24/25
HOW TO POSITION YOURSELF BEFORE PLANTING
3/21/25
REASONS TO BE OPTIMISTIC IN GRAINS?
3/20/25
WAS THAT THE BOTTOM IN CORN?
3/19/25
THE PATH HIGHER & THE DOWNSIDE RISKS IN GRAINS
3/18/25
SEASONALS, CATTLE HEDGE, CHARTS & DROUGHT?
3/17/25
WHEAT RALLIES. DON’T GET BACKED INTO A CORNER
3/14/25
MARCH 31ST REPORT THOUGHTS & WHAT’S NEXT FOR GRAINS
3/13/25
EXPLAINING RE-OWNERSHIP VS COURAGE CALLS
3/12/25
TARIFF FEARS. EU, CANADA, & ETHANOL
3/11/25
USDA SNOOZE. RECORD FUND SELLING A CONCERN?
3/10/25
USDA TOMORROW. GETTING COMFORTABLE IN MARKETING
3/7/25
HOW TIGHT IS THE WORLD & US SITUATION?
3/6/25
TARIFFS PUSHED BACK. FUTURE OPPORTUNITIES?
3/5/25
IS GRAINS BIGGEST RISK WEAK CRUDE & DEFLATION?
3/4/25
TRADE WAR BEGINS. 8TH DAY OF PAIN FOR GRAINS
3/3/25
TARIFFS ON TOMORROW. BUY SIGNAL
3/3/25
BUY SIGNAL
2/28/25
WHEN WILL THE BLEEDING STOP?
2/27/25
CORN AT CRITICAL SPOT. USDA ACRE REPORT. WAY TOO EARLY DROUGHT TALK
2/26/25
HISTORY SUGGESTS CORN TOP ISN’T IN? ACRE OUTLOOK TOMORROW
2/25/25
POSITIVE CLOSE. WHAT TO KNOW ABOUT USDA OUTLOOK
2/24/25
USDA OUTLOOK, FIRST NOTICE DAY & BRAZIL
2/21/25
WHAT TO EXPECT MOVING FORWARD IN GRAINS
2/20/25
FIRST NOTICE DAY CONCERNS. MASSIVE CORN ACRES OR NOT?
2/19/25
HOW TIGHT IS THE CORN SITUATION?
2/18/25
MORE DETAILS ON TODAYS SELL SIGNAL
2/18/25
OLD CROP KC WHEAT & CORN SELL SIGNAL
2/14/25
WHEAT BREAKING OUT ON WEATHER RISK. TECHNICALS & FUNDAMENTALS
2/12/25
GLOBAL GRAIN SITUATION, ACRE TALK, CHARTS & MORE
2/11/25
USDA: NOT A BEARISH REPORT. DISAPPOINTING PRICE ACTION
2/10/25
USDA TOMORROW. LONG TERM PATH FOR SUB 10% CORN STOCKS TO USE?
2/7/25
WHY WOULD THE FUNDS EXIT THEIR LONGS?
2/6/25
WHEAT FINALLY CATCHING A BID
2/5/25
COMPLETE THOUGHTS ON MARKETS: BACK & FORTH DISCUSSION
2/4/25
STRONG JANUARY LEAD TO STRONG YEAR? TARIFFS, CHARTS & MORE
2/3/25
TARIFFS PUSHED BACK
1/31/25
TARIFF NEWS ALL OVER THE PLACE. ARE YOU PREPARED FOR POSSIBILITIES?
1/30/25
WHEAT BULL ARGUMENT. TRUMP ADDS TARIFFS
1/29/25
CORN APPROACHES $5.00
1/28/25
TARIFFS, CORN FUNDS, SOUTH AMERICA & MORE
1/27/25
HEALTHY CORRECTION WE TALKED ABOUT & TARIFF NEWS
1/24/25
GRAINS DUE FOR SHORT TERM CORRECTION?
1/23/25
OUR ENTIRE NEW CROP SALES THOUGHTS & OLD CROP SELL SIGNAL
1/22/25
GRAINS TAKE A BREATHER. IS CORN IN A BULL OR BEAR MARKET?
1/21/25
HUGE DAY IN GRAINS. WHAT TO DO WITH OLD CROP VS NEW CROP
Read More
1/20/25
VIDEO CHART UPDATE
1/17/25
TRUMP, CHINA, ARGY & USING THE SPREADS INVERSE
1/16/25
OLD CROP LEADS US LOWER. MARKETING THOUGHTS
1/15/25
SIGNAL & HEDGE ALERT QUESTIONS EXPLAINED. IS $6 CORN EVEN POSSIBLE?
1/14/25
MORE DETAILS ON TODAYS HEDGE ALERT & SELL SIGNAL
1/14/25
CORN & SOYBEANS HEDGE ALERT/SELL SIGNAL
1/13/25
USDA GAME CHANGER OR NOT?
1/10/25
BULLISH USDA FOR CORN & BEANS
1/9/25
USDA OUT TOMORROW
1/8/25
2 DAYS UNTIL USDA. BE PREPARED
1/7/25
THE HISTORY OF THE JAN USDA & MORE
1/6/25
MAJOR USDA REPORT FRIDAY
Read More
1/3/25
UGLY DAY ACROSS THE GRAINS
1/2/25