
ARGY TAXES REAPPLIED. HOW MUCH SUPPLY TO OFFSET DEMAND?
MARKET UPDATE
You can scroll to read the usual update as well. As the written version is the exact same as the video.
Timestamps for video:
Argy, China, Trump News: 0:00min
Exports: 2:45min
Seasonals: 4:00min
Corn: 4:45min
Beans: 8:15min
Wheat: 11:40min
Cattle: 13:05min
Want to talk about your situation?
(605)295-3100
Want every udpdate & sell signal?
Since you are not a subscriber you only receive a handful of our updates we send out every single day and will not get our next sell signal.
Lock in our harvest sale before its over
Futures Prices Close
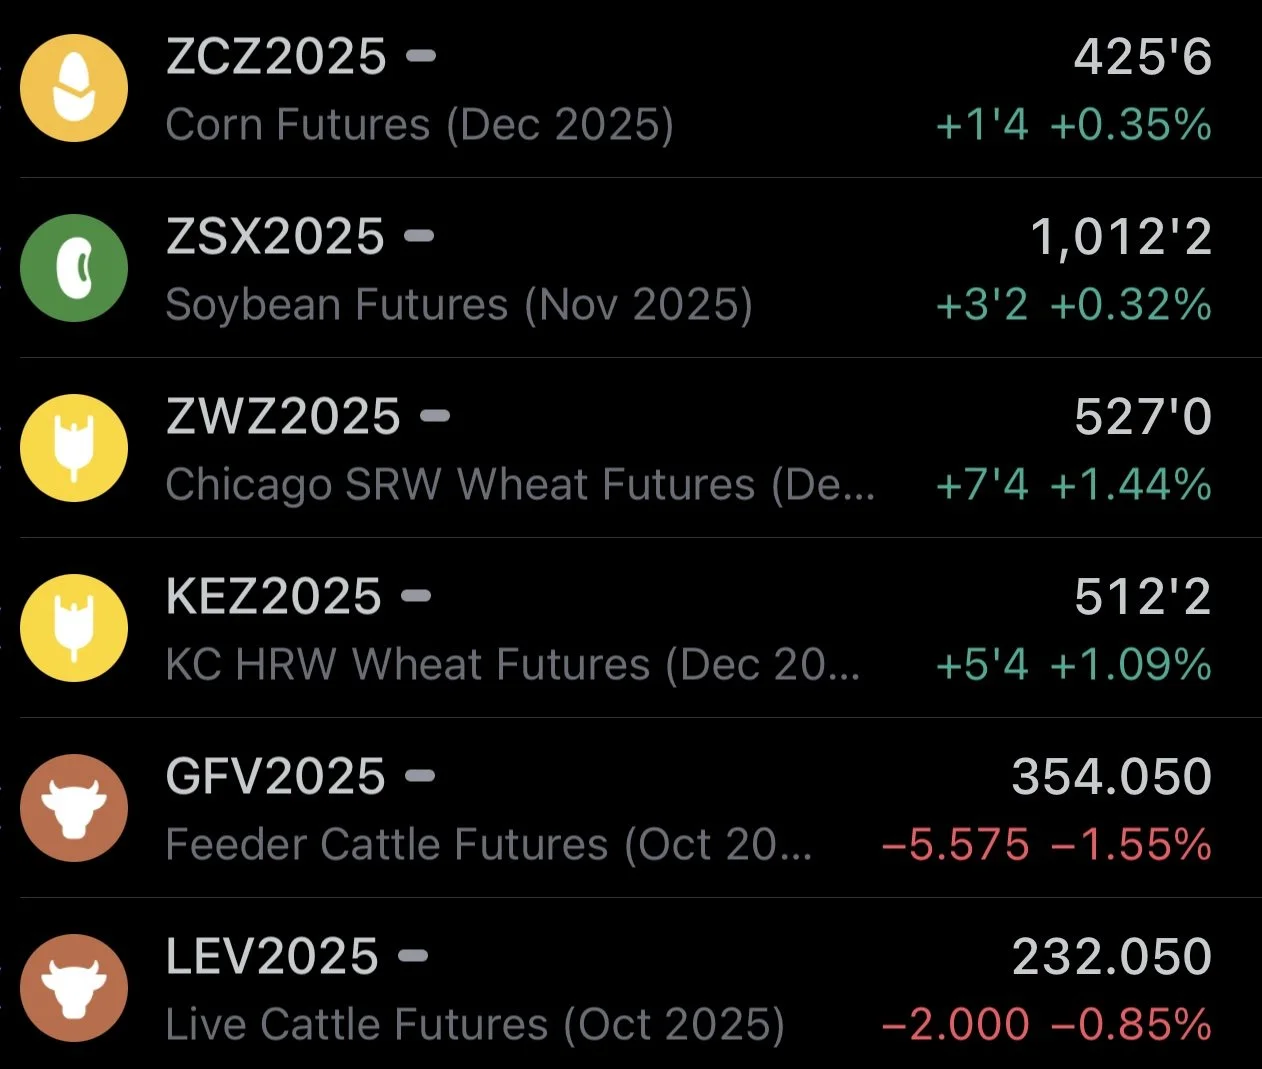
Overview
Decent day for the grains as the wheat market catches a bid while the cattle market takes a hit.
Earlier this morning all the grains were decently higher, but both corn & soybeans faded off the early highs.
This first story is probably the biggest reason for the strength.
Argy News
This was the biggest news today and had the grains higher this morning.
Argentina's cut to their export tax is already over after just 3 days. As export tax is back on for the grains but still on for beef.
The terms of this cut to export tax on grains were that the cuts remained until October 31st or if grain/oilseed export sales reached the $7 billion cap.
They already met that $7 billion cap so taxes have been re-applied.
Sources say that China bought around 90 million bushels of soybeans from Argentina while taxes were cut.
So we undoubtedly lost some business there.
However, we probably won’t be seeing much more business out of Argentina now.
The reason that Argentina did the tax cuts was to generate some cash and help boost their economy.
As the Argentina Peso has lost -99% of it's value compared to the US Dollar in the past decade, and lost -30% of it's value this year alone. Despite getting a +10% bounce this week due to all of this news.

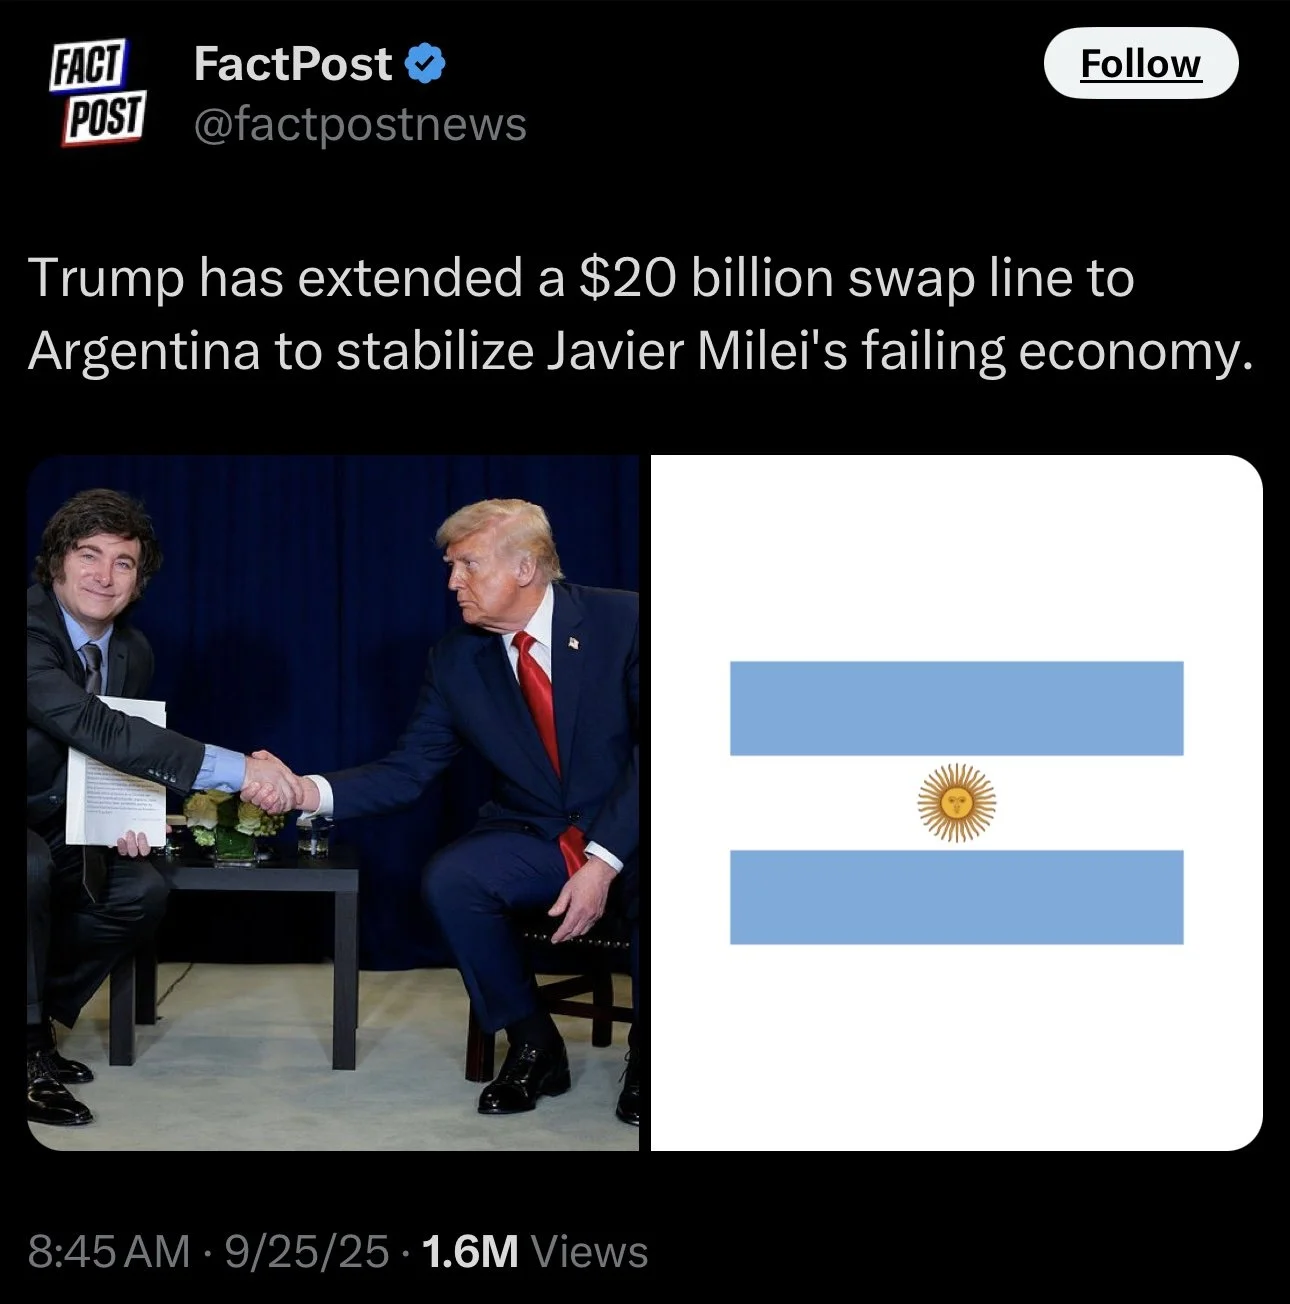
The US has now announced they are going to extend a $20 billion currency swap line to Argentina, and also buy Argentina's bonds.
Essentially, they are lending $20 billion USD to Argentina. Argentina can then use that money to help stabilize it's economy. Later on, Argentina is then suppose to swap the money back to the US.
By the US doing this, yes we are helping support one of our biggest competitors. But by giving them money, does that now help keep their exports closed for longer now? Potentially helping China come to the table if Argy is closed for business. Who knows, but something to think about.
China News
On Monday, China expressed that they were possibly interested in buying US soybeans.
They signaled that they could buy US soybeans ahead of bigger trade talks "IF" the tariffs were dropped.
On the export market, US soybeans are cheaper than Brazil. But the tariffs are making Brazil beans cheaper than US ones. So China continues to stay away.
Basically, China says they will only buy our beans if we lift the tariffs.

Trump News
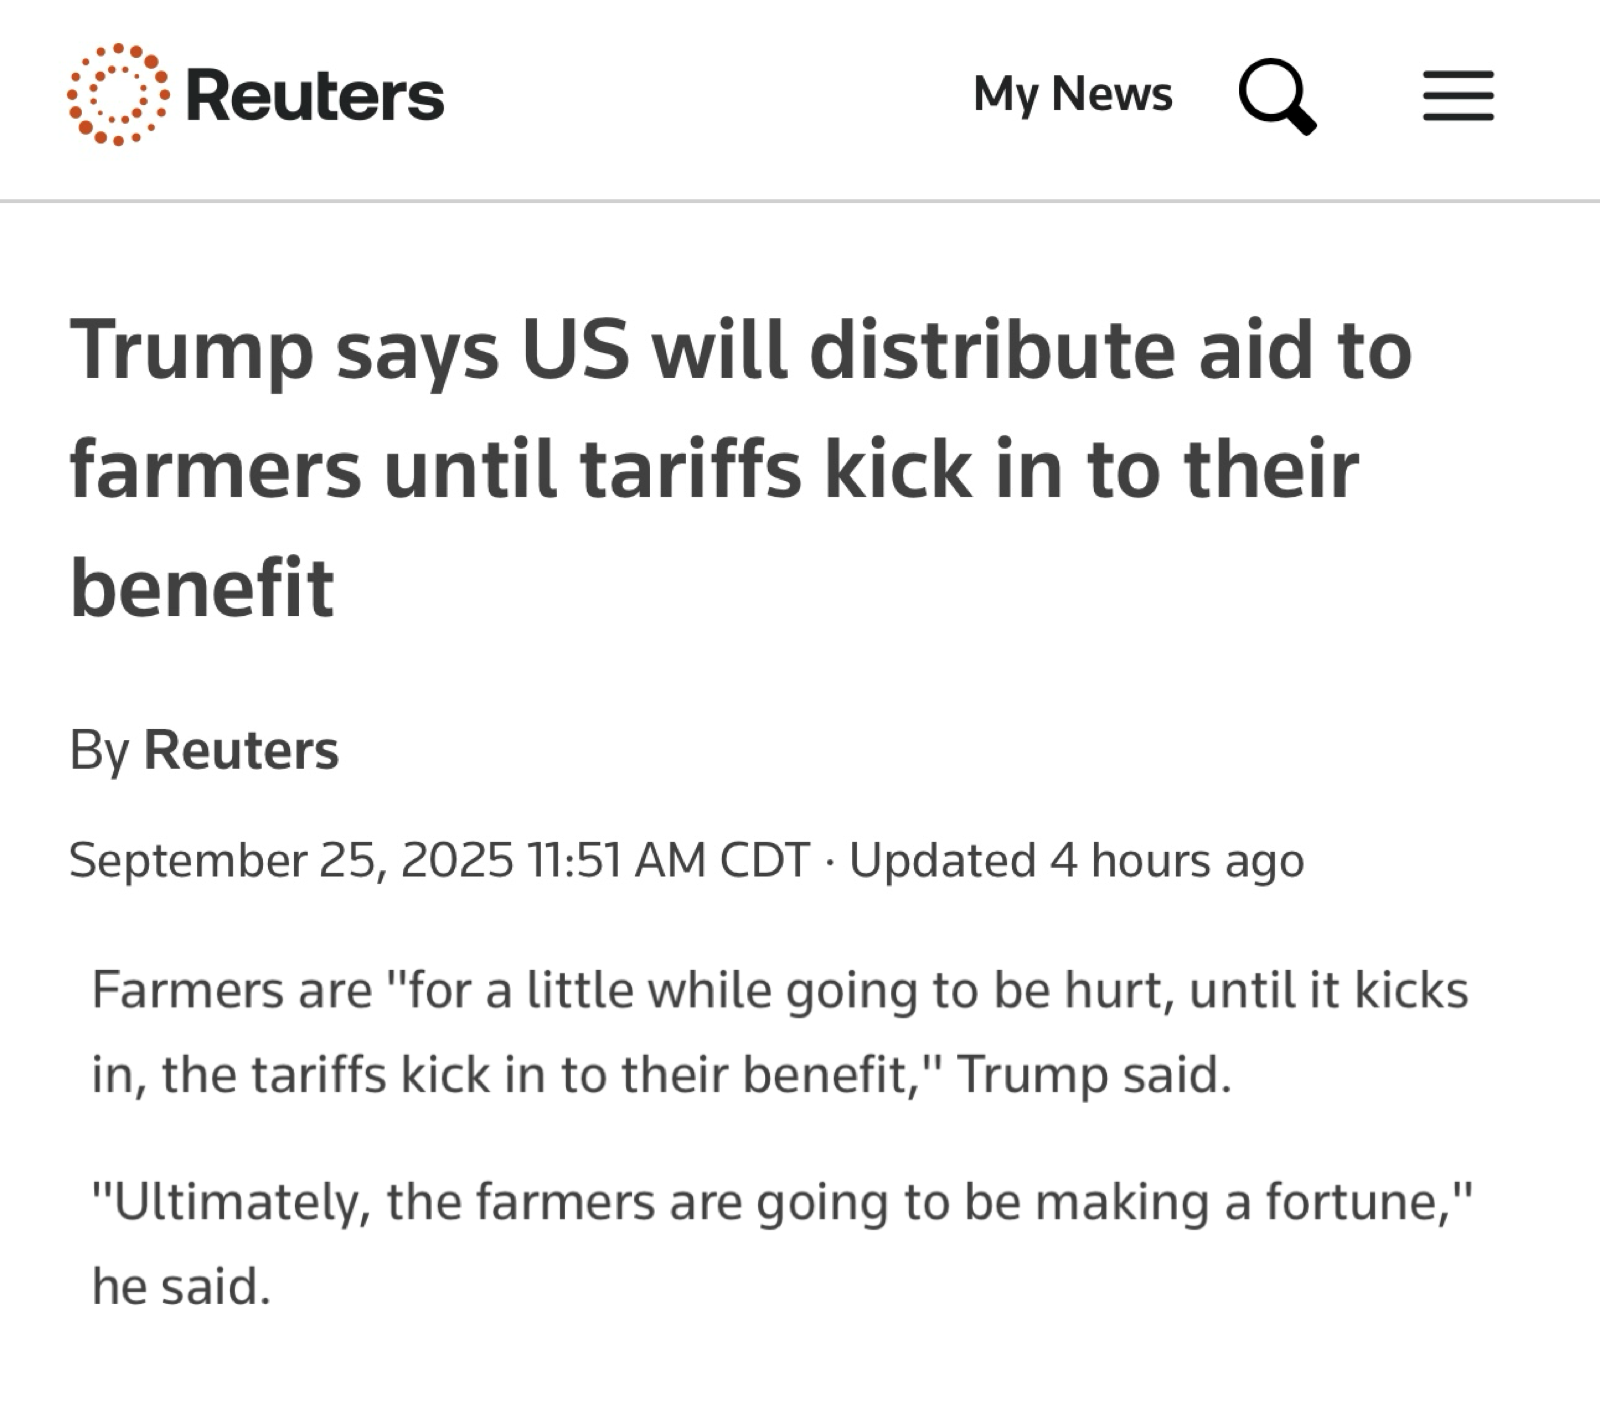
Trump announced that US farms will receive some of the proceeds from tariff revenues.
He said:
"Farmers are going to hurt for a little while, until the tariffs kick in to their benefit."
"Ultimately, the farmers are going to be making a fortune."
This does kind of sound like he is not expecting a deal to be struck with China soon, as he makes it sound like the tariffs are here to stay and China essentially said they won’t buy soybeans until the tariffs go away.
Exports
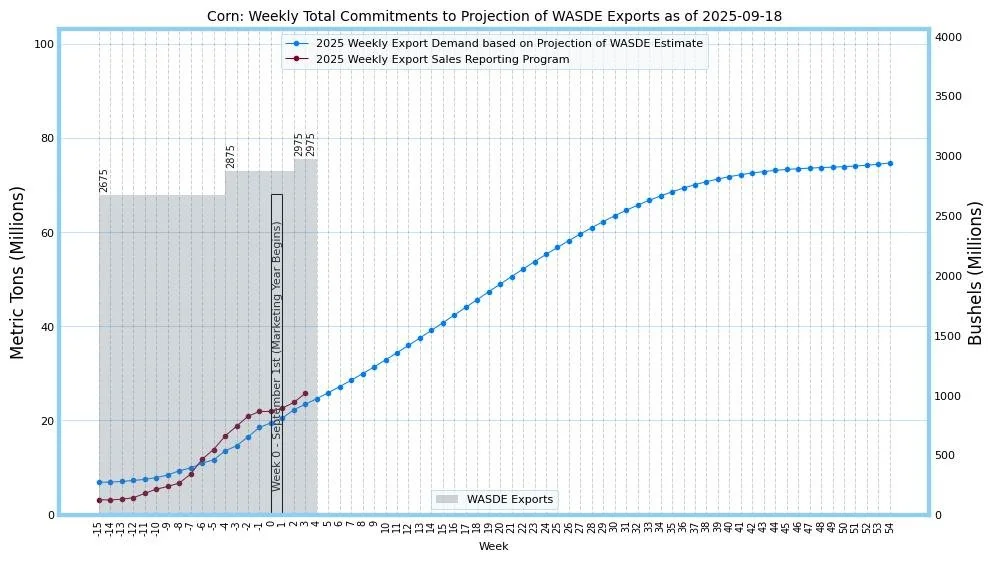
Corn 🌽
We now have RECORD corn exports.
We have offically passed 2021.
The craziest part is that in 2021, China accounted for nearly 50% of all of these exports.
We haven’t sold a penny to China this year.
Chart from Karen Braun
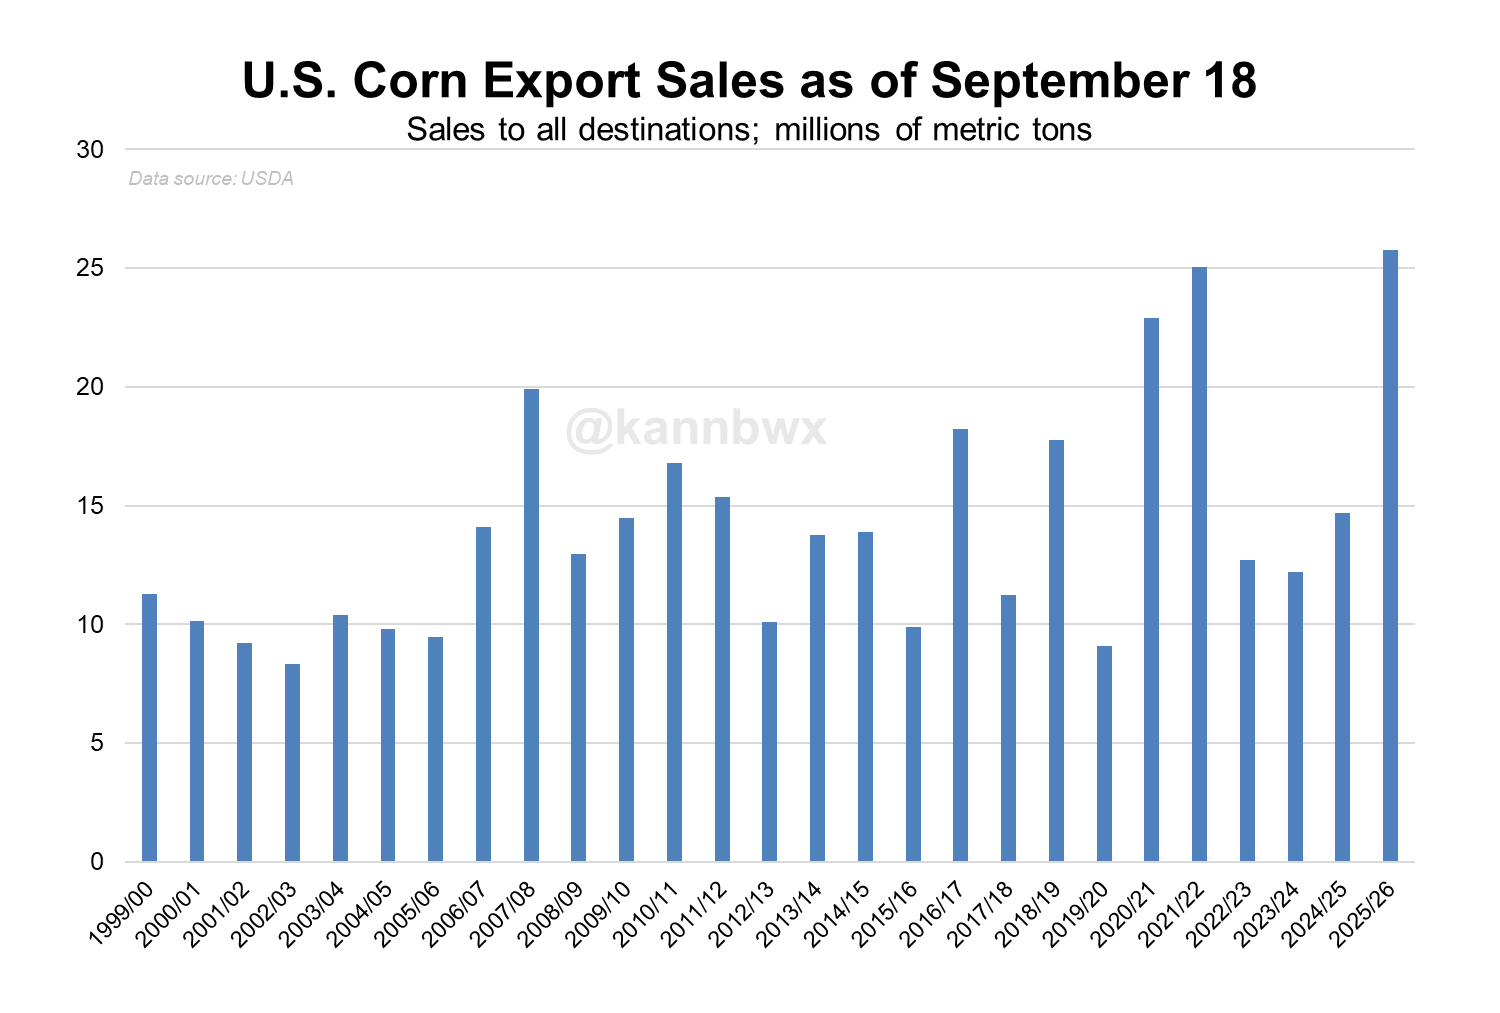
Corn is +5% ahead of the USDA's estimates.
Those estimates already seemed pretty large to begin with, but we are now surpassing them.
Needless to say, corn demand remains phenomenonal.
Many have tried to argue that corn export estimates are too high, but based on this, you can’t really make that argument yet.
The USDA has some lofty expectations, but we are continuing to impress.
I think the bigger question mark for corn demand is going to be the feed and residual. Not exports.
Chart from Robert McClure on X
Soybeans 🌱
Soybeans exports on the other hand remain well below expectations.
Demand everywhere outside of China has been great, but it's hard to make up for the lack of China.
As soybean exports are -19% behind the USDA's expectations.
We are almost certainly going to see the USDA lower their export projections for soybeans.
Chart from Robert McClure on X

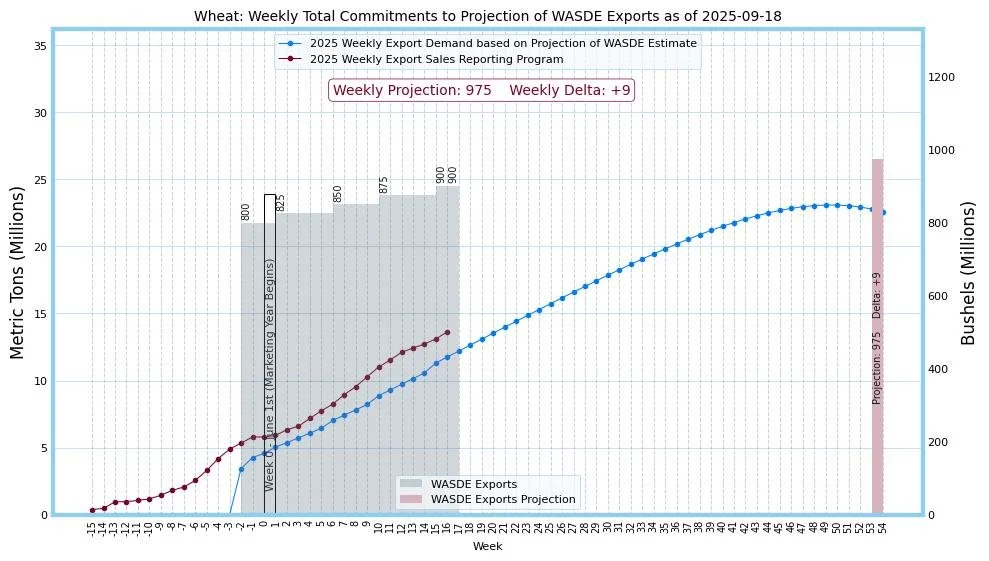
Wheat 🌾
Wheat demand remains great along with corn demand.
Well ahead of the USDA's current projections.
Chart from Robert McClure on X
Seasonals Update
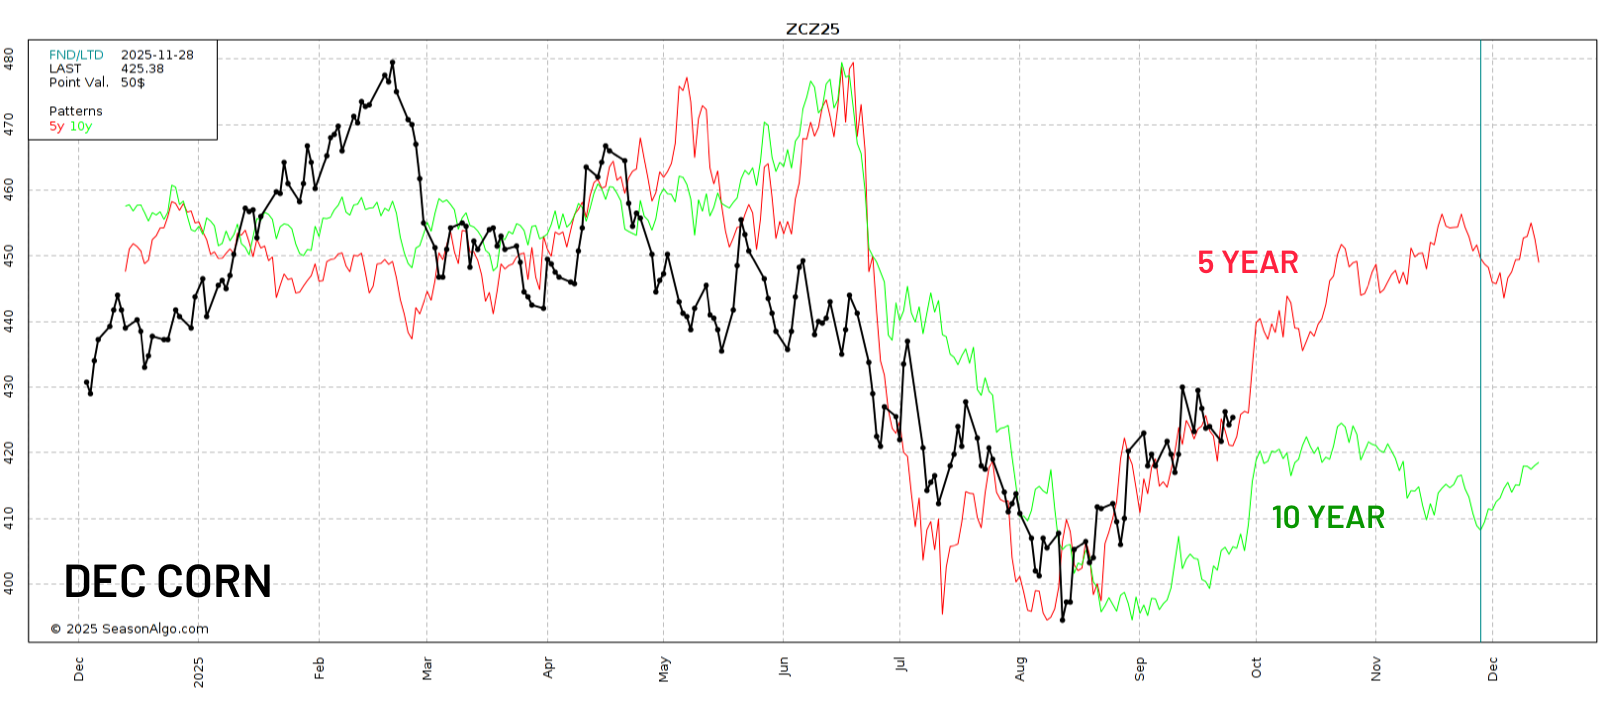
Corn 🌽
5 Year:
We've followed this one very close this year. It marked the exact bottom and rally thus far. It has us grinding higher the rest of the year.
10 Year:
This one says we make our highs in October before grinding sideways.
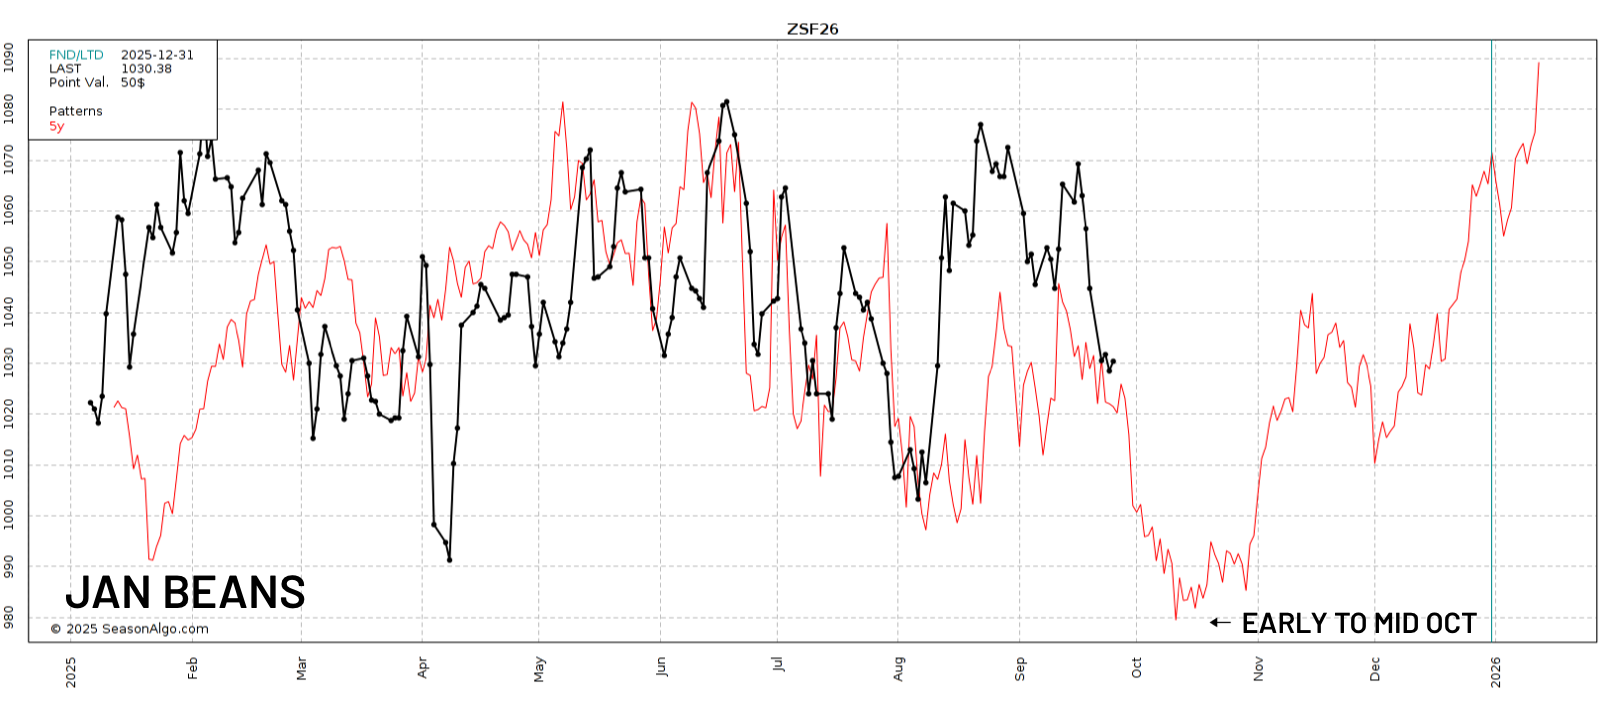
Beans 🌱
5 Year:
Typically we carve out lows in early to mid-October before rallying into November. Which typically coincides with some South America production uncertainty.
Wheat 🌾
The 5, 10, and 15 year seasonal all say we head higher from here.
All of them have us posting our local top in mid-October.

Today's Main Takeaways
Corn
Demand is amazing.
Yield is getting smaller, some say perhaps drastically smaller.
However, the only reason you can’t get super bullish on this corn market (not yet anyways) is because we are going to have record production even if that yield falls short.
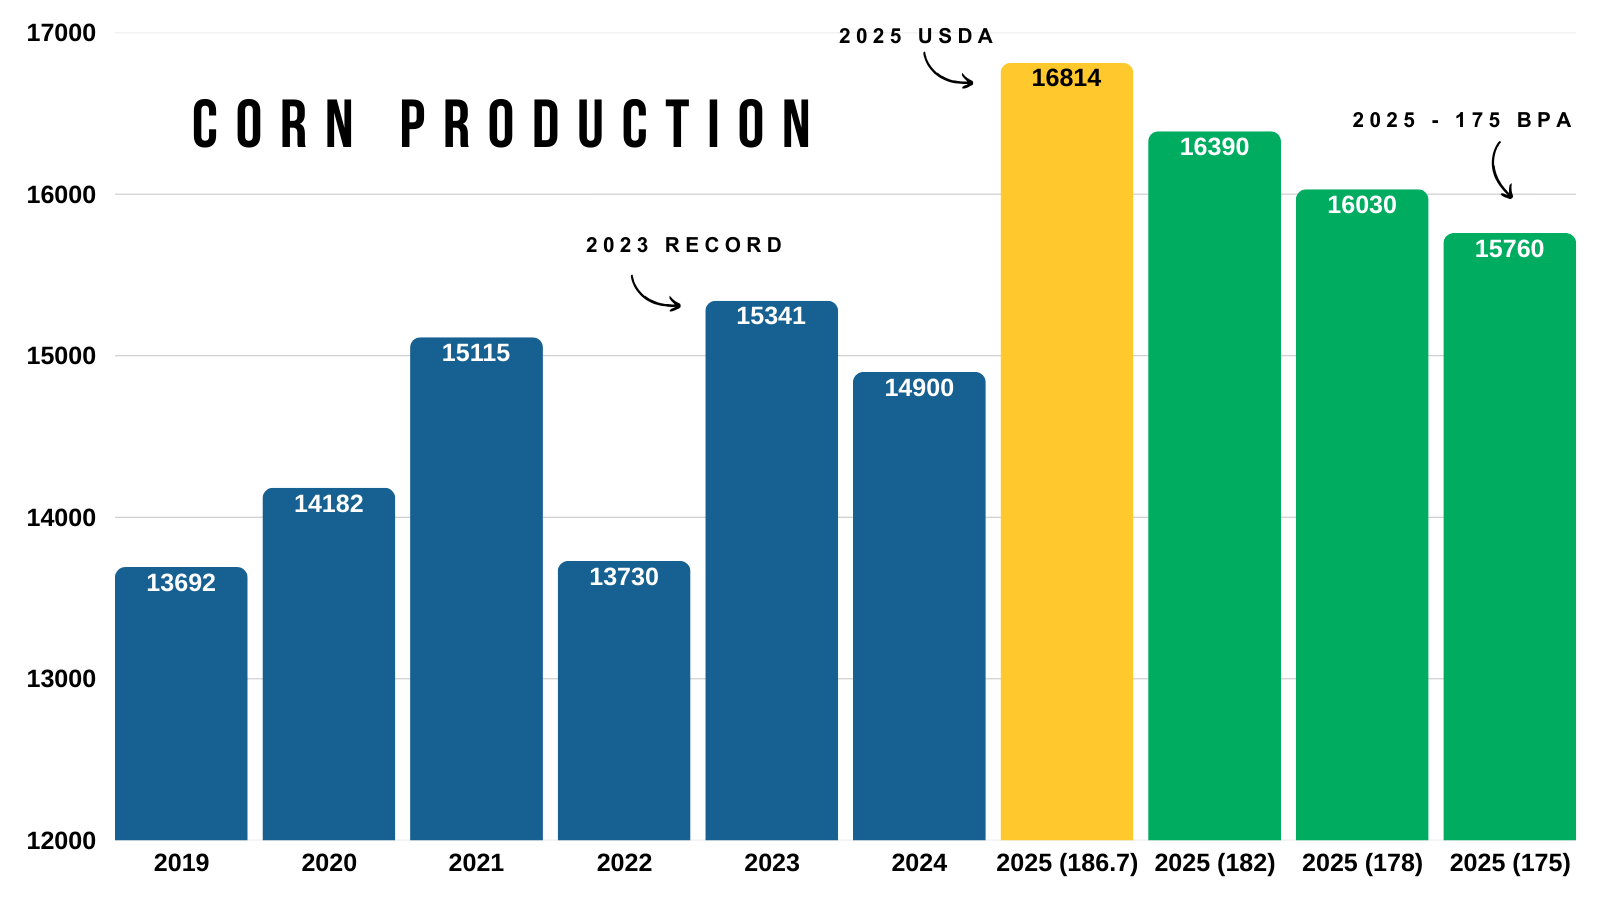
Here is a chart that shows corn production over the years, along with where production would be based on different yield scenarios.
Even if yield fell all the way down to 175, we would still print a record production number given the massive acres.
The current estimates have us being rougly +1.5 billion bushels higher than our previous record in 2023.
That is how big our production is.
However, on the bright side, demand is also the strongest it has ever been. So this helps offset that.
Production is indeed getting smaller.
We've already priced in a massive crop.
So you can’t really get bearish corn here either.
Normally, we are suppose to struggle to rally throughout harvest.
However, once harvest is out of the way and once we get into that January report where I am sure yield is going to be smaller, you do have to wonder where the ceiling is in this corn market.
Here are a few balance sheet scenarios, without changing demand numbers.
Arlan Suderman says this crop is between 178 to 182, and would be surprised if it was bigger but not smaller.
So here is what those potential balance sheets could look like. As always, demand will be cut to offset some of these losses. But it gives you an idea.
Here is the current balance sheet for reference:

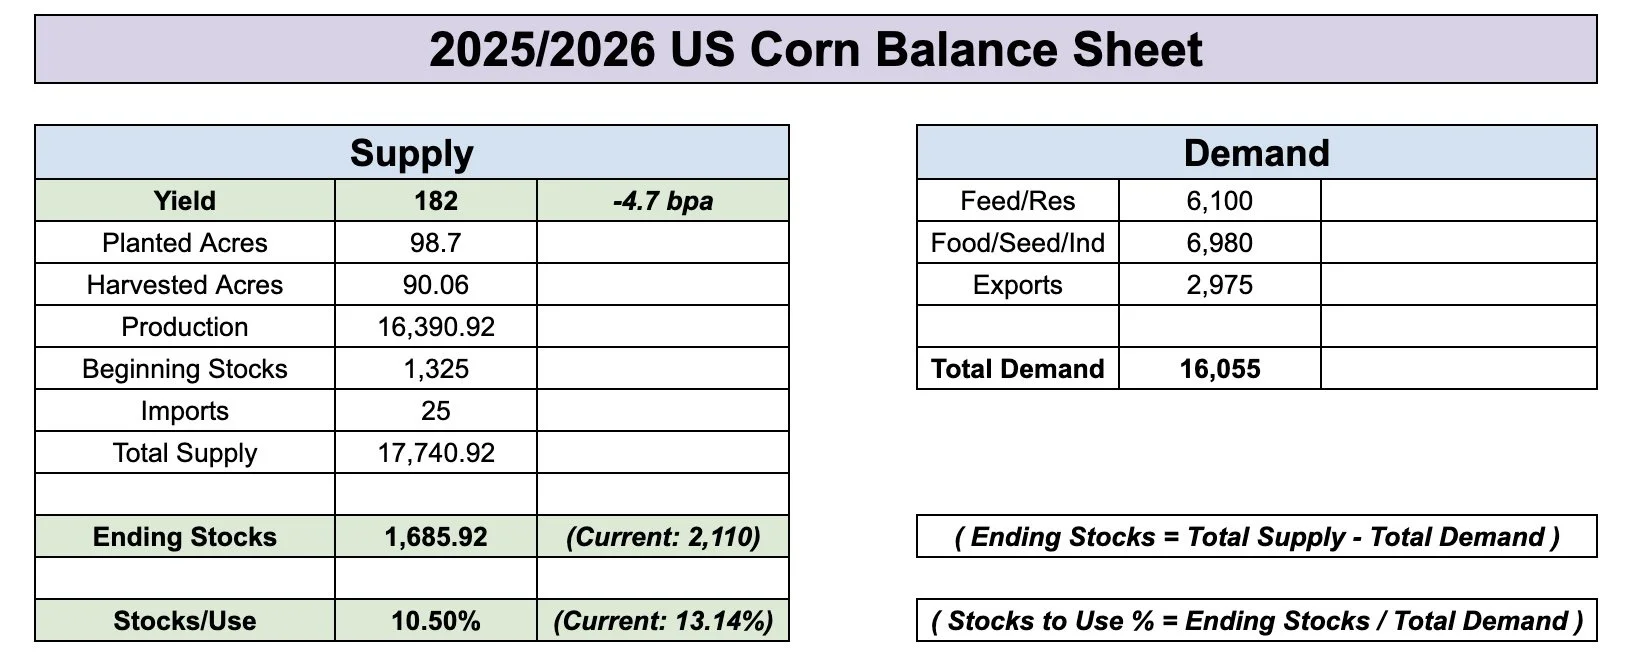
182:
It would put our stocks to use ratio around 10.5% to 11% depending on how much they drop demand.
With a 1.7 billion bushel carryout.
That still isn’t exactly bullish, but it's not sub $4 corn bearish.
180:
Here is where things get a little more interesting.
It drops our carryout to 1.5 billion.
Again, this is barring demand changes. If the USDA drops demand by a -100 million then you simply add +100 million to our carry out and get 1.6 billion instead.
It drops our stocks to use ratio below 10%, which is considered bullish.

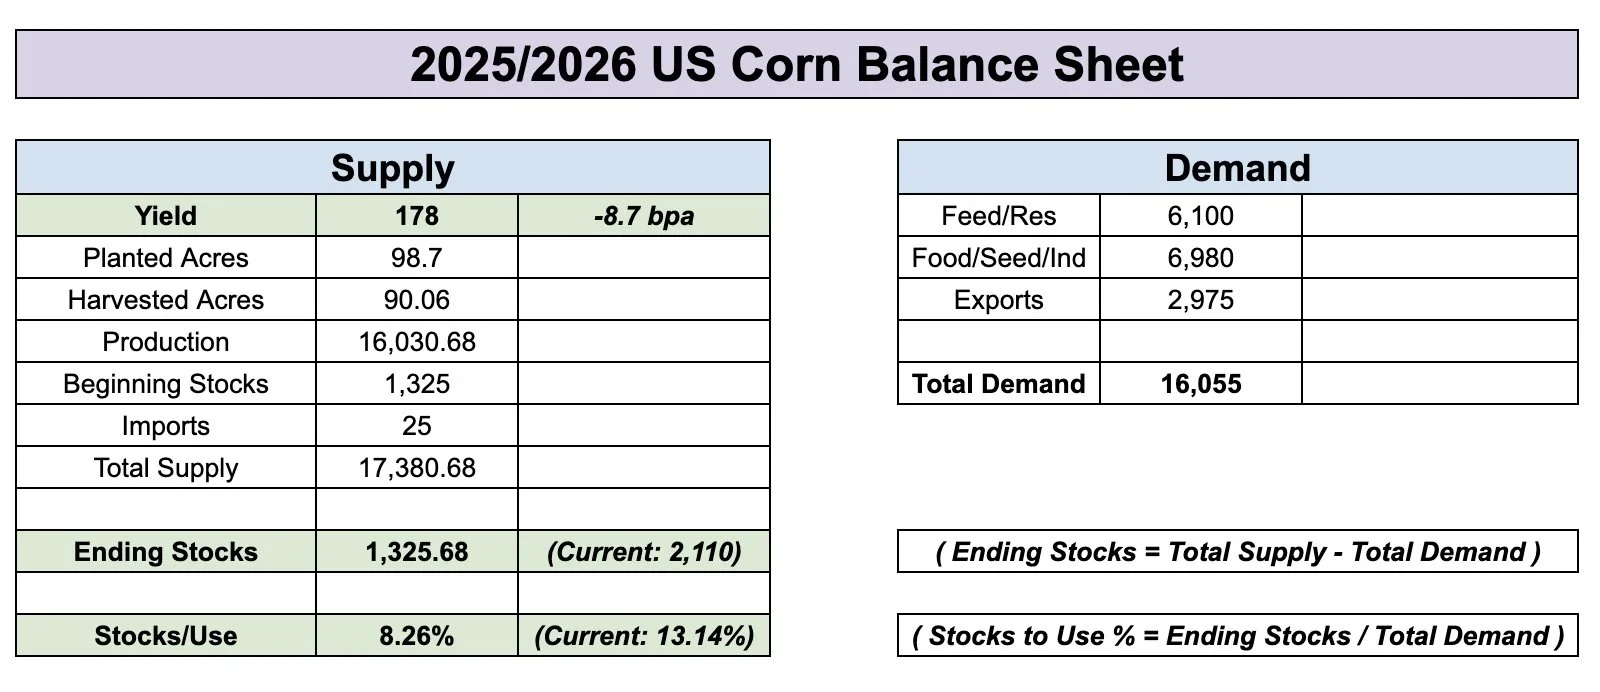
178:
Now this could potentially paint a bullish situation in the corn market.
This drops carryout down to 1.3 billion.
Dropping our stocks to use ratio to nearly 8%.
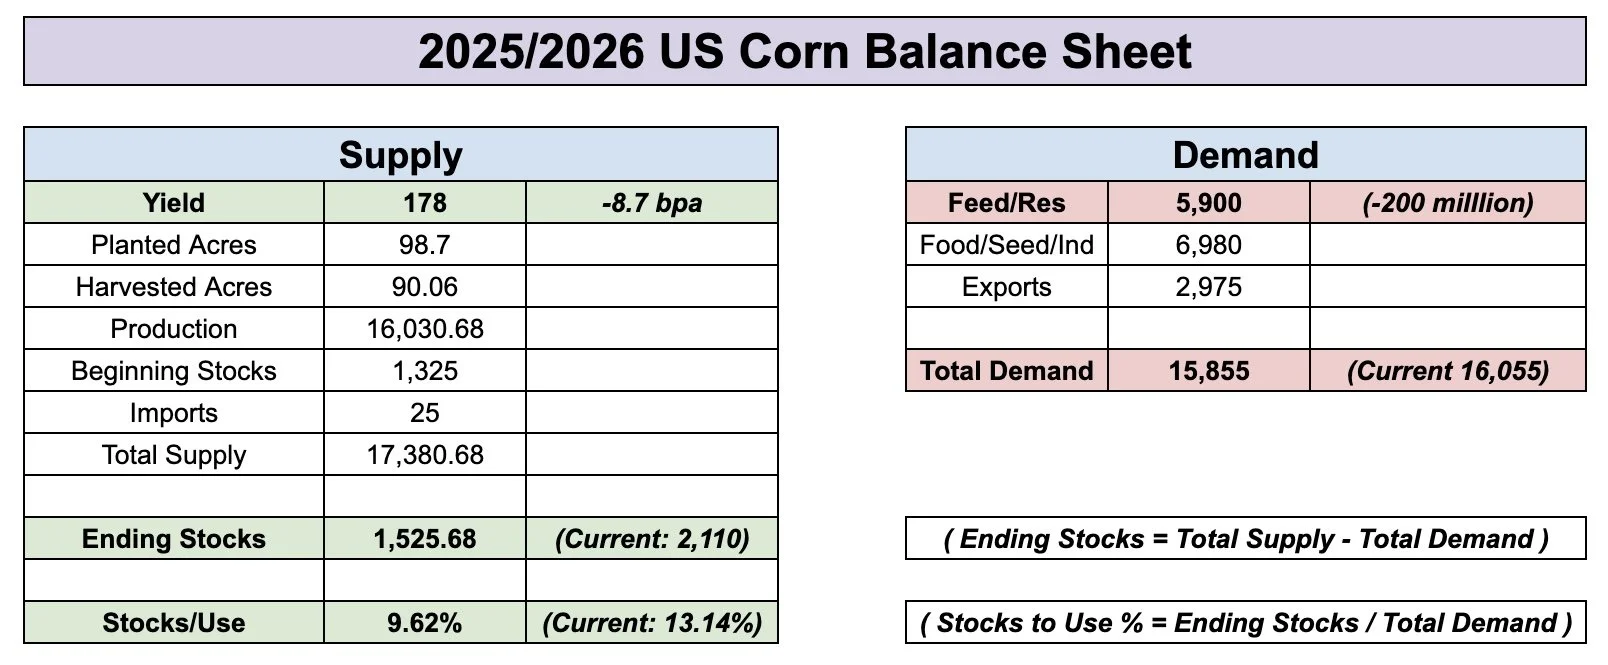
In this scenario, even if the USDA dropped feed demand by -200 million our stocks to use would still be below 10% (check 2nd chart for this).
So a 178 could give you a bullish scenario even if demand estimates are too high.
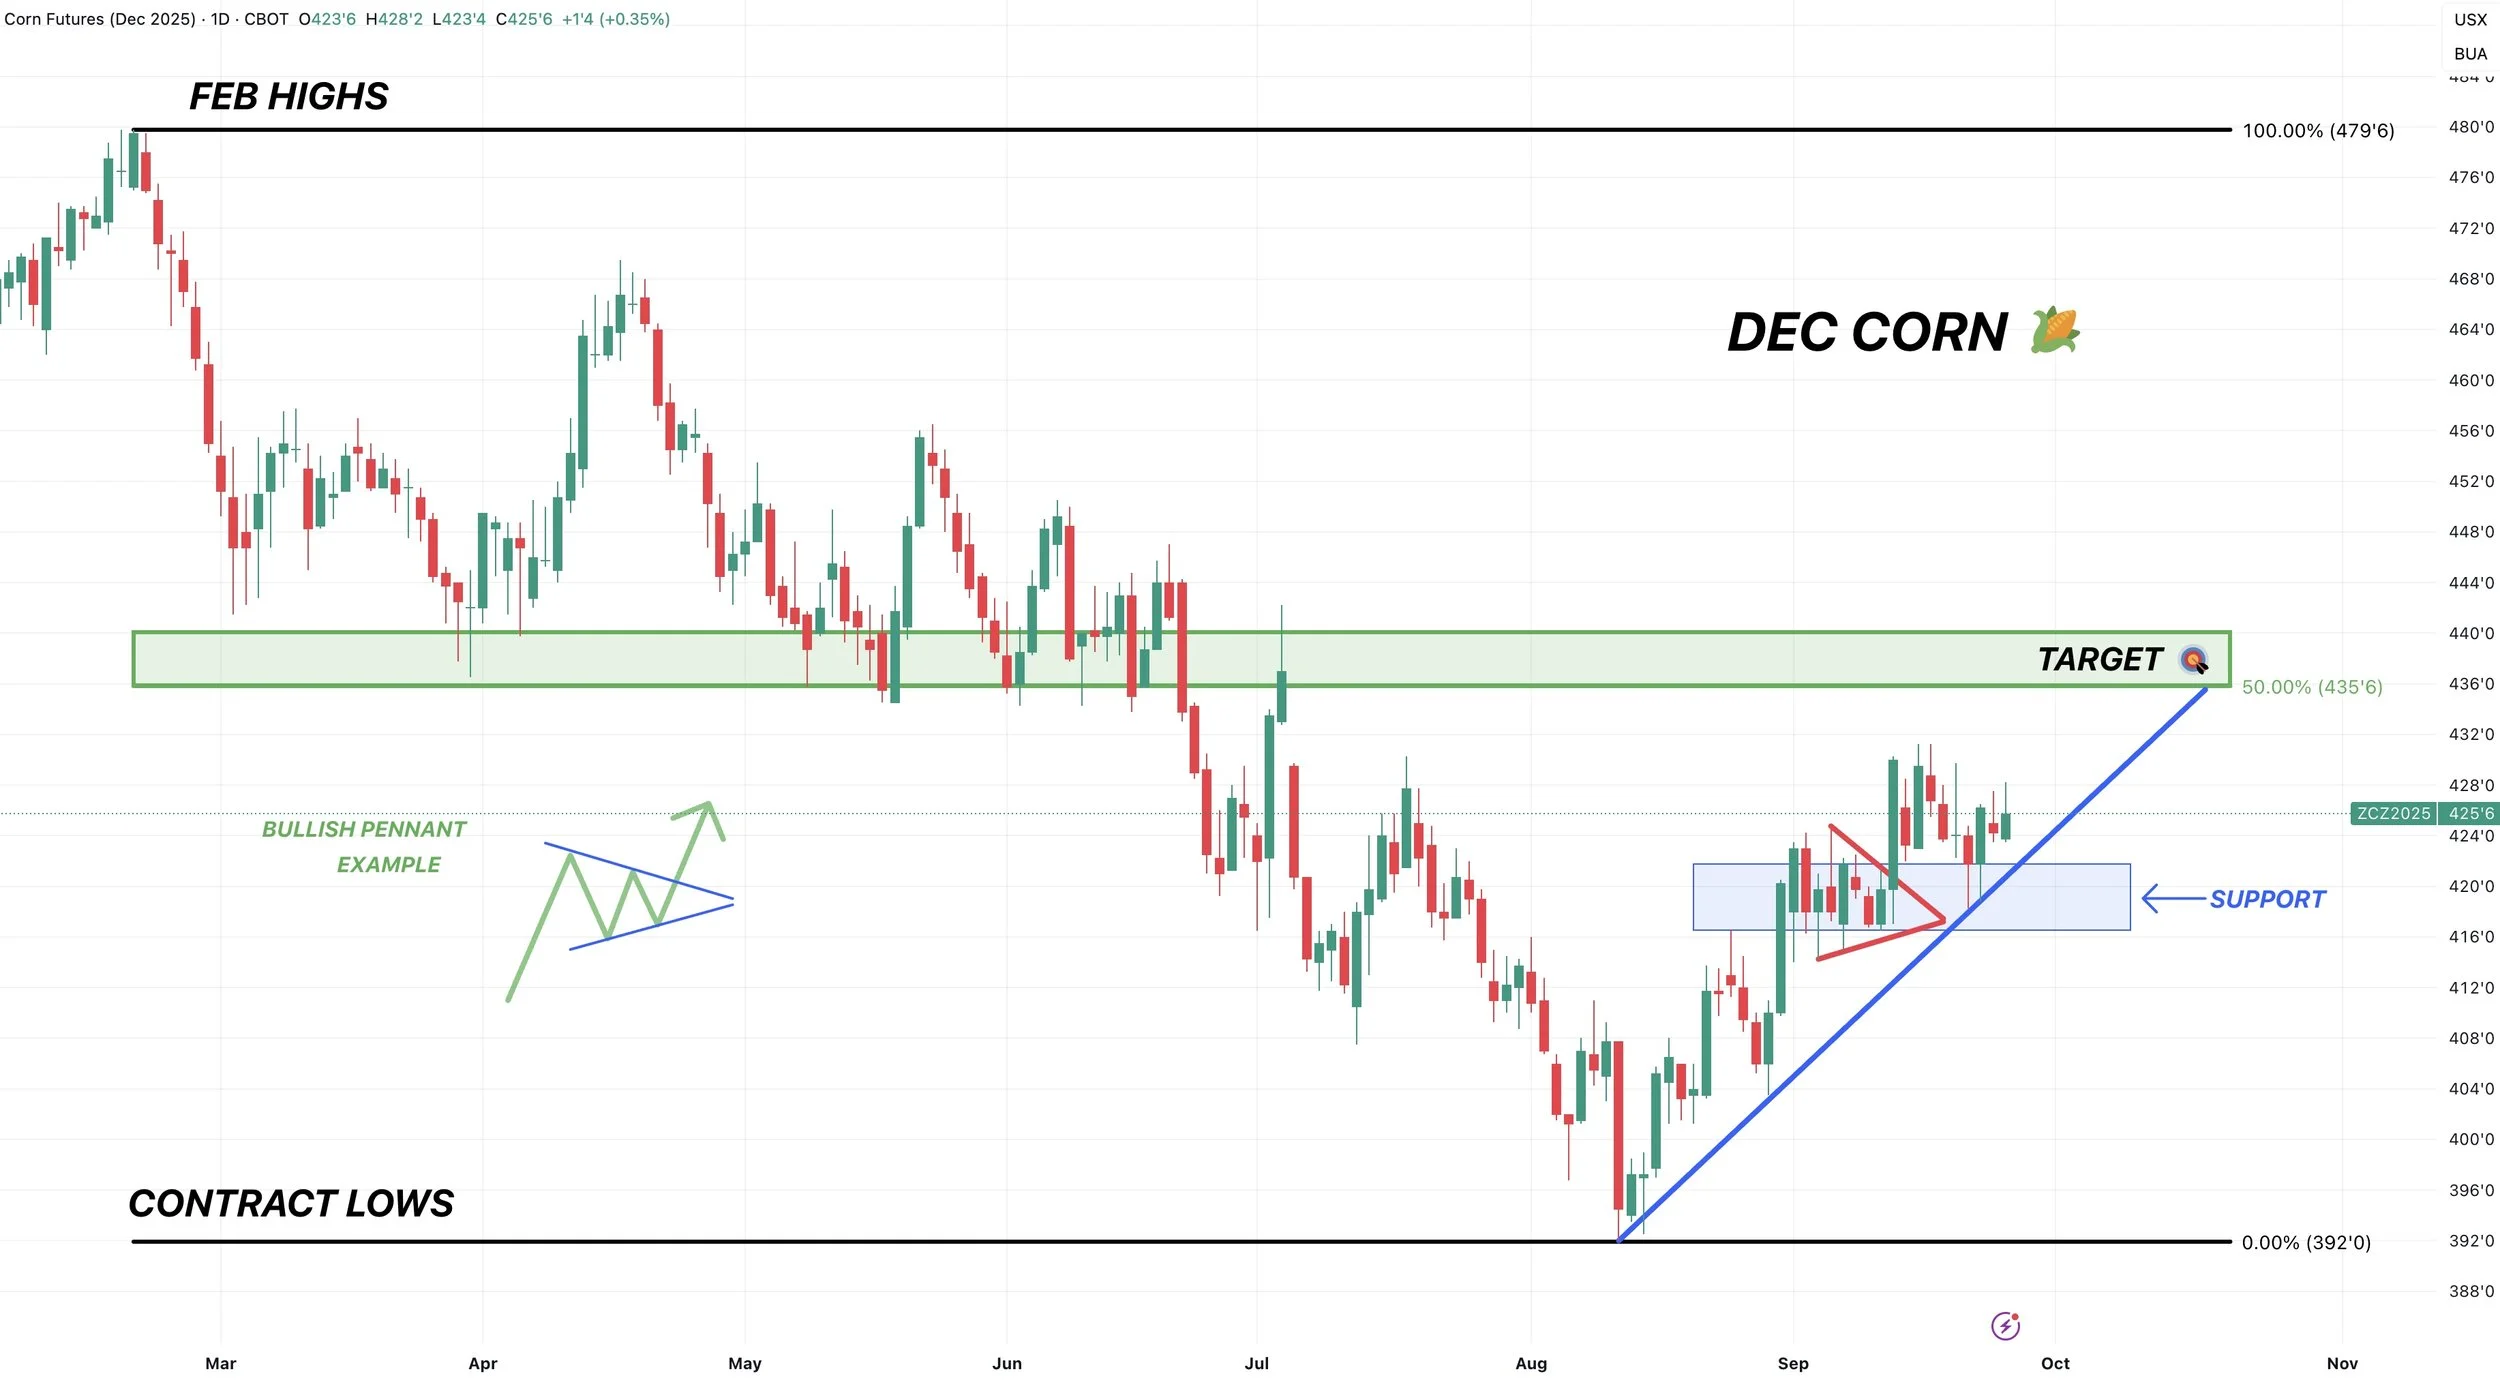
Daily Dec Chart:
Still planning on de-risking at $4.35
That gives back 50% of the Feb highs and is key support from spring.
No damange has been done to this chart. We are simply consolidating above previous resistance. Old resistance is new support.
The price action is pretty similar to what we saw before that last bullish pennant breakout. As before that breakout we consolidated right at old resistance as well.
Short term I'd like to see us hold this newly formed trend and that blue support box. If the box breaks we probably make a leg lower.
Soybeans
The soybean market is struggling to make a decision.
Does the potential loss in supply make up for the possible loss in demand?
China is the wild card.
Most are saying that exports for soybeans could drop by -300 to -400 million if China refuses to come to the table.
Currently, our exports are behind by -19%. If we continued this pace, exports would end up short by -320 million.
So let's dive into how this impacts the balance sheet and how much supply loss it would take to truly offset these demand losses if we see them.
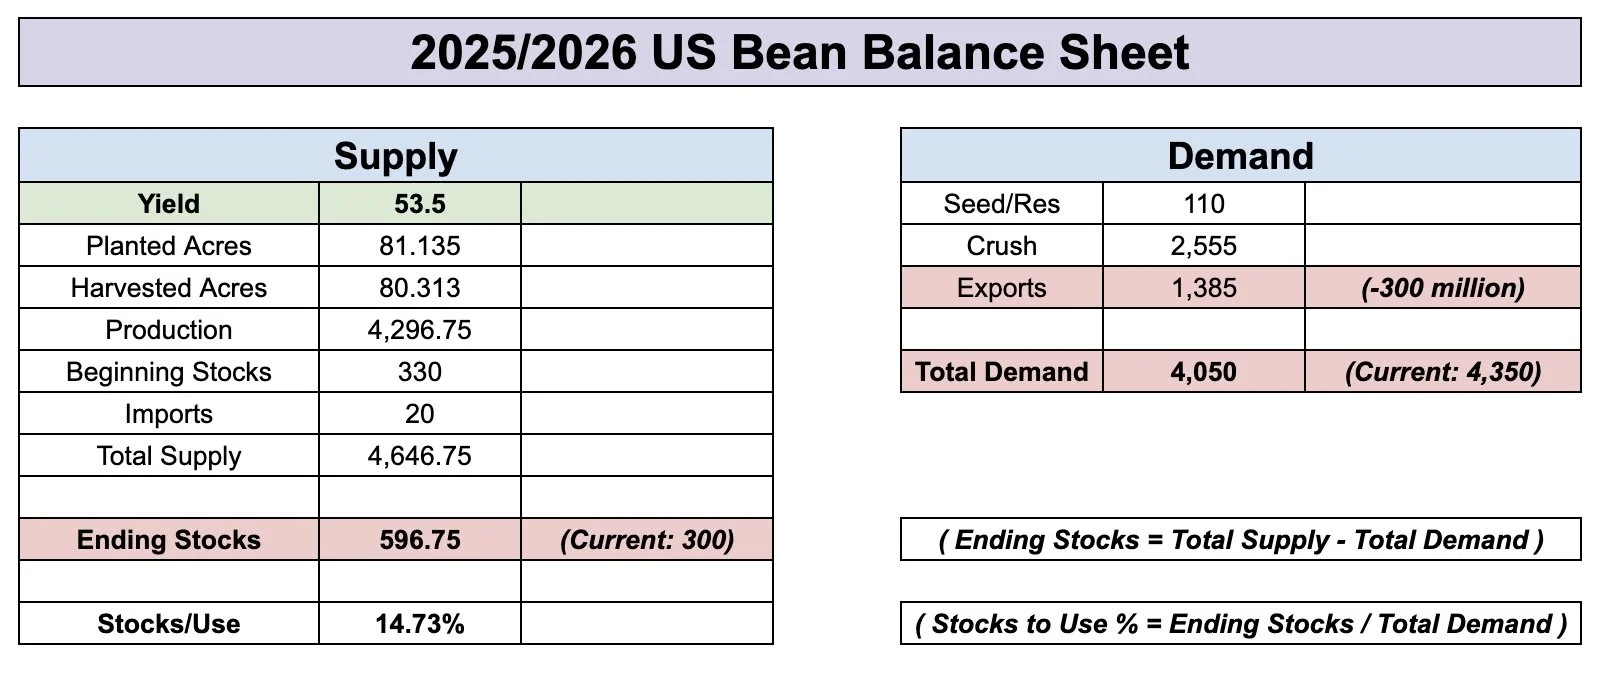
For this experiment, we are cutting exports by -300 million and only changing yield.
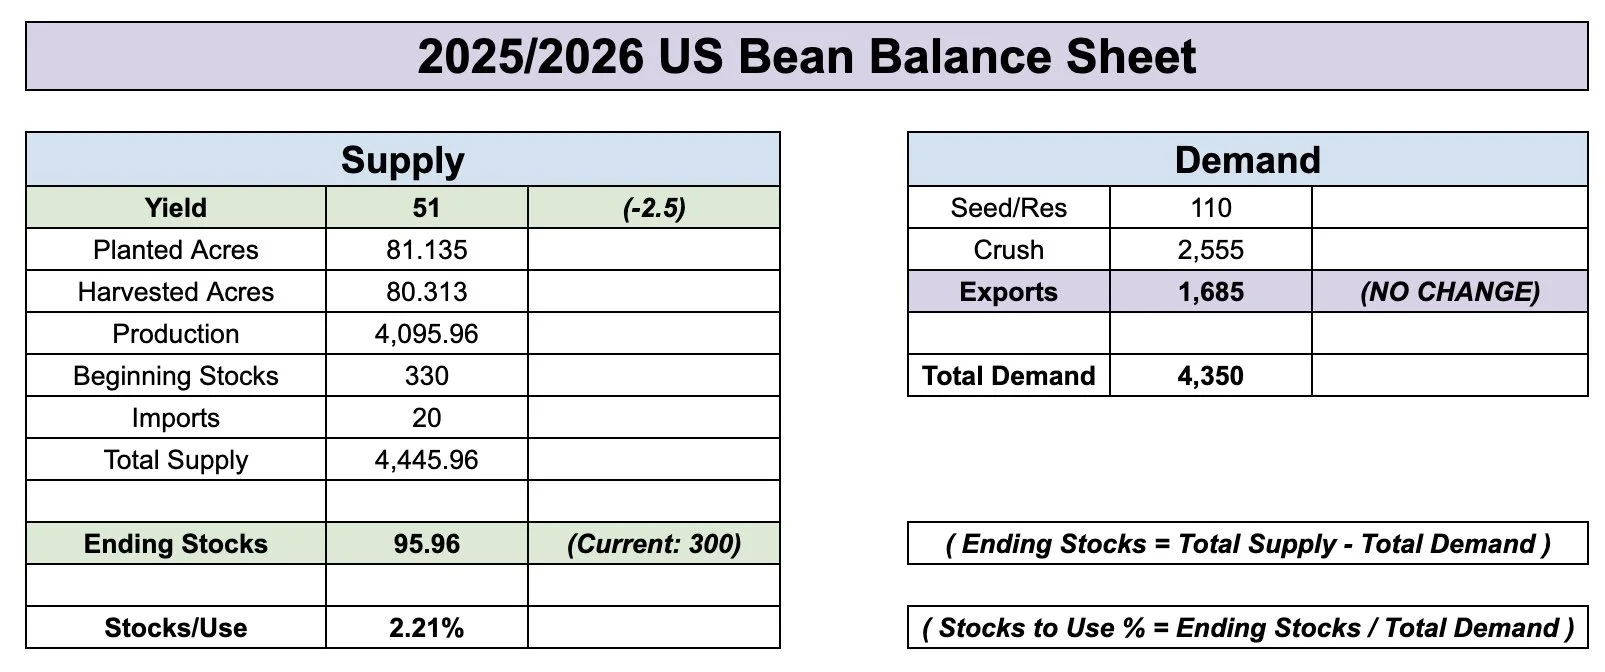
Here is the current balance sheet for reference:

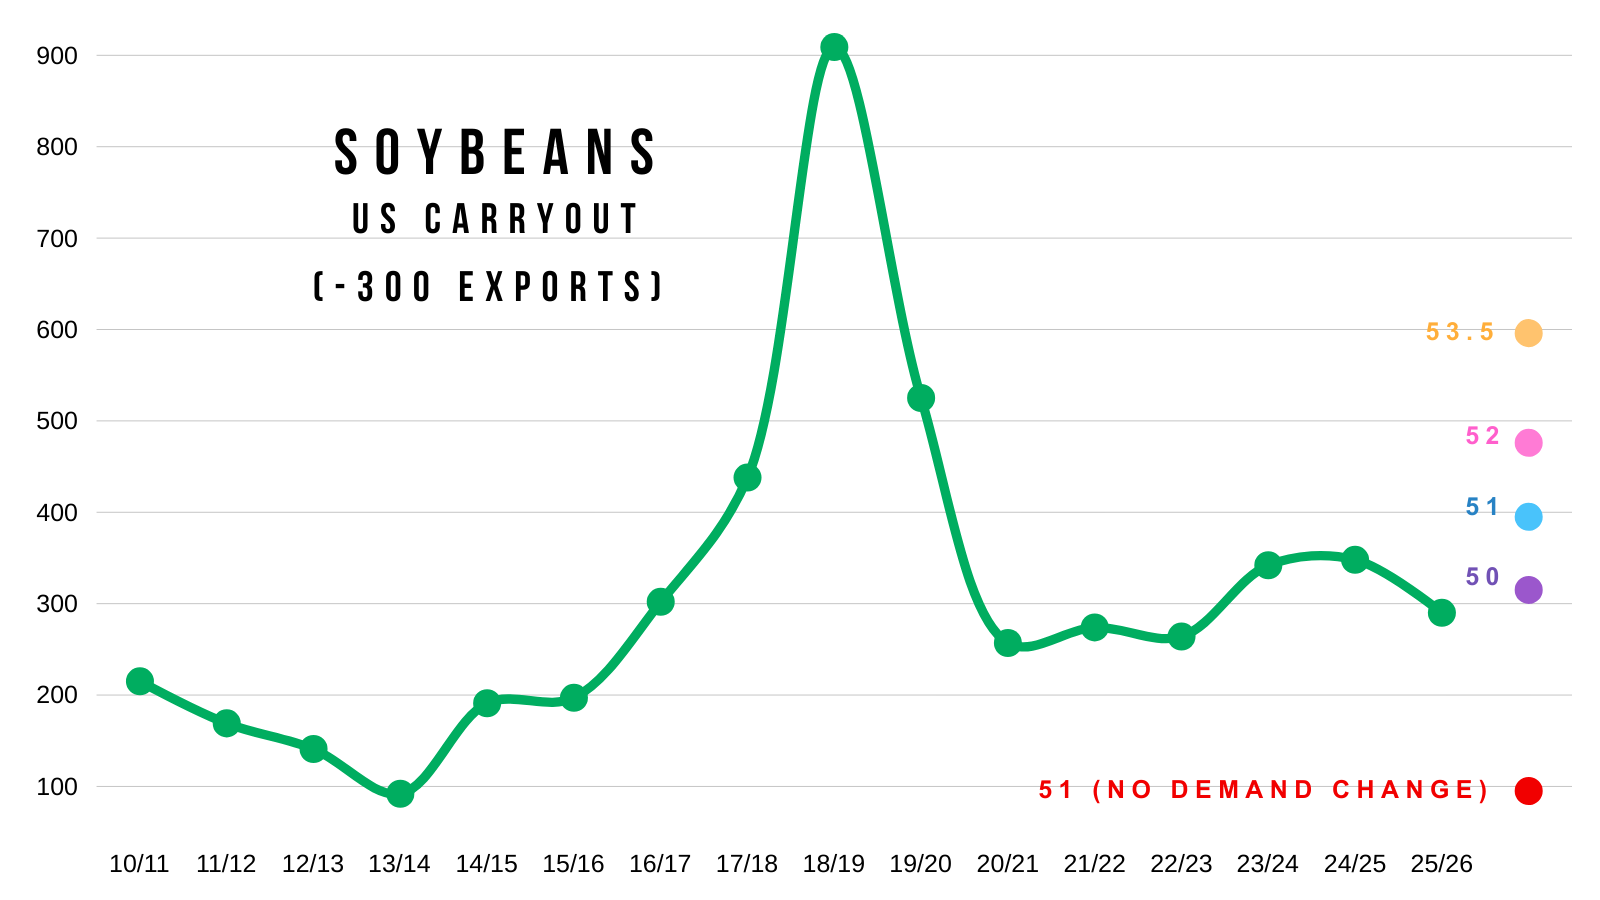
53.5 Yield:
With the loss in exports, this would sky rocket our carryout to 600 million vs the current 300 million.
Our carryout would double.
We had a 300 million carryout. We lost -300 million demand. Which results in a 600 million carryout.
Now that is very bearish.
It would be the highest since the trade war.
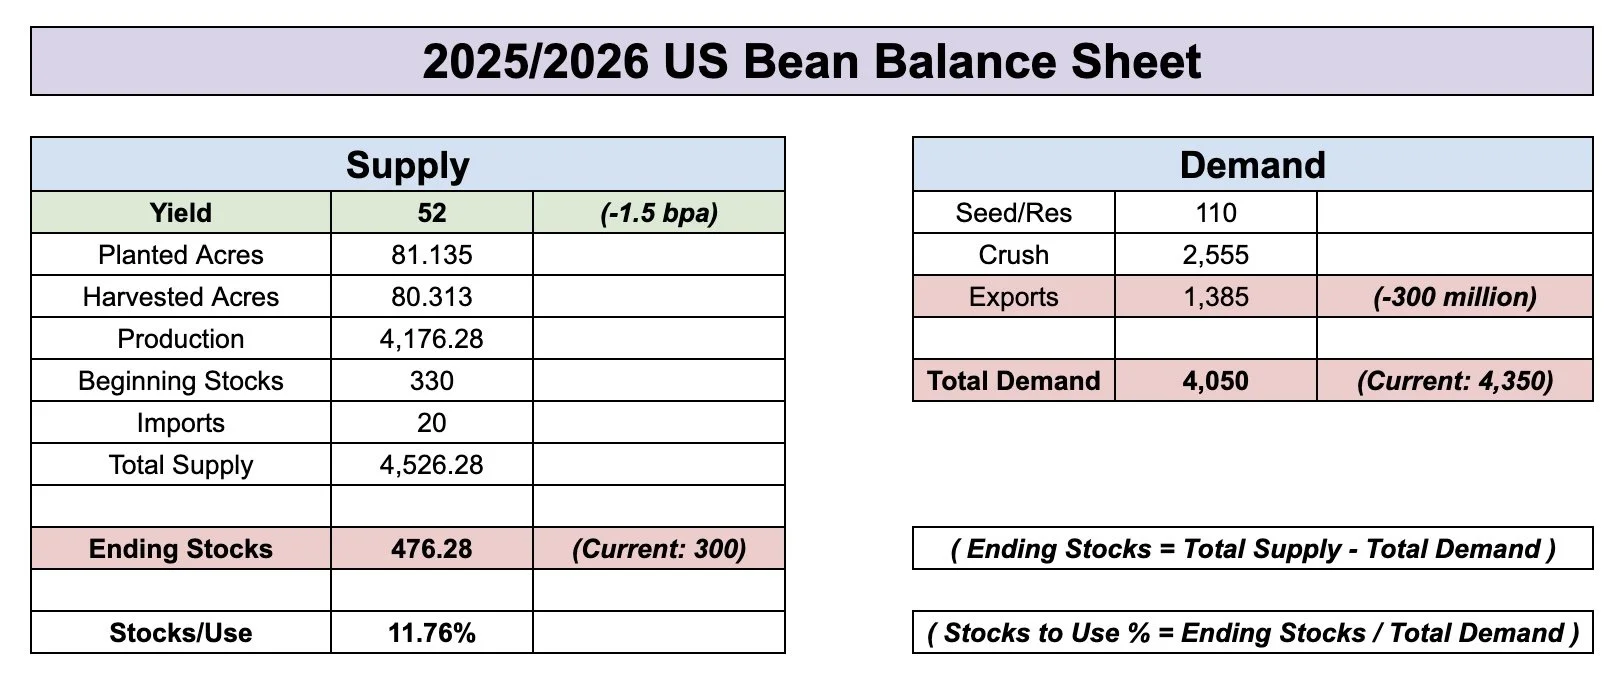
52 Yield:
Carryout would still be almost 500 million.
Still very bearish.
51 Yield:
Carryout is 400 million.
That isn’t crazy trade war bearish, but is still far from being super friendly.
For reference, our final carryout the last two years was around 350 million.

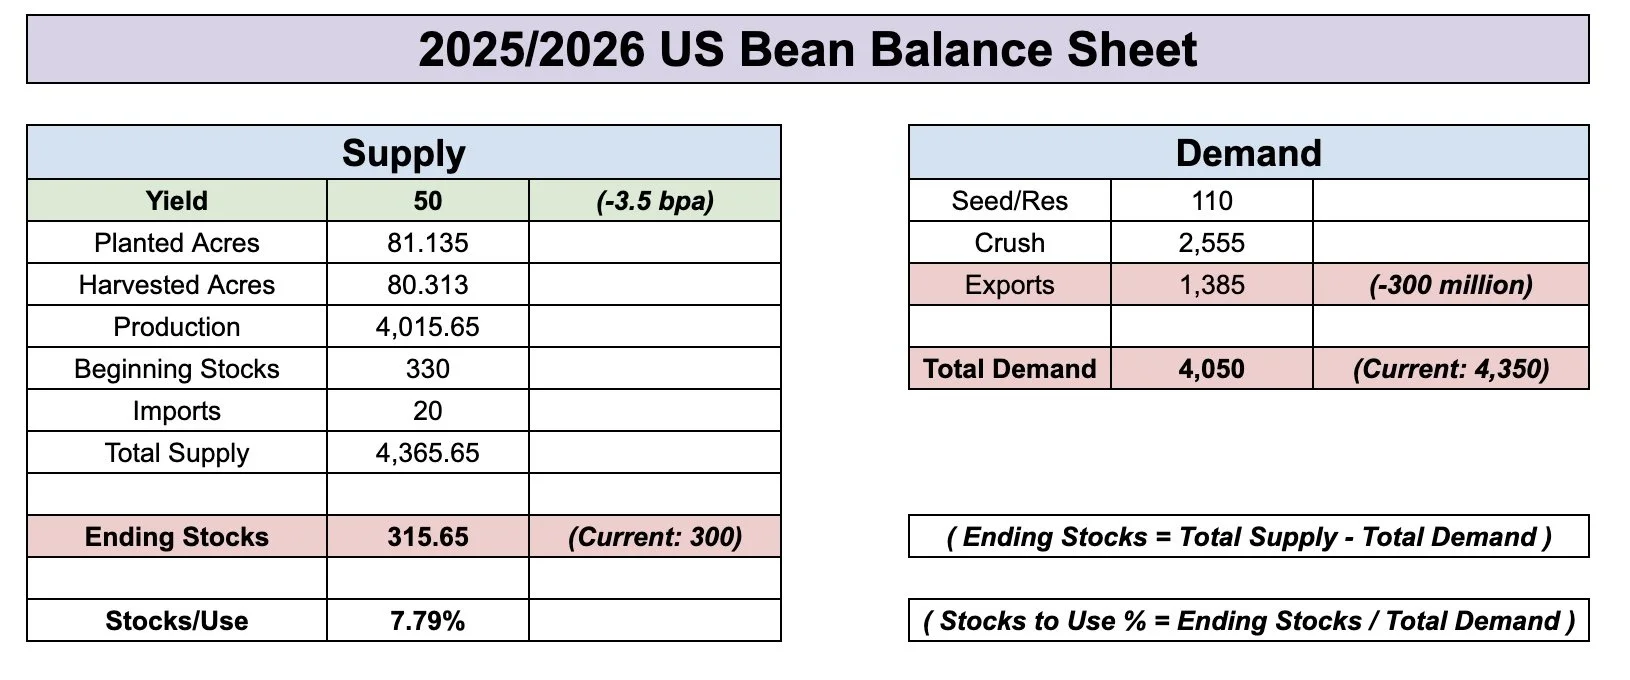
50 Yield:
Carryout would remain roughly the same as it is today with a 53.5 yield.
So if exports are cut by -300 million, it would take a 50 bpa yield to offset those losses in demand.
Leaving our balance sheet about where it is at today.
Which is the tightest in 3 years, but still not considered out of this world bullish.
51 Yield & No Demand Change:
Now here is the balance sheet if demand wasn’t dropped at all and yield came in at 51.
It becomes virtually non-existent. Which would be very bullish.
However, there is no chance the USDA doesn’t lower exports to some extent.
The bigger question is by how much?
Here is what all of those examples look like compared to other years.
This is why there is so much uncertainty in this market, and why you could argue for $9 or $12 soybeans and no one would call you crazy for either argument.
If China actually doesn’t buy any soybeans at all, we could be in trouble.
But if demand isn’t actually in trouble and our yield isn’t as big as advertised, there is a realistic path for this thing to get incredibly tight.
Daily Nov Chart:
Soybeans still hovering right at this 61.8% level at $10.12
This is where the market makes a decision. We either bounce and this is it for the sell off, or we make another leg lower.
If we take out Tuesday's low, I could easily see us testing the $9.90 level. Which is where that trendline that marked the last 3 major bottoms is at.
That is where I would look at some potential re-ownership strategies if we get there.
For now, I am waiting to see what decision the market makes here at this critical spot.

Wheat
Nothing to update fundamentally on the wheat market.
However, I am really liking what I am seeing on the charts.
Daily Chicago:
We are once again bouncing at the bottom of this massive channel like we have done a dozen times.
Now sitting in somewhat of a falling wedge pattern.
Today we did post an outside up day, where we took out yesterday’s lows but closed above yesterday’s highs.
That is seen as a positive sign.

If we zoom in here, I am still watching the $5.35 level.
I think if we break above there, it sparks a leg higher. If we break above, I'd be confident we finally posted our lows.
The chart looks promising but we need to break that level for confirmation.
First point of interest after that is $5.49

On Monday I talked about how we were showing some massive bullish divergence the past few weeks.
We posted new contract lows on Monday, but once again the RSI posted another higher high.
This tells us the downside momentum is getting weaker, not stronger.

Daily KC Wheat:
KC looks pretty good here as well.
Also sitting in a bigger picture wedge pattern.
Need to see us take out those highs from last week to say we found our true bottom.
After that our first point of interest is $5.40
Like Chicago, on Monday we printed some clear bullish divergence.

Cattle
Our partner Lauren of Texas Hedge specializes in the cattle market, and has more fundamental knowledge in this market than I do. Here is what she had to say:
Thoughts from Lauren Urbanczyk of Texas Hedge:
Feeder were limit up on Monday based on the secretary of ag saying that relief was coming to American ranchers to rebuild the beef herd, since cattle supply is historically low.
The market took this and ran with it as rumors of a stimulus package was coming for heffer retention. However, it was then confirmed today by the secretary of ag that there is no stimulus coming for cattle ranchers in the form of heffer rettenion.
So the market gave back all of it's early gains from earlier this week. Beef has struggled as we seasonally get a September pullback. So a lot of this is following the seasonals.
This situation was kind of a buy the rumor sell the fact situation. As the market digested the rumors to realize they were just rumors.
We have cash trading -$3 lower in Texas, and in some instances -$5 lower in Kansas. So a weaker tone to the markets to the cash side and to beef. We are starting to see the futures give away.
Both live and feeder cattle are about flat on the week. So tomorrow’s price action will important to see if we get higher weekly closes or not.

Oct Feeder:
Earlier this week we bounced right in the golden zone where we needed to.
On the recent bounce, we rejected right off the 78.6% retracement up to the contract highs (the 61.8% level is more common, but this bounce was overextended)
The most common correction pattern is an "ABC".
So the must hold spot here is the red box. If the red box fails to hold, we could easily get a broader correction down to the blue one. Which is the golden zone of the entire rally since June.
If we drop into the blue box, that is where I would potentially consider some re-ownership strategies.
We still like having protection up here.

Oct Live:
Very similar chart to feeder. Except on the recent rally we rejected right off the 61.8% level we talked about on Monday. Which is where we needed to close above to be more confident we'd go test the highs.
Area to hold is the red box.
If it fails, we could easily get that bigger correction towards the blue box.

Past Sell or Protection Signals
Aug 22nd: 🌱
Soybean sell signal & hedge alert.
July 31st: 🐮
Cattle sell signal & hedge alert.
July 10th: 🐮
Cattle sell signal & hedge alert.
CLICK HERE TO VIEW
June 5th: 🐮
Cattle sell signal & hedge alert.
June 2nd: 🌾
MPLS wheat sell signal.
April 10th: 🌽
Old crop corn sell signal.
March 19th: 🐮
Cattle hedge & sell signal.
Feb 18th: 🌽 🌾
Old crop KC wheat & old crop corn signal.
Jan 23rd: 🌽 🌱
Corn & beans old crop sell signal.
CLICK HERE TO VIEW
Jan 15th: 🌽 🌱
Corn & beans hedge alert/sell signal.
Jan 2nd: 🐮
Cattle hedge alert at new all-time highs & target.
Dec 11th: 🌽
Corn sell signal at $4.51 200-day MA
CLICK HERE TO VIEW
Oct 2nd: 🌾
Wheat sell signal at $6.12 target
Sep 30th: 🌽
Corn protection signal at $4.23-26
Sep 27th: 🌱
Soybean sell & protection signal at $10.65
Sep 13th: 🌾
Wheat sell signal at $5.98
May 22nd: 🌾
Wheat sell signal when wheat traded +$7.00
Want to Talk?
Our phones are open 24/7 for you guys if you ever need anything or want to discuss your operation.
Hedge Account
Interested in a hedge account? Use the link below to set up an account or shoot Jeremey a call at (605)295-3100.