
AUDIO COMMENTARY
Some divergence in cattle market
Corn and wheat higher despite crude
Crude oil got smacked hard today
Funds have pitched most of their length
Don’t want to see funds get full on short
Are we closing the export gaps
We have interview with USDA this week
We want to know the USDA’s reason & process
Very large sales of corn today
Where is the line that finds demand & supply
Midterm elections tomorrow
Where supply is at will be huge key
If you make good sales this year
Implied volatility has gone to nothing
Risk to reward with call options
Wheat finally with possible stabilization
Be proactive not reactive in marketing
What should we ask the USDA?
Charts below audio*
Listen to today’s audio below
Want to talk?
Office: (806)484-1214
Your free trial has ended
Don’t miss our next sell alert or future updates
Our harvest sale ended this weekend. Since you were on a trial here is extended access
A FEW CHARTS
I’ll be going over all of the charts a lot more in depth in tomorrow’s video and update, but here are a few quick ones.
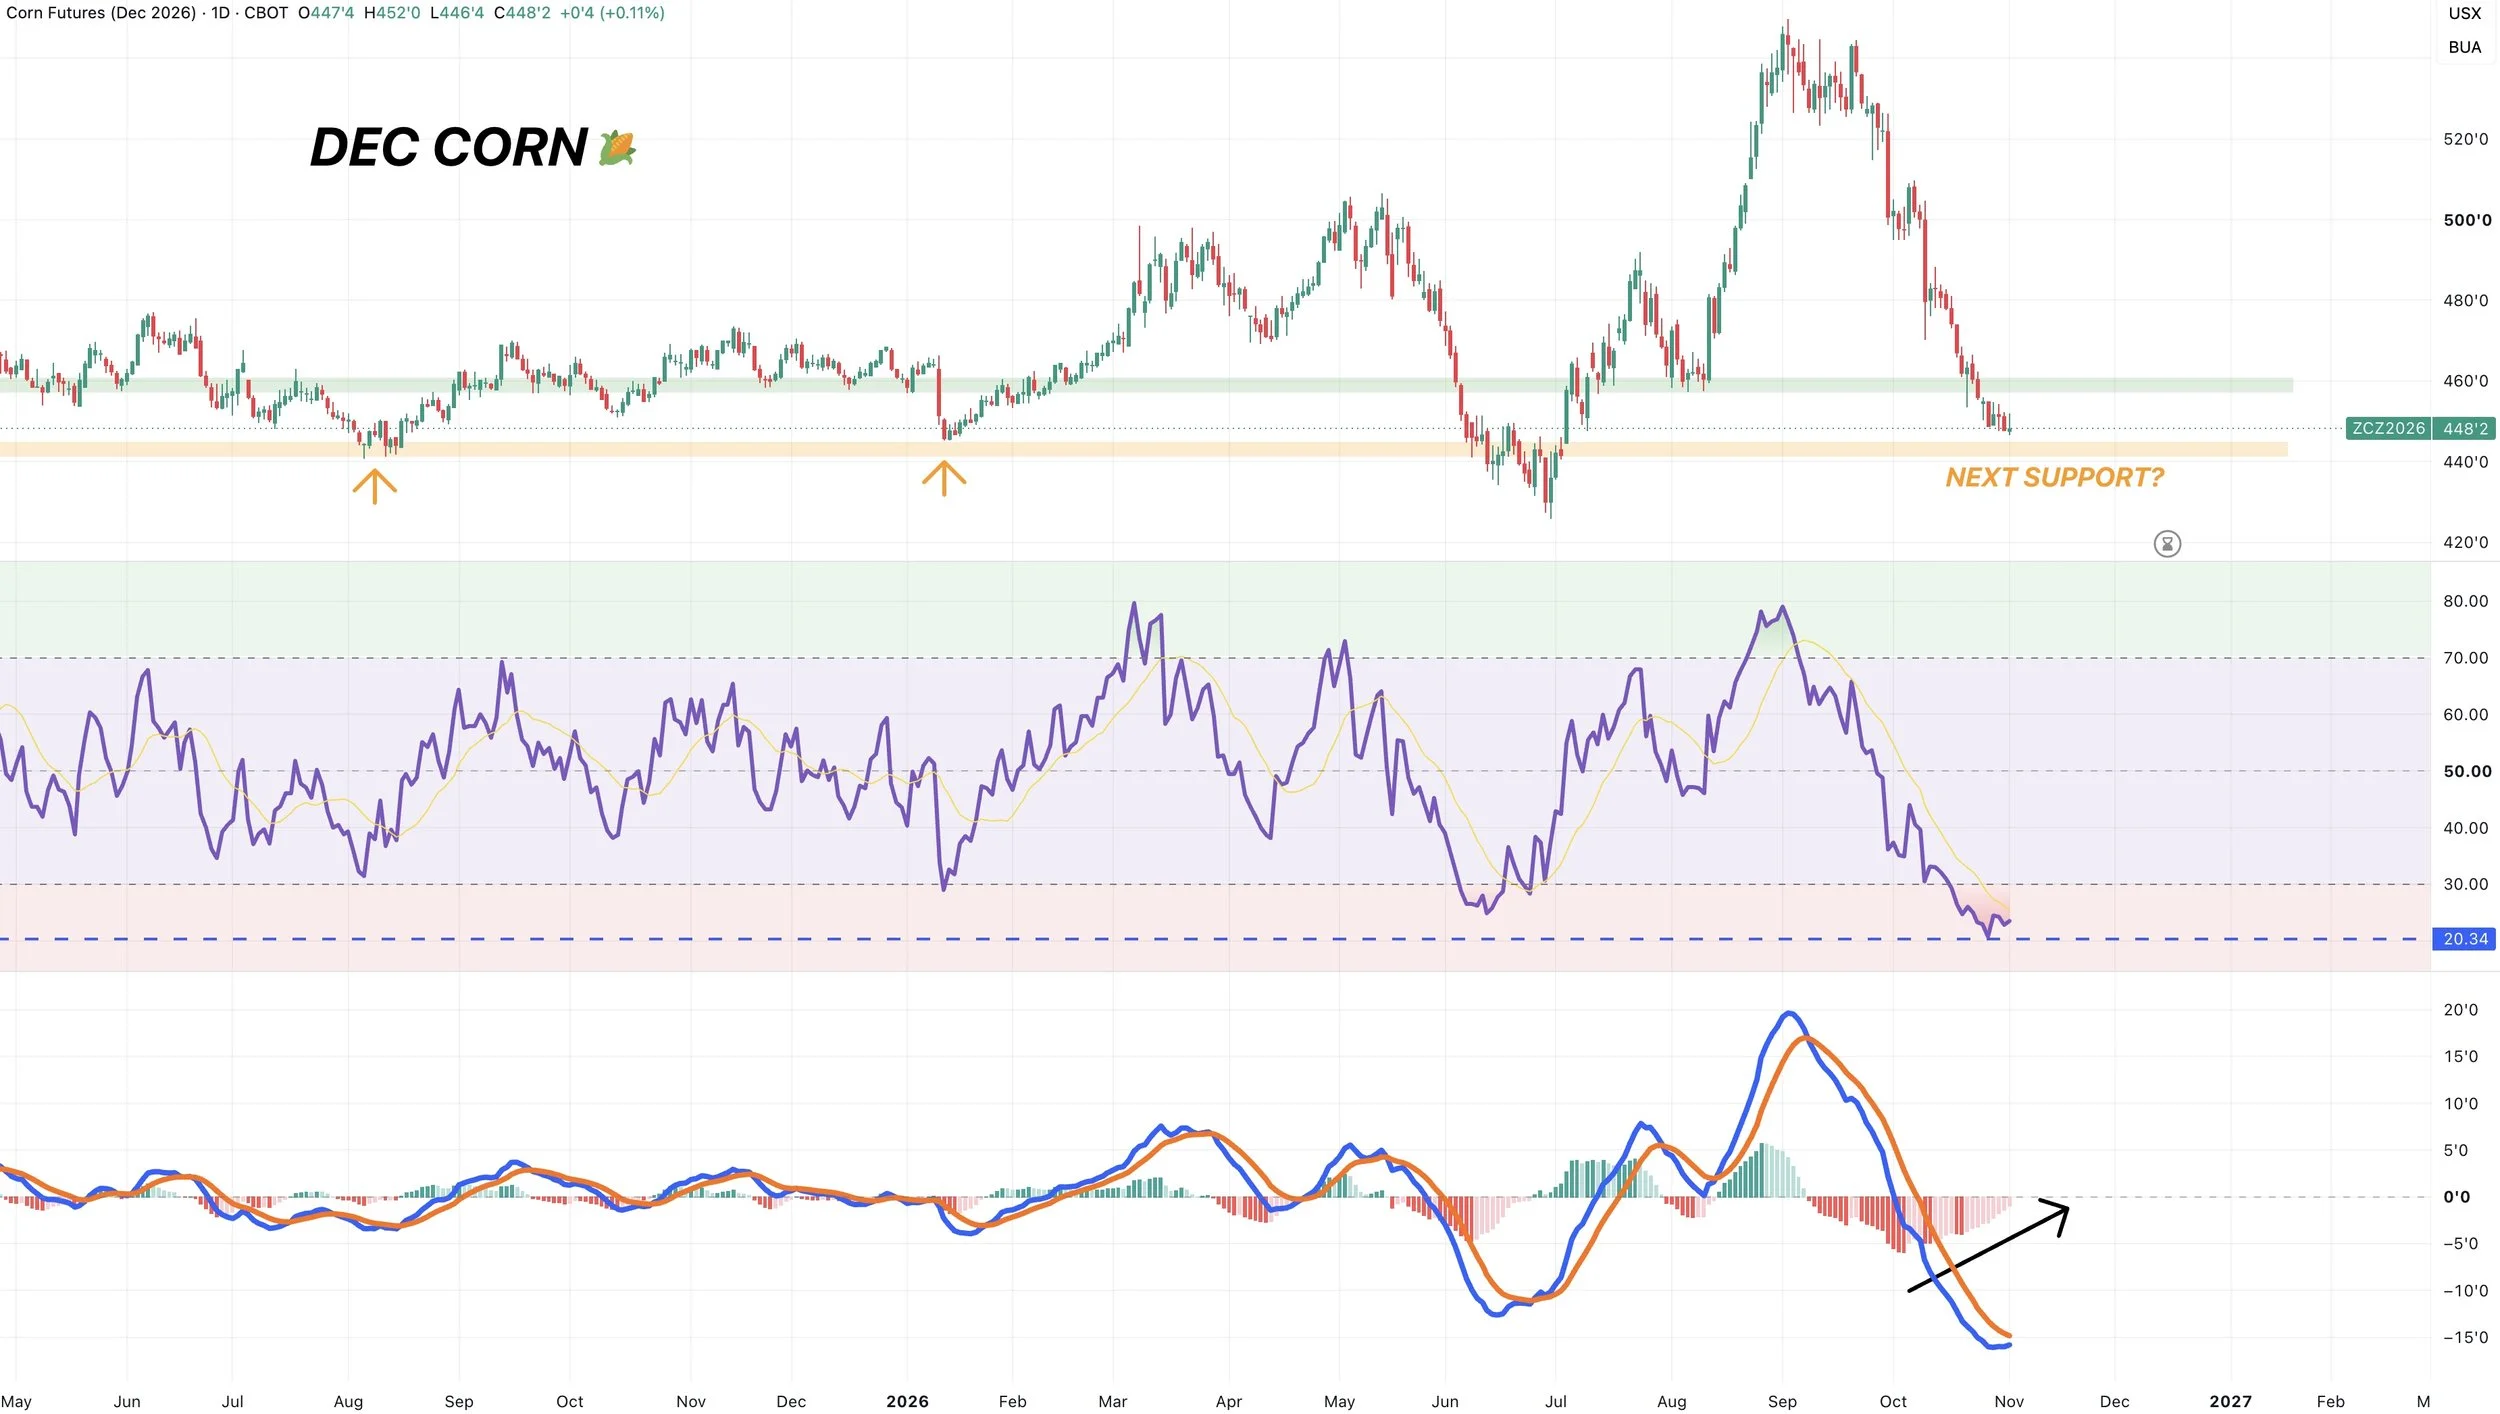
Dec Corn 🌽
Not much to update in corn.
The level I still want to see us hold is this $4.40 to $4.45 range. It’s marked the bottom for this market on 5 separate occasions. The only time we failed to hold it was the contract lows.
At the same time, I am watching the indicators here as well.
We have some “potential” bullish divergence on the RSI but it has not been confirmed. Prices made new lows yet the RSI hasn’t. If prices post a new low but the RSI confirms bullish divergence, that would be one possible sign of a bottom.
The MACD is the other one. The last several times this has crossed bullish a bottom soon followed. It has not yet crossed bullish but is currently curling higher for the first time in a long time. Showing the downside momentum may be getting weaker.
I’d like to see us break above $4.60 and those old August lows for us to have some confidence we are in for a leg higher finally.
Jan Beans 🌱
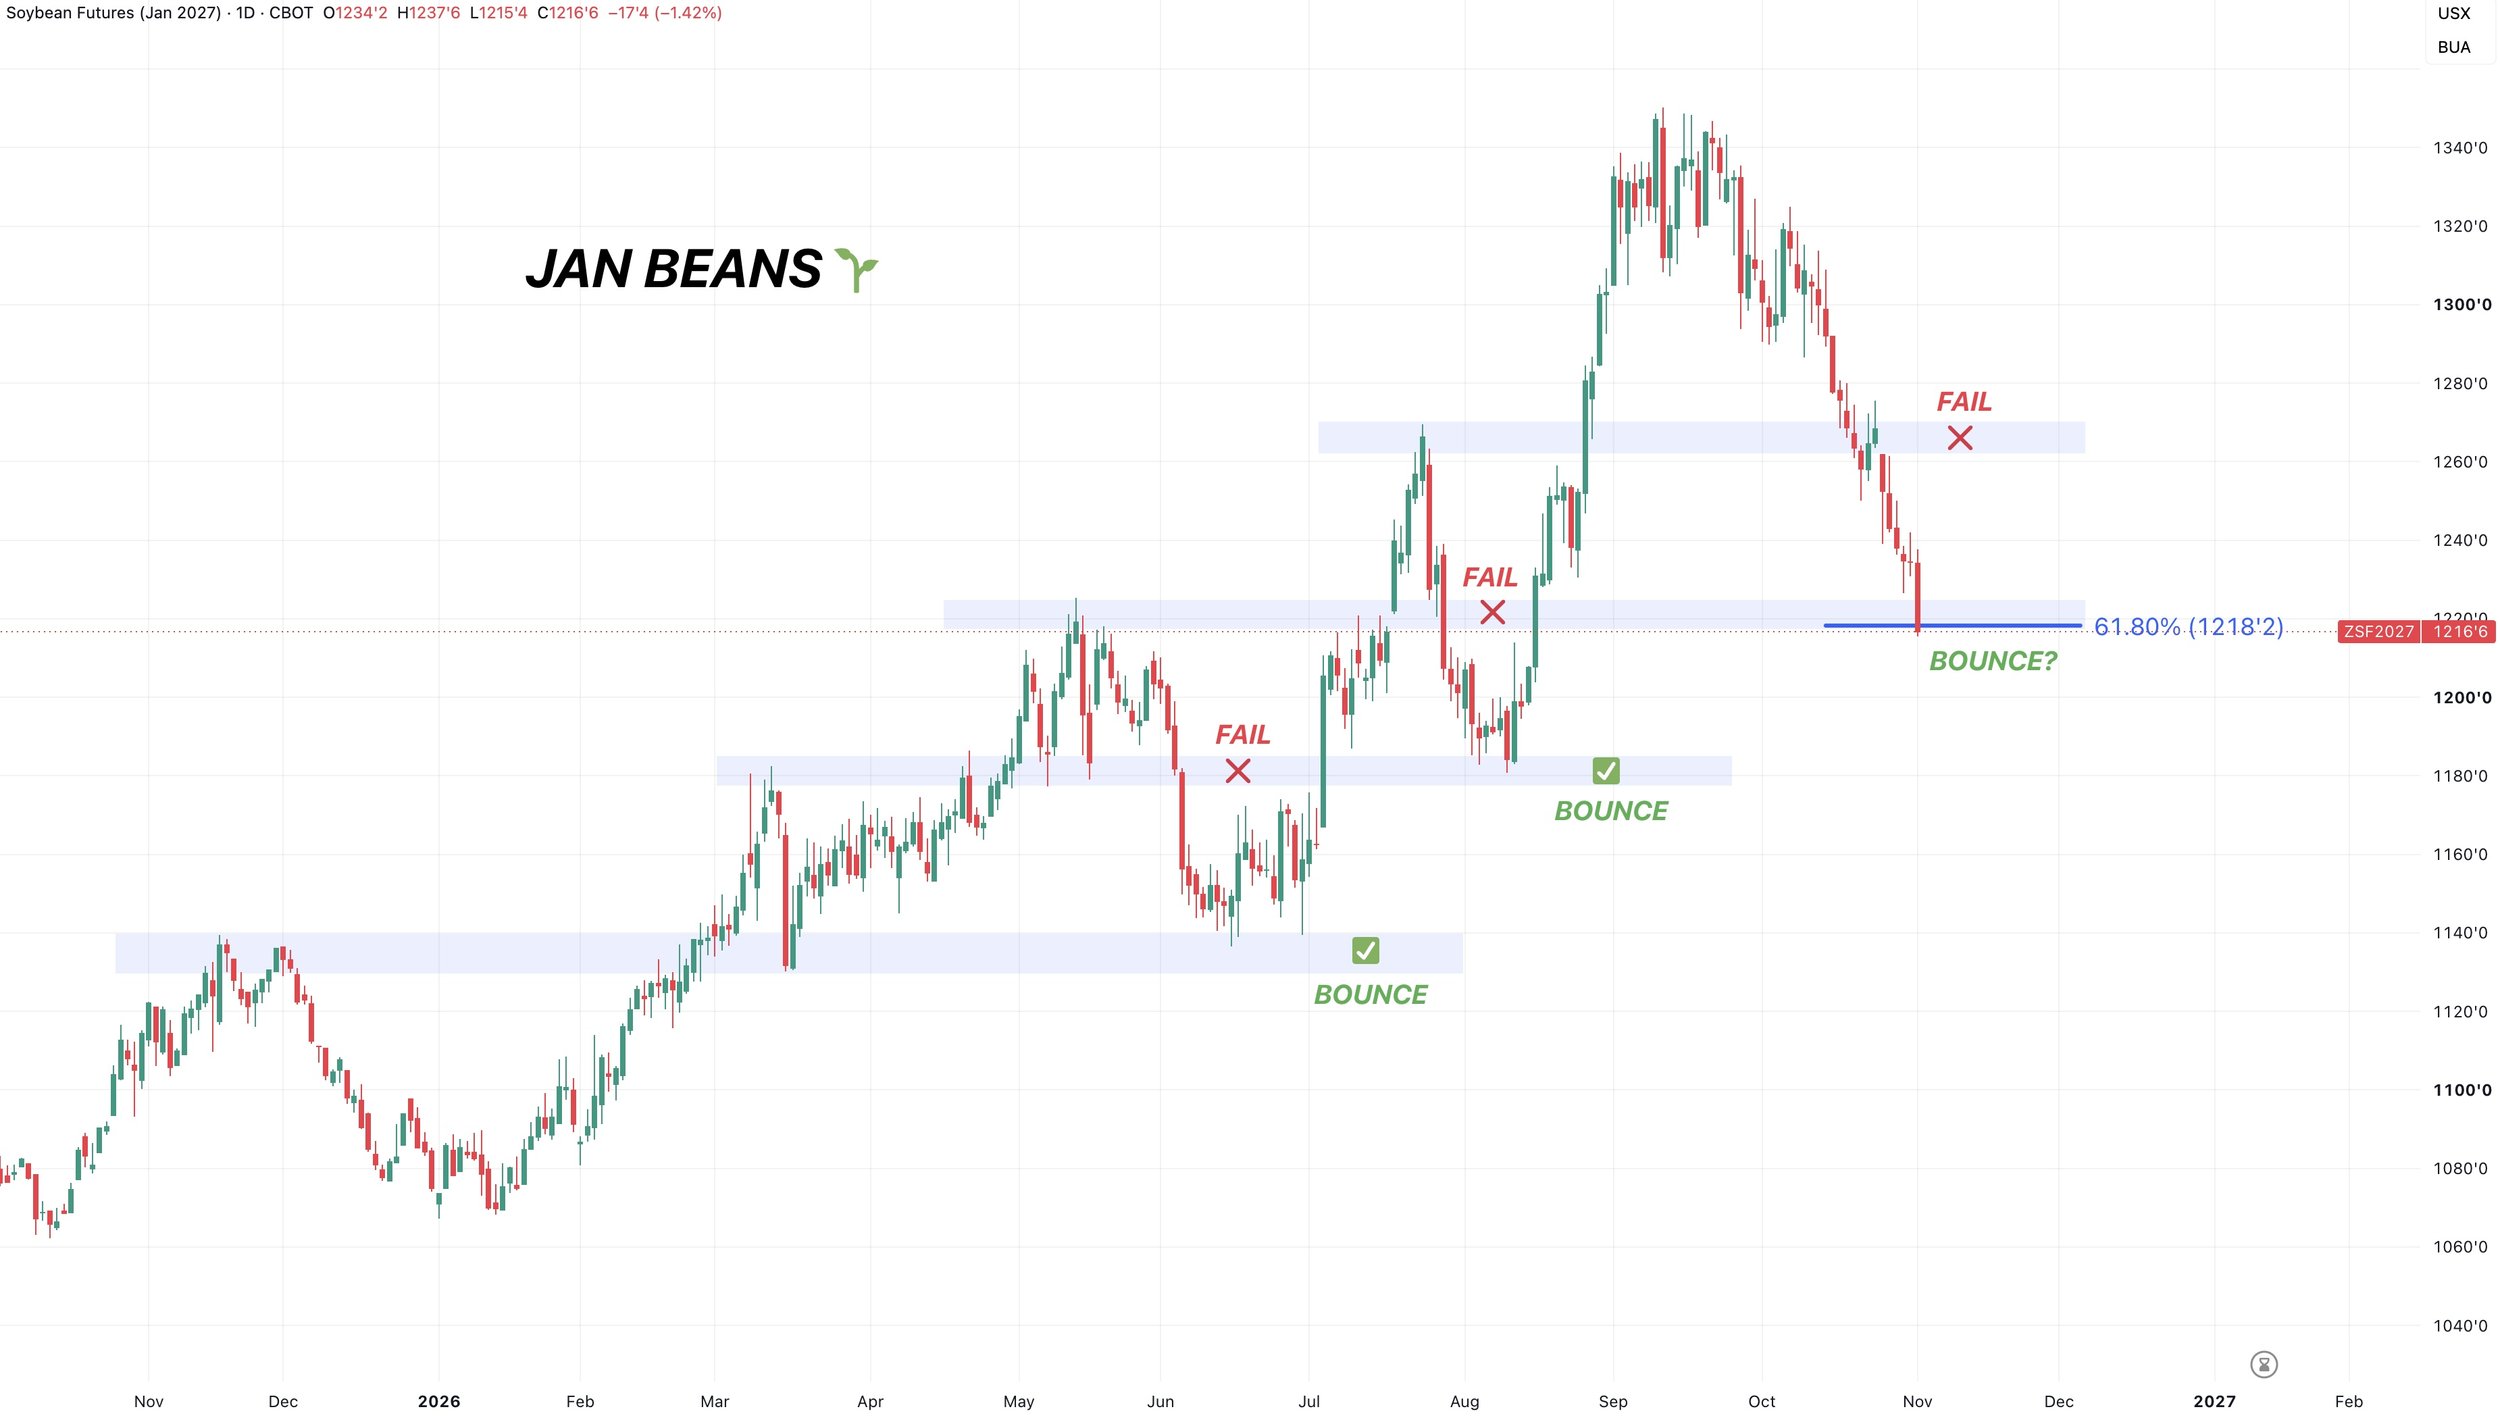
Soybeans have consistently turned old highs into new lows all year long. But the key here is that we have always failed to hold the most recent highs, instead bottoming at the highs before that.
In August we failed to hold the May highs. We then bottomed at the March highs.
In June we failed to hold the March highs. We then bottomed at the November highs.
Now we failed to hold the July highs. Perhaps we can bottom at the May highs now. As we have yet to turn them into support.
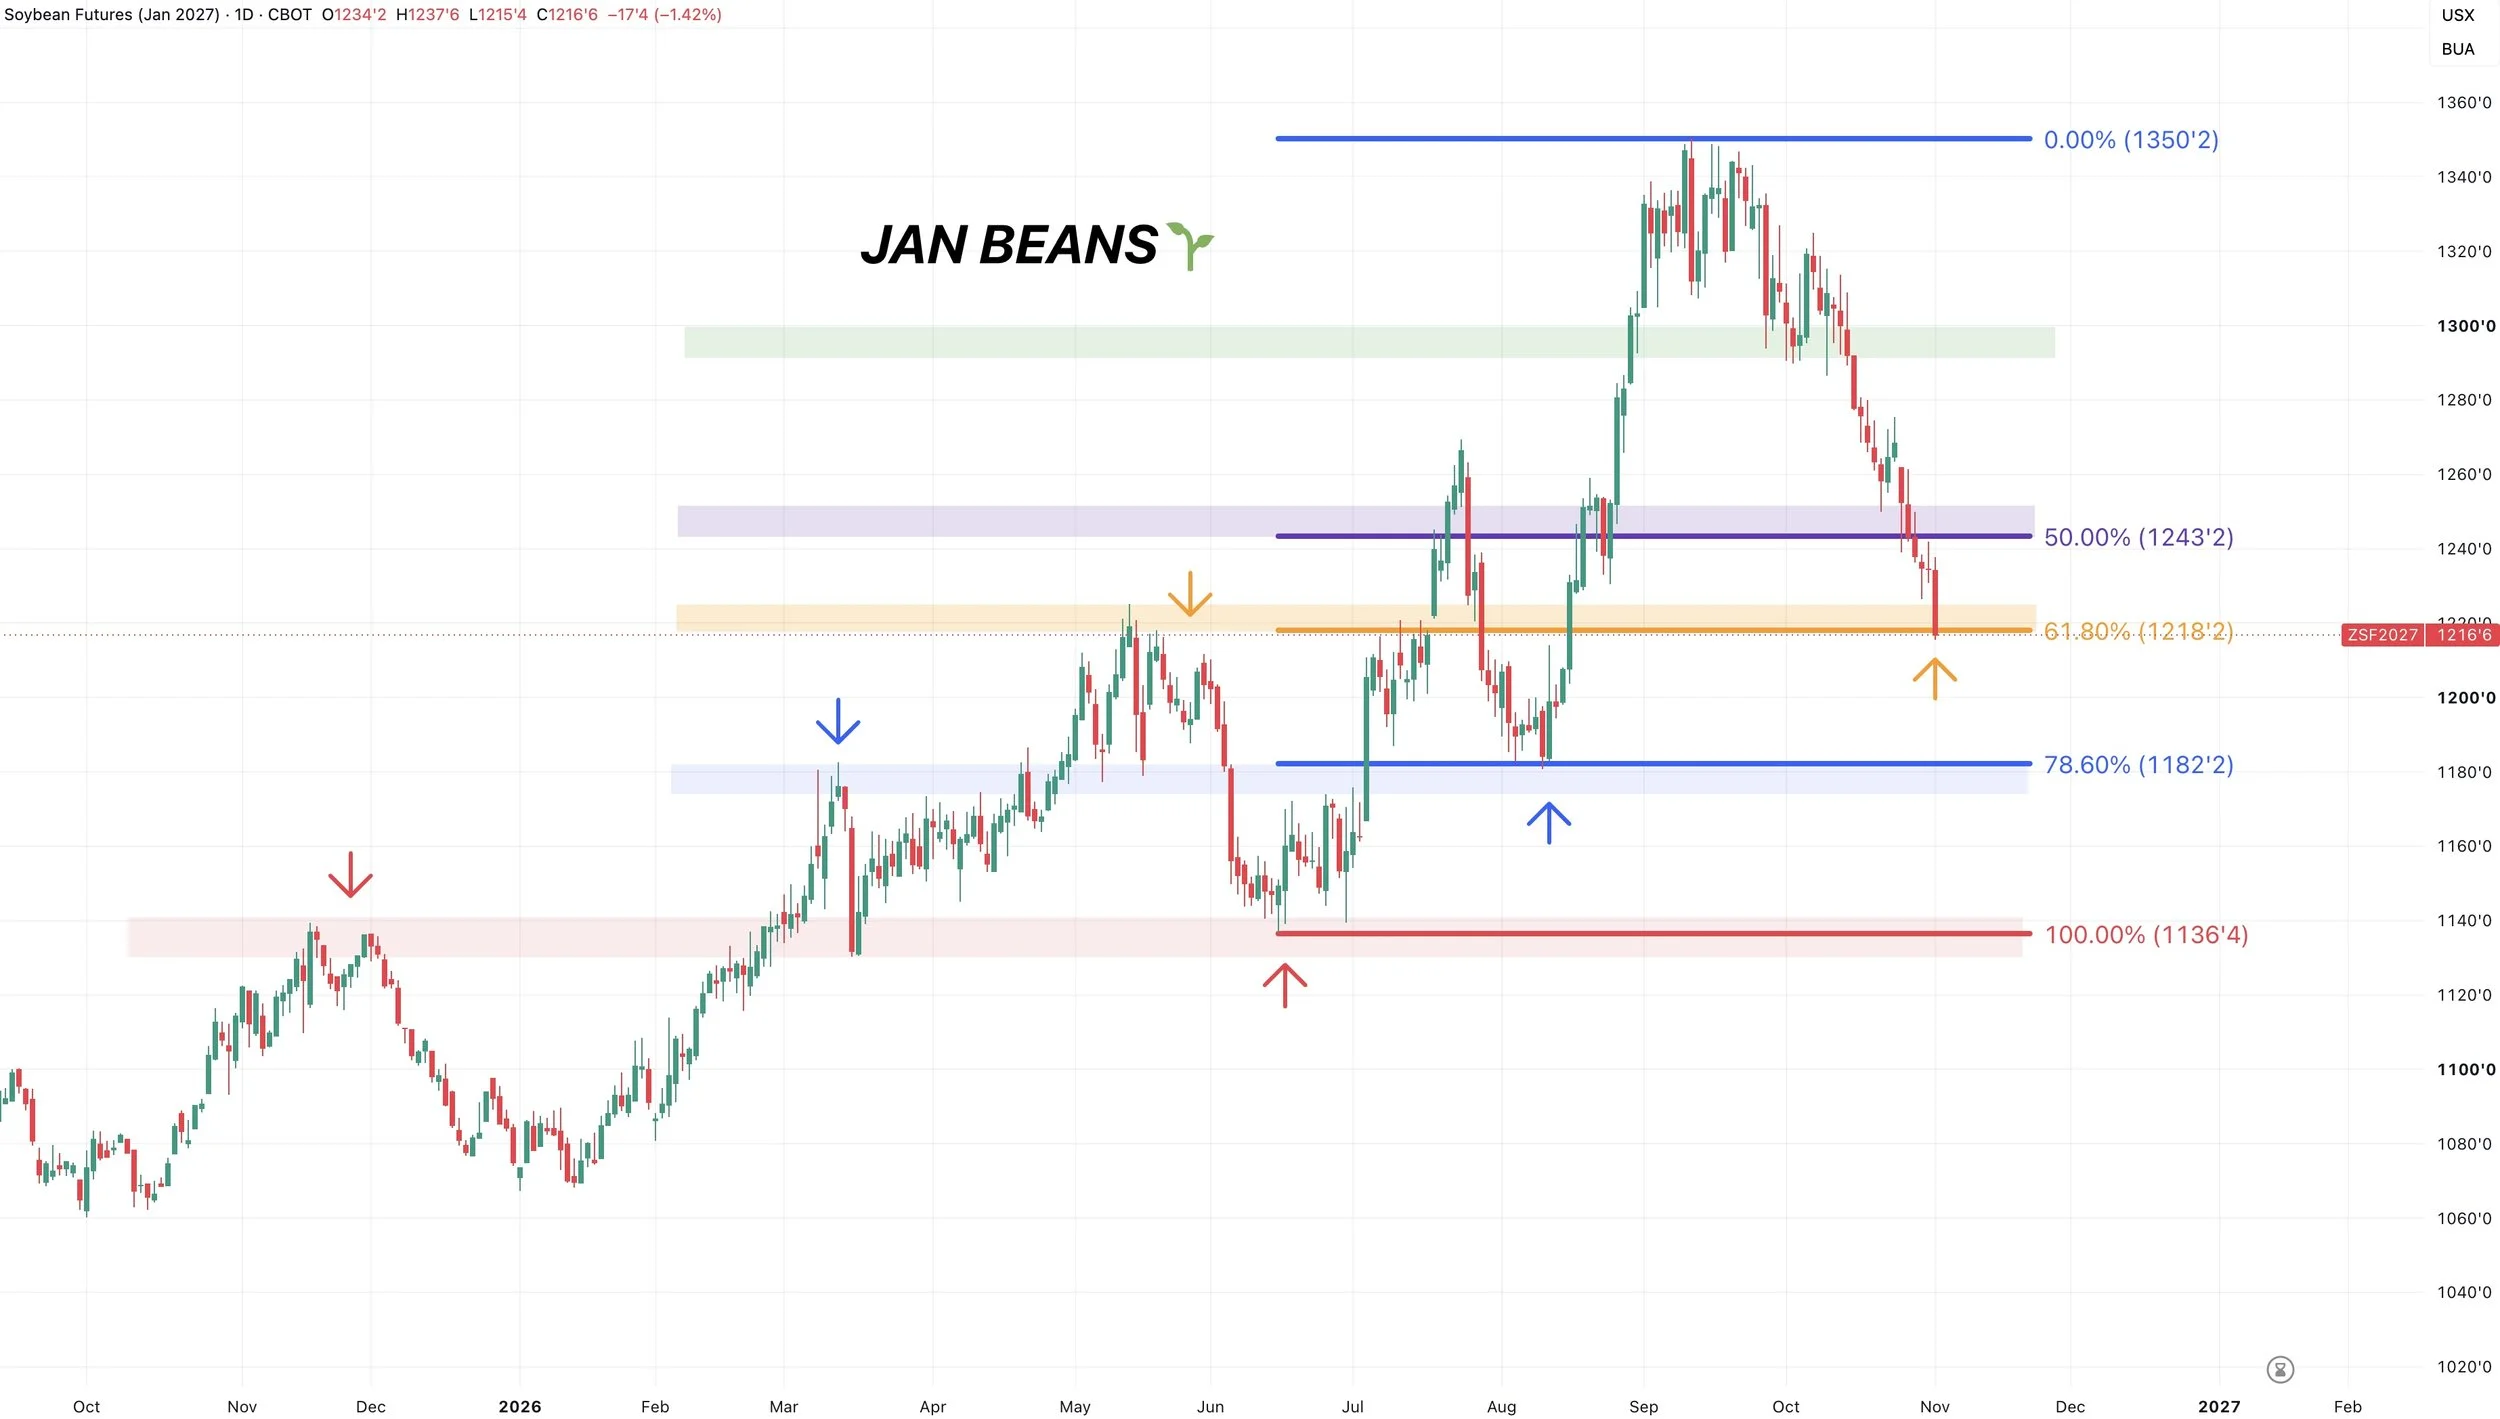
If we look at the retracements.
We are currently sitting right at the 61.8% level down to the June lows. So this would be a big point of interest for us to find some support. As this is the most common retracement.
As again it’s right at those May highs.
But what if we are not able to hold this level right here?
Scroll for the next chart.
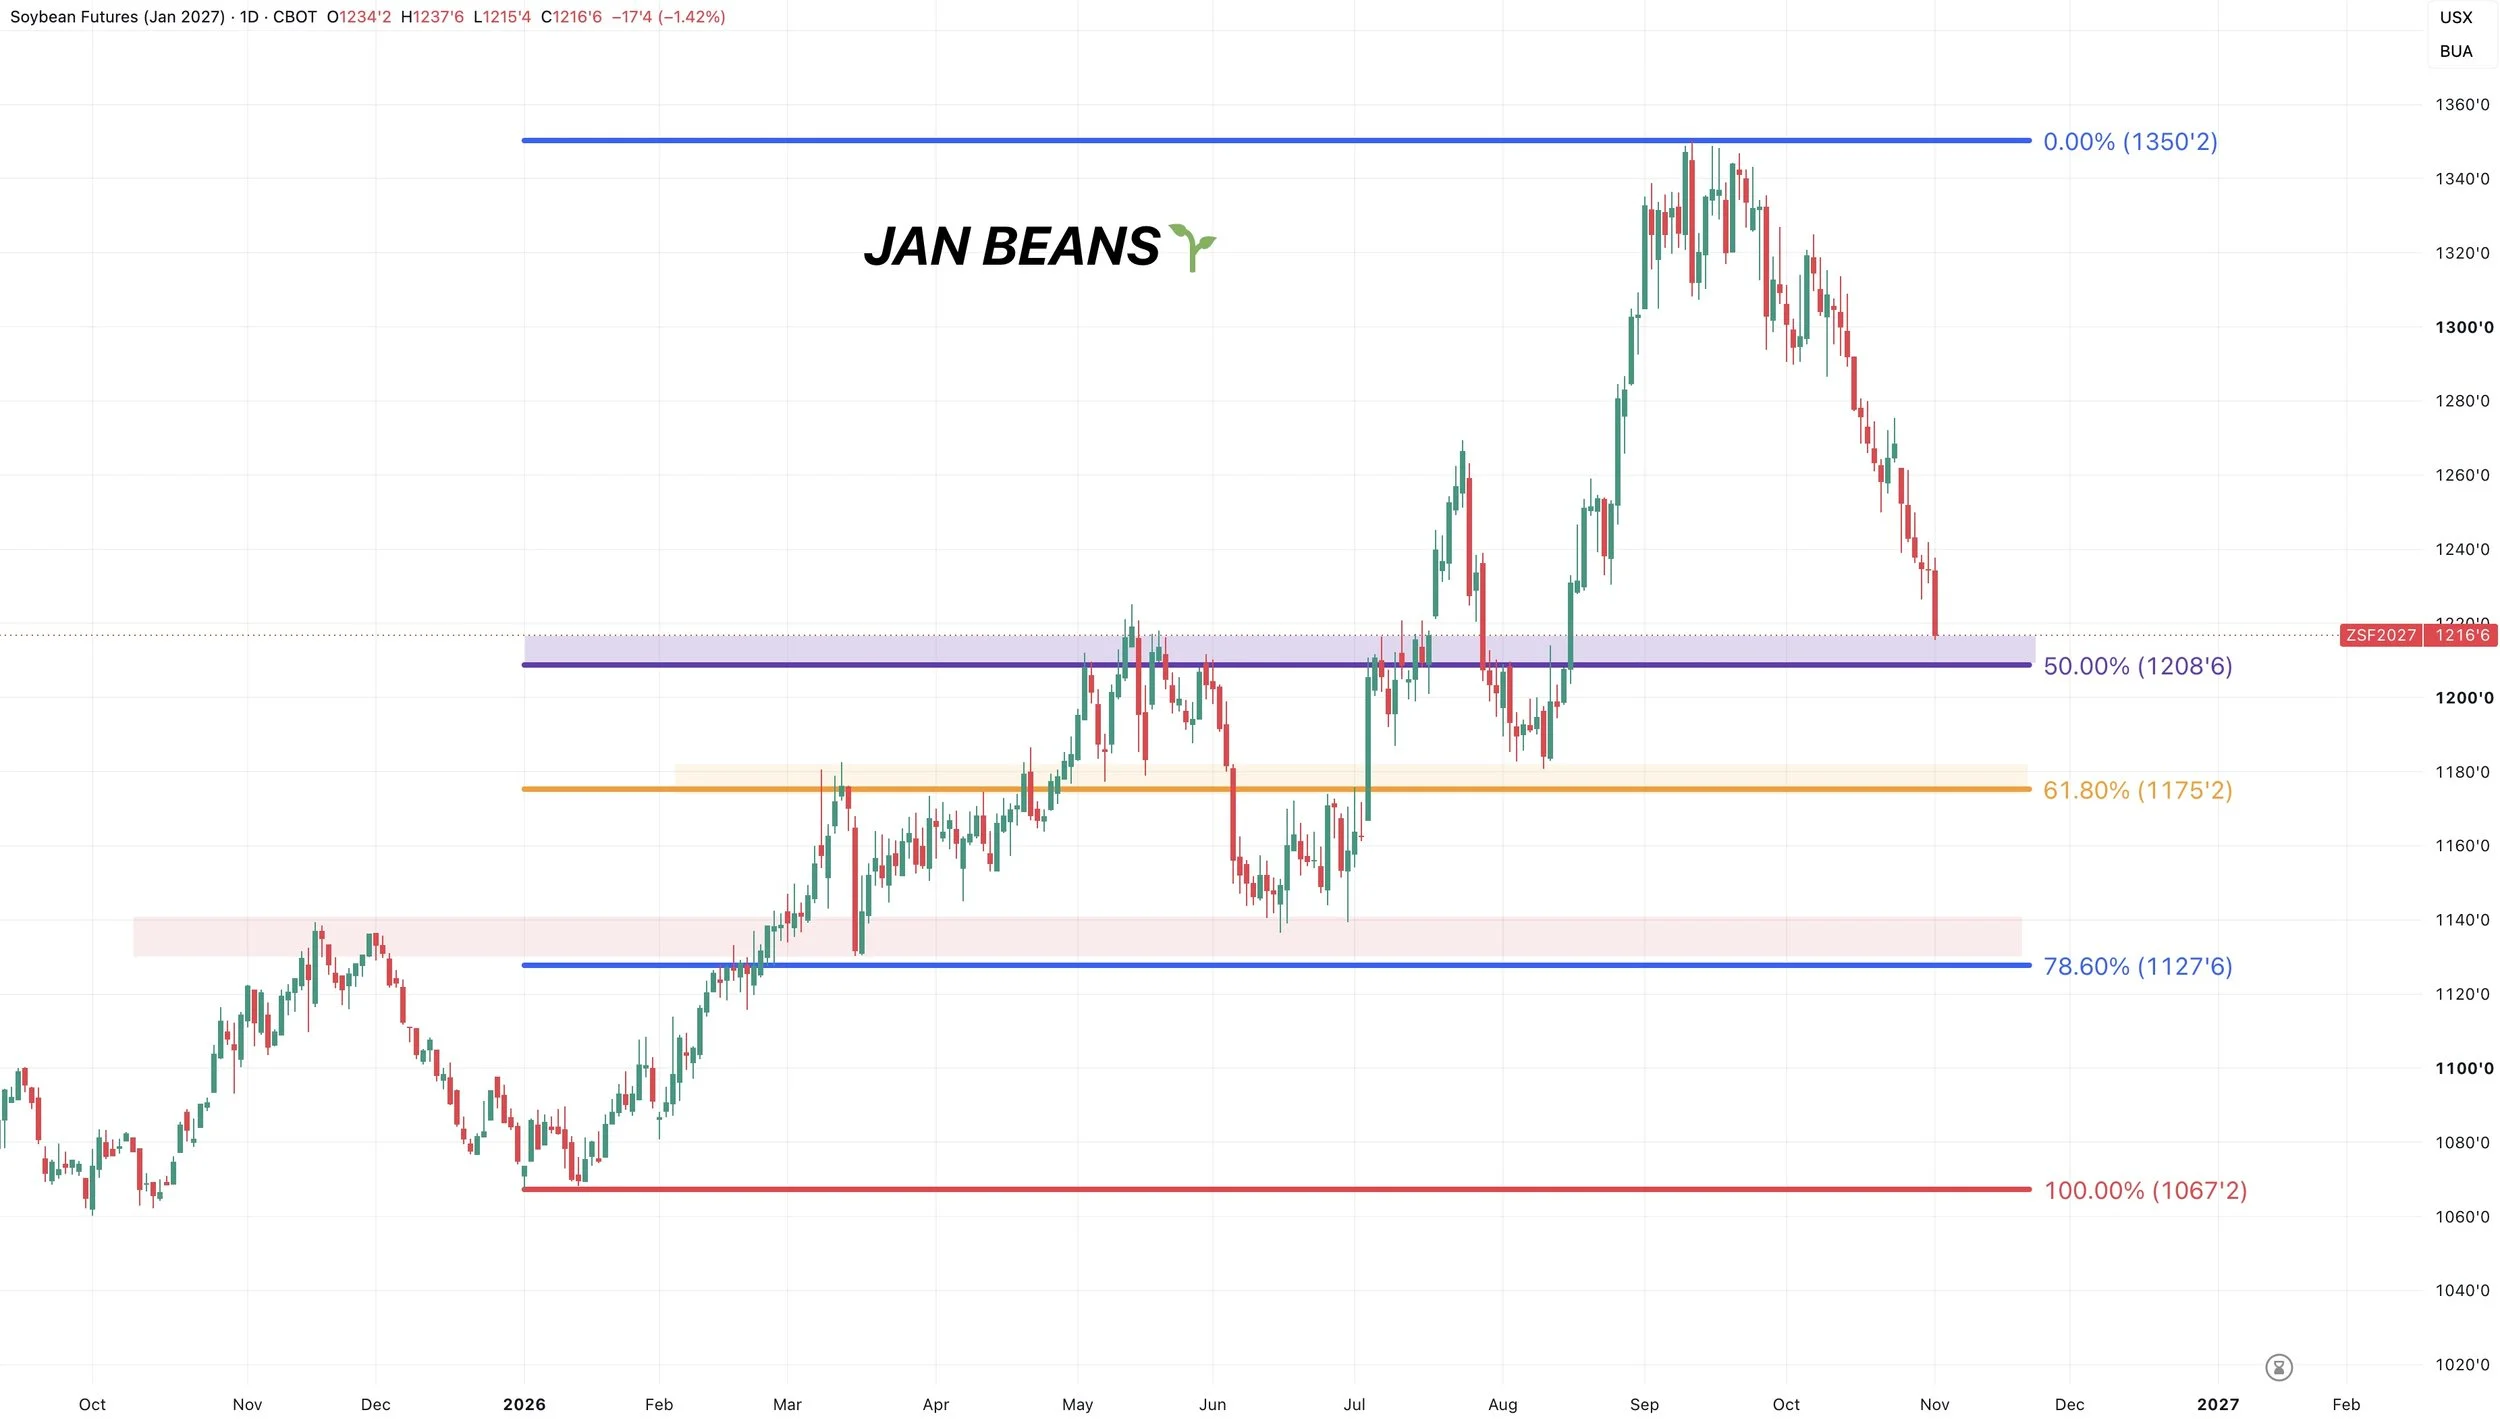
Here are the retracements down to the yearly lows instead of just down to the June lows.
The 50% level sits at $12.09. Again that re-tests all those May highs.
I would say that is the line in the sand here short term. If you lose $12.09 it would open the door around another 30 cents lower towards $11.80 and those August lows.
But for now, I still expect us to bounce at these May highs.
Hopefully that makes sense.
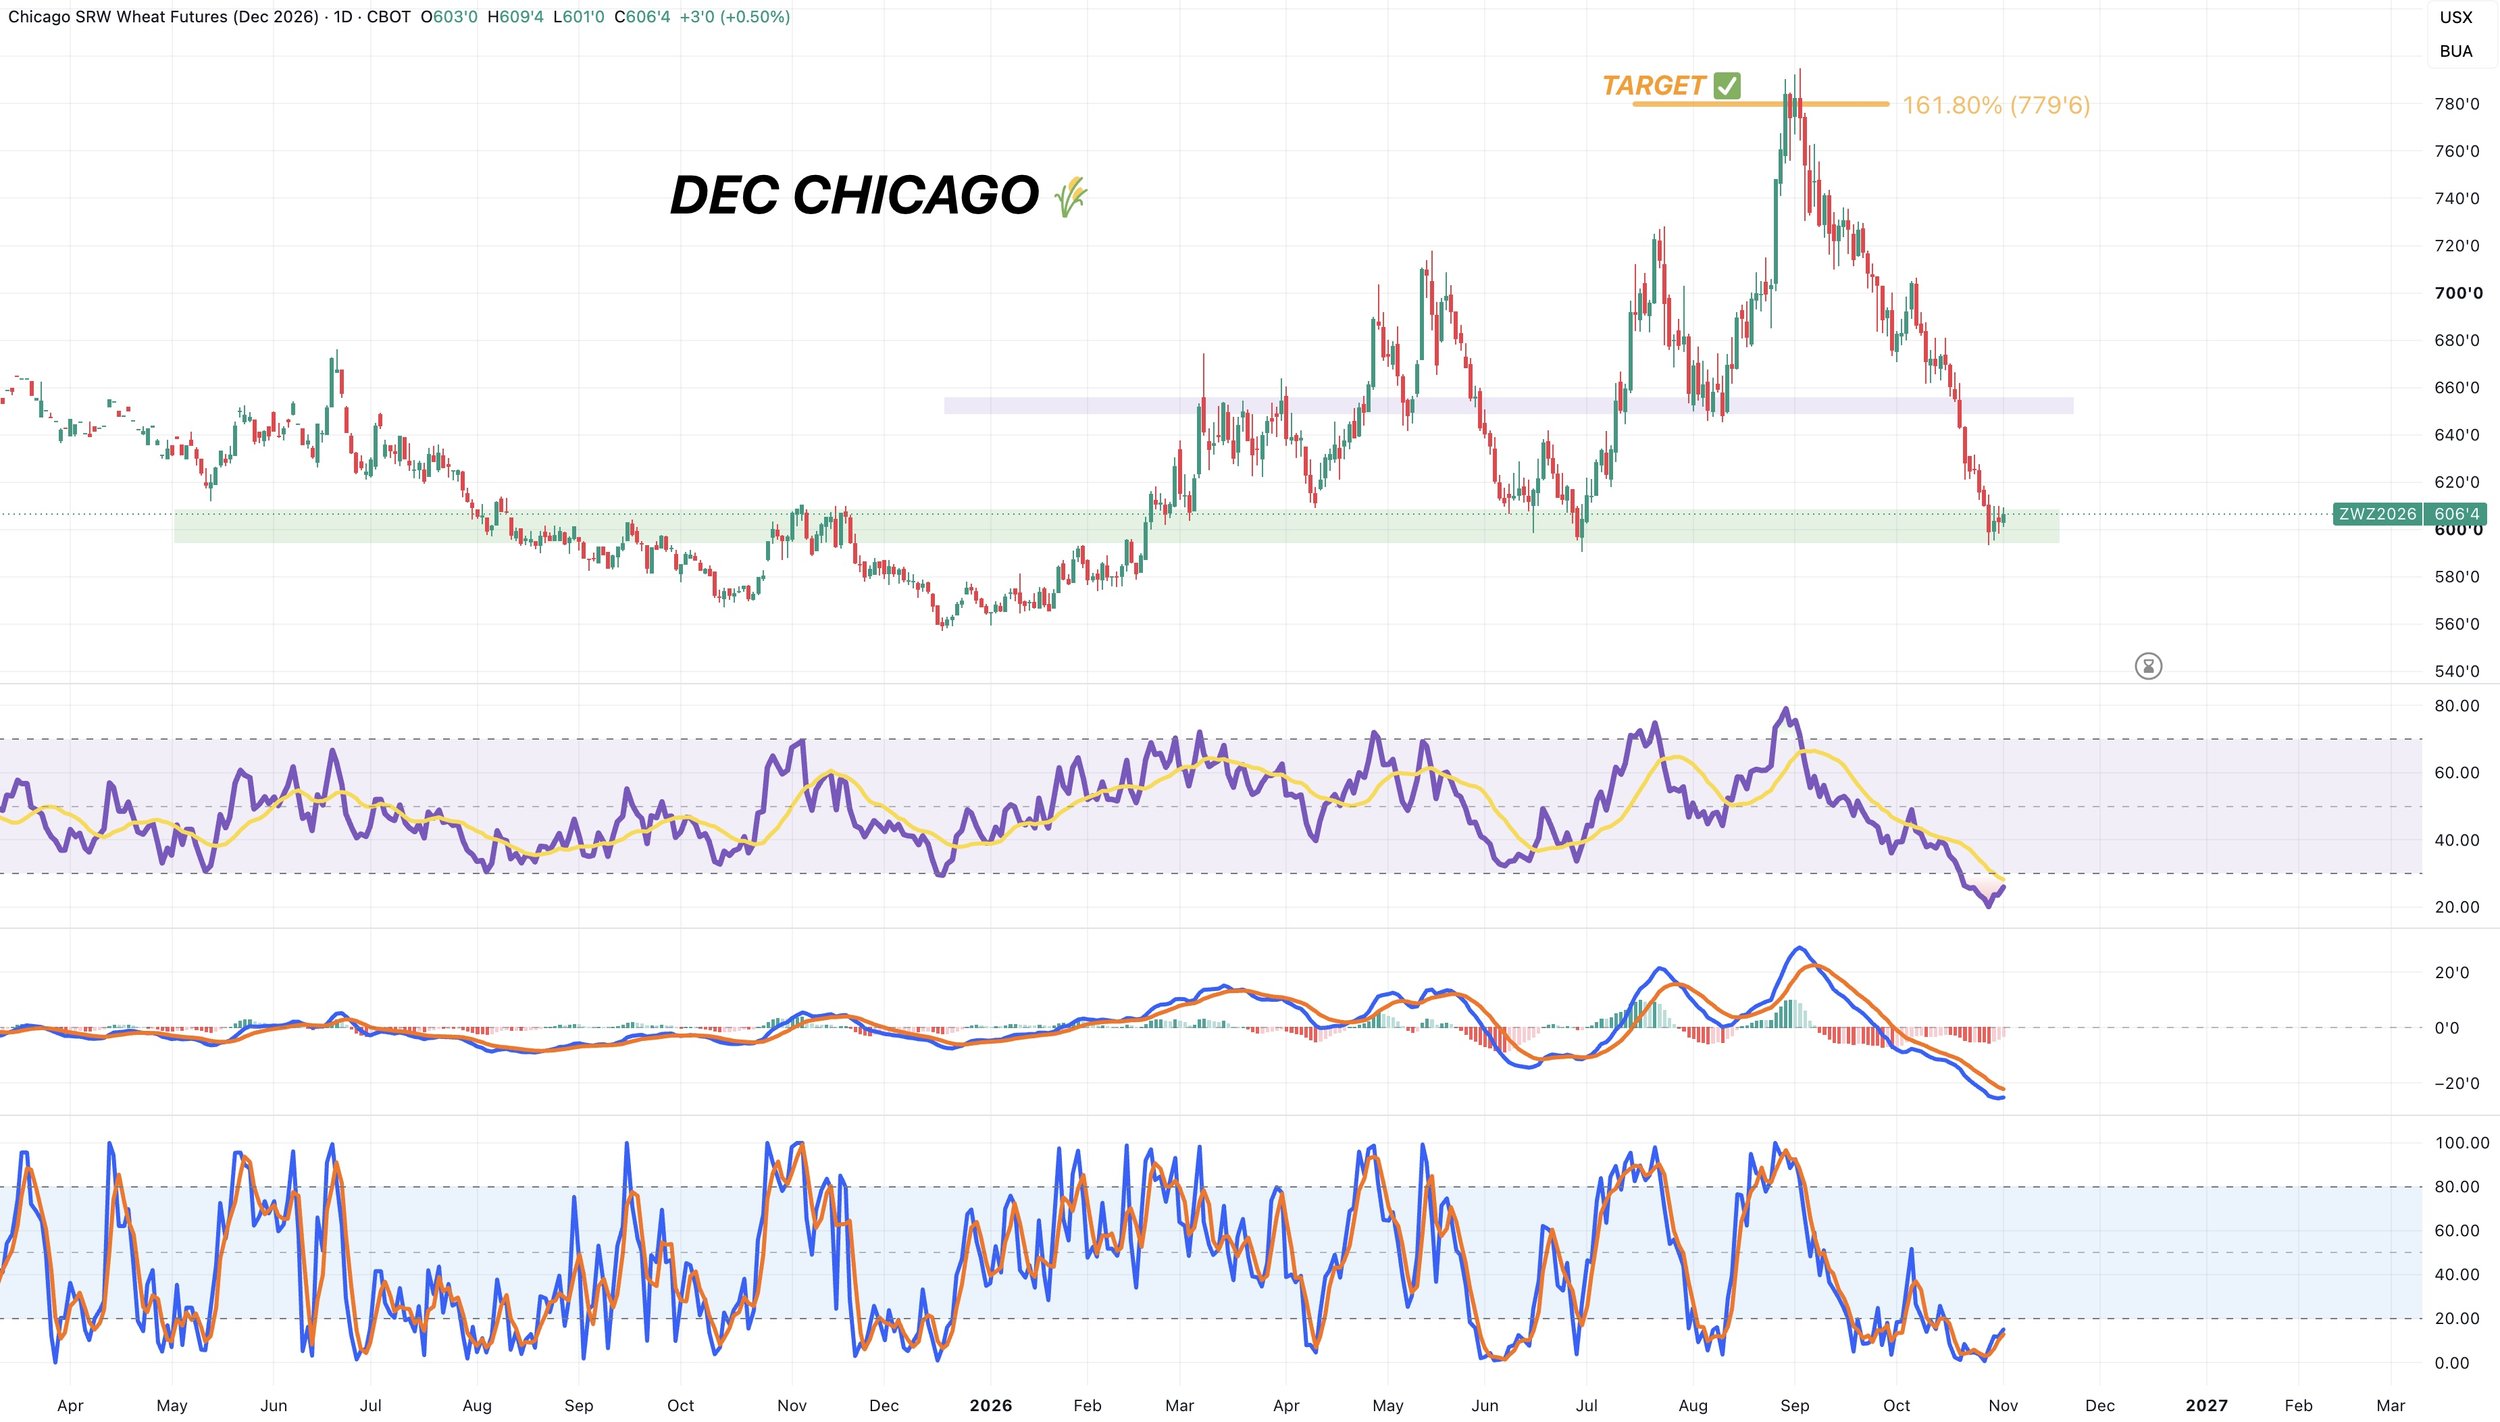
Dec Chicago 🌾
Pretty simple here.
We are at the very last support before contract lows. If we are going to bounce, bulls want it to happen right about now. So far we are finding some stablization which is nice to see.
The indicators are all starting to pick up some momentum too after being beat down hard.
Want to Talk?
Our phones are open 24/7 for you guys if you ever need anything or want to discuss your operation.
Jeremey & Office: (806)484-1214
Sebastian: (605)280-1186
Email: sfrost@dailymarketminute.com
Hedge Account
Interested in a hedge account? Use the link below to set up an account or give us a call.