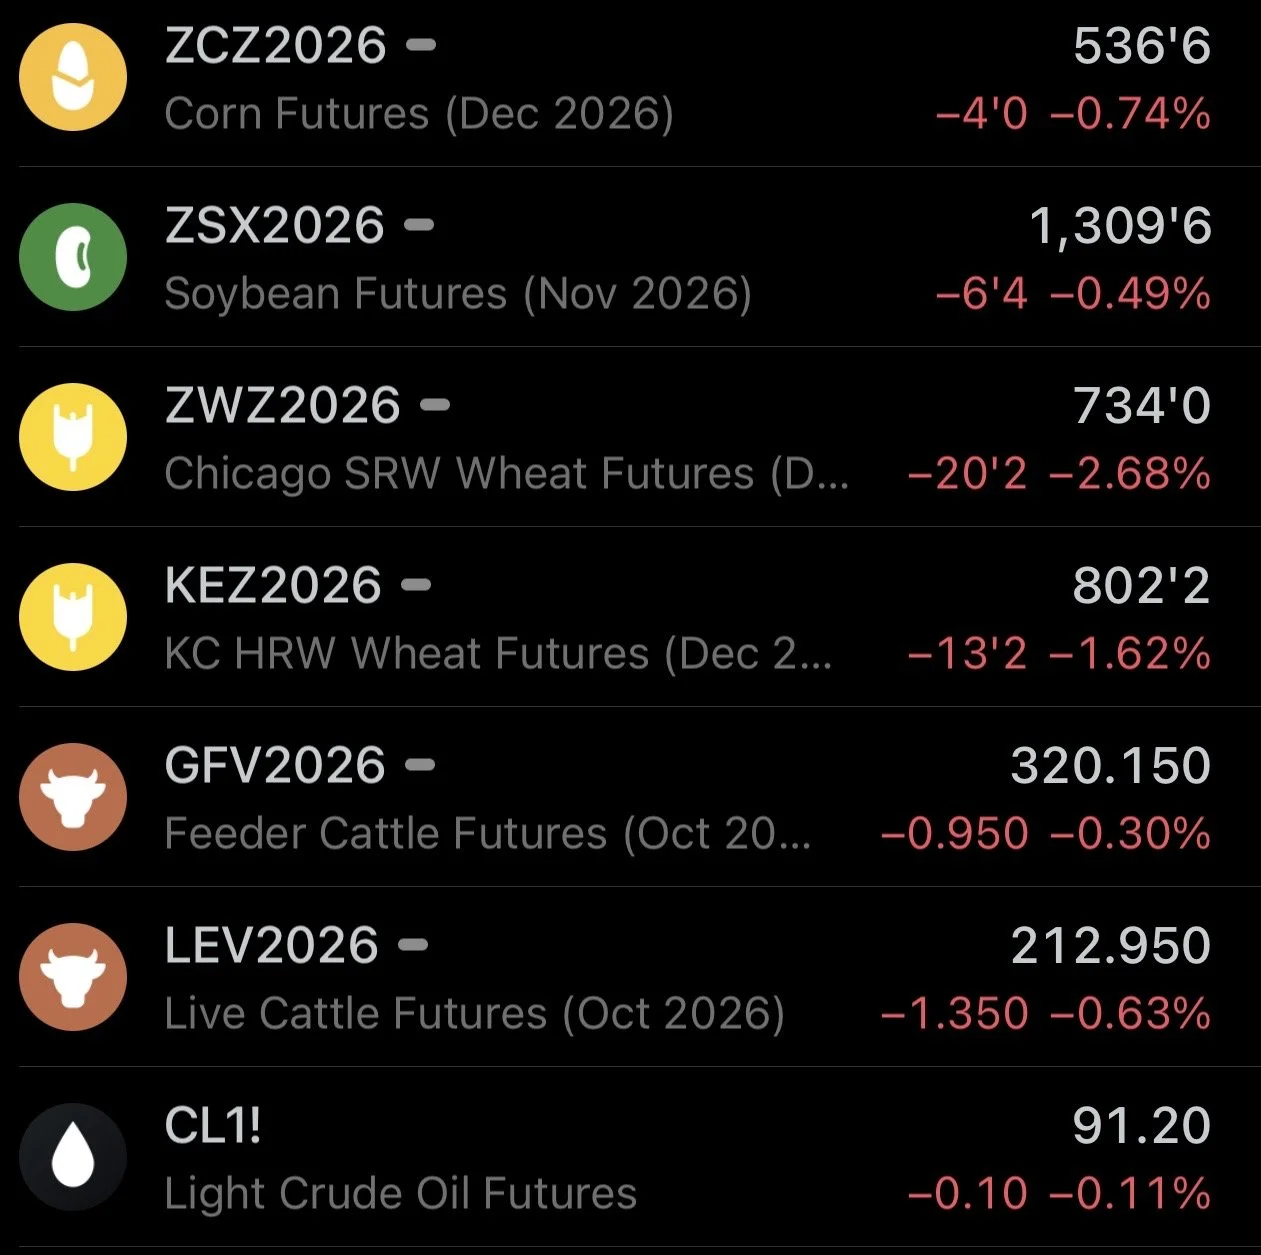
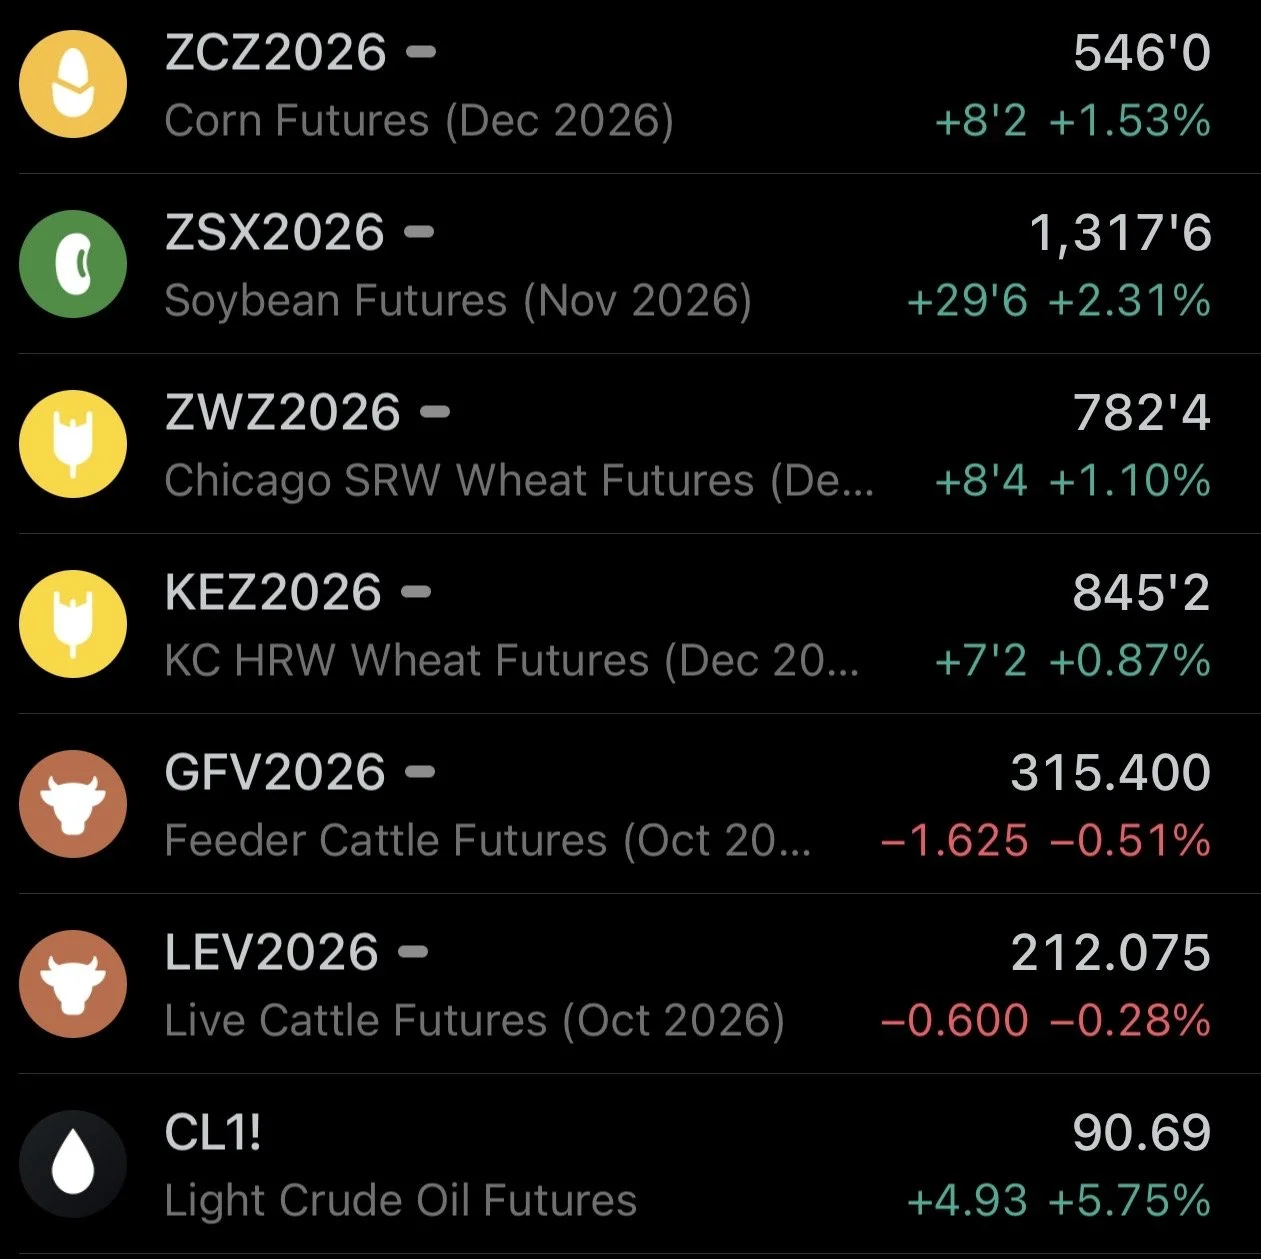
WHAT THE USDA REPORT MEANS
AUDIO & REPORT RECAP
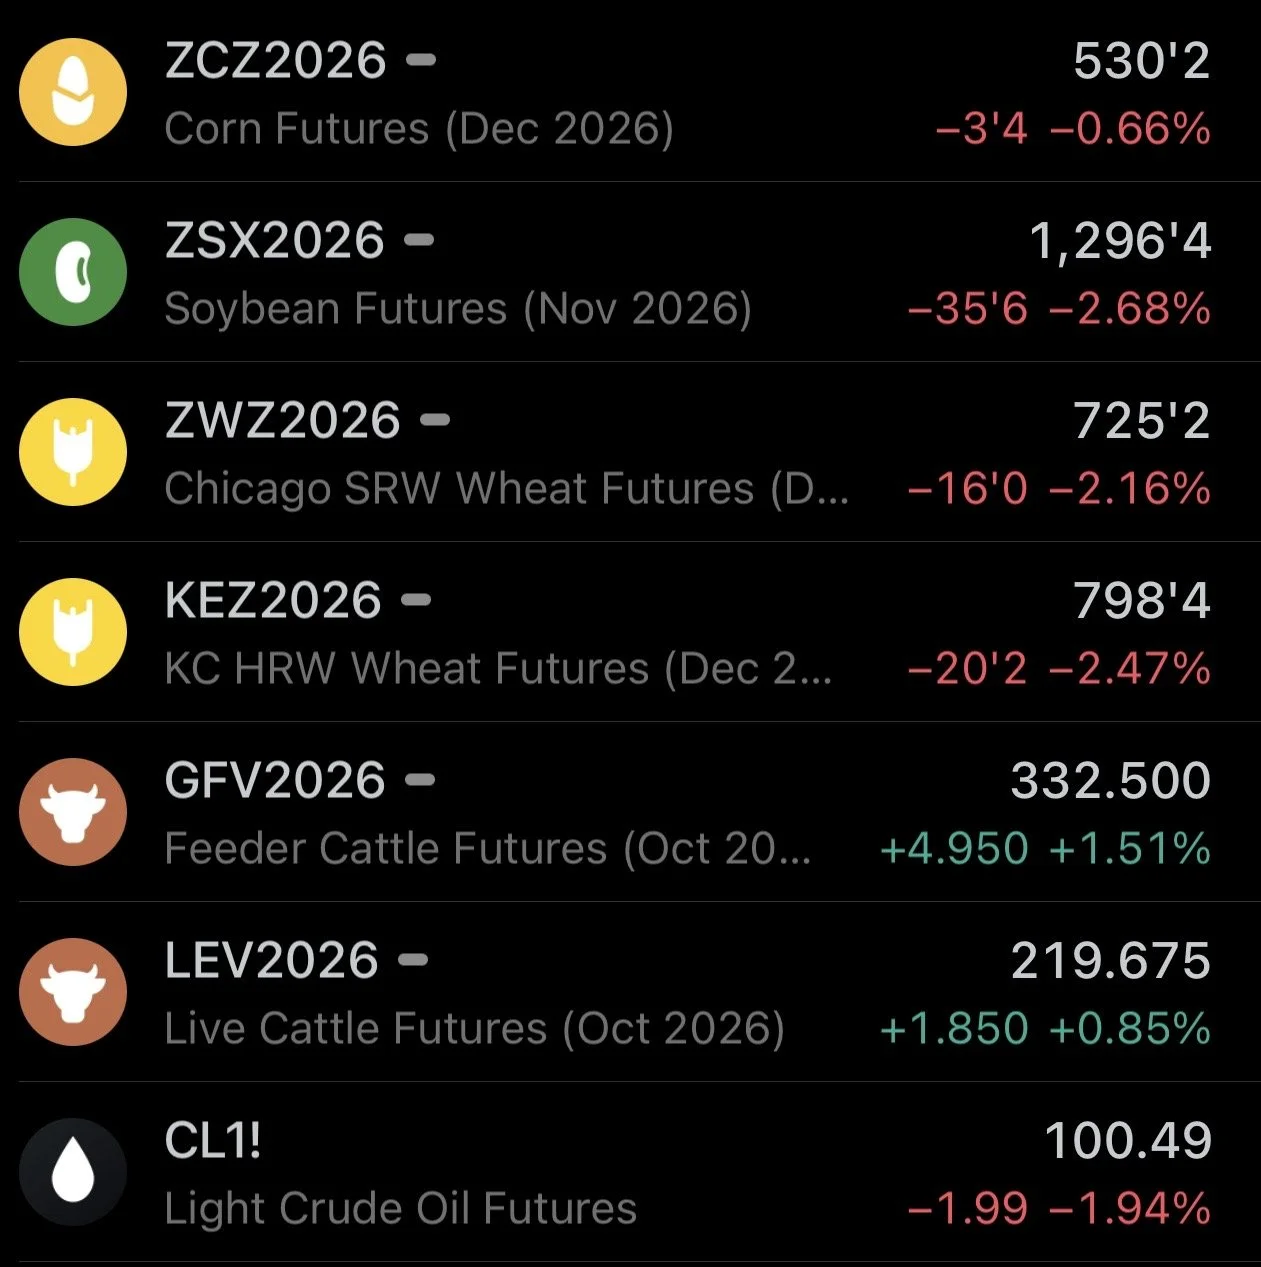
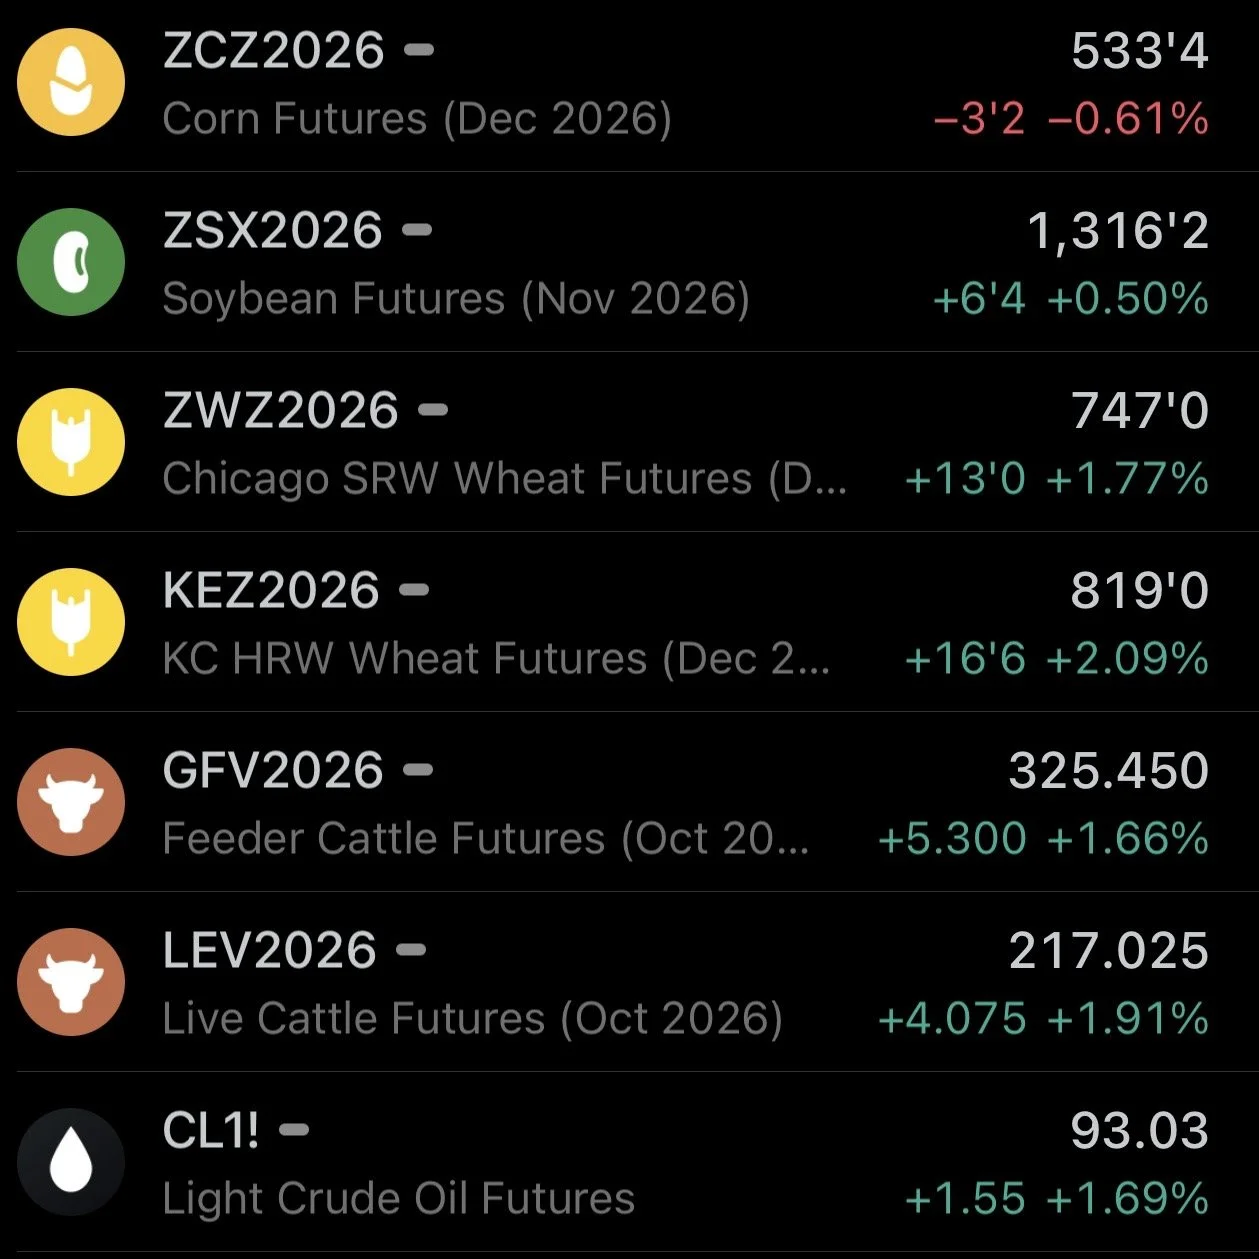
Stocks bullish across board
Corn acres way above. Bean acres way below.
3rd report in a row where we are tighter
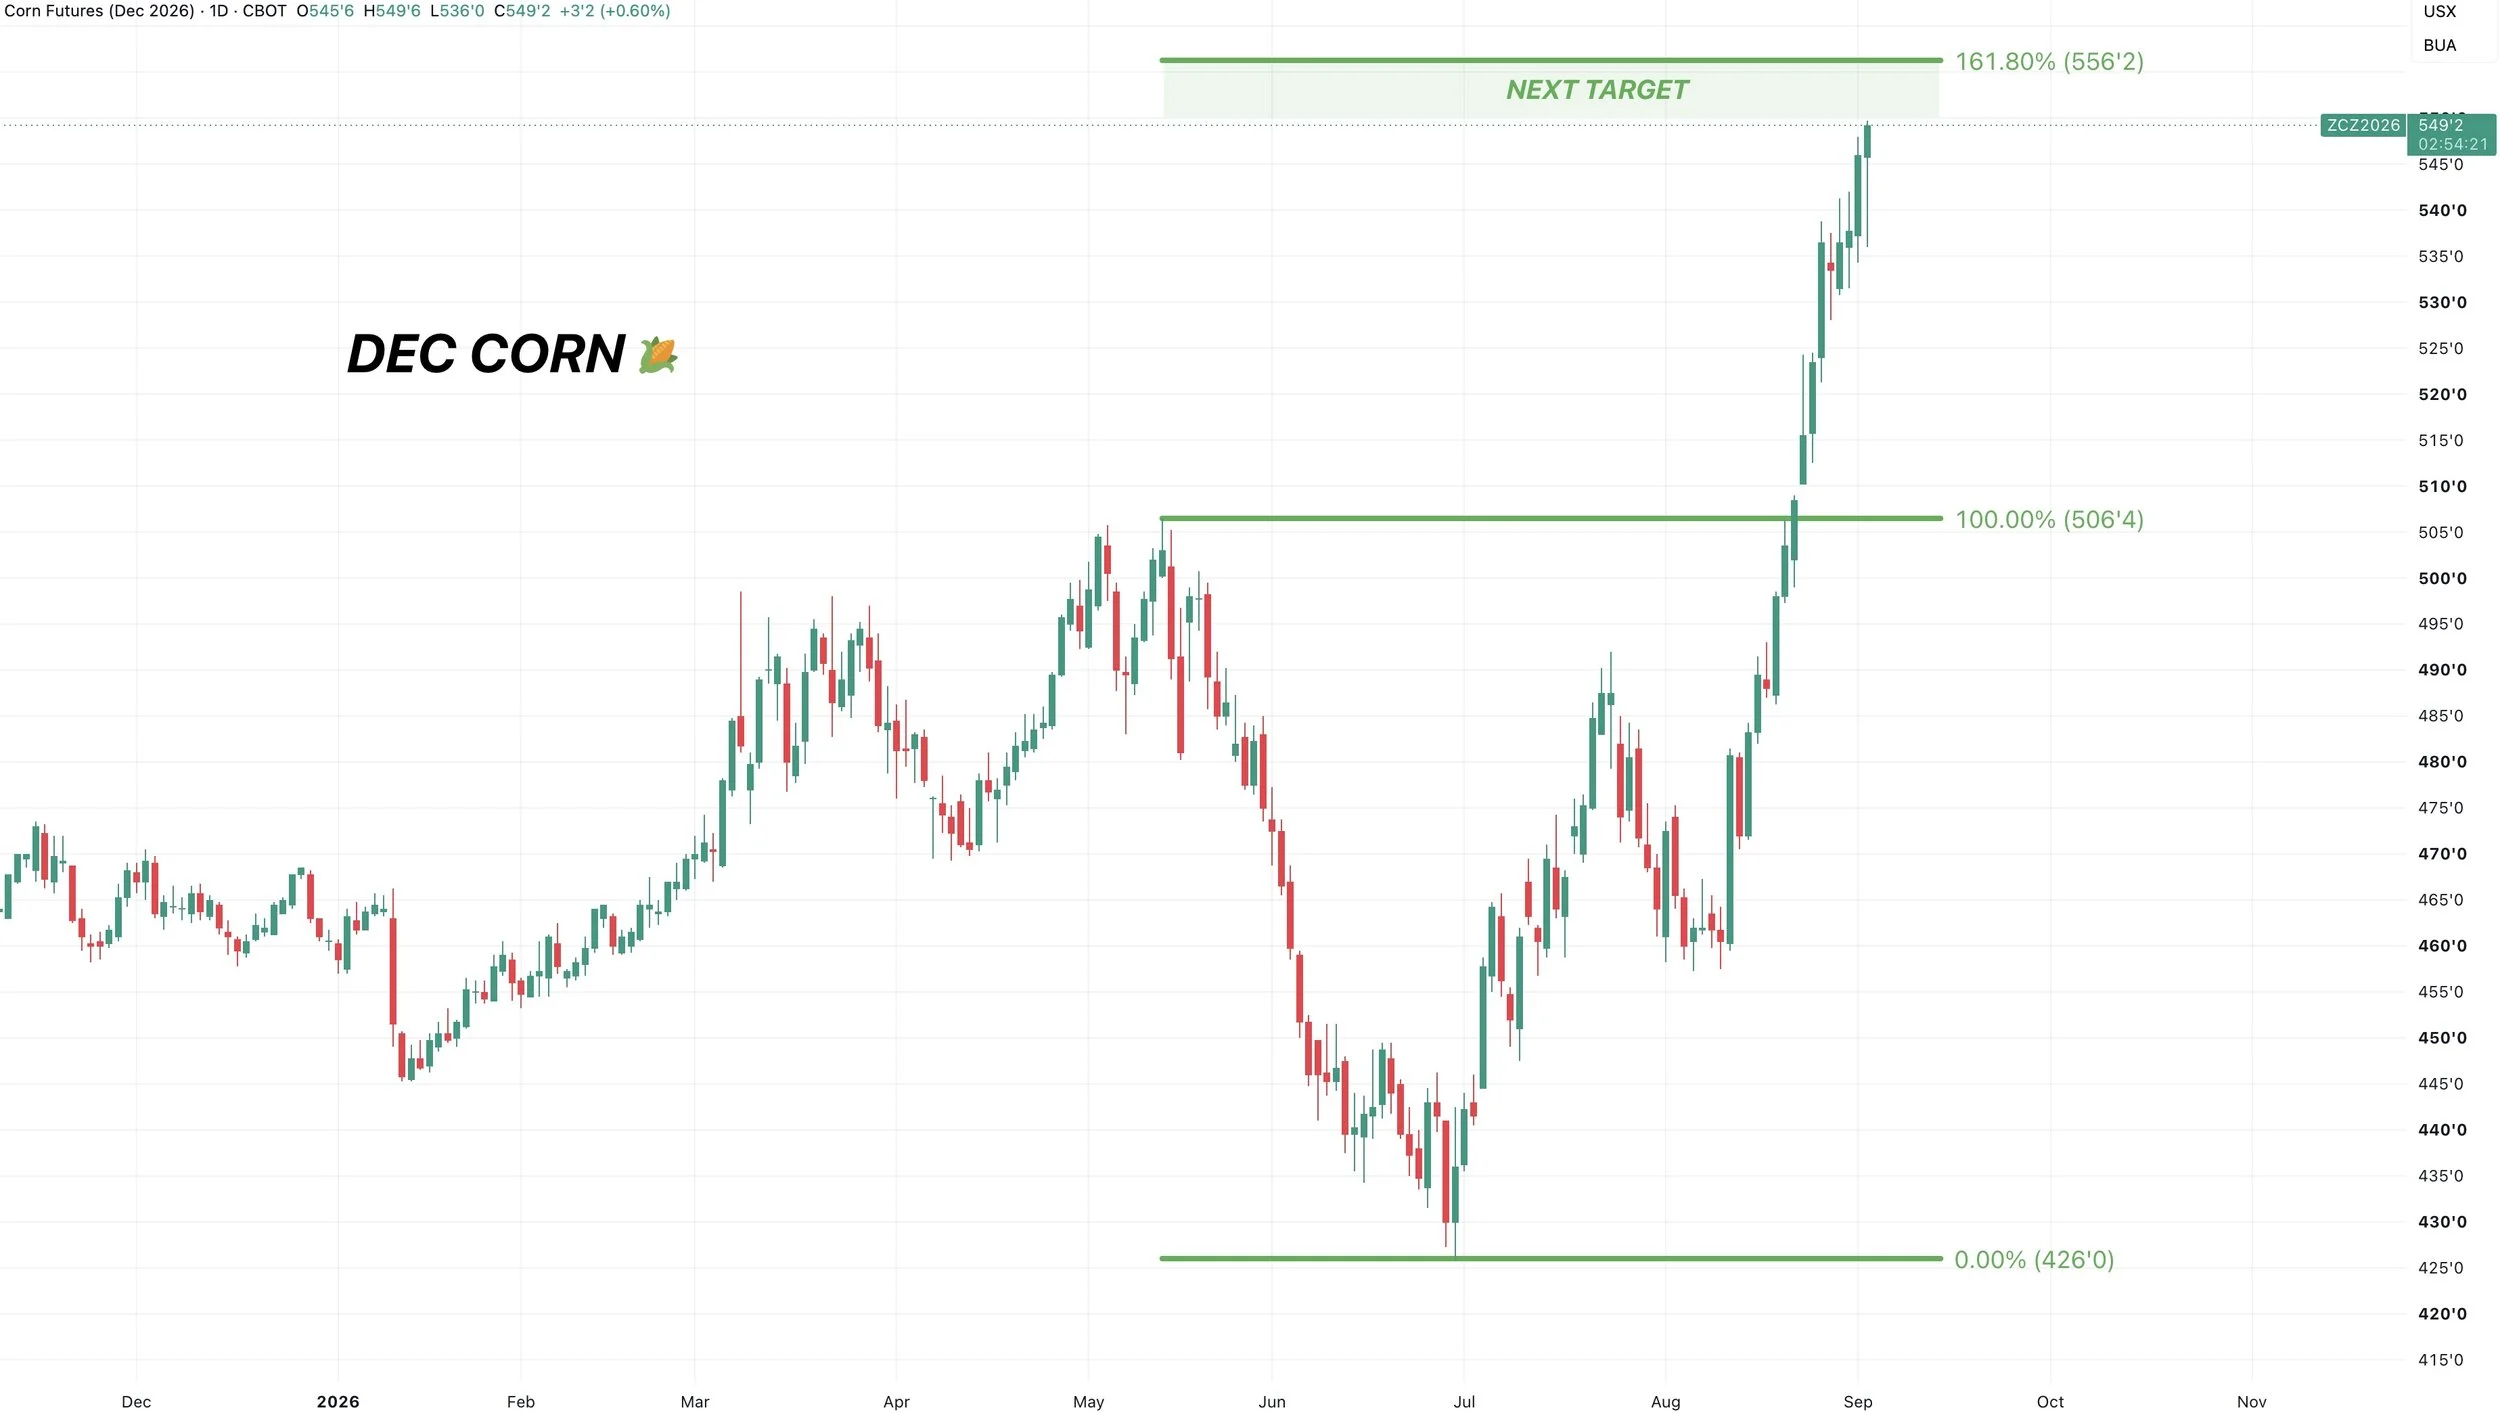
Can corn bounce off $5.00?
Report says weather is not as important for corn as beans
Not much room for error with beans
Areas like North Dakota won’t raise what they say
Will beans pull corn higher, or will corn drag beans lower?
Is path of least resistance to downside for corn
Difference between 2012 is we just haven’t had that heat
Low prices create better demand
What should you do in your specific situation
Listen to today’s audio below (Scroll for USDA numbers)
MISS OUR SALE? LAST CHANCE BEFORE YOUR TRIAL ENDS
We offered our biggest discount ever earlier this week. Since you were on a free trial we are still giving you access to this exclusive offer. Save over $500 yearly. Take advantage before it’s gone & your trial expires. (Must use link below).
$299/yr vs $800/yr
Become a Price Maker. Not a Price Taker
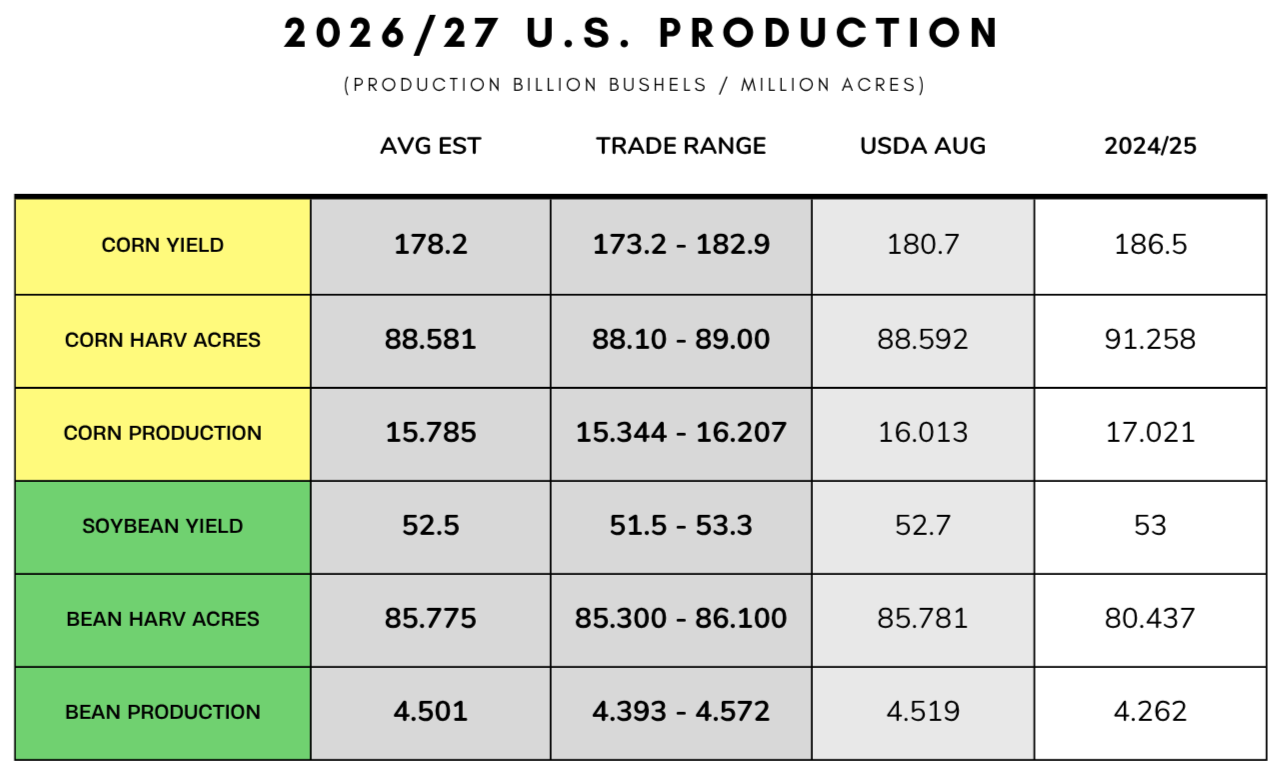
USDA NUMBERS
All stocks fall below estimates (Billion Bushels)
🌽 4.106 vs 4.255 (-6% from YOY)
🌱 0.796 vs 0.812 (-18% YOY)
🌾 0.580 vs 0.611 (-17% YOY)
Corn acres come in WAY above. Bean acres WAY below. (Million Acres)
🌽 94.096 vs 91.853
🌱 83.505 vs 87.673
🌾 49.628 vs 49.656

CHECK OUT PAST UPDATES