
MARKET UPDATE
You can scroll to read the usual update as well. As the written version is the exact same as the video.
Timestamps for video:
Overview: 0:00min
Corn: 3:50min
Corn Charts: 5:20min
Beans: 9:25min
Bean Charts: 11:30min
Wheat: 14:15min
Cattle: 16:25min
Want to talk?
Office: (806)484-1214
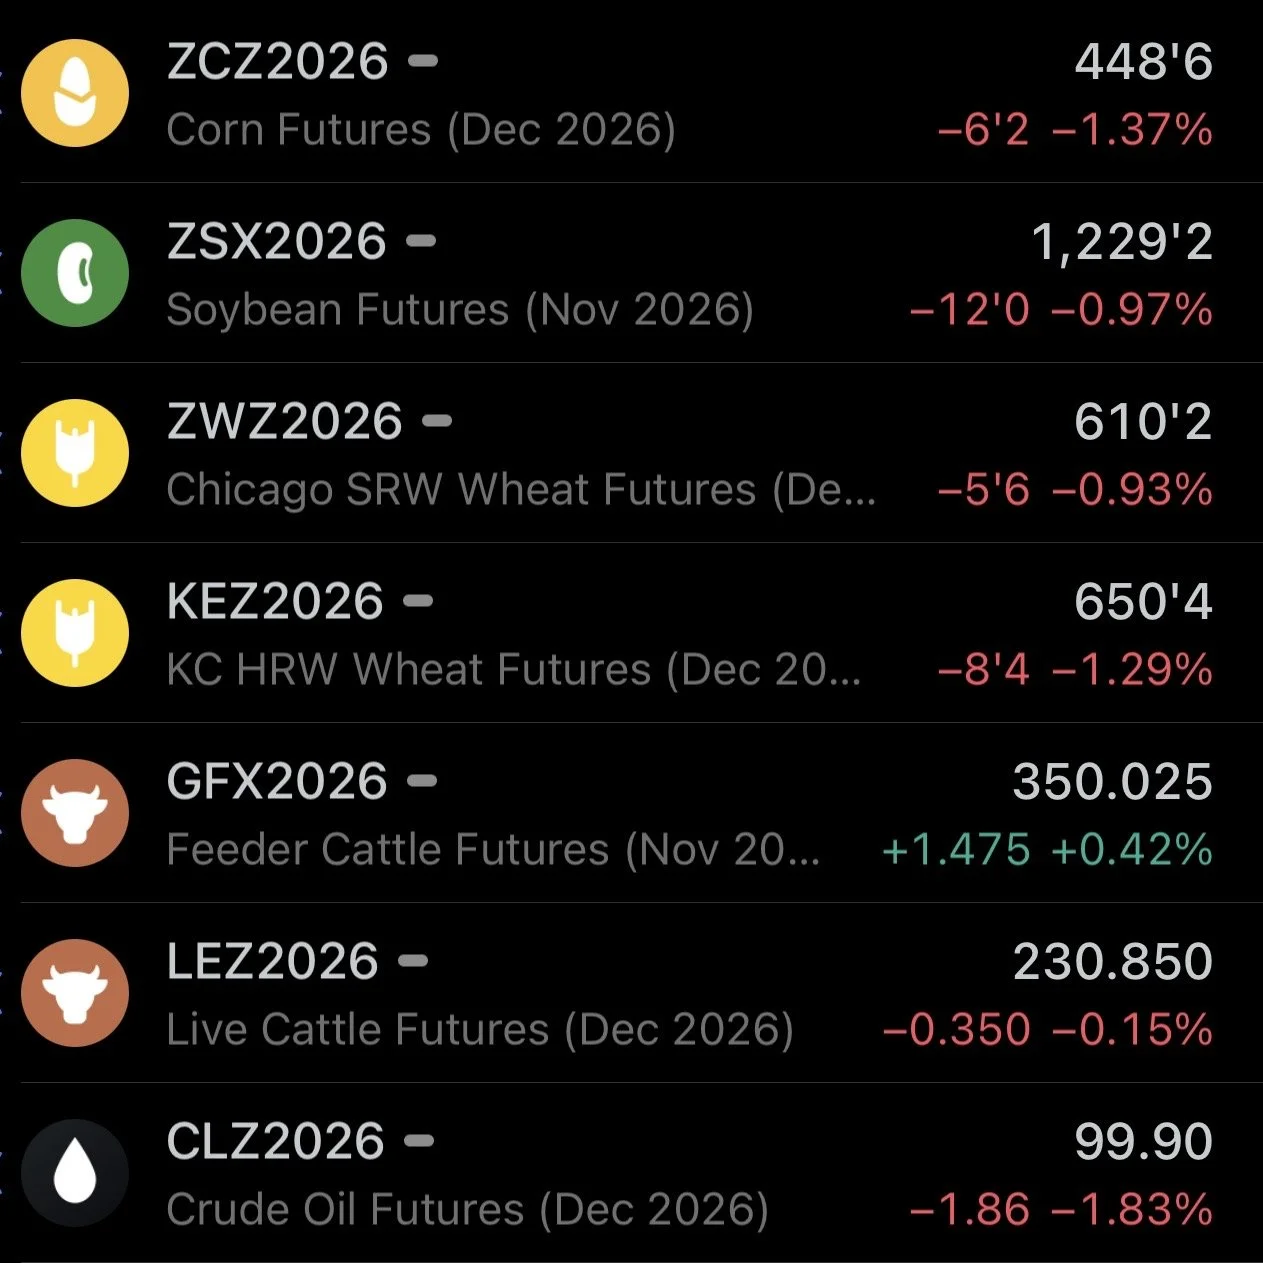
Futures Prices Close
Overview
Grains continue to fall apart, as nearly everything was lower today. As corn and wheat both posted yet another round of new lows today.
Soybeans closed well off the low's yesterday following the Brazil headlines, and they tried to rally today.
Soybeans were up +10 cents early on but failed and ended the day back near yesterday’s lows. Down about a dime on the day and -20 cents off the highs. So pretty disappointing price action today.
Corn has only had 4 green days in the past entire month.
Corn has not had a back to back green day since September 15th. As bulls just lack a catalyst for this market to catch it's footing.
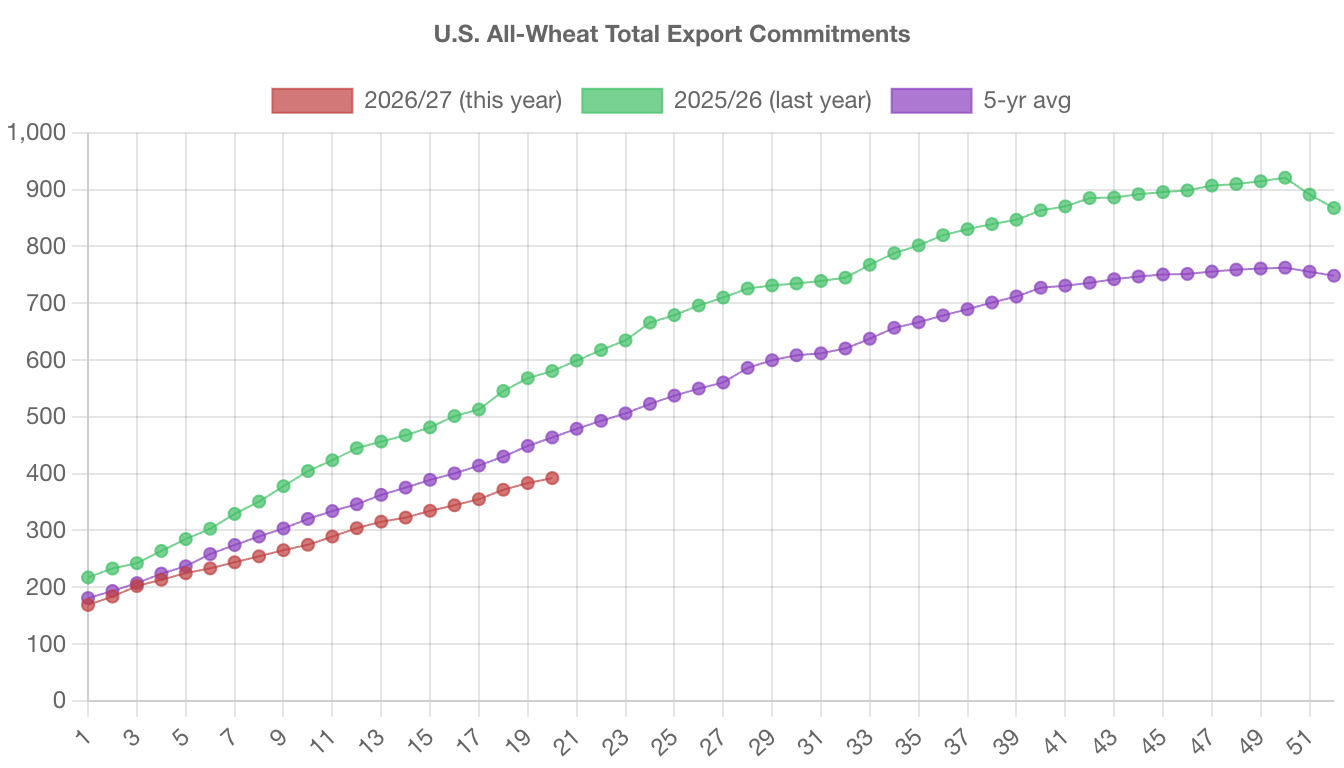
Wheat has been lower the last 13 of 14 days. As we continue to see some peace talk discussions over in the Black Sea. The market is also still concerned that we haven’t seen any extra business despite the Black Sea export situation.
We have one of the slowest wheat export starts we've seen in a long time, so that's certainly not helping bulls.
Harvest continues to ramp up.
Corn is at 60% complete, which is just behind the 5-yr average pace of 66%.
Soybeans are actually now running above average pace, at 79% complete vs the average of 77%.
But what happened in soybeans yesterday?
What Happened in Brazil?
Jeremey touched on this in his audio yesterday. But I wanted to go into a little more detail as to why soybeans reacted the way they did and why this was such a surprise to the market.
So what caused this was that Lula won the Brazil election.
This was such a shock to the market because he had nearly a 90% chance of losing before this according to the polls.
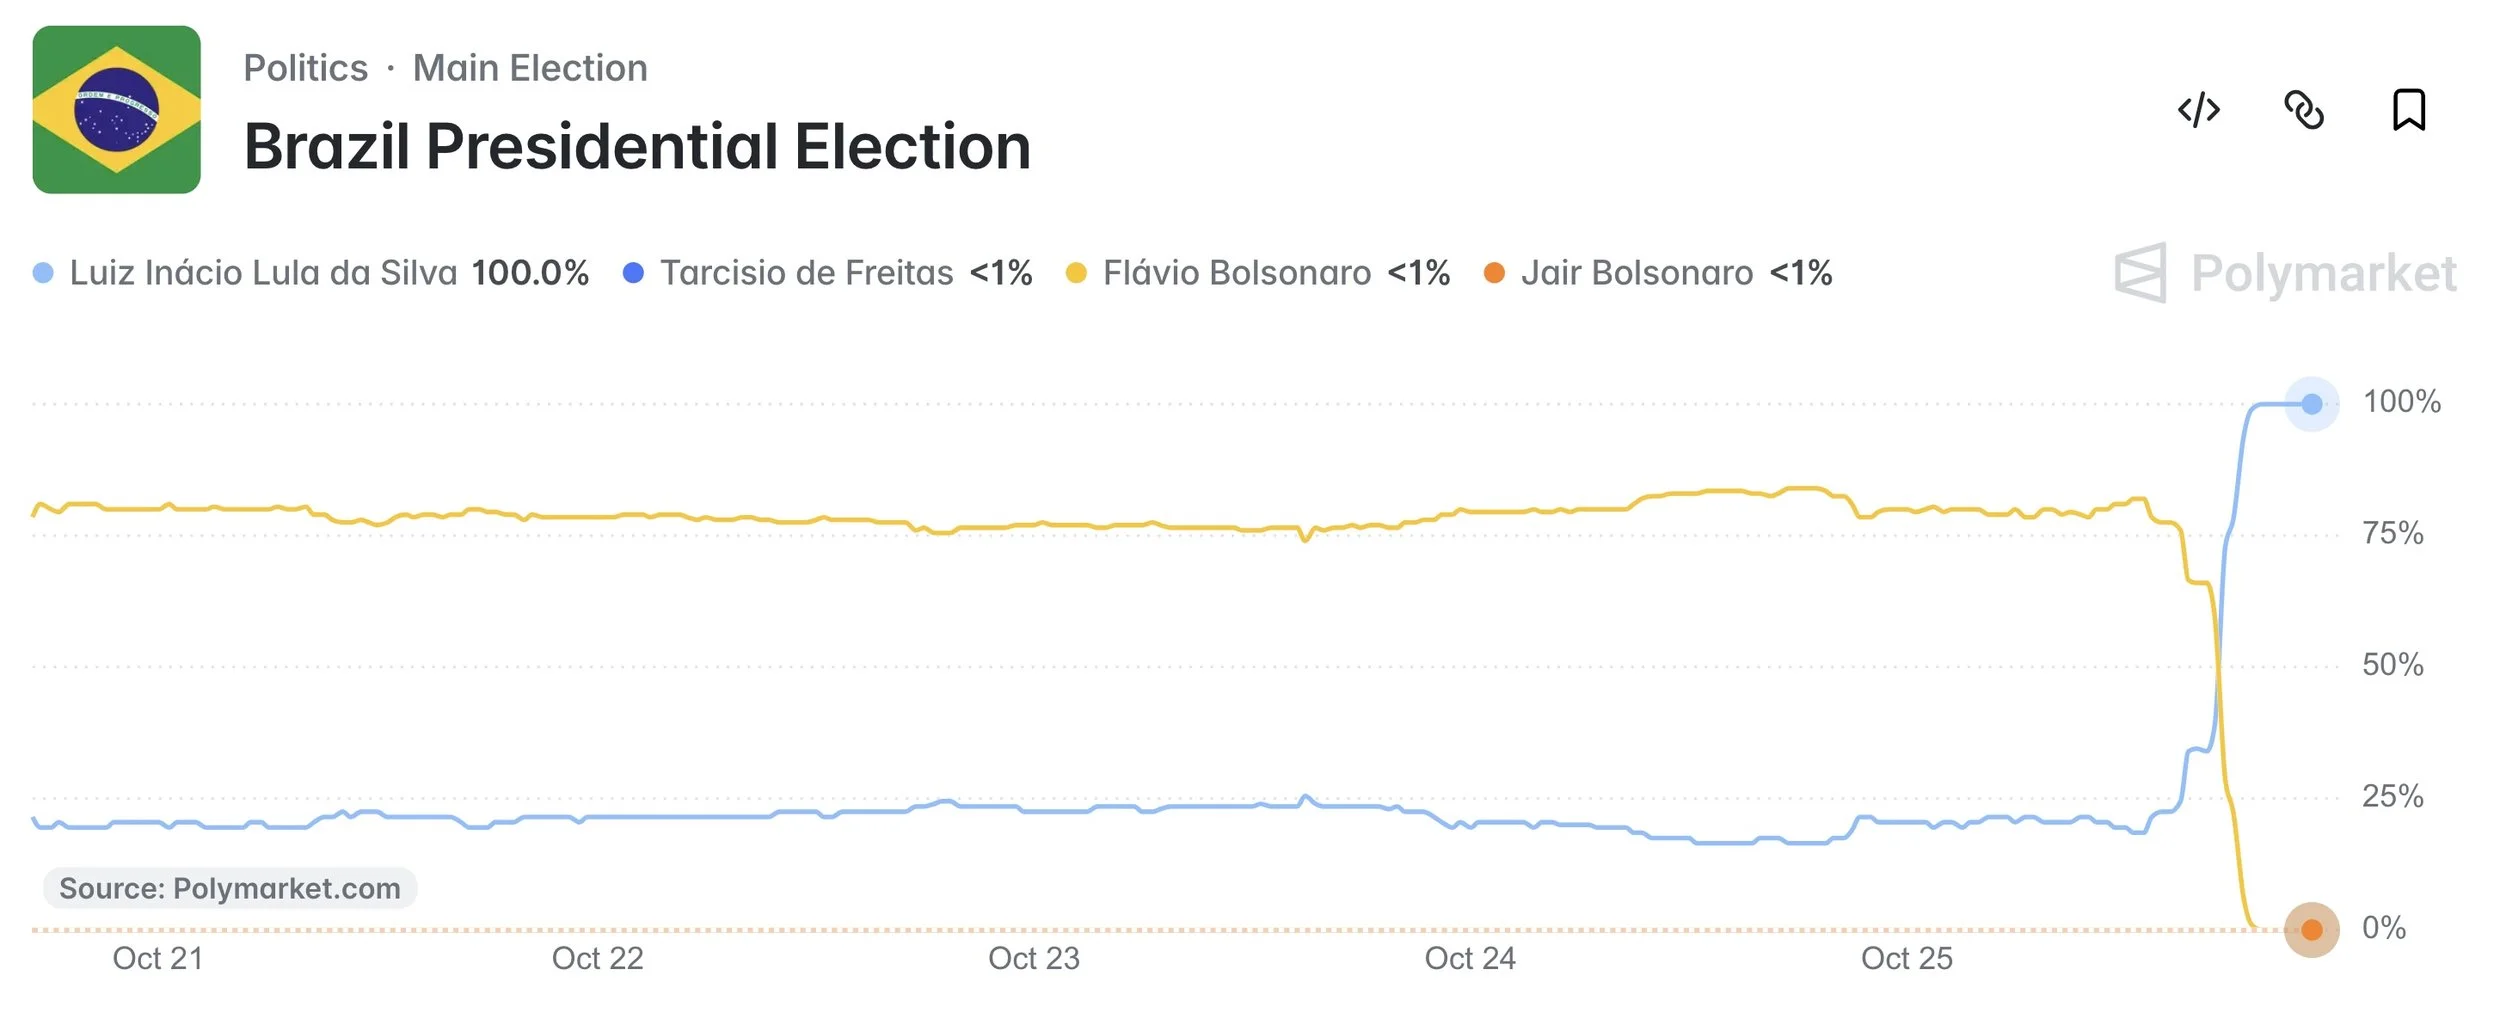
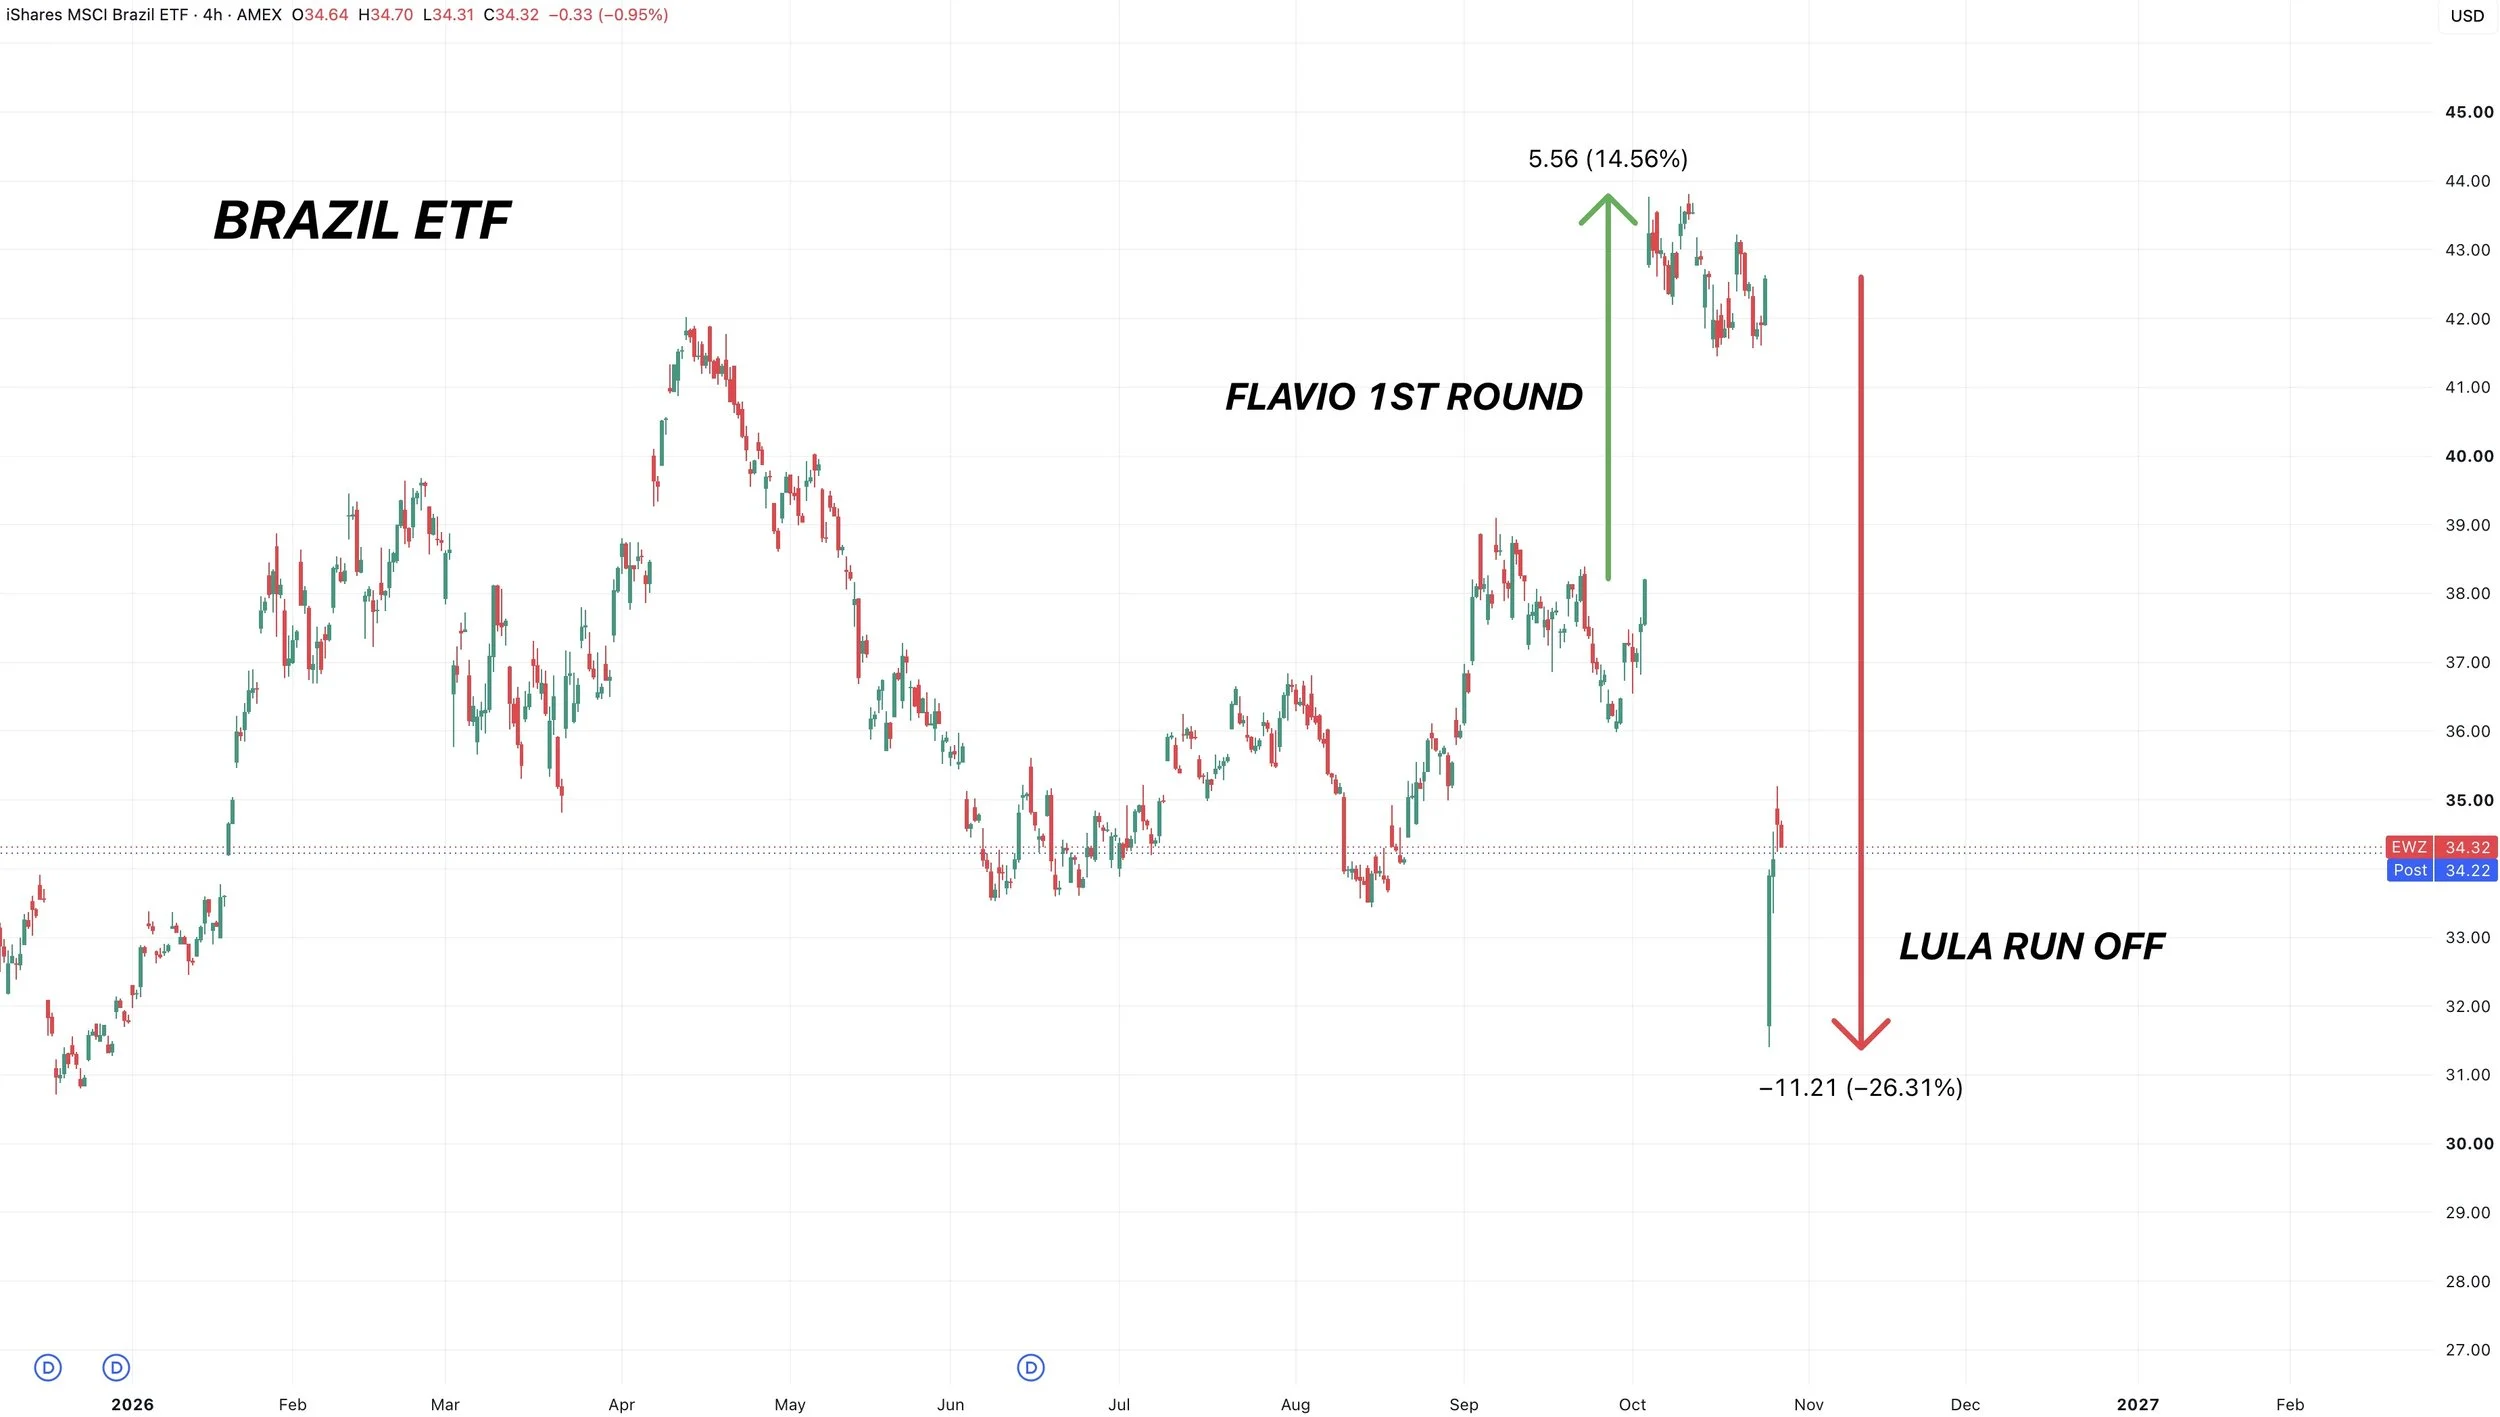
On October 4th, Flavio defeated President Lula in the first round of the election.
Which marked Lula's first loss since 1998.
As a result, Brazil's stock market rallied +15% afterwards.
Neither Lula or Flavio reached the mark needed to win the election outright, so they had to hold a runoff.
Lula somehow won and shocked the market, and it sent the Brazil markets into a full on panic.
The Brazilian stock market absolutely tanked.
It was down over -25% at one point yesterday.
Which was the largest loss in history.
What this also impacted, and more importantly for the grains, was the Brazilian real.
Flavio won round 1. The real rallied.
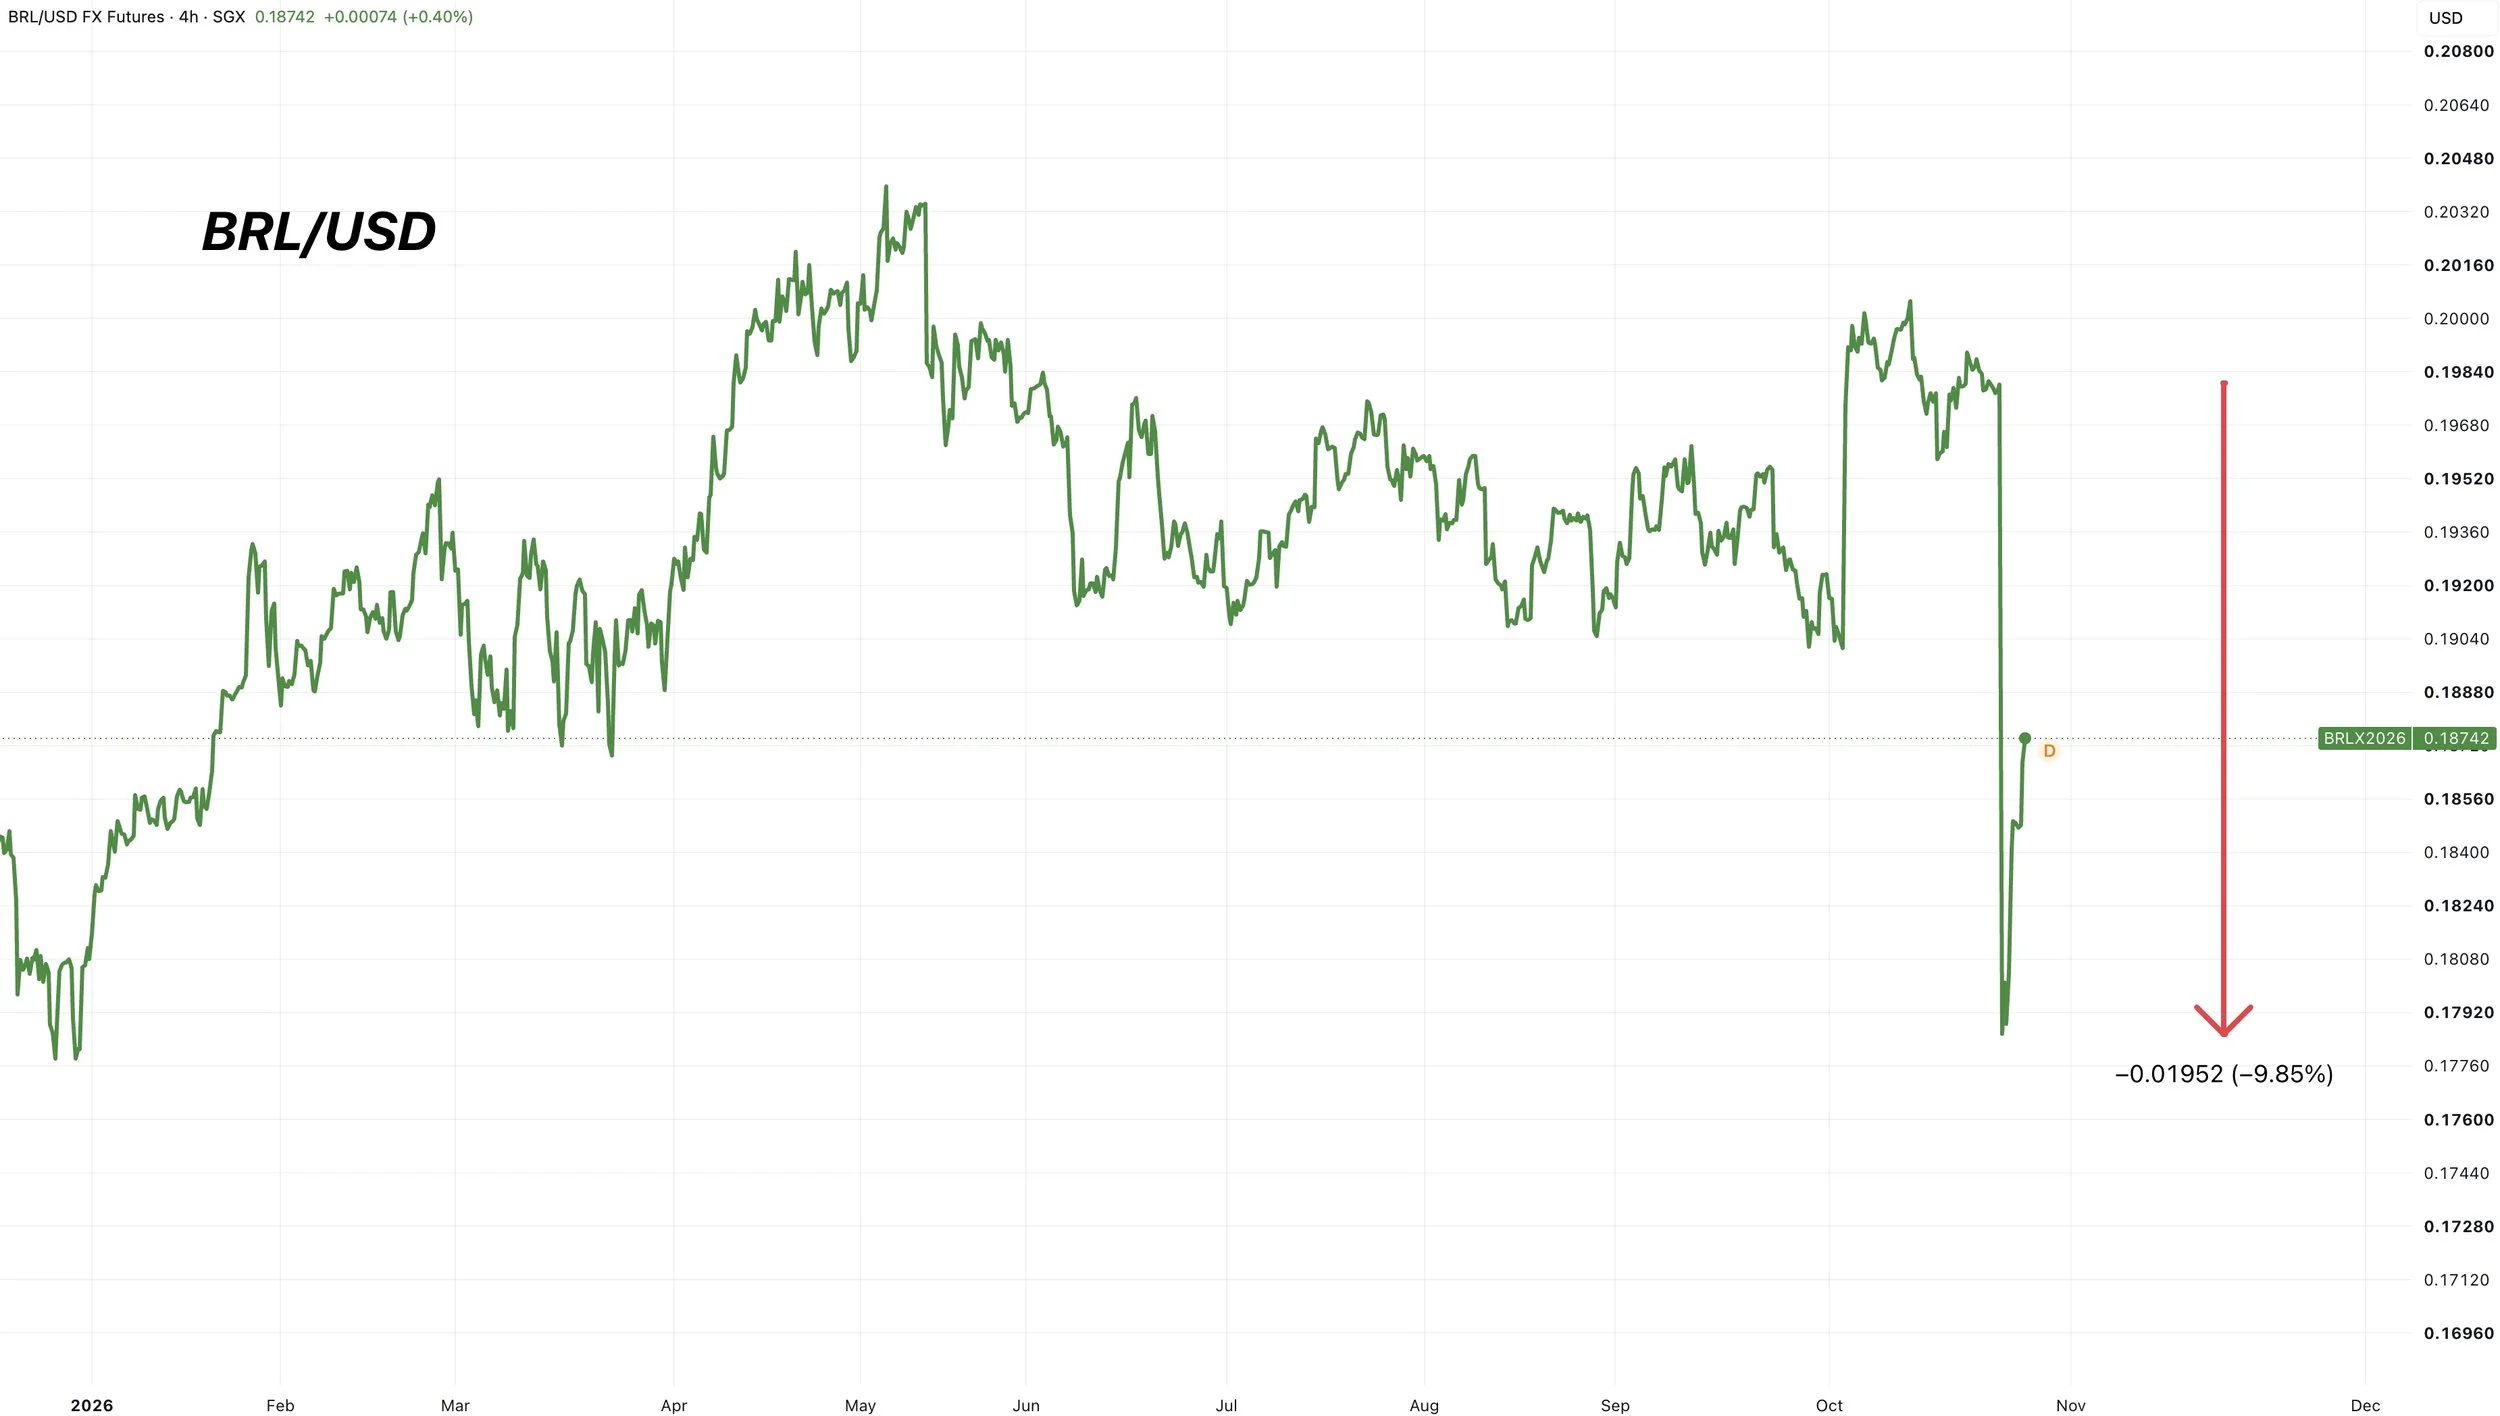
Lula won the run off. The real then plunged -10%.
Going from near yearly highs down to yearly lows overnight.
So the Brazilian markets clearly did not like this surprise at all, and this alone was what hammered soybeans.
The real has since recovered, now down around -6% since the news.
But essentially Brazil corn and soybeans just got 10% cheaper overnight.
When this falls, it makes our US ags less competitive vs Brazil. So it's bearish.
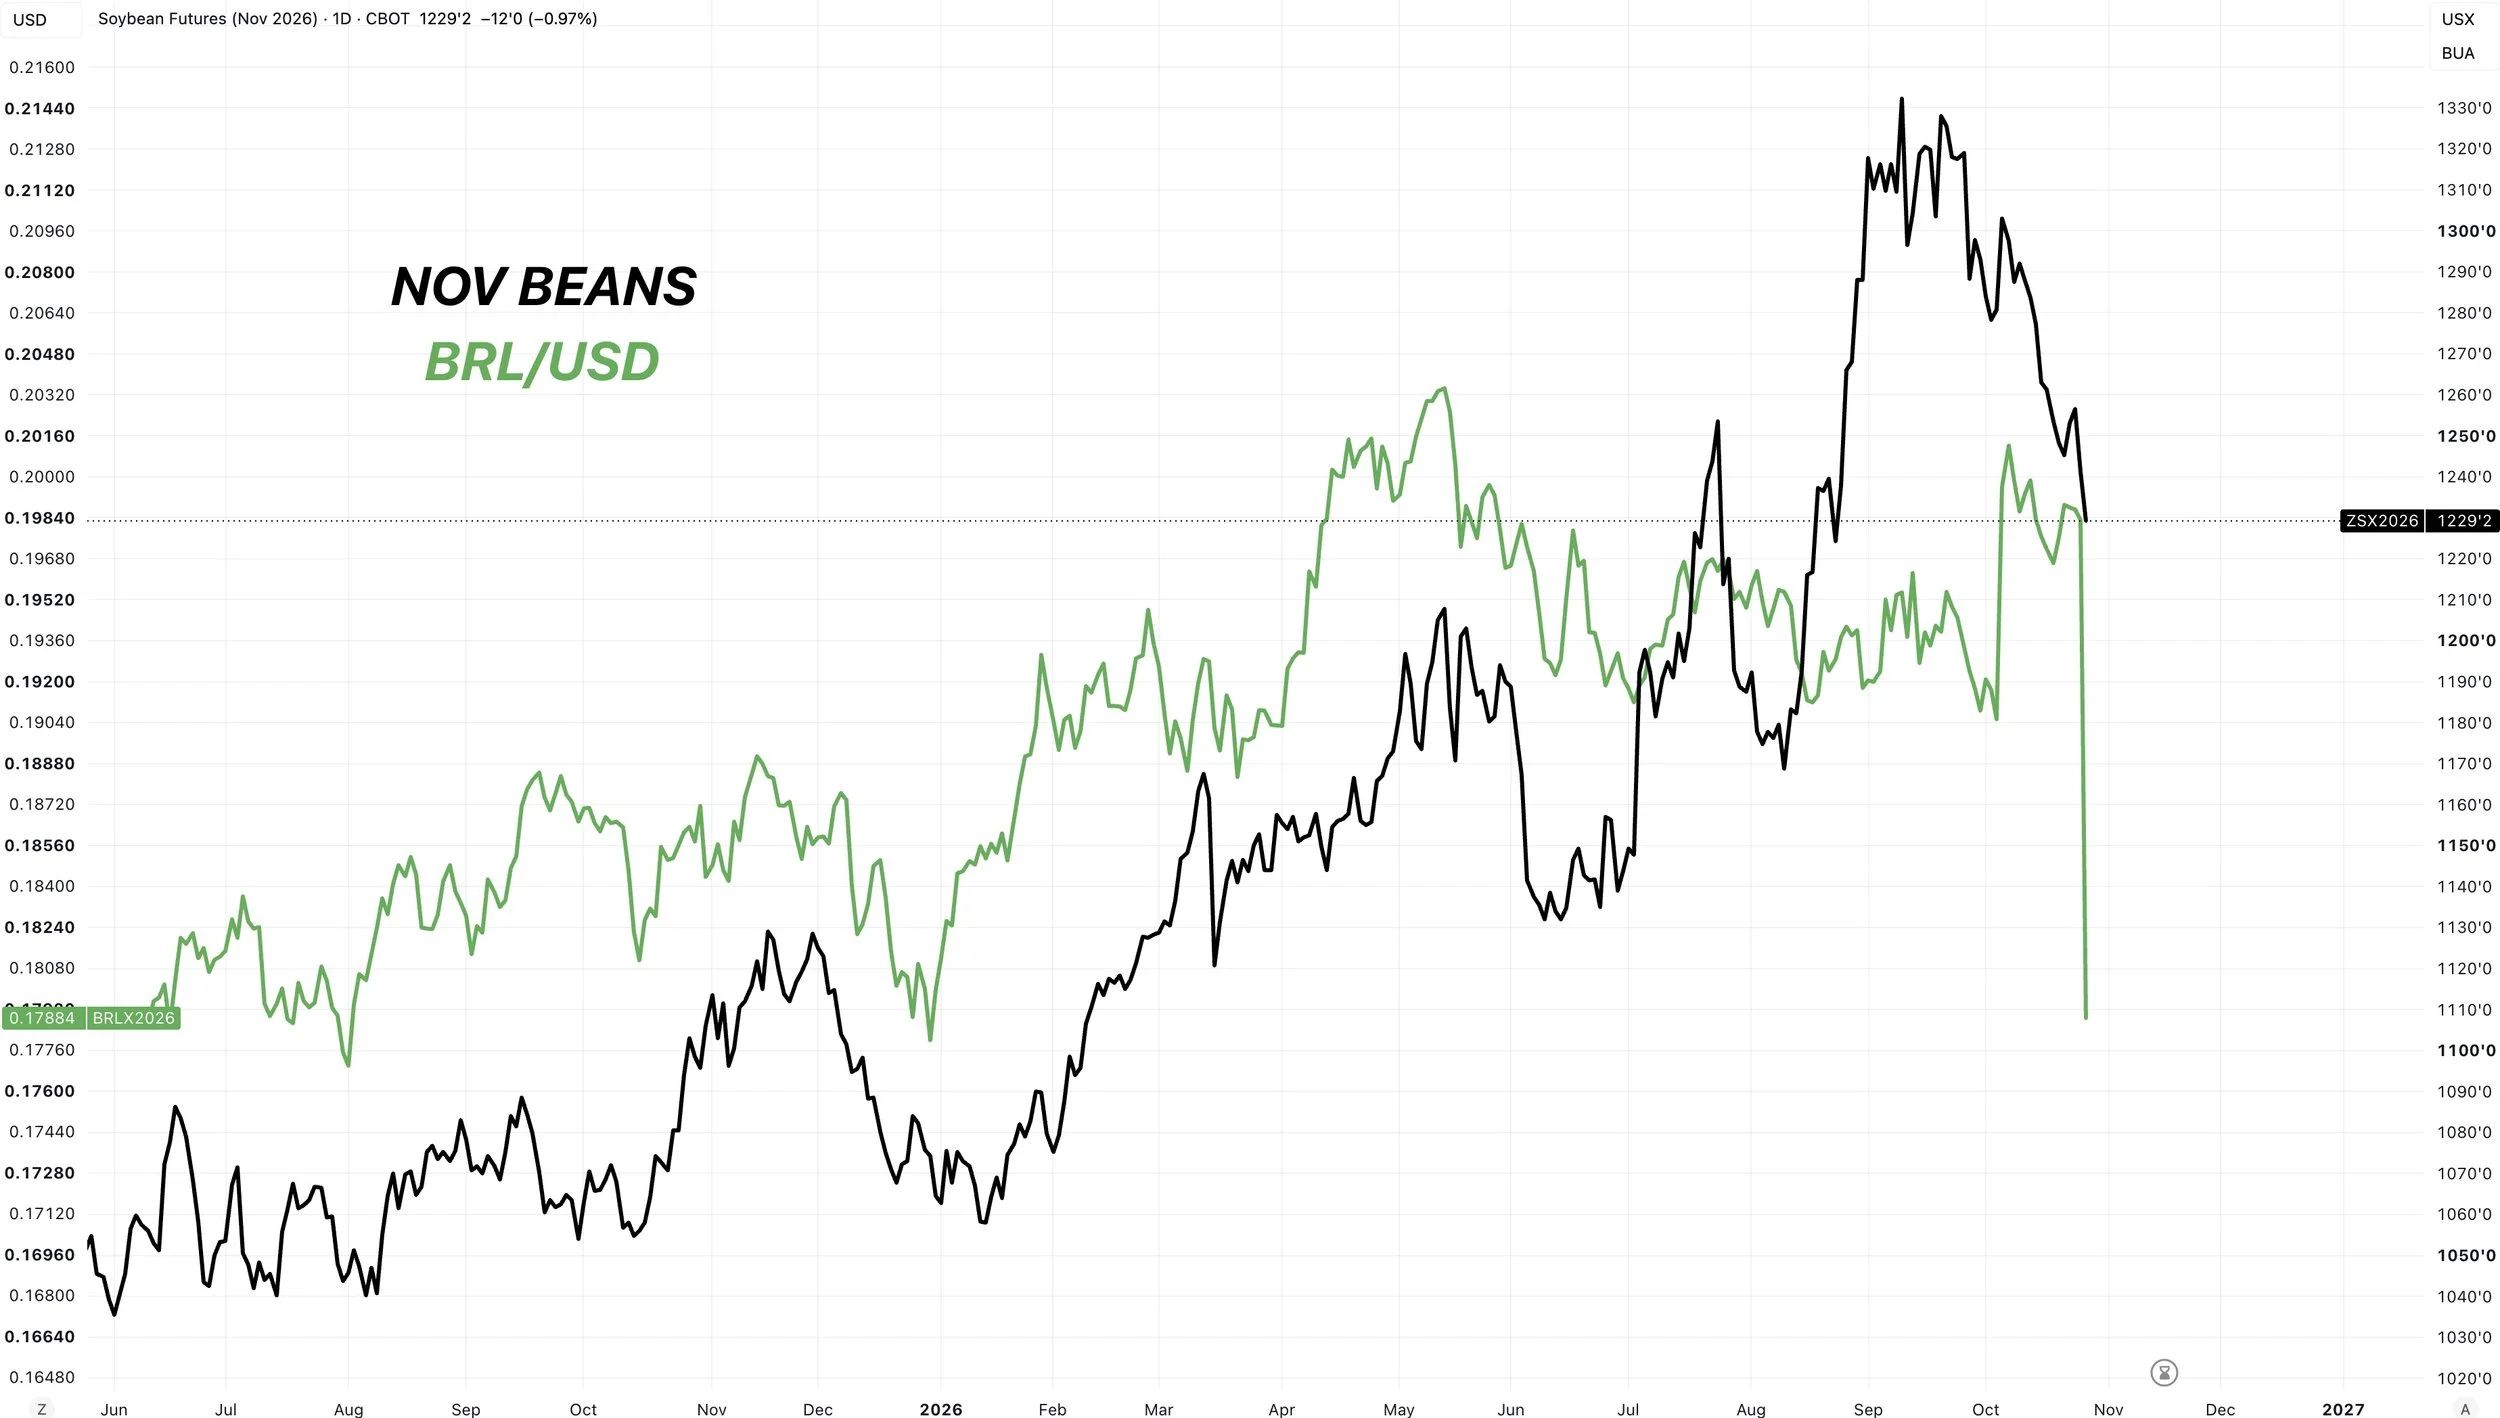
Here is a correlation for soybeans vs the real.
It's not a perfect correlation, but it's definitely there.
So this dropping this hard, it bearish for soybeans. As it makes it that much harder to compete with Brazil for demand as it makes us less competitive. It also makes it more likely to see more farmer selling.
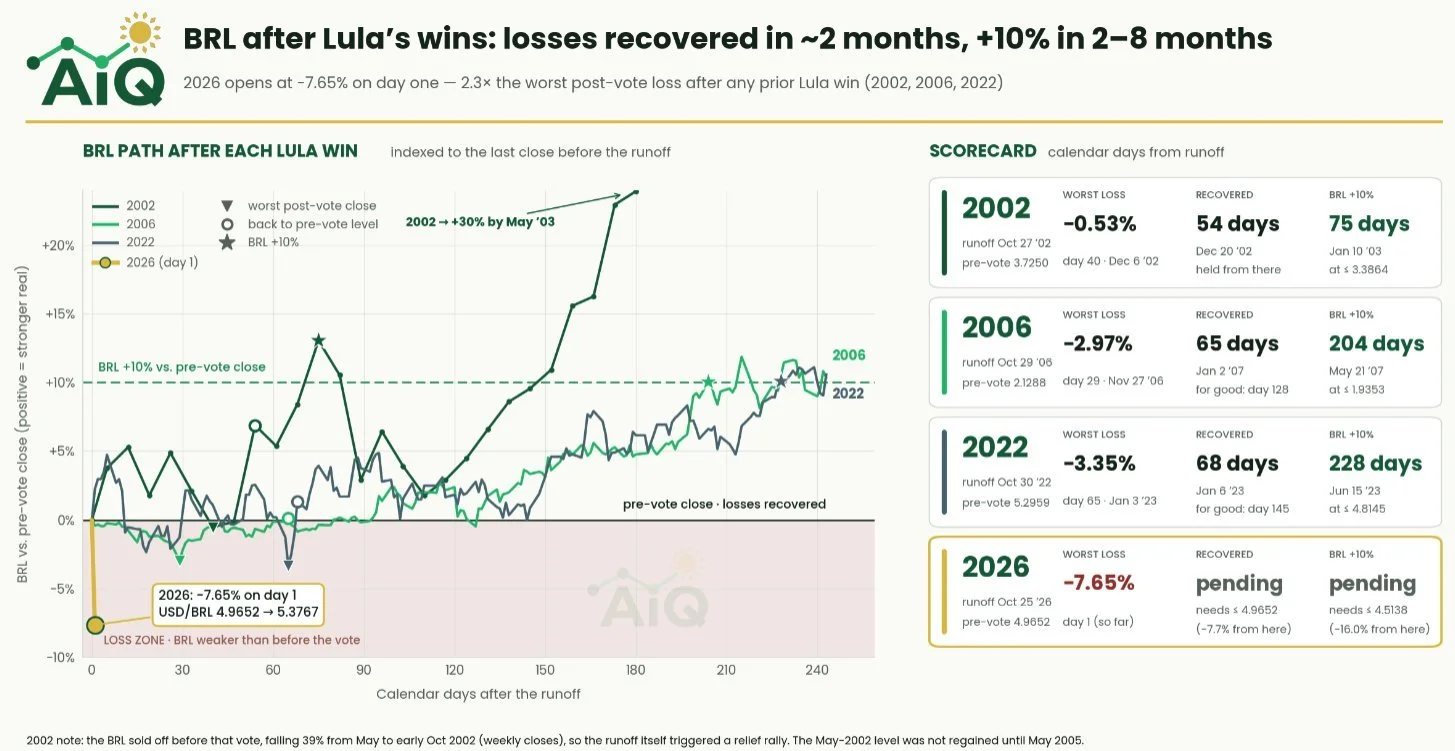
Here is some good data from Nico AiQ on X.
The real does have a history of recovering after it sells off on Lula elections.
The last 3 made a recovery in about 2 months.
So the real dropping the way it did was bearish no doubt, but historically it does recover.
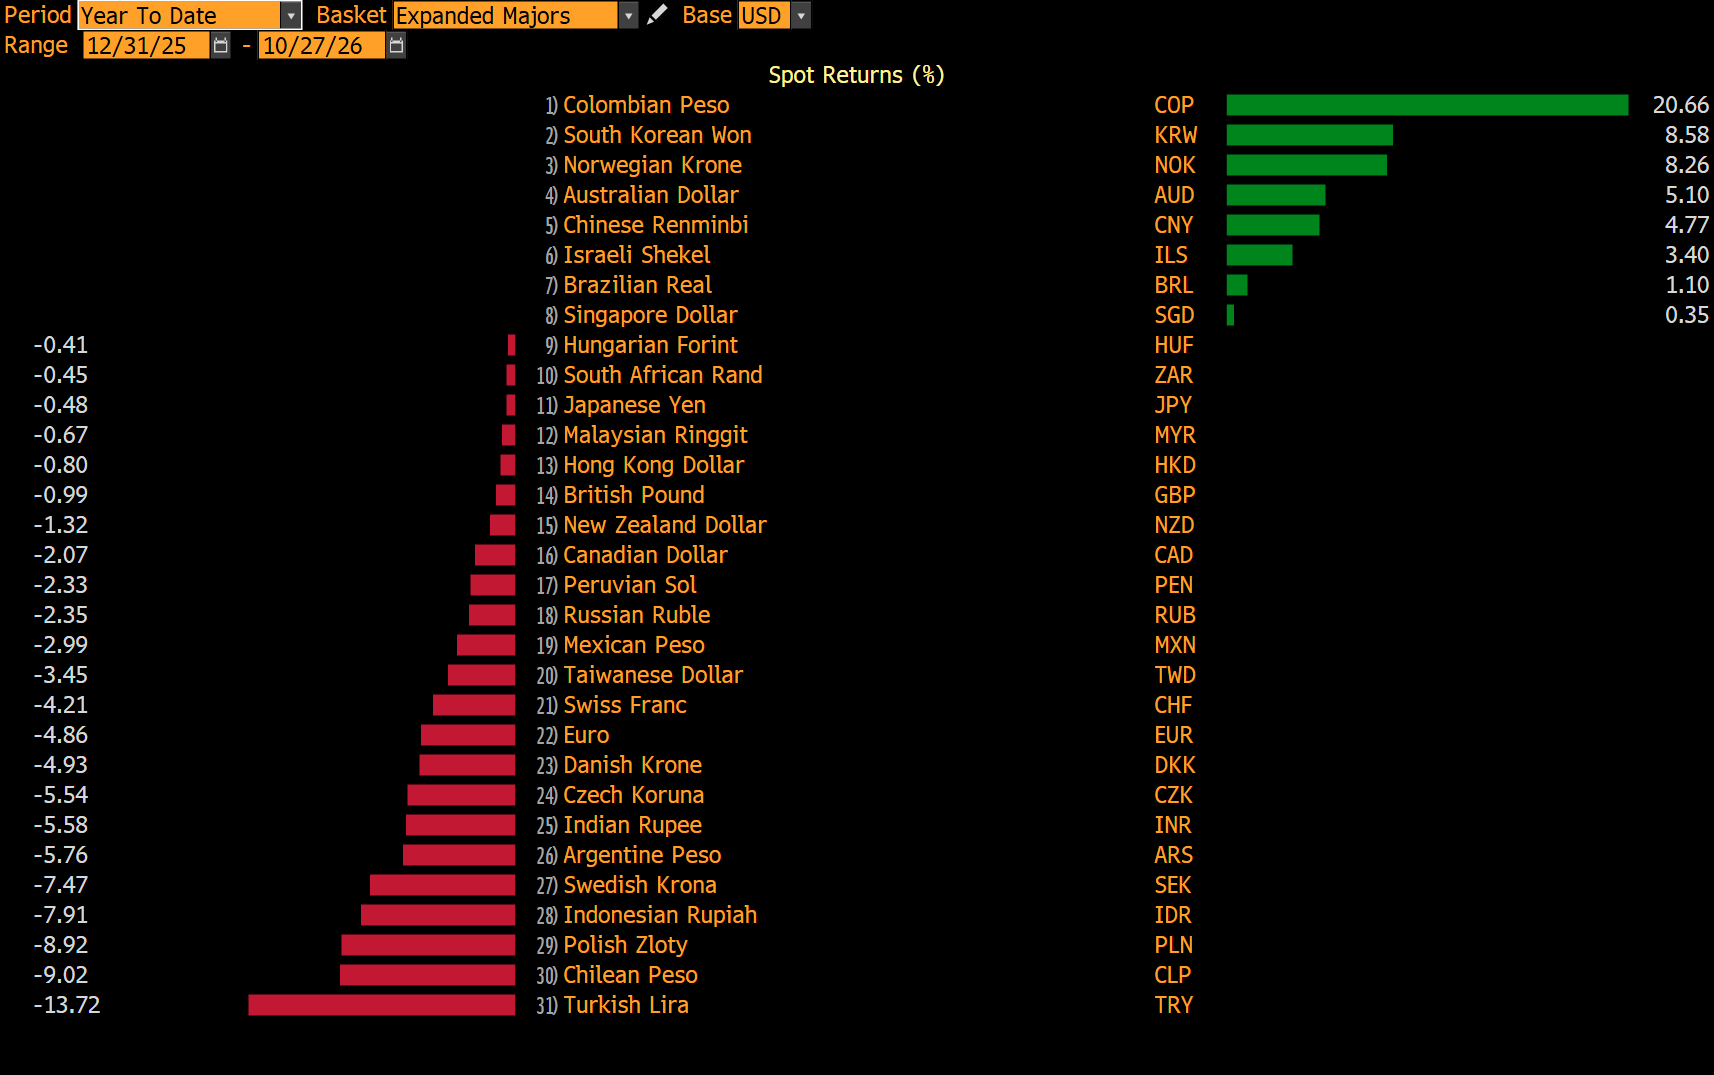
Even with the major drop, the real is actually still one of the best performing currencies this year.
It's just 1 of 7 that are higher on the year.
Todays Main Takeaways
Corn
Fundamentals:
There really isn’t anything fresh fundamentally.
This market lacks a story.
I think yield and the balance sheet will both ultimately be lowered, but the market doesn’t seem to think so today. Even so, it's not a story for today.
The last month has been brutal. There will be more opportunities. They just might not happen as fast as any of us would like.
Long term, I think corn has potential from here. Short term, we just need to see this market give us a sign that it's done going down.
So just simply remaining patient waiting for us to carve out a bottom.
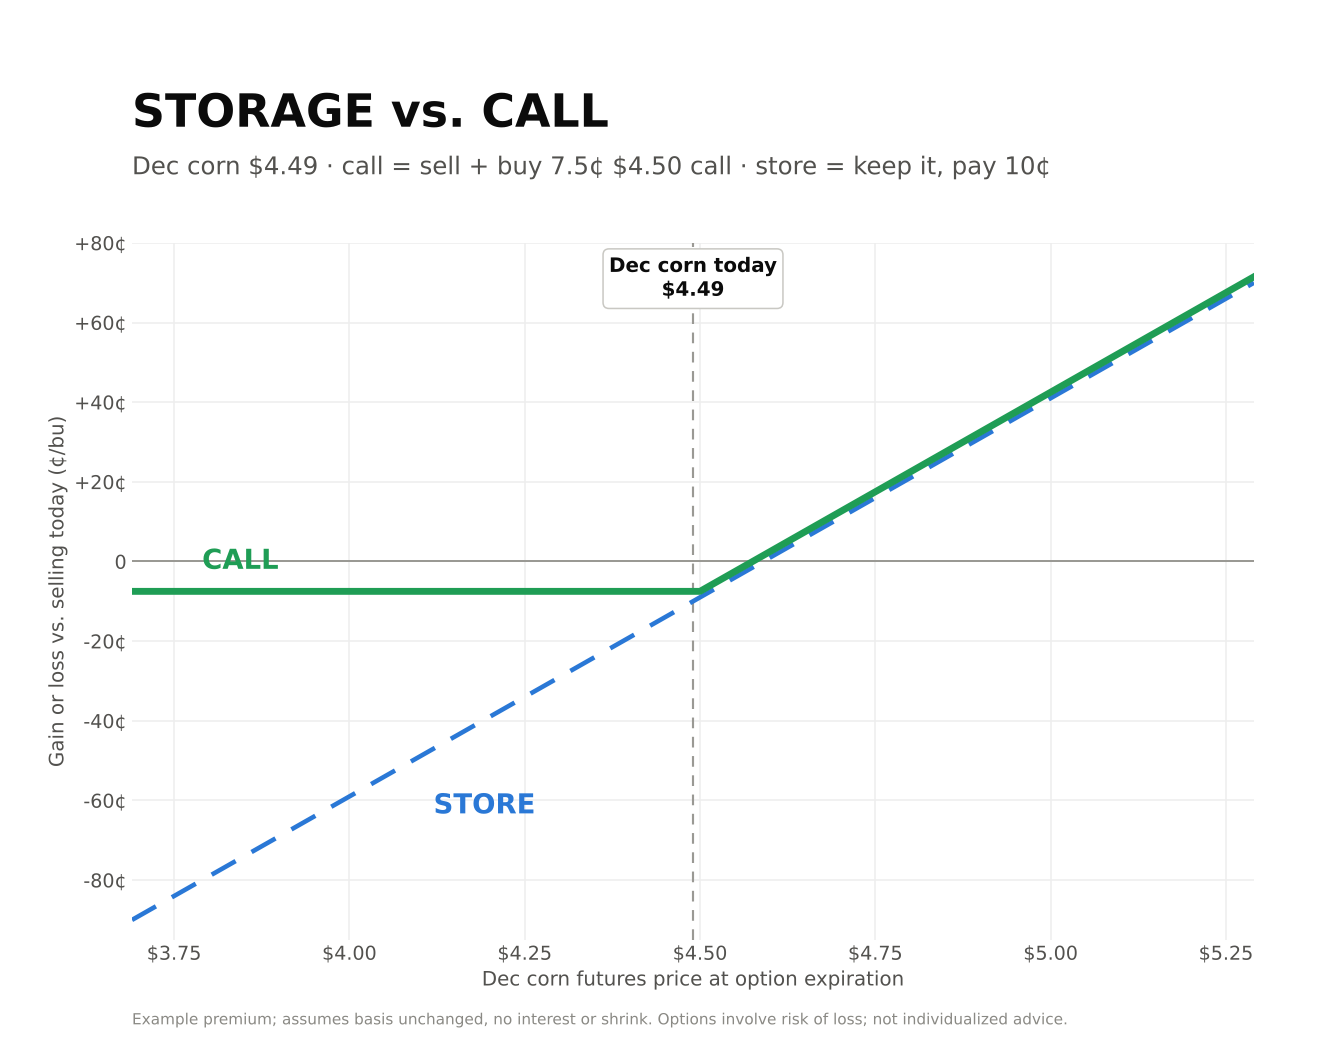
One thing we talked about a week or so ago that I wanted to mention again was storage vs call options.
Sometimes, it makes more sense to just sell the corn and re-own it with call options depending on a few factors.
Call options close to ATM cost roughly the equivalent of 5 cents of storage a month.
Essentially, you would take the money that you normally would have used for storage, and use it on call options.
If you are paying more than 5 cents a month in storage, mathematically it might make more sense to re-own with calls.
What using calls does is that it also reduces your downside risk. As the most you can lose would be the cost of the call. Where as the price of your corn could go a lot lower.
So make sure you look into this and consider this instead of rolling a basis contract.
If you are forced to sell something off the combine, options have become very cheap as well for those who want upside exposure.
Charts
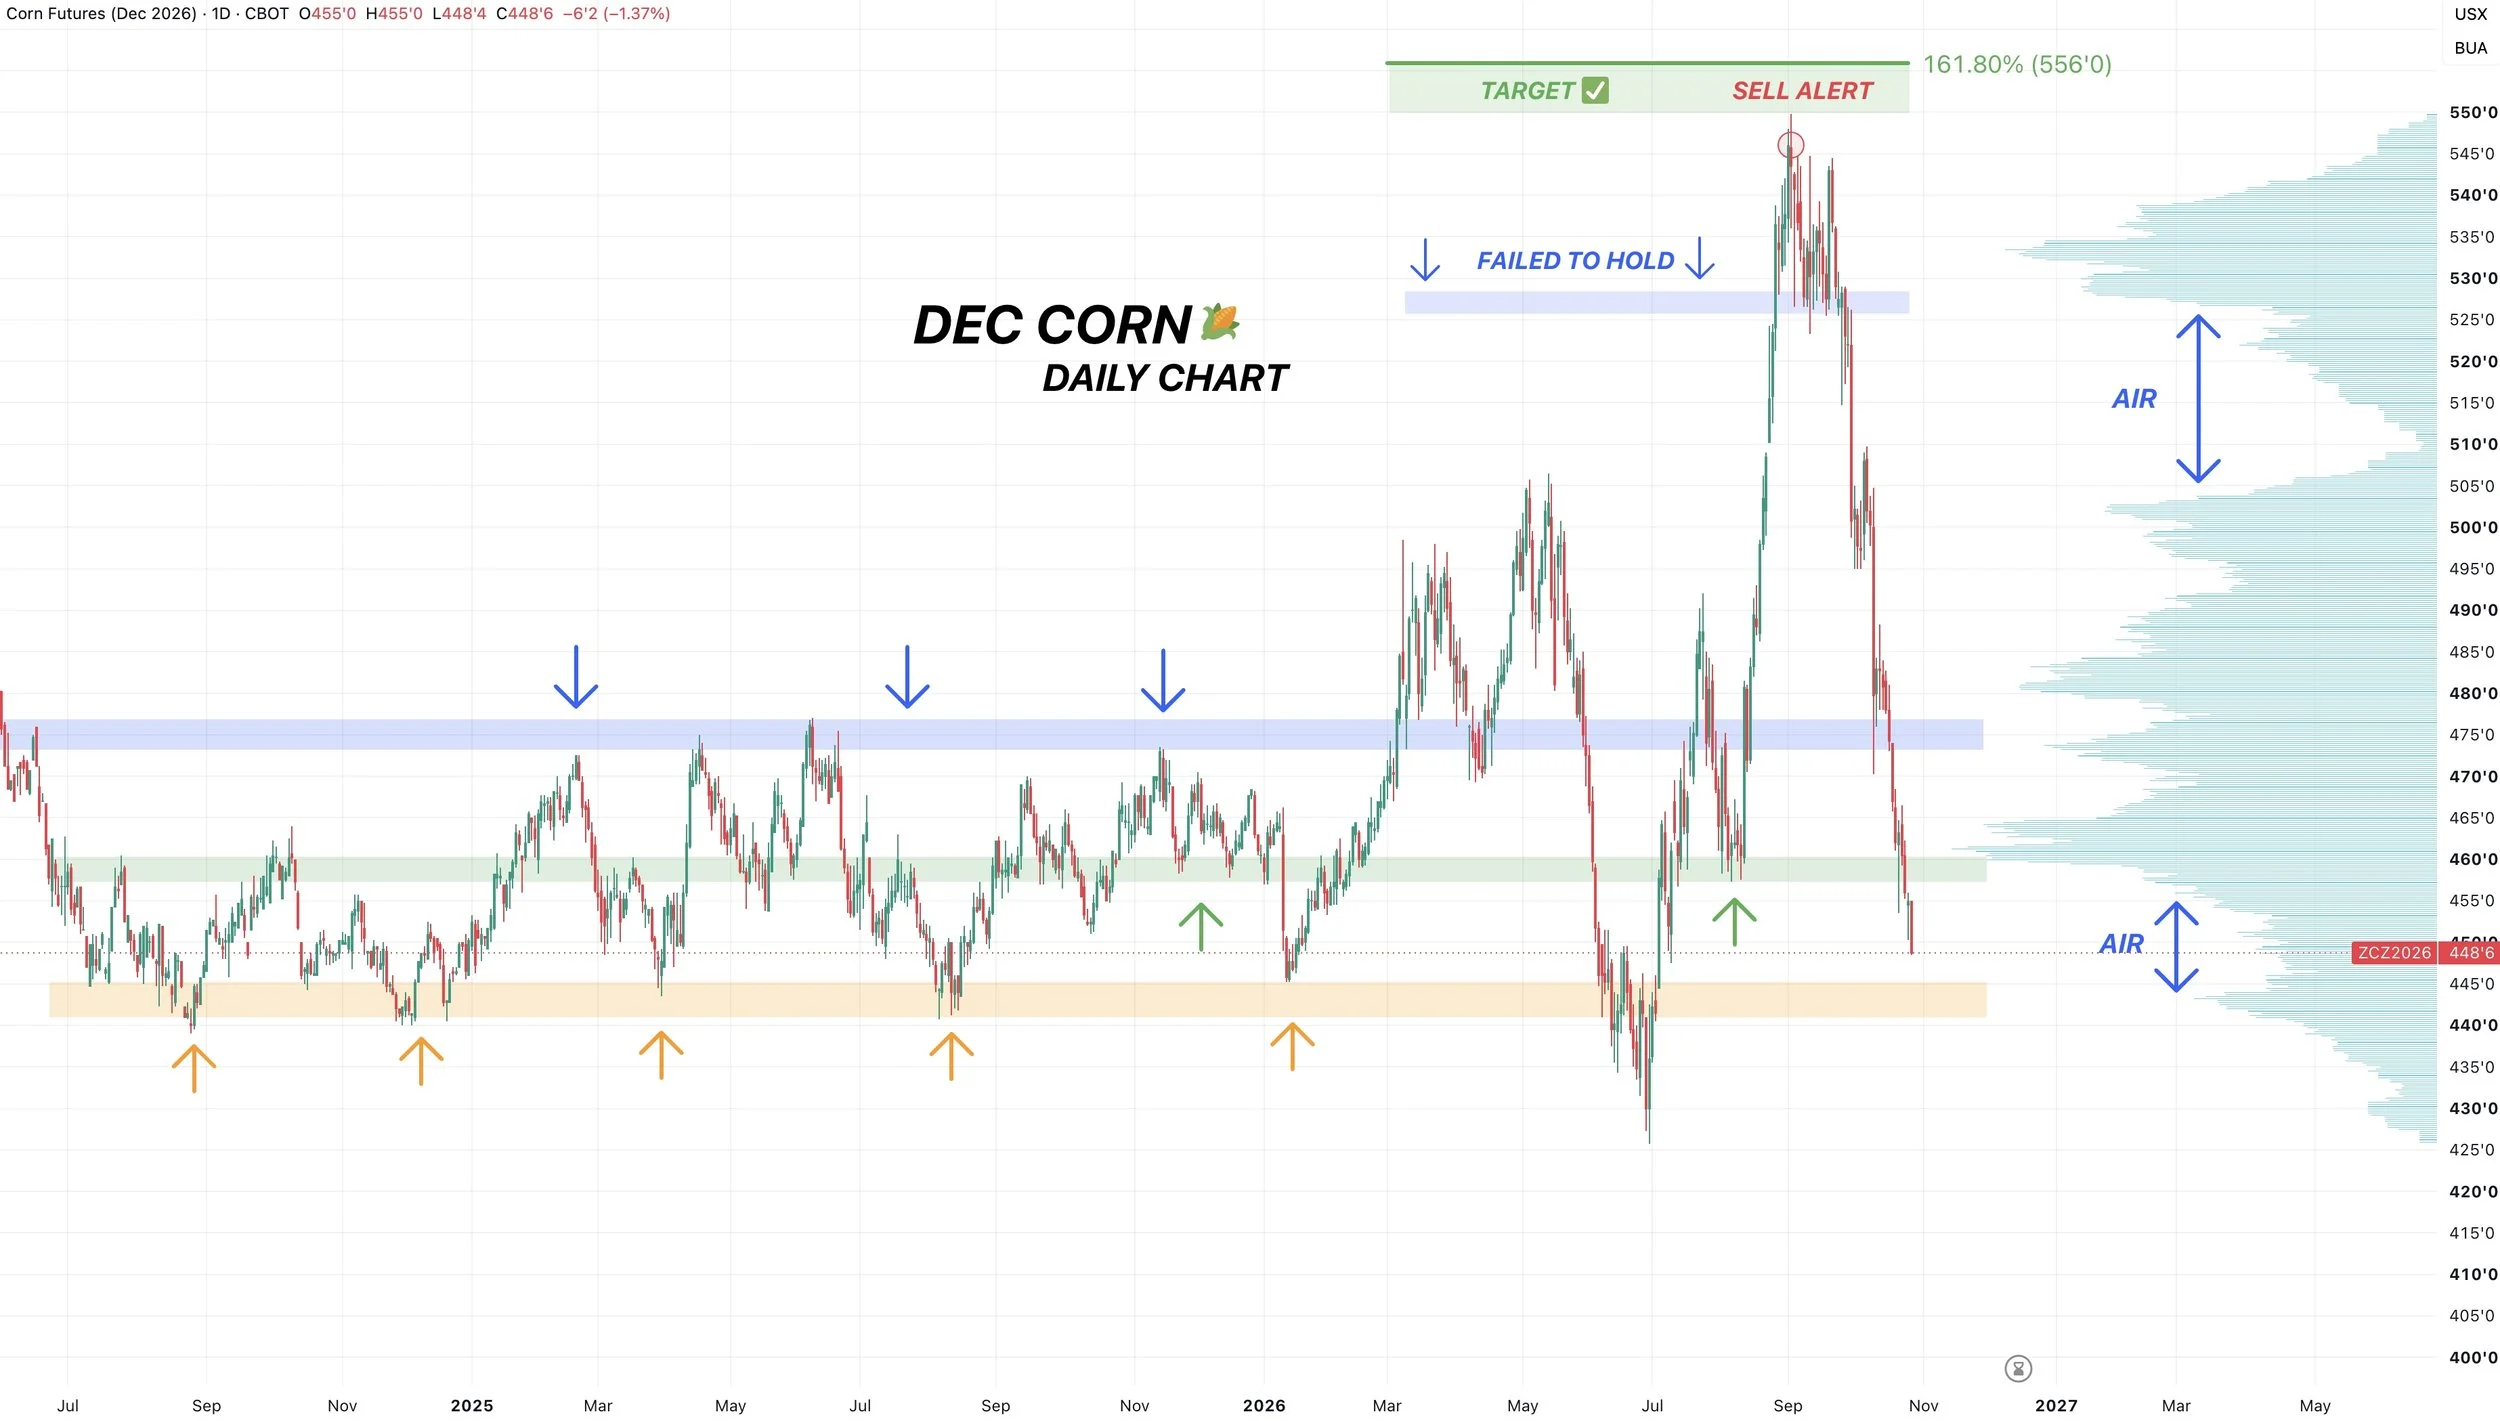
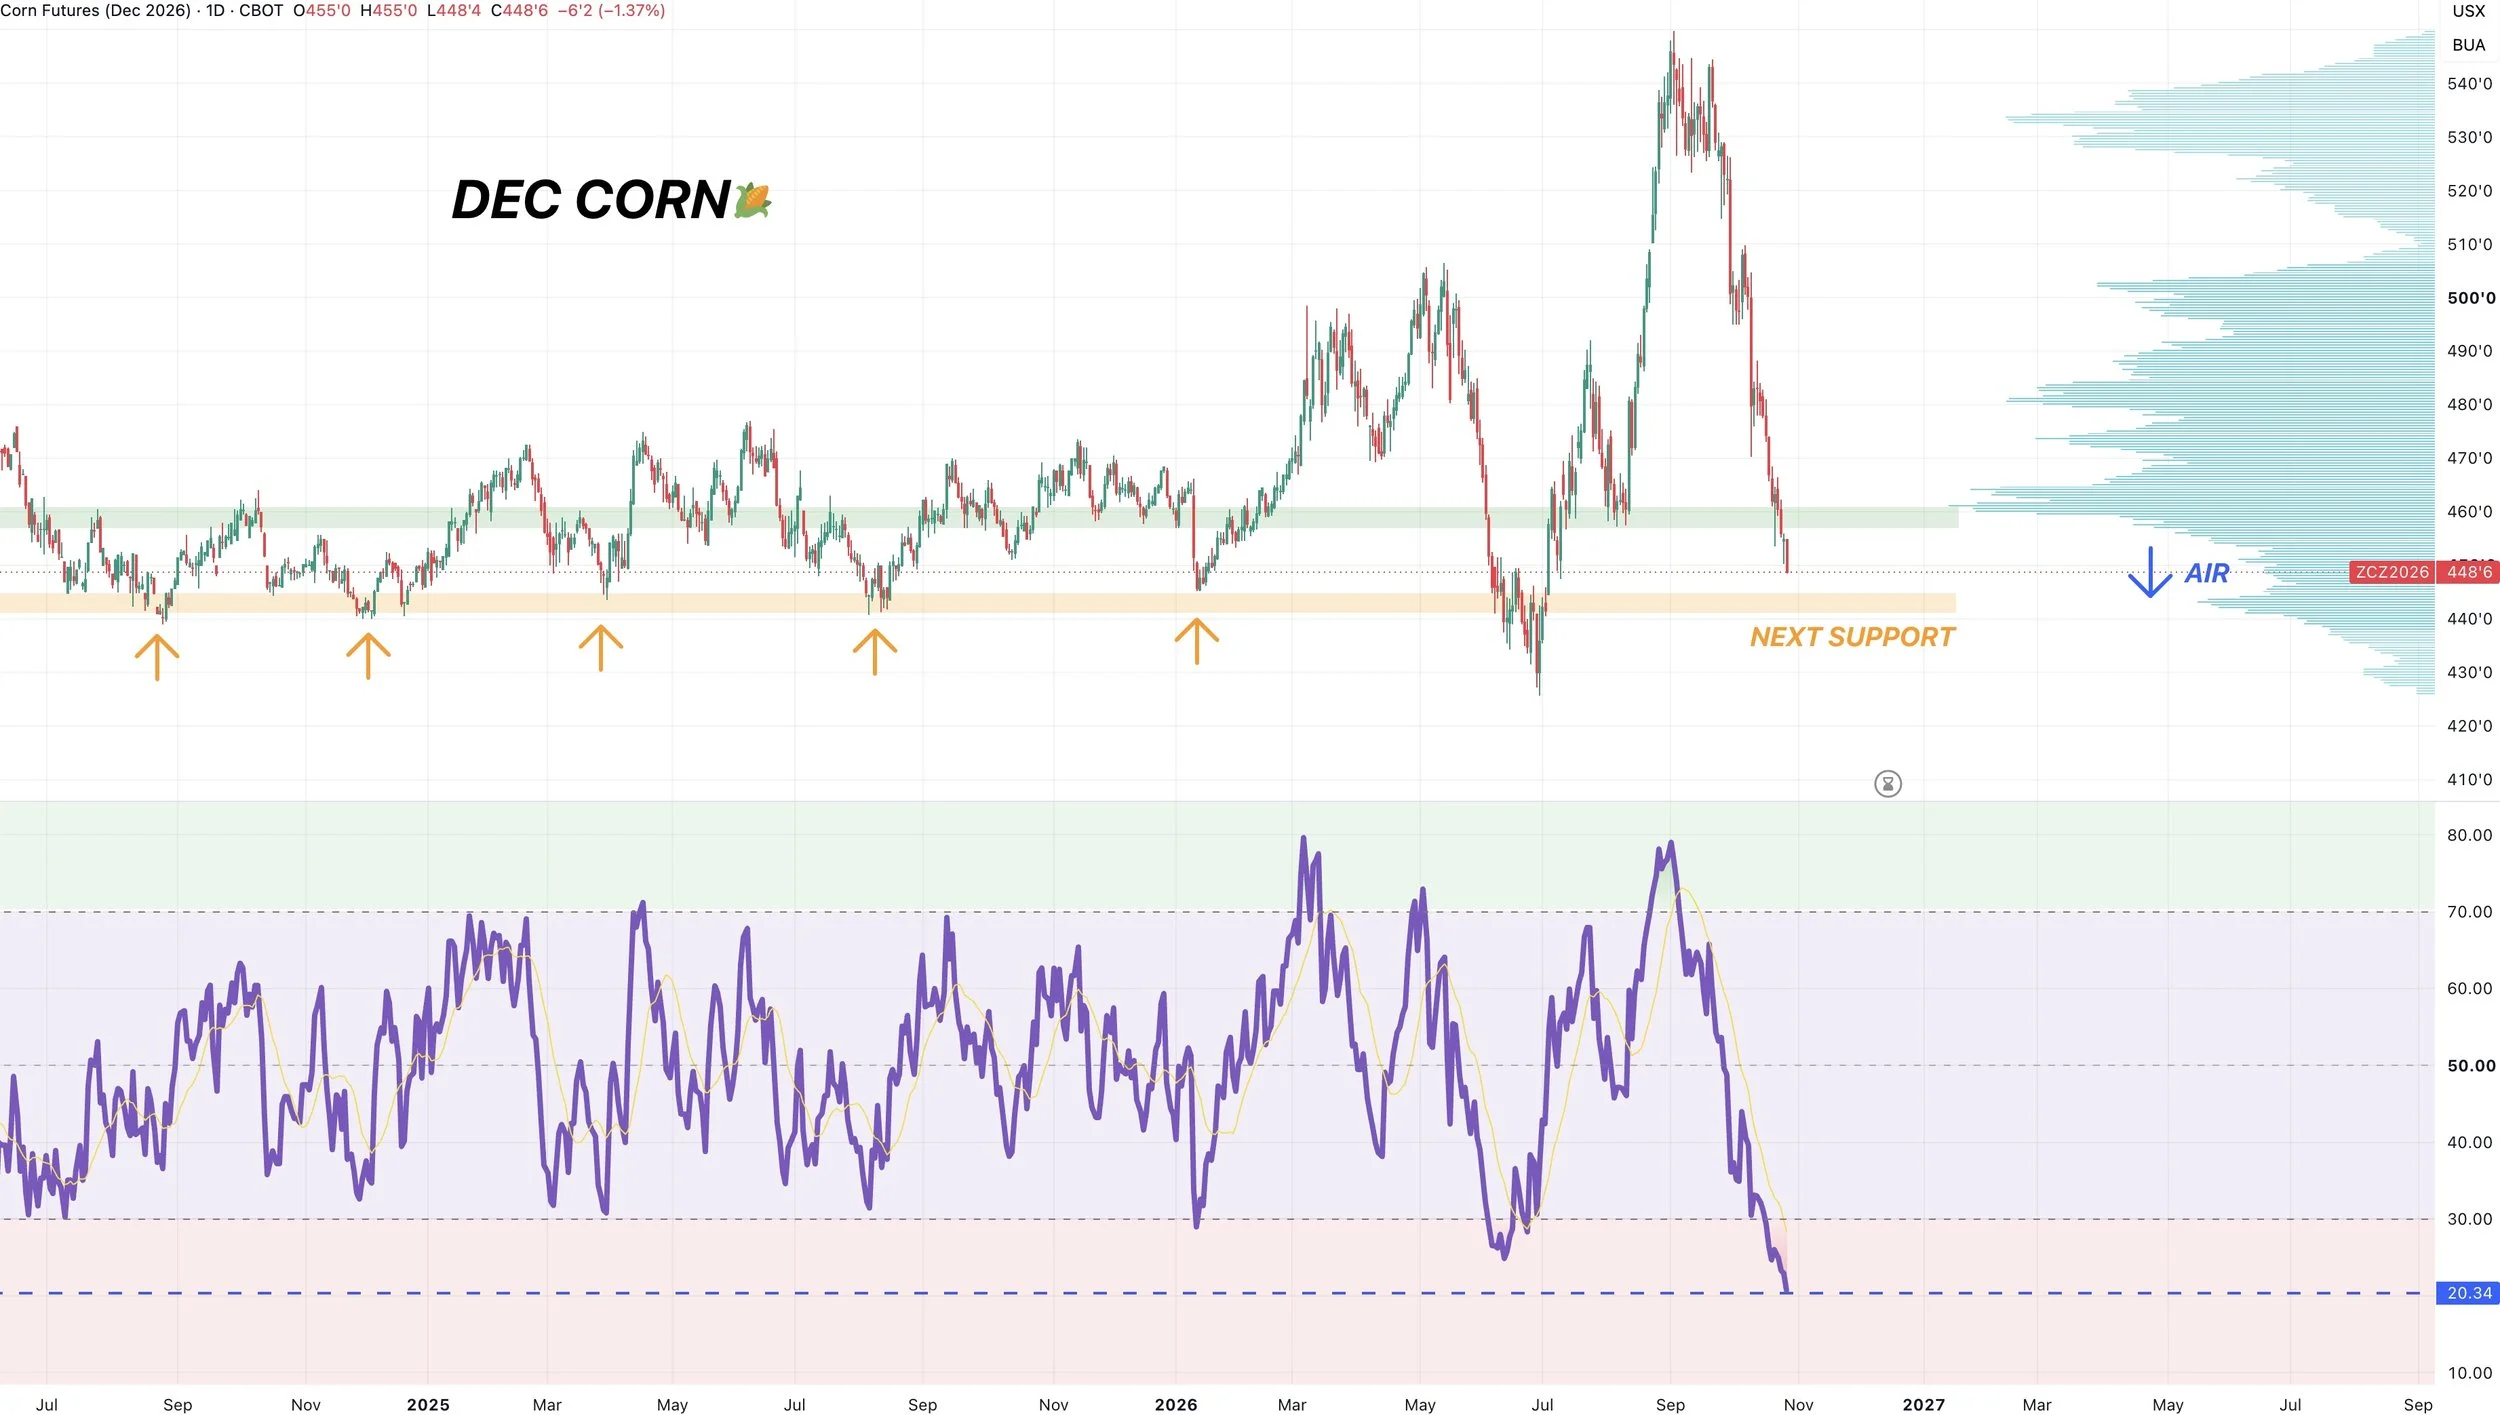
Dec Corn Chart: Next Support
We continue to fall apart.
We failed to get any follow whatsoever from that optimistic reversal last week.
We are now below some key support that we would've liked to see hold.
As we broke below the August lows and the bottom of that yearly range from last year (green box).
So this does open the door towards the next level of support.
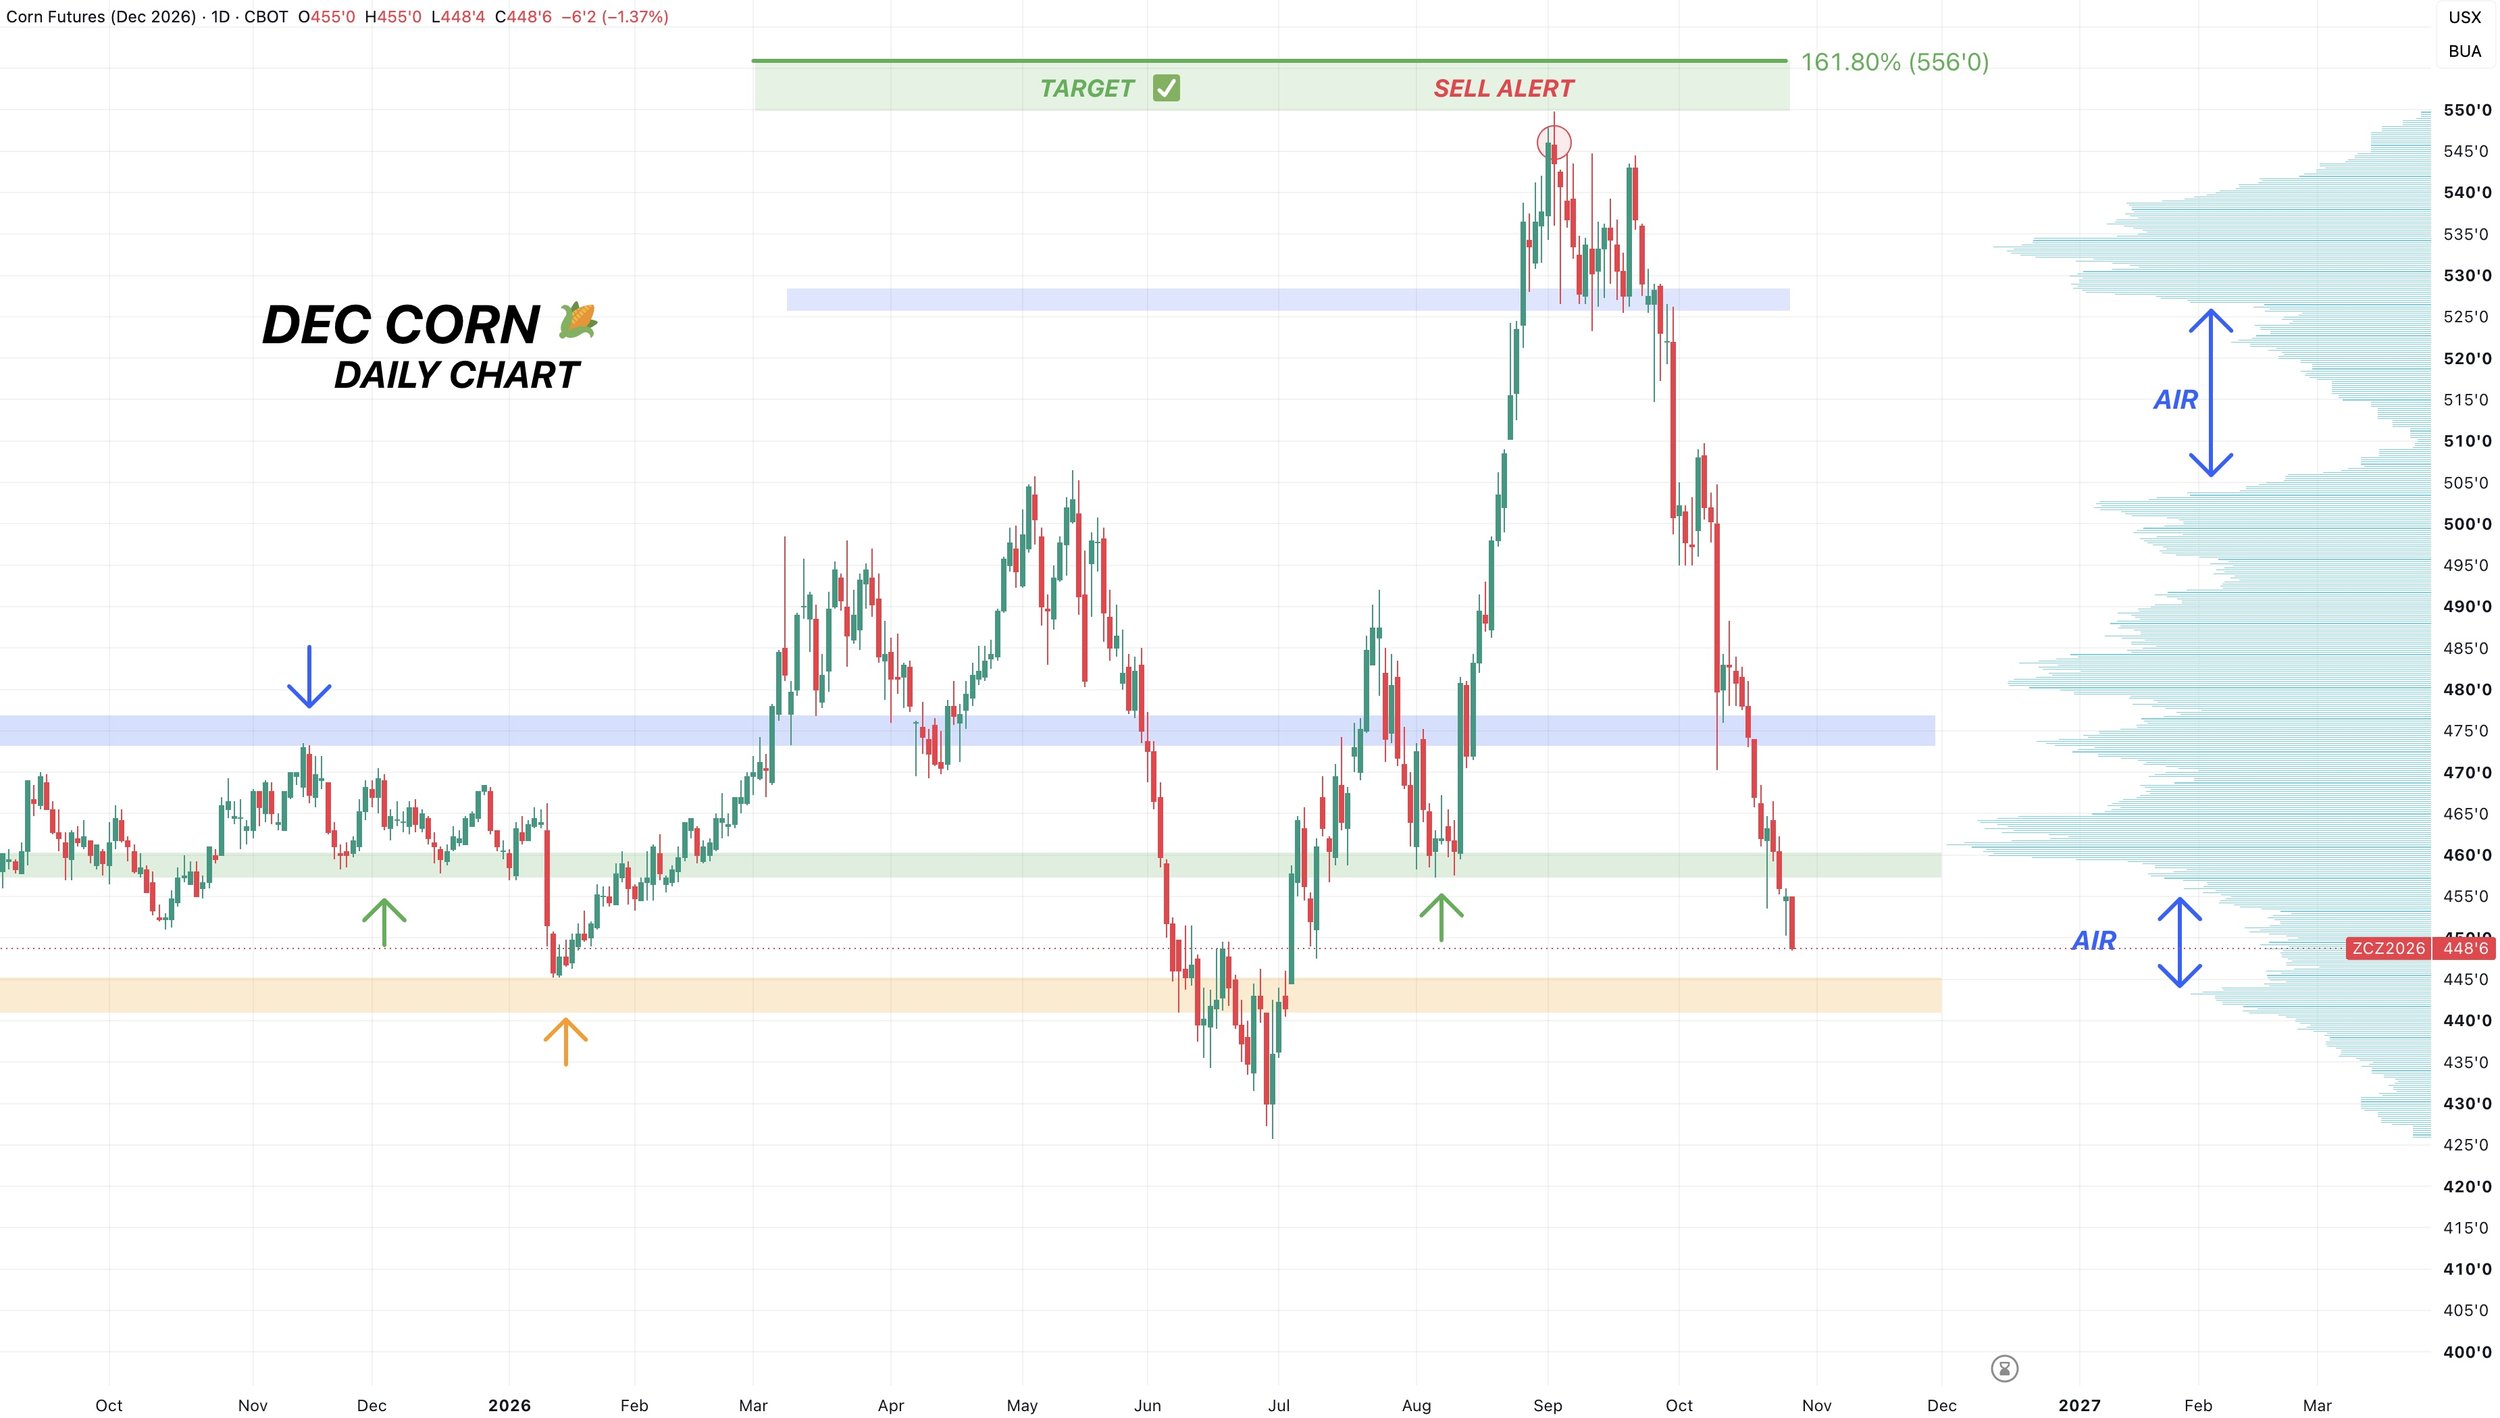
Like we've talked about before, there is a gap of air to the downside towards the $4.40 to $4.45 area. So that could be the next level we gravitate towards unless we are able to turn this market around asap.
That level has marked 5 separate bottoms in this market.
If you lose that level, the next support would be contract lows.
Here is a more zoomed in look for more reference.
3-Day Chart:
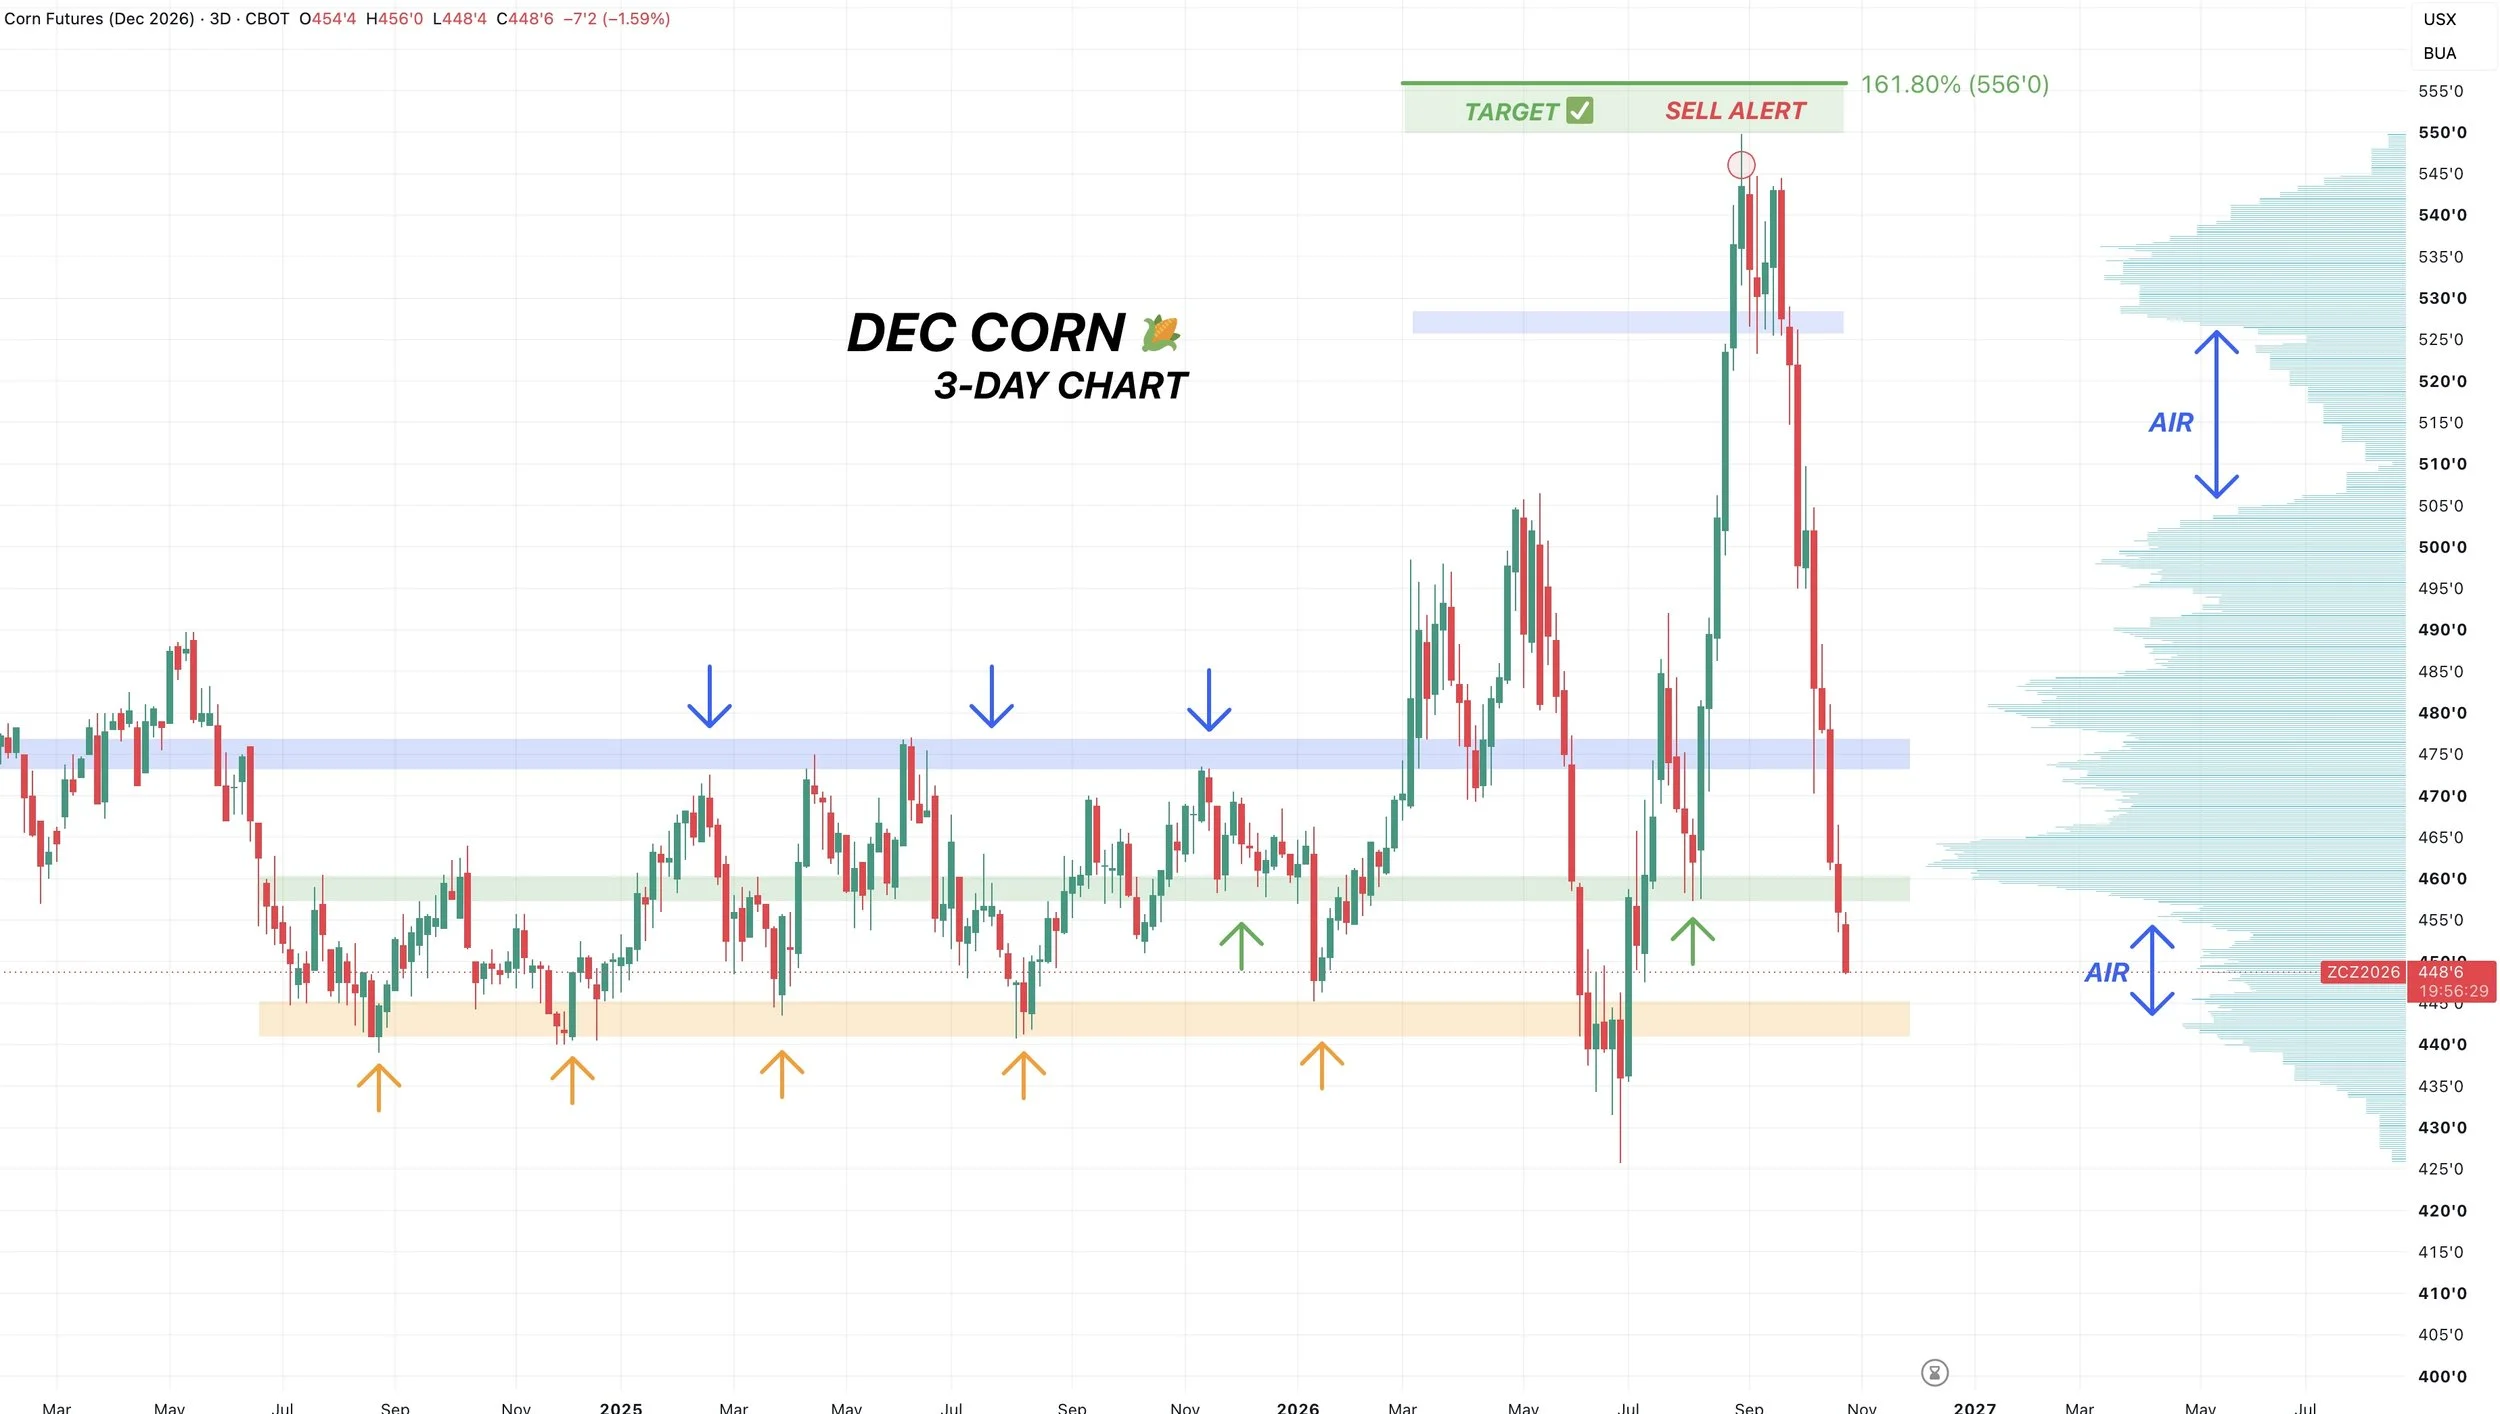
Here is the 3-day chart for additional context.
That orange box at the $4.40 to $4.45 level is basically your only support between contract lows.
We could bounce anytime, but that's where we need to see us hold.
RSI: Most Over Sold Since 2023
This market is getting very very oversold.
Oversold territory sits at 30 on the RSI.
Currently the RSI under 21.
This is extreme oversold conditions. The most oversold Dec corn has been in over 3 years.
This does not mean we have to bottom today, as currently we have no confirmation of a bottom, and have seen zero stabilization.
However.. we are getting due for some sort of bounce. Or at the very least due for some stabilization and for this market to stop bleeding. Simply given just how oversold we are.
Historically, markets don’t stay this oversold for too long.
Last time we were this oversold?
Over the last decade, there are only 2 other times Dec corn was this oversold.
2022 and 2023.
So what happened?
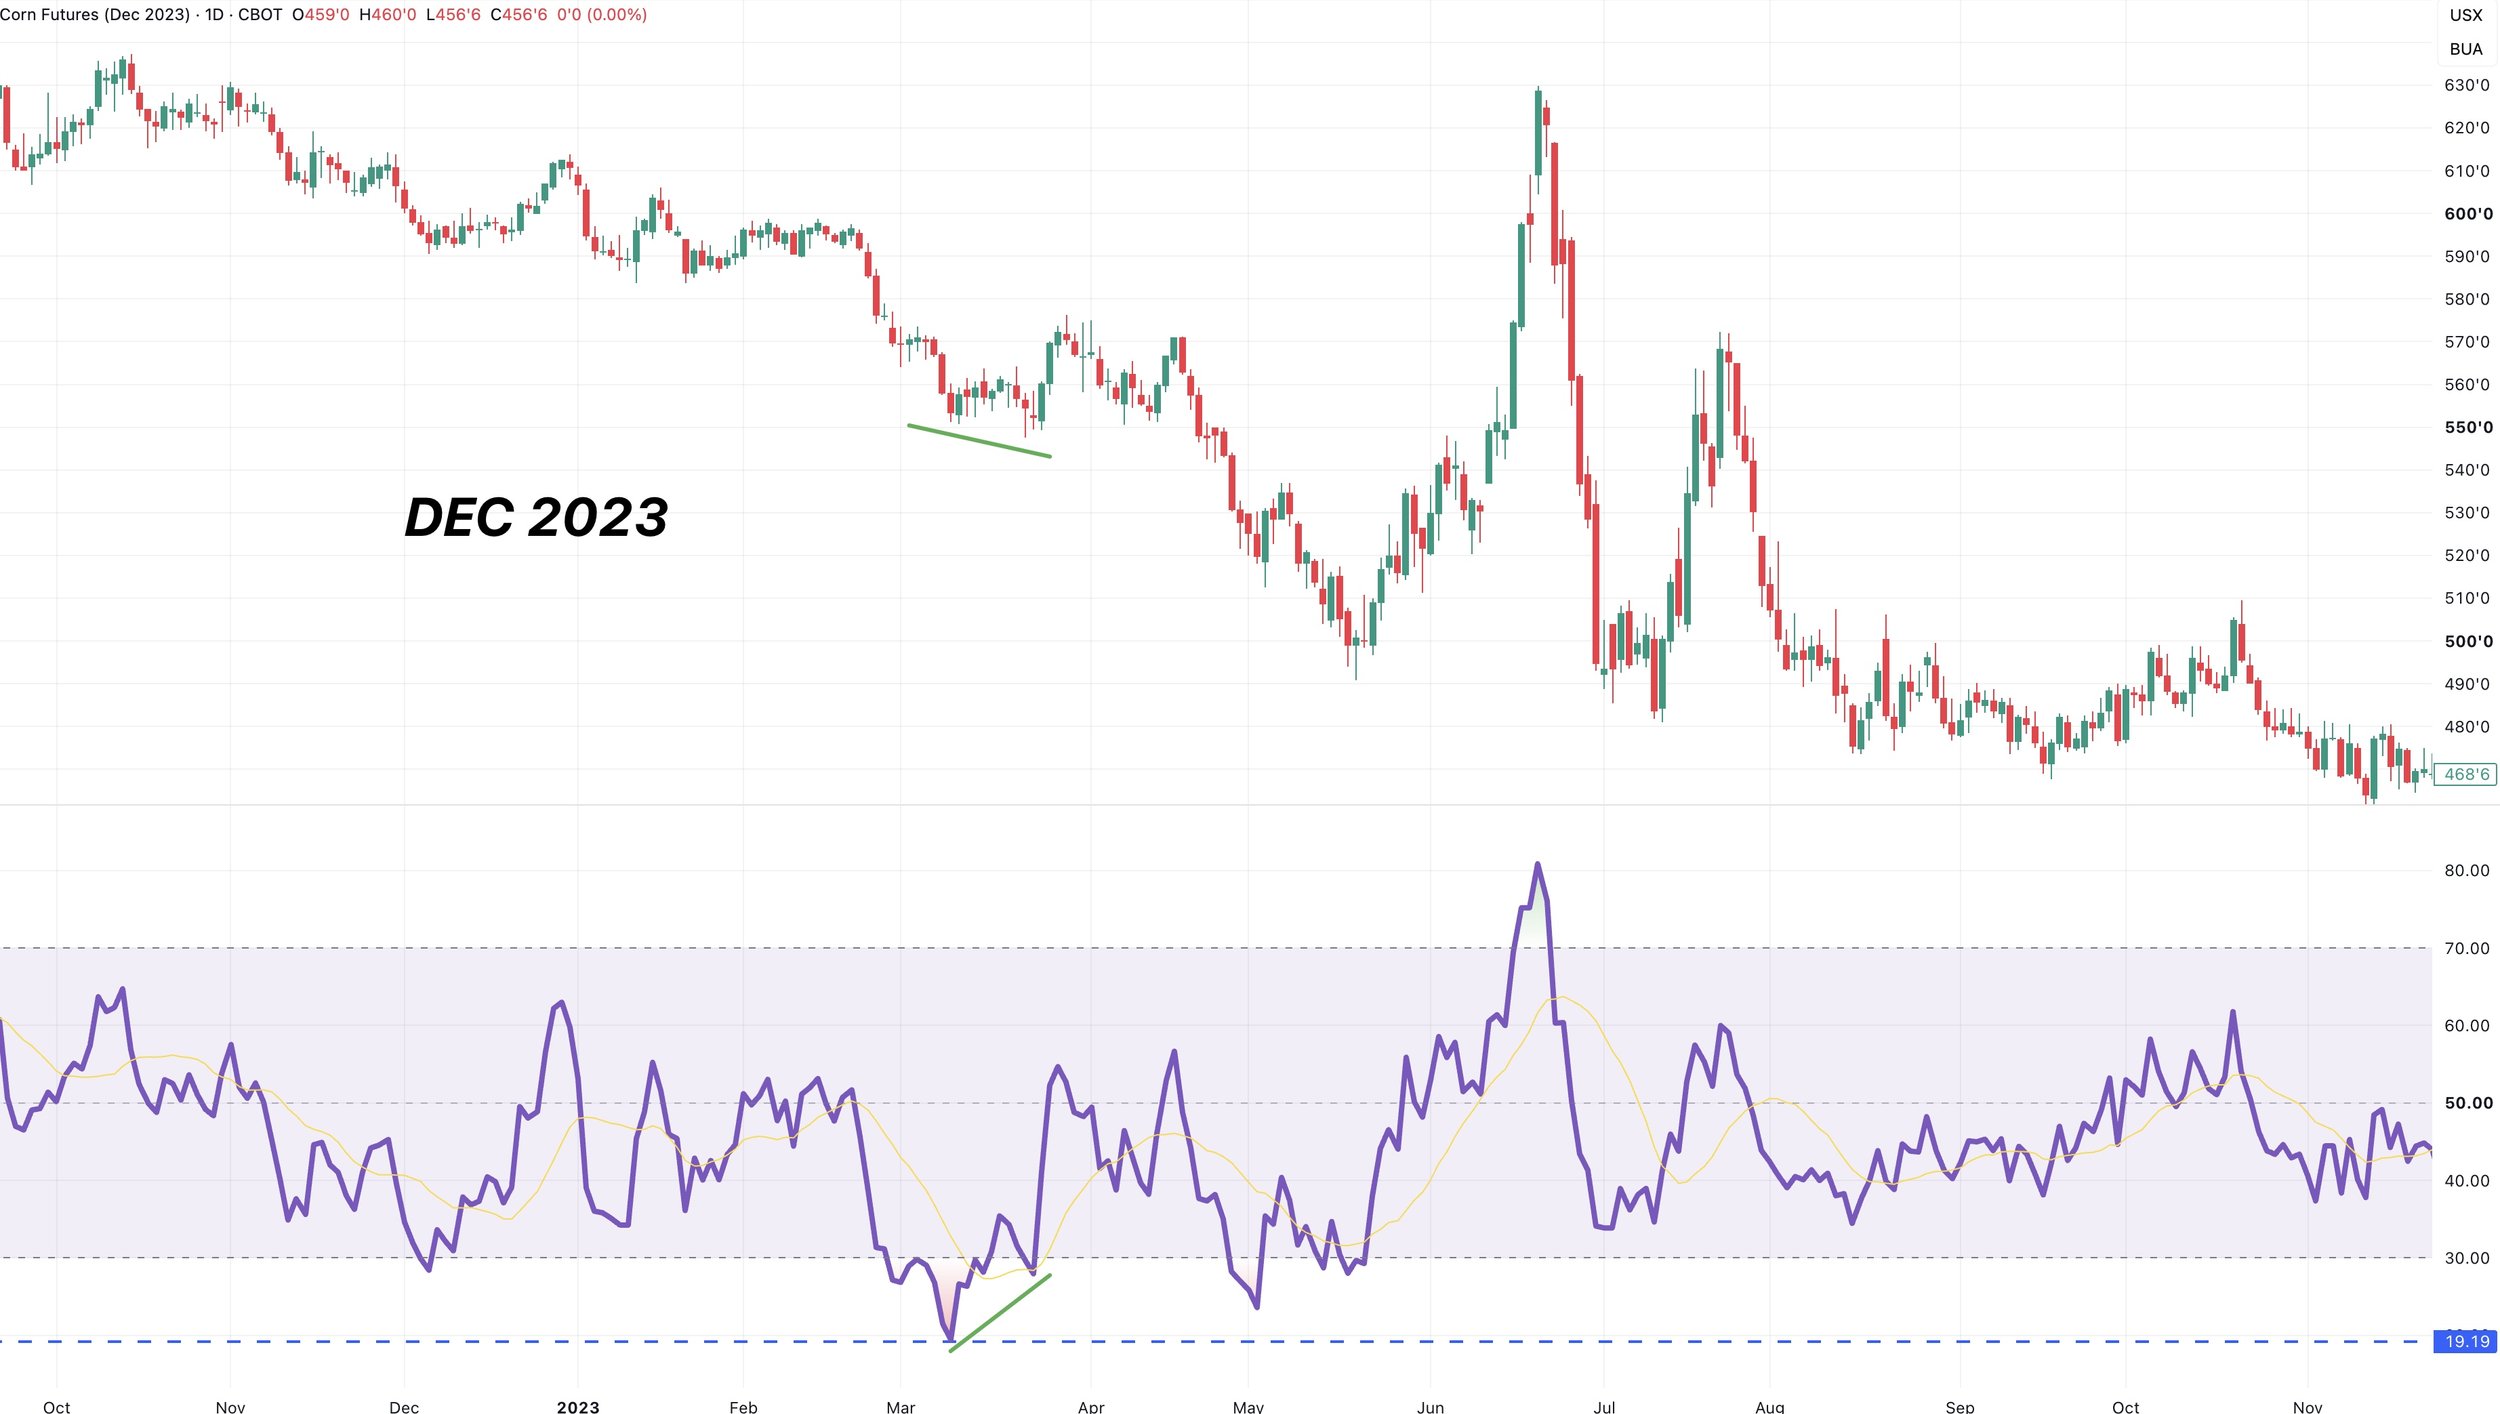
2023:
Prices stabilized, altough grinded lower. We saw the market post new lows while printing bullish divergence before putting together a nice 20-30 cent bounce before heading lower.
However, we do have to point out that this one did happen in March, and we were already in a clear multi-month downtrend from the 2022 highs. So not exactly a similar situation.
2022:
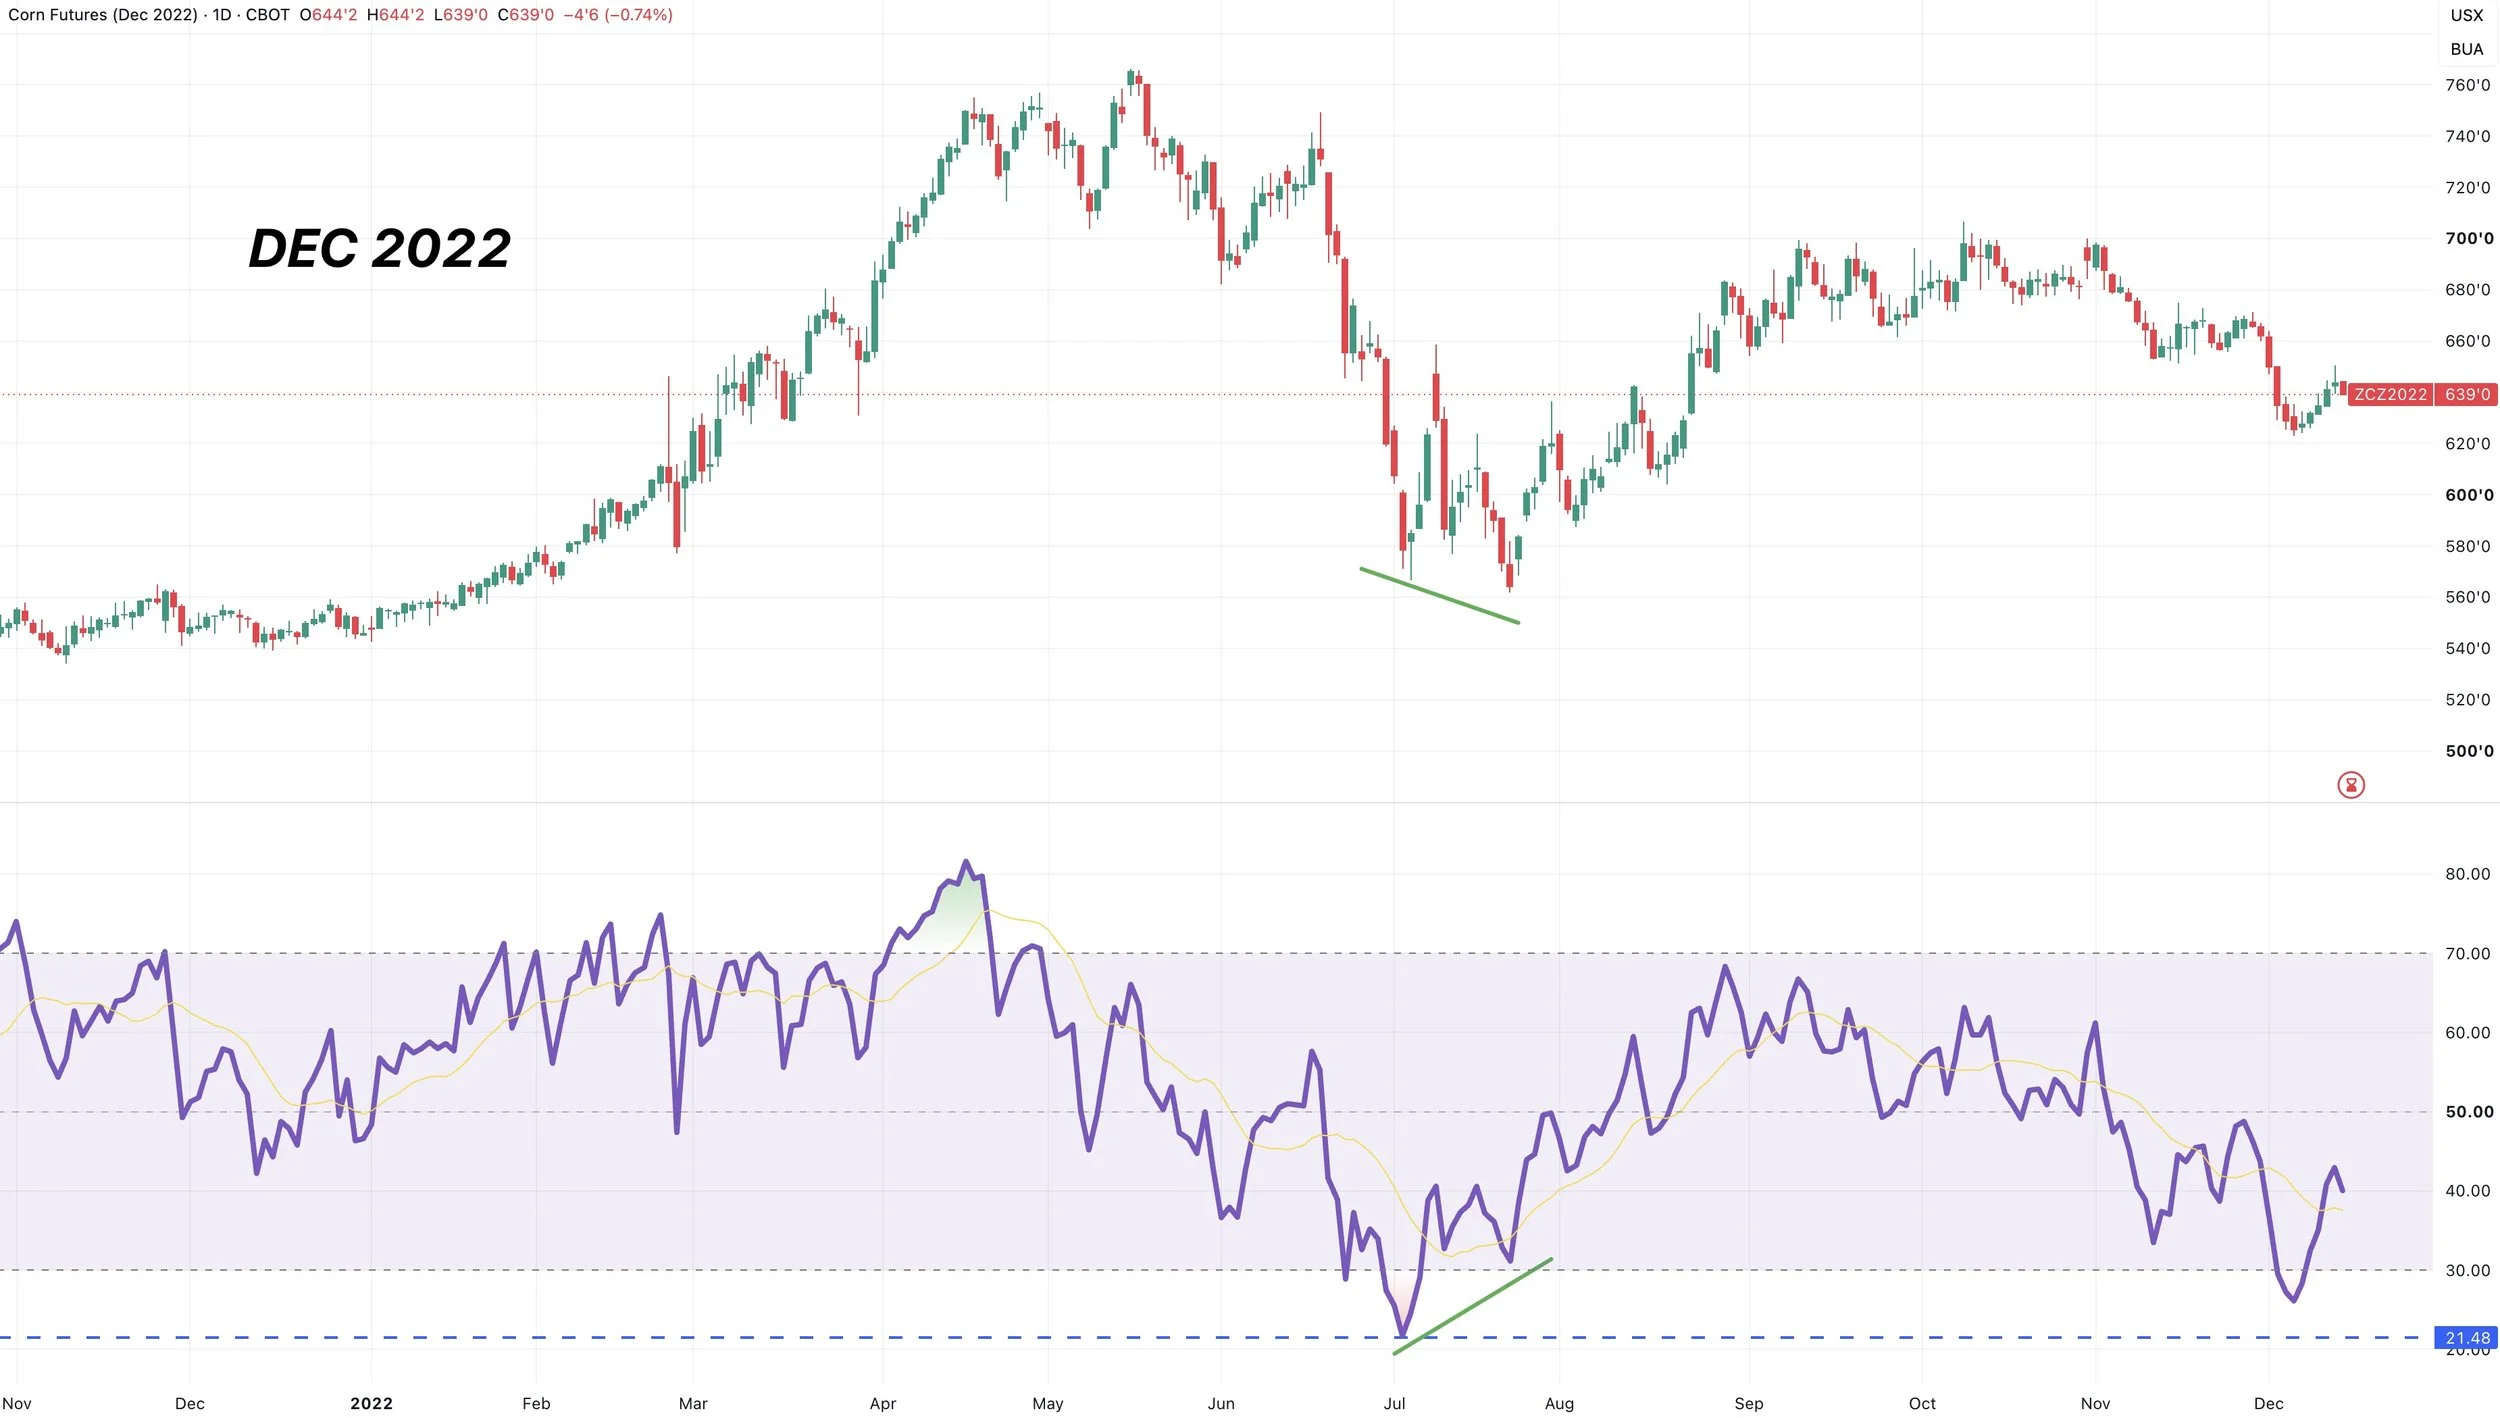
The other year was late summer 2022.
The market stabilized, but grinded a little lower before printing bullish divergence and carving out some lows.
So it's reasonable to think we should watch for a potential similar situation. Where we stabilize and grind slightly lower, before printing bullish divergence and a bottom.
Just something to keep our eyes on if this happens this time. As clear bullish divergence would be one possible sign of a bottom.
Dec Crude Chart:
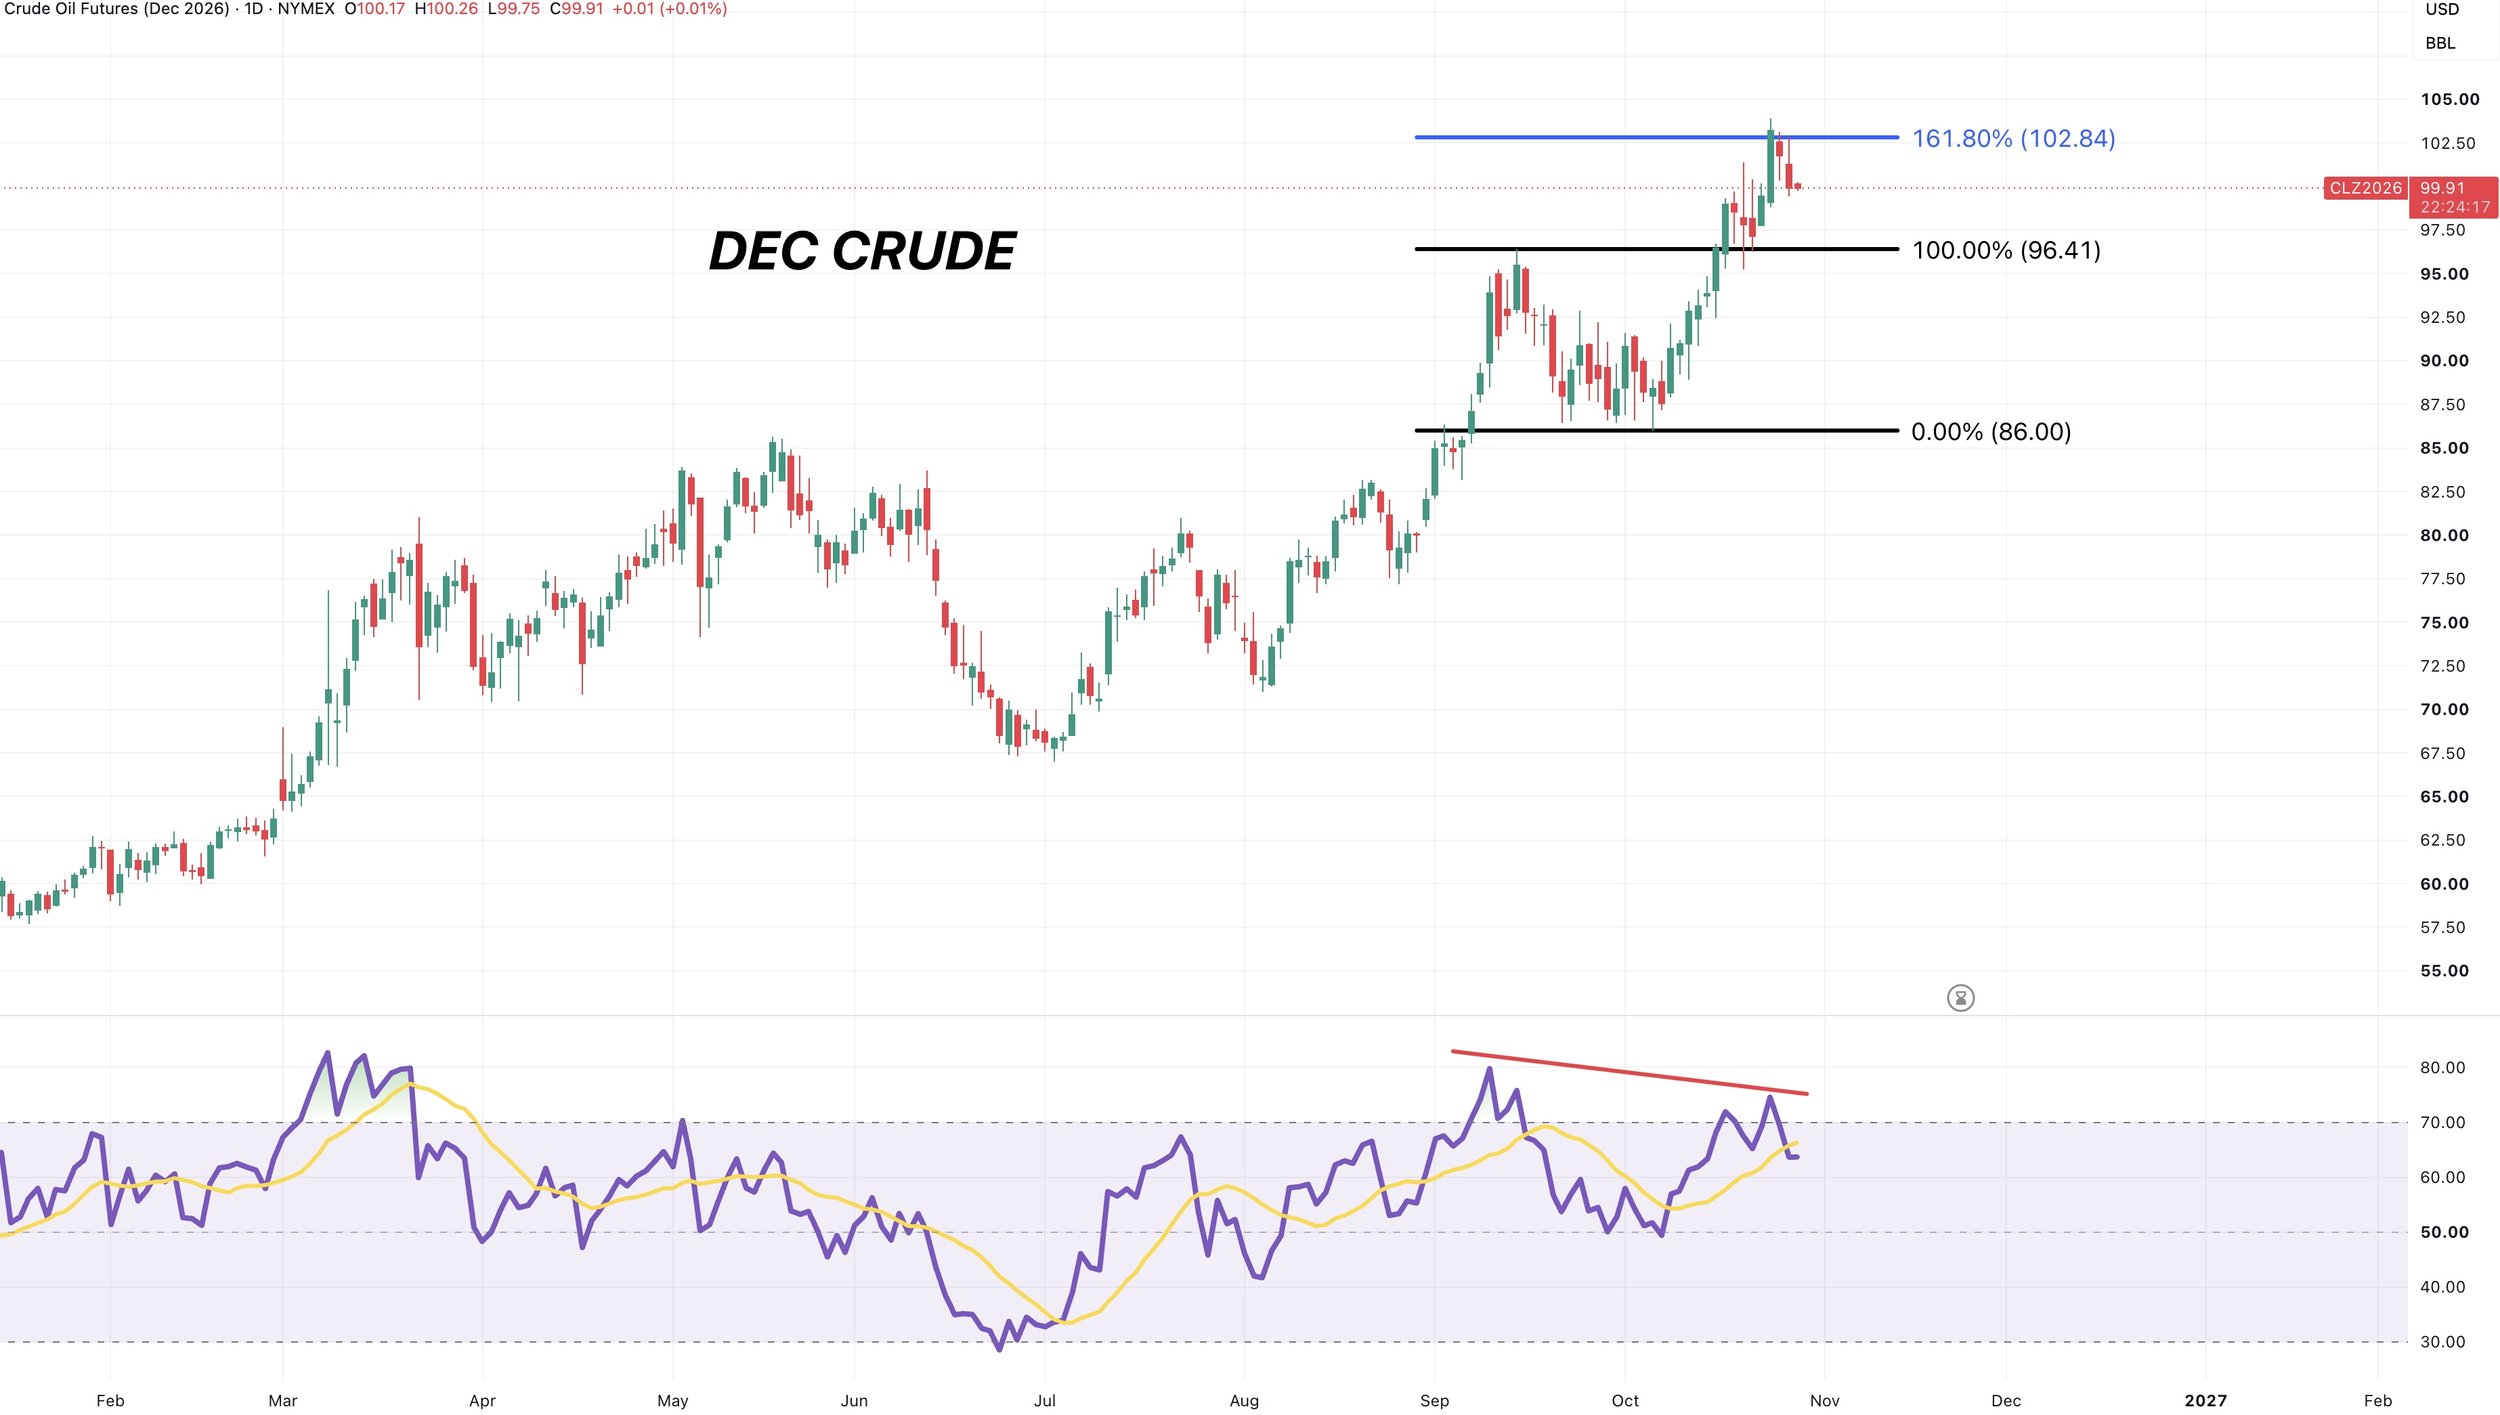
I had some requests to start throwing a crude analysis into the mix more.
We hit the 161.8% golden fib target. Currently seeing a rejection.
We also have some clear bearish divergence on the RSI, as prices pushed way above the recent highs yet the RSI did not.
So it does appear like crude could potentially be in for a pullback.
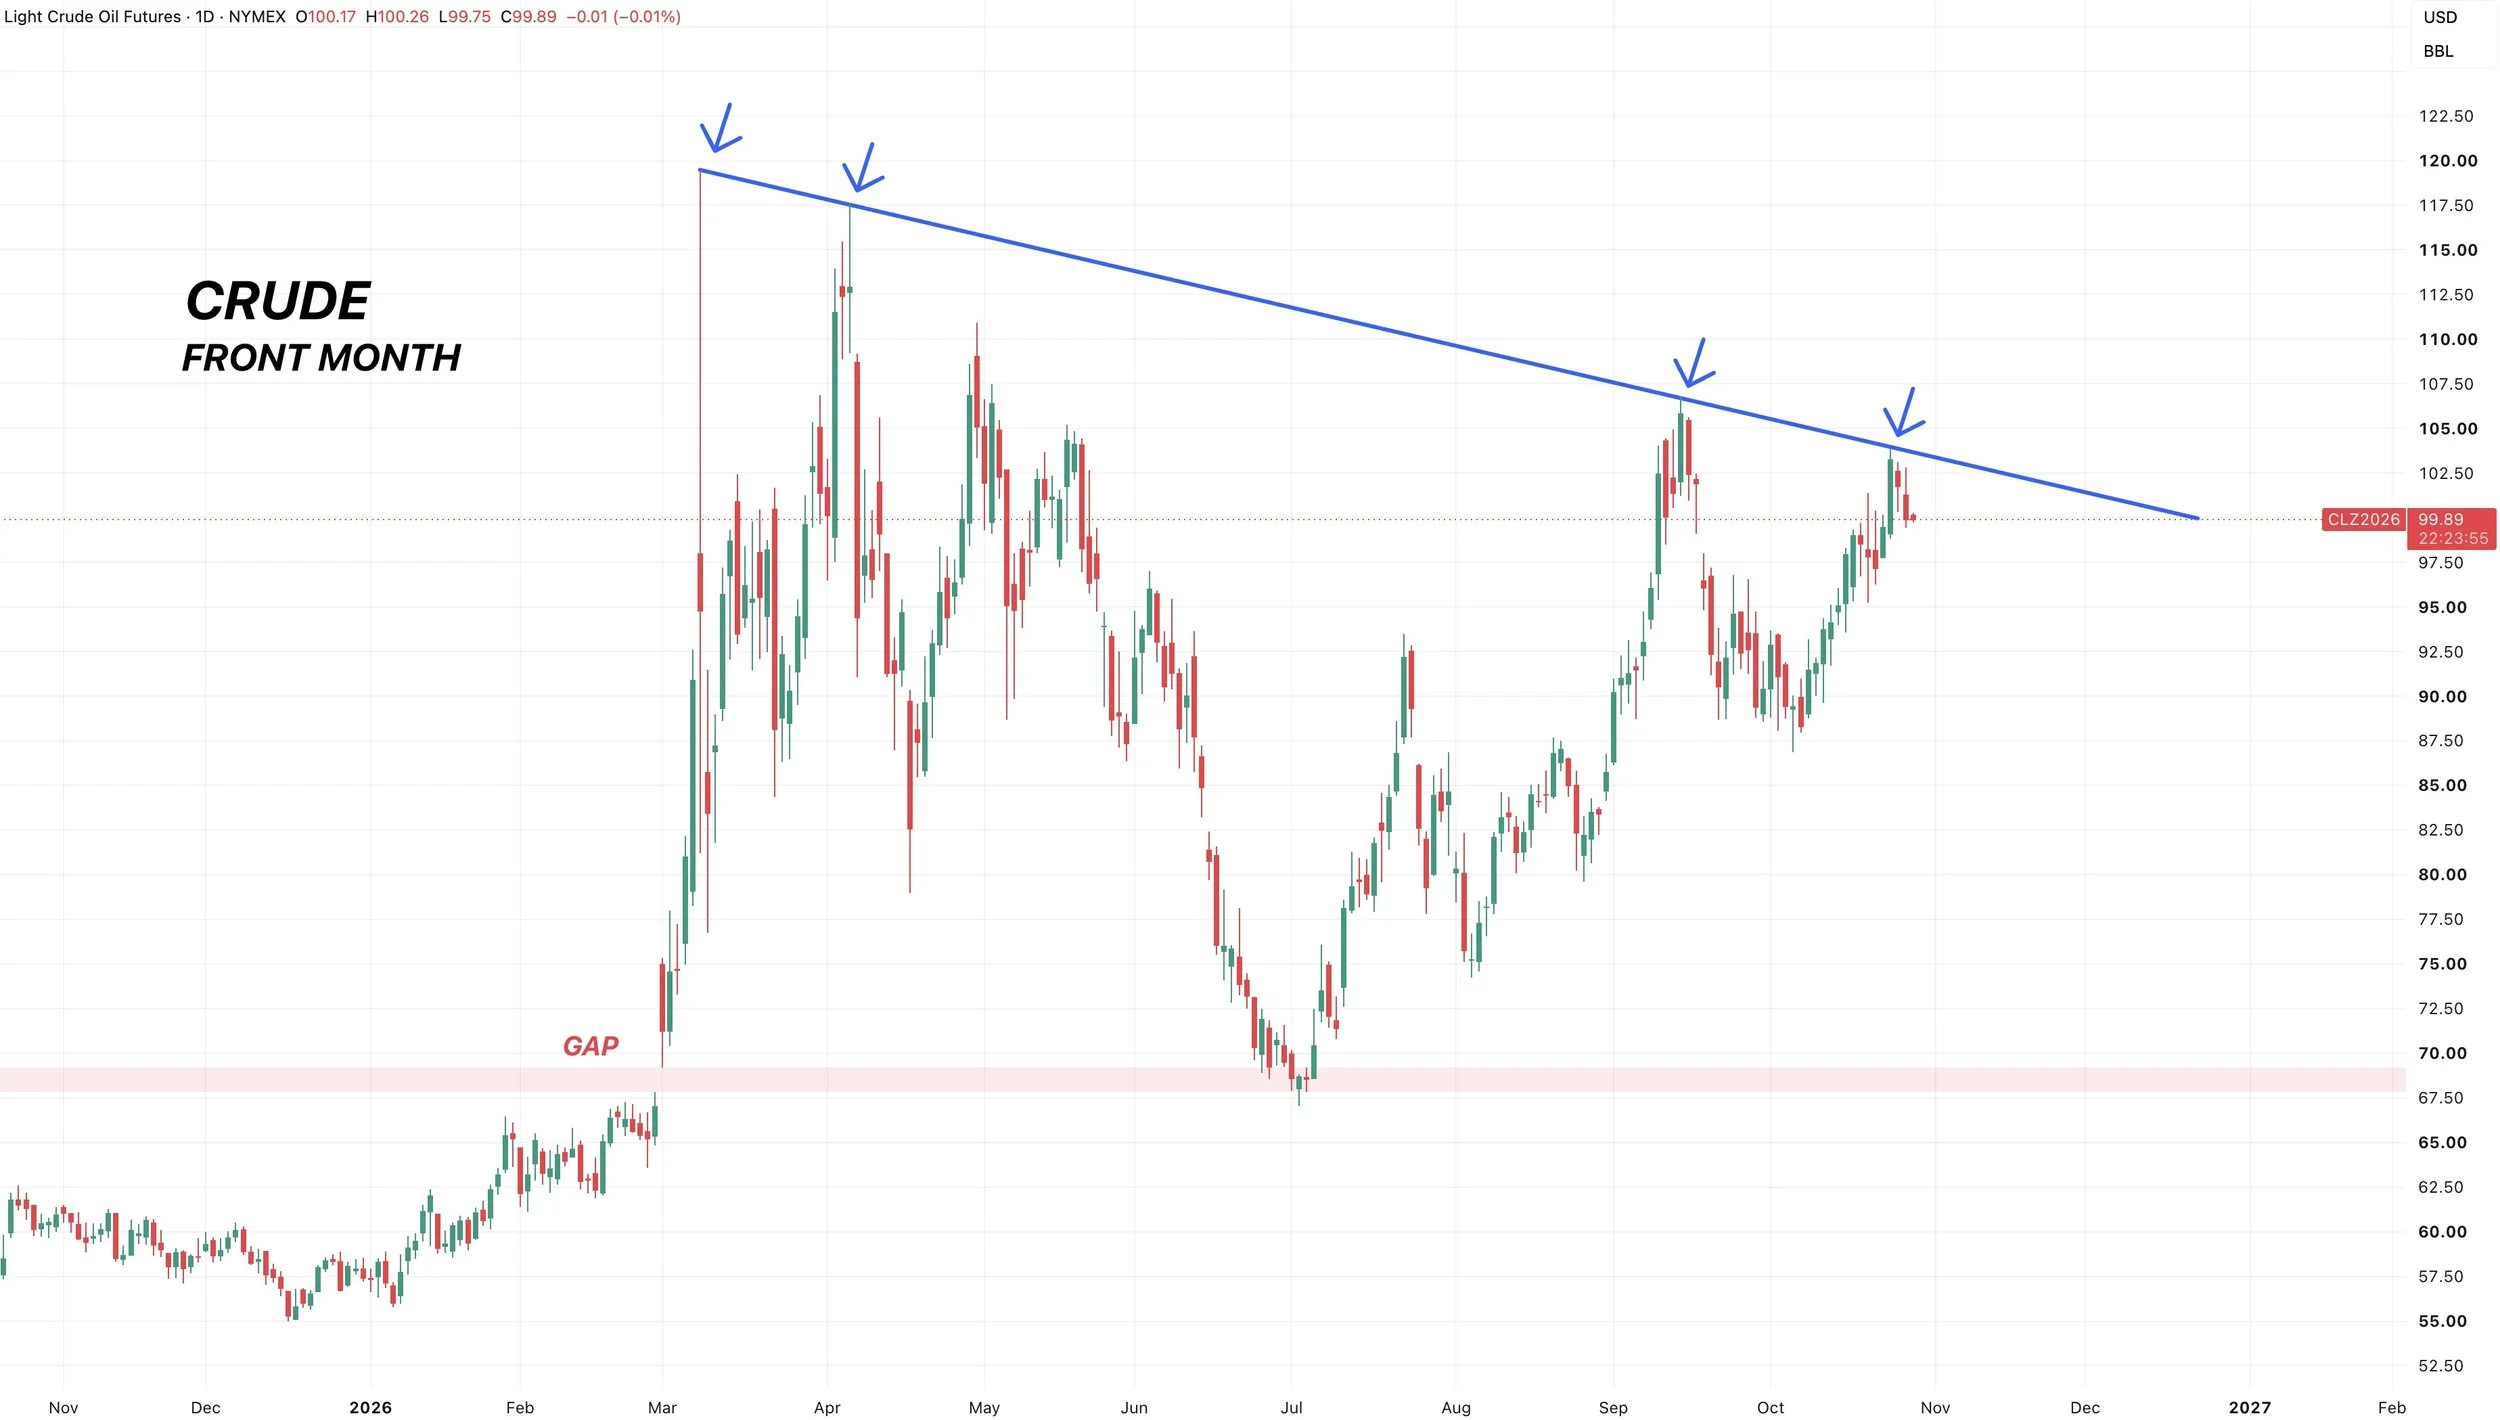
Front Month Crude:
Even looking at the front month chart, you do have some simple trendline resistance that has marked the last few tops.
Soybeans
Fundamentals:
Right when it felt like this soybean market was finally trying to put something together we get hit with some Brazil headlines that spook the market.
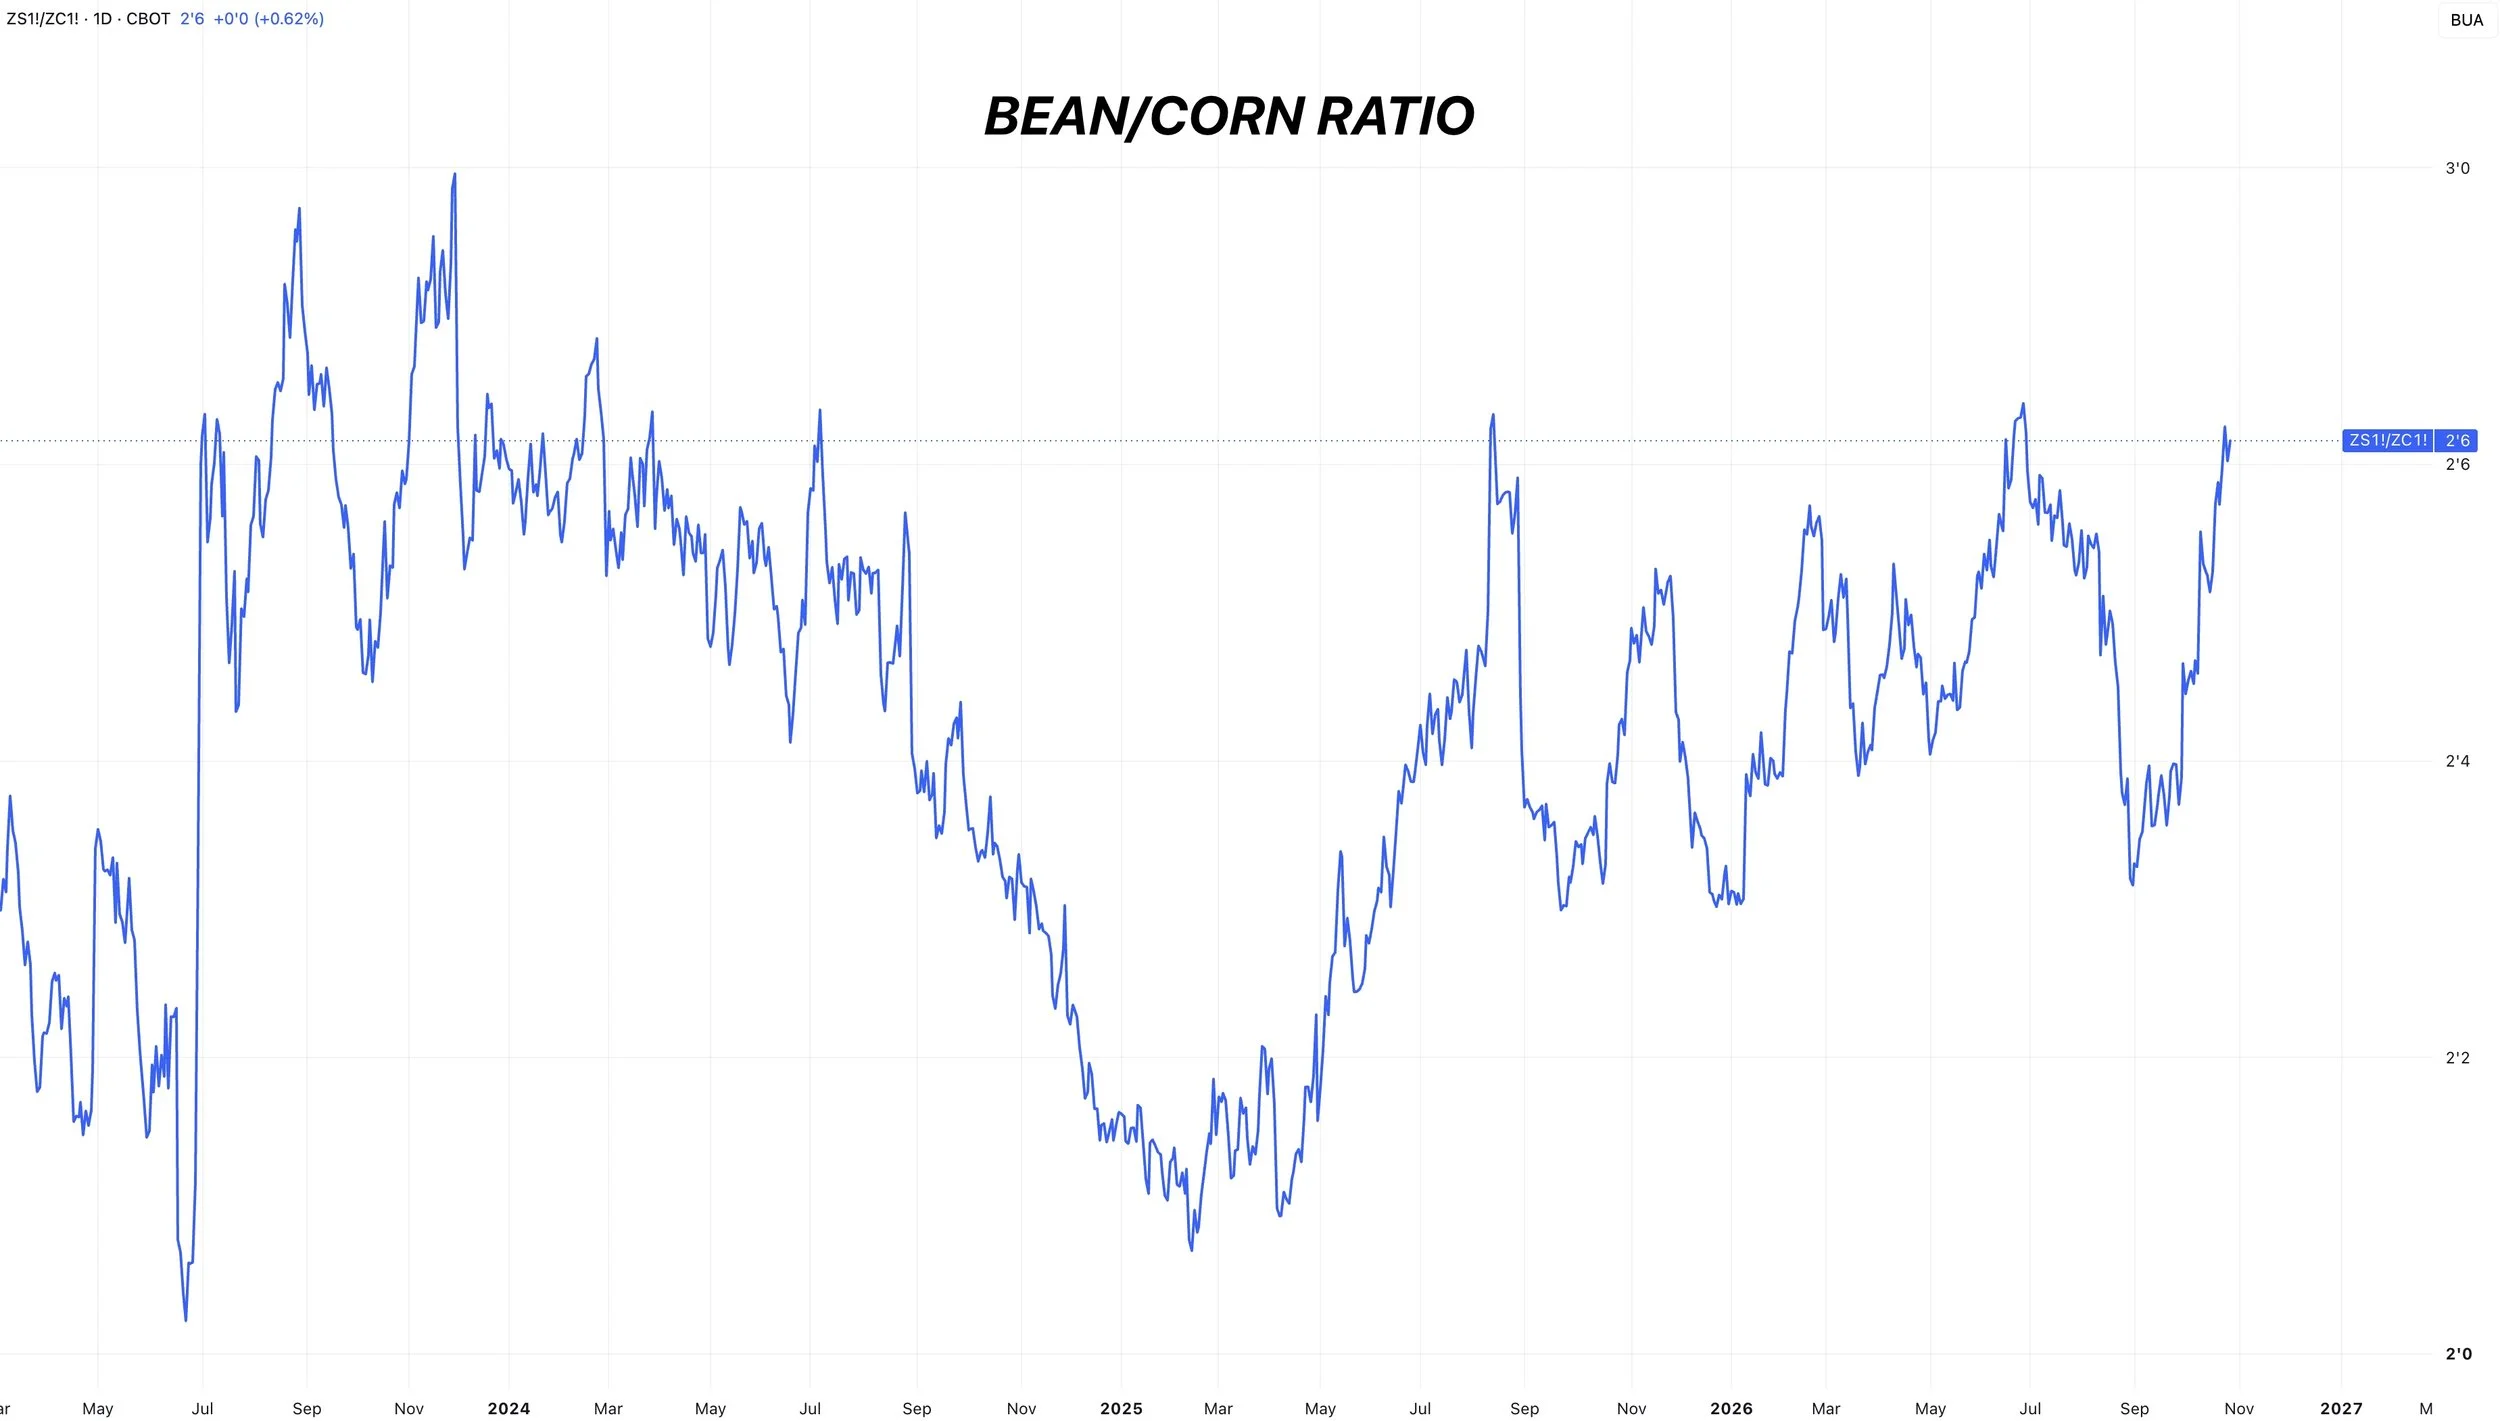
One thing I wanted to talk about today was the ratio between corn and soybeans.
Clearly corn is undervalued, and soybeans are overvalued when you compare them relative to one another.
The ratio is getting rather lofty.
We do not like selling anything here, but if you are forced to move one of the other, it makes more sense to store corn and sell beans.
You get more cash flow for soybeans, corn is more undervalued, and soybeans relatively have more downside risk from here.
You always want to sell what's overvalued and store what's undervalued if you have to sell one.
Spreads:
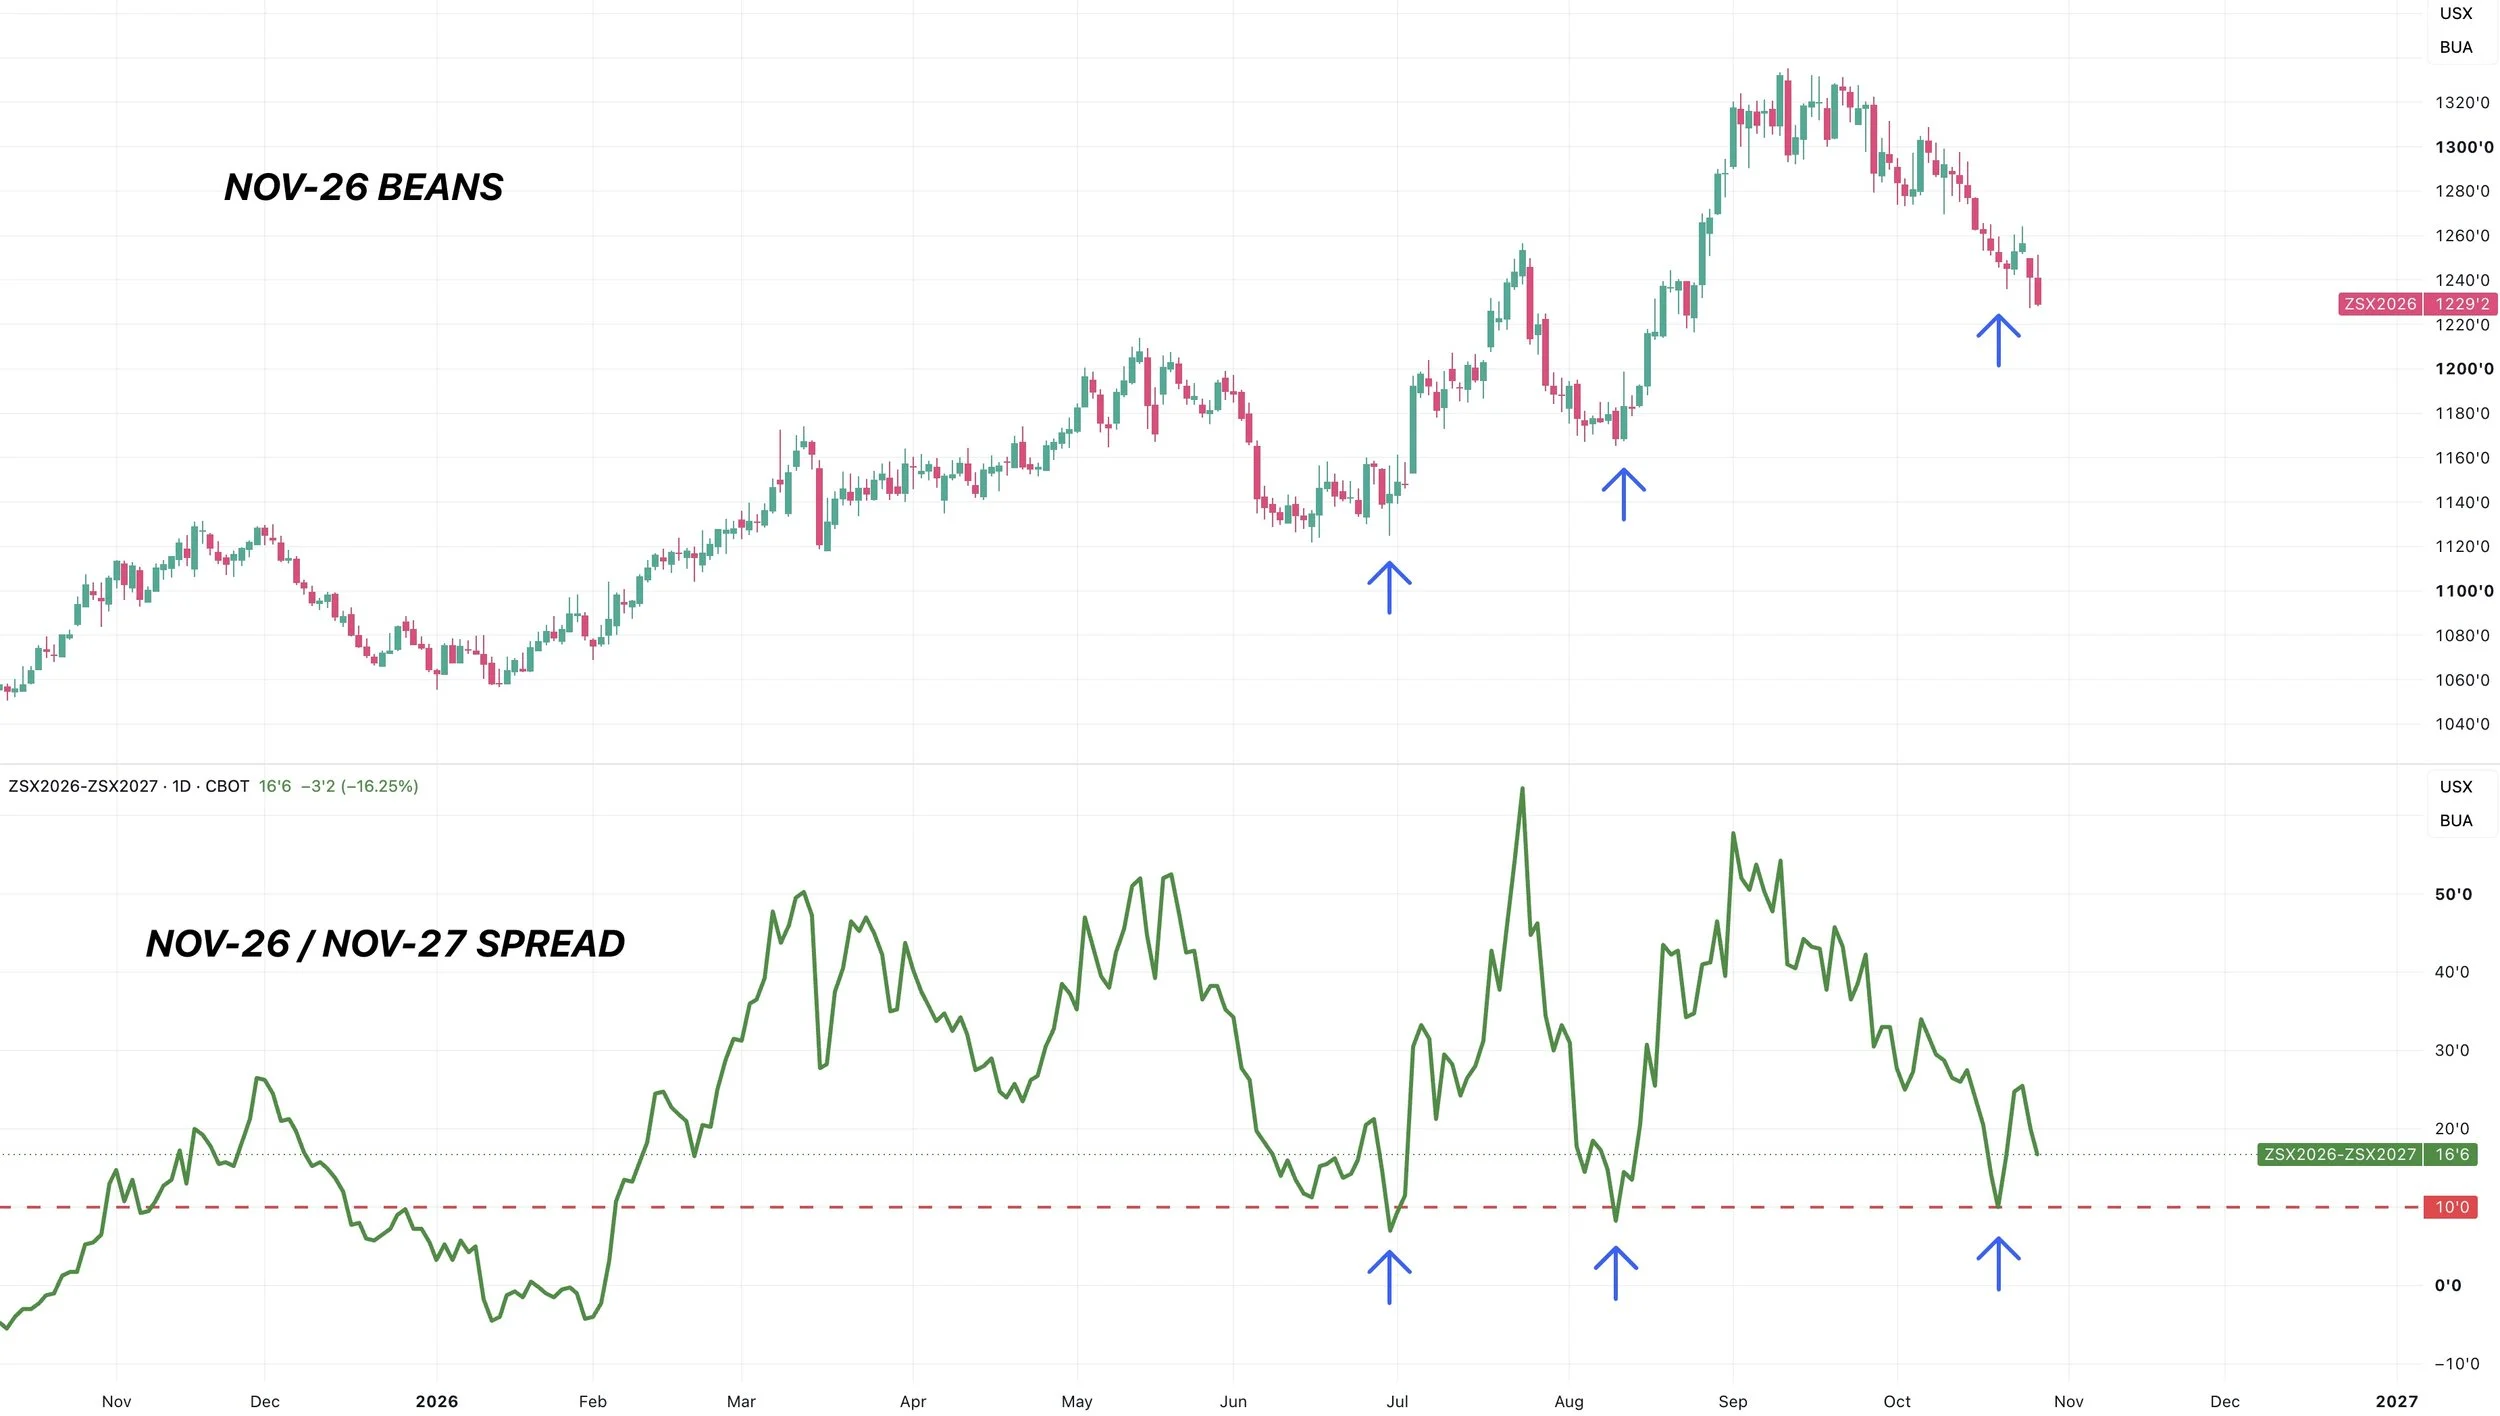
The spreads are still going to be one of the key things to watch.
If they continue to firm up, that would be a bullish sign.
Today, the spreads loosened. Which was negative.
However, the spreads are still firmer than they were a week or so ago.
The last two times the Nov to Nov spread was at this level, it did mark a bottom for the soybean market.
However, we need to continue to see the spreads do the work. If the spreads continue to firm, that's a bullish sign.
If the spreads post a new low, it could be a sign that soybeans are in for yet another leg lower.
Bottom Line:
There isn’t much fundamentally we haven’t talked about in the past. As aside from the Brazil fiasco, there isn’t much new.
Long term and heading into next year, I think soybeans have a ton of potential just simply due to the demand story that we've been talking about for a long time.
China's buying the most in years. Crush is a record.
We have way more acres this year in the US, yet the balance sheet isn’t growing year over year.
Both the US and Brazil keep putting out record crops and that still isn’t enough for the world balance sheet to get bigger.
However, short term this market like the rest of the markets just lacks a catalyst here and the Brazil headlines certainly didn’t help things.
The big factor over the next few months will of course be weather down in South America. For the time being, there hasn’t seemed to be any major reasons for concern down there just yet.
On the charts we are sitting at a must hold spot to prevent another leg lower, so let's get into the charts.
Charts
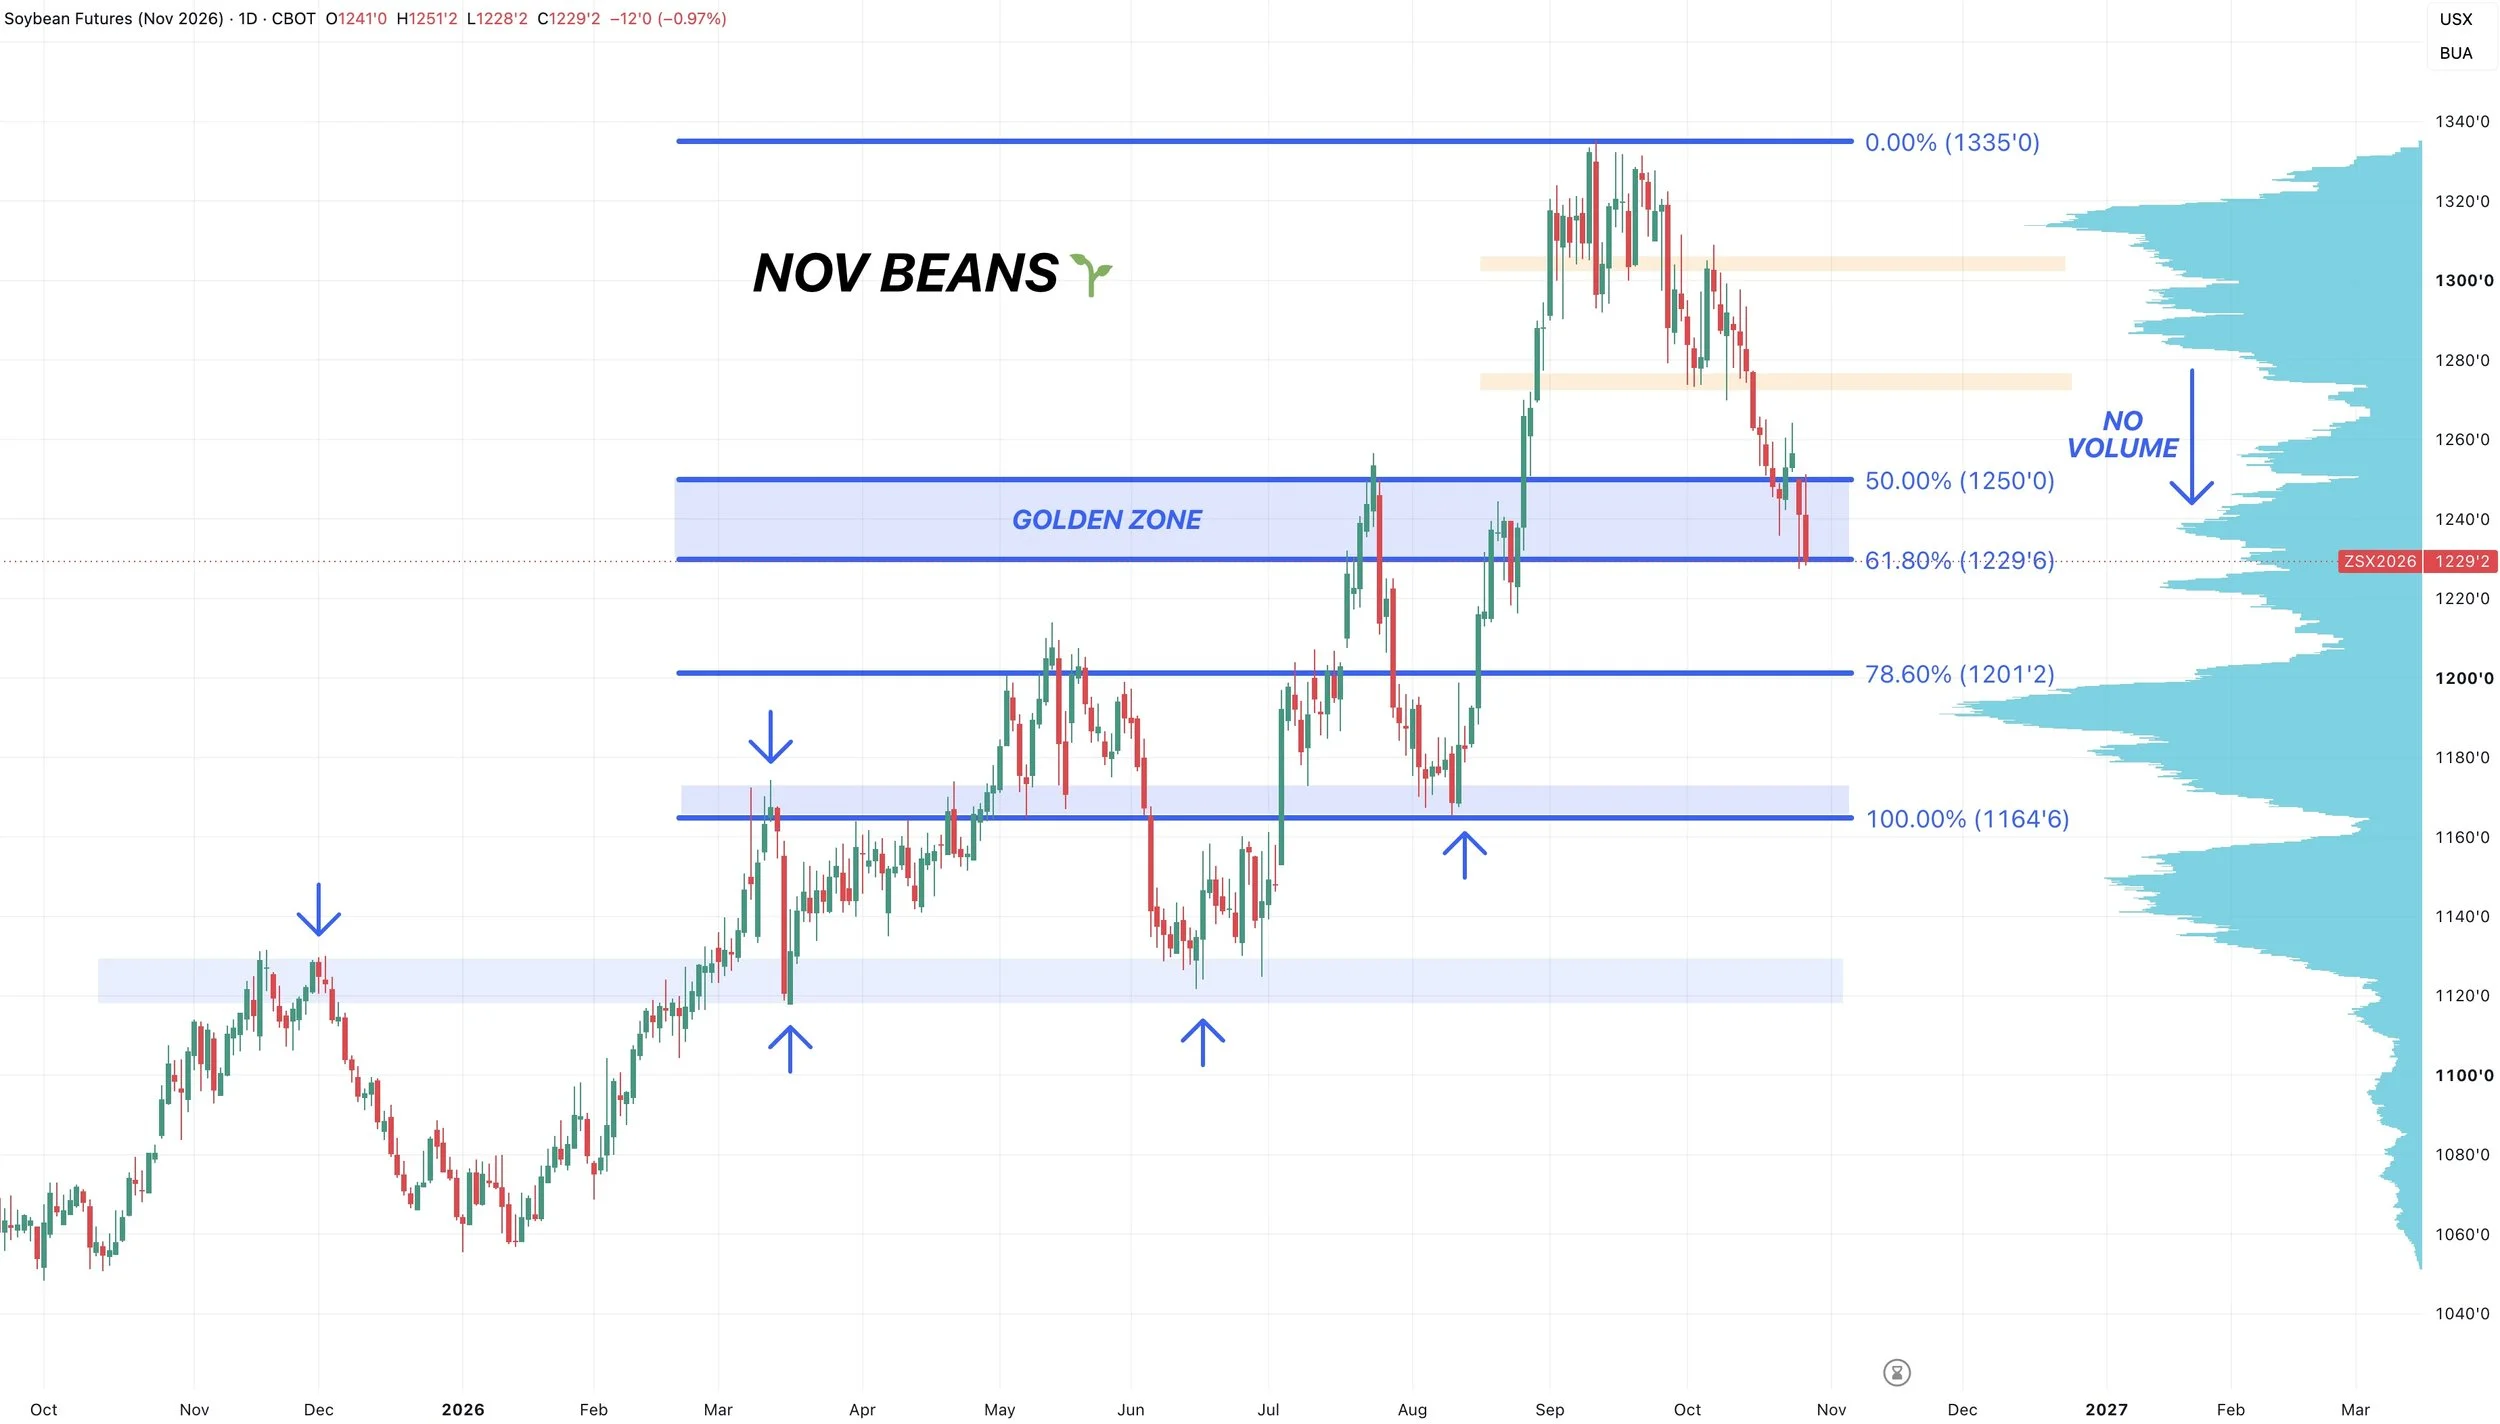
Nov Beans Chart:
Very poor price action in soybeans as we failed to hold the early rally after seeing a nice recovery yesterday. Closing right back at yesterday’s lows.
Soybeans need to bounce right about now or it could very easily open up another decent sized leg lower.
If we fail to hold this support, it likely opens the door to rest that $12.00 range.
Which is the next volume shelf and next retracement level. Being the 78.6% retracement down to the August lows.
Currently we are sitting at the 61.8% level. Re-testing those highs from July.
But if we fail to hold here, there is a volume gap to the downside towards the May highs.
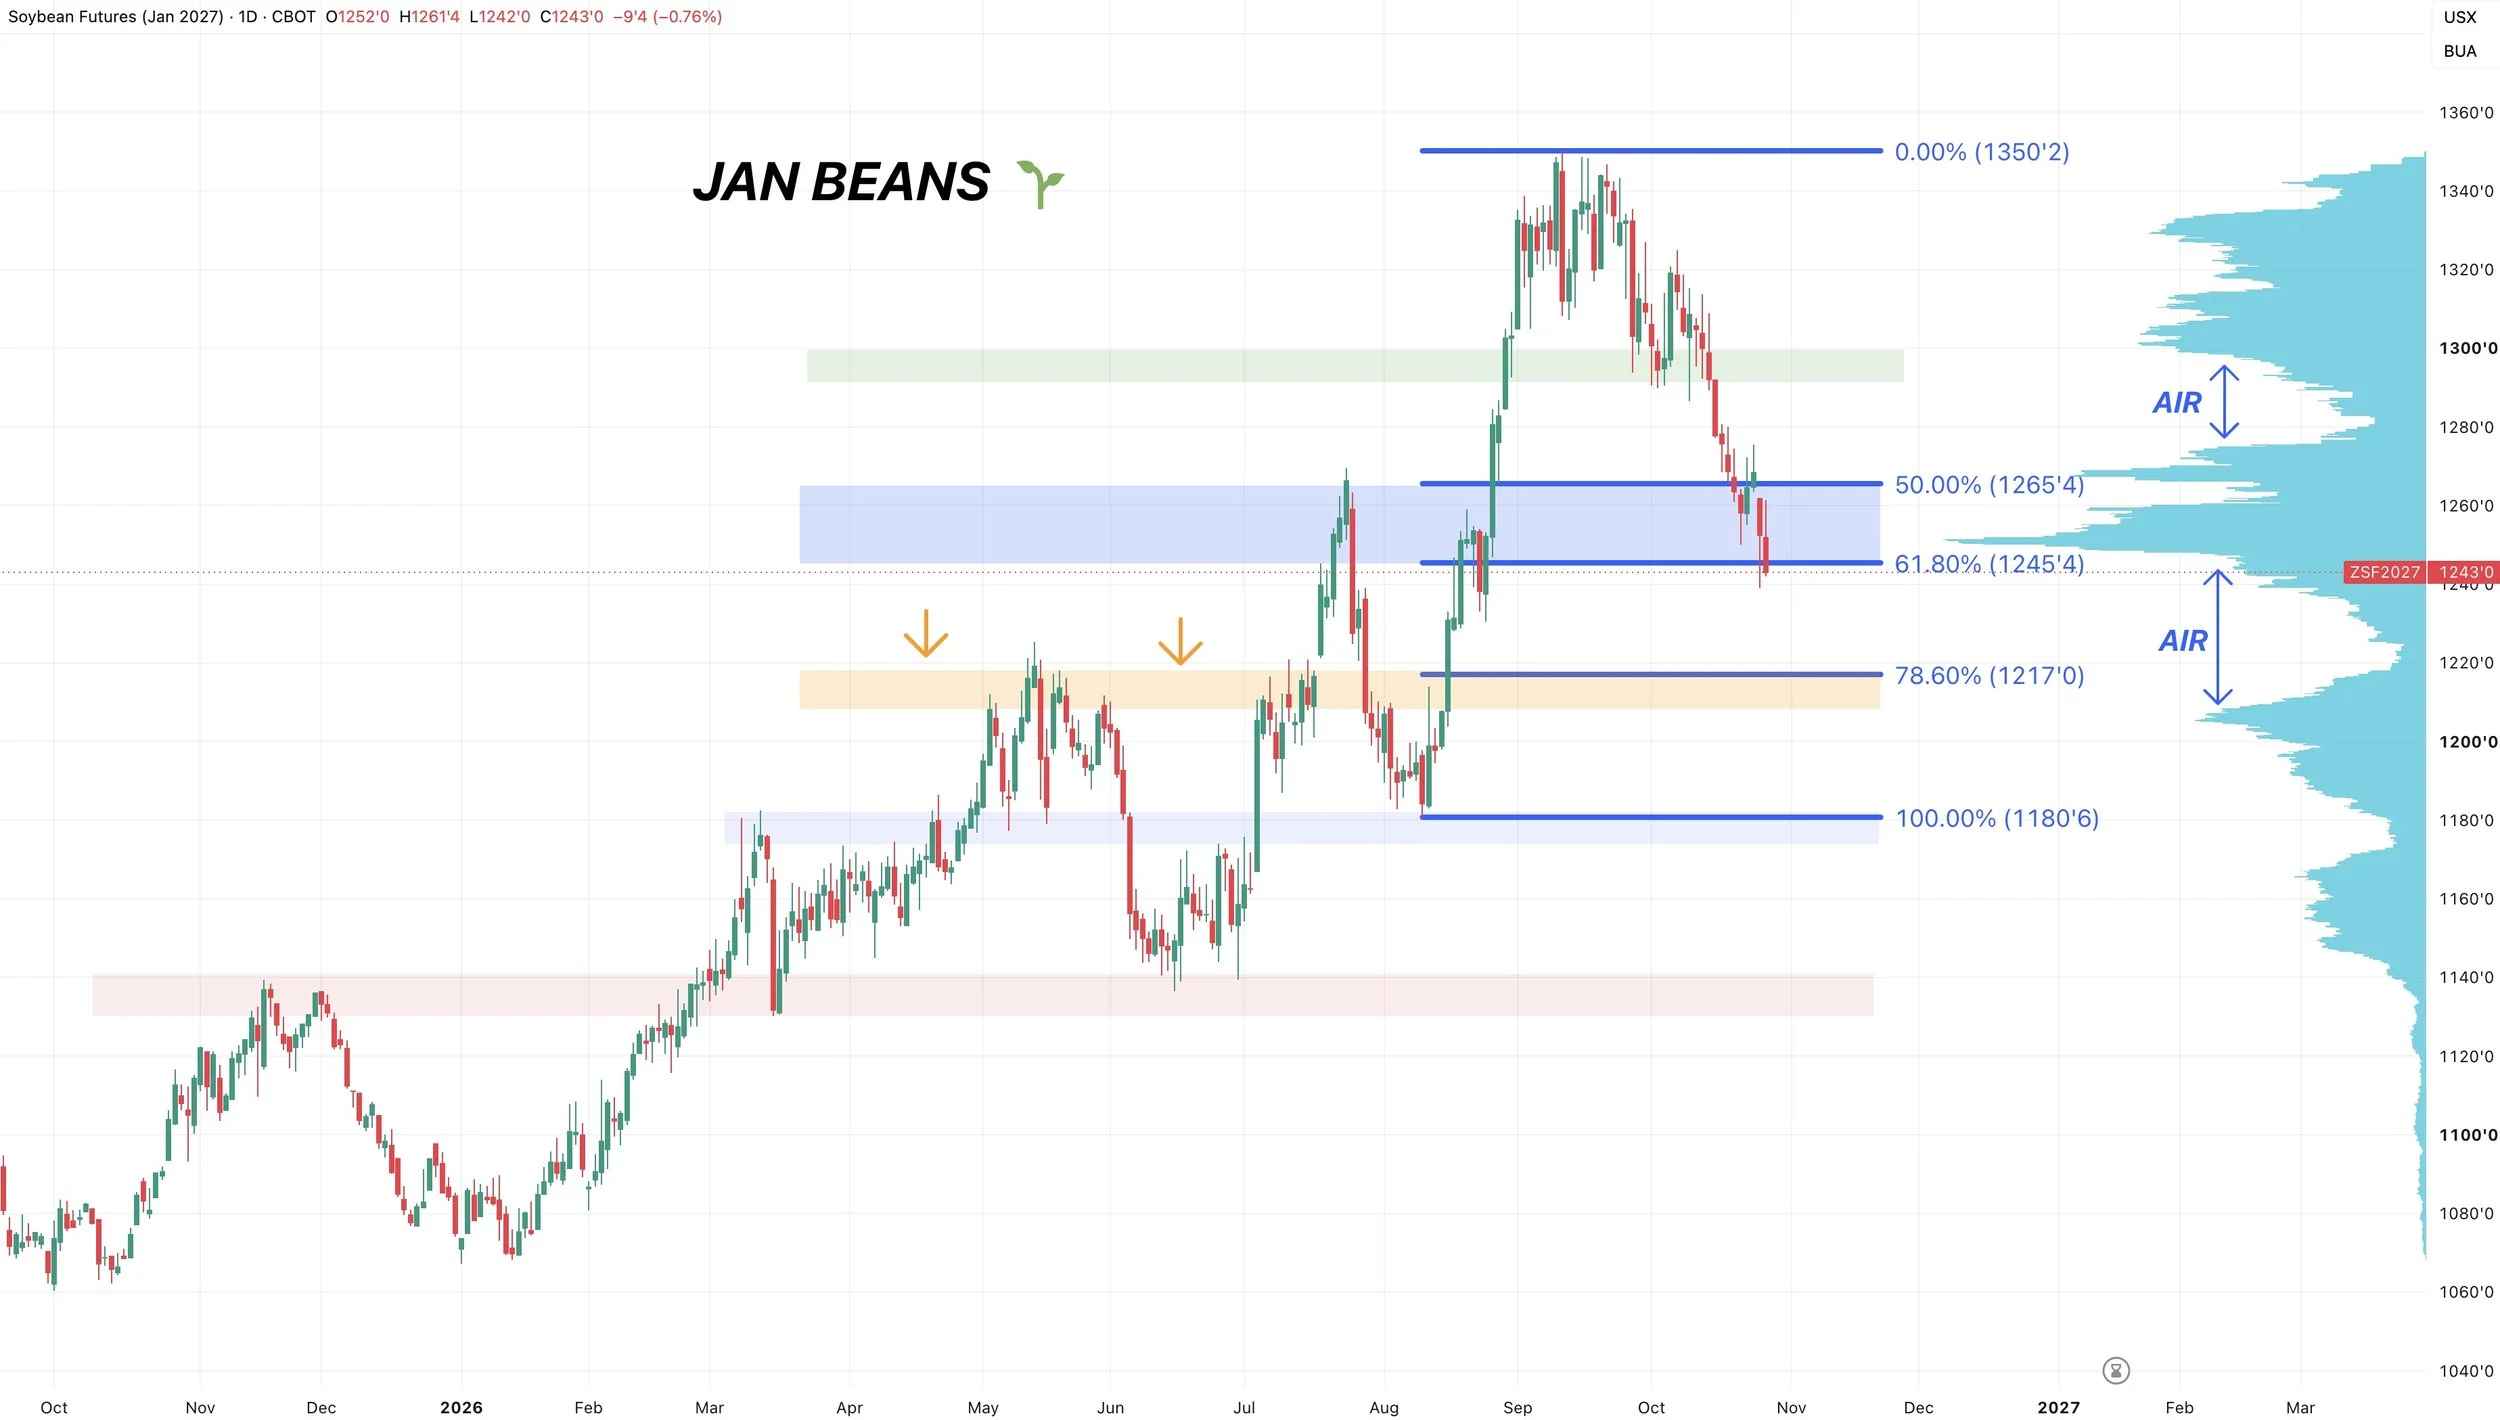
Jan Beans:
The Nov contract goes off the board here in a few weeks, so Jan is going to be the main one here shortly.
But we have a very similar look here.
We are at a very critical spot on the charts.
We are sitting at the 61.8% level down to the August lows. Re-testing the July highs.
We are at a big shelf of volume. But below this box there is a huge gap of air to the downside towards those May highs and the next retracement of 78.6%.
Here is another look.
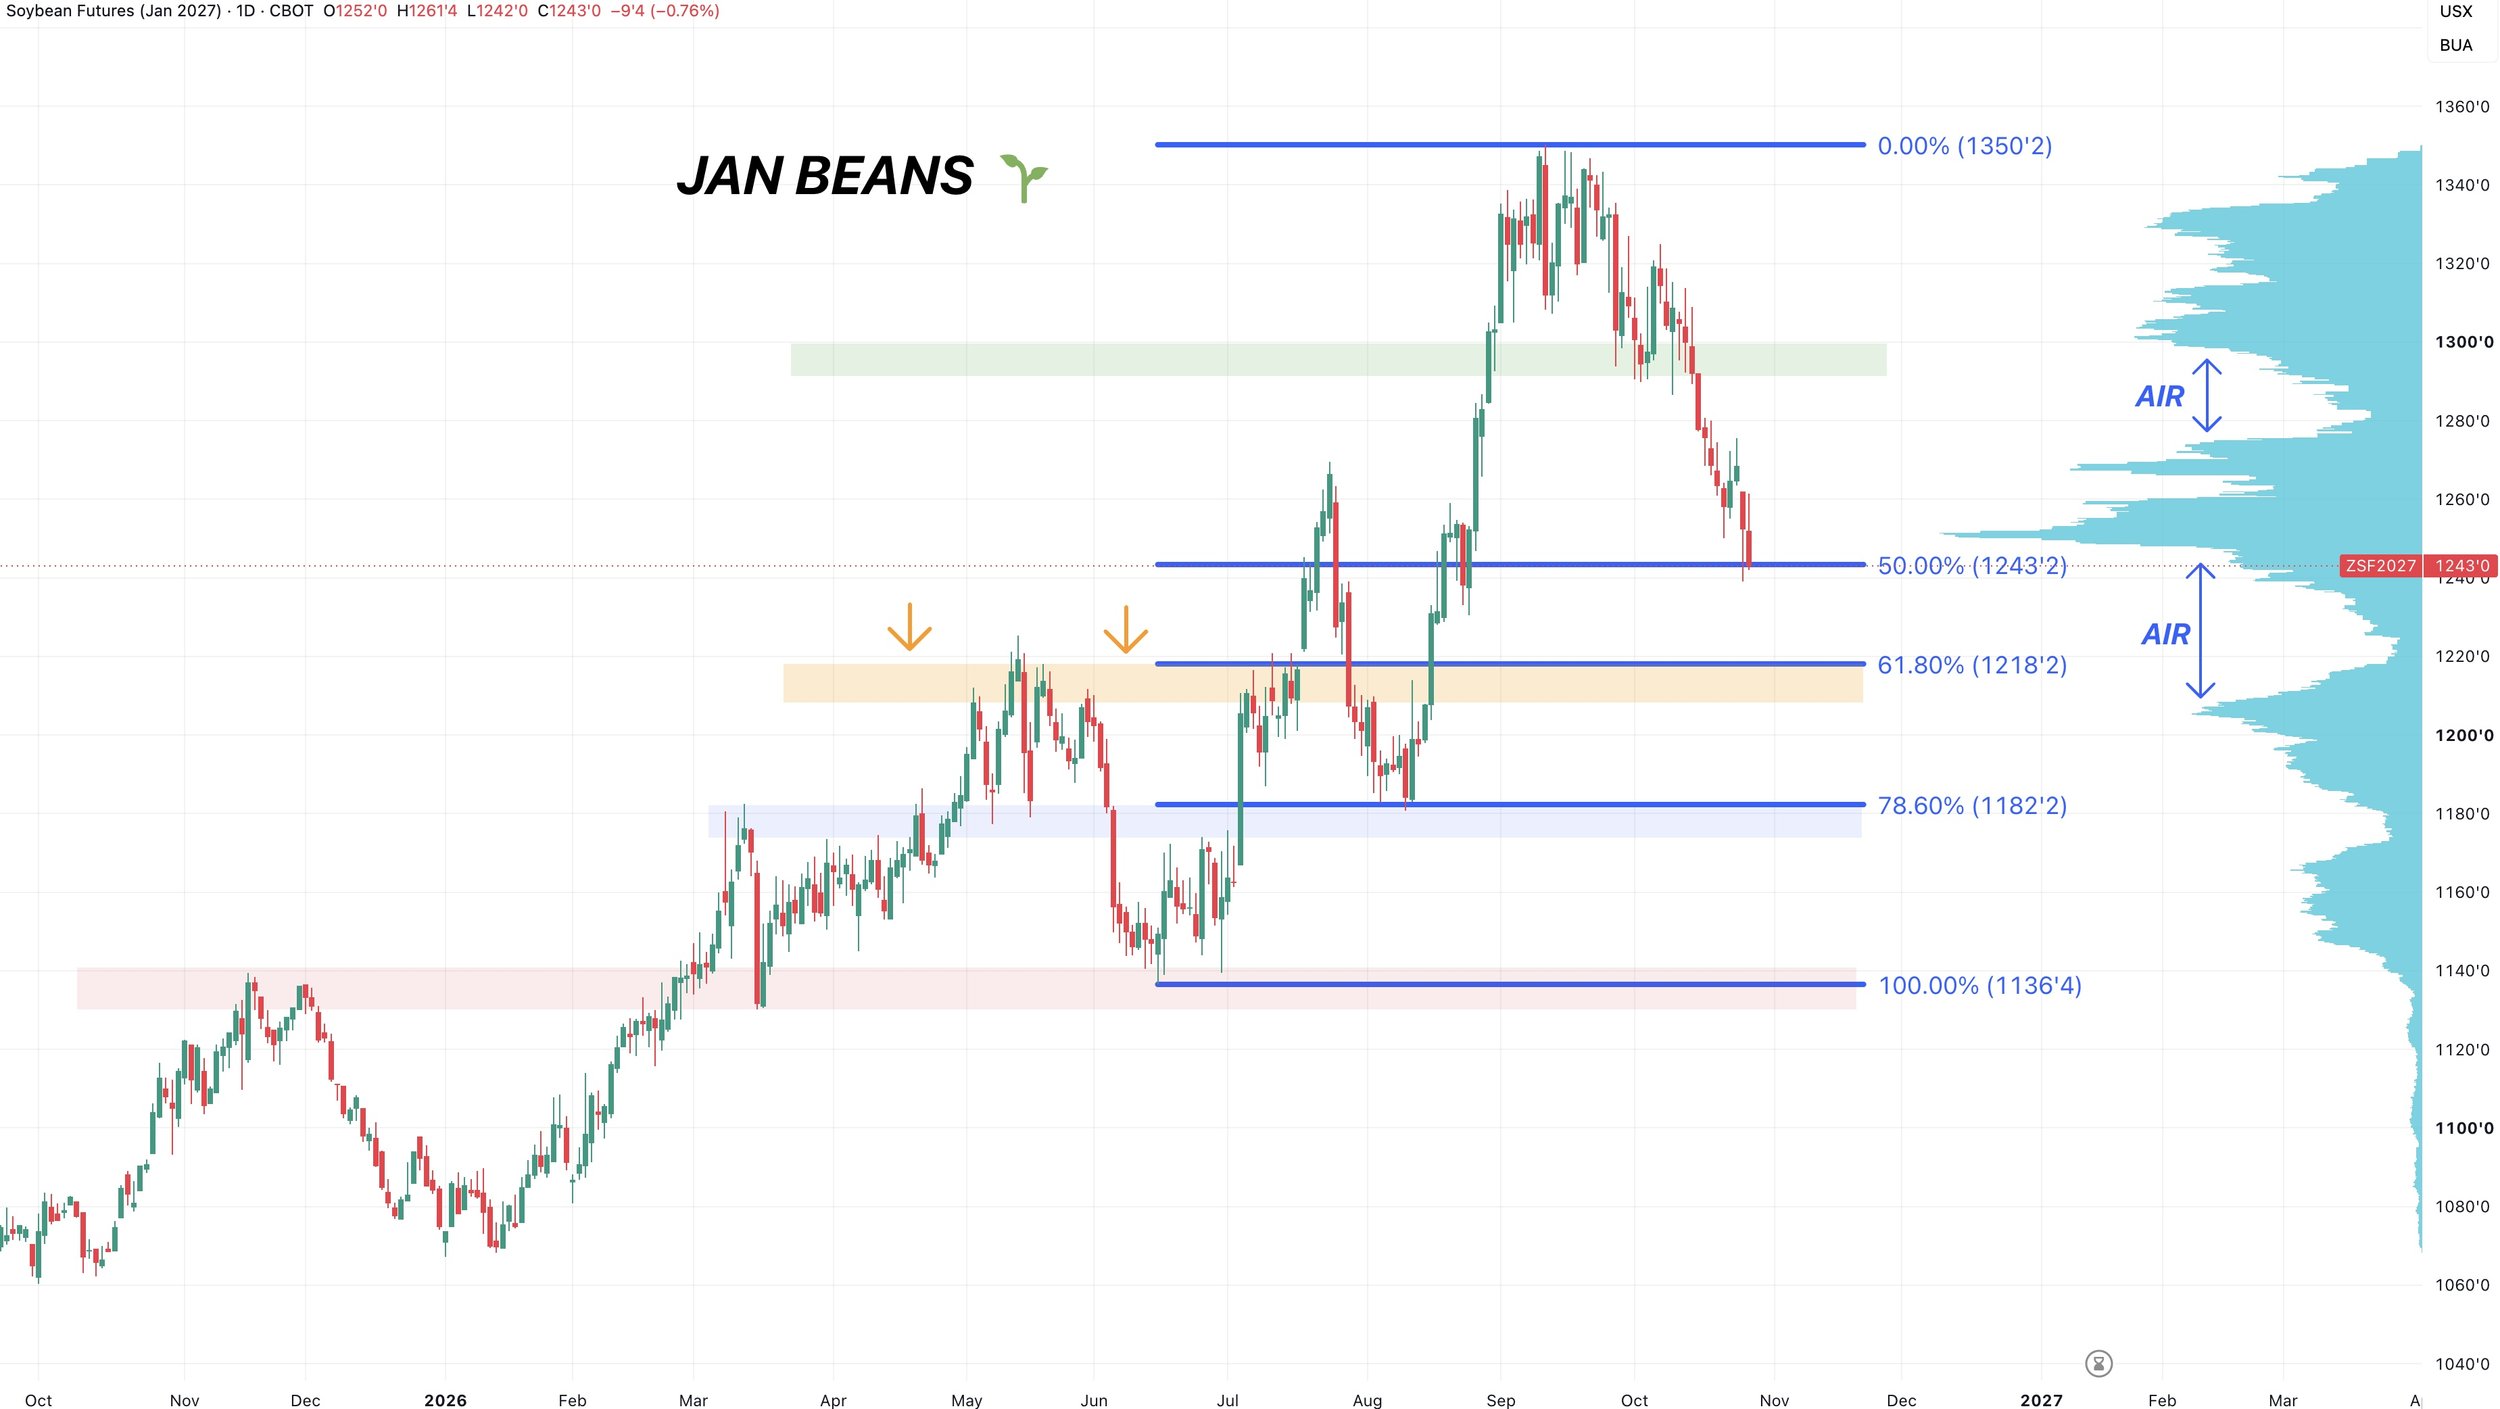
Instead of the retracements down to the August lows, I put on the retracements down to the June lows instead.
Like in the previous chart, we are at a key level. Sitting at the 50% retracement. With air to the downside.
If we fail to hold here, we could drop towards the 61.8% level. Which would again re-test those May highs.
Basically, the retracements down to the August and June lows both have this as a big level. With the next major level being the May highs if we fail here.
Meal Chart:
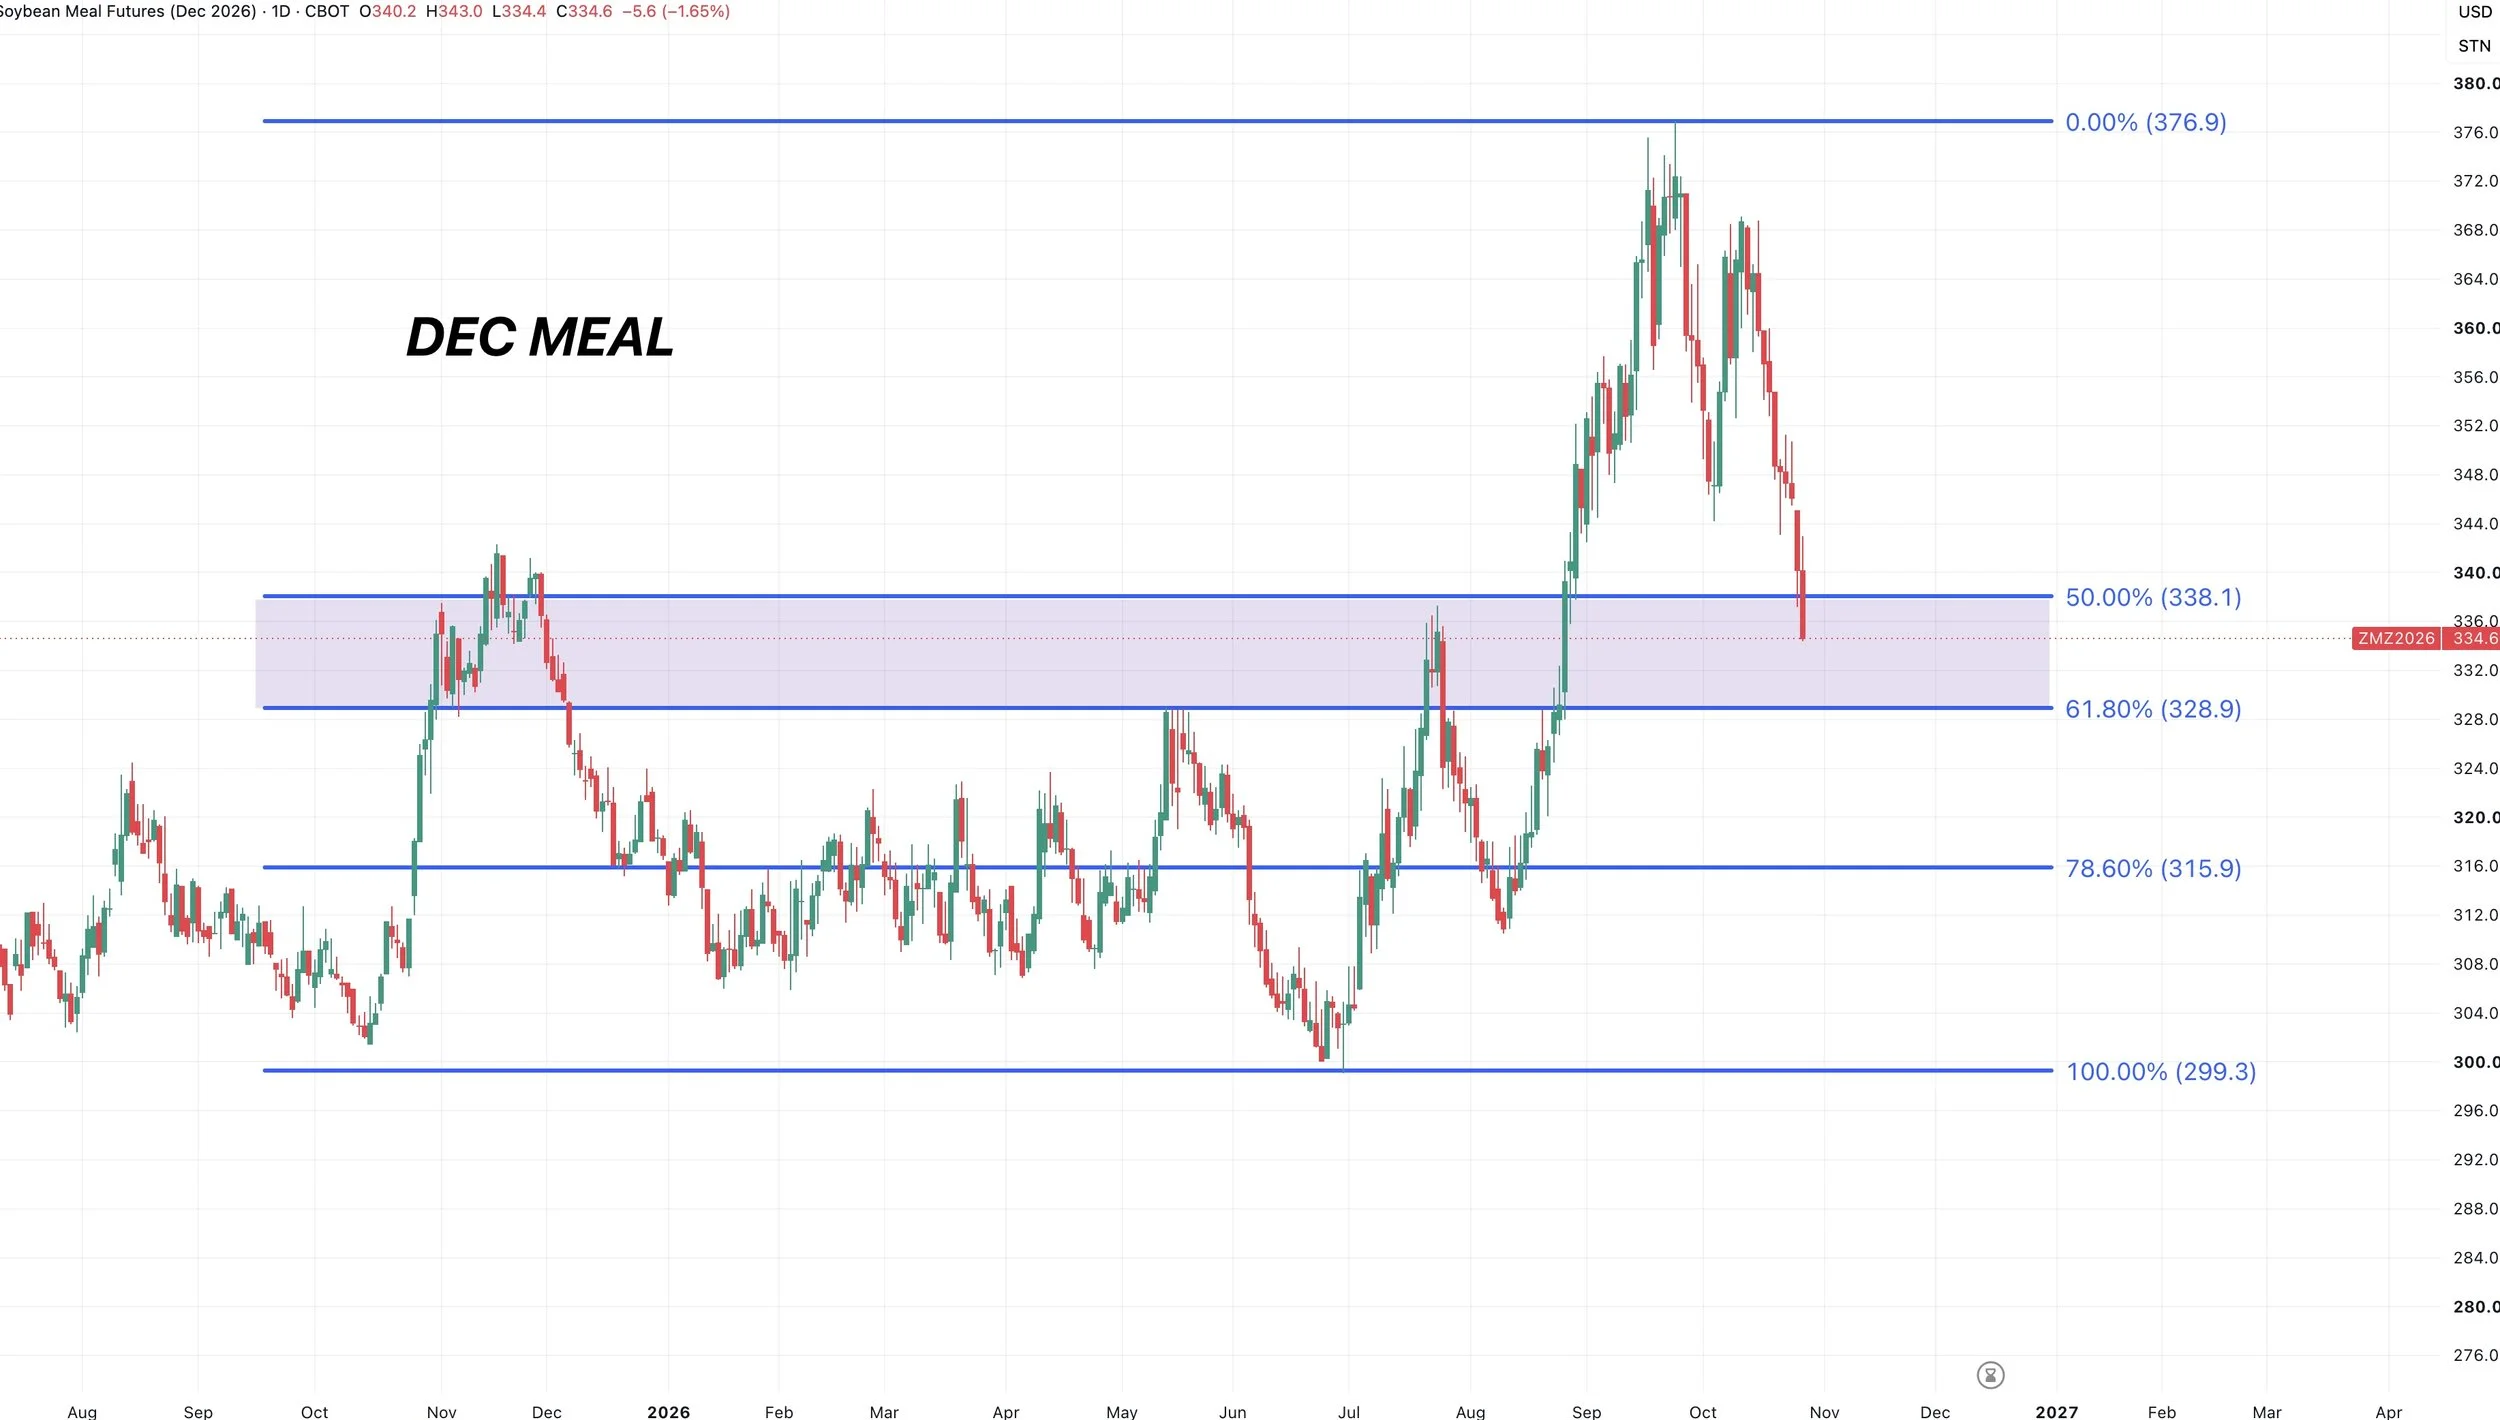
No signs of a bottom in meal yet either.
However meal is quickly approaching a good area of support where you'd expect us to be able to carve out some lows.
The golden zone from contract highs down to contract lows.
This same area re-tests all of the previous highs as well.
Bean Oil:
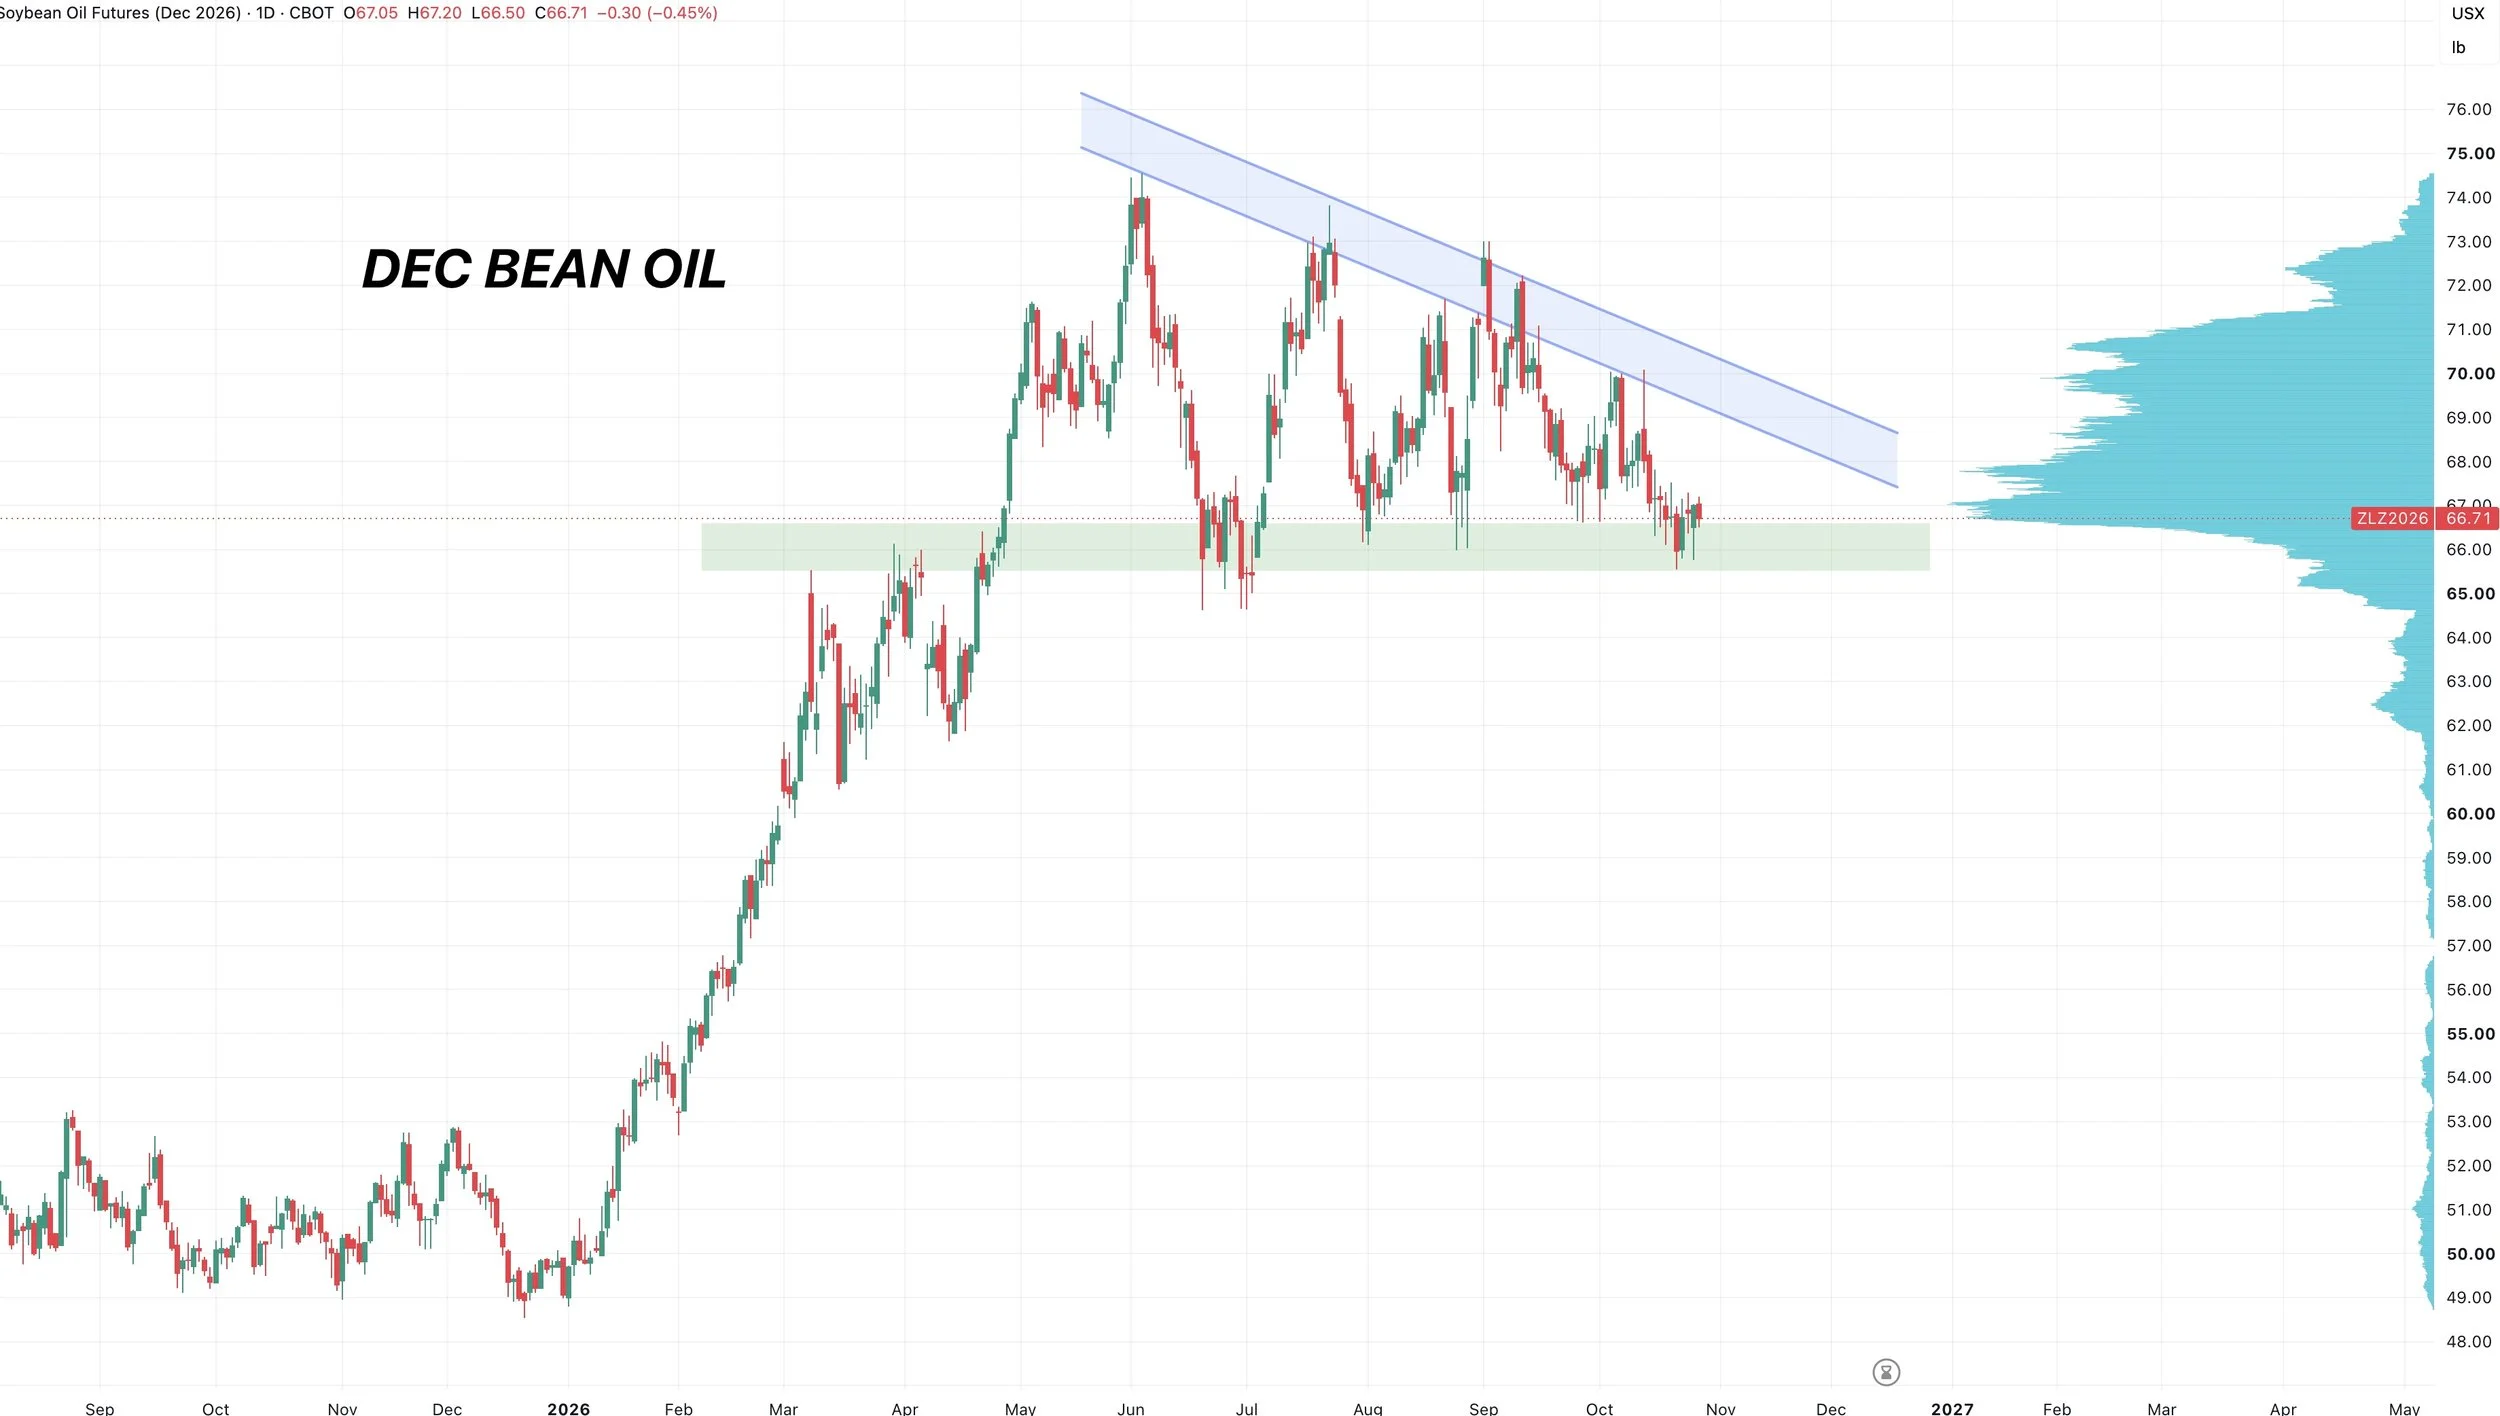
Still consolidating at some big support.
We've held this support zone all year long.
No concerns for bean oil unless we start to break below this range. As there is very little support below.
Wheat
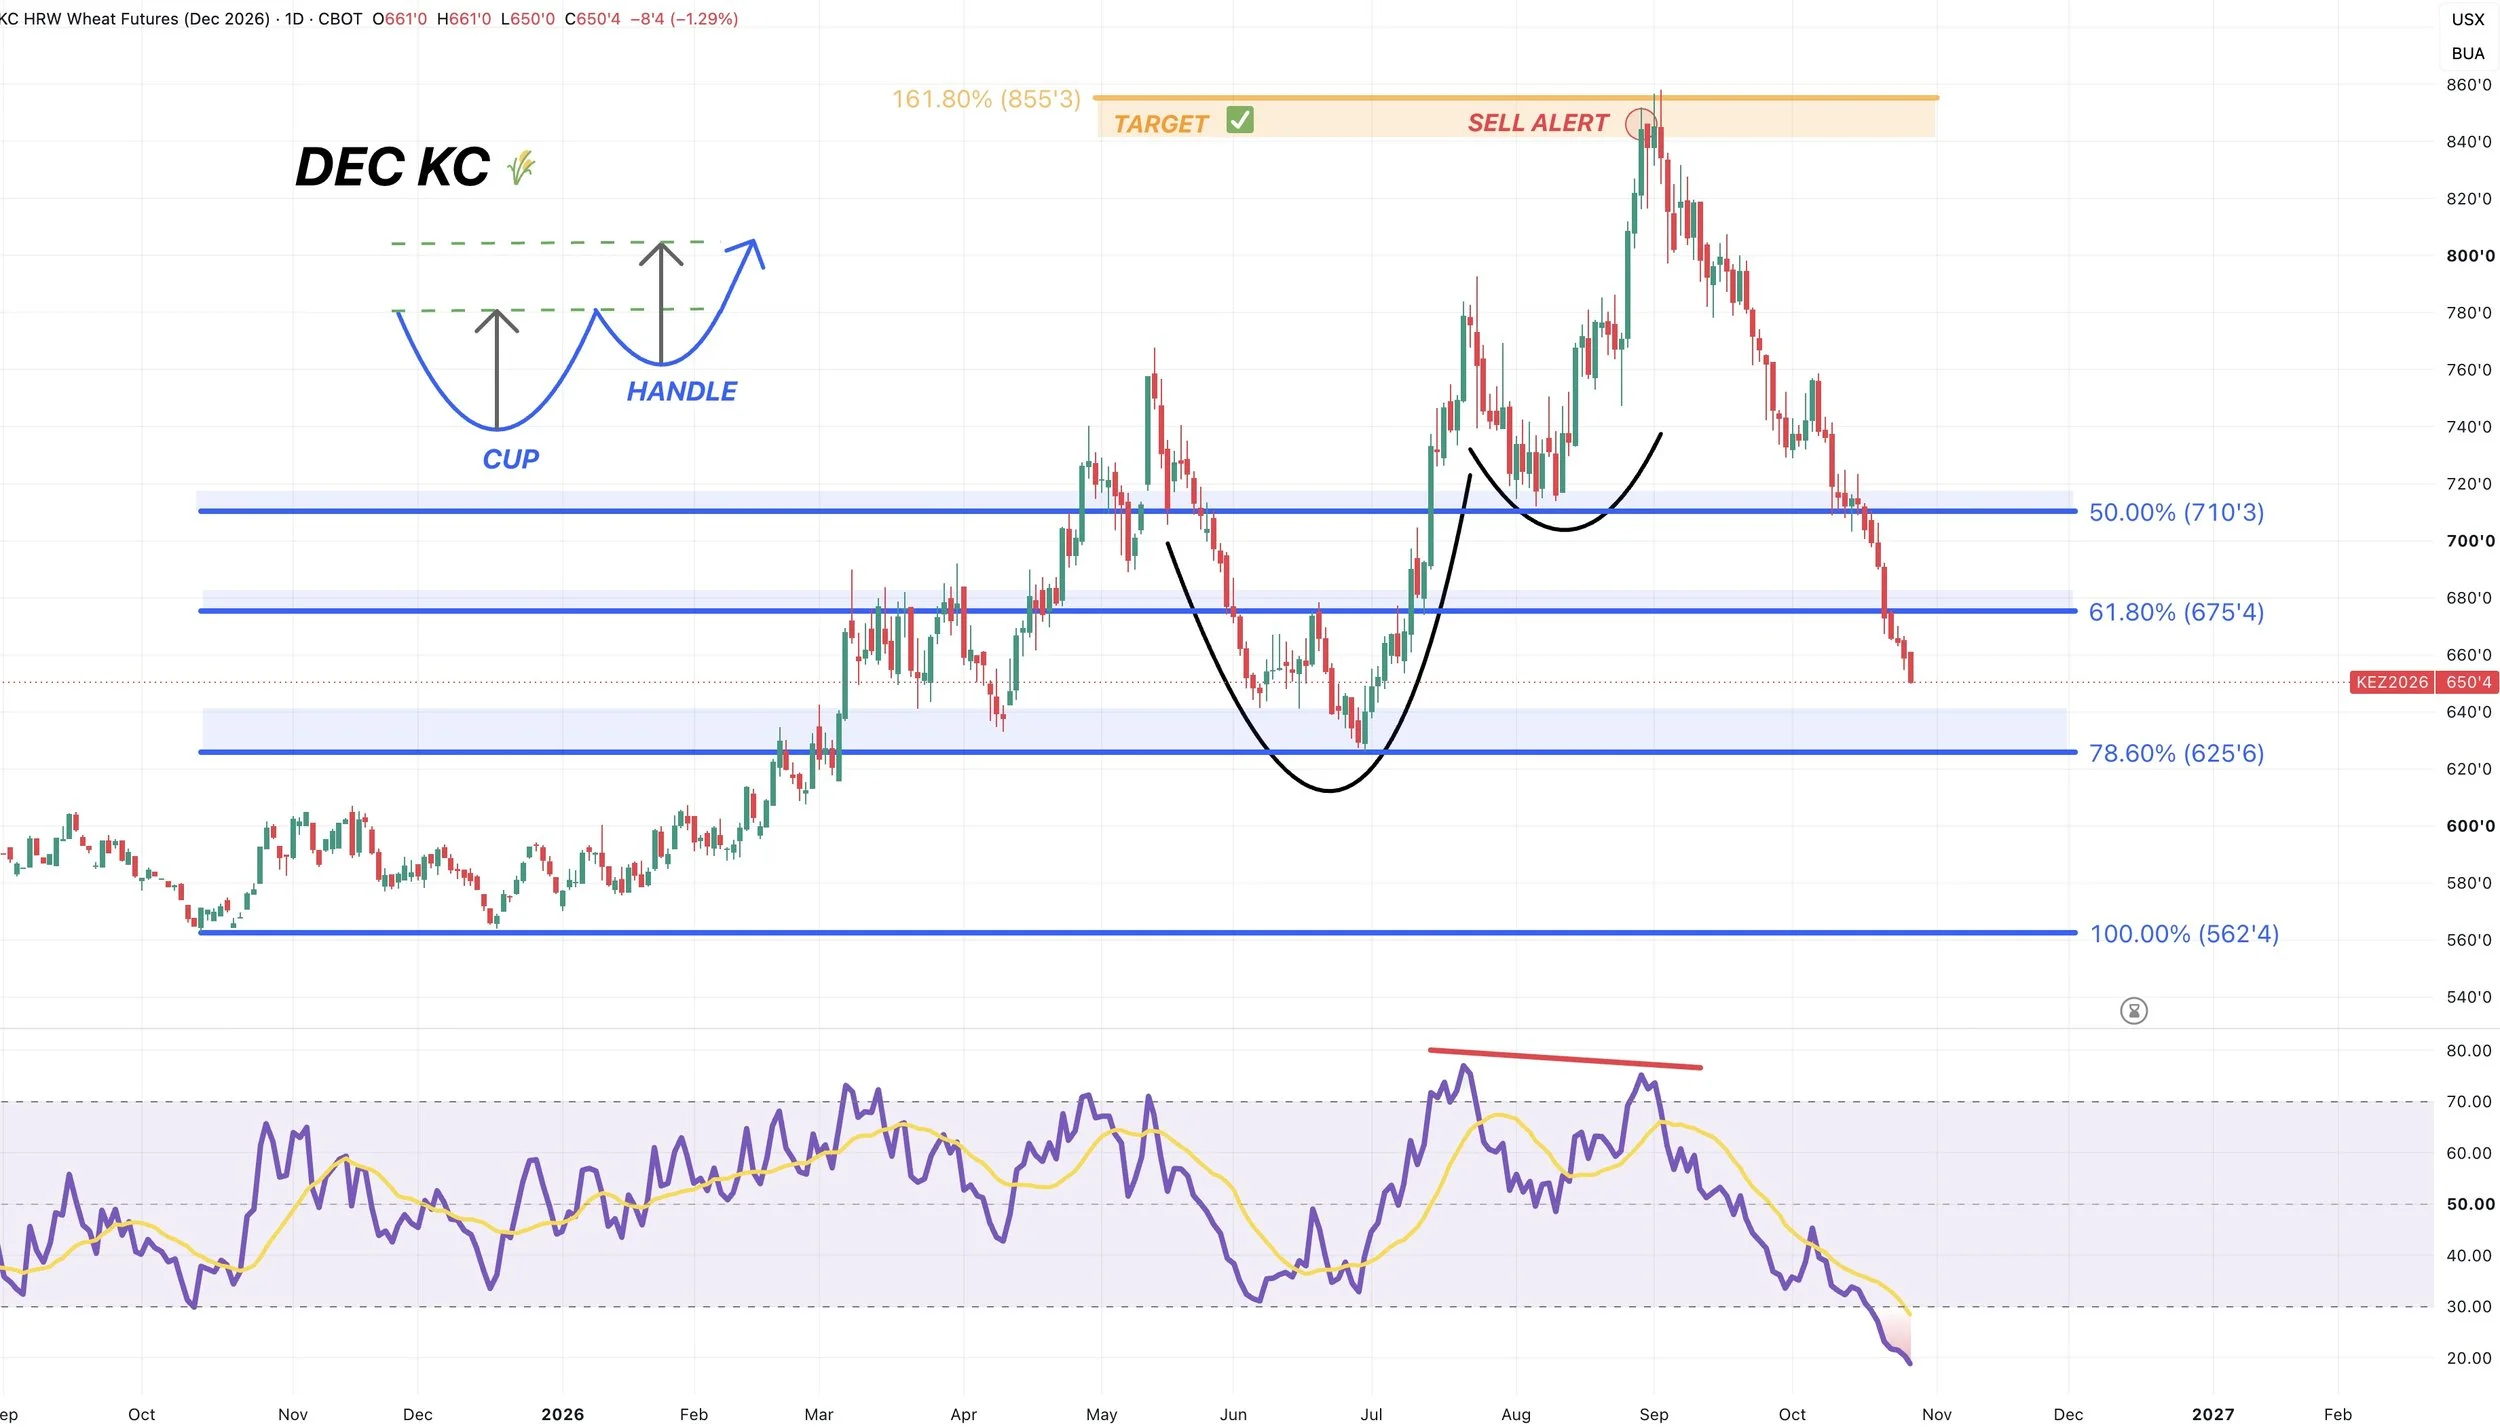
Dec KC Chart:
Long term I think wheat is a sleeper and I view it as undervalued, but this market just continues to struggle to find a reason to go higher here.
We continue to slice and bleed right through every single support. Still no signs of a bottom yet.
The June lows are the last support before contract lows.
We are extremely oversold still. That alone doesn’t confirm a bottom. However, it does mean we'd like to see some sort of bounce or stabilization soon.
Oversold territory is 30 on the RSI.
It currently sits below 19.
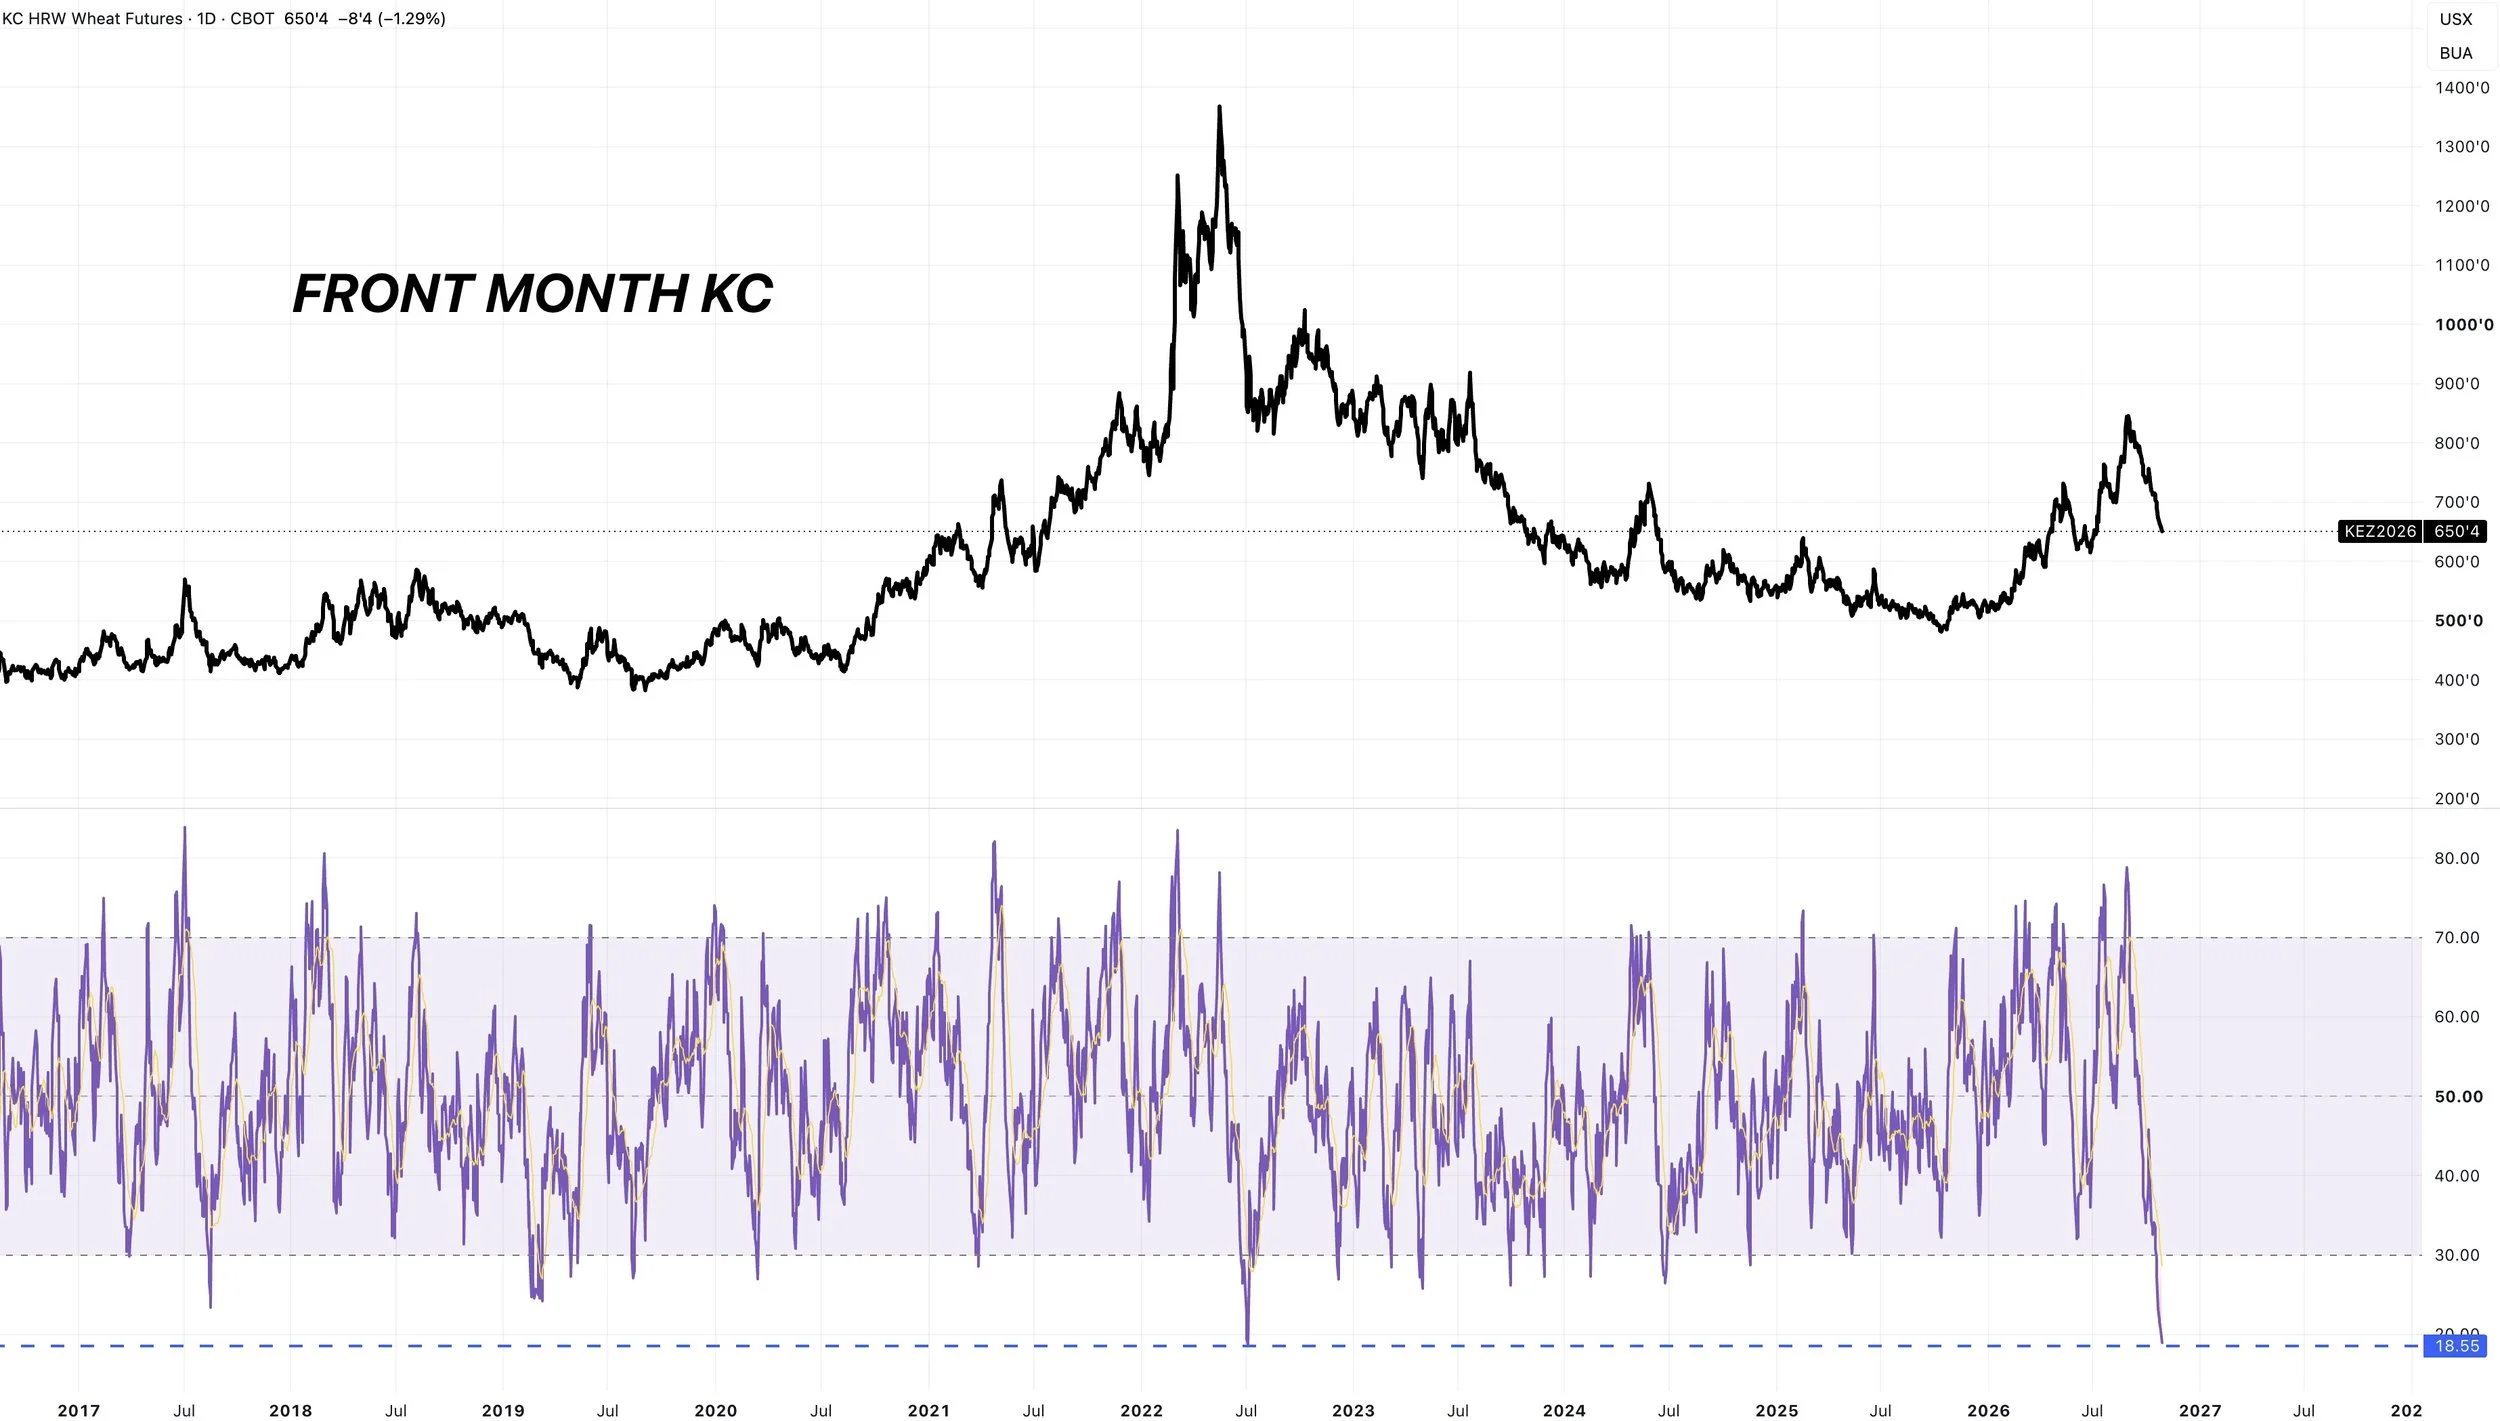
Here is the front month chart just for some reference.
KC wheat is at it's most oversold levels it's been this decade on a front month basis.
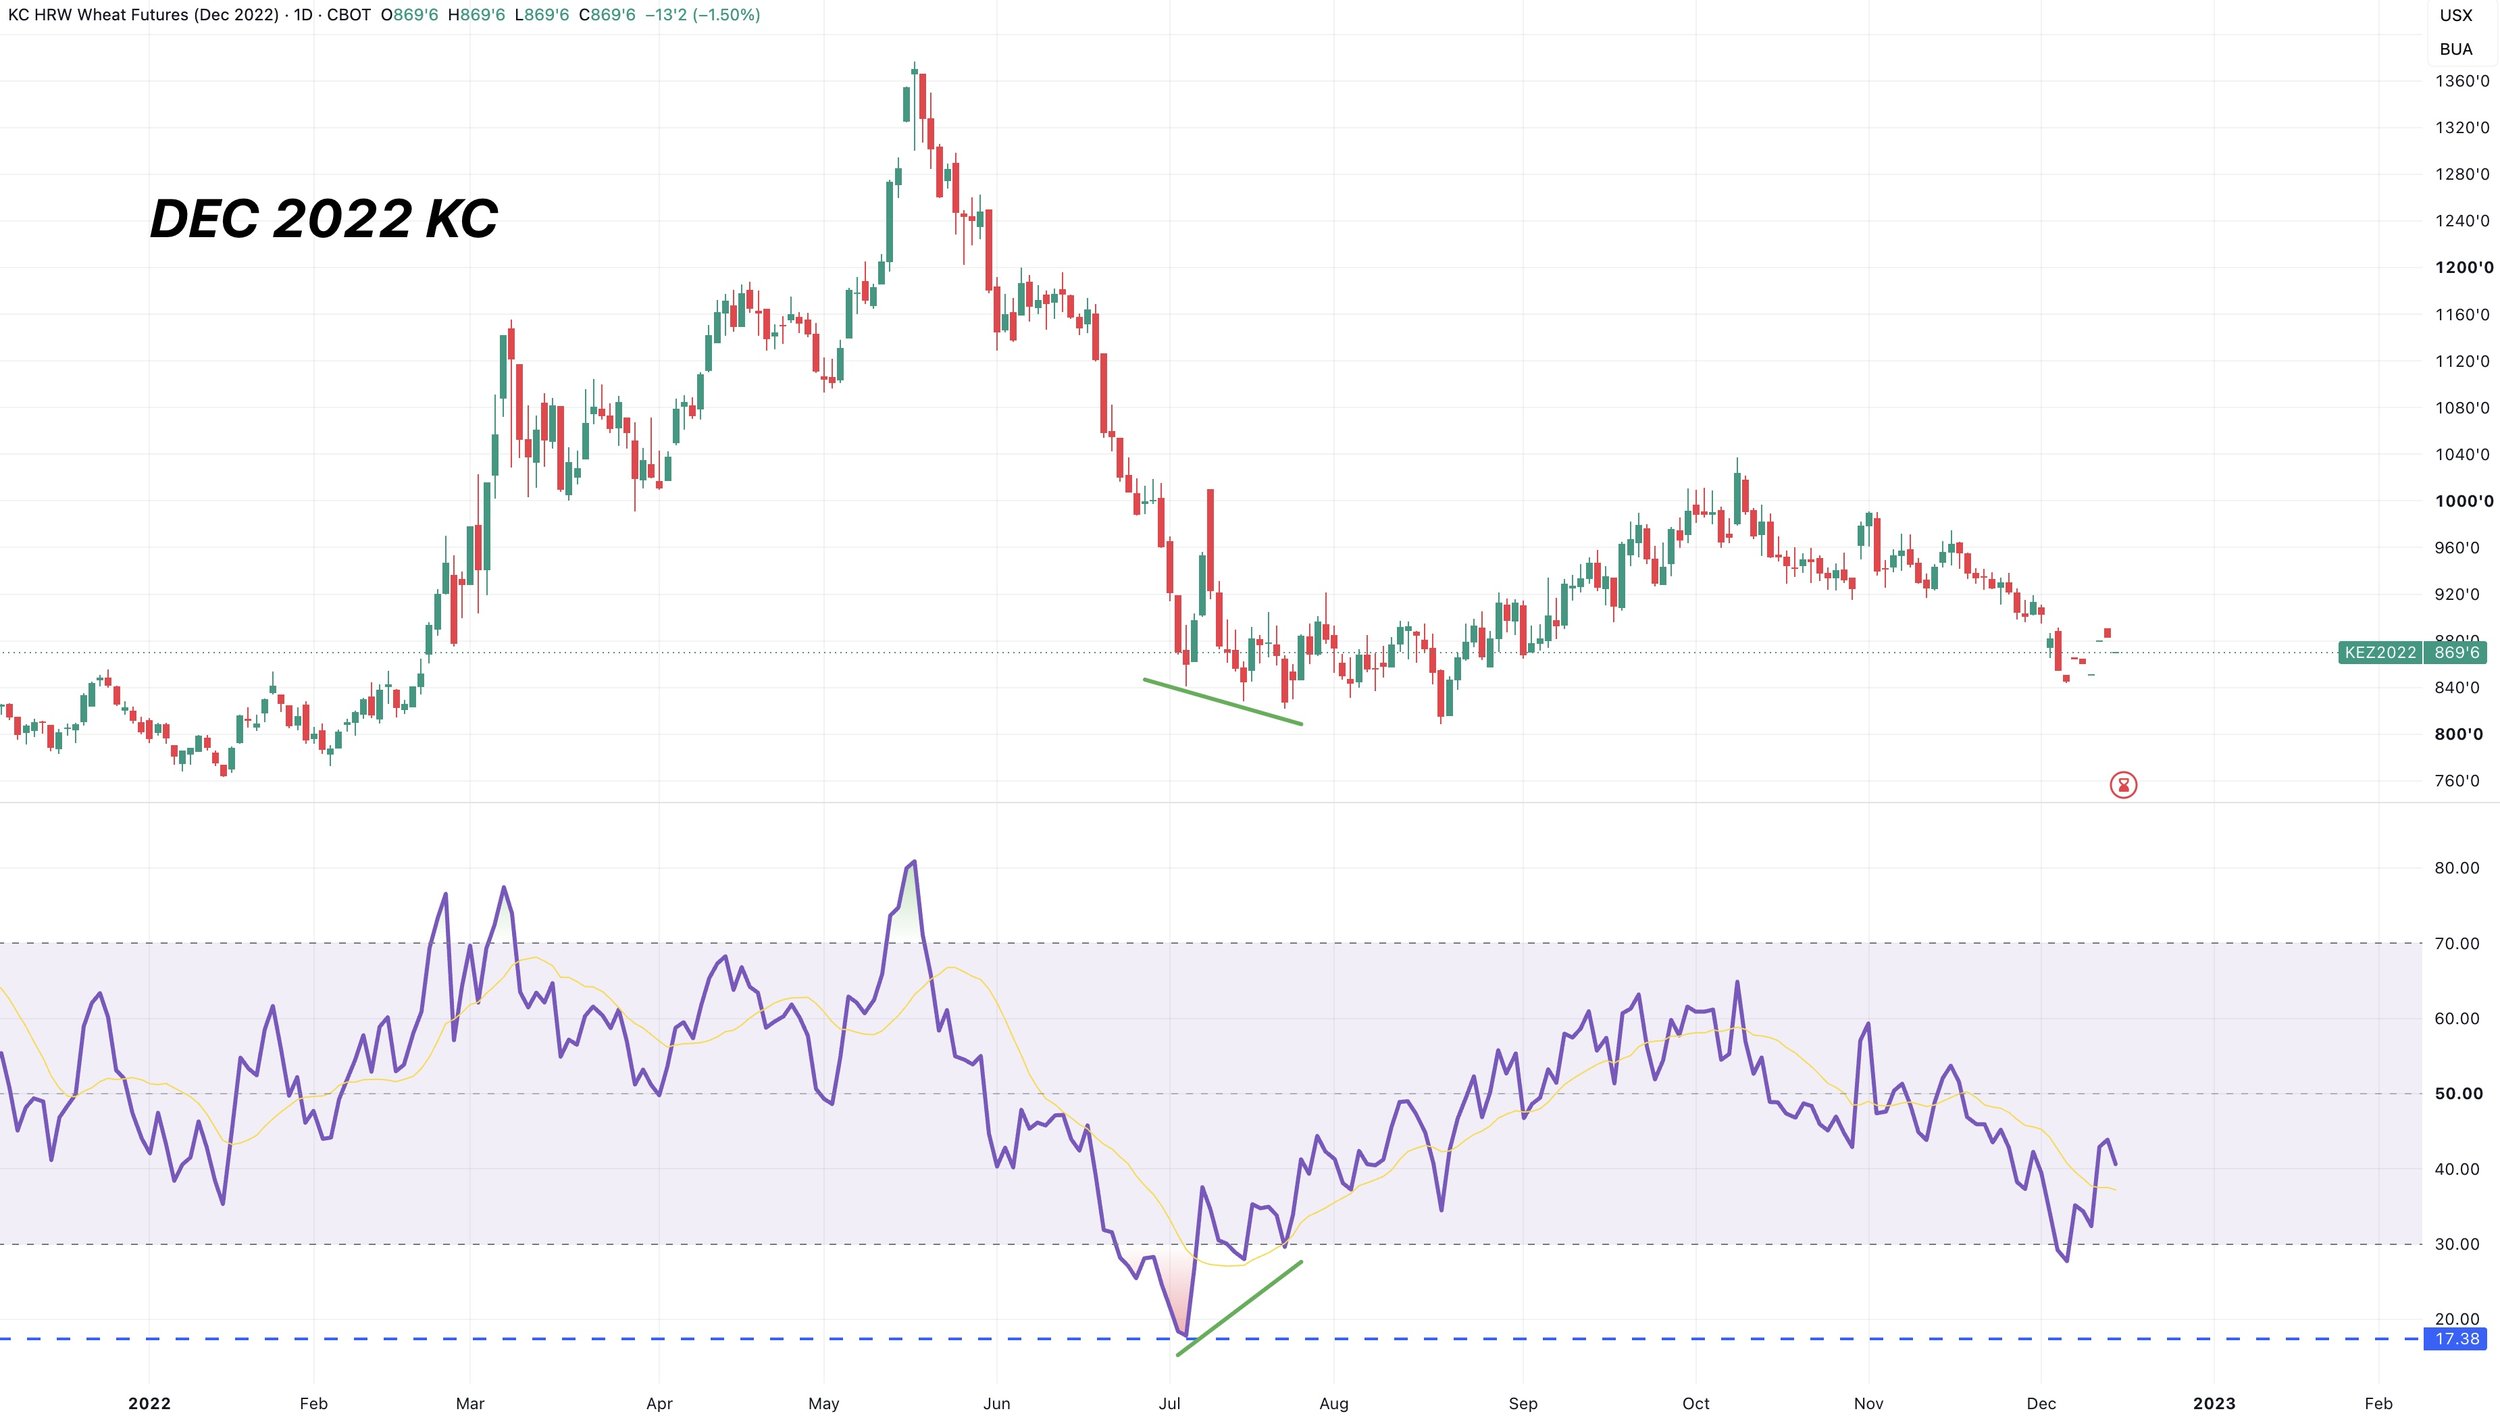
If you look at just the Dec contracts, the last time Dec KC was this oversold was back in 2022.
The market didn’t just pull a 180 and head higher, but it did at least stabilize.
We grinded slightly lower before printing bullish divergence and putting together a nice rally.
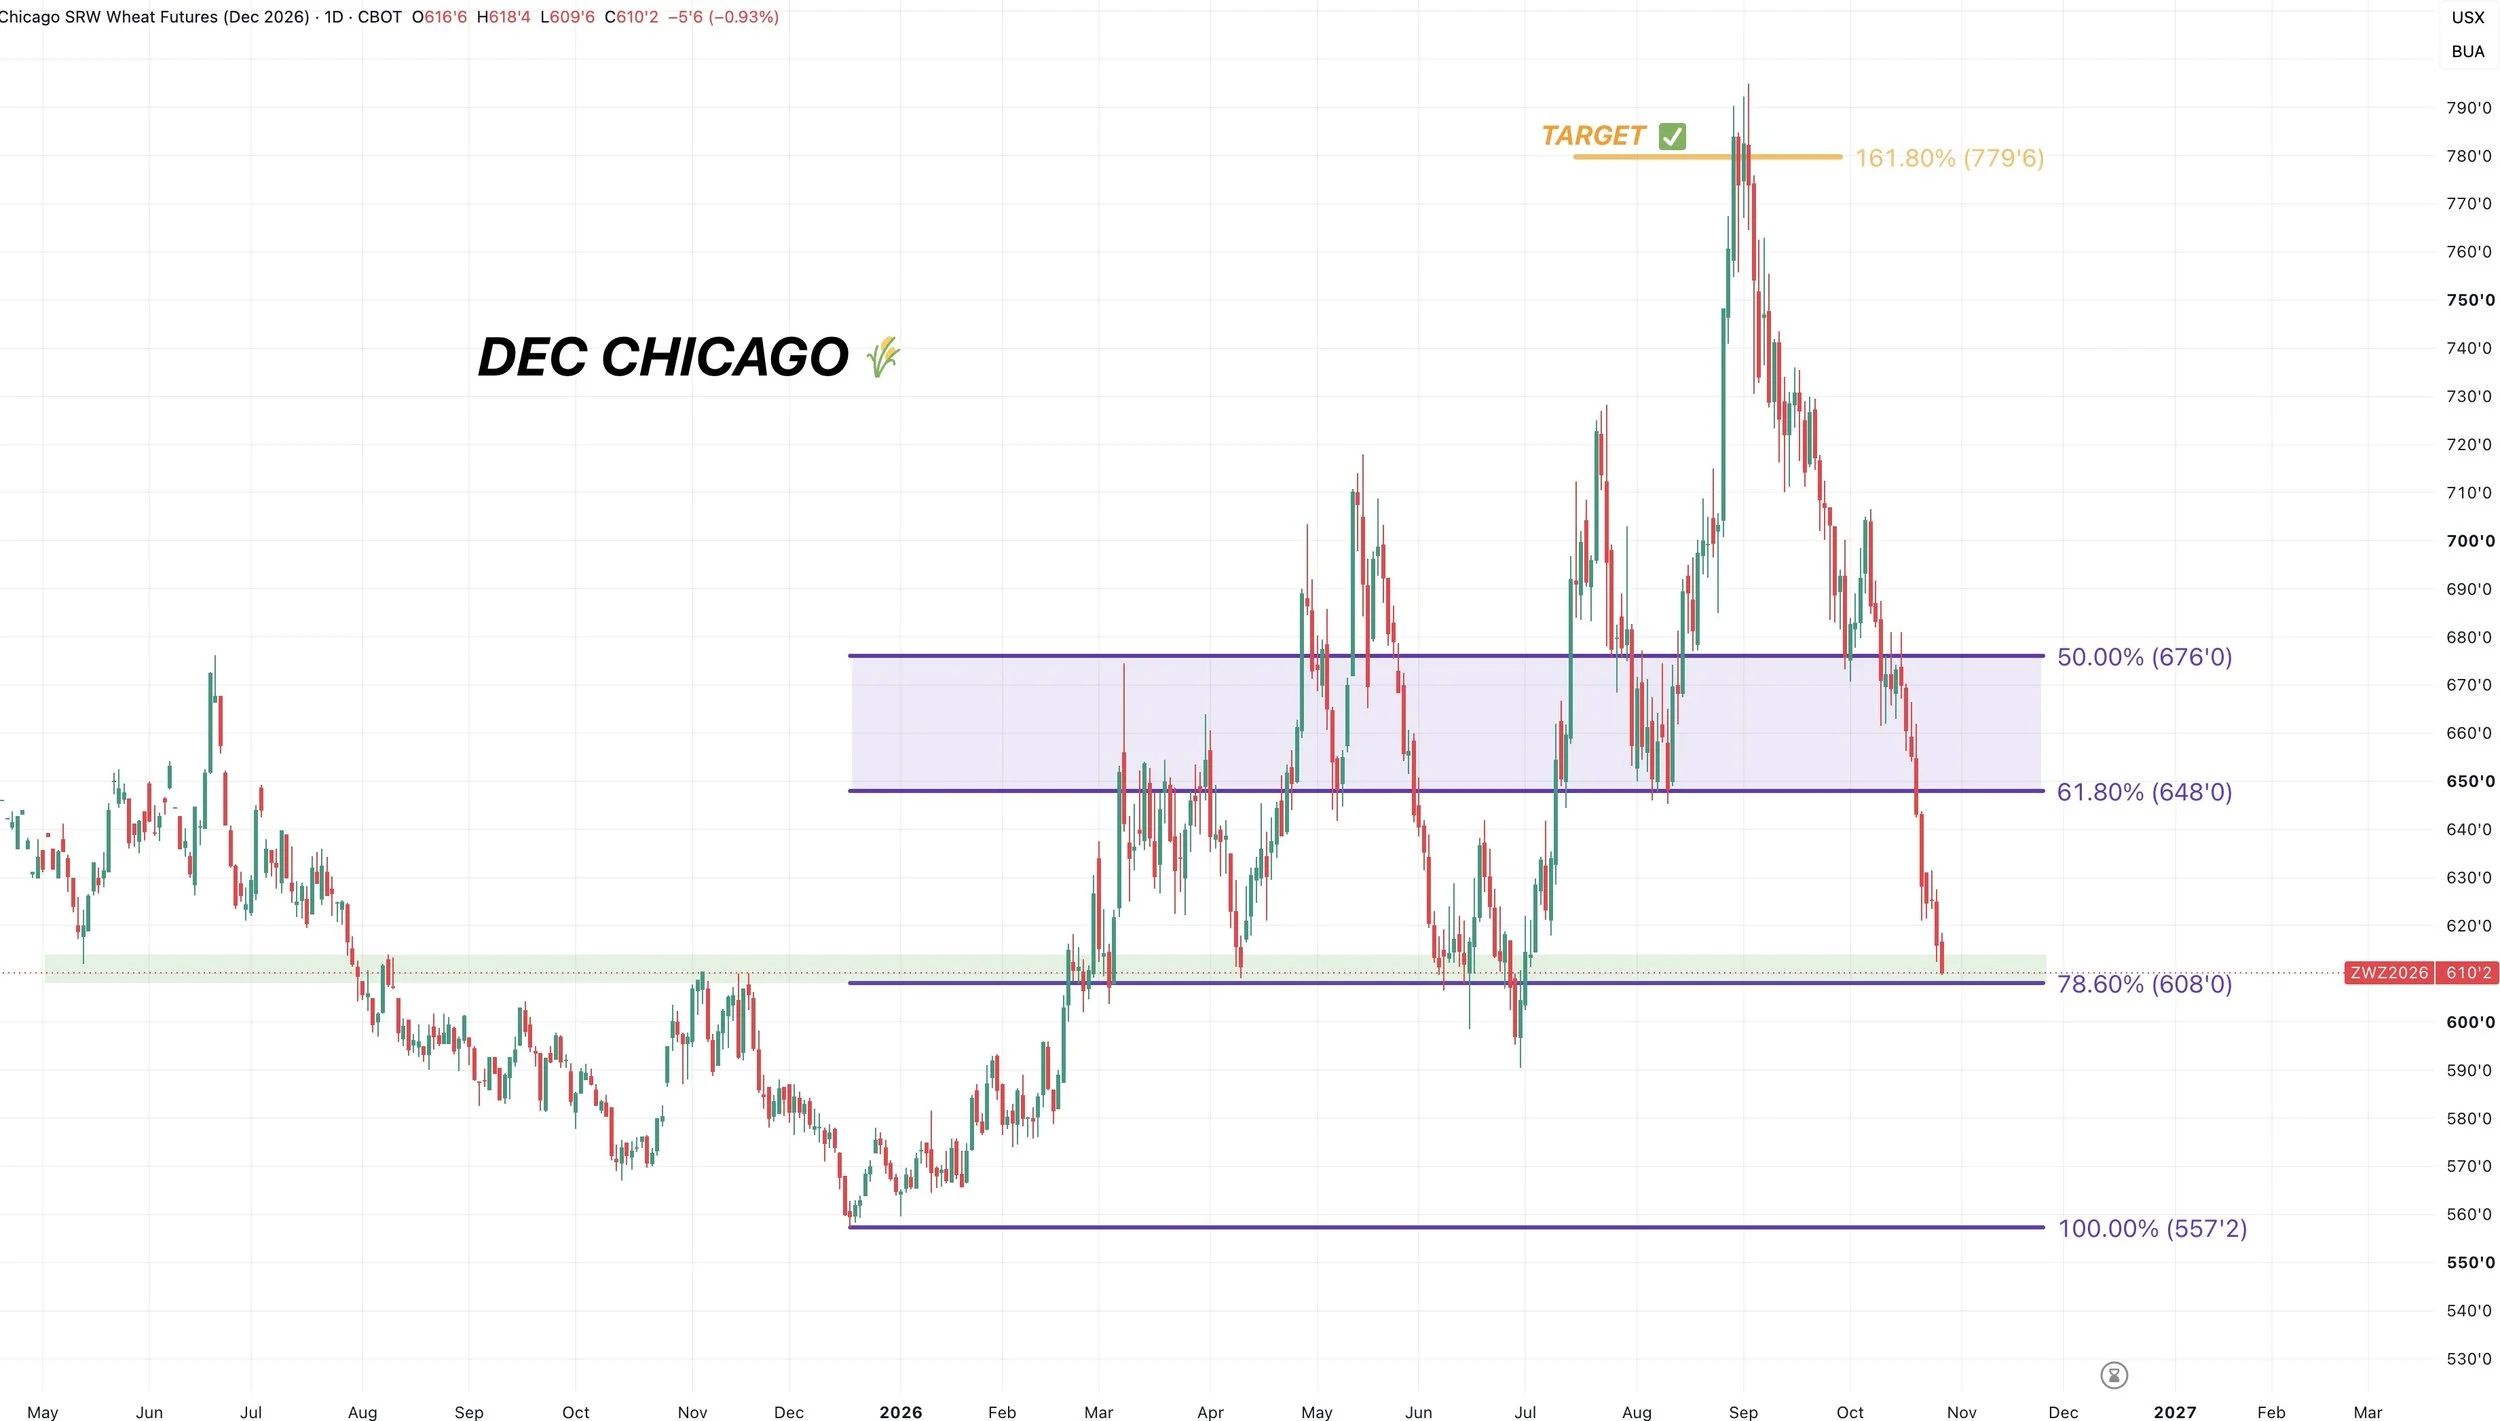
Dec Chicago Wheat Chart:
Chicago also continues to free fall and slice right through every single support.
We are sitting at pretty much our last level of support here. As this is really the last big support between here and contract lows.
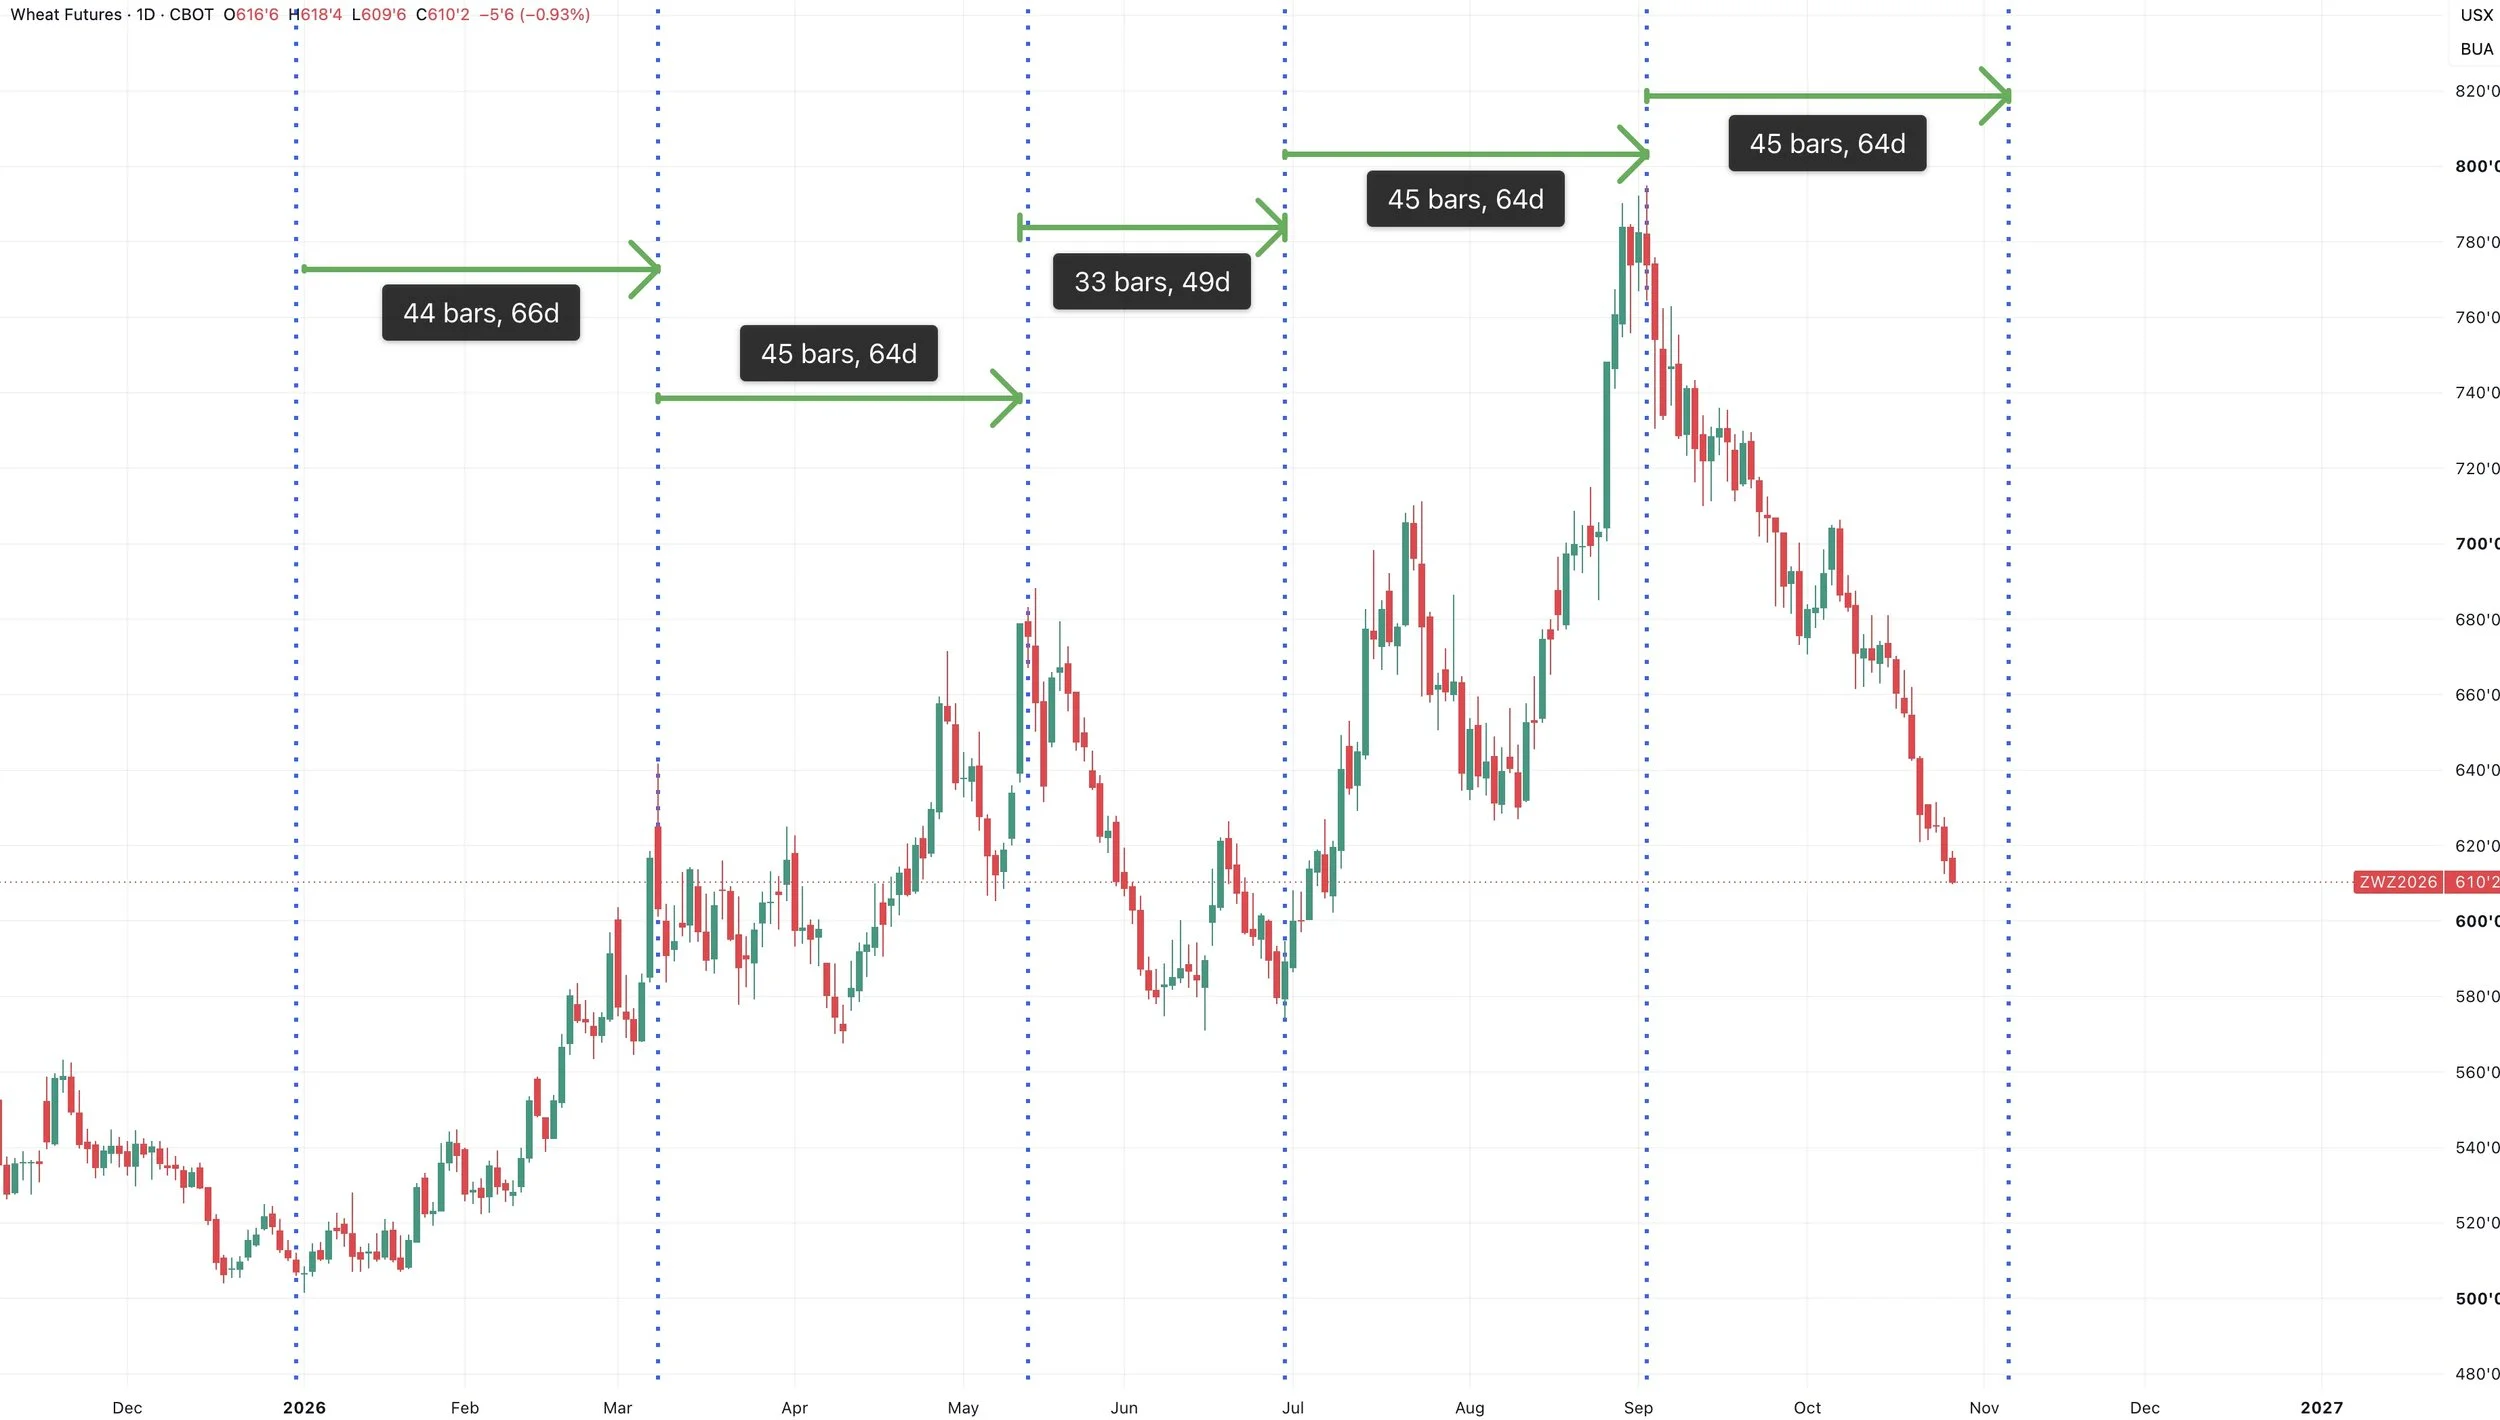
2-Month Pivots?
One last interesting thing I wanted to throw in here was this.
Roughly every 45 trading days has been a pivot in this market.
Currently we are around 40 trading days into the sell off.
This might not mean anything at all, but the timing is pretty interesting.
Cattle
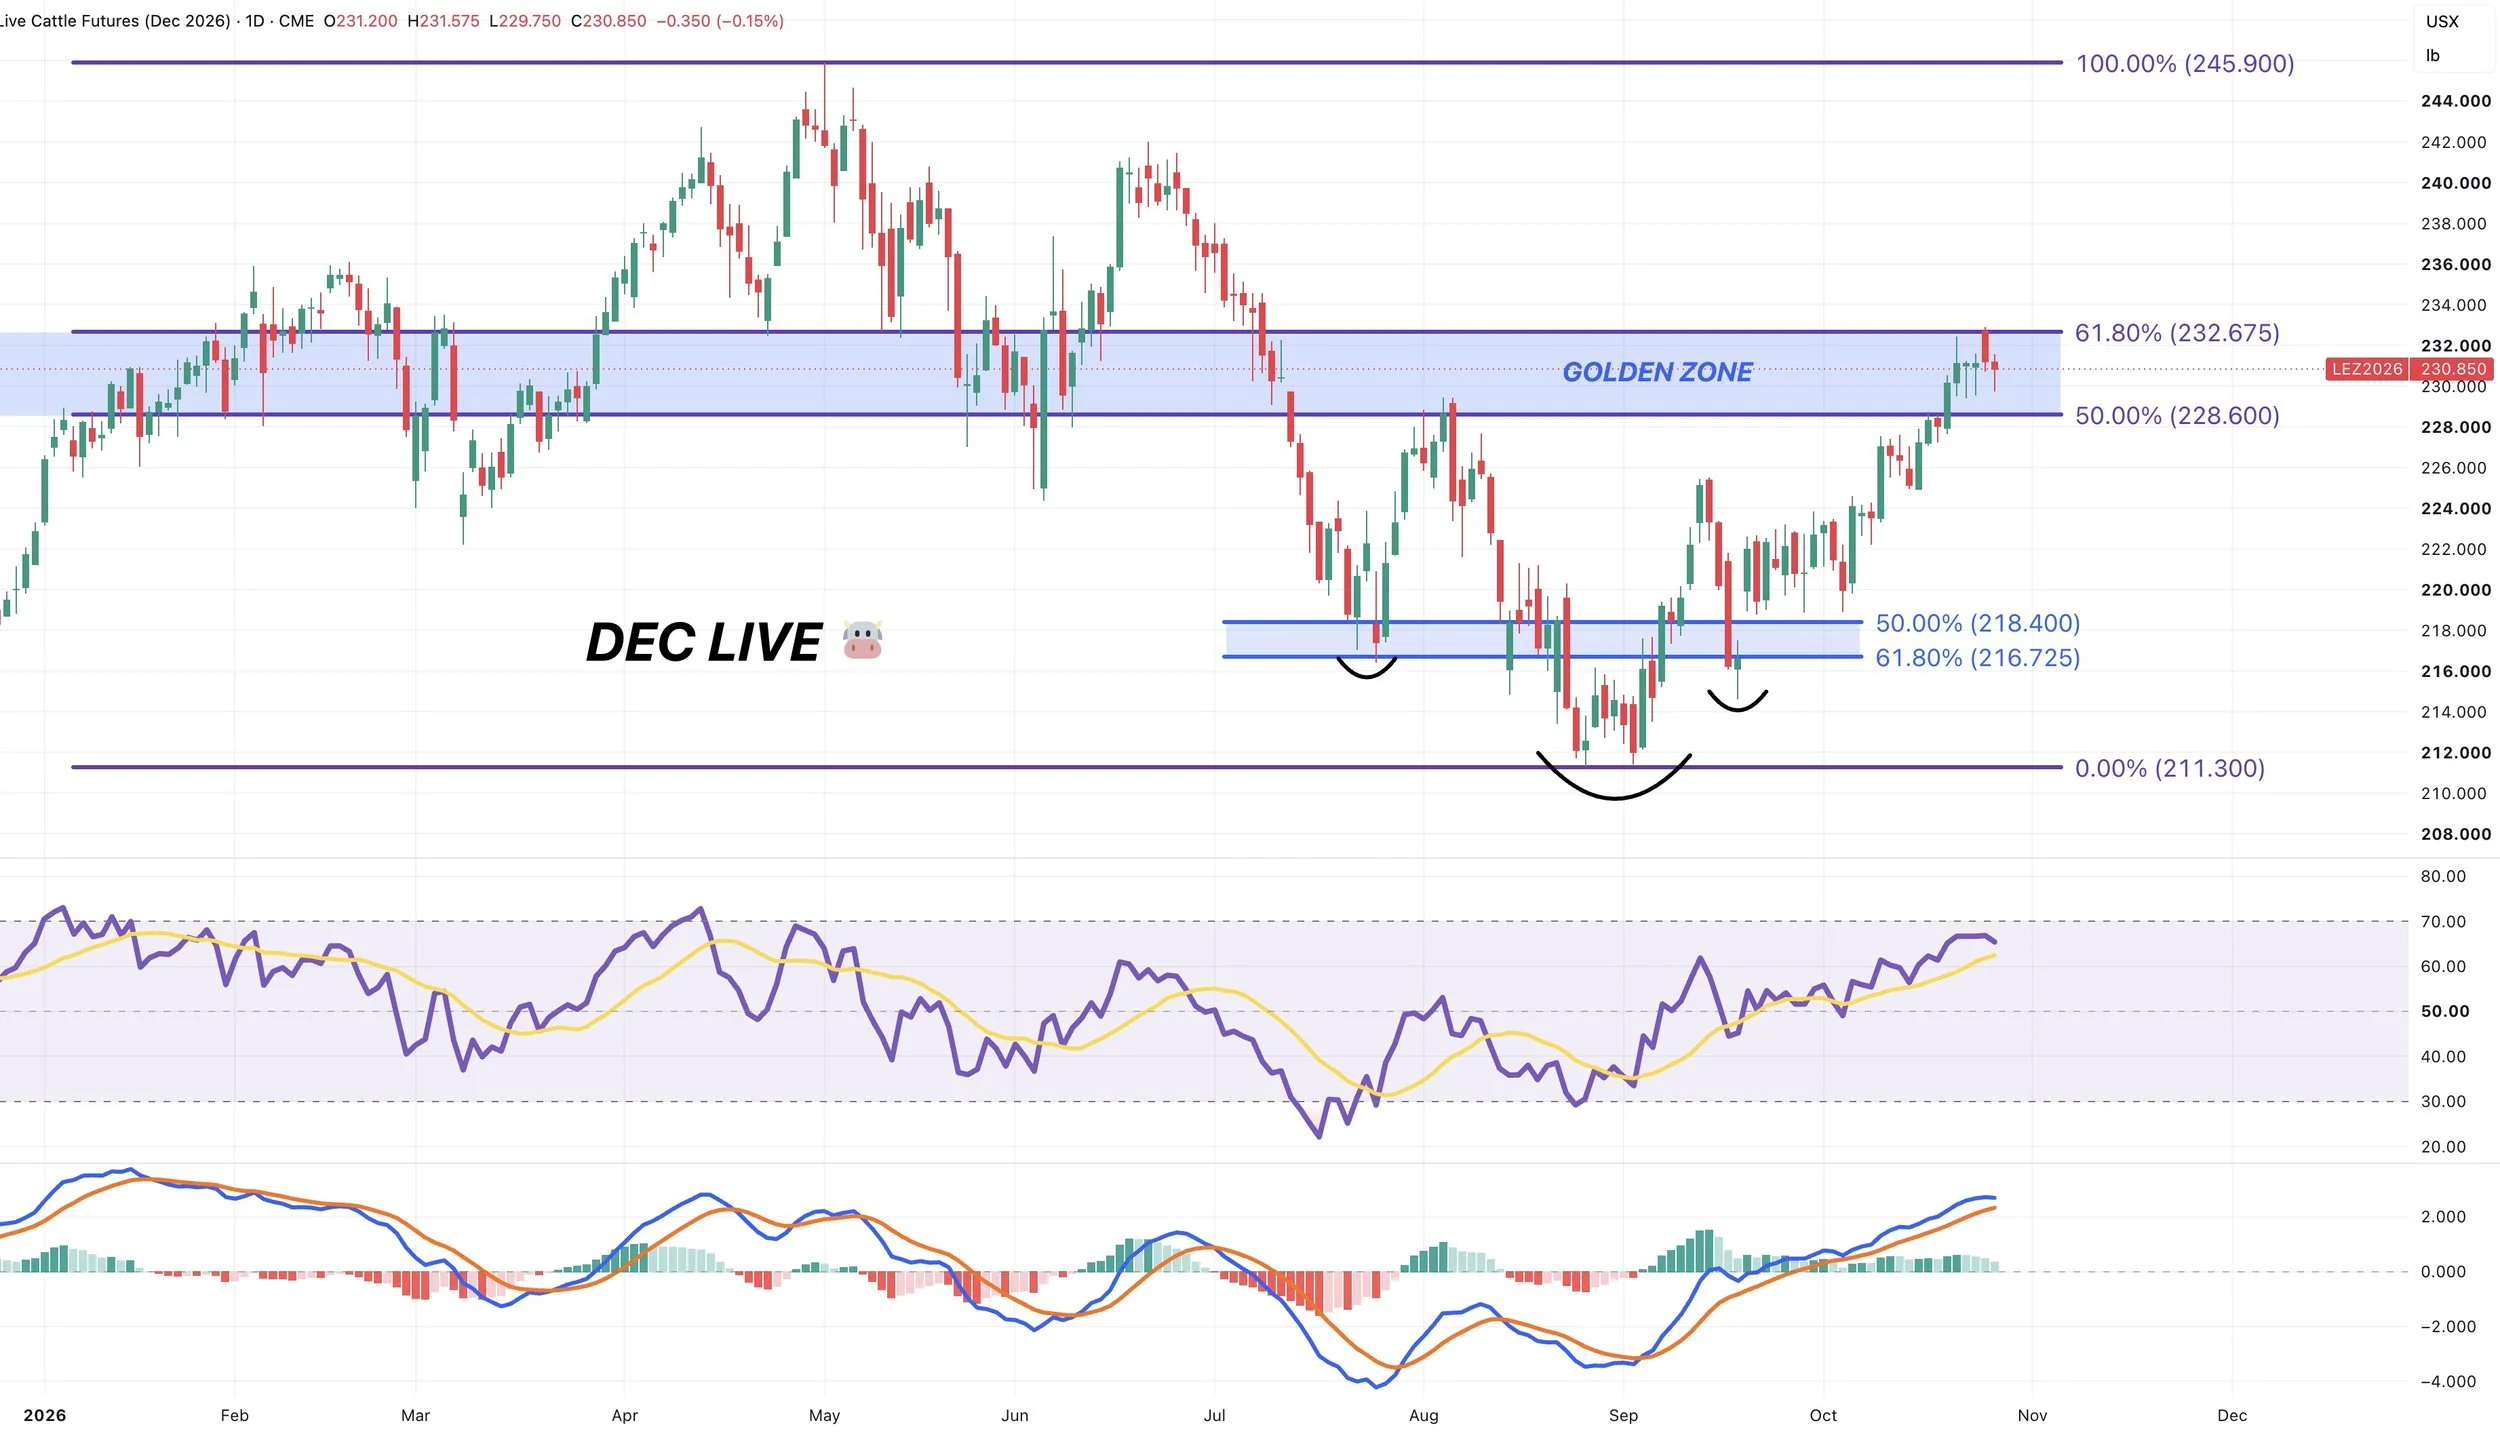
Dec Live:
Not a ton to update on cattle.
Dec cattle perfectly hit the 61.8% retracement to the contract highs.
If a market is going to stall out, this would be a very common spot for it to happen.
It doesn’t mean we "have" to. But I think it makes sense to defend these levels if you have not yet.
This market is also starting to get pretty overbought and momentum looks like it may be starting to slow down up here.
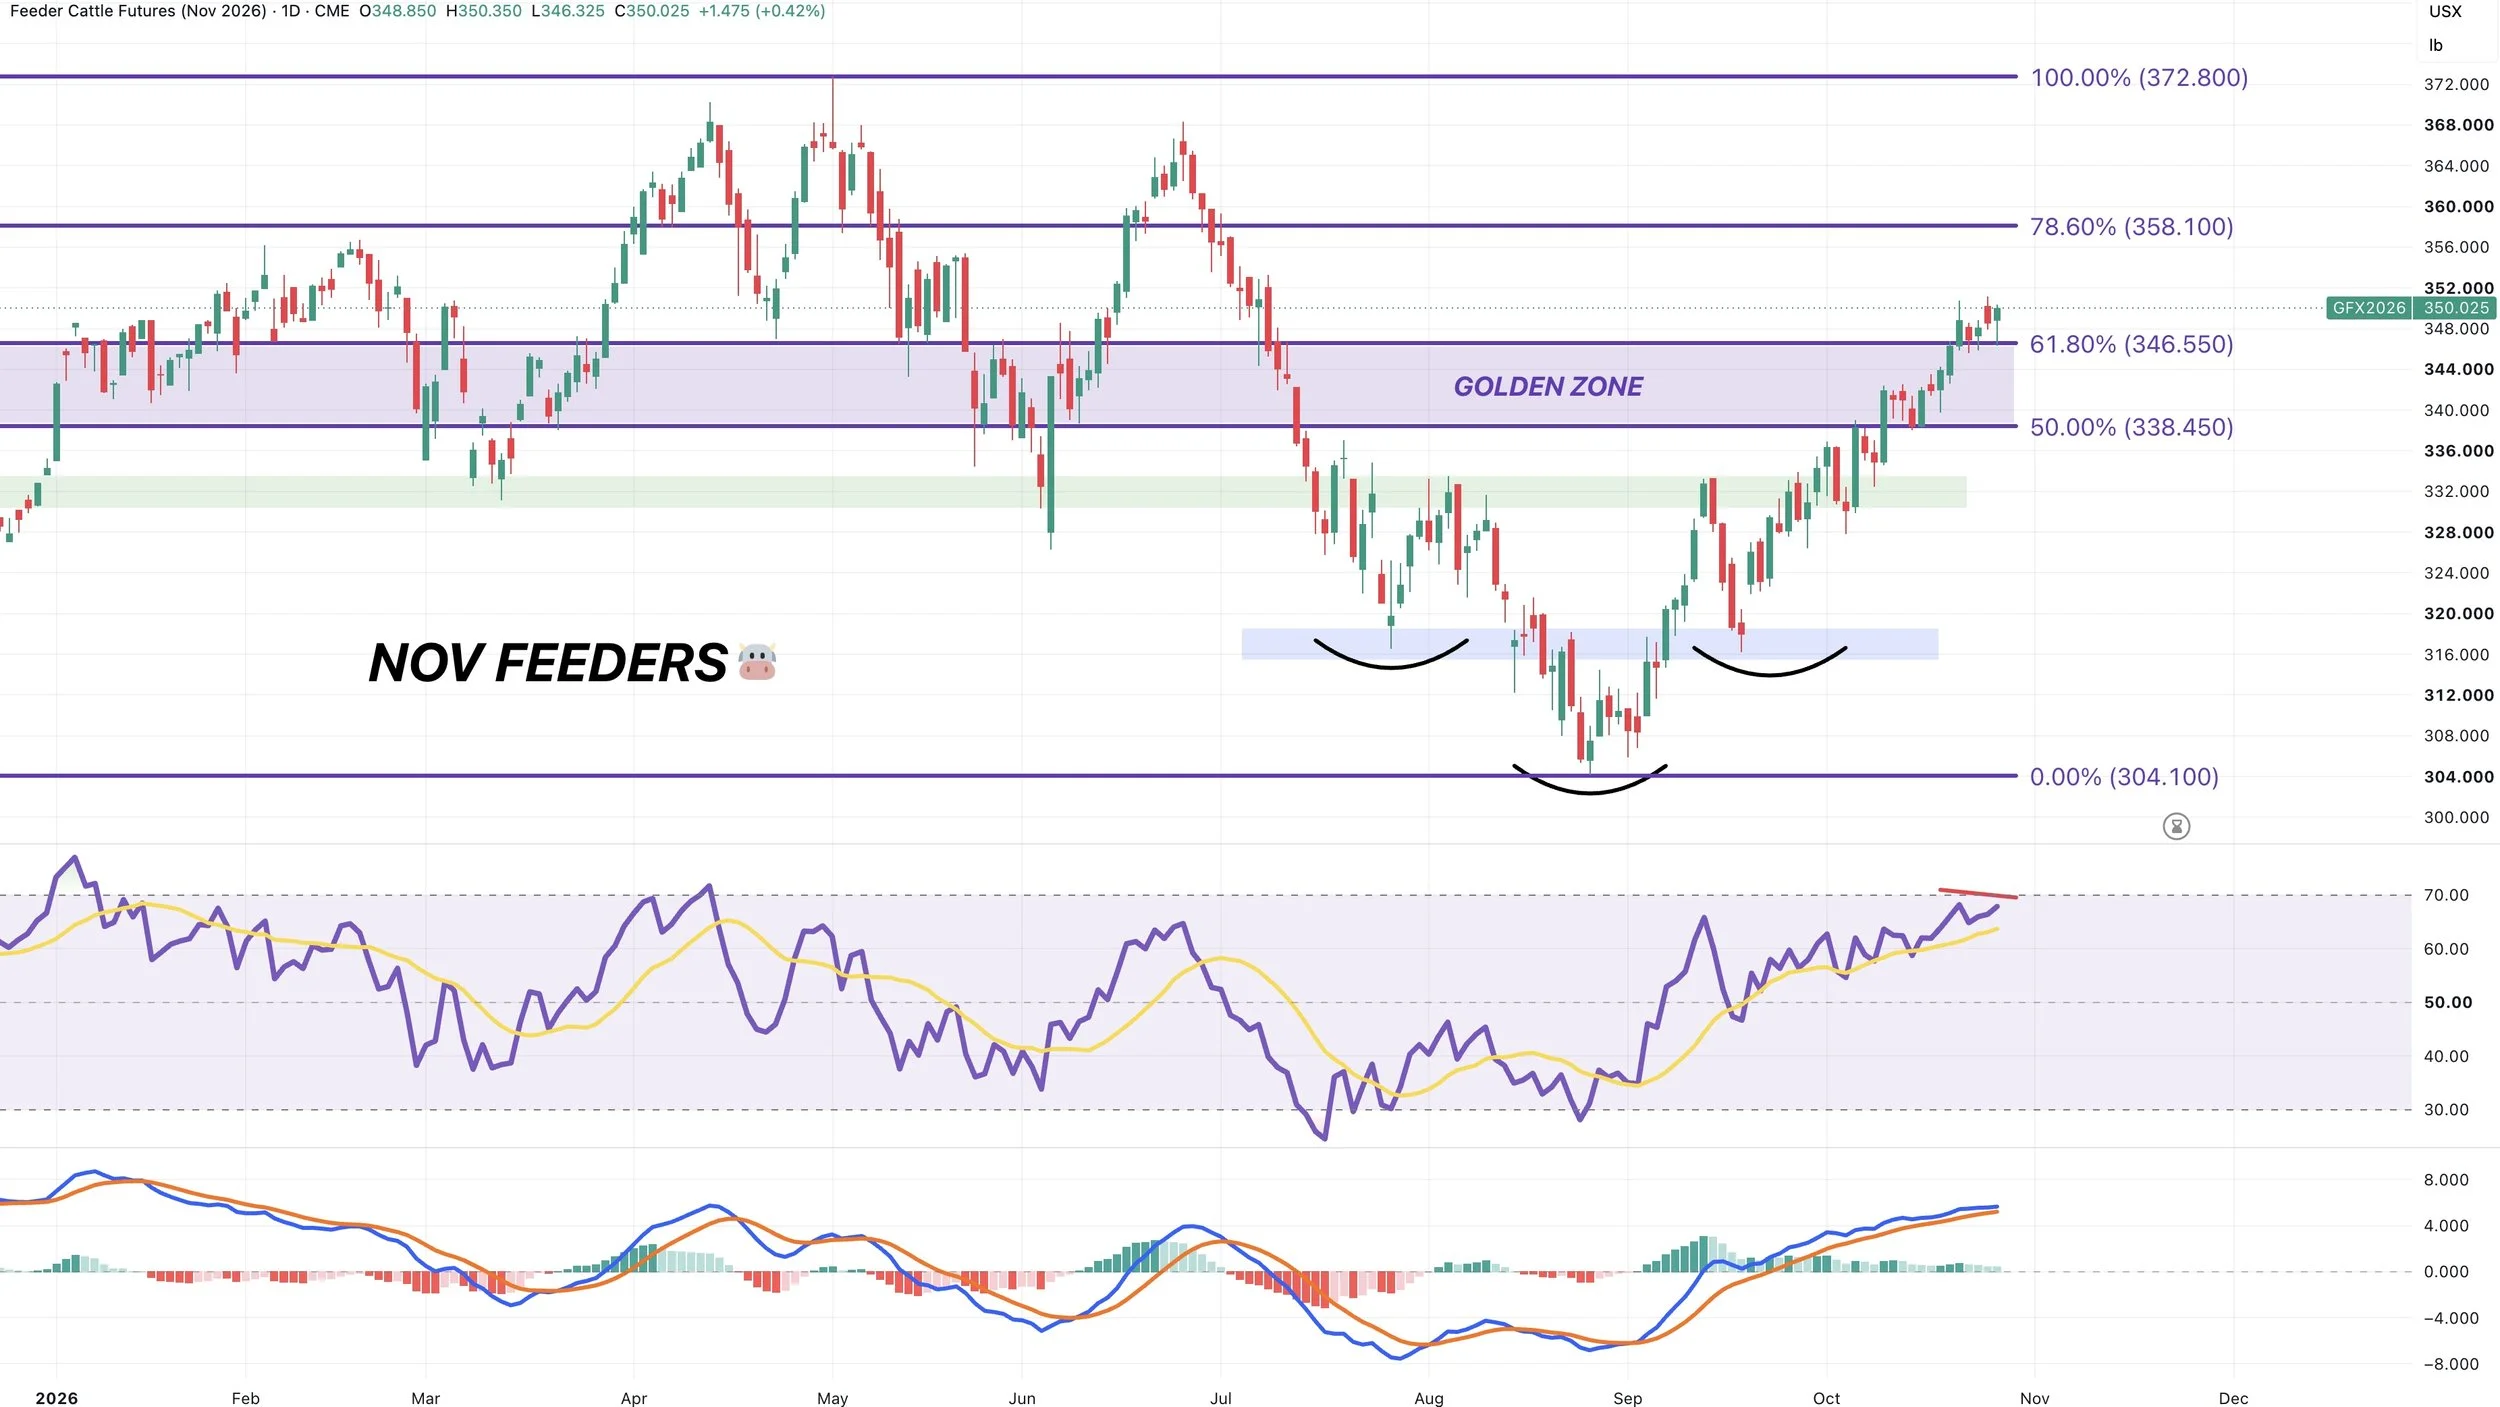
Nov Feeders Chart:
Feeders have been stronger than live, as a result we slightly pushed past that target.
But like in live, I view this as an area to manage your risk.
The last few times this market has been this overbought, it has been a good time to protect.
The MACD looks like it may start to cross bearish as well. Suggesting potential weaker momentum.
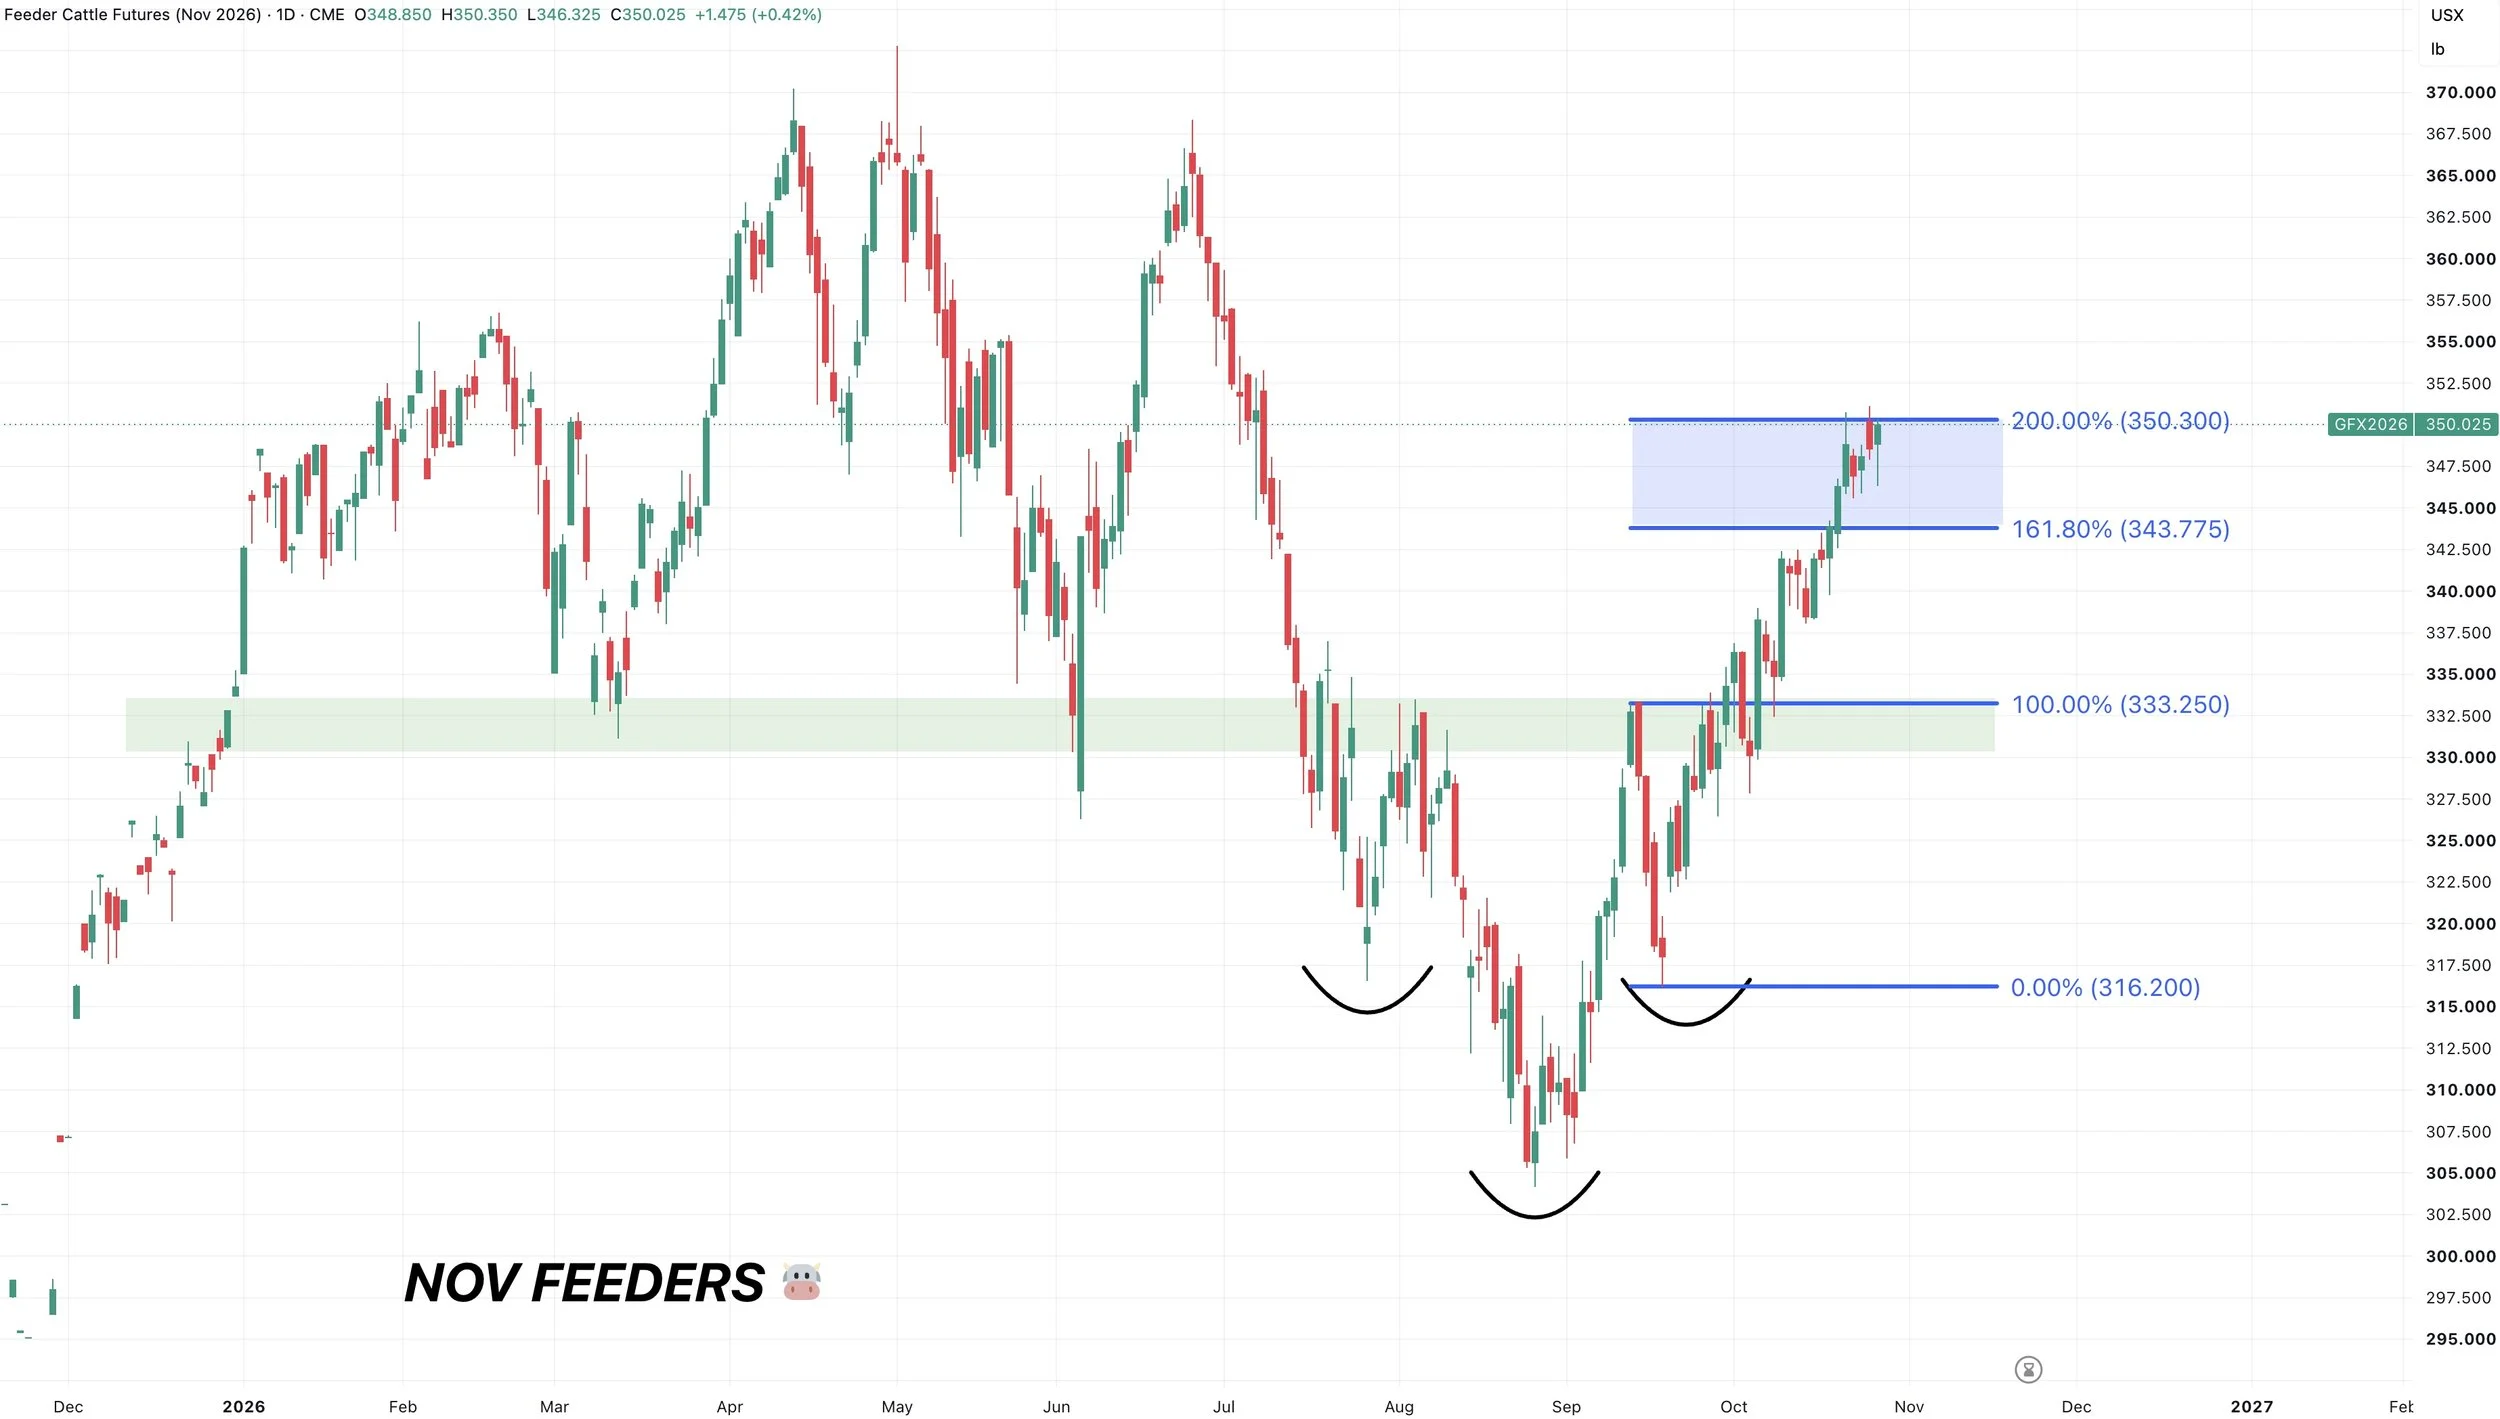
Feeders also hit the 200% fib extension from the first rally off the lows.
Just another reason I like defending these levels if you have not.
Want to Talk?
Our phones are open 24/7 for you guys if you ever need anything or want to discuss your operation.
Jeremey & Office: (806)484-1214
Sebastian: (605)280-1186
Email: sfrost@dailymarketminute.com
Hedge Account
Interested in a hedge account? Use the link below to set up an account or give us a call.