
CHARTS, TARGETS & MORE
MARKET UPDATE
You can scroll to read the usual update as well. As the written version is the exact same as the video.
Timestamps for video:
Overview: 0:00min
Corn: 2:40min
Beans: 8:30min
Wheat: 11:35min
Cattle: 12:30min
Want to talk?
Office: (806)484-1214
Futures Prices Close
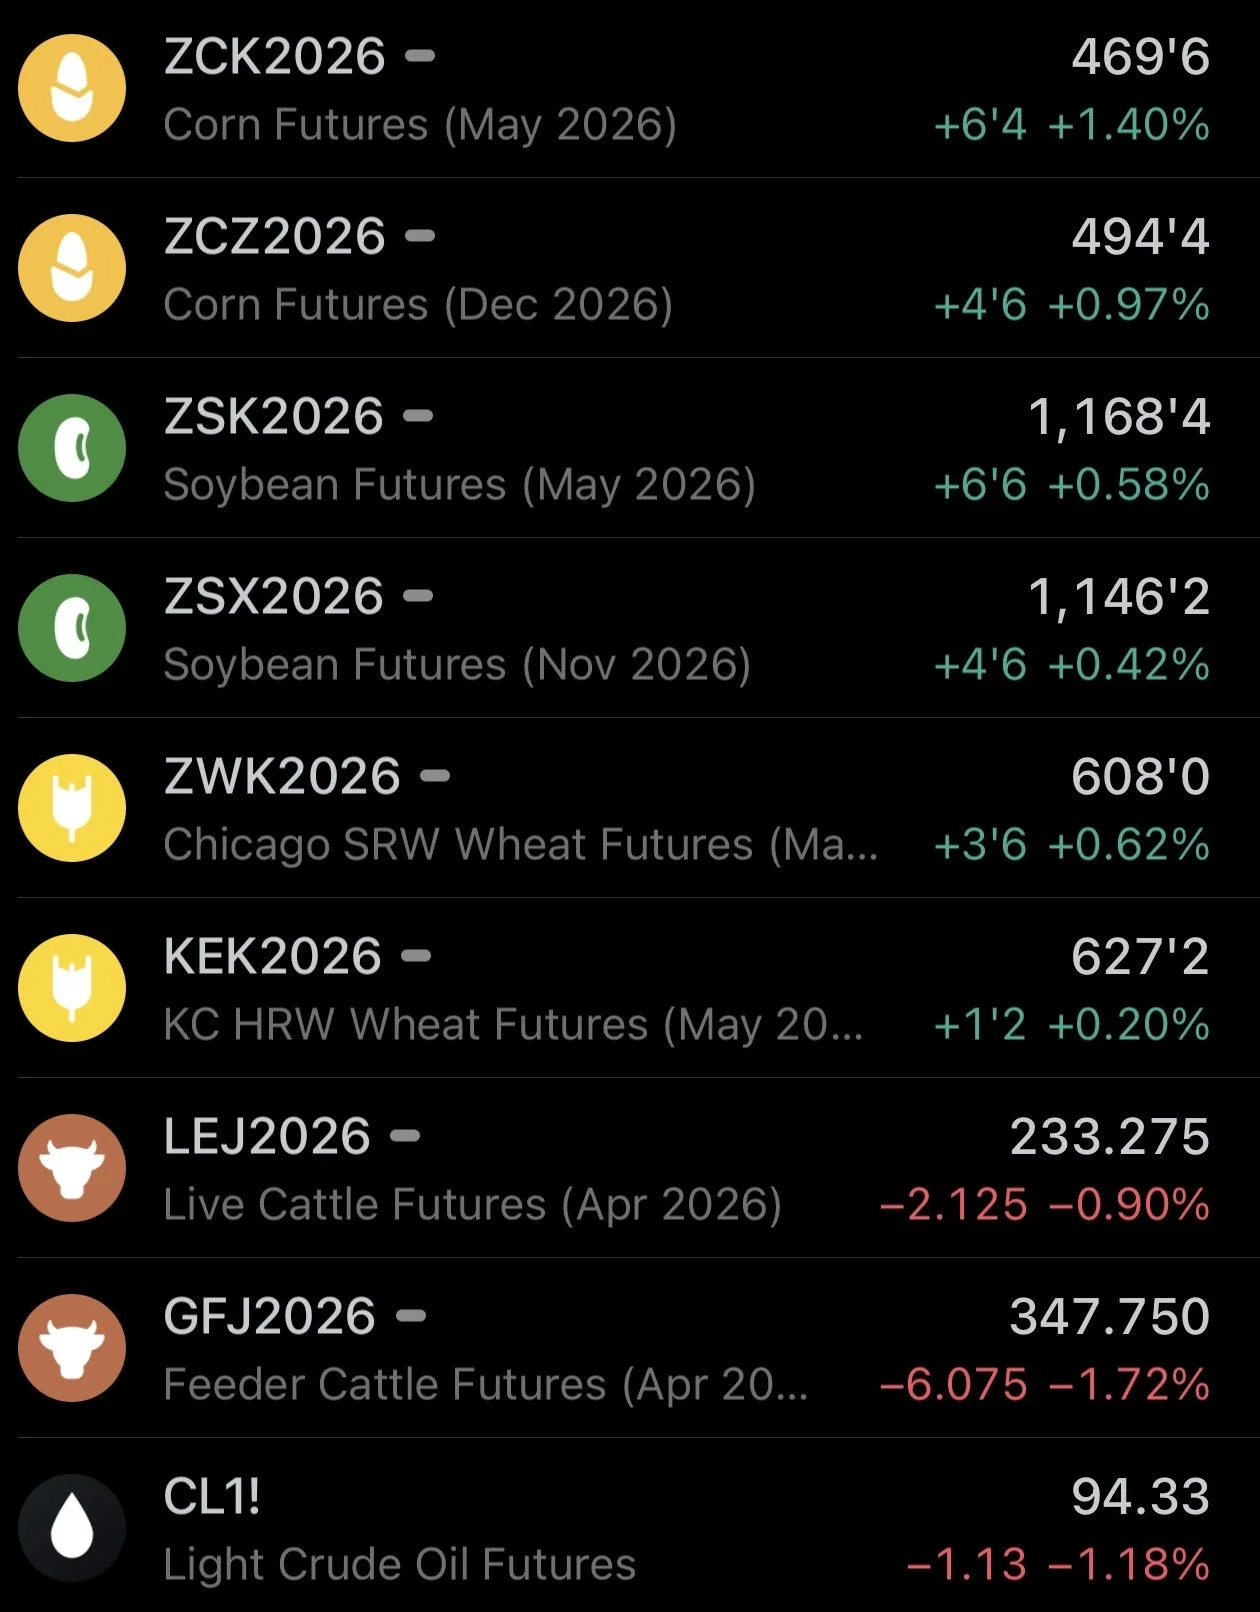
Overview
Solid day for the grains, while the cattle market was under pressure along with the stock market.
We've got that March 31st report out in less than two weeks. We will talk more about that in next week's updates.
Overall it was actually a pretty quiet day for the news compared to as of late.
It was announced that the US will NOT implement a crude export ban.
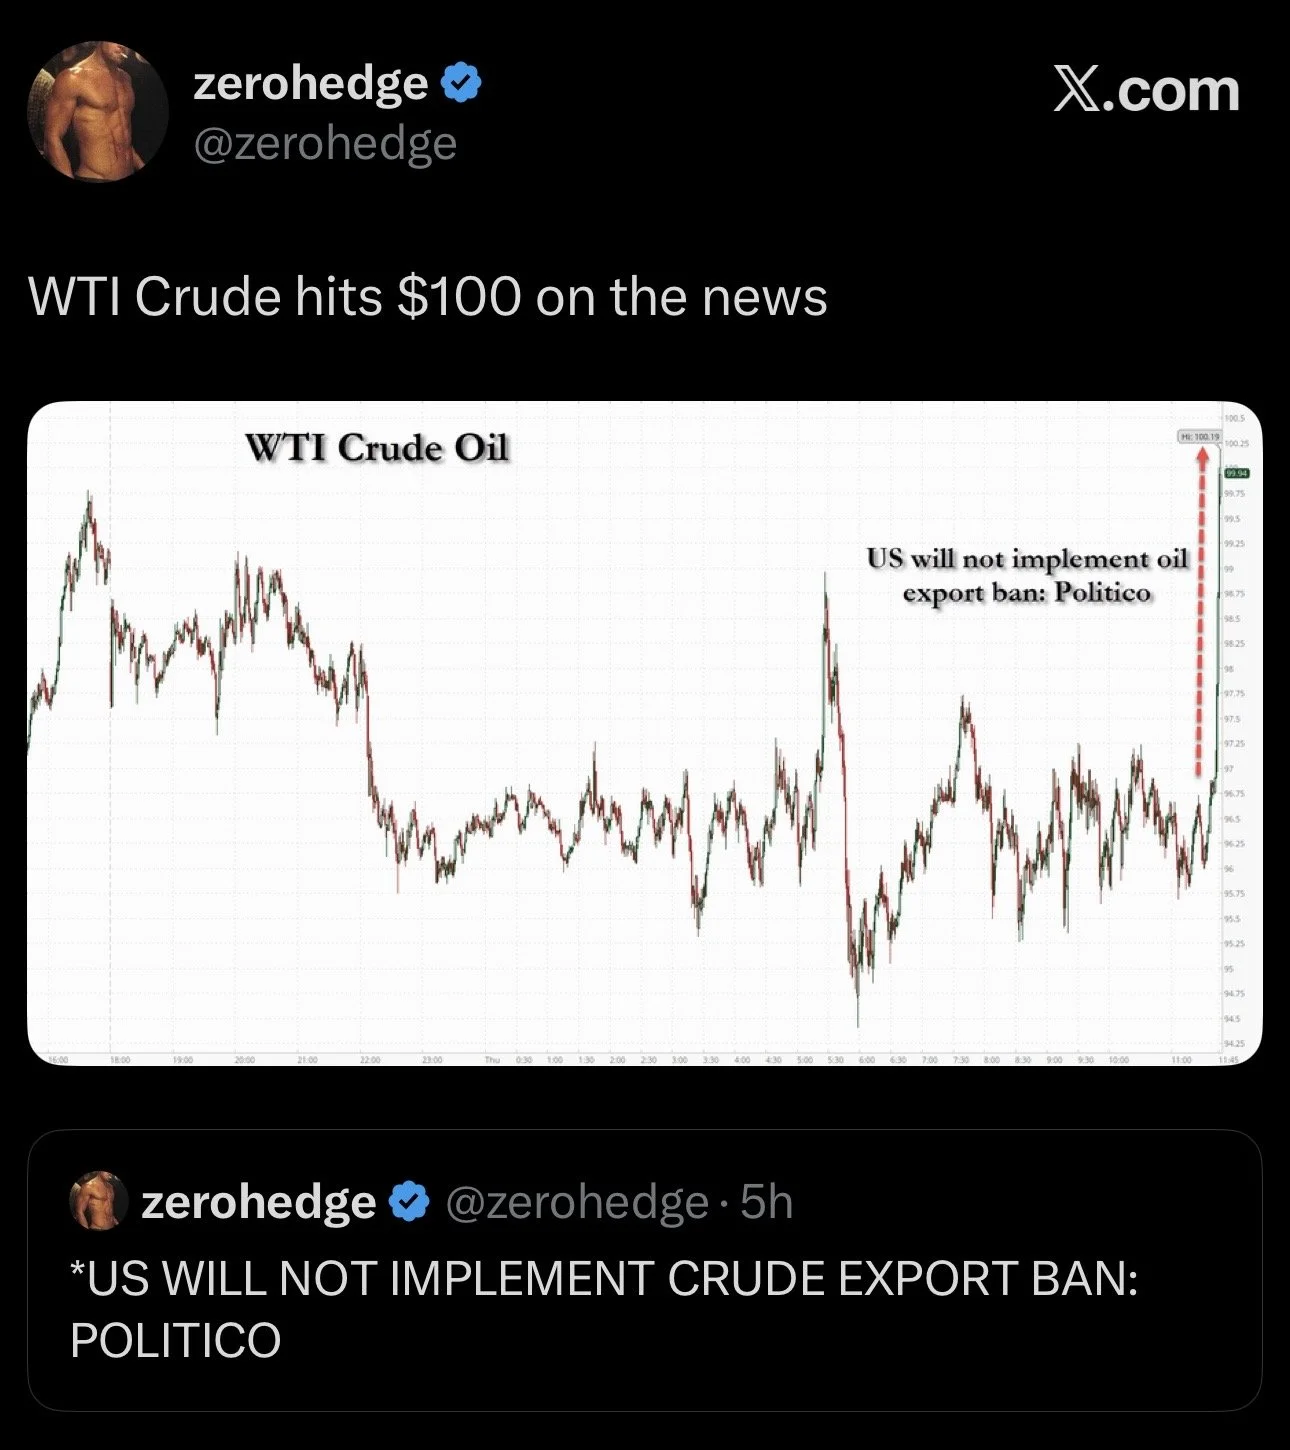
Crude oil immediately shot up $5 and traded over $100 on the news.
But we then gave back all of the gains and actually went in the red by the time the grain markets closed.
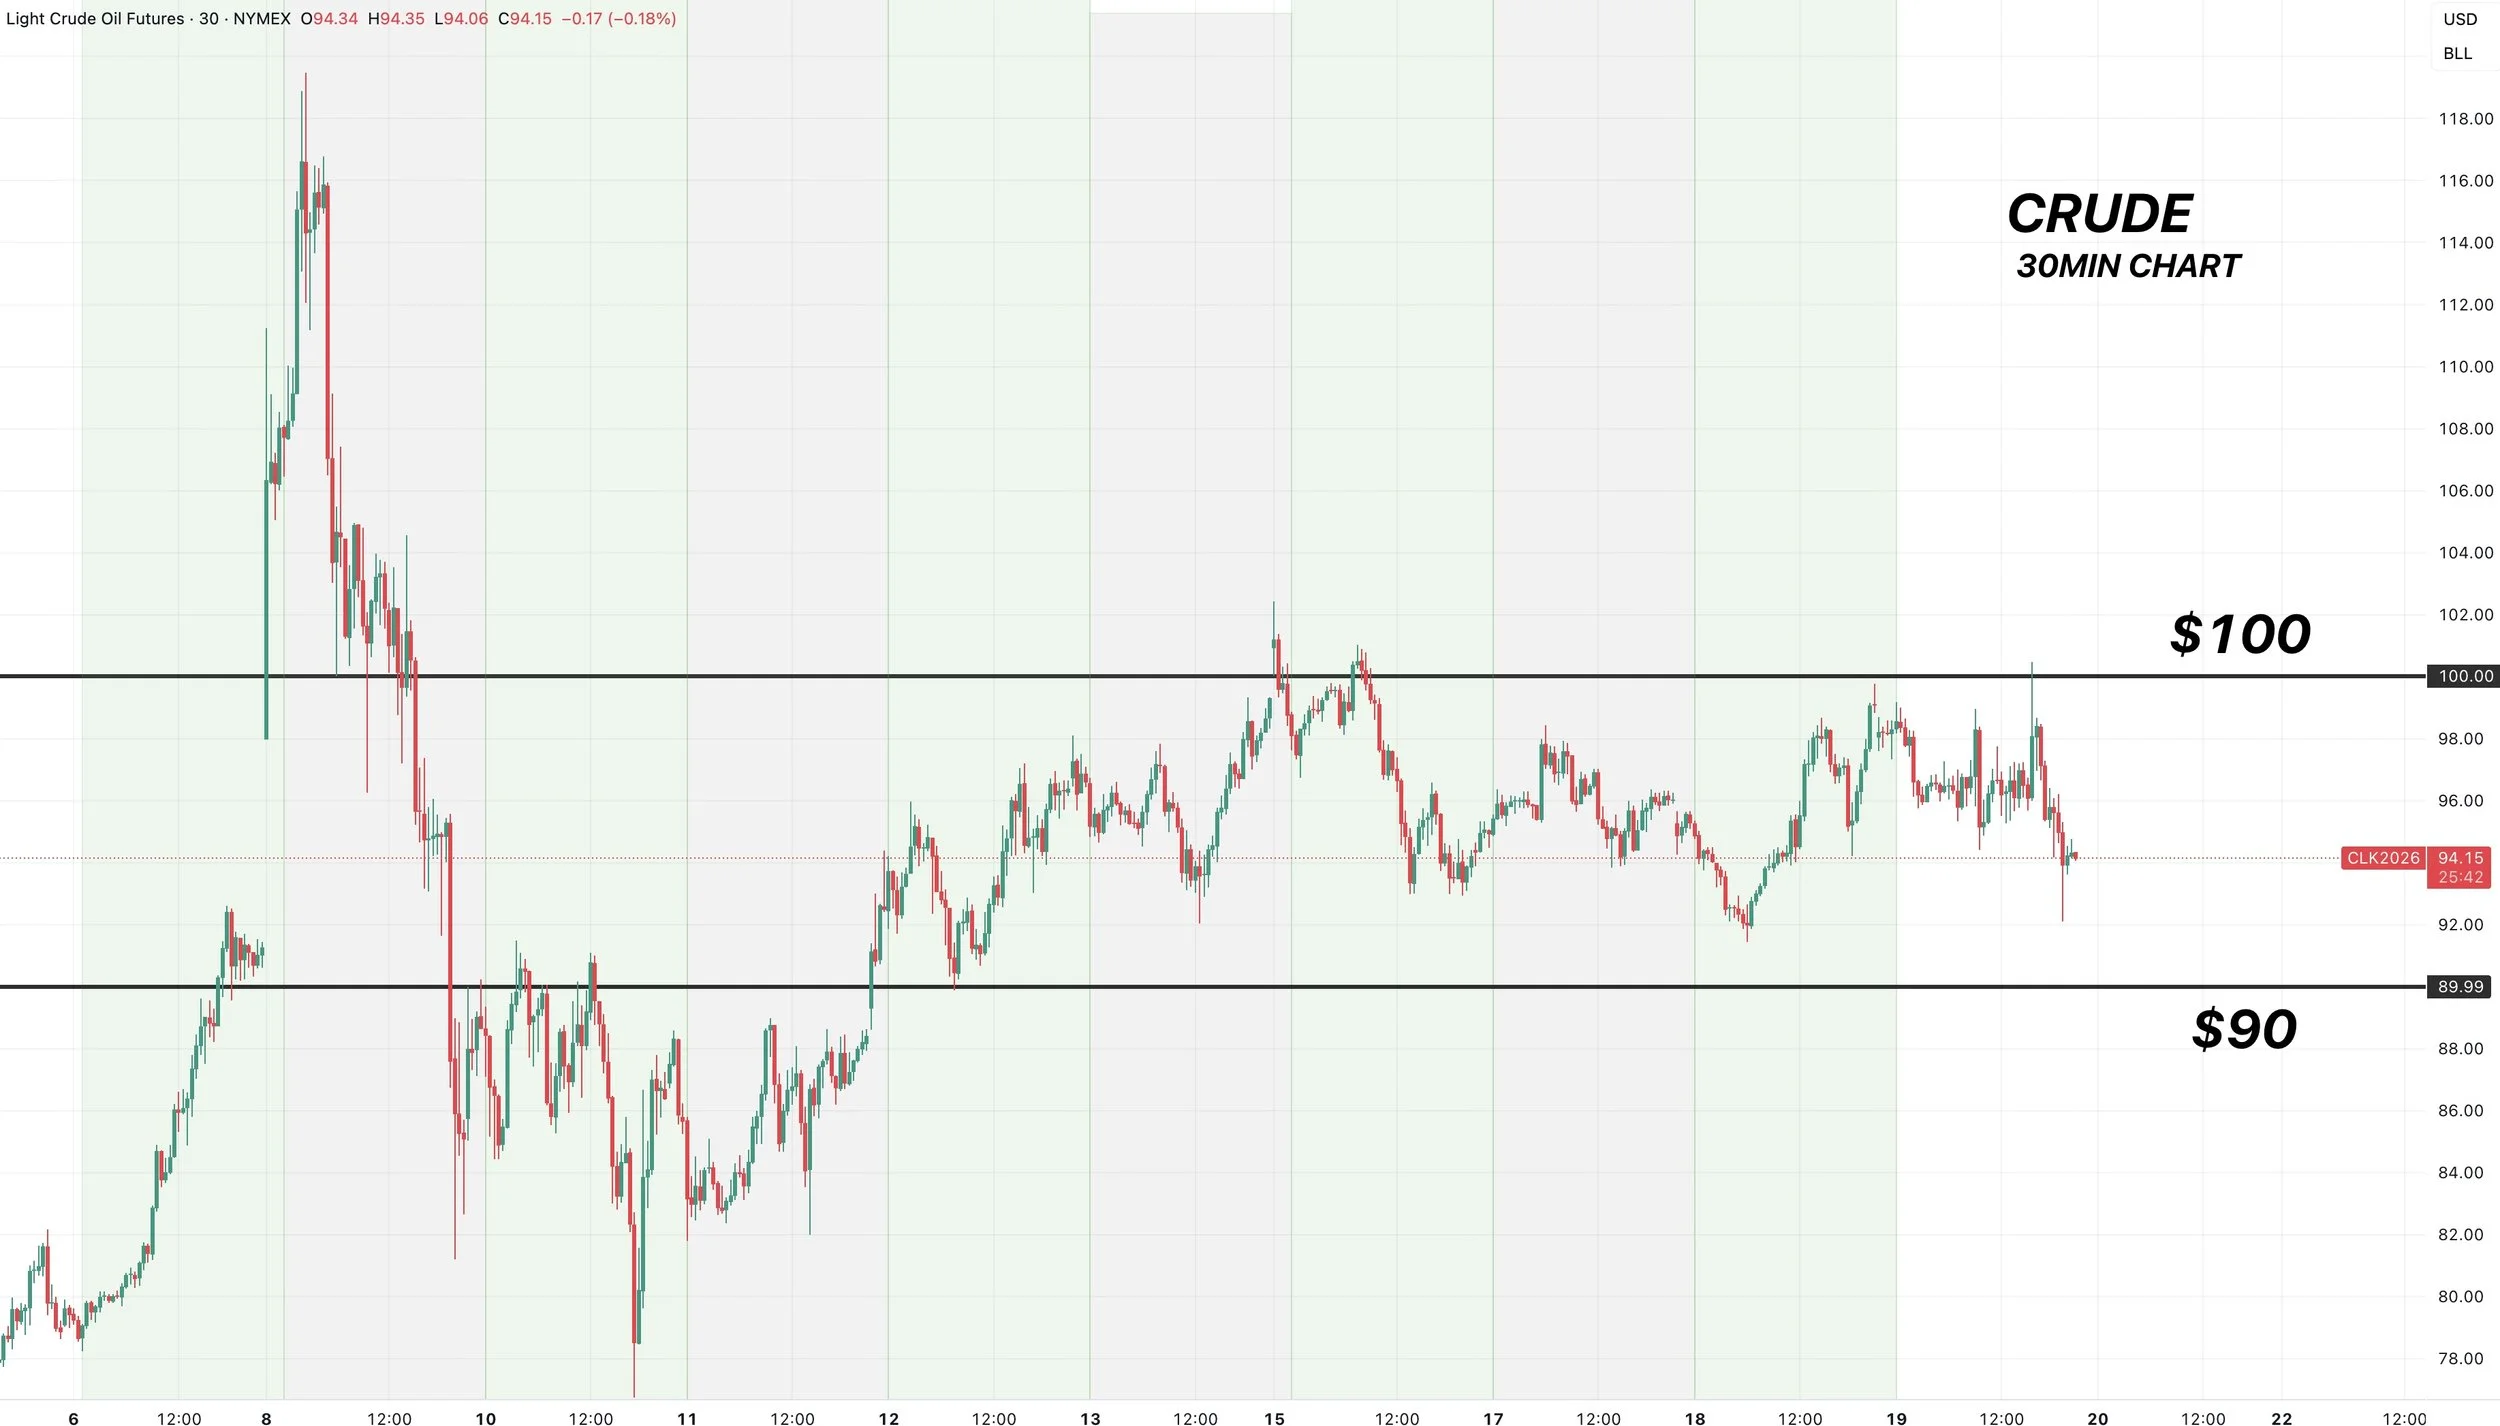
So there is still some crazy volatility in crude, as we continue to bounce between $90 and $100.
A $10 range is normally a pretty big swing, especially considering we were trading in the $60's not too long ago.
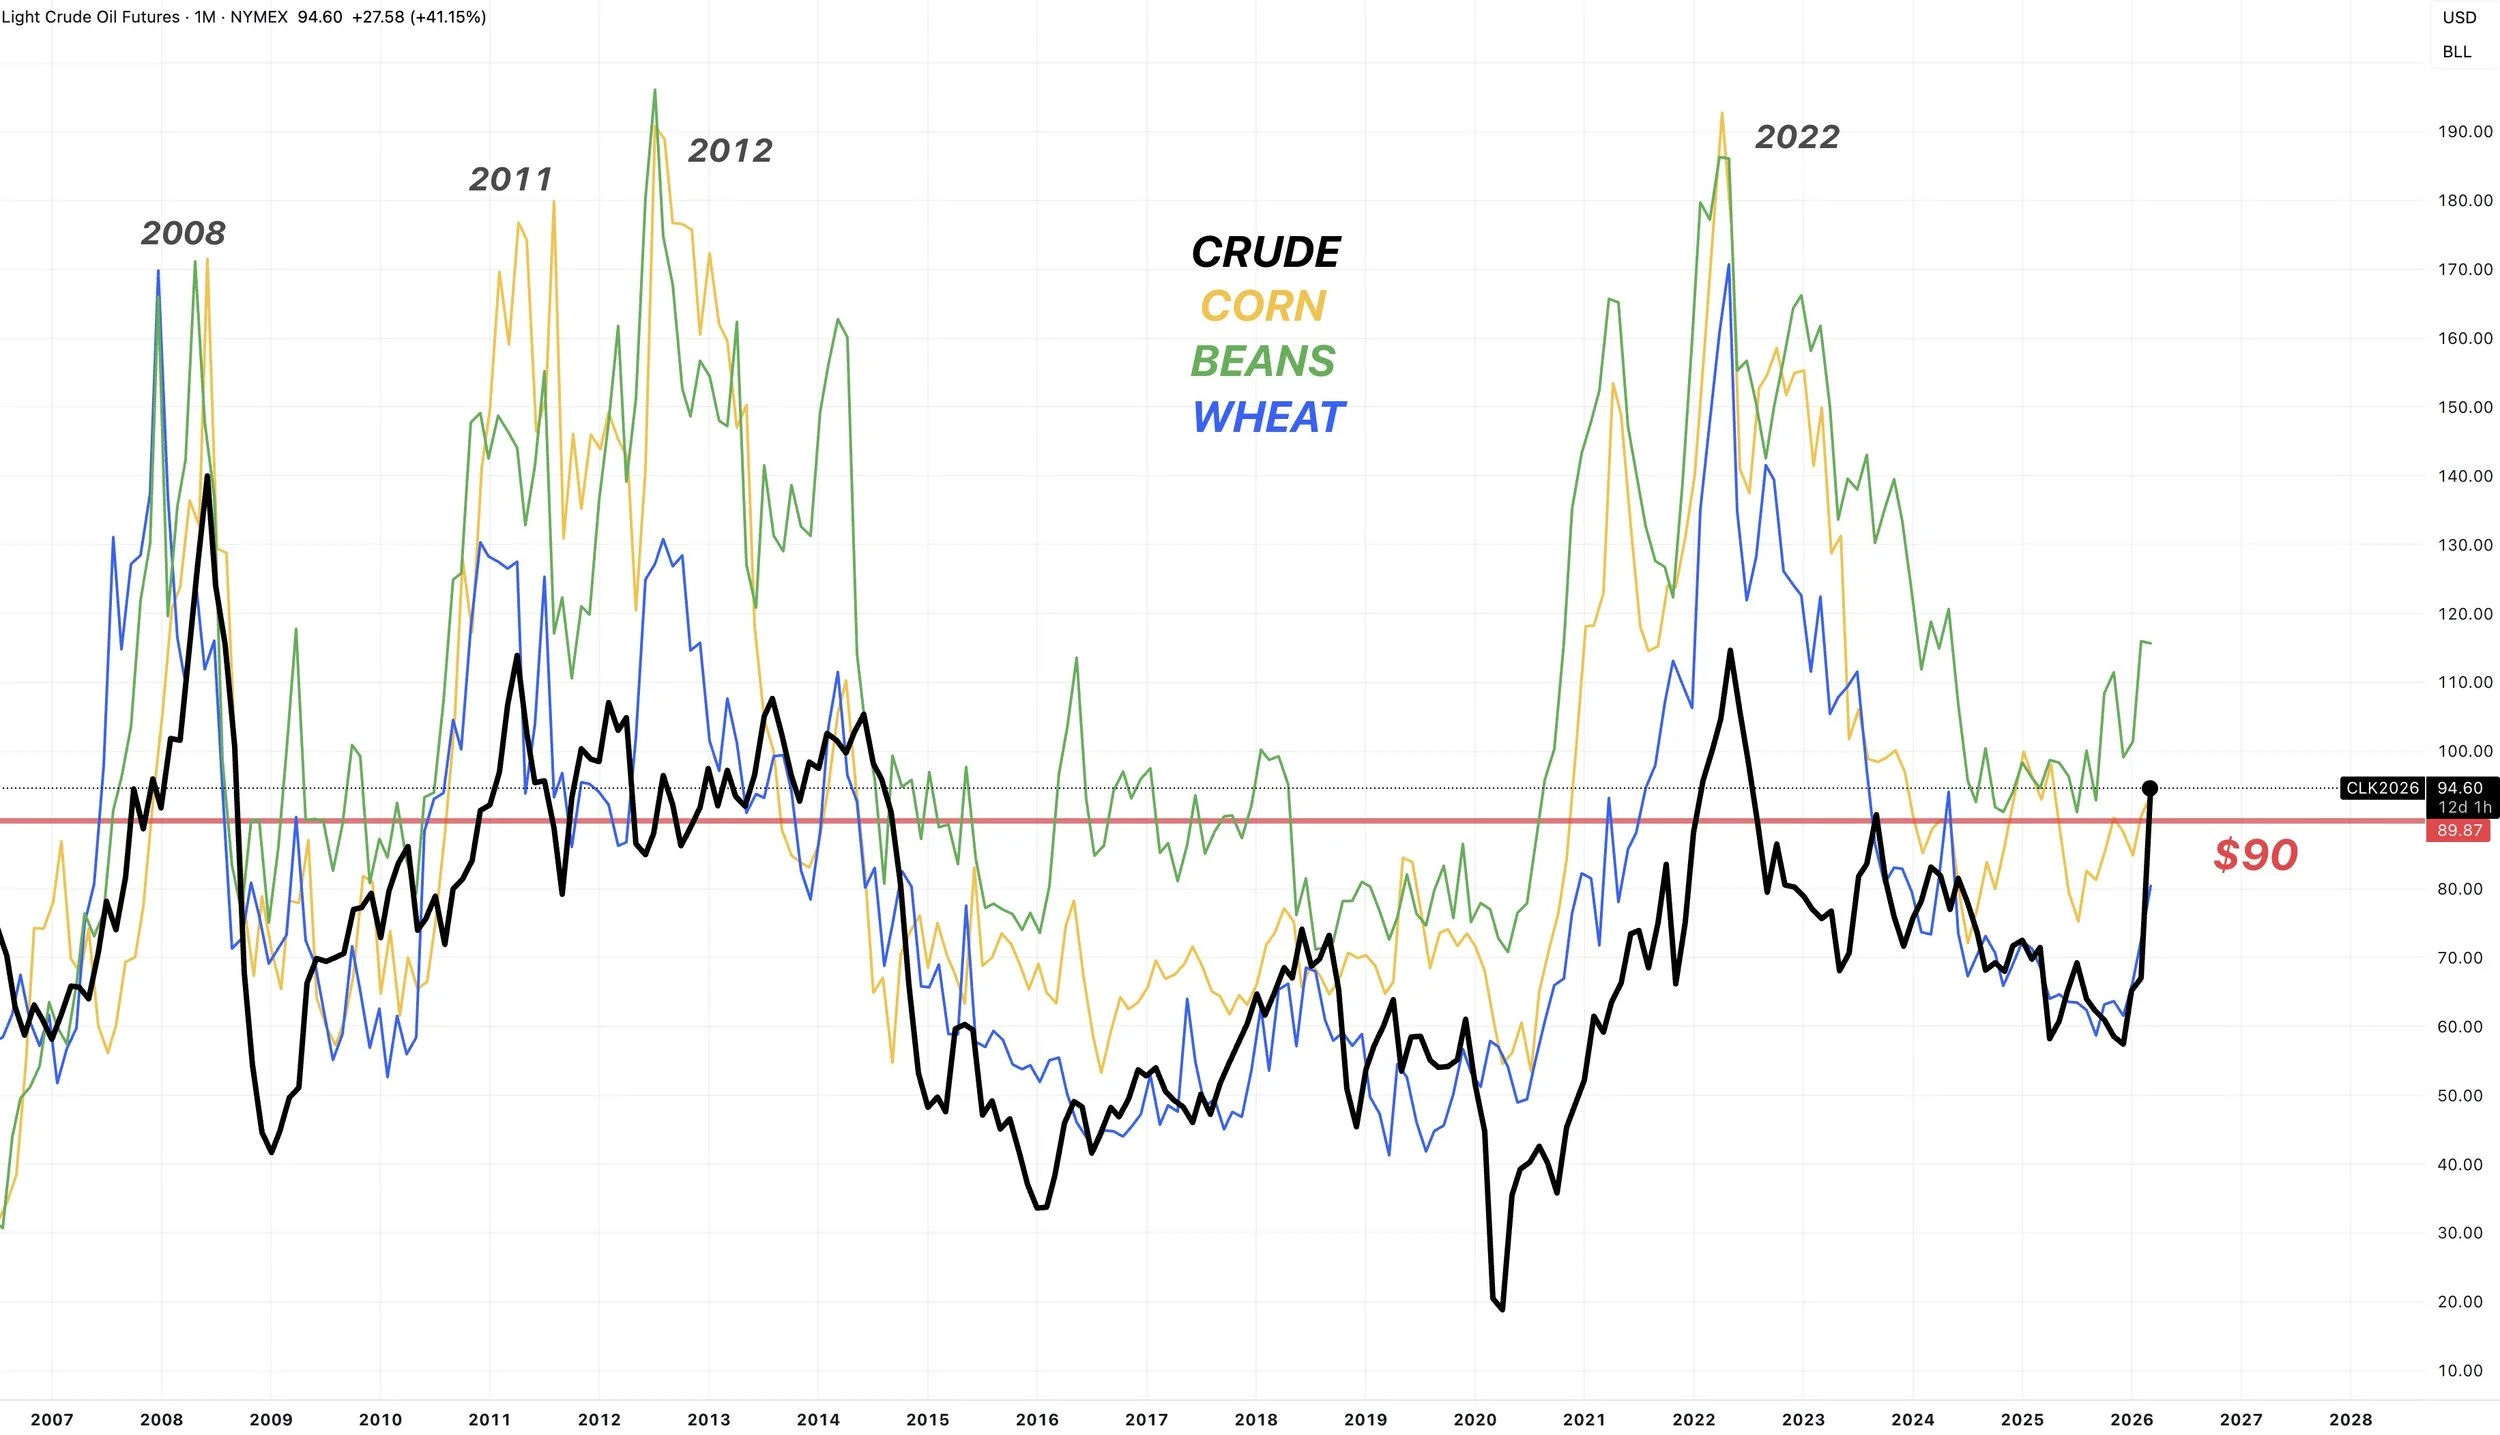
Crude vs Grains
I touched on this in our last few updates, and showed the long term crude oil chart vs corn chart.
Here is what that looks like if you throw soybeans and wheat in there as well.
Personally, I don’t think crude stays above $100 for months on end.
But if it does, we have to expect that the grains would follow.
Because if crude stayed that high, you could probably argue grains are undervalued in comparison.
Given that every time crude has came up here, grains followed.
But every time crude came up here, it stayed up here for months.
It is definitely possible crude stays up here, but at the same time I'm not betting the house on it.
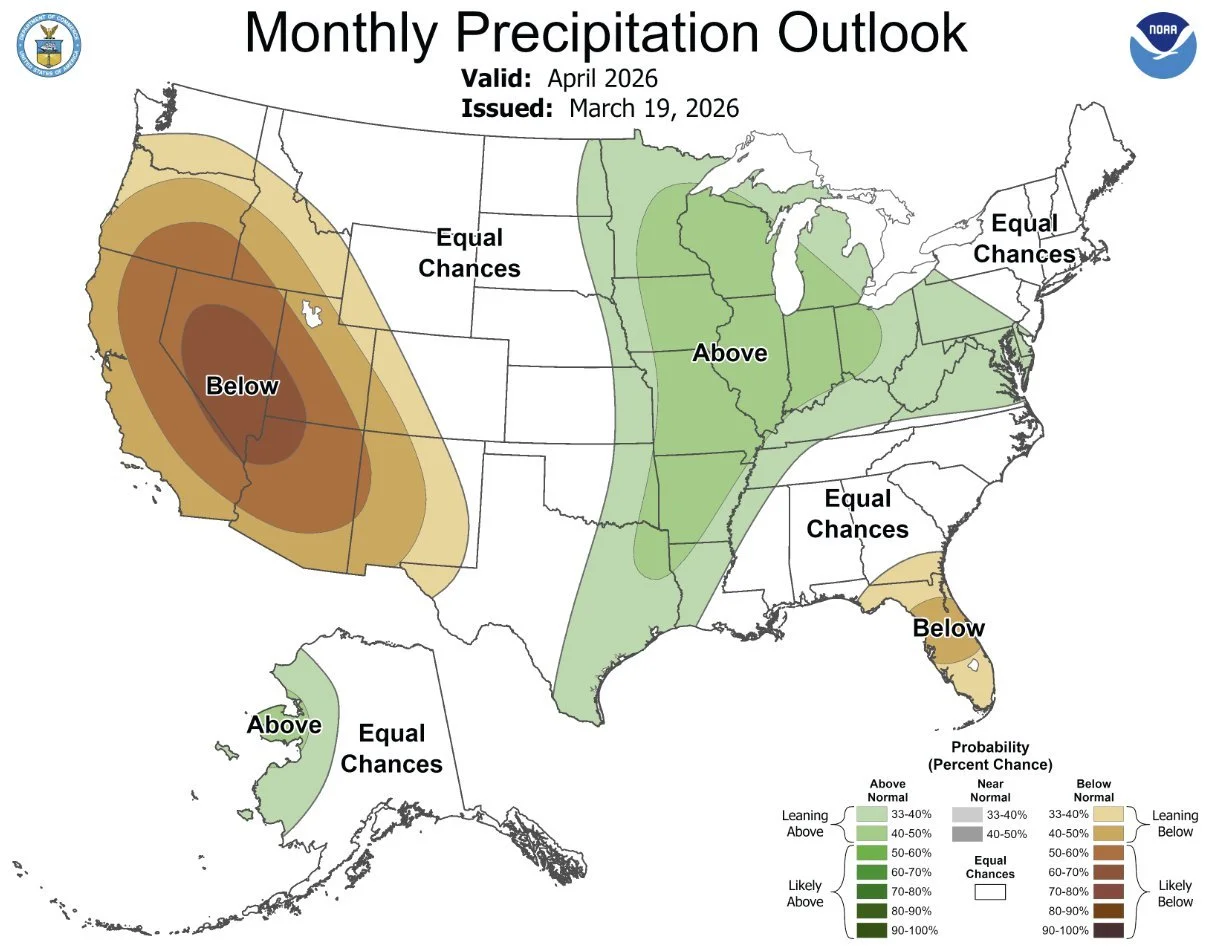
Wet Spring?
The offical NOAA April forecast was just released.
This is what they have for the month of April.
Pretty wet across the I-states.
Typically, a dry spring is bearish short term because we get the crop in the ground fast, but bullish heading into summer due to the lack of moisture.
A wet spring is potentially bullish short term as it opens the door to some planting delays etc, but heading into summer it's a bearish factor as boosts the moisture.
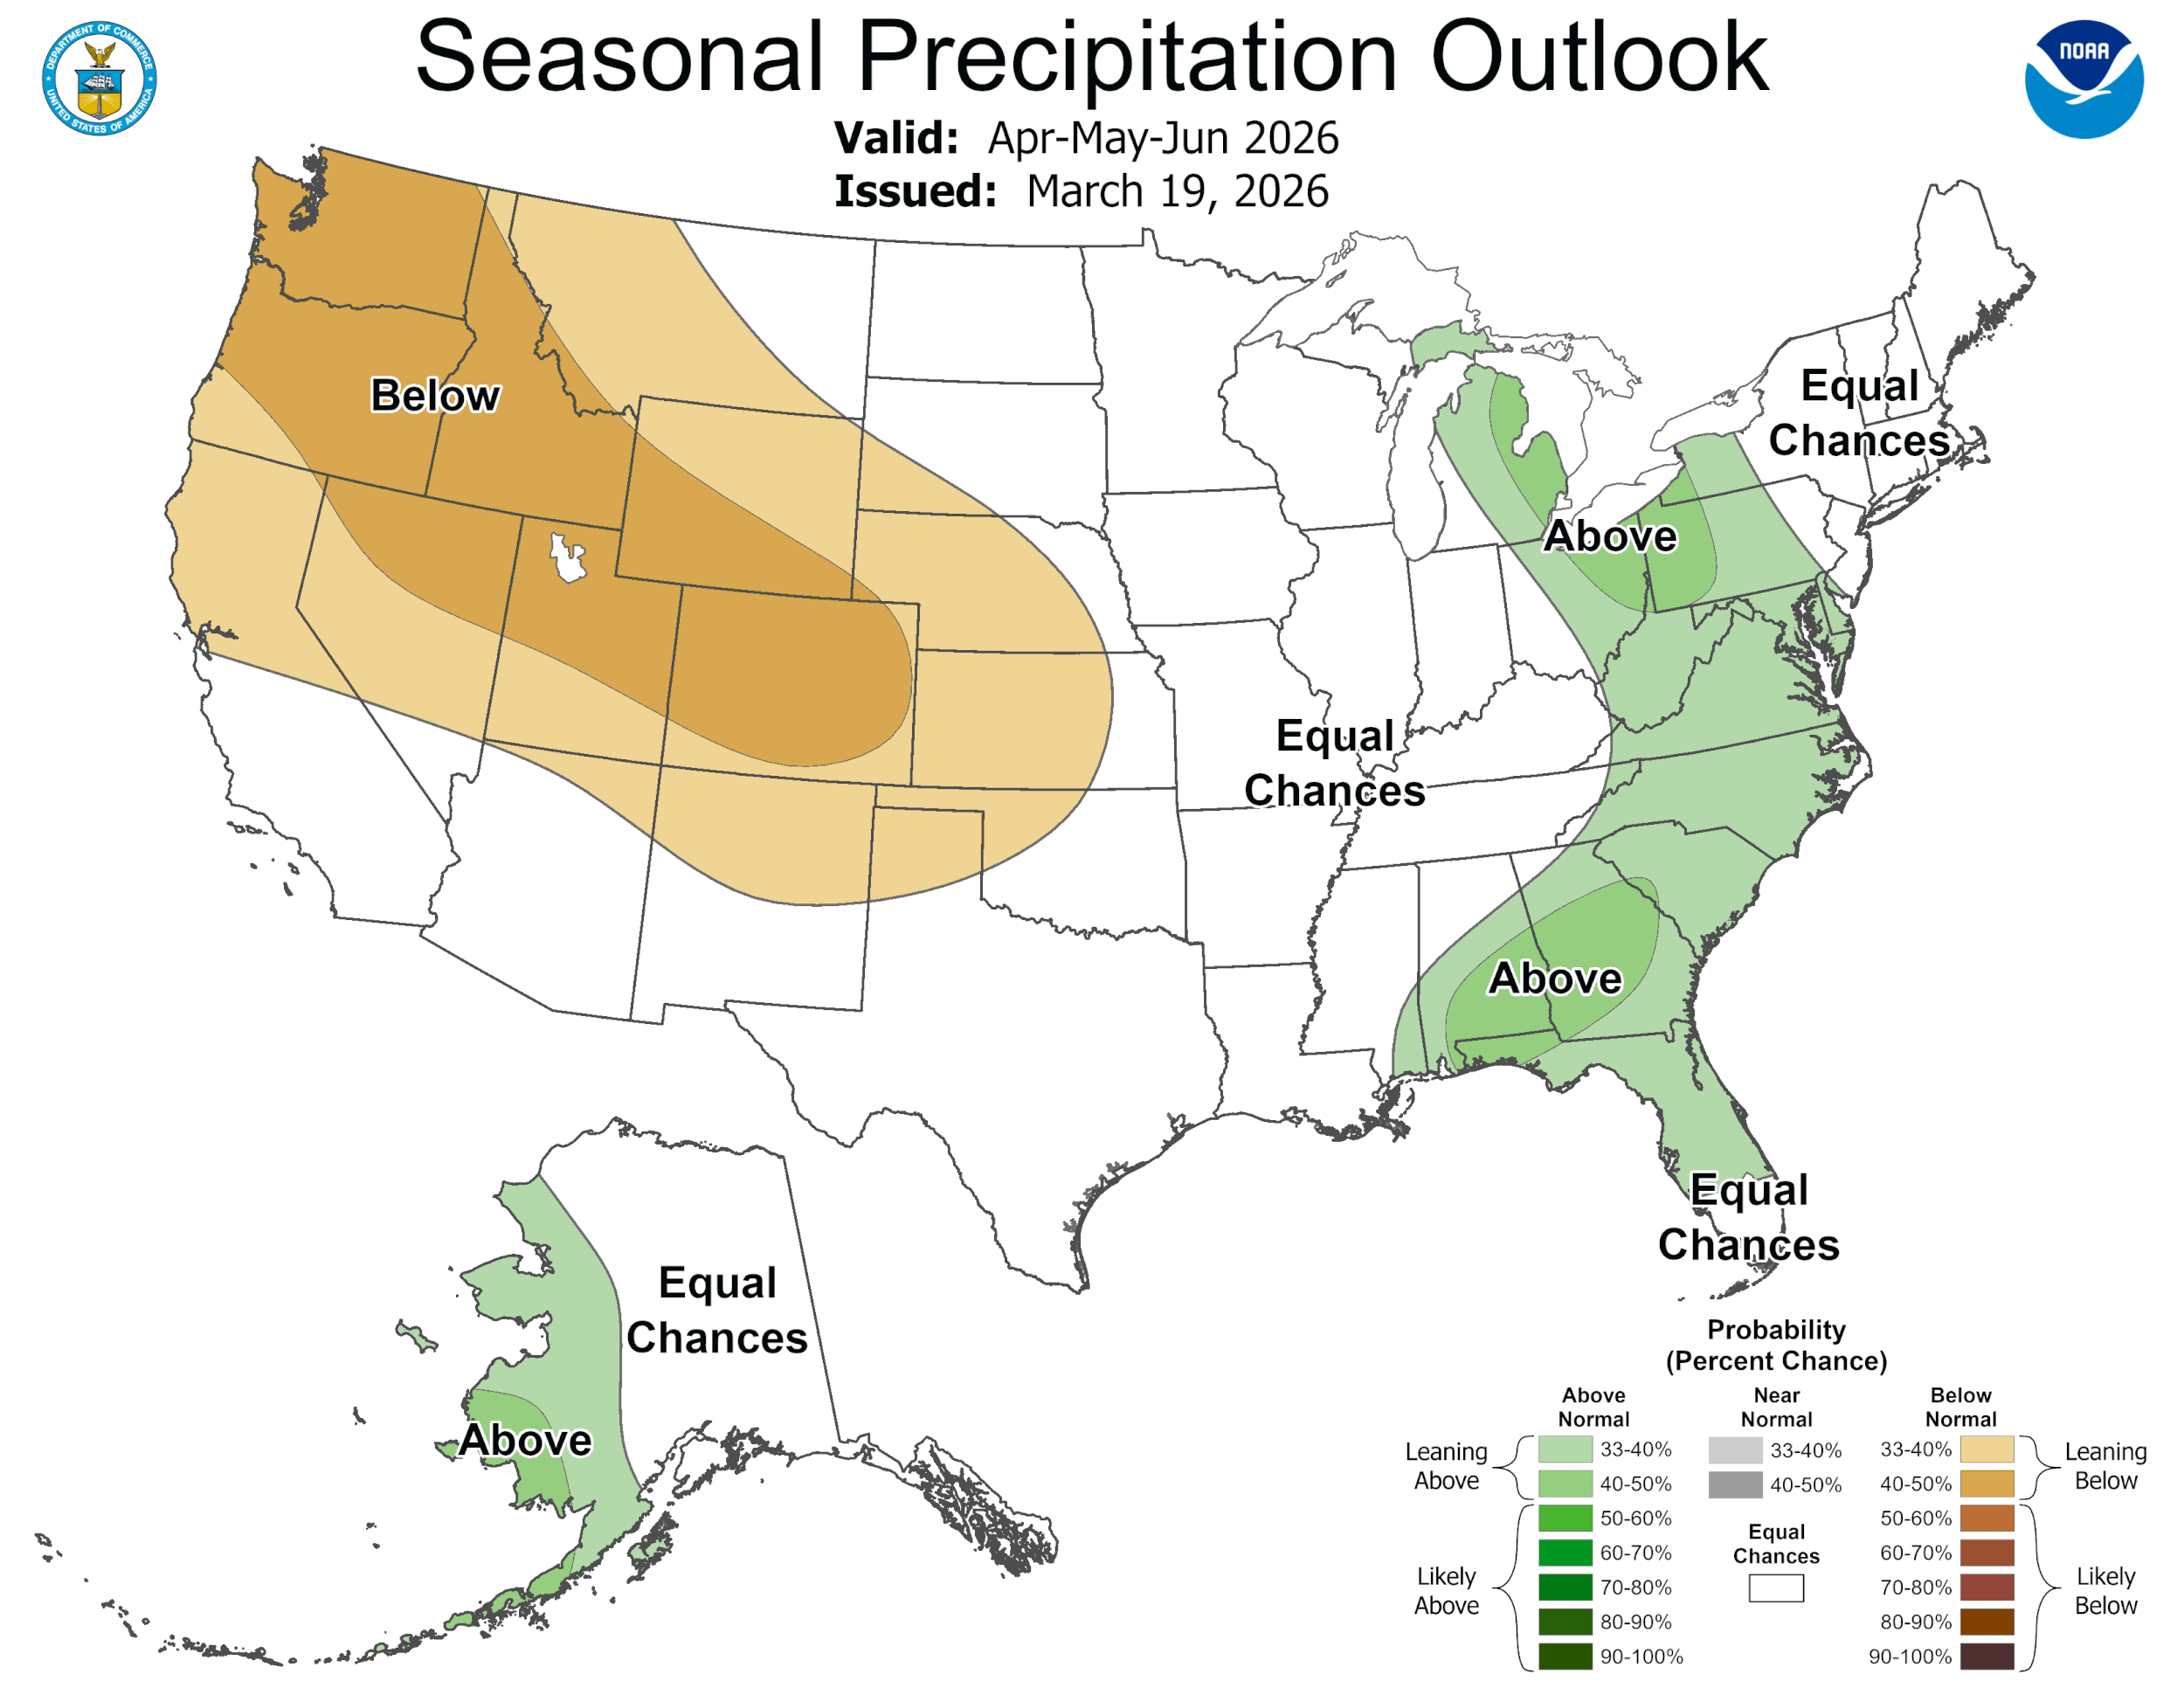
Then here is what they had for April to June.
They are expecting it to be on the dry side for the western plains, with equal chances in most of the corn belt.
This forecast is way too far out though, so not putting much into it at all.
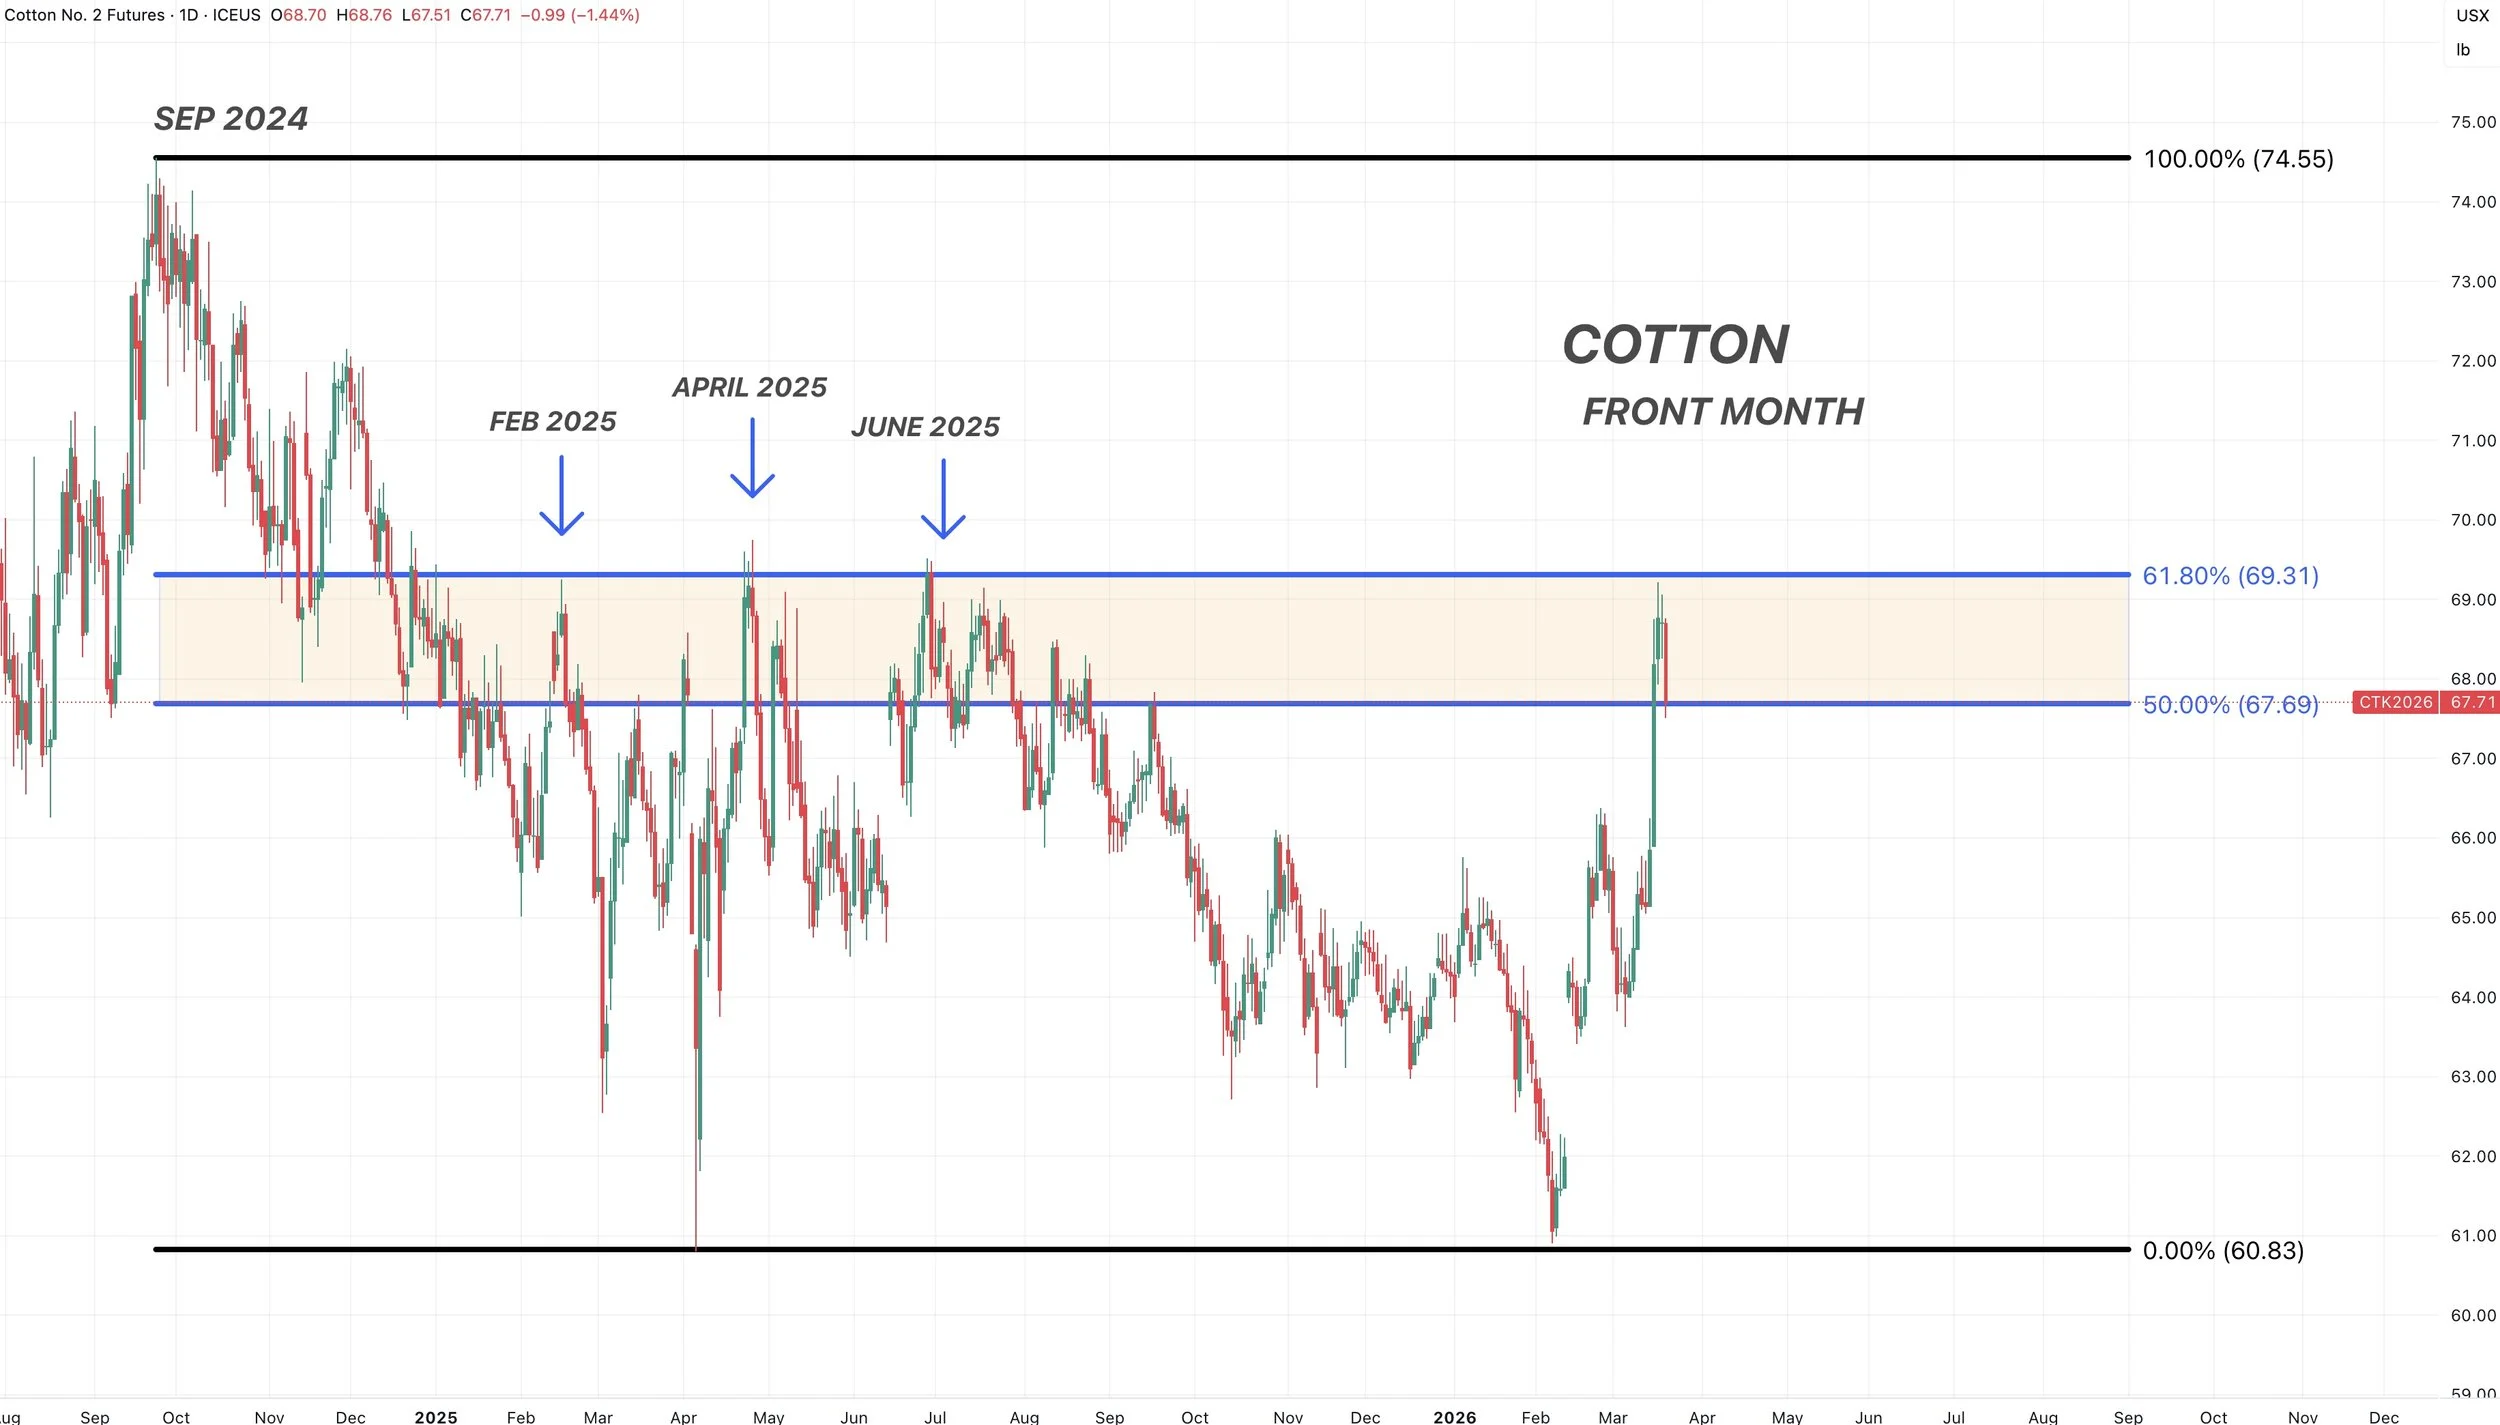
Cotton Update
We talked about how we wanted to reward this rally on Tuesday.
On the front month contract chart, we perfectly clawed back 61.8% of the 2024 highs.
This same level lined up with where this market topped out at on 3 separate occasions last year.
So far we are struggling at that level.
Today's Main Takeaways
Corn
Not going to get too deep into the fundamentals today like we often do.
Right now, this market isn’t trading fundamentals.
If it was, corn would probably be lower than it is today.
Because the current balance sheet doesn’t scream $5 corn, but $5 corn feels possible here.
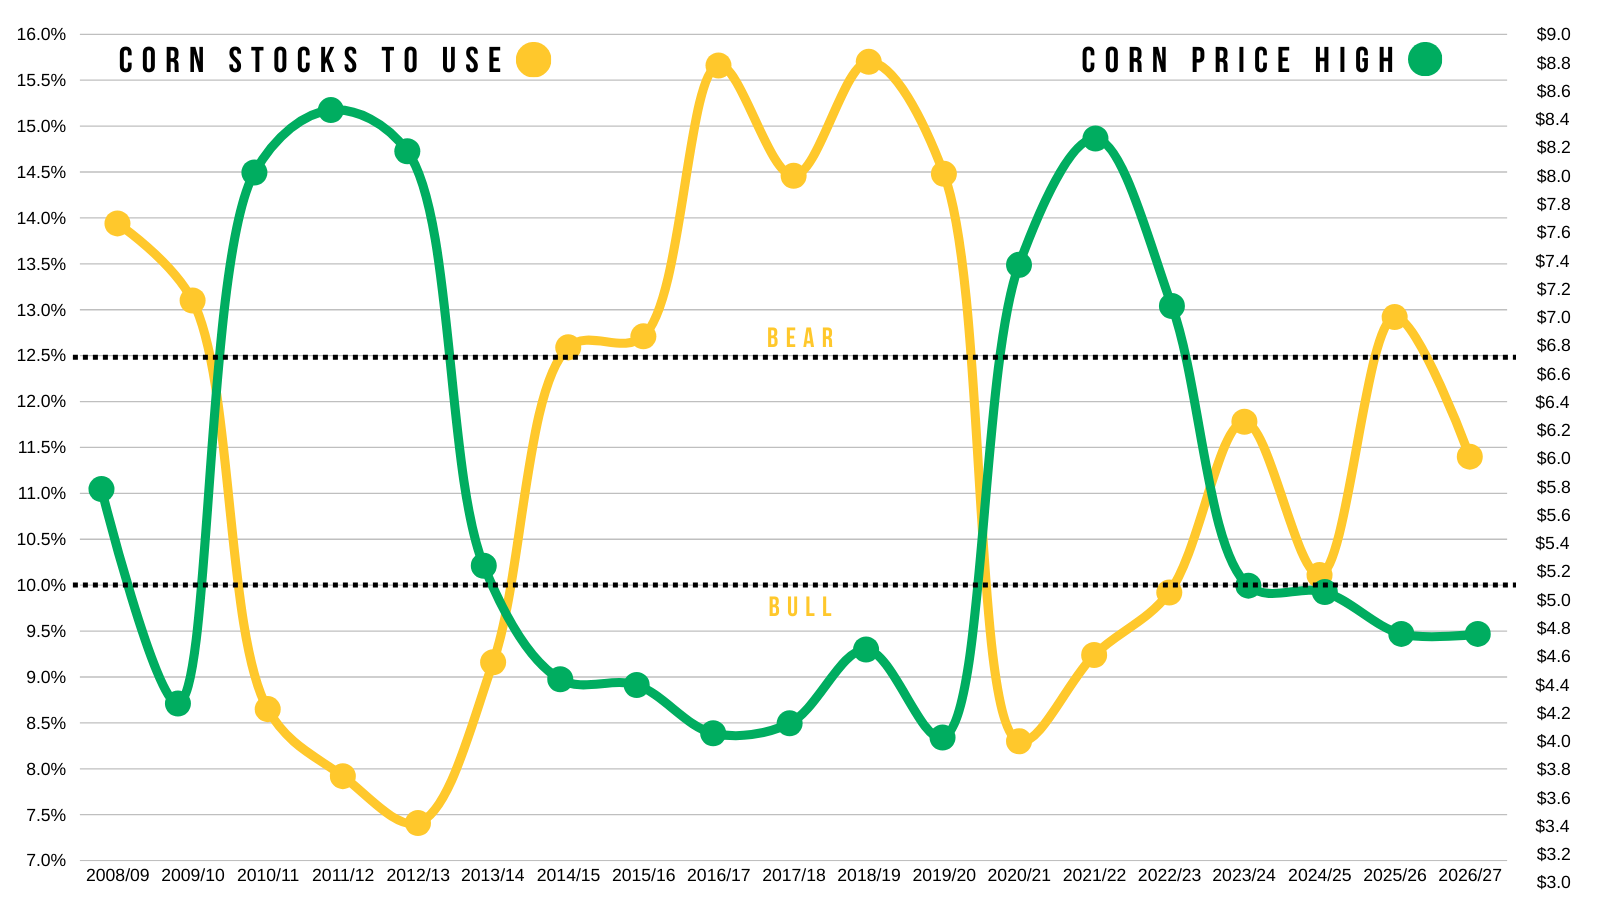
I've shown this chart a thousand times. It is our stocks to use vs our highest price of the year.
Typically, you need a 10% stocks to use to get much above $5, but that doesn’t necessarily have to be the case if this rally is being driven by something non-fundamental.
At the end of the day it's all about money flow and headlines. Wherever big money wants to put their cash.
Right now corn is one of those bets.
Like we talked about earlier this week, they just had their 4th largest week of buying ever.
Now long over 200k contracts. The record is around 400k.
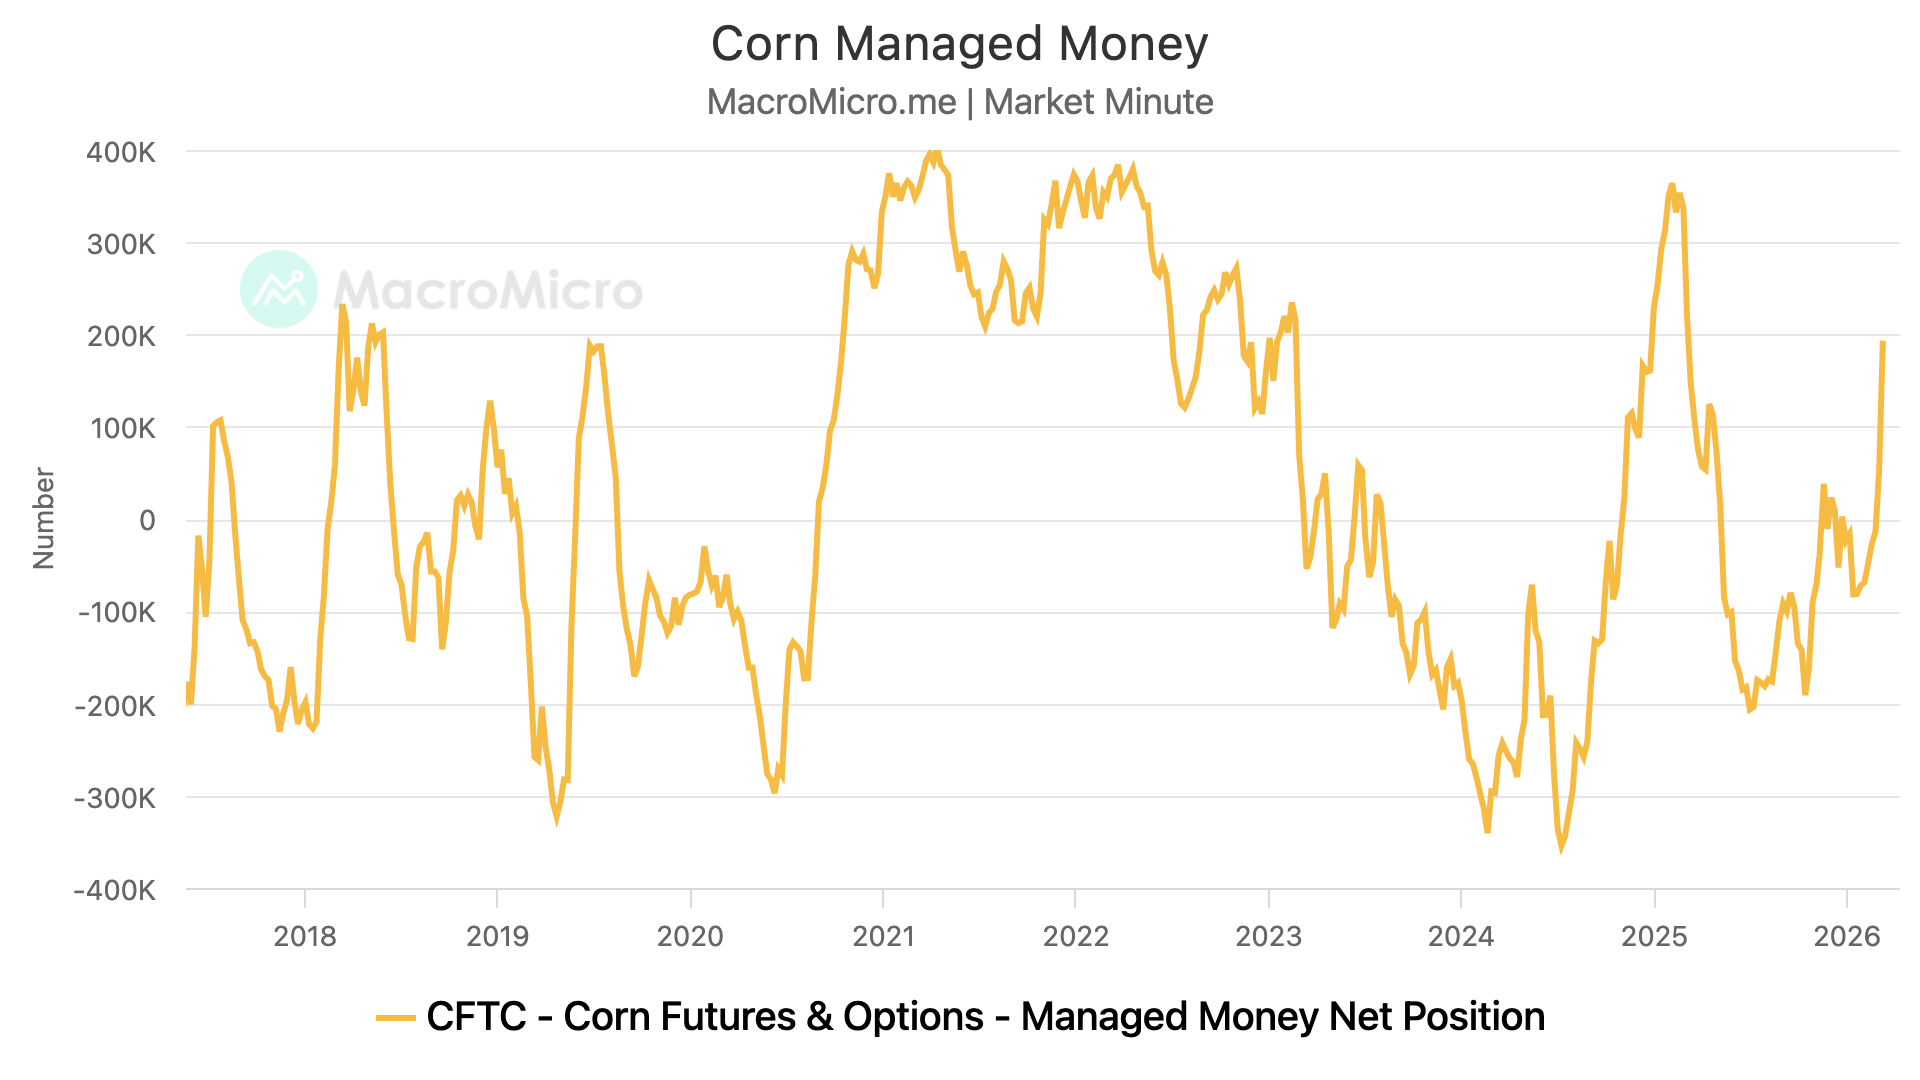
Corn is a fuel play.
With the war, crude, and fertilizer prices through the roof, the funds are thinking that maybe corn is going to follow.
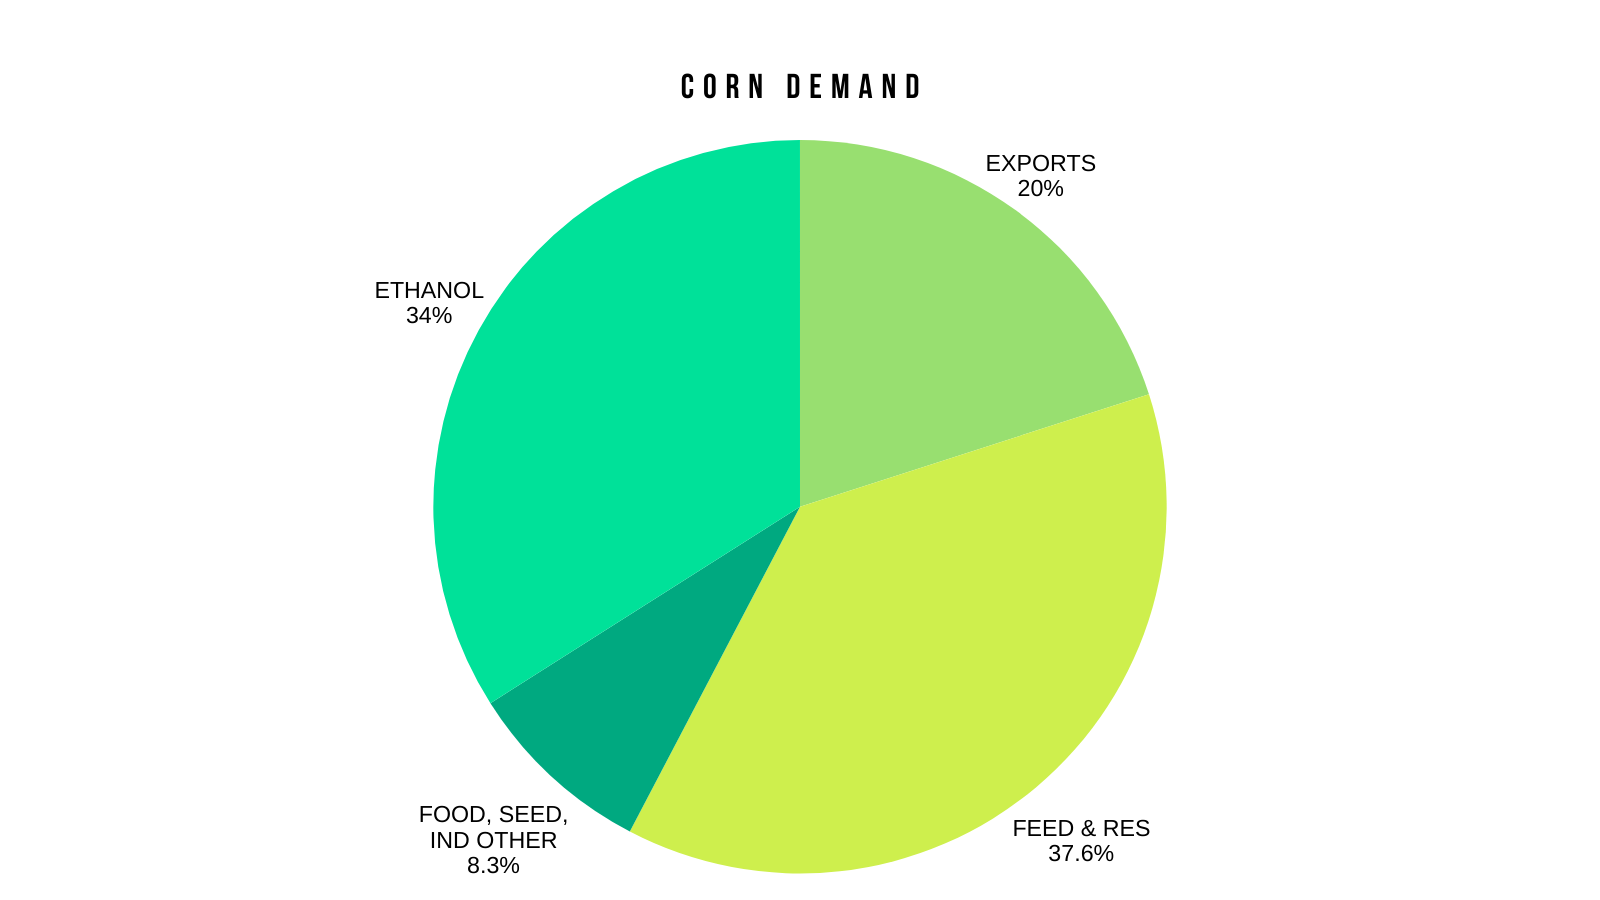
The USDA's old crop balance sheet shows 16.47 billion bushels of total corn demand.
How many bushels does ethanol demand account for?
5.60 billion bushels.
That is 34% of all corn demand.
So it makes sense that corn would catch a bid if crude actually does stay at this level or heads even higher.
But obviously a headline market is a market that offers risk.
What happens when the war ends?
Does crude go lower? If so, do grains follow?
No one knows how it'll pan out.
Overall, we want to of course leave plenty of dry powder with the upside potential here. We aren’t going out and selling everything. Not even close.
But if you haven’t done anything up here yet, I don’t want to just do absolutely nothing. Whether that's an incremental sale or keeping some downside protection.
We are nearing our next set of targets which I'll touch on at the end of the corn section.
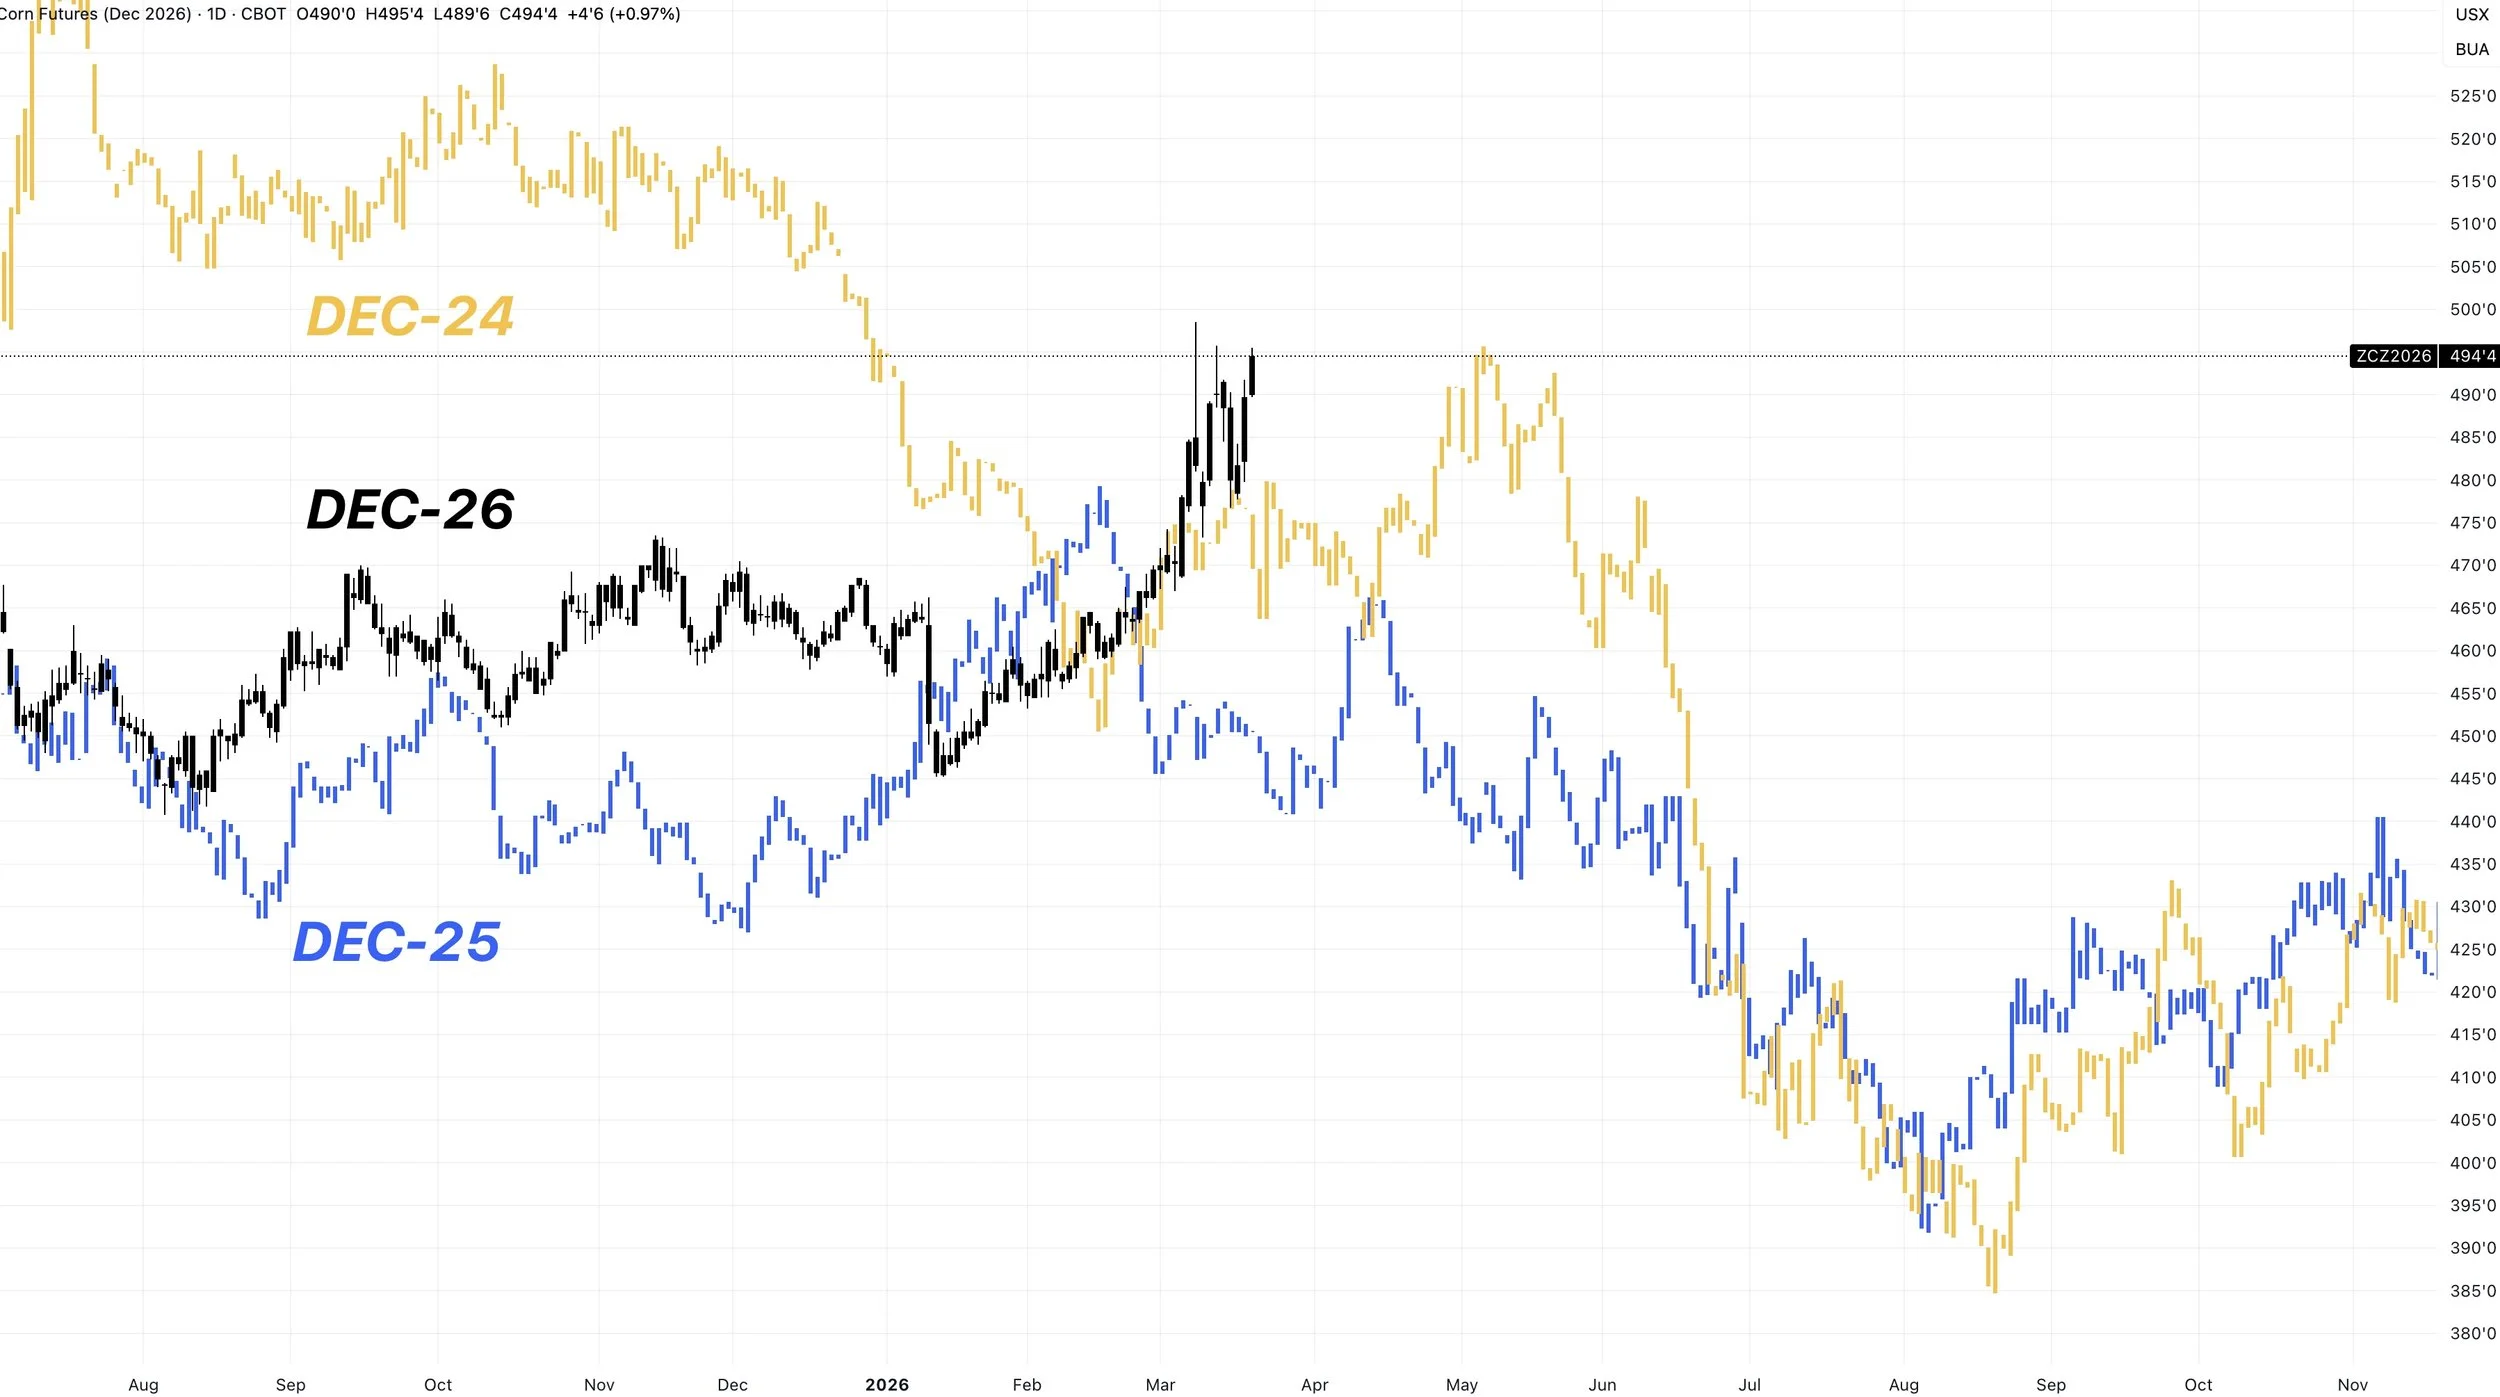
Here is Dec-26 vs Dec-25 vs Dec-24.
Last year, you did not even have the chance to do something at these levels.
In 2024, this was as high as we got in May.
Two year highs isn't the worst spot to lock in a floor or take a little chips off the table.
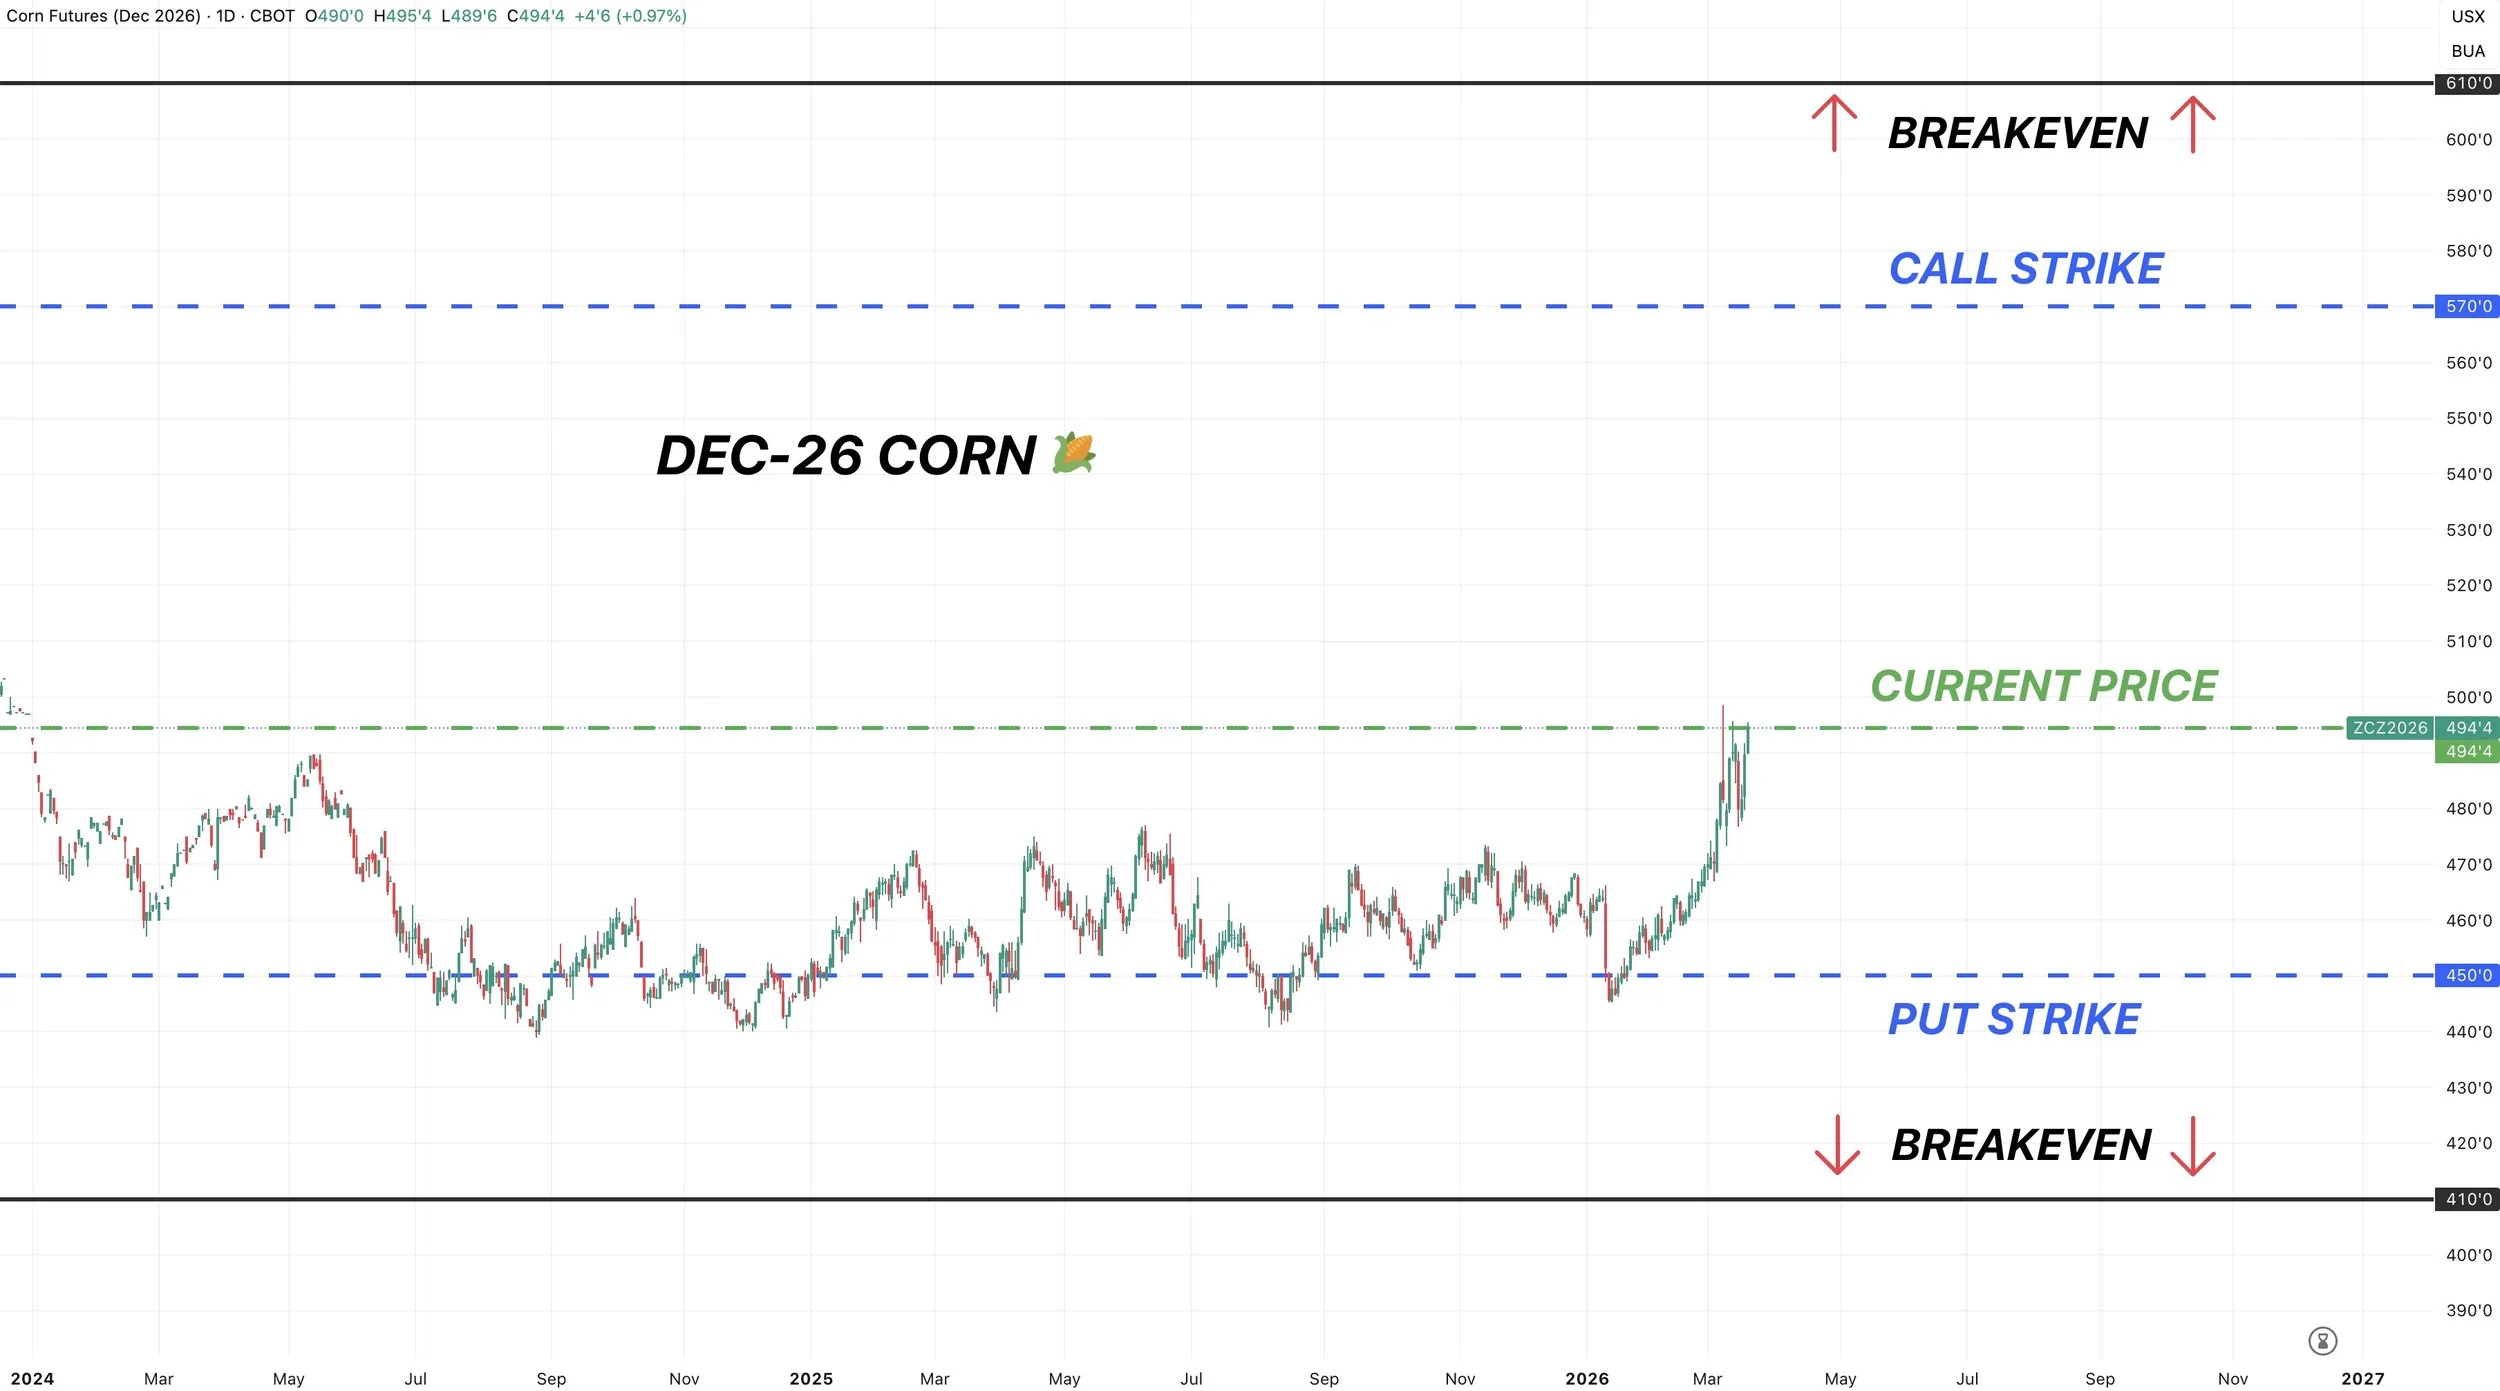
Corn Trade Idea
Here is a trade idea that allows you to collect around 40 cents.
We like selling the high implied volatility as a way to enhance your bottom line.
The trade:
Sell Dec $4.50 put = collect 18 cents
Sell Dec $5.70 call = collect 20 cents
Total = collect 38 cents
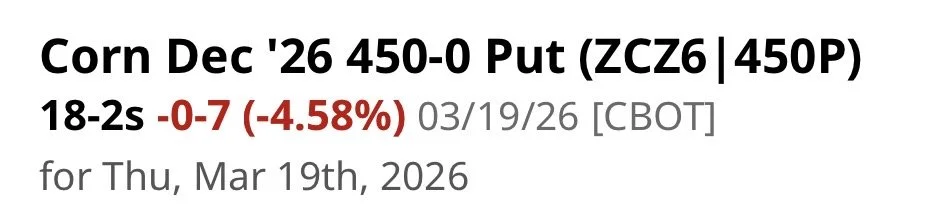
Your break even levels on this trade are $4.10 and $6.10.
If we are between those two prices, this trade is profitable.
The math is the strike +/- the total premium = breakeven
$5.70 + $0.40 = $6.10
$4.50 - $0.40 = $4.10
For an example, if we are at $5.70 at expiration, you get $6.10 for your corn.
If we are at $4.10 at expiration, you get $4.50 for your corn.
Futures and options are risky. This trade is not for everyone. This trade involves margin risk.
So give us a call to see if it's right for you or if you want to talk through the strategy.
Office: (806)484-1214
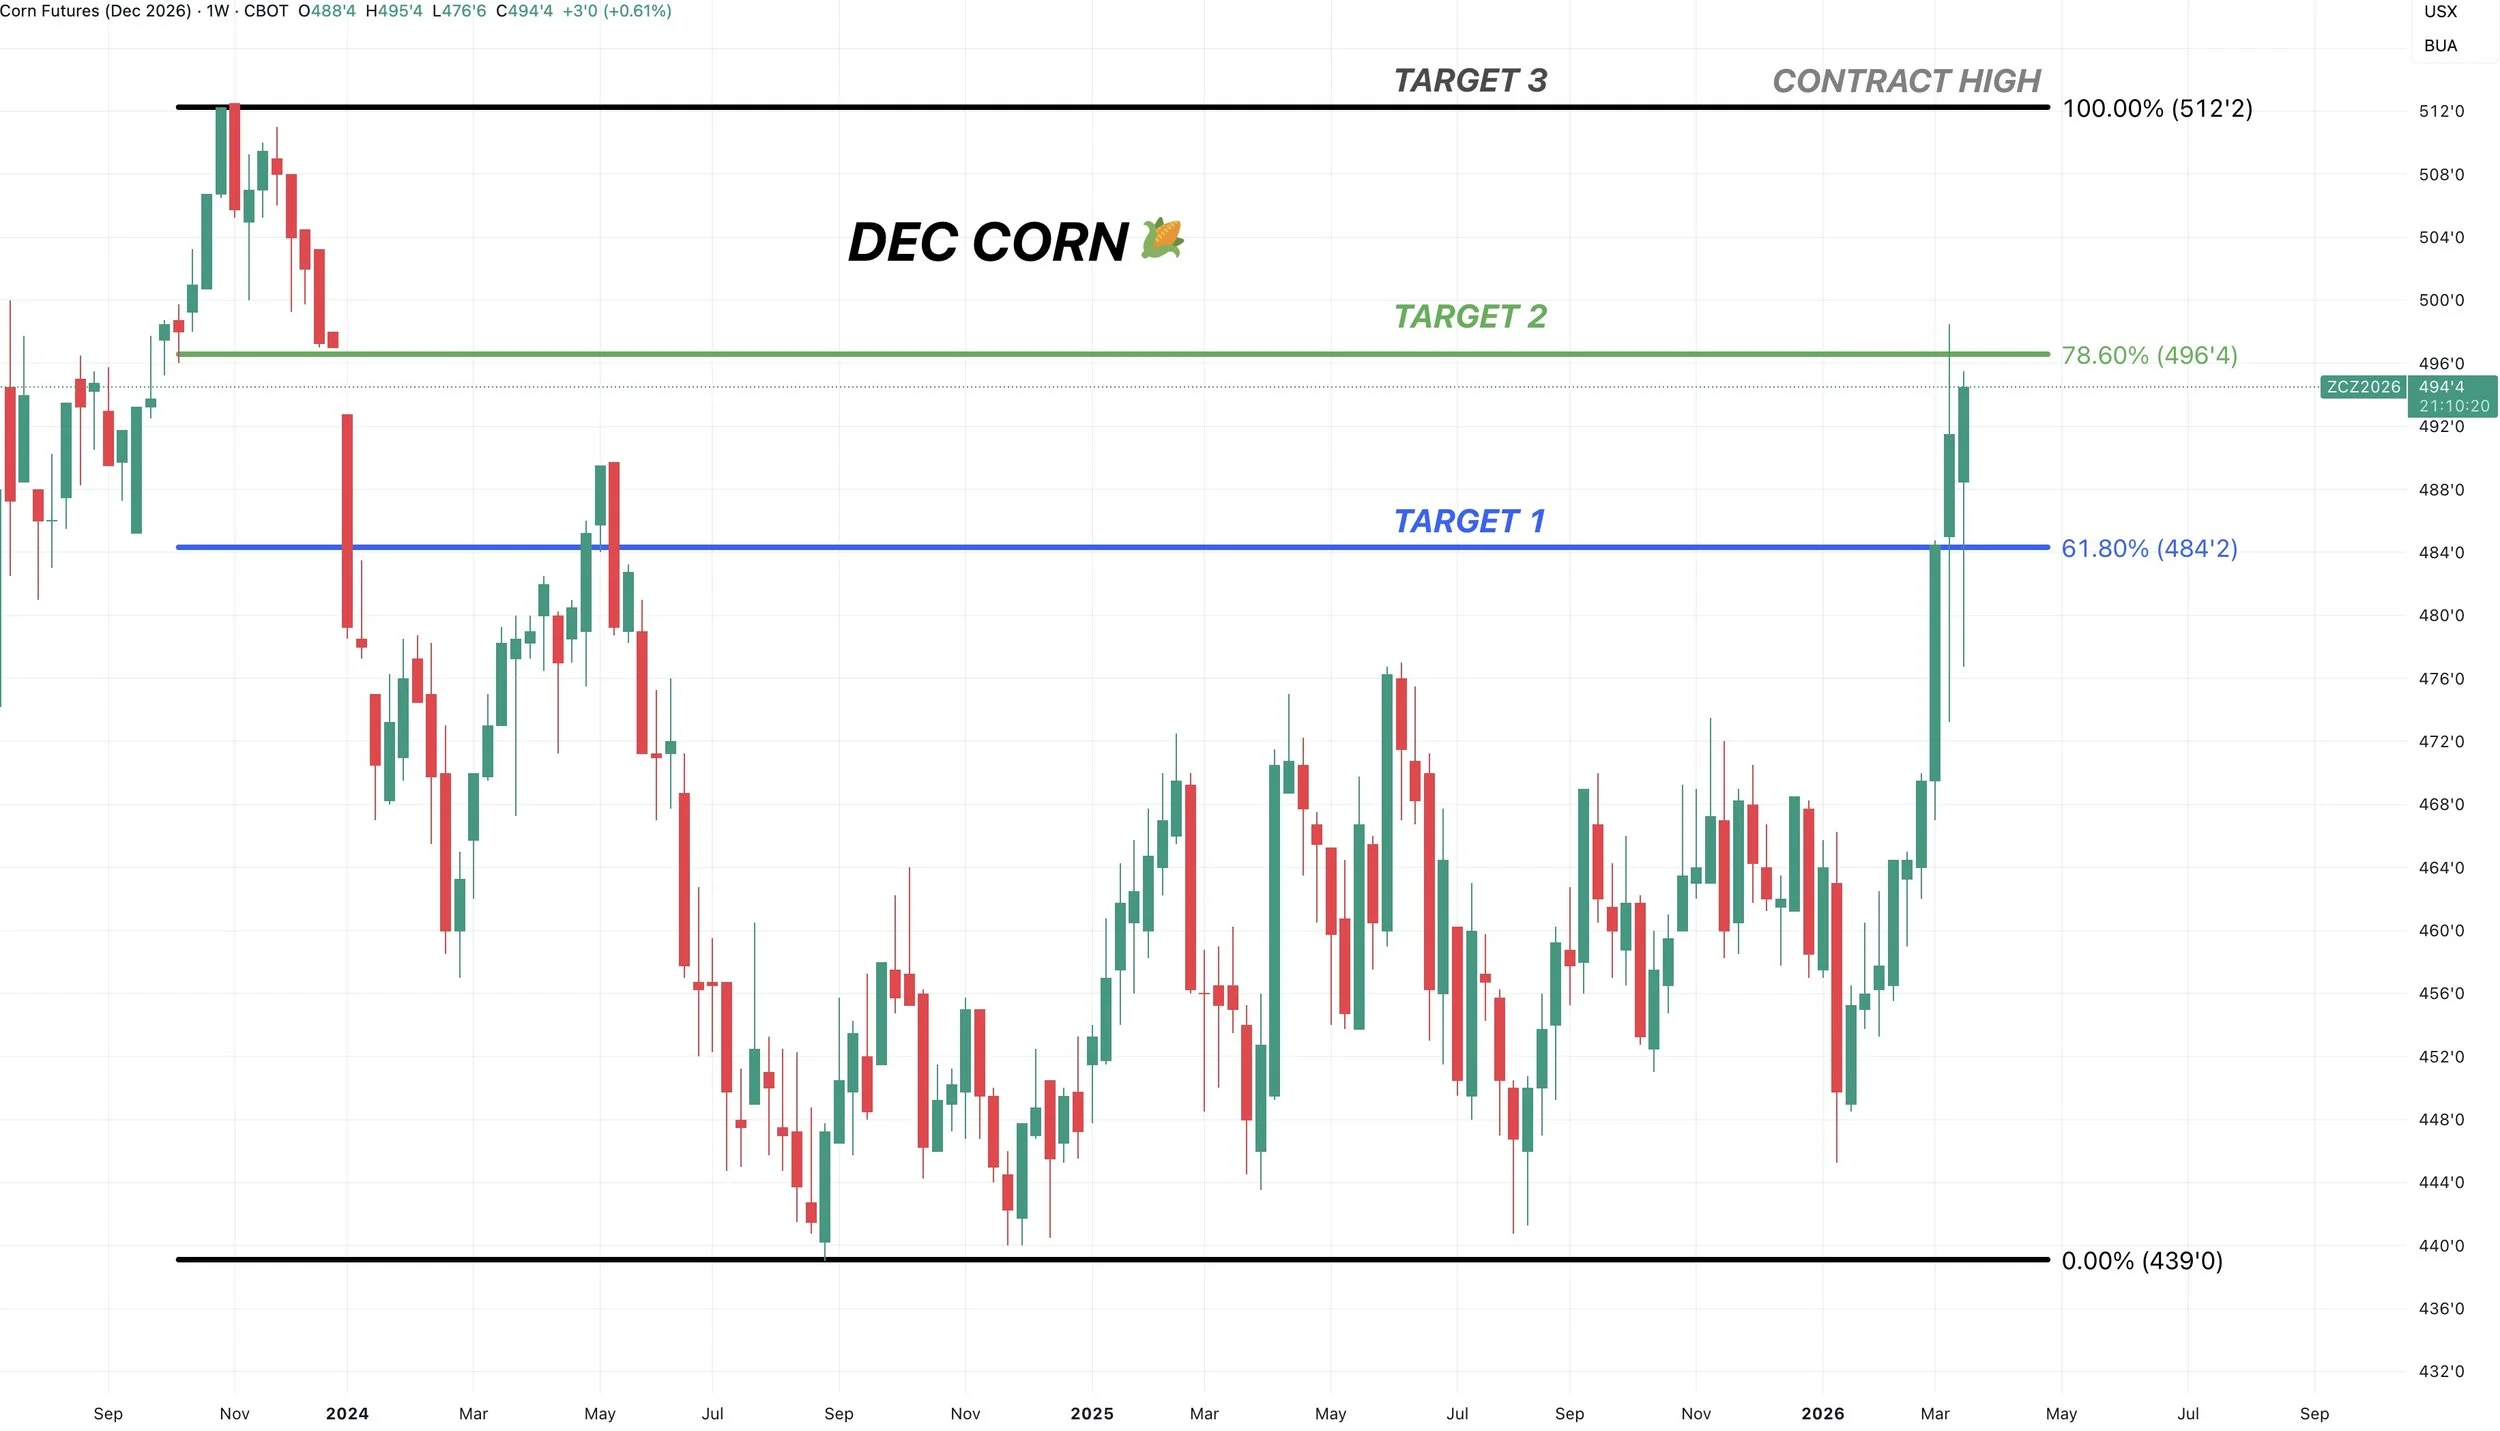
Dec Weekly Corn:
We are right back near those highs from that one Sunday night spike.
So if you feel like you missed out or are behind in your marketing, I like doing something here.
We are very close to that $4.97 target again.
Which is 78.6% of the contract highs and where we left a gap.
Next target is going to be the contract highs at $5.12
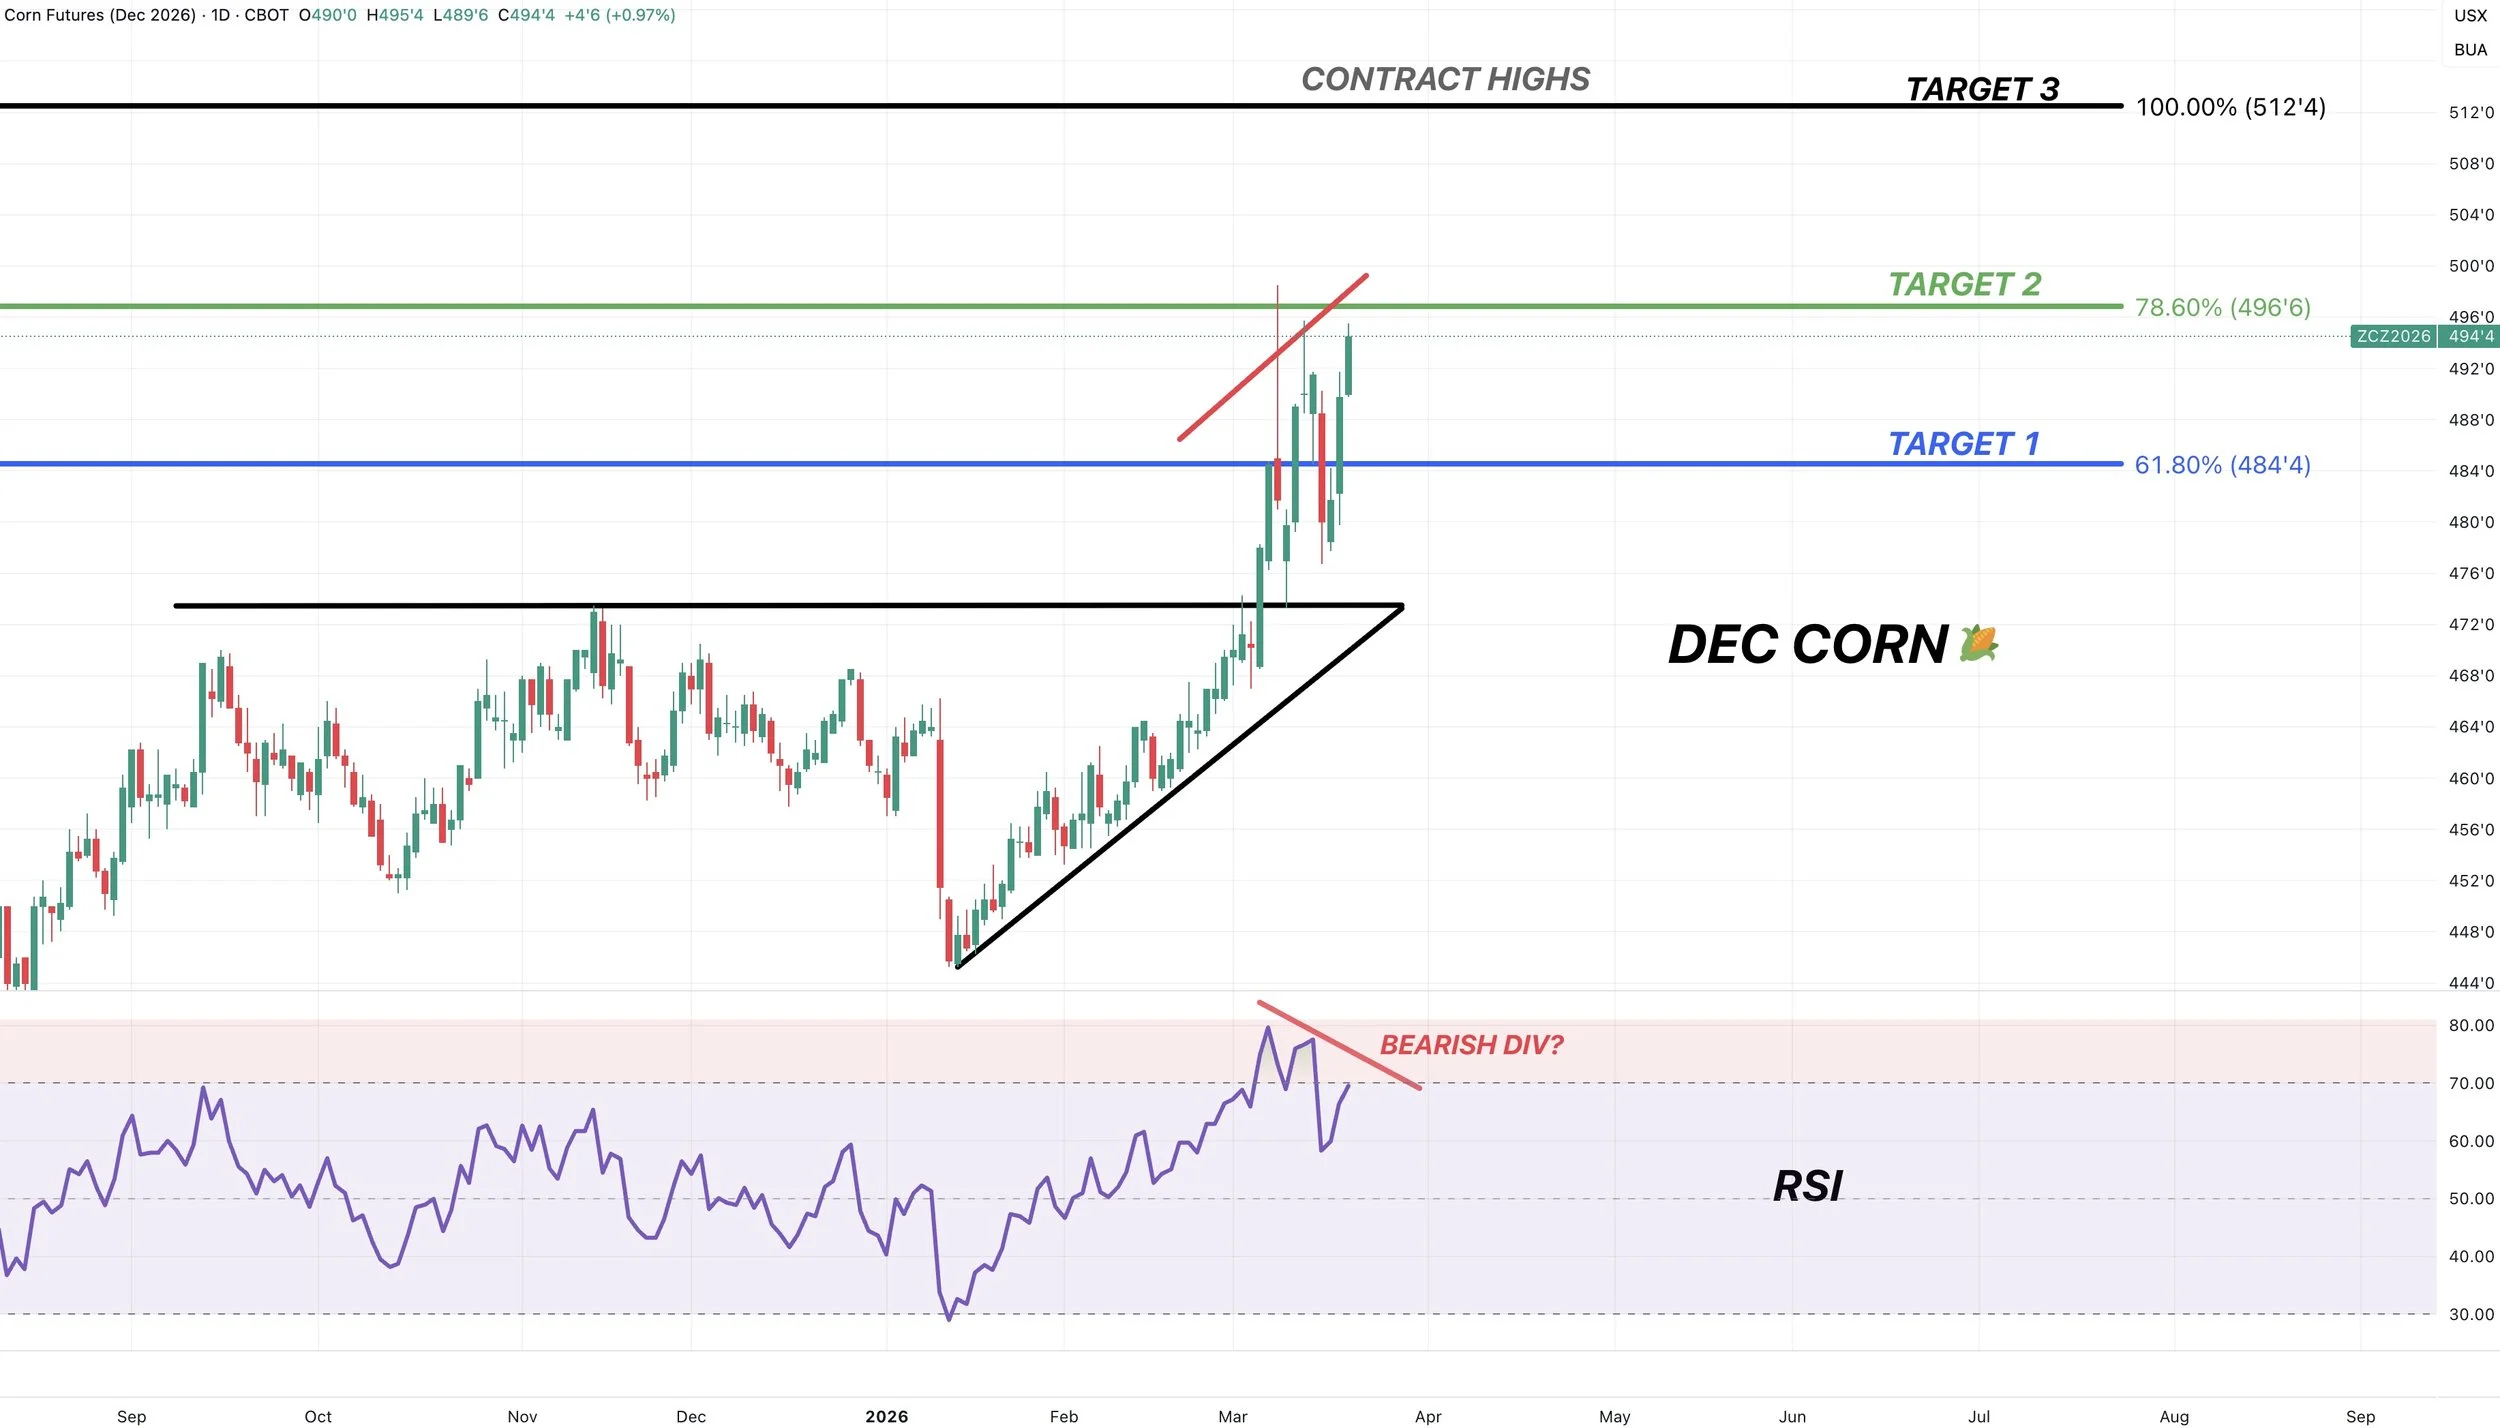
Dec Daily Chart:
Here is the daily chart to give you another view.
We are also showing some bearish divergence here, which is why I want to look to protect this level.
Prices are making new highs, the RSI is not. It can often be a sign of losing momentum.
I will likely alert a signal tomorrow if we hit that next target, but you can of course always have a target order in.
Again, we are not getting carried away and selling everything. But makes sense to do a small amount.
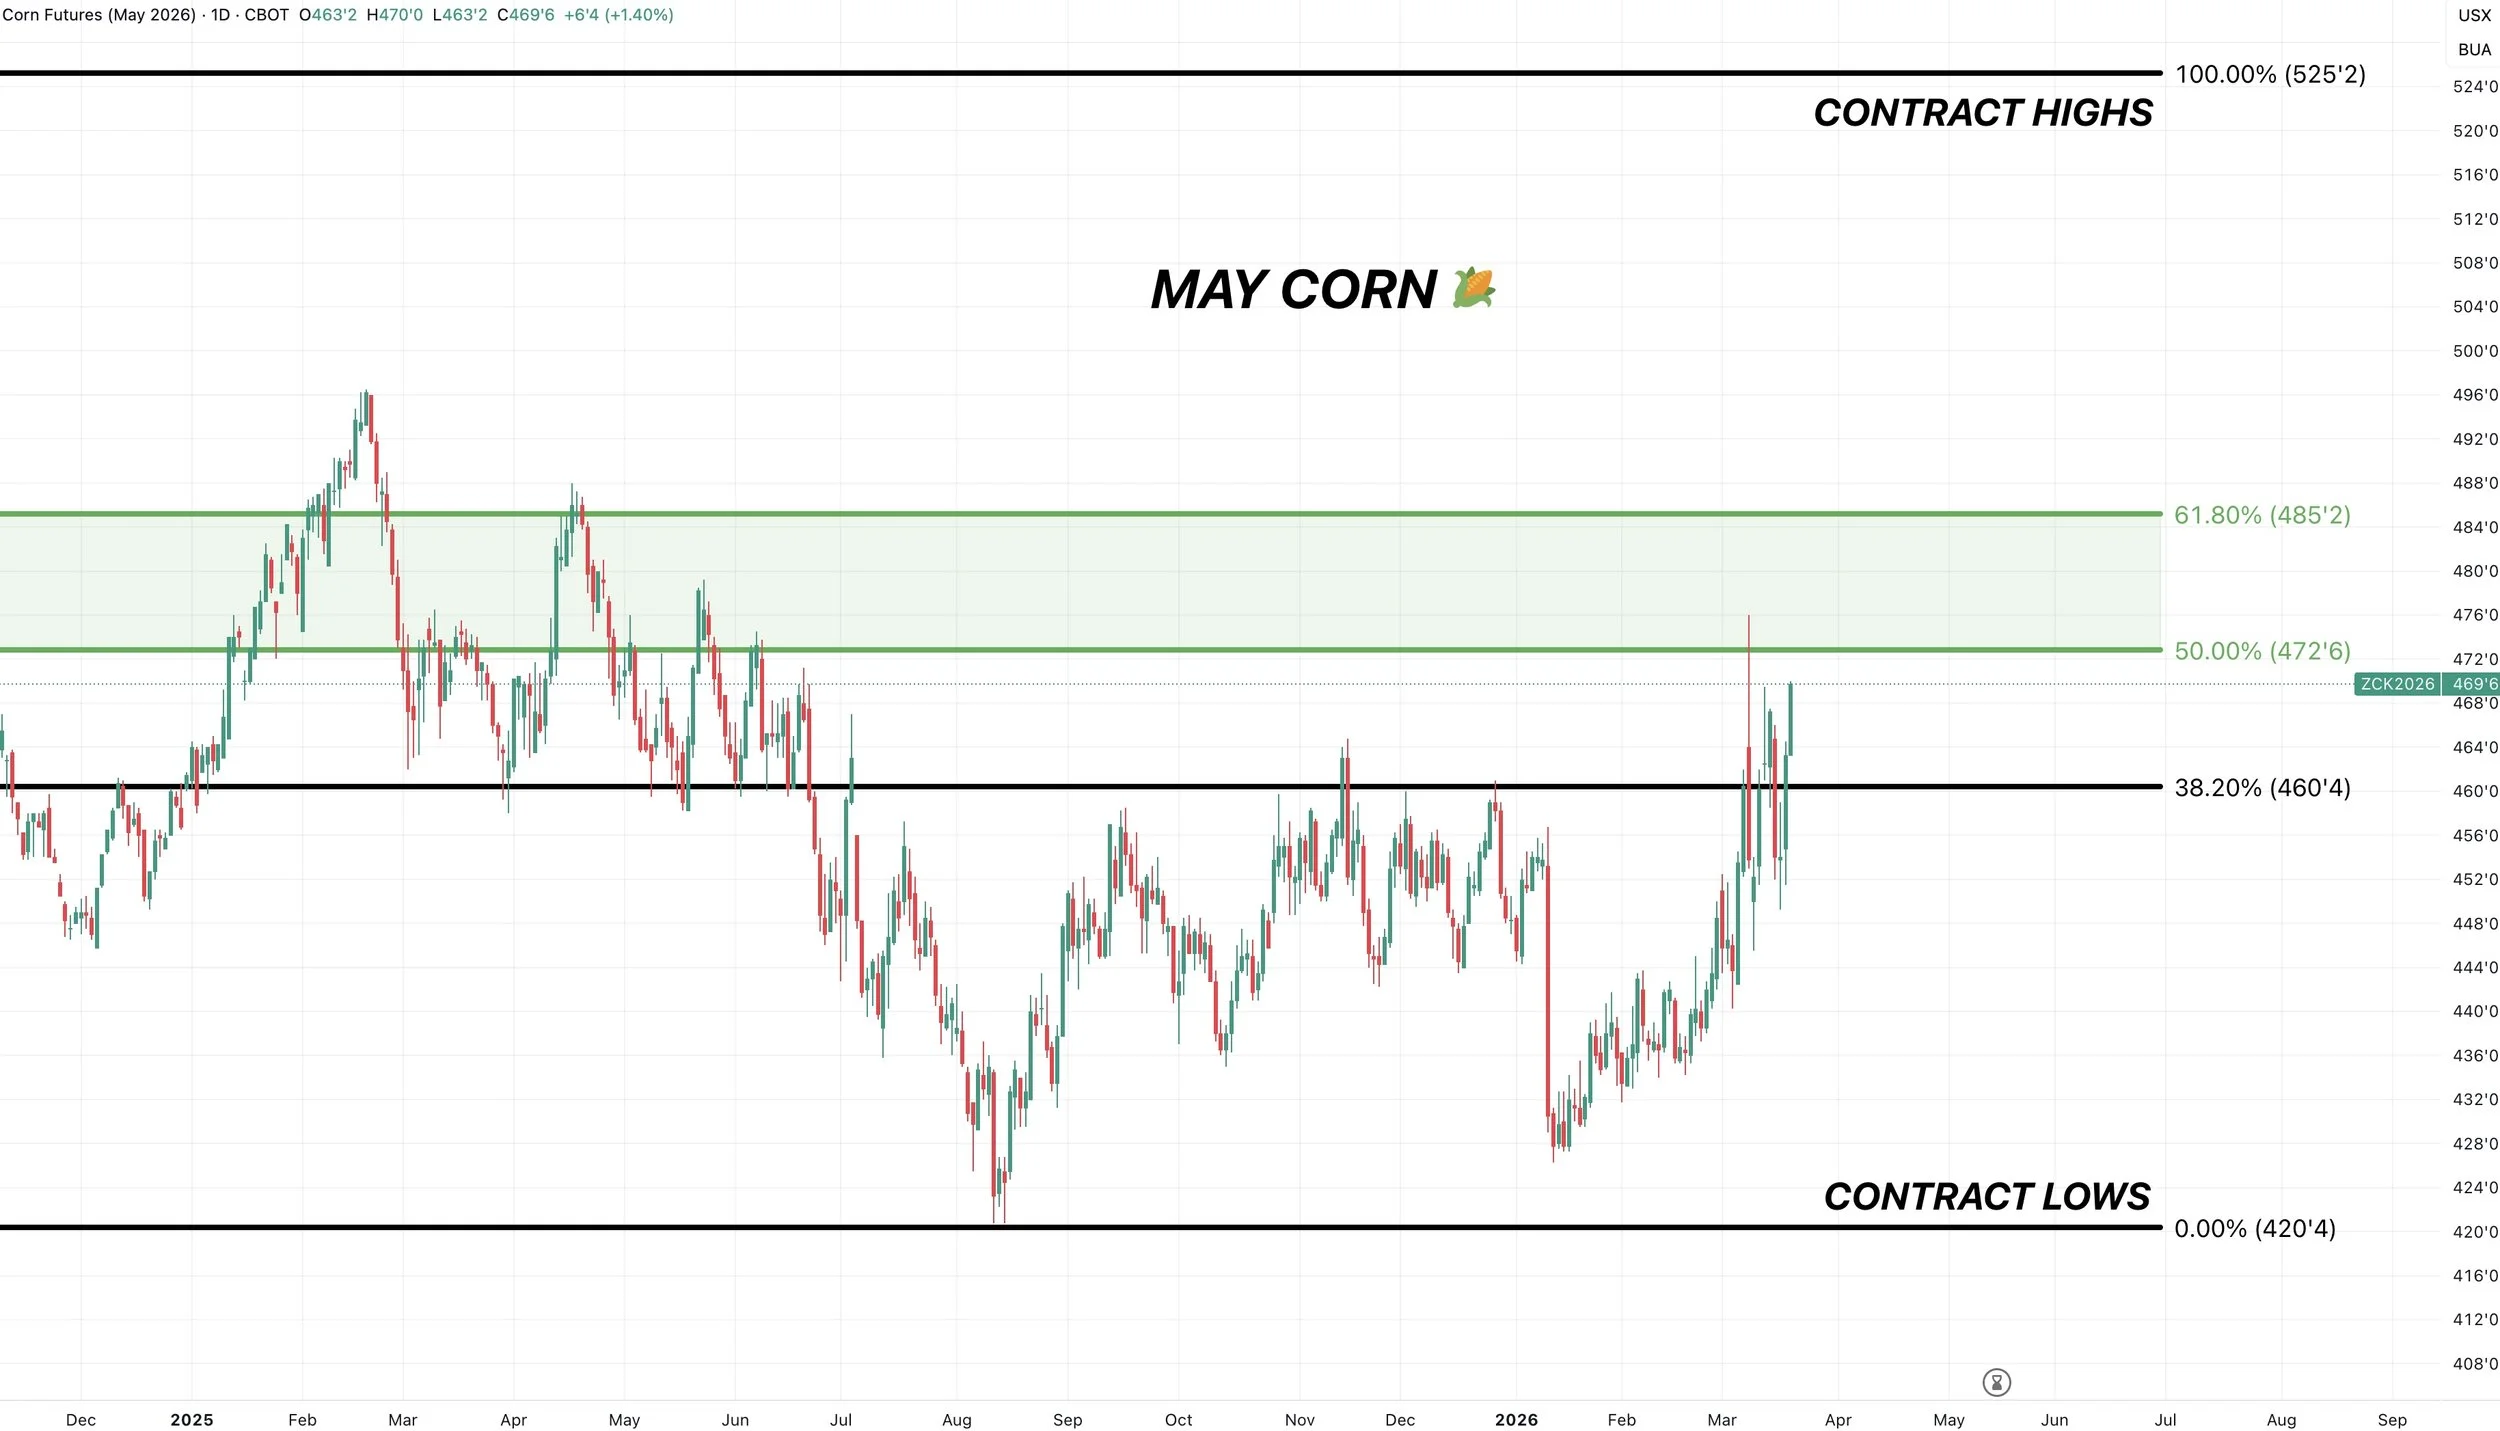
May Corn:
I like rewarding a move between $4.73 to $4.85
That is 50% to 61.8% from the contract lows to the contract highs.
Common area to struggle.
If you notice, we struggled at the 38.2% level back in November.
Like Dec, if we get another day higher I will likely look to take some chips off the table and alert a signal.
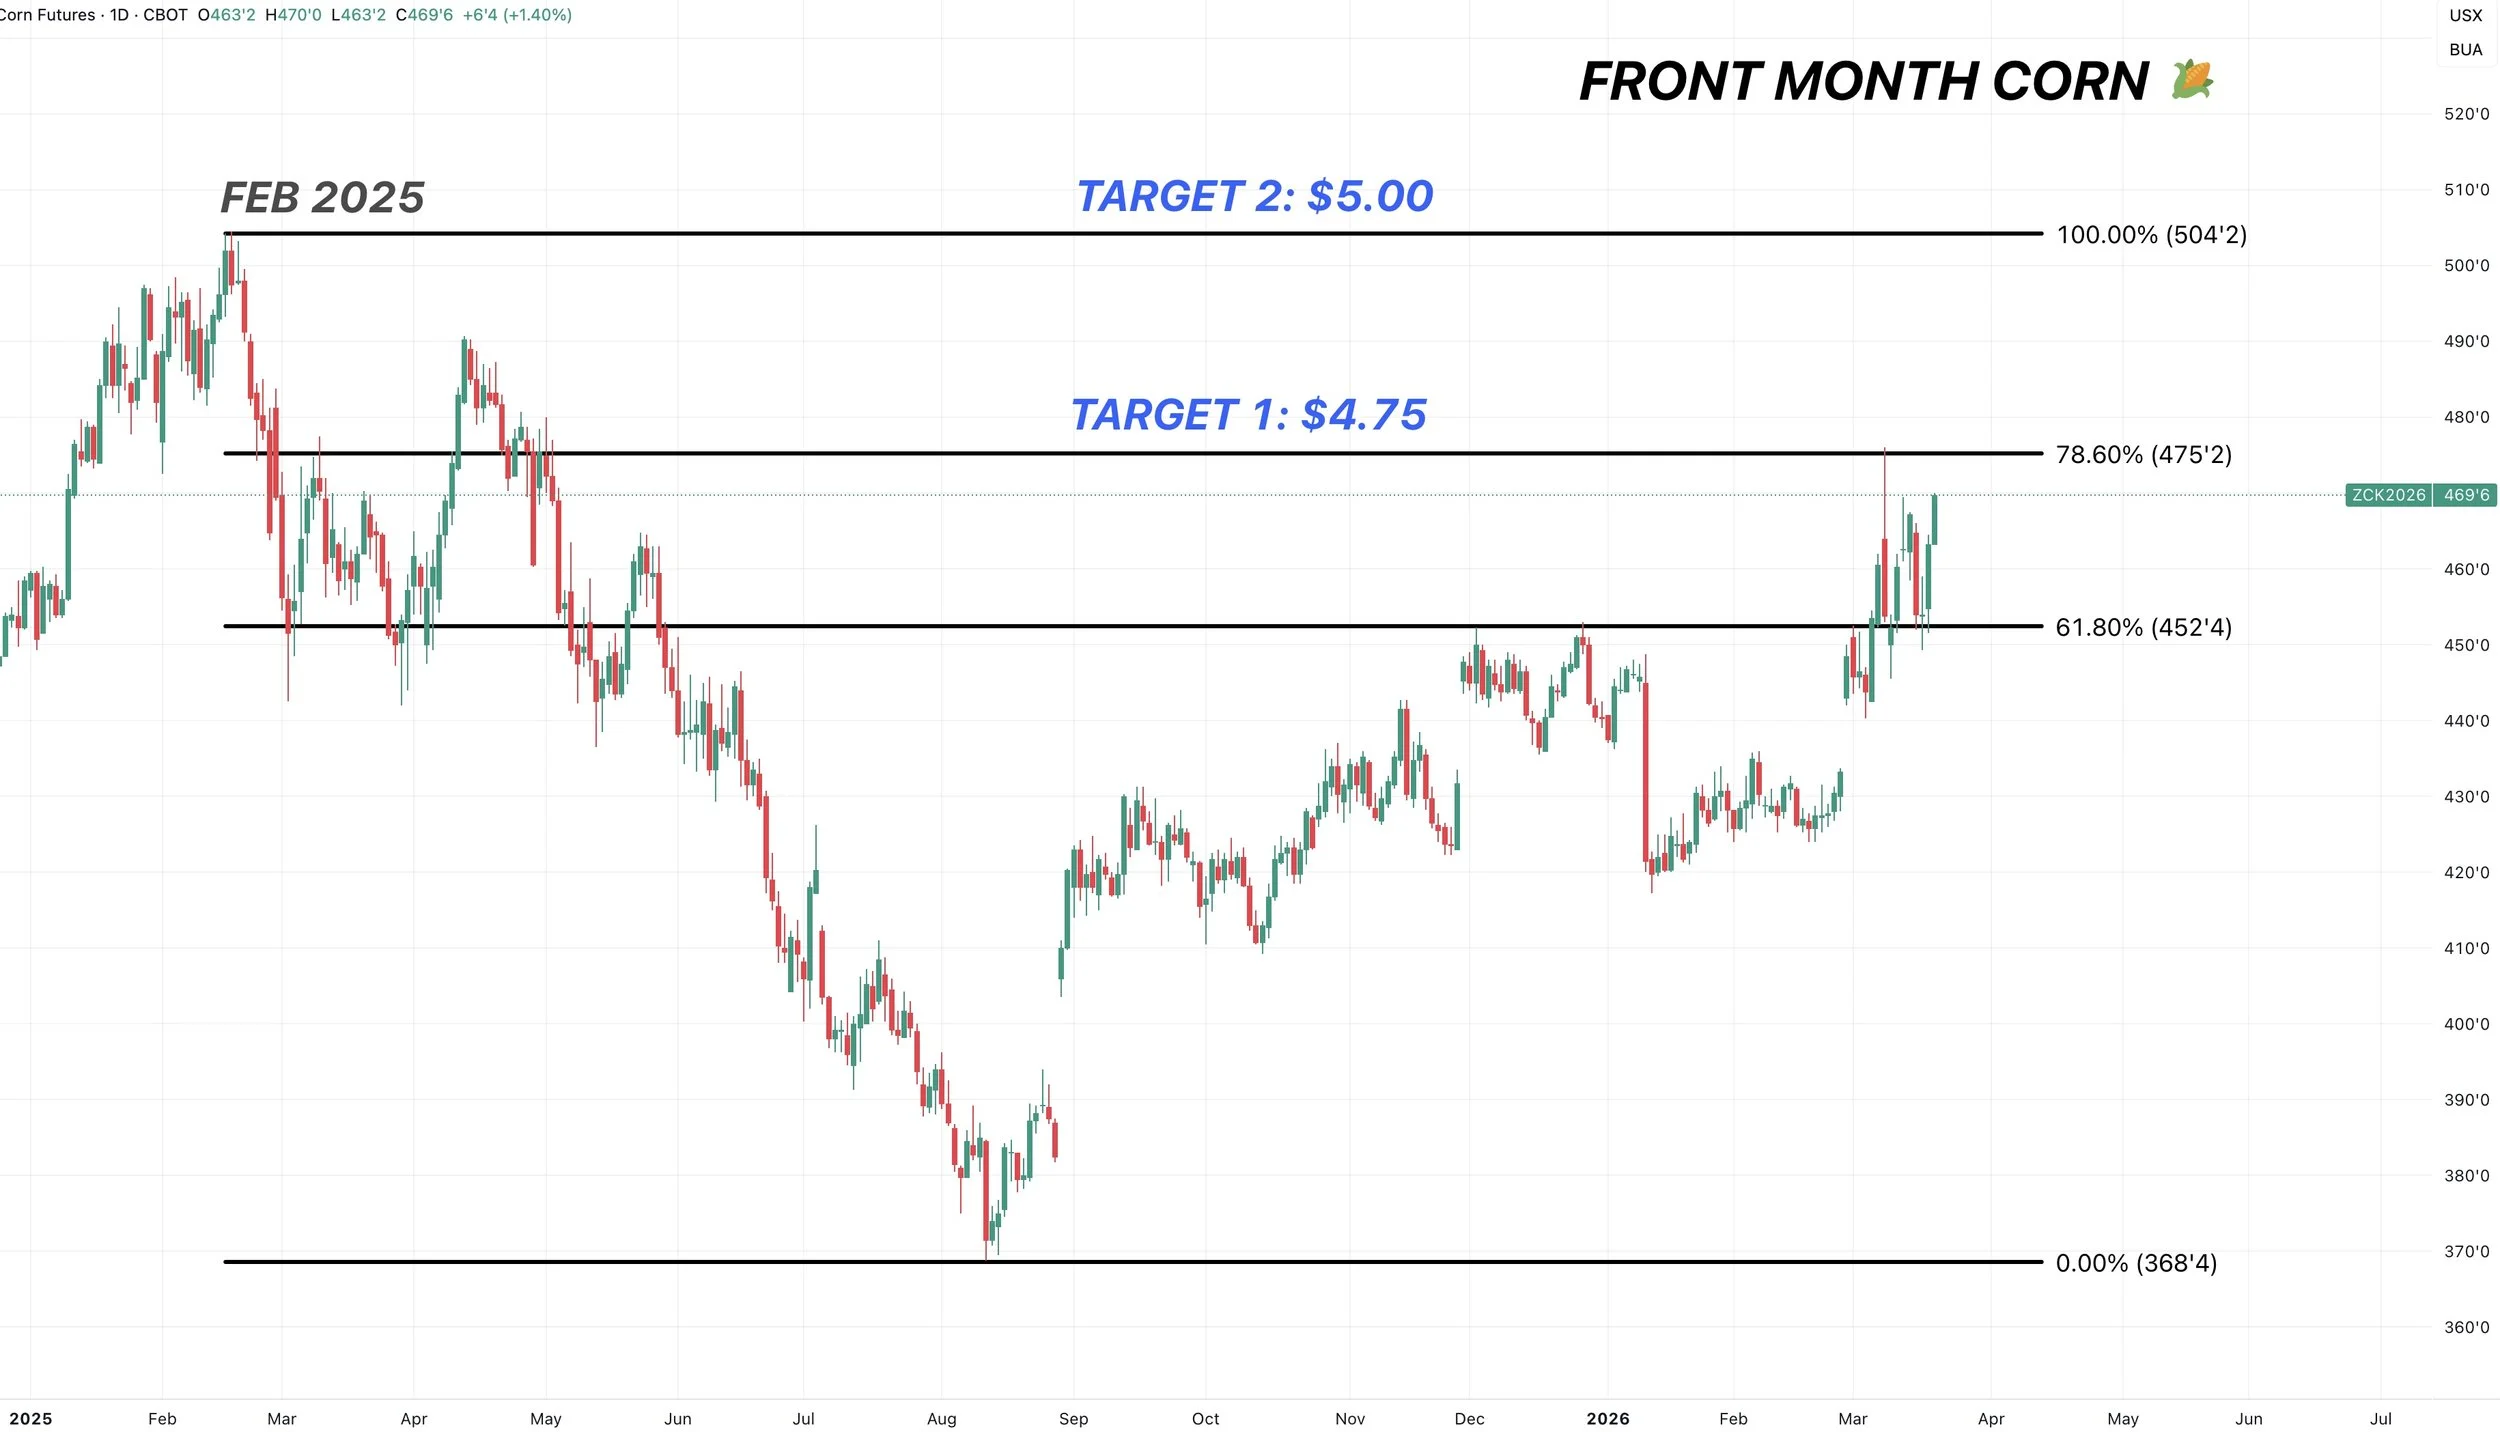
Front Month Corn Chart:
That target box on May aligns with the next target on the continuous chart.
Which is 78.6% of the Feb 2025 highs at $4.75
We struggled at the 61.8% level back in November.
Next target after this will be $5.00 and those highs from last February.
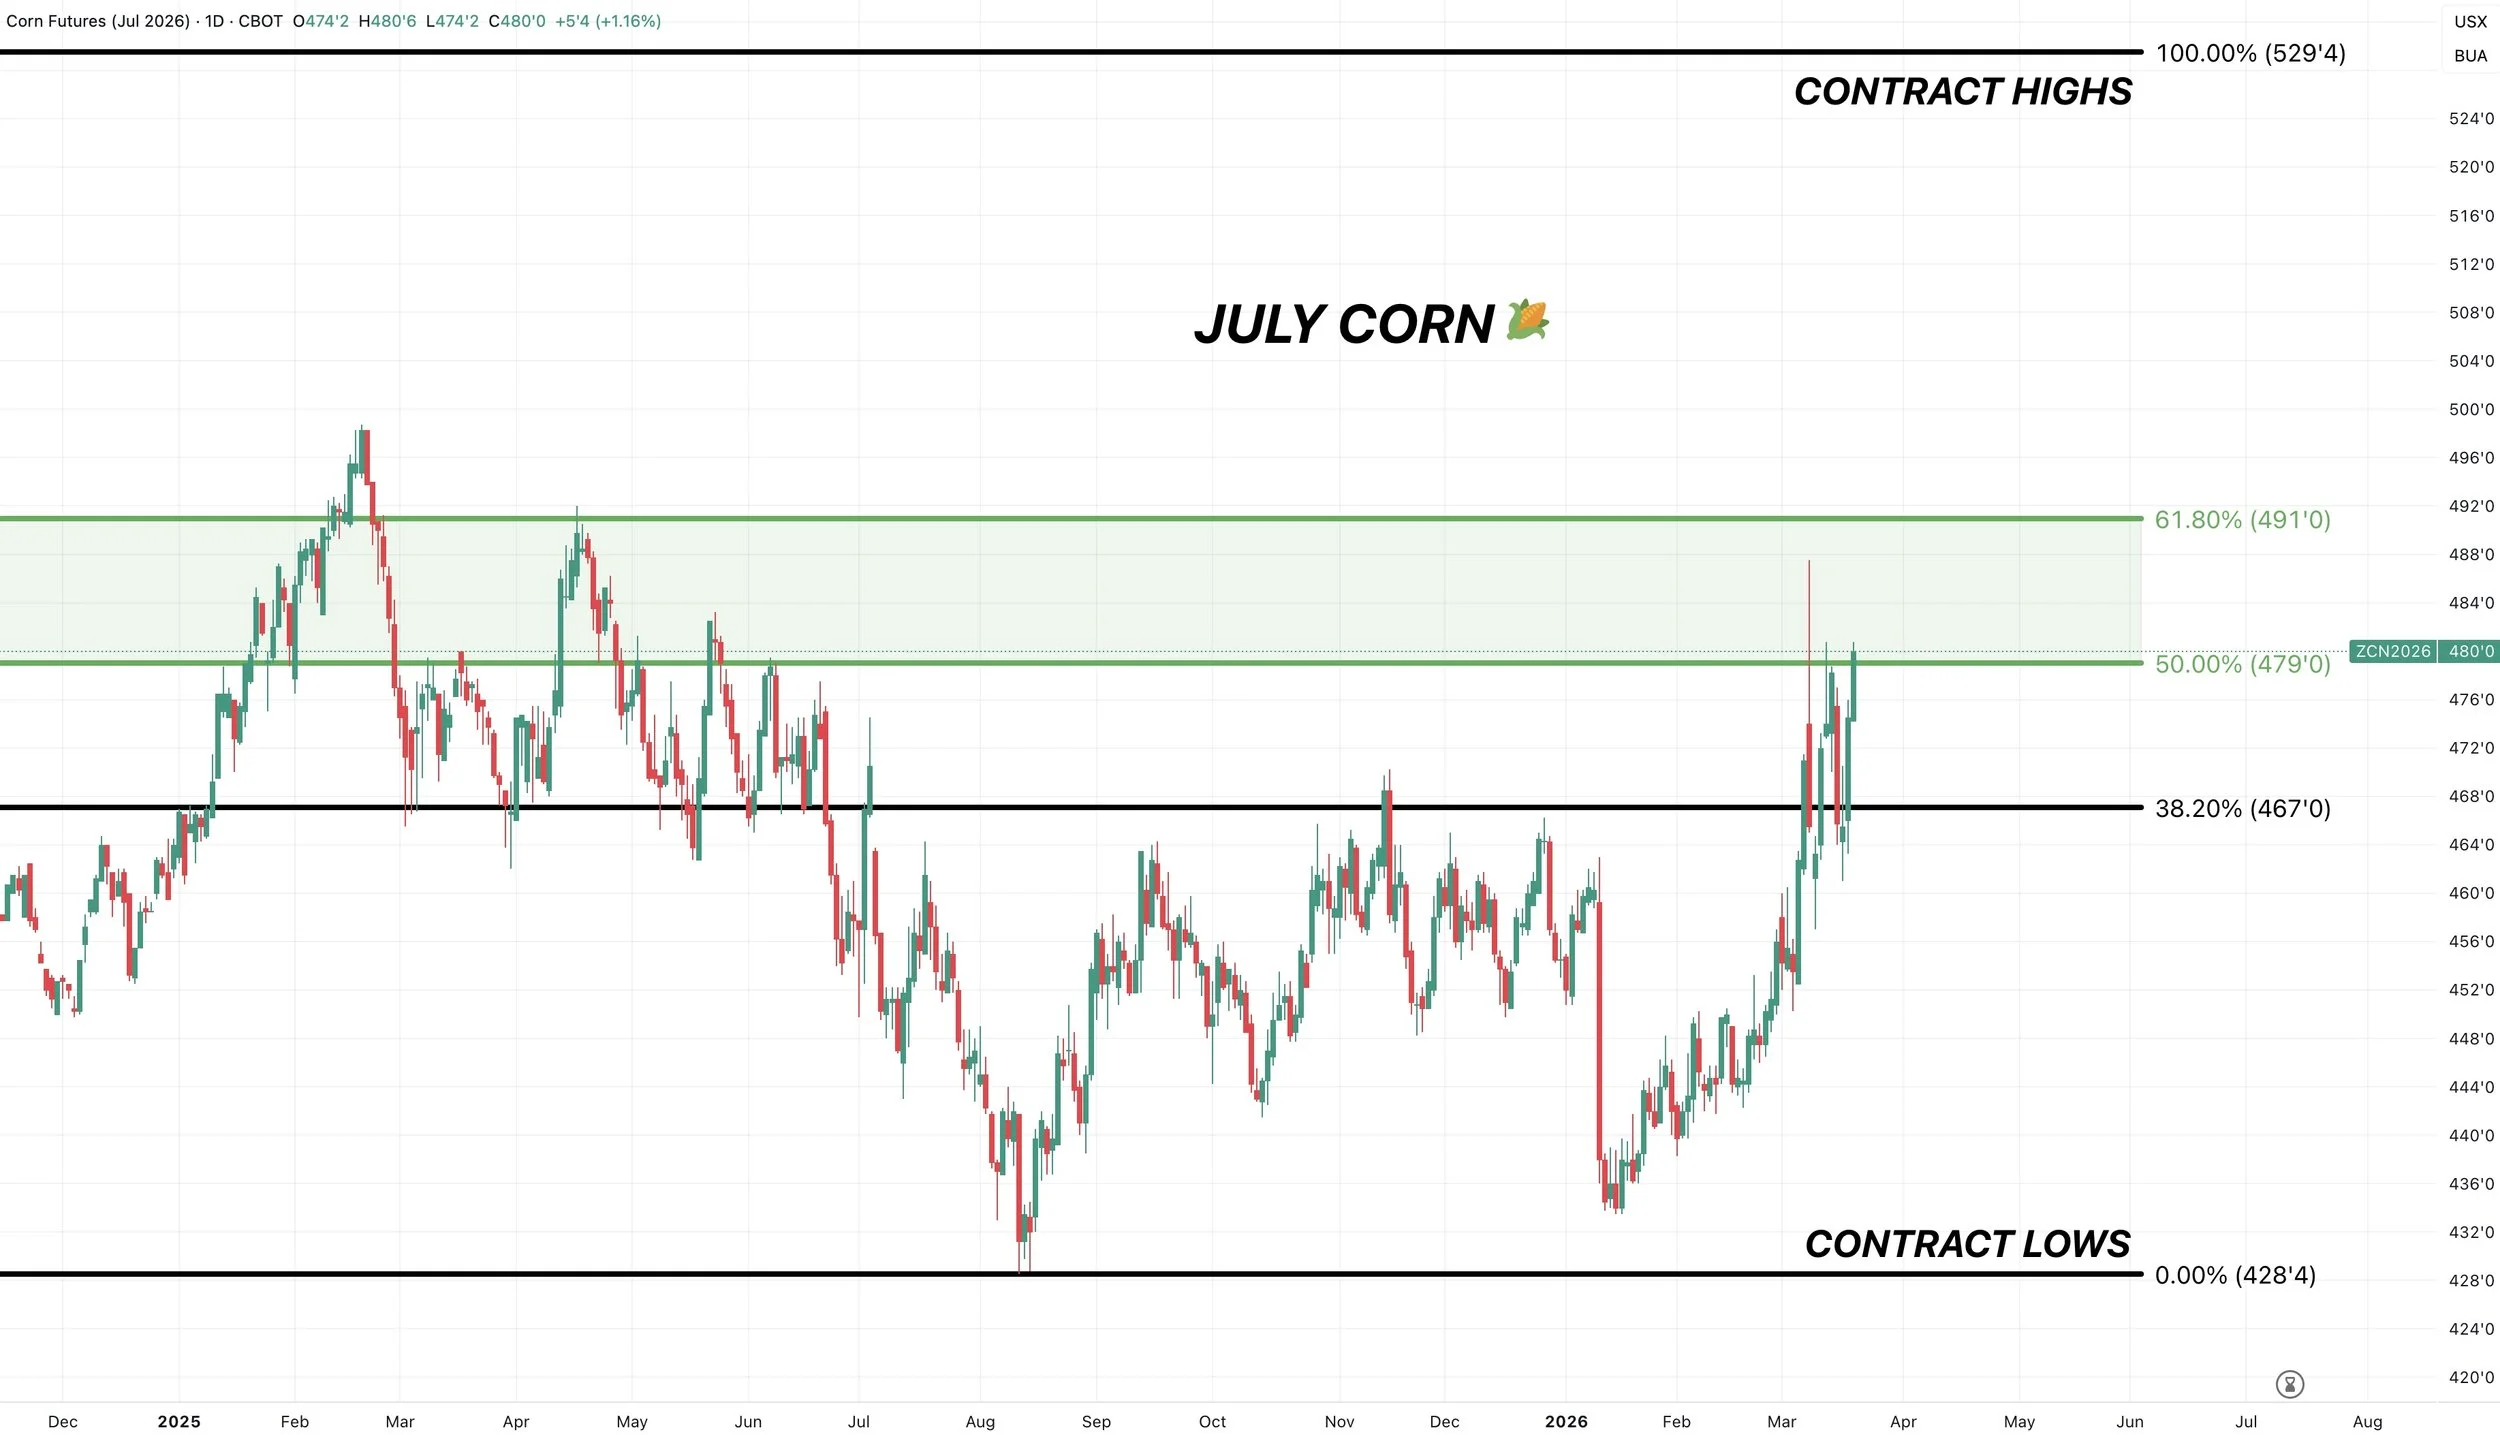
July Corn:
I like rewarding a move between $4.80 and $4.90
The golden zone retracement from contract lows up to the contract highs.
Like May and Dec, will likely alert a signal if we come up into the box tomorrow.
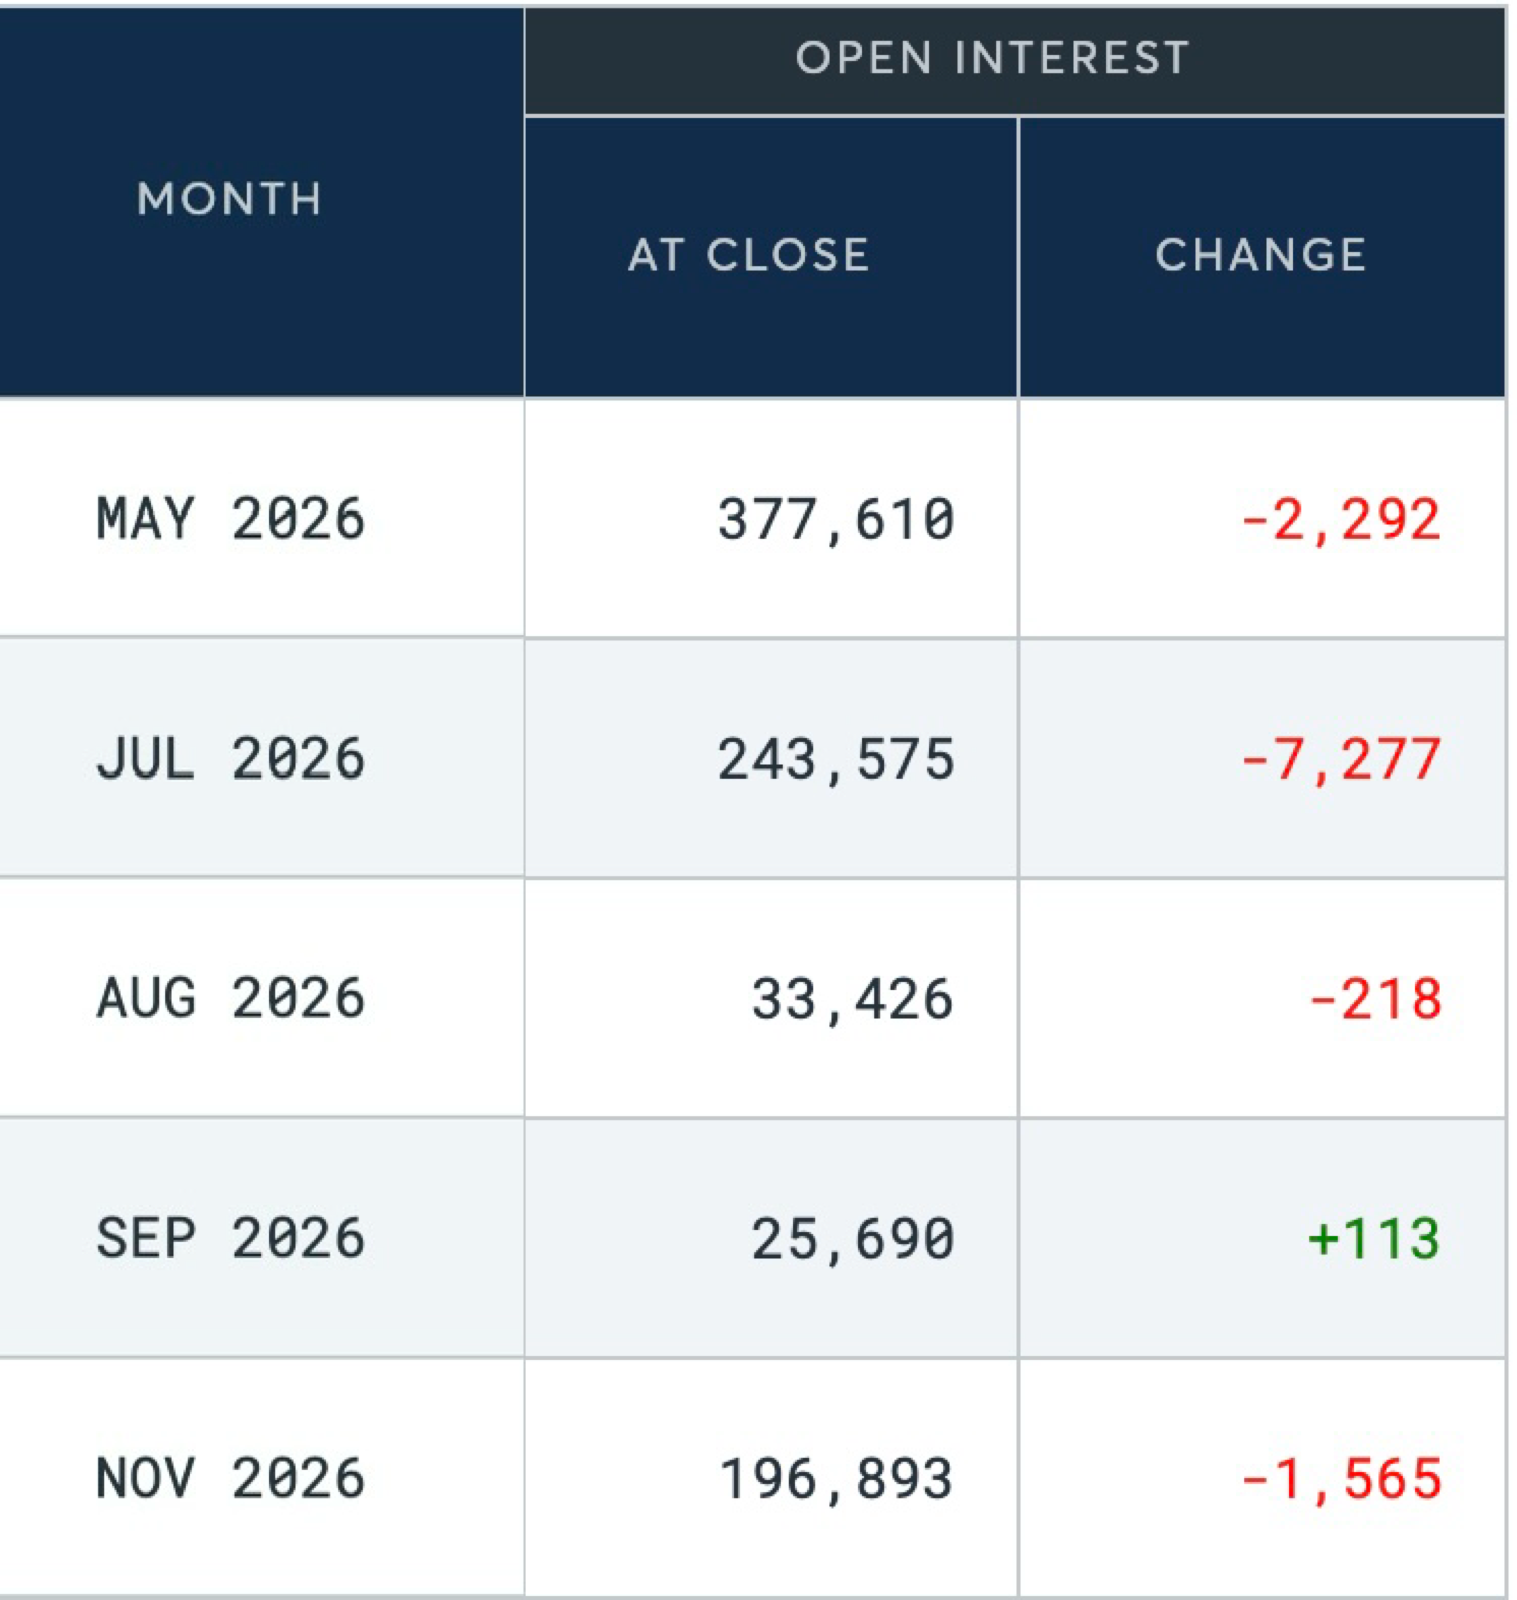
Soybeans
Mainly going to look at the charts today.
It's the same old news for soybeans. Waiting for that meeting with China.
China has yet to buy any new crop soybeans. So that does make wonder if we are going to see something on the books ahead of that meeting.
As normally, they have some on the books by now. As they are expected to still commit to that 25 MMT for new crop.
The biggest question is of course will they buy old crop soybeans or not? Impossible to know.
The market doesn’t seem to think so. Which is why new crop soybeans have actually put together a nice rally while old crop is still well off the highs.
So that spread fell apart. Narrowing by 40 cents.
Basically traders were selling their old crop to buy new crop.
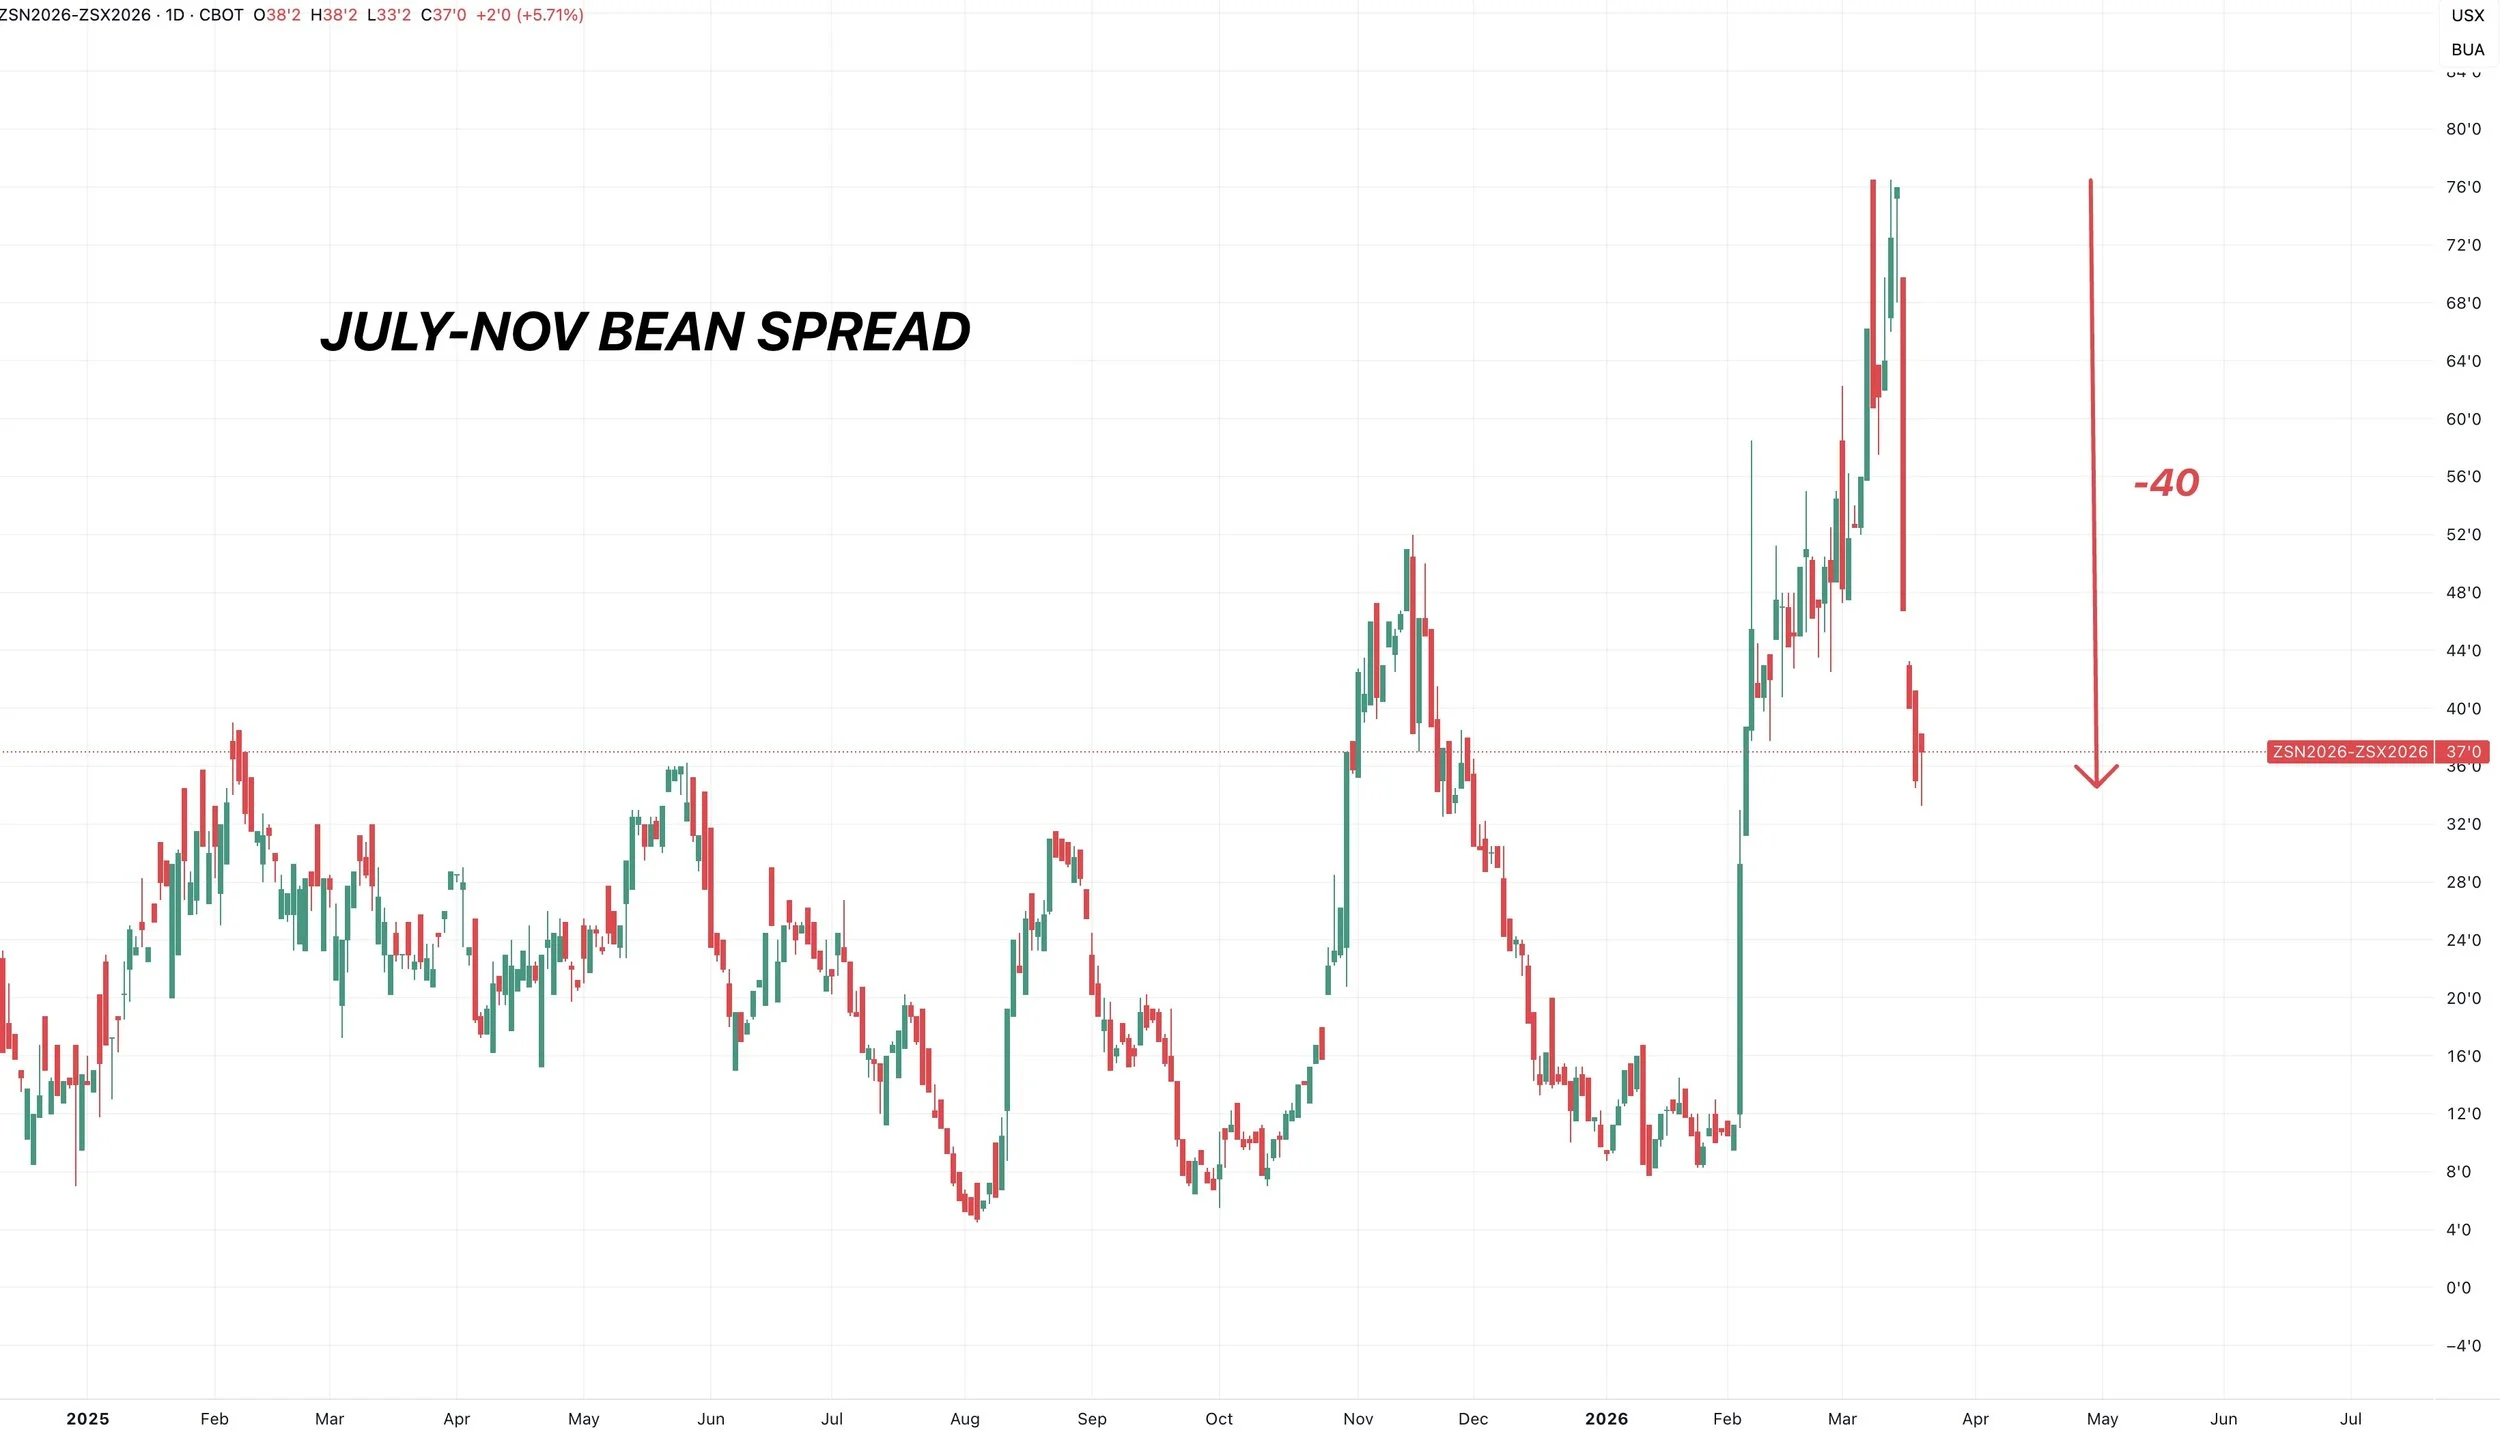
However, it looks like they might be potentially done doing that.
If we look at open interest yesterday, it was down in both July and Nov. Yet we traded higher.
This means that funds were exiting their short positions, rather than buying new long positions.
If it was fresh longs entering the market, open interest would have gone up.
So it feels like the funds might be taking off their short spread. Because open interest dropped in both contracts and we traded higher.
Something to note is that since this is likely just shorts leaving the market, the move is viewed as a short covering rally until you start to see open interest going up. Aka the funds actually adding new longs.
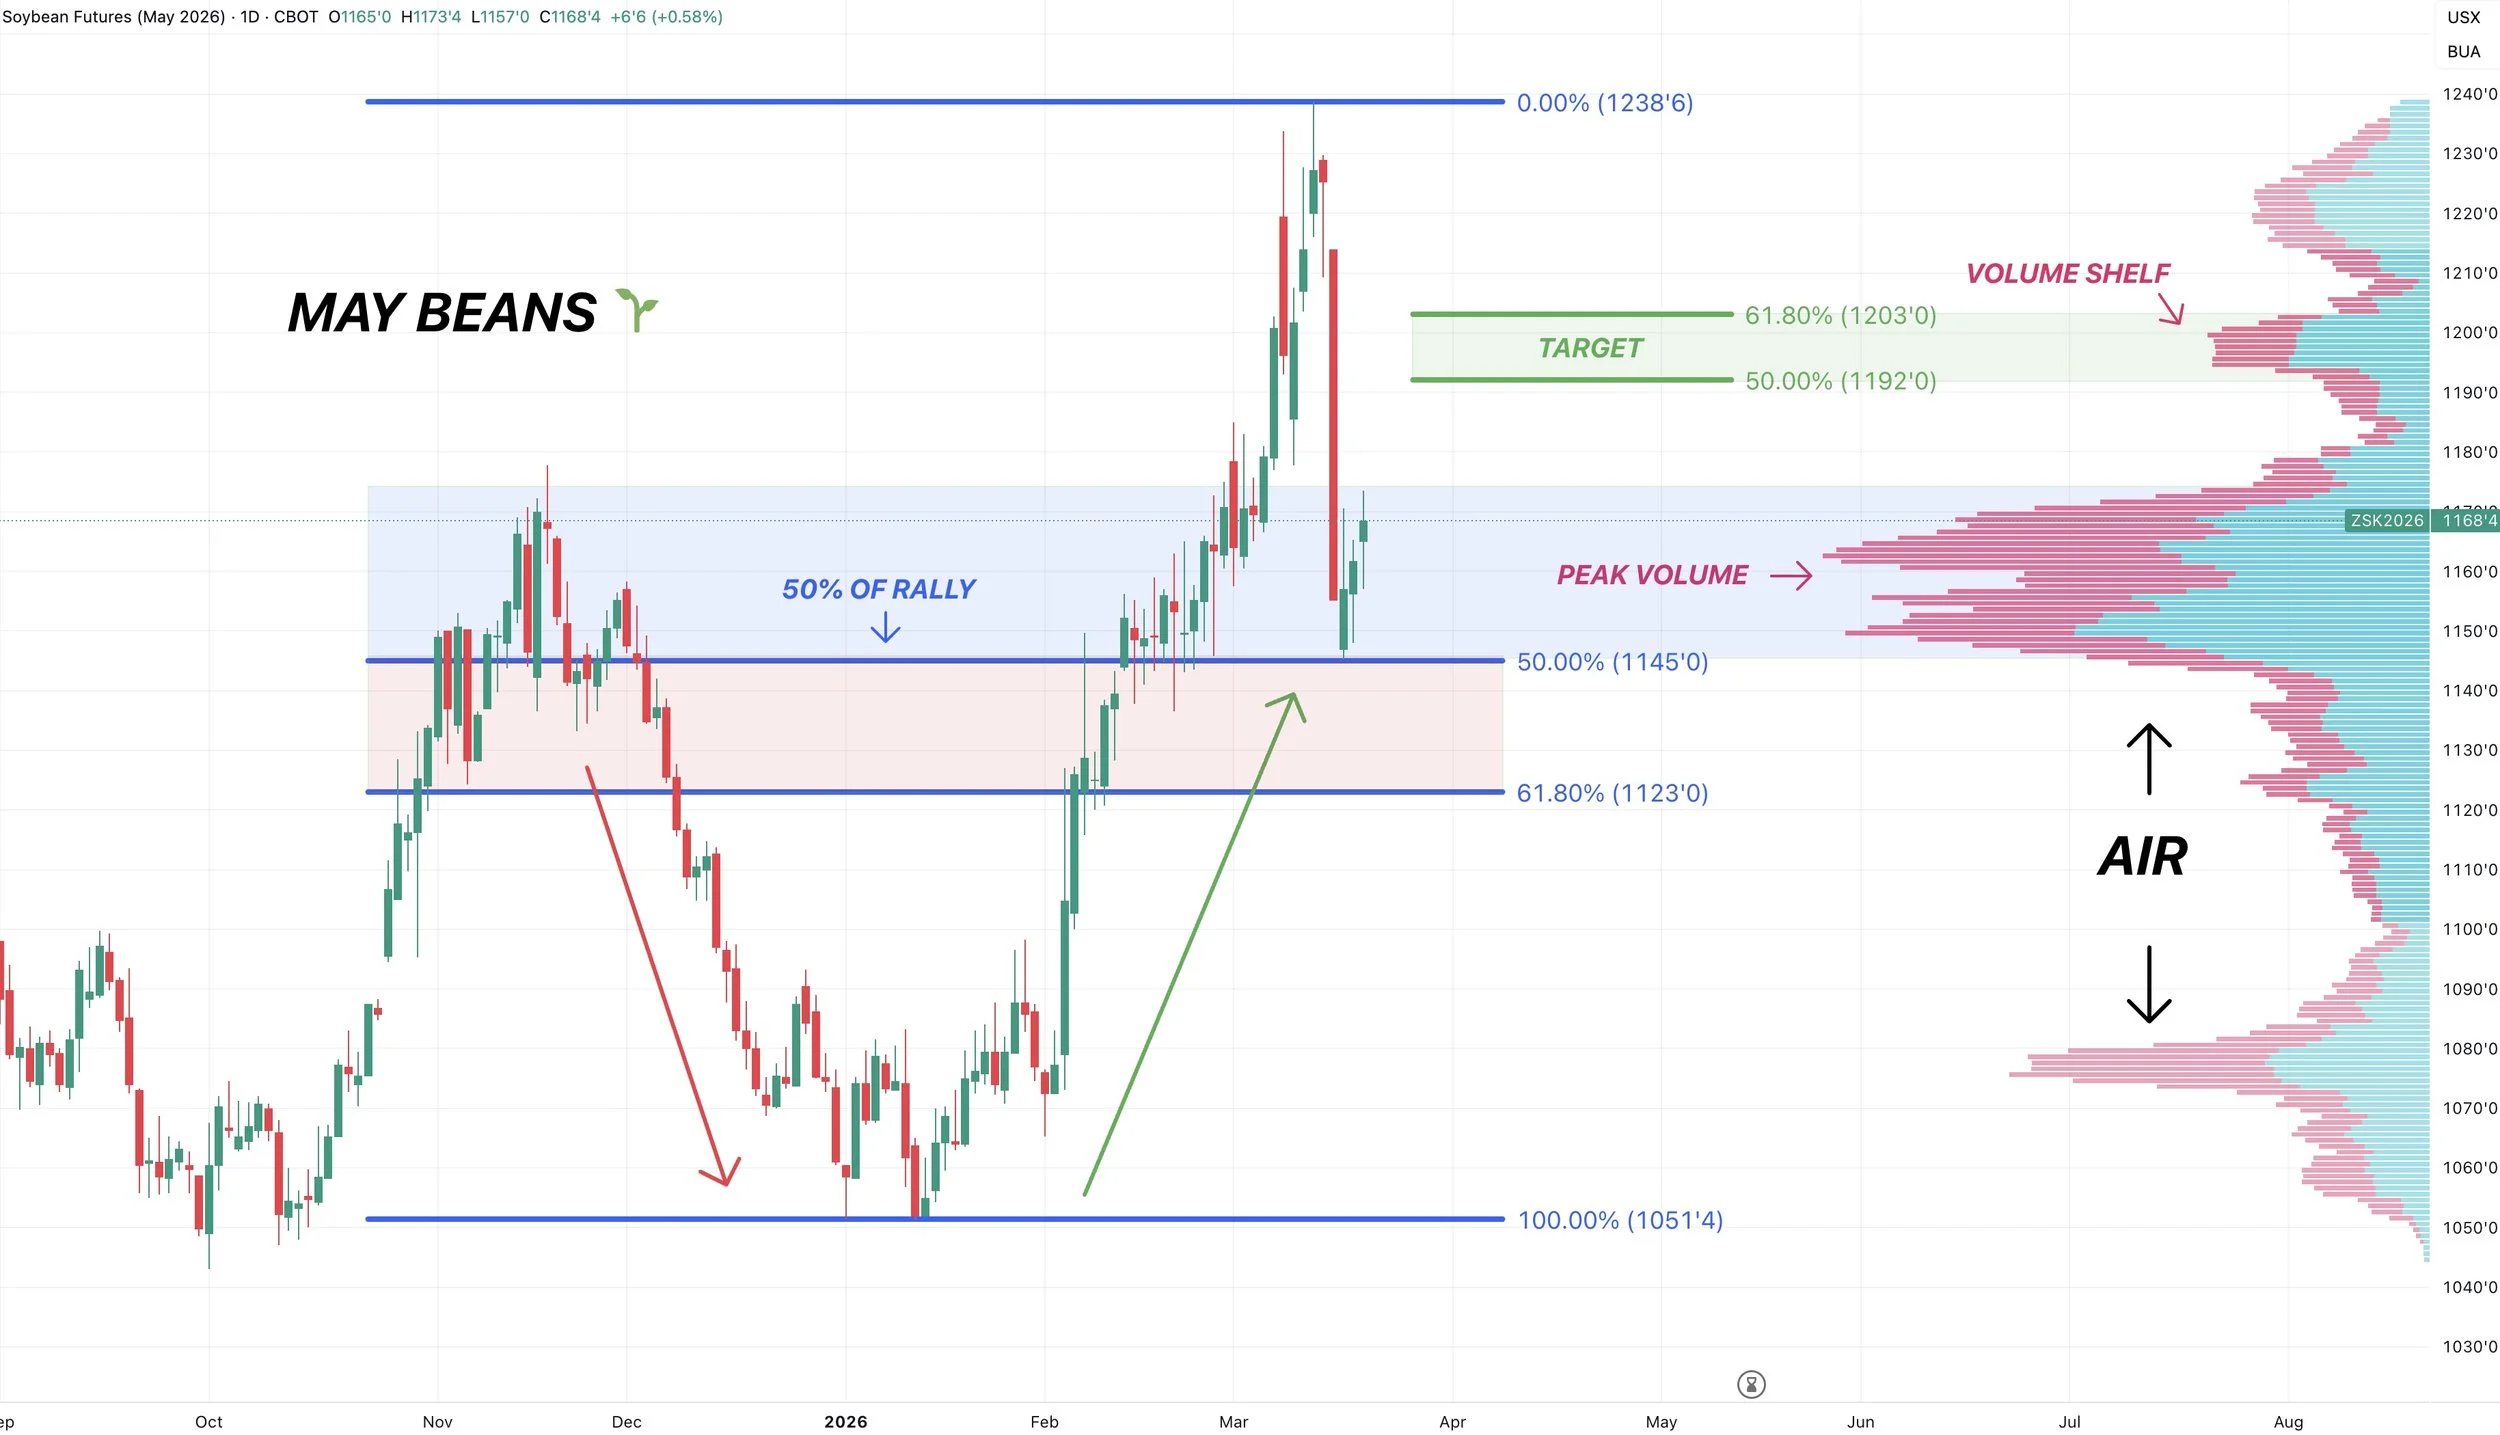
May Beans Chart:
Have we found a bottom?
Here is why we I think we might have at the very least found a local bottom.
We gave back 50% of the entire rally.
This same level is an area of high volume.
Areas of high volume act as magnets. They provide key support and resistance.
Every time we traded under this level, we rallied right through or fell right through. So there is no support beneath here.
Which means that this is a very important spot to hold. If we fail to hold $11.45 it opens the door lower.
But finding some life here would make perfect sense.
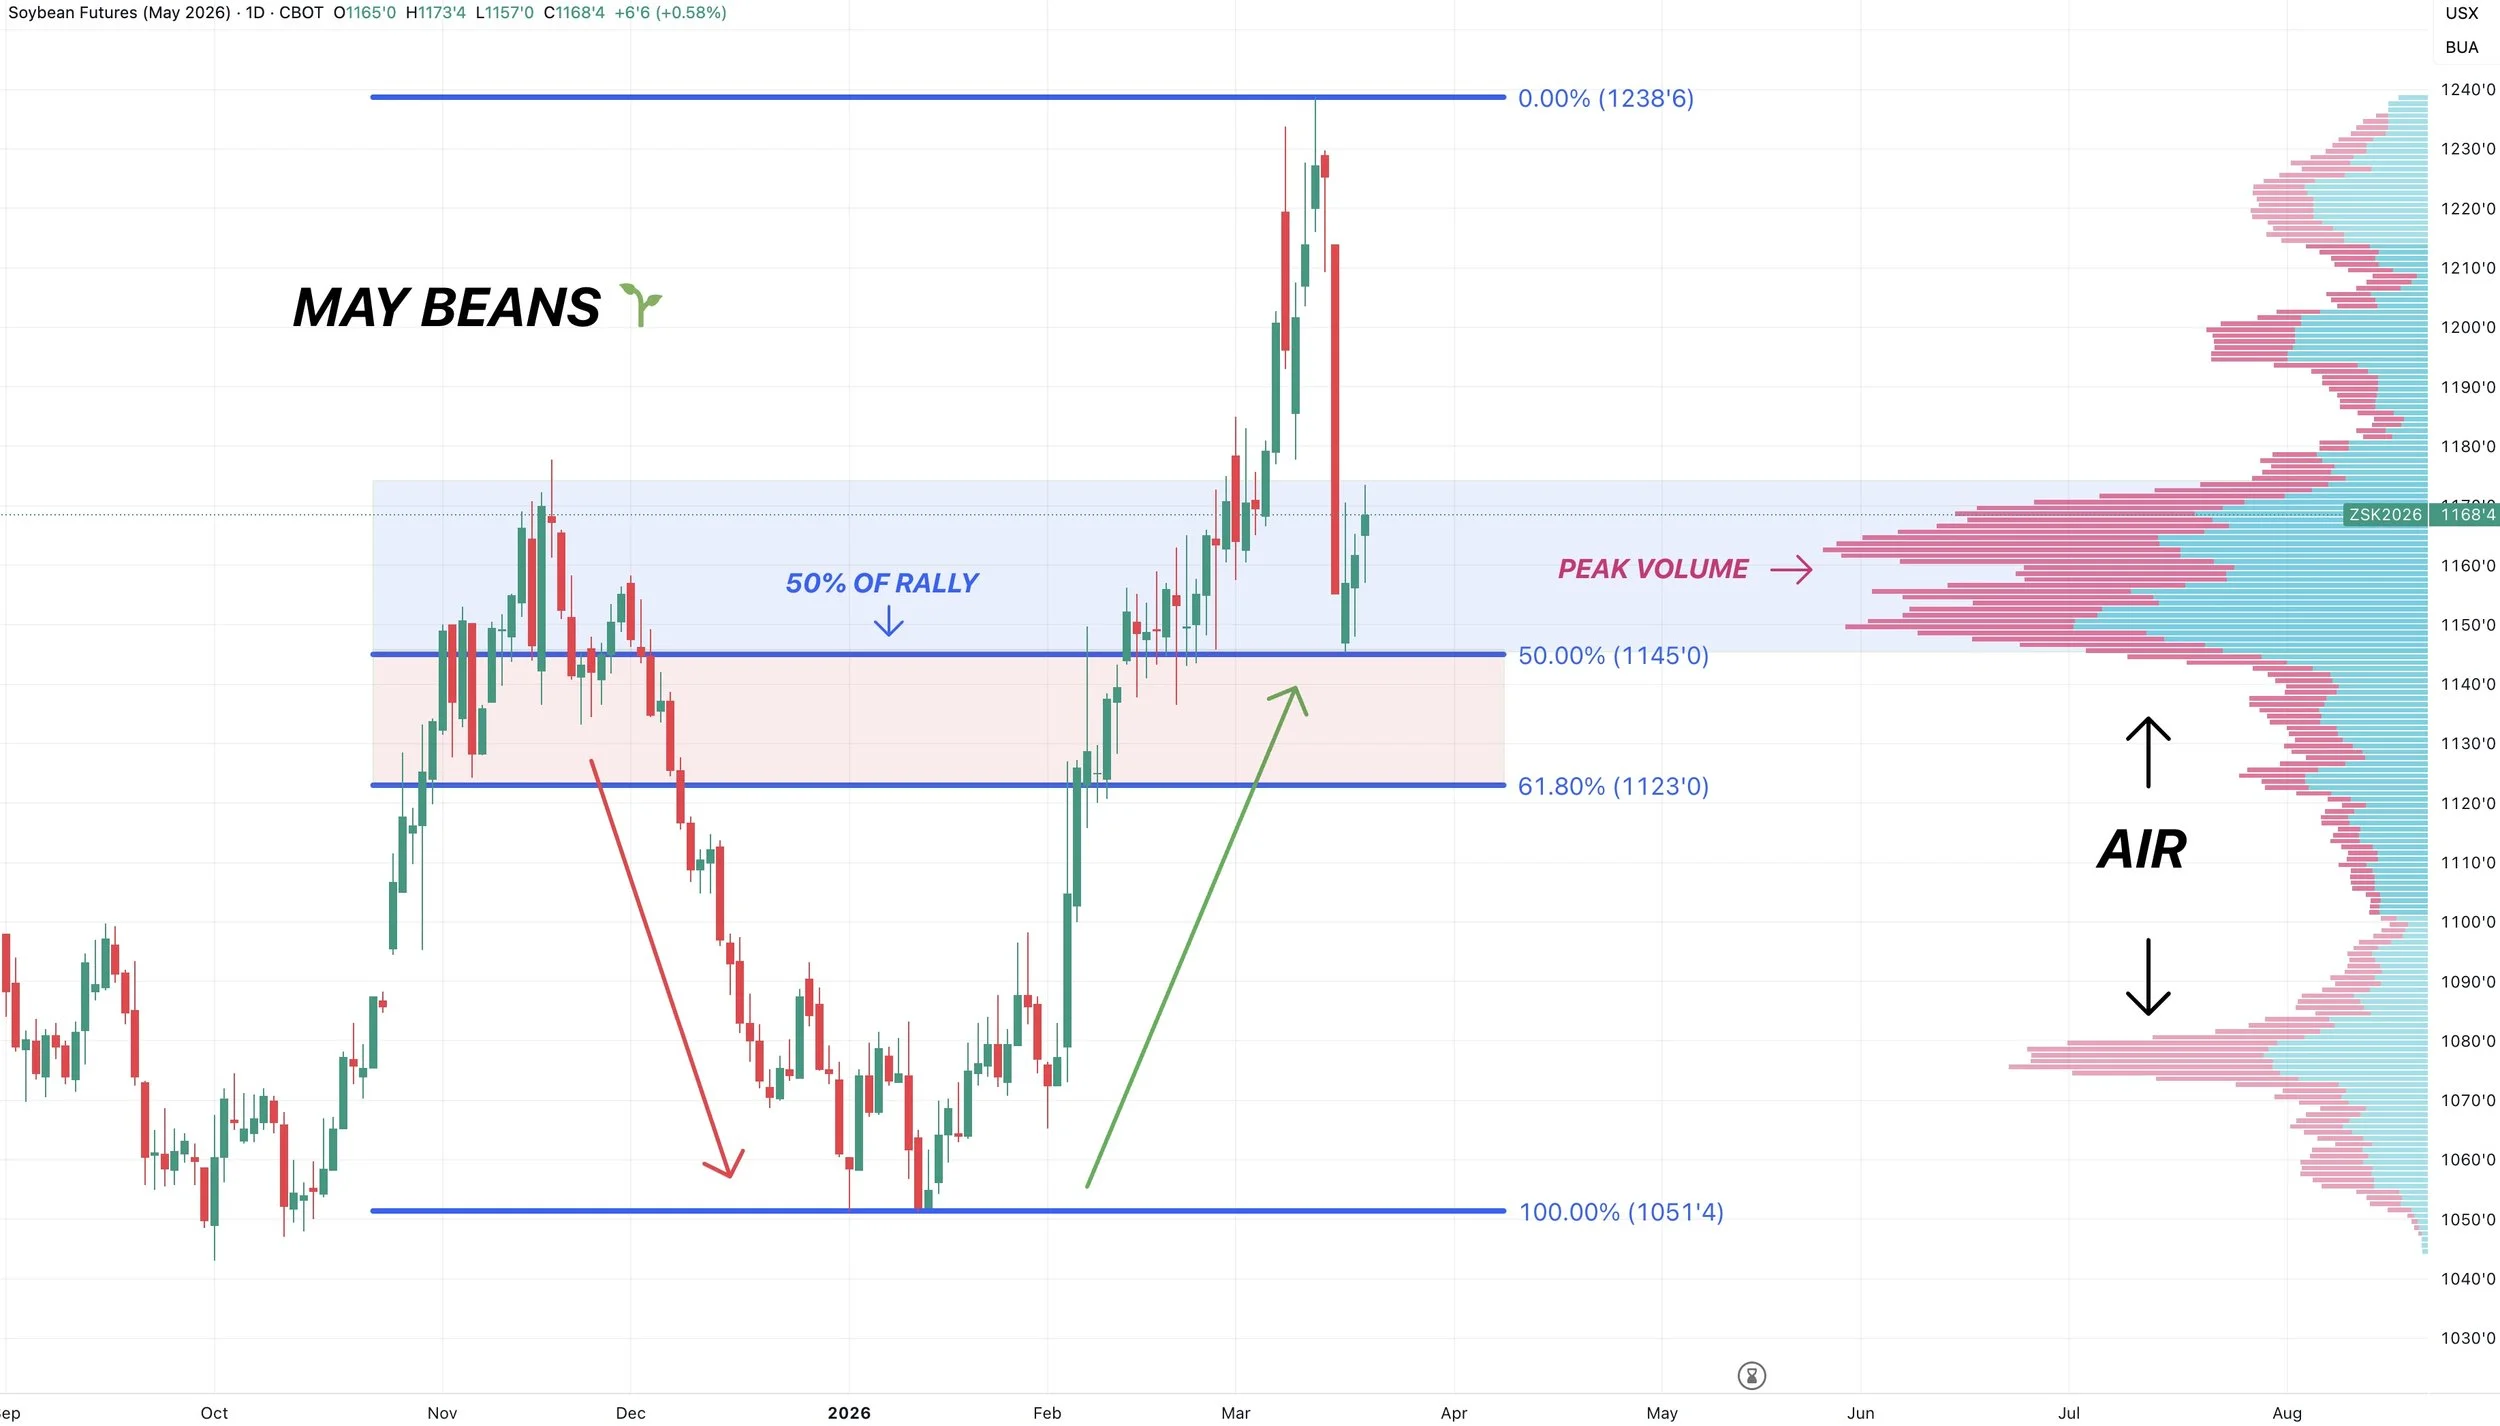
Your usual relief bounce can claw back 50% to 61.8% of the sell off.
That comes in at $11.90 to $12.00
So that is where I'm looking to reward if we get there.
That same exact level is the next area of high volume. We have a volume shelf that sits there.
Again, volume shelves can act as magnets.
We do not have to get there, but that is the target.
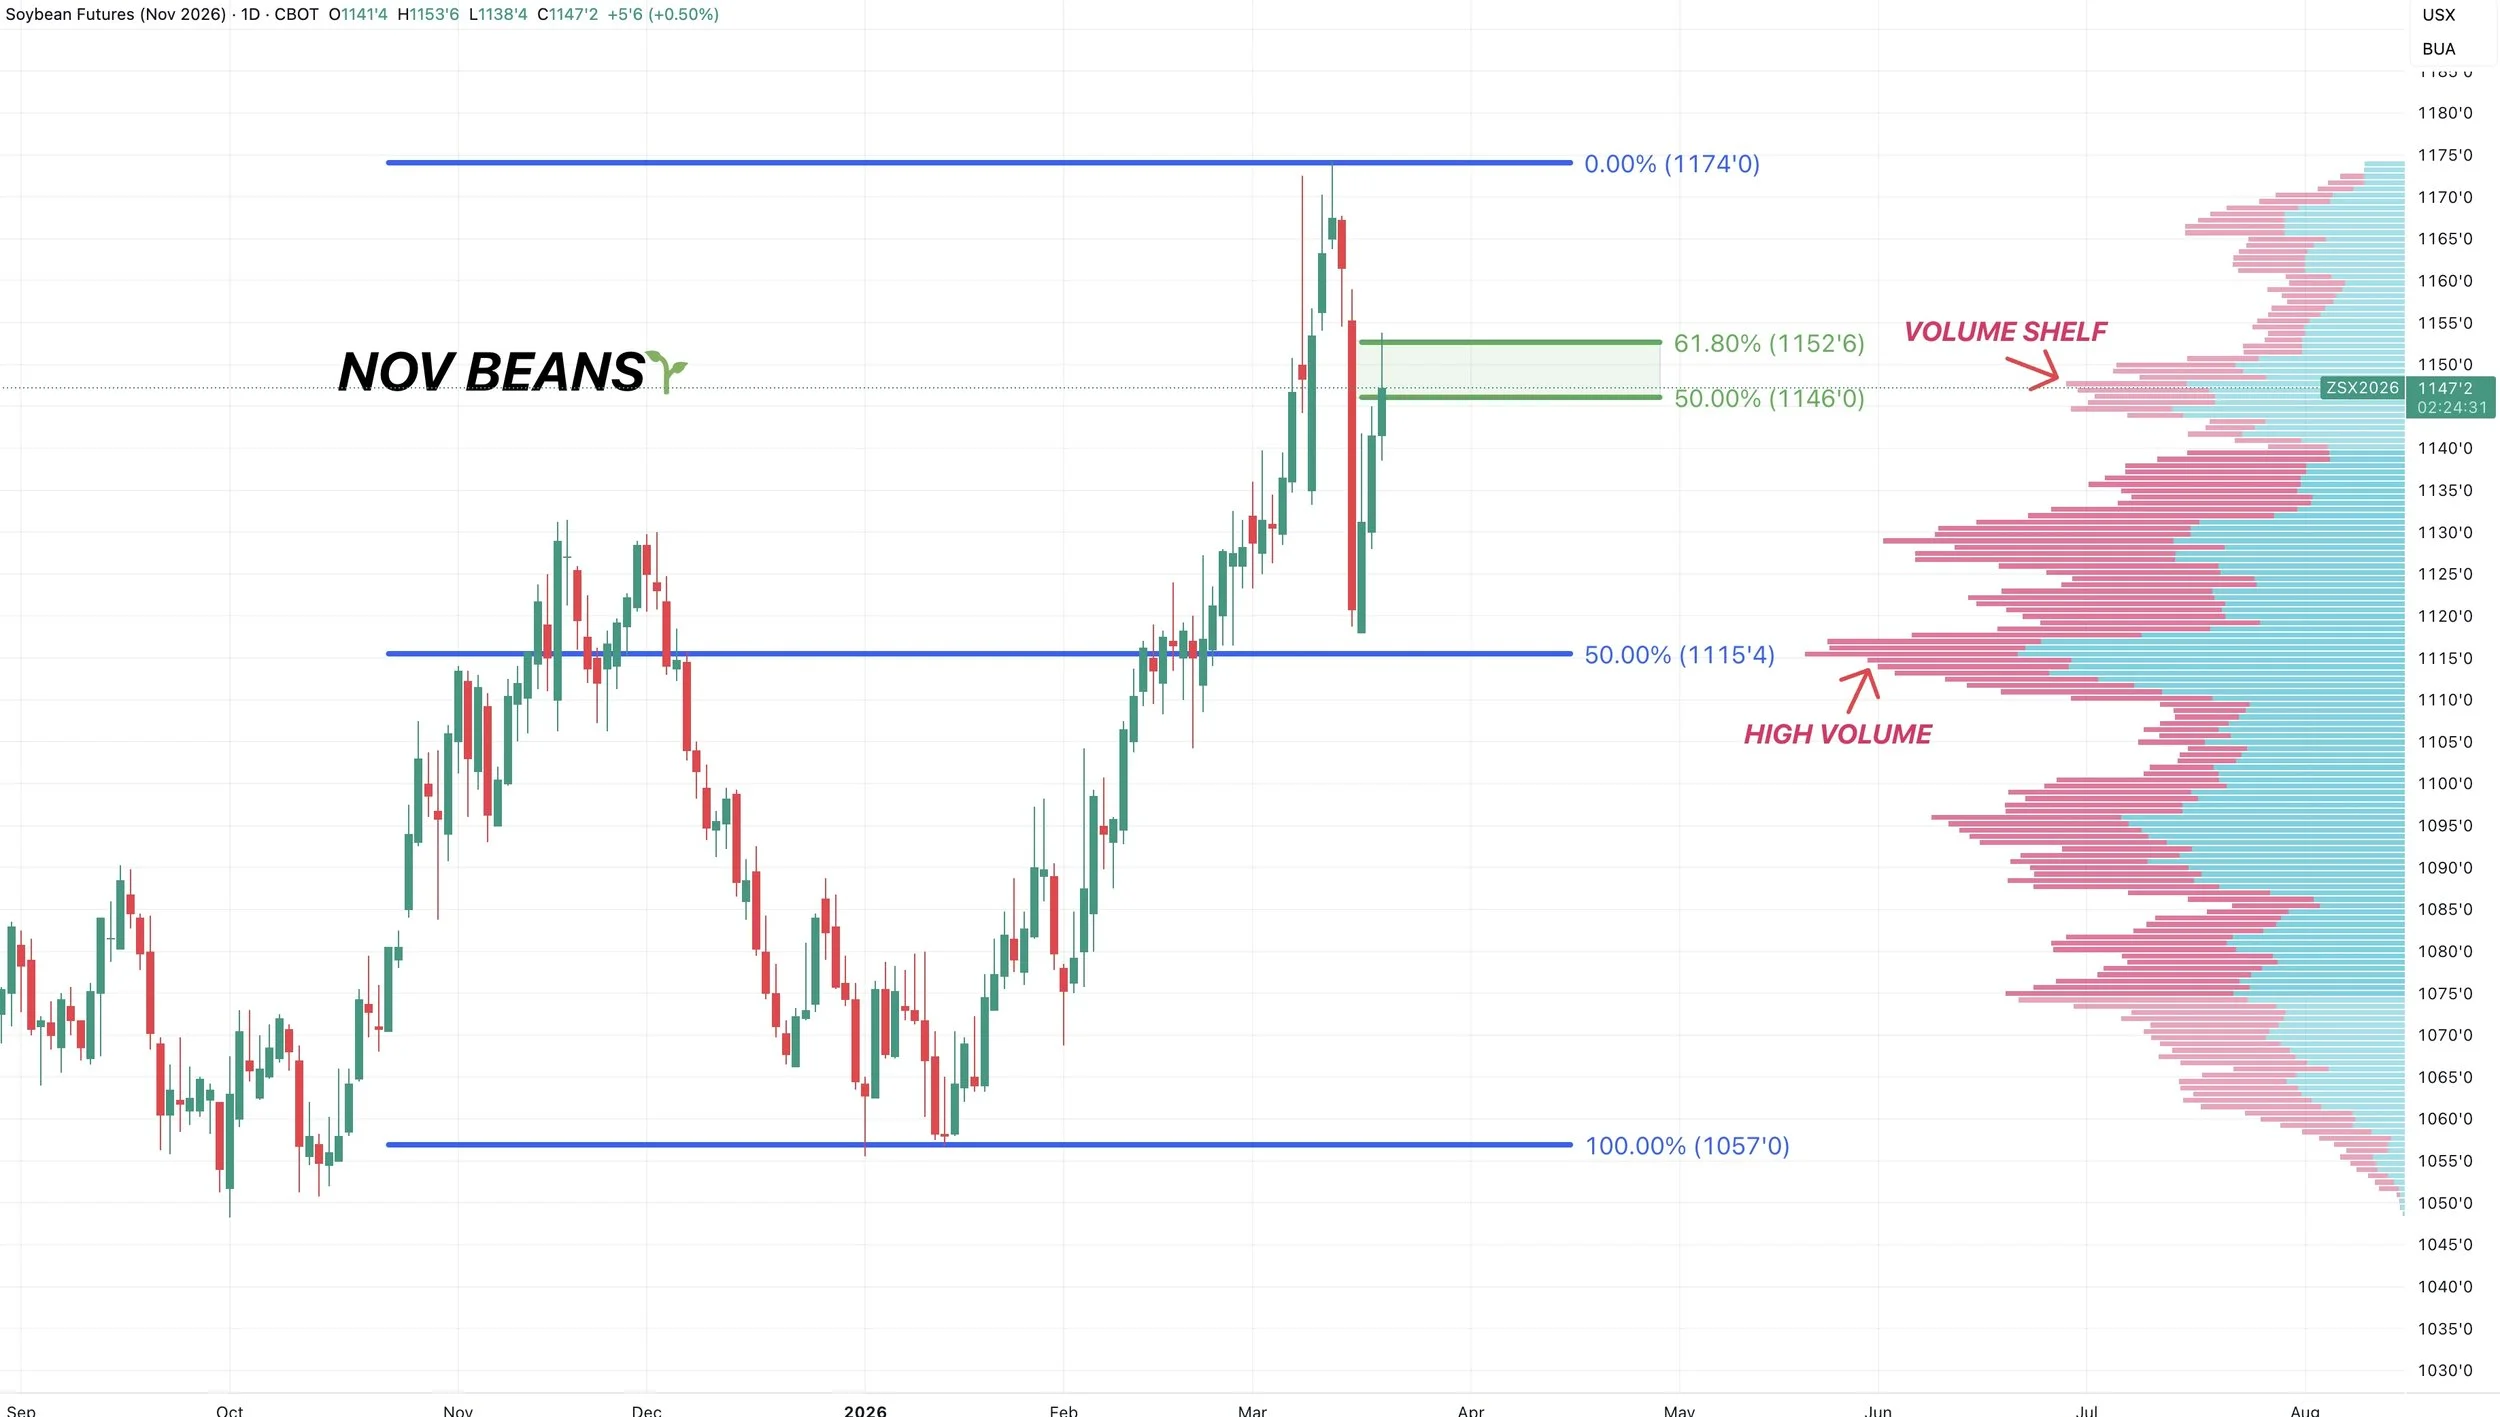
Nov Beans Chart:
Today we did issue a sell signal and hedge alert for new crop beans only.
Click Here to Read It
This was for those who felt like they were behind in their marketing.
It felt like the sky was falling 3 days ago.
We've now rallied and clawed back over half the sell off.
So if you were worried you missed out, this could be viewed as an opportunity.
Despite Monday's sell off, this is still one of the highest closes we've seen.
We reclaimed 61.8% of the sell off. A very common level for a relief bounce to stall out at.
If we break above that level, then it usually tells us it's more than a relief bounce and we can go and test the highs. But again, relief bounces can fail here.
Wheat
Like the rest of the grains, wheat is simply in a headline and war driven market.
So the fundamentals don’t matter a whole lot right now.
Let's just go over the charts.
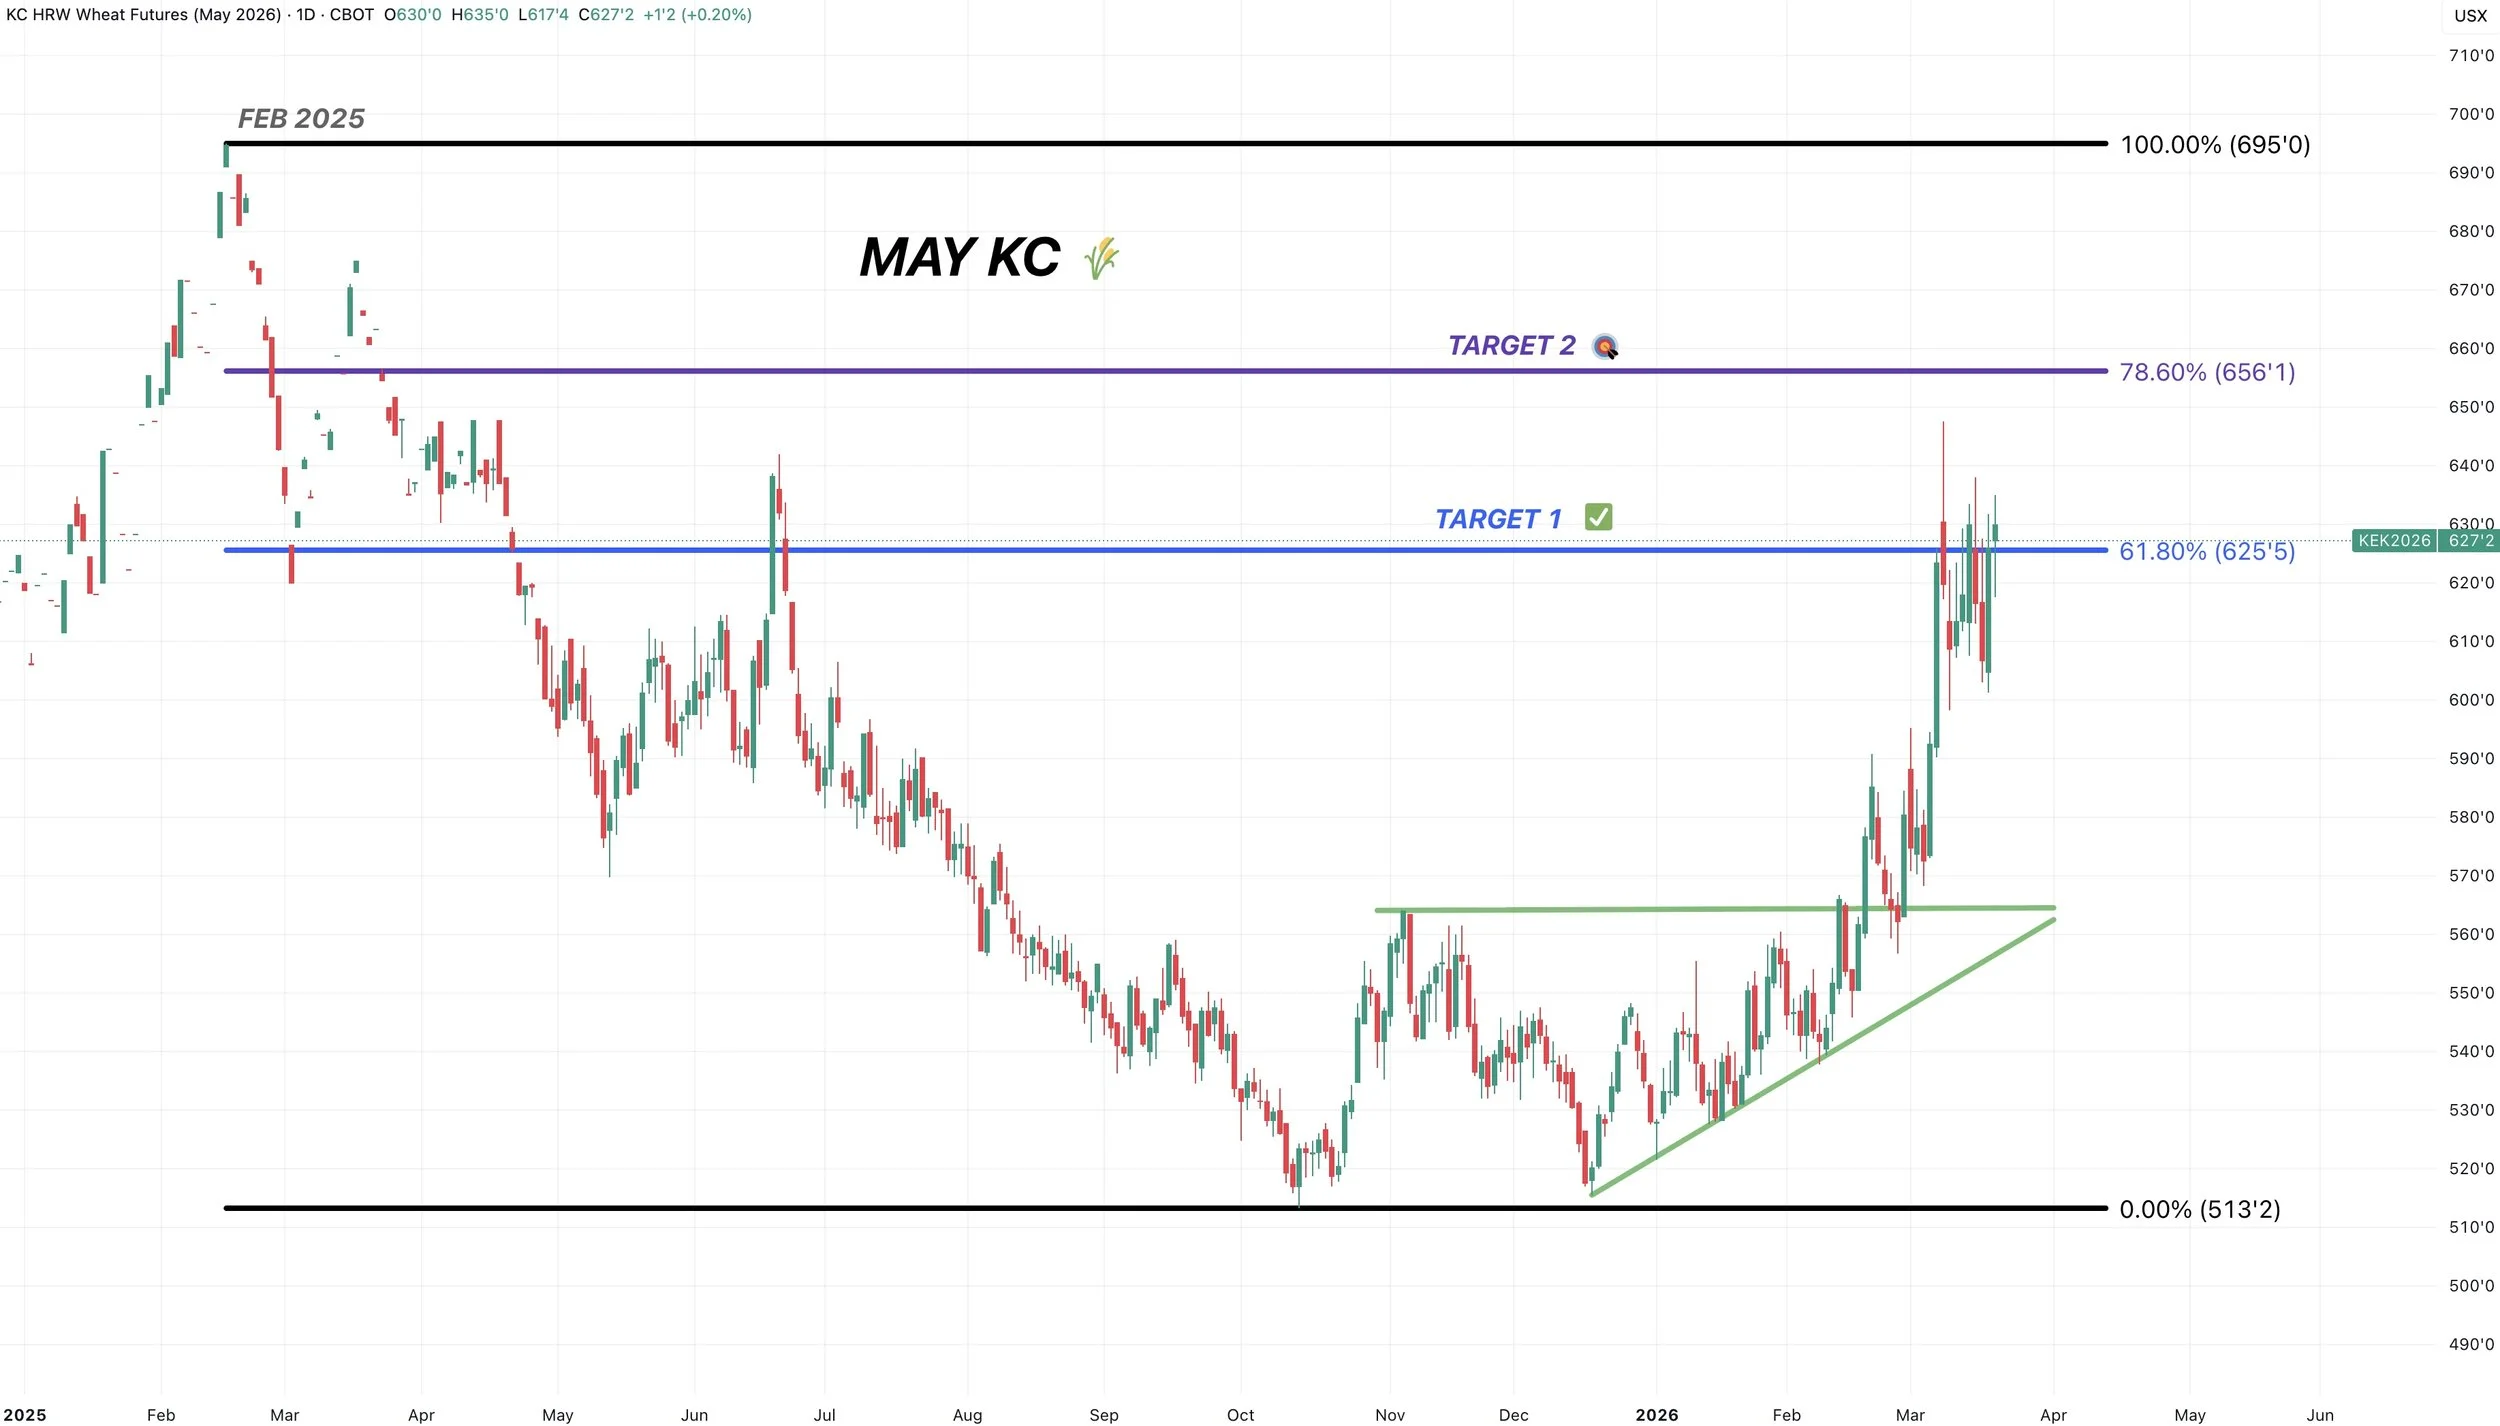
May KC Chart:
Extremely choppy action in wheat.
We've bounced around in a 35-cent range all week long. Up and down every other day.
Something to note is that we are continuing to hold that key support at $6.00 that we talked about Tuesday. Good sign we continue to see buying there.
That is peak volume. Failure to hold there could spark a sizeable leg lower as there is little support beneath.
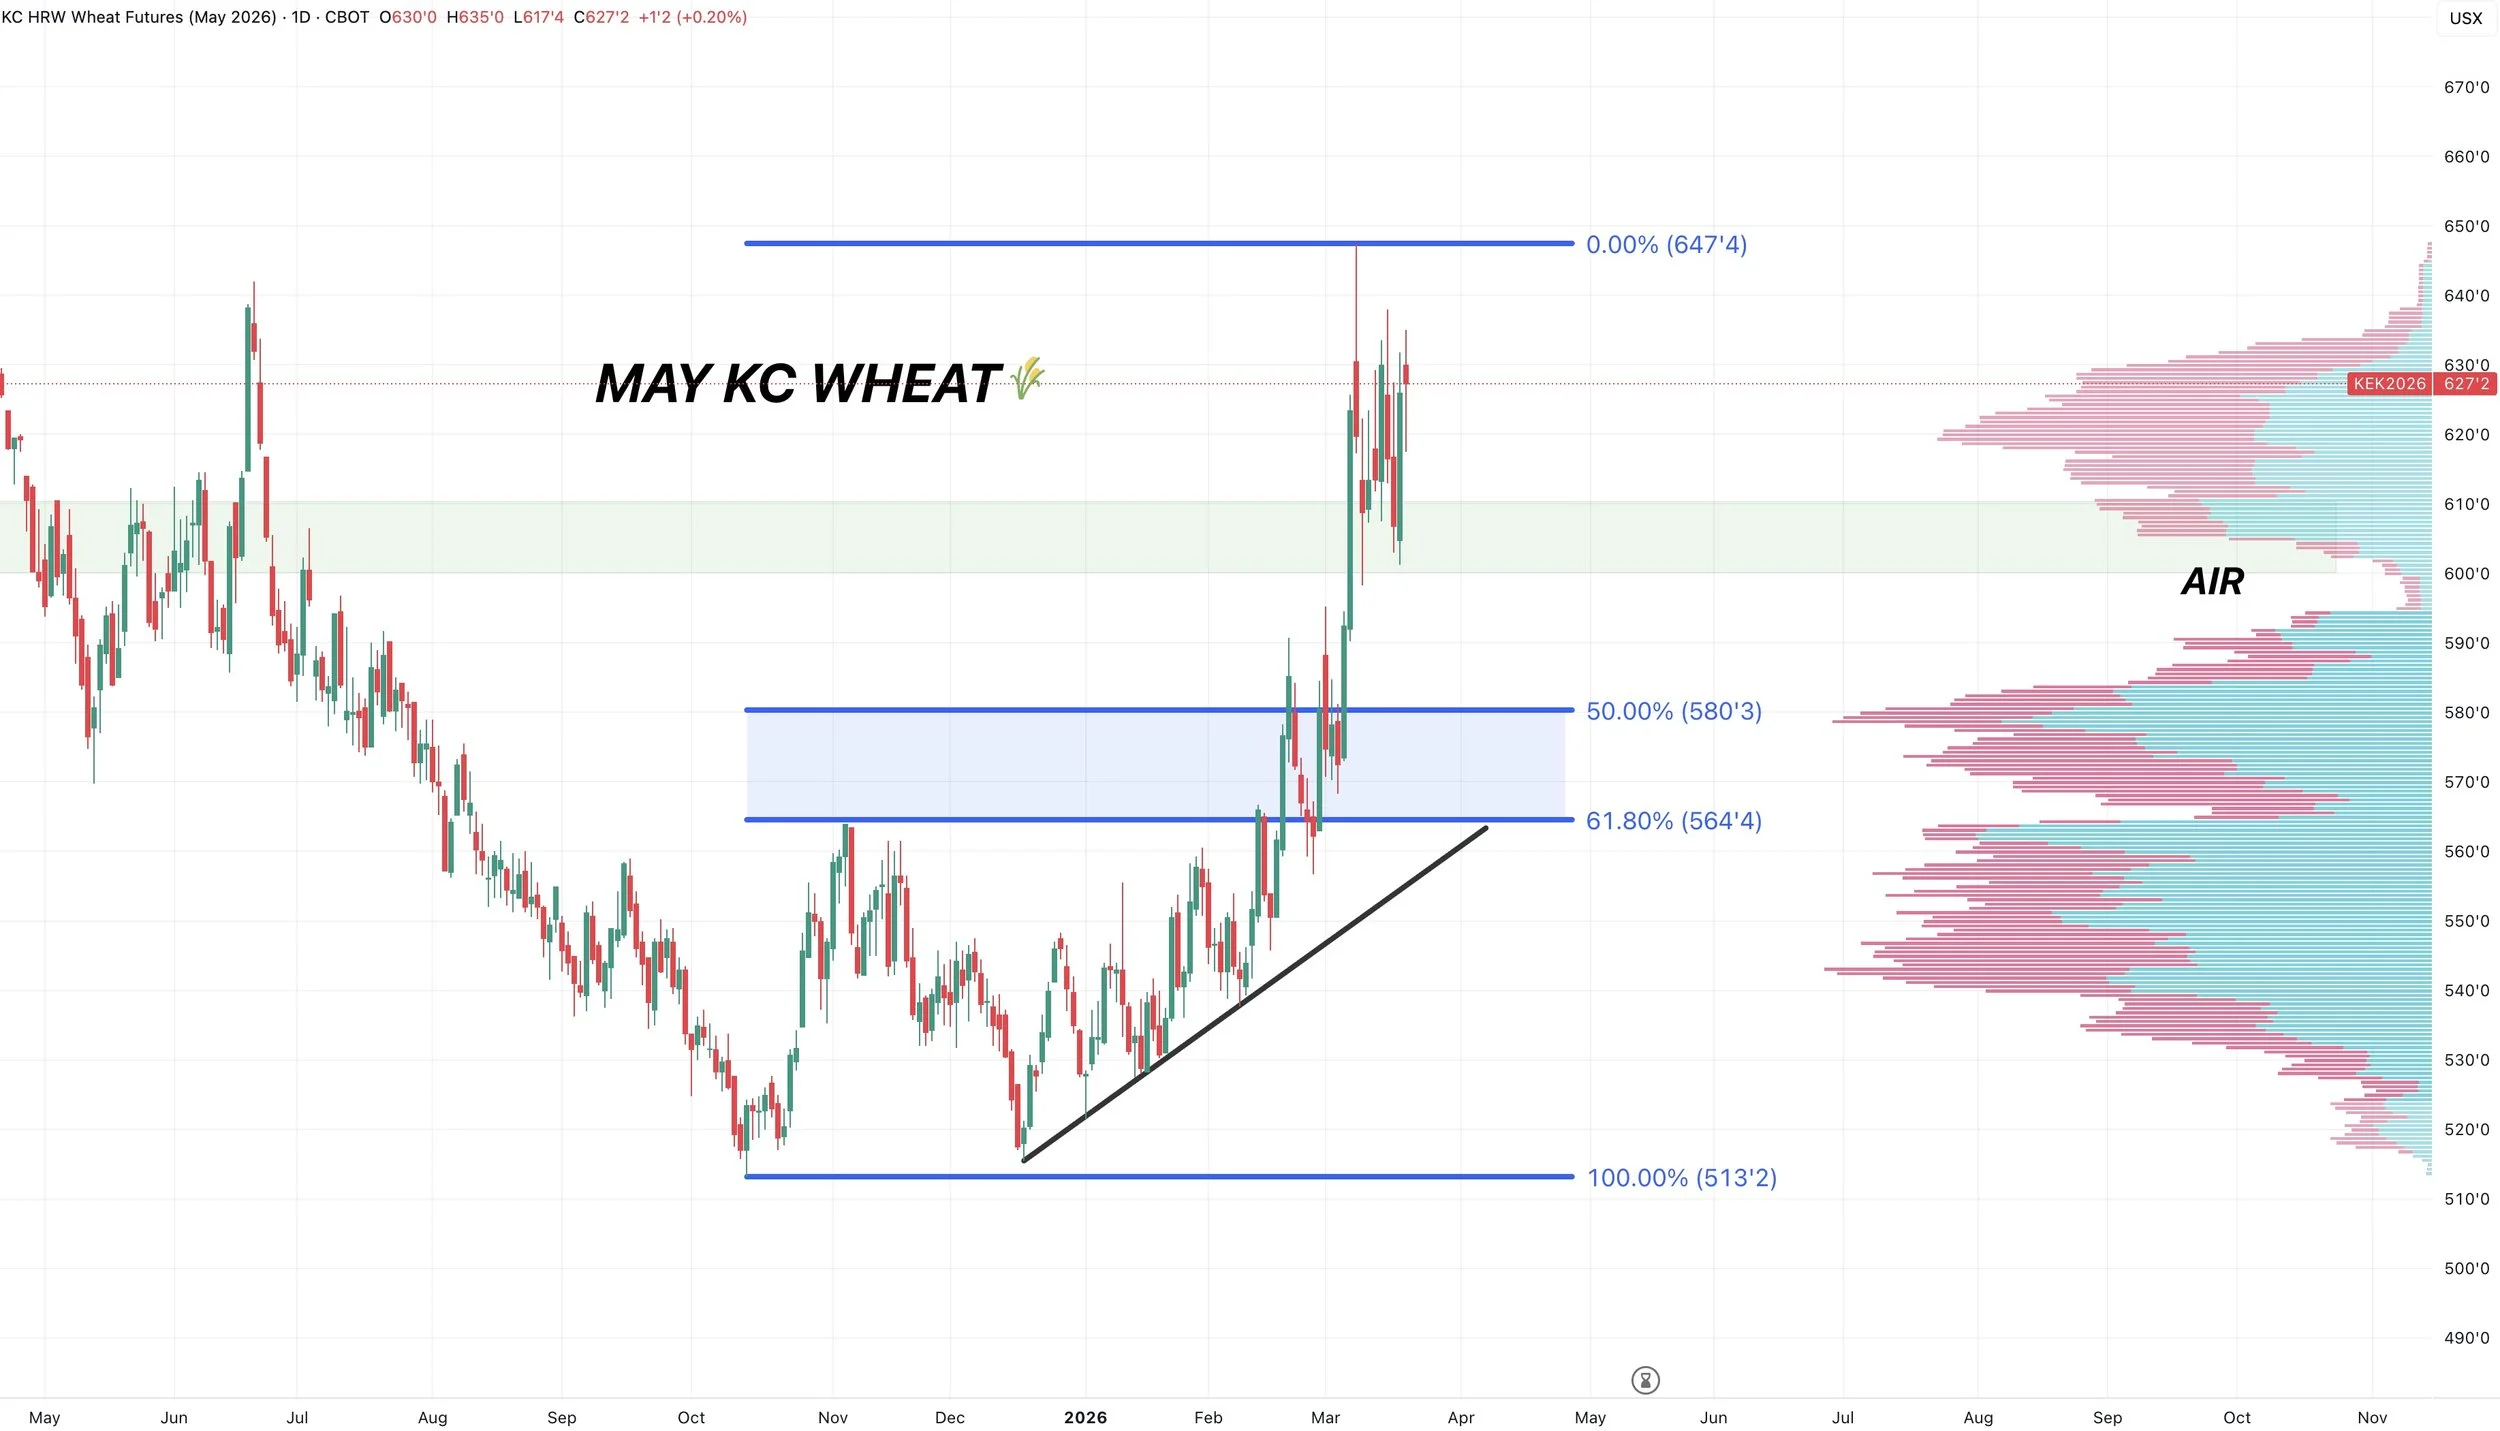
We are back near the highs.
We already rewarded this rally at this level.
So if you have not yet done so, I still like doing so.
If you have, the next target to layer into a little more is about another 30 cents higher.
$6.55 is the next retracement up to those Feb 2025 highs.
Cattle
It felt like the cattle market has followed macros the last few days.
Earlier this week, the stock market was higher, and so was cattle. The stock market cooled off the last day or two, and so did cattle.
The cattle market is essentially seeing some pressure due to the same reasons why the grains have found some strength.
Cattle rely on consumer confidence and a strong economy.
The war is raising some concerns about the economy.
If the economy is impacted, it makes you question what happens to the demand for beef.
To me it seems like the JBS strikes are mostly priced in.
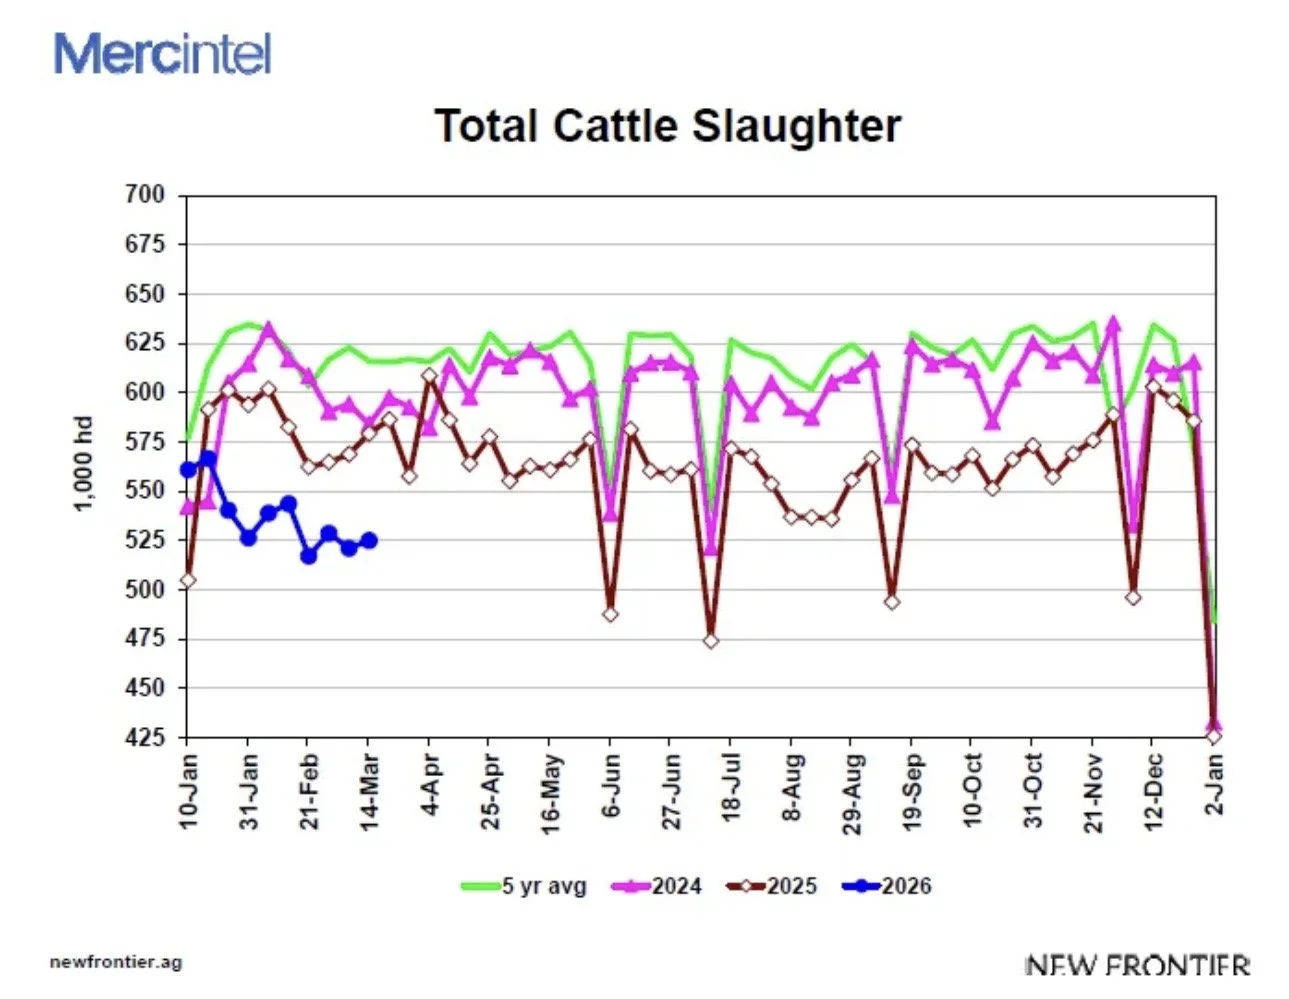
Beef prices are seeing a correction after soaring to record levels for the month of March.
But this isn’t because demand is higher.
It's because kills are down.
If kills are down, are cattle staying on feed longer? If weights are creeping up, the extra tonnage can lower head count and keep a lid on the upside.
Bottom line, I still see downside risk in cattle as I have for the last few months.
Here is that chart I've shown recently. All year, kills have been consistently at historically low levels.
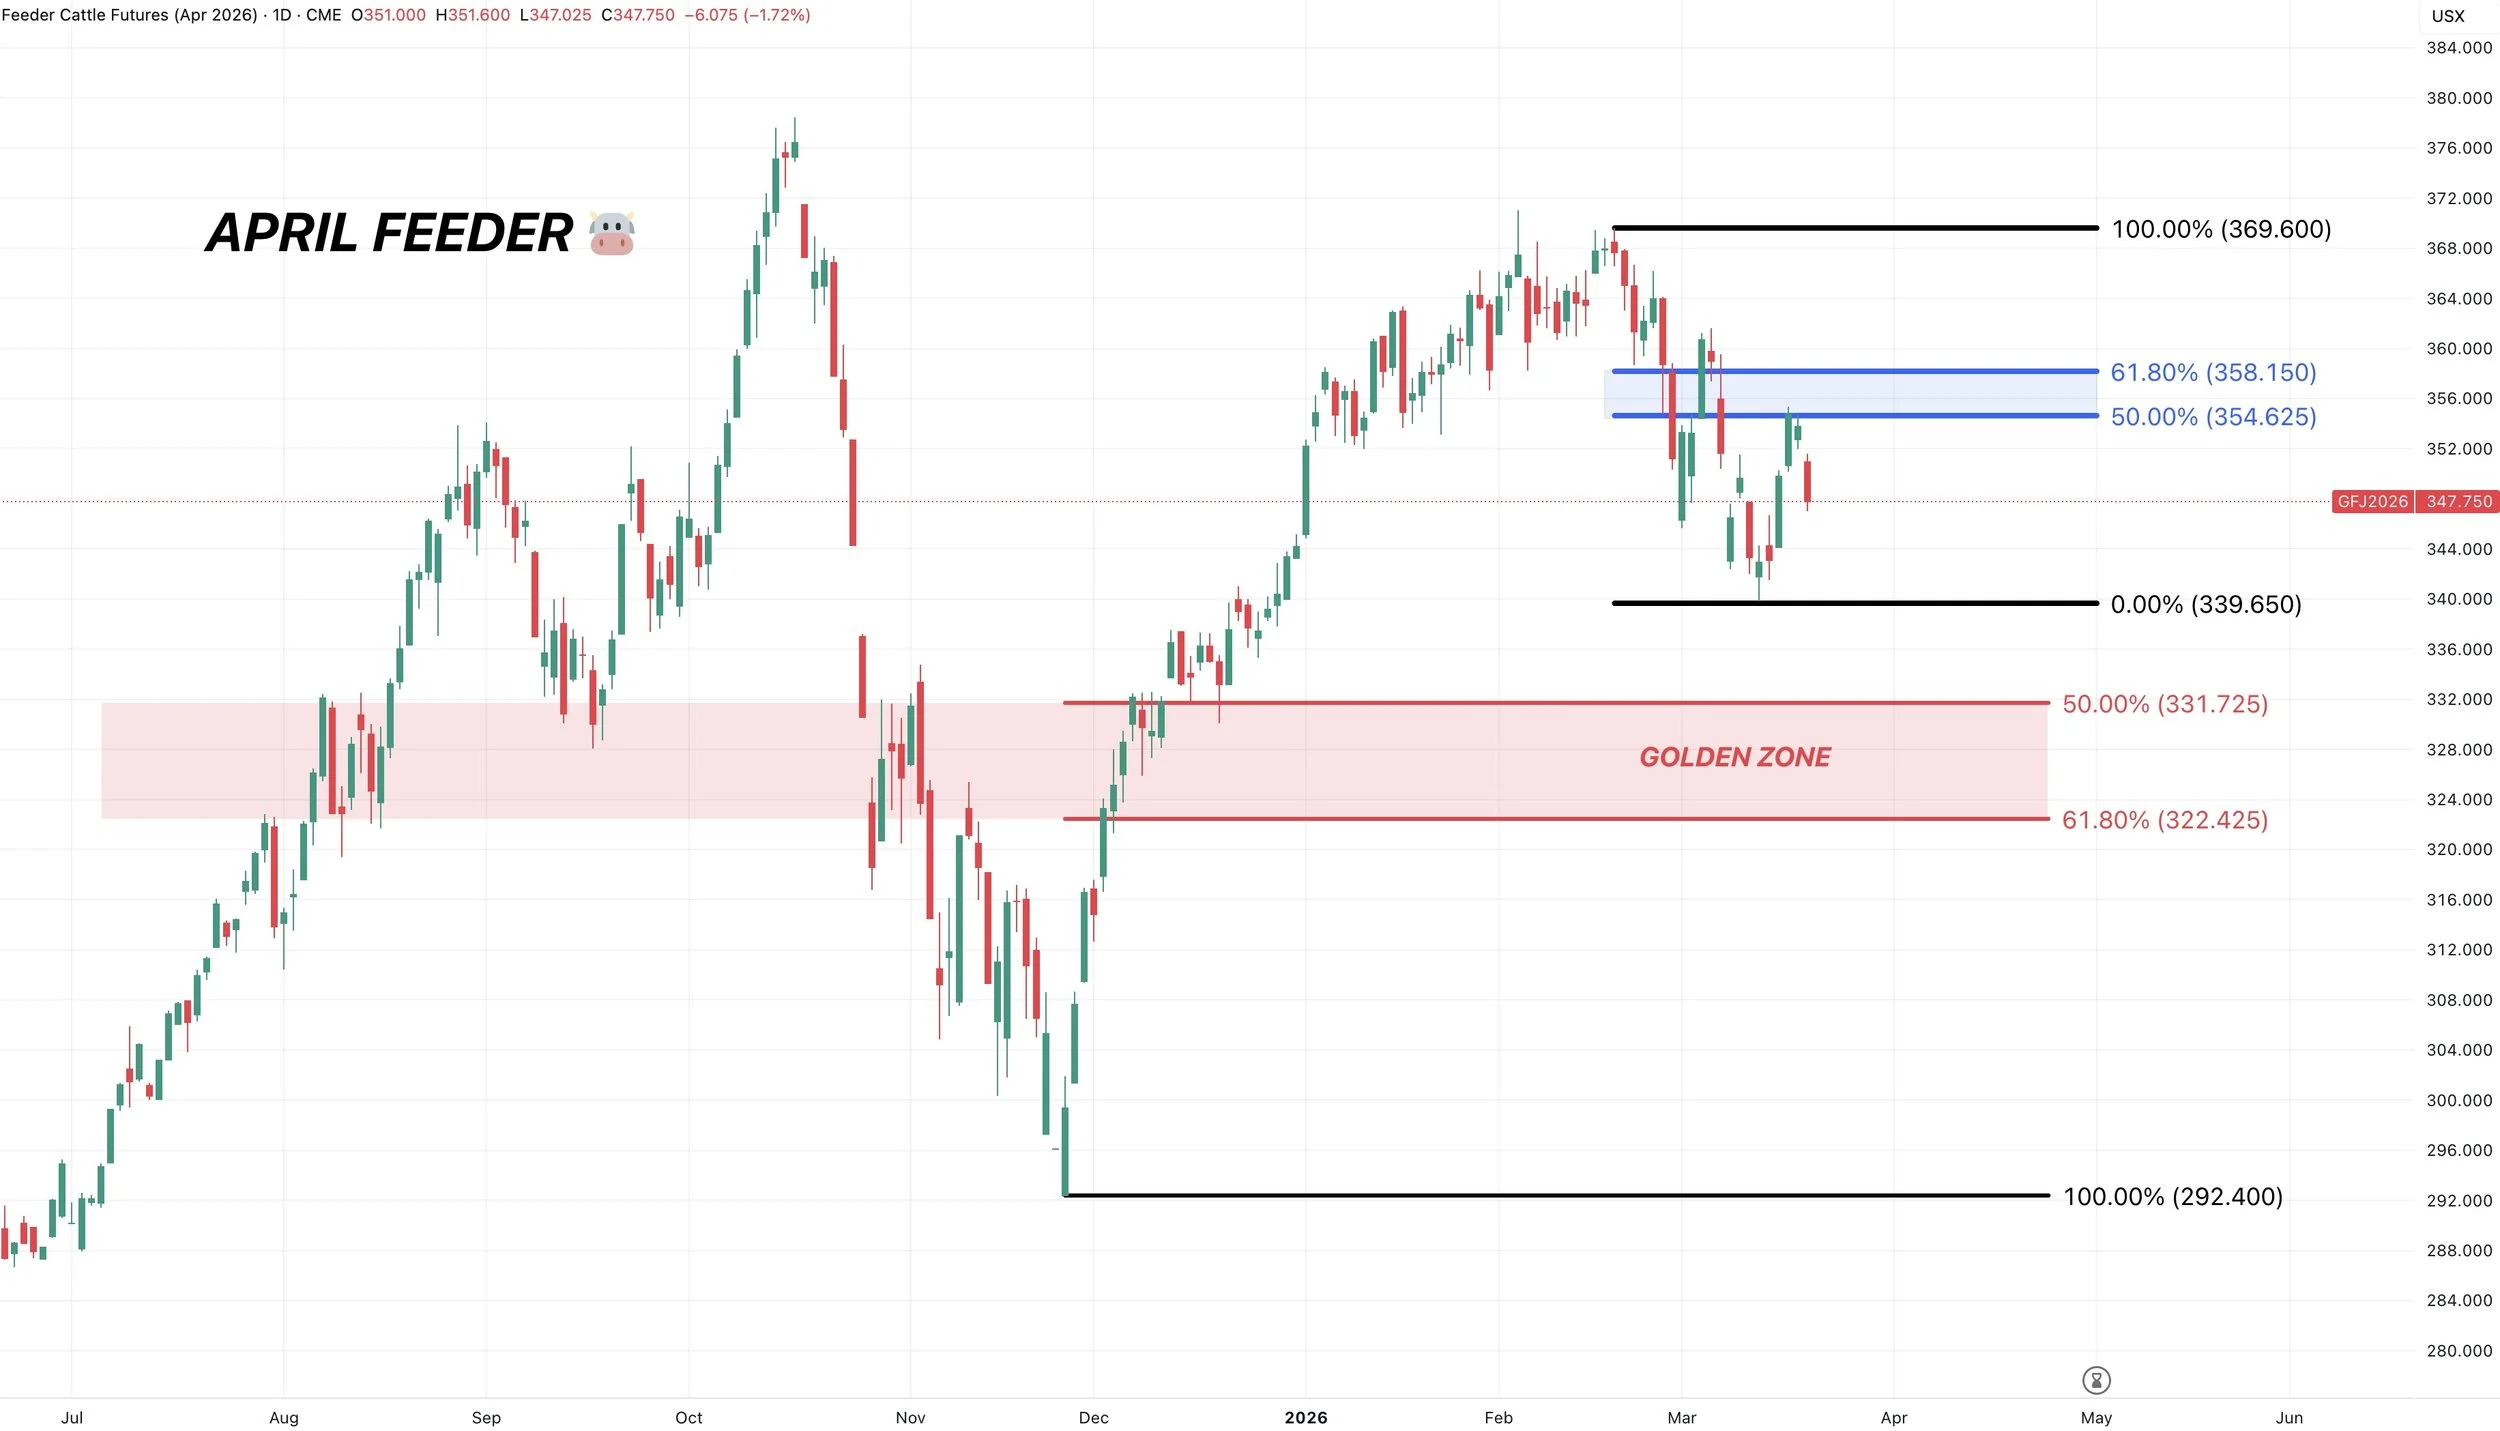
April Feeders Chart:
Like we talked about on Tuesday, we wanted to defend the recent bounce because we clawed back 50% of the entire sell off.
The trend remains lower in my opinion, unless we take out the blue box.
Which would be 61.8% of the sell off at 358.
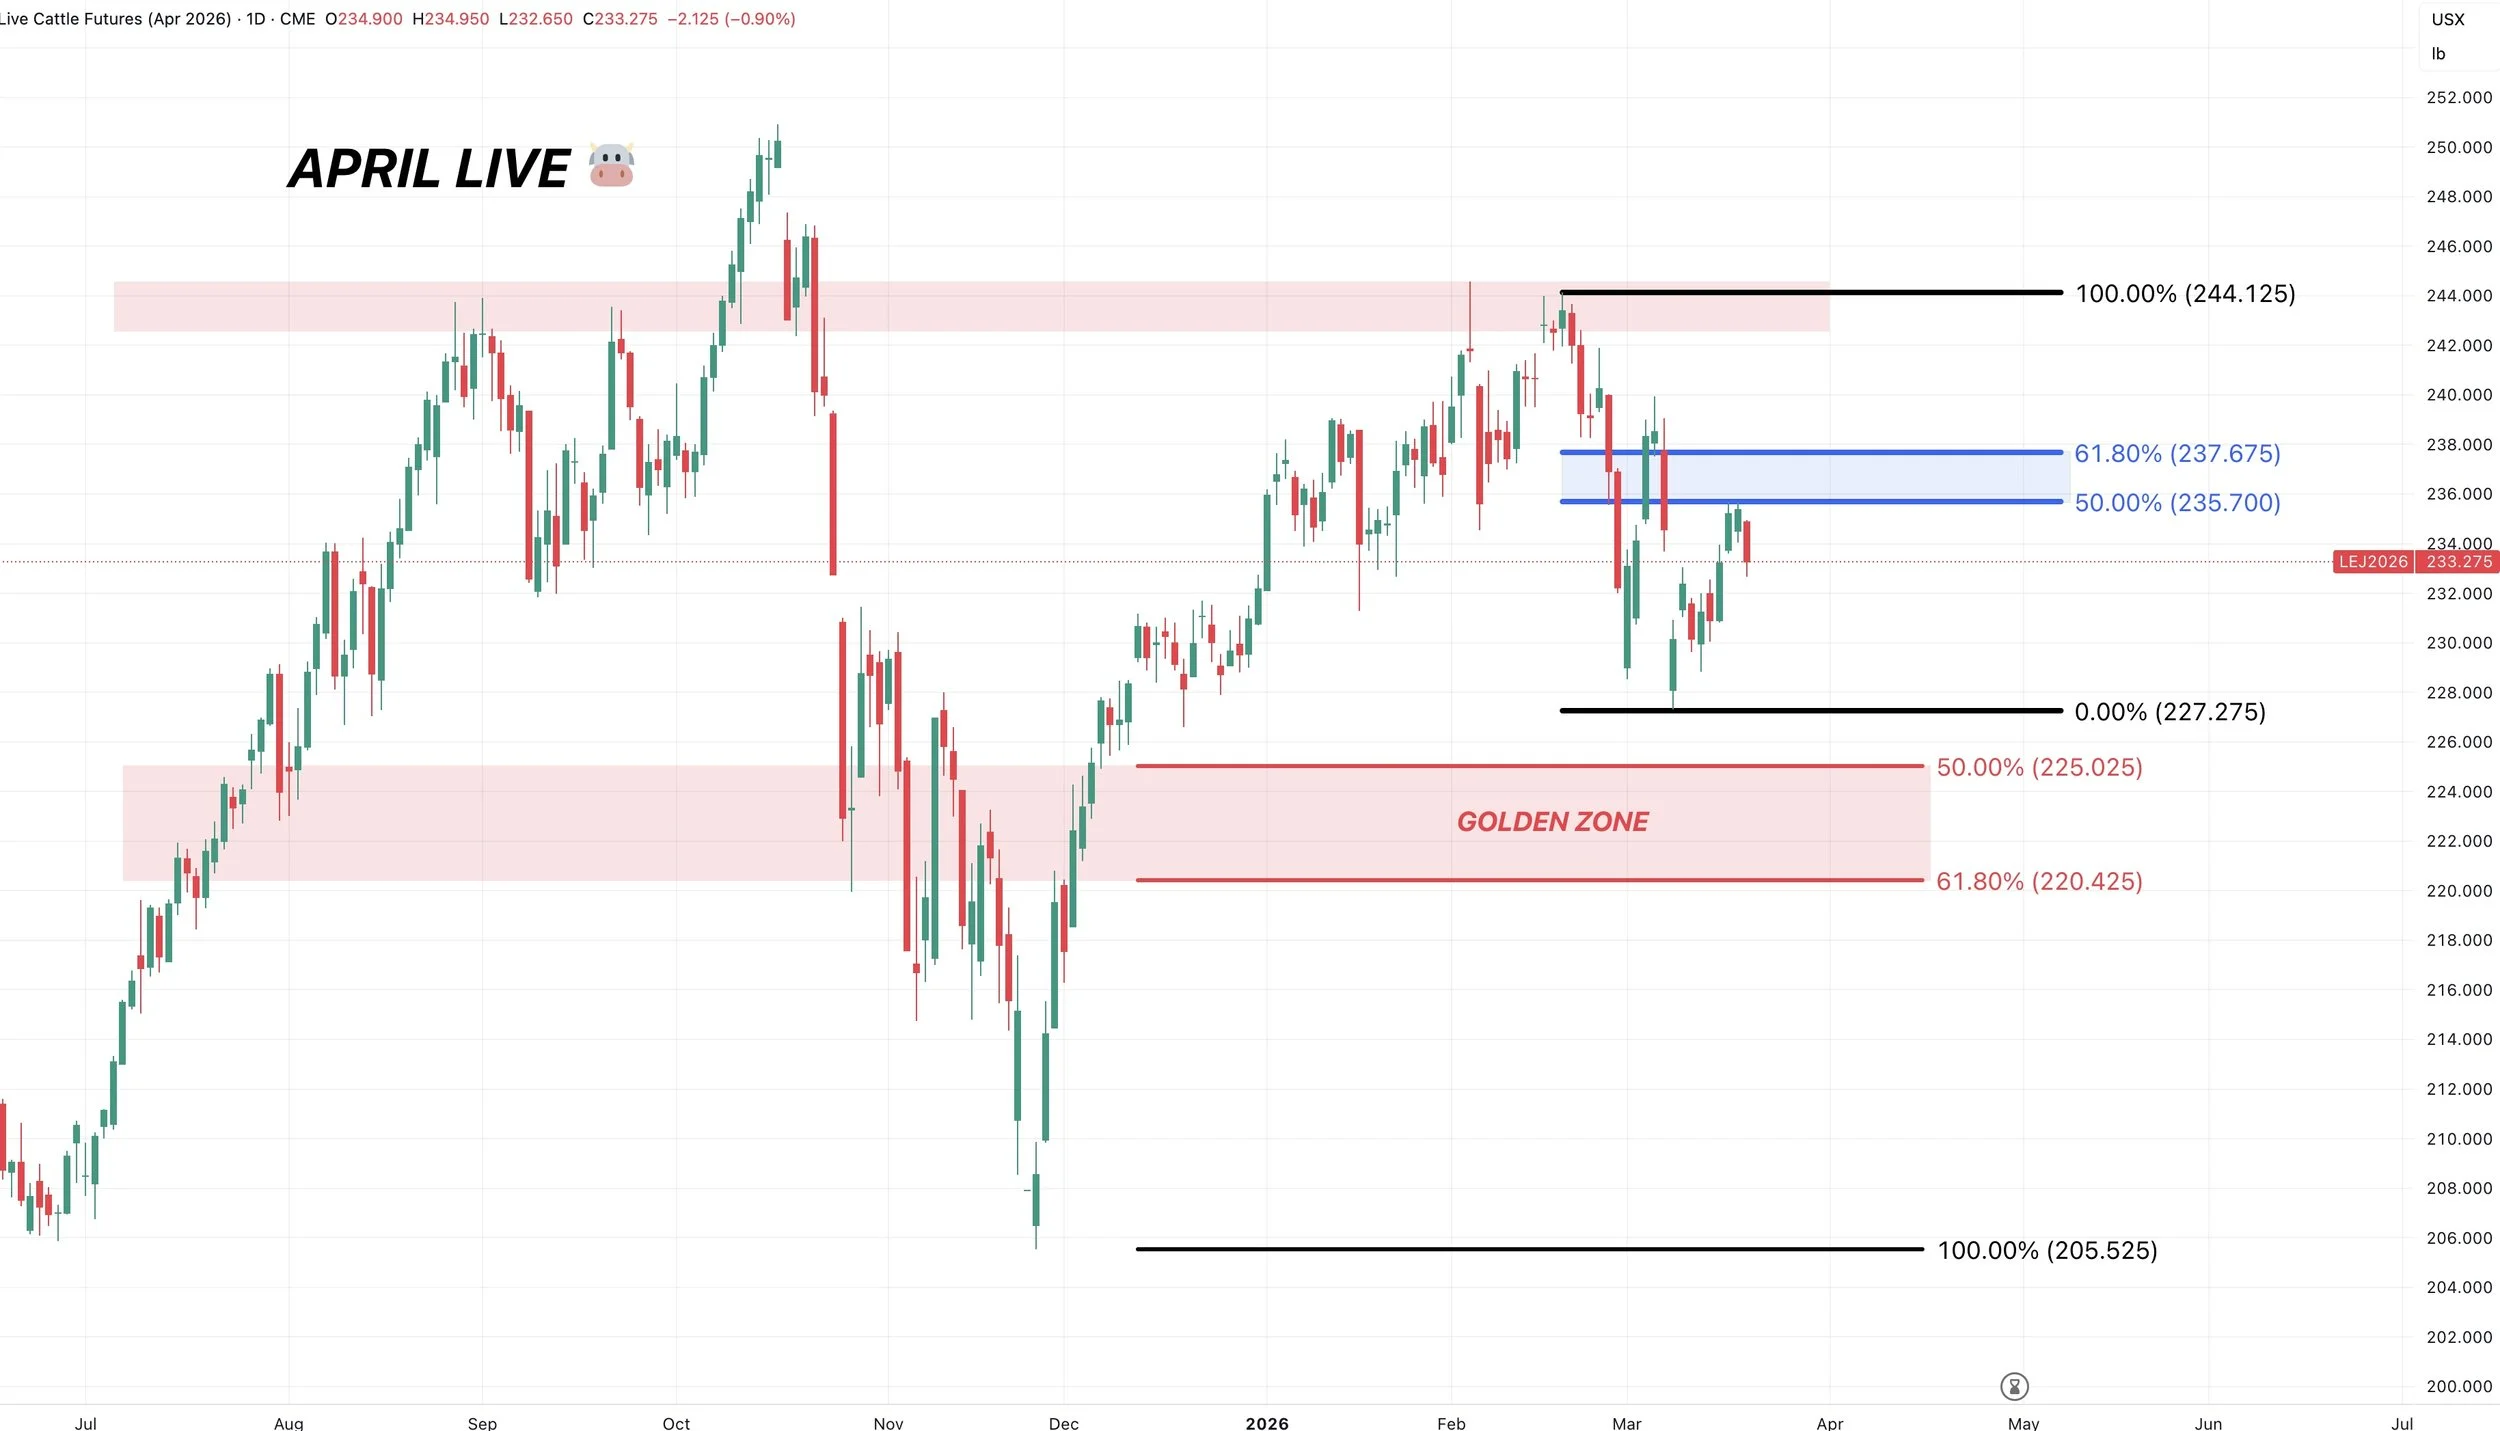
April Live Chart:
Also clawed back 50% of the sell off before rejecting.
The trend remains lower unless we break above 238 and the 61.8% level of the entire sell off.
Want to Talk?
Our phones are open 24/7 for you guys if you ever need anything or want to discuss your operation.
Jeremey, Lauren & Office: (806)484-1214
Sebastian: (605)280-1186
Email: sfrost@dailymarketminute.com
Hedge Account
Interested in a hedge account? Use the link below to set up an account or give us a call.
Recent Signals
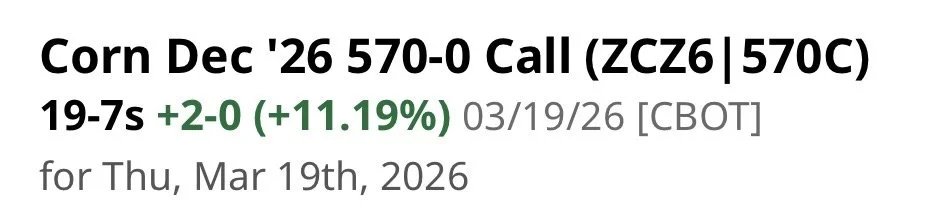
March 19th, 2026: 🌱
New crop soybeans signal & hedge alert.
CLICK HERE TO VIEW
March 9th, 2026: 🌱
Soybeans signal & hedge alert. Sent via text.
March 6th, 2026: 🌽 🌾
Corn & wheat sell signal & hedge alert.
March 3rd, 2026: 🌽
Old crop & new crop corn sell signal & hedge alert.
Feb 26th, 2026: 🌱
Old crop & new crop beans sell signal & hedge alert.
Feb 19th, 2026: 🌾
KC wheat sell signal & hedge alert.
Feb 6th, 2026: 🌽 🌱
Old crop corn & soybean sell signal & hedge alert.
Feb 4th, 2026: 🌱
Soybean sell signal & hedge alert.
Nov 17th, 2025: 🌱
Soybean sell signal & hedge alert.