
GRAINS STRUGGLING AT RESISTANCE
MARKET UPDATE
You can scroll to read the usual update as well. As the written version is the exact same as the video.
Timestamps for video:
Overview: 0:00min
Corn: 1:55min
Corn Charts: 6:10min
Beans: 7:30min
Beans Charts: 9:50min
Wheat Charts: 11:05min
Cattle Charts: 12:15min
Want to talk?
Office: (806)484-1214
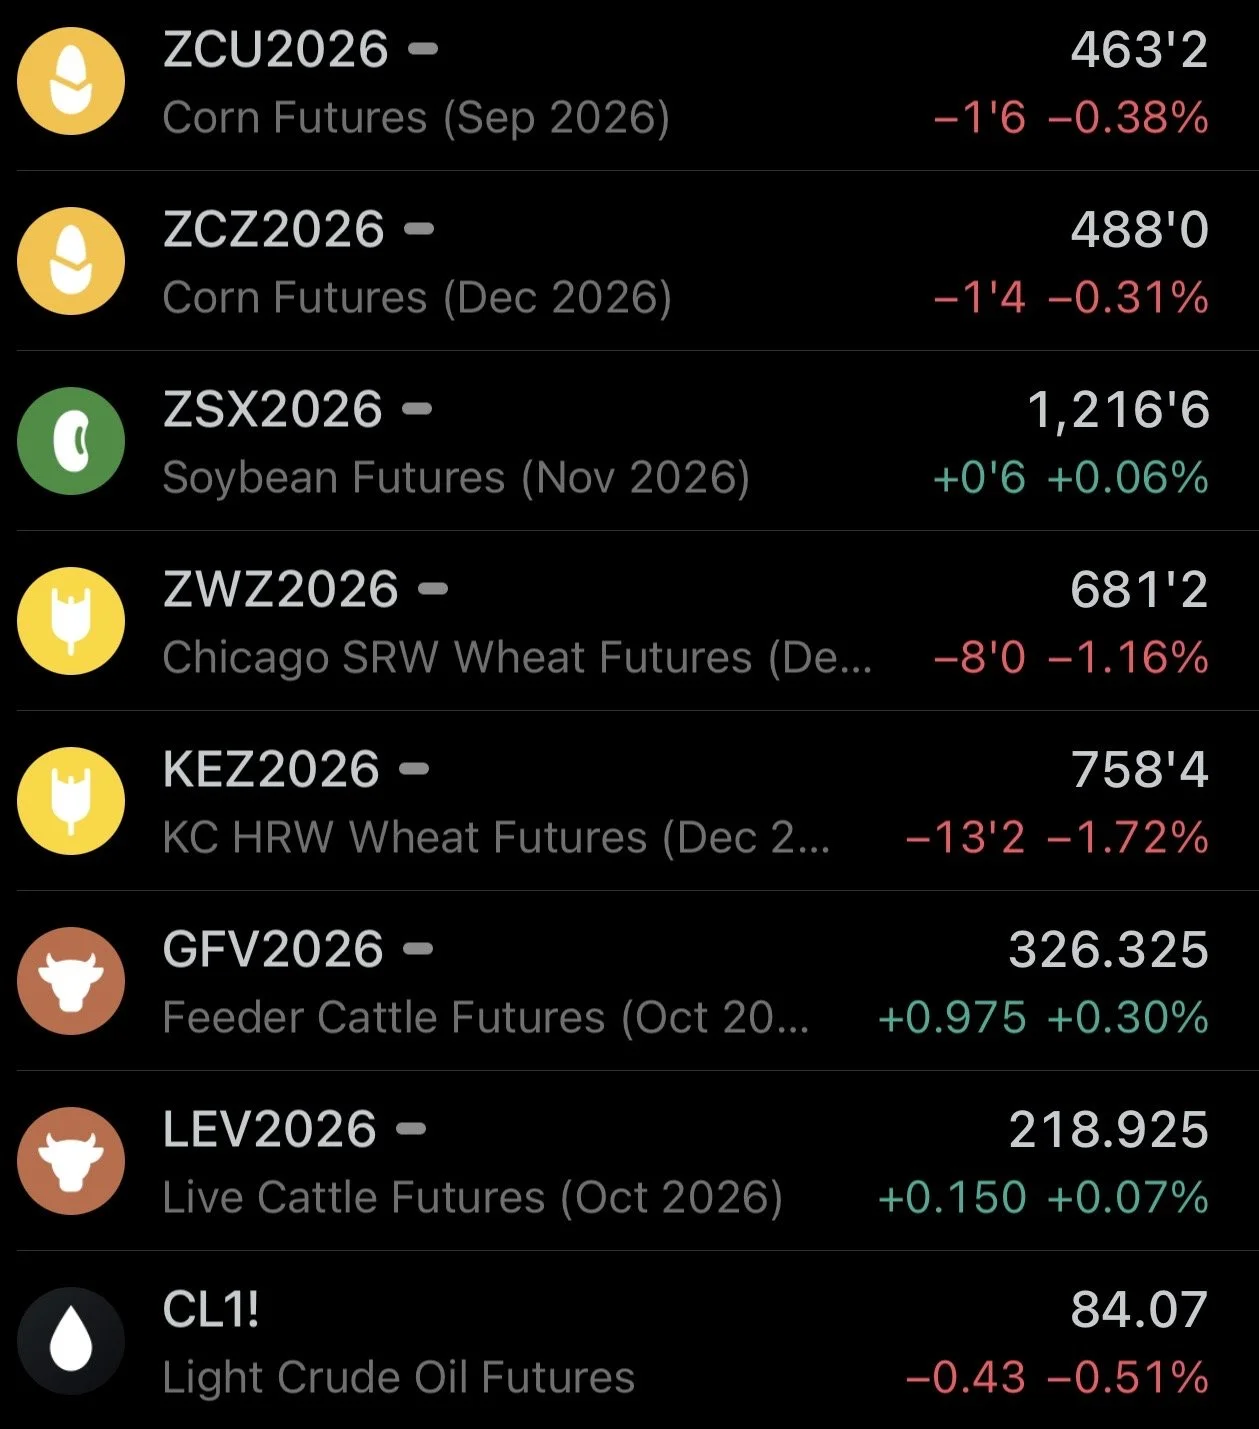
Futures Prices Close
Overview
Very poor closes in the grains today. All of the grains were initially higher, but then faded well off the highs.
Soybeans were up +16 cents early on but then sold off and closed nearly unchanged.
Wheat was up +9 cents but closed down -13 cents.
As the grains are failing at some key resistance levels on the charts we'll get into.
The market hasn’t really seen a ton of fresh news since the USDA report. So we don’t have a ton of new things to discuss and are going to try to keep today's update on the shorter side.
We are in the middle of the crop tours, so let's look at the first day's results.
Crop Tour Day 1
I'll be diving into some of this data further as we get the results from more states.
Last night we got the results from South Dakota and Ohio. They are doing Nebraska and Illinois today.
The actual yield numbers from the tour are of course going to vary from the USDA.
So instead of taking the yields and pod counts at face value, the easiest way to interpret the numbers is to see how the USDA views the crop vs last year, and how the tour views the crop vs last year.
Day 1 Results:
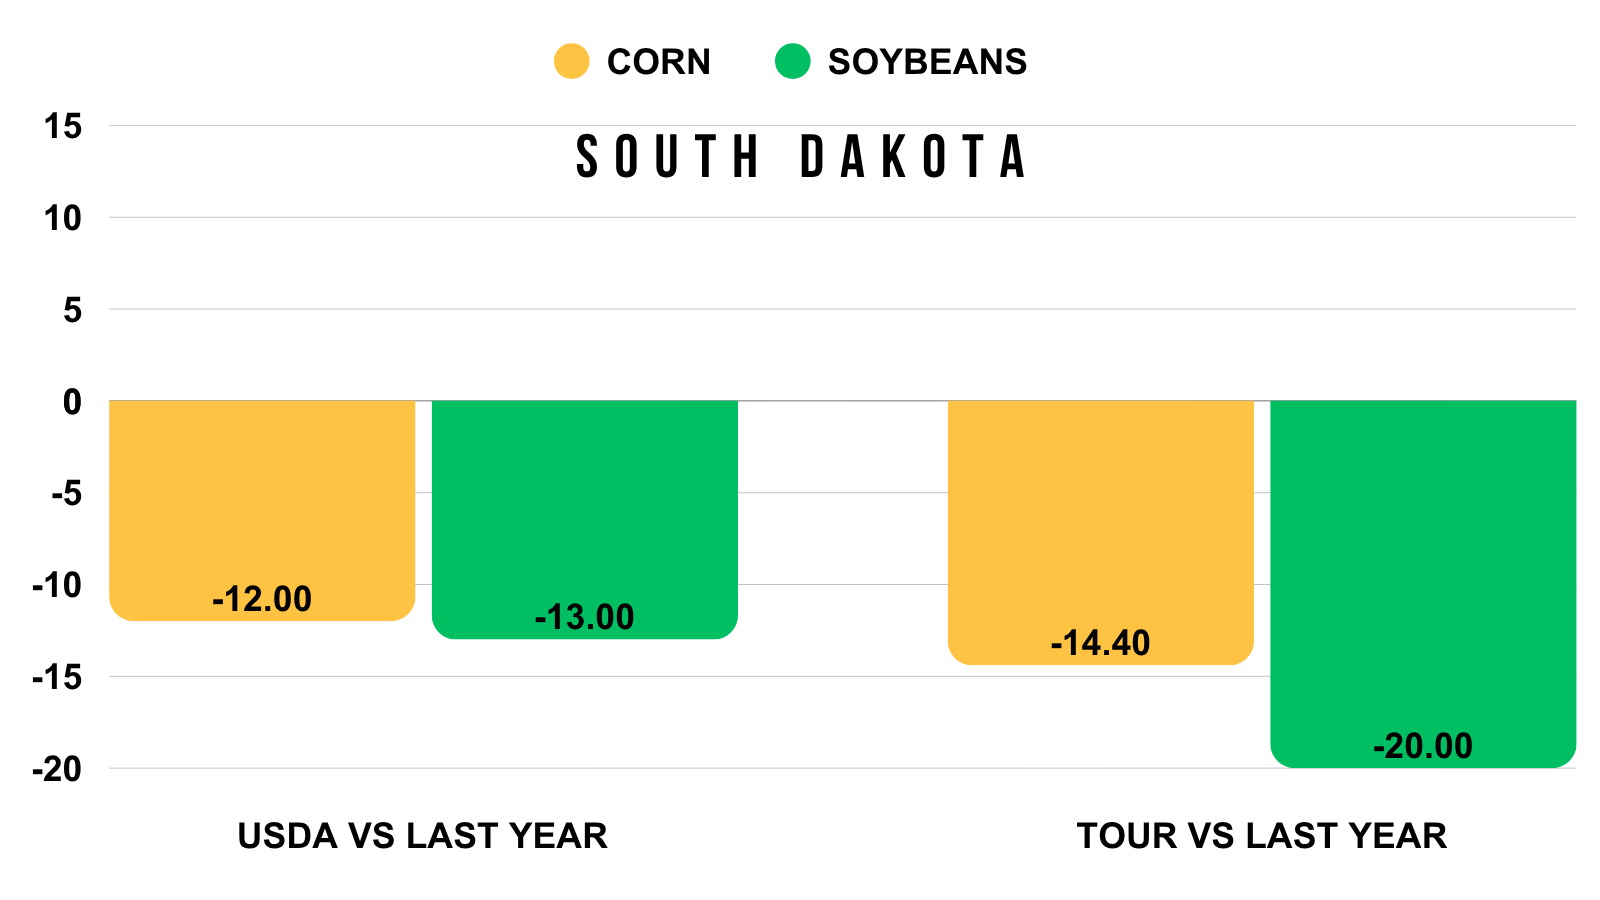
South Dakota Corn:
Tour: -14.4% vs last year
USDA: -12% vs last year
South Dakota Beans:
Tour: -20% vs last year (pod counts)
USDA: -13% vs last year (yield)
So the South Dakota crops were worse than expected. Although they do not cover the entirety of the state.
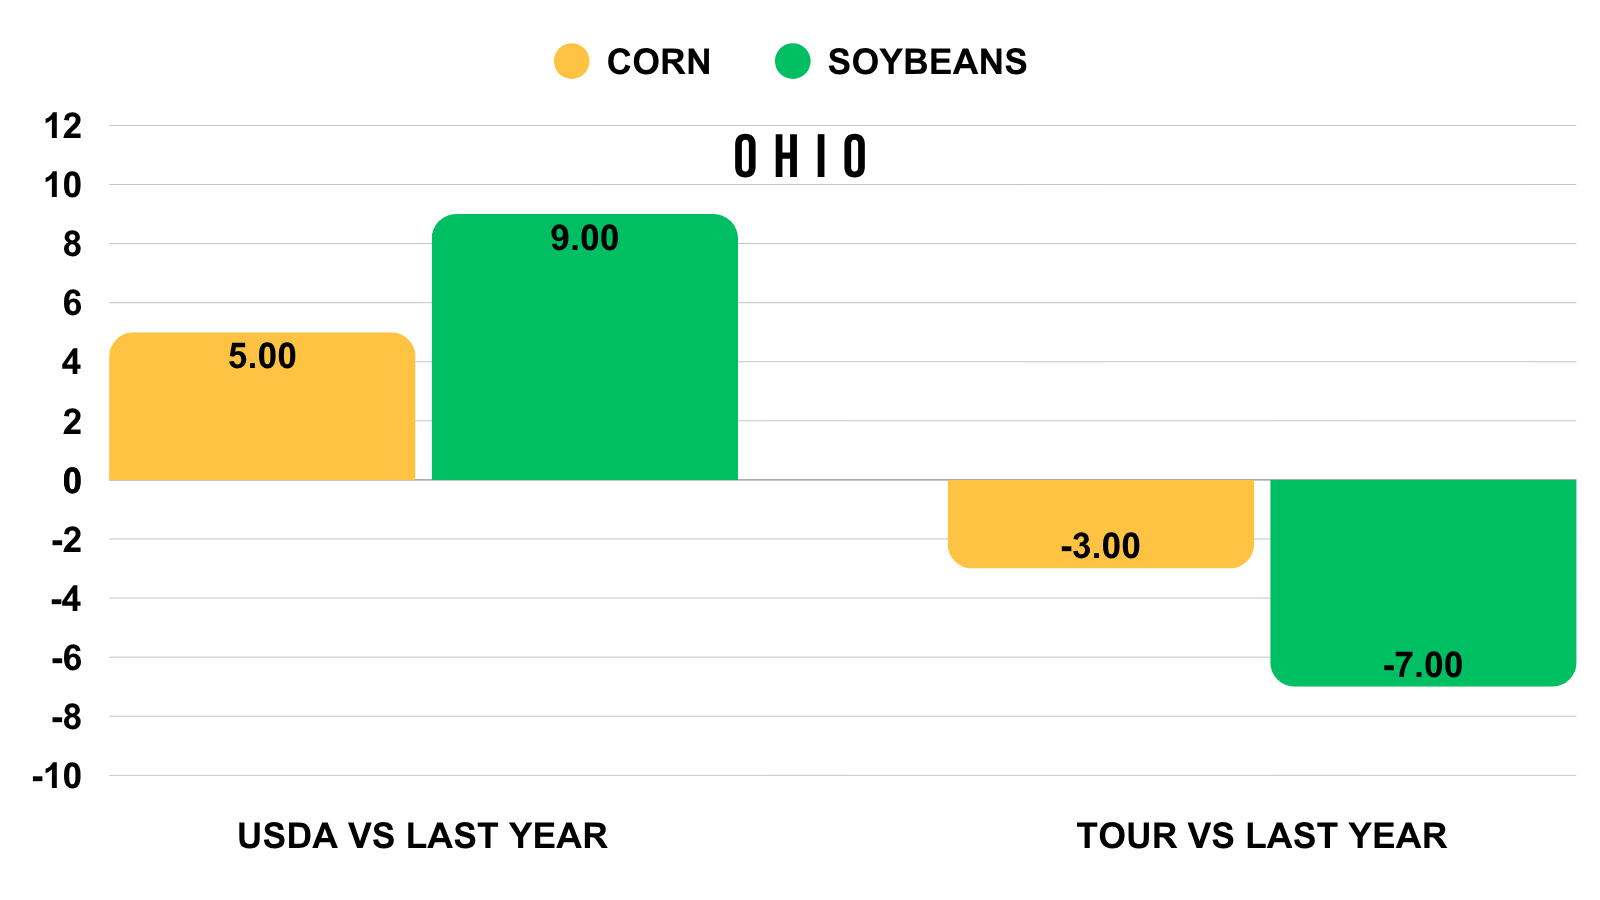
Ohio Corn:
Tour: -3% vs last year
USDA: +5% vs last year
Ohio Beans:
Tour: -7% vs last year (pod counts)
USDA: +9% vs last year (yield)
Meanwhile in Ohio, the USDA is expecting a better crop than last year, but the tours data has a worse crop than last year for both corn and beans.
Today's Main Takeaways
Corn
Short term, we are running into some possible resistance on the charts which we will touch on.
Long term, the upside potential is still there.
We already went over this pretty heavily last week, but the USDA just dropped our stocks to use down to 10%.
Which is not a bearish number.
It's not quiet in full blown bull market territory like a 8-9% stocks to use would potentially imply. But essentially, we are knocking on the door of that bullish territory.
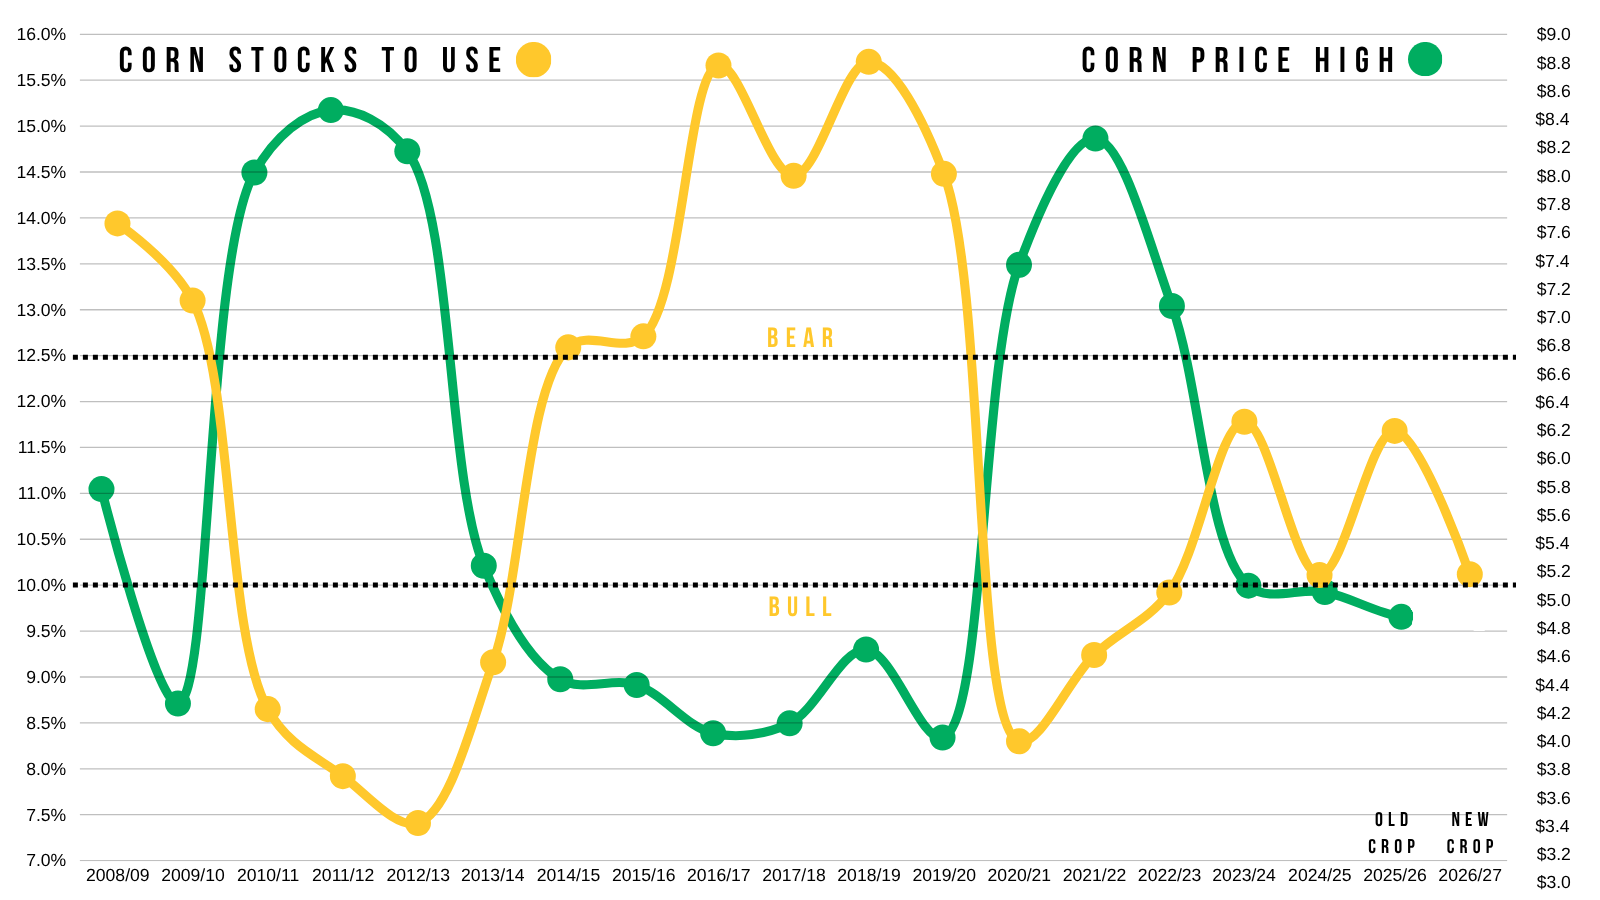
If that number starts to creep towards 8-9% then you would have to argue that corn is likely too cheap here.
As that would historically imply higher prices.
To get corn beyond $5.00 we usually need to see it drop below 10%.
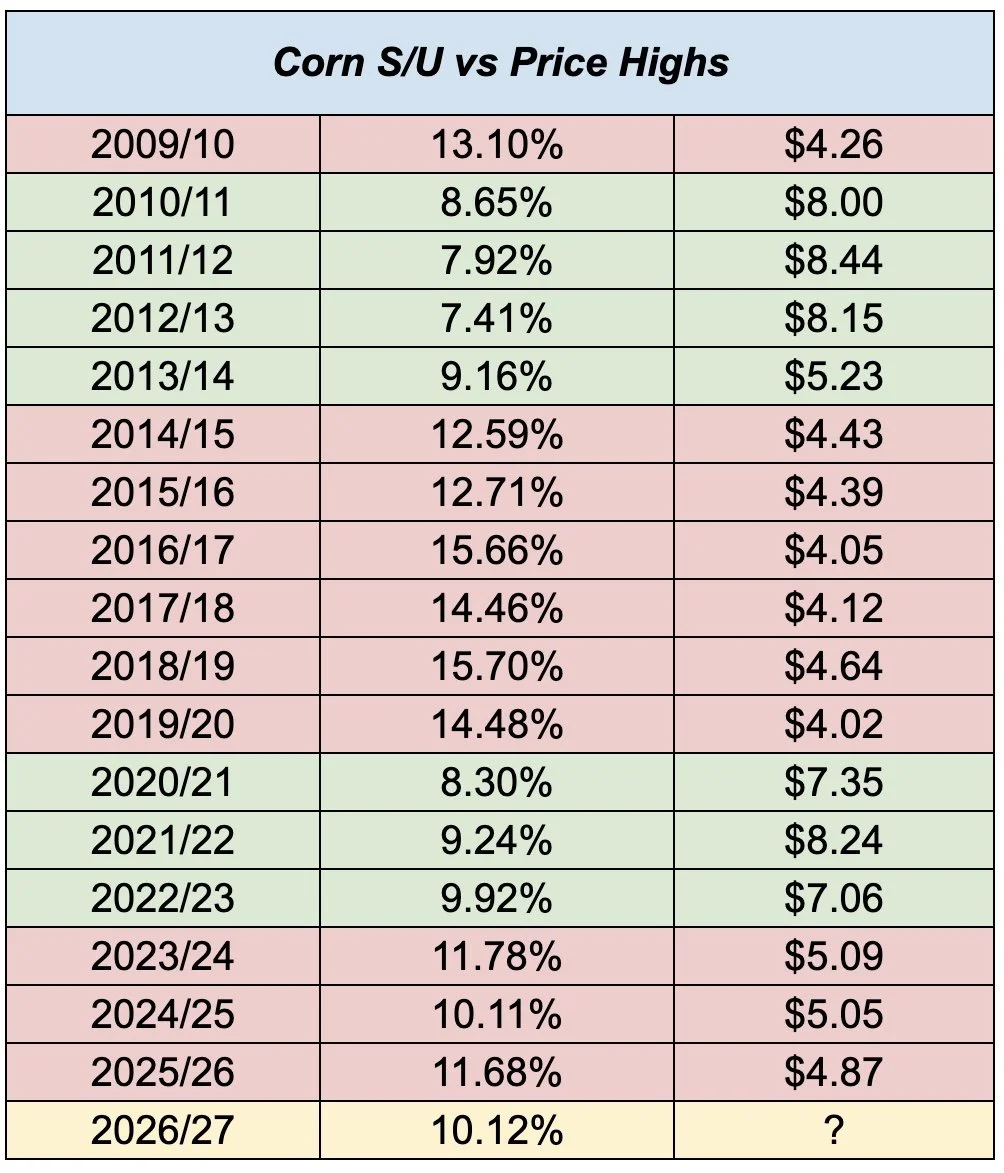
Do we "have" to get a sub 10% stocks to use? No.
But the most interesting part is just how tight we are for this time of year when you compare this to years of the past.
I showed this last week as well.
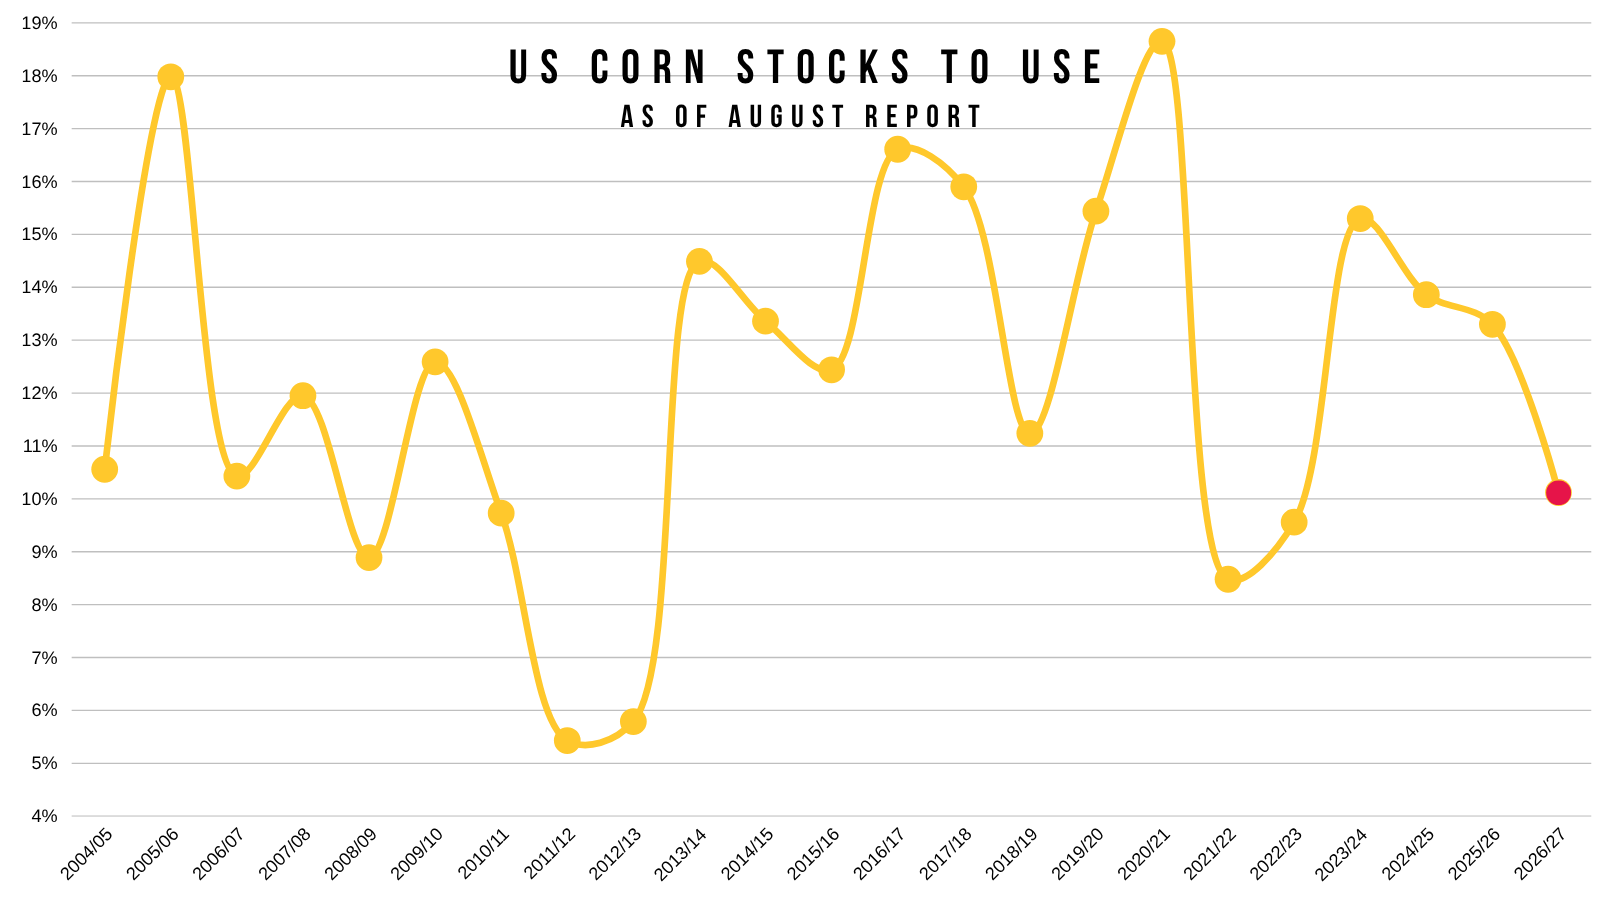
This is the stocks to use as of the August report.
For August, we are the tightest we've been since 2022, which is actually one of the tightest starts in over the last +20 years.
Meaning we are starting off a lot tighter than we have the last several years.
So the room for error is the tightest it's been at this point in the year in a long time.
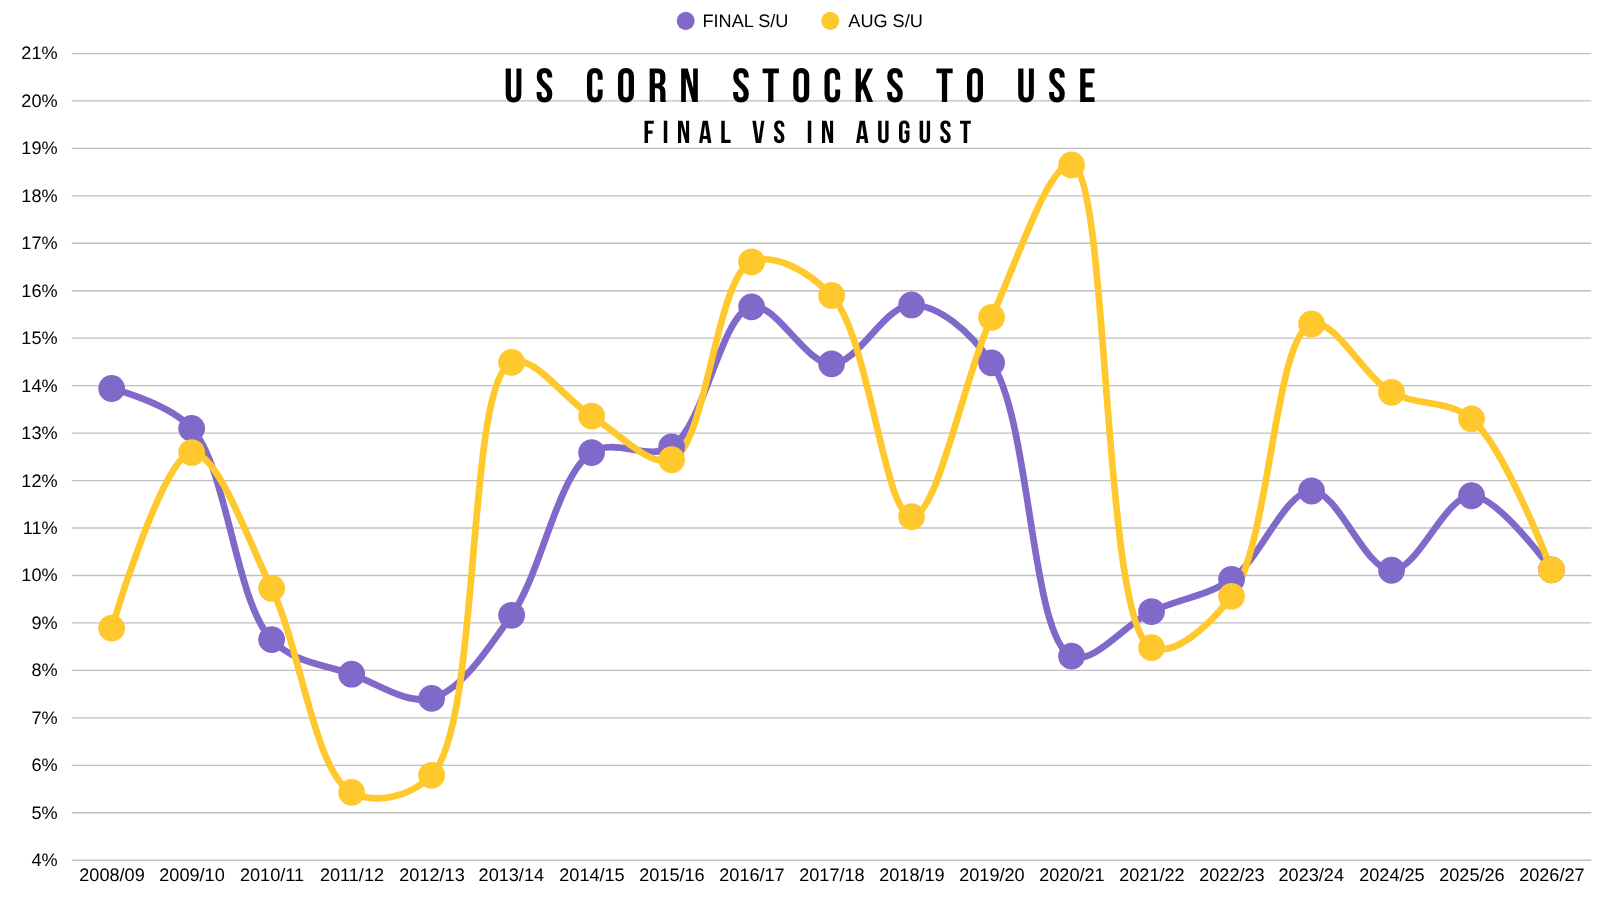
Here is what it looks like if you compare the August stocks to use vs the final one.
Over the last several years, the situation has gotten tighter as the marketing year went on.
The story is largely still a demand one.
Demand is still great, the best it's ever been.
Most would argue that our old crop exports are still going to need to be bumped even further. Potentially as much as another 100 million. Given how far ahead of pace we are vs the USDA's target.
If this happens, it tightens up the new crop situation via in the form of beginning stocks.
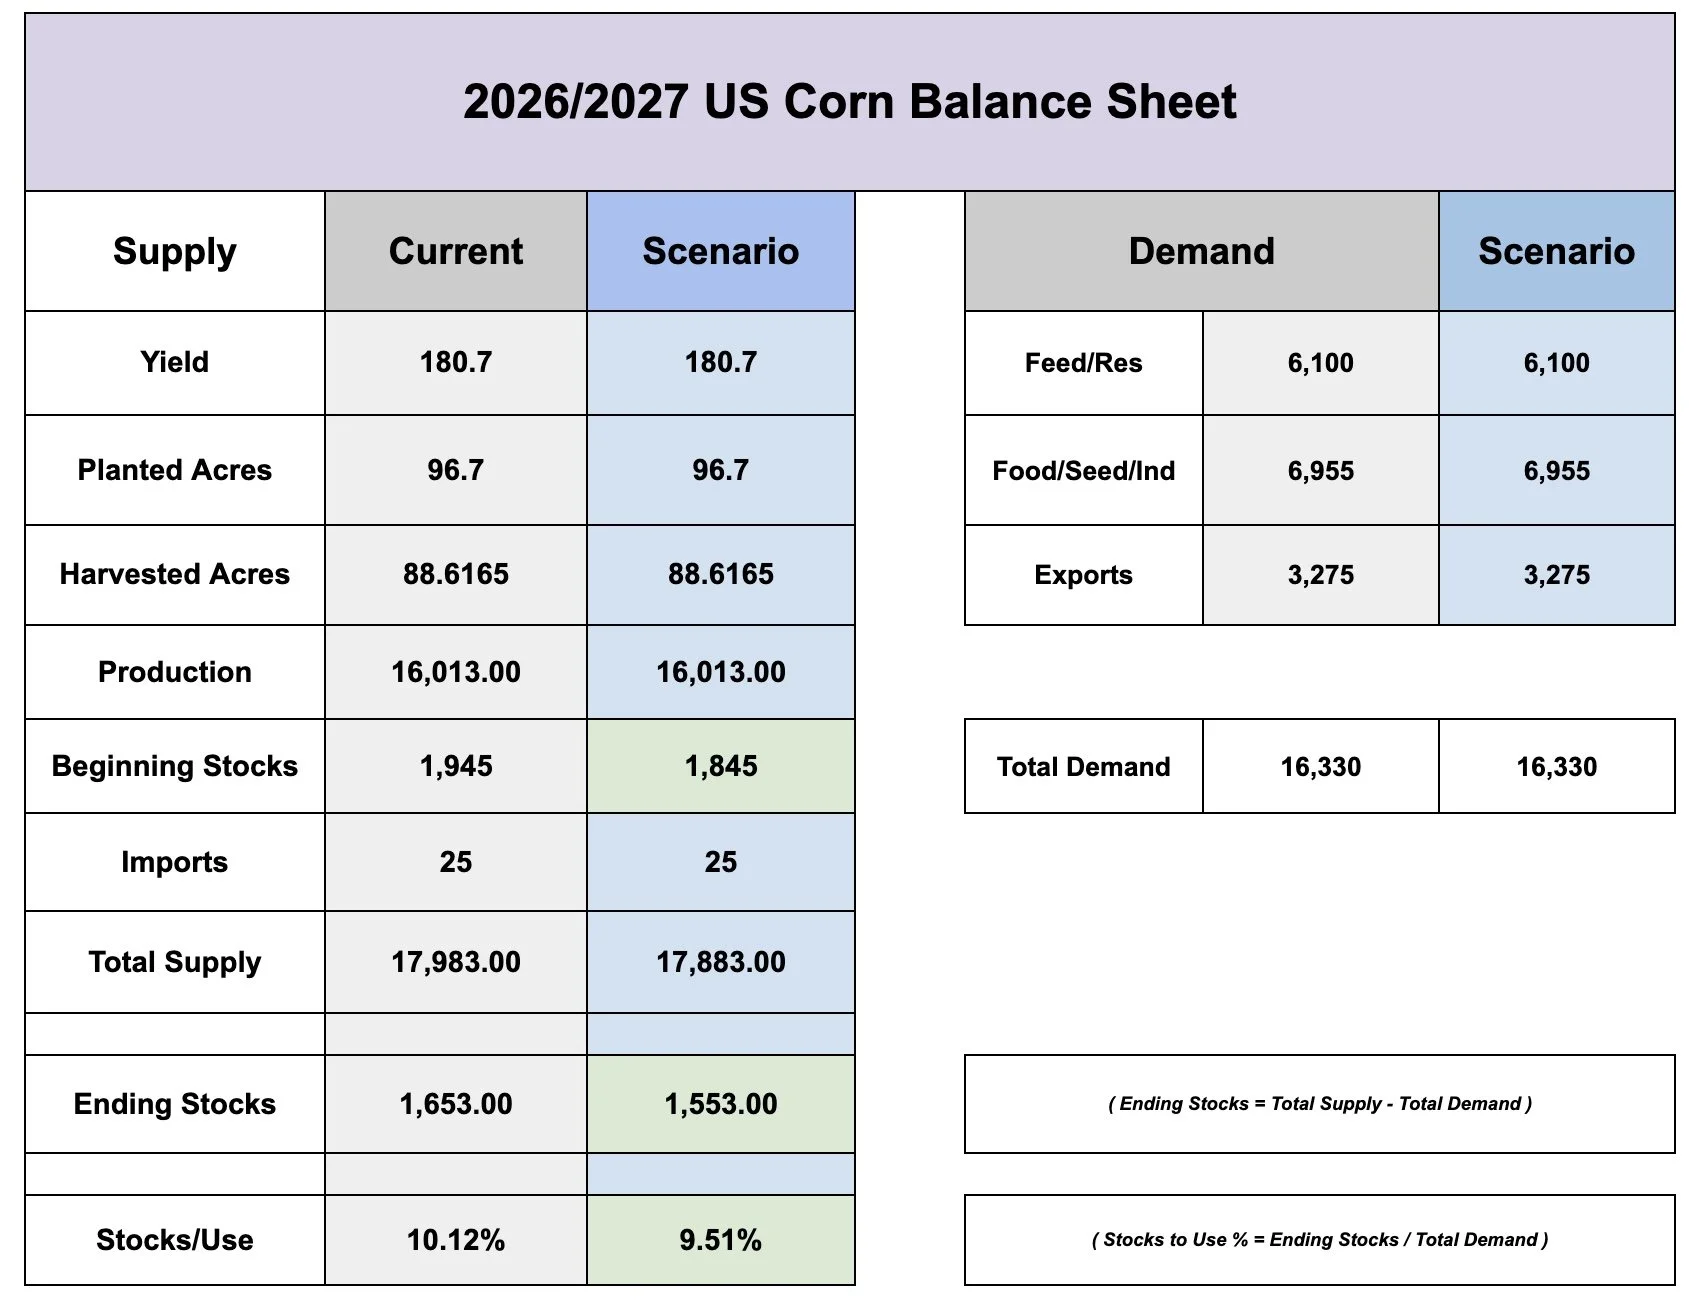
What happens if you simply take off 100 million bushels of beginning stocks off the new crop balance sheet?
Well, if the yield doesn’t increase from here, and the USDA doesn’t magically find more acres once again.
That alone would give you a sub 10% stocks to use and print a decently bullish scenario.
Or if yield ultimately comes down further, that would of course also chew into the carryout rather fast.
Again, this doesn’t have to happen, but it is hard to argue that the potential is not there.
As there isn’t much wiggle room or room for error.
(Below is a scenario where the crop size and acres stay the same, yet old crop exports get bumped by +100 million)
One possible wild card everyone seems to have forgotten about is China.
They are still suppose to be buying non-soybean ag products this year and over the course of the next few years.
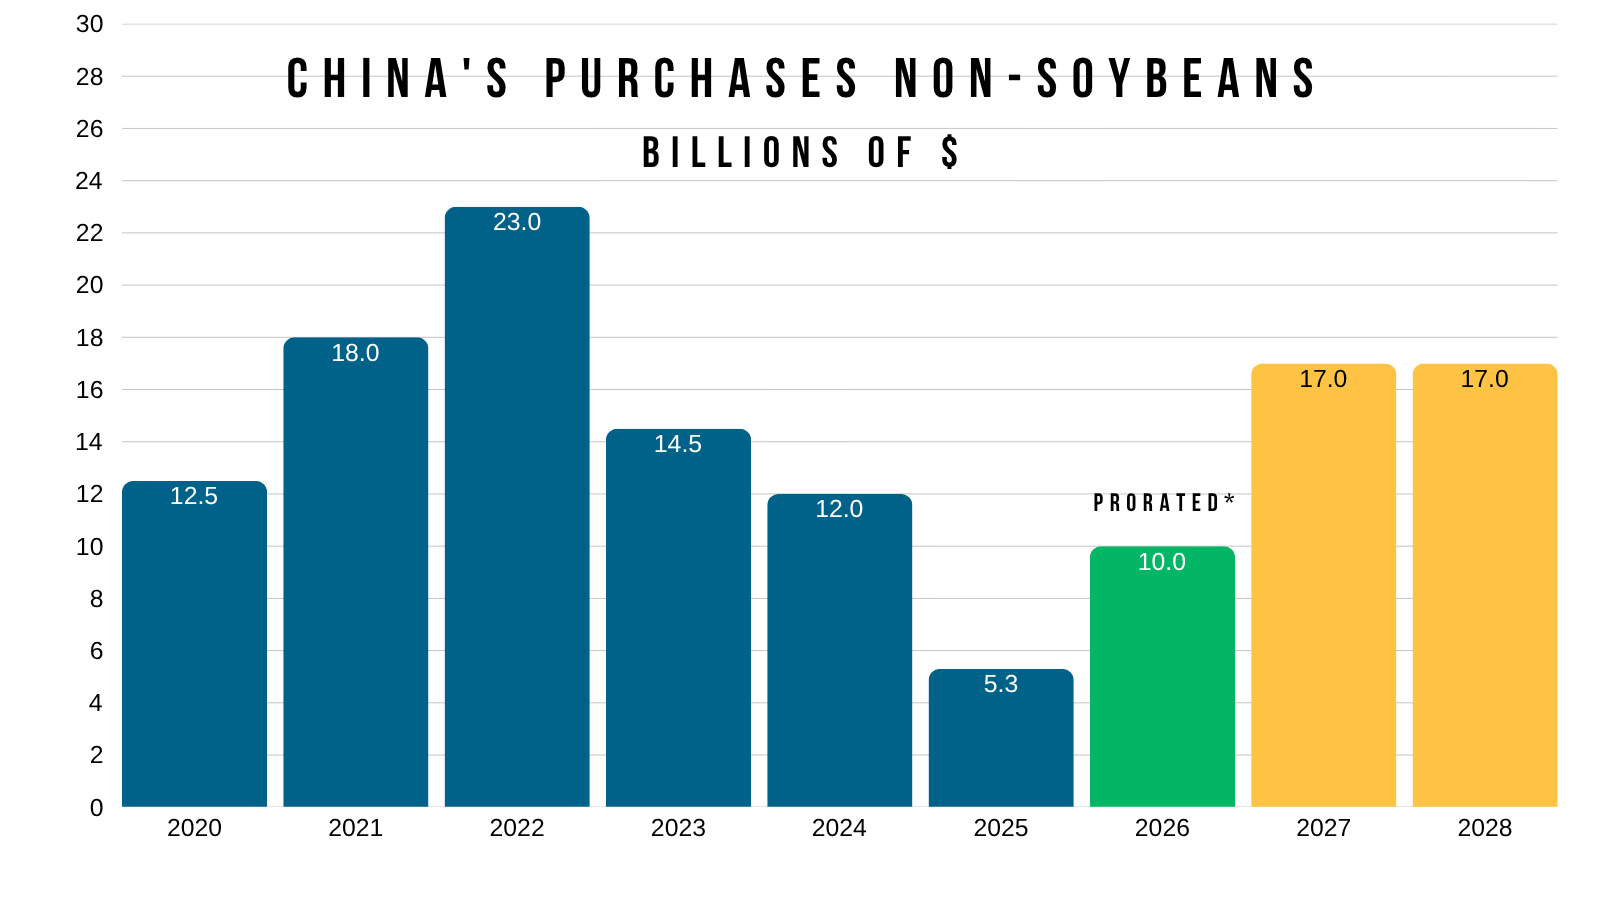
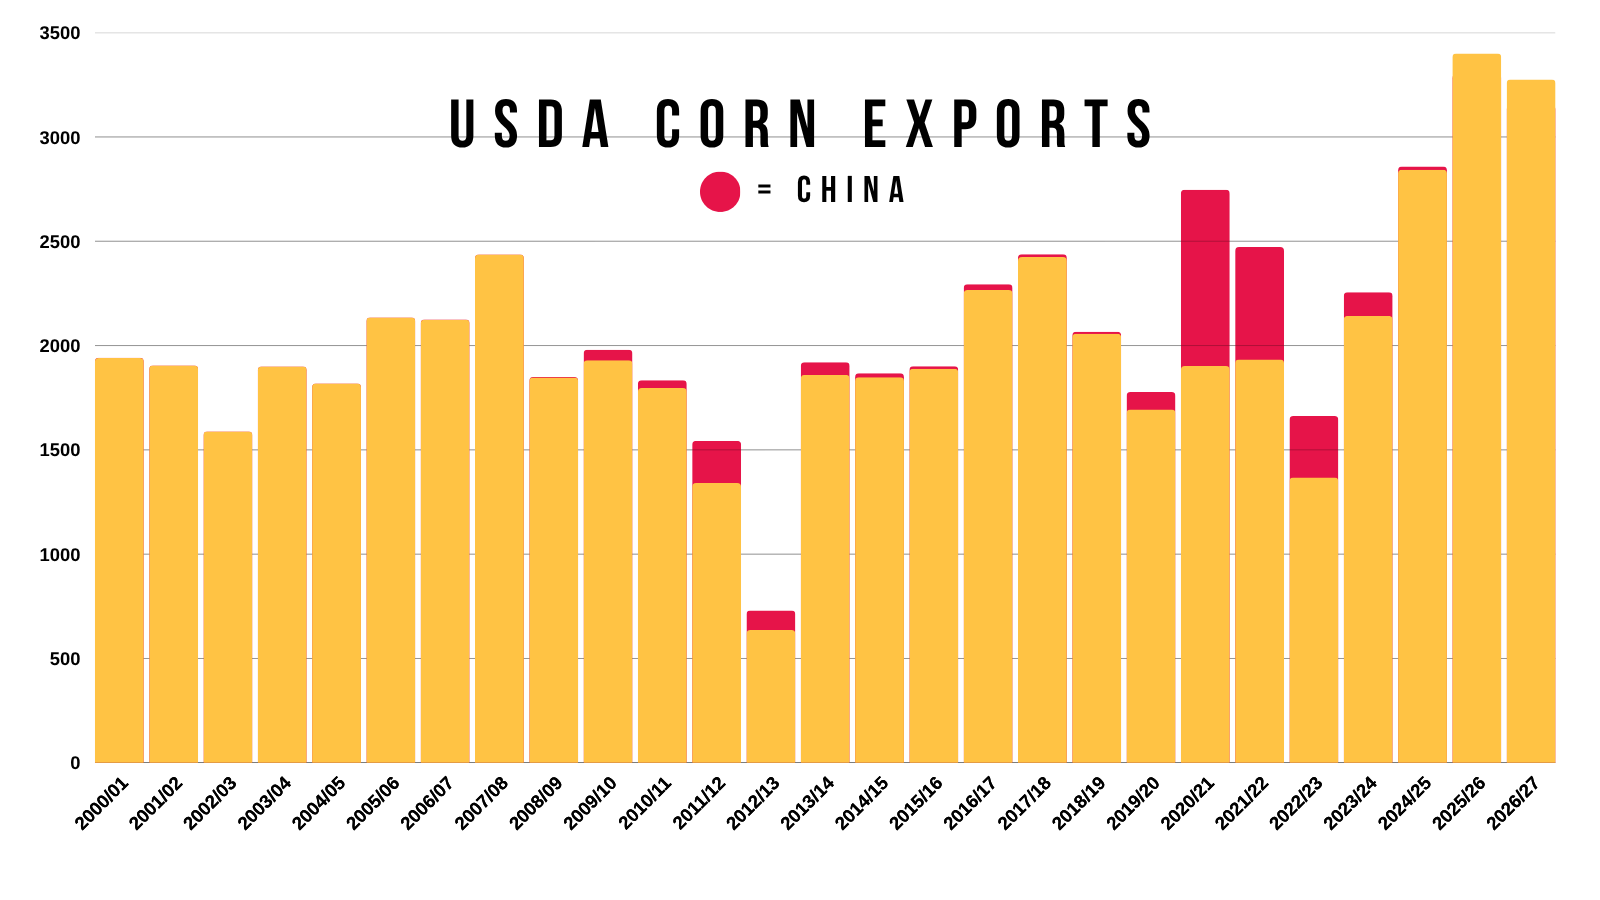
What happens if China buys on top of what is already record demand?
Our export demand shattered those 2021 and 2022 records. Which were entirely led by China vs not having a single dime of China business today.
Of course it's not guaranteed, but a very very real possibility China still steps in at some point.
Bottom Line & Marketing:
I am not going to spend much else time on corn today. We've done plenty of deep dives into the long term potential and the fundamentals.
If you are behind in your marketing or lack storage, we hit $4.90 Dec corn again for the 4th time this year and are up against some potential short term resistance.
So if you did not do enough near the May highs or the recent July highs, it is not be the worst spot to take a few chips off the table for you.
For the time of year, Dec corn is also sitting at it's highest levels since 2022. So that's hard to pass up entirely.
For those that don’t need to move anything and are comfortable at your current levels, we like being more patient as I think there will be more opportunities later on. They just might not happen exactly as fast as we want.
Sales for Next Year?
If you are wondering about sales for next years crop, we aren’t a big fan. Especially if you do not have inputs locked in.
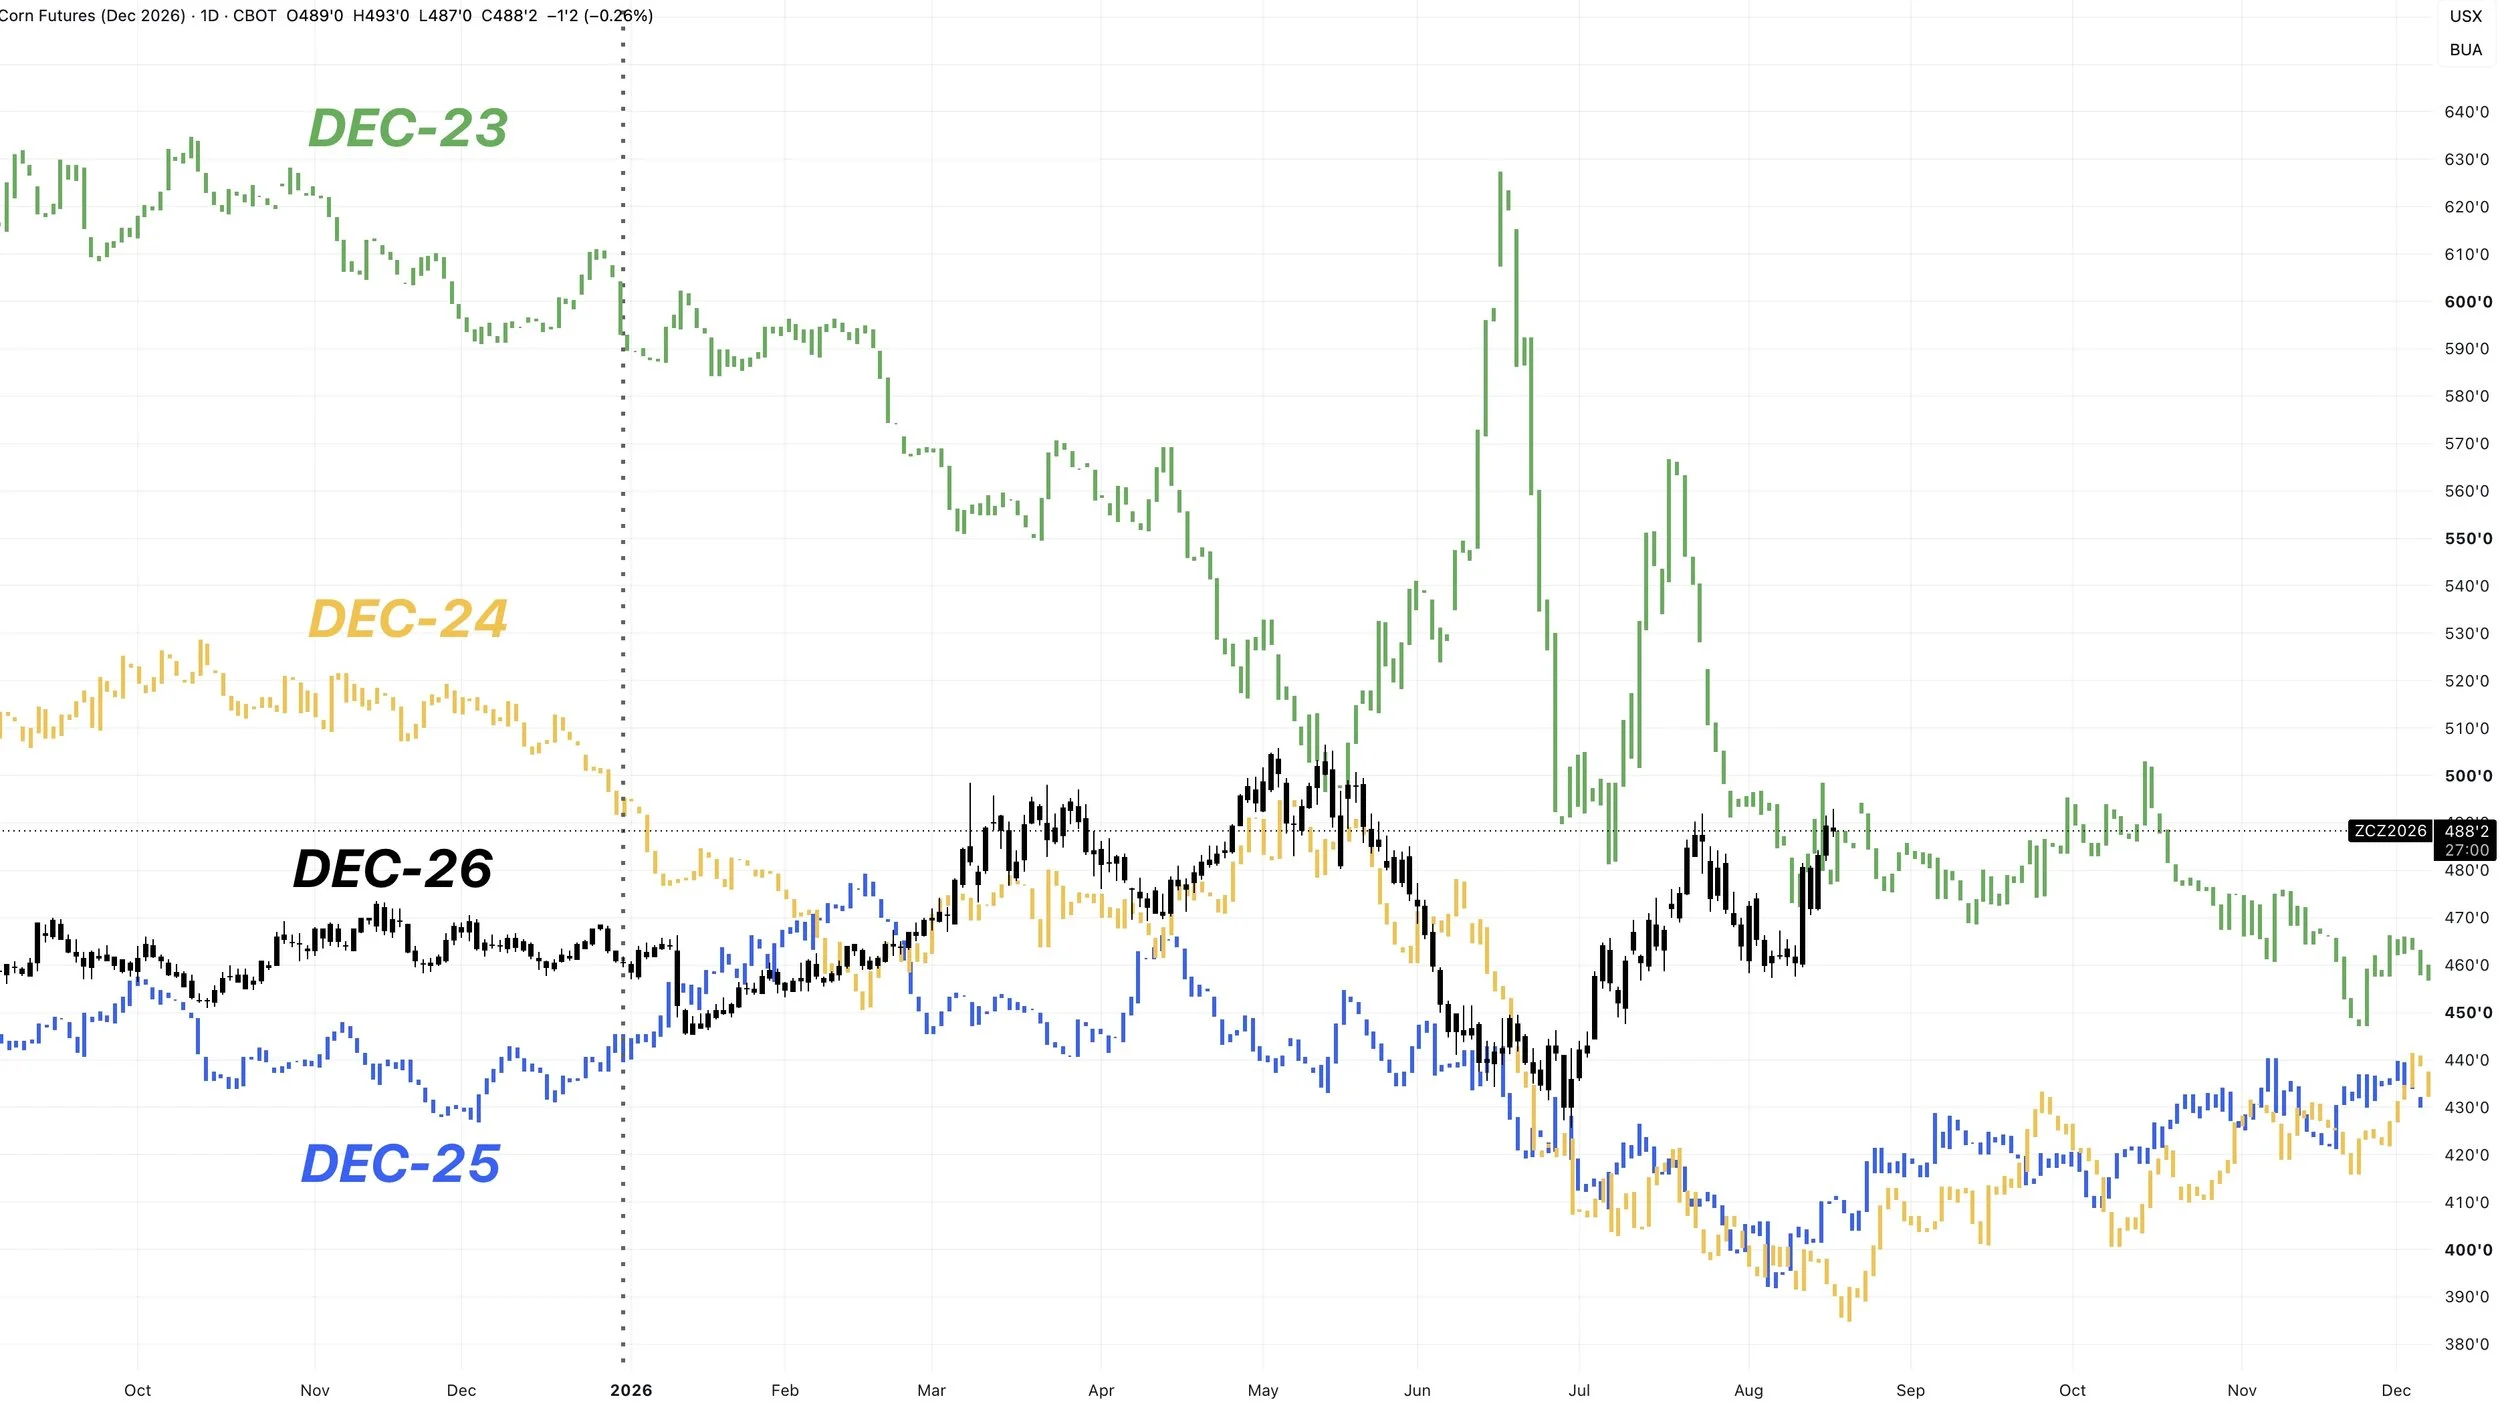
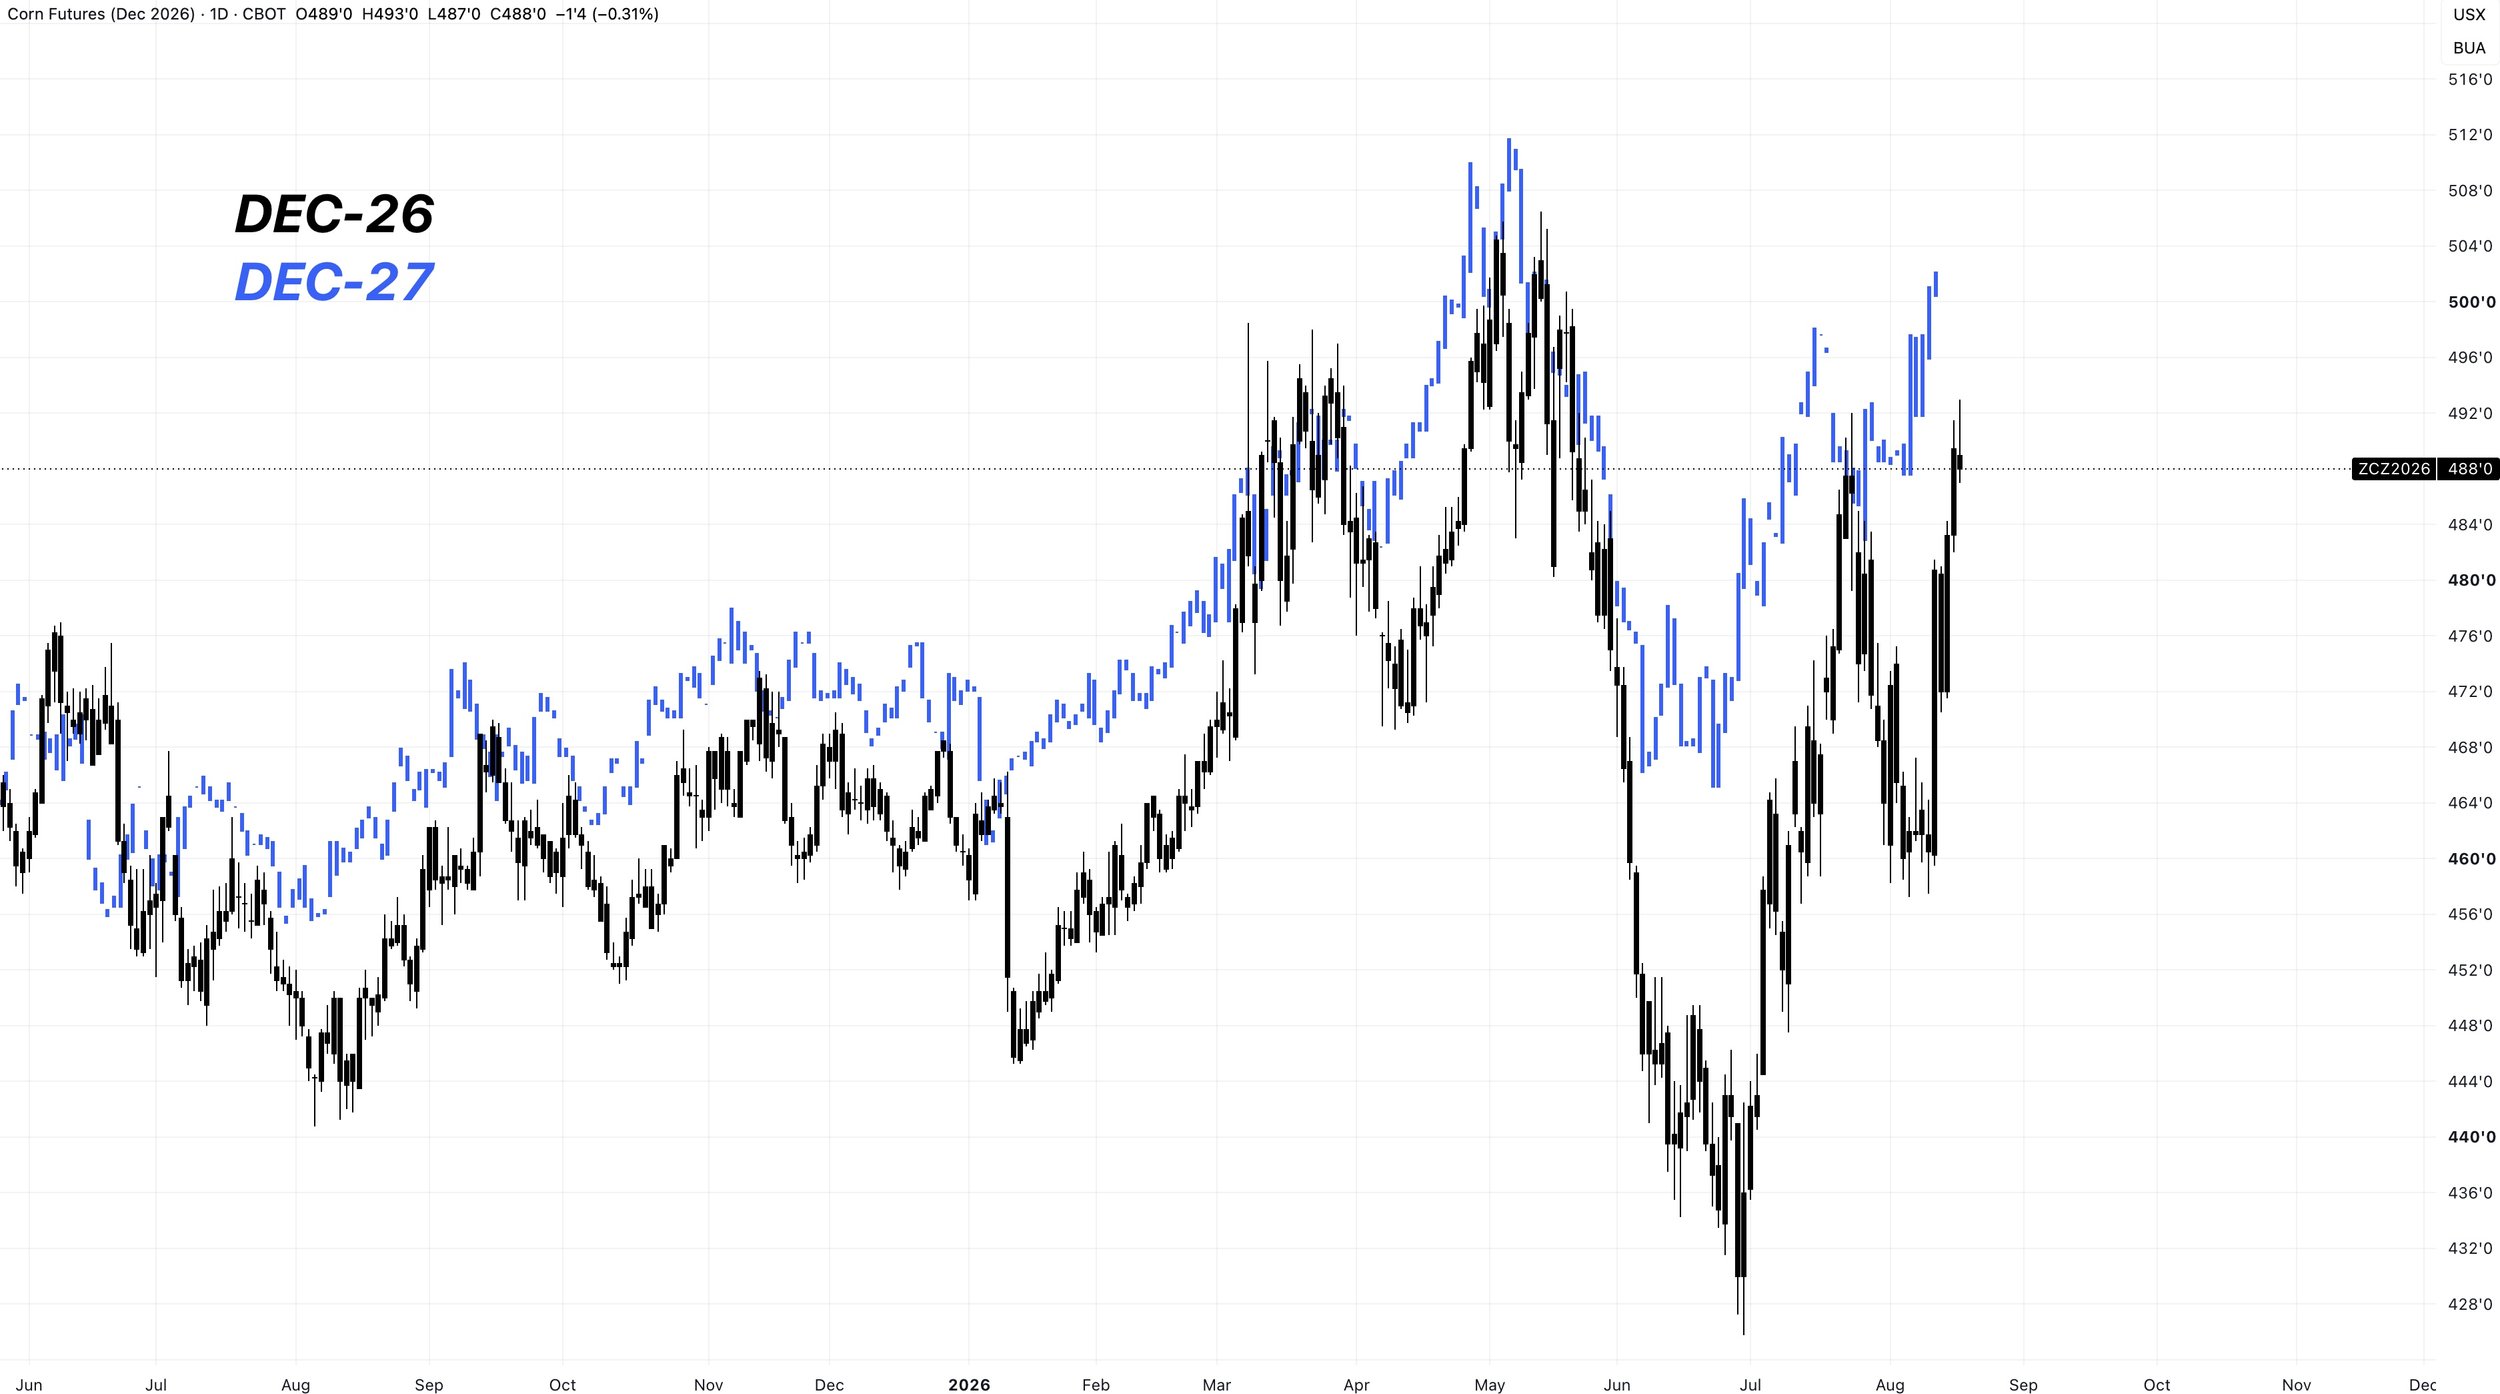
There is only a 12 cent carry from Dec-26 to Dec-27 corn.
So if anything, it might make more sense to reward Dec-26 than Dec-27, as that is not a large carry.
There is also probably more downside risk in Dec-26 than there is in Dec-27 corn.
For reference, look at the recent sell off in June. Dec-26 fell much farther than Dec-27 did.
If we fall, Dec-26 will lead us lower. If we rally, Dec-26 will lead us higher.
Dec Corn Chart:
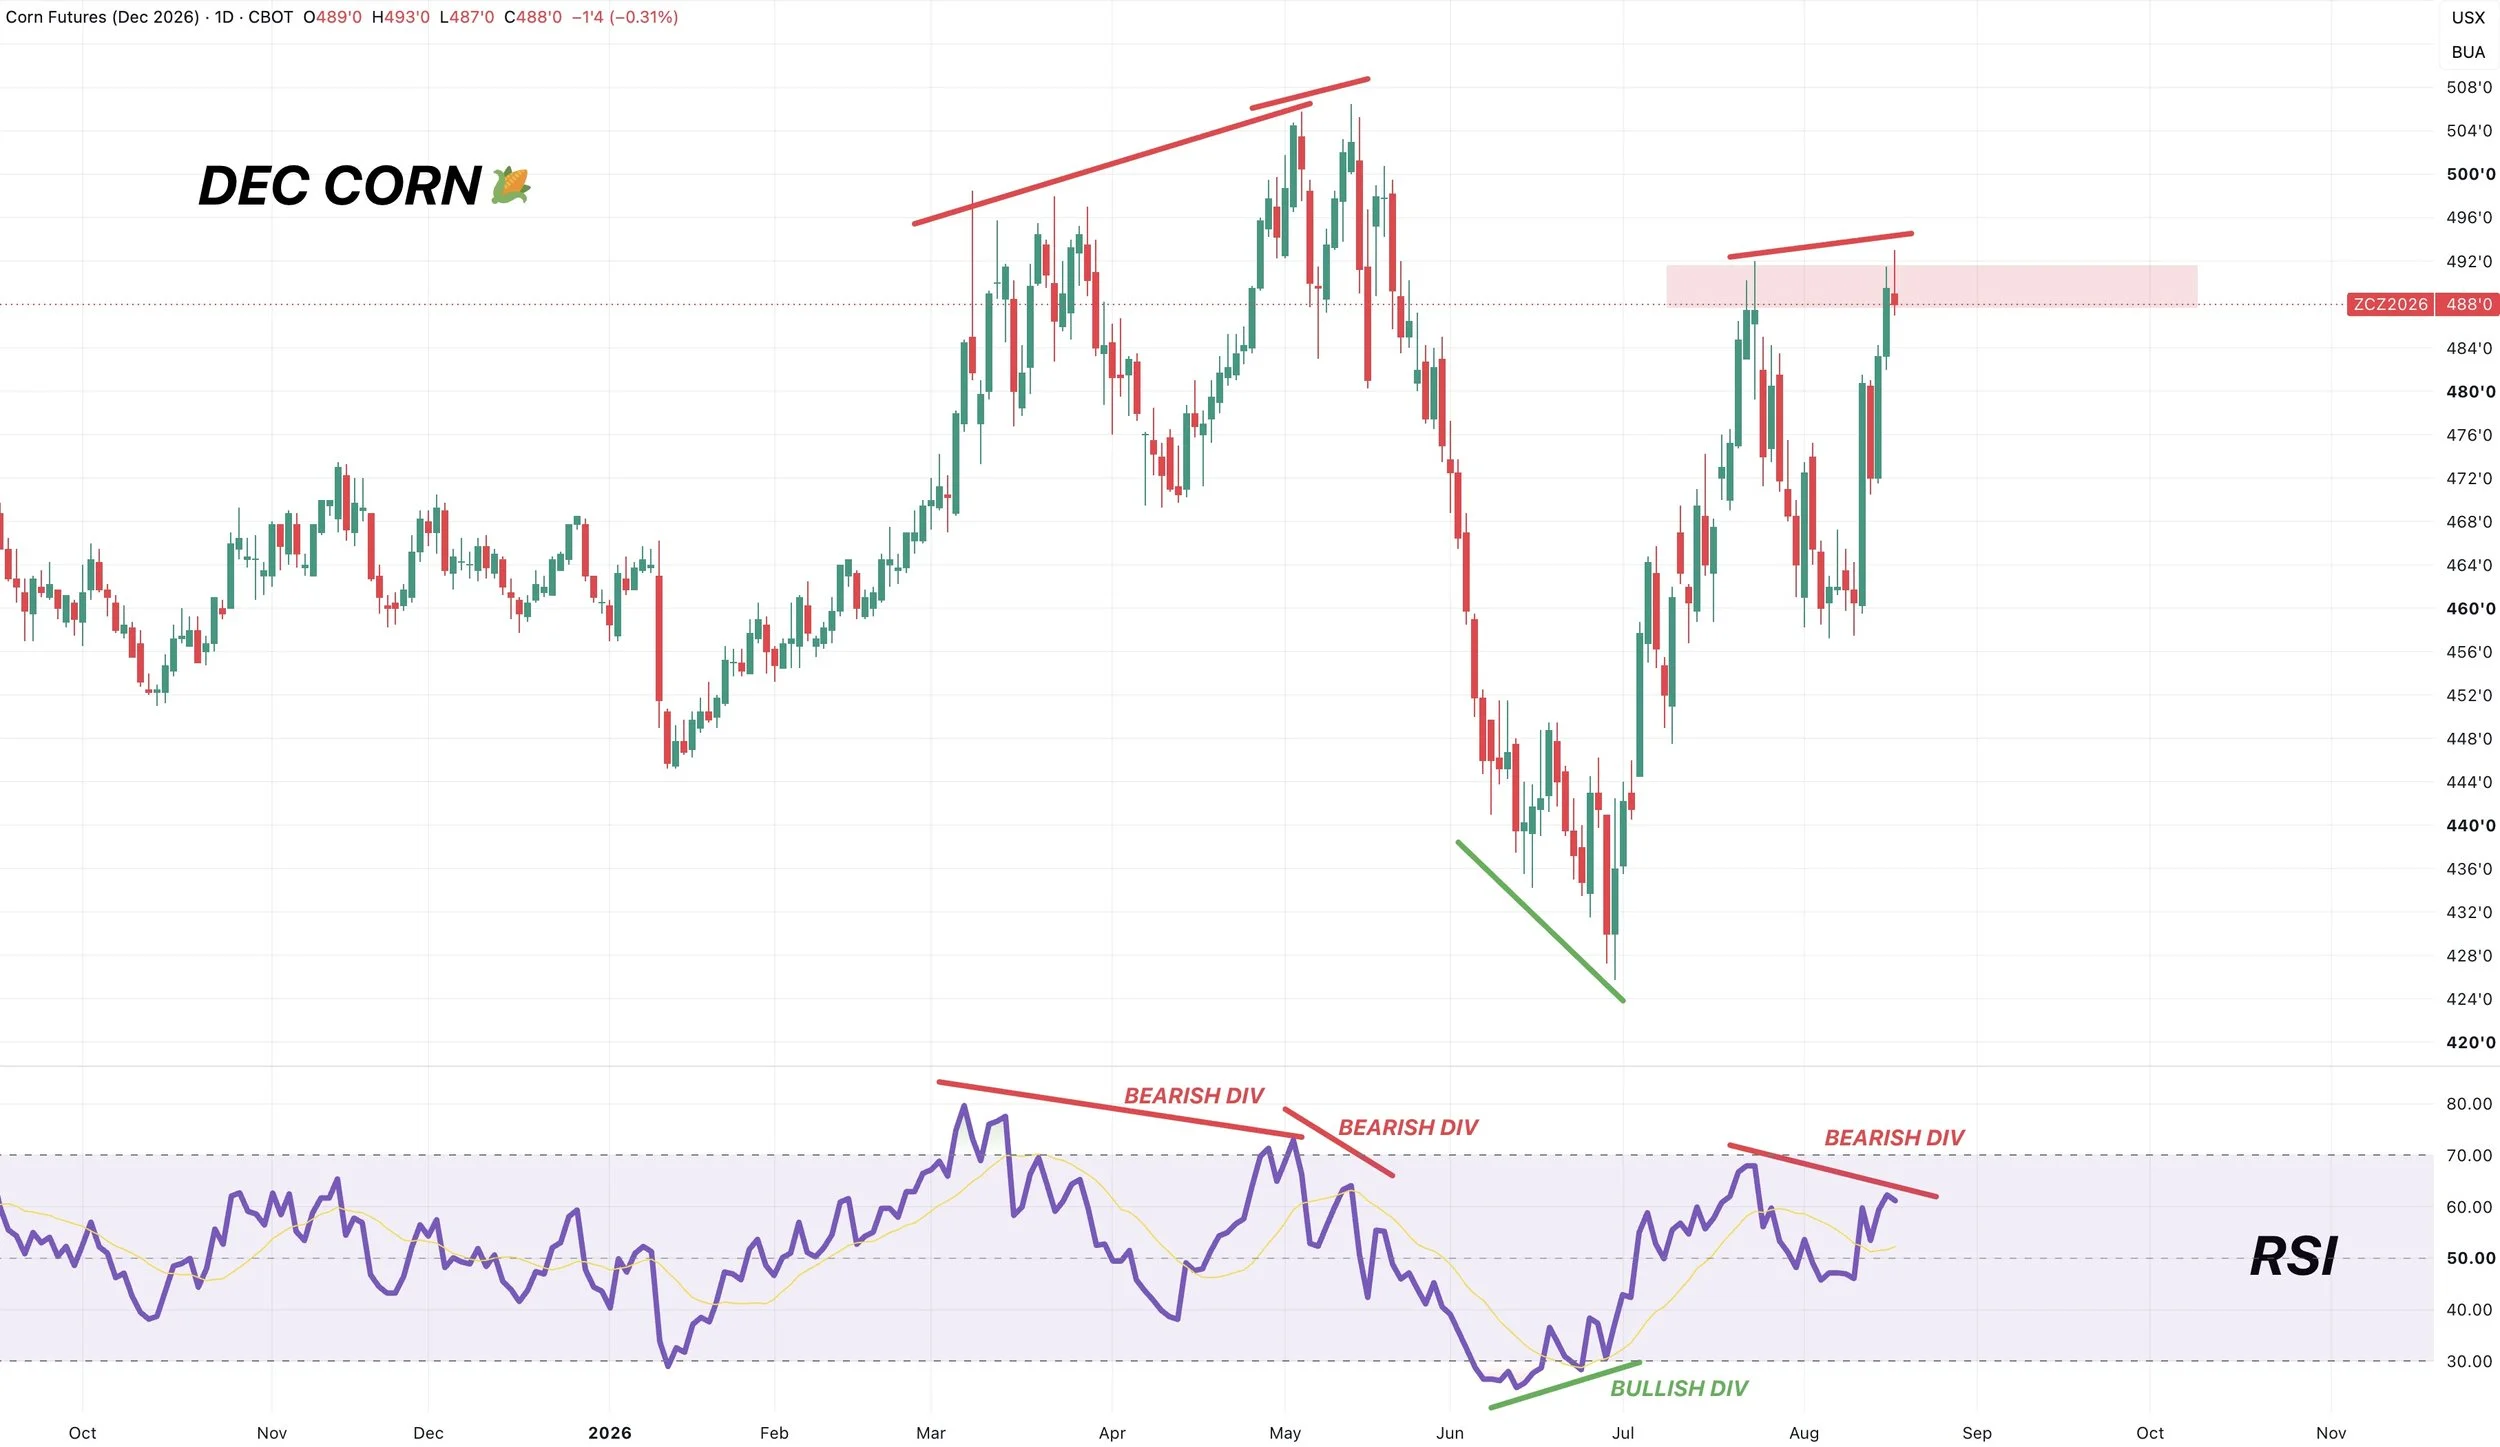
We are right up against those highs from July, and currently struggling to break through.
We do also have some slight bearish divergence that adds some short term caution.
We posted a new high, yet the RSI clearly did not. Which can often be a sign of fading momentum.
It of course doesn’t mean we "have" to head lower, but is something to be aware of here short term.
Essentially, it would not be a surprise to see us get a pullback. Although no, we do not have to.
For those that don’t have much time, rewarding at resistance is never a terrible idea.
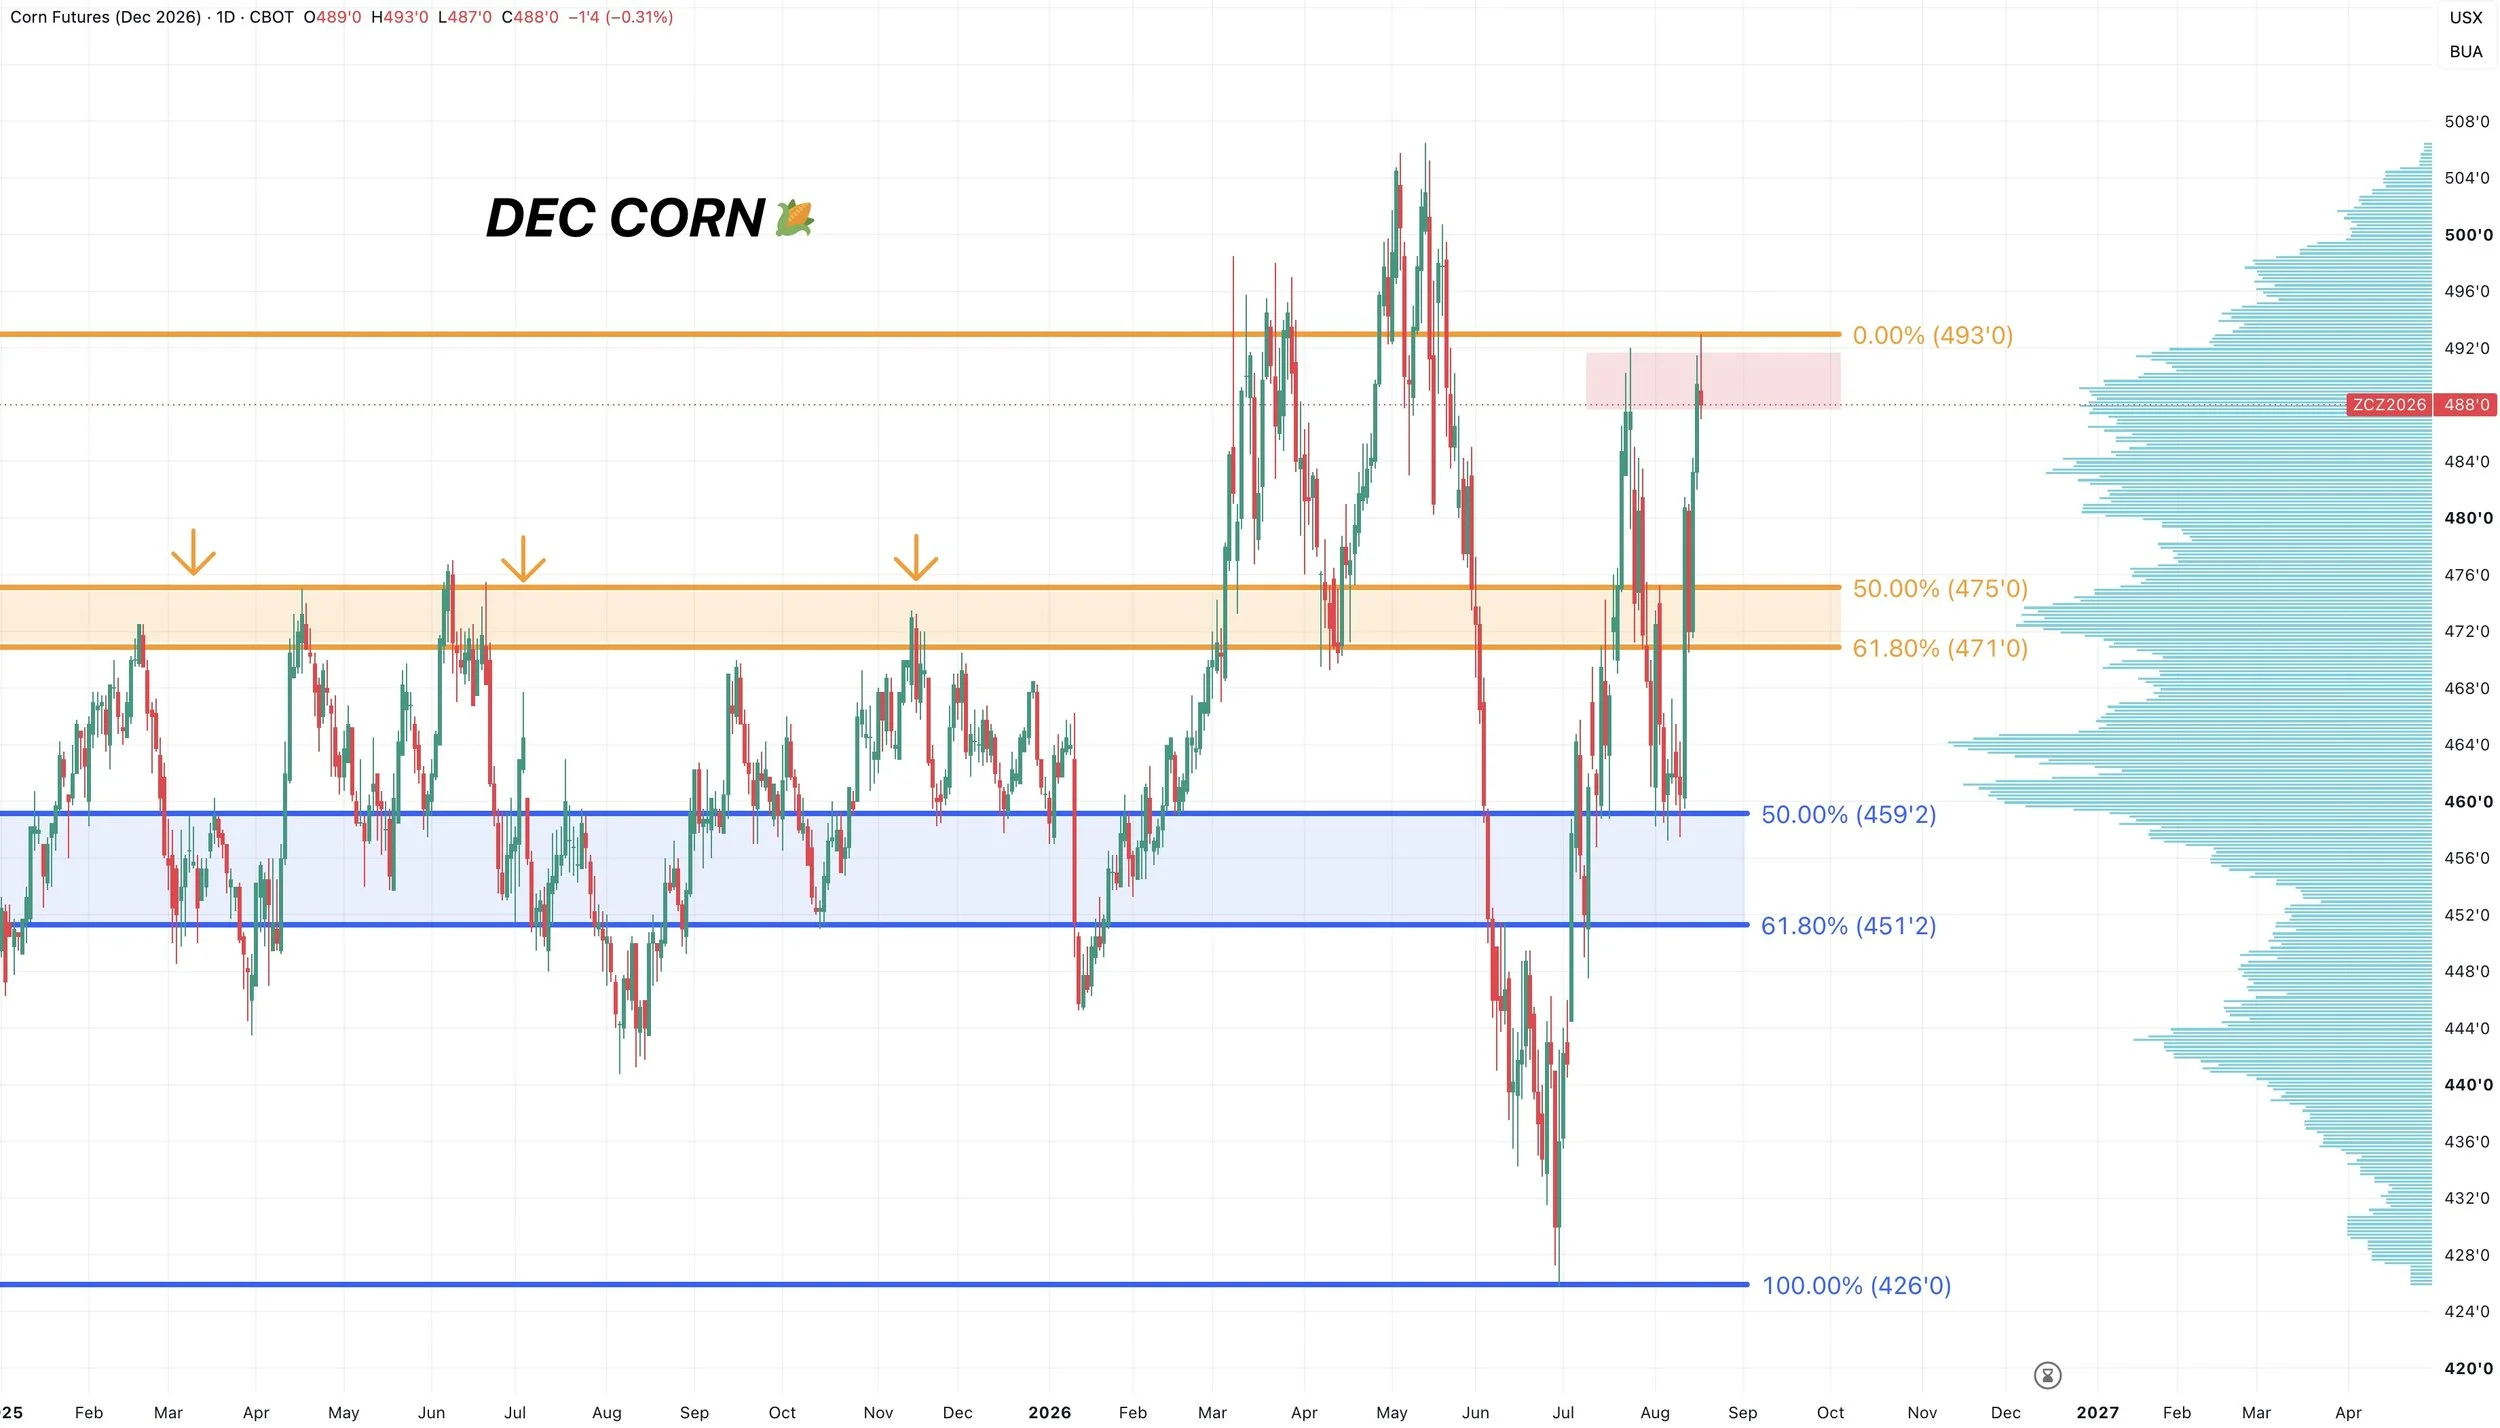
If we break through, the next obvious next target and resistance is going to be those May highs.
If we reject, a reasonable place to find a bottom would be around $4.70 to $4.75
That gives back 50% to 61.8% of the recent mini rally.
That same level is also a volume shelf, which can act as a magnet.
It's also been a key support and resistance level in the past. Being the lows from April and the highs several times throughout 2025.
If we get a pullback, that is where I'm looking for a bounce.
Soybeans
We have been seeing a ton of rain, so the market is starting to wonder if we've actually gotten too much rain.
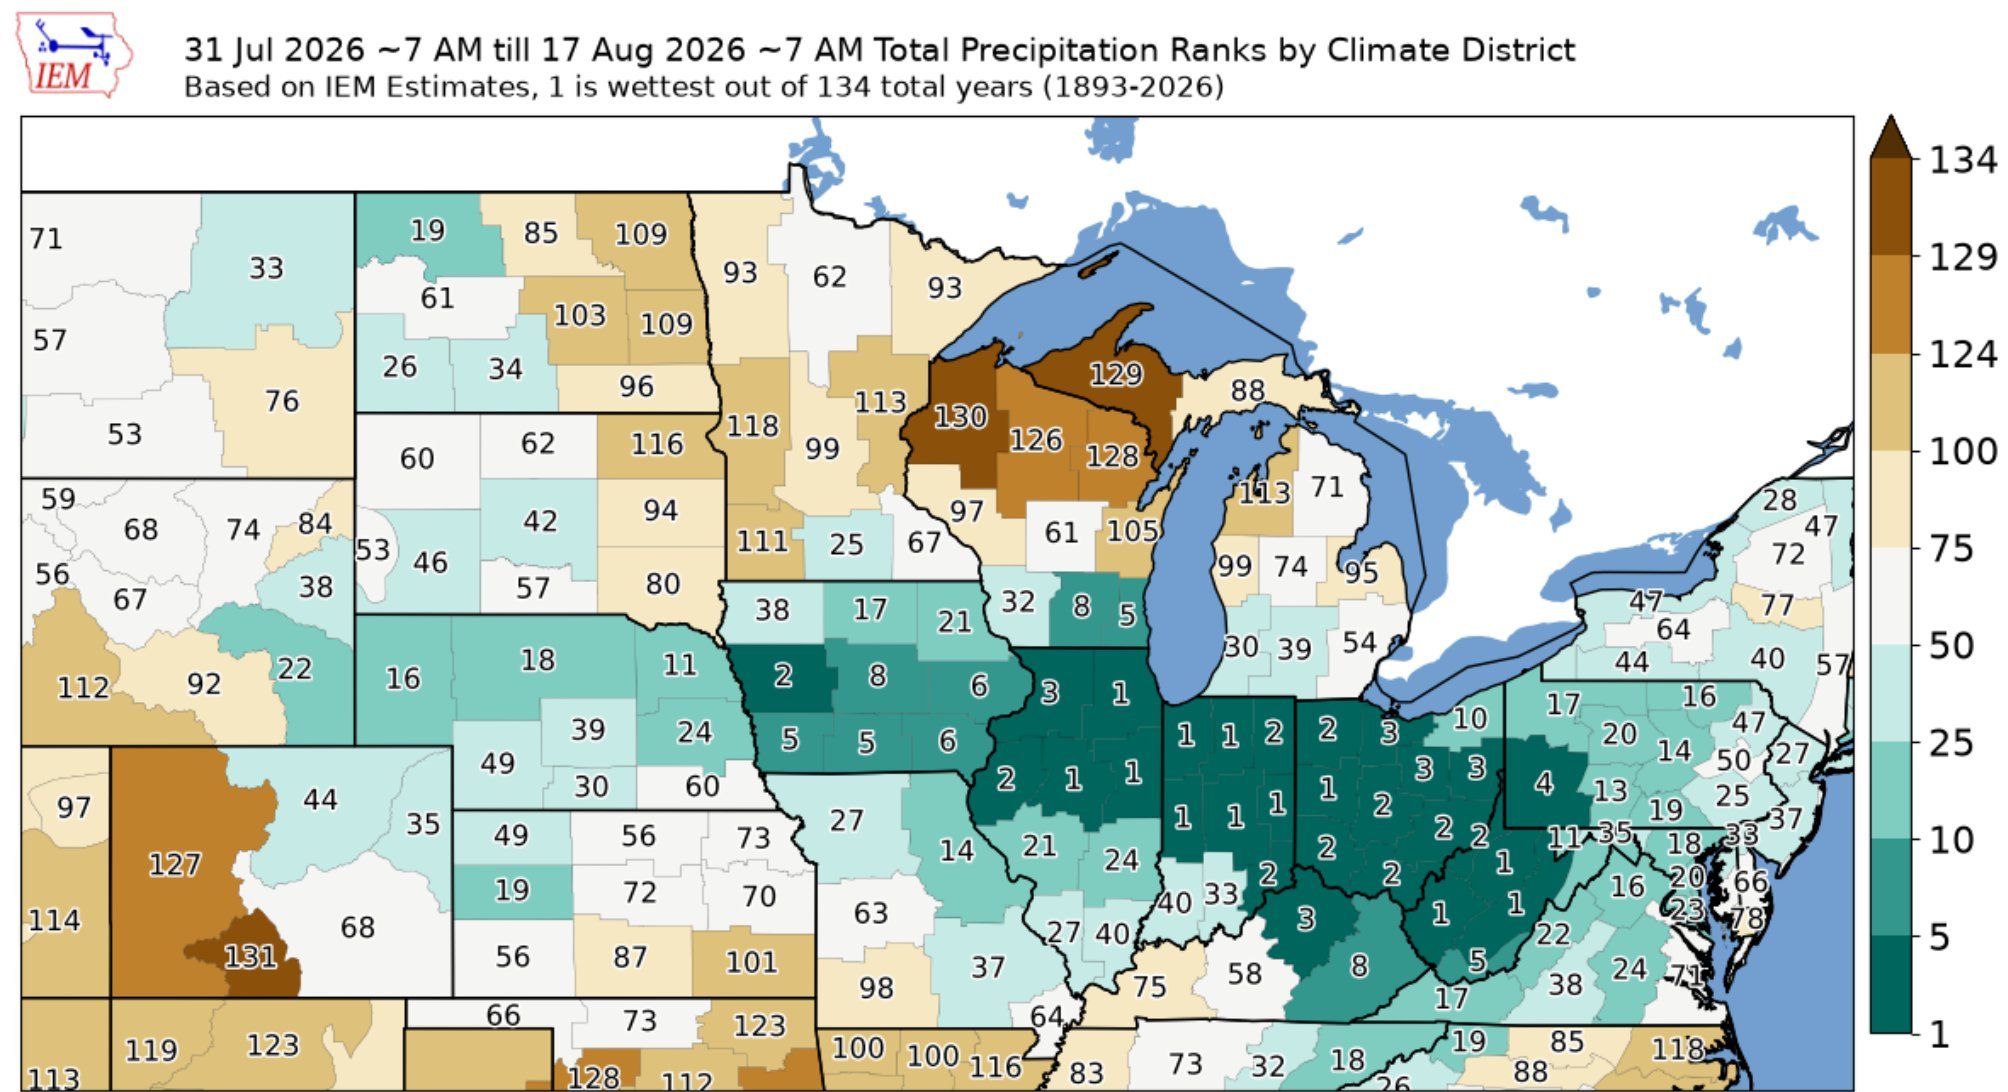
A good portion of the central to eastern corn belt has seen their wettest start to August of all time.
Although, the forecasts do appear like they are going to be drying out for the next week or two. So that could have actually been part of the weakness today.
China keeps buying soybeans, as we saw yet another flash sale this morning.
I am not going to get too deep into this topic today, as we've talked about this before.
But the China buying is one of the biggest potential bullish factors in the soybean market long term.
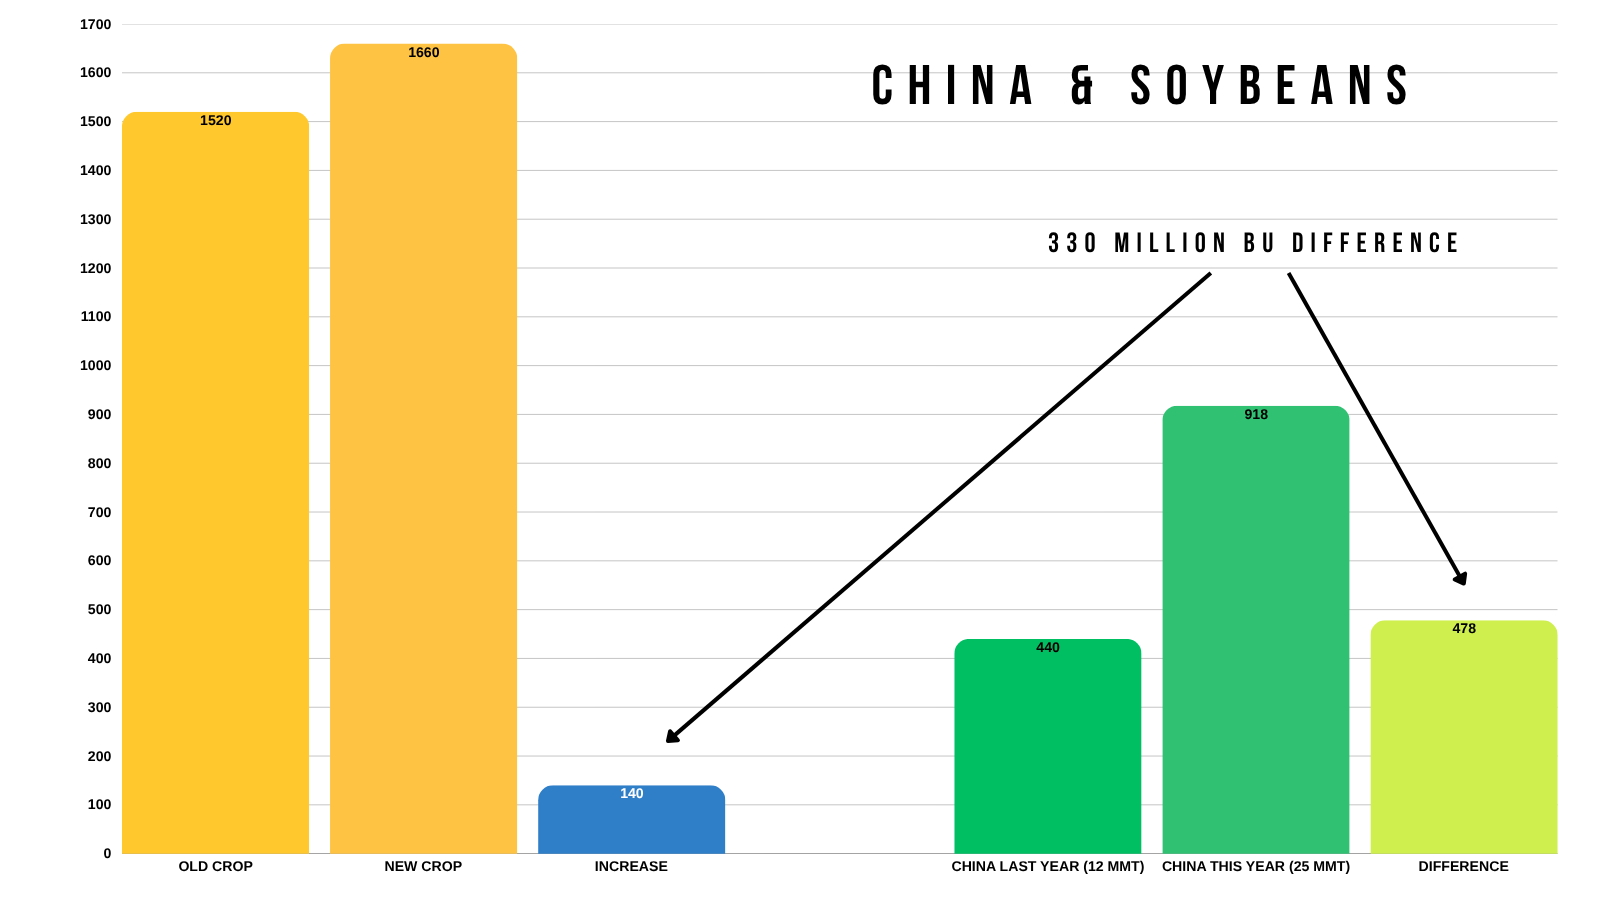
Given that the the USDA only expects them to buy 16 of the 25 MMT they agreed to buy.
To keep it short, the USDA has exports up 140 million vs last year.
But.. China agreed to buy 480 million bu more than last year.
Which is over a 300 million bu difference, and that would be the same size as our entire carryout.
Meaning if China actually buys what they said they would, we simply do not have the soybeans to fulfill that goal.
So to fix this, we would potentially have to ration demand to non-China via higher prices. Incentivizing us to lose that demand to non-China.
We had NOPA crush out yesterday.
The numbers were called disappointing because they came in below the estimates.
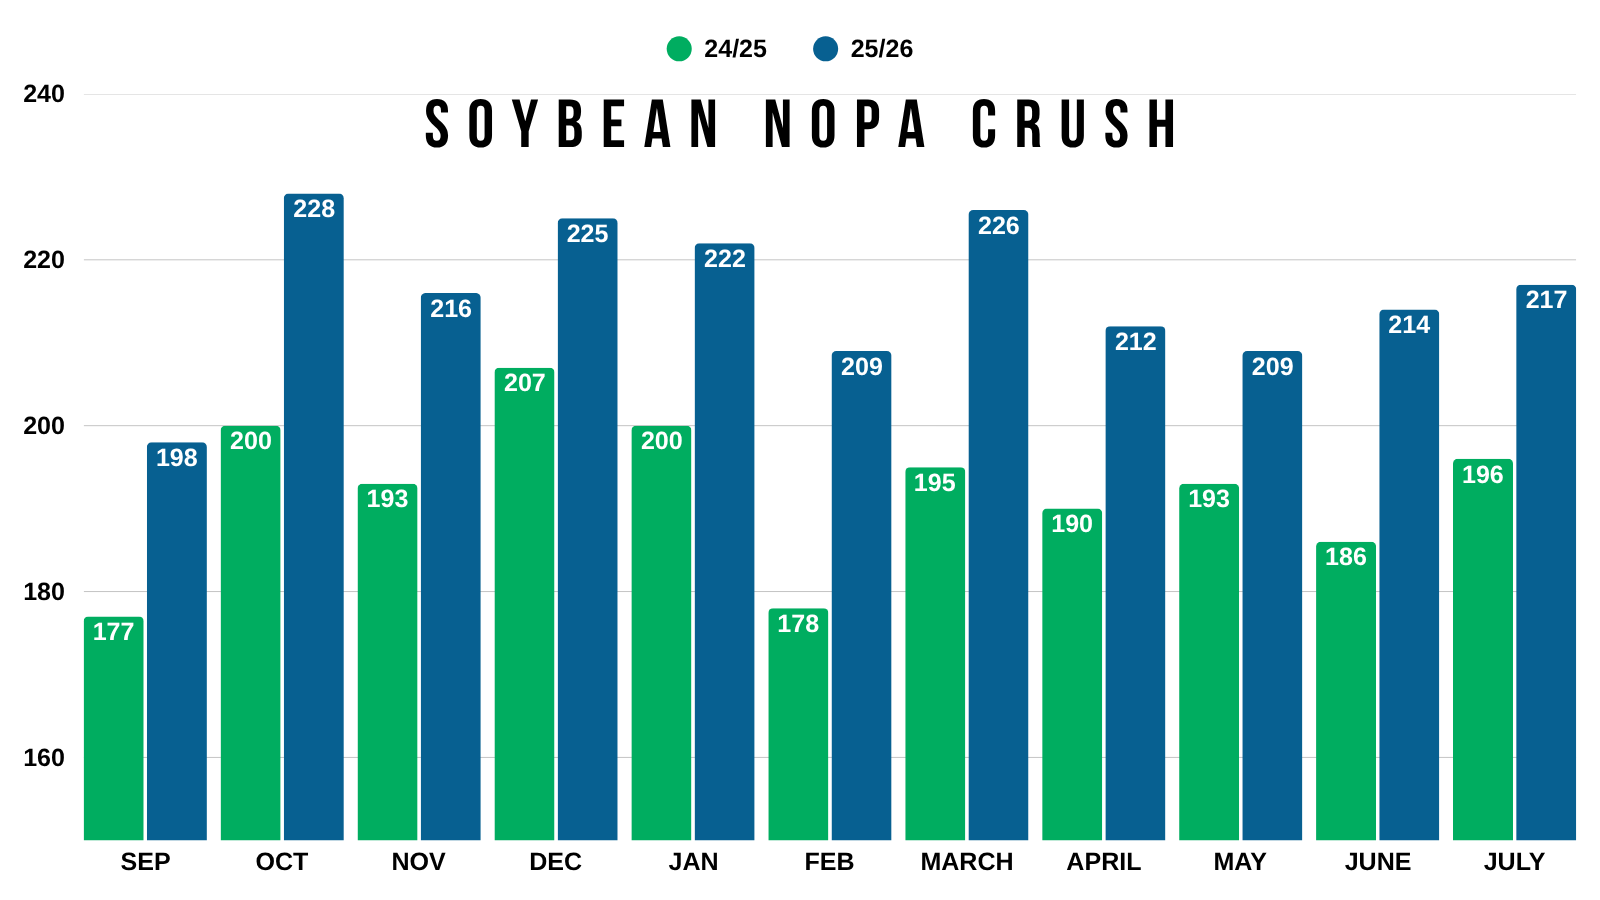
But I couldn’t call a record crush for the month all that disappointing.
Here is the monthly crush numbers vs last year.
There is nothing disappointing about this. We are shattering records when it comes to crush.
In that report, we also had soybean oil stocks come in lower than expected. Soybean oil stocks are actually the lowest they've ever been for July.
What does this mean?
It means that soybean oil demand is outpacing the supply. Which is friendly for soybean demand.
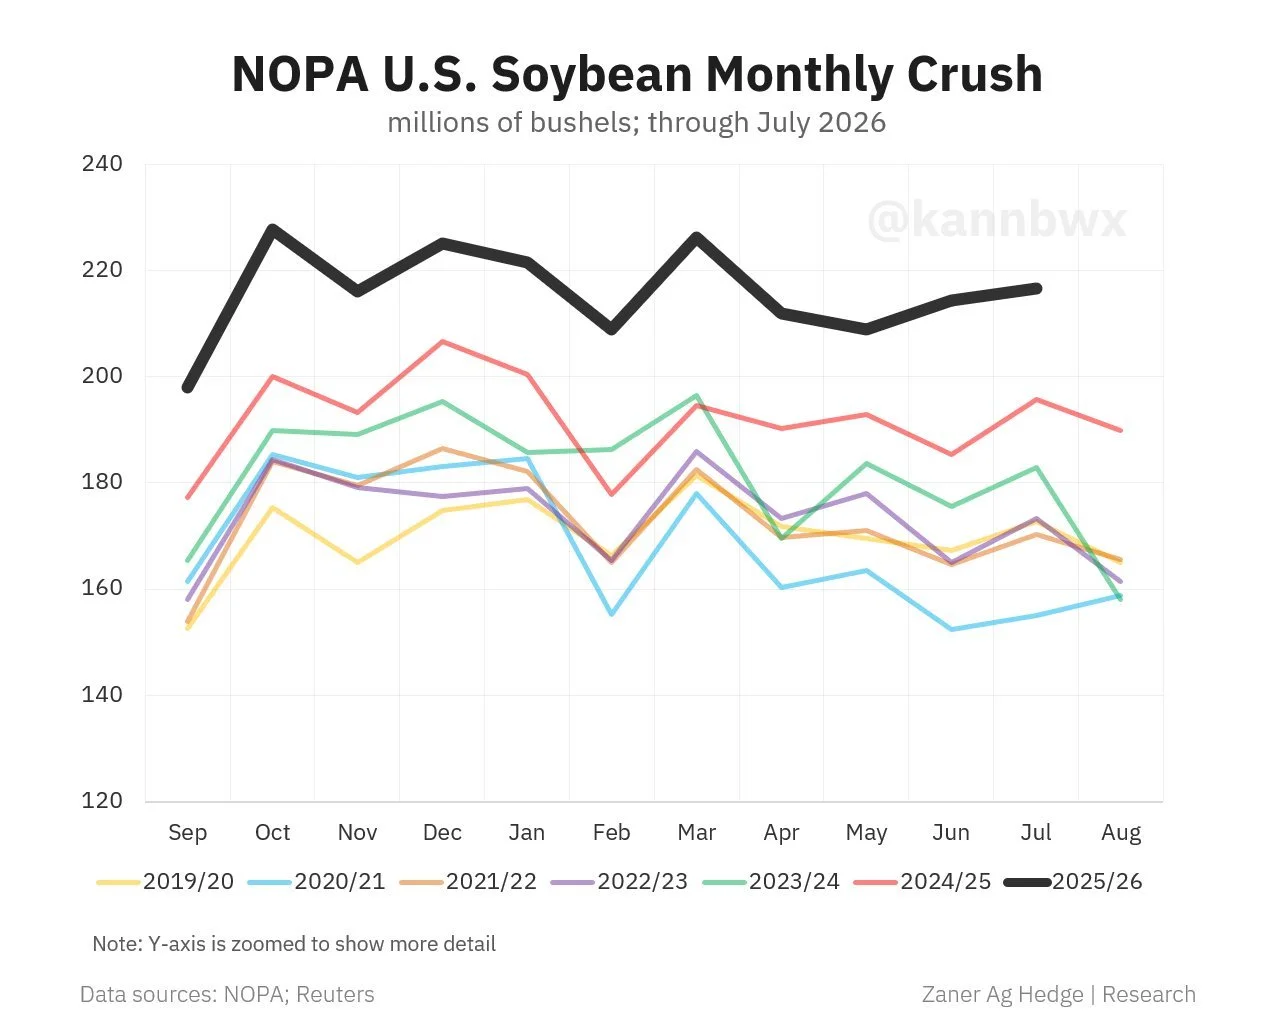
Here is a solid chart from Karen Braun (@kannbwx on X) that gives you a great visual on just how amazing our crush has been.
We absolutely shattered last year's record.
This year stands in a league of it's own.
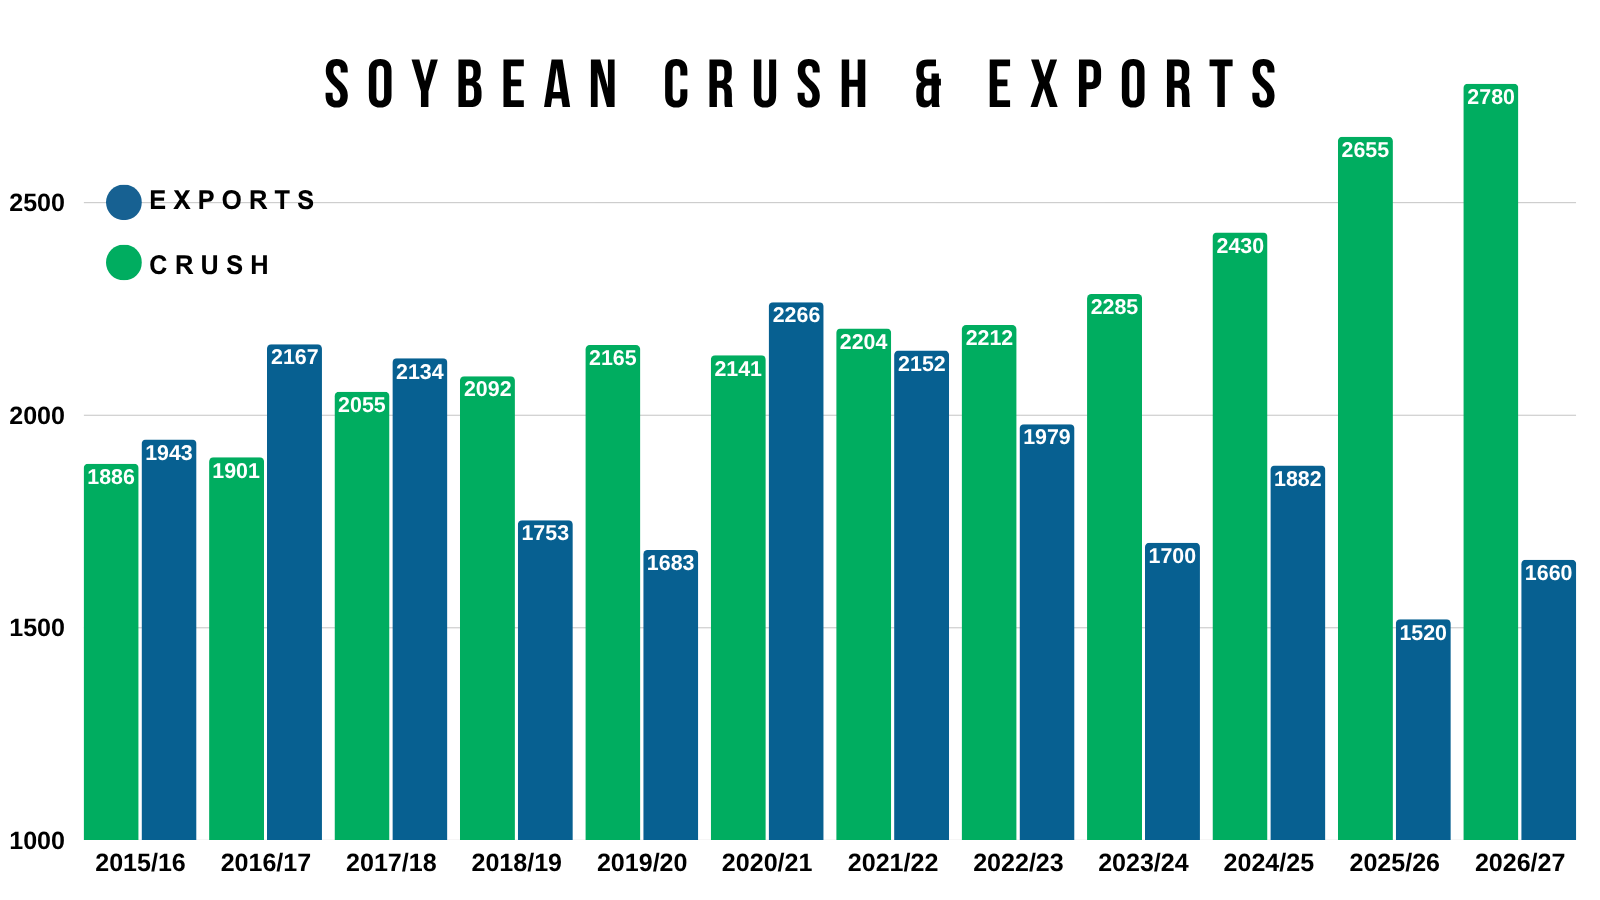
I still think that eventually, soybeans could become a demand led market long term.
China is buying.
Crush is phenomenal.
Look at the crush number. It's not going anywhere.
I've asked this question countless times, but what happens if exports improve from here?
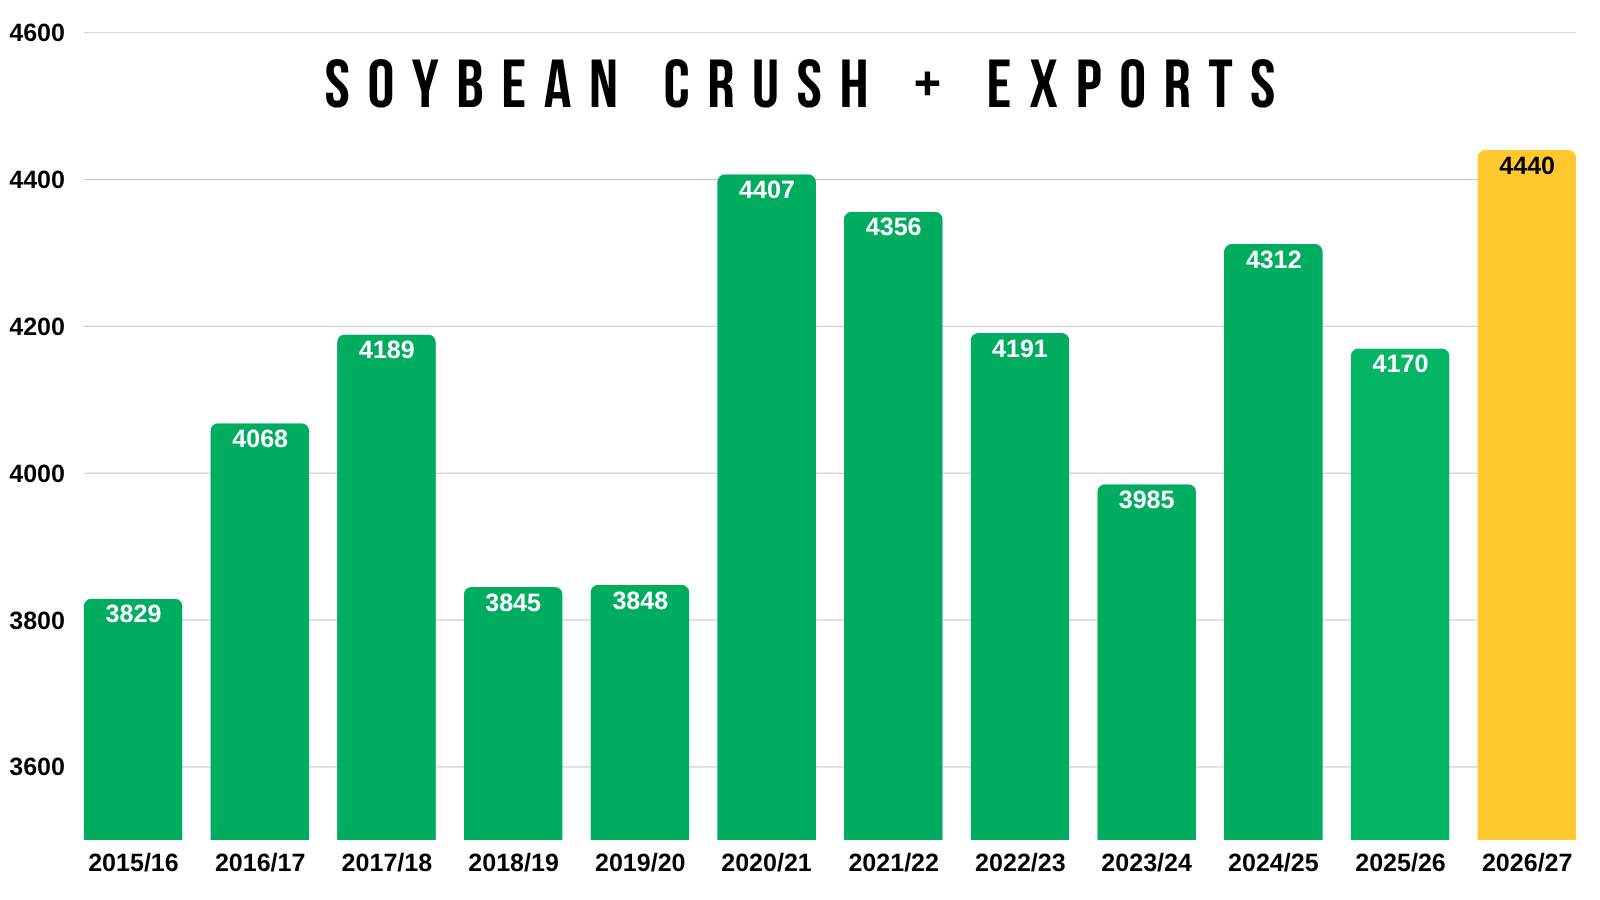
As we've talked about many times, when you combine our total crush plus our exports, domestic demand is actually the best it has ever been.
This is with relatively low exports in comparison to years prior.
Because crush demand is purely that strong.
Nov Beans Chart:
We bounced right where we needed to at that key support and buy zone we had been talking about heavily the last few weeks.
The 61.8% retracement down to the June lows. That same level was the highs from March.
Which was one of several reasons why we saw this as a potential level for a bottom.
So it was a perfect rally right where we wanted to see us bounce.
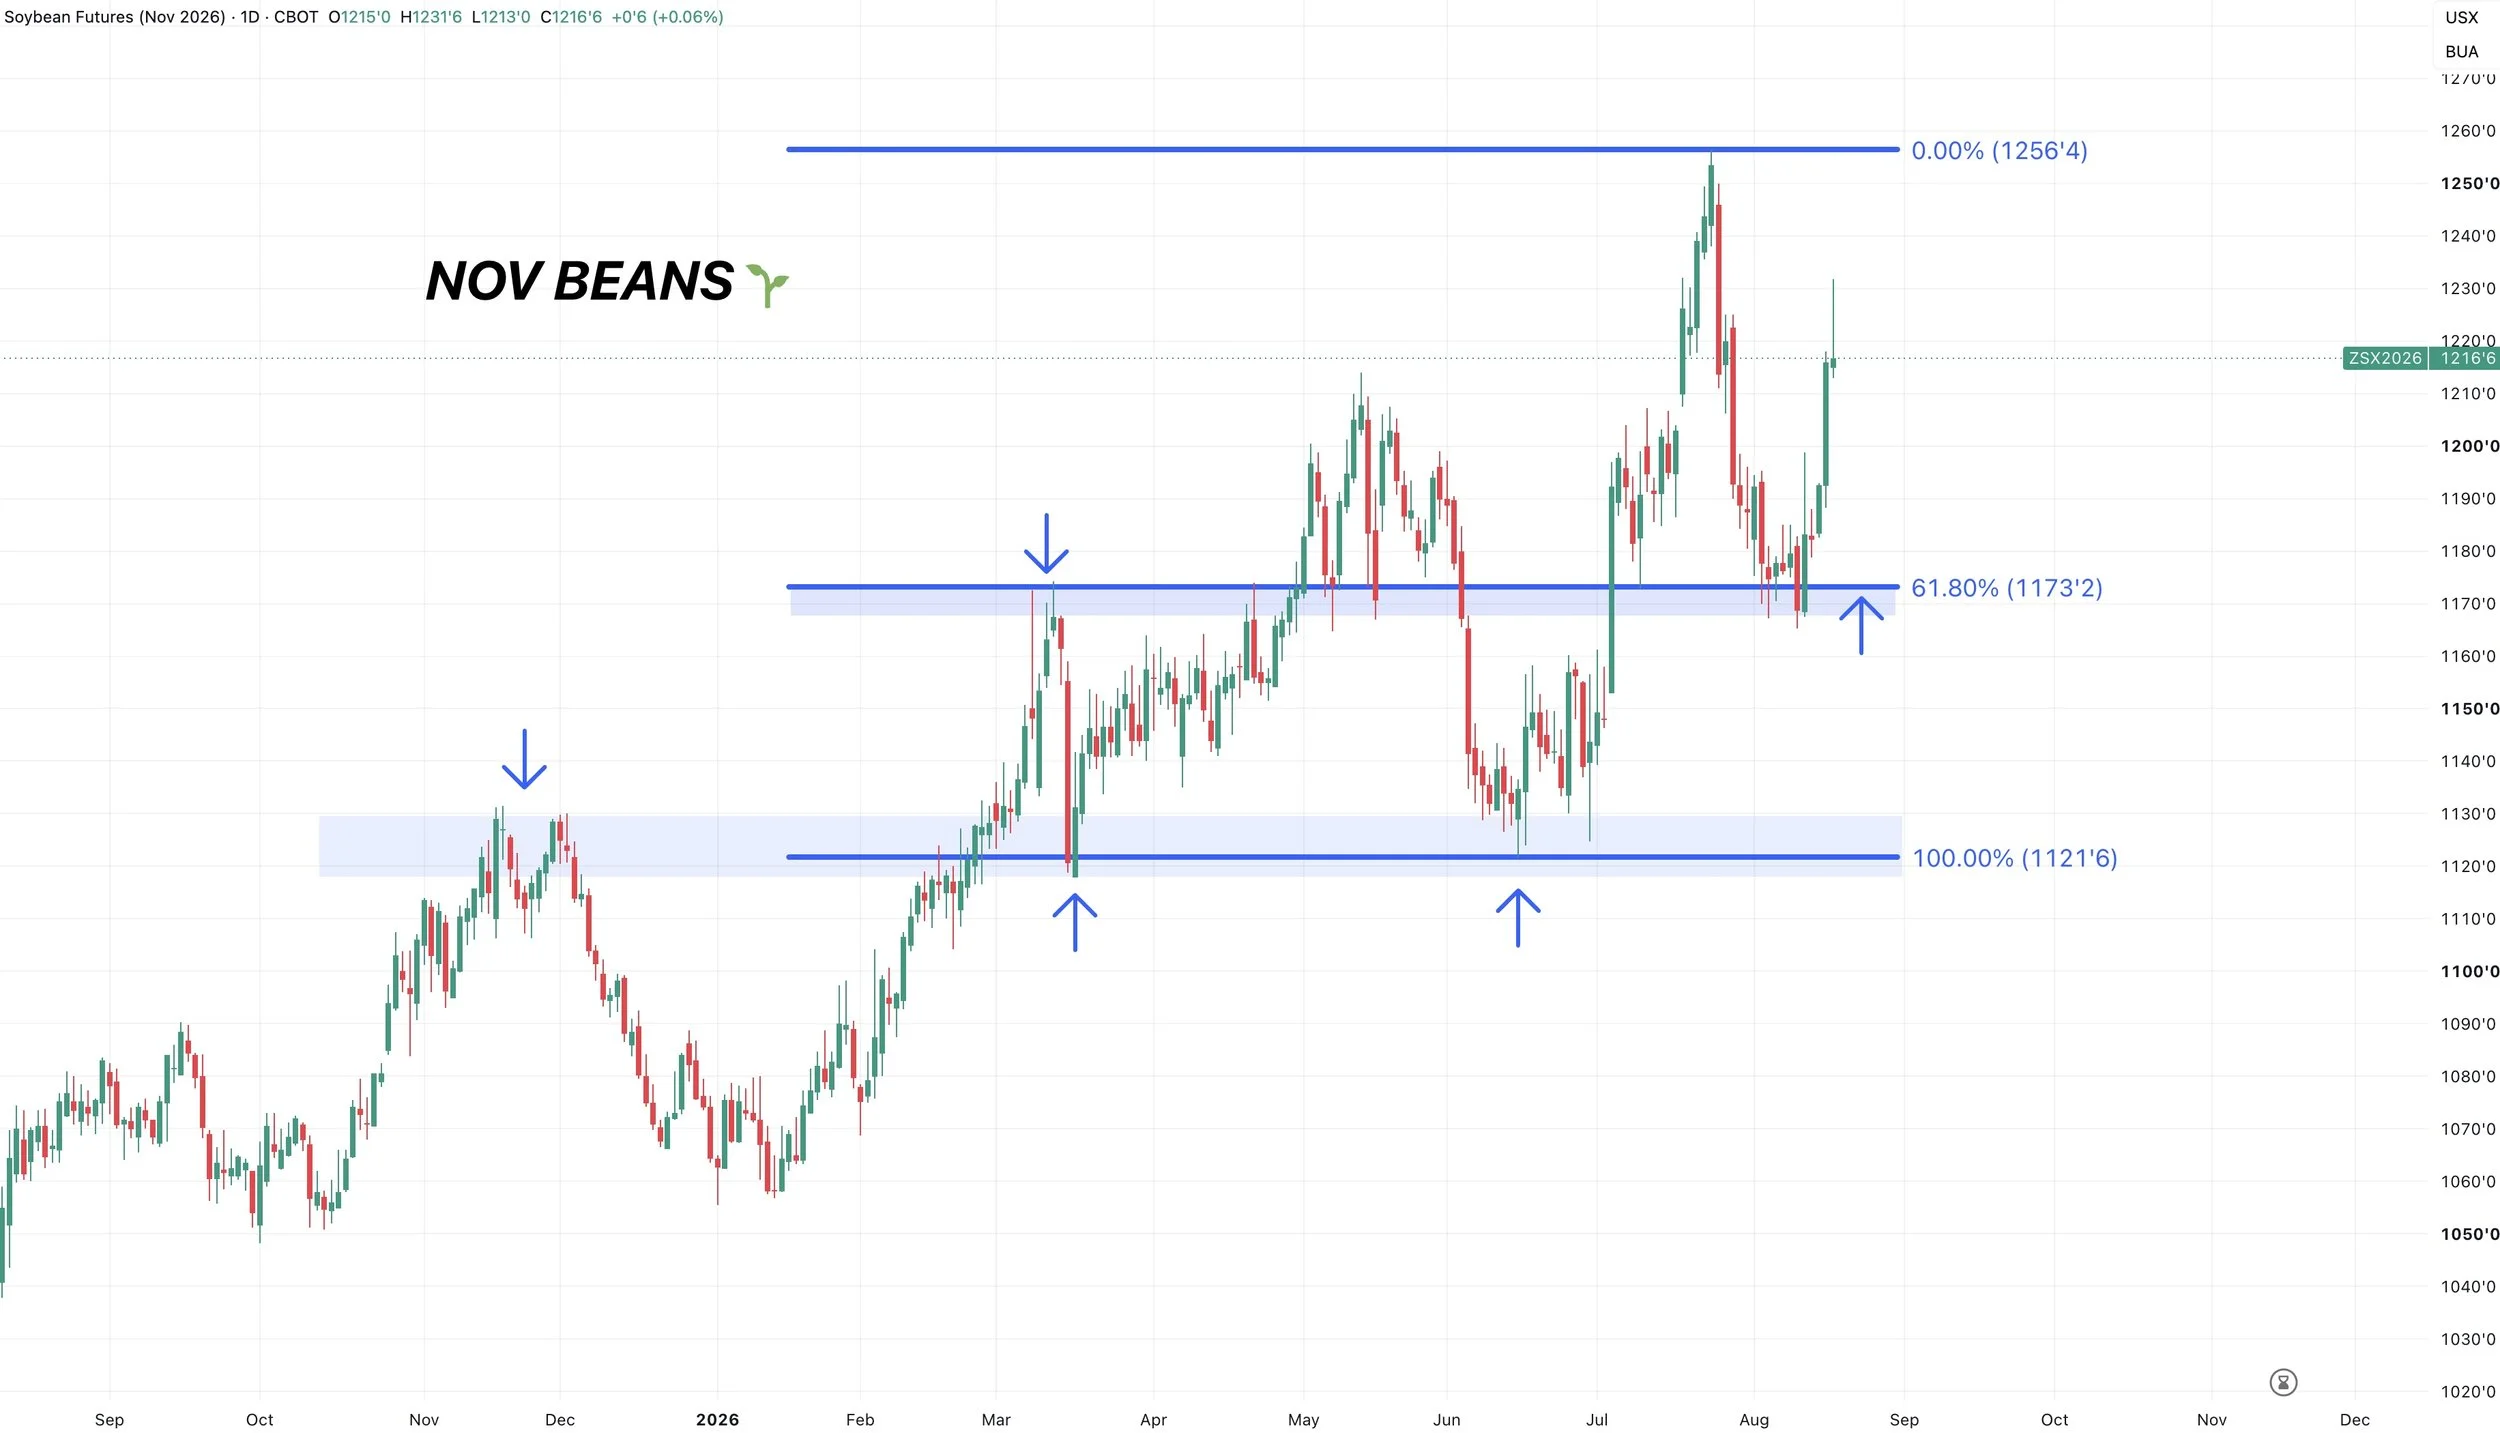
However, we are now running into some short term resistance potentially.
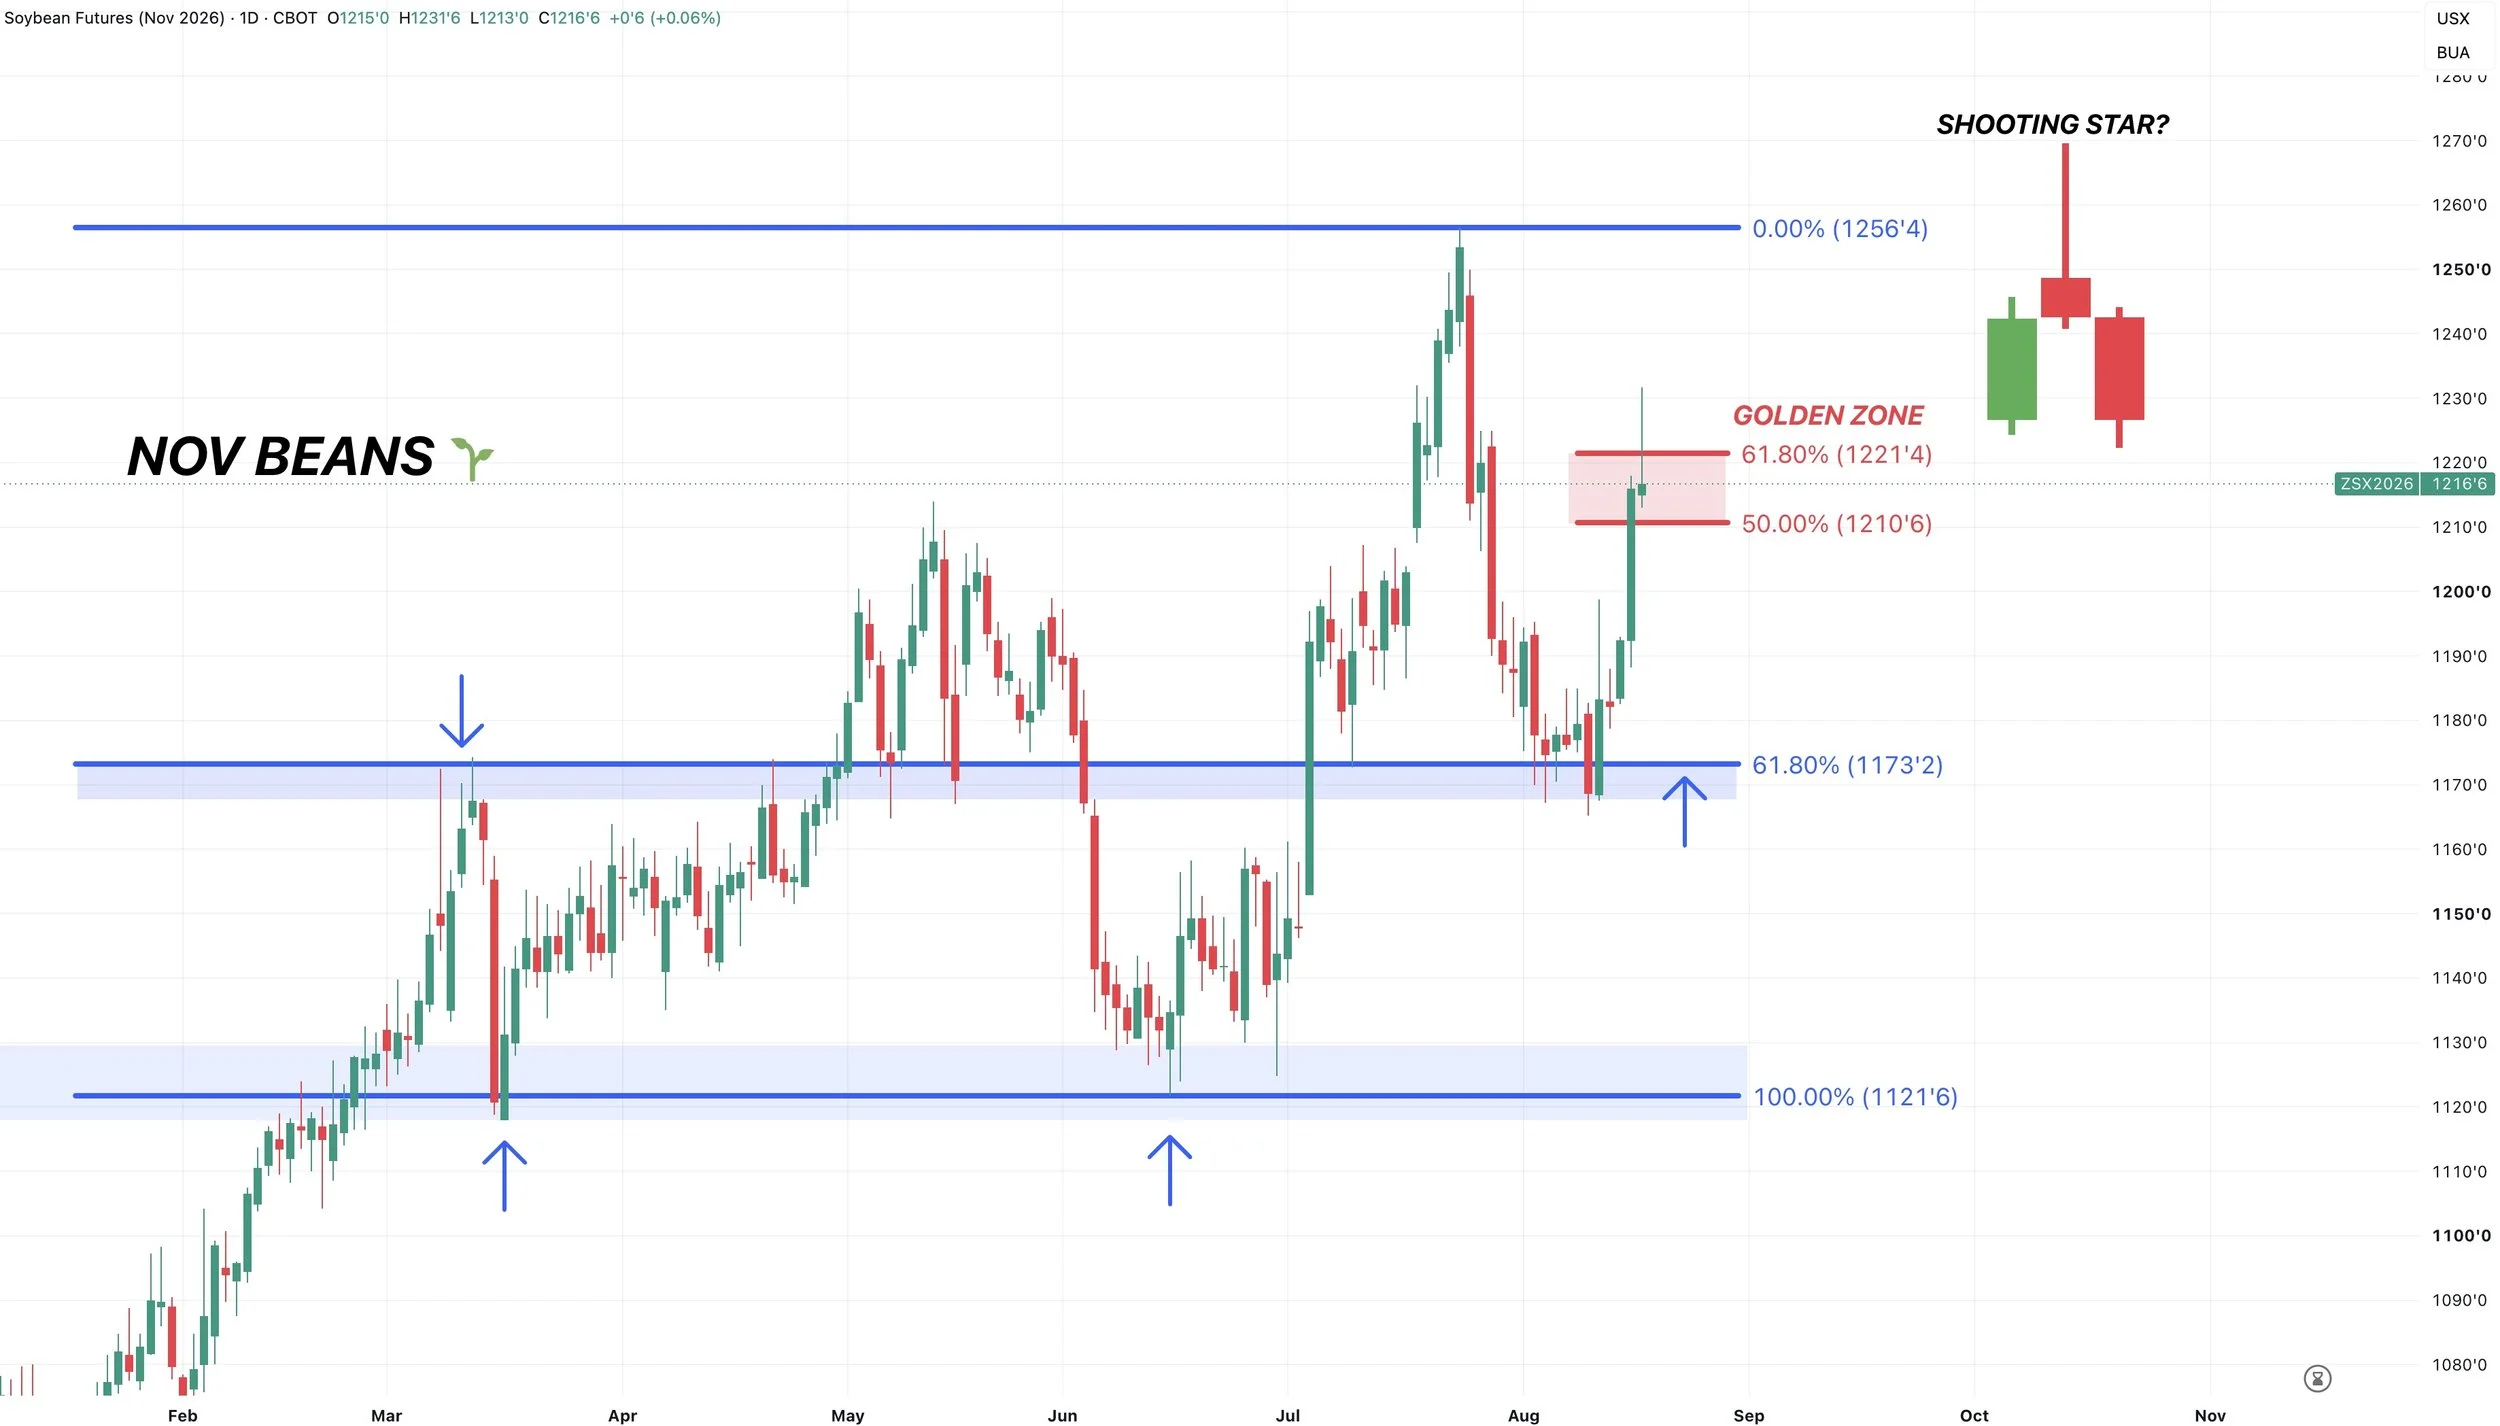
We clawed back 61.8% of the entire sell off, and failed to close above that level. Which is a very common level for a rally to stall.
That's the level we need to close above to run towards the highs.
At the same time we left a pretty ugly candle today.
We were up +16 cents early on but nearly closed unchanged. Leaving a shooting star candle, which can often lead to a pullback.
So it would not be surprising to see us take a breather here.
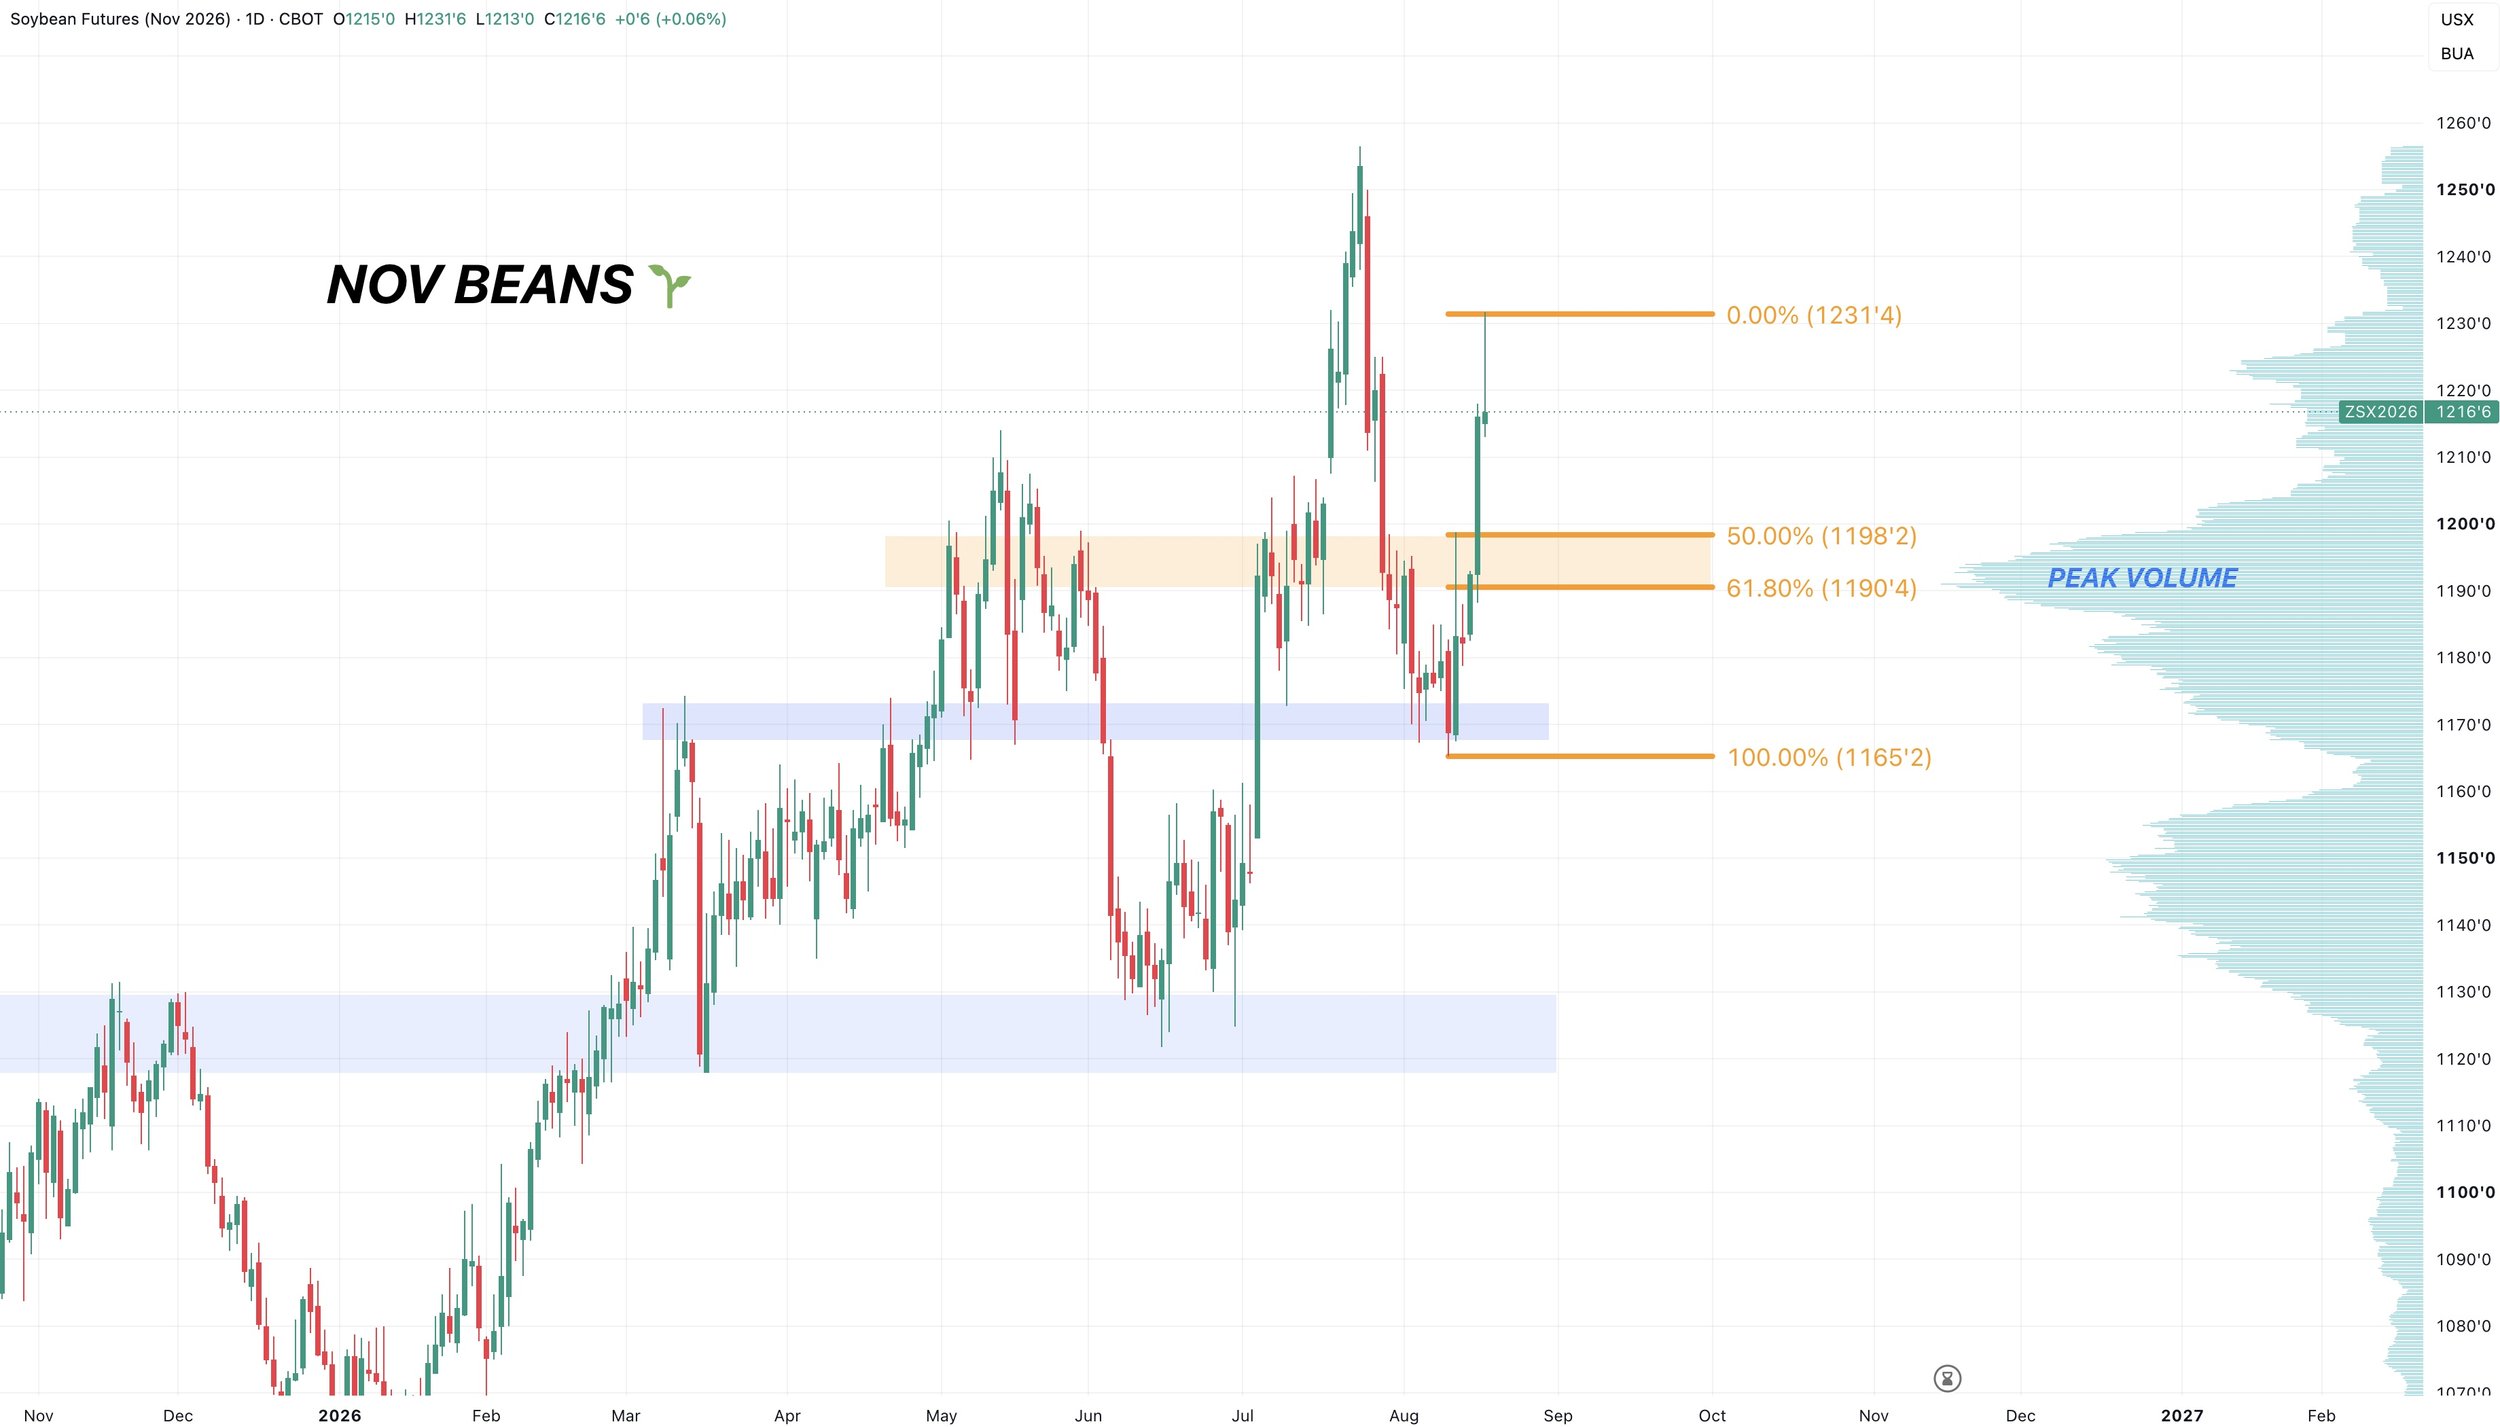
If we pull back, where could could we expect a bounce?
I am eyeing the $11.90 to $12.00 level.
That gives back 50% to 61.8% of the recent rally.
That same level is peak volume
Wheat
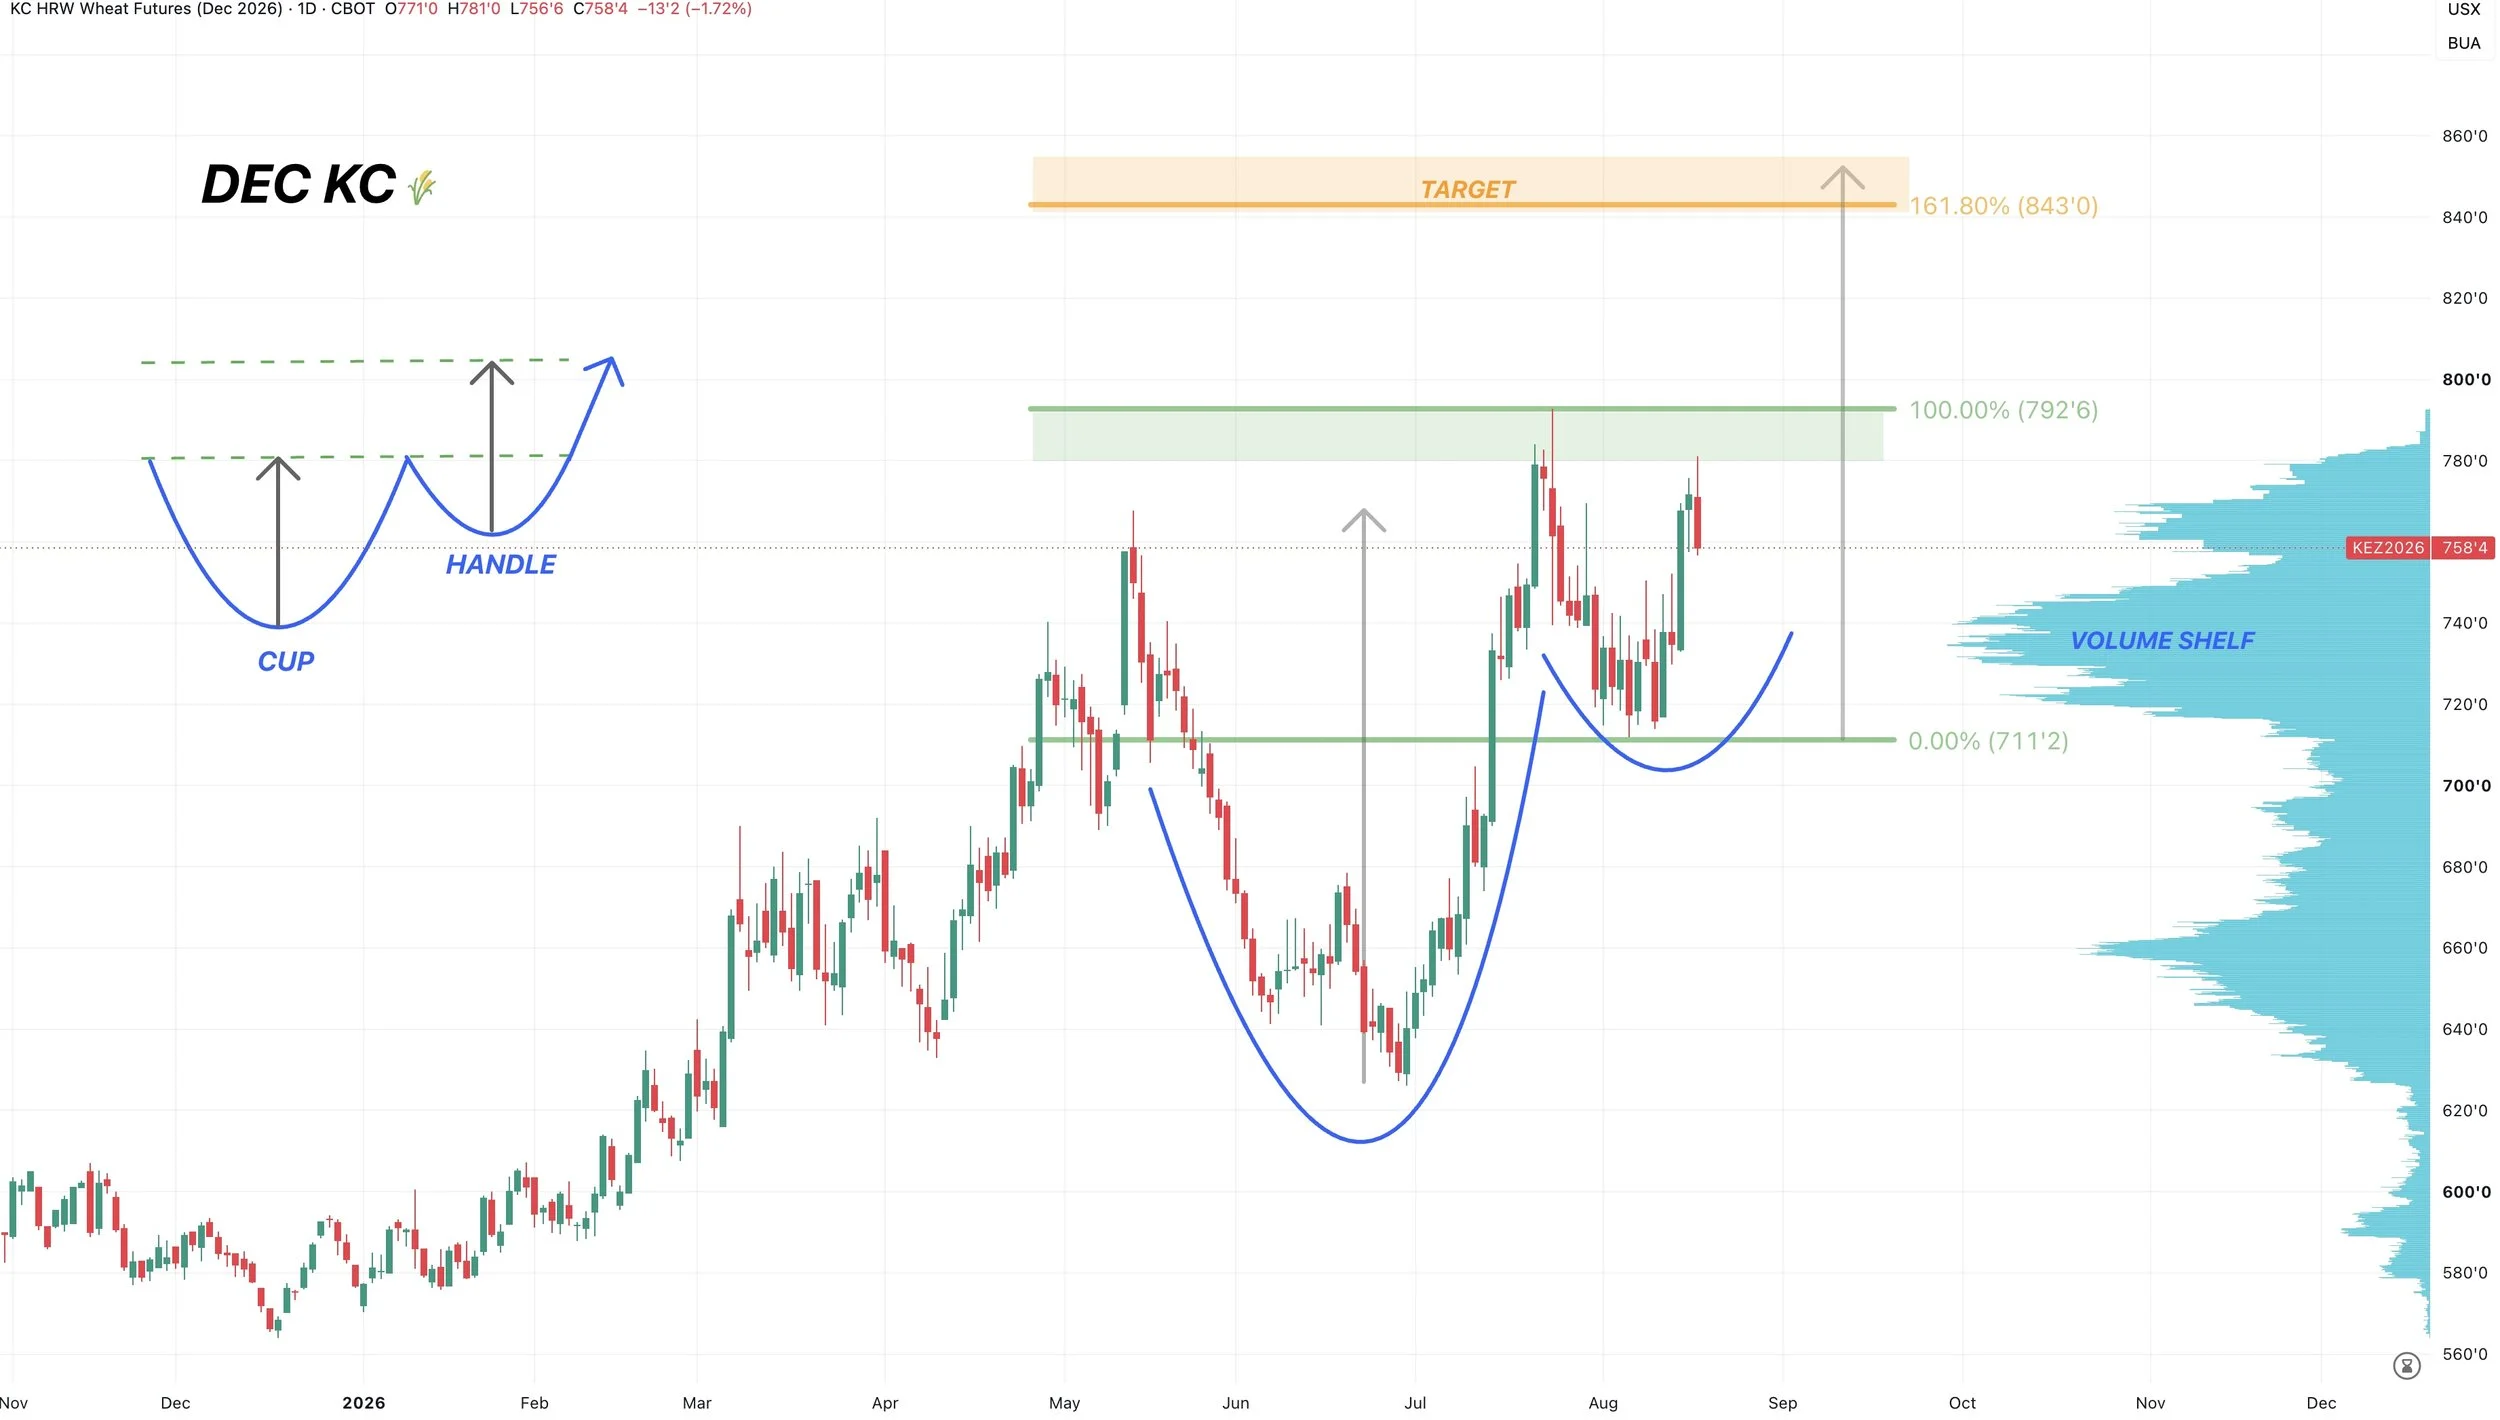
Dec KC Wheat Chart:
We are rejecting those highs from July.
Where would a bottom make sense?
Like in corn and beans, the most common area for a typical bounce to form is going to be that 50% to 61.8% level.
In this case, that same level is also peak volume.
Areas of high volume can act as magnets.
So if we get down there, that's where I'd look for a bounce.
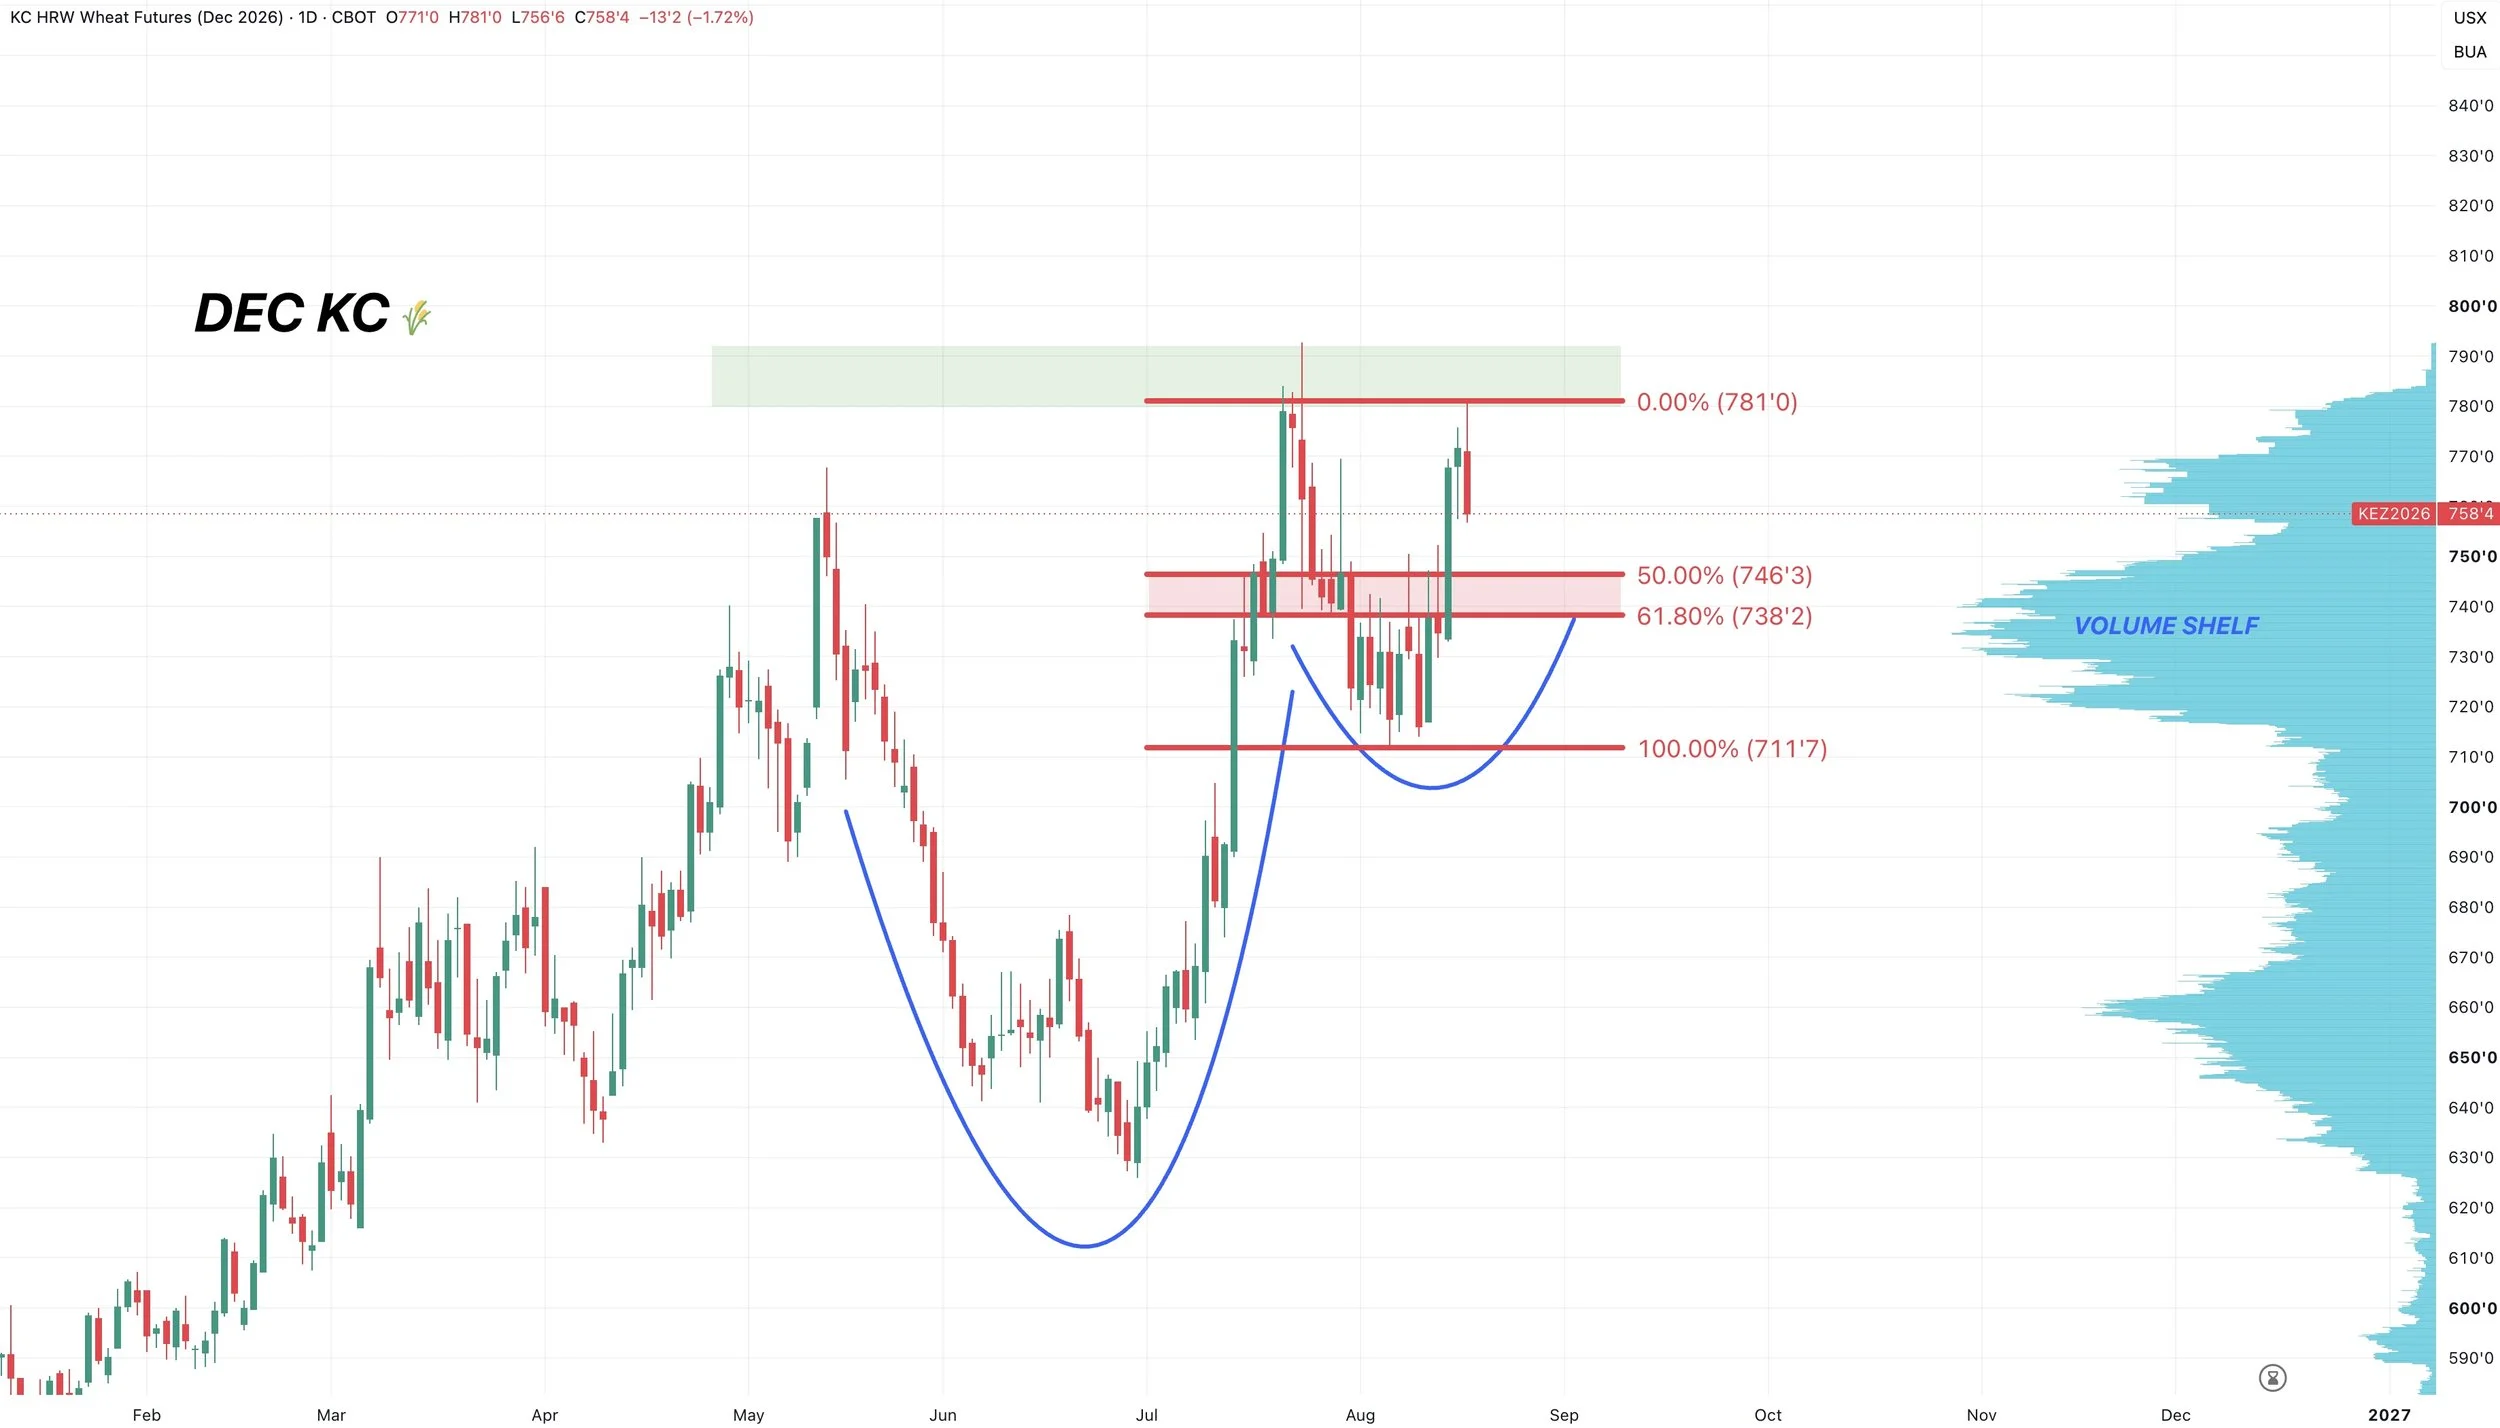
Overall, if we end up taking out those highs from July we do still have this cup and handle pattern in place.
These highs would be the first target and resistance.
If we take out those July highs, I still have a target of $8.40 to $8.50.
Dec Chicago Chart:
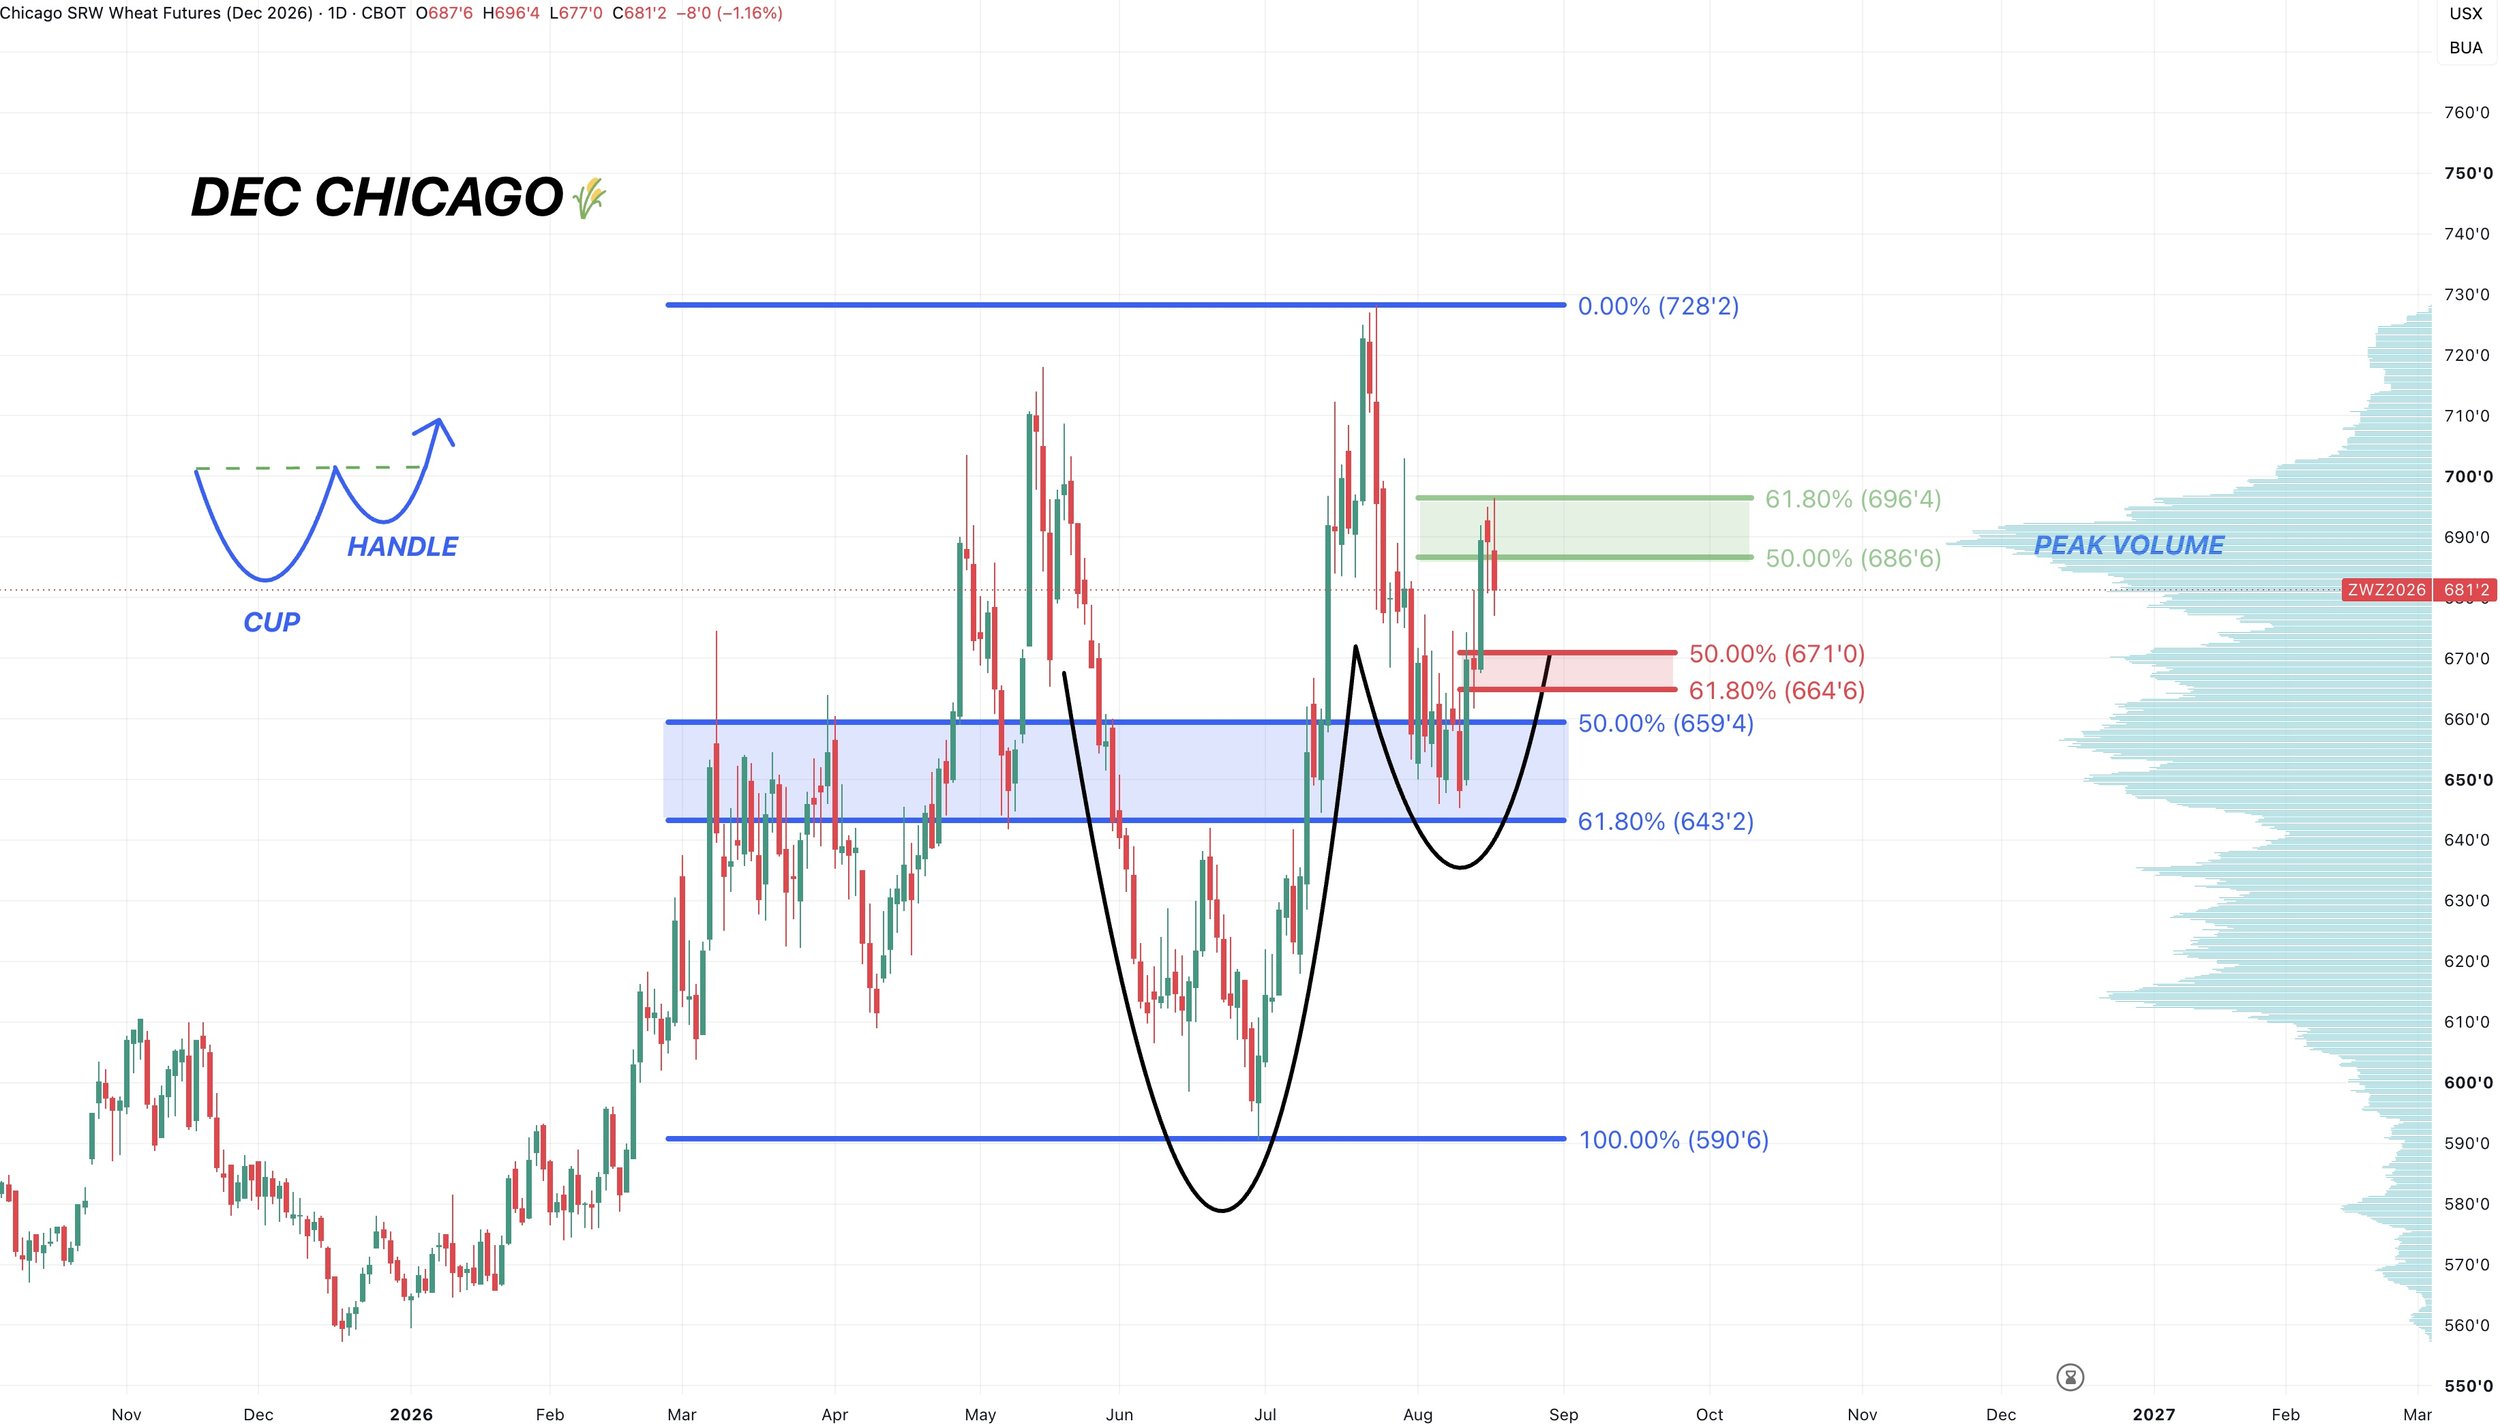
Just like we talked about yesterday, Chicago is rejecting right in the golden zone. Which is a very common area to stall.
That same level was peak volume.
Now want to hold the golden zone to the downside if it comes.
Cattle
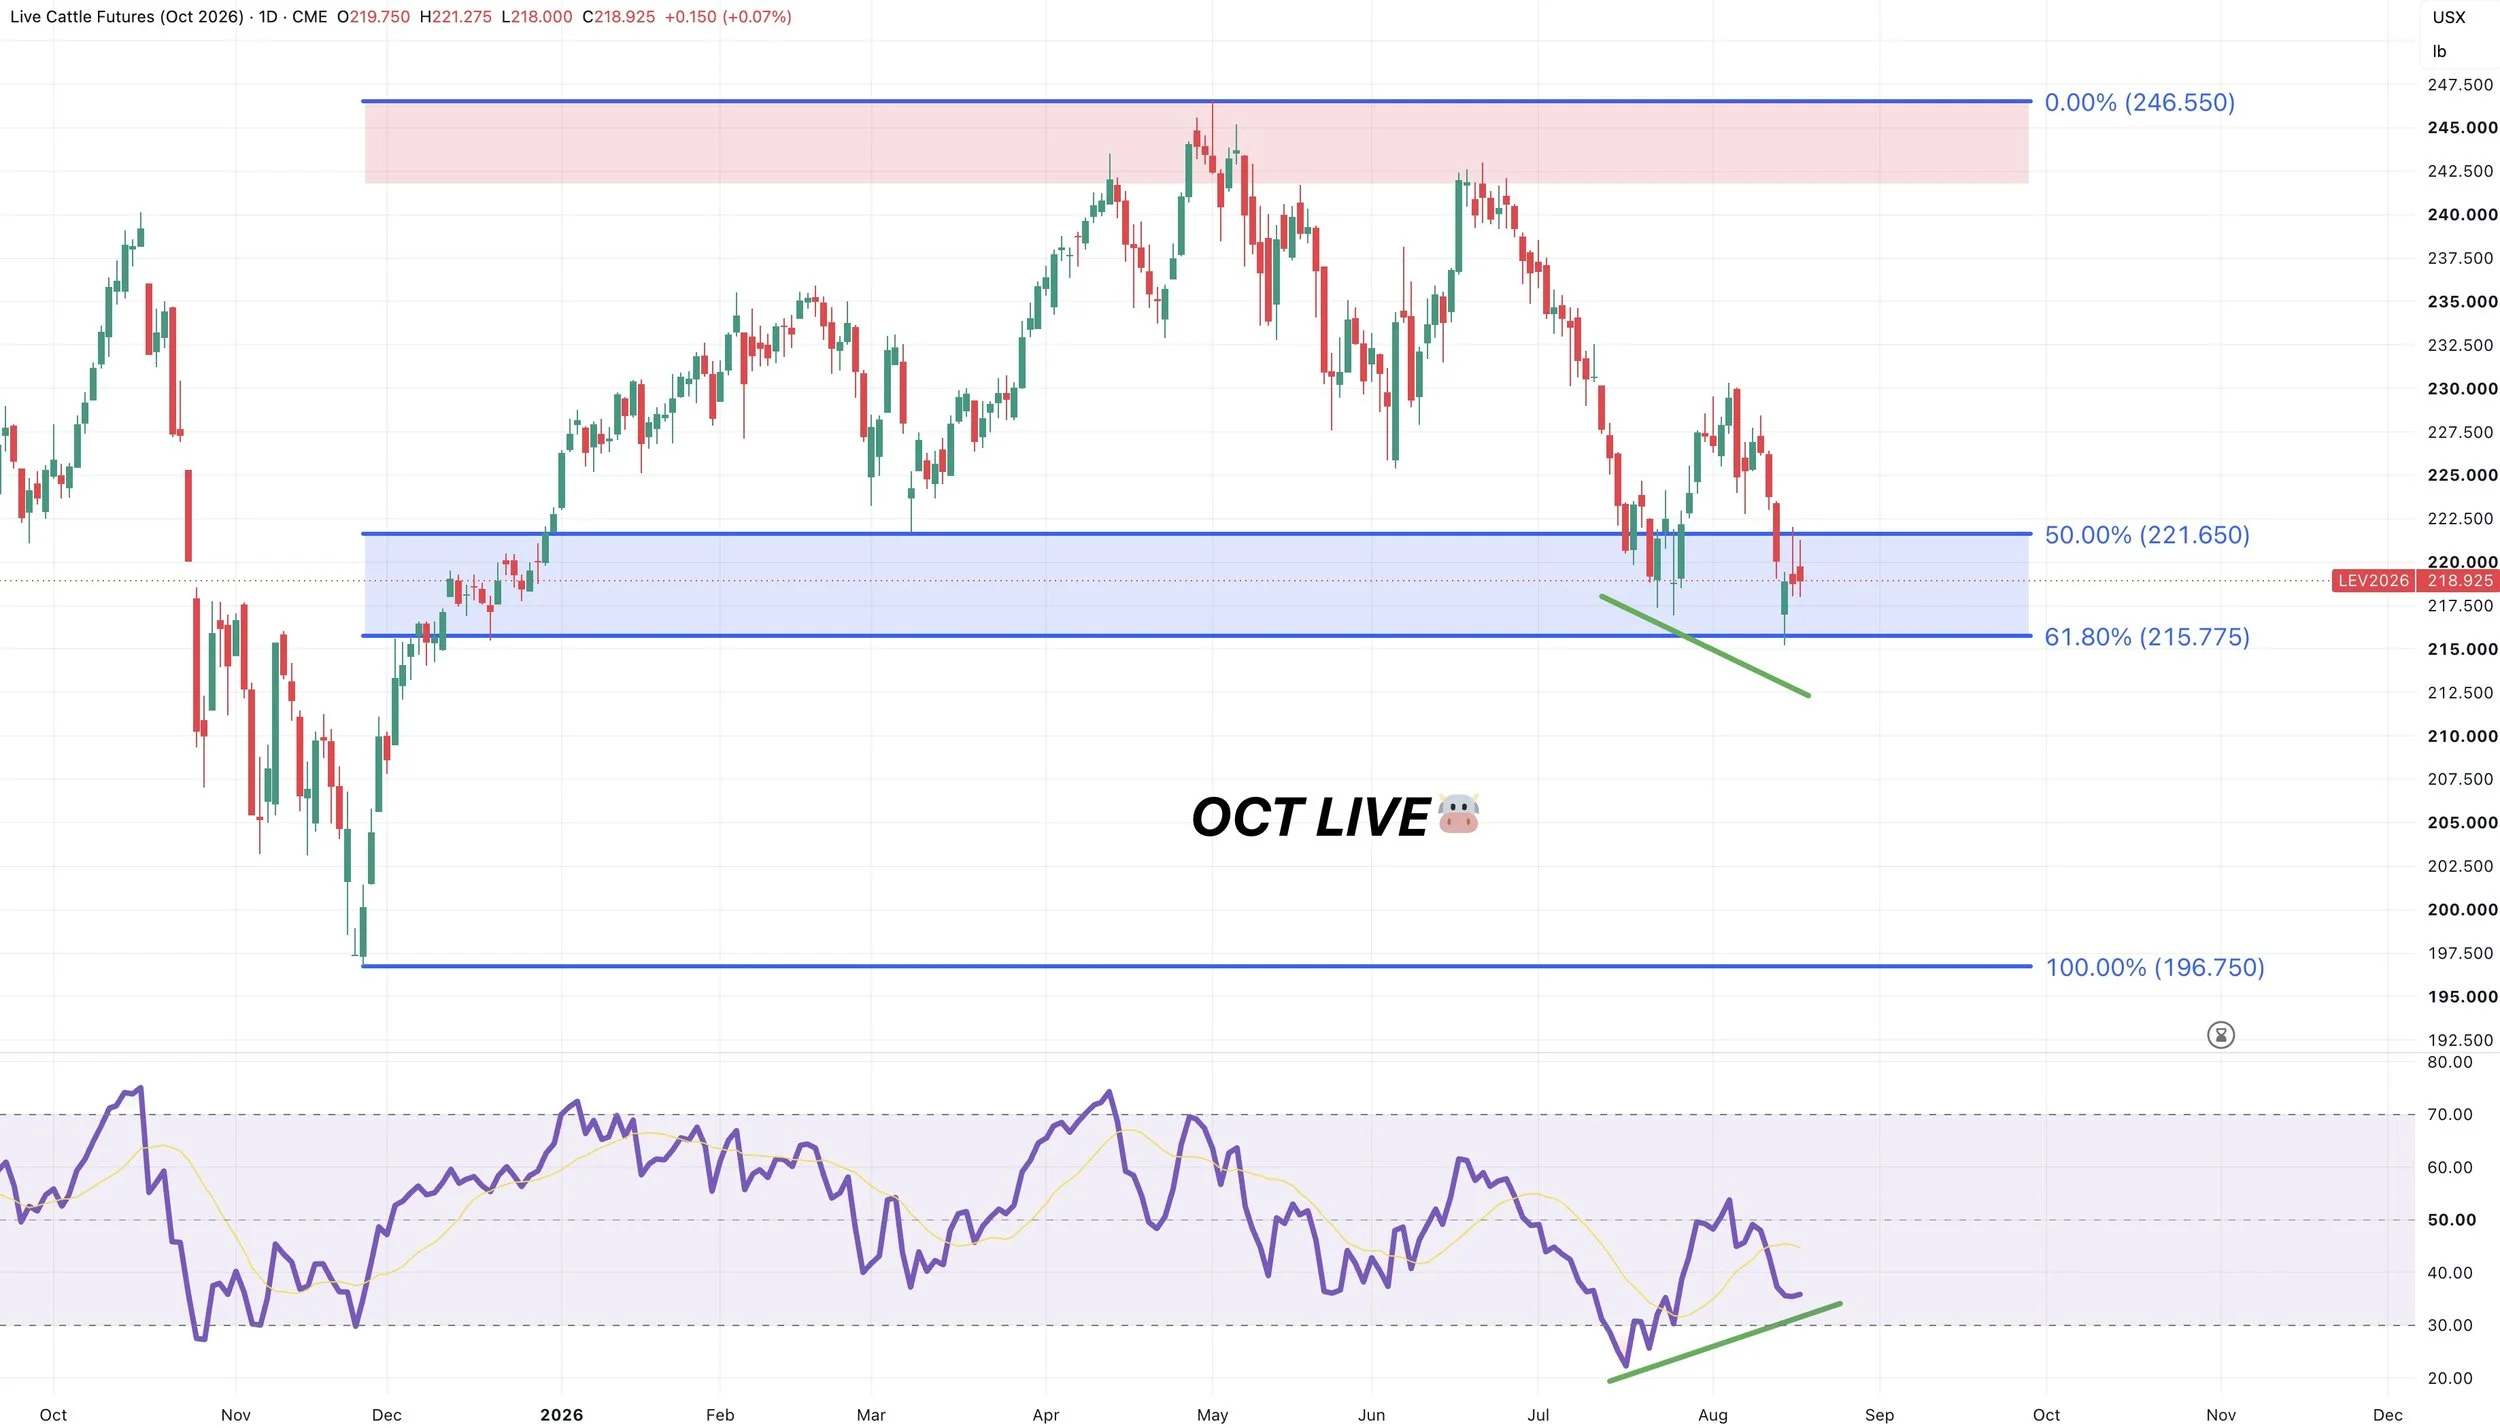
Oct Live Chart:
So far perfectly bouncing at the 61.8% retracement down to the November lows.
That is still the must hold level. Lose that level and it opens up further downside.
We are showing some bullish divergence on the RSI.
Prices made new lows. The RSI did not. So we could be due for a bounce at this key level.
If we are going to bounce, we want it to be here.
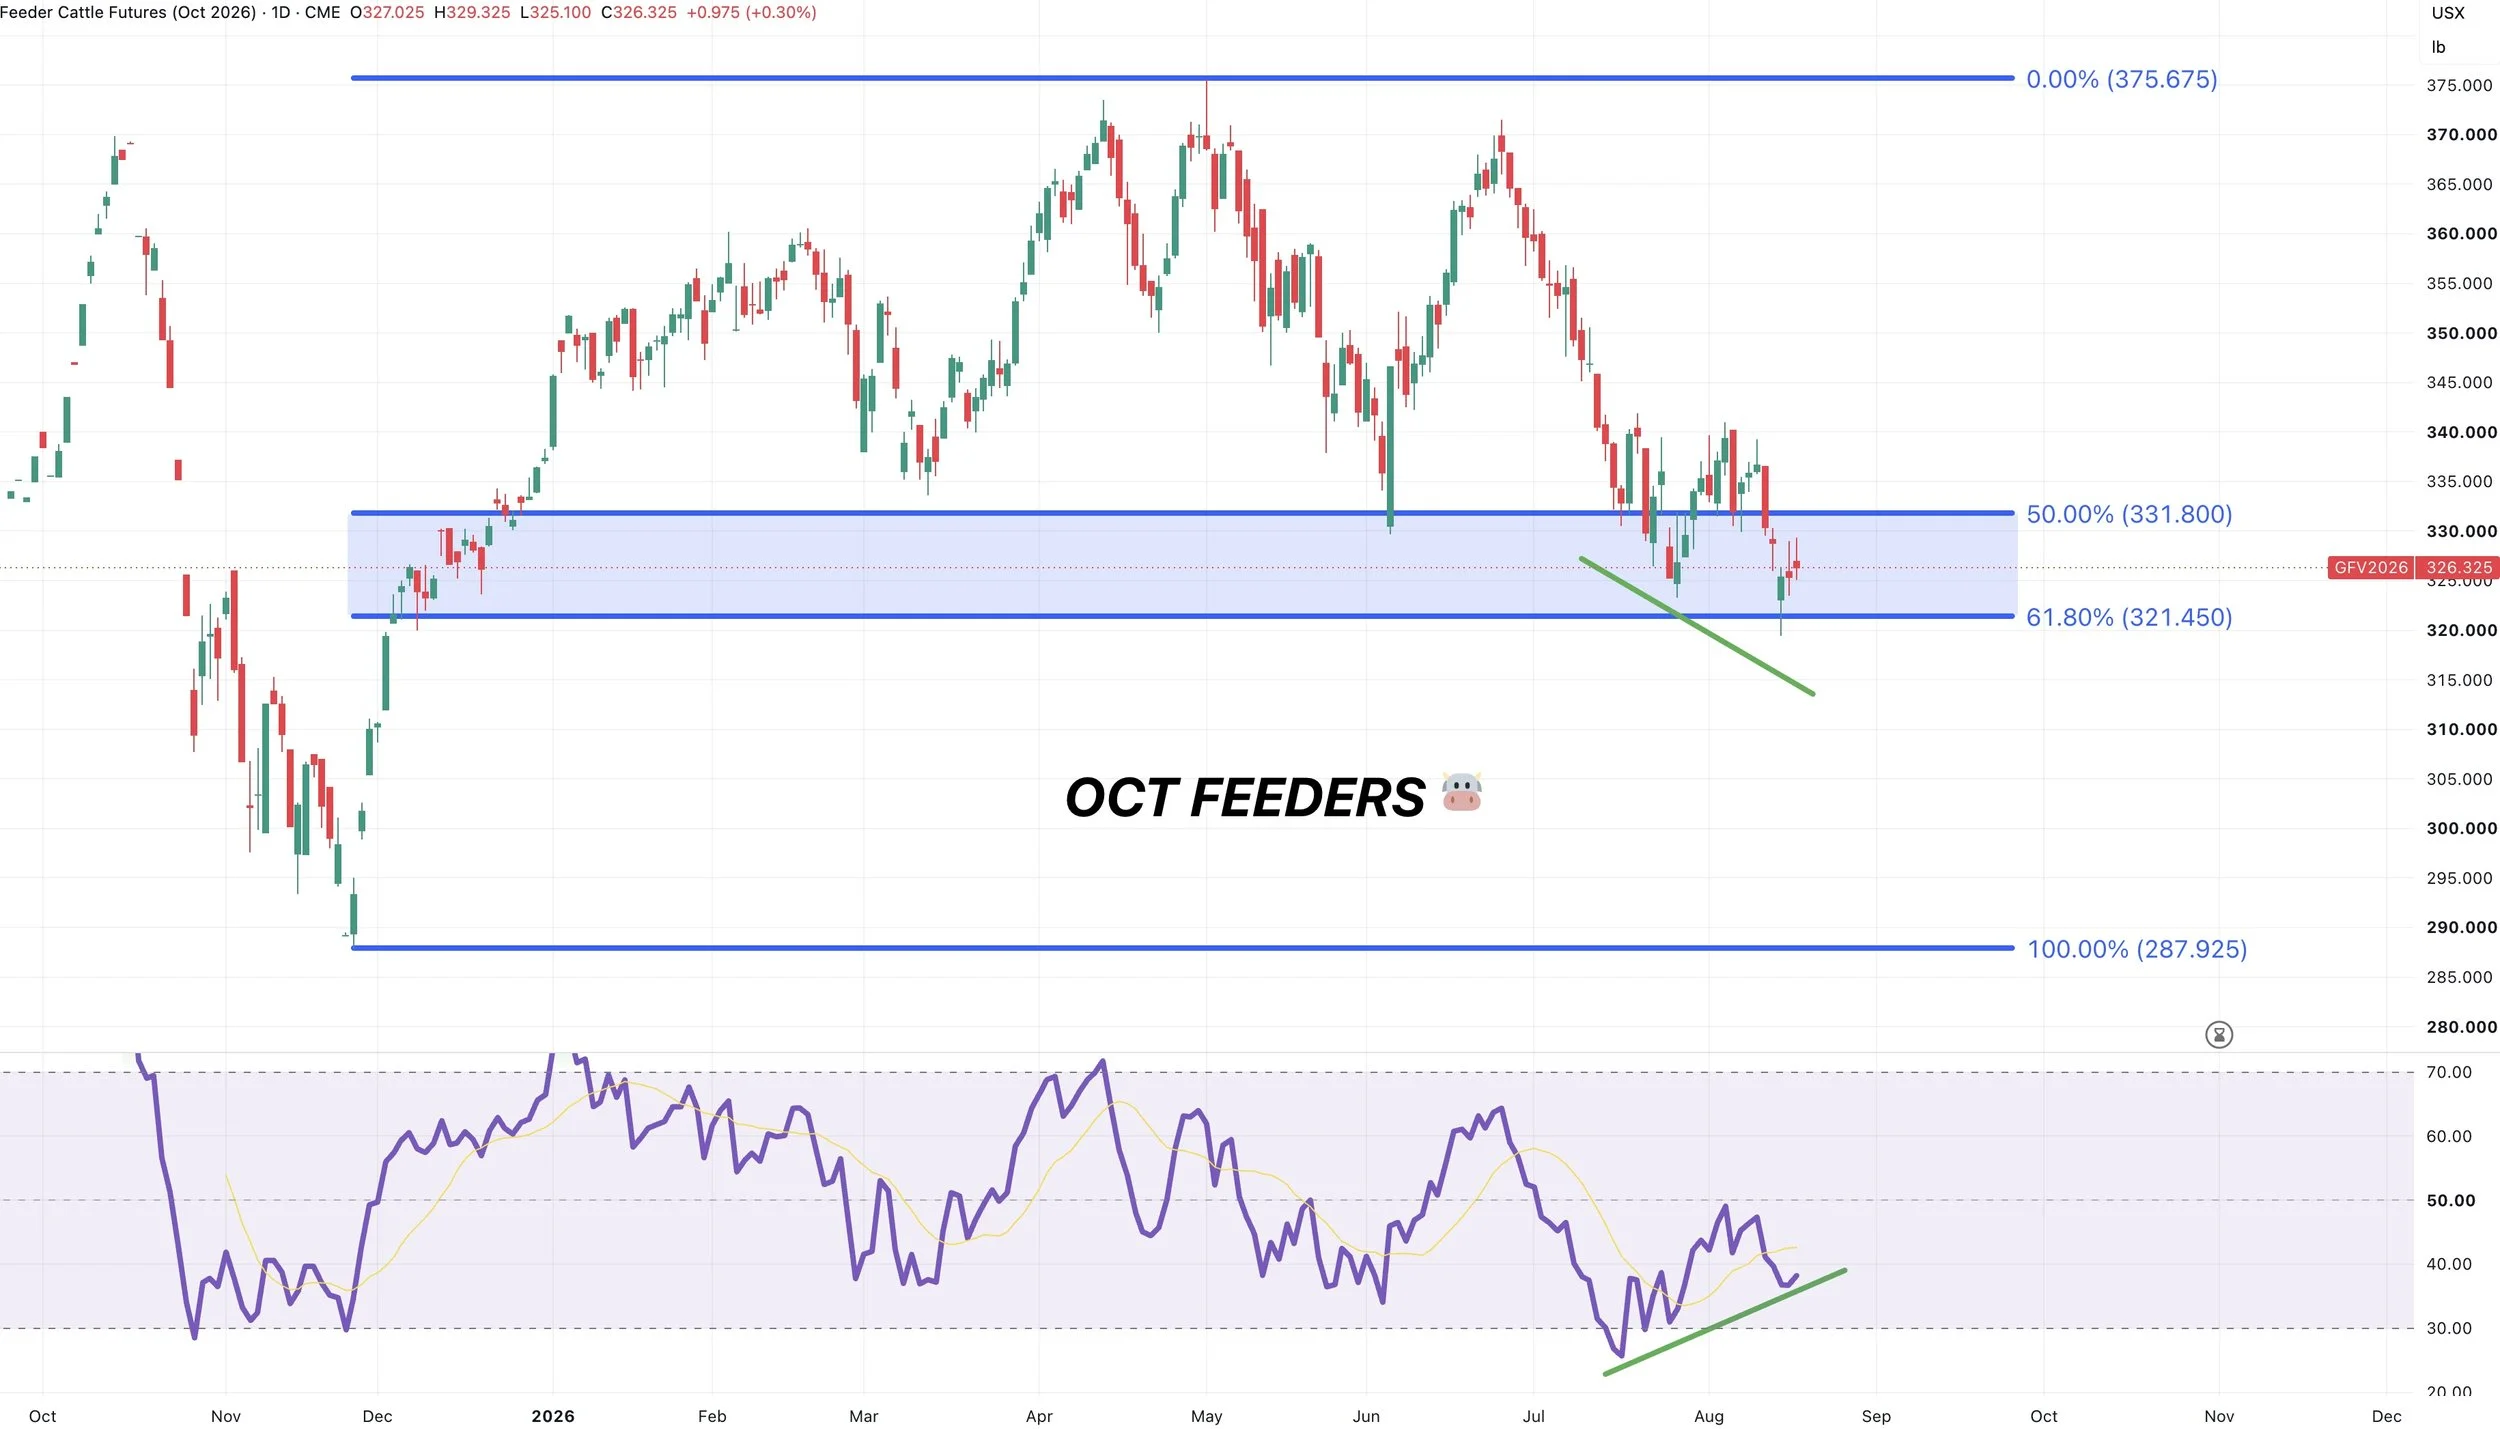
Oct Feeders Chart:
We bounced right off the 61.8% retracement from the May highs down to the November lows from last year.
That is going to be the must hold level. Lose that level and it opens up further downside.
We are also showing bullish divergence in feeders.
So that would be a reason to think we could bounce off this key level.
Want to Talk?
Our phones are open 24/7 for you guys if you ever need anything or want to discuss your operation.
Jeremey & Office: (806)484-1214
Sebastian: (605)280-1186
Email: sfrost@dailymarketminute.com
Hedge Account
Interested in a hedge account? Use the link below to set up an account or give us a call.