
WEIGHING GRAINS UPSIDE VS DOWNSIDE POTENTIAL
AUDIO COMMENTARY & CHART VIDEO
Good moves in row crops today
SoDak tour results less than last year
Tour today is in areas that aren’t as good
Crop conditions dropped in corn & beans
Export demand remains great
Bean oil stocks below expected
US soybeans are cheaper than Brazil soybeans for the first time in a long time
How to utilize options in marketing
Get puts when we are higher not lower
More upside potential vs downside?
Fundamentals are shifting friendlier
Corn situation far different than last year
Soybean China situation is very interesting
Big potential is there for the first time in a while
Should you make sales or not?
Balance upside vs downside with probabilities
A lot of talk about flooding
If you are undersold do what you should do
Don’t do everything in one day
I am staying away from sales for next years crop until I have inputs locked in or if we get to levels that have more downside risk than opportunity
Video chart update below audio*
Listen to today’s audio below
Want to talk?
Office: (806)484-1214
QUICK CHART VIDEO
Here is a quick 5min video where I run through the corn, soybeans, and wheat charts.
If you would rather read, I put together a written version below the video as well.
WRITTEN VERSION:
Nov Soybeans 🌱
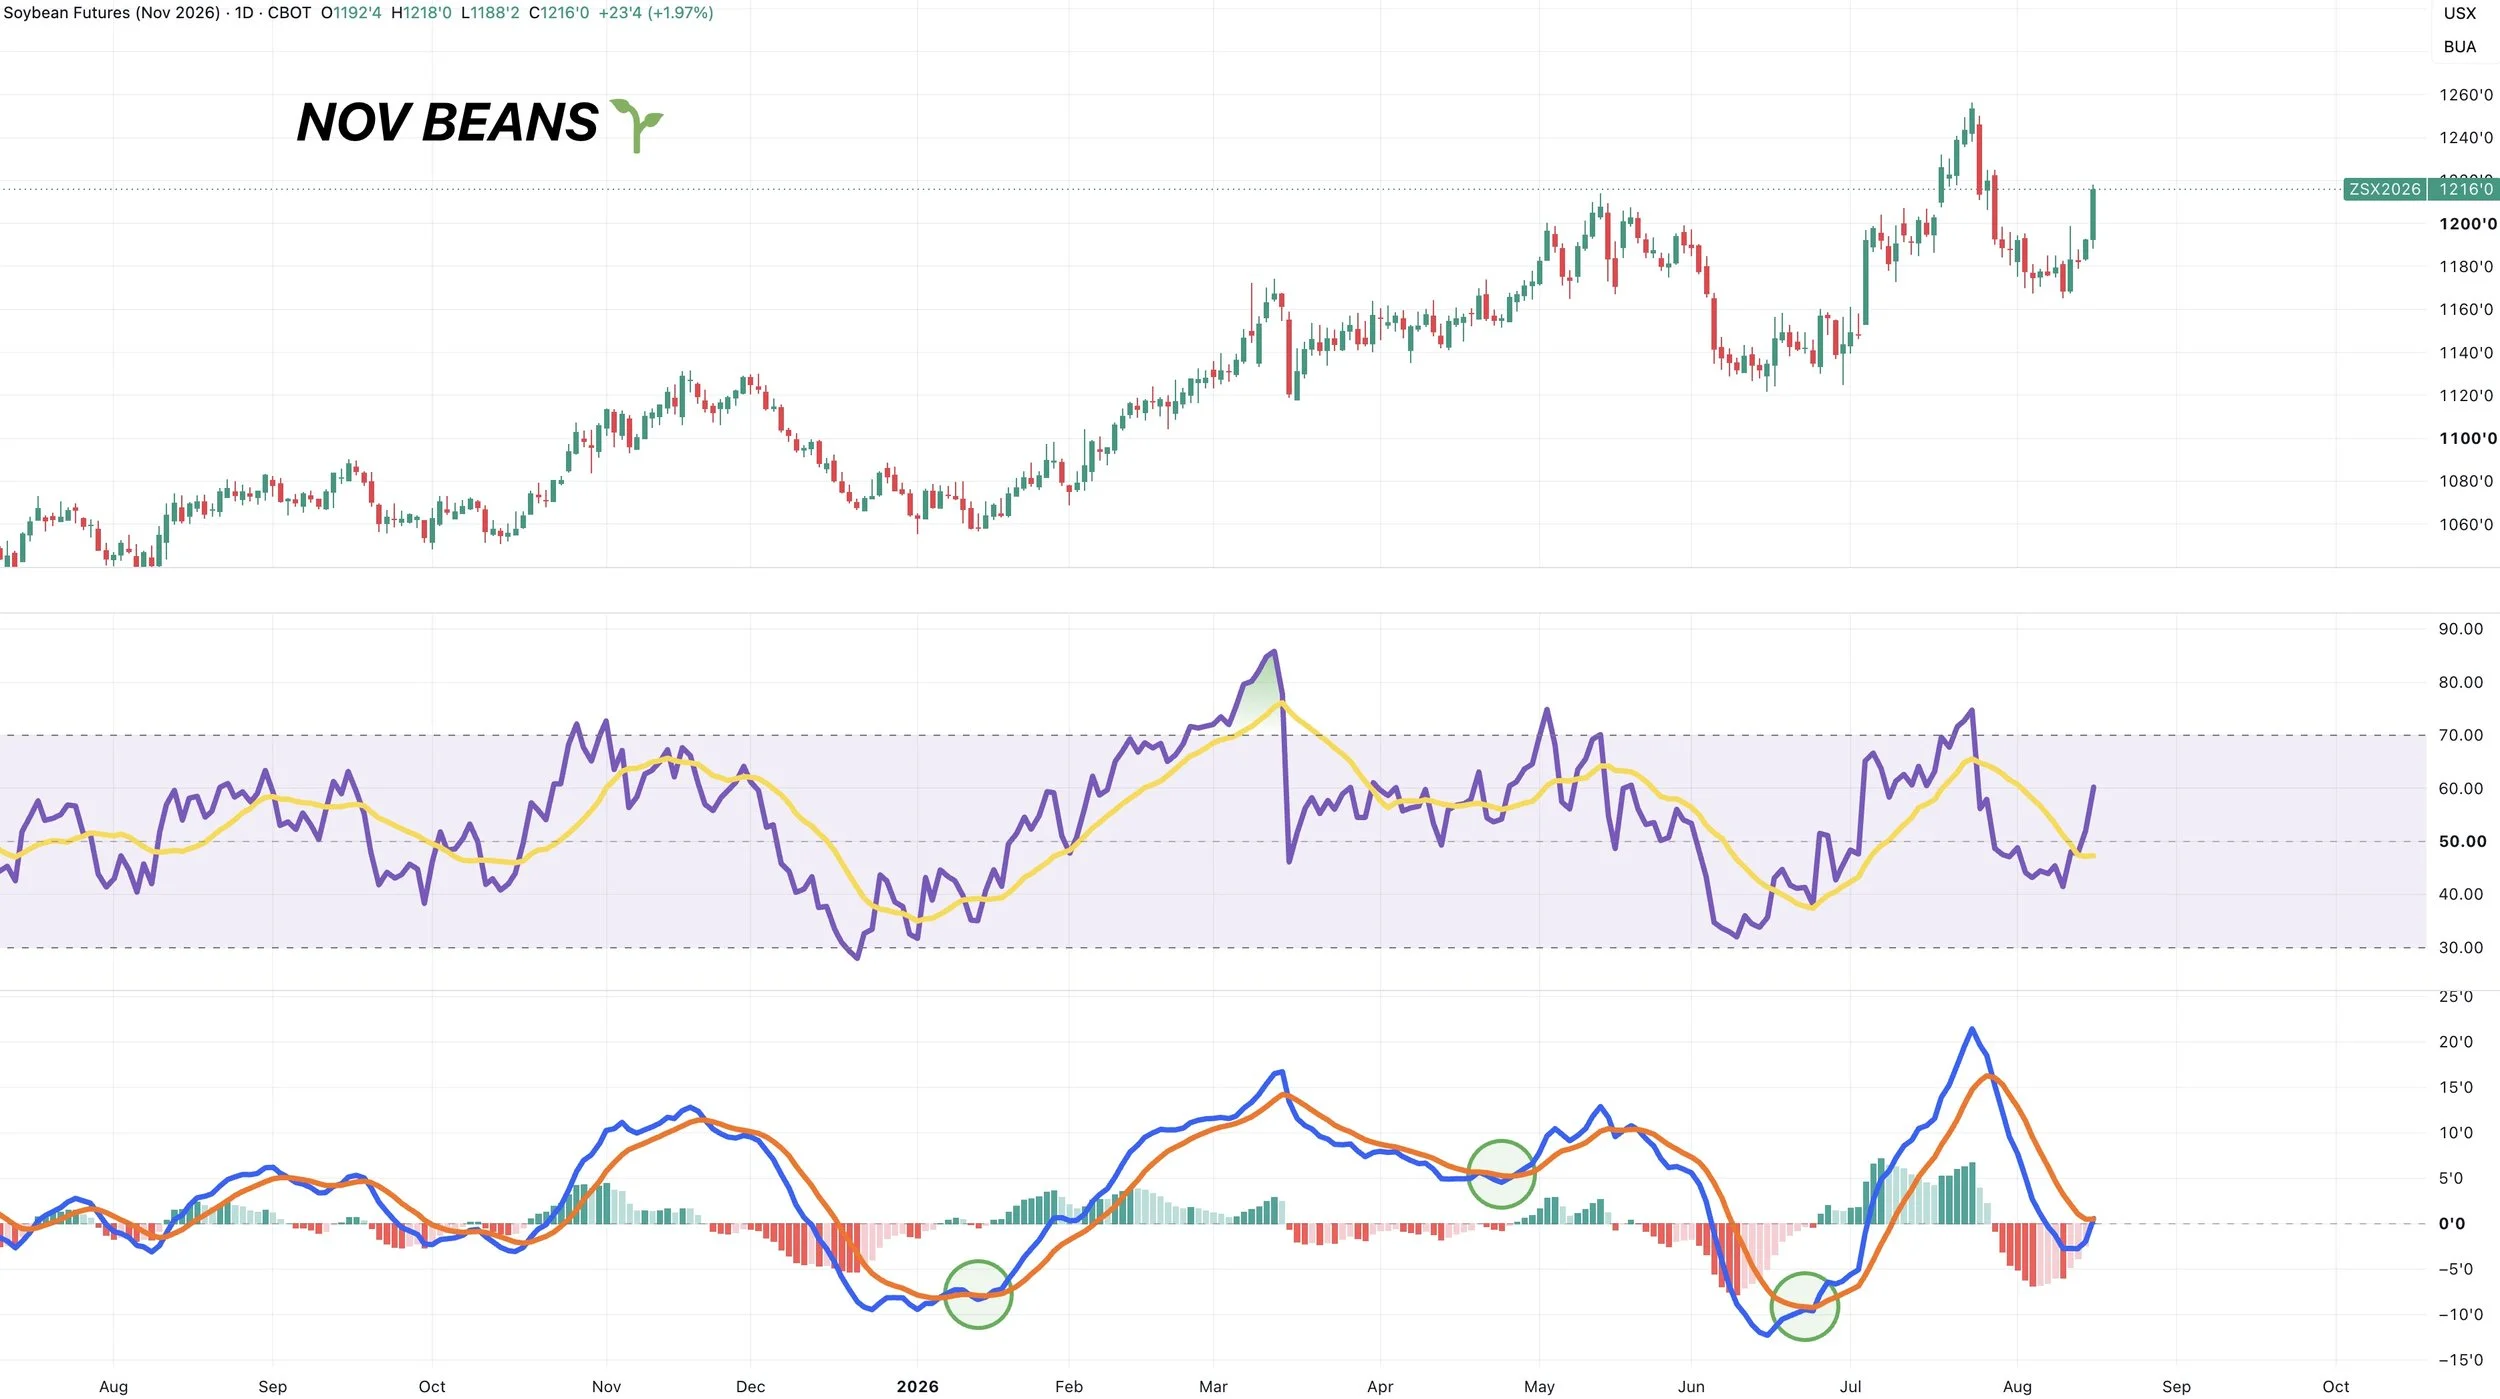
We're seeing a picture perfect bounce off that key support and "buy zone" we've been heavily discussing the last few weeks.
Why here?
For starters, this was the 61.8% level down to the lows from June lows. The most common retracement.
That same level was the highs from March. So we were able to turn that old ceiling into our new floor. Just like we saw happen in the past.
On the June sell off, we turned the old November highs into our new lows.
We also had a volume gap lower, meaning if we did not hold this level, we were likely going to drop quiet a bit lower. Meaning it was a sink or swim level with an area of invalidation.
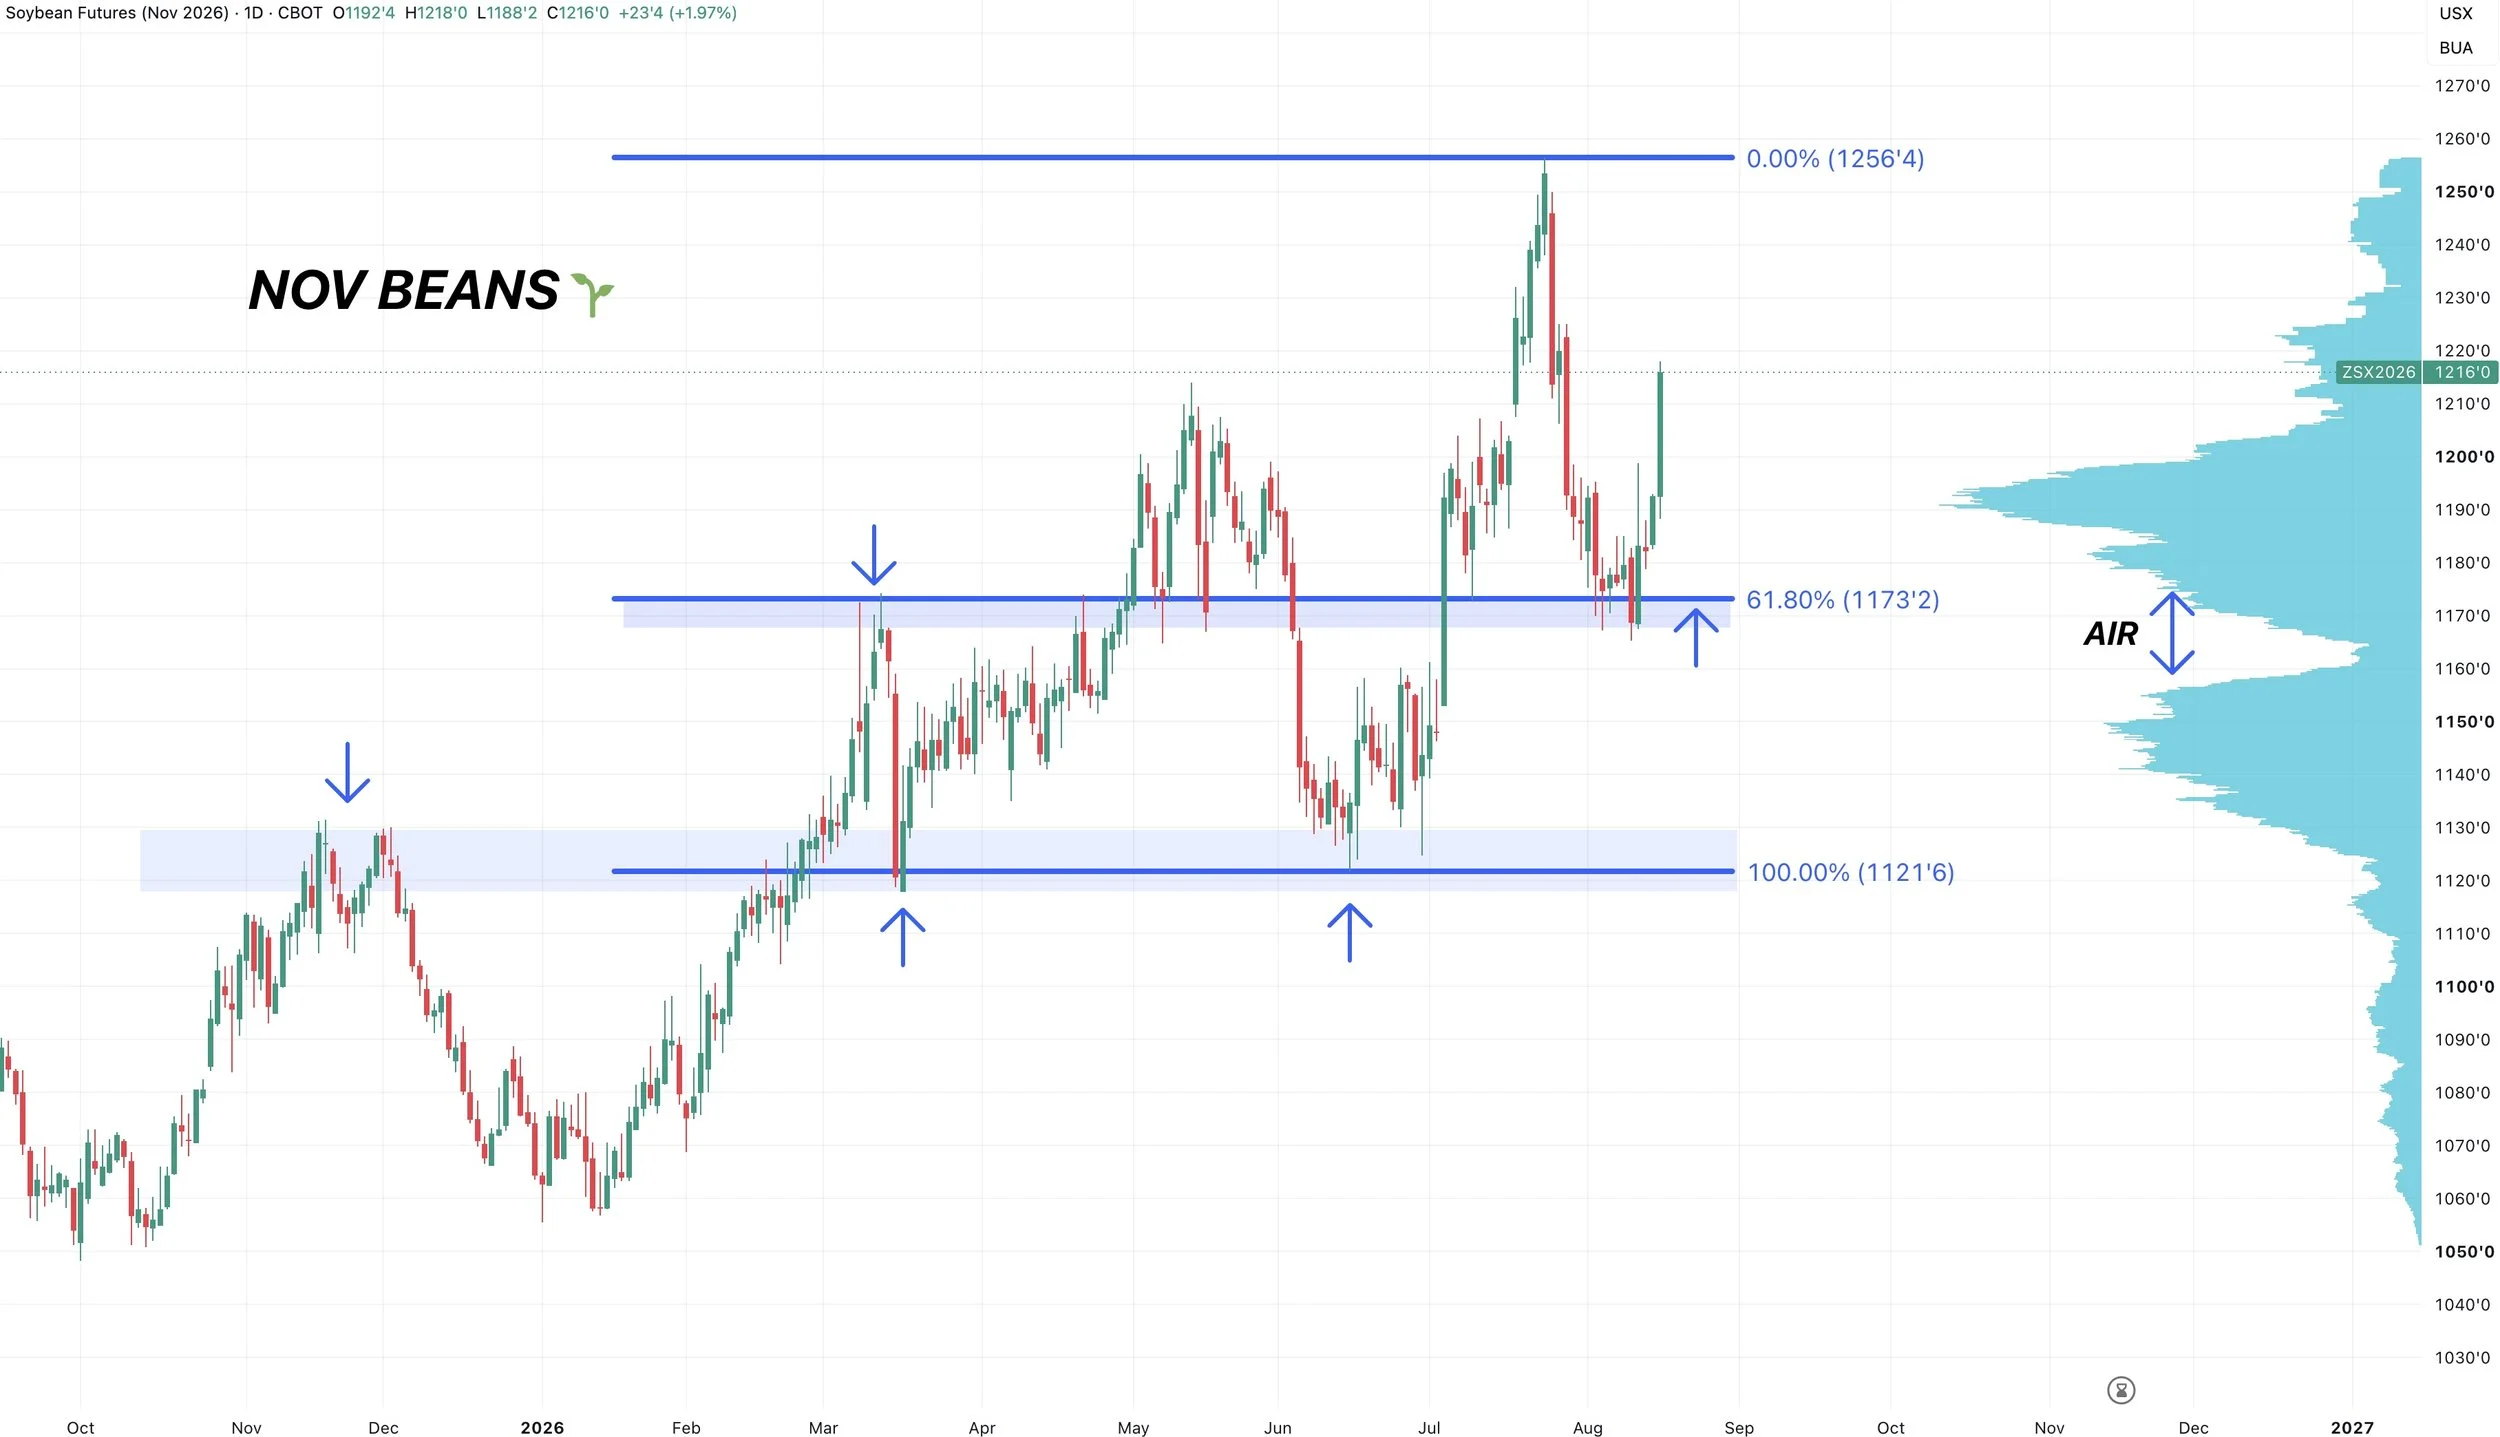
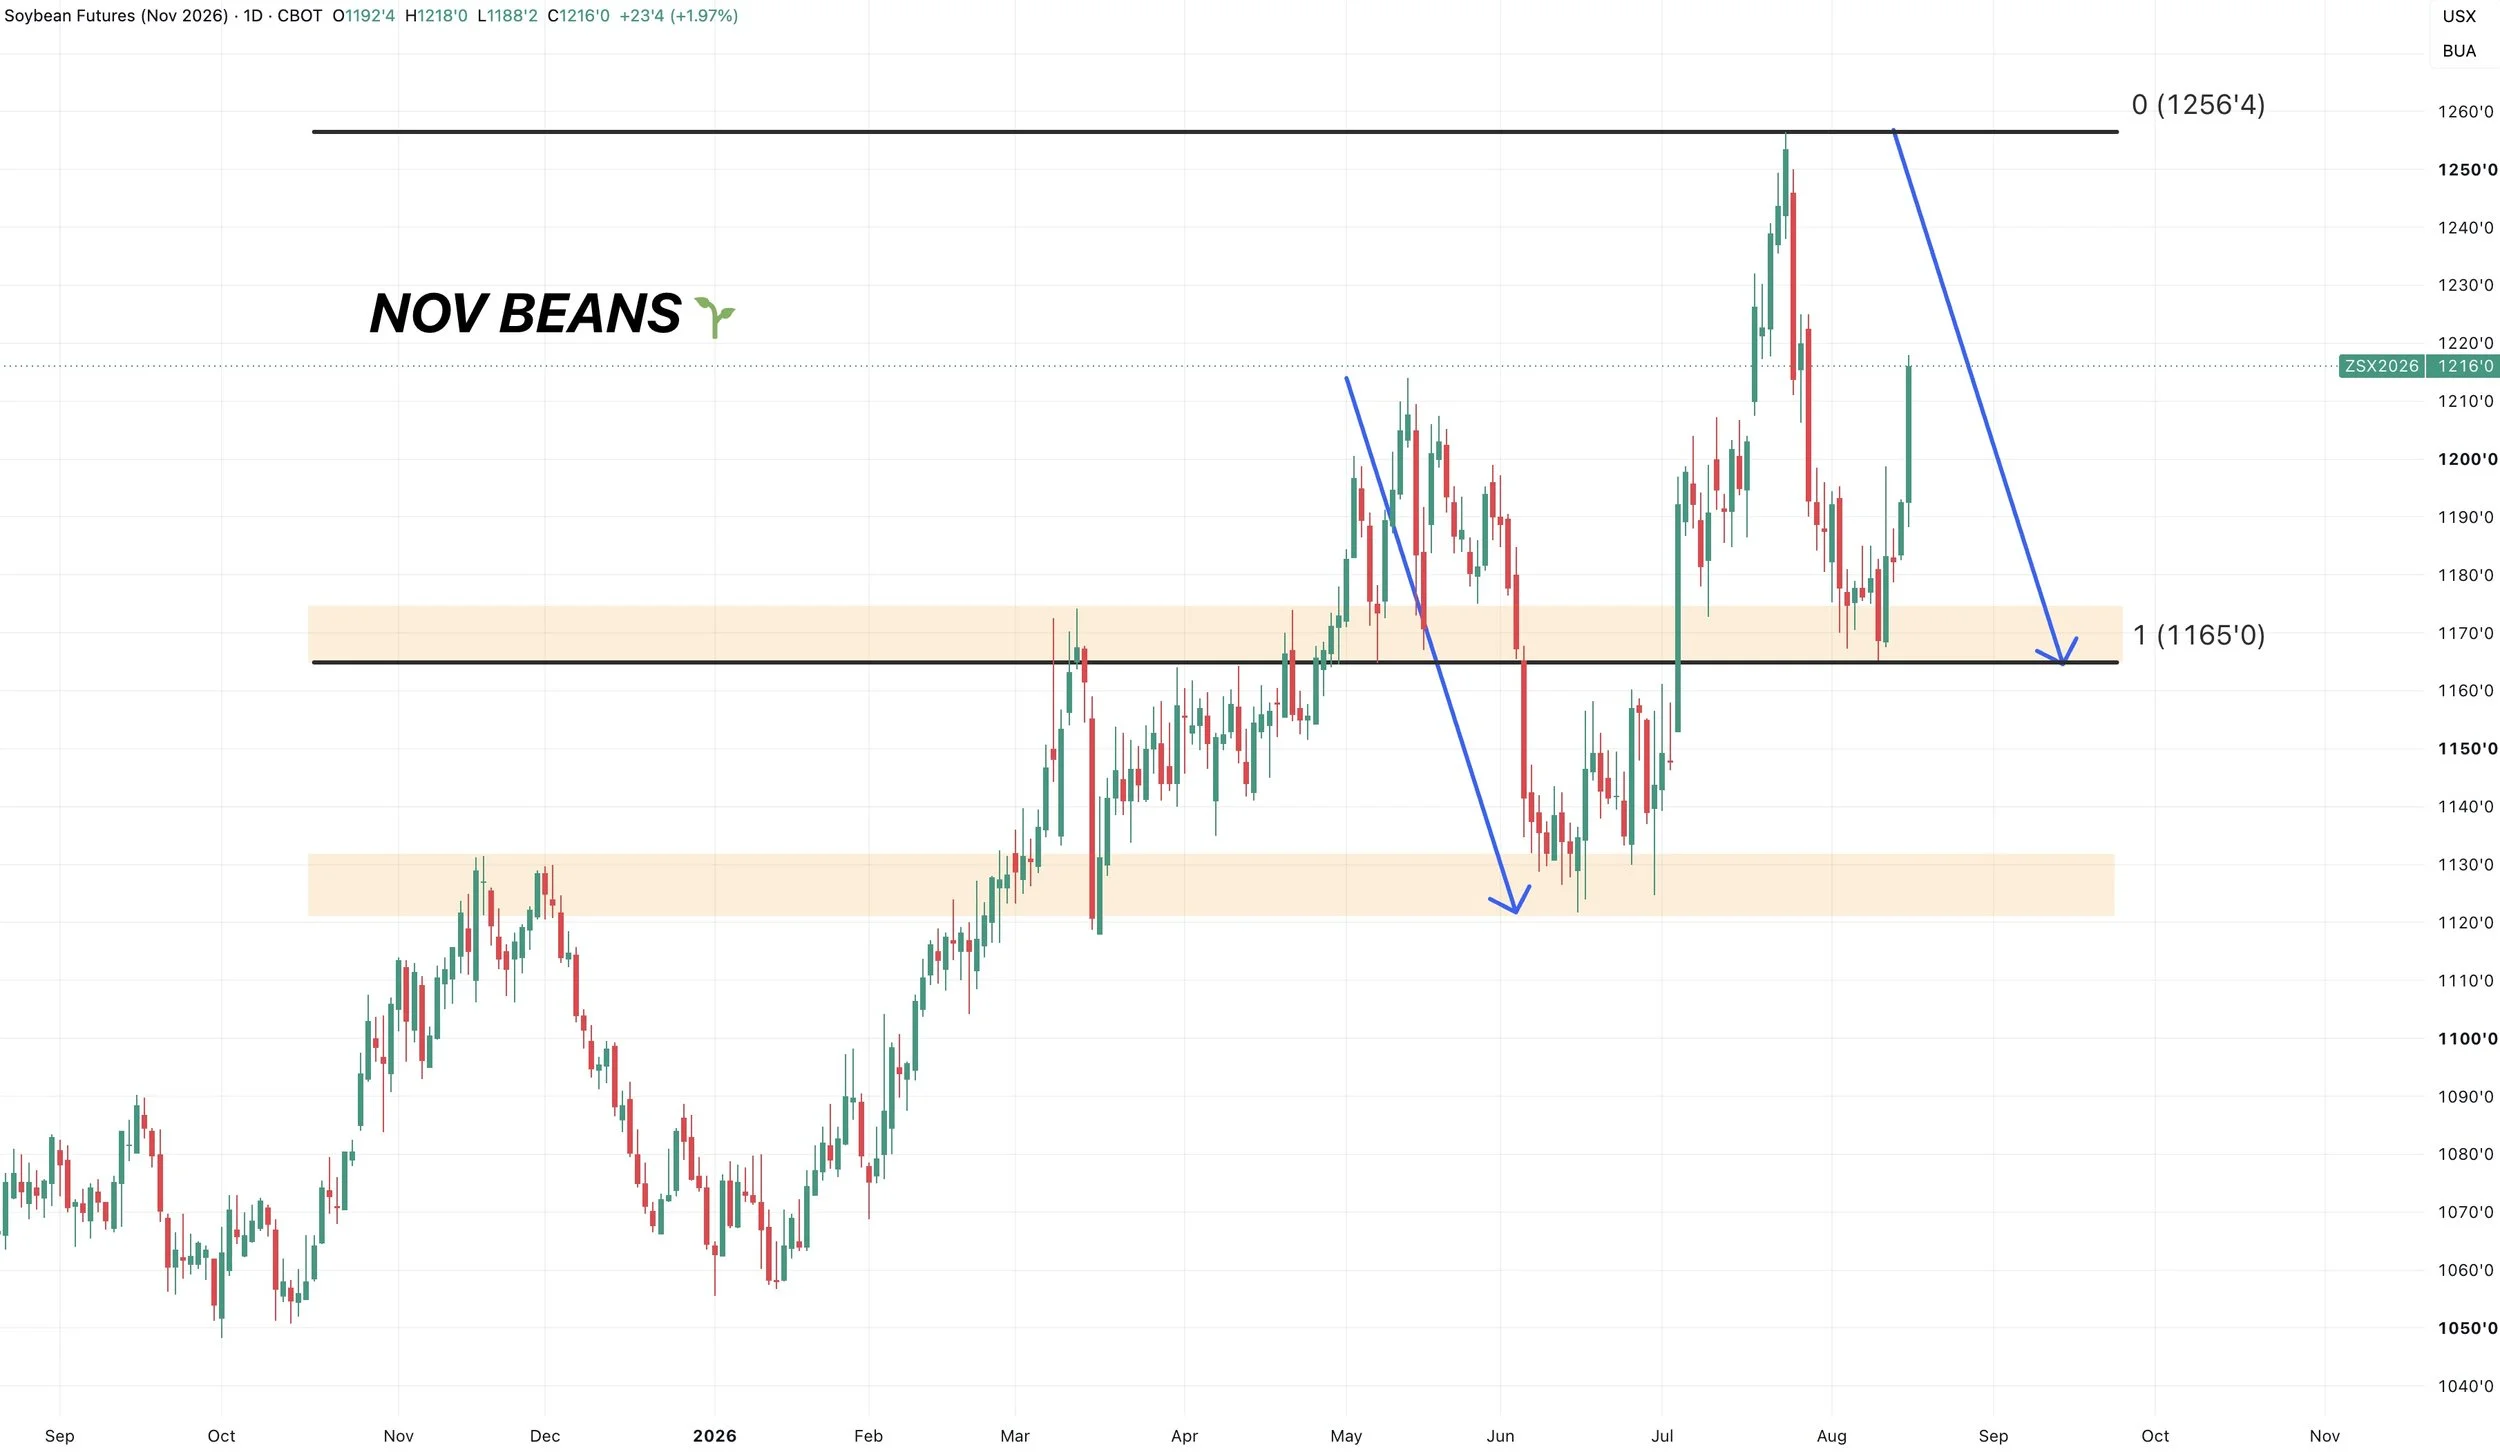
This was also the exact 1 to 1 move from the June sell off.
Meaning this sell off was the exact same size as the one from June. Down to the penny actually.
Now what?
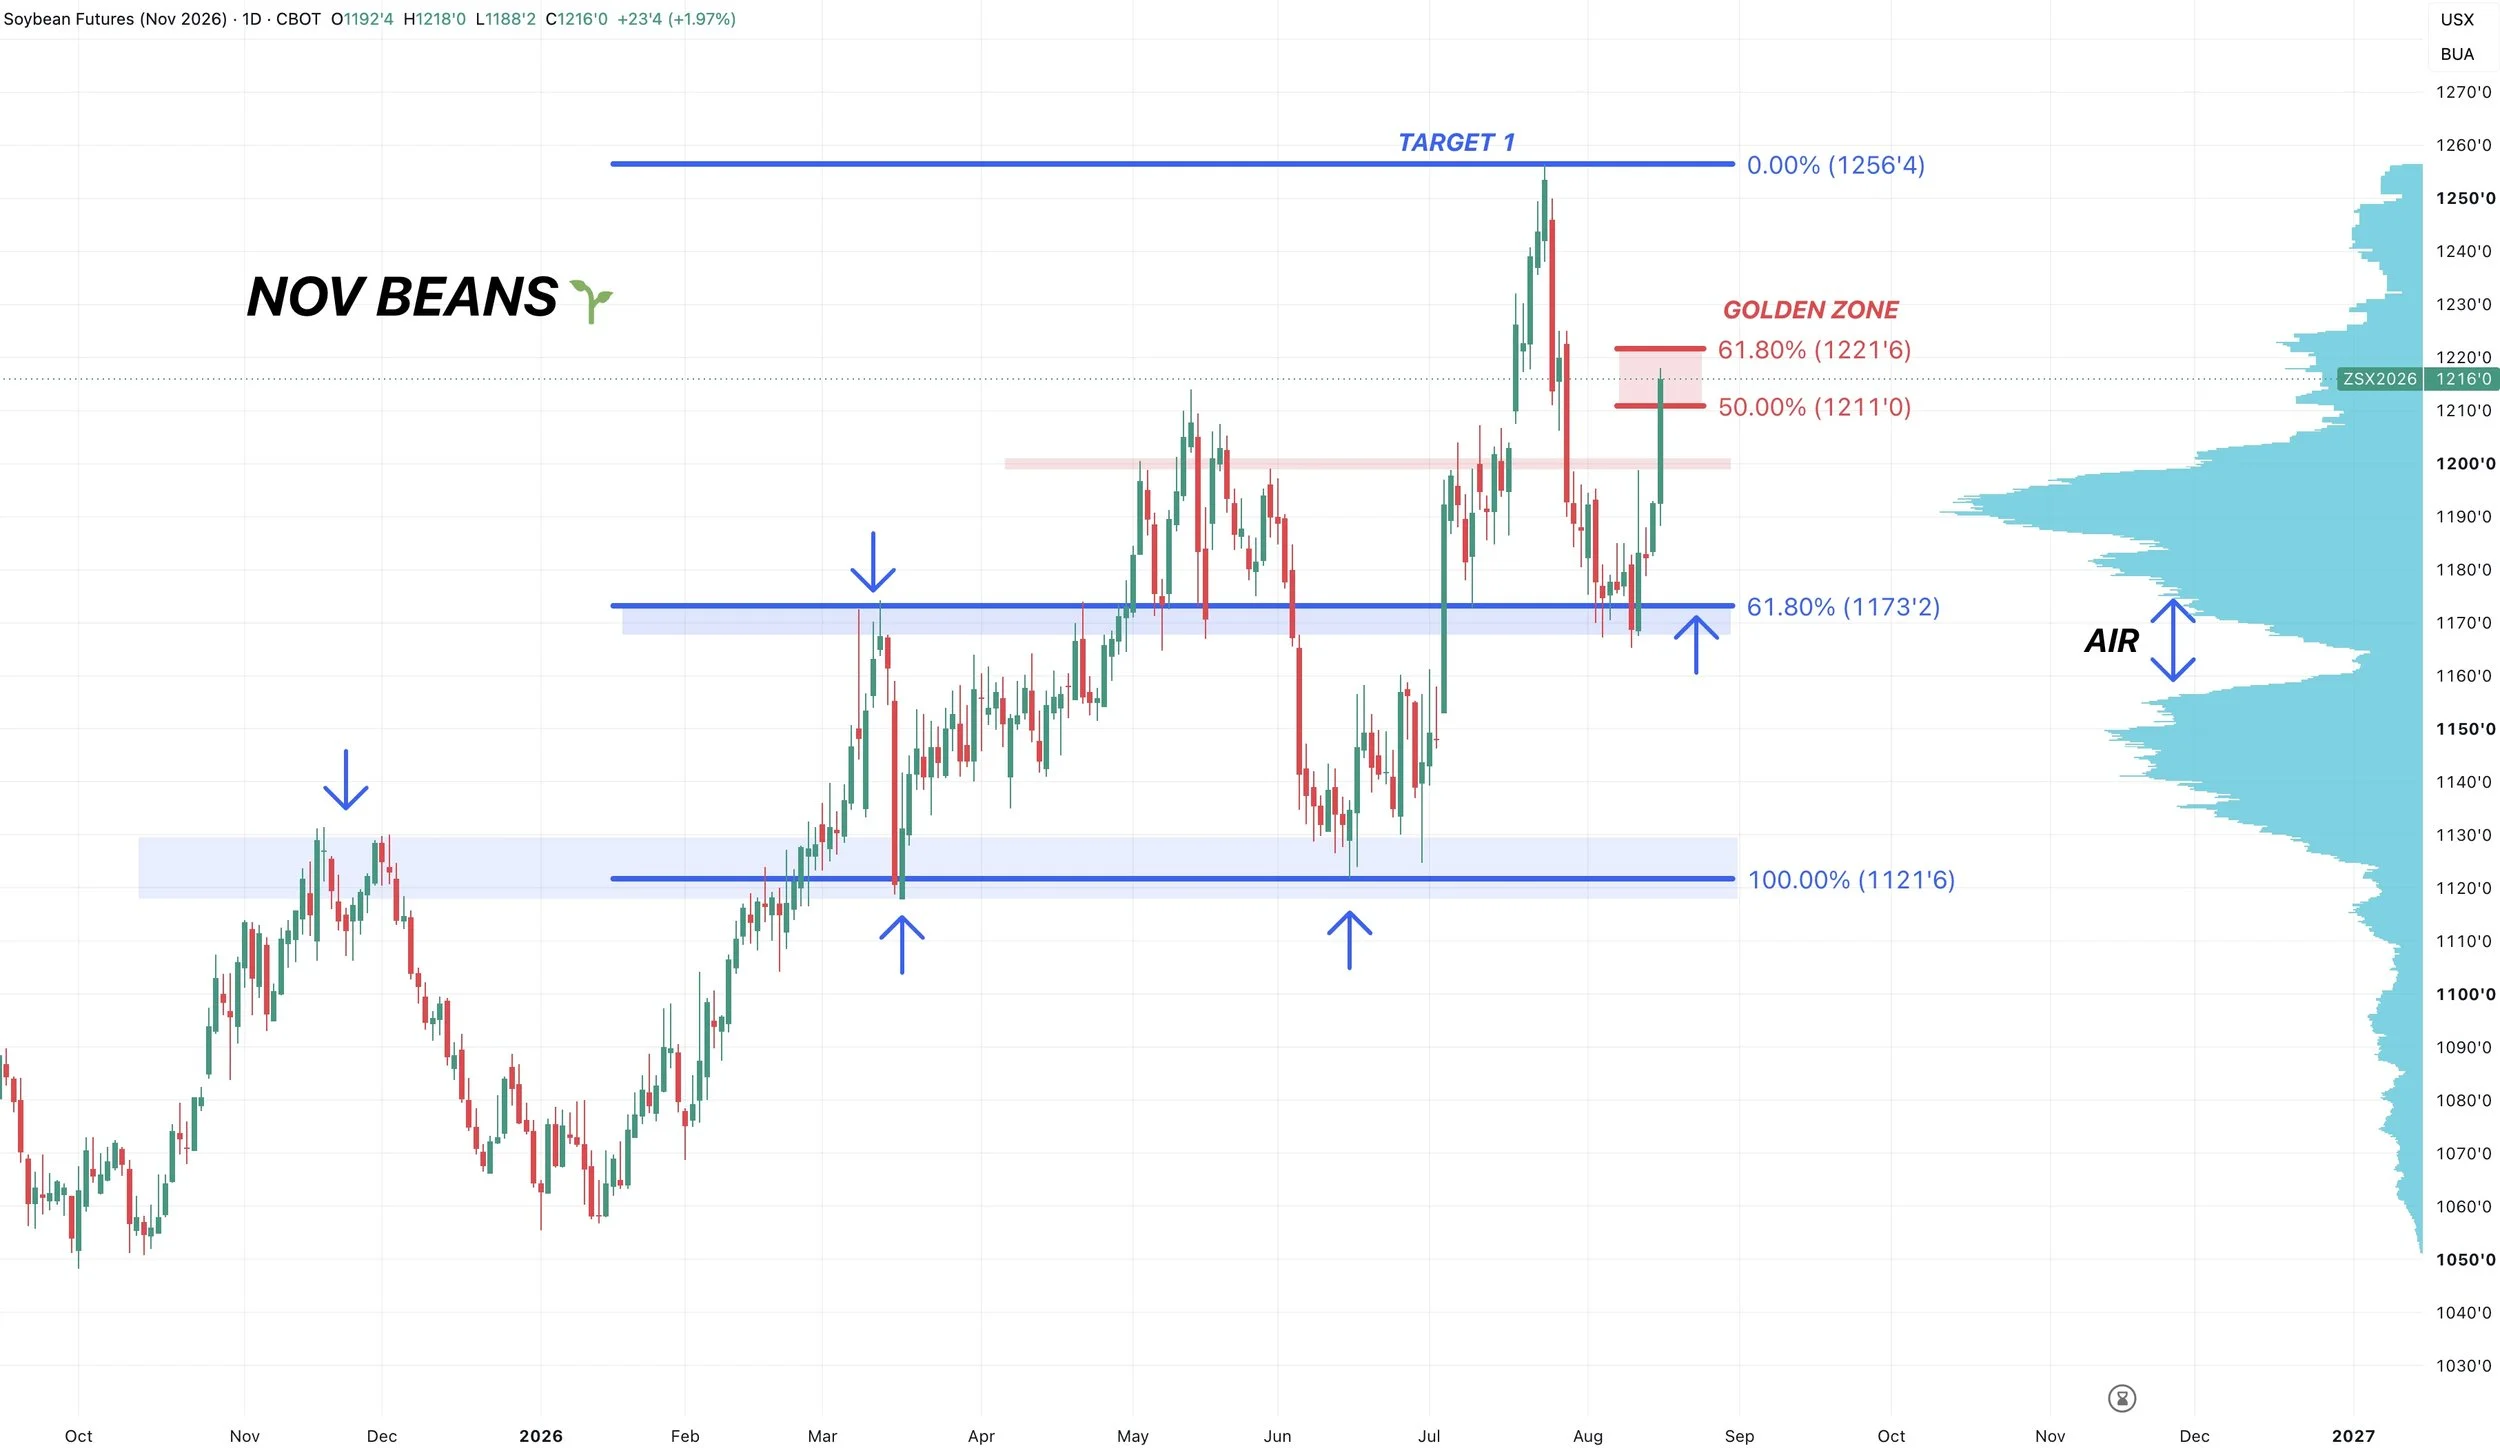
We are approaching some "possible" resistance.
We've now clawed back 50-61.8% of this entire sell off from July.
So this would be a common area to stall, but we do not have to. This will be a big level to watch here short term.
If we break above, the next resistance is going to be those highs.
If we get a pullback, I think it would be viewed as a good opportunity. Perhaps a re-test of that peak volume. I'll have exact levels if we actually get a pullback.
As for a longer term target.
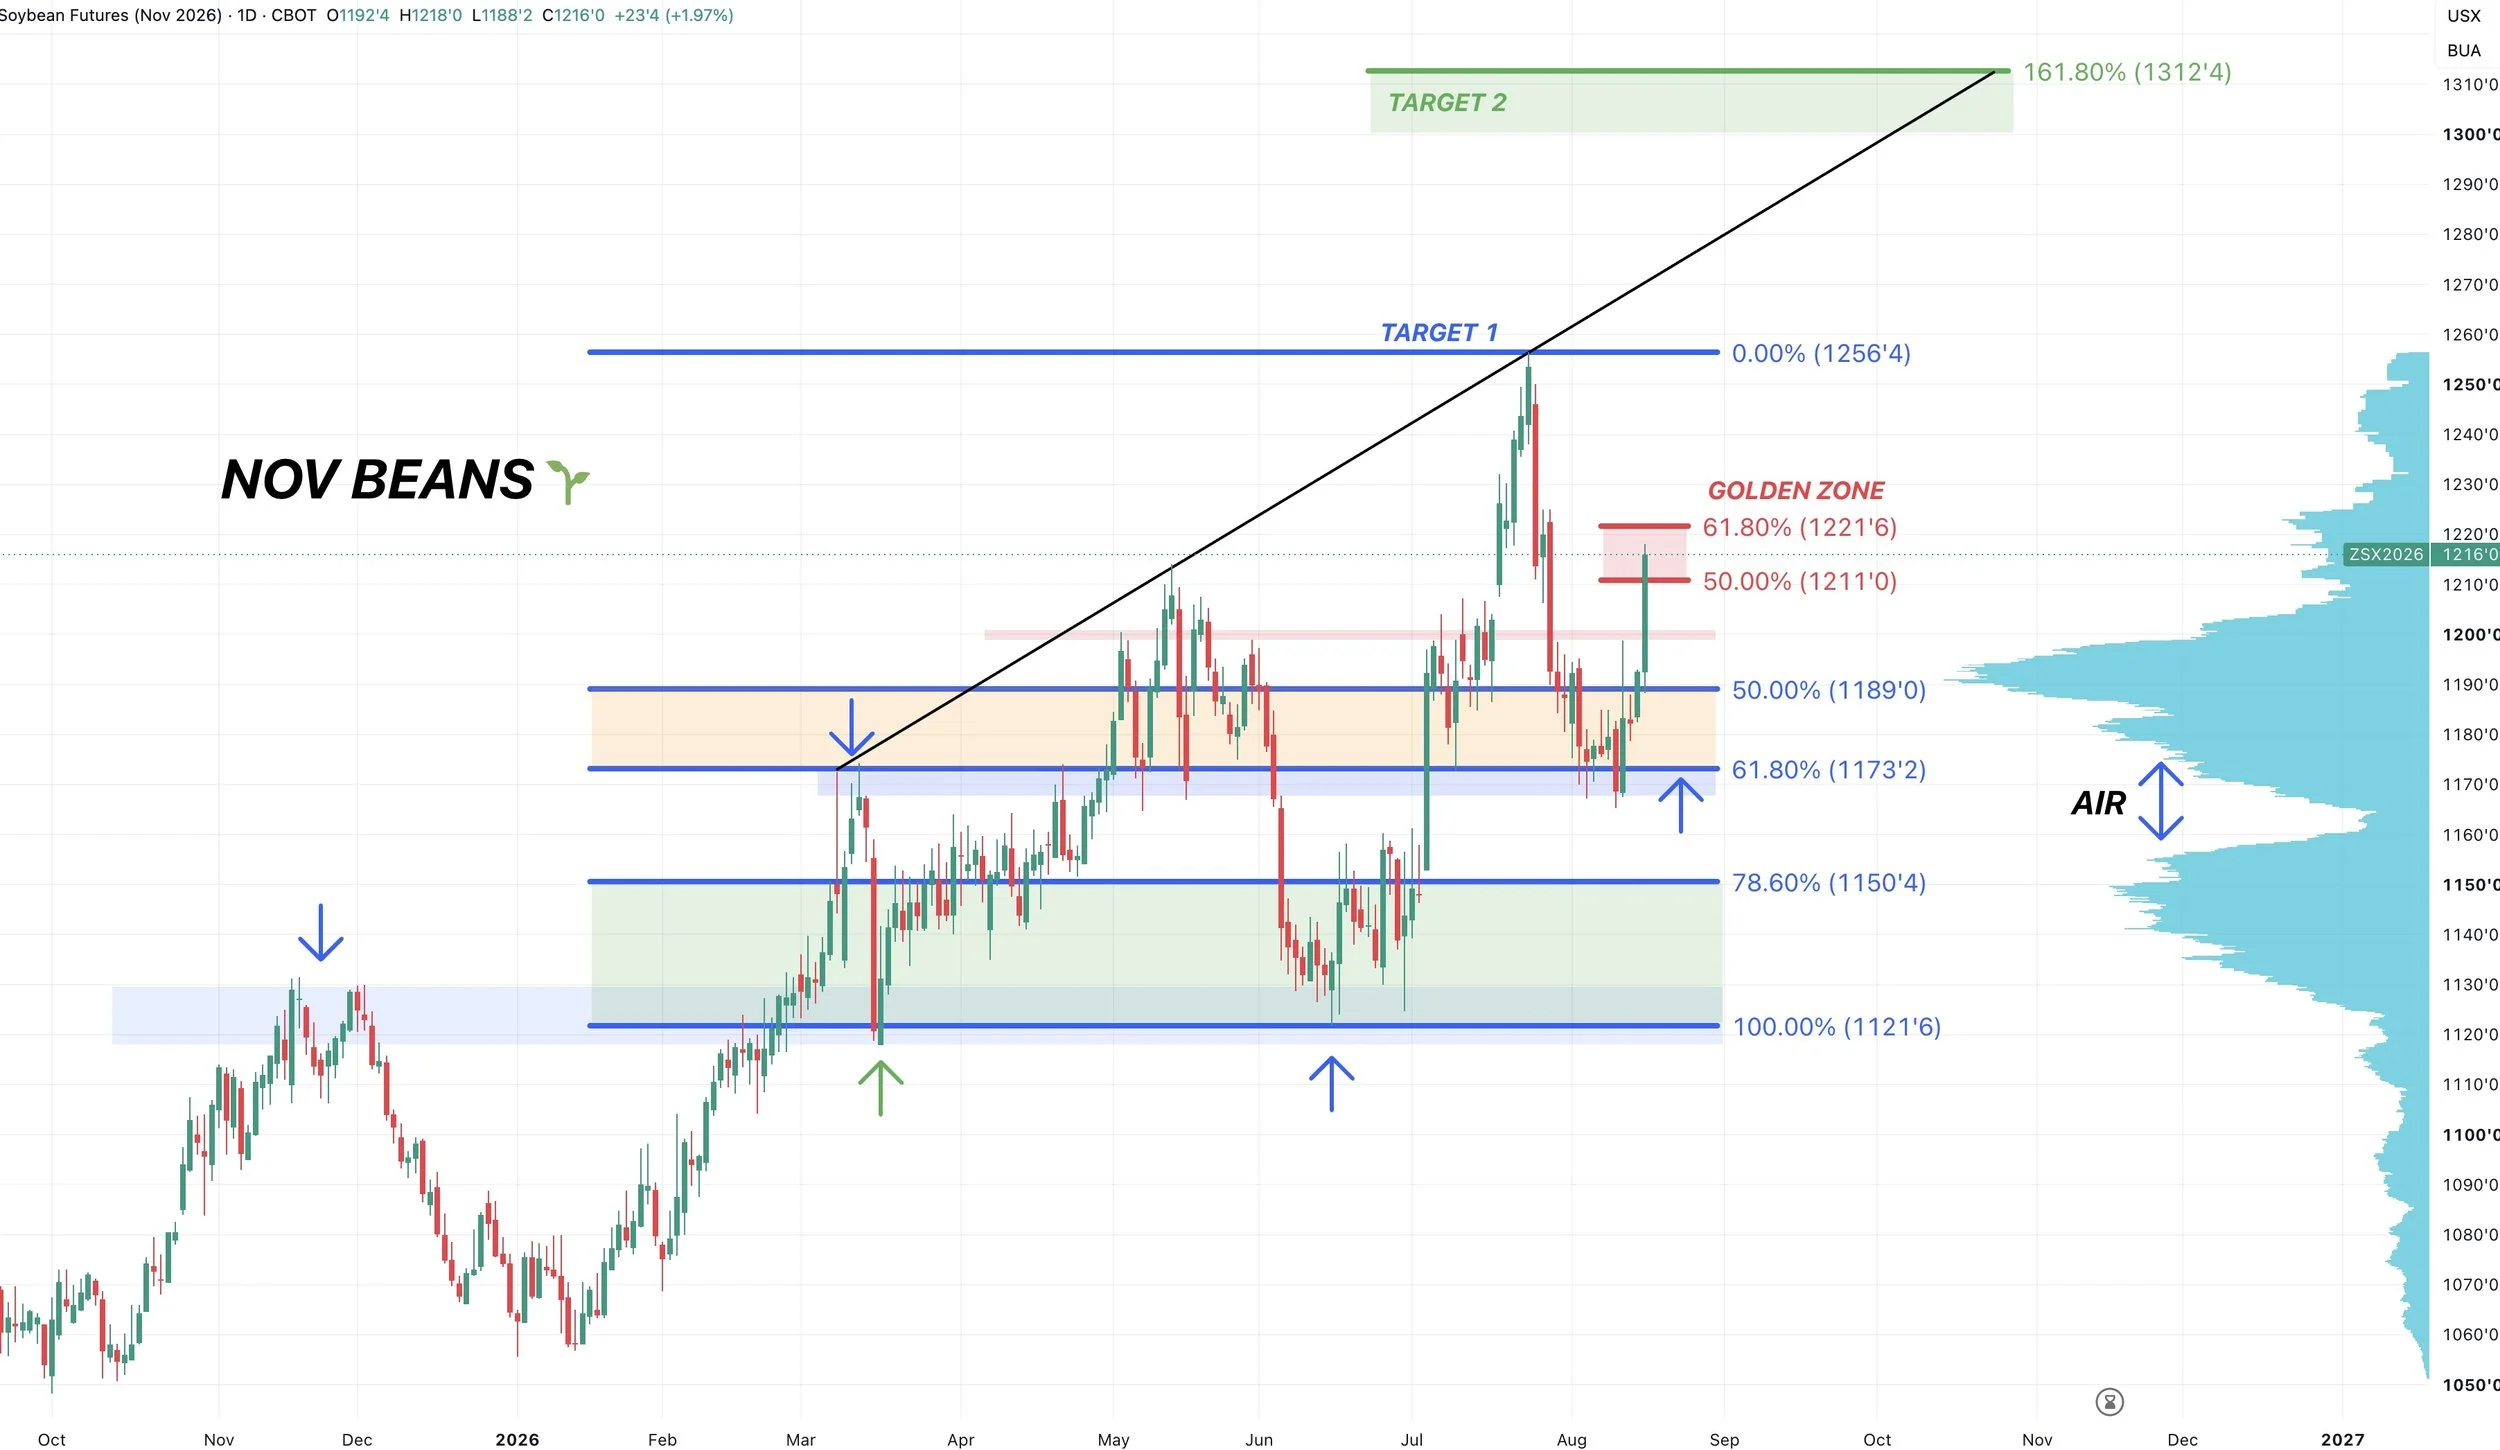
If we are able to break the recent July highs.
I have a target of $13.00 to $13.10.
That $13.10 level is the 161.8% move from the recent lows up to the July highs. A common continuation target.
One last thing to note is that the indicators are friendly.
The MACD is crossing bullish for the first time since those June lows.
This is not a perfect indicator, as none are.
But the last several times we saw a bullish cross did lead to further upside.
Dec Corn 🌽
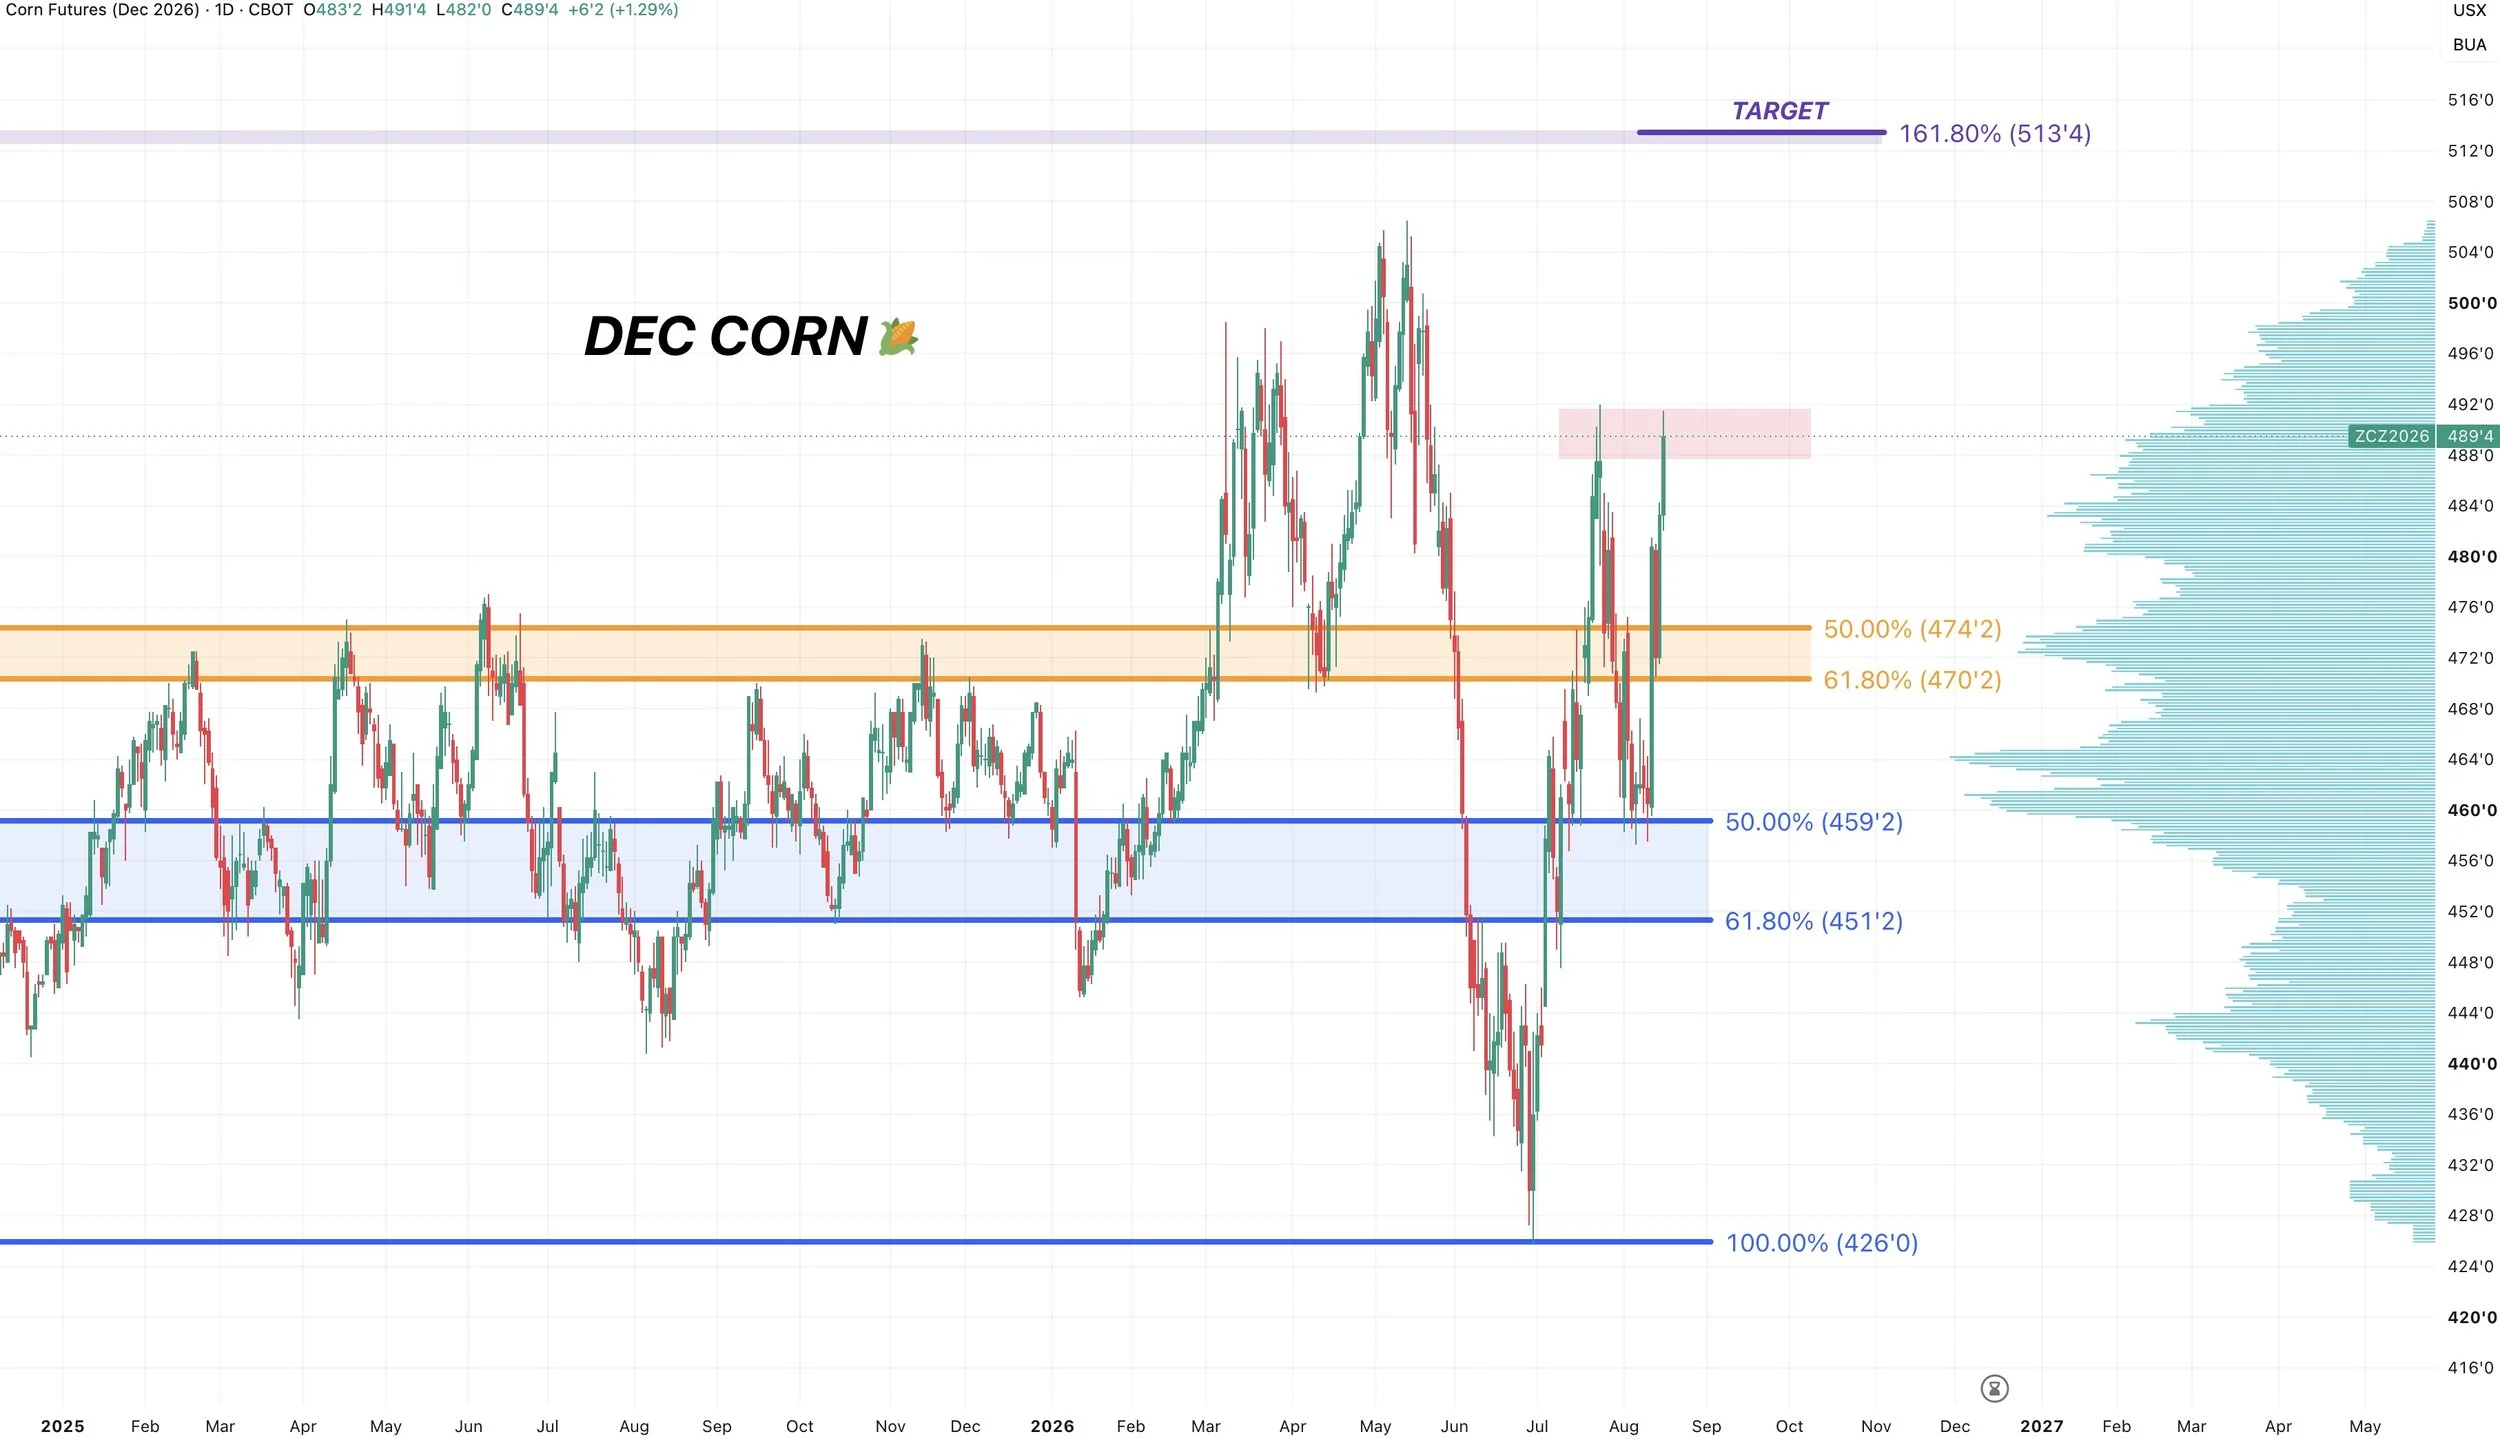
We are right up against those highs from July.
So this is clearly going to be a big level.
If we are able to break above, then the next target is of course those highs from March and May.
If we get a rejection here, a reasonable spot to get a bounce would be between $4.70 to $4.75. Which would give back 50-61.8% of the recent little rally we've had.
That same area would line up with those April lows and several highs from last year.
There is also a volume shelf that sits there.
I am not saying we have to get a pullback down to there. I am just saying if we get a rejection here, that would be an area that may offer an opportunity if it comes.
As for a big picture target.
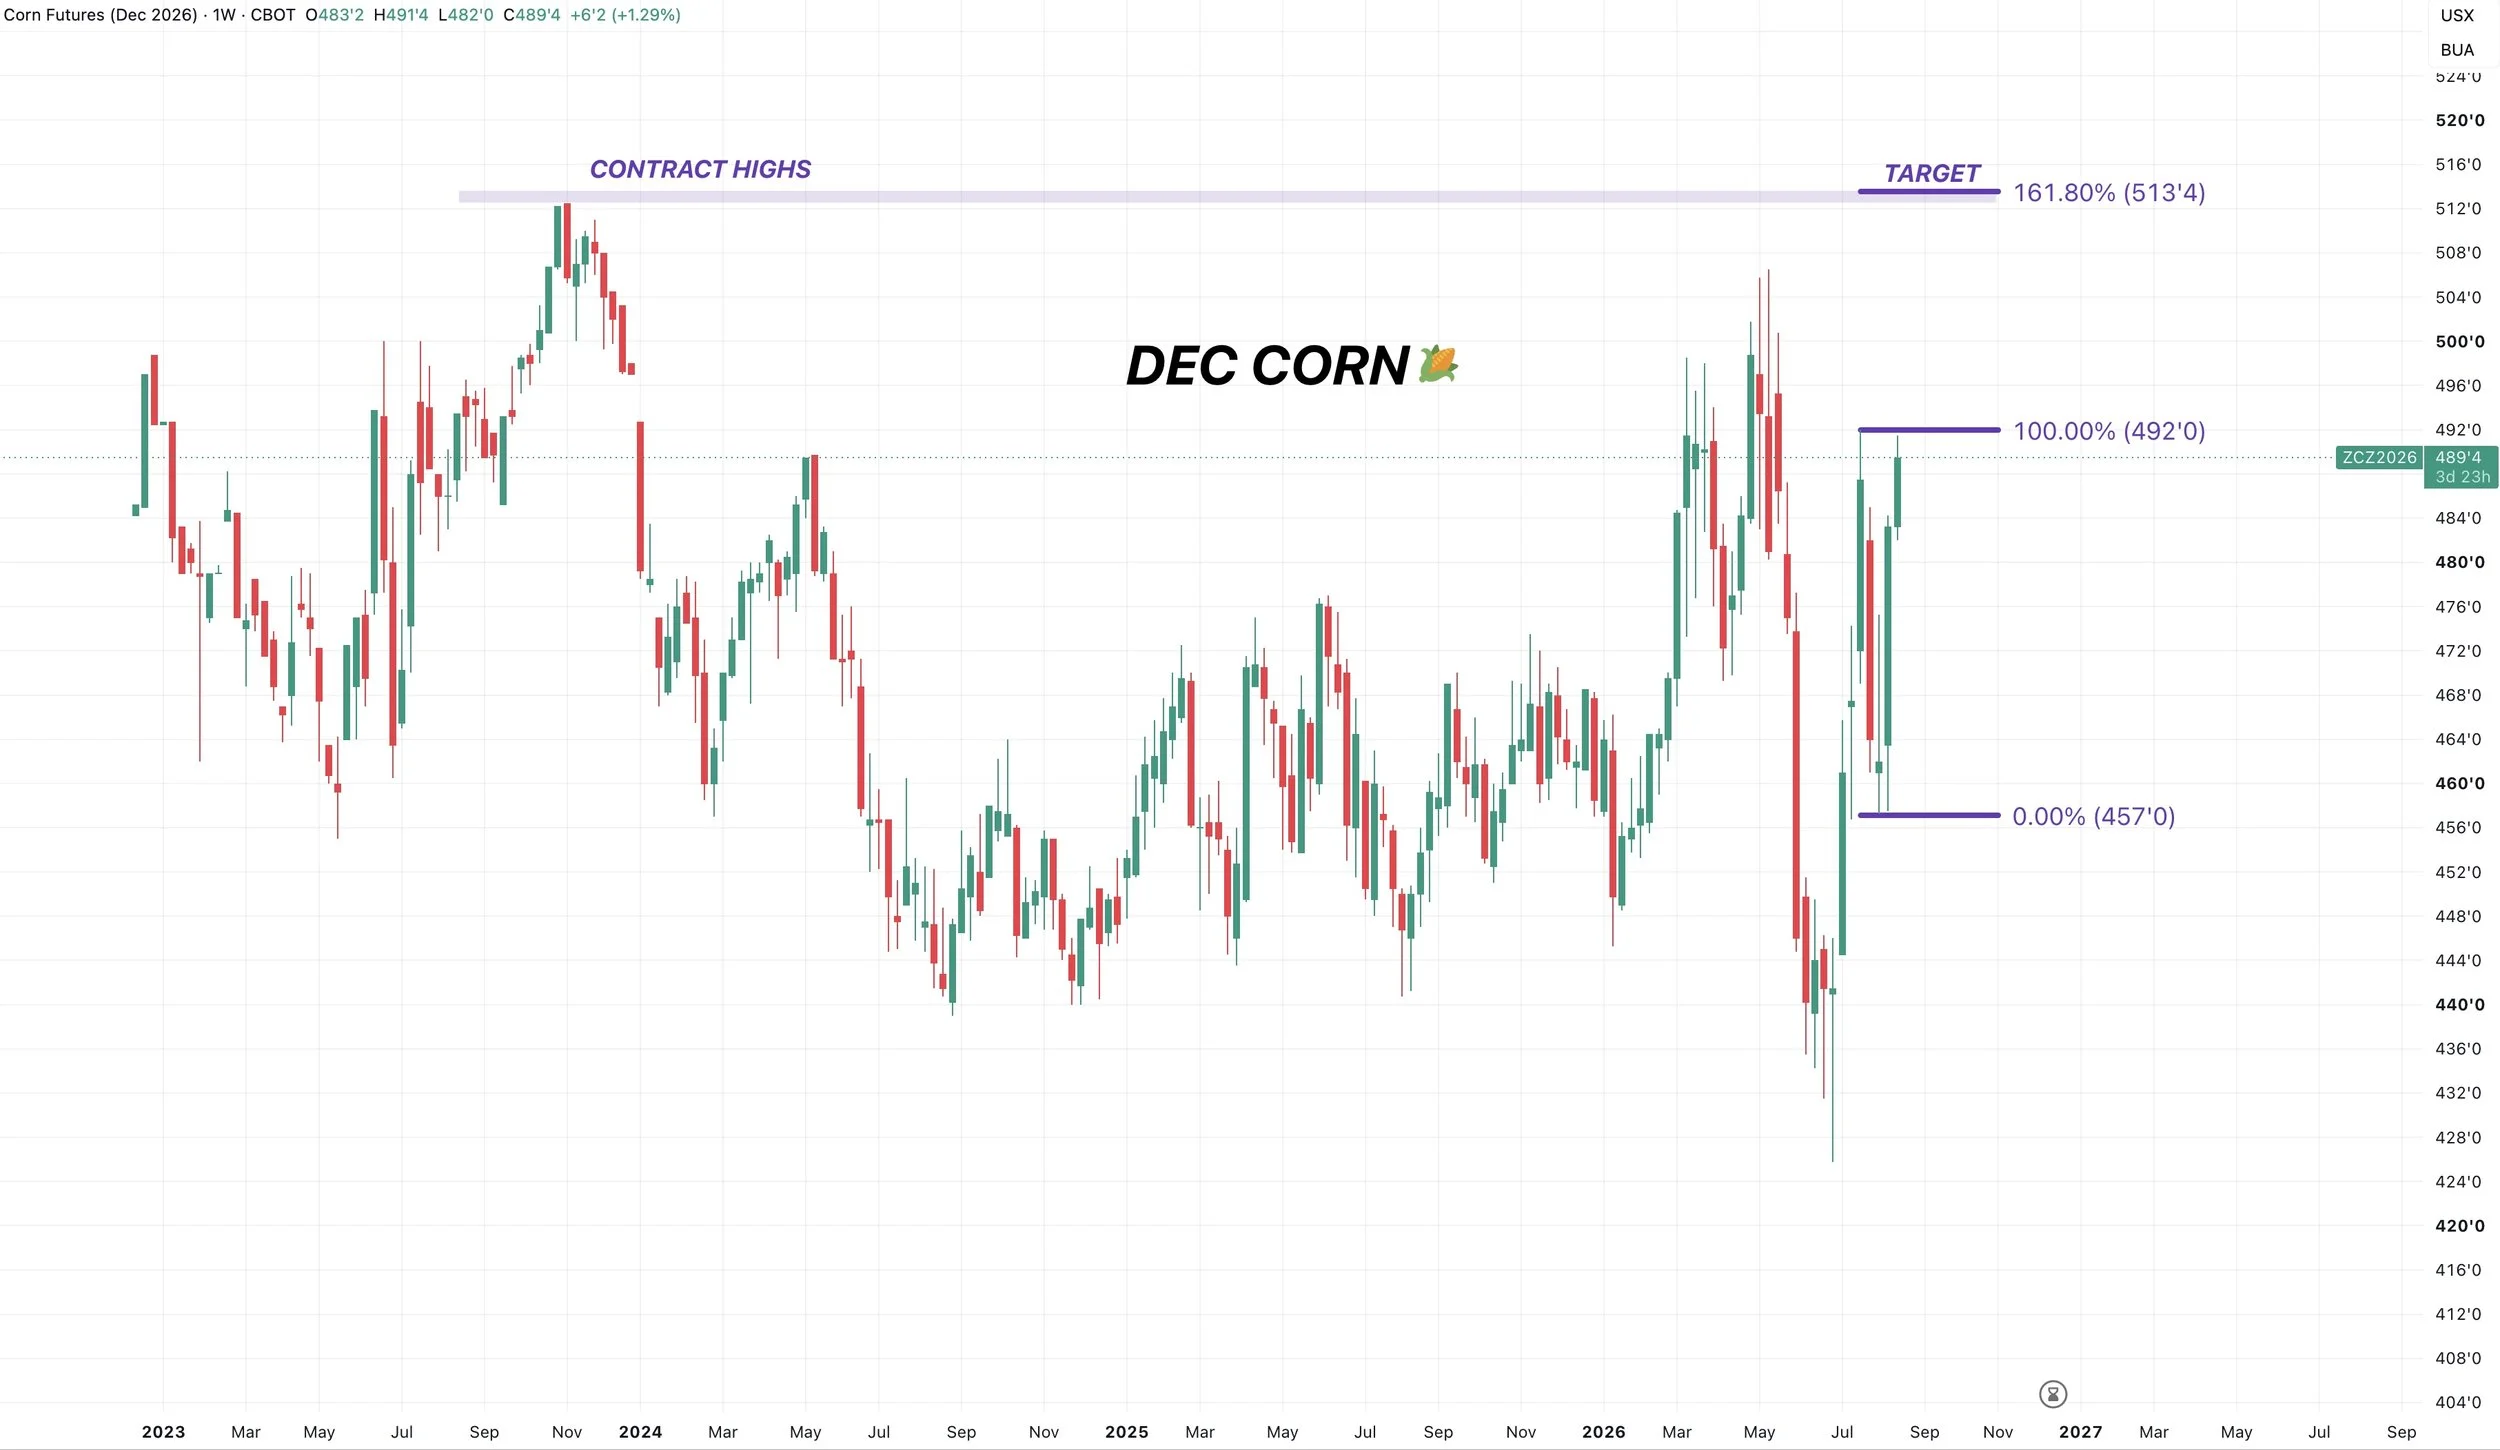
I have a target that sits at $5.13 if we are able to break above both the July and May highs.
That's the 161.8% (golden fib) from the recent lows up to the July highs.
That same level is the contract highs.
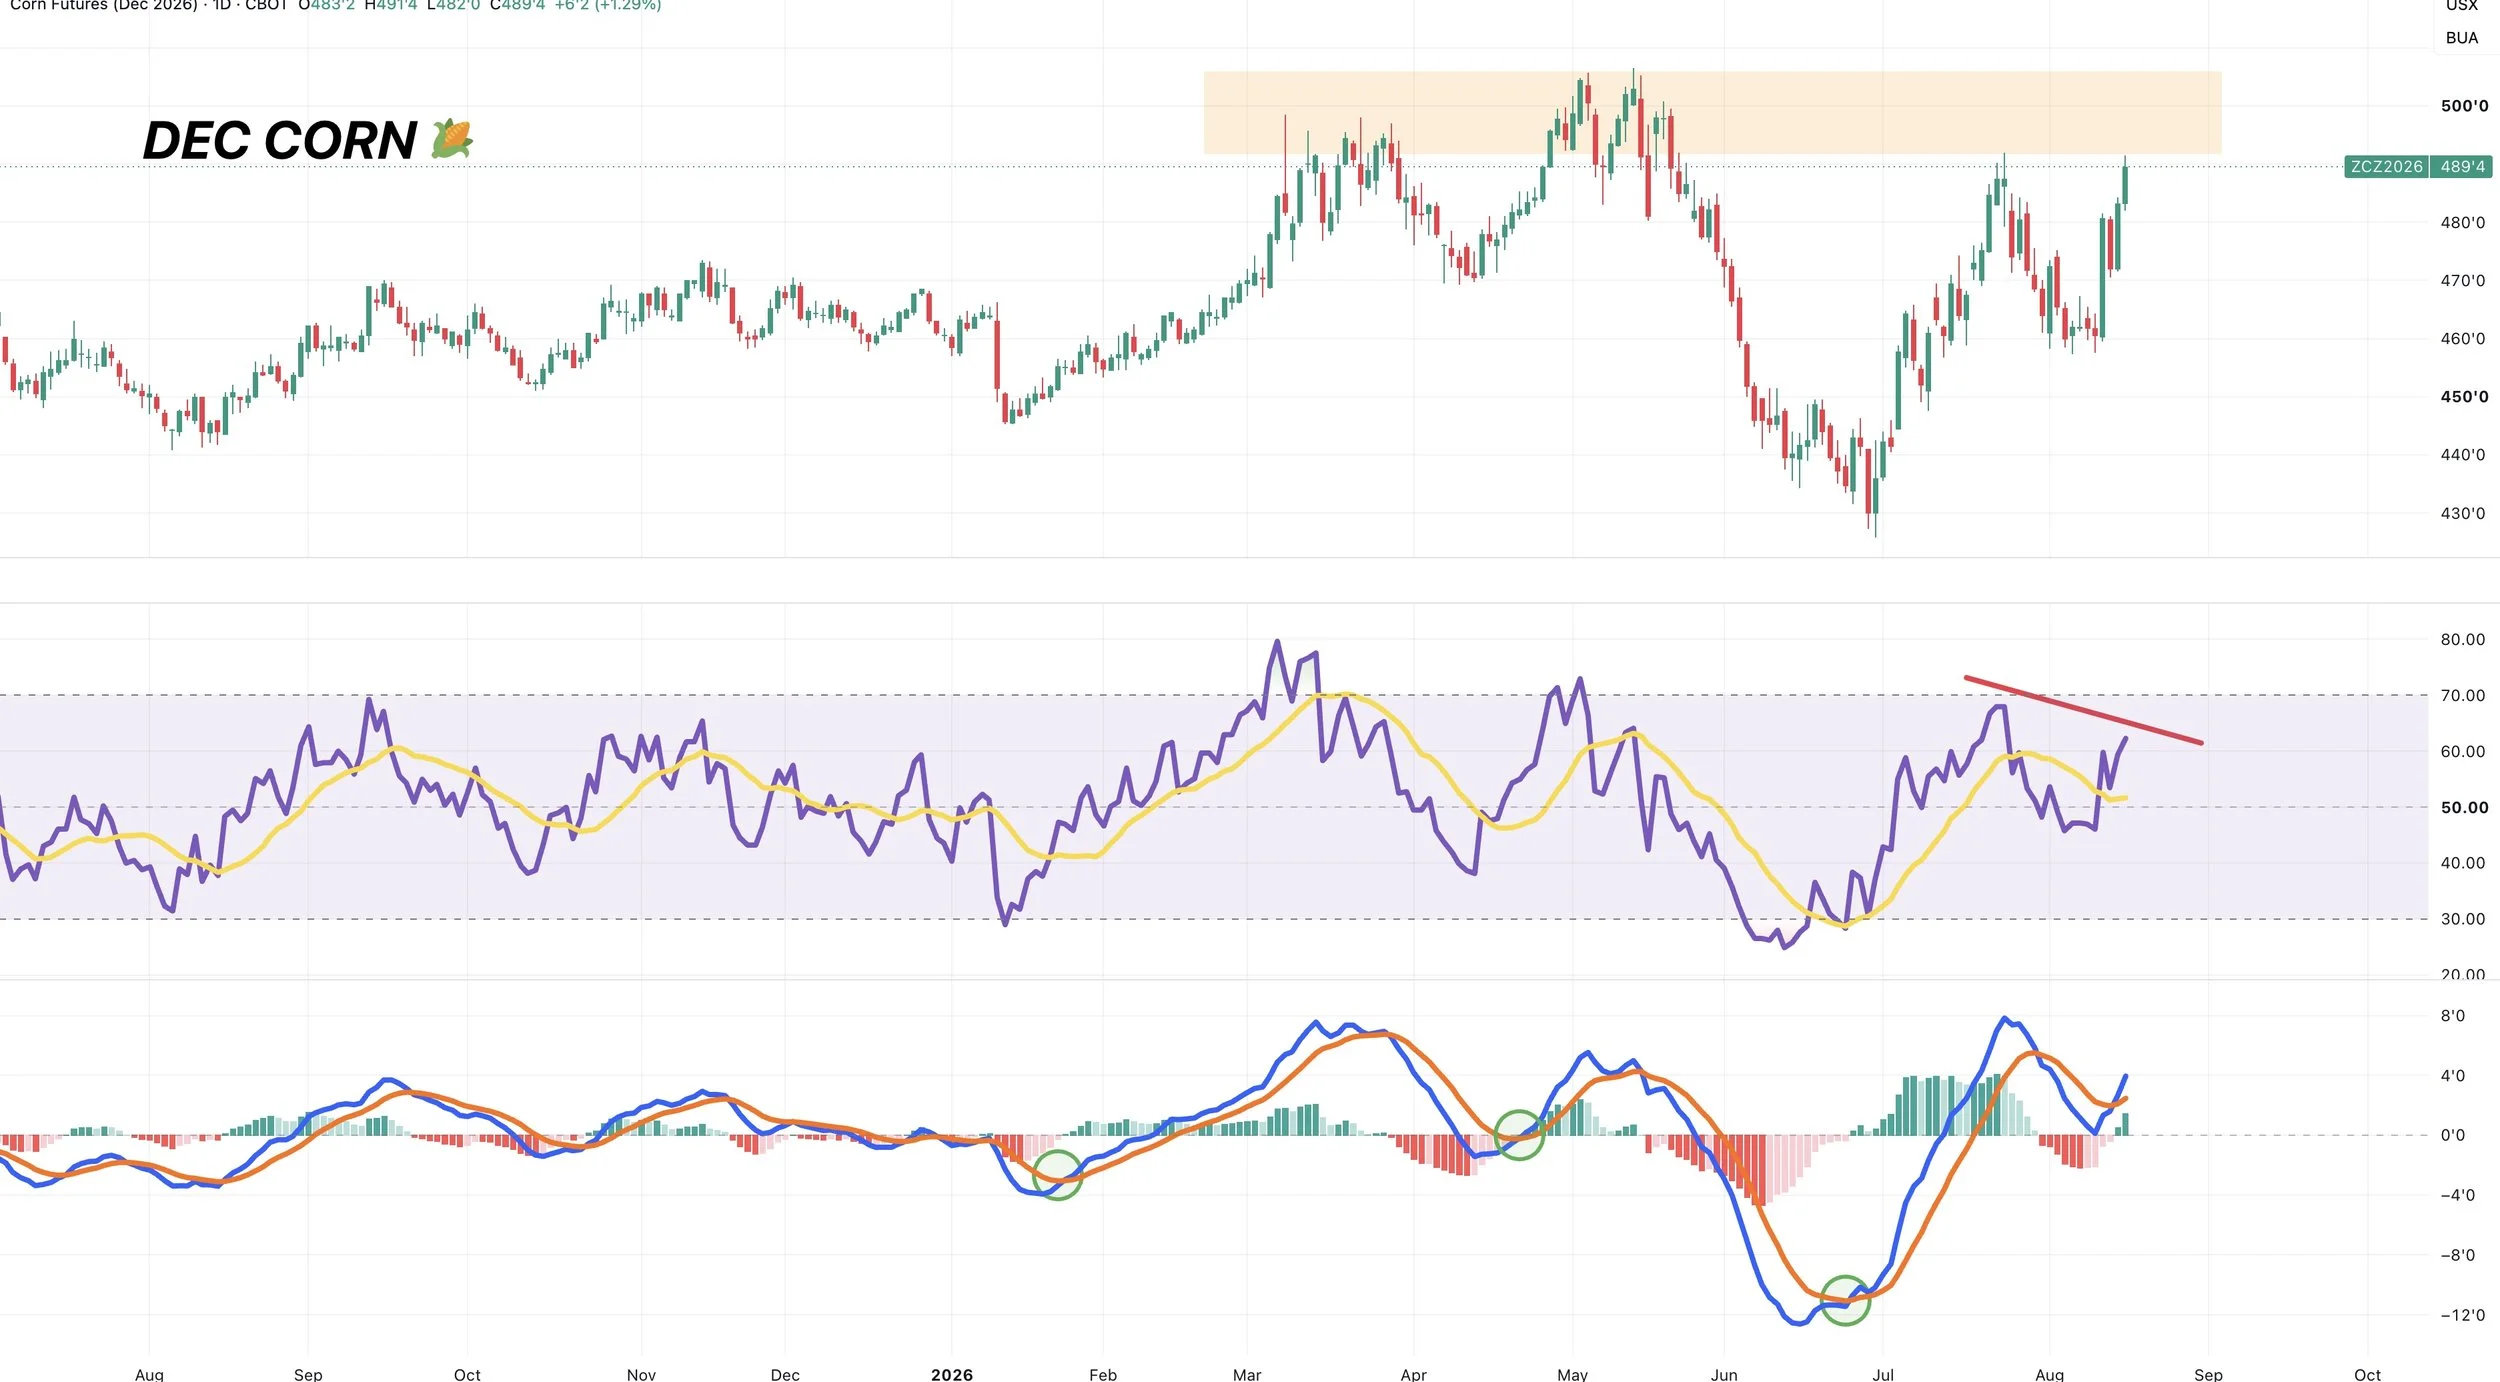
The MACD crossed bullish for the first time since the June lows. Suggesting momentum is higher.
However, one thing to note is that if we take out these July highs we might have some bearish divergence on the RSI.
As prices could post new highs, while the RSI does not.
So it would not be the worst idea to reward this high time frame resistance if it happens and we post new highs and bearish divergence.
Bearish divergence marked the May highs.
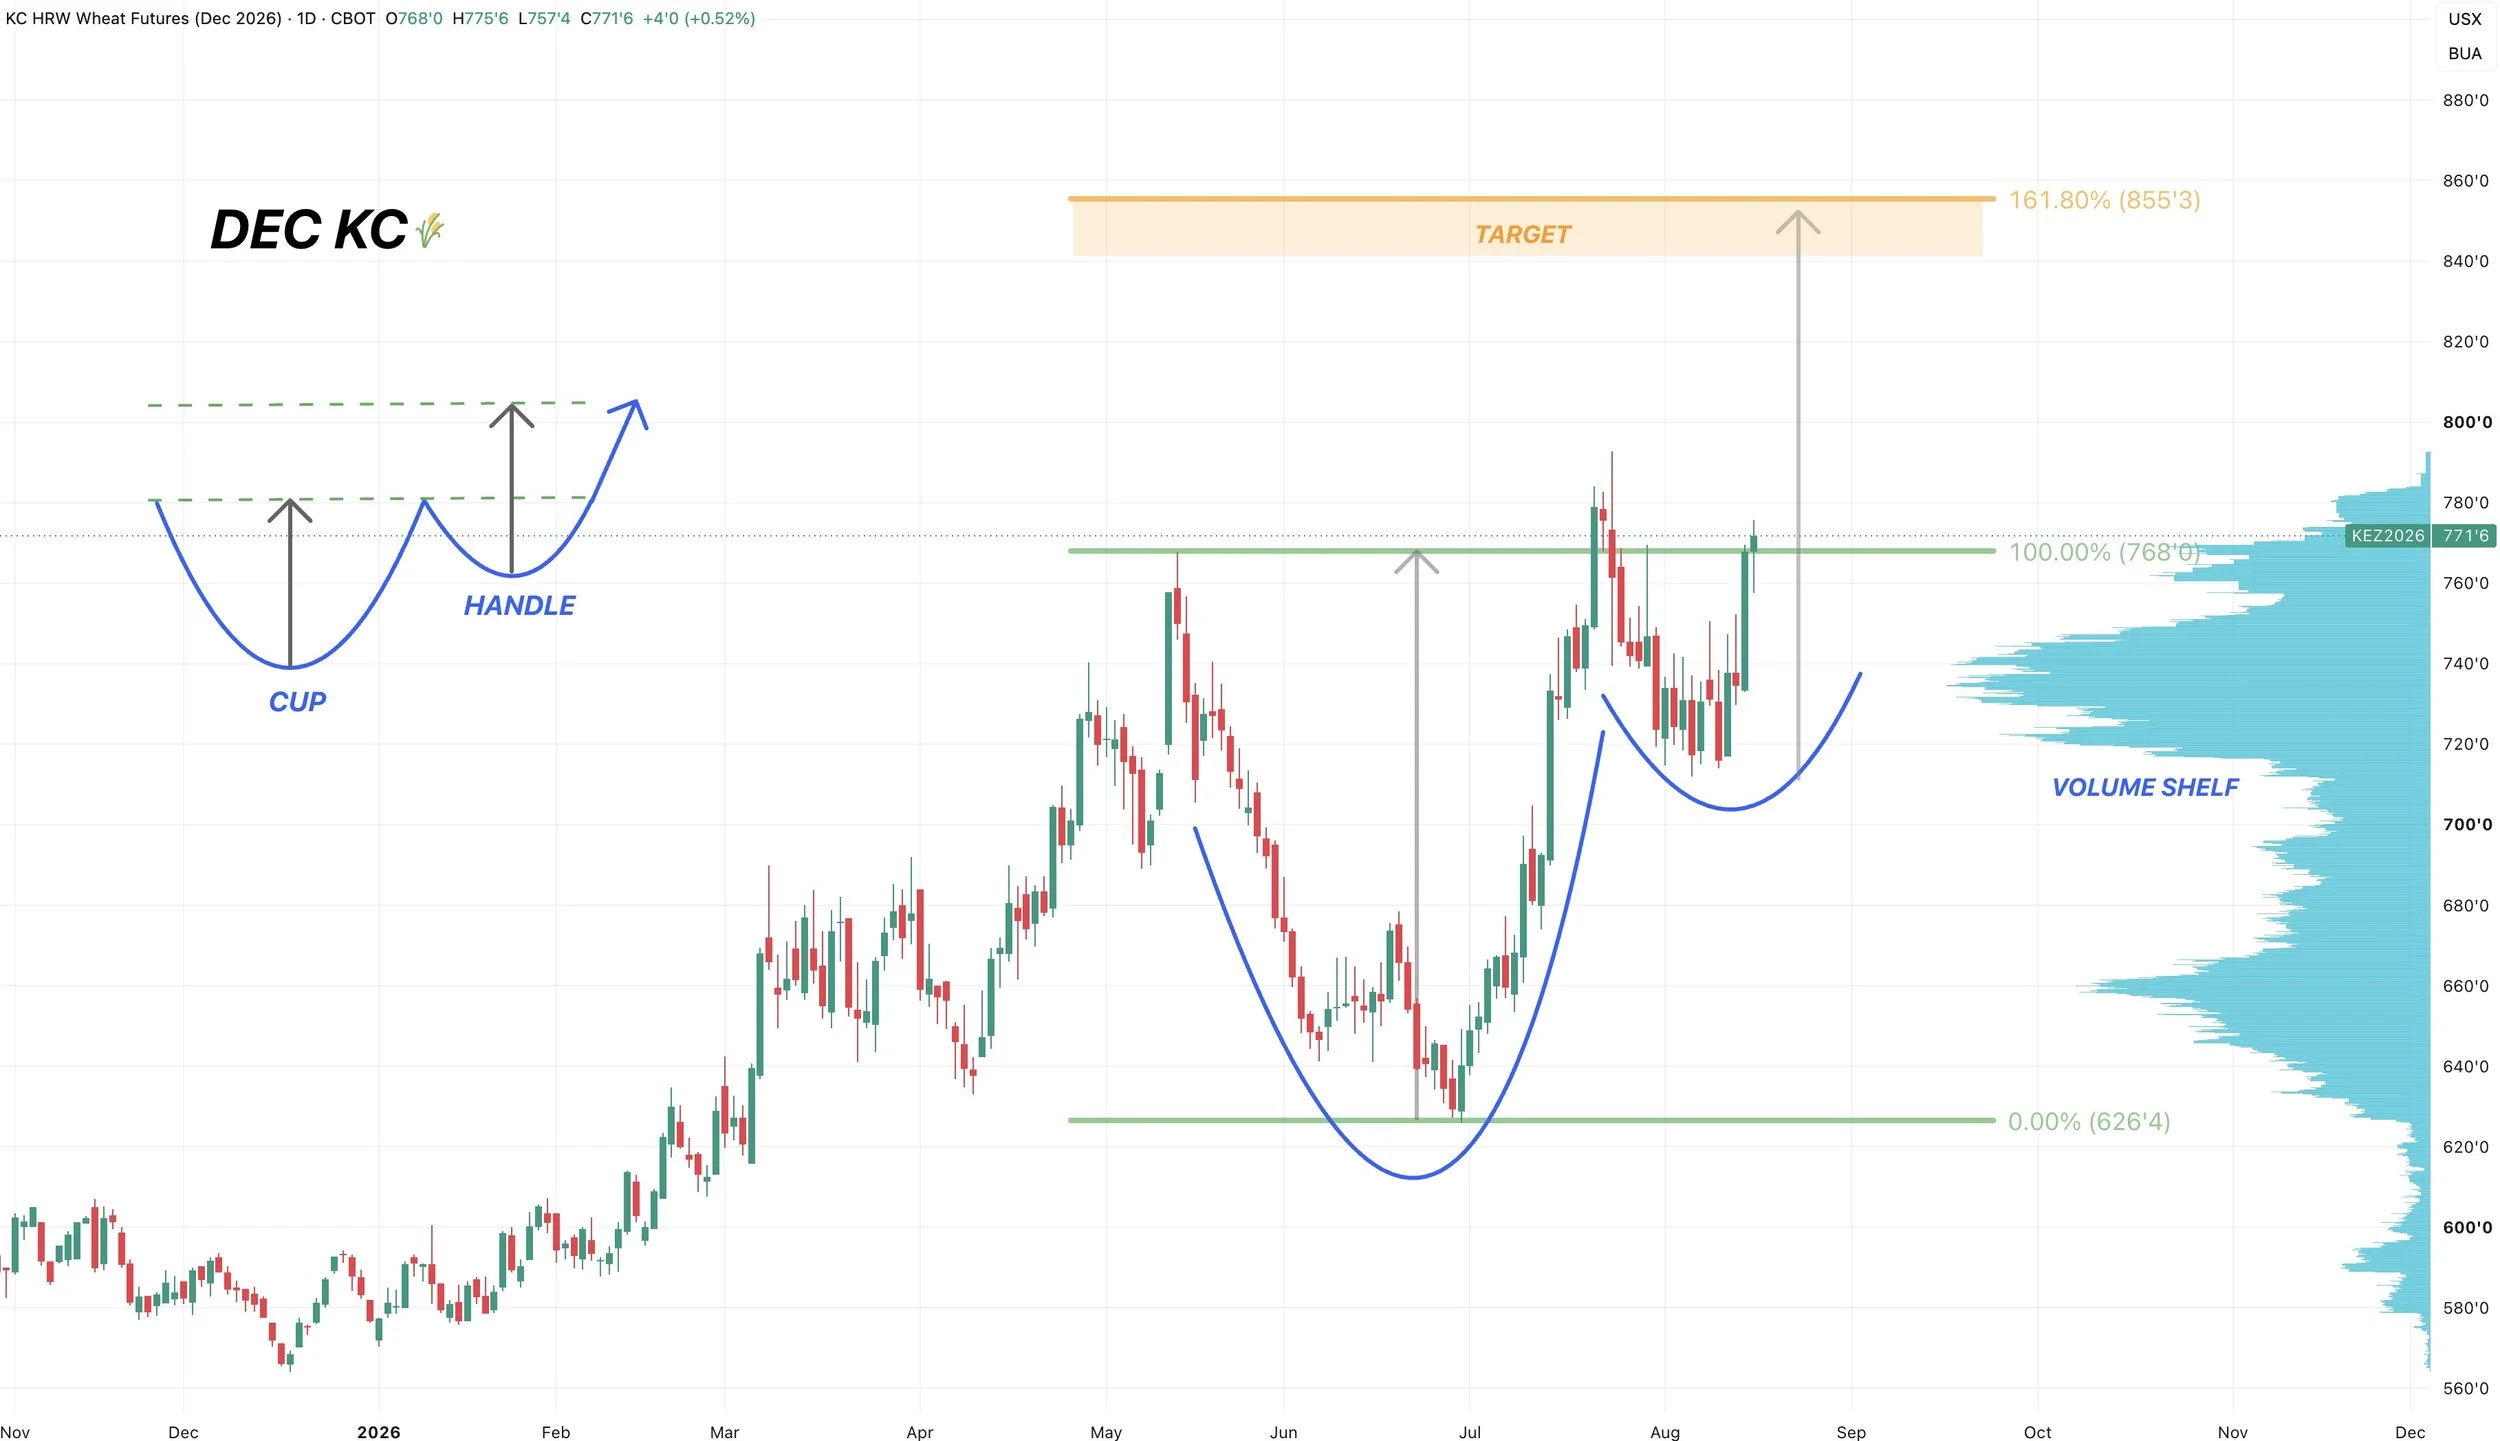
Dec KC Wheat 🌾
We blasted off that volume shelf and launch pad we had been talking about.
We are now up near some possible resistance here and those highs from July.
If we are able to bust through and post new highs, I have a target of $8.40 to $8.50
Which would be the golden fib and the implied move from this cup and handle pattern we have. But for this to be vaild, we of course need to post new highs.
That target is also subject to change, but is my long term target for now.
Dec Chicago 🌾
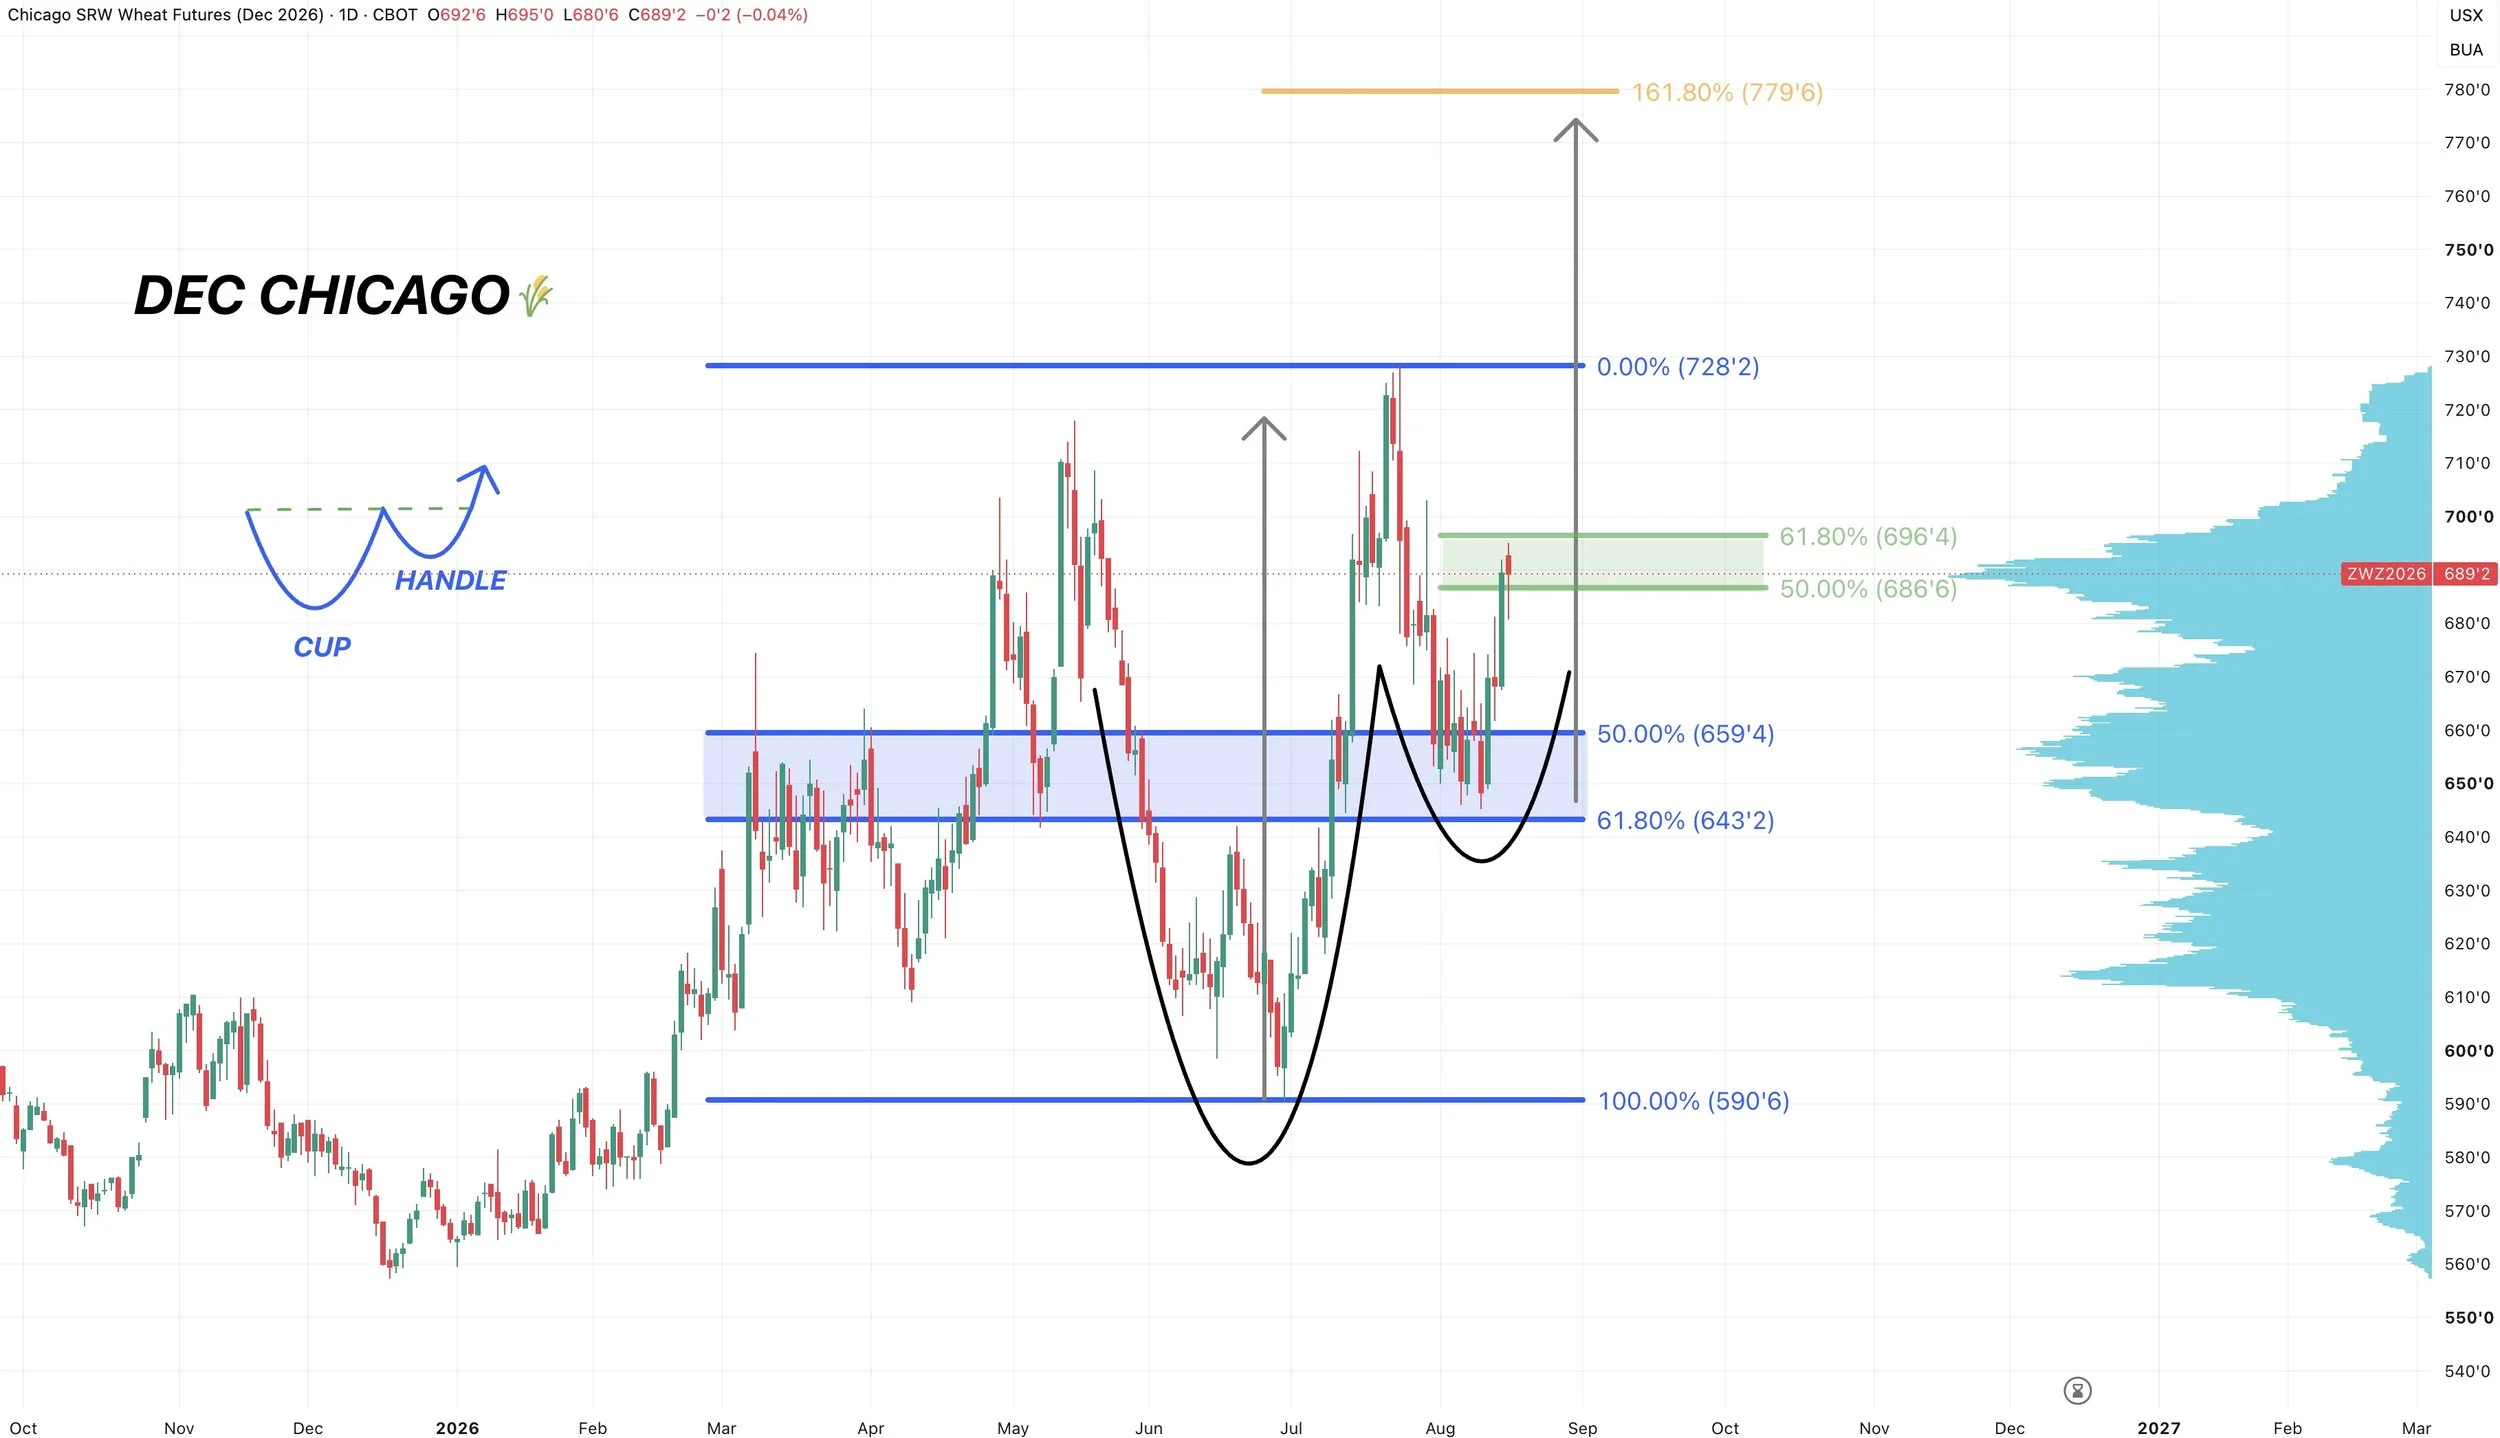
We bounced right in that golden zone where we wanted to see us find a bottom. Also sitting in a potential cup and handle pattern here as well.
Chicago is at some resistance here.
We've clawed back 50-61.8% of the entire sell off.
This same level is peak volume. So we could struggle here.
However, if we break above, the next resistance is those highs.
Want to Talk?
Our phones are open 24/7 for you guys if you ever need anything or want to discuss your operation.
Jeremey & Office: (806)484-1214
Sebastian: (605)280-1186
Email: sfrost@dailymarketminute.com
Hedge Account
Interested in a hedge account? Use the link below to set up an account or shoot us a call.