
USDA & WHEAT LIMIT UP
MARKET UPDATE
You can scroll to read the usual update as well. As the written version is the exact same as the video.
Timestamps for video:
USDA: 0:00min
Corn: 7:50min
Beans: 10:30min
Wheat: 13:55min
Cattle: 16:55min
Want to talk?
Office: (806)484-1214
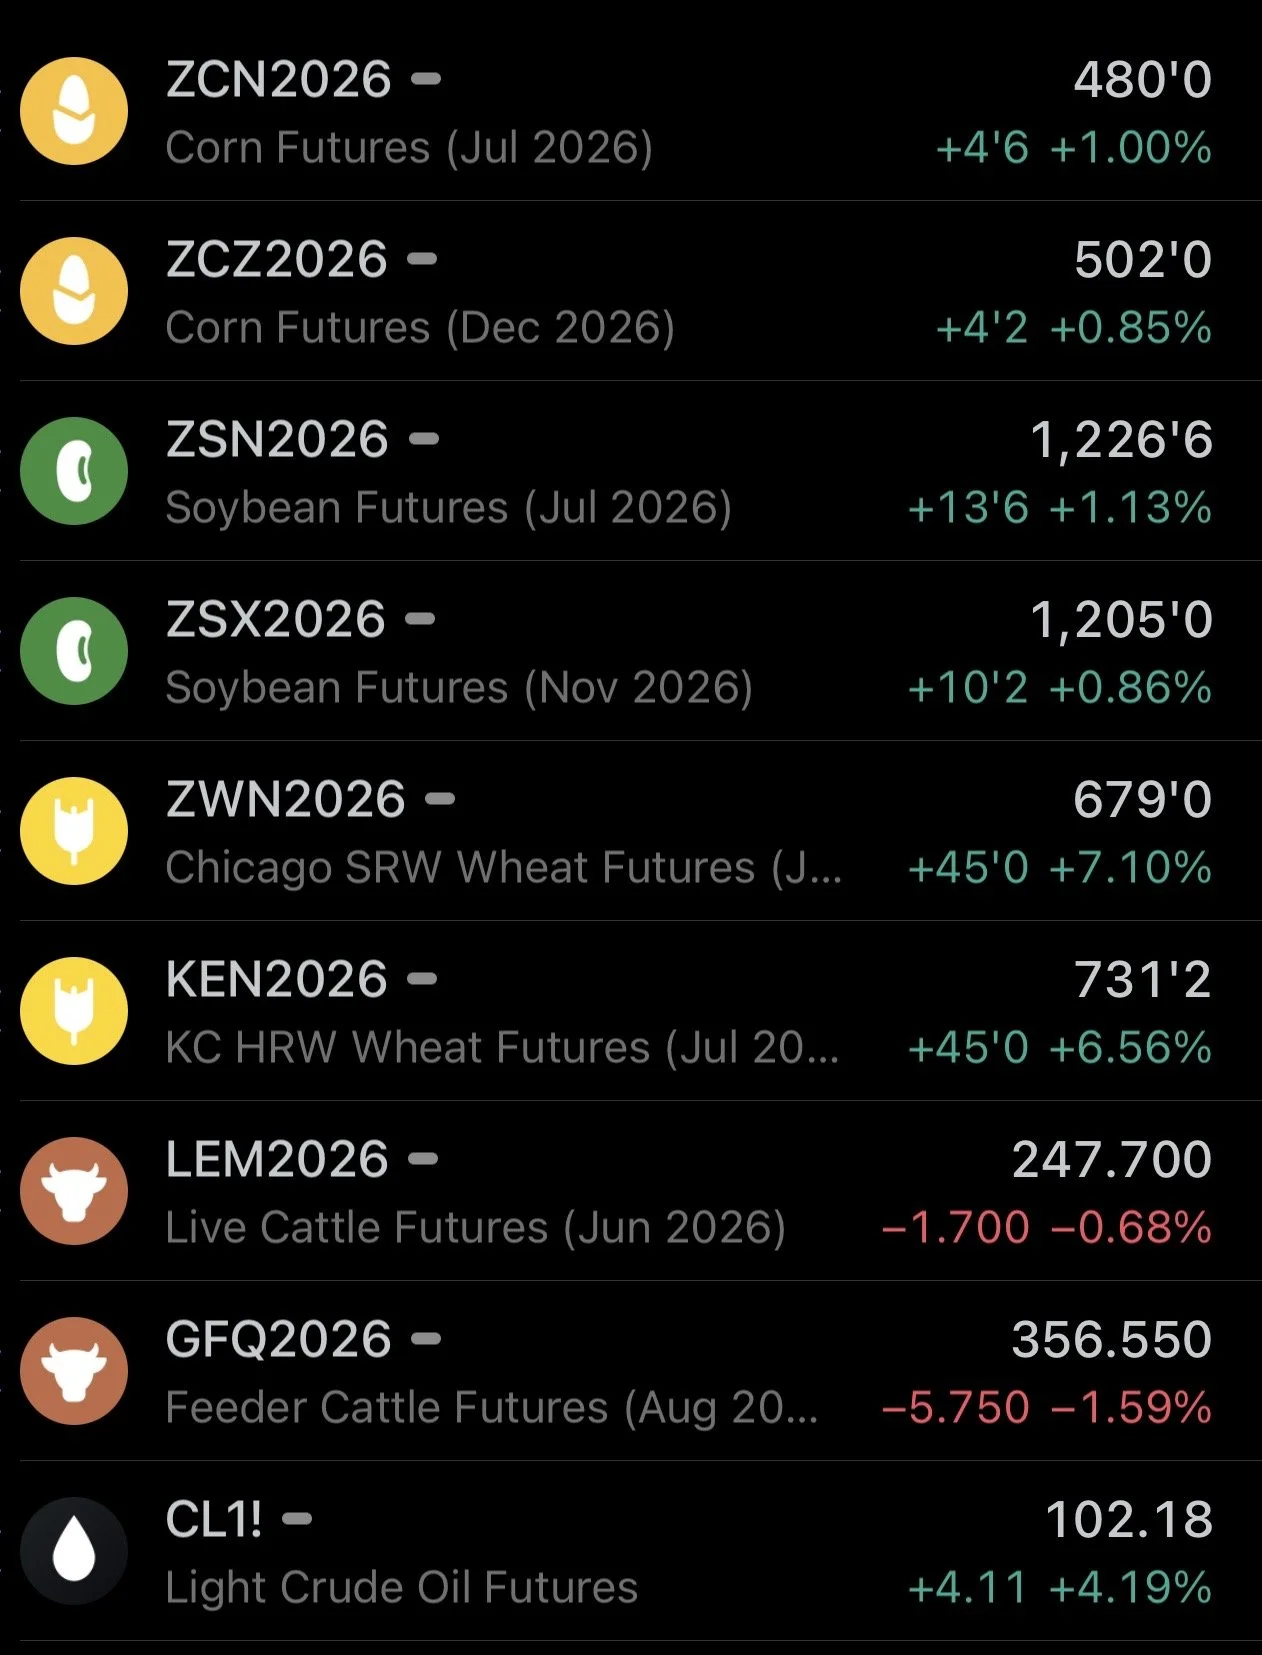
Futures Prices Close
Overview
Great day for the grains today following the USDA report, with wheat leading the way higher. As wheat traded limit up today. Synthetically, we are actually trading higher than where we closed at.
Meanwhile, the cattle market took a hit on the chin today, continuing it's recent weakness.
For the first time in years we had new crop corn close above $5, beans close above $12.00, and wheat close above $7.00
We still have the Trump and China meeting that is scheduled to take place around 10:00am China time on Thursday.
So if you're in central time here in the US that is around 9:00pm on Wednesday night. So we should have a good amount of details come Thursday morning.
Today was all about the USDA report, where the wheat market caught a massive bid. Wheat was trading over a dime higher before the report due to the drop in crop conditions, but the USDA added fuel to the fire.
Let's get right into the report.
USDA Recap
Carryout:
First let's look at carryout for both old crop as well as new crop.
We got our first offical looks at the new crop balance sheets.
Old crop wasn’t too interesting for anything. Corn was slightly higher and beans were slightly lower.
The surprises came in new crop.
New Crop Corn
Today: 1.957
Estimate: 1.933
Old Crop: 2.142
Corn came in right around the expections, but is expected to see a sizeable drop from last year of course due to less acres and lower yield.
New Crop Beans
Today: 0.310
Estimate: 0.365
Old Crop: 0.340
Soybeans had a friendly surprise here. Carryout came in over 50 million bushels lighter than the trade was expecting. Which would result in carryout actually being less than last year even with the increase we're going to see in acres.
New Crop Wheat
Today: 0.762
Estimate: 0.833
Old Crop: 0.935
This was a huge shock to the market. Wheat came in well below the trade estimates, and is projected to be 175 million bushels less than last year.

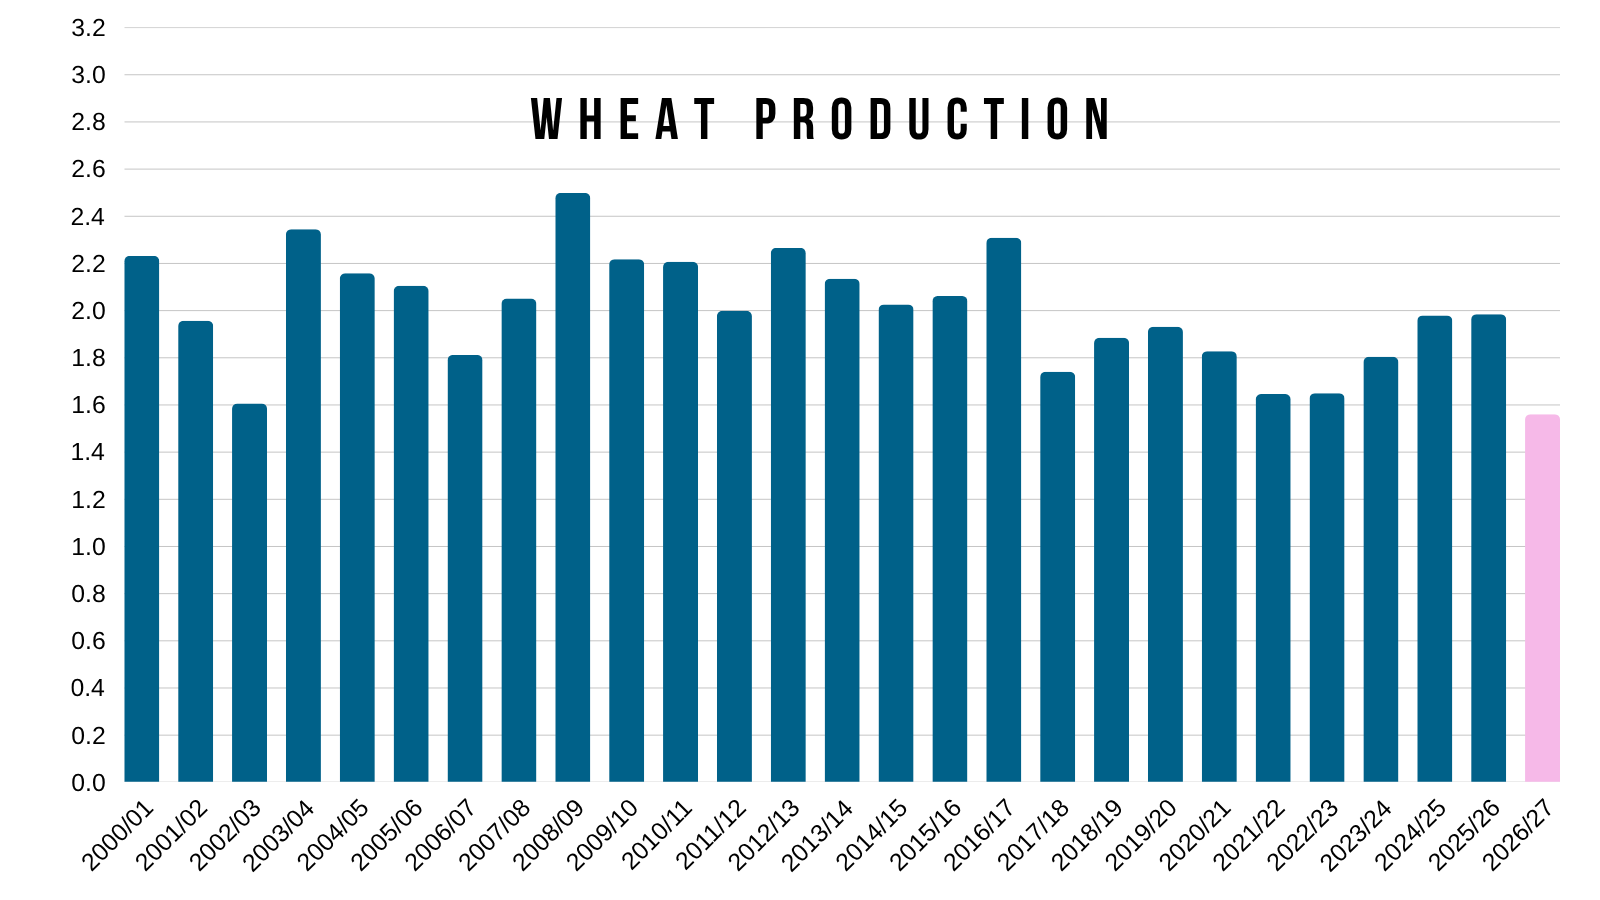
Wheat Production:
Here was where the big surprise came.
Wheat production came in at 1.56 billion.
The trade was expecting 1.74 billion.
Last year we had 1.99 billion.
That is over a -20% decrease from last year. Which is a huge decline.

Lowest Wheat Production Ever:
This would be one of the smallest wheat crops of all-time.
The smallest since at least before the year 2000.
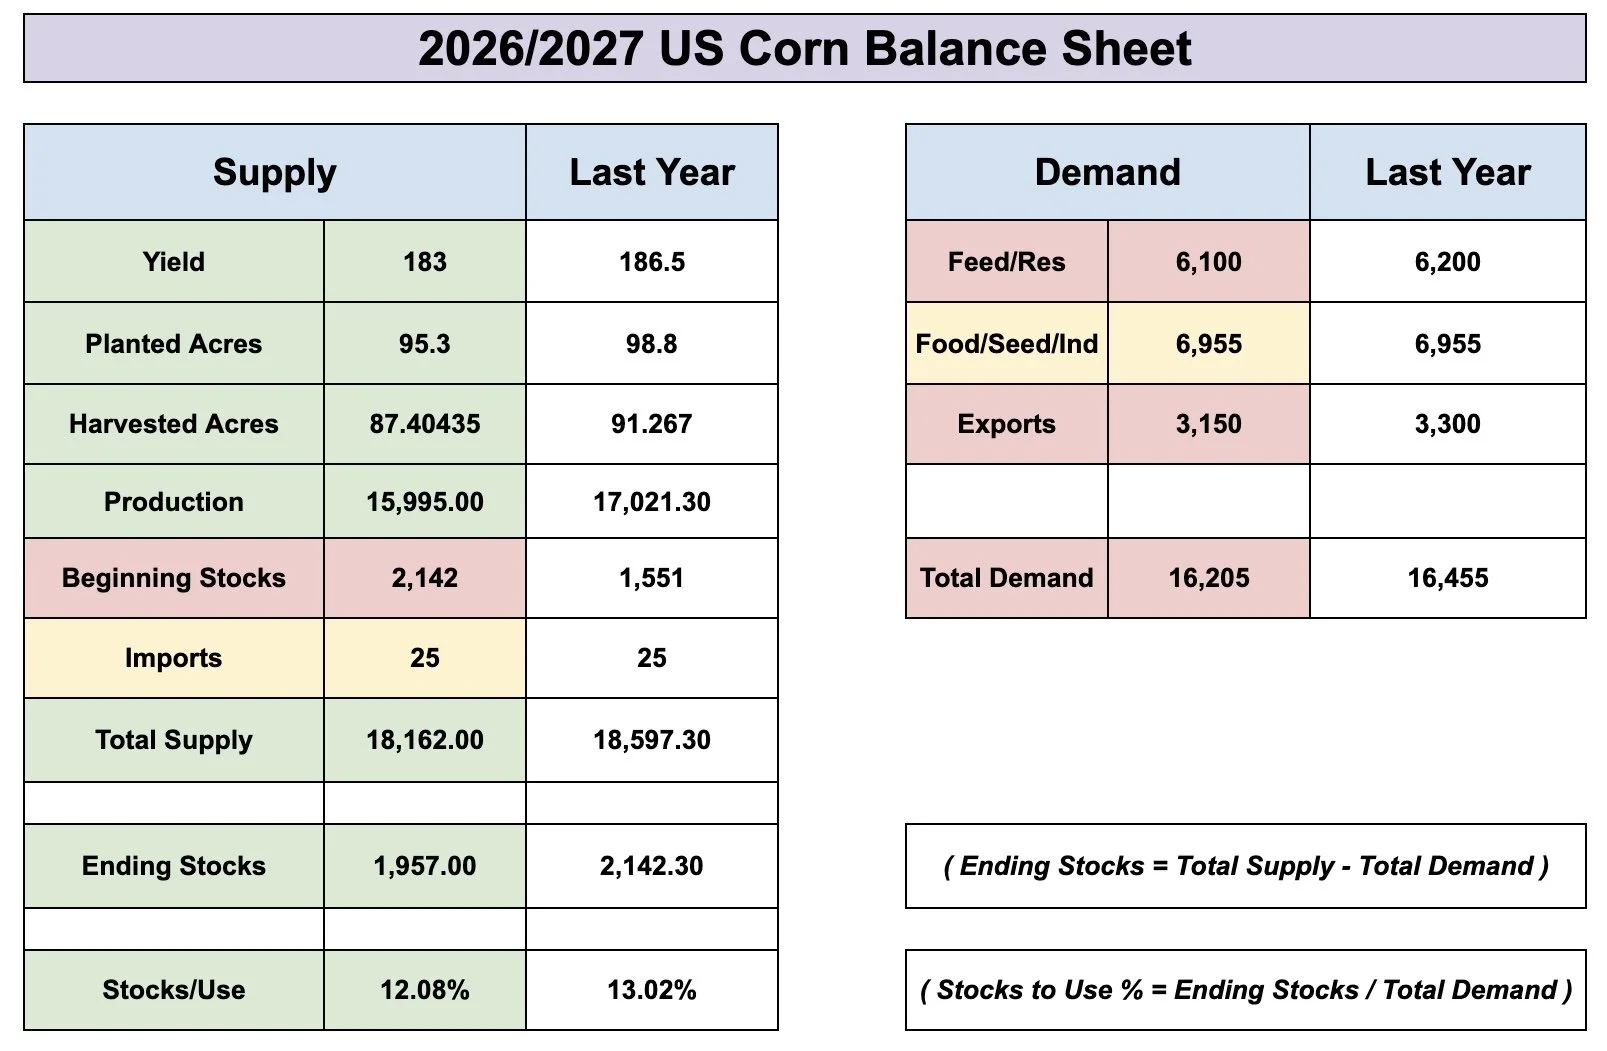
First New Crop Corn Balance Sheet:
As mentioned, we got our first balance sheets for new crop.
Here was what they had for corn, along with how it stacks up vs last year.
Green indicates a bullish change vs last year.
Yellow indicates no change.
Red indicates a bearish change.
Compared to last year, demand is expected to be 250 million bushels less than last year. But we are expected to have 435 million bushels of less supply. As a result carryout is expected to be about 185 million bushels less than last year.
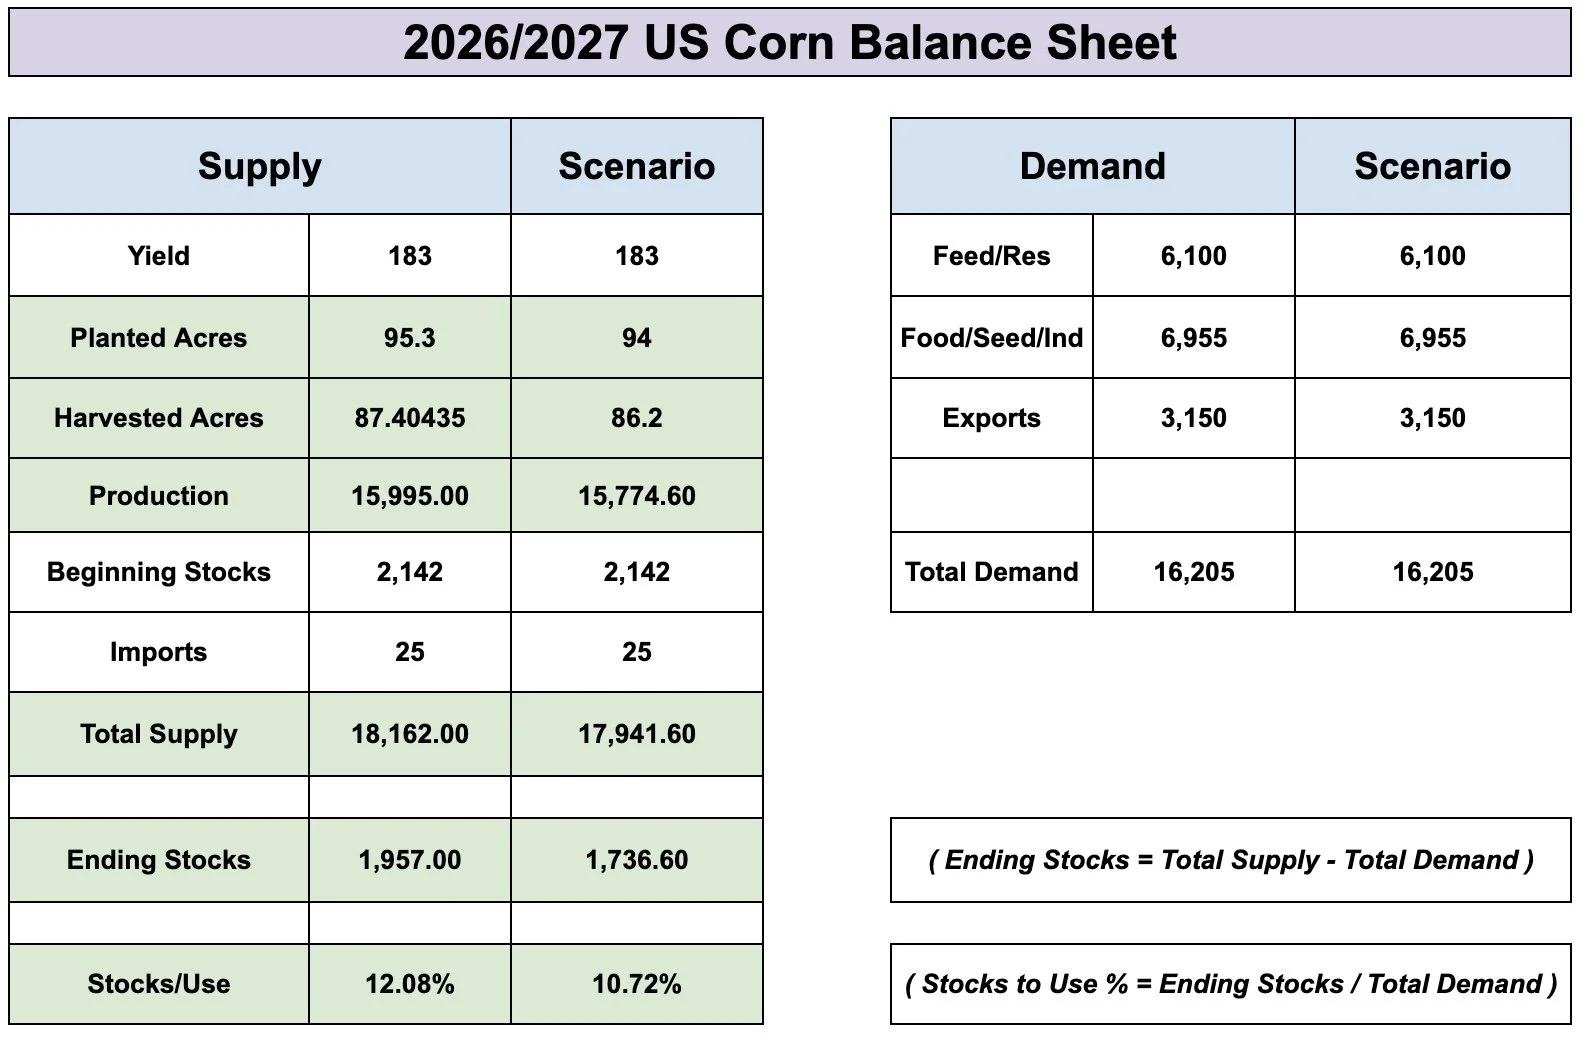
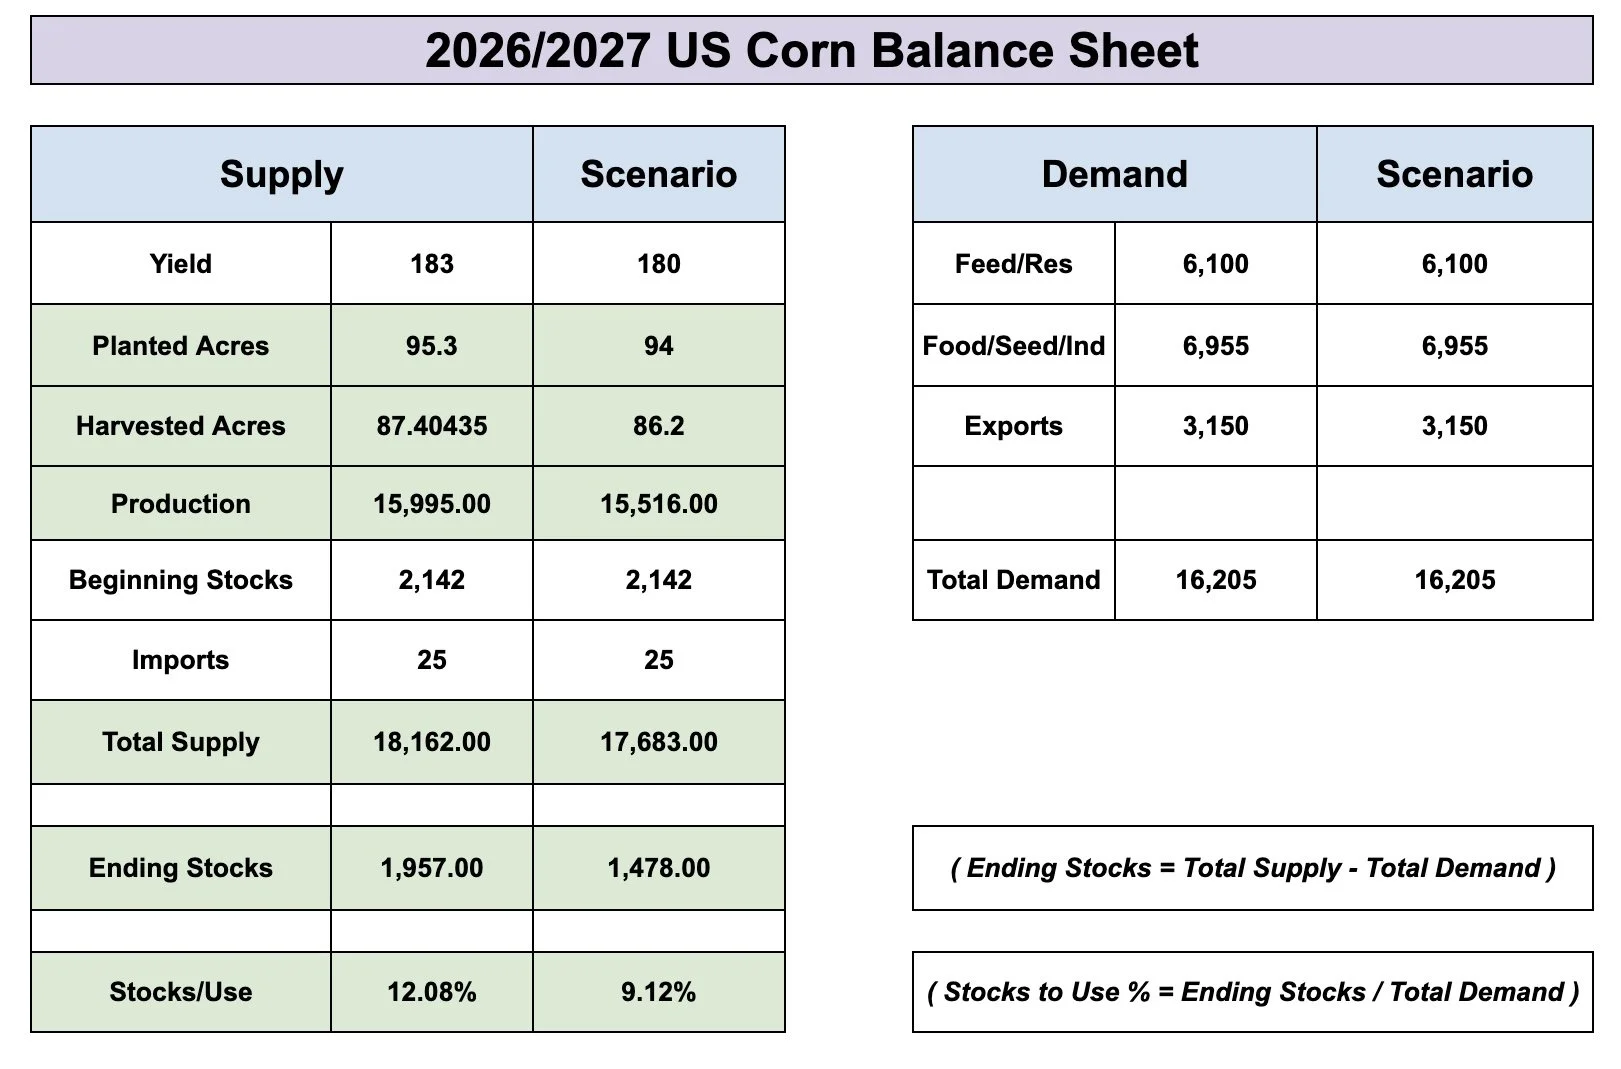
Corn Scenarios:
Now let's run through a few quick scenarios.
For these, I am leaving demand unchanged. If supply gets cut, the USDA will likely offset some of that supply loss by also cutting demand.
So the scenarios are not 1-for-1 perfect, but give you a good feel on how things can change and what impact acres and yield can have.
What happens if acres end up light?
I personally think acres are too high right now.
If you drop acres down to 94 million, even if you leave yield at 183 it paints a far more friendly scenario than we currently have projected.
It drops carryout by over 200 million more.
It brings that stocks to use ratio from 12% down to 10.70%.
Now what if acres are too high, while at the same time we don’t raise a perfect crop?
Here is what the balance sheet looks like if you drop acres down to 94 million and drop yield down to 180.
This brings the carryout to around 1.50 billion and gives you a sub 10% stocks to use ratio.
A stocks to use ratio of 10% or lower is typically what you need to see to have a market be considered in "bullish territory".
Again, cuts to demand will offset some of the supply losses, making it not as drastic. But you get the idea.
If acres and yield end up being too high, there is some potential in new crop.
I am not saying the potential has to happen, I am simply saying it's possible.
Unlike in old crop, where the situation is clearly bearish and doesn’t have a path to becoming mega-bullish.
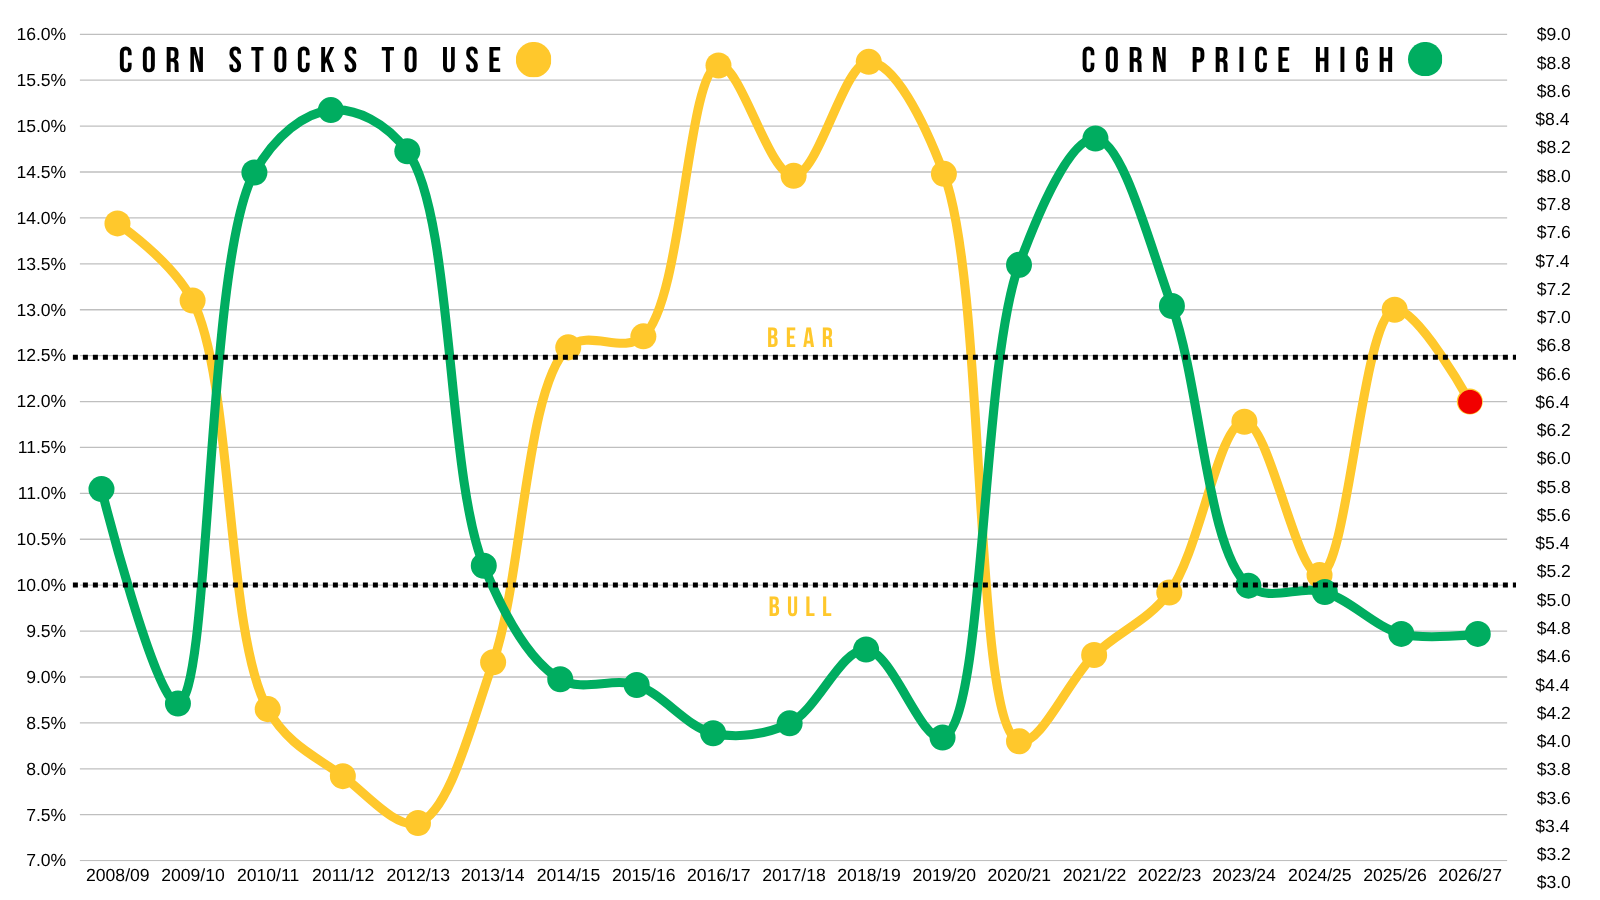
Here is an update on that chart I show all the time when looking at how the stocks to use ratio stacks up vs corn's highest price of the year.
Again, normally to get corn much above $5.00 you need a stocks to use ratio below 10%.
Currently, the old crop situation doesn’t have that. The old crop situation is still considered to be in bearish territory.
The new crop story on the other hand is currently not considered super bullish, but there is a possible path down the road for this to change.
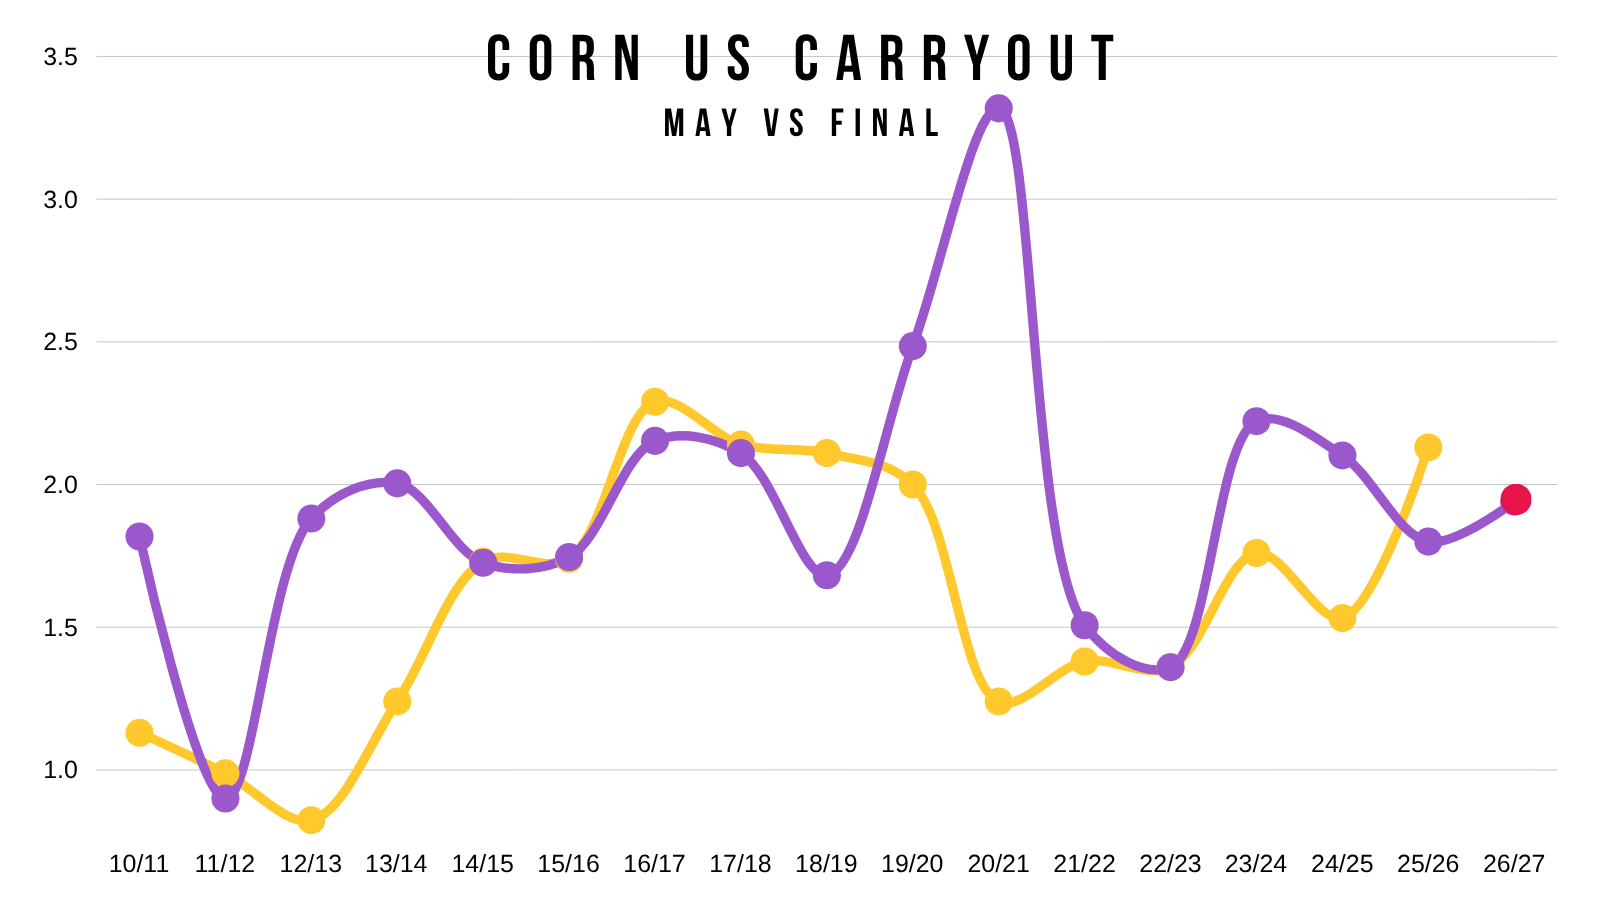
Corn May vs Final Carryout:
I did want to note that historically, our final carryout does typically tend to be less than where the USDA originally pegs in May.
Last year was the first time since 2018 where it actually ended higher than the starting point.
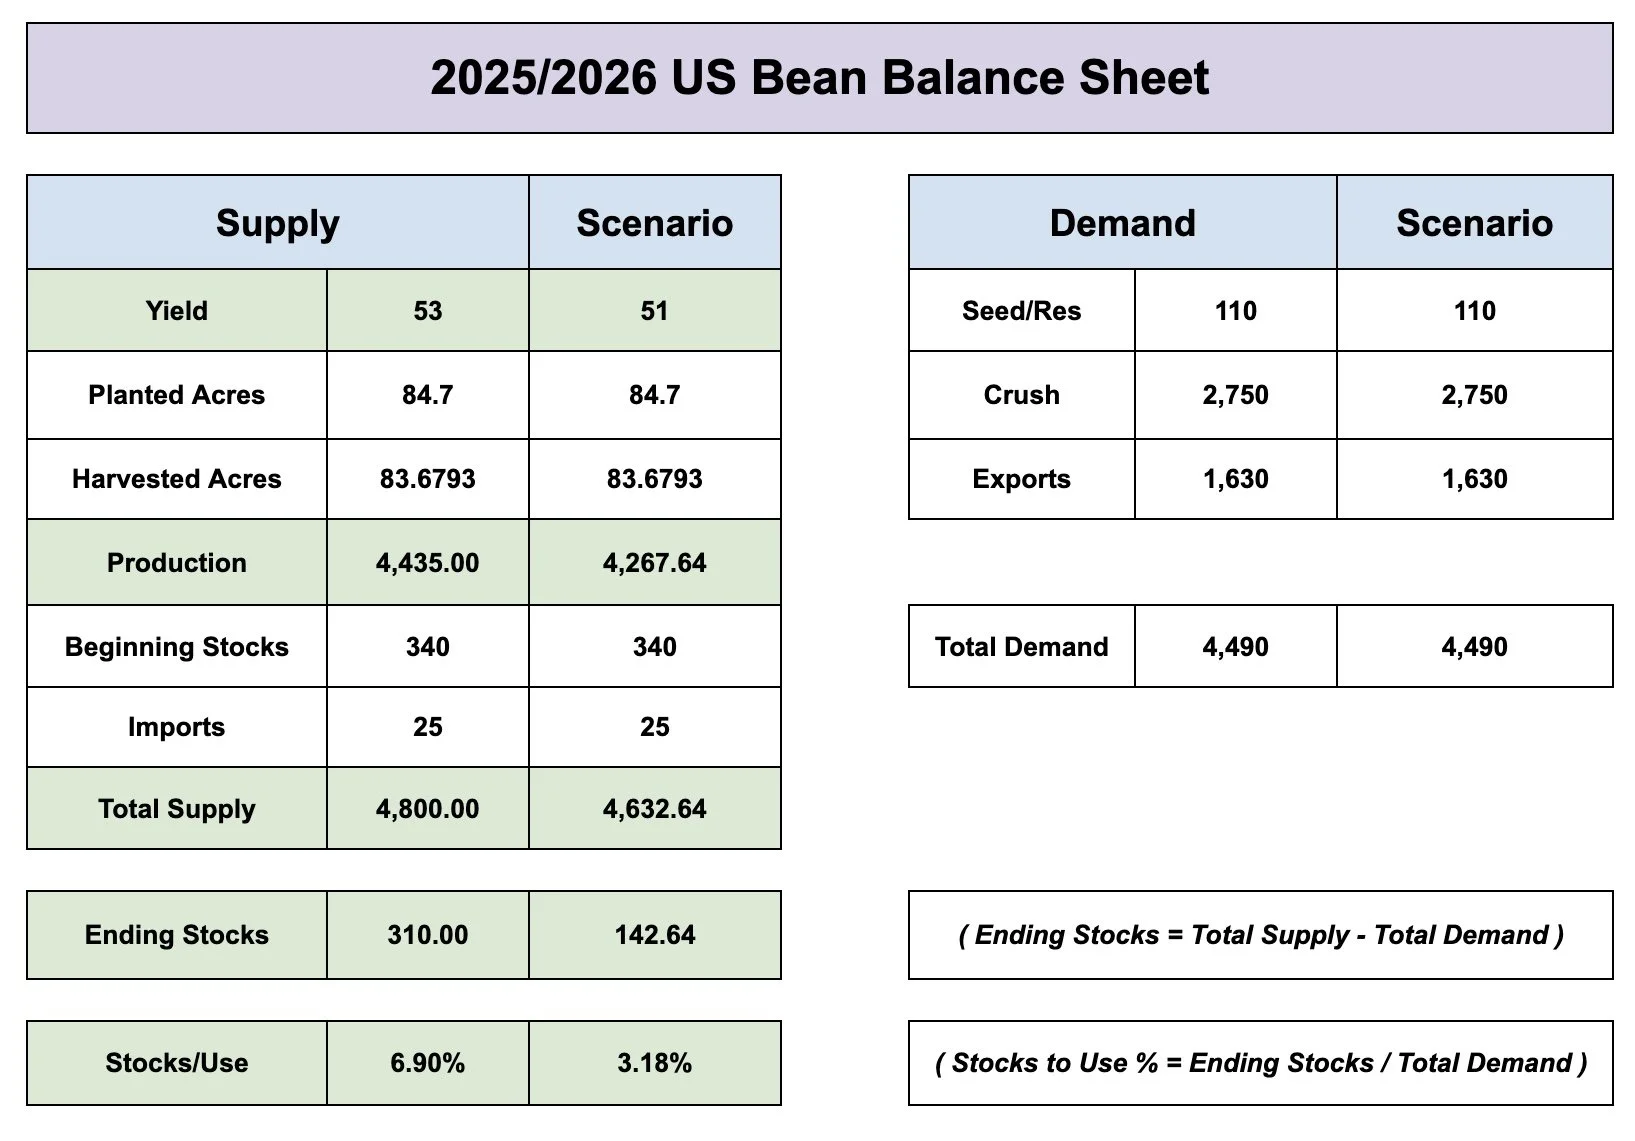
First New Crop Bean Balance Sheet:
Here is the new crop soybean balance sheet and how it stacks up vs last year.
Even with the higher acres, our carryout is actually expected to be lower than last year.
We are expected to have around 190 million bushels of more supply than last year.
But demand is expected to be over 220 million more than last year. Due to the big bumps in both crush demand as well as exports.
As a result, carryout is expected to be down 30 million vs last year.
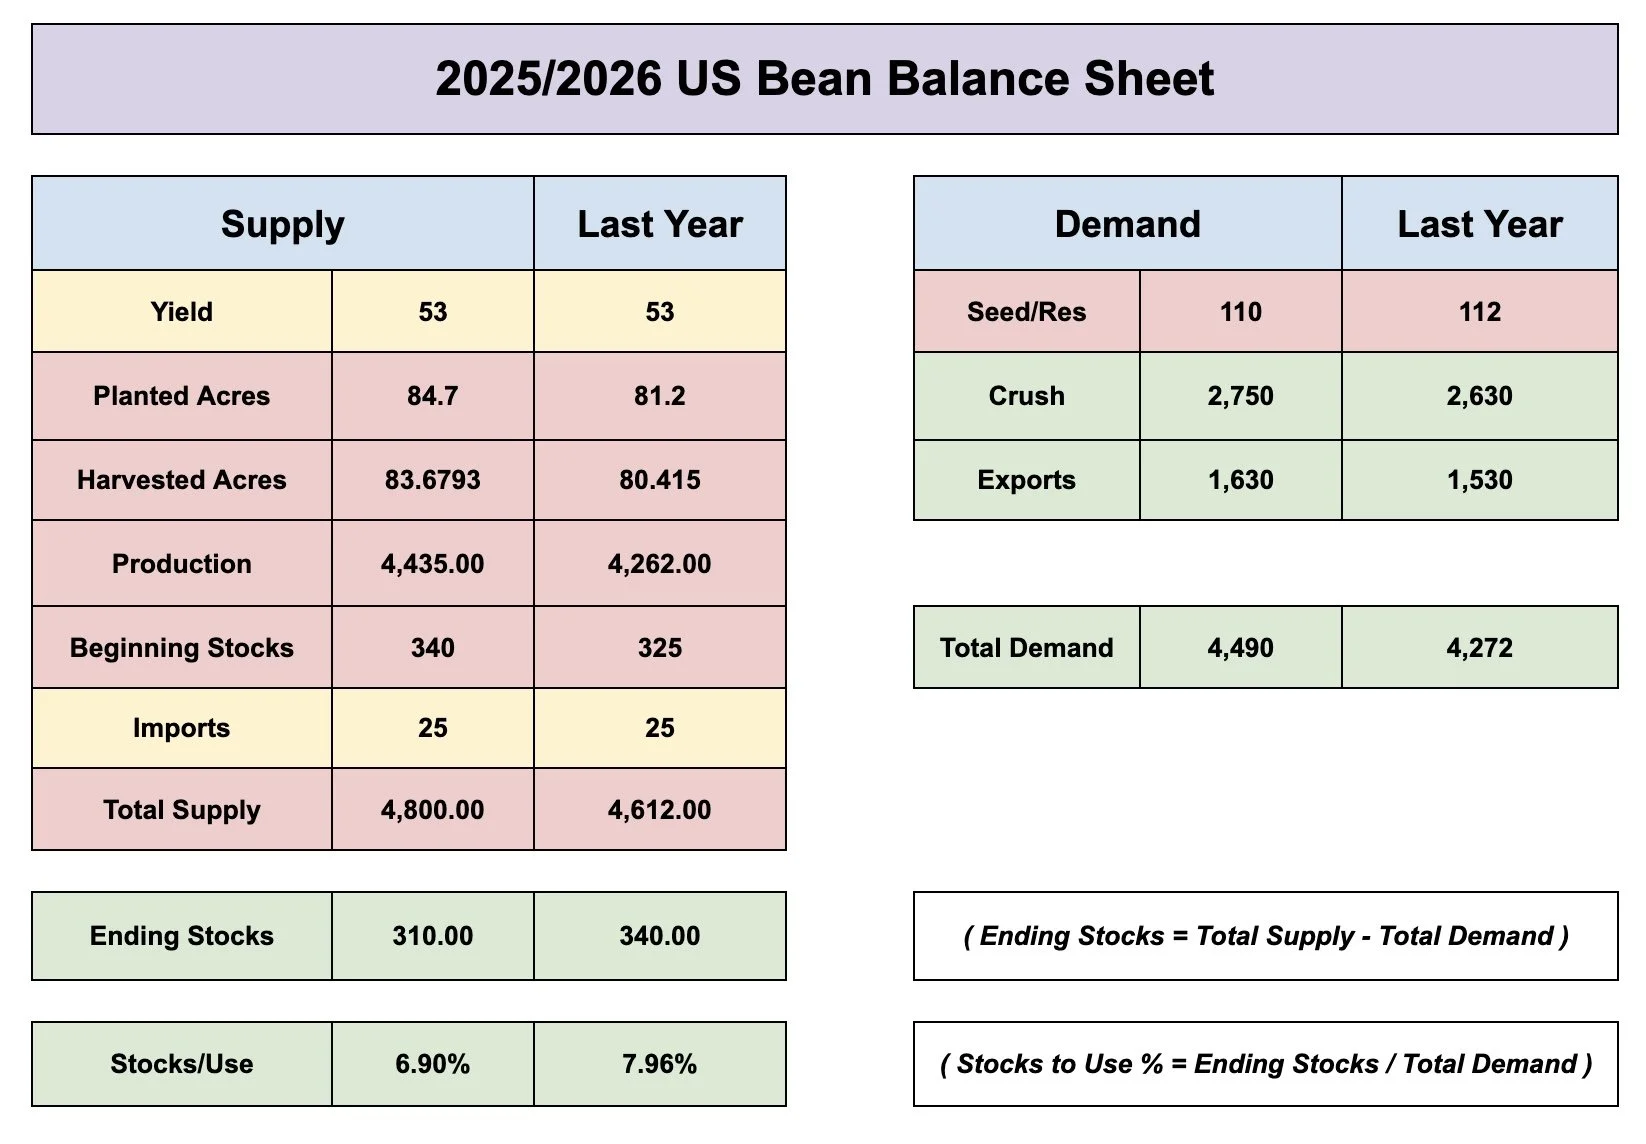
Bean Scenario:
My intial thoughts here were, what if yield is a few bushels an acre less than last year's record 53?
If you drop yield down to 51 bpa instead, it immediately cuts that carryout in half. That is how impactful yield is on the balance sheet.
No this again does not account for any changes to demand. And if corn acres are too high, there is a chance beans acres are too low.
But even with a 53 bpa yield and higher acres, carryout is expected to be lower than last year.
So I'd say there is a potential story there if we don’t manage to raise yet another record yield.
World Numbers:
These also provided a decent surprise in the report.
New Crop Corn
Today: 277.54
Estimate: 289.53
Last Year: 296.95
The corn number was a big friendly surprise. I'll touch on this more, but that is a massive year over year decline of 22 MMT. And was a much larger cut than the trade was expecting.
New Crop Beans
Today: 124.78
Estimate: 126.29
Last Year: 125.13
Soybeans surprised slightly lower, but not to the extent as corn did.
New Crop Wheat
Today: 275.04
Estimate: 280.84
Last Year: 279.21
Wheat also surprised low.

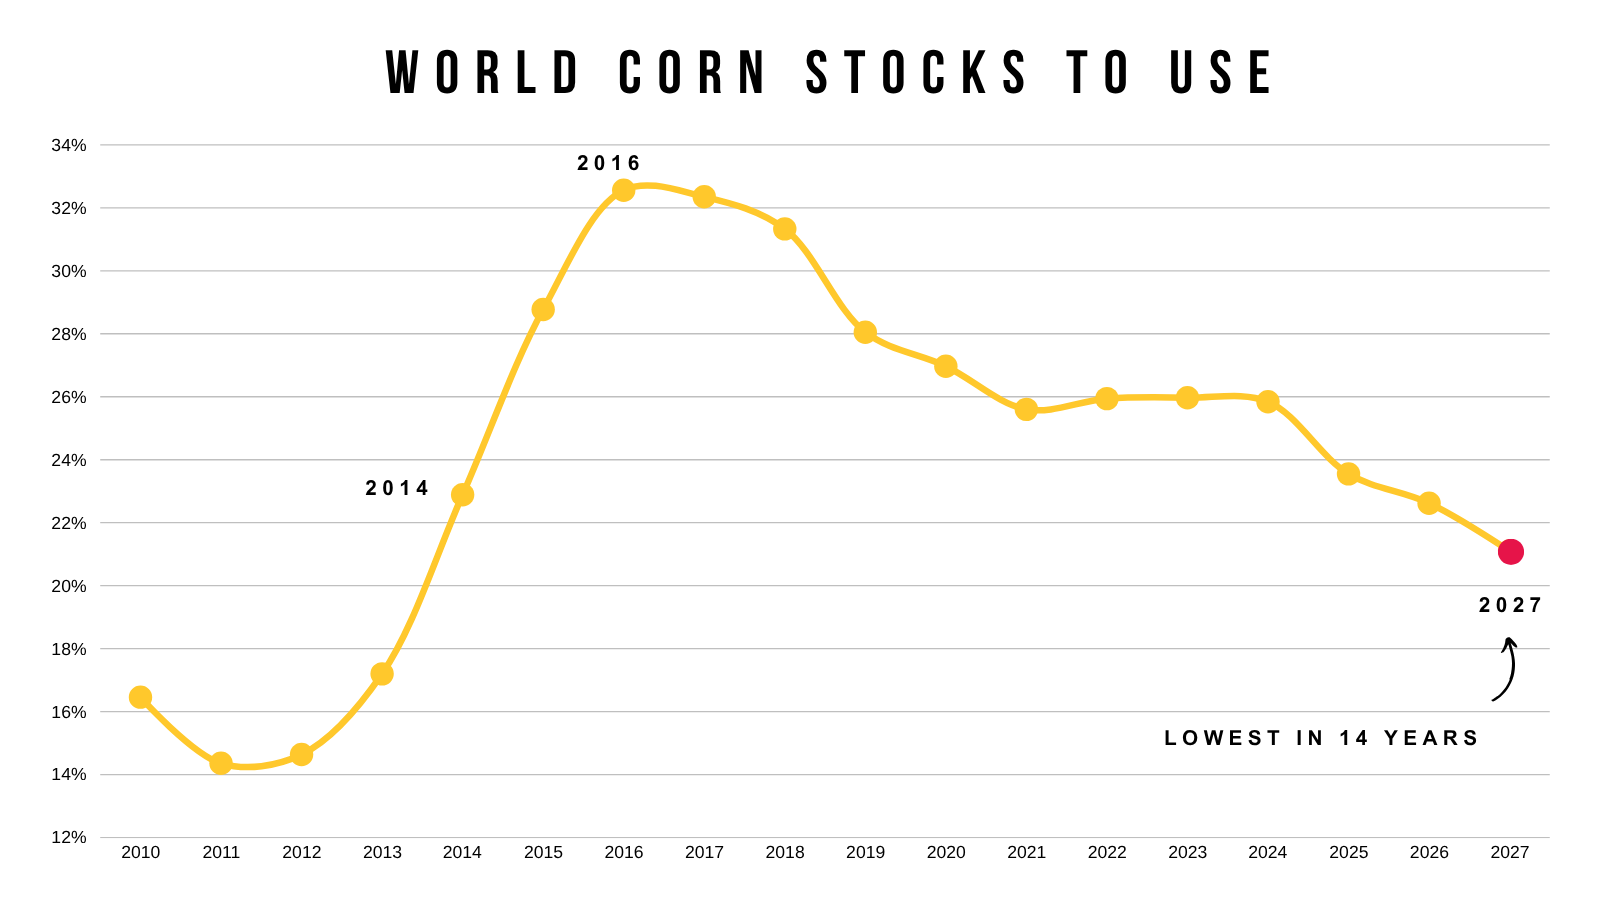
The World Needs US Corn to Perform:
Today's report reaffirmed that world corn stocks continue to dwindle despite ample supplies here in the US.
The world corn stocks to use ratio is now sitting at 14 year lows.
Continuing to fall year over year.
This is even with a big crop here in the US and the USDA even raising their South America production estimates.
Does this matter a whole lot if the US has a bumper crop? No.
What this does mean is that the US absolutely has to perform. Because the world simply cannot afford a sub par US crop.
The world needs our corn.
Today's Main Takeaways
Corn
The report wasn’t considered bullish, altough the world numbers were a friendly surprise.
For now, the US has plenty of supply, but that doesn’t mean the story can’t change down the line for new crop.
Wheat was limit up today. Corn was only up a nickle. That's evidence that the old crop story isn’t wildly bullish for now.
Overall, still looking to put our marketing hats on here real soon.
As historically, unless we see an issue with this crop, the next 30-45 days is that seasonal window where we usually make our highs for the year.
The biggest factor short term has to be the China meeting. If they agree to buy some corn, the story completely changes for corn.
That would be one possible way you run into a situation like the last trade deal. Which eventually led to the bull market.
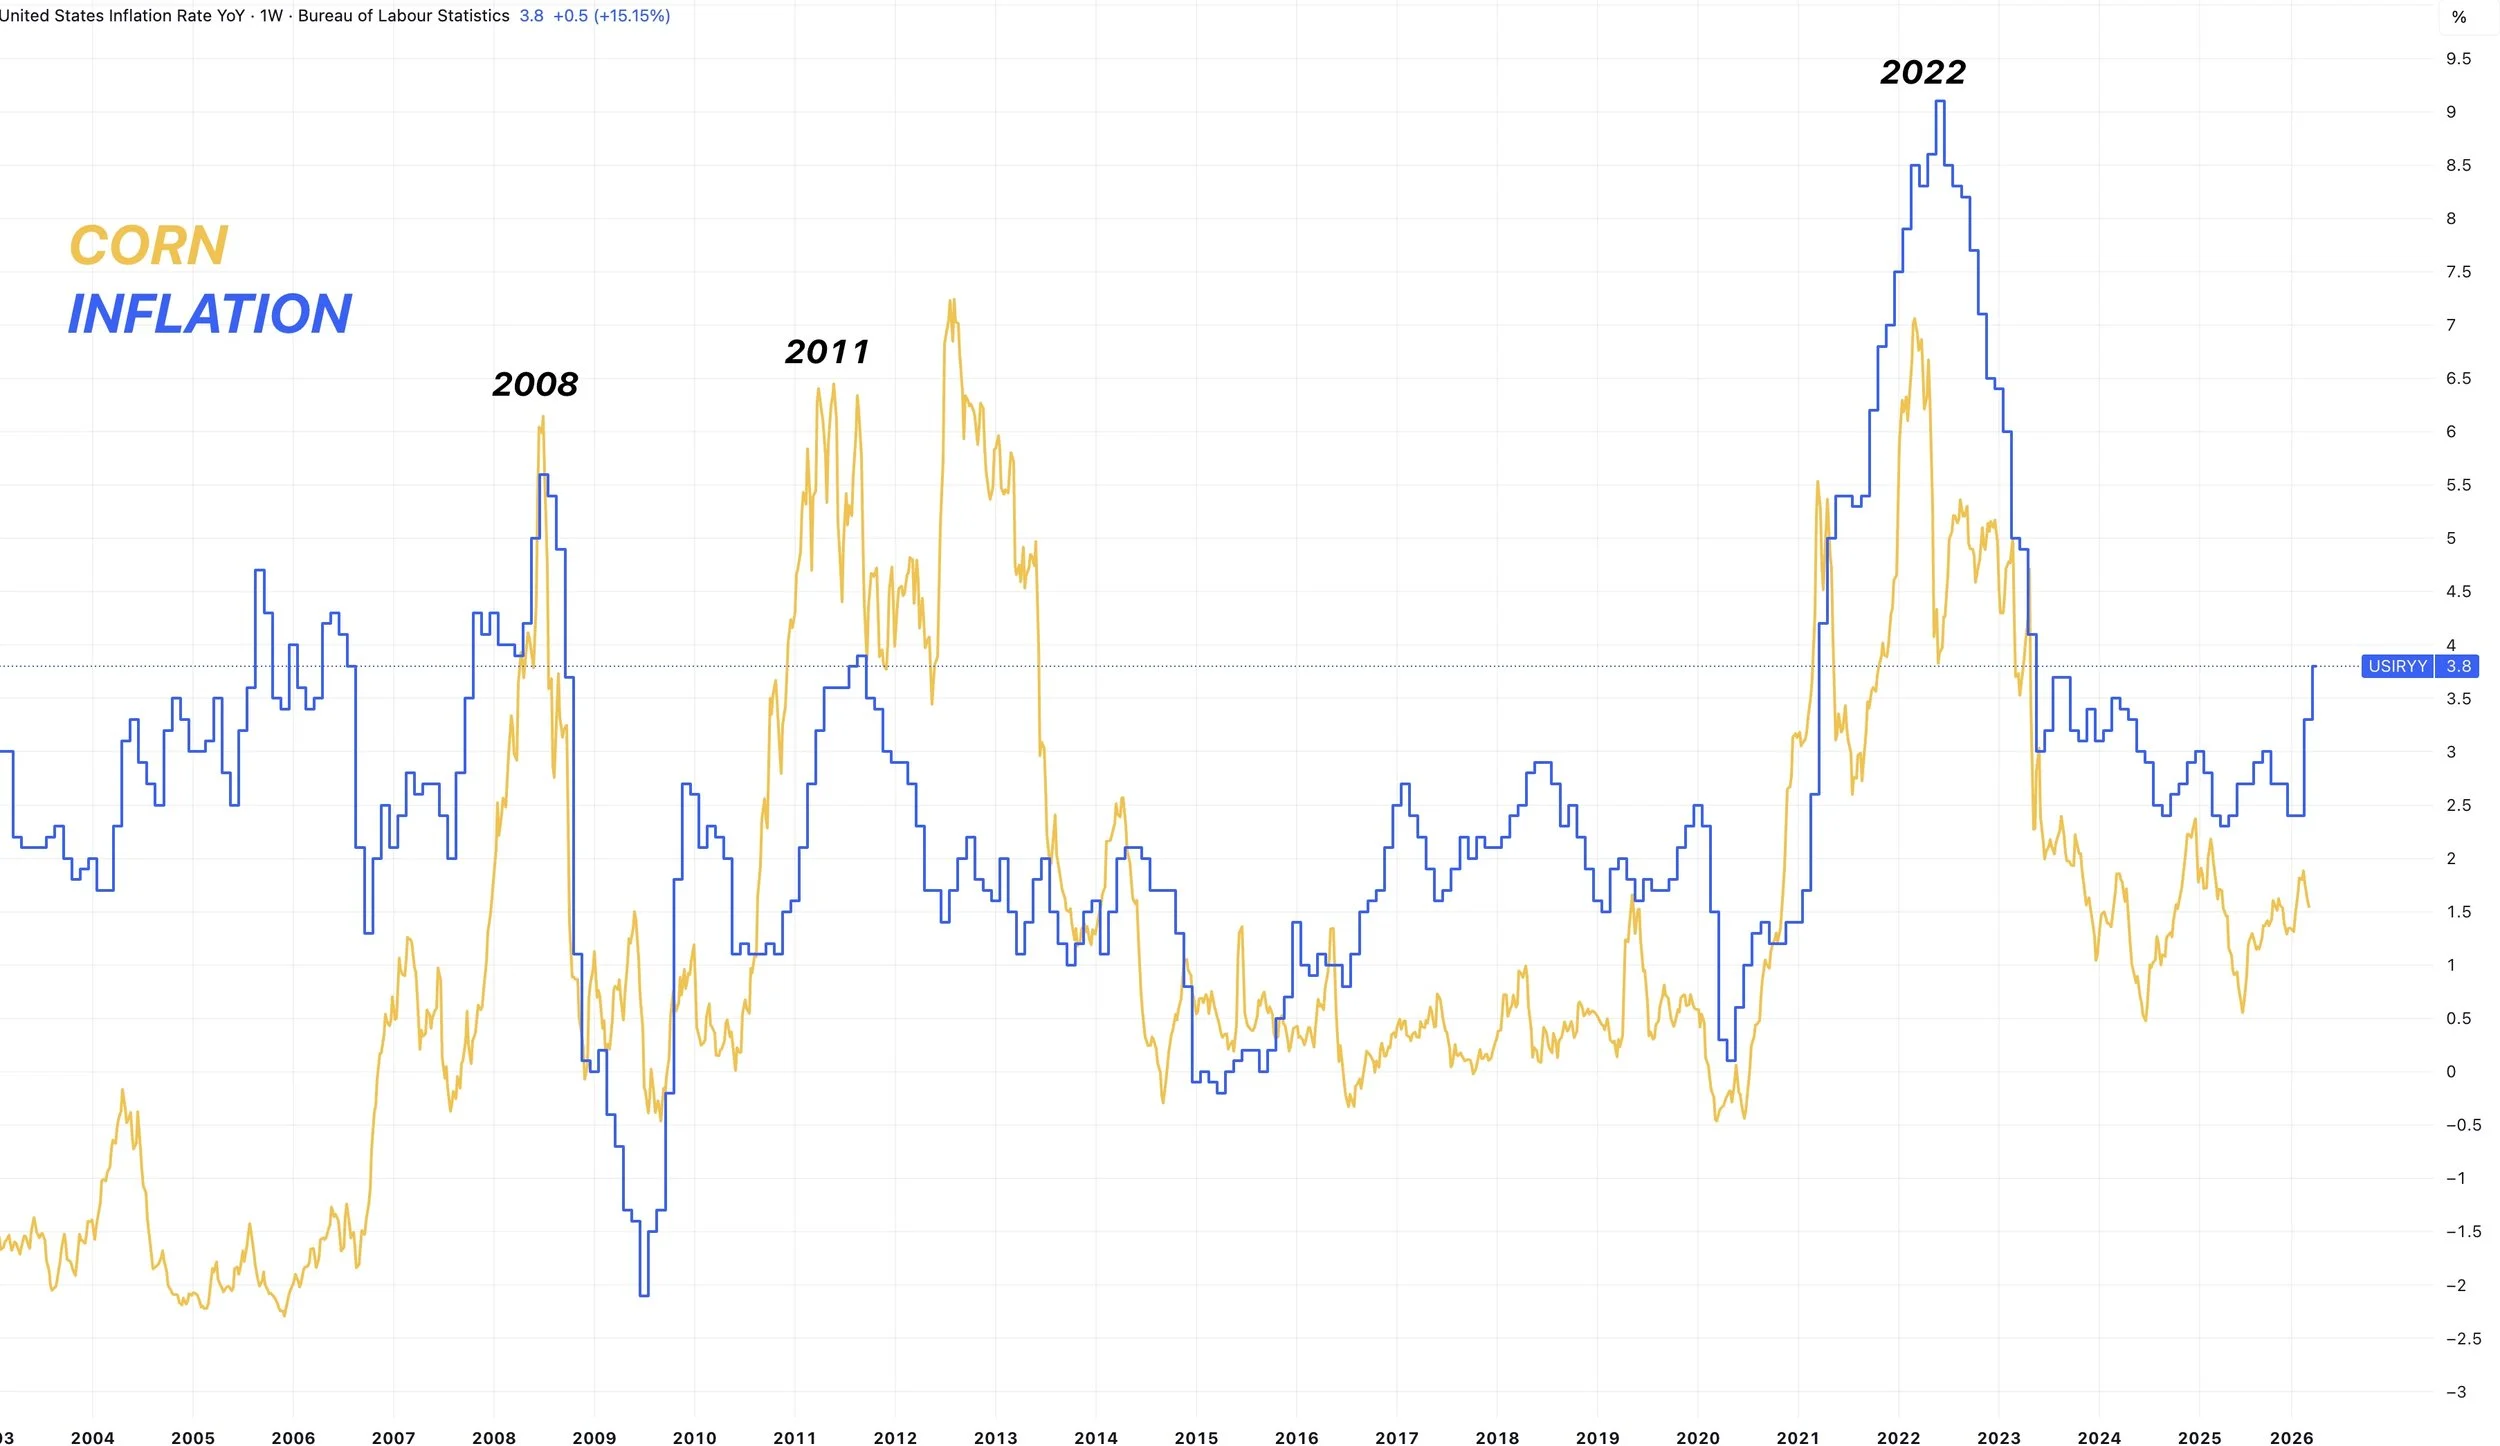
Inflation:
Inflation came in at 3.8% today.
That is up from 2.4% at the start of the year.
Might not matter much right now, but IF inflation continues to jump higher.. you could argue grains should follow higher.
Something to note is that every bull market featured a spike in inflation.
Could potentially be a longer term factor to keep your eyes on.
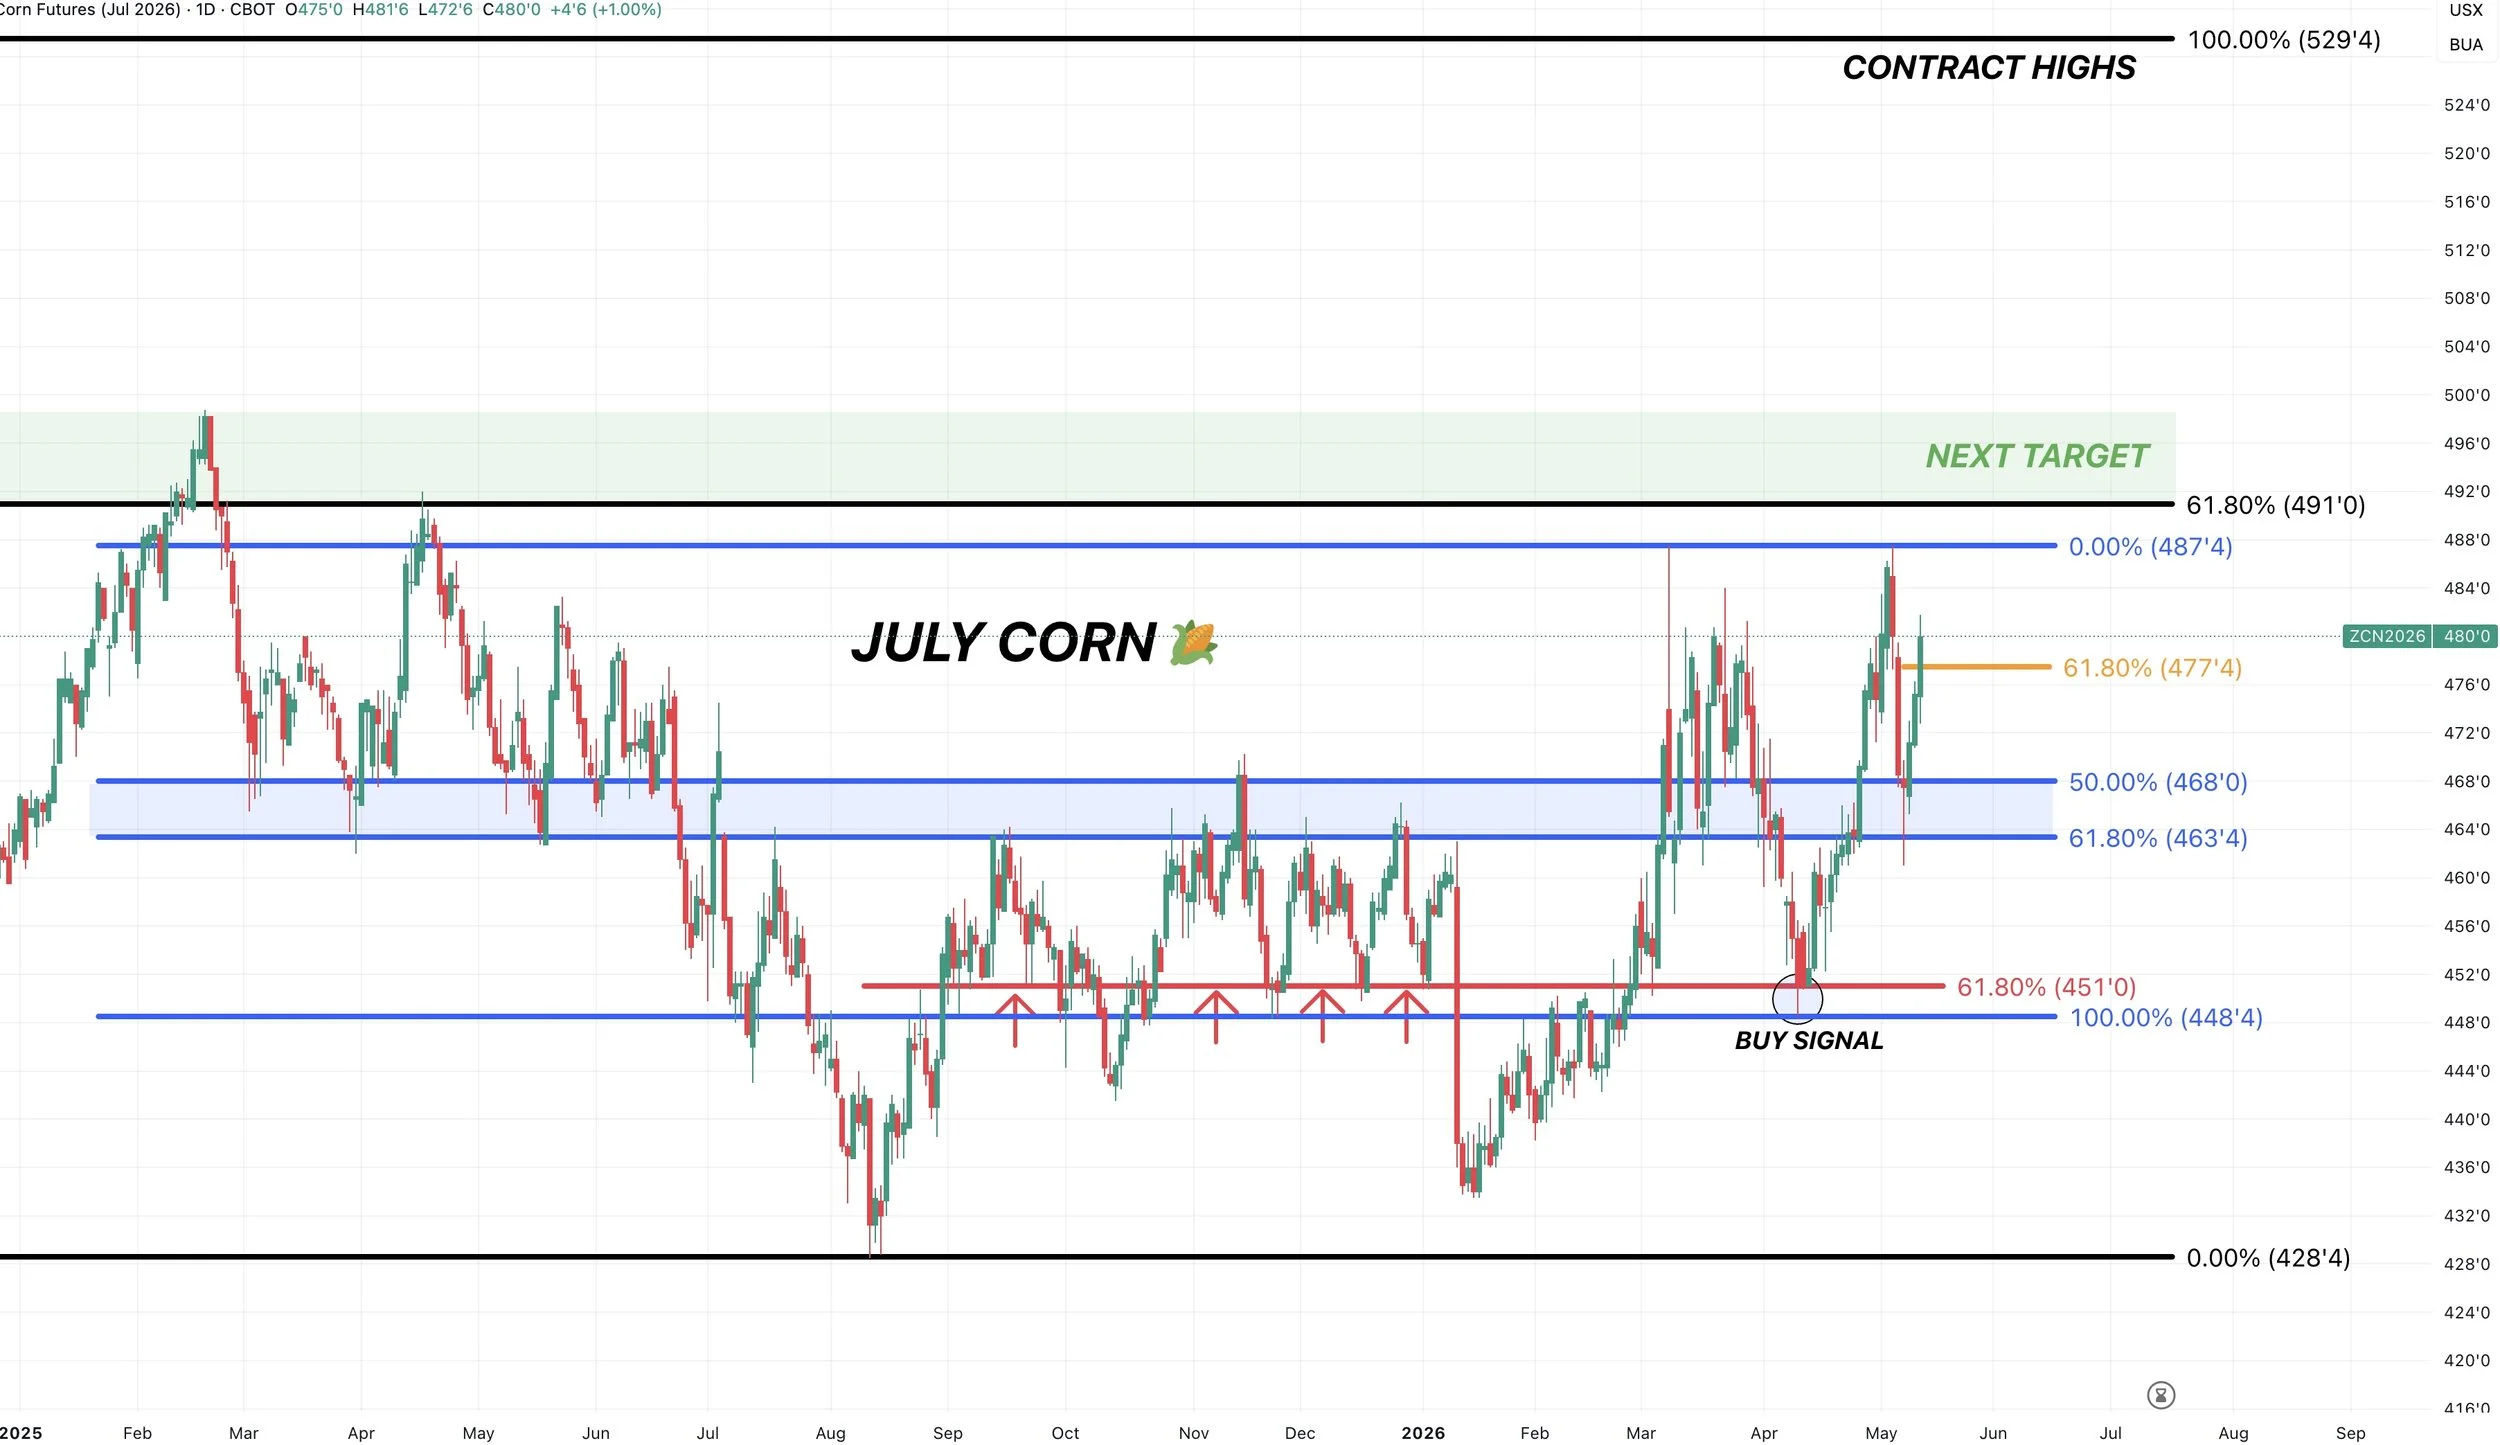
July Corn Chart:
We found life exactly where we needed to in this buy zone we talked about a lot last week.
Which was the golden zone and prior resistance from fall. It was a must hold level and it held.
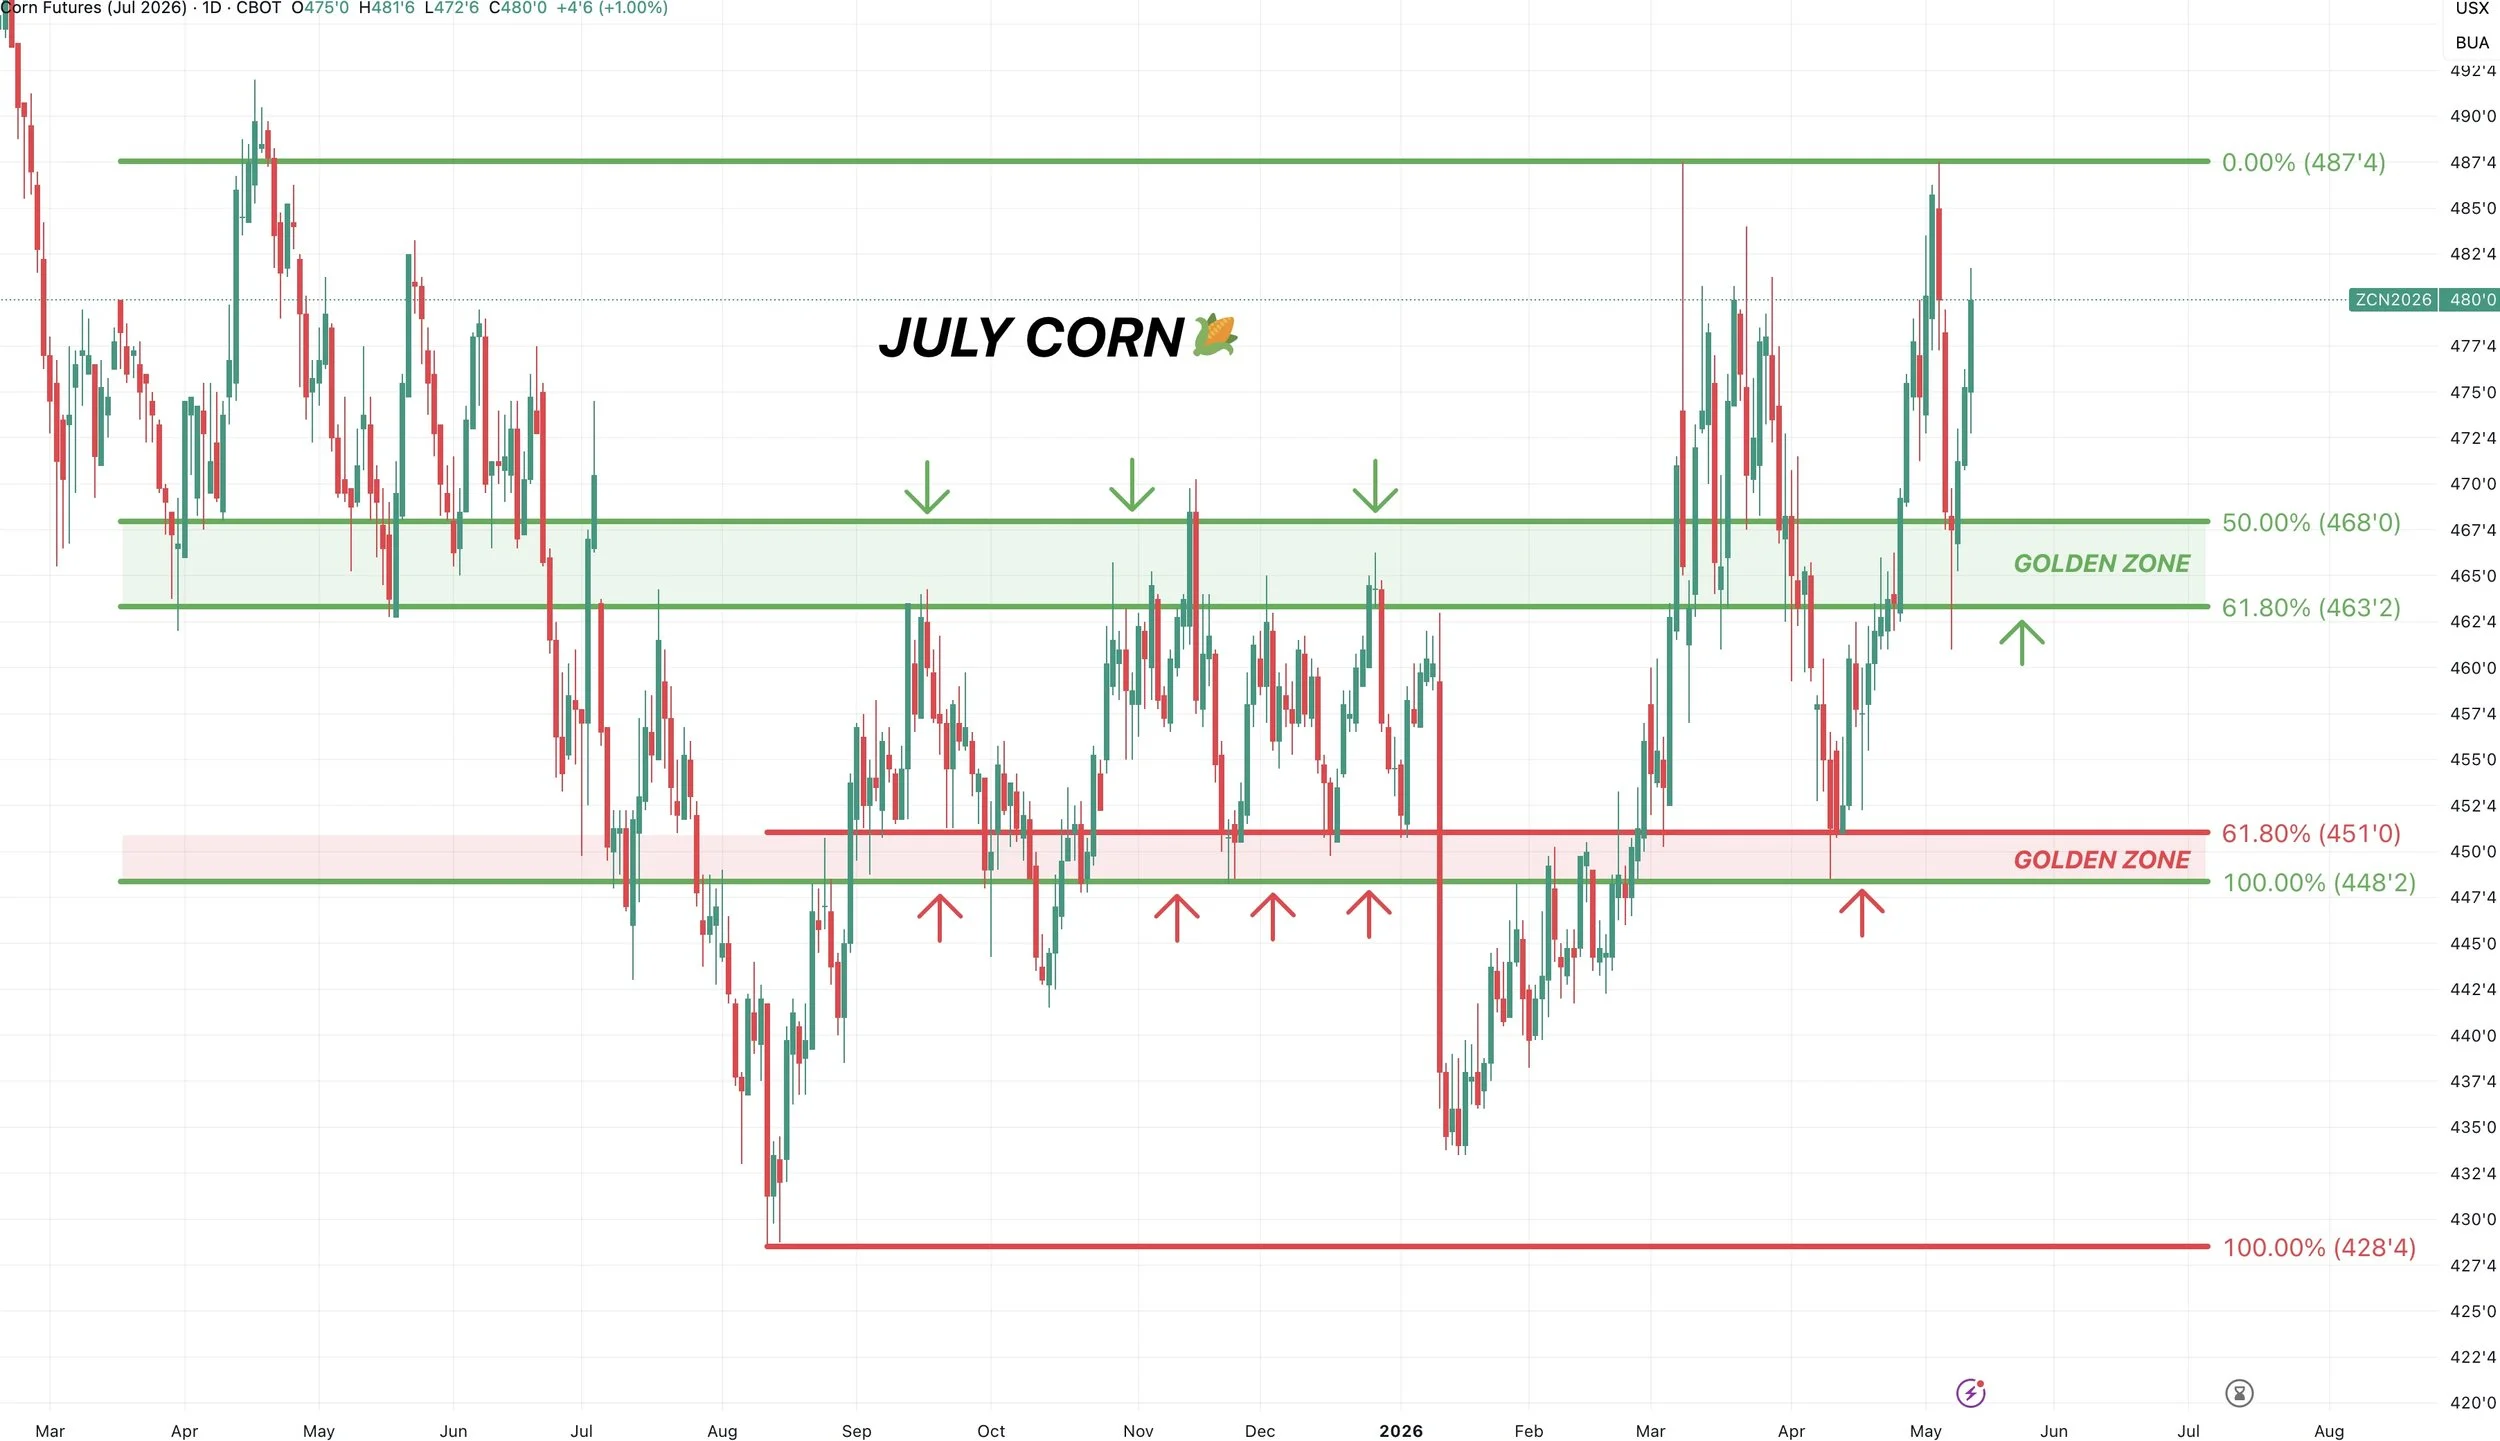
Upside Targets:
We've now clawed back more than 61.8% of the sell off, so odds favor the rally to continue.
But we are back at the highs if you missed them.
If we can break above these highs, I am looking to reward a move towards $4.90 to $5.00
$4.90 is the highs from last April. It's also 61.8% of the contract highs.
$5.00 is the highs from last February.
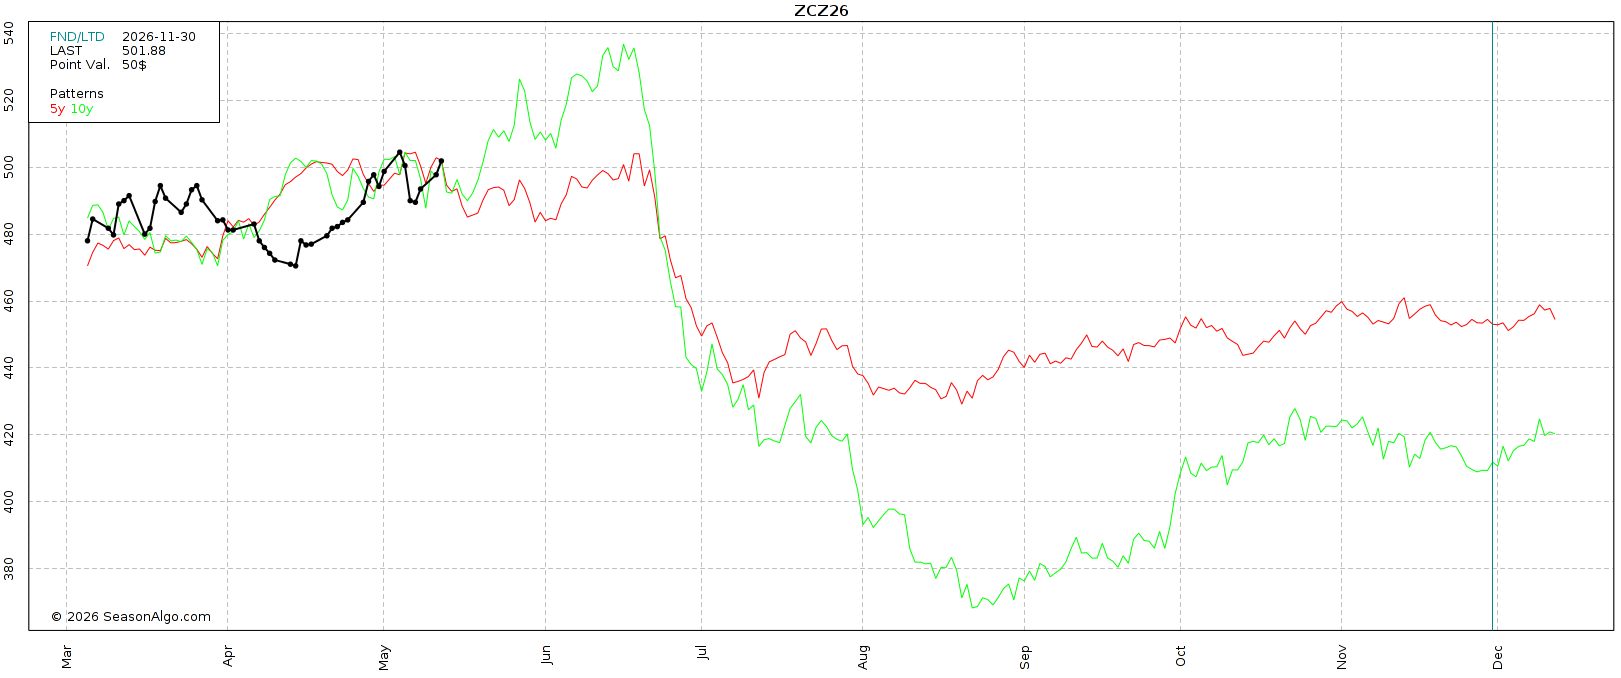
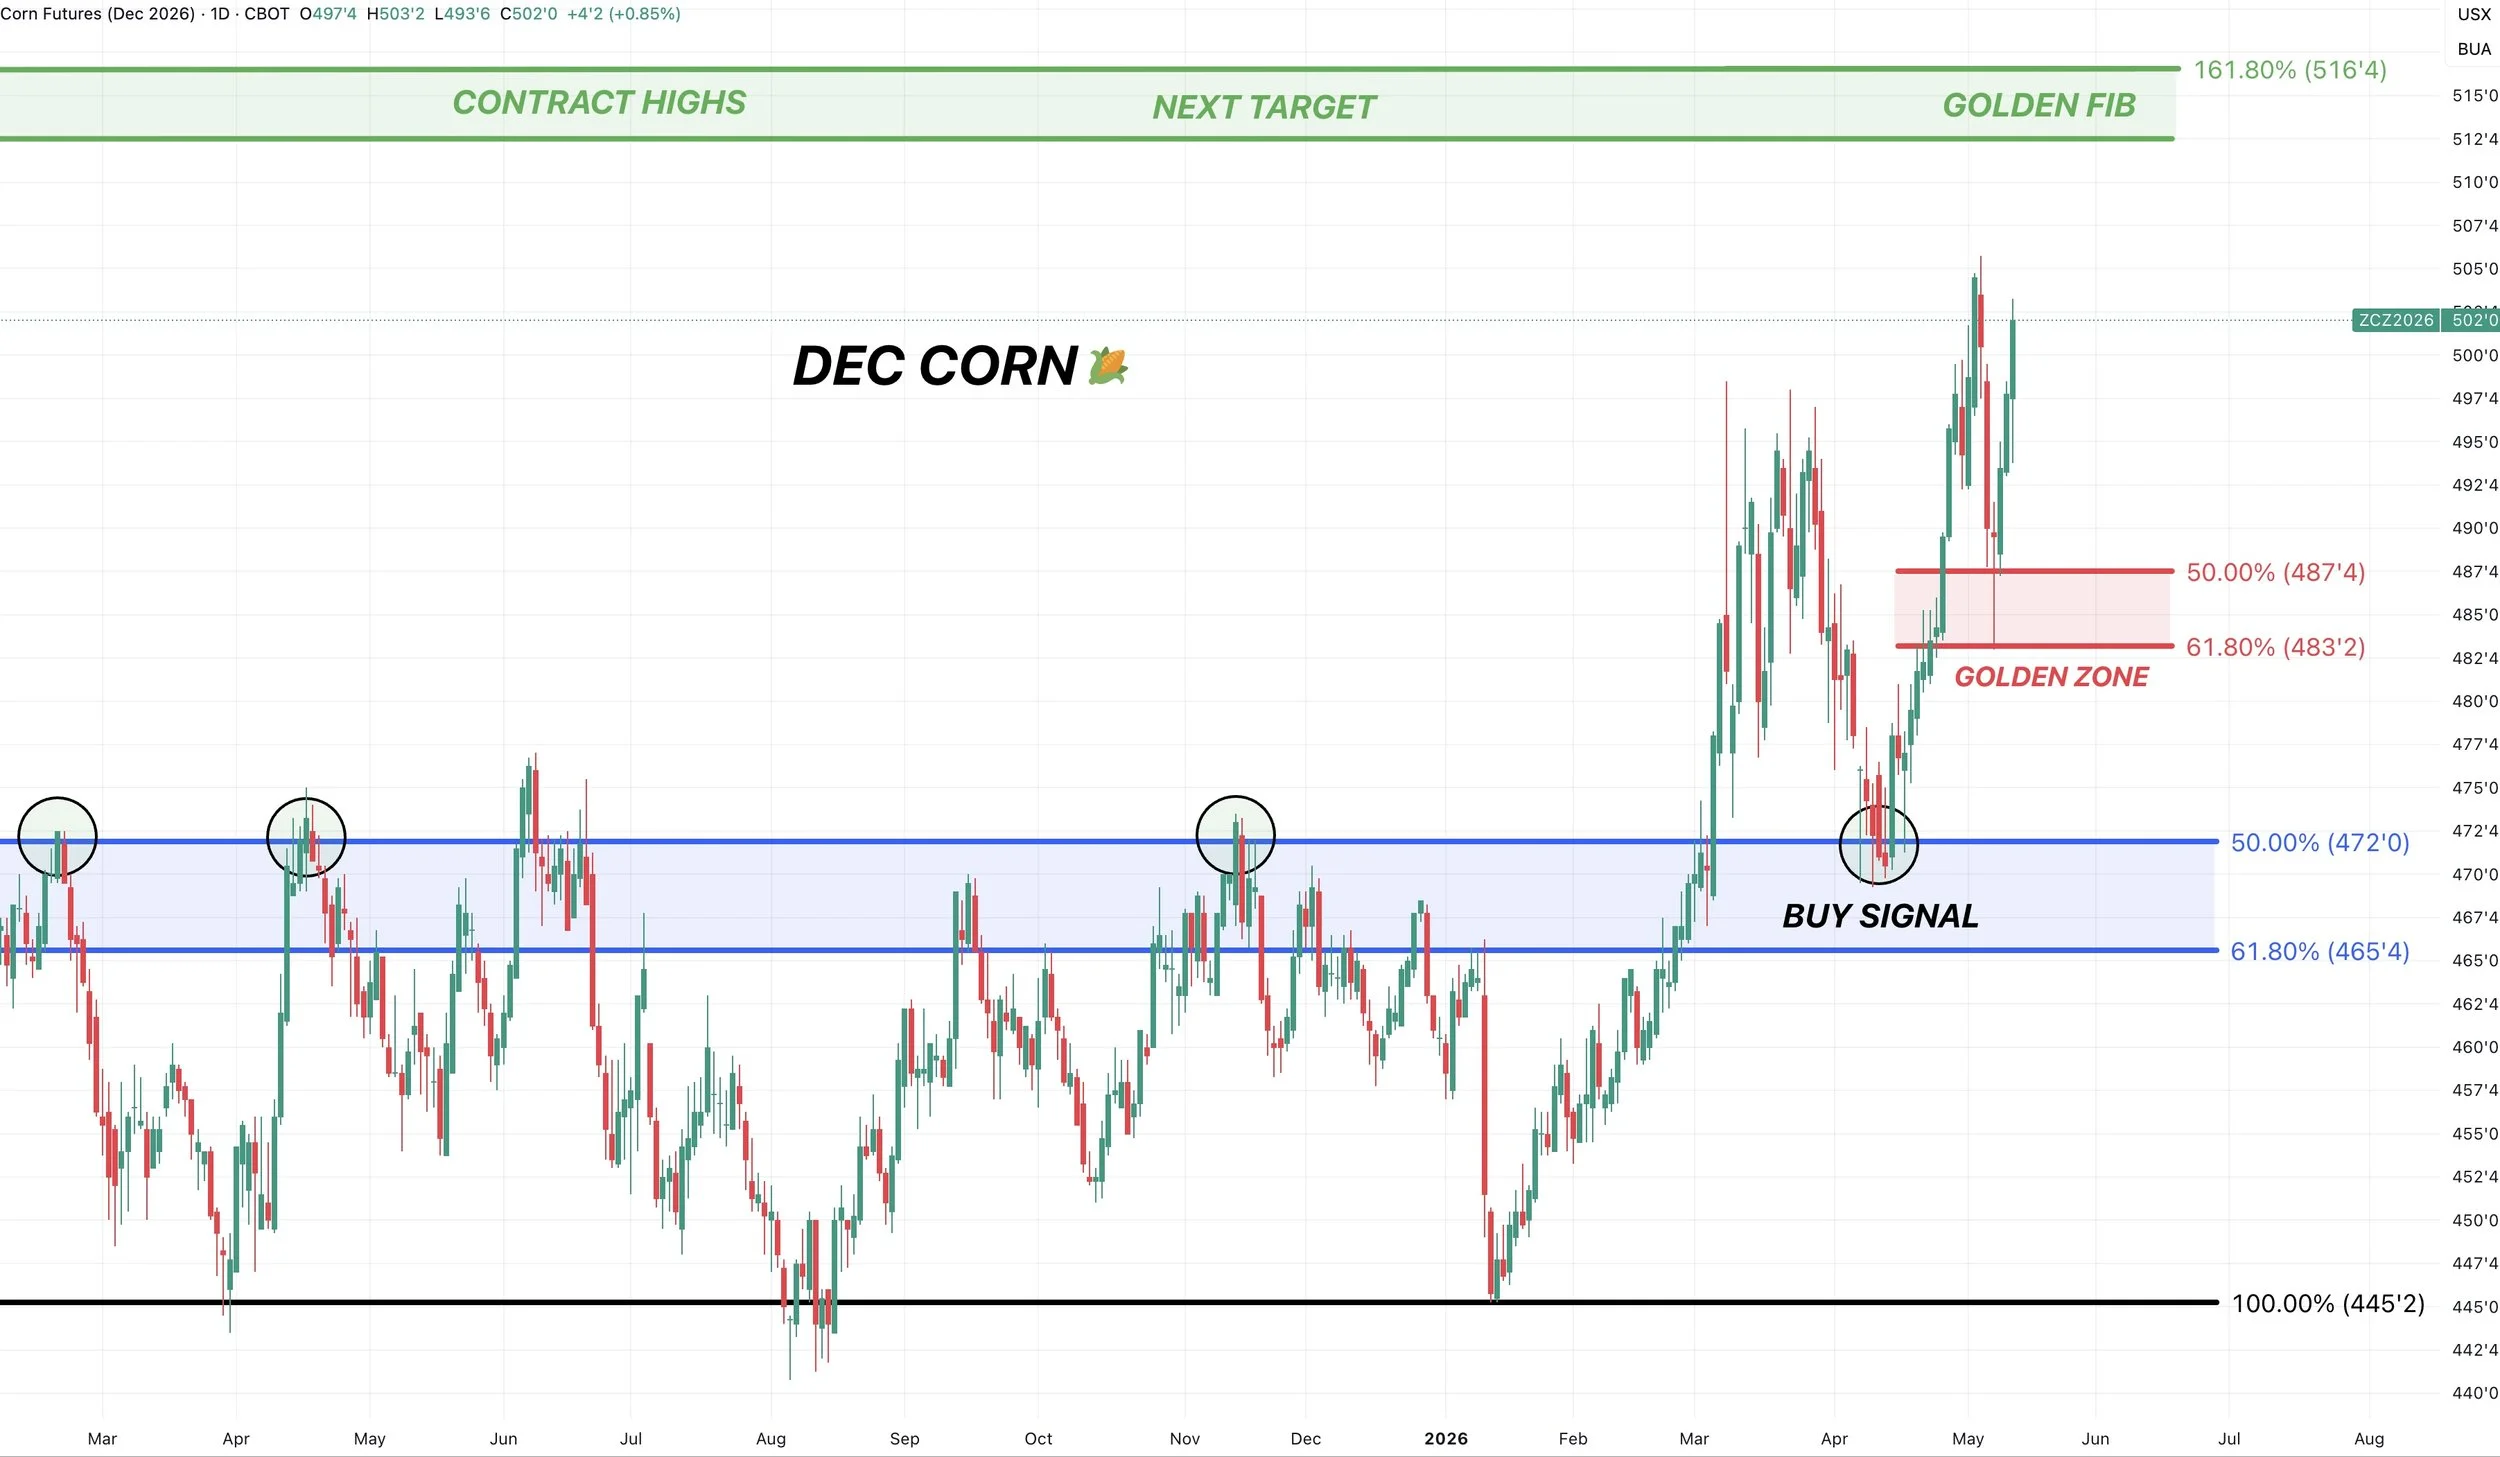
Dec Corn Chart & Targets:
Absolute perfect bounce in Dec corn last week.
Perfectly giving back 61.8% of the rally to the penny before continuing higher. Which told us that this is likely just your standard sized correction before continuing the trend.
Again, we are back abvove $5.00 and near the highs if you missed them.
However, if we can break above these highs I'm looking for a move towards to $5.10 to $5.15
That's the area I'd like to look to reward.
The contract highs are $5.12
The golden fib sits at $5.15. Which is 161.8% of the April lows up to the March highs.
Soybeans
Today' New Crop Sell Signal & Hedge Alert:
Today we sent out a new crop sell signal for those who feel like they are being in their marketing. We like getting caught up to normal here.
(Scroll to view the charts and reasoning behind the signal)
Link to Today's Alert
If this is a profitable level for you, we like taking a few chips off the table here or protecting yourself heading into this meeting.
We like selling calls above the market and or buying short term puts to protect yourself in the event that the meeting disappoints. That way you keep your upside open while having protection at the market.
Call or text us if you have questions.
Office: (806)484-1214
It all comes down to the China meeting.
Does China buy any old crop? How much new crop do they agree to buy? Do we get any specific details at all? Does it end up being wildly bullish or does it disappoint?
There are so many unknowns entering this meeting.
Last week we talked about why it would make sense for us to rally going into this meeting. Now that we've done so, this meeting does offer the risk of being a buy the rumor sell the fact event.
Where you rally going into the event, then sell off once it happens. As the market has already priced in the news.
So there is a risk of that happening if the meeting doesn’t turn out super bullish and exceed expections.
I think the meeting ends up being positive for grains, but that's the risk.
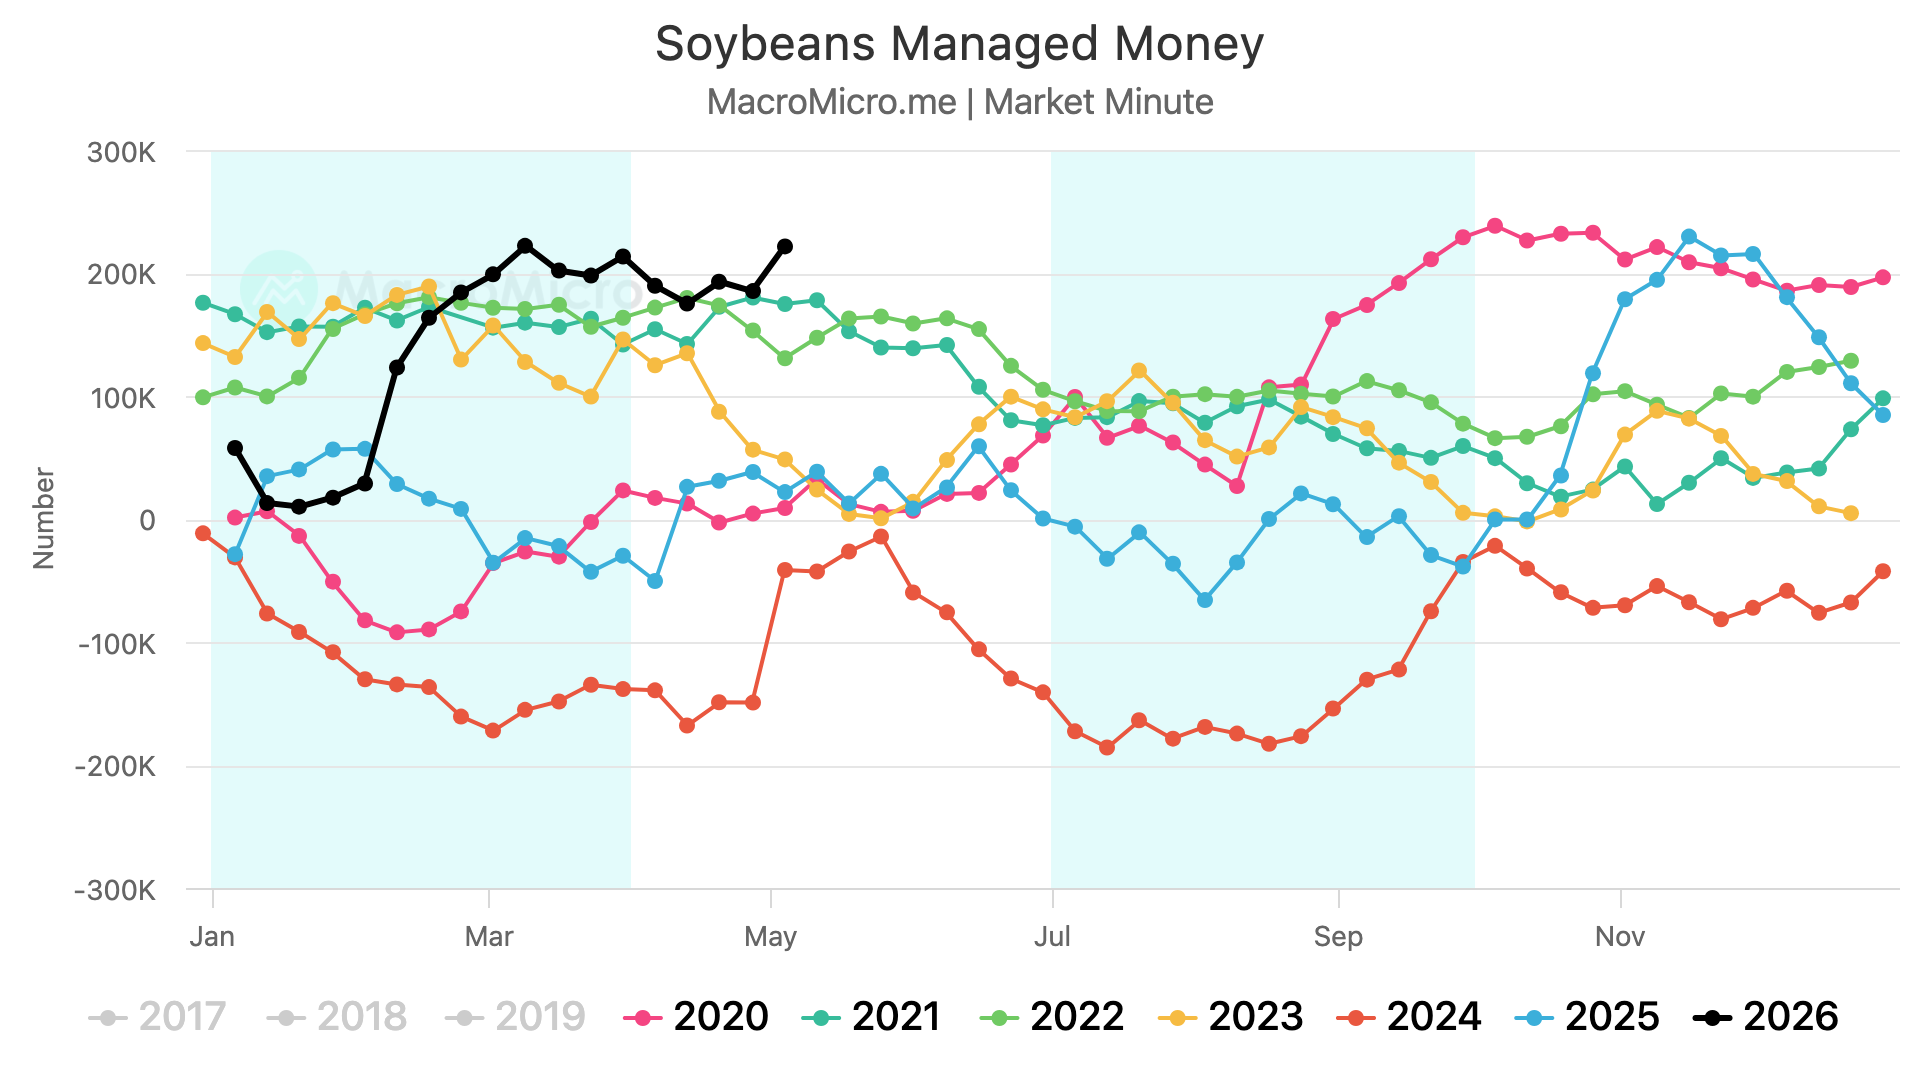
We also can’t forget that the funds are incredibly long the entire soybean complex. Near record long everything. That doesn’t mean they can’t continue to pile on, as they must see a story. But that's another risk.
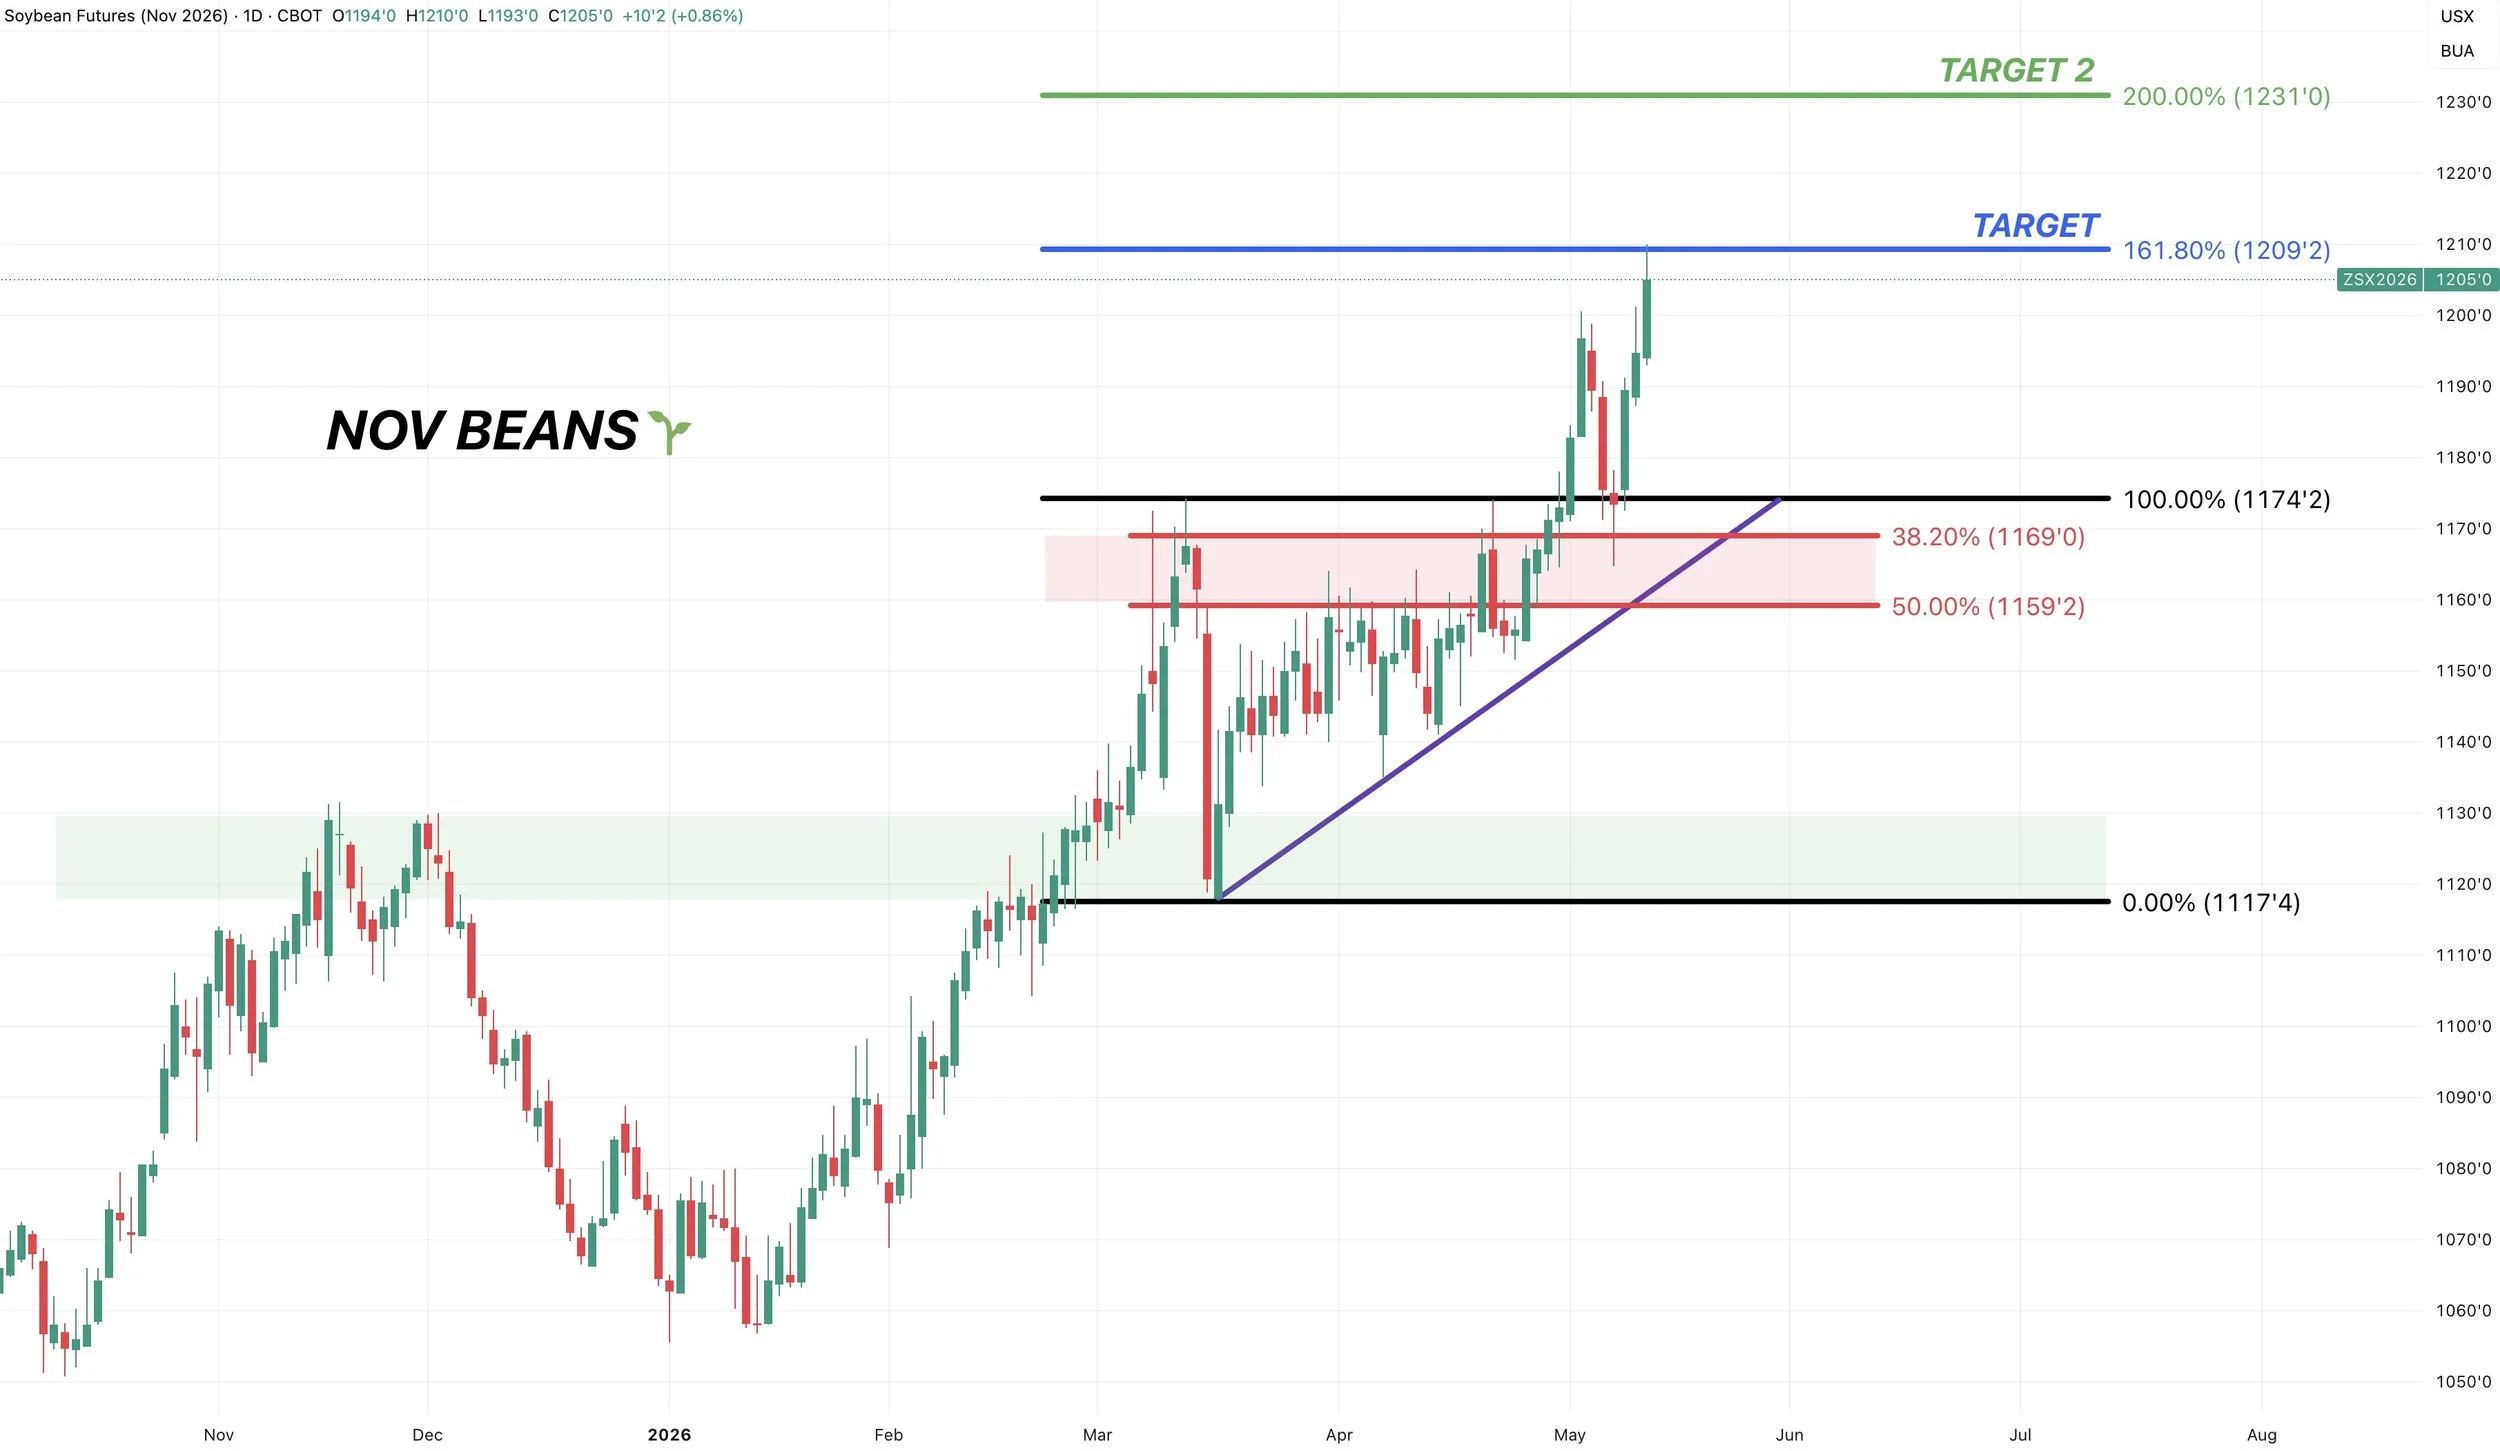
Nov Beans Chart:
Like we talked about last week, we normally look at the golden zone when trying to identity a bottom. But in a strong market like Nov beans or KC wheat for example, the corrections can often be more shallow and occur within the 38.2% to 50% range instead.
Which is exactly where Nov soybeans bounced last week. Turning old resistance into new support.
However, we've now posted new highs and reached our first target of $12.09
$12.09 equals 161.8% of the March lows up to the March highs. Aka the golden fib and a common level for a rally to stall.
If we take out this level, a secondary target would be the 200% level at $12.30 and 25 cents higher than today.
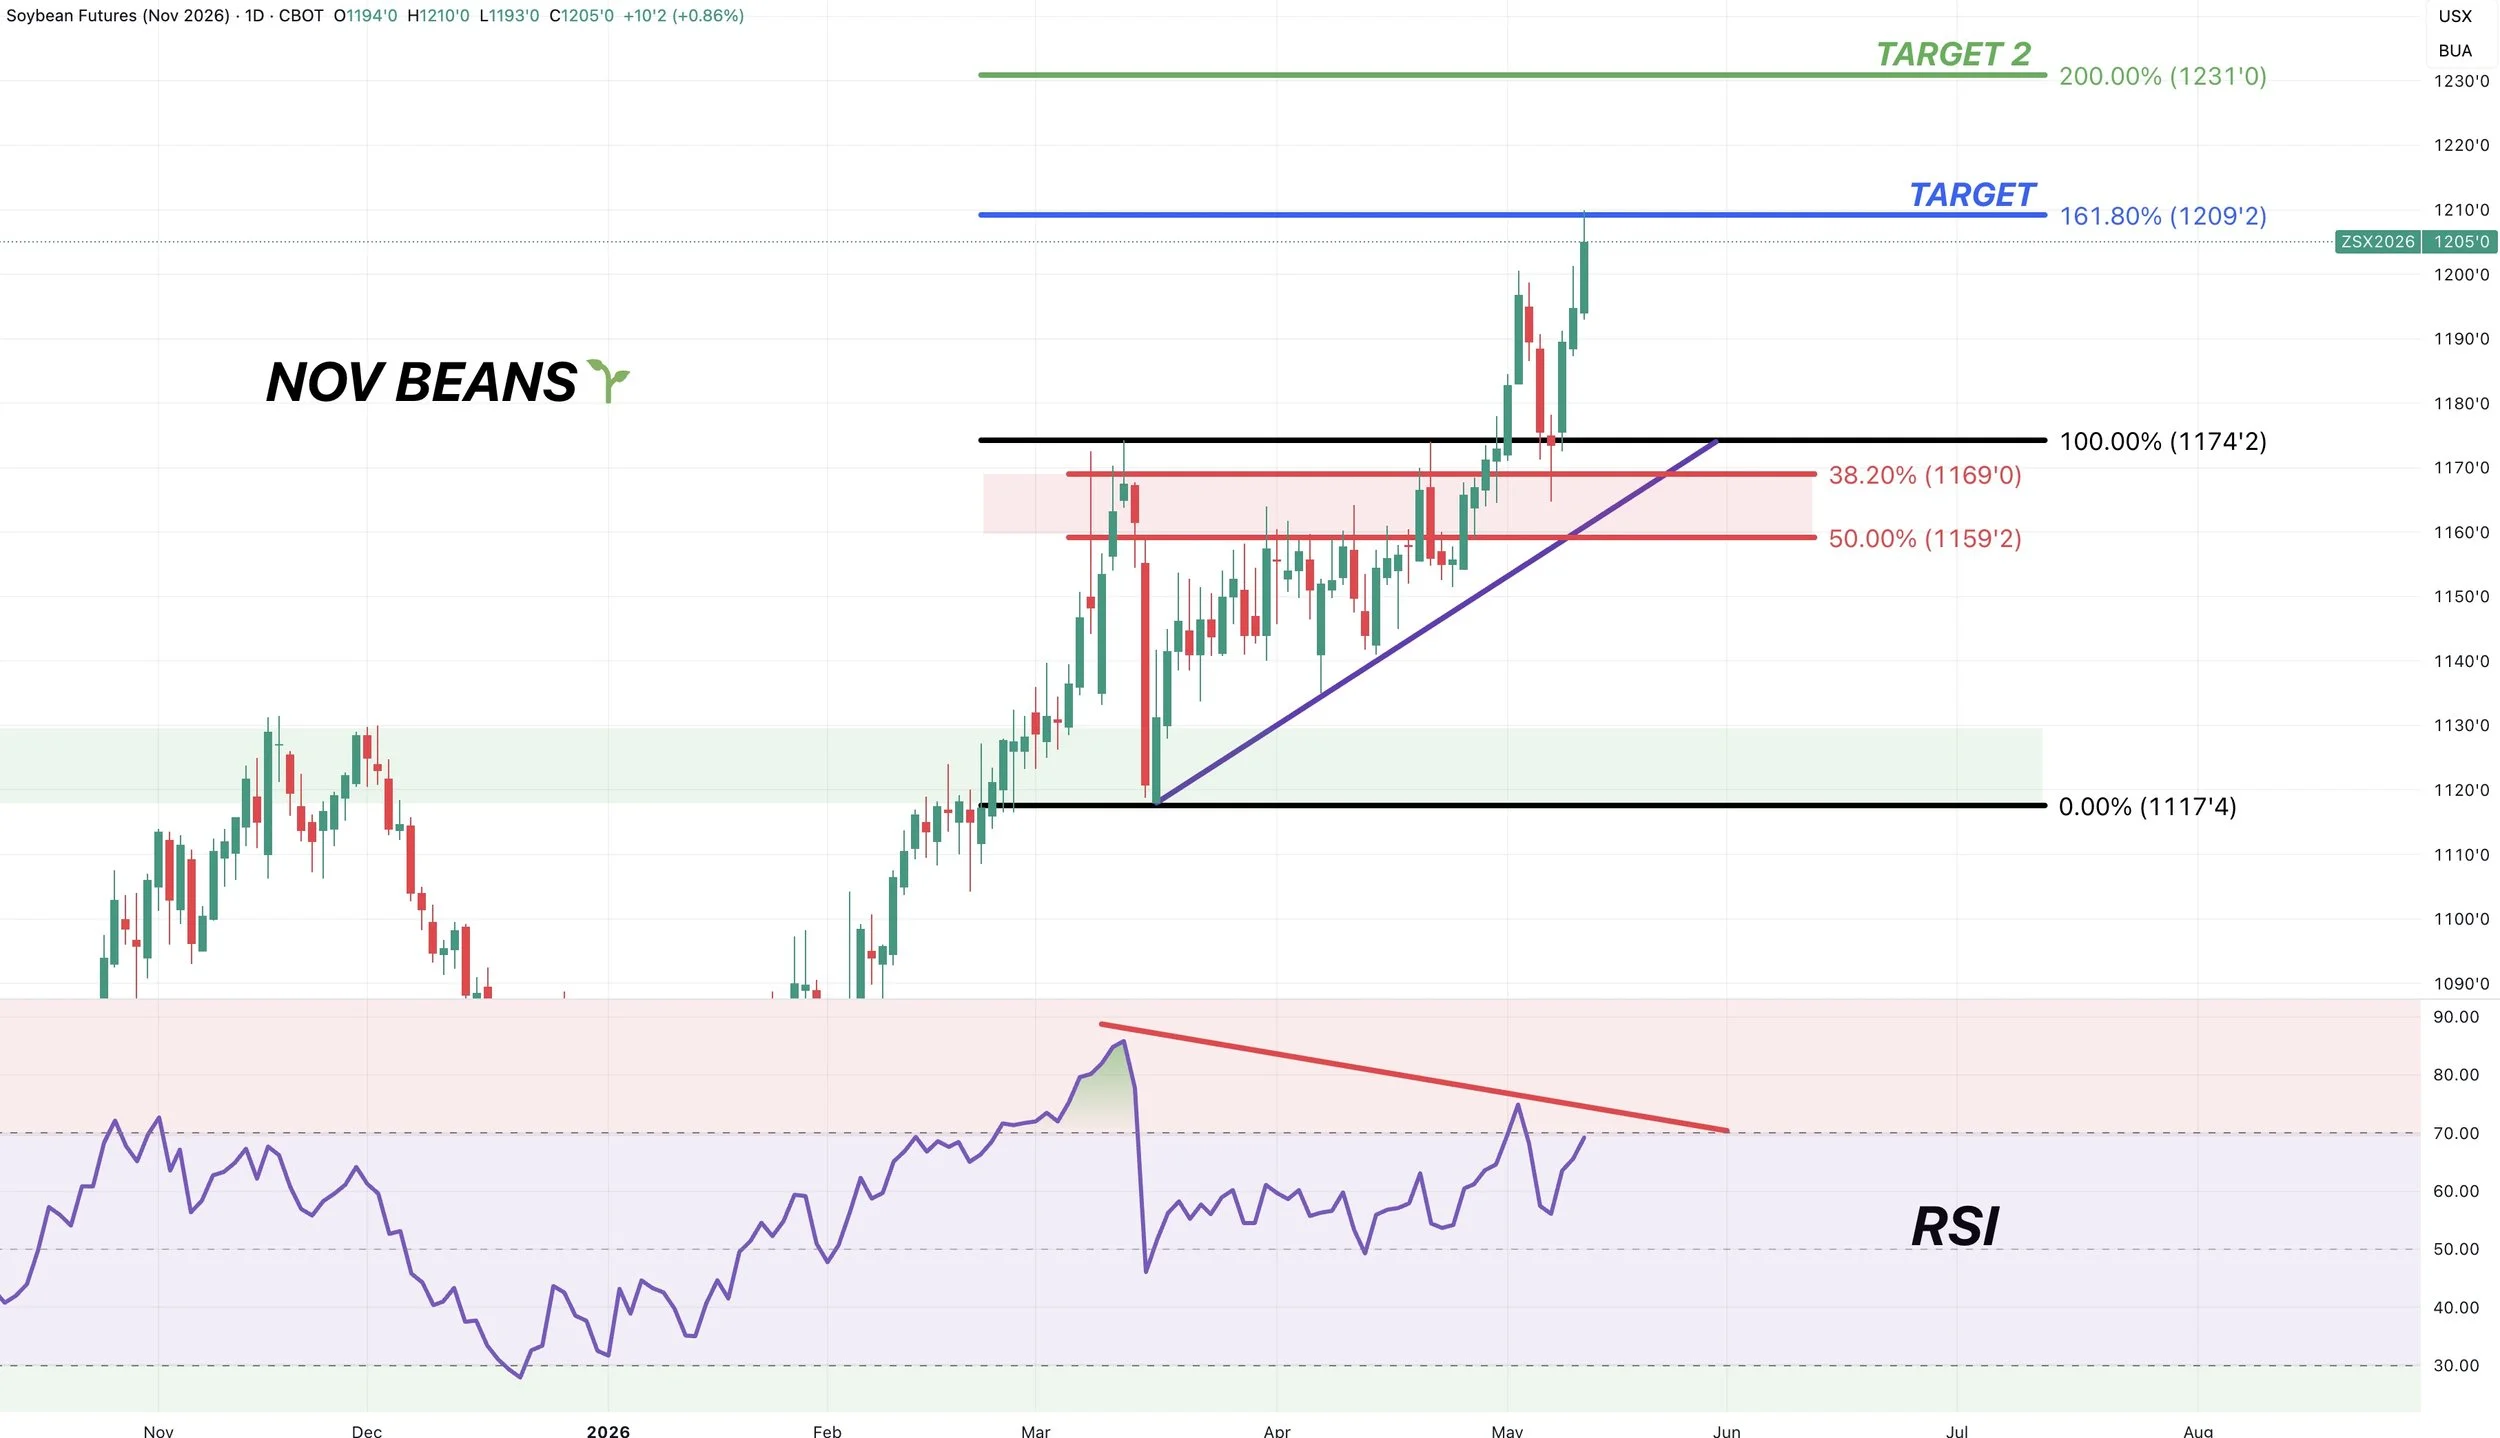
One other thing I am being cautious of here is the bearish divergence on the RSI.
Prices are posting new highs.
The RSI is not.
That does not mean the rally has to be over at all.
It's often just a warning sign that momentum might be starting to cool off up here.
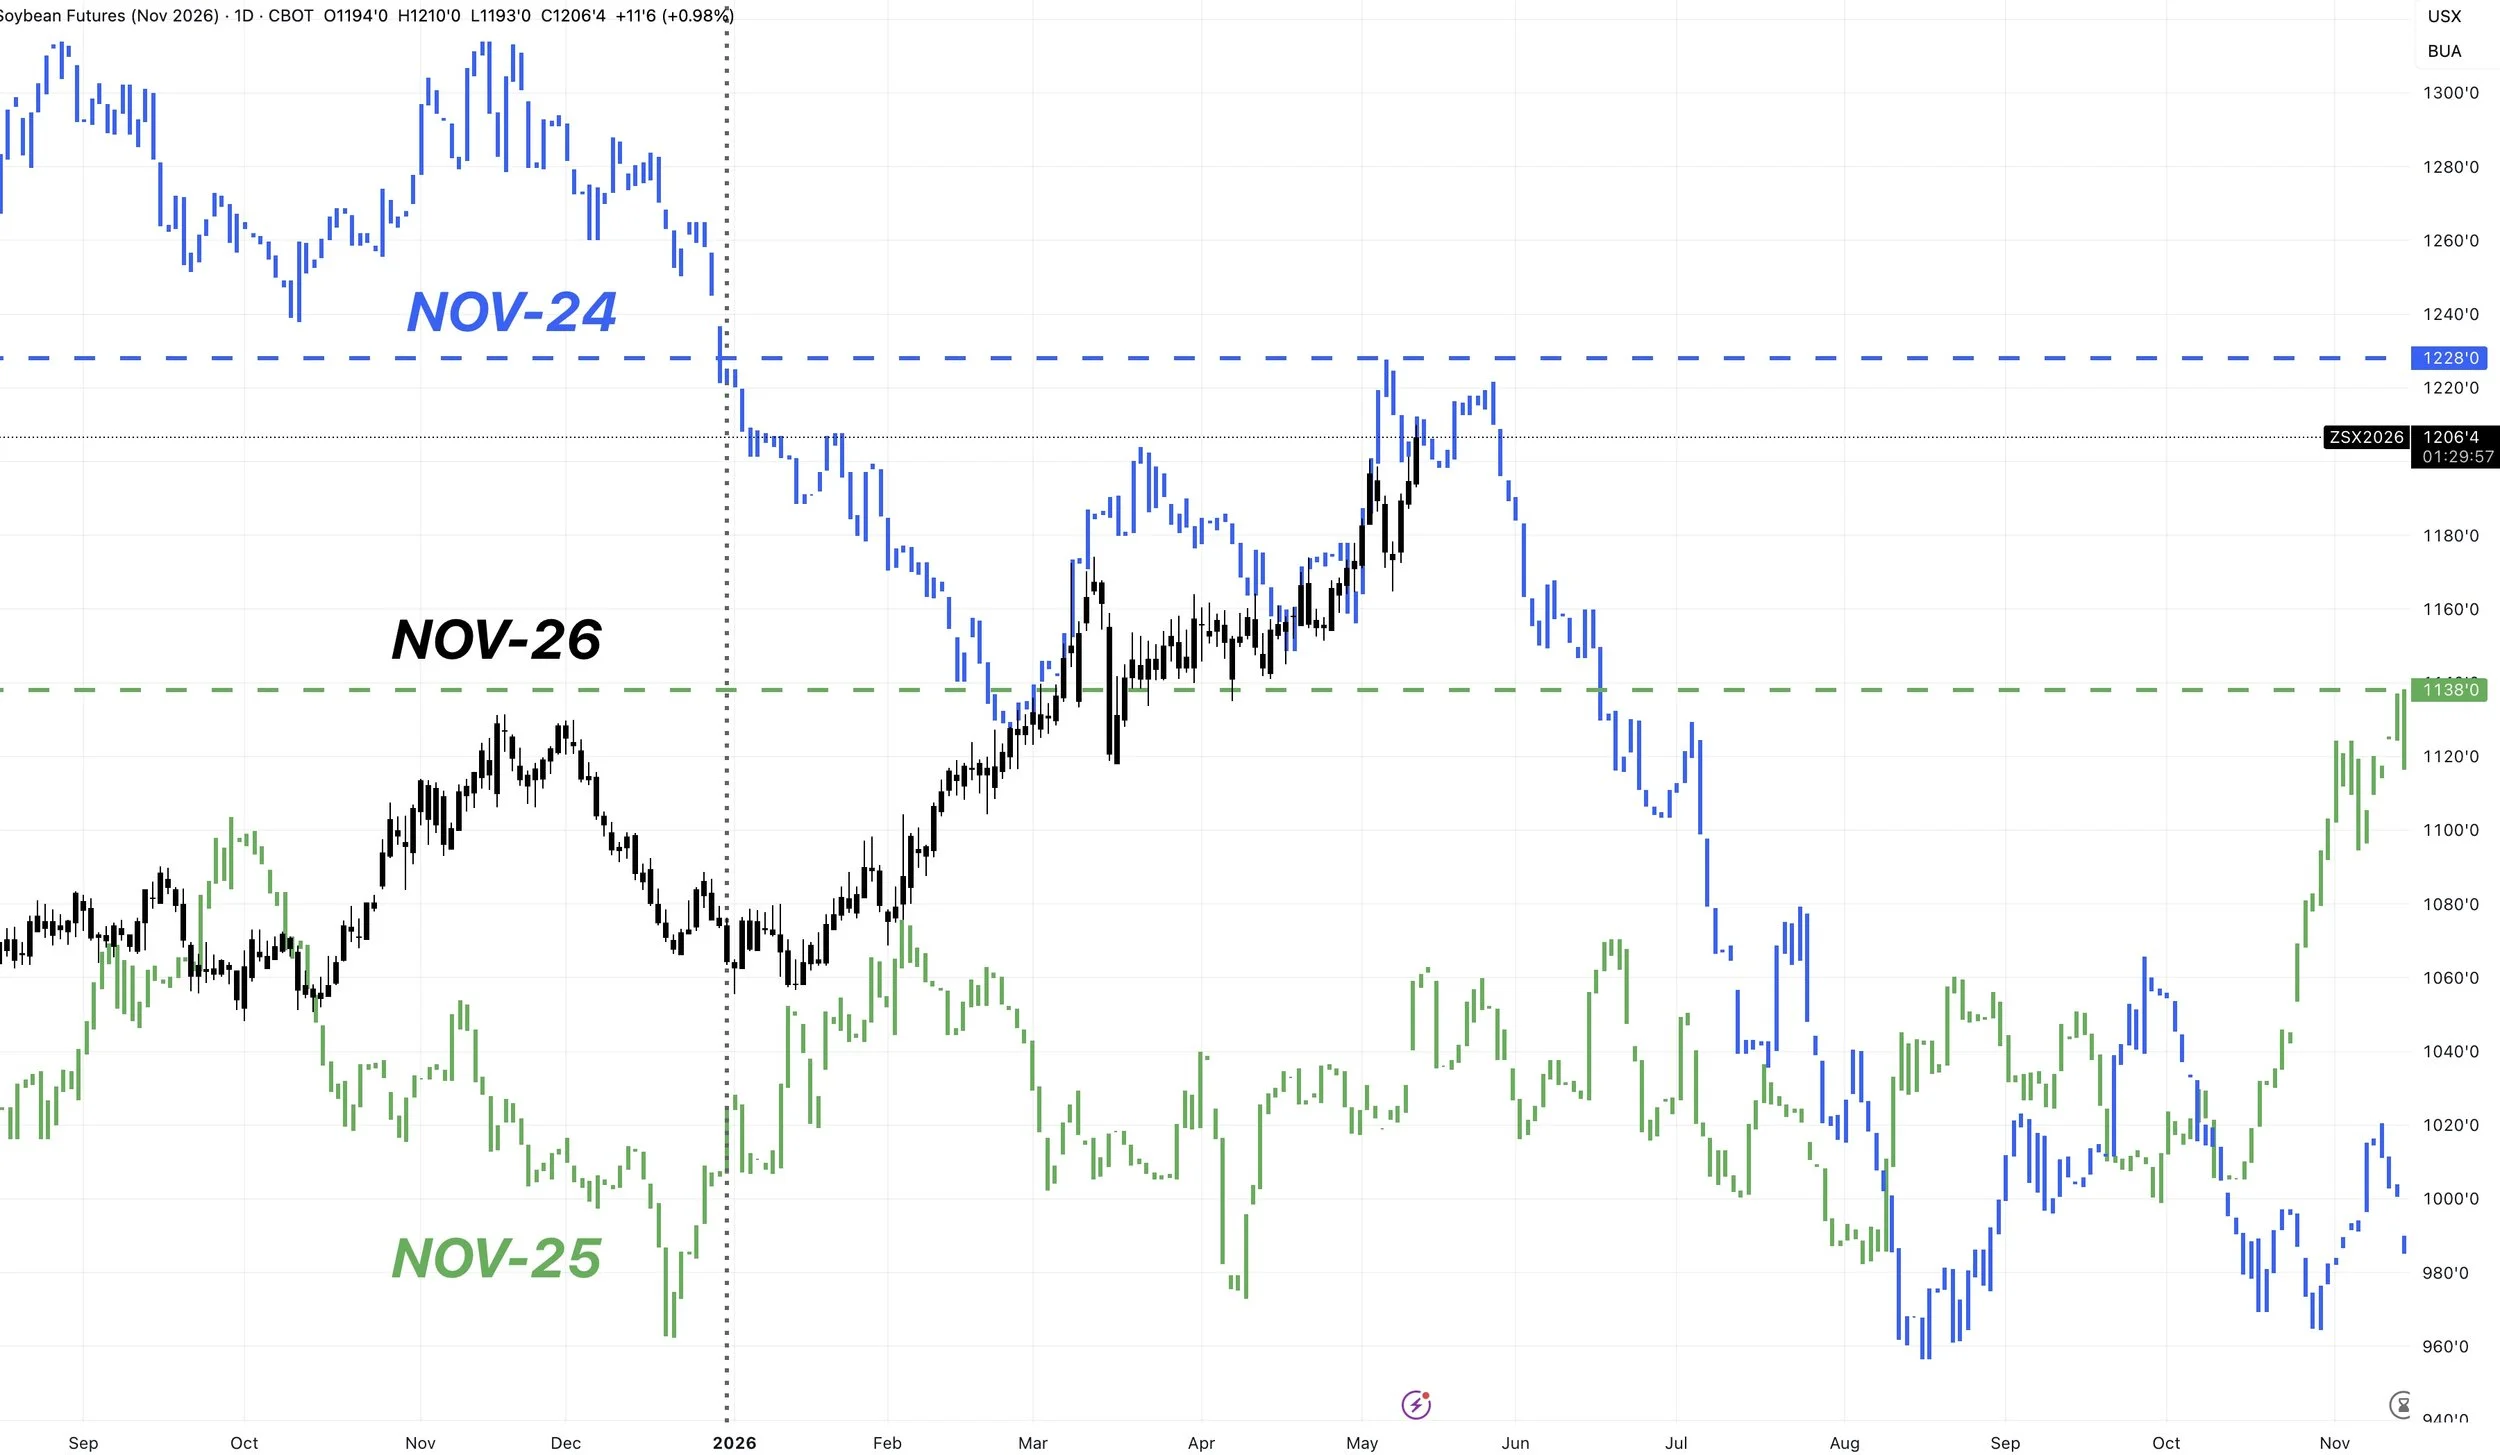
Nov Nearing 3-Year Highs:
Nov beans are higher than they were all of last year.
We are within striking distance of the highs from 2024.
Near 3-year highs in a market is never the worst place to take a few chips off the table even if there is still potential.
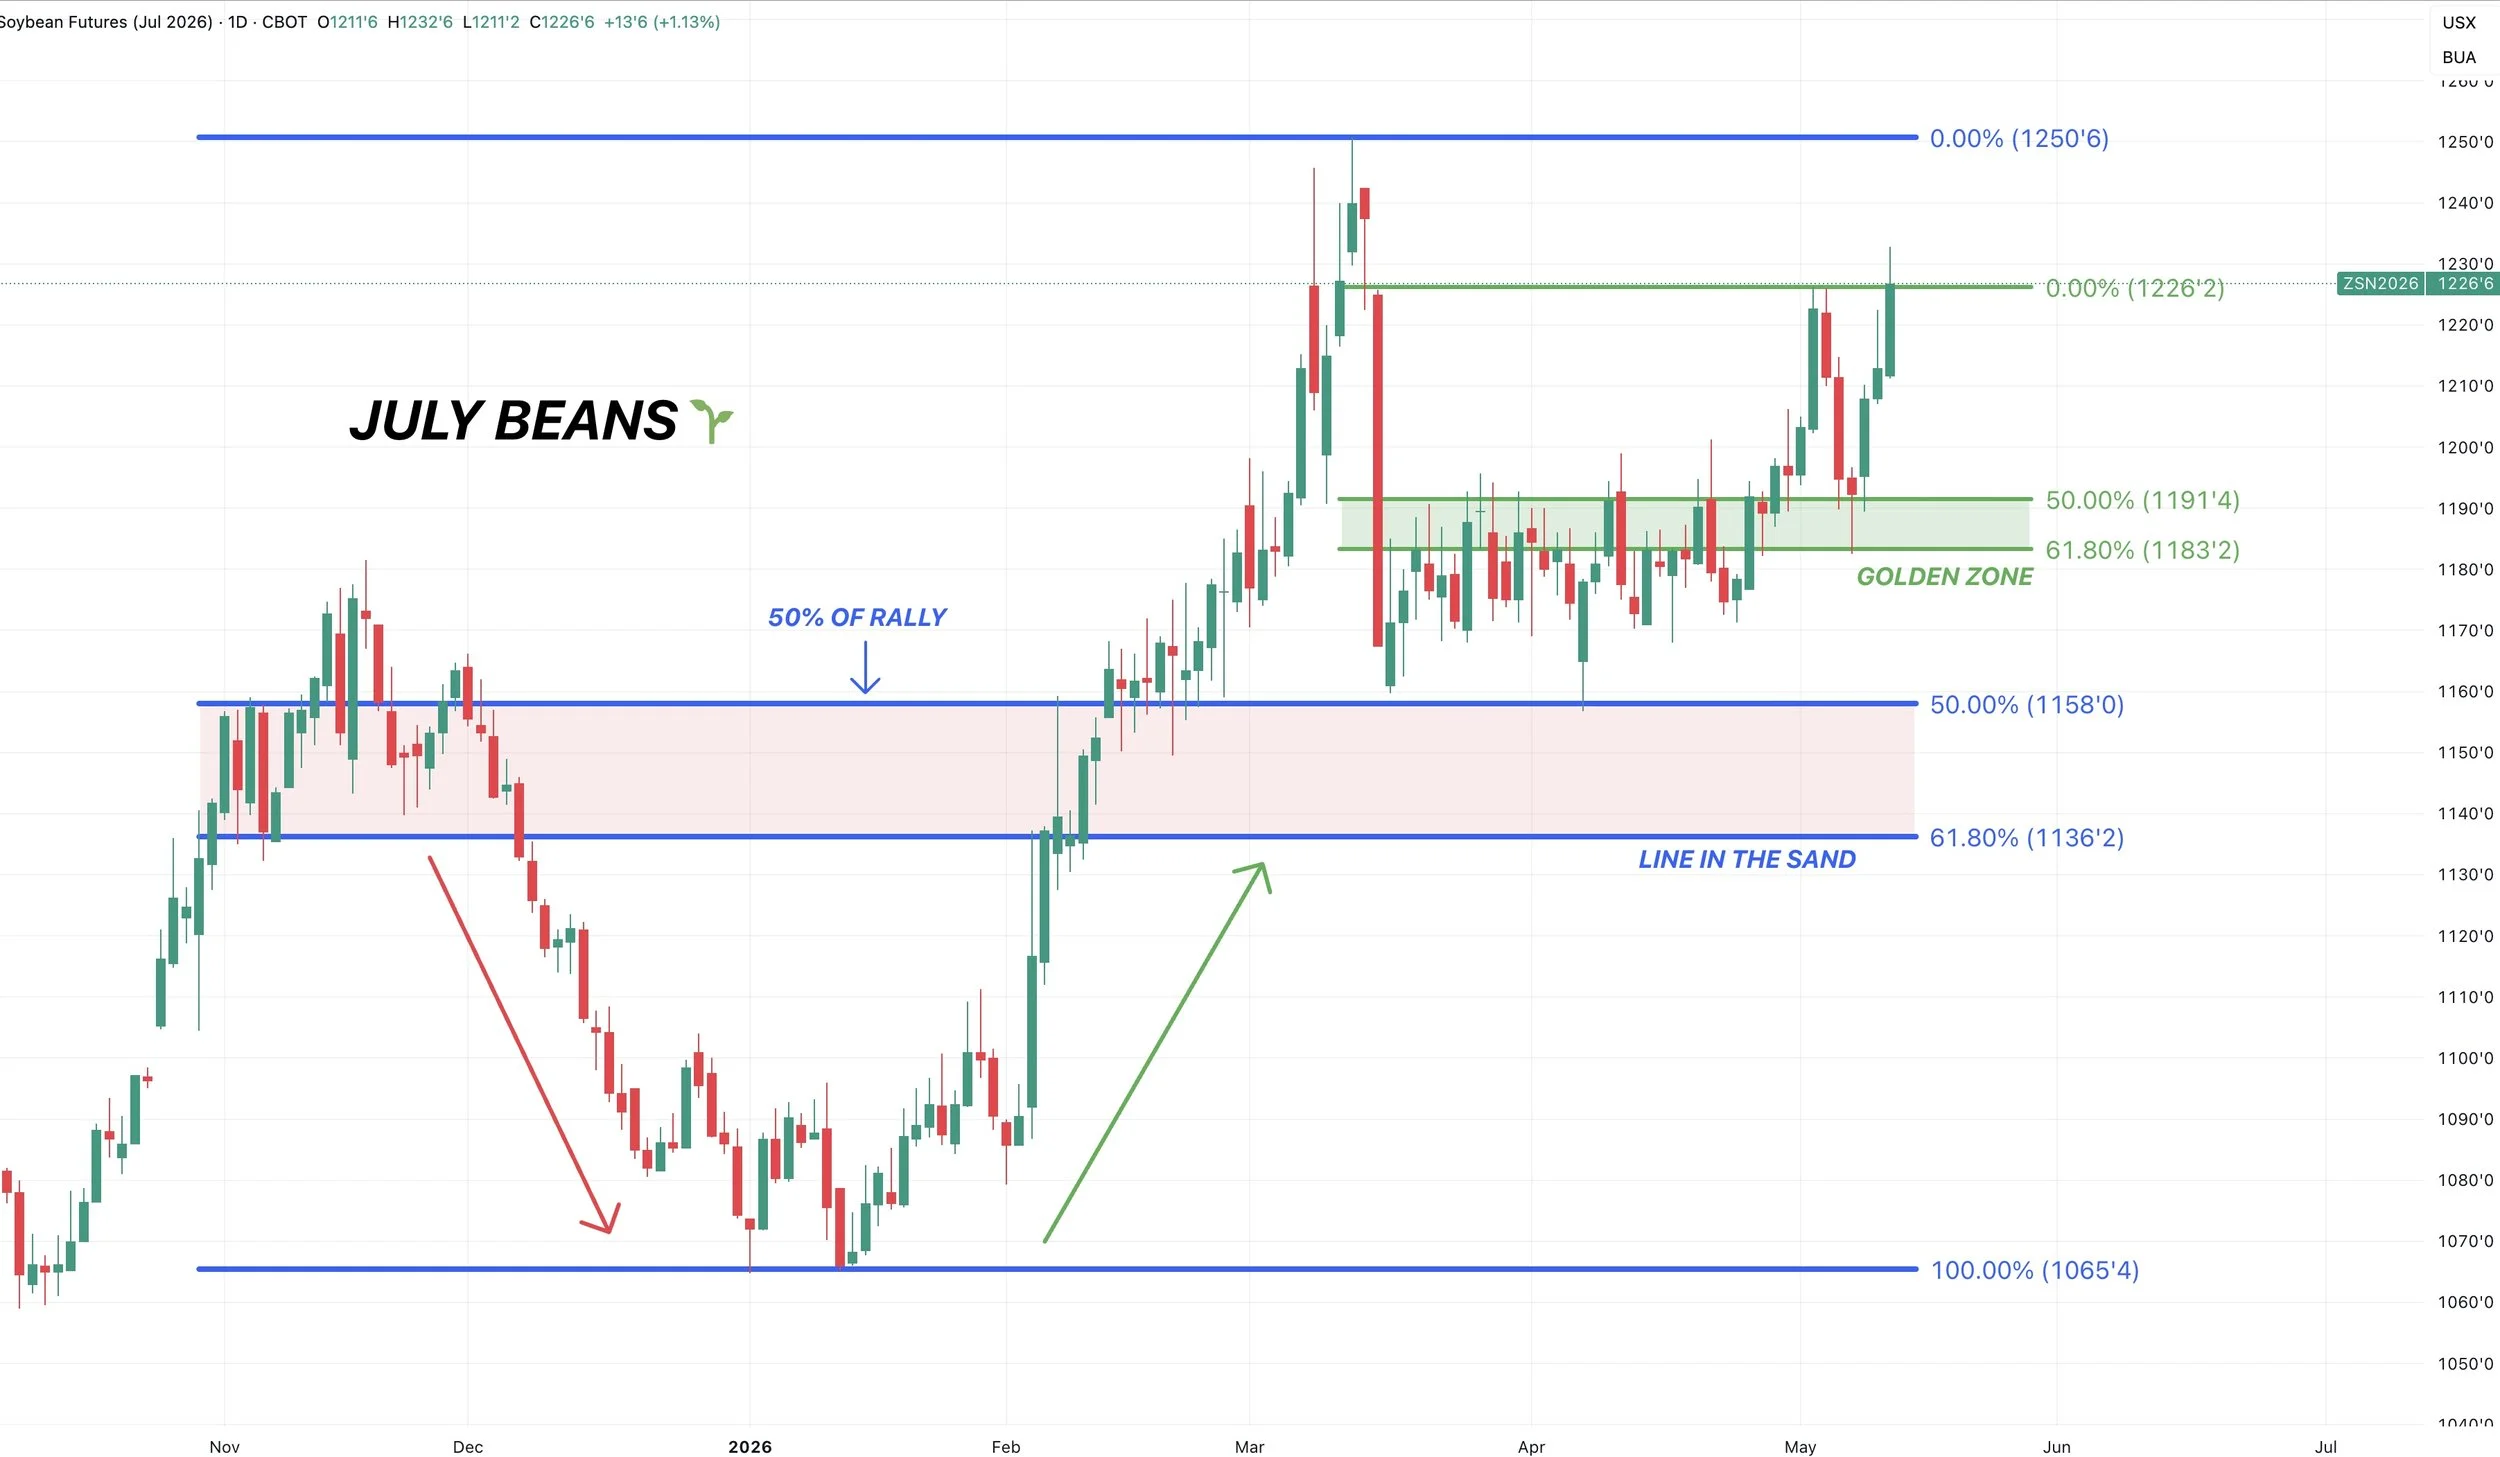
July Beans Chart:
We held the golden zone perfectly and turned that old resistance into new support.
We are now up against those recent highs.
If we can take out these recent highs, the next point of interest is going to be those $12.50 highs from back in March.
Which is another 25 cents away.
This target would possibly line up with that 2nd target in Nov beans of $12.30. Which also sits 25 cents away.
Wheat
Worst Winter Wheat Ratings Ever:
Winter wheat ratings dropped again. Down to 28% G/E.
This would officially be the worst rated crop ever.
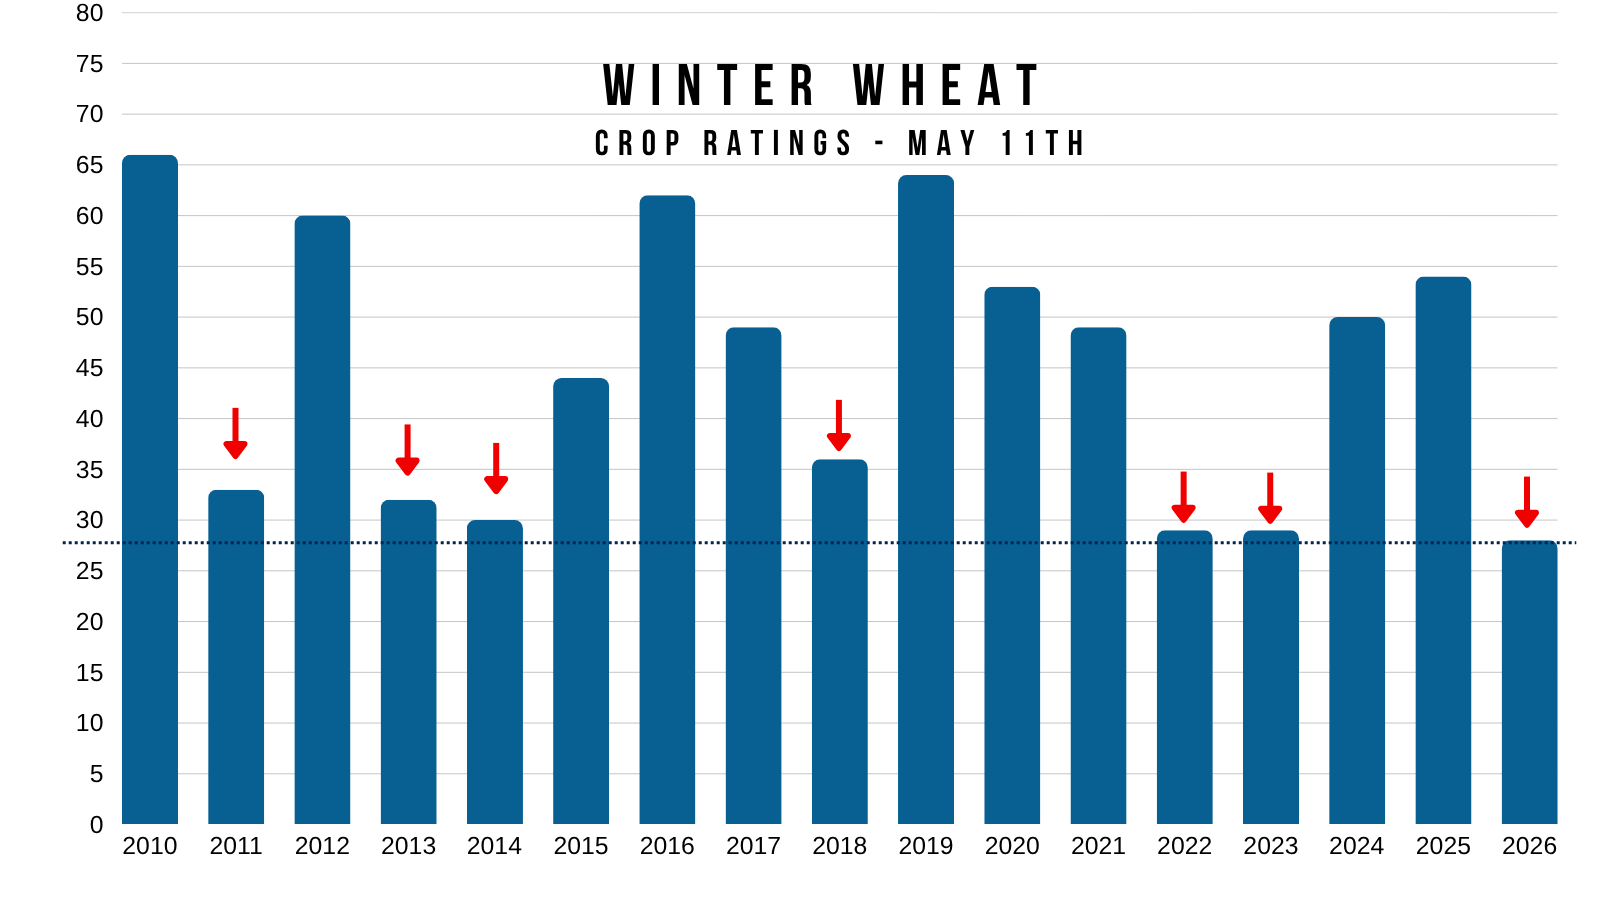
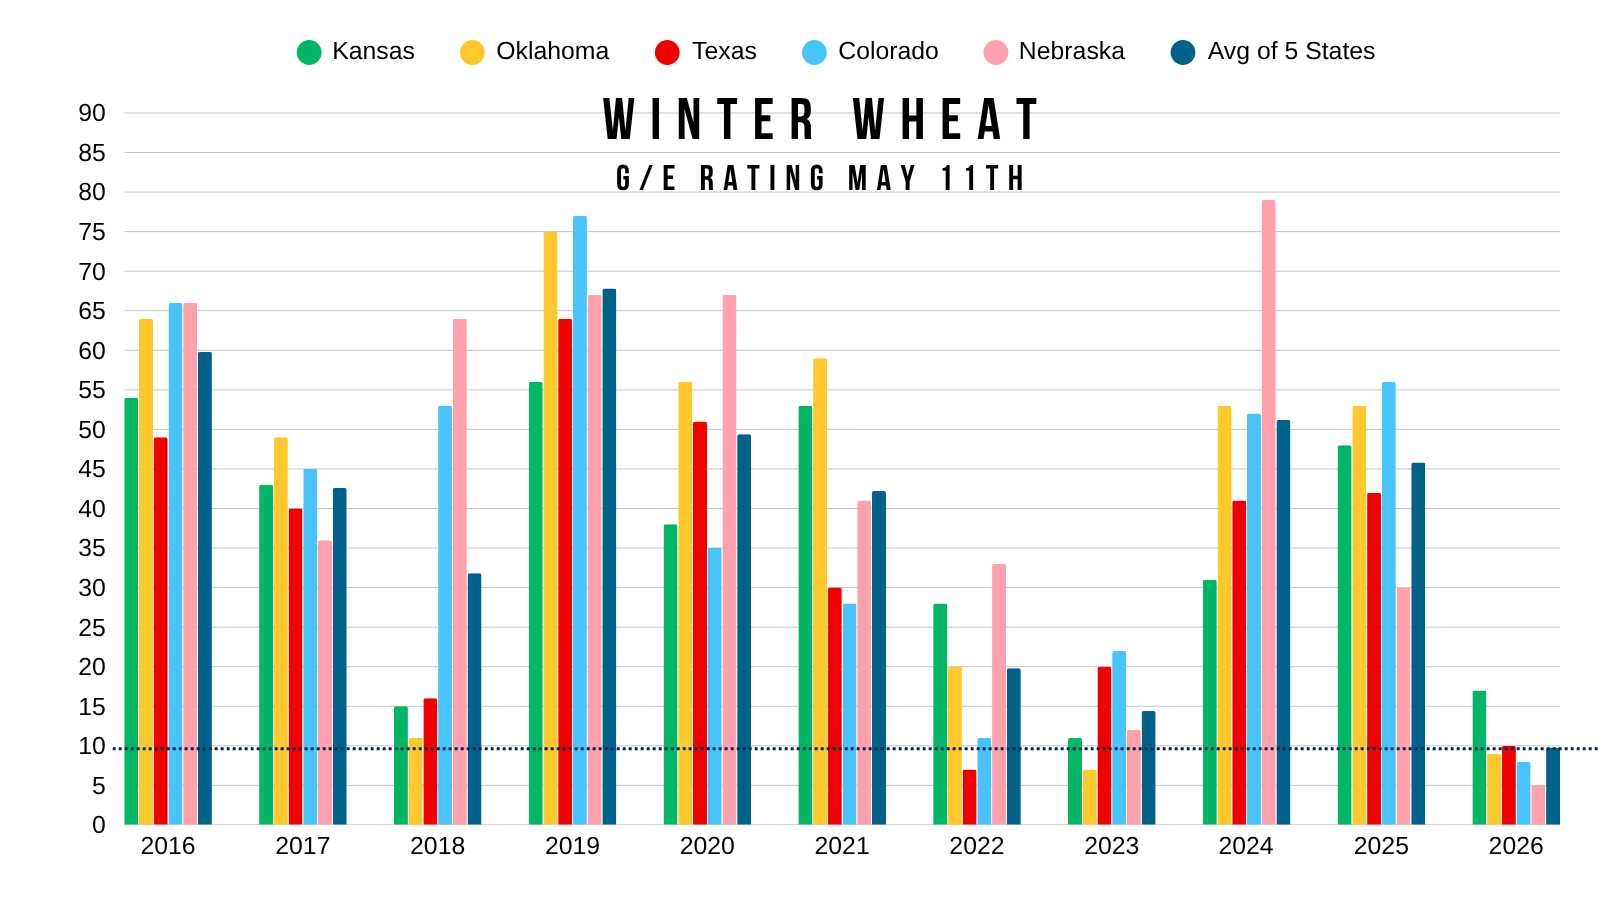
As we've talked about for a long time, this doesn’t even tell the full story.
If we look at the top HRW states ratings.. It's not even close.
The average rating of the top 5 states is 9.8%
By far the worst of all-time.
The next closest is 2023's 14.4%.
Every single one of these tops states has one of if not the worst rating it has ever had.
So you have one of the worst winter wheat crops ever.
You have the record low acres.
Then you throw the entire fertilizer story on top of this, you get a bullish scenario. With a bunch of positive factors all coming together at once.
As we've said for a long time, wheat has some serious potential. Especially when you look long term at the potential effects from the fertilizer situation and it's impact globally.
We do want to keep in mind that seasonally, this is the time of year we need to start looking at pricing wheat. So I like being ready to start.
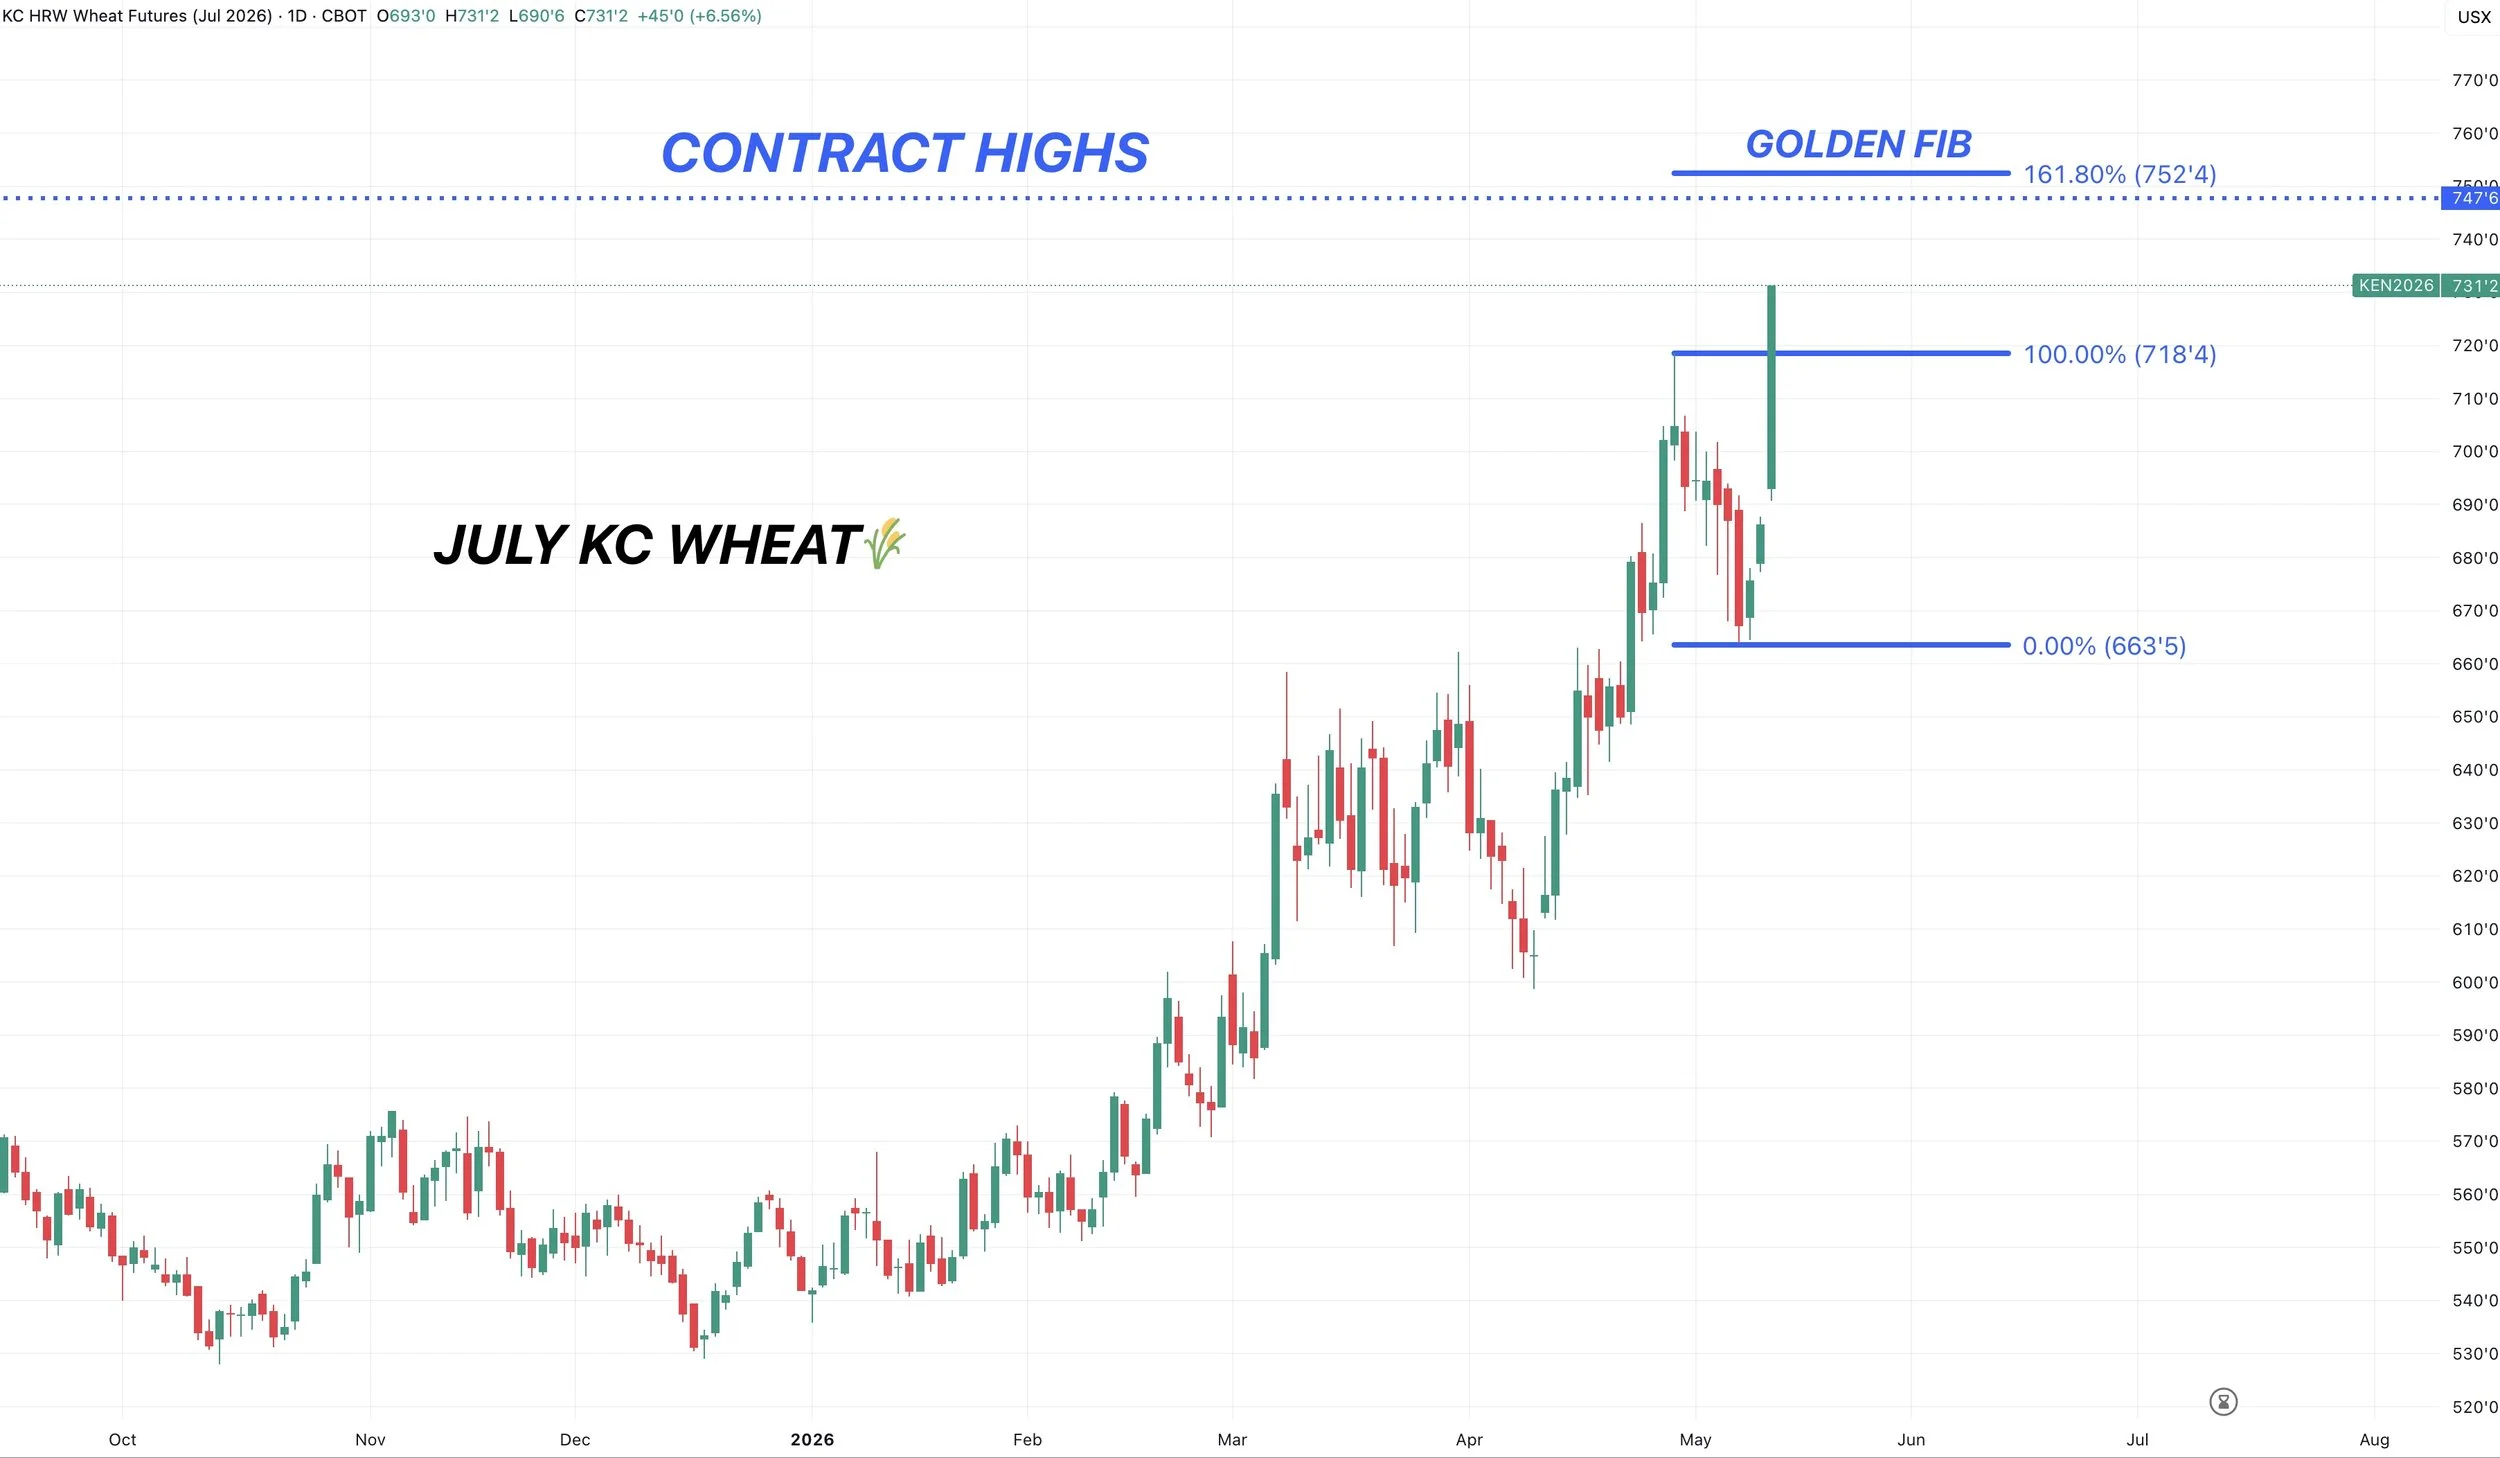
July KC Chart:
We bounced right in that support zone we talked about all week last week.
We've now posted fresh highs.
Now what?
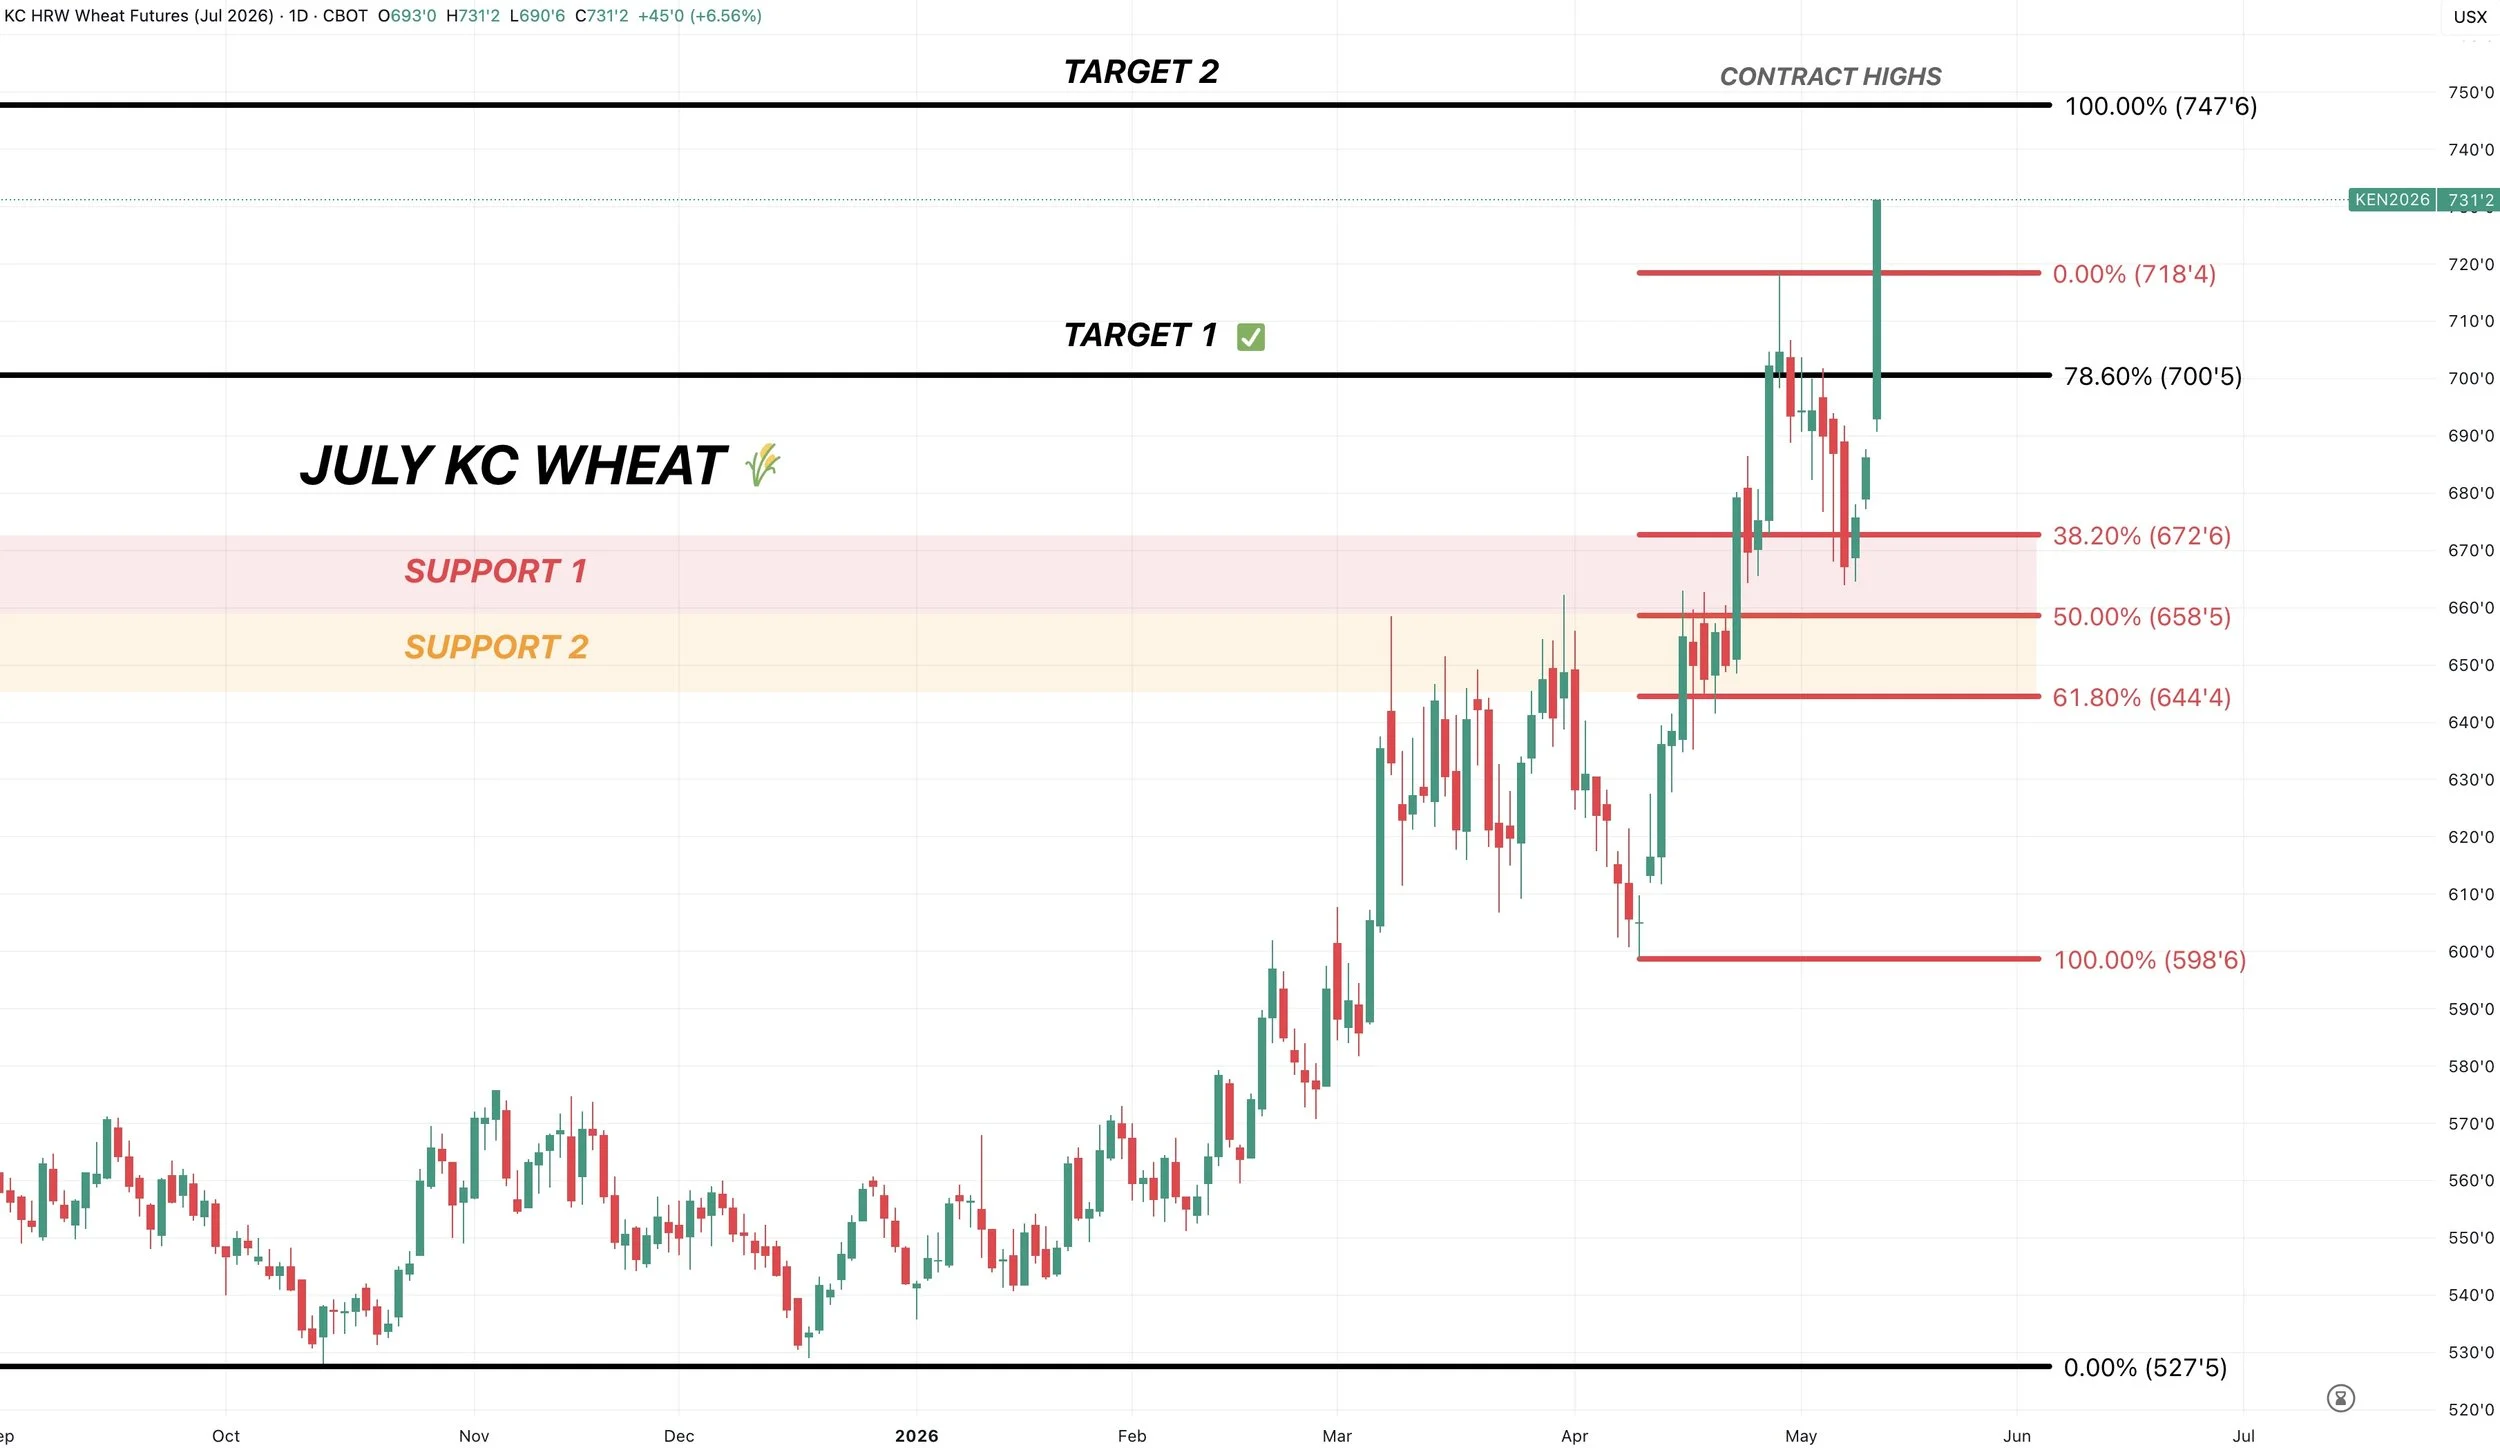
Next Target:
The next target is still going to be $7.45 to $7.50 as it has been for a long time now.
That is the contract highs.
It's also the golden fib from the recent sell off.
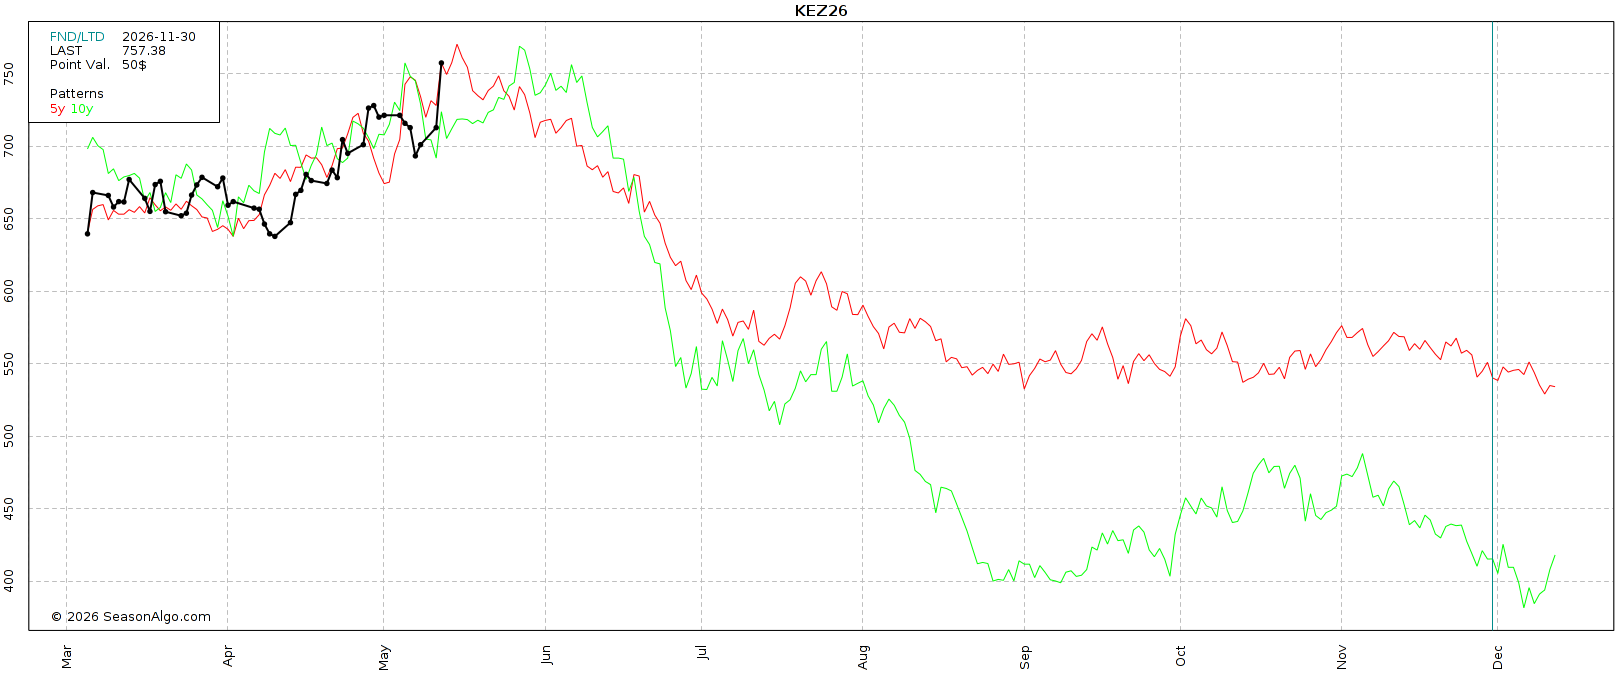
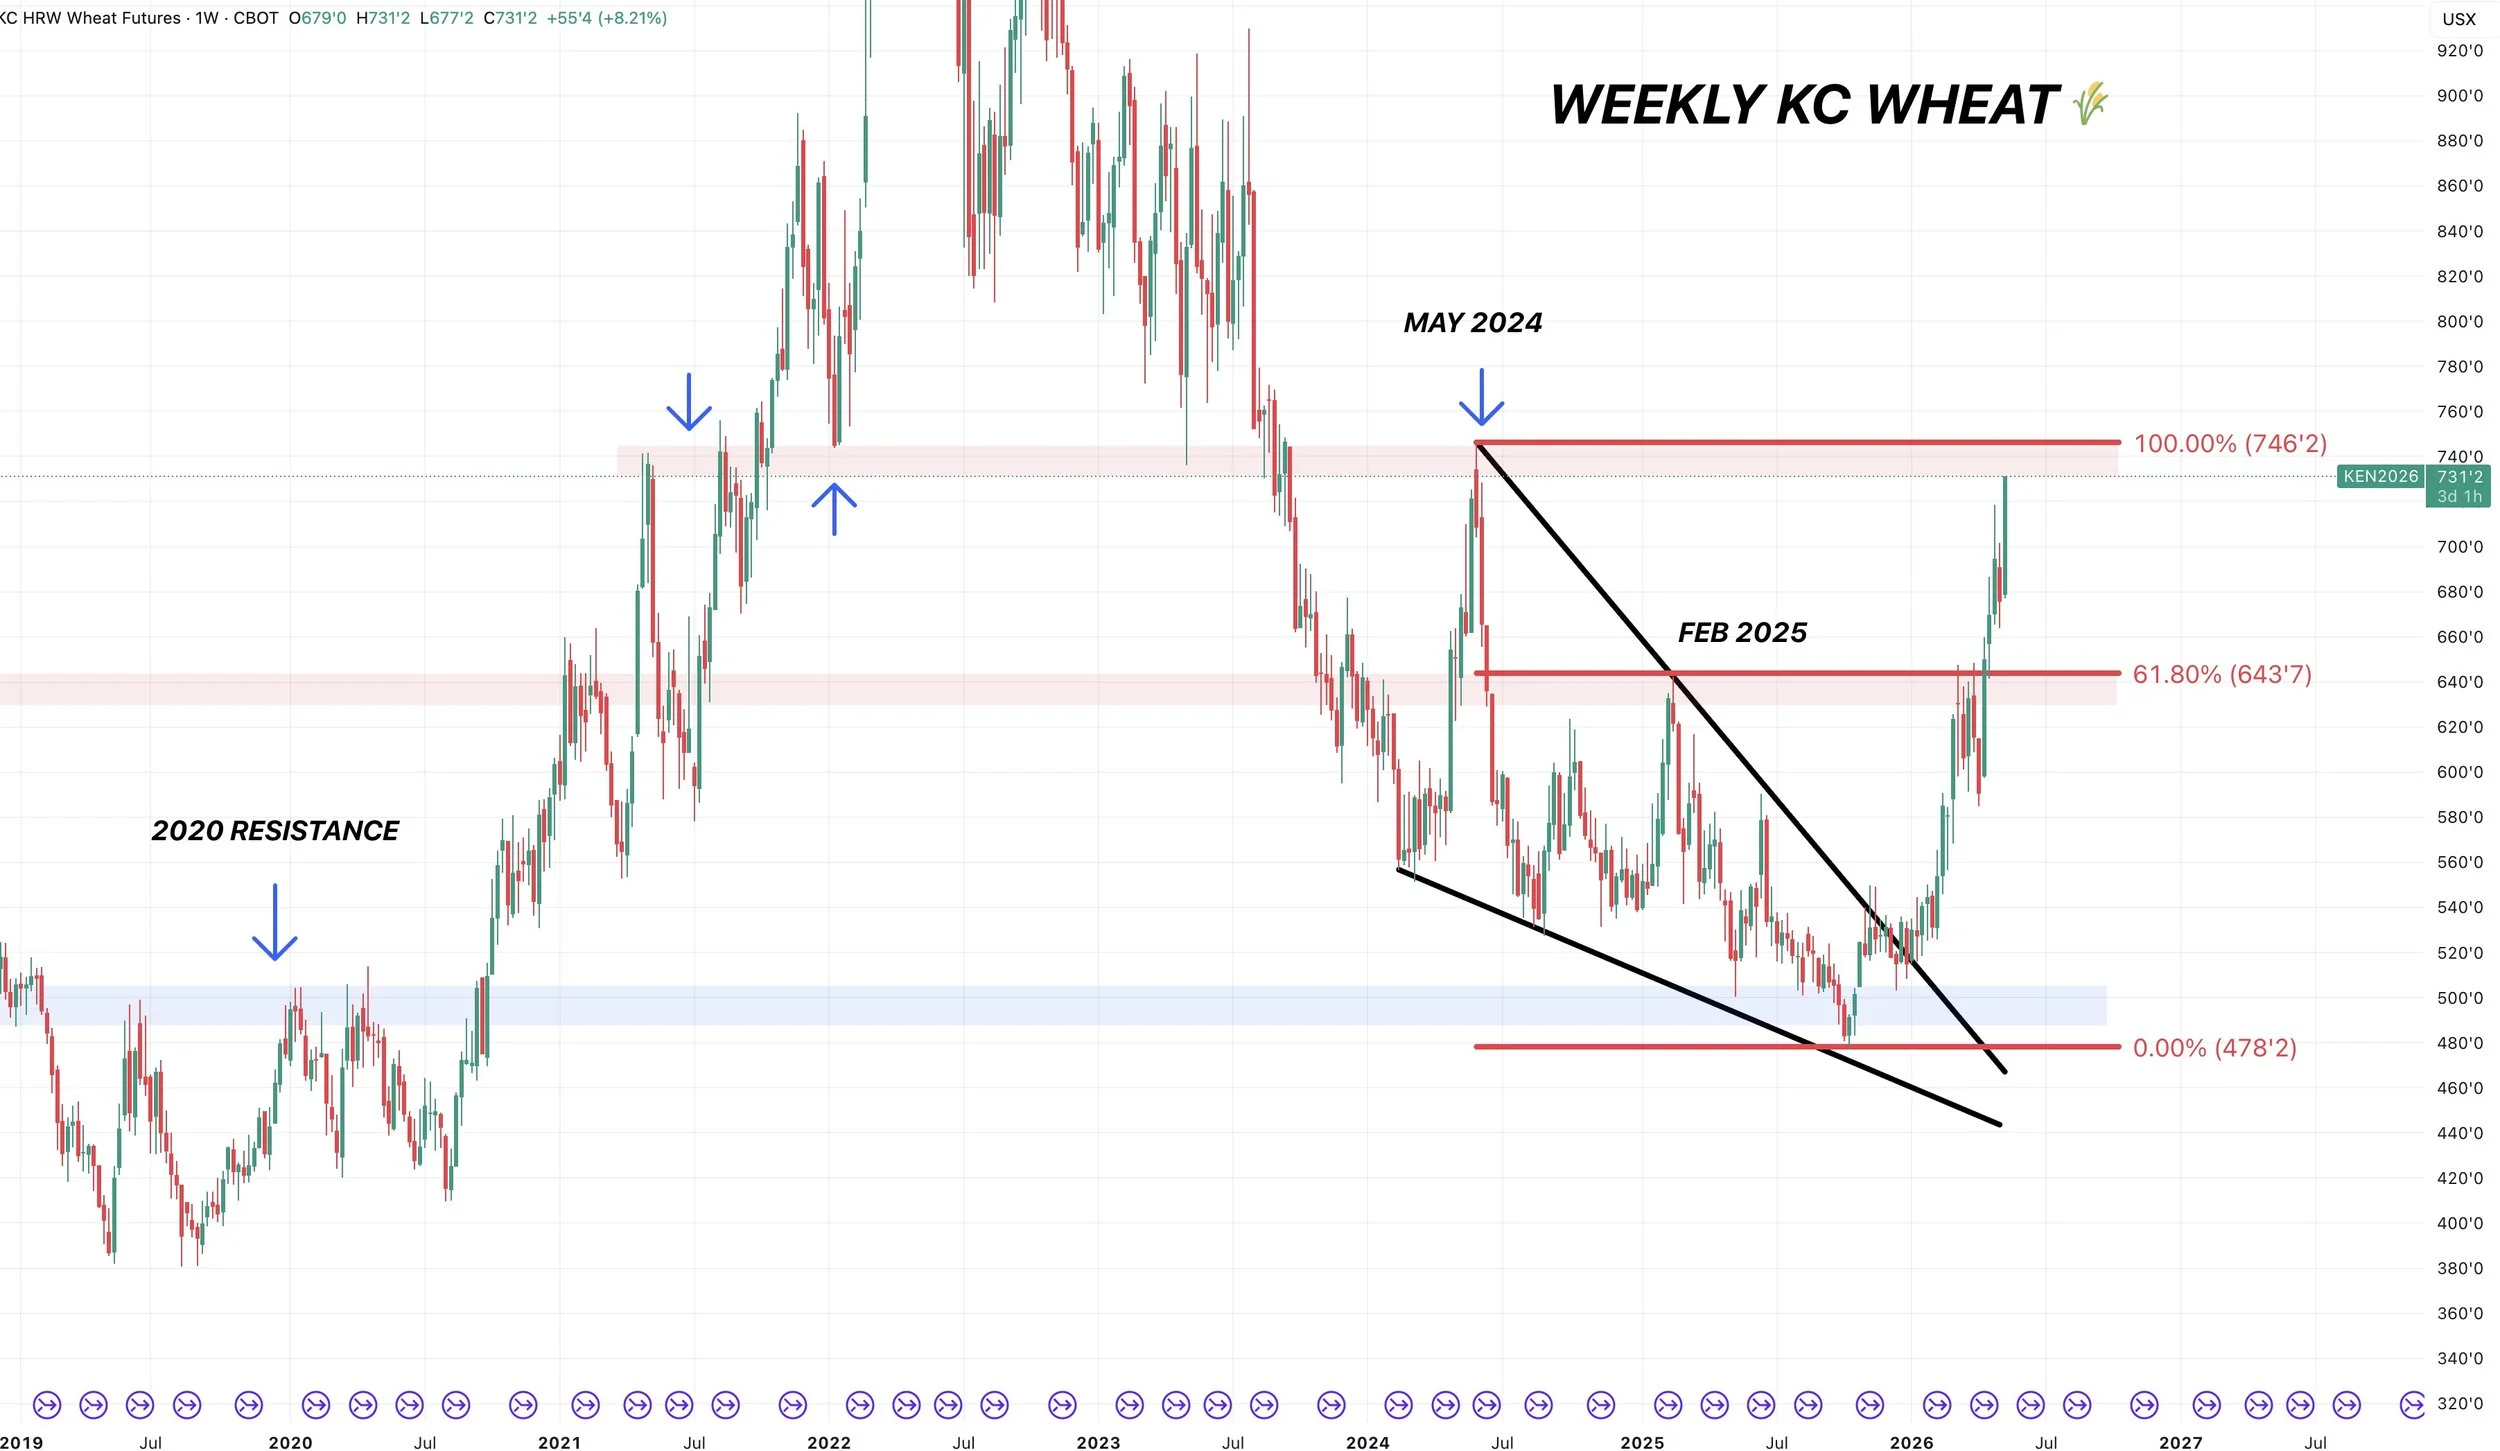
Big Picture Chart:
$7.50 has always been our major target for a while now. This chart is another reason for that.
We took out the highs from last year.
The next major resistance is the highs from May 2024. That same area has acted as big support and resistance on several occasions.
$7.50 should be a big level for this market.
If you manage to break through, then it does open the door quite a bit higher and $8.00 wheat becomes very possible.
But for now, that's the target.
I still think we've posted some major multi-year lows in this market.
With our first higher high since 2022 and the longest sustained rally in 5-years by a wide margin.
Long term I think the trend is higher for wheat.
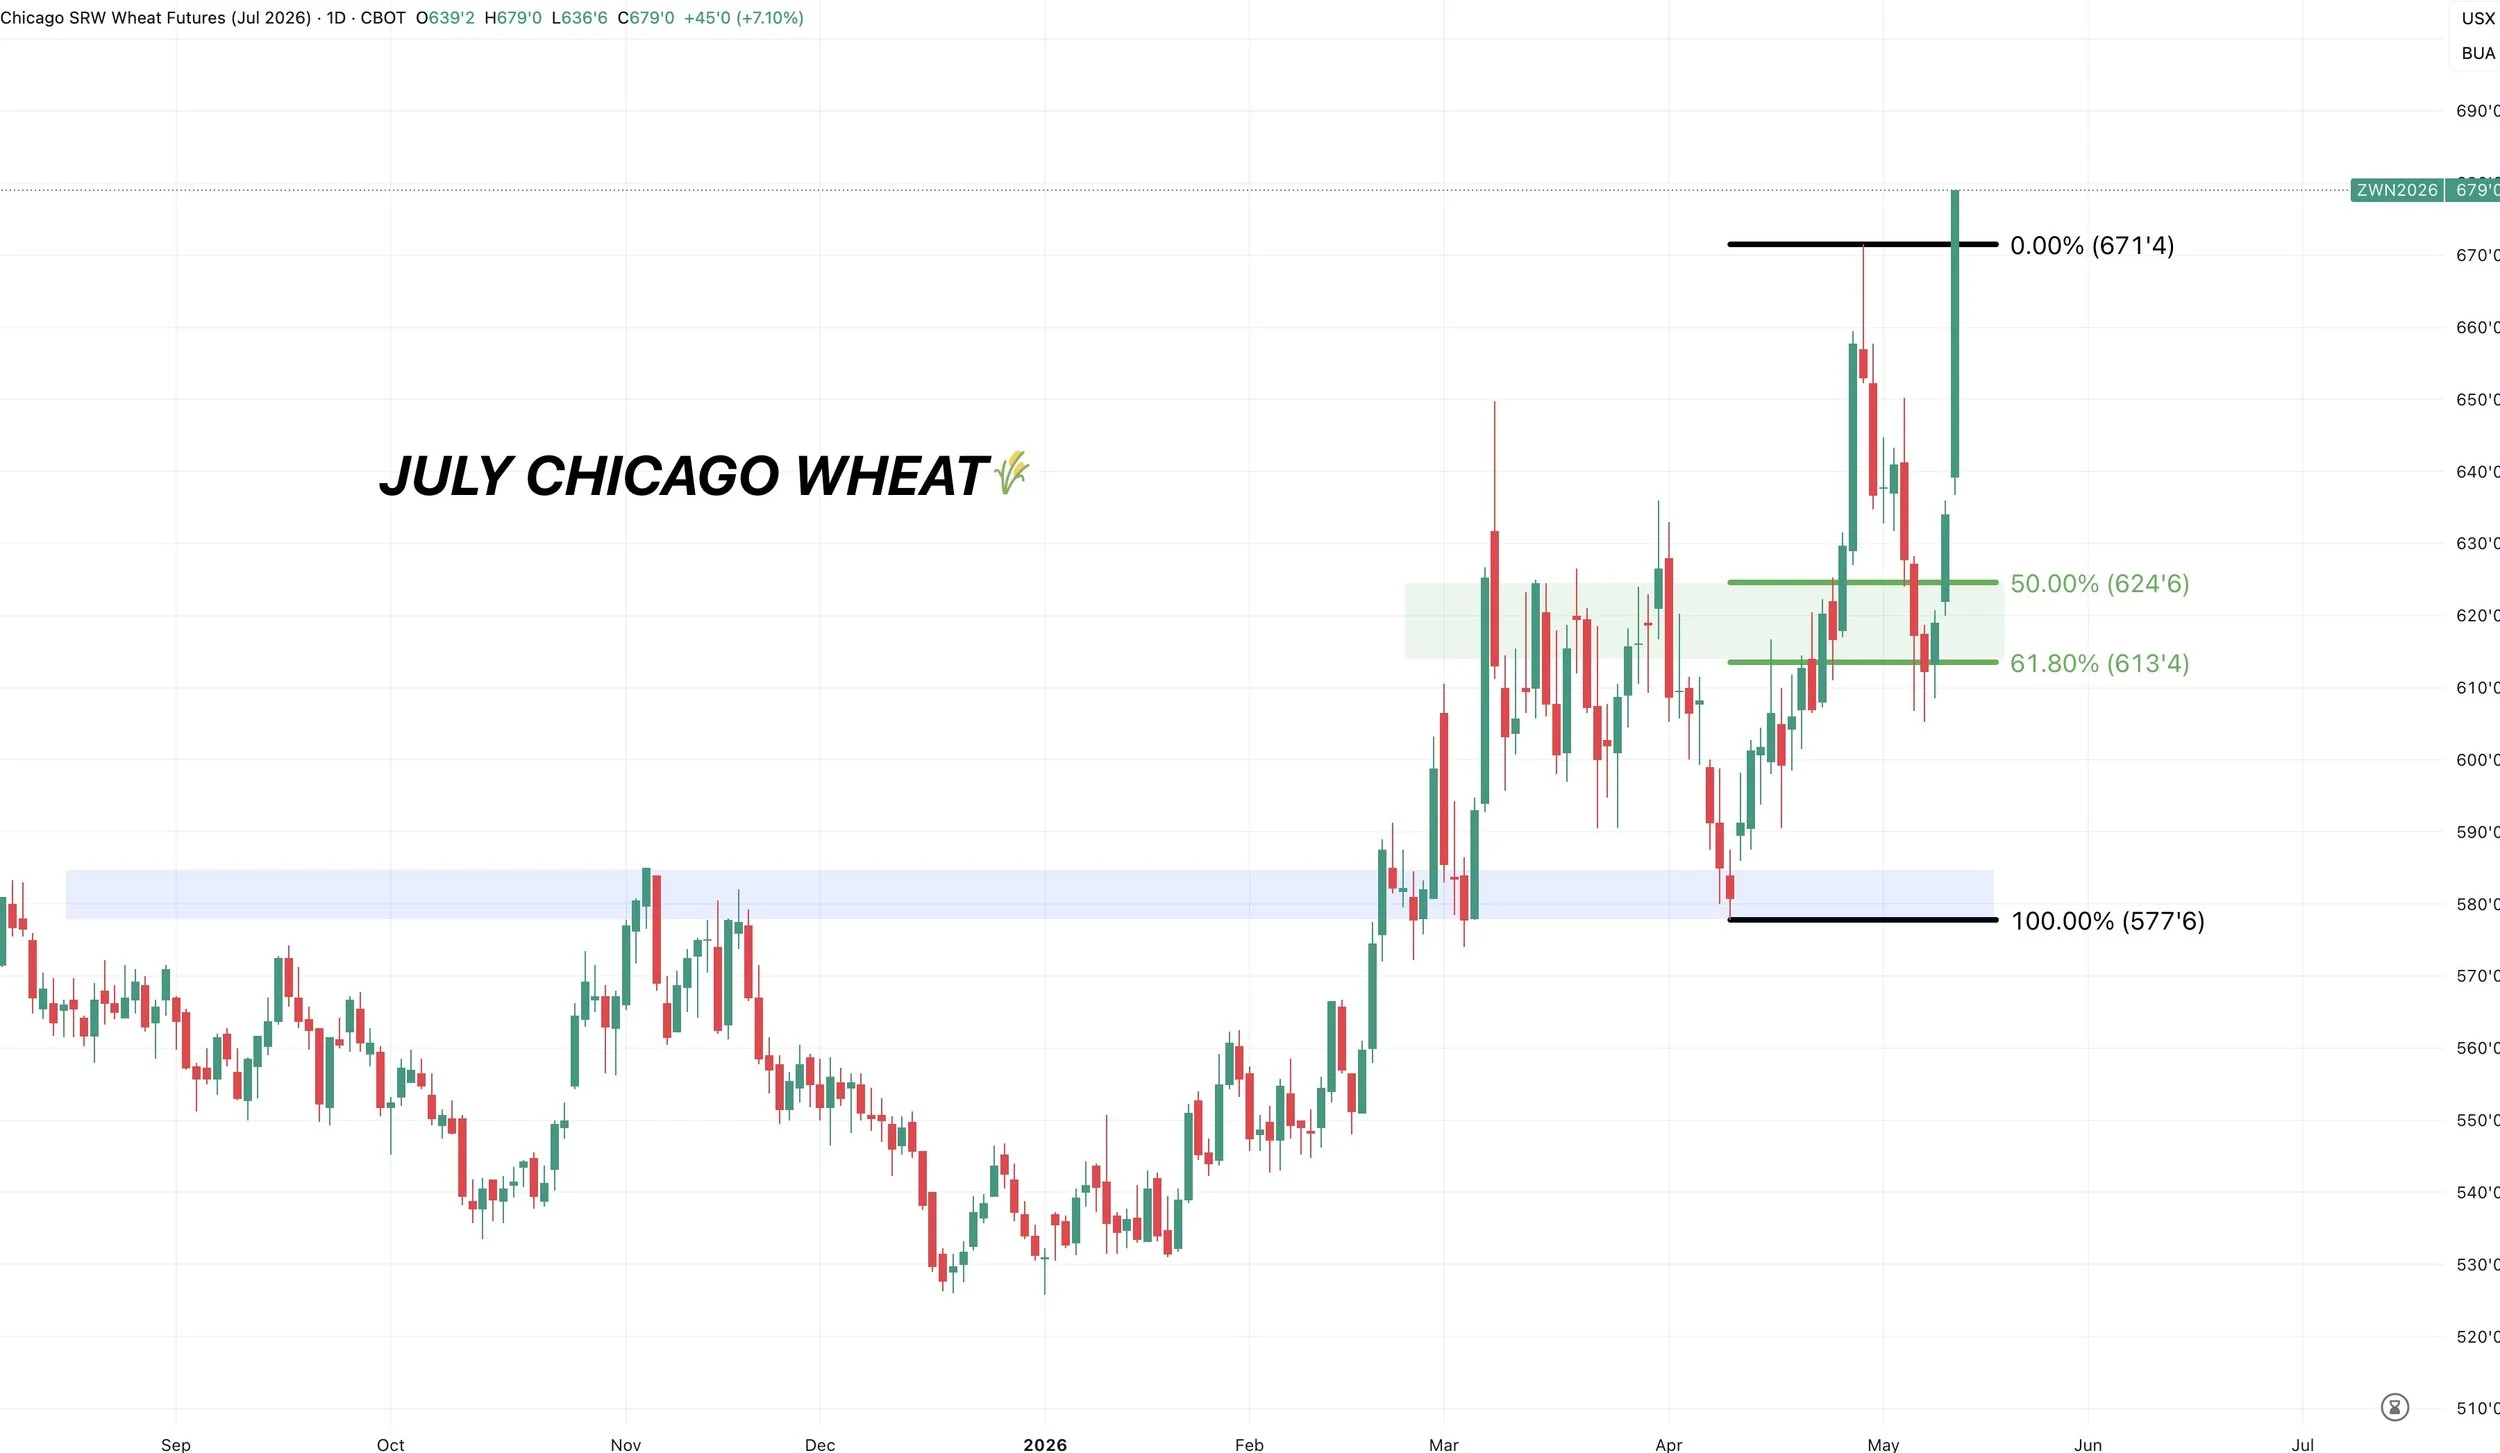
July Chicago Chart:
We had that must hold spot we talked about last week.
We held it perfectly.
Giving back 61.8% of the rallly before bouncing. Exactly what we wanted to see.
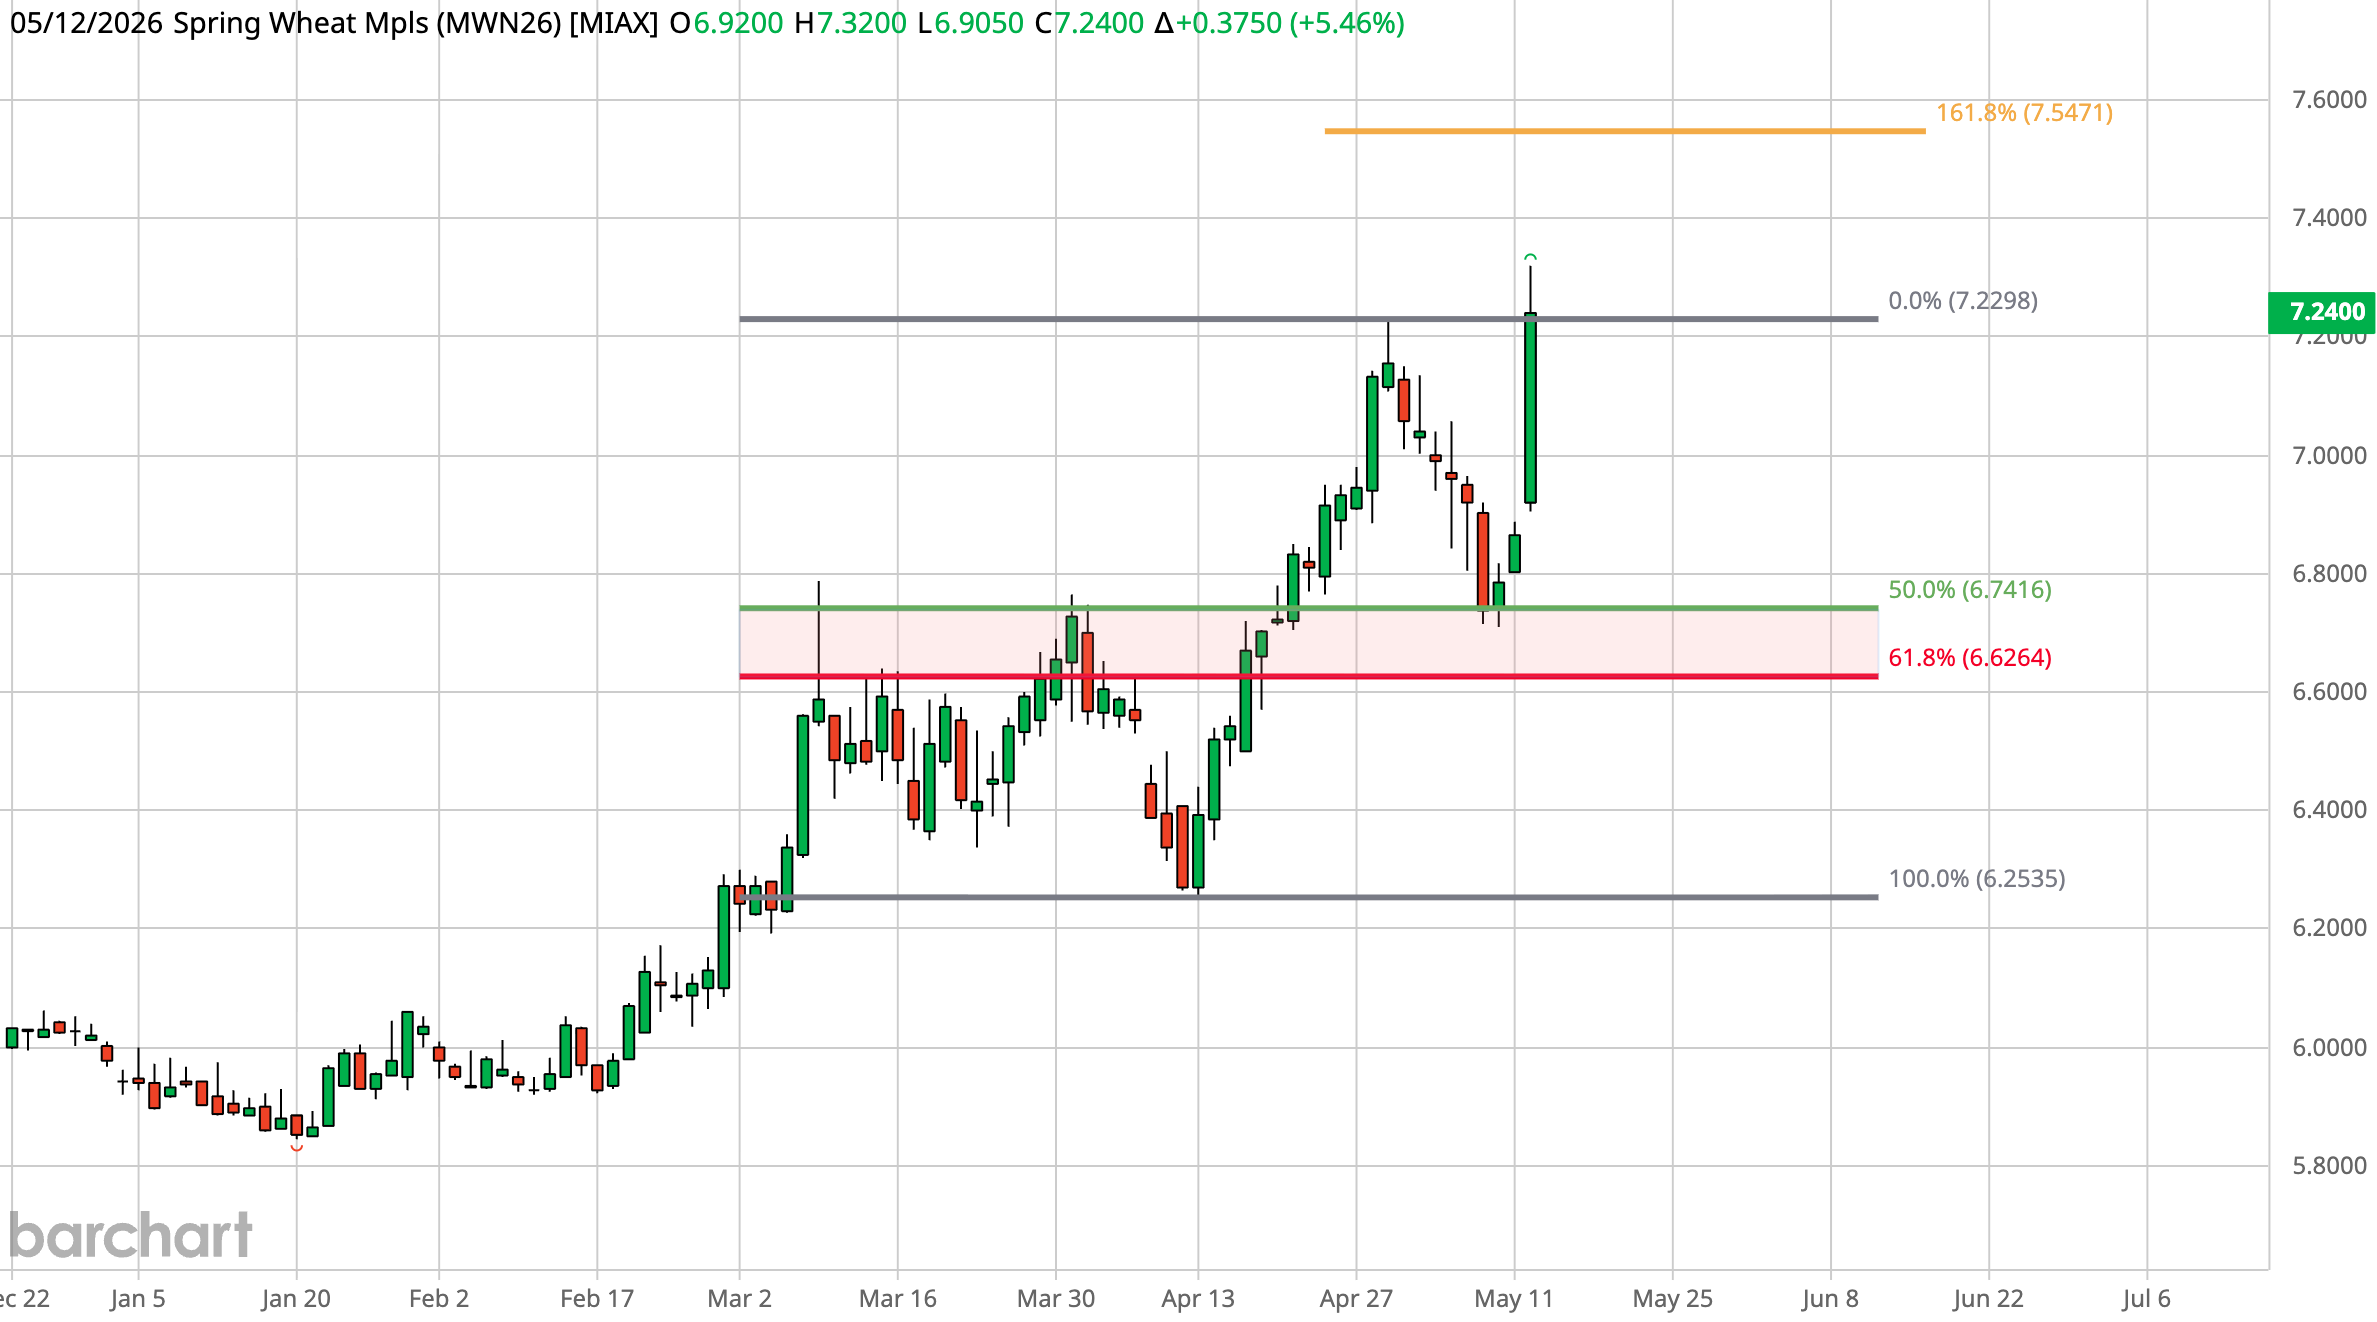
July MPLS Chart:
We bounced right in the golden zone where we needed to.
We posted new highs by a few cents if you missed out on the previous one.
A common next target would be $7.54 as that is the golden fib. Meaning it's 161.8% of the recent lows up to the March highs.
Cattle
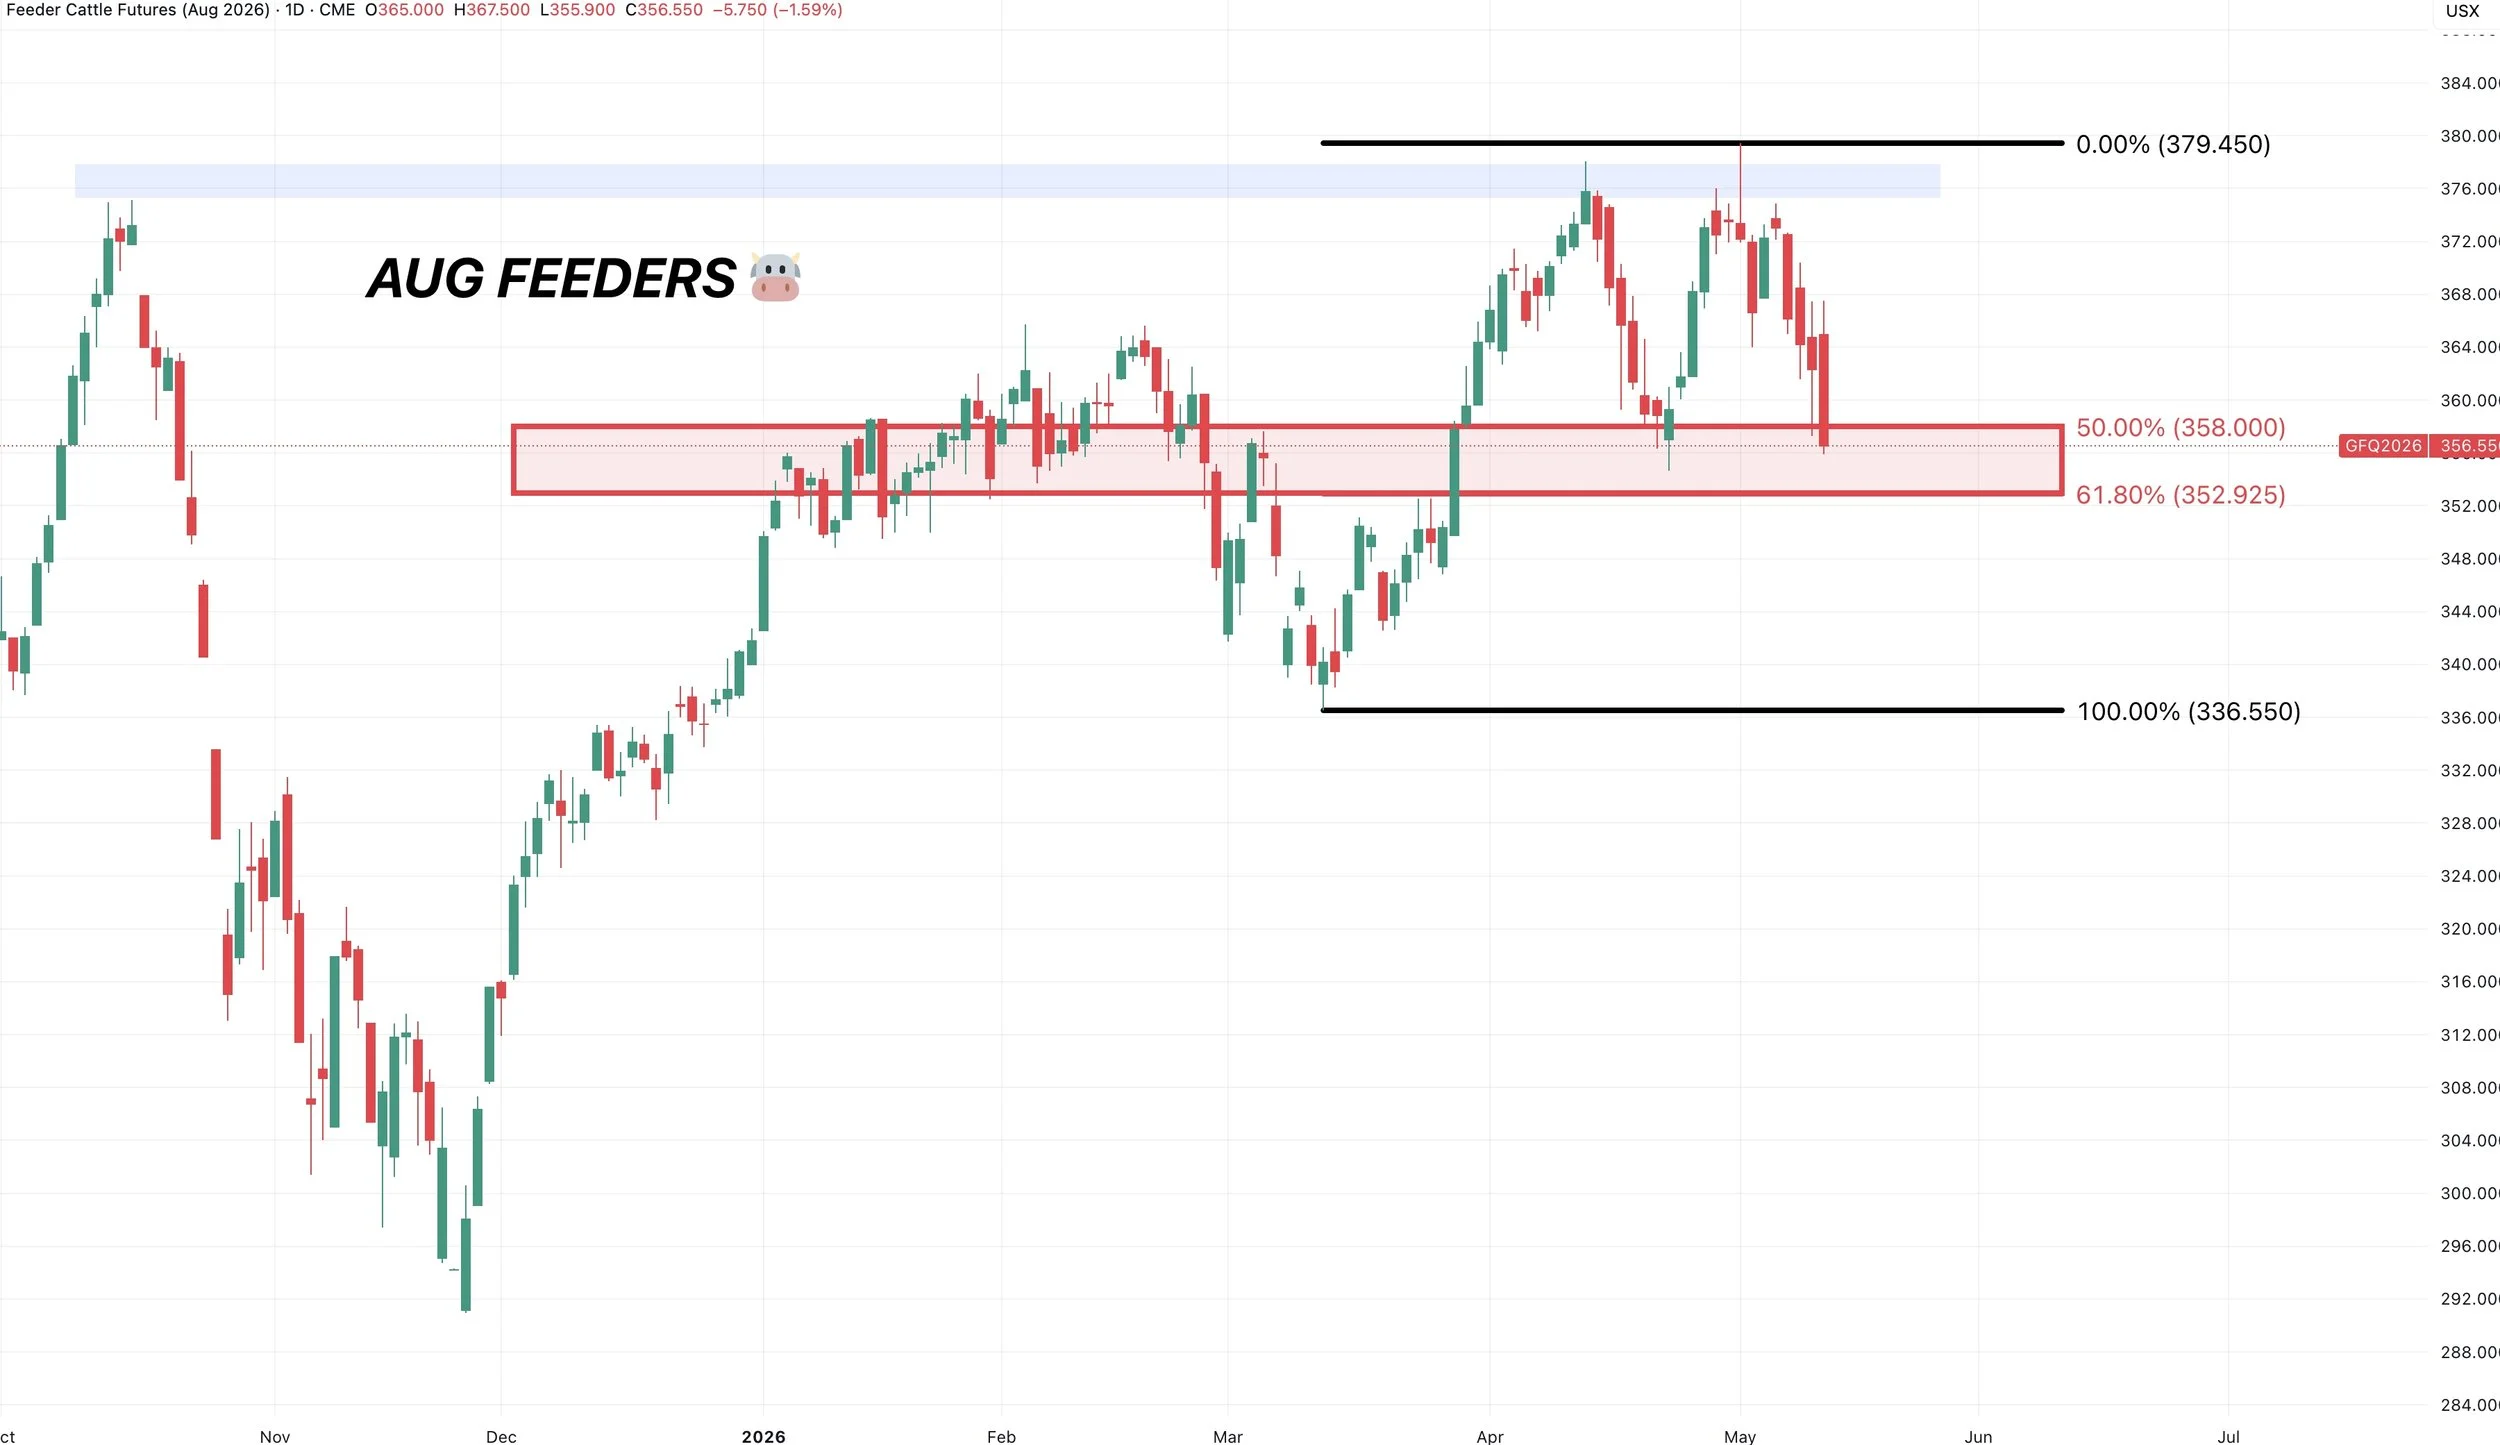
Aug Feeders Chart:
Feeders not looking too hot here, but nearing an important spot.
We are approaching essentially a must hold level.
The golden zone down to those March lows.
If we fail to hold this red box, it could spark a sizeable leg lower. And would tell us that this is likely more than your standard size correction but potentially the start of something bigger.
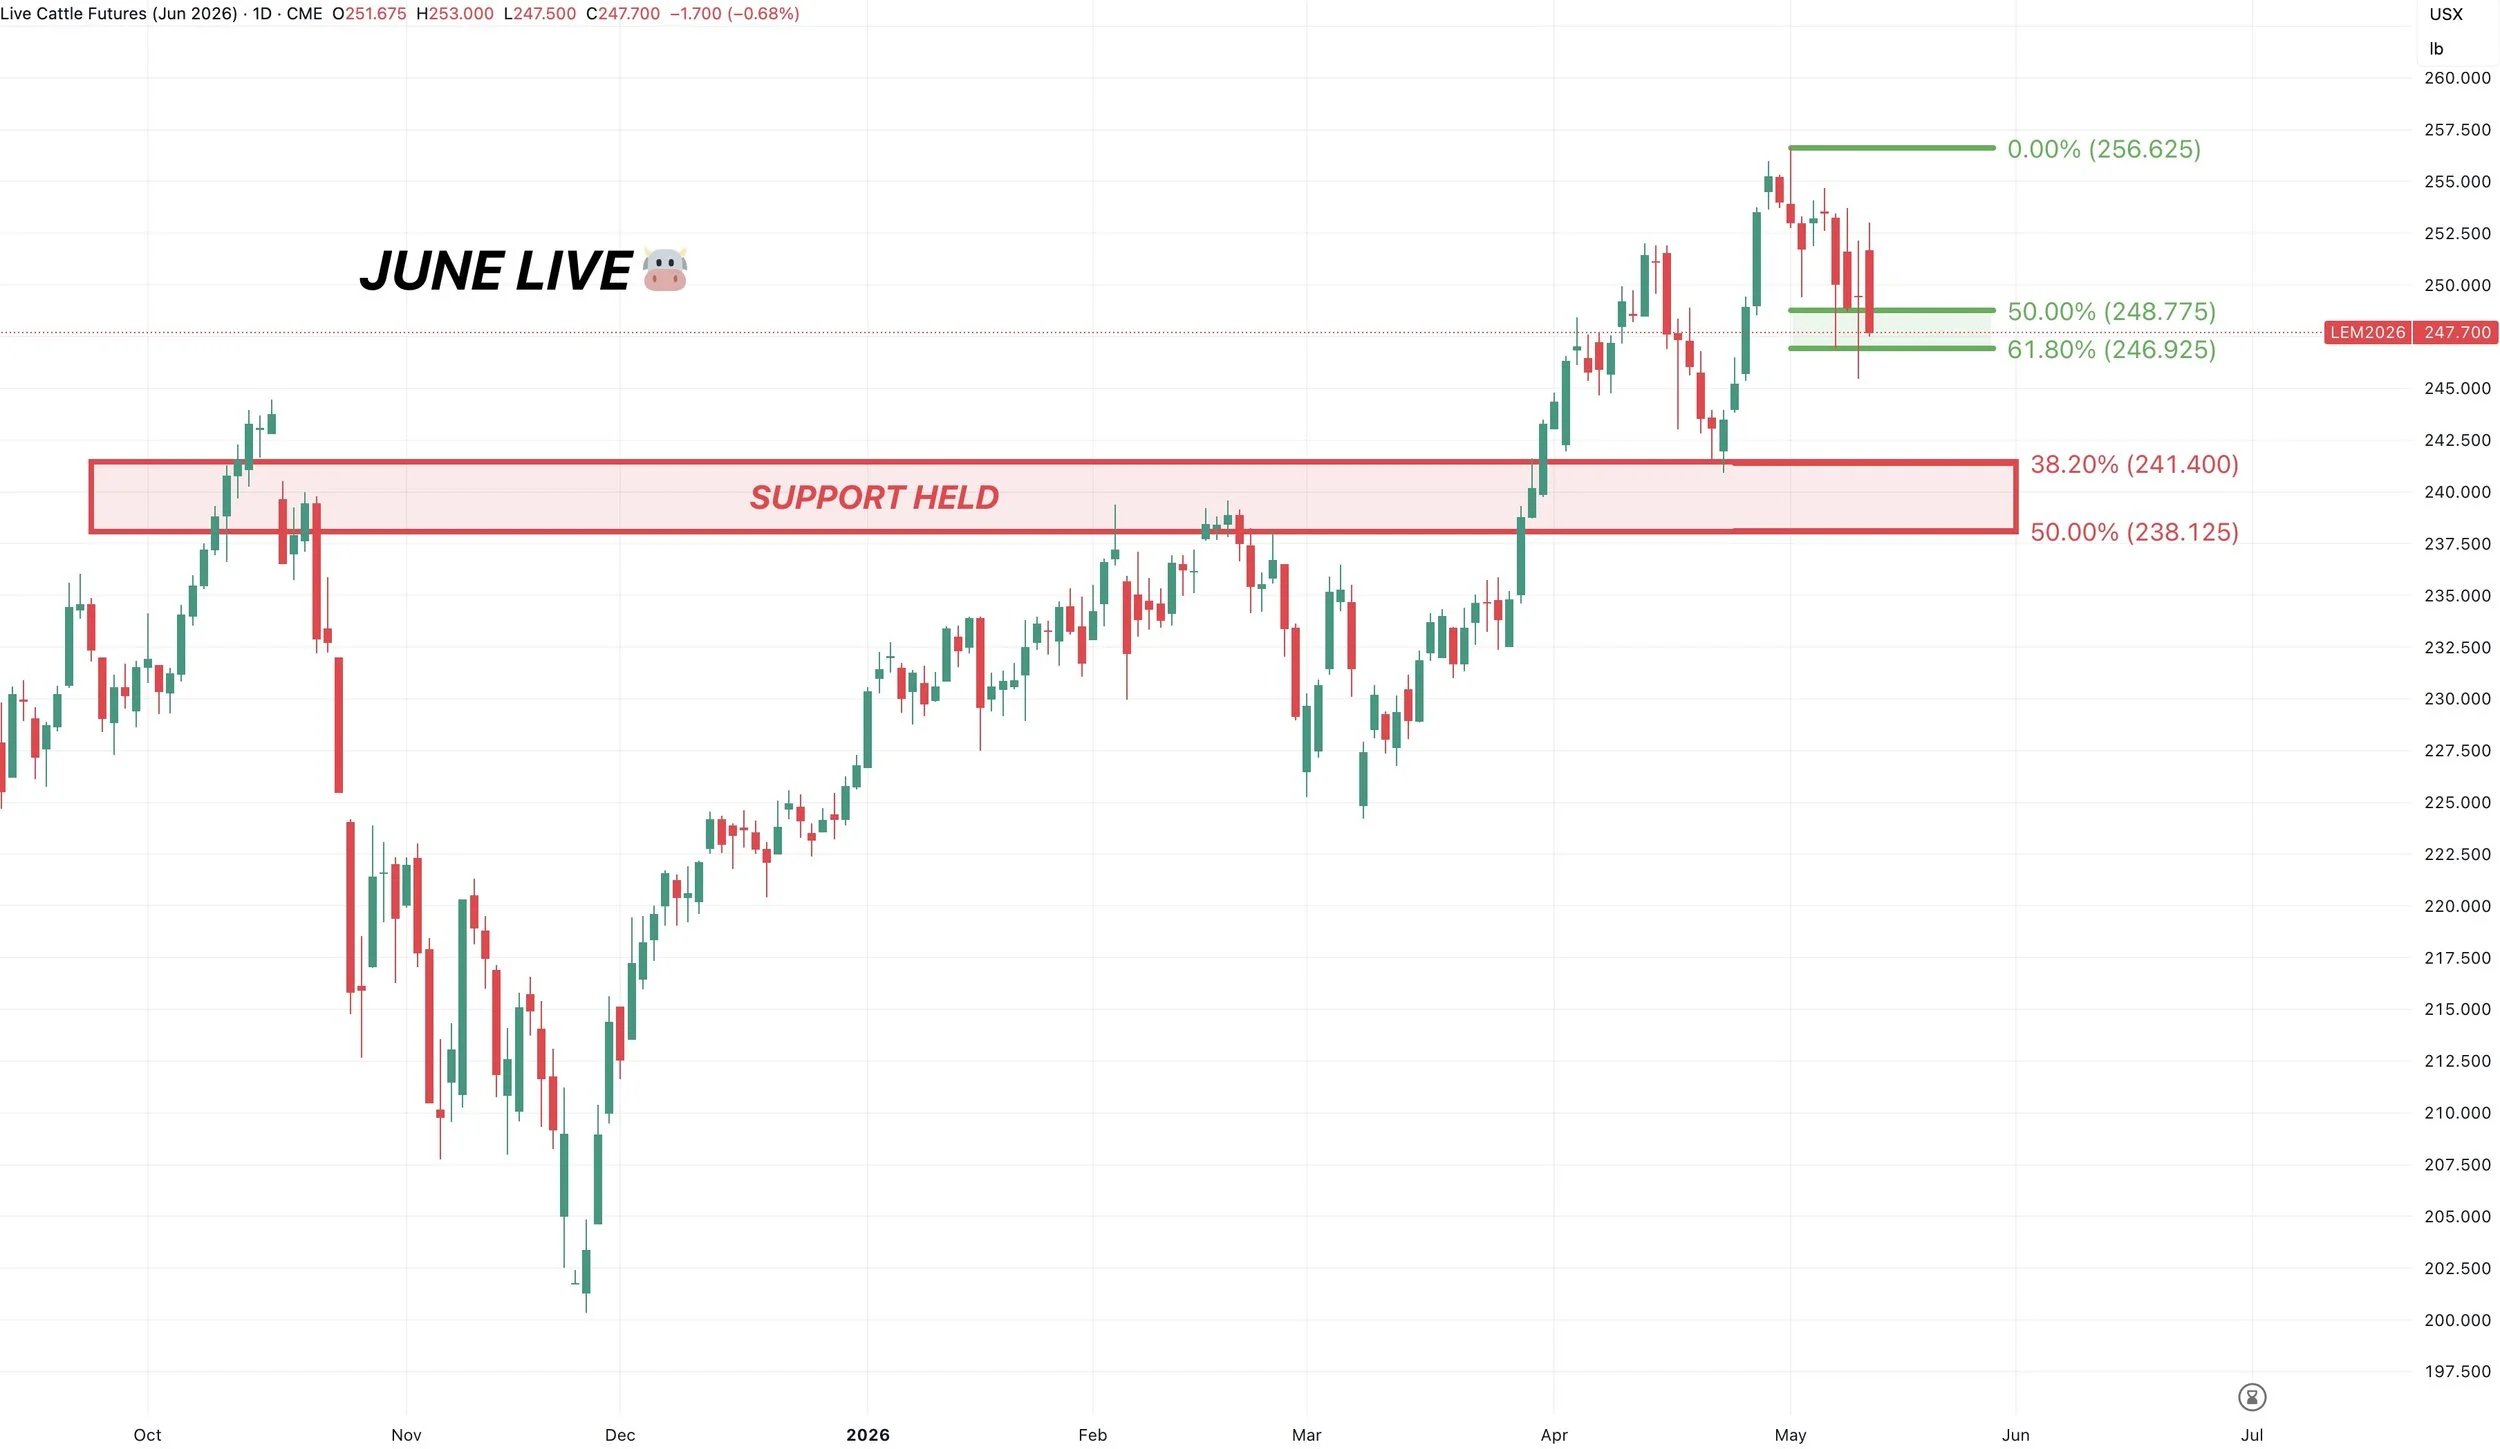
June Live Chart:
Live cattle looks a lot better than feeders and has held far better.
Live cattle is still holding the golden zone of the recent rally. Sitting right in it.
So if we are going to bounce, bulls need it to be here. Or we could go test those April lows.
Want to Talk?
Our phones are open 24/7 for you guys if you ever need anything or want to discuss your operation.
Jeremey & Office: (806)484-1214
Sebastian: (605)280-1186
Email: sfrost@dailymarketminute.com
Hedge Account
Interested in a hedge account? Use the link below to set up an account or give us a call.
Recent Signals
April 28th, 2026: 🌾
KC wheat specific signal.
CLICK HERE TO VIEW
April 27th, 2026: 🌽
Corn catch up sell signal.
CLICK HERE TO VIEW
April 10th, 2026: 🌽
Corn buy signal.
CLICK HERE TO VIEW
March 19th, 2026: 🌱
New crop soybeans signal & hedge alert.
CLICK HERE TO VIEW
March 9th, 2026: 🌱
Soybeans signal & hedge alert. Sent via text.
March 6th, 2026: 🌽 🌾
Corn & wheat sell signal & hedge alert.
March 3rd, 2026: 🌽
Old crop & new crop corn sell signal & hedge alert.
Feb 26th, 2026: 🌱
Old crop & new crop beans sell signal & hedge alert.
Feb 19th, 2026: 🌾
KC wheat sell signal & hedge alert.
Feb 6th, 2026: 🌽 🌱
Old crop corn & soybean sell signal & hedge alert.
Feb 4th, 2026: 🌱
Soybean sell signal & hedge alert.
Nov 17th, 2025: 🌱
Soybean sell signal & hedge alert.