
CORN SITUATION & CATTLE BREAK OUT?
MARKET UPDATE
You can scroll to read the usual update as well. As the written version is the exact same as the video.
Timestamps for video:
Overview: 0:00min
Corn: 1:25min
Bean: 5:35min
Wheat: 9:25min
Cattle: 10:40min
Want to talk about your situation?
(605)295-3100
Our harvest offer ends soon
Don’t miss future updates & our next signal before your trial ends
Futures Prices Close
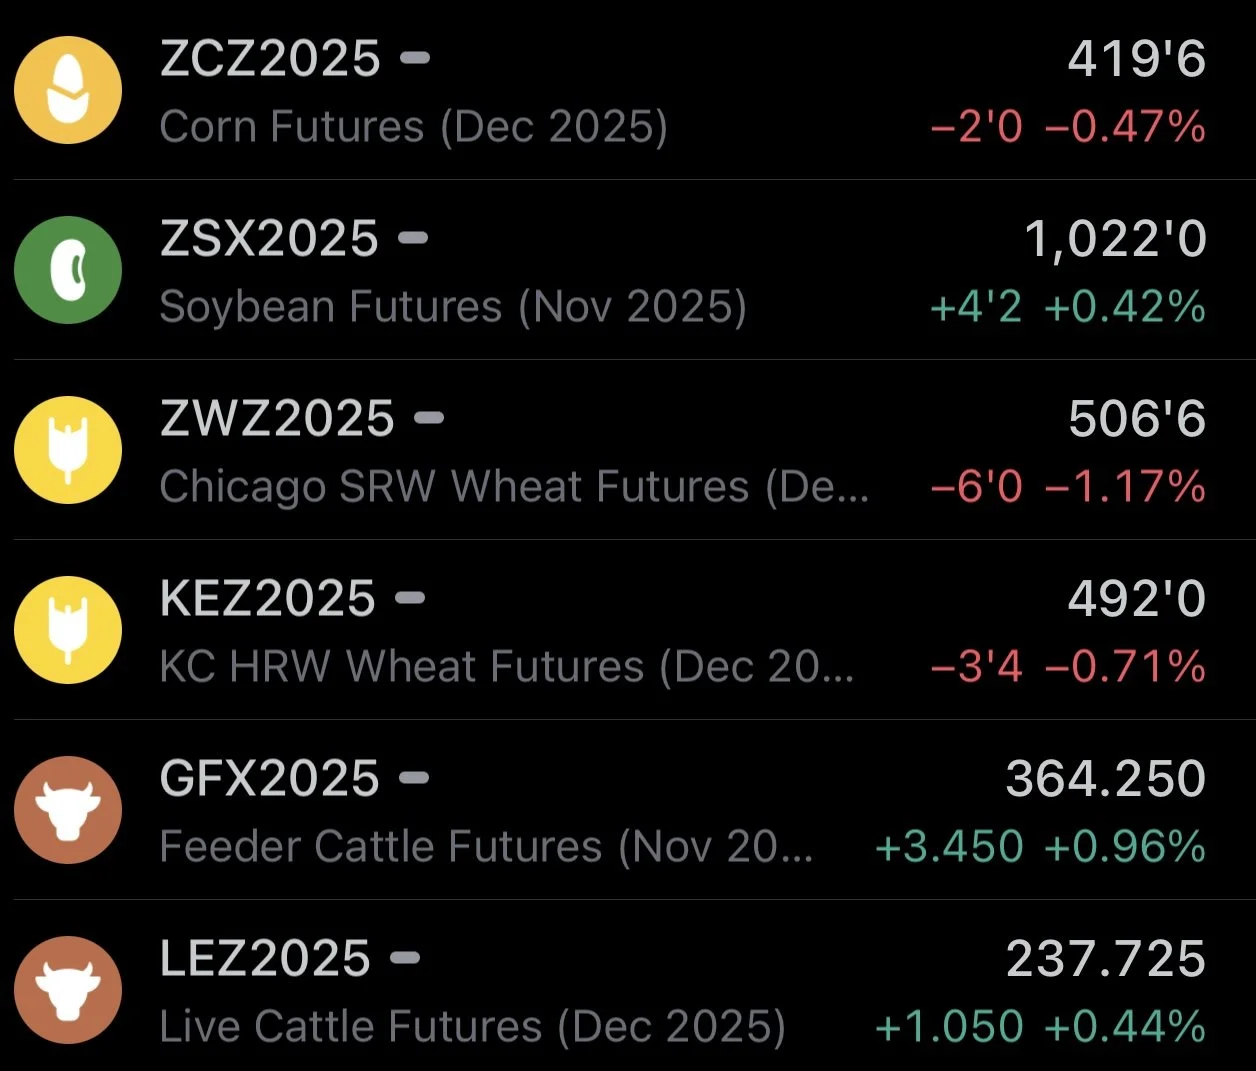
Overview
Grains mixed with soybeans leading the way higher on optimism of trade aid, while the wheat market leads the way lower.
Meanwhile, the cattle market bounces right at some crucial support off the back of screwworm news and no trade deal between Brazil and the US.
Thursday was supposed to be the October USDA report. That is not happening.
This is now day 7 of the government shutdown.
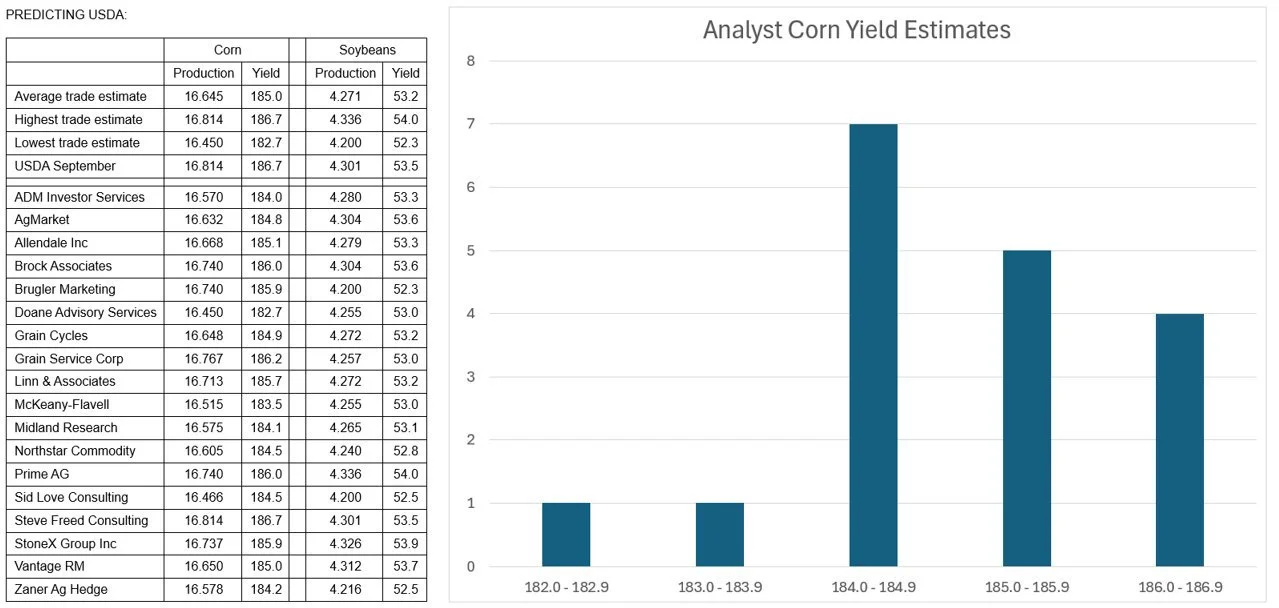
However, despite there not being a report. The analysts still provided their estimates for the report.
Corn Yield: 185 (186.7 in Sep)
Bean Yield: 53.2 (53.5 in Sep)
Chart from Allendale
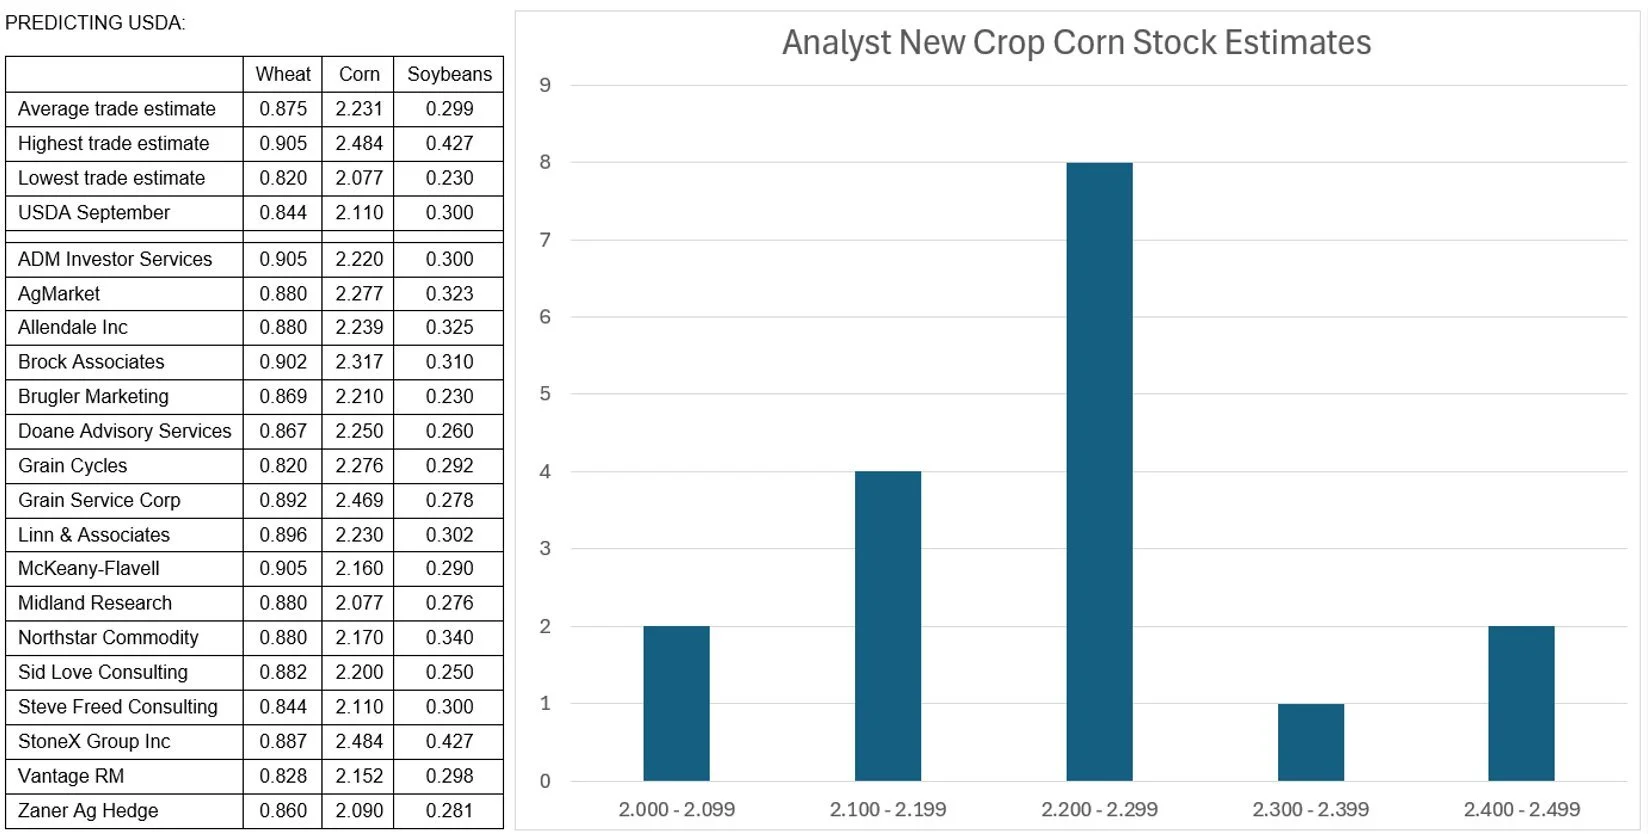
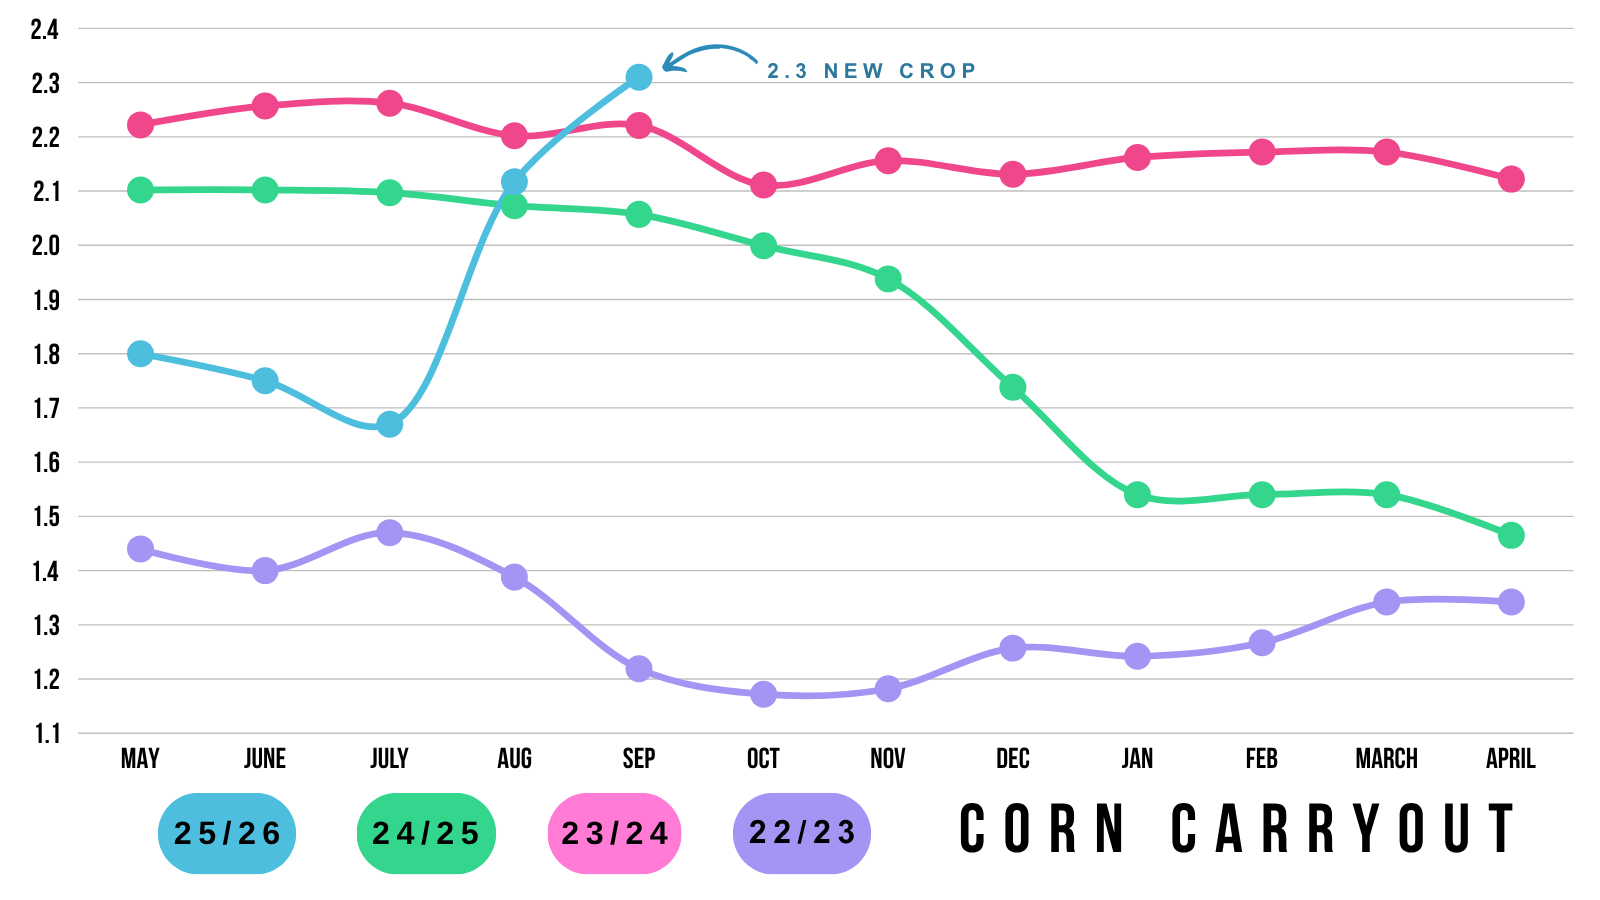
Corn Carryout: 2.231 (2.110 in Sep)
Bean Carryout: 0.299 (0.300 in Sep)
Wheat Carryout: 0.875 (0.844 in Sep)
Corn stocks are projected to be higher due to that quarterly stocks report. Where the USDA was +200 million too high on their old crop feed demand numbers, which automaically got added to the new crop balance sheet in the form of beginning stocks.
Chart from Allendale
Today's Main Takeaways
Corn
Despite harvest ramping up fast, sitting around 30% complete based on the estimates. The corn market isn’t seeing any major harvest pressure.
The market is definitely aware that yield is smaller, some think it could be drastically smaller. Hence why we are hanging in there.
From a pure fundamental standpoint, you could argue corn should be heading lower.
I mean we are looking at a 2.2 to 2.3 billion bu carryout.
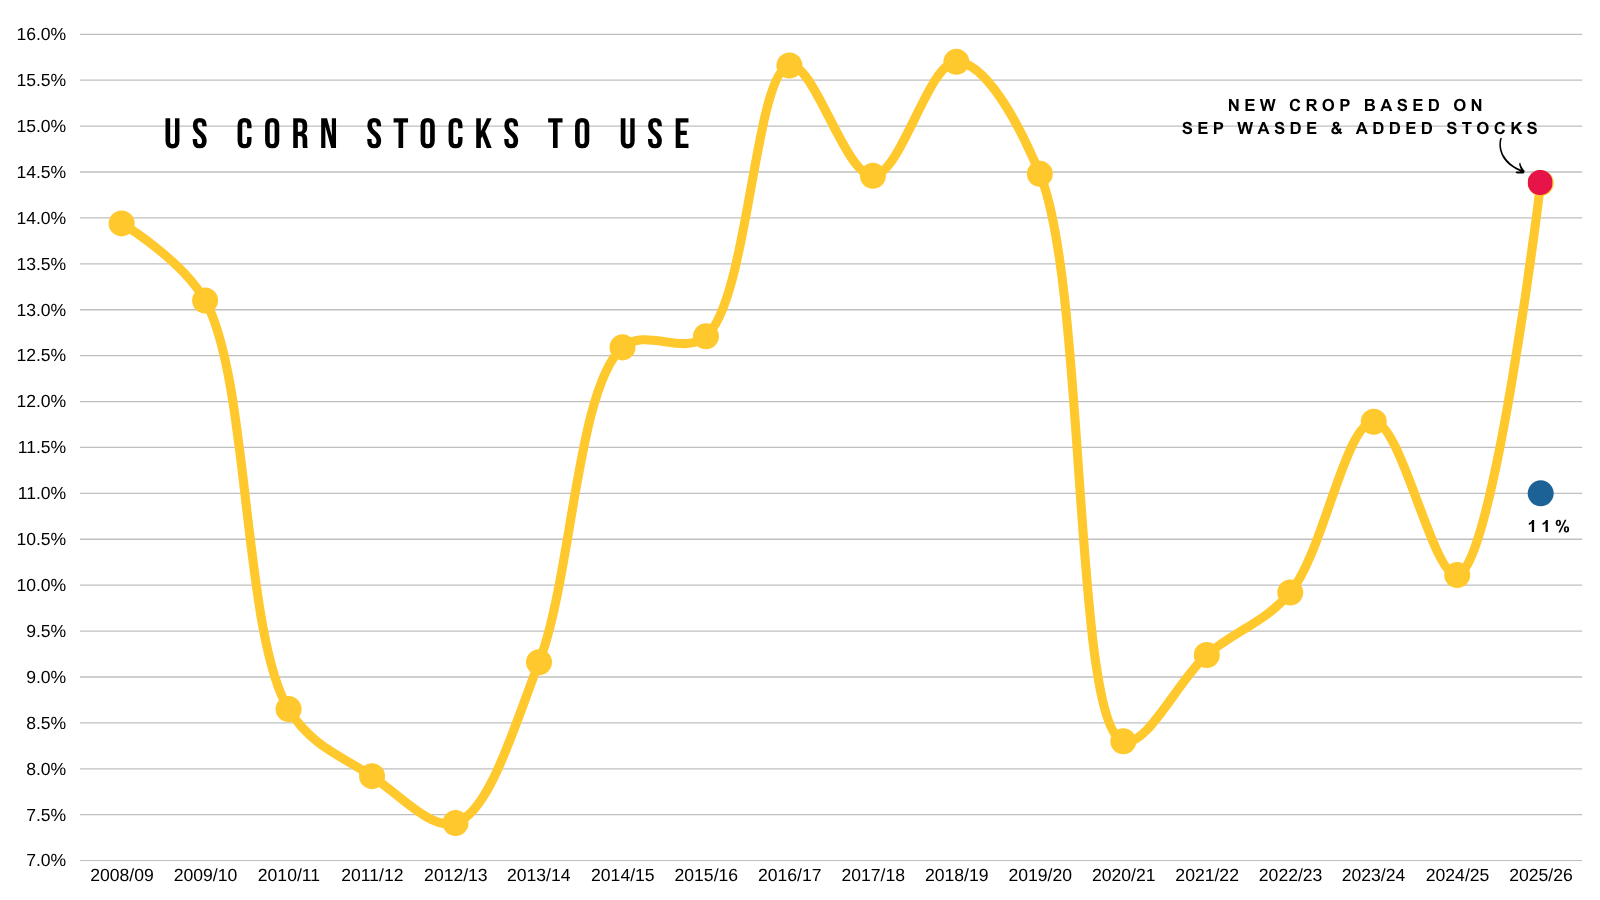
Which would peg out stocks to use ratio at some pretty high levels.
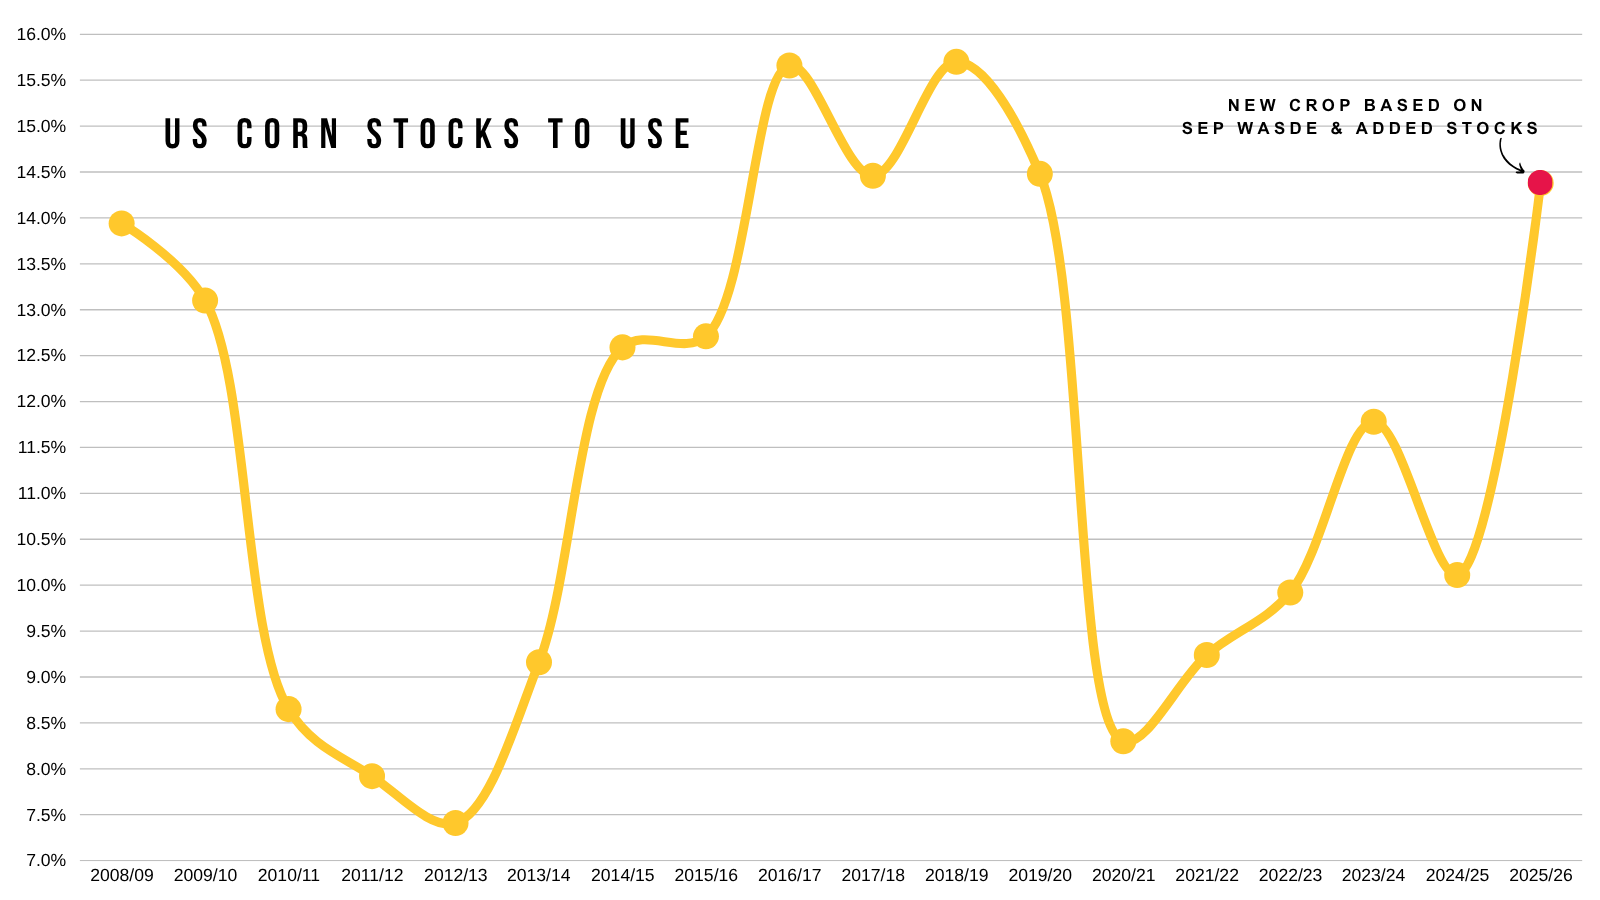
Given the extra acres, even if yield dropped to 180 and you left demand unchanged, it would still only print around an 11% stocks to use which isn’t super bearish, but it's not crazy bullish by any means either.
Here is the rough current balance sheet vs with a 180 yield and no demand changes.


Here is what that 11% would look like compared to other years.
Way less burdensome than the current projections, still not out of this world bullish.
We have to keep in mind, that even if yield falls. The USDA will also be taking feed & residual demand back which could offset some of this.
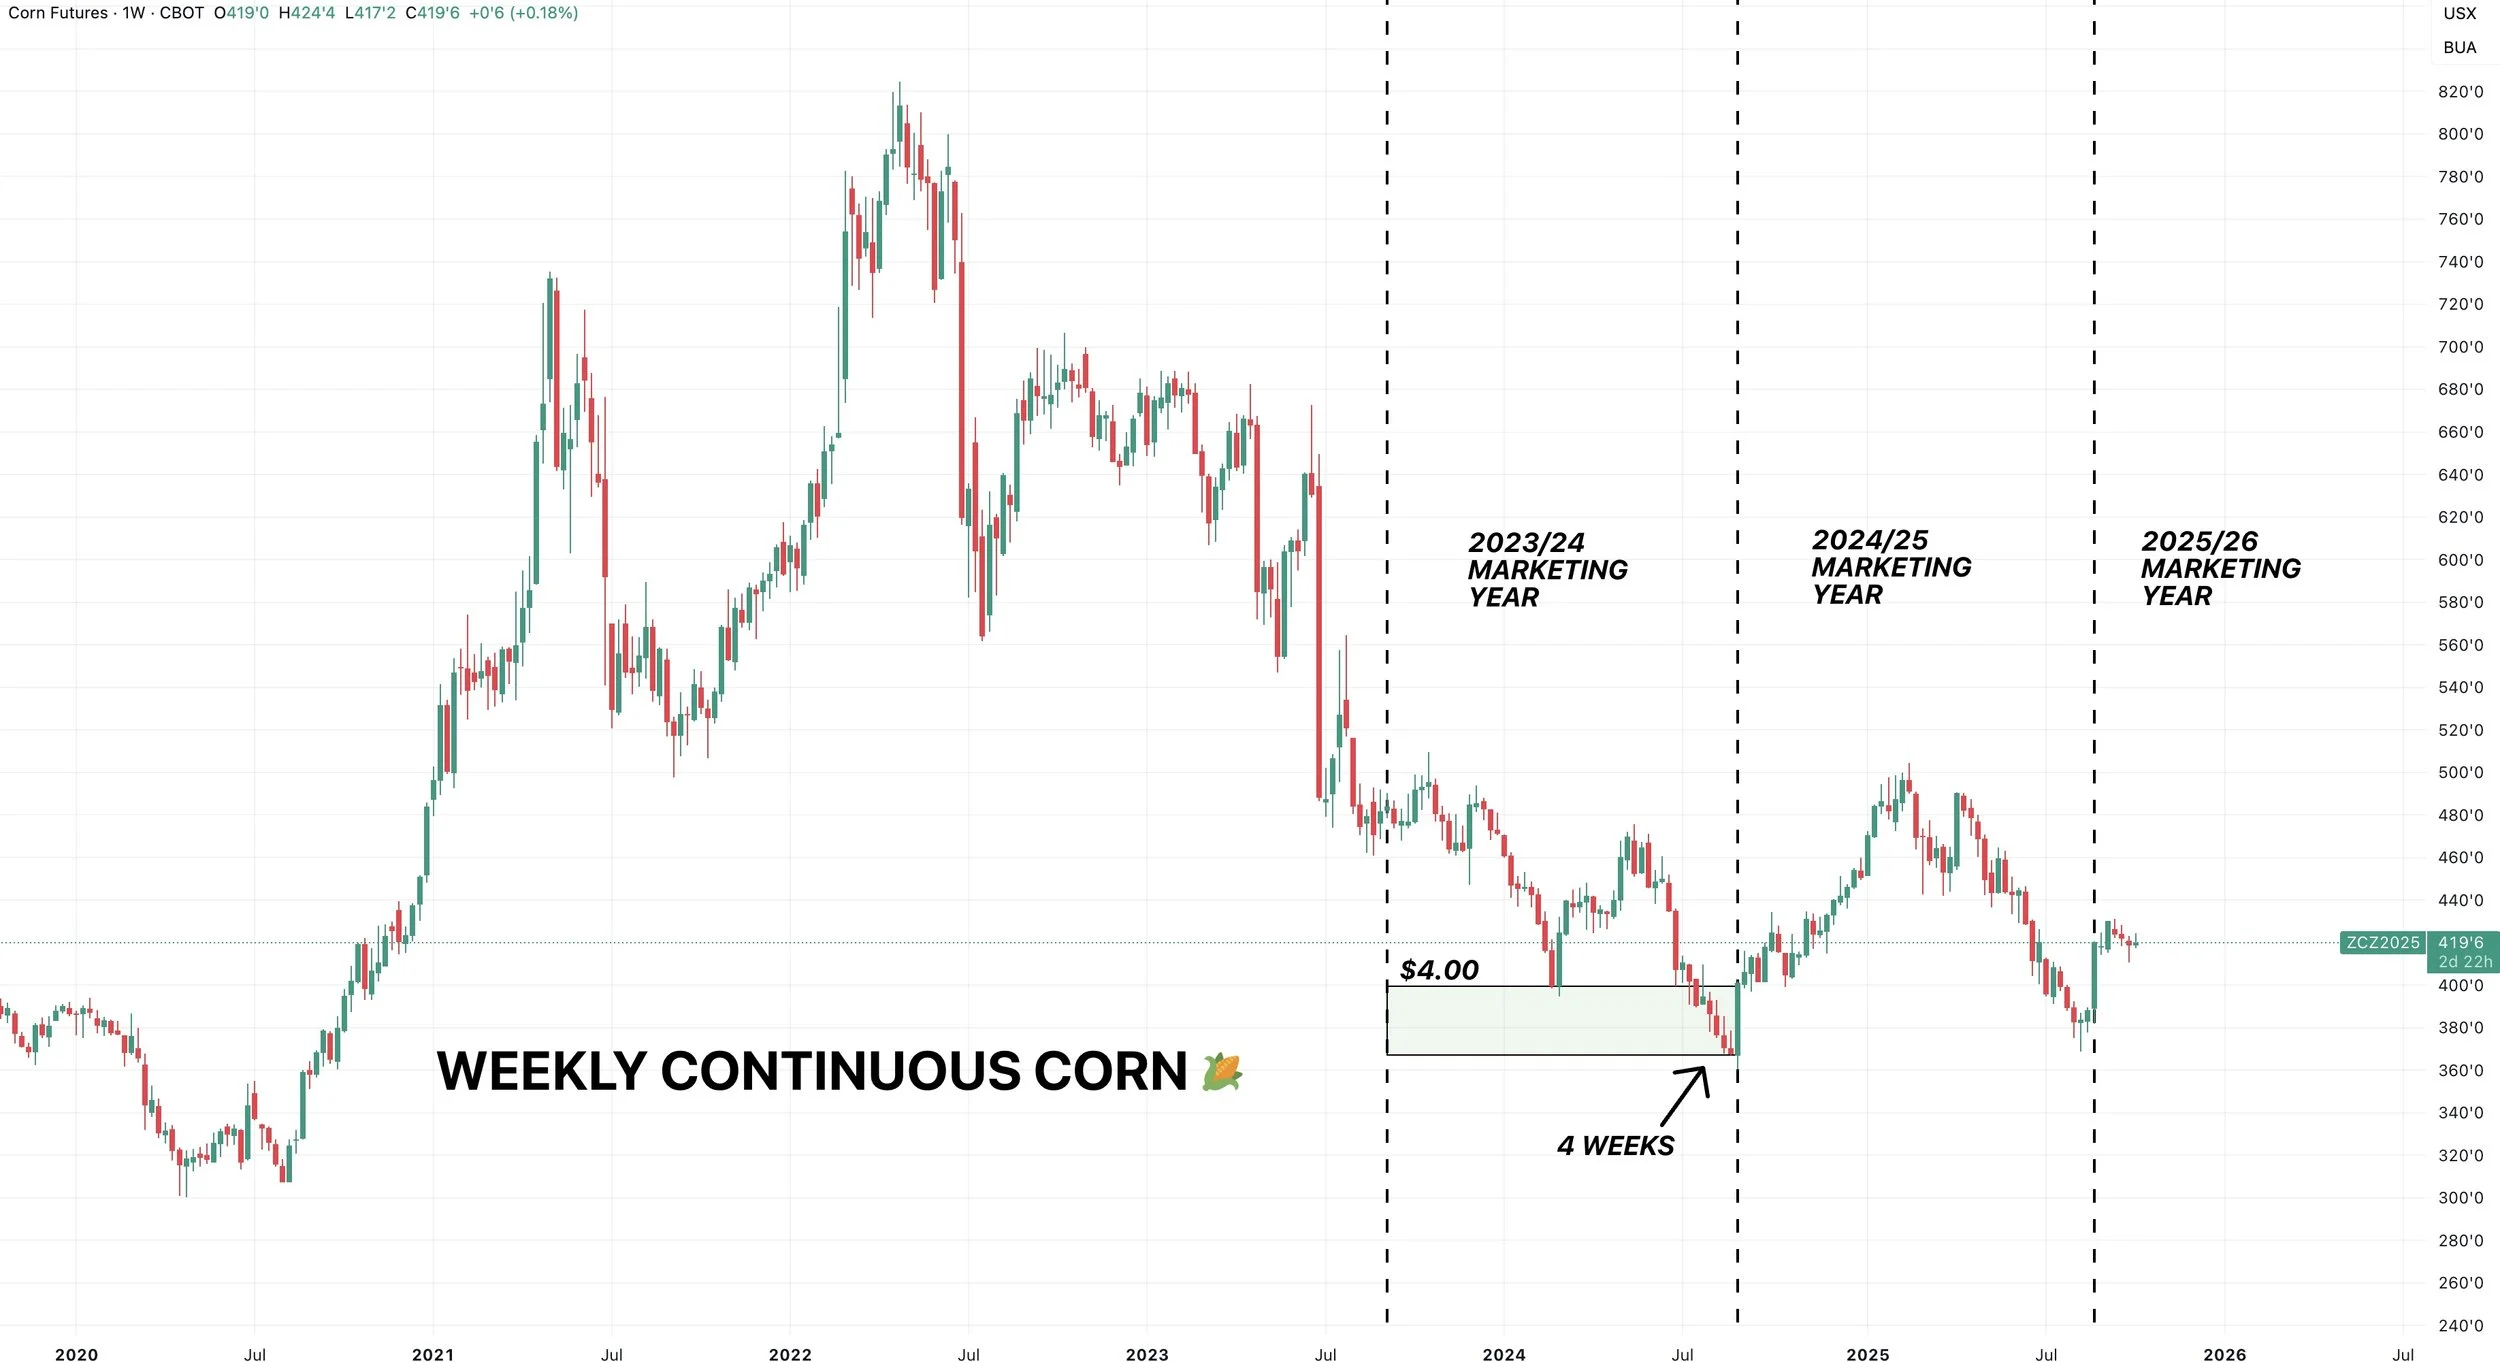
However, on the other hand. The only marketing year that saw over a +2 billion carryout over in recent memory was 2023/2024.
The 2023/2024 marketing year ran from Sep 2023 to August 2024.
If you look at prices during this time frame, we only spent a handful of weeks below $4.00.
Which was last August before we went on that run.
So the point is, does corn really have to venture below $4.00 by a wide margin if at all?
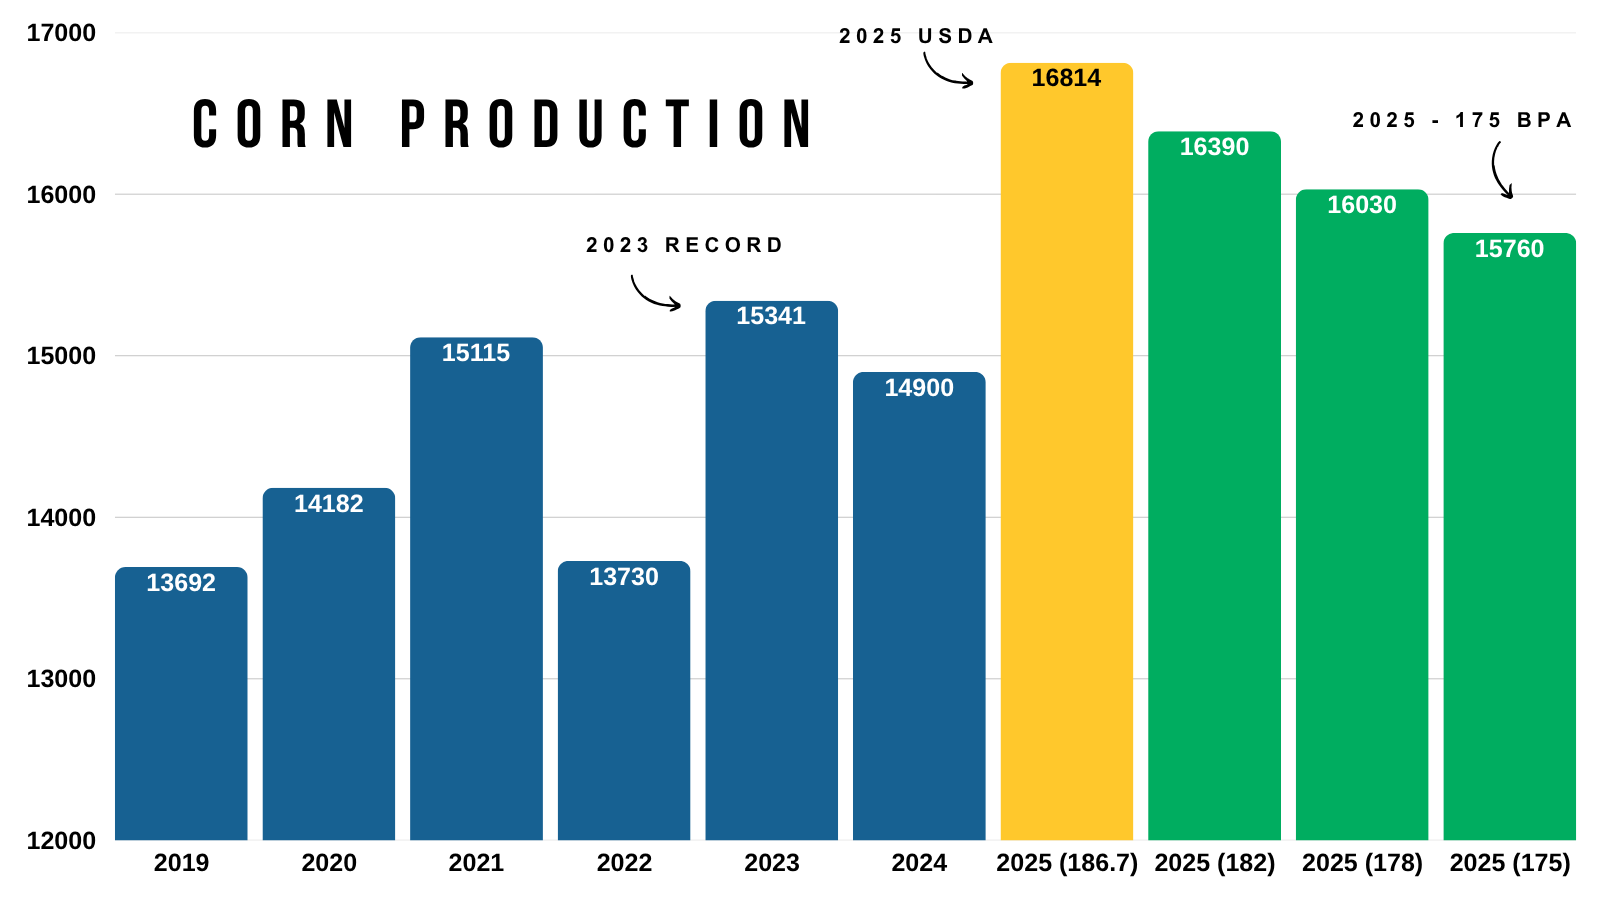
Given the record acres.. we are going to have record corn production no matter where yield comes in at.
Even if yield is 175 we are still going to have a record production number.
However.. we have been creating a demand monster for the last year.
2023 was our record production year.
In 2023, exports were 2,150 million bushels.
The current estimate for this year is 2,975 million.
A near 50% increase.
So we have record supply, but we also have record demand offseting that supply.
Here is a good chart from Karen Braun I showed last week.
Look at our exports compared to 2023. Up to this point, we are nearly double what we were then.
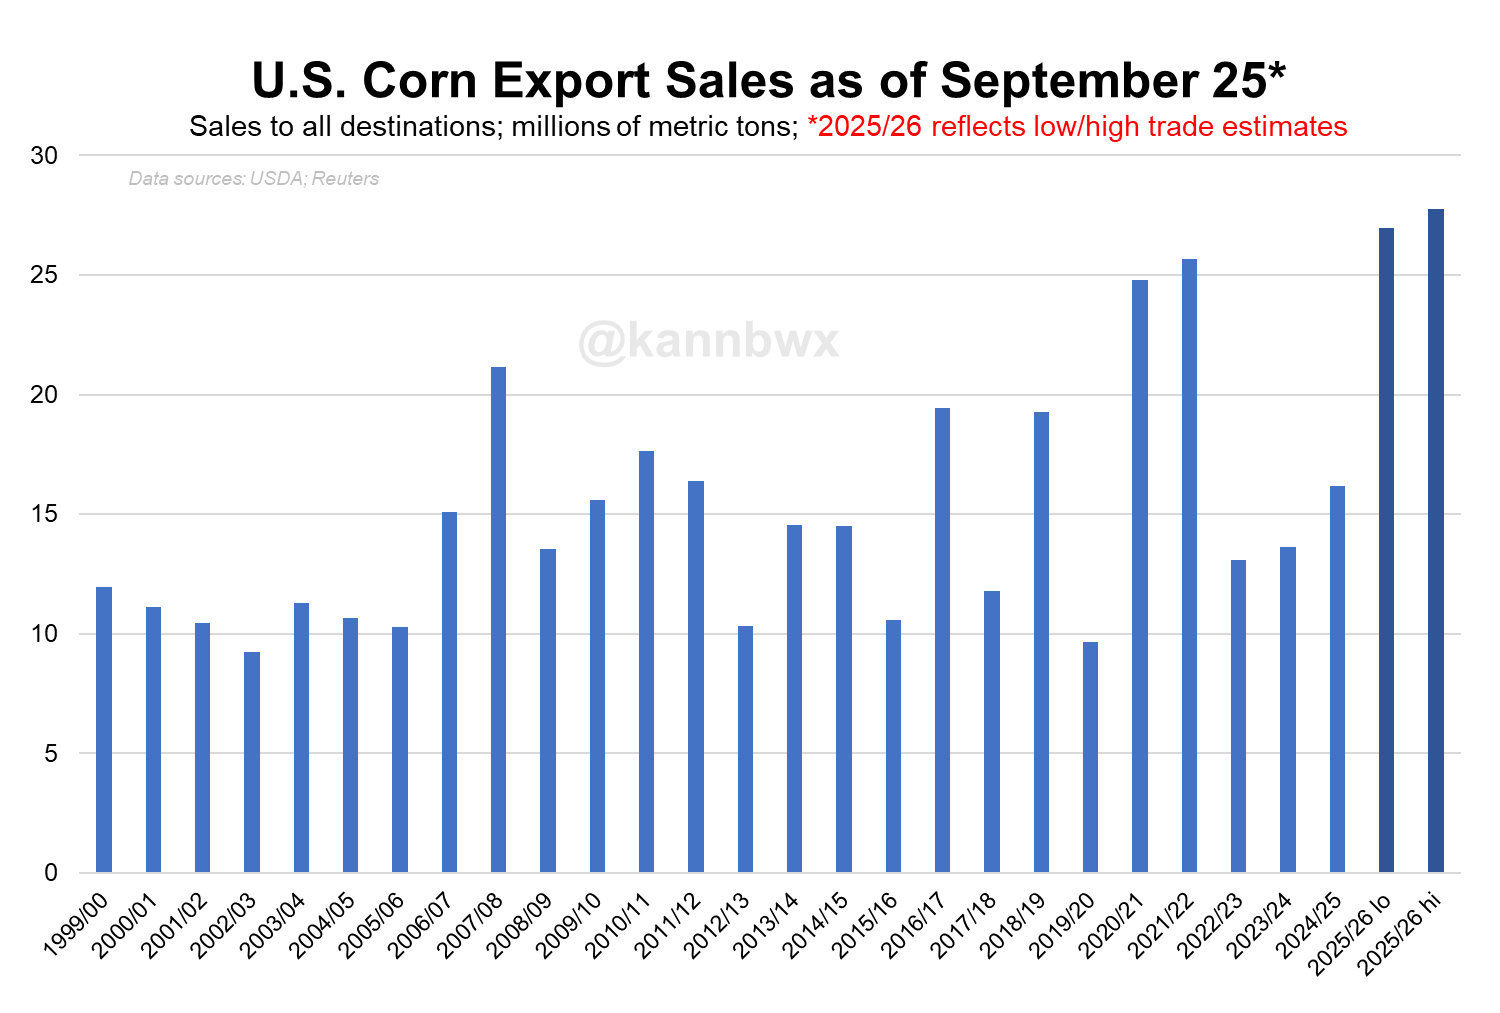
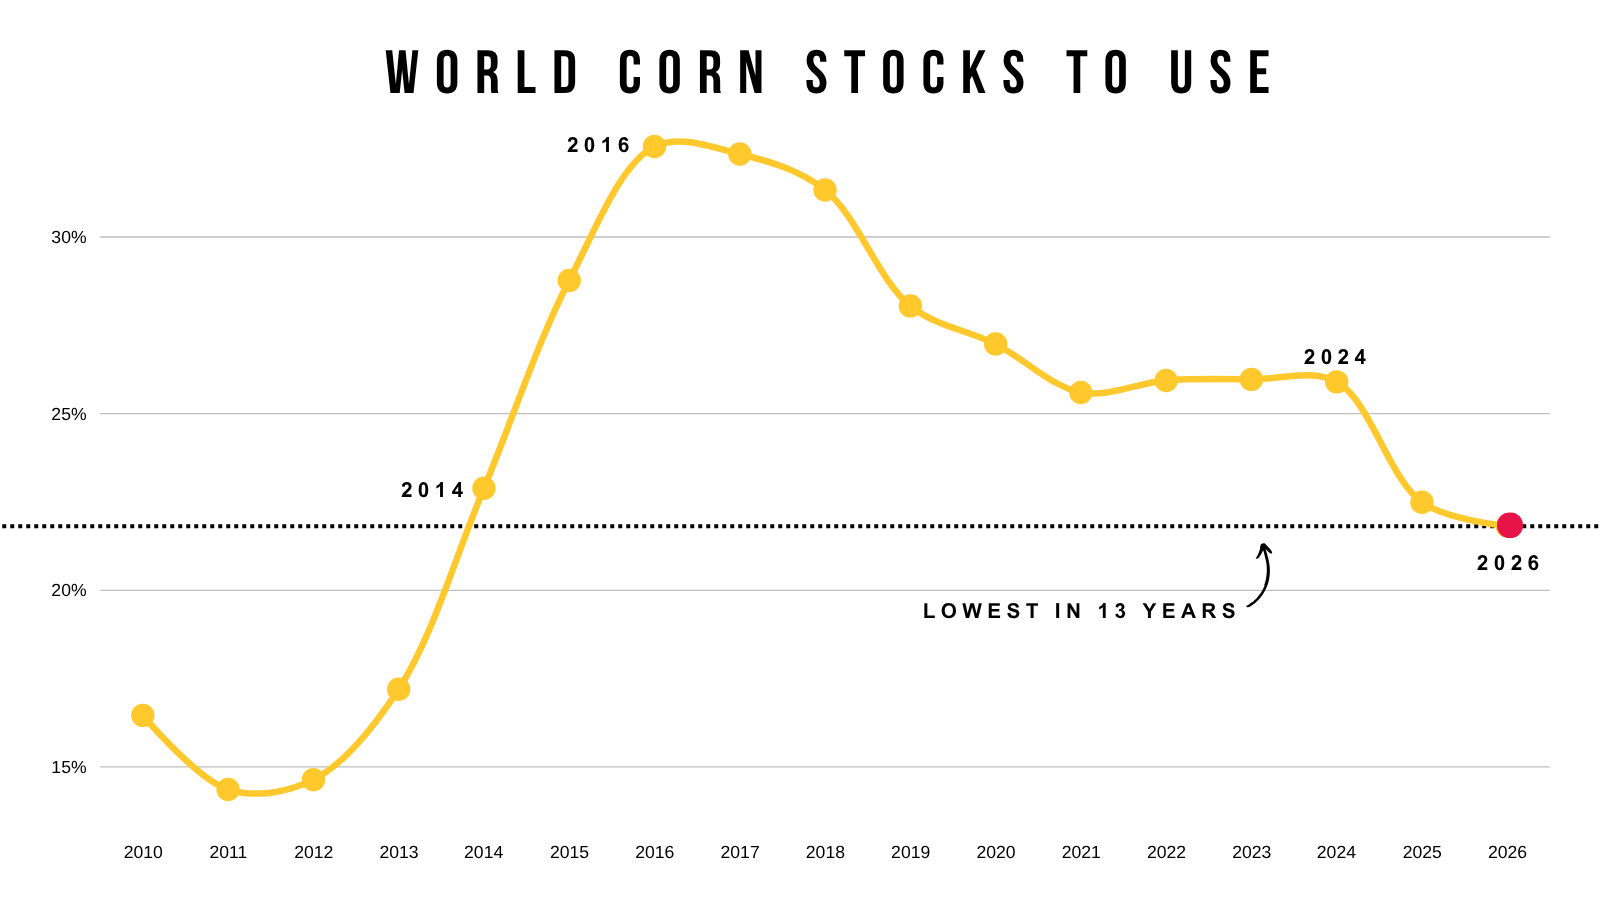
Despite the huge crops out of both the US and Brazil, the world situation is still one of the tightest in years.
The tightest in 13 years.
The world still needs corn.
Now the biggest risk in this corn market has to be a post-October insurance sell-off. That would be the worst-case scenario to end the year.
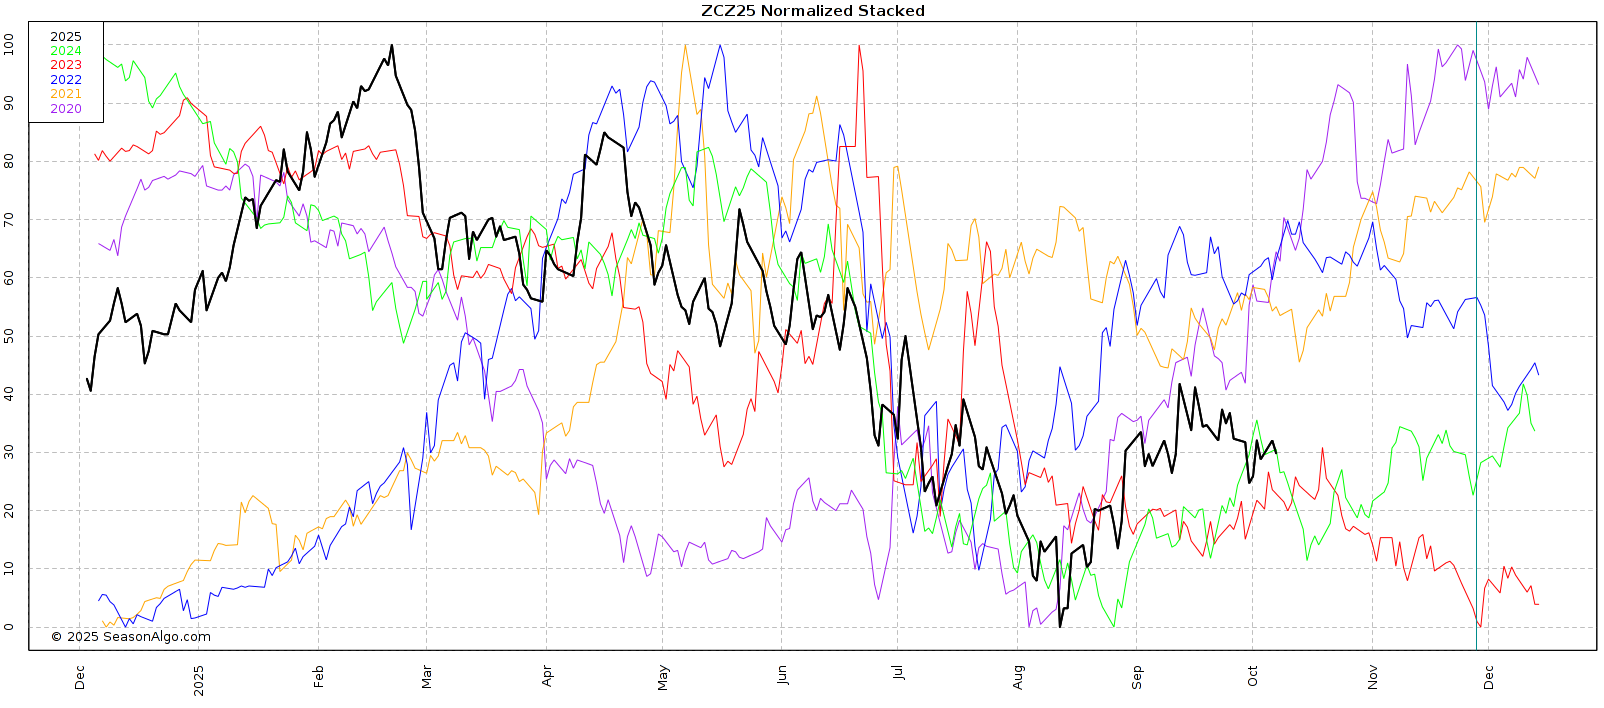
If we look at the seasonal patterns, the 5-year suggests a possible grind the higher the rest of the year. That is what has happened on average over the last 5 years.
However, both the 10 and 15 year patterns suggest a top in October, followed by an end of year sell off.
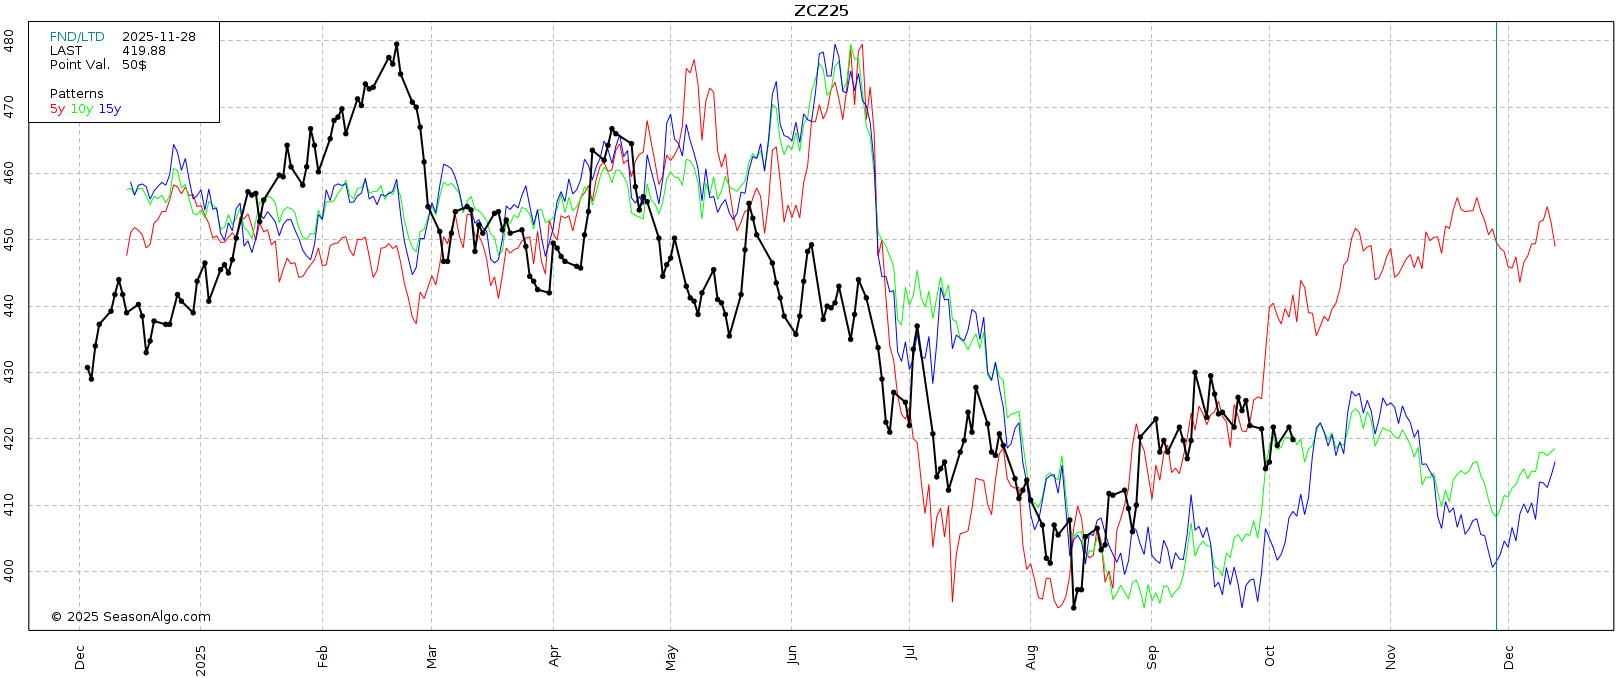
The most recent example of this was 2023.
That is the one year during that 5-year seasonal window where we did not grind higher the rest of the year.
We sold off in late October and never looked back.
The red line is 2023.
Technicals:
Pretty simple chart in Dec corn.
We had a failed breakout today. Rejecting right off this newly formed downward trend.
If we get the breakout above, it should spark a leg higher.
Target is still $4.35 to de-risk.
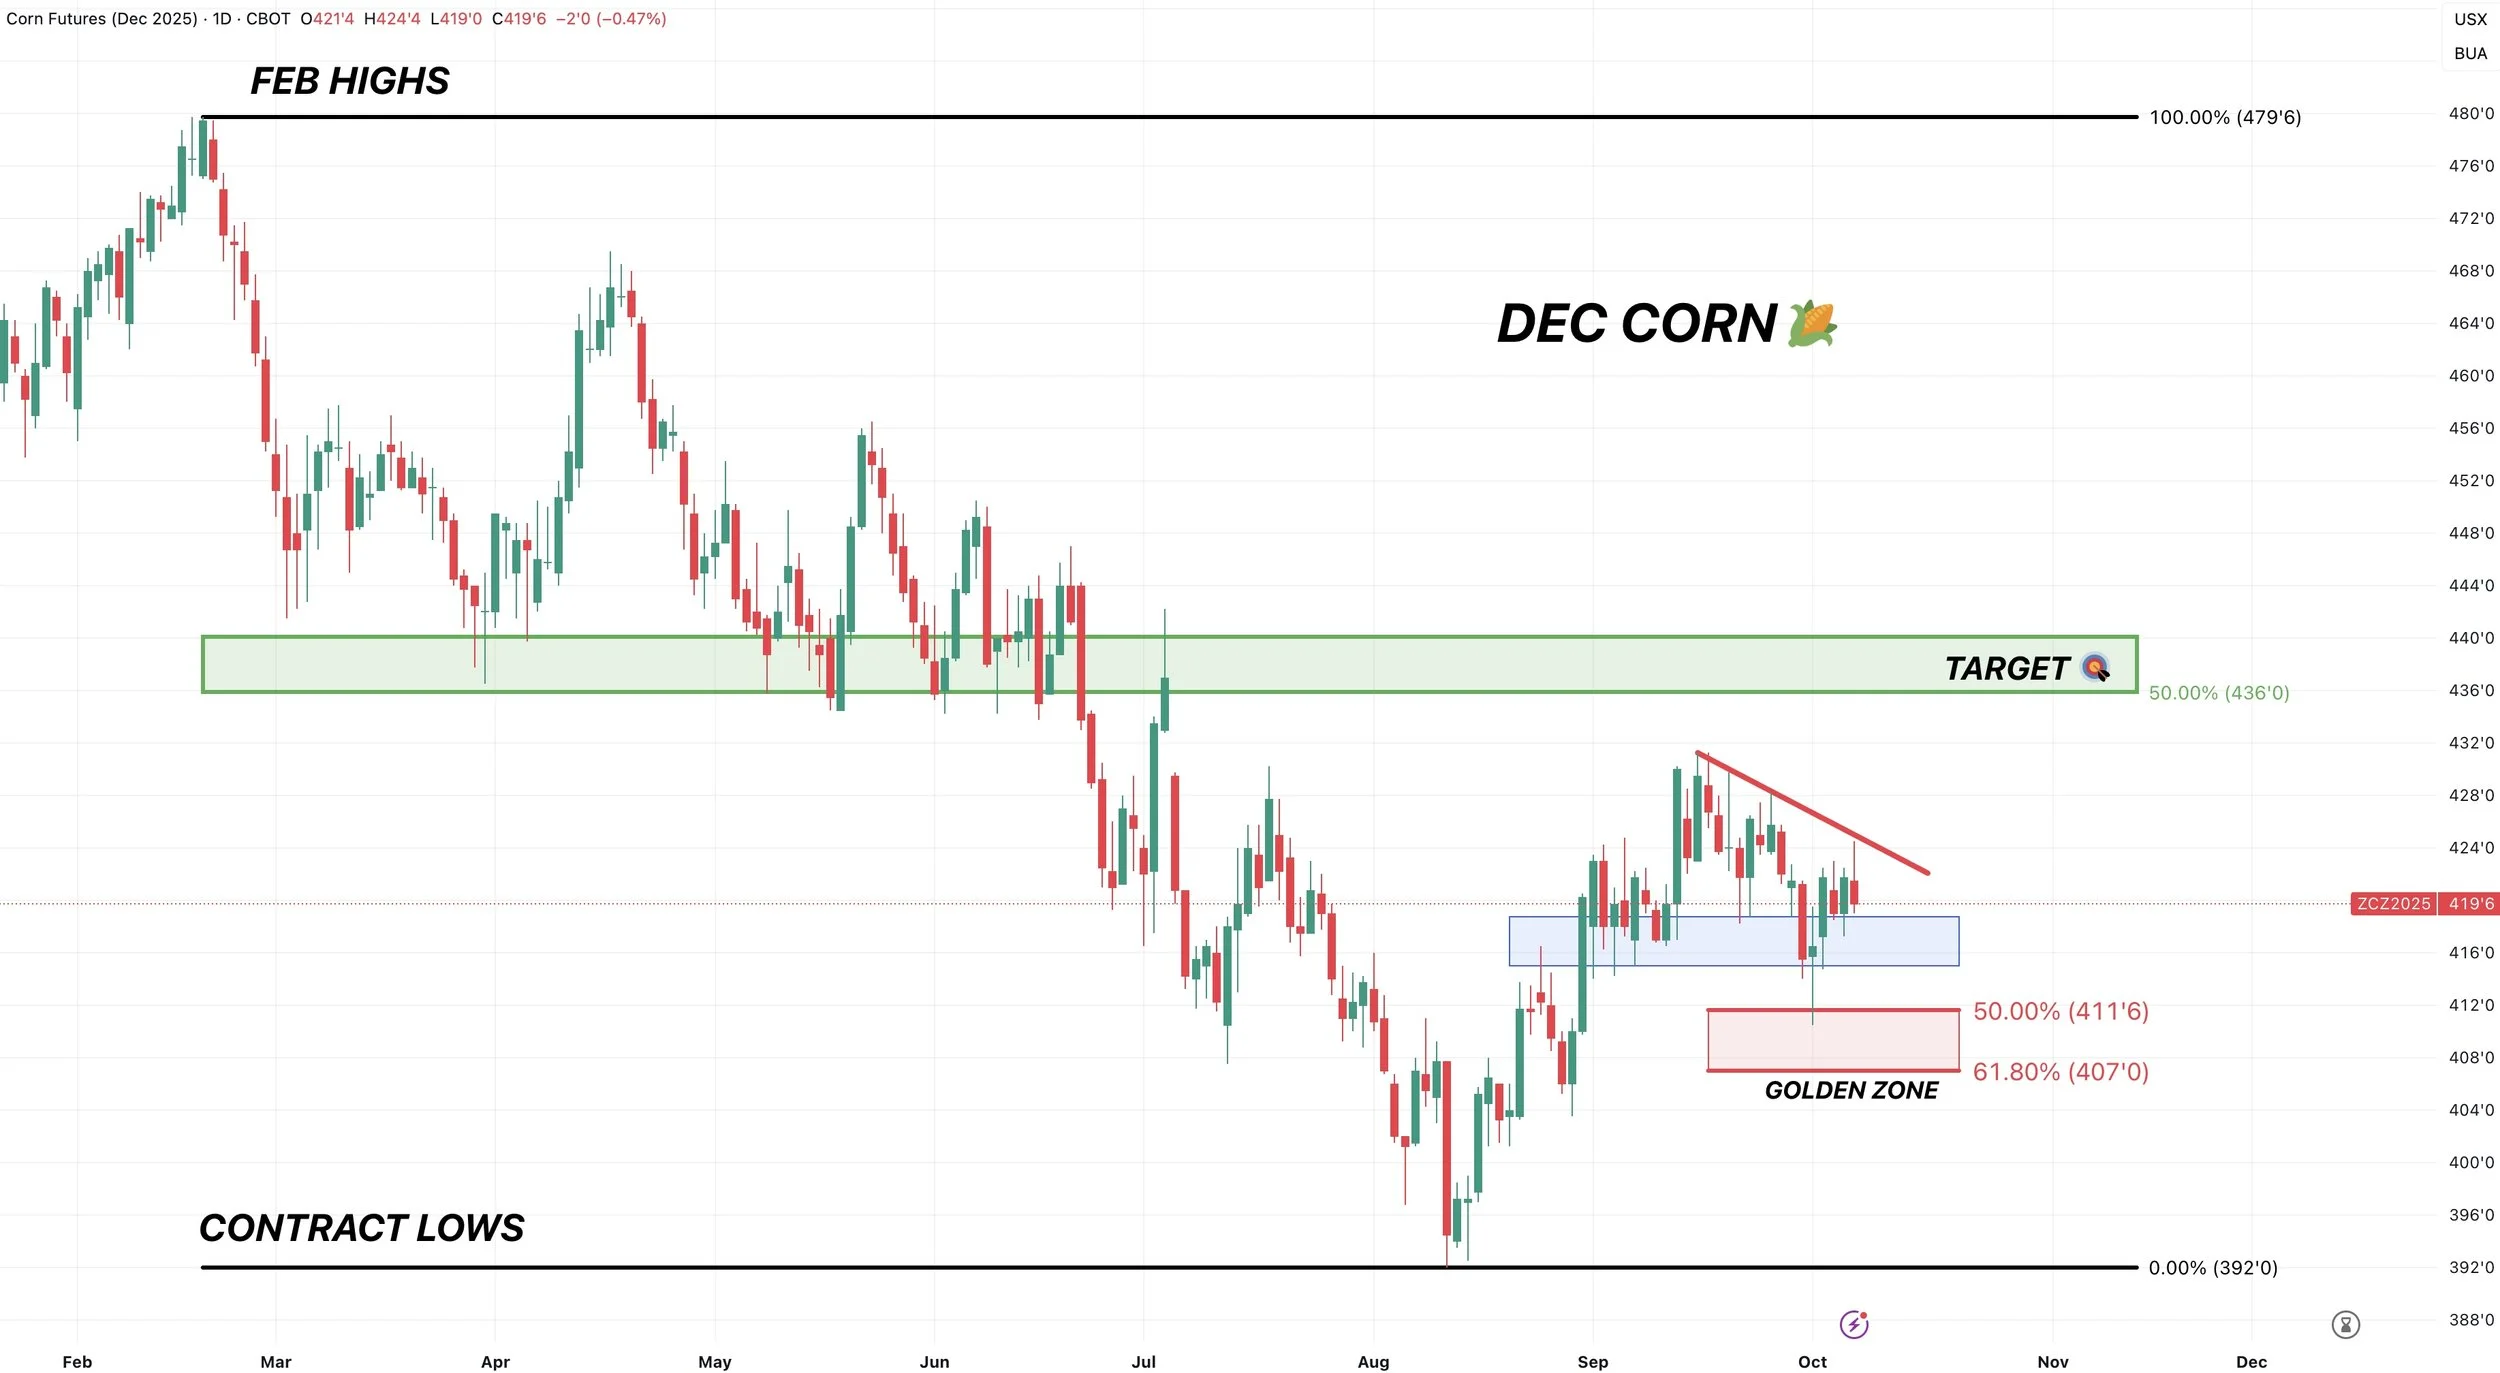
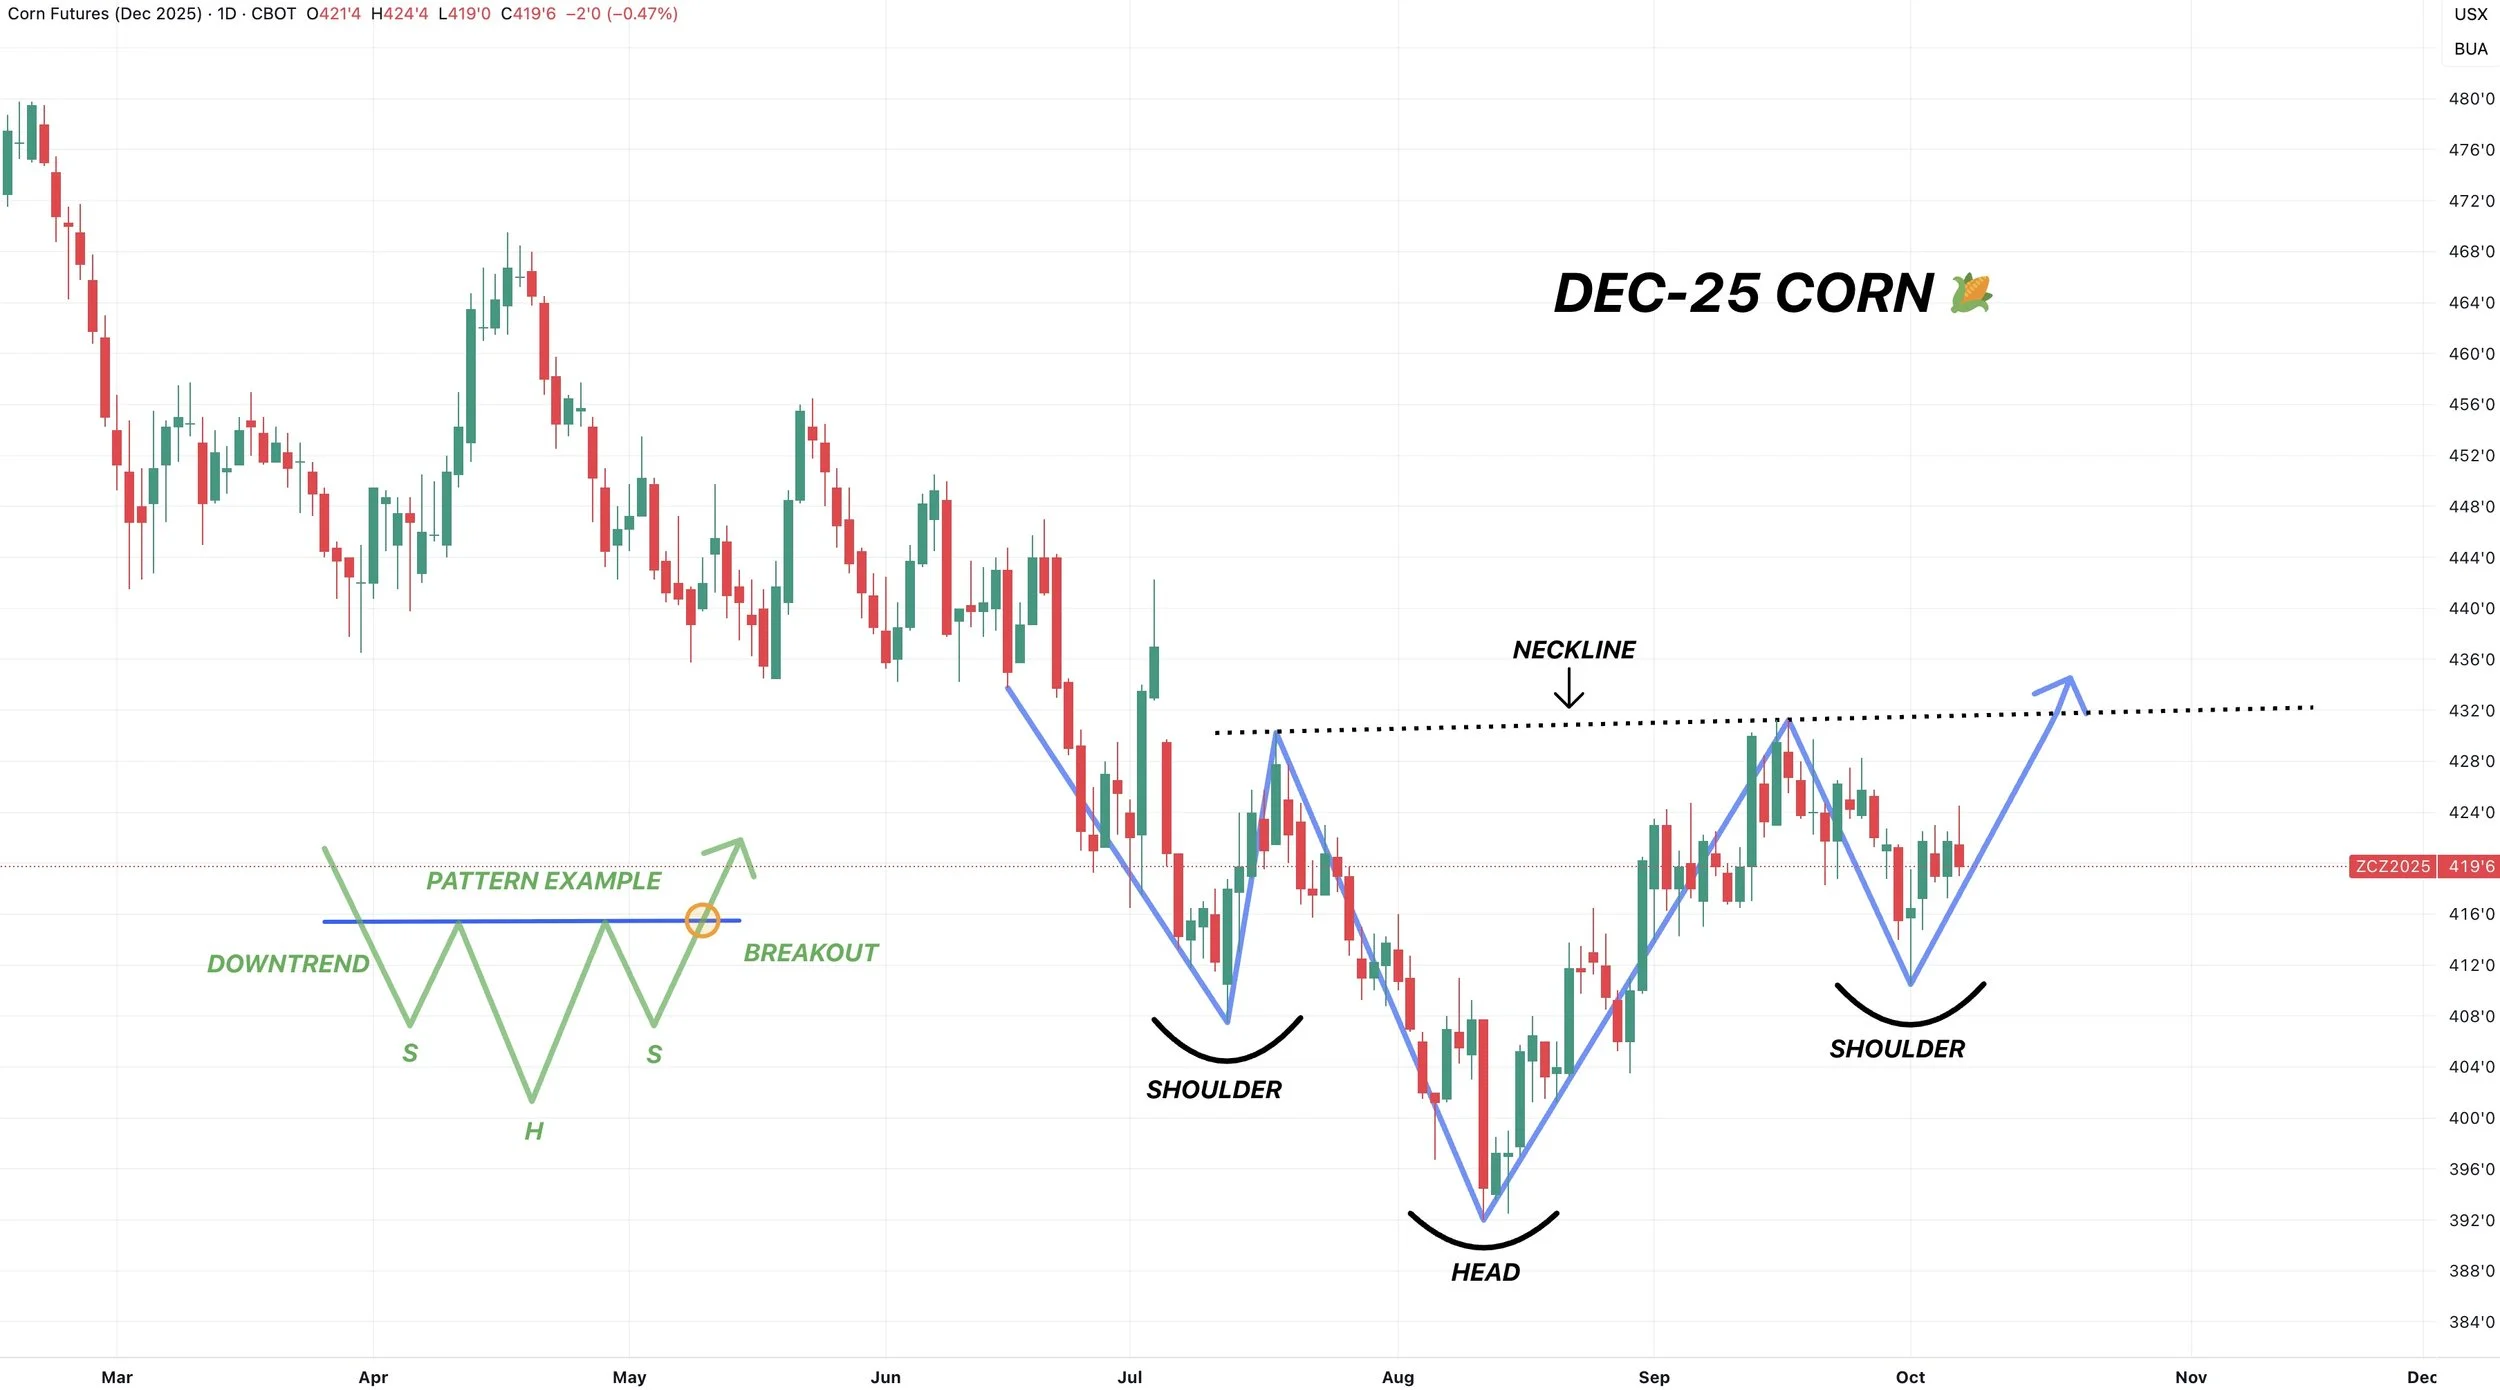
We still have an interesting potential inverse head & shoulders pattern.
Which in nature, is considered bullish.
Soybeans
Fundamentals:
Soybeans saw a boost today because the market is anticipating a trade aid package.
There isn’t a ton of news for the market to trade, so any positive news here helps support the market.

Why is this a supportive factor?
Mainly because it could keep some bushels off the market.
Prices aren’t great to begin with. Basis is awful in plenty of areas because we aren’t seeing any business to China. So this aid might help farmers hold on and not dump as much supply into the market.
However, trade aid does make it seem like the government isn’t extremely confident about a trade deal coming to boost prices relatively soon.
It might be quiet here for the next few weeks.
We don’t have the USDA report. China and Trump aren’t scheduled to talk until the end of the month. So the market does not have much to digest and trade on.
Little fundamental changes can lead to quiet markets.
It's mostly a waiting game here in soybeans. We always get a nice boost on these trade deal talks, then sell off after the meeting because it didn’t lead to anything. So you really can’t get overly excited unless this meeting actually materially changes something.
Long term you do have to be somewhat optimistic on how a trade deal could impact things. Short term is the concern given that we've already missed a good chunk of our prime shipping window.
I still find it hard to imagine that yield is going to be +2 bpa higher than anything we've seen before.
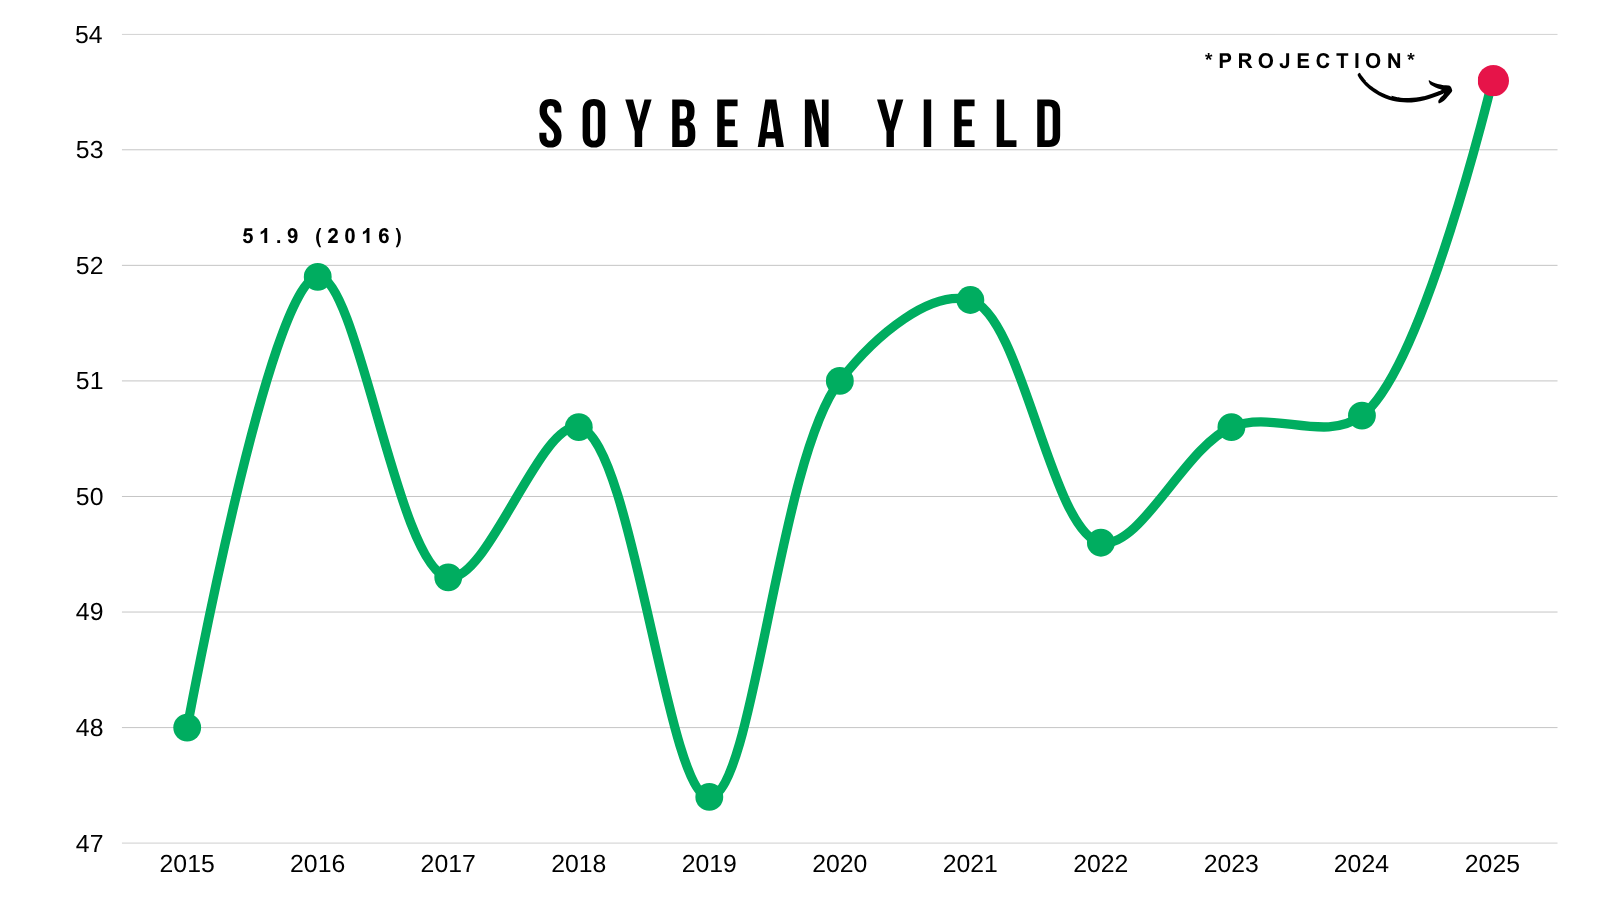
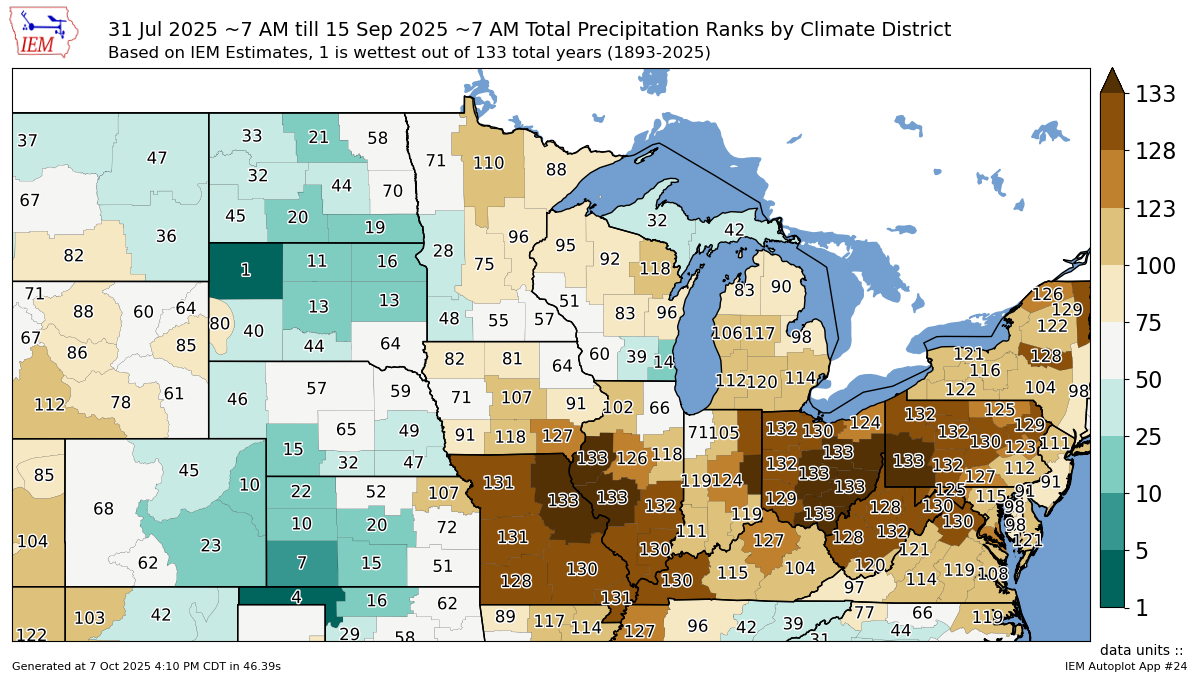
As a reminder, we did just one one of the driest finishes on record.
Here is the precip rankings from Aug 1st to Sep 15th.
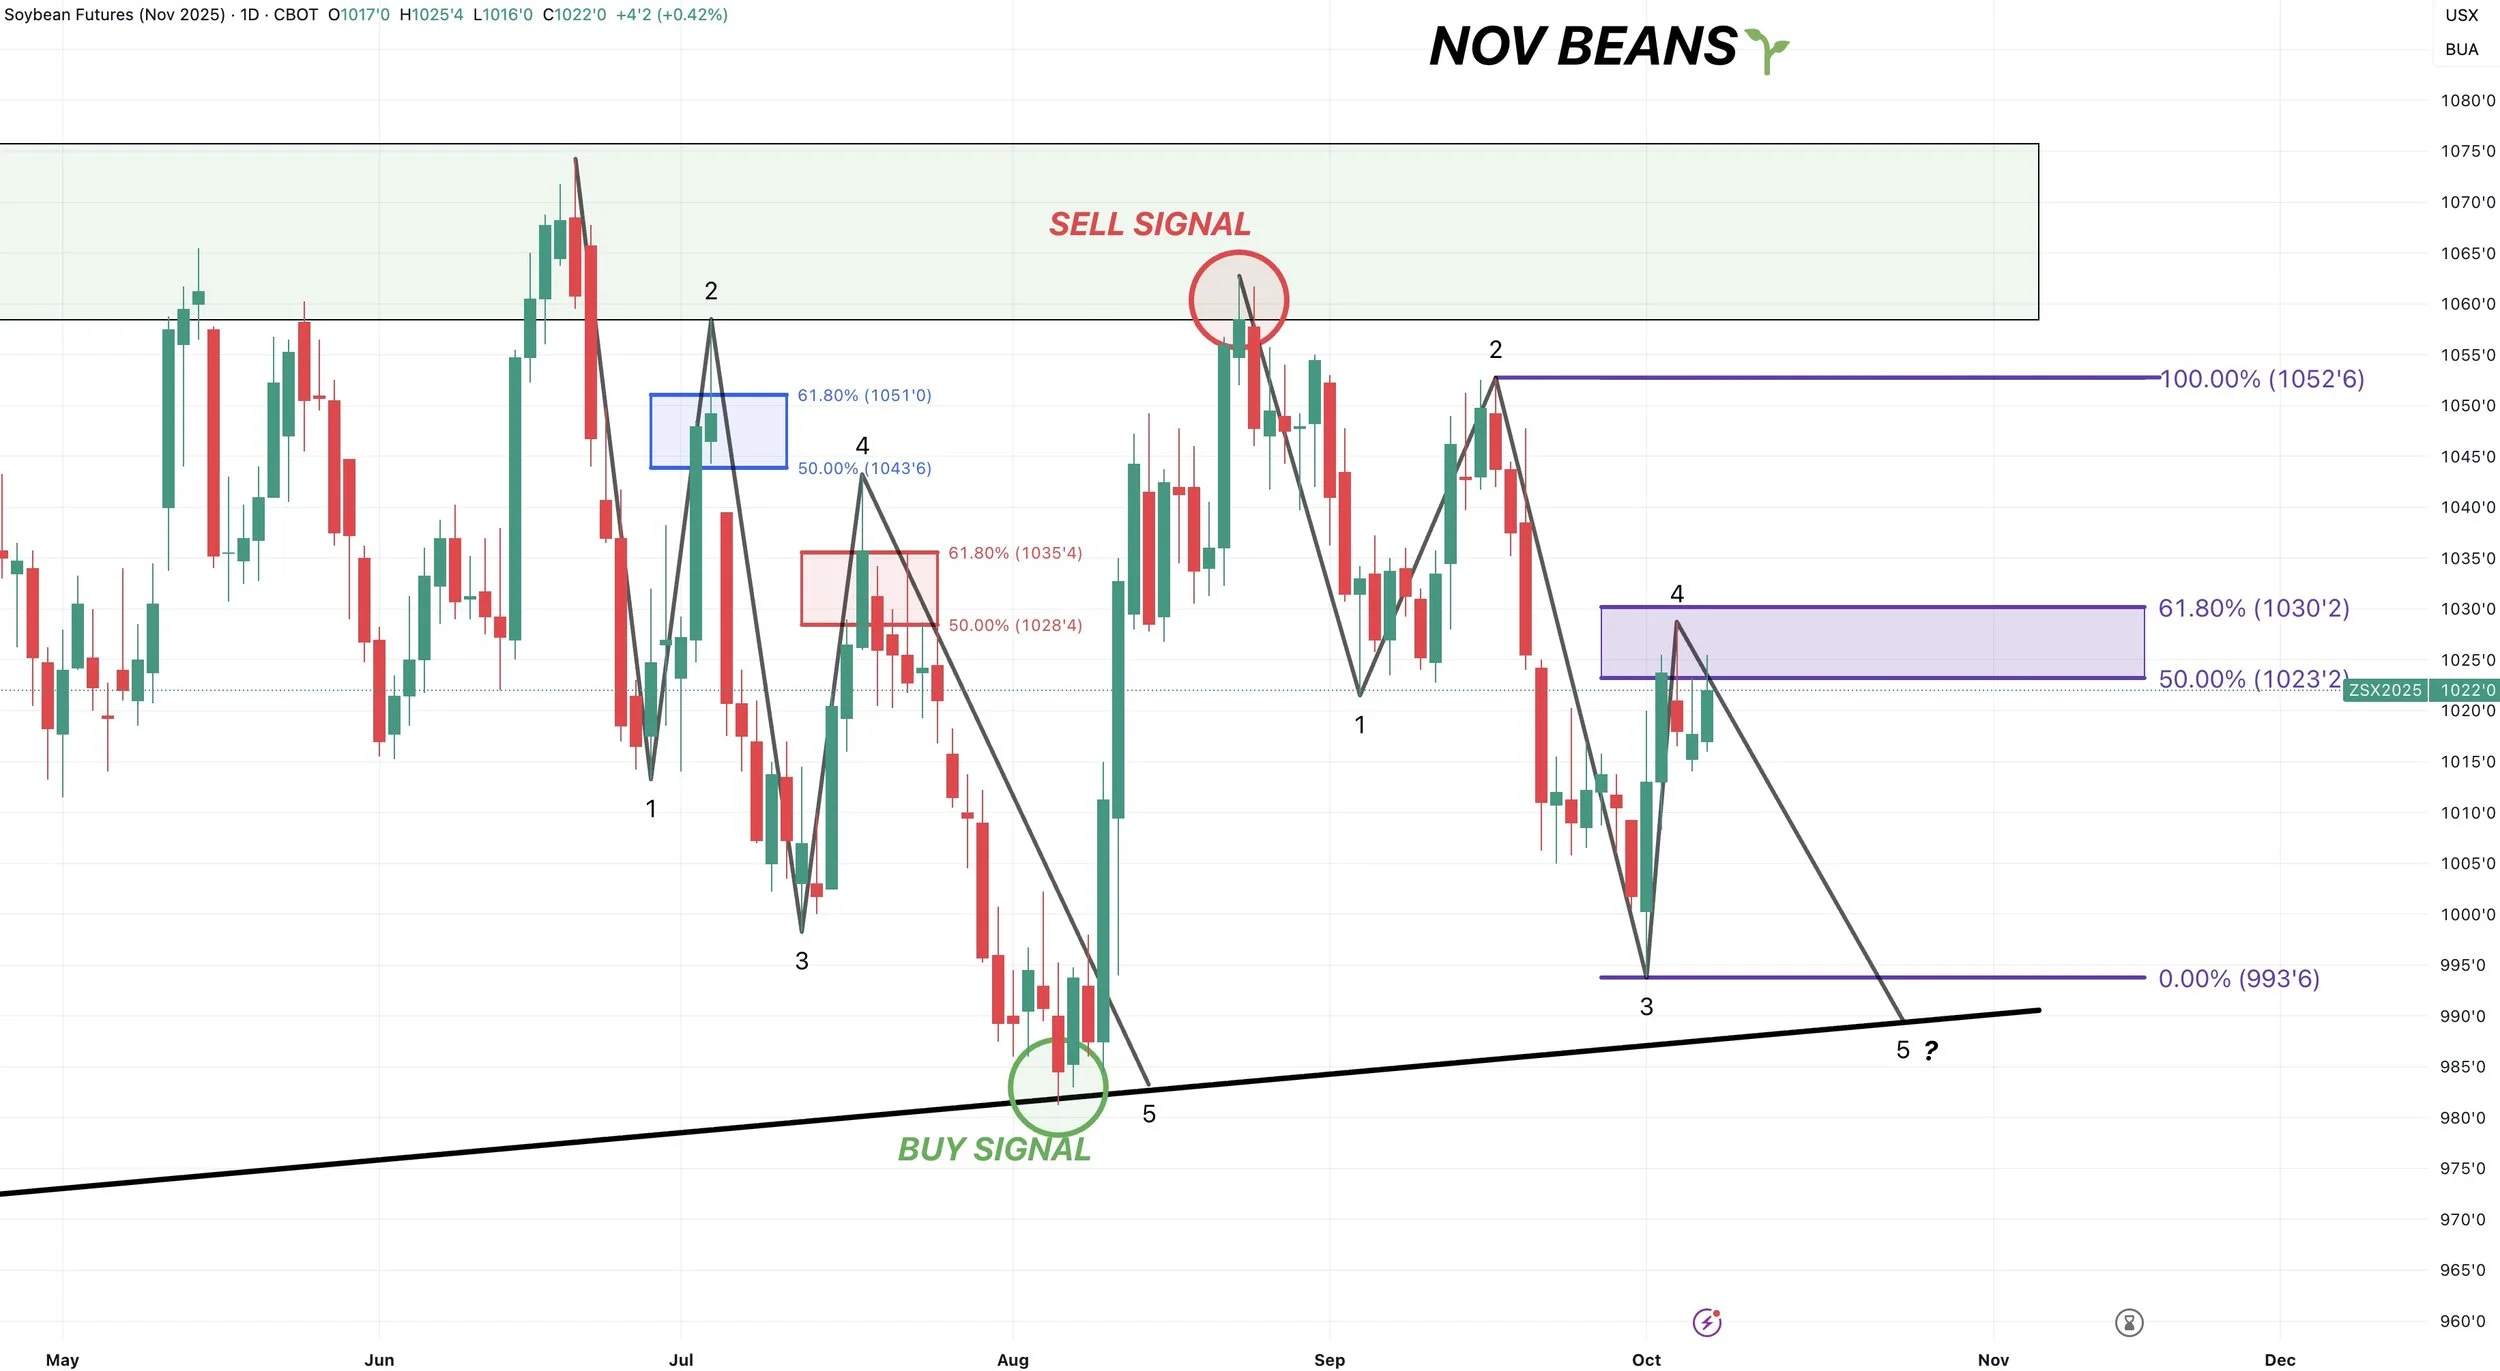
Technicals:
We rejected right at this golden zone retracement box.
As we reclaimed 61.8% of the recent sell off.
This is a normal size for a correctional bounce. So unless you break above that box, this bounce is seen as nothing more than a usual relief bounce. Meaning the risk is still lower.
If we break above the box, most of the time it would suggest we've put in our lows. As it would no longer be a standard-sized relief bounce in a broader correction.

I'm also cautious here because we could see a similar pattern play out like we did earlier this summer unless we break that box I mentioned above.
Often times, markets move in 5 waves.
The summer sell off saw 5 waves.
So far we only have 4.
Both the 2nd and 4th wave on the summer sell off rejected the 61.8% level. The level we are are currently battling.
This doesn’t have to happen at all. I just can’t be confident in this market until we clear the purple box. It's a big spot.
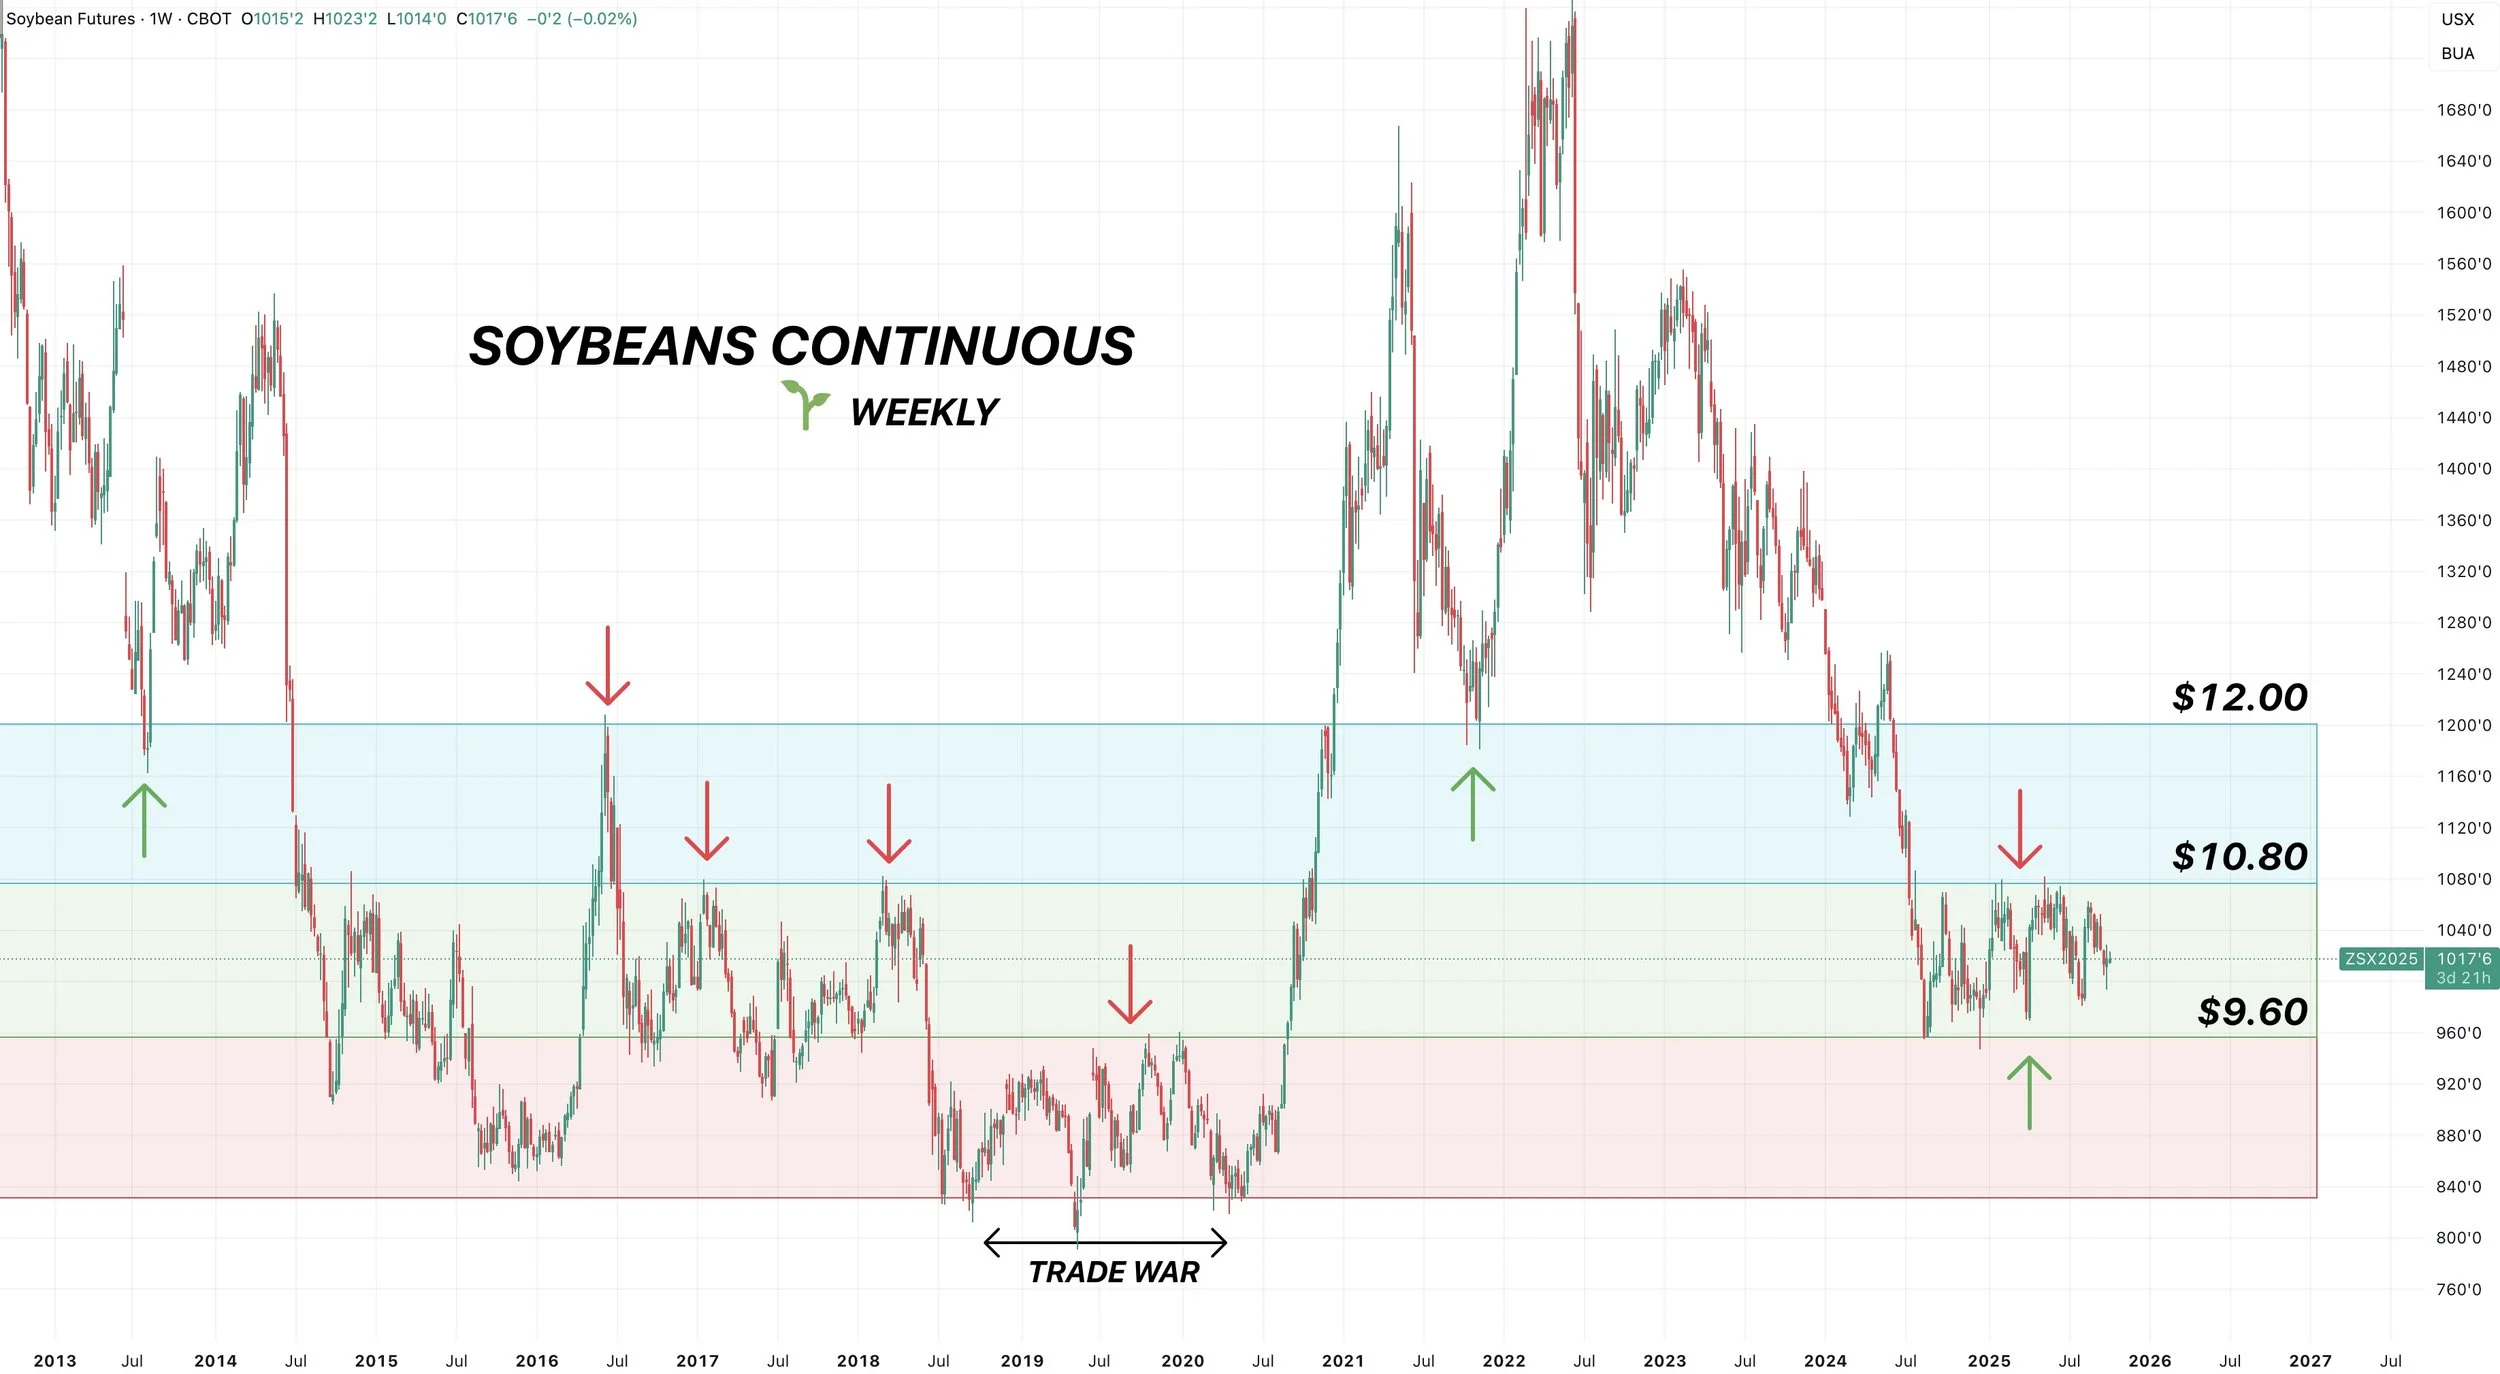
I've shown this chart recently as well.
Soybeans have traded in one of the smallest & longest ranges we've ever seen.
Trapped between $9.60 and $10.80 for 427 days now. Essentially sideways for over a year.
Finding support at our trade war resistance. While finding resistance where we did in 2016-2018.
Soybeans absolutely hate trading in the $11.00's. Which is marked with the blue box.
We either rally to $12 or break into the $10.00's.
My bias leans towards the belief that $9.60 is our new long term floor. But if you ever broke below that level things could get ugly.
On the other hand, if we ever take out $10.80 the chart is completely open to the upside.
There are so many unknowns in this market. But if we strike a deal with China, this chart has so much room to run long term.
Wheat
Fundamentals:
Very little fresh news in wheat.
Seasonally, this is the time of the year where wheat tries to buy some acres but has struggled to find a catalyst to move higher.
We certainly aren’t buying extra acres here.
We just have an ample amount of supply around the world and no real concerns anywhere.
On the bright side, our exports are fantastic. Some of the best demand we've seen in years. Which doesn’t have to lead to higher prices right now, but is one way you can chew into the carryout and paint a friendly situation here in the US.
It's just a waiting game in wheat. Being patient for opportunities. They just might not come as soon as any of us would like.
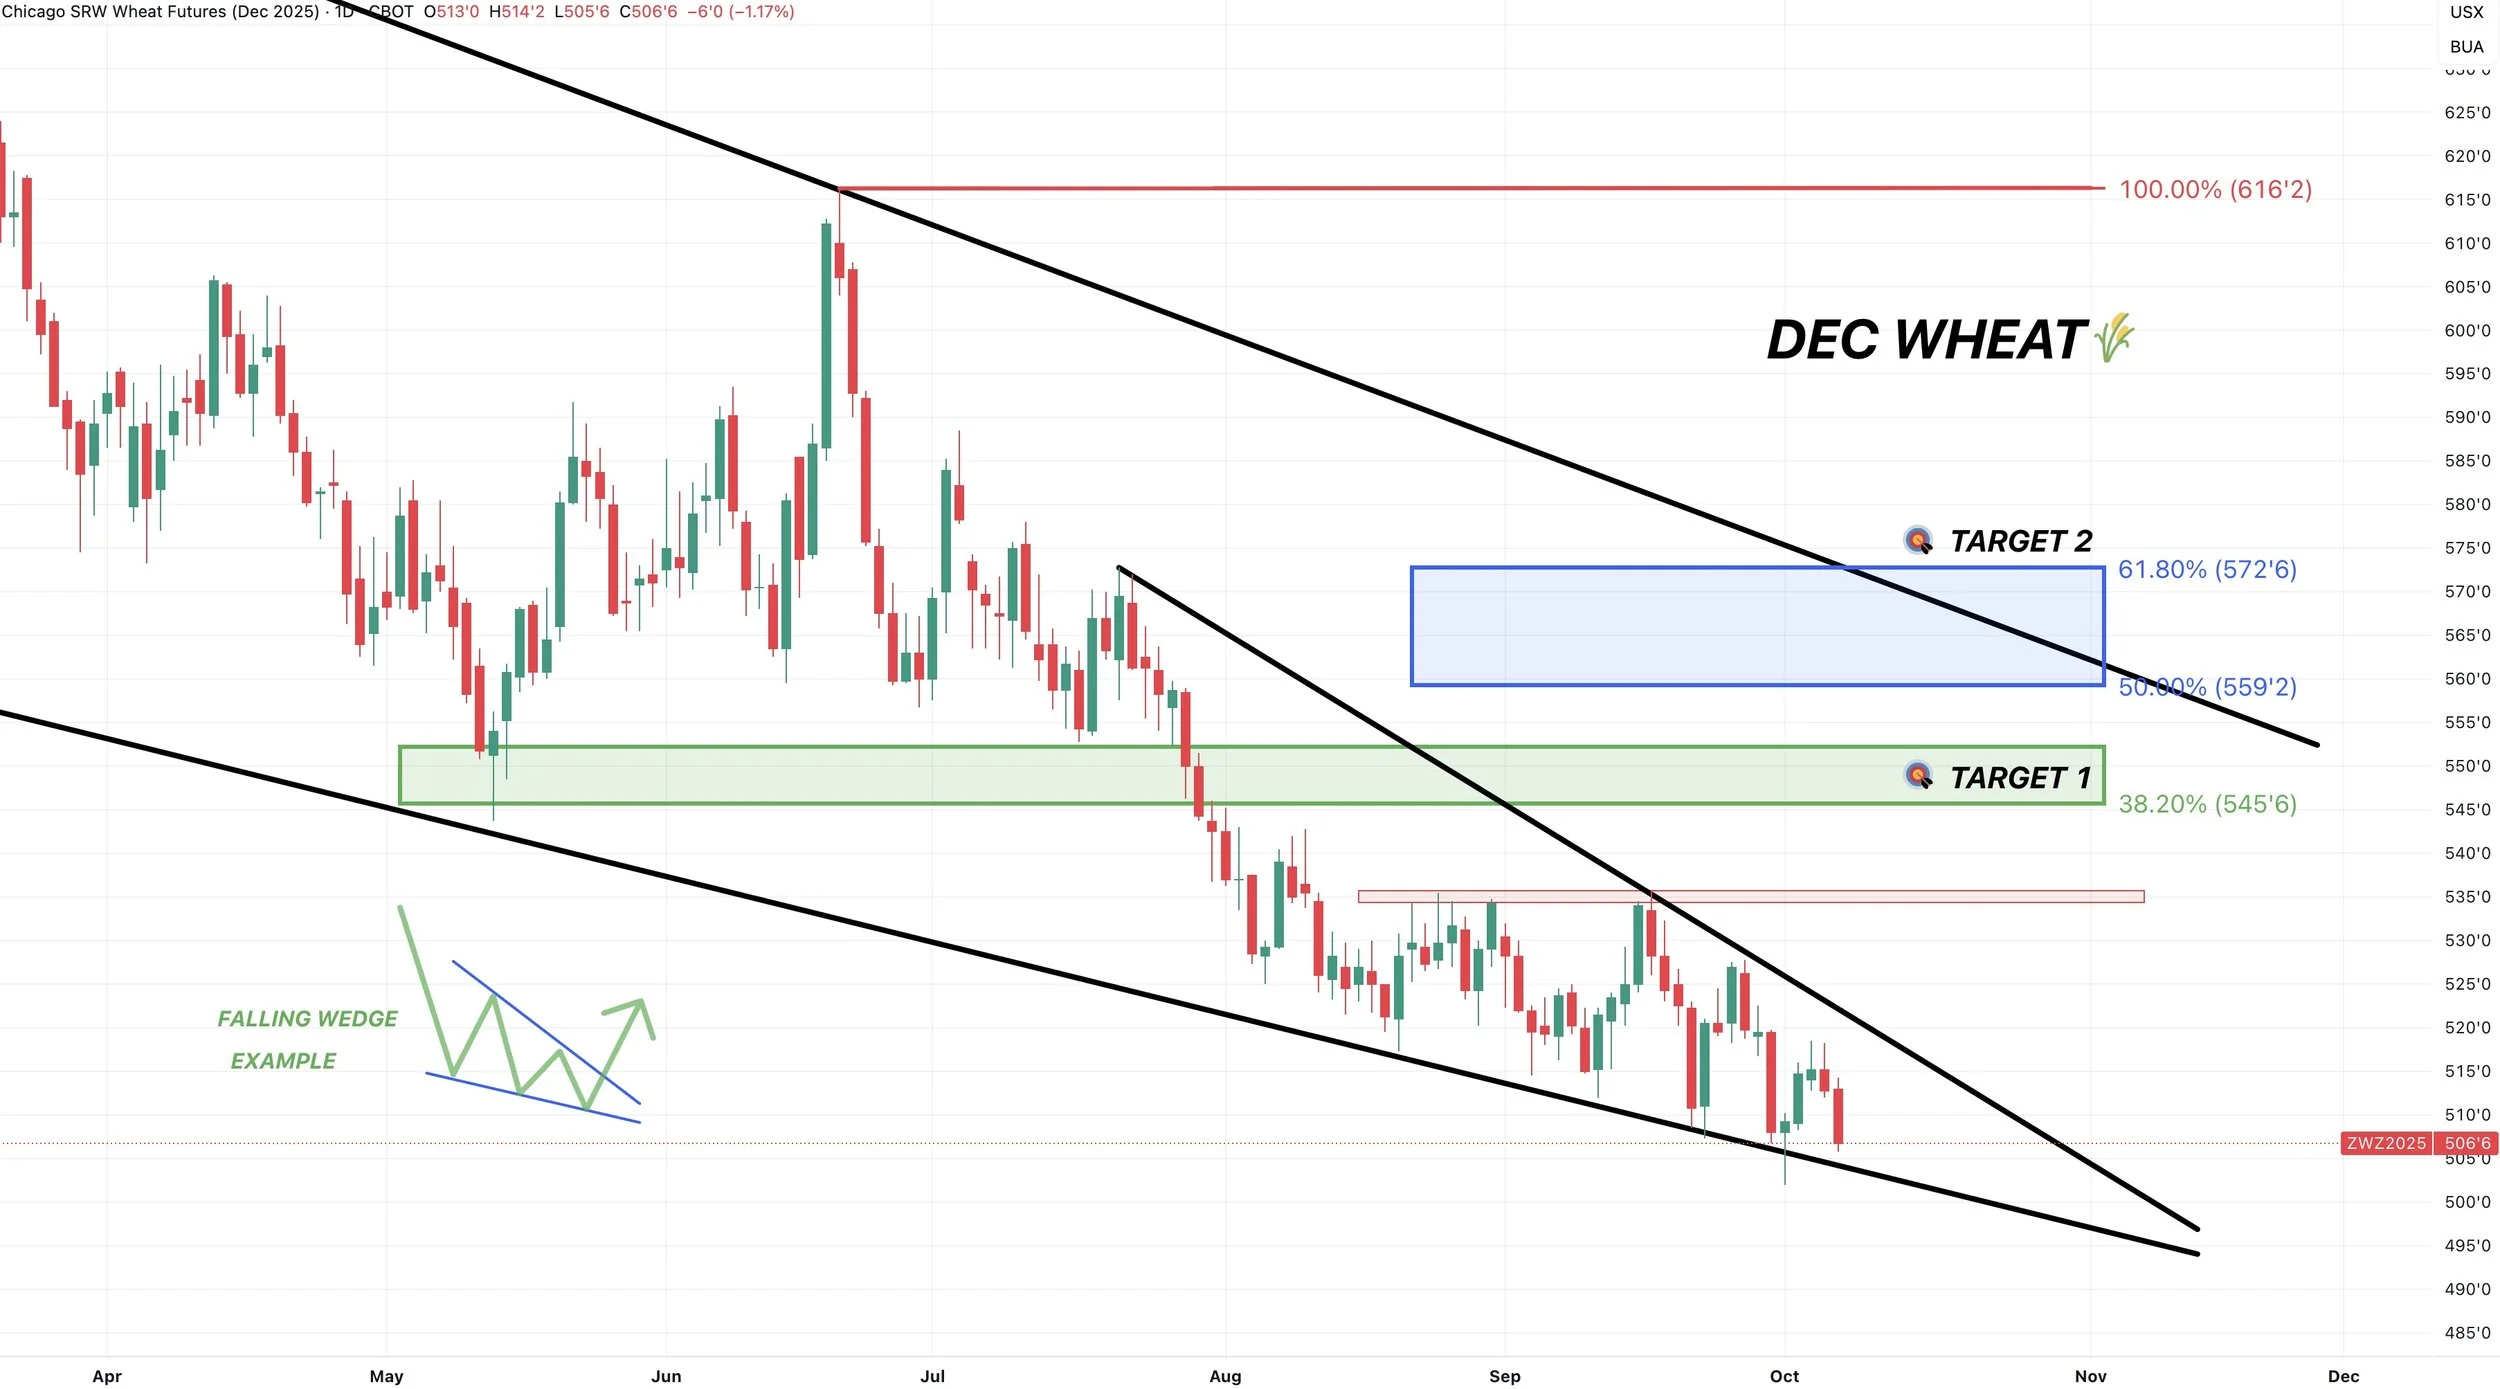
Dec Wheat Technicals:
We continue to trickle lower. But I personally still think we are coiling for a move higher.
Still trapped in this falling wedge. Waiting for the breakout.
If the breakout comes, I think we could reasonably run to $5.45.
Which gives back 38.2% of the June highs and is old support.
Dec KC Wheat Technicals:
Pretty similar to Chicago.
Coiling in this wedge pattern.
If the breakout comes, a reasonable target would be $5.35 which is old support and 38.2% of the June highs.

Cattle
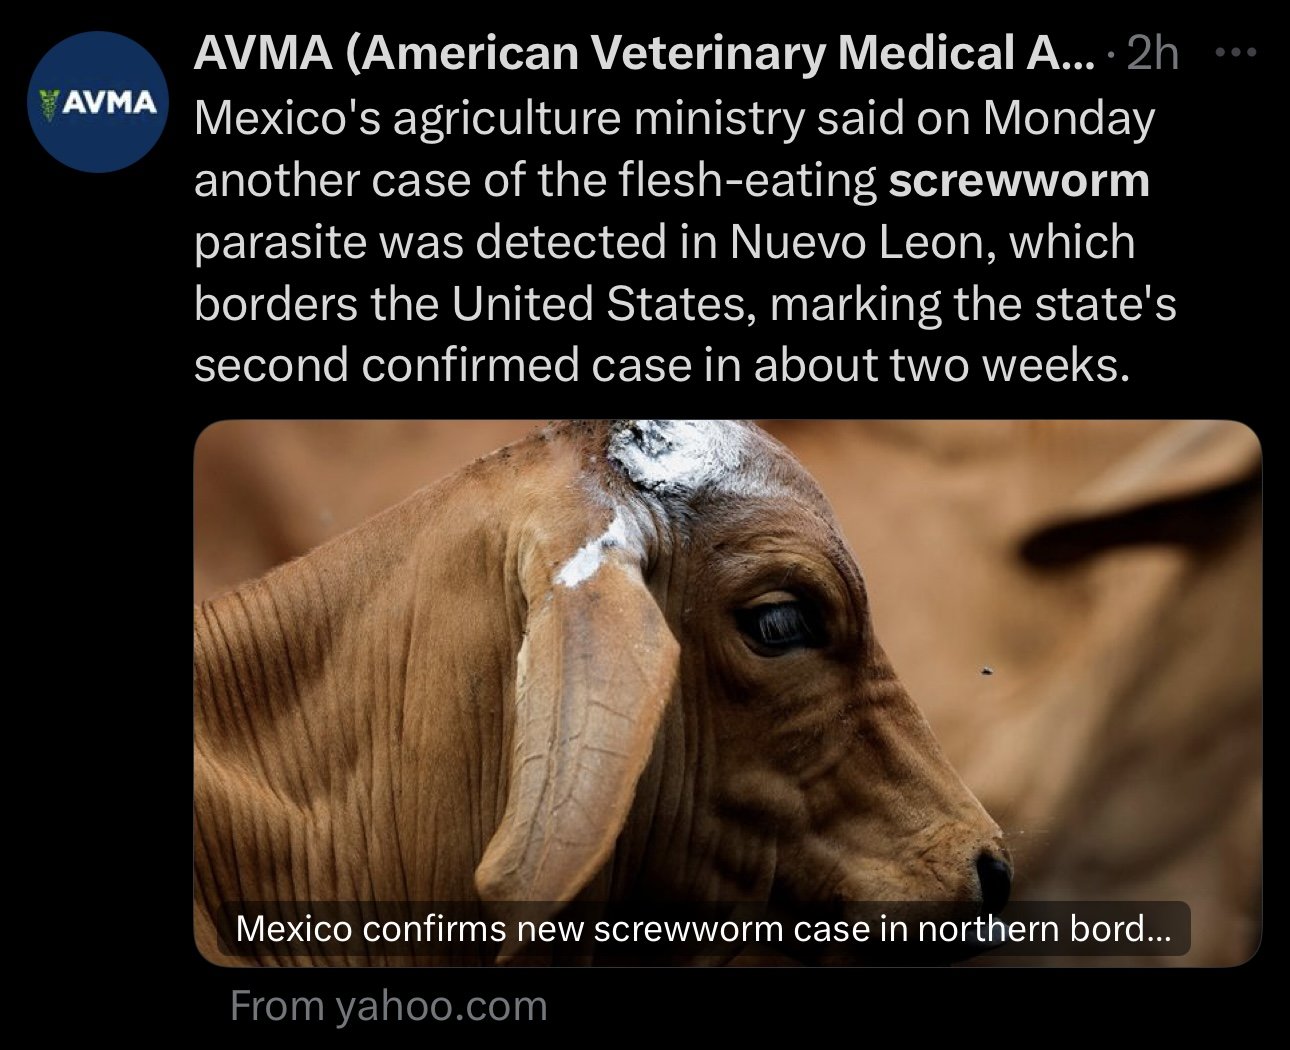
We had a few pieces of news that's been supporting cattle.
First was that there was another screwworm case in northern Mexico.
It looks like someone knew this info was coming because the market rallied before this came out. But it looks like the border isn’t re-opening soon.
We also had the news that Trump and Brazil did not come to a trade agreement. So the tariffs remain on Brazil beef.
As Trump and Brazil spoke for the first time since he added 50% tariffs on Brazil's beef.
Brazil is the #1 beef exporter in the world. This 50% tariff means that their beef gets priced out of the market.
These pieces of news came at a pretty perfect spot on the charts. Right at critical support.
Oct Feeder Chart:
We were sitting in a wedge pattern and got the breakout today.
That is a pretty friendly sign and suggests we could go print new highs.
If we post new highs, we have a potential target of 377.
That is the golden fib from the bottom of the wedge up the previous end of Sep high (outlined on the chart).
(If you are new, the golden fib means it equals 161.8% of the prior move).
This is a common spot for a 2nd rally to pause.
To the downside, the biggest thing to watch is the 50-day MA. That is a must hold spot and will be our warning sign that this market is truly experiencing a larger correction.
The 50-day has acted as an absolute floor in this market.
If it breaks, it could open the door much lower.
The downside target would be to give back 50-61.8% of the entire rally since June. Which is also where the 100-day MA sits.
They always say the trend is your friend. Until the 50-day gives out, you have to lean higher.

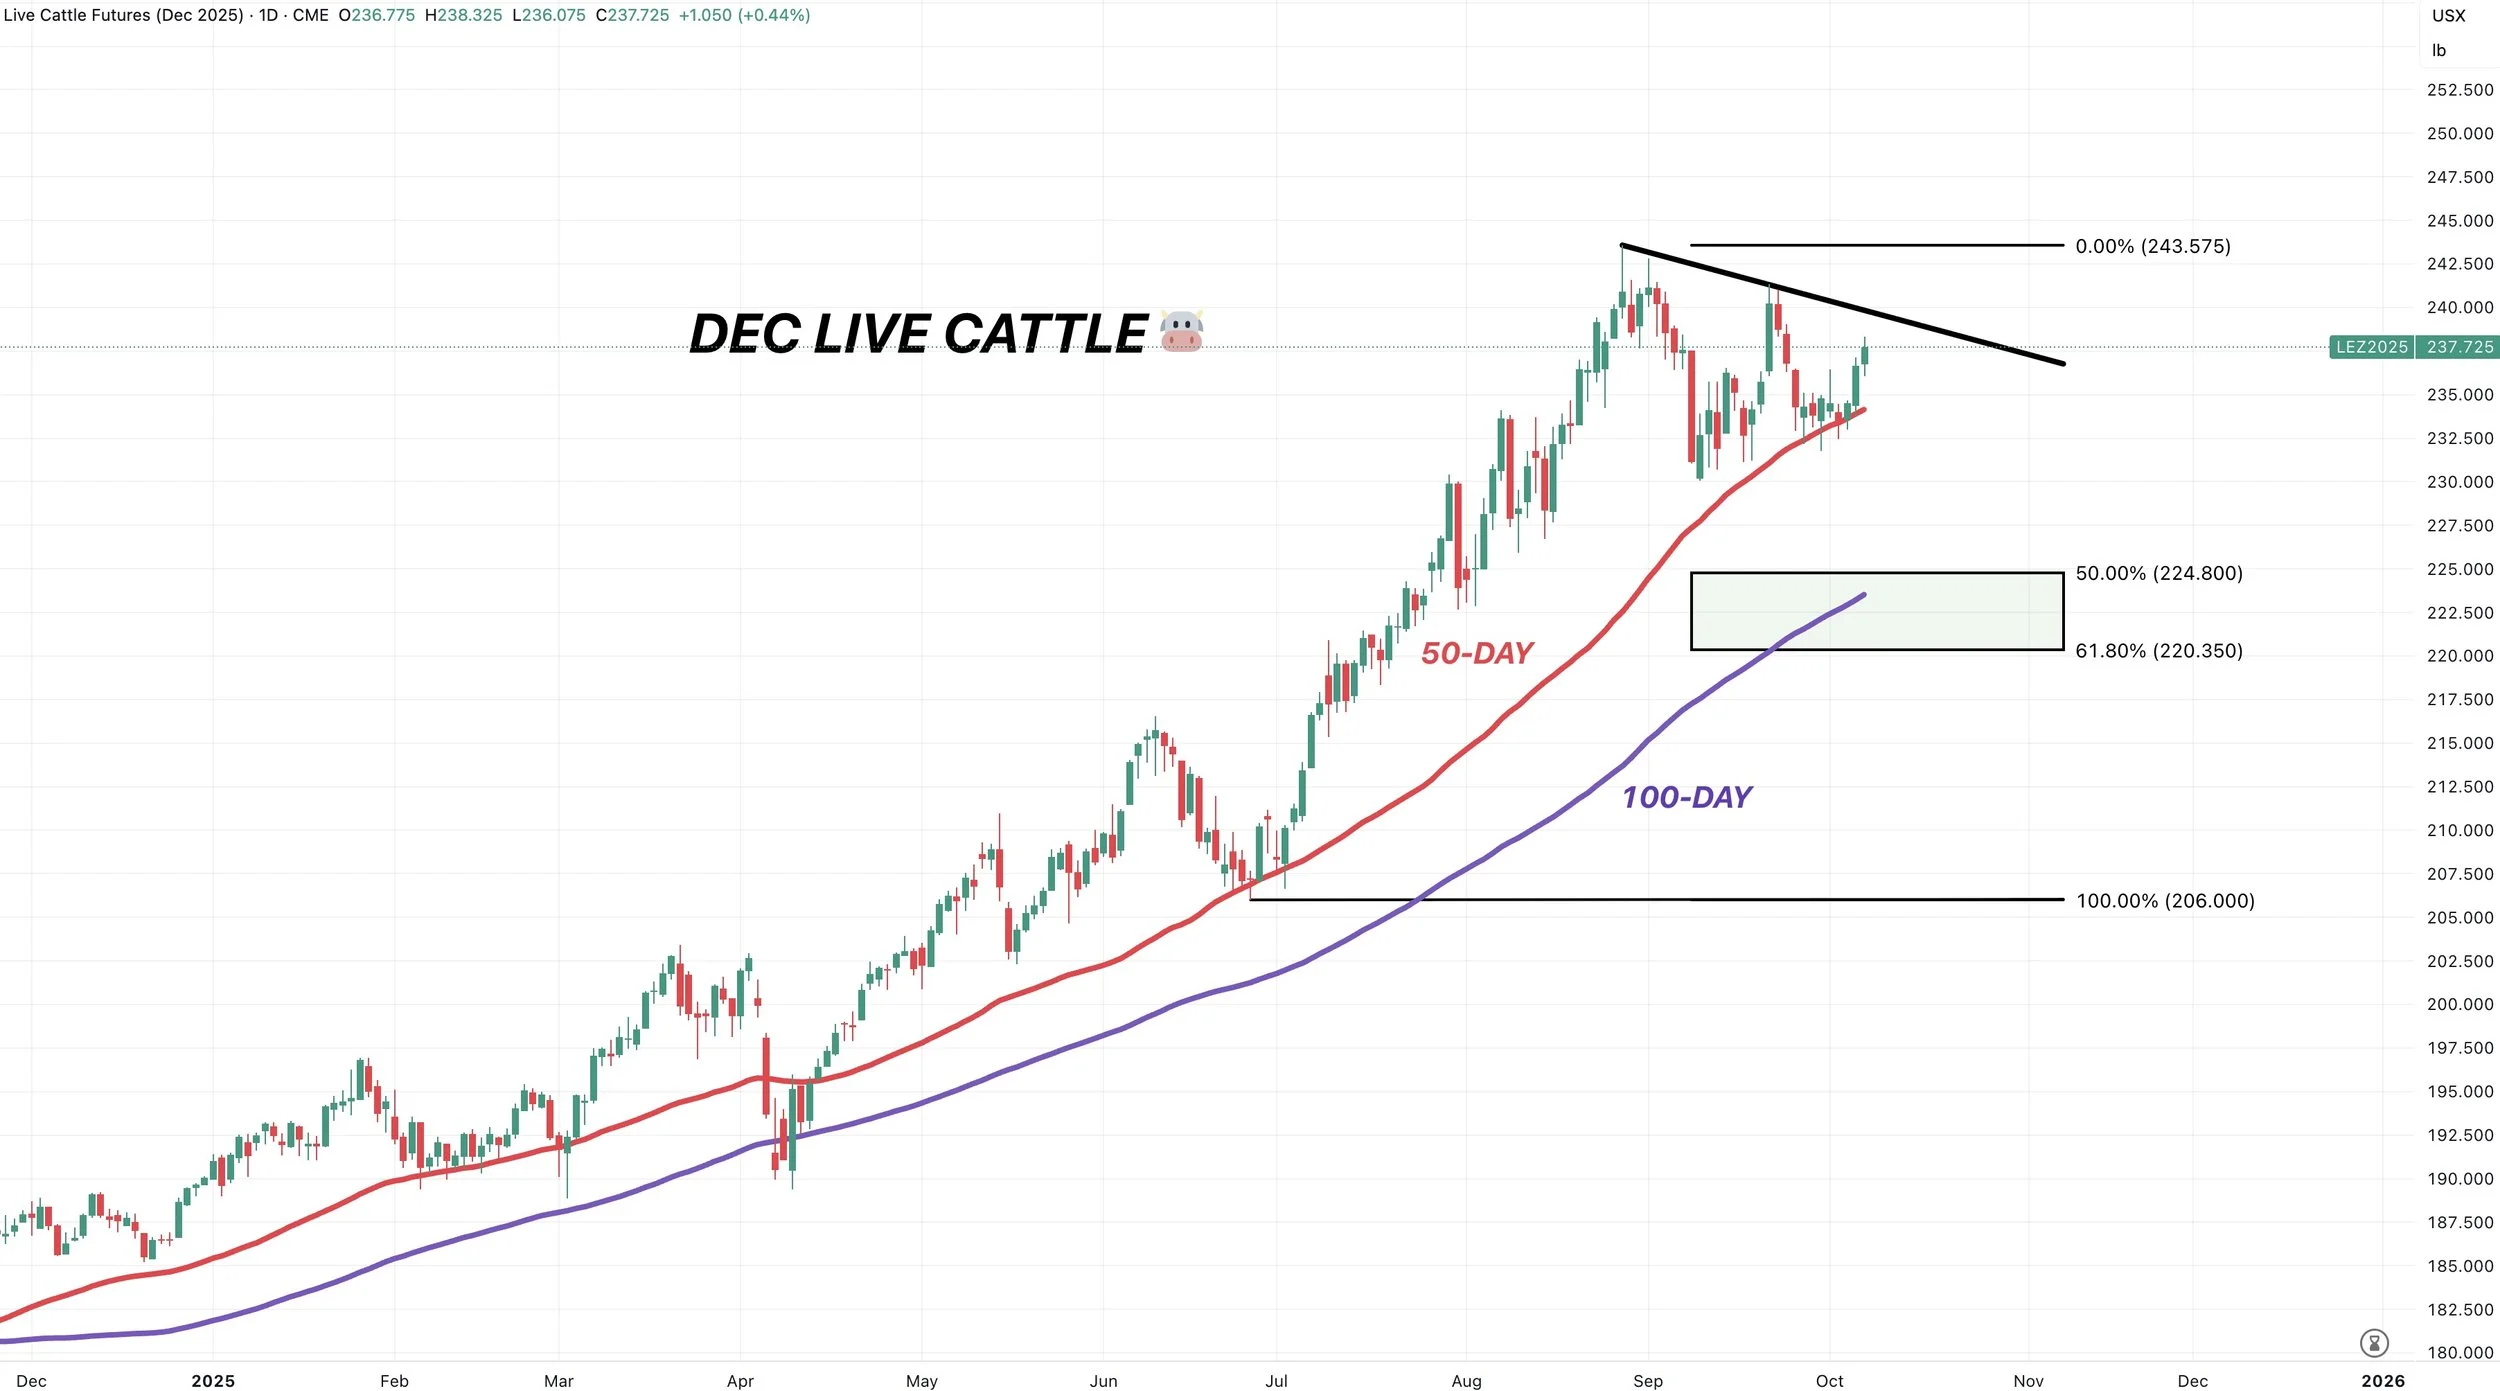
Dec Live Cattle:
Live has not had the breakout that feeders have had.
However, we bounced EXACTLY where we needed to.
Right off that 50-day MA.
This market has bounced there countless times. The only time we broke below it was back in April. We then proceeded to fall to the 100-day.
So the 50-day is still the must hold spot and warning sign. If it gives out, it could open the floor gates lower.
But so far we've continued to hold.
Past Sell or Protection Signals
Aug 22nd: 🌱
Soybean sell signal & hedge alert.
July 31st: 🐮
Cattle sell signal & hedge alert.
July 10th: 🐮
Cattle sell signal & hedge alert.
CLICK HERE TO VIEW
June 5th: 🐮
Cattle sell signal & hedge alert.
June 2nd: 🌾
MPLS wheat sell signal.
April 10th: 🌽
Old crop corn sell signal.
March 19th: 🐮
Cattle hedge & sell signal.
Feb 18th: 🌽 🌾
Old crop KC wheat & old crop corn signal.
Jan 23rd: 🌽 🌱
Corn & beans old crop sell signal.
CLICK HERE TO VIEW
Jan 15th: 🌽 🌱
Corn & beans hedge alert/sell signal.
Jan 2nd: 🐮
Cattle hedge alert at new all-time highs & target.
Dec 11th: 🌽
Corn sell signal at $4.51 200-day MA
CLICK HERE TO VIEW
Oct 2nd: 🌾
Wheat sell signal at $6.12 target
Sep 30th: 🌽
Corn protection signal at $4.23-26
Sep 27th: 🌱
Soybean sell & protection signal at $10.65
Sep 13th: 🌾
Wheat sell signal at $5.98
May 22nd: 🌾
Wheat sell signal when wheat traded +$7.00
Want to Talk?
Our phones are open 24/7 for you guys if you ever need anything or want to discuss your operation.
Hedge Account
Interested in a hedge account? Use the link below to set up an account or shoot Jeremey a call at (605)295-3100.