
GRAINS CATCH A BID WHERE NEEDED
MARKET UPDATE
You can scroll to read the usual update as well. As the written version is the exact same as the video.
Timestamps for video:
USDA Preview: 0:00min
Corn: 6:10min
Beans: 11:00min
Wheat: 13:15min
Cattle: 17:00min
Want to talk?
Office: (806)484-1214
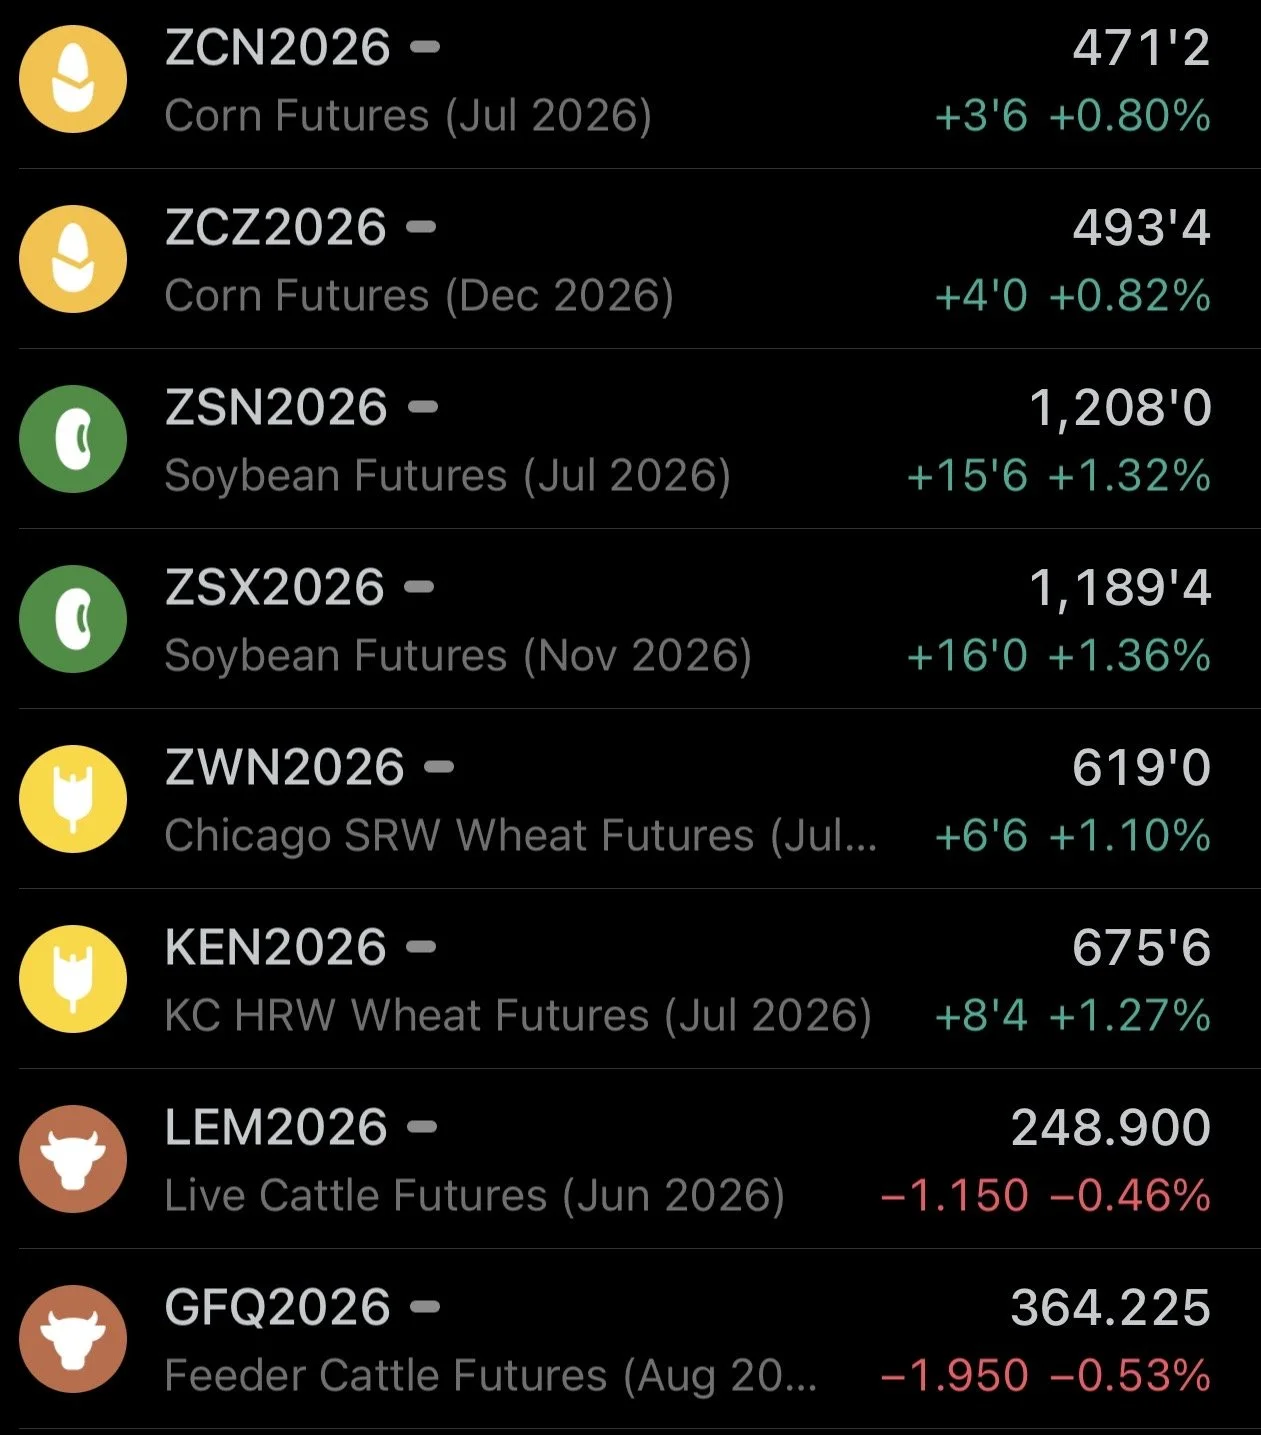
Futures Prices Close
Overview
Solid day for the grains as we catch a bid right where we needed to at those key support levels we've been talking about the last few days.
Overall today was a boring day newswise.
All eyes are set on next week's big events.
We've got that China meeting scheduled for Thursday.
Then we've got the USDA out on Tuesday.
Today's update is mainly going to be chart focused, and we're going to go over a preview of next week's USDA.
USDA Preview
This USDA report is going to give us our first official balance sheets for new crop.
We'll get into the estimates and how they stack up compared to the last several years, but first I wanted to see, is this report a big market mover or not?
Market Mover?
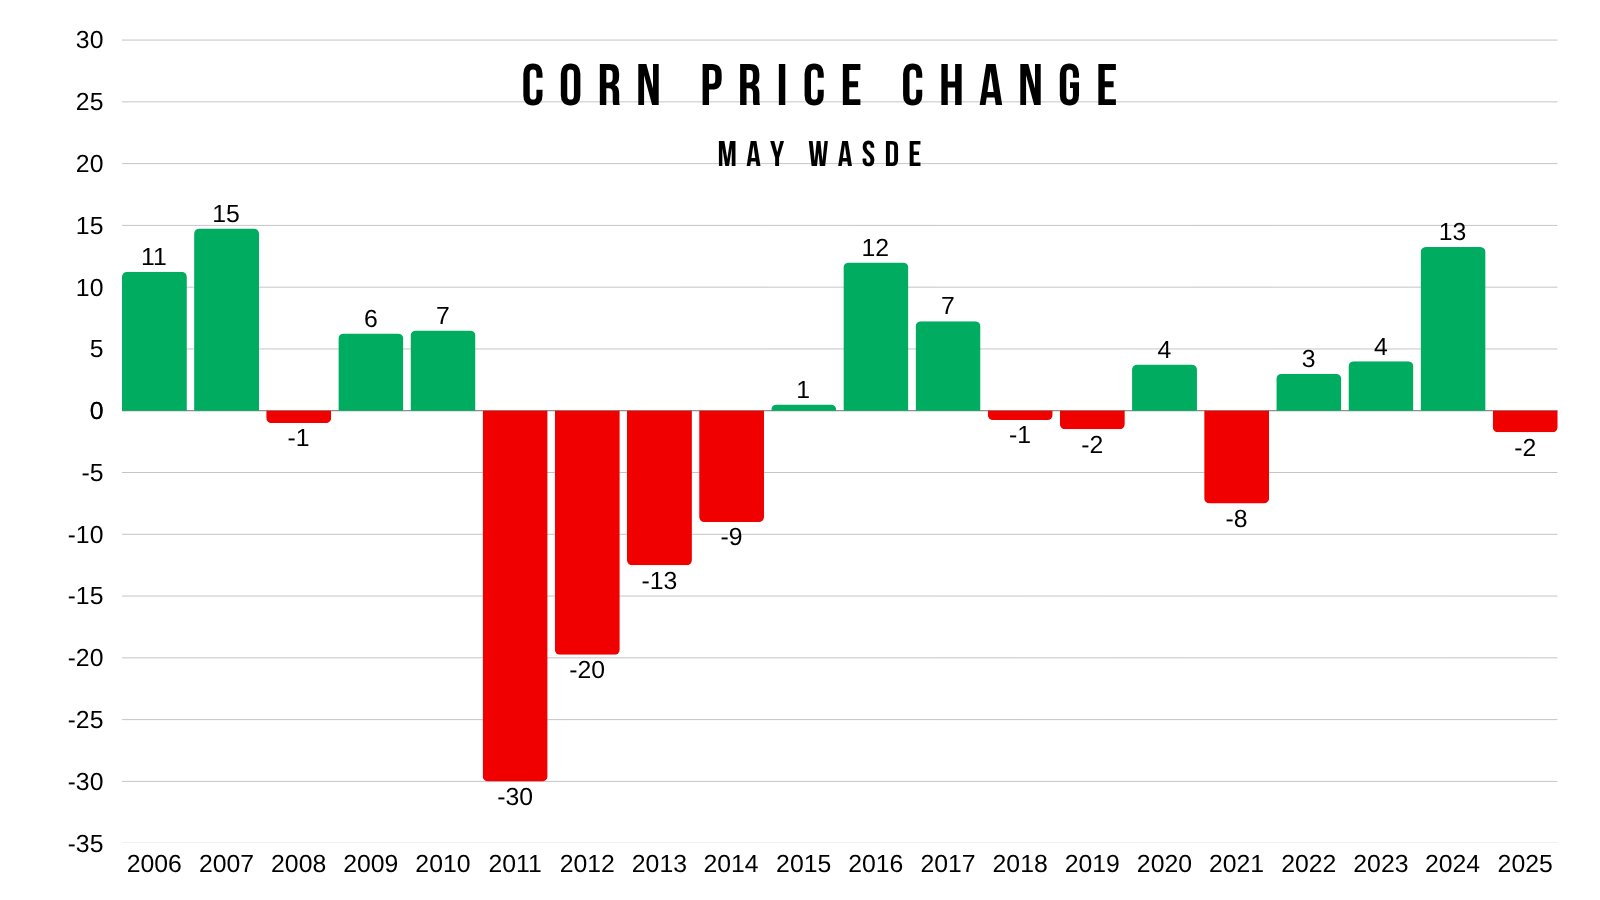
First for corn.
Over the last decade, no this report hasn’t tended to be a "major" market mover.
In the last 10 years, we saw corn move less than 5 cents in 6 of those 10 years.
The average move the last decade is +/-5 1/2 cents.
We haven’t dropped by more a dime since 2013.
We've only dropped by more than 5 cents just once since 2014.
So the report has had somewhat of a friendly tilt over the last decade, or at least not a bearish one.
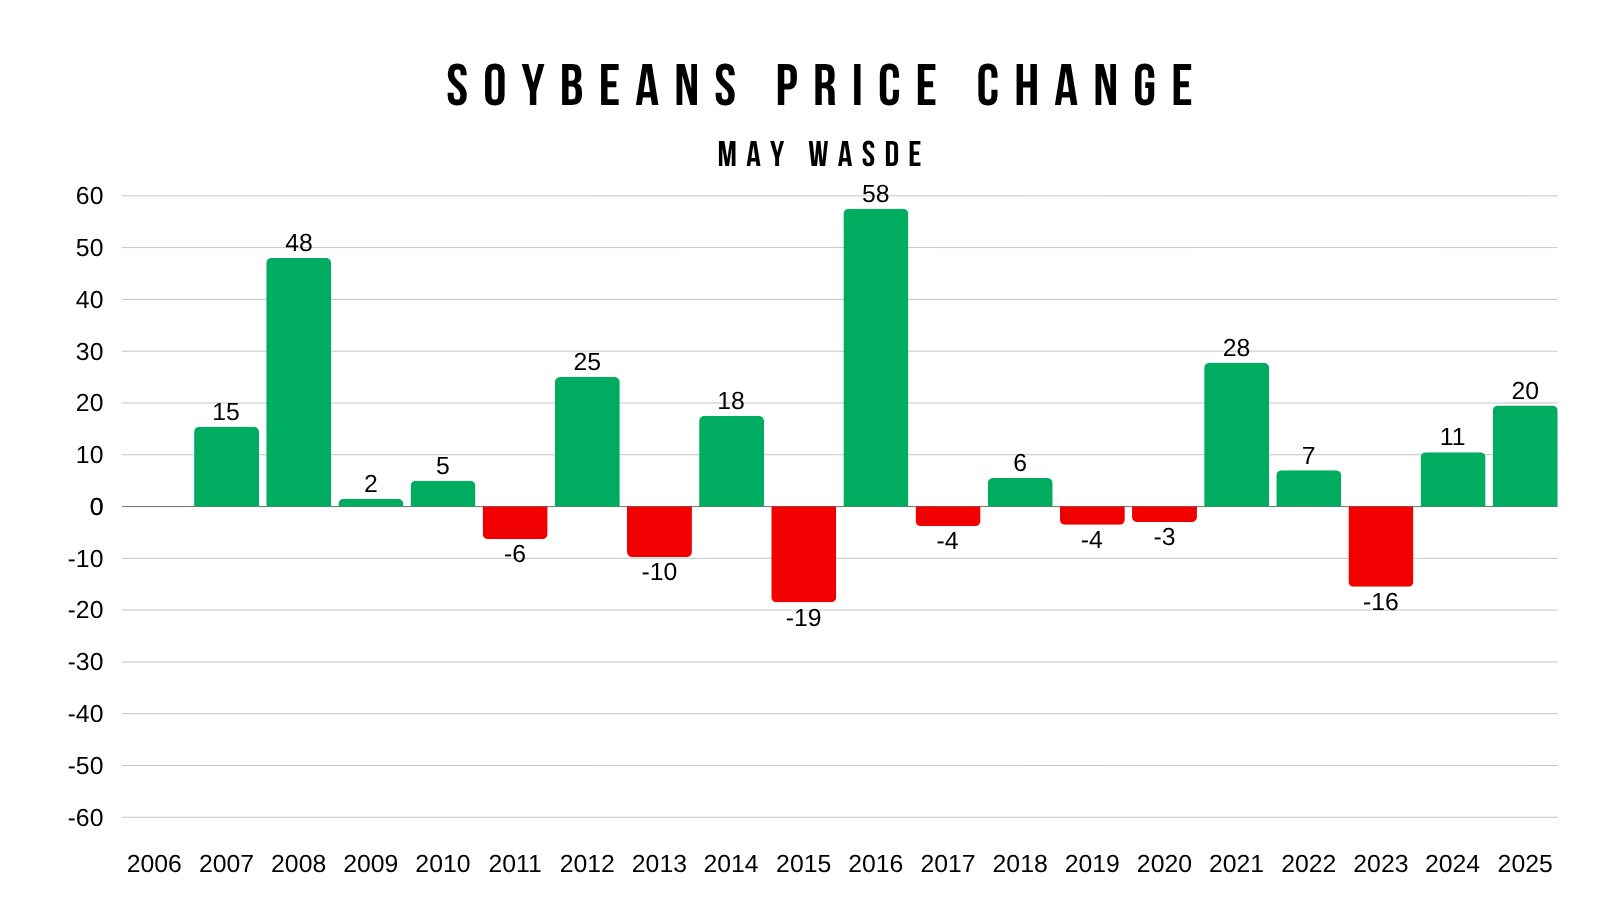
Some years beans move a decent amount on this report, others, they hardly move.
Over the last decade, we've seen us move more than a dime in 5 of those 10 years. Half the time.
The average move the last decade is +/- 15 1/2 cents (altough 2016 skews this).
Something to note is that beans have only lost more than a dime twice in the last 20 years.
So it also has a friendlier tilt for beans as well.
The report has been positive the last 4 of 5 years.
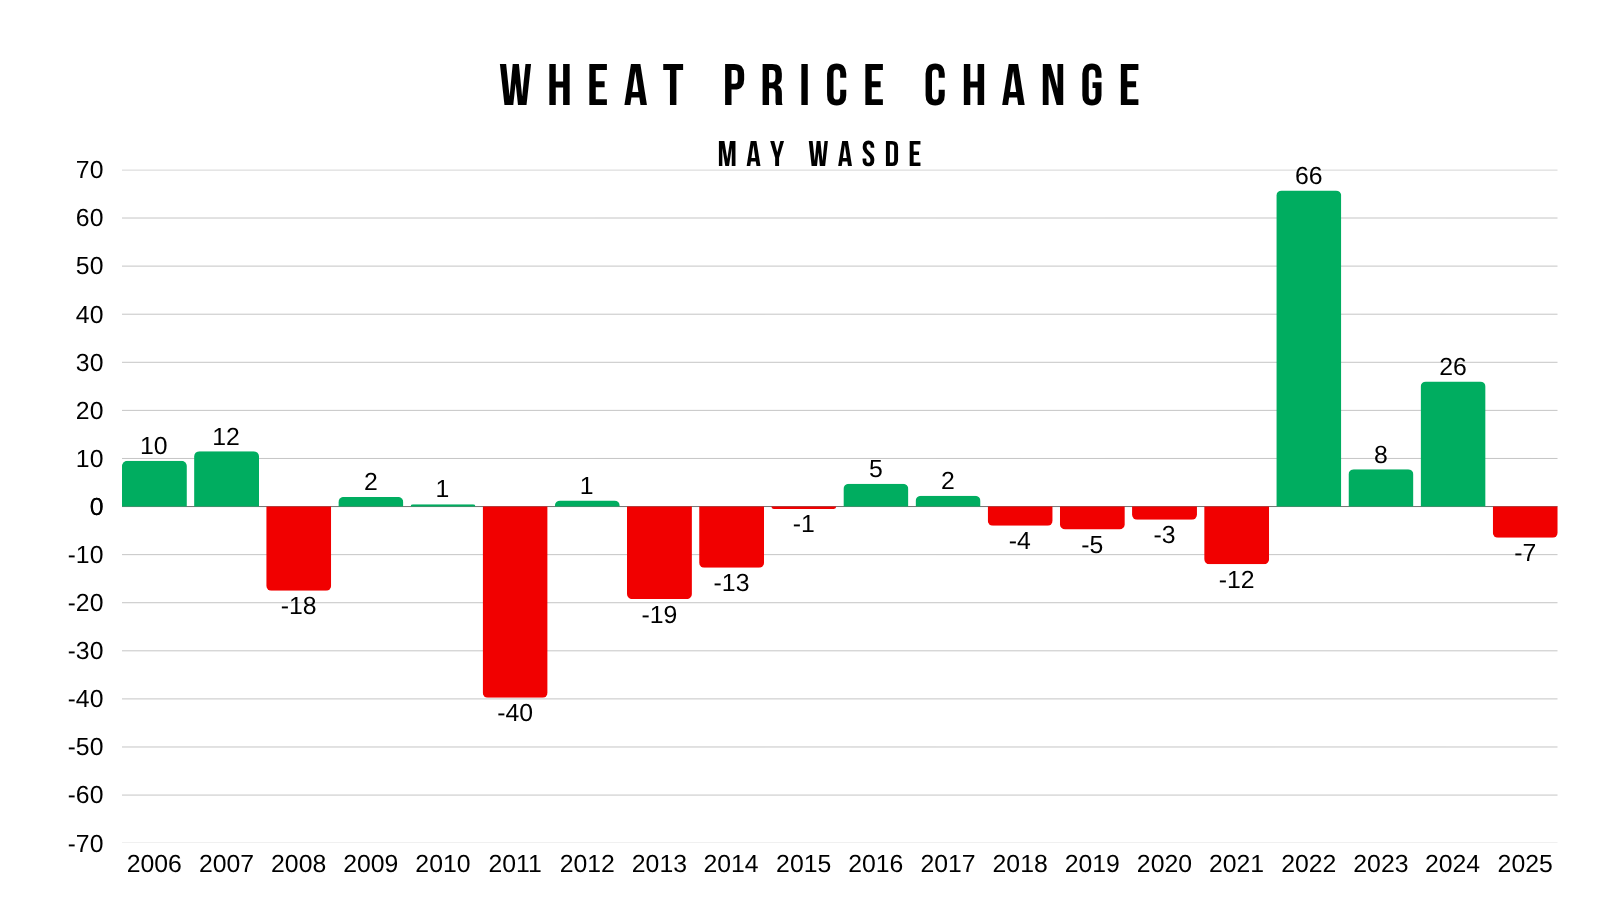
There are several years where wheat doesn’t move at all on this report, but the last 5 years have seen a wider range of trade.
Average move last decade is +/- 14 cents. But 2022's skews that data, as we've only moved more than a dime twice since 2014 if you remove 2022.
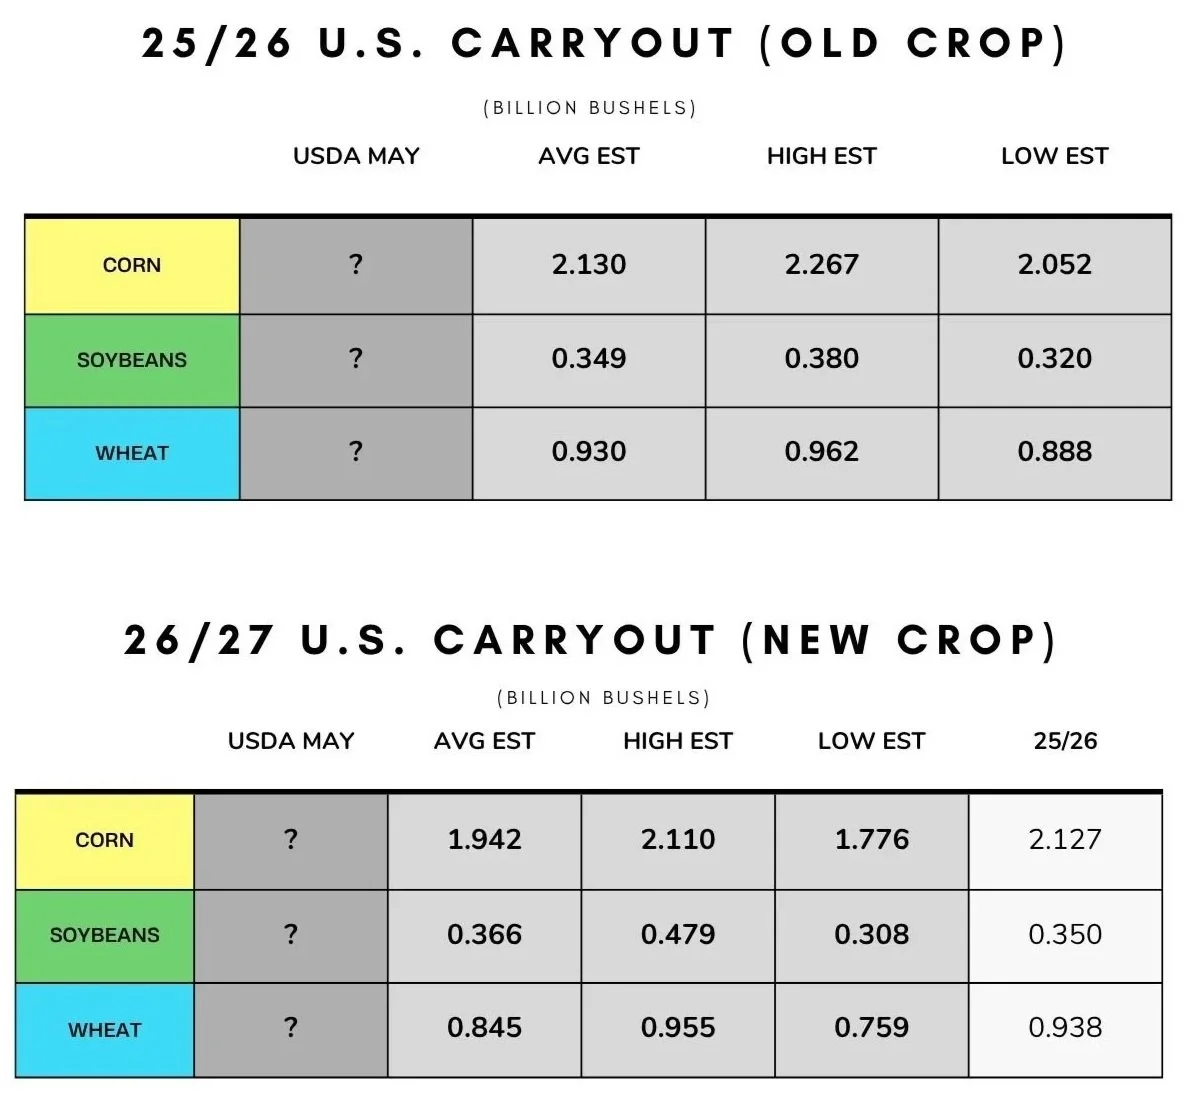
The Estimates:
New Crop
Corn: 1.942 billion
Beans: 366 million
Wheat: 845 million
Old Crop
Corn: 2.130 billion
Beans: 349 million
Wheat: 930 million
So the trade is looking for soybeans to be roughly the same as they were last year. But are looking for a pretty sizeable cut in both corn and wheat.
Those new crop numbers would be a near -200 million change in corn vs last year, and a -100 million cut to wheat.
Corn Visuals:
Next we're going to take a quick look at how these estimates stack up compared to previous years.
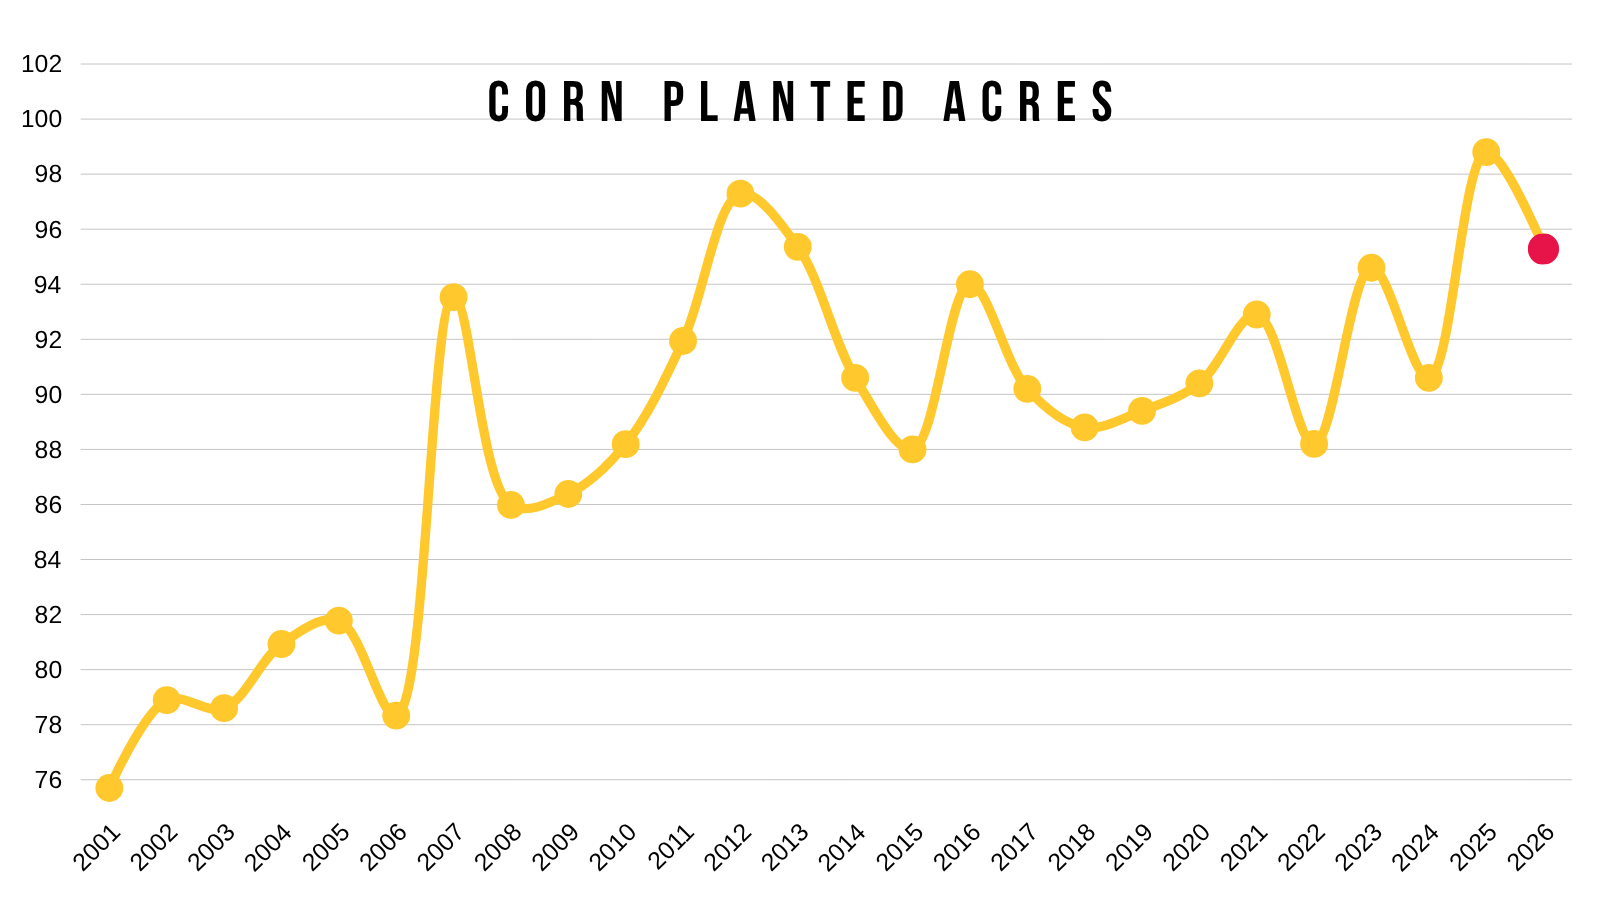
The USDA is more than likely going to say we have 95.3 million acres and a yield of 183. Where the demand side of the balance sheet comes in will be important.
The trade is expecting a 1.94 billion bu carryout.
Like we mentioned, that would be a pretty sizeable cut from last year.
But outside of last year, it would still be the highest since 2019/20 if that number held.
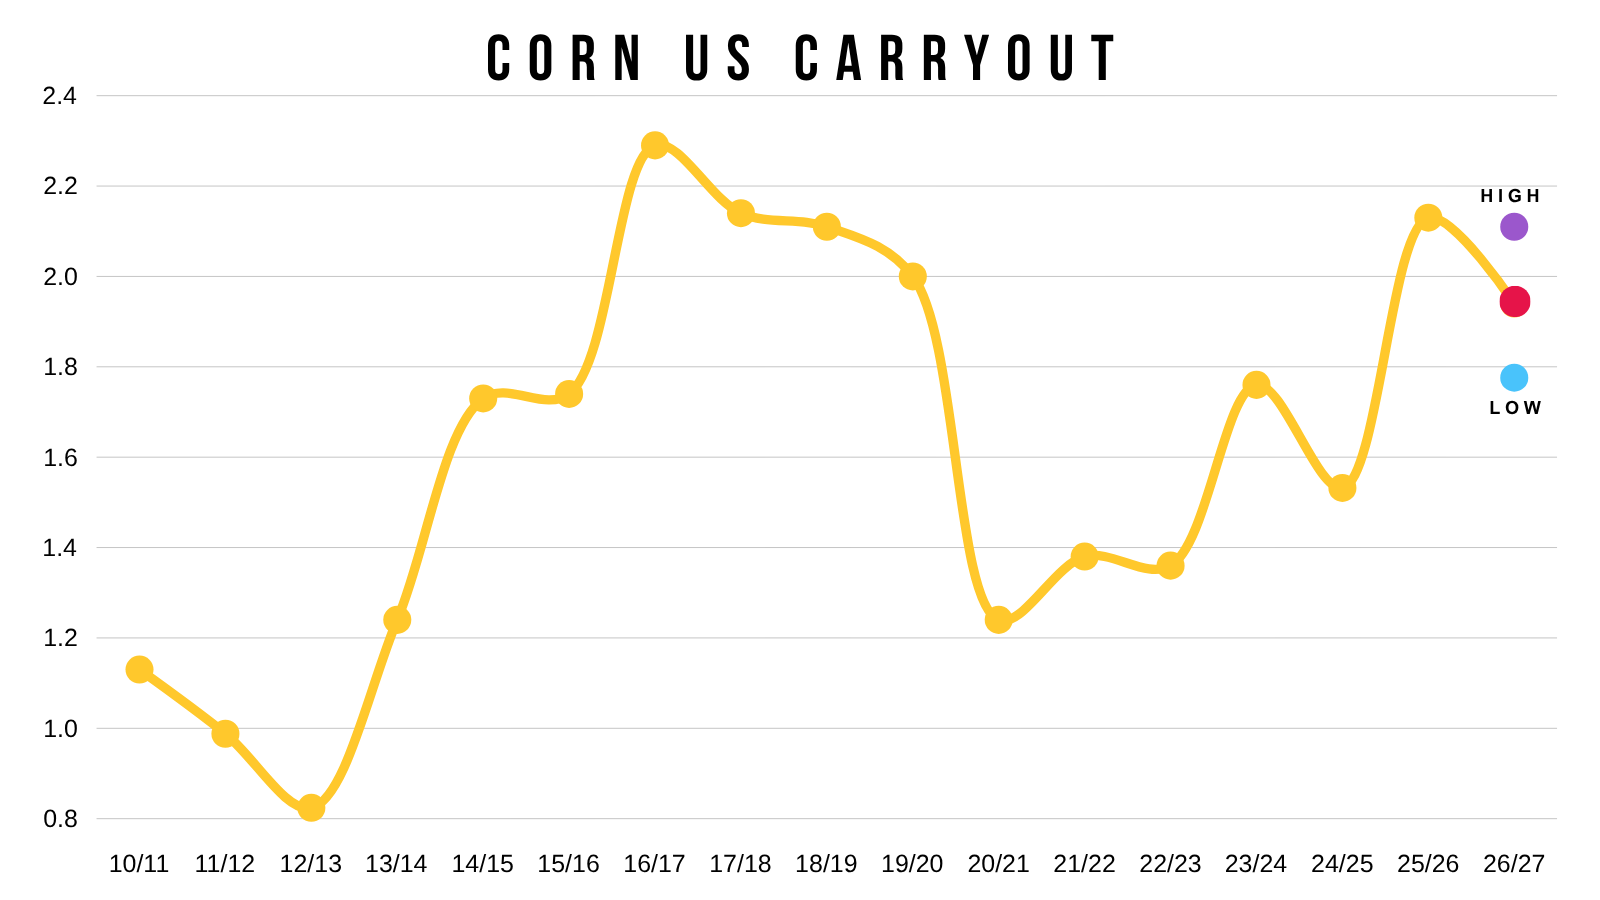
However it's of course just the starting the number and bound to change.
We will be going over some balance sheet scenarios after we get the USDA's initial numbers. As yield and acres can make a huge impact.
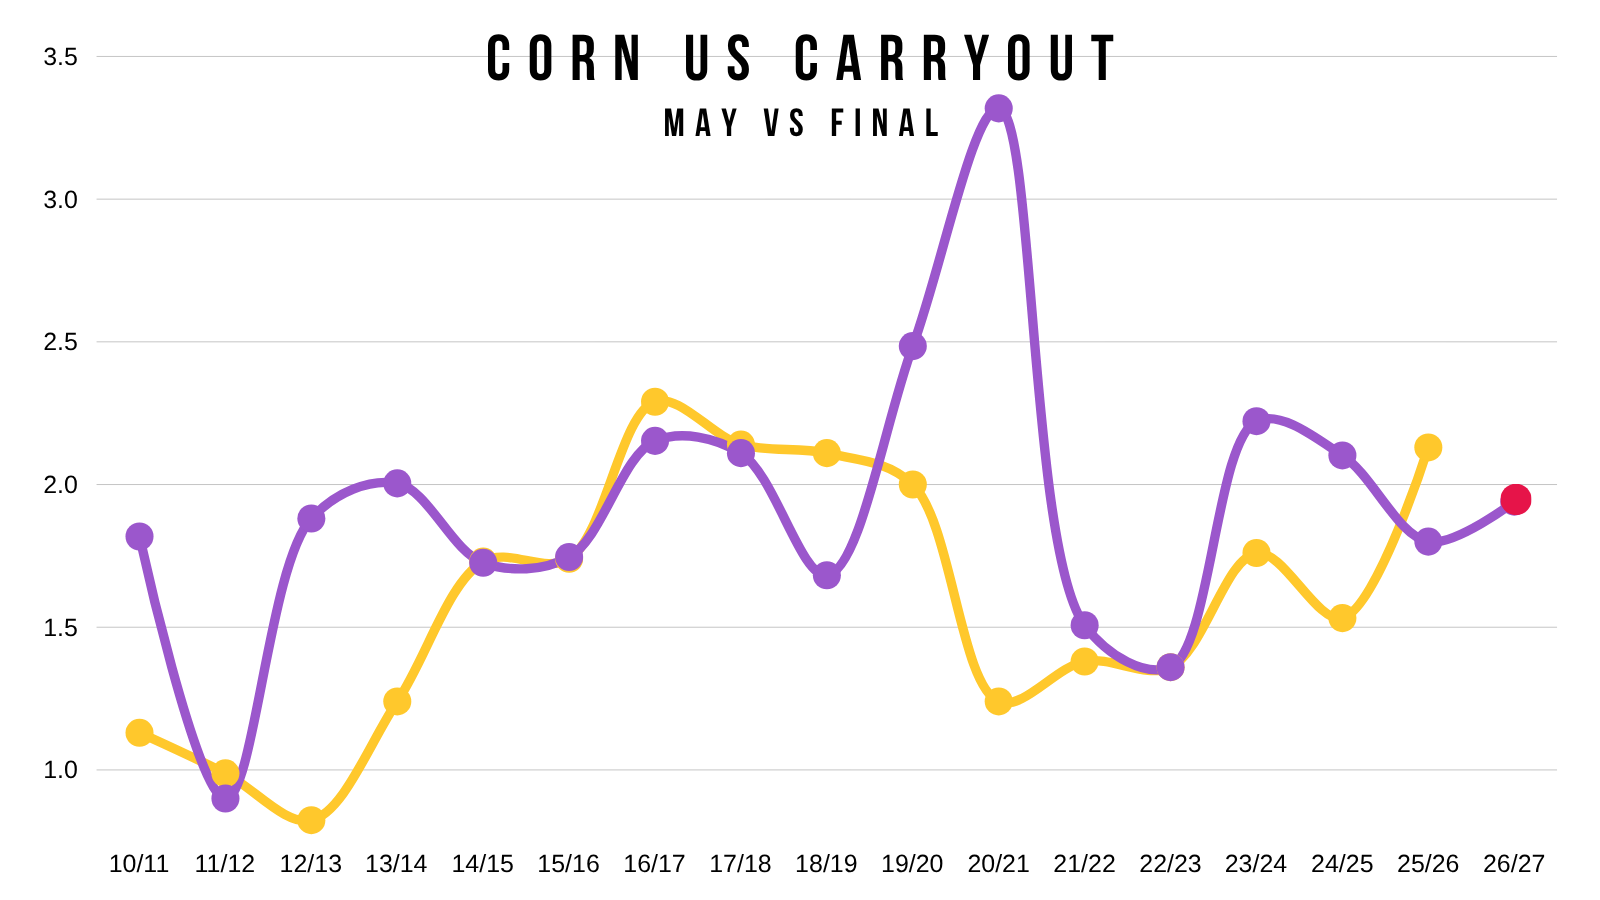
If we look at how final carryout came in vs the USDA's starting carryout number in May, you can see that most of the time we do ultimately end up lower than that starting number.
Last year was the first time since 2018/19 where the final number actually ended up being higher than the starting one.
(Purple = May Carryout) (Yellow = Final Carryout)
We've seen a record yield for 3 straight years in a row.
The first time we've ever seen that happen, and the longest streak.
I don’t think there is any way we get a 186 again this year.
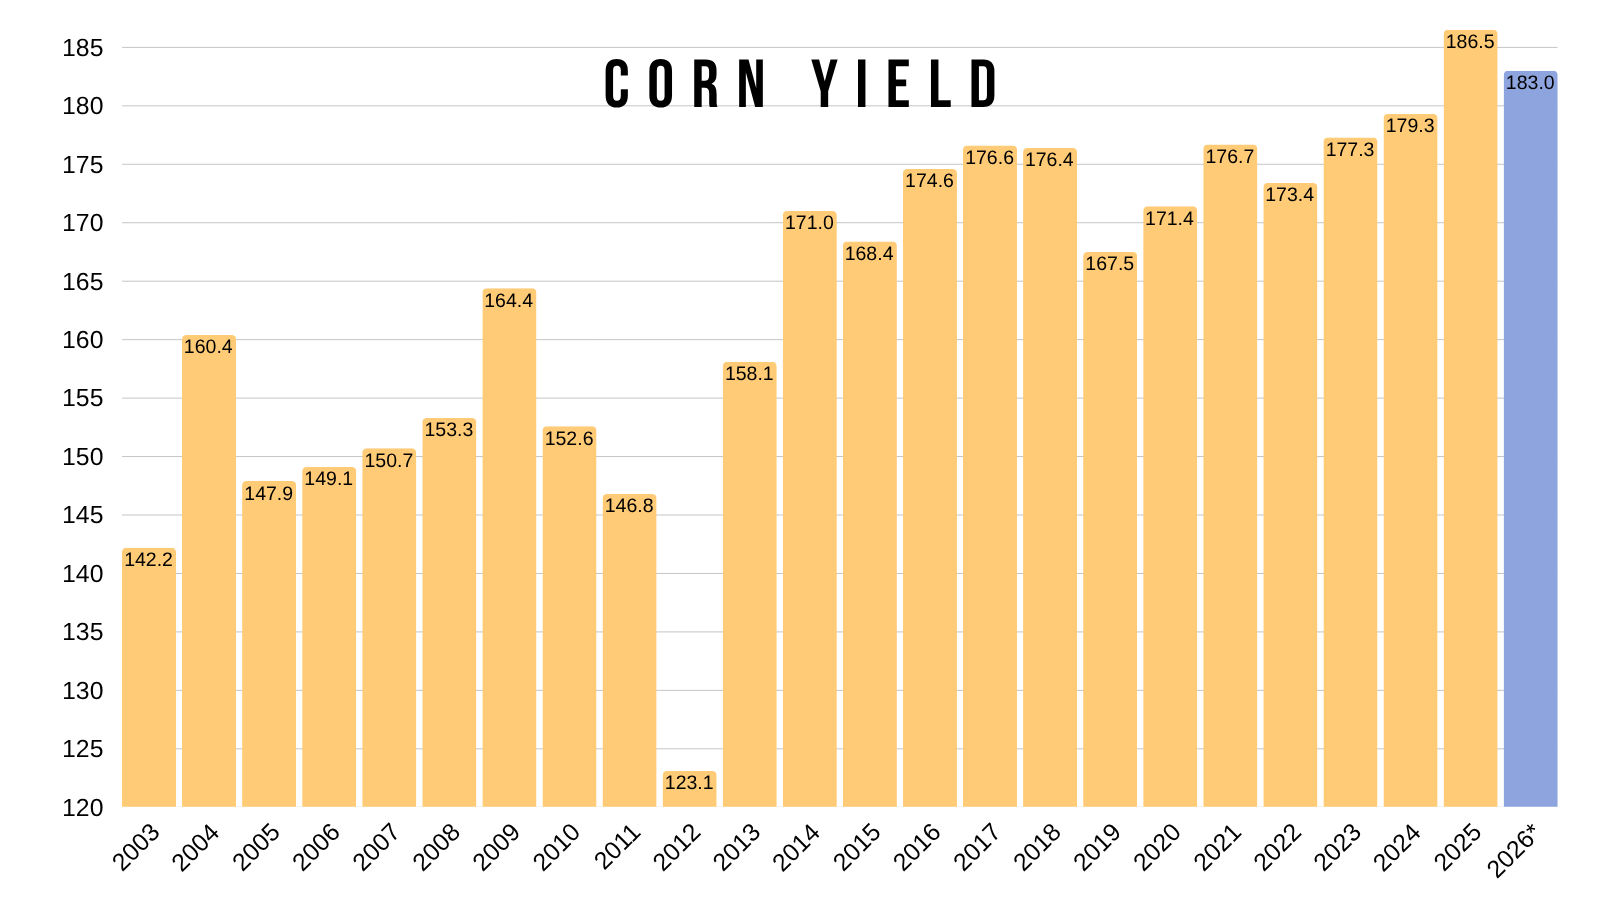
The planting intentions had 95.3 million acres.
That is a pretty large drop from last year's near 99 million.
However, that 95.3 would still be the 3rd most acres ever.
Are we really going to see that many acres with the whole fertilizer situation?
My personal bias still leans towards acres being a little too high.
Again, I'll be touching on this next week once we get the balance sheets, but if acres drop to 94 or 93 million, it would be pretty friendly. As it would equate to roughly 200-400 million bu less on the supply side of the balance sheet. Part of the reason why I believe new crop has a "potential" story down the road.
Soybean Visuals:
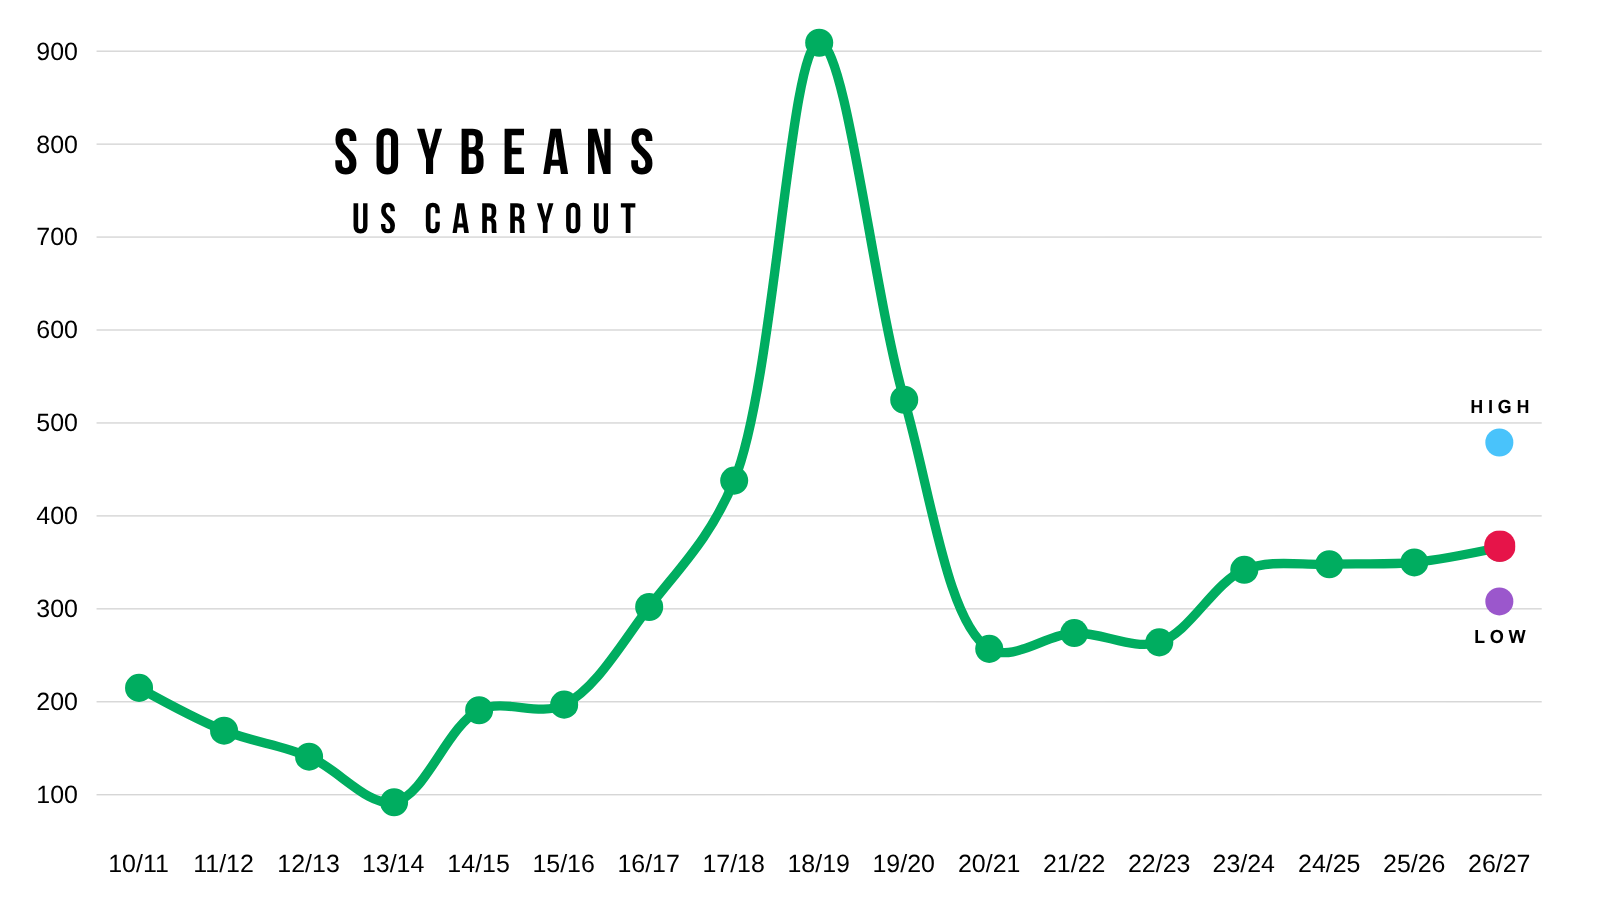
Soybean carryout has essentially been unchanged for 3 years in a row now.
The trade is expecting it to remain basically unchanged for the 4th year in a row.
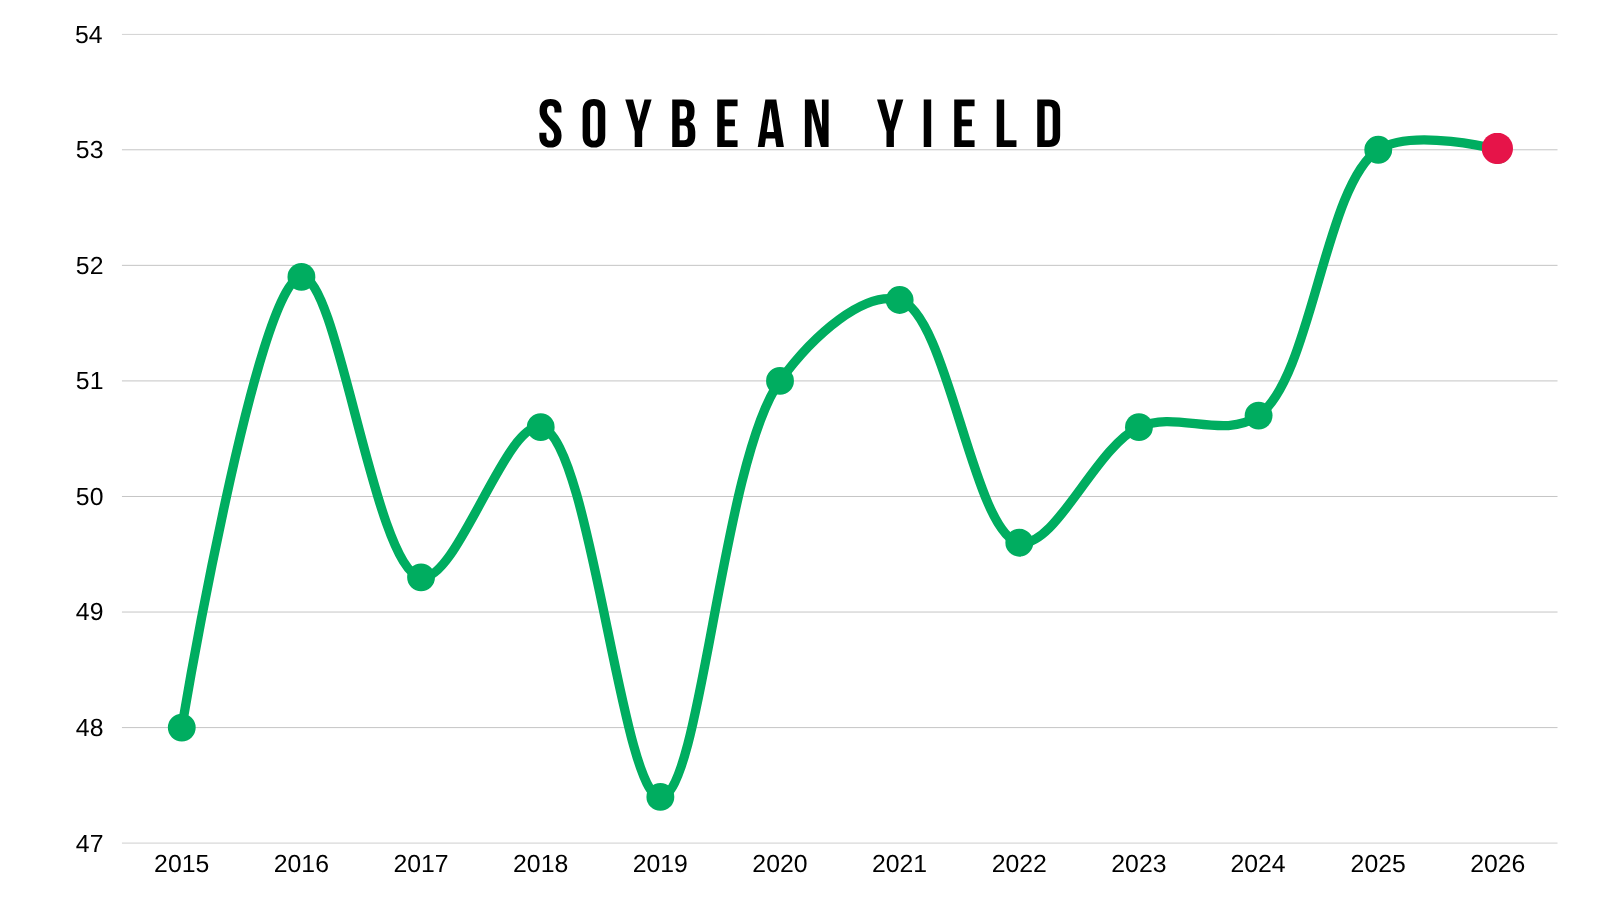
Last year we had that record yield.
The USDA is likely going to be saying yield is going to be 53 bpa once again as their starting point.
Are we going to see back to back records? That is something we have yet to see.
As 2016's record held until last year.
Wheat Visual:
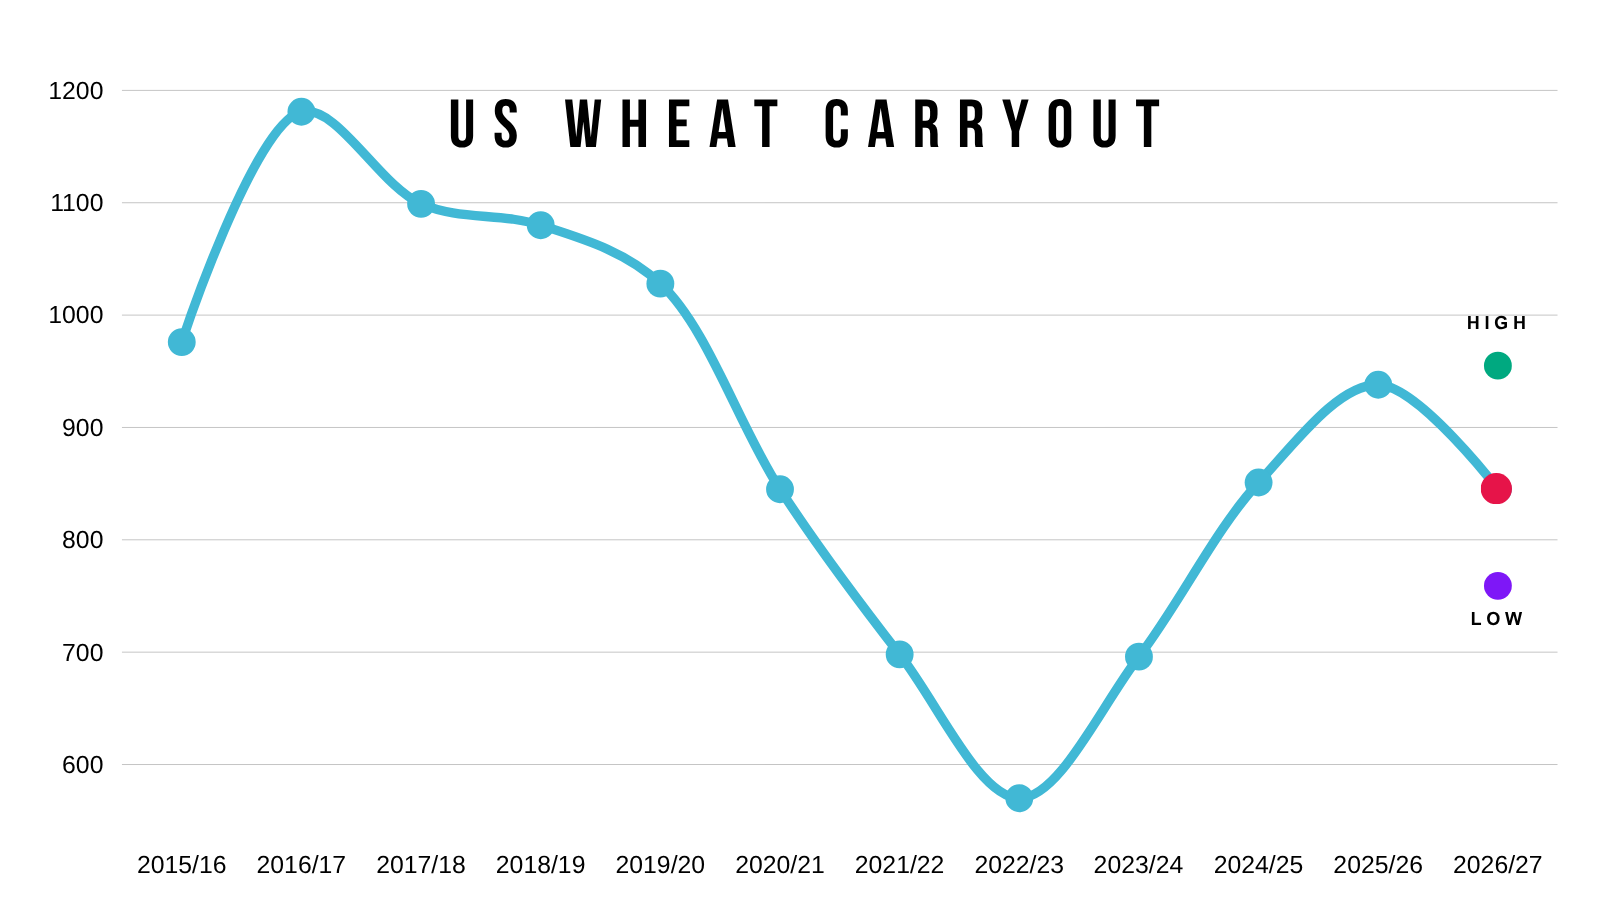
As mentioned, the trade is expecting a large drop vs last year.
This number would be about on far with what it was 2 years ago.
Today's Main Takeaways
Corn
Seasonal Window:
I already dove into this topic pretty heavily in my last few updates.
So if you want to see more data on the seasonals, and how critical the time frame we are approaching typically is, check out Wednesday's update.
I go over how often we are lower from today by July 1st, how often we are lower from today by August and a bunch of other data.
Click Here for Wednesday Update
Even though I think new crop corn has plenty of potential down the road, we can’t ignore the fact that the next 30-45 days are where we typically see our highest prices of the year. So that is where we want to make the majority of the sales we are going to make. Especially those who lack storage. We are "almost" always lower by August.
That potential whether it comes from the fertilizer situation, lower acres, or even an inflation play, might not happen until late in the year or early next year, or maybe it doesn’t happen at all.
For starters, we won't even be getting an update on acres until at least June, which is historically when that seasonal window starts to close.
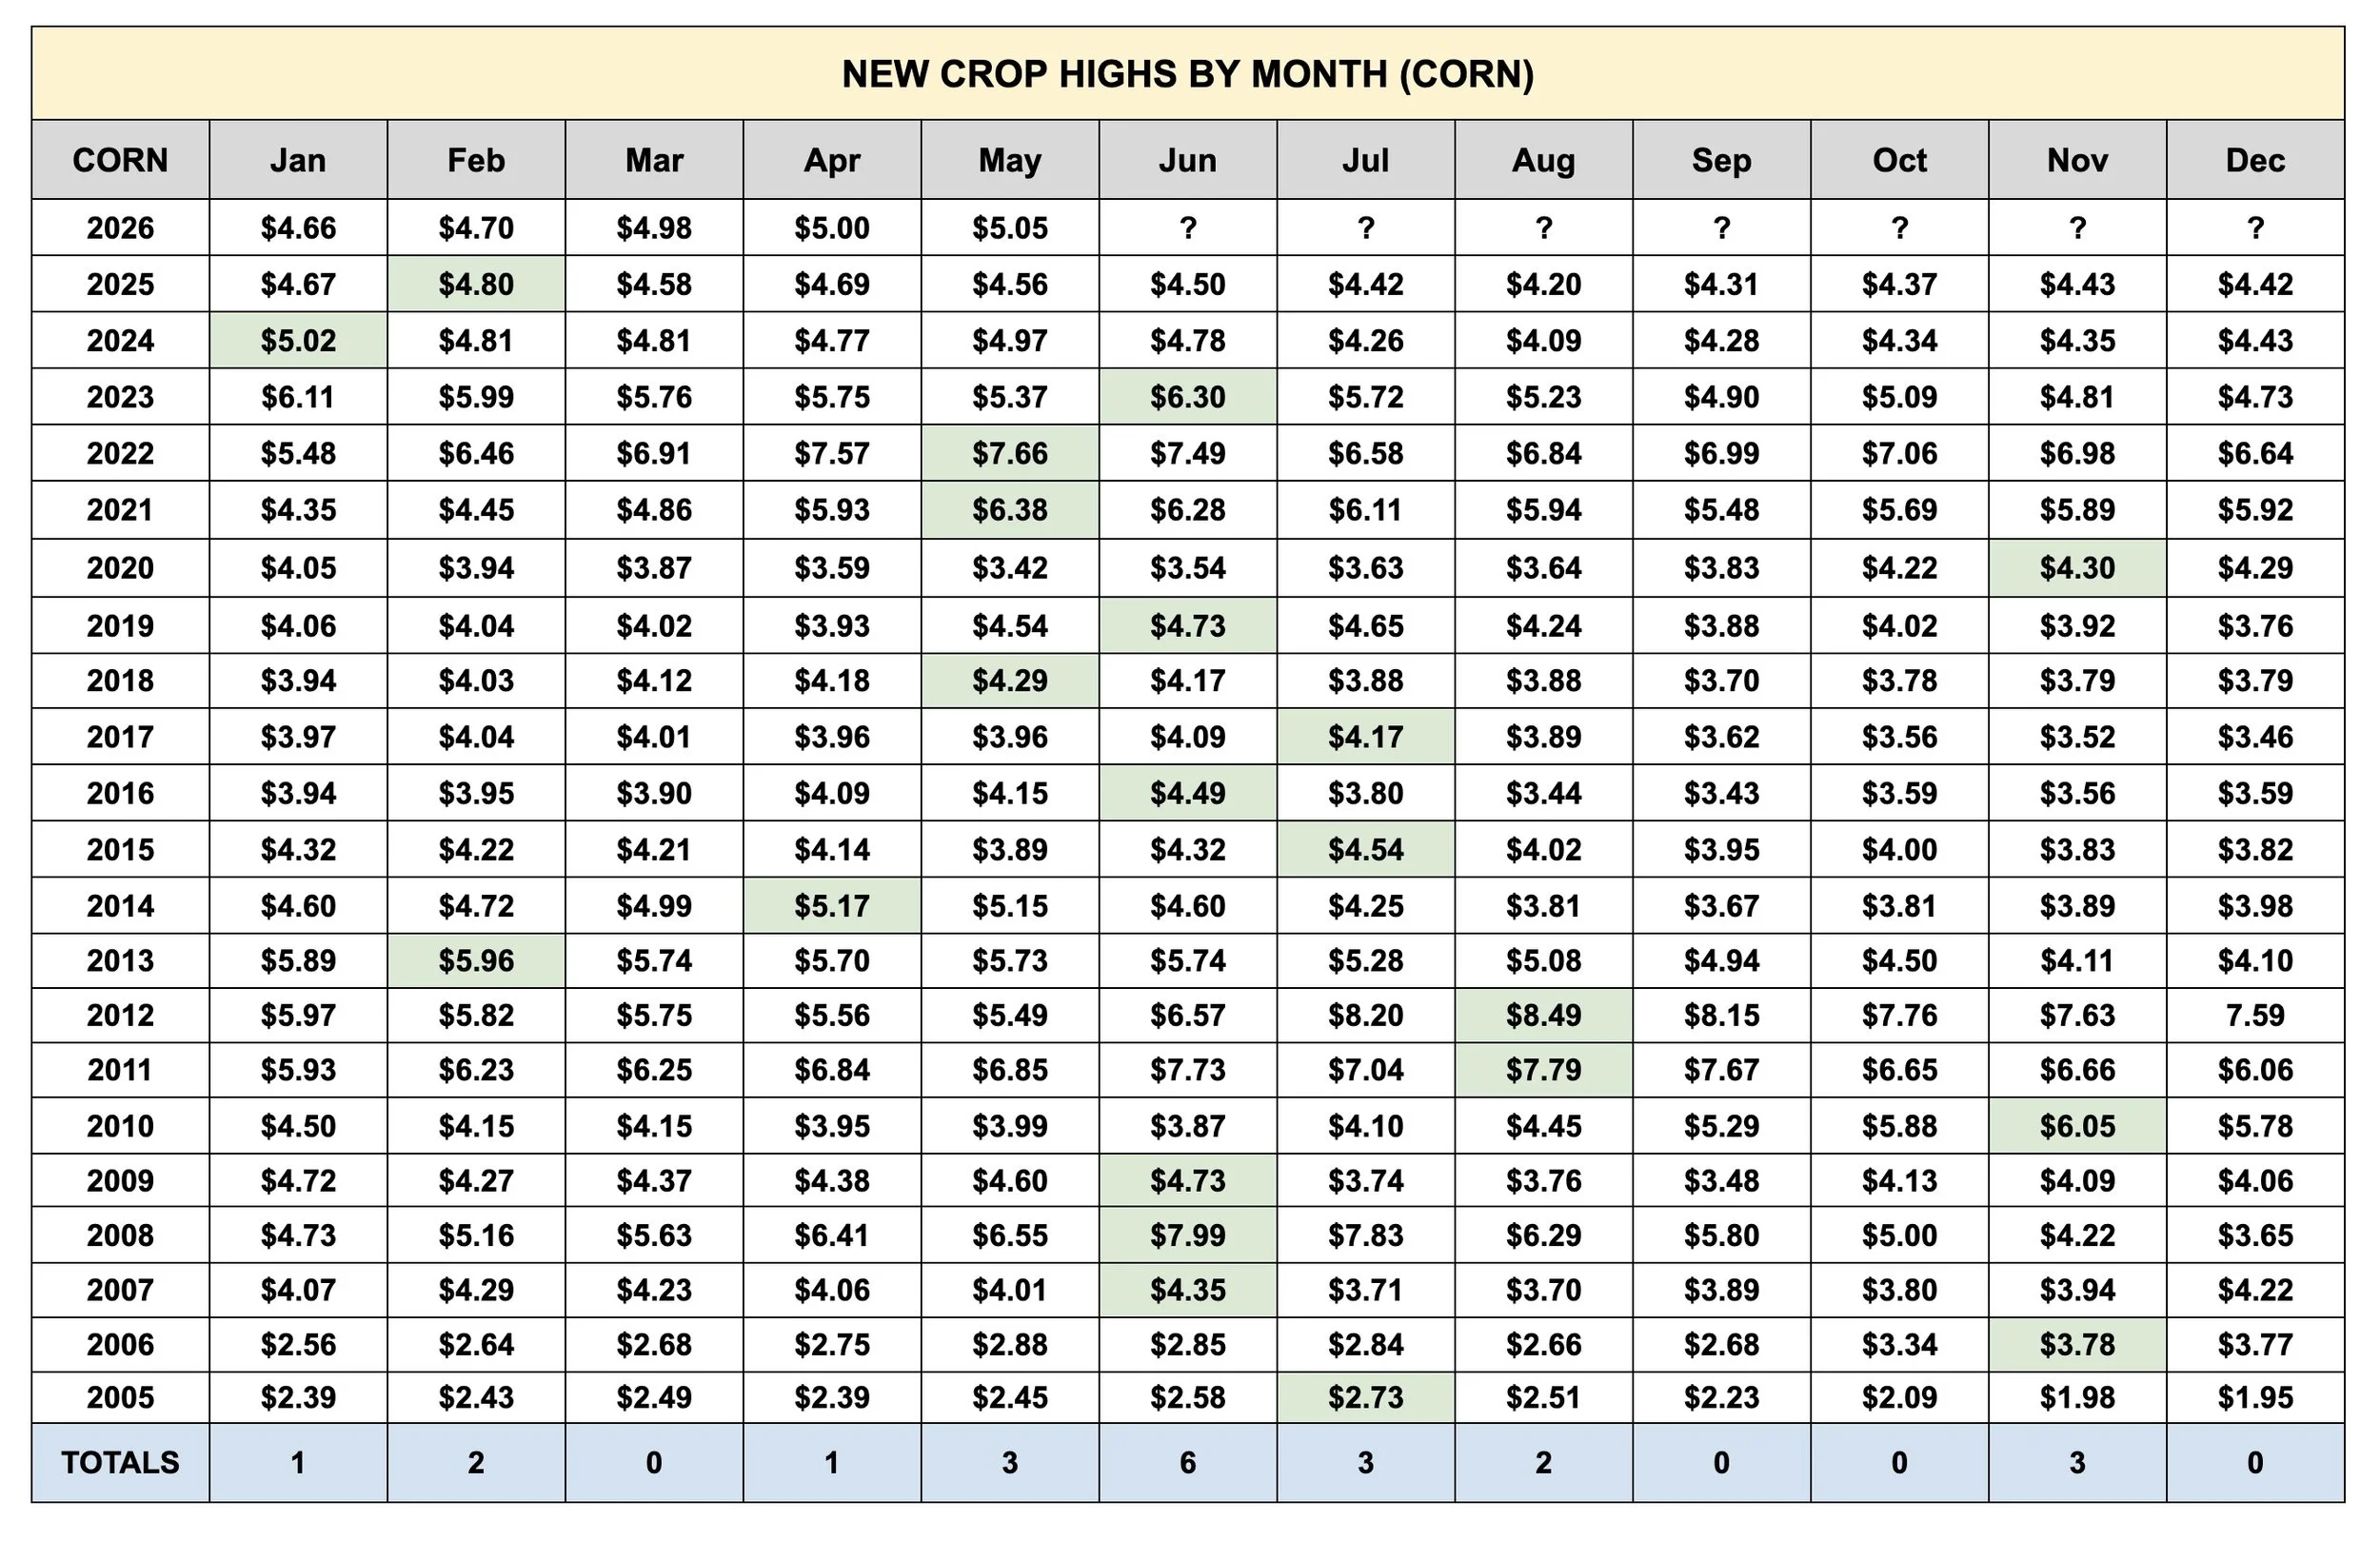
I've shown this in the last few updates, but once again, here is Dec corn's highest price for every month since 2005.
May and June have marked the highs the last 6 of 10 years.
We haven’t seen a July top since 2017.
We haven’t seen an August top since 2012.
The last two times we posted our highs in November, a bull market followed over the course of the next 1-2 years. So that's going to be something to watch. If we end up making new highs super late in the year, it's previously resulted in much higher prices.
The only caveat here would be that this isn’t a normal year due to the war. But this is what the data tells us.
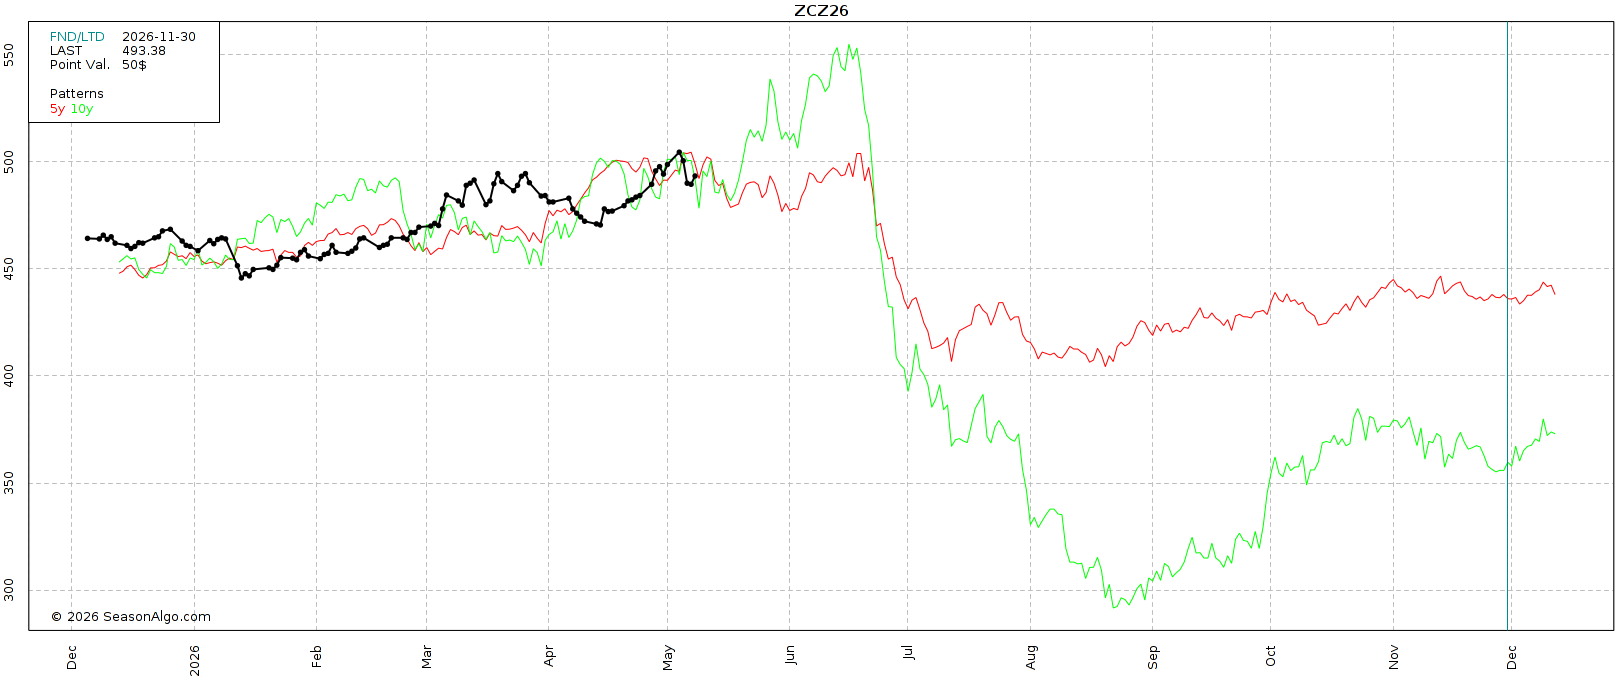
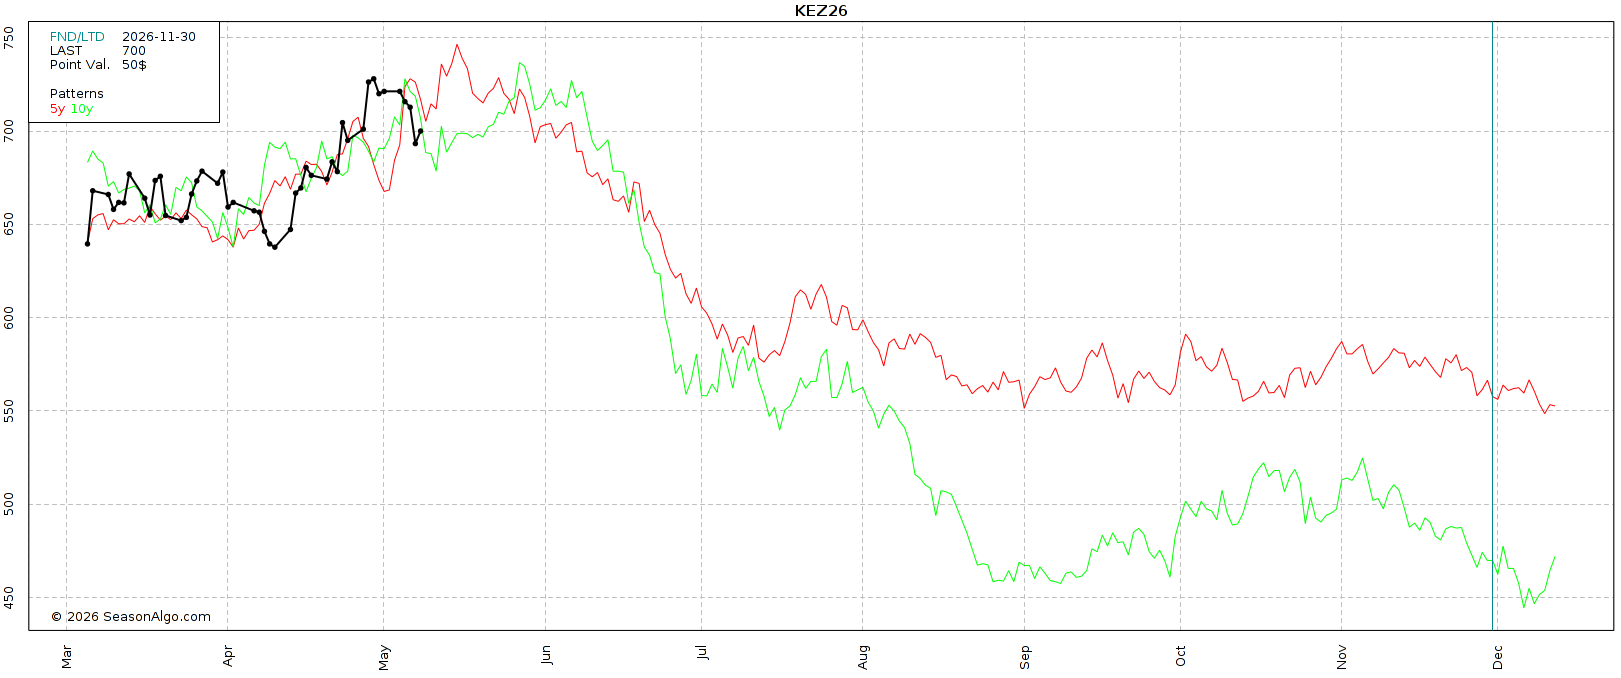
Here is an update on the 5-year and 10-year seasonal pattern.
Again, we tend to fall apart come the end of June if there are no issues with the crop.
The seasonal pressure usually only gets extended if we get a real weather scare.
Even in years like last year or in 2024 where we didn’t receive that "usual seasonal rally", both still featured seasonal weakness.
So that seasonal sell off doesn’t have to happen just because it came after a rally.
I'm not bearish on corn by any means. But this is the window.
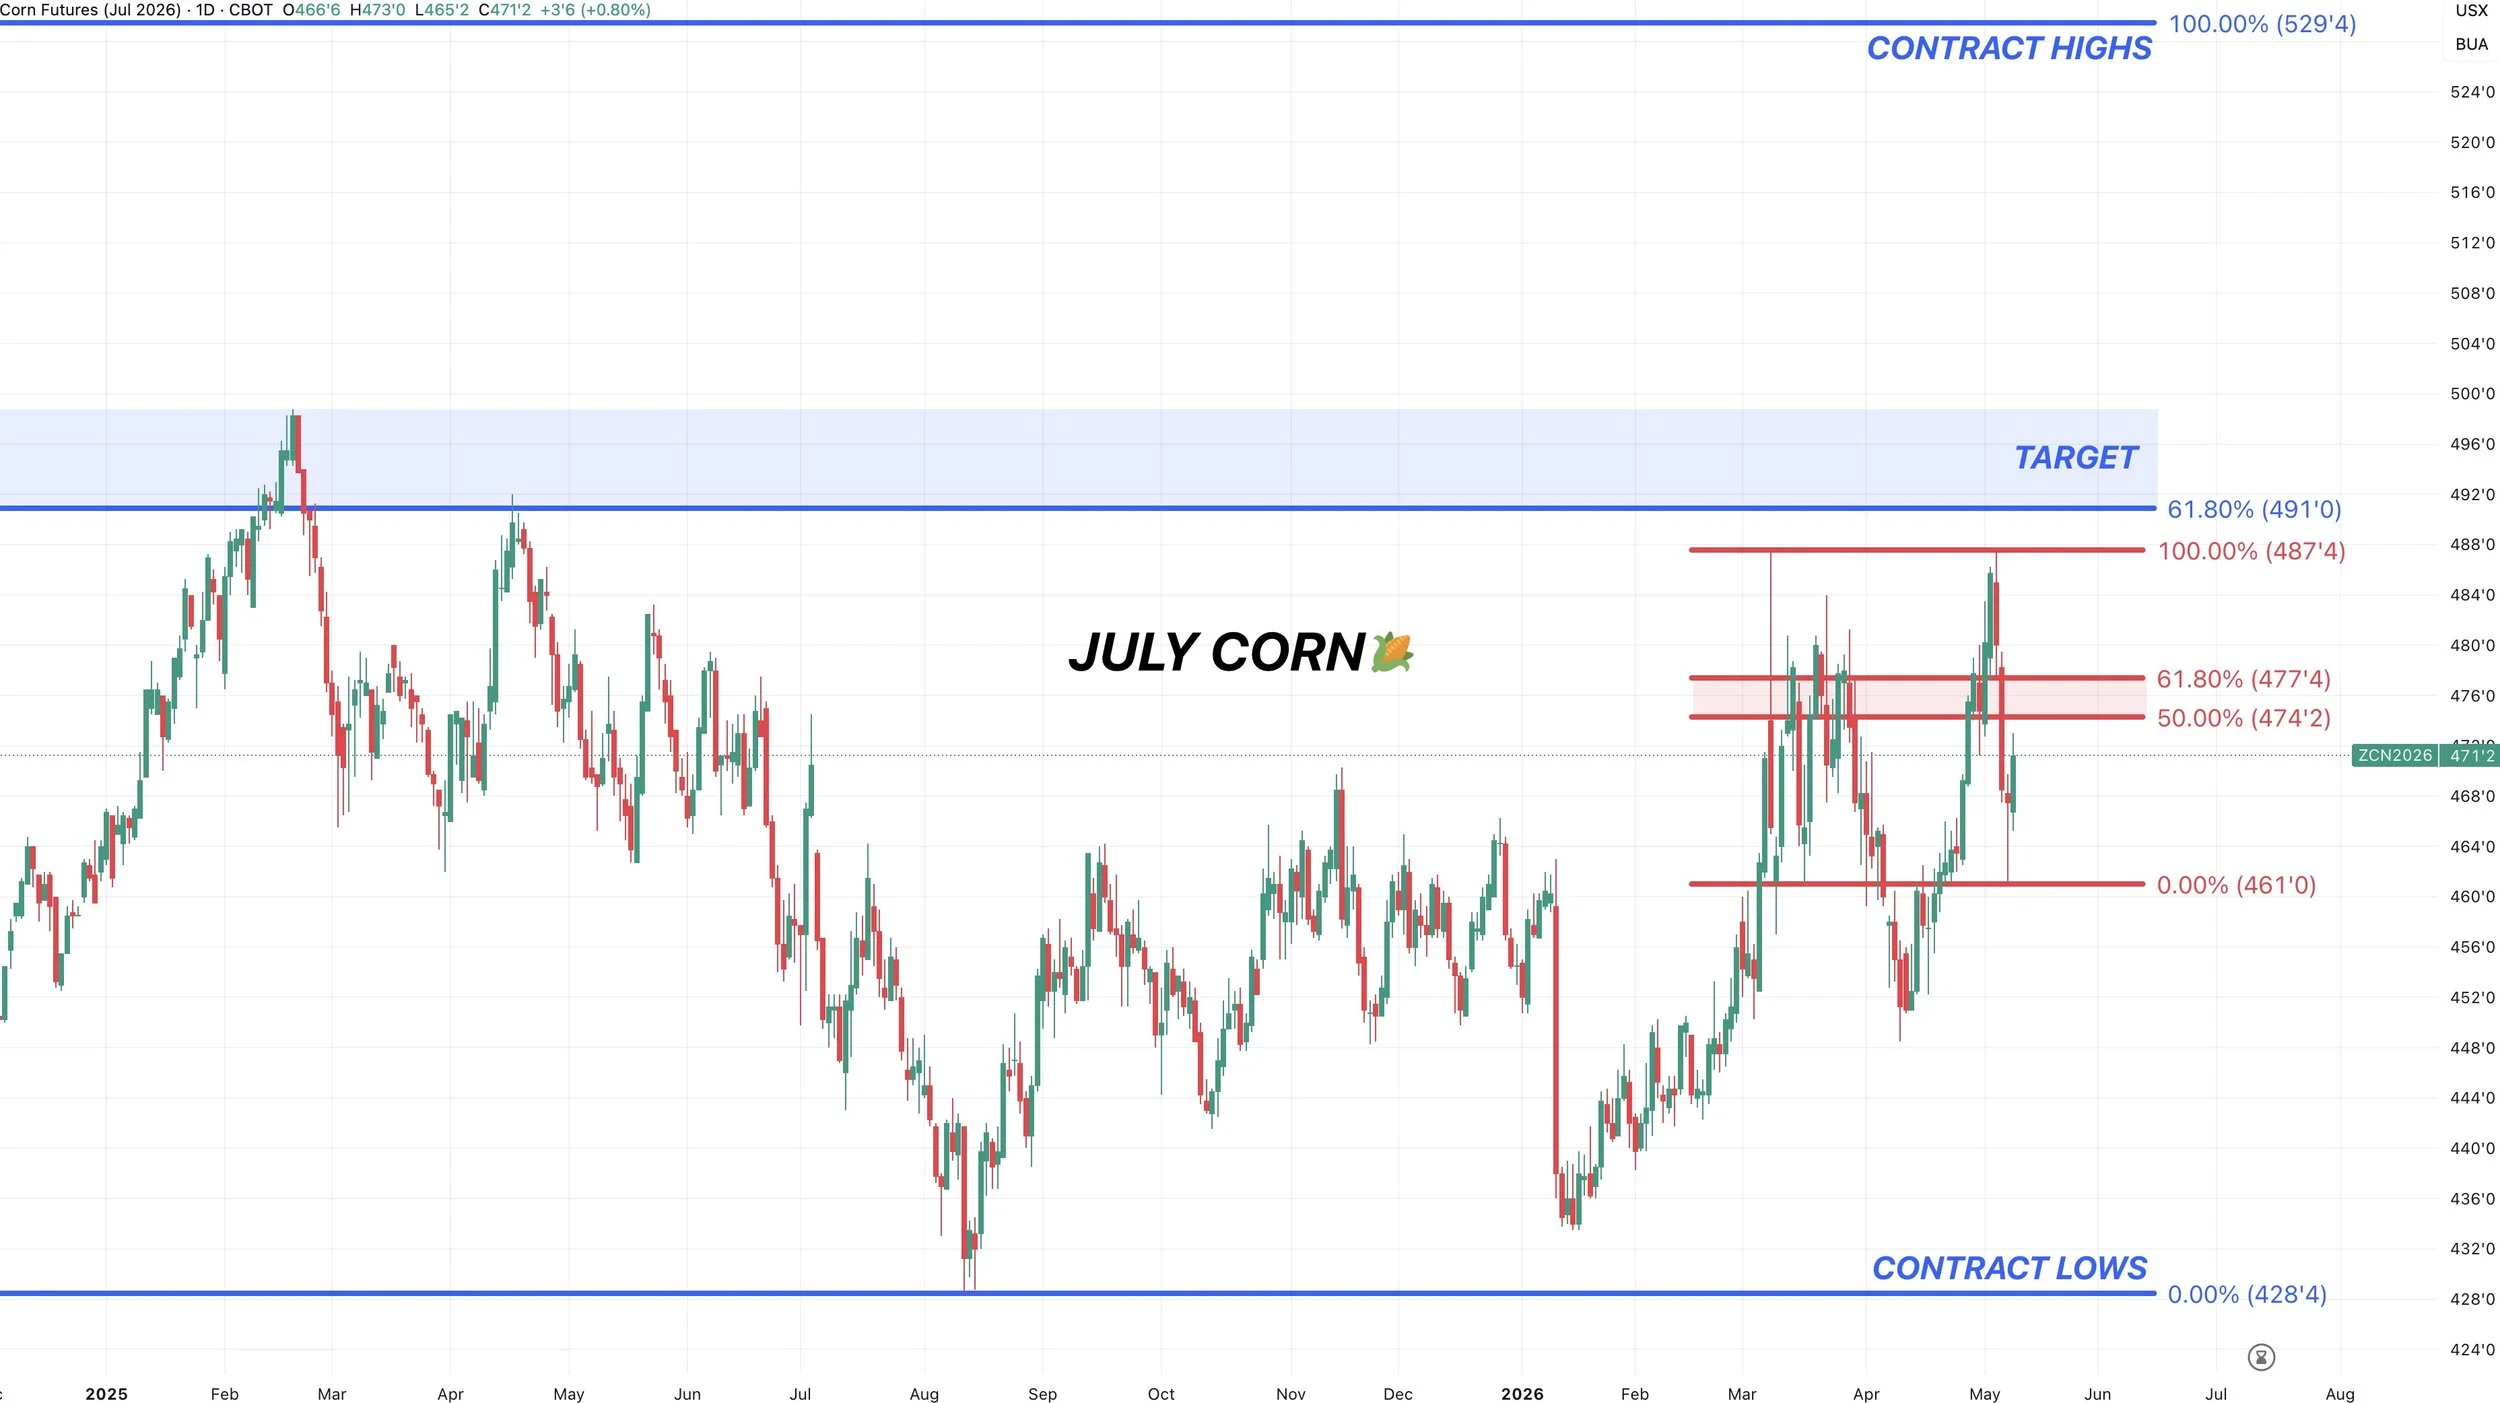
July Corn Chart:
We found life exactly where we needed to in this buy zone.
Bouncing after giving back 61.8% of the recent rally.
That same level was resistance back in the fall. Right where we struggled to break through on multiple separate occasions.
Like we talked about earlier this week, and really talk about all the time, the 61.8% level is often where the market tells us one of two things.
This is either a standard correction, or we are starting to fall apart.
We saw the exact same thing unfold on the April sell off and that buy signal we issued back on April 10th.
We had given back 61.8% of the entire rally from contract lows. That same level was prior key support. So it was a make or break level that ultimately held.
So seeing us hold this level looks optimistic. But that is still going to be the must hold level moving forward. As a break below likely results in us dropping down to those April lows.
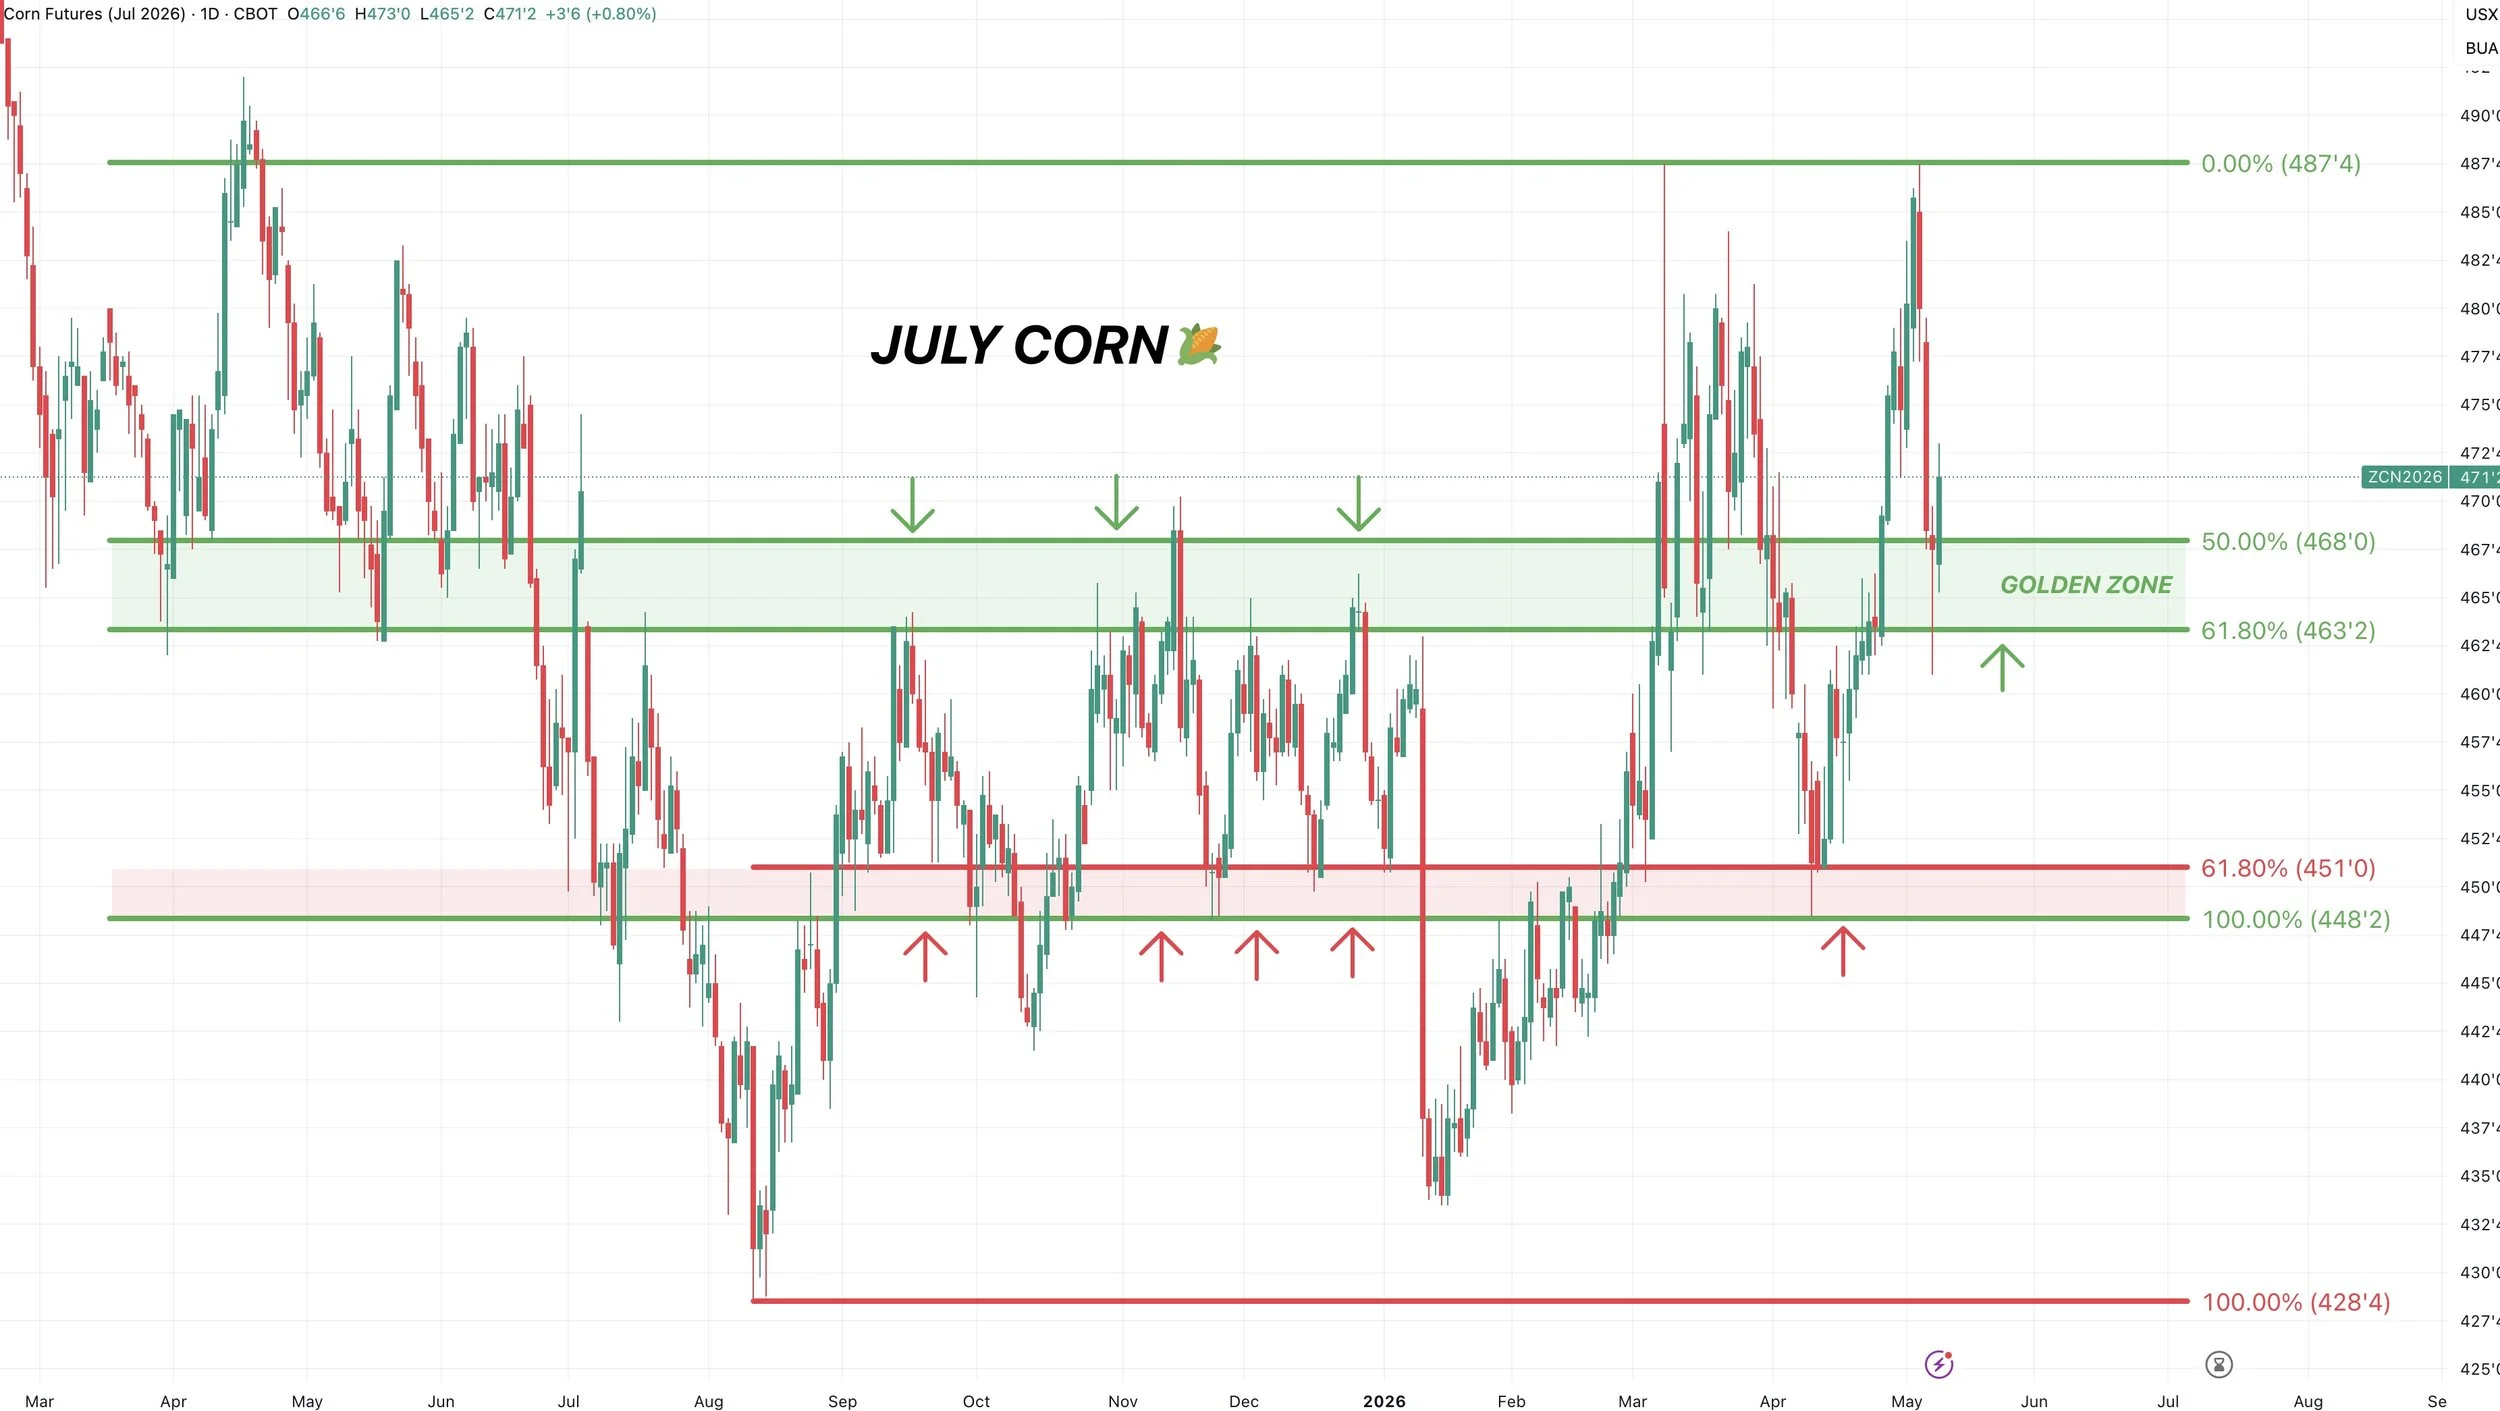
As for the upside.
$4.74 to $4.77 claws back 50-61.8% of the recent sell off. That is going to be the level that tell us if we are going to challenge the highs or not.
As more often than not, when you break above it suggests the bounce is no longer just a relief bounce.
So if you are someone who is behind, that would be a level to eye.
But if we take out that level, I'm looking for $4.90 to $5.00. I think that would be an area to reward.
$4.90 is 61.8% of the contract highs. It is also the highs from last April.
$4.99 is the highs from last February.
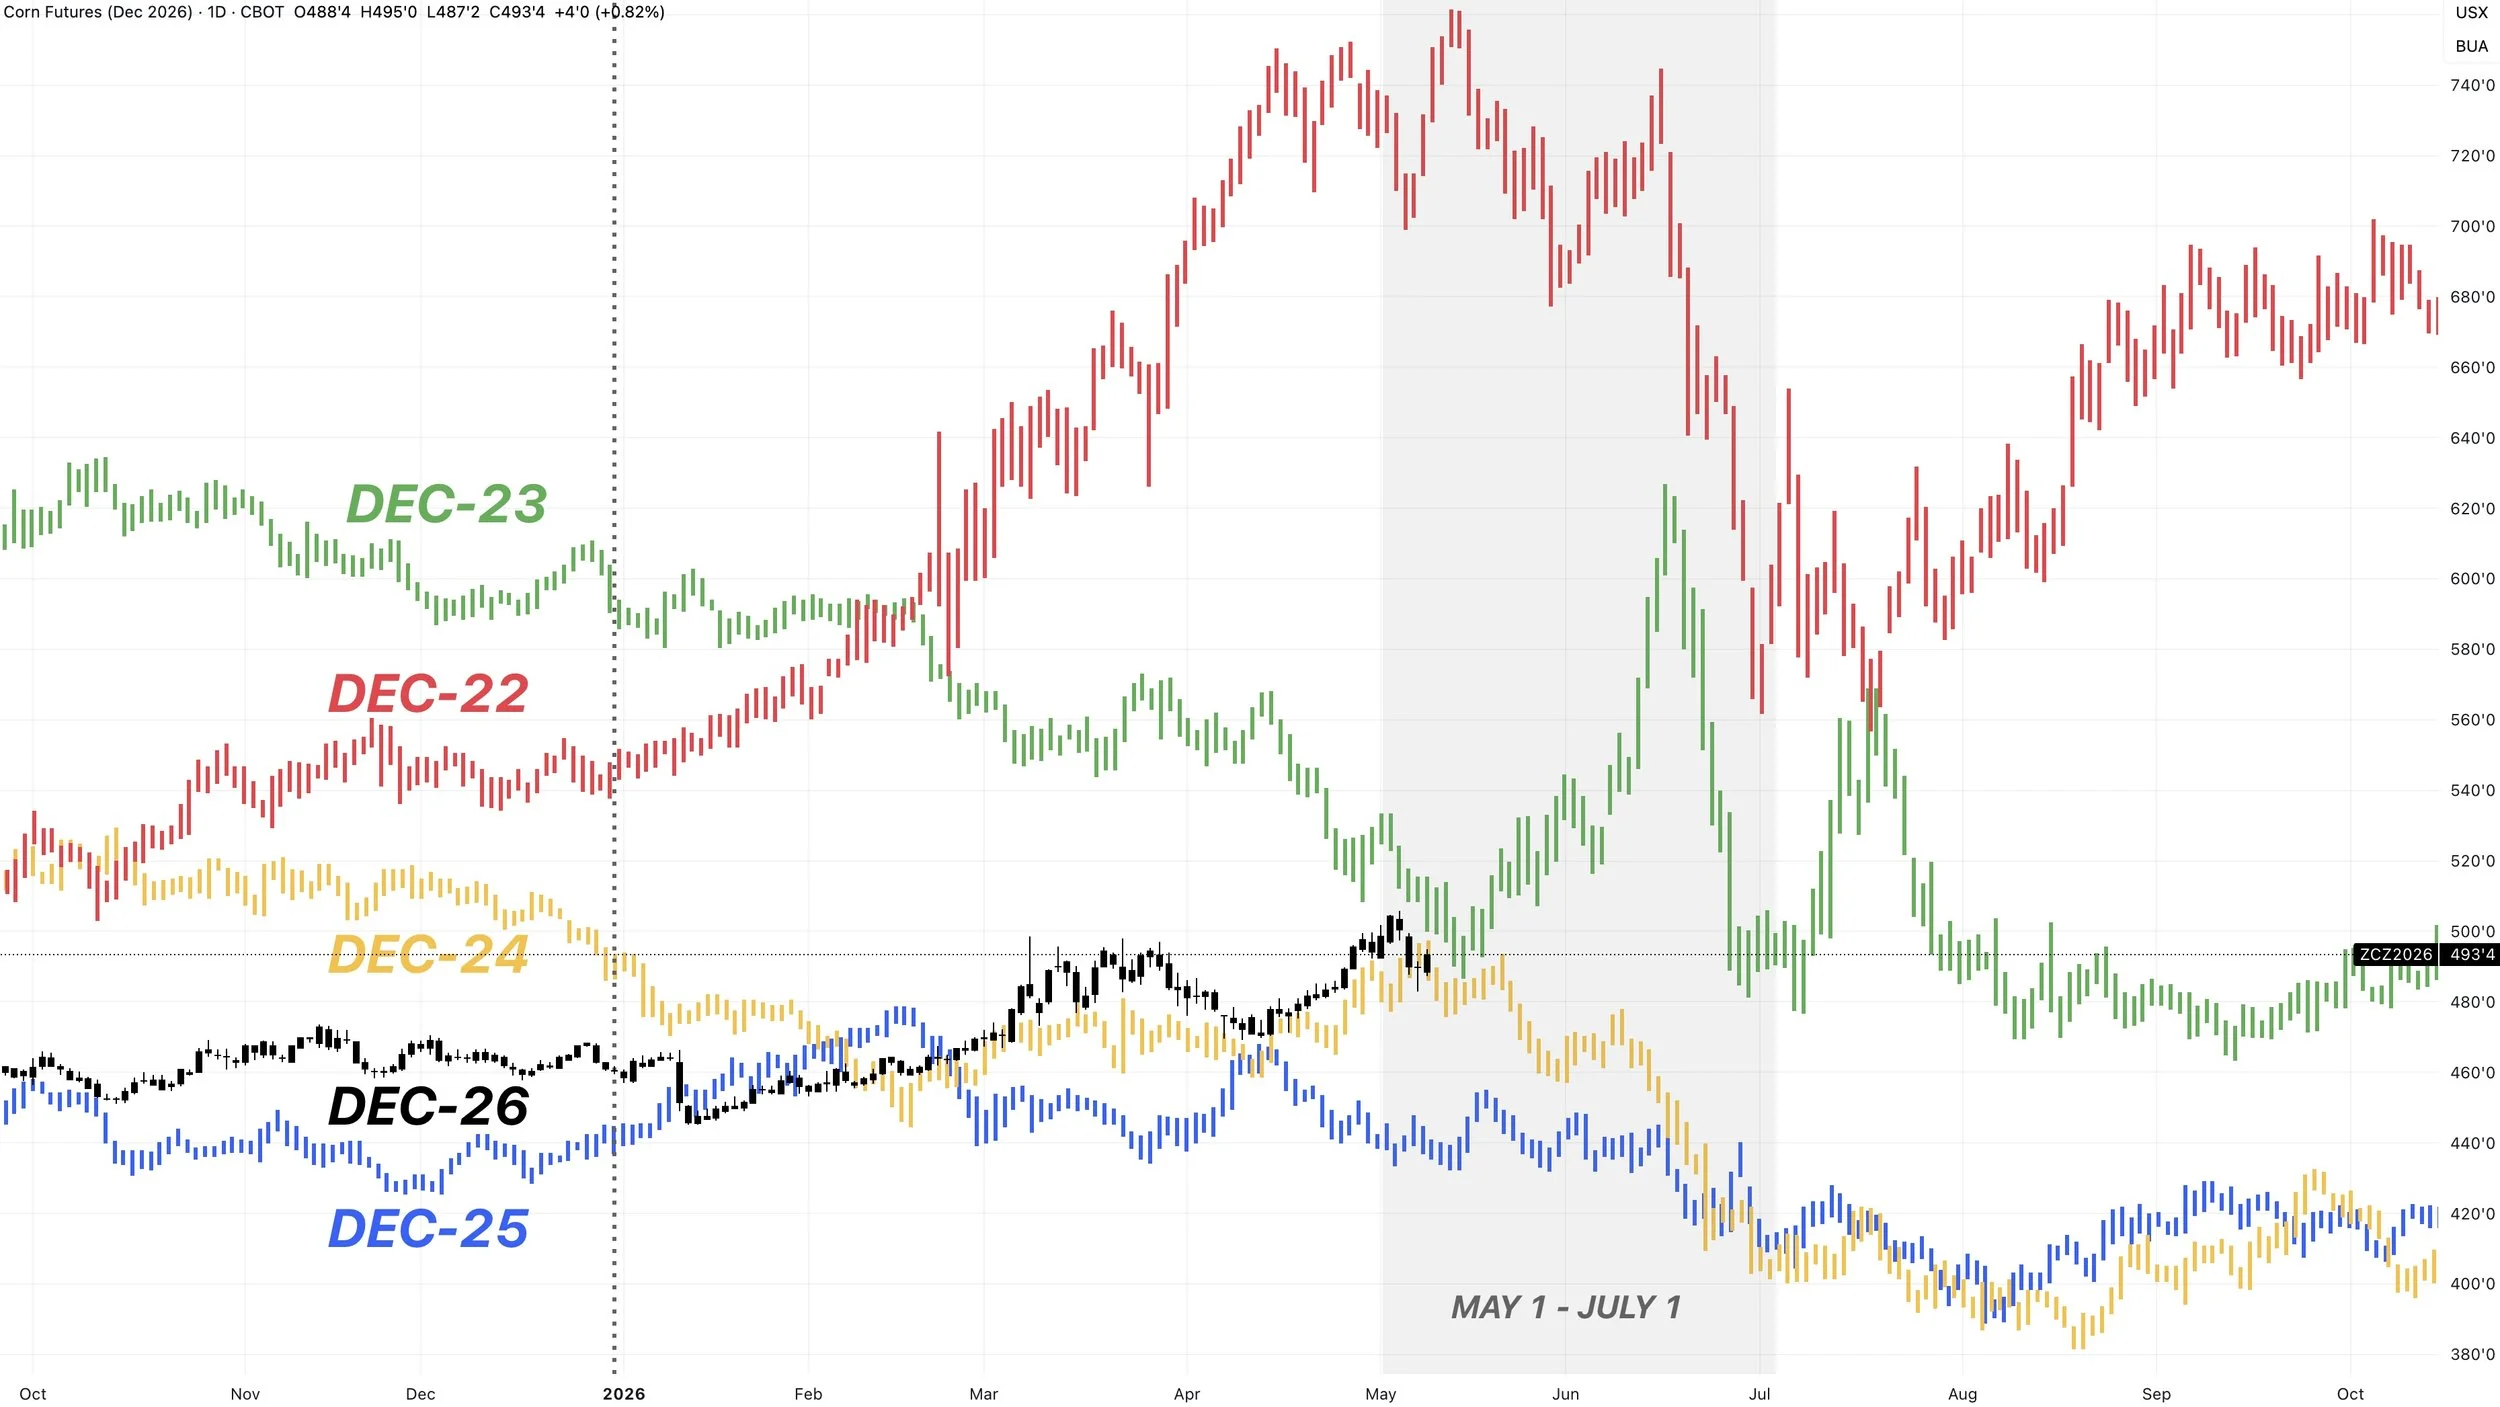
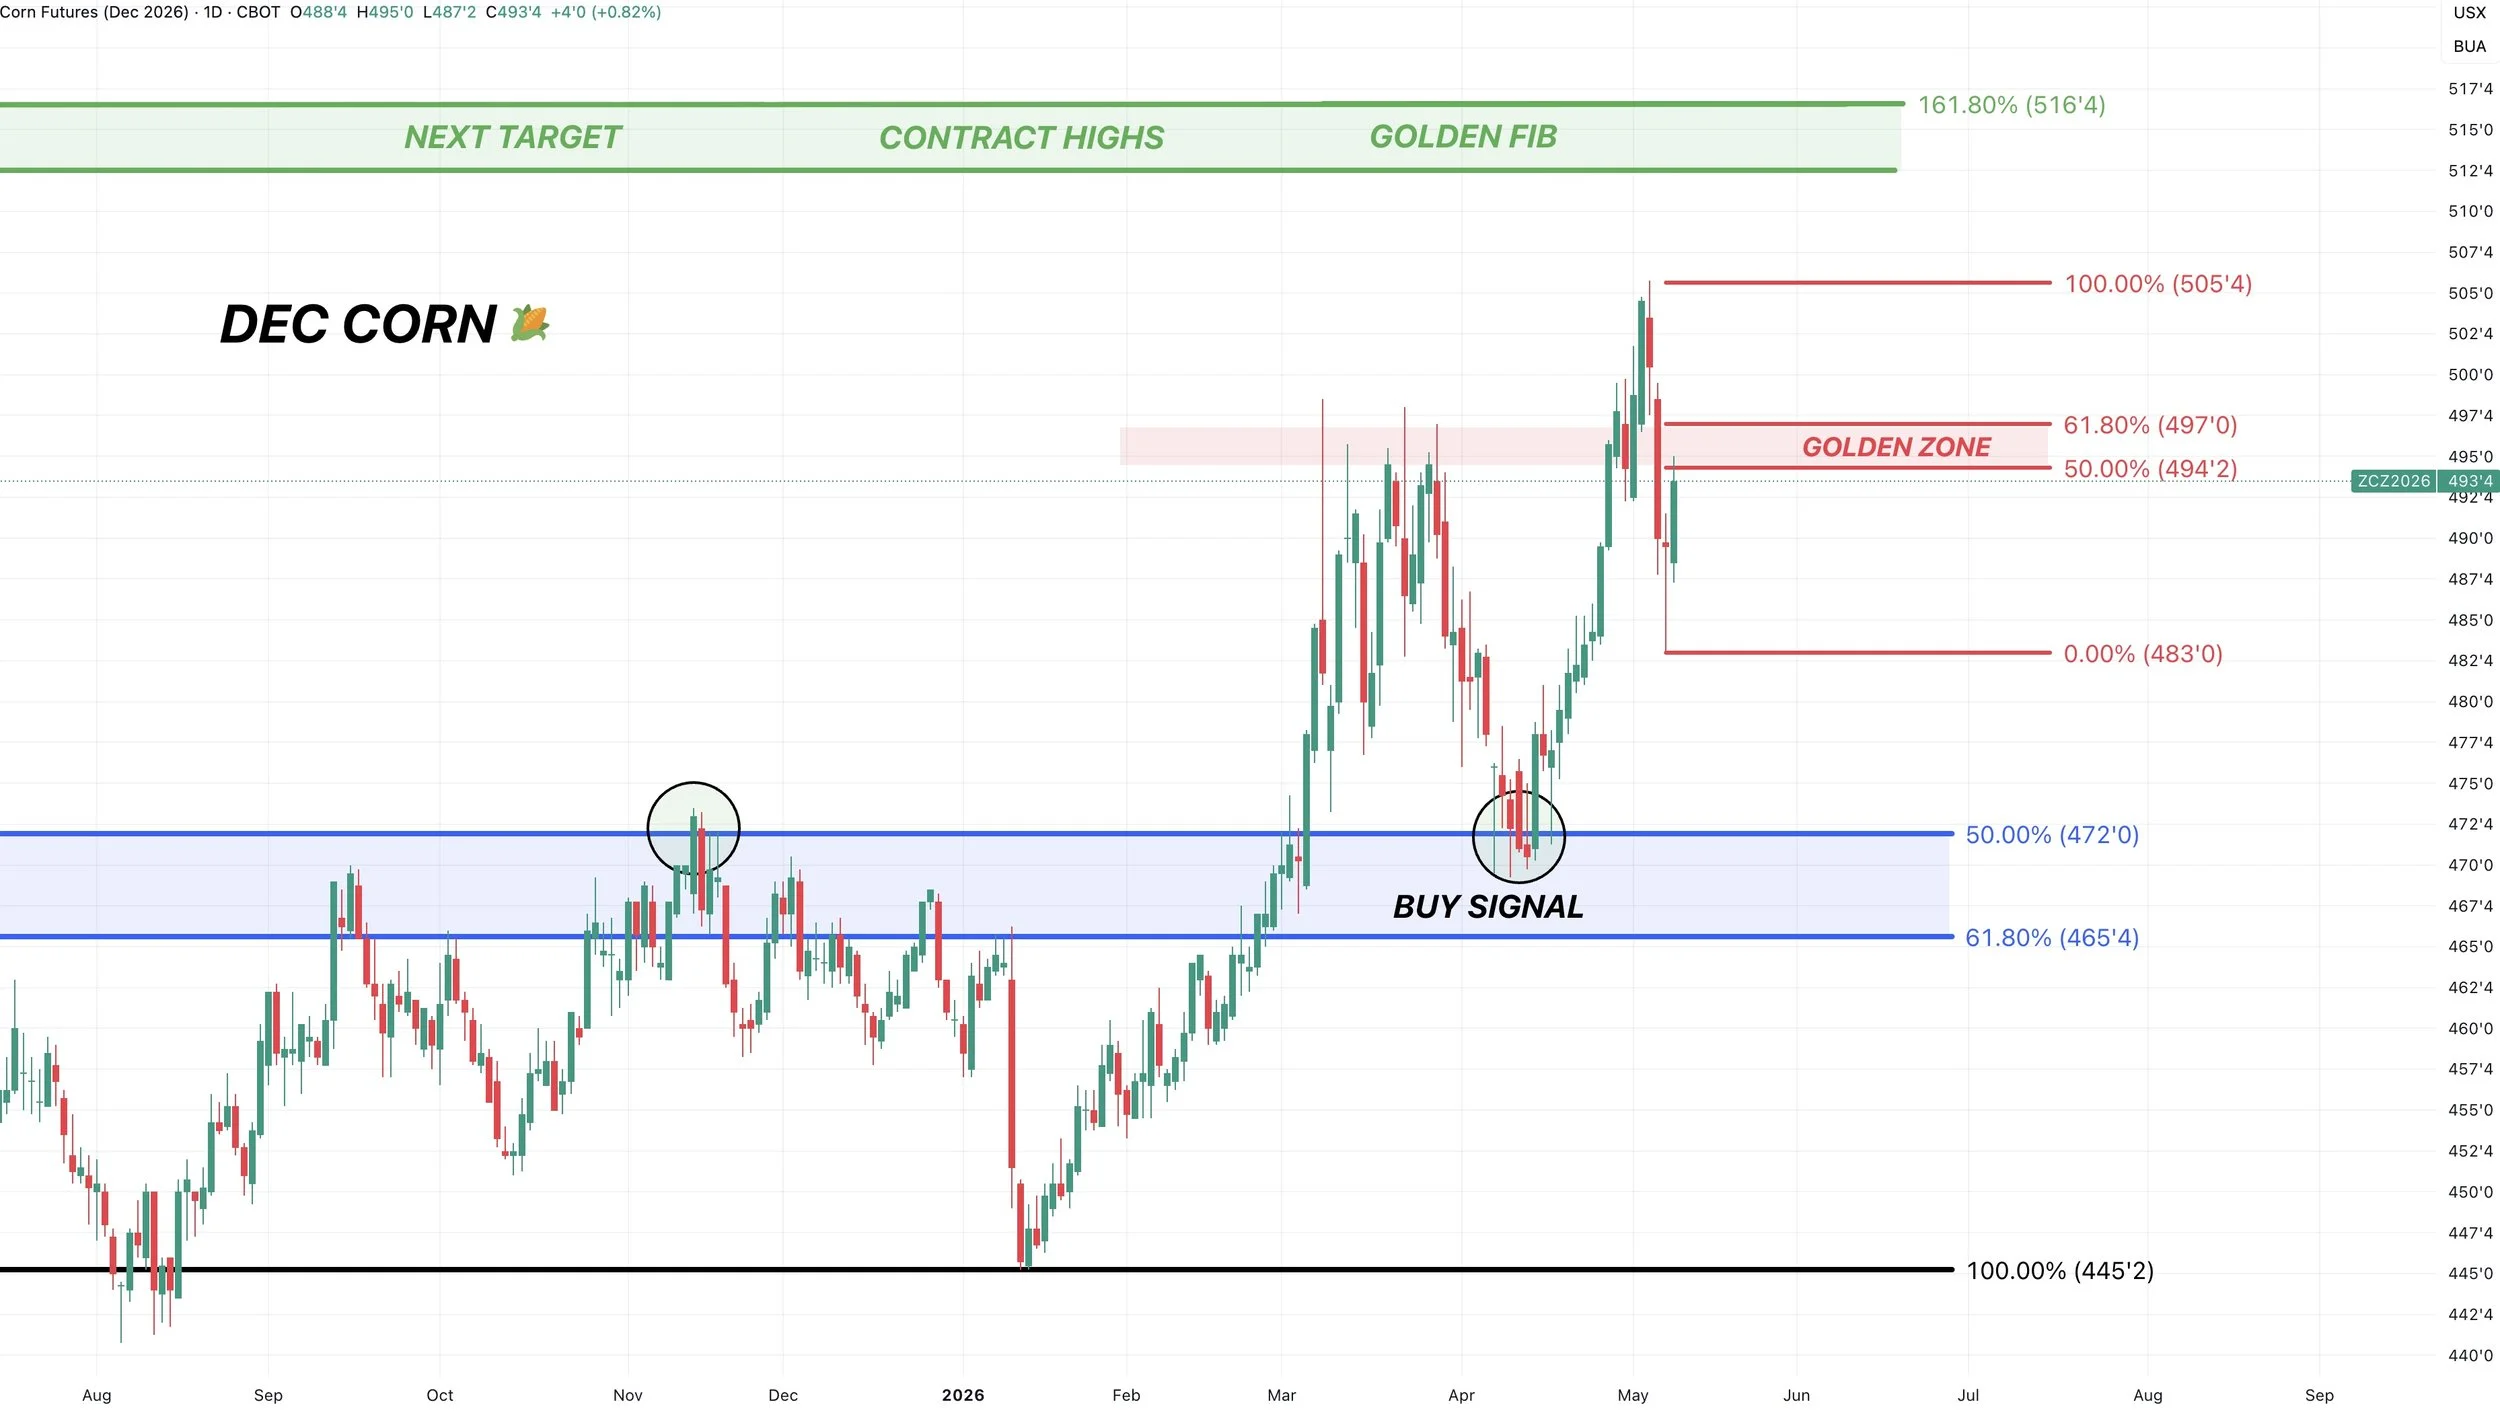
Dec Corn Chart:
We saw a perfect bounce in Dec corn. We tagged the 61.8% level at $4.83 to the penny before bouncing.
That's going to be the key spot to hold now to prevent a leg lower.
As long as that level holds, the trend remains higher.
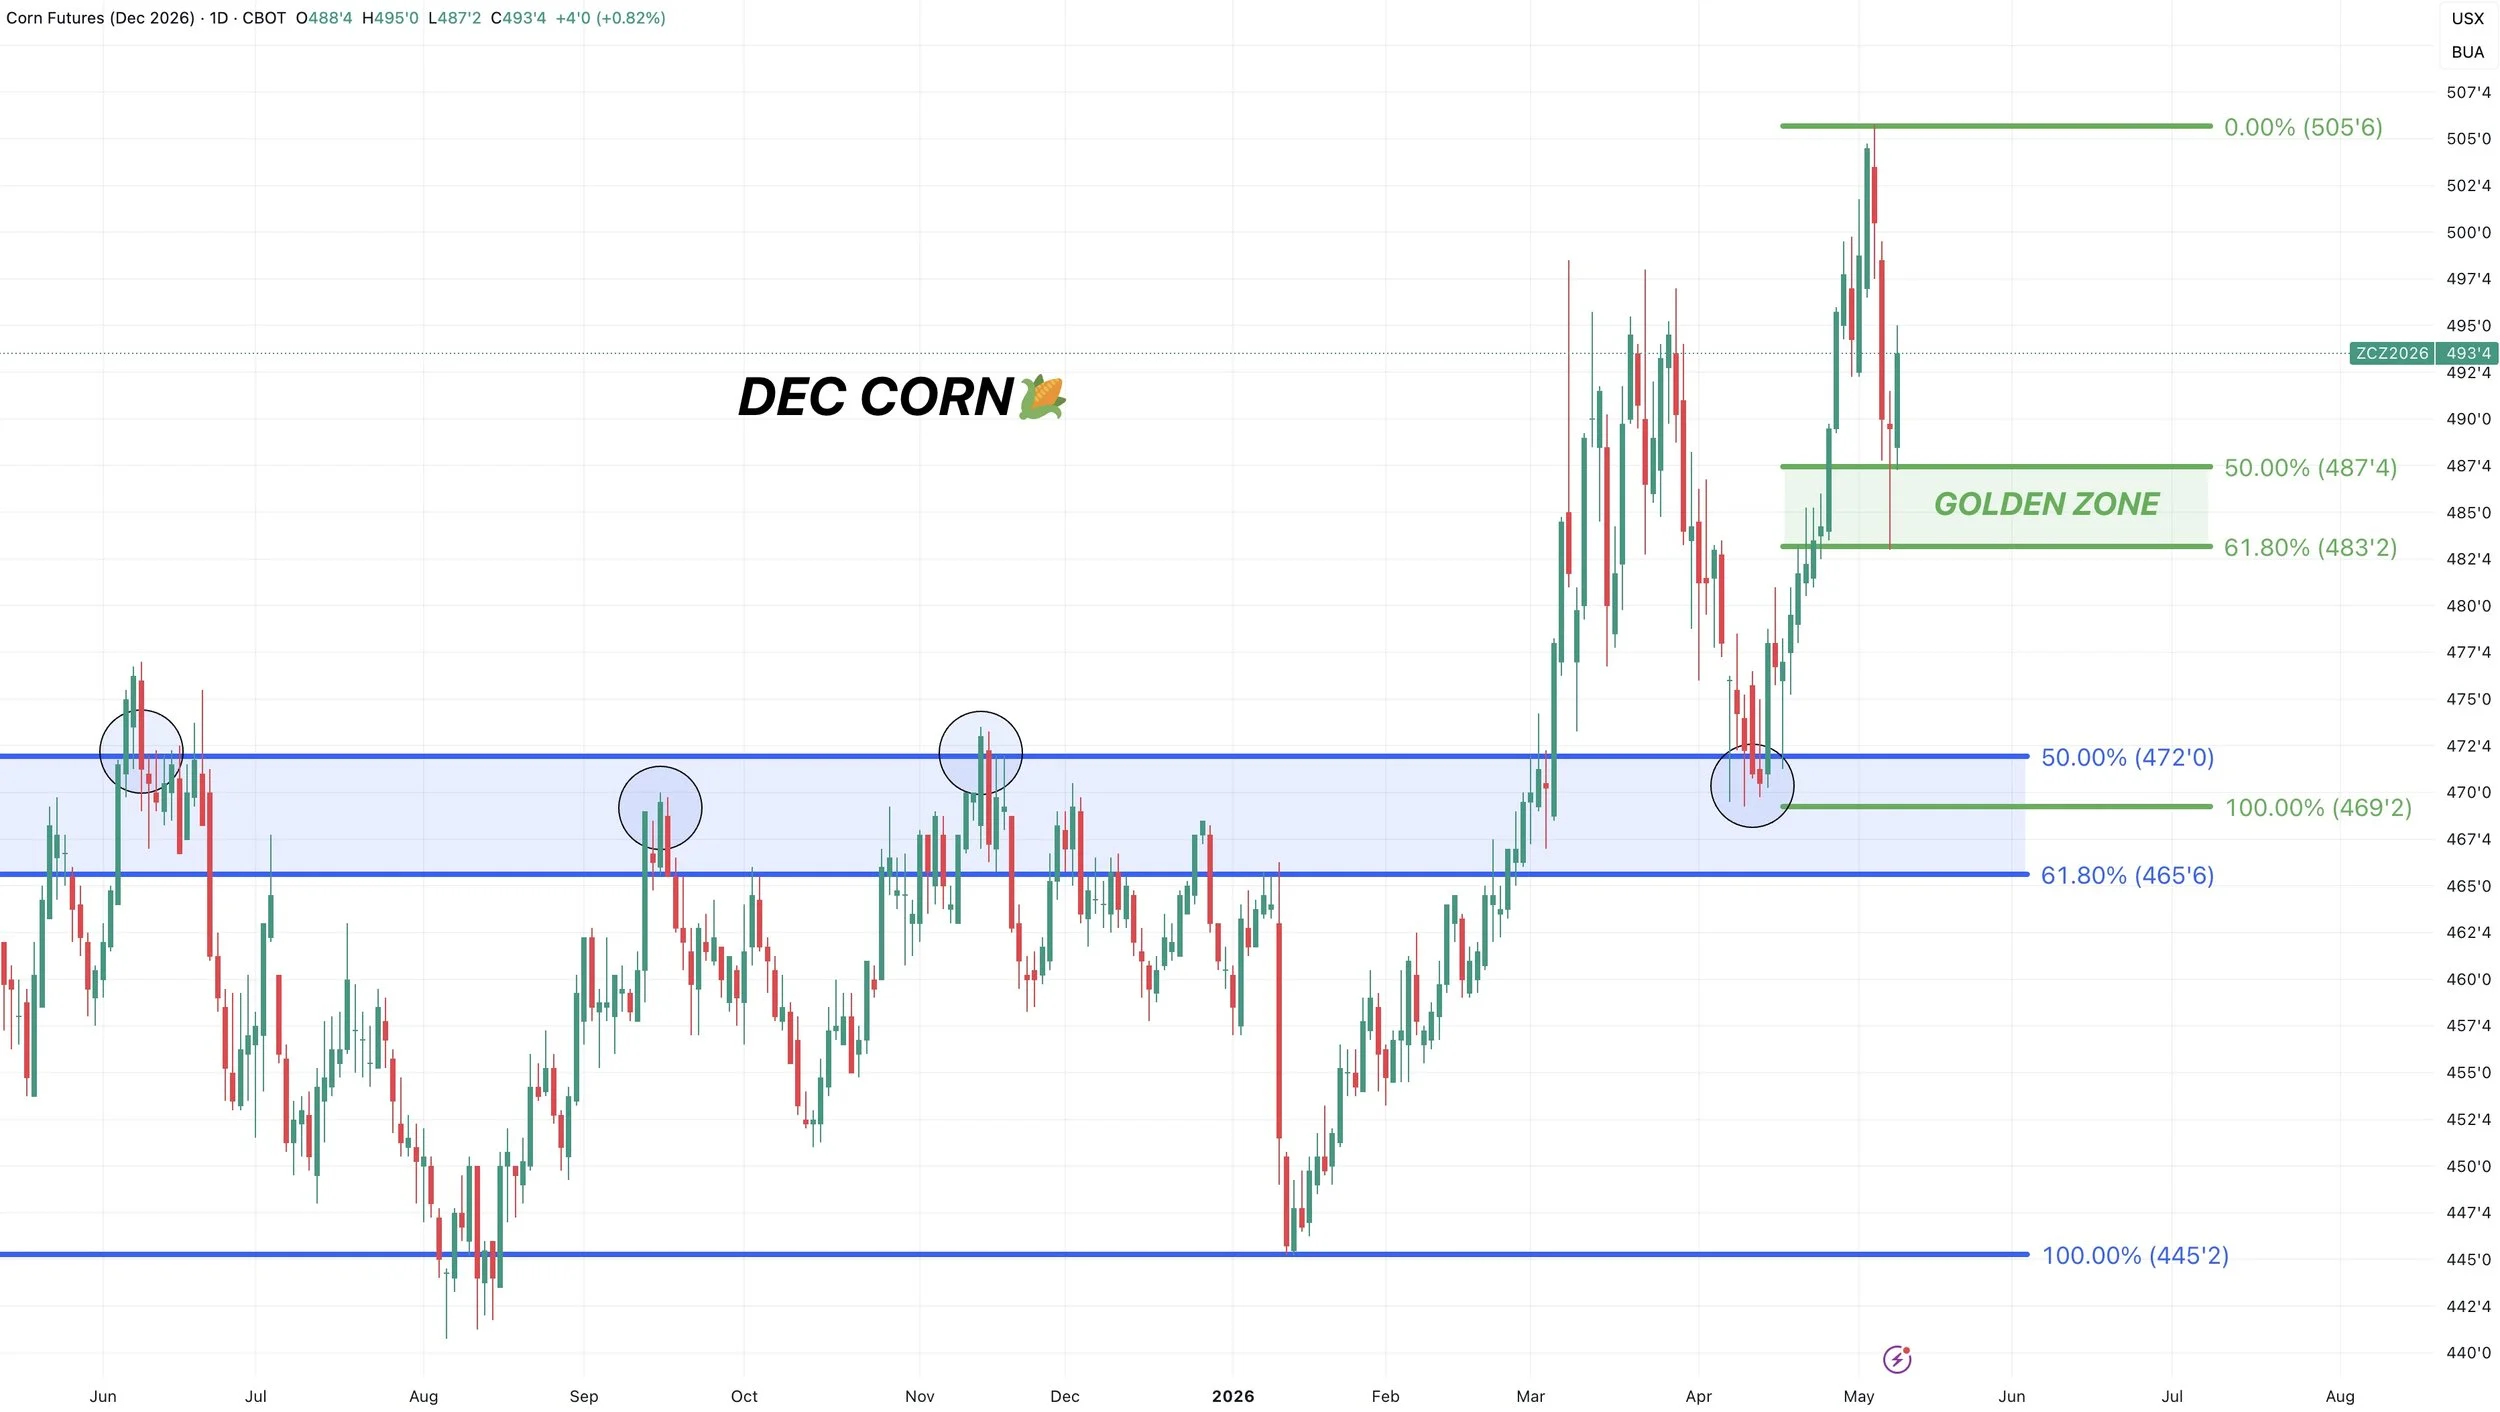
To the upside, $4.94 to $4.97 claws back 50% to 61.8% of the sell off.
Again, a break above will tell us whether this has legs to it or it's a dead cat bounce.
So if you feel like you missed out on the first two highs, that would be an area to look at.
If we break above, I am still looking for $5.10 to $5.15
That's around the contract highs and the golden fib.
(Golden fib is 161.8% from the recent April lows up to the March highs)
Soybeans
It's really all about that China meeting next week.
It would maybe make sense to rally going into the meeting, as that is something we've seen before.
But the real question is are they going to buy any old crop or not?
Do we get any details or further confirmation that they are going to be buying that 20 MMT of new crop? As we have yet to see any purchases.
The other big question of course, has to be will the deal include corn..?
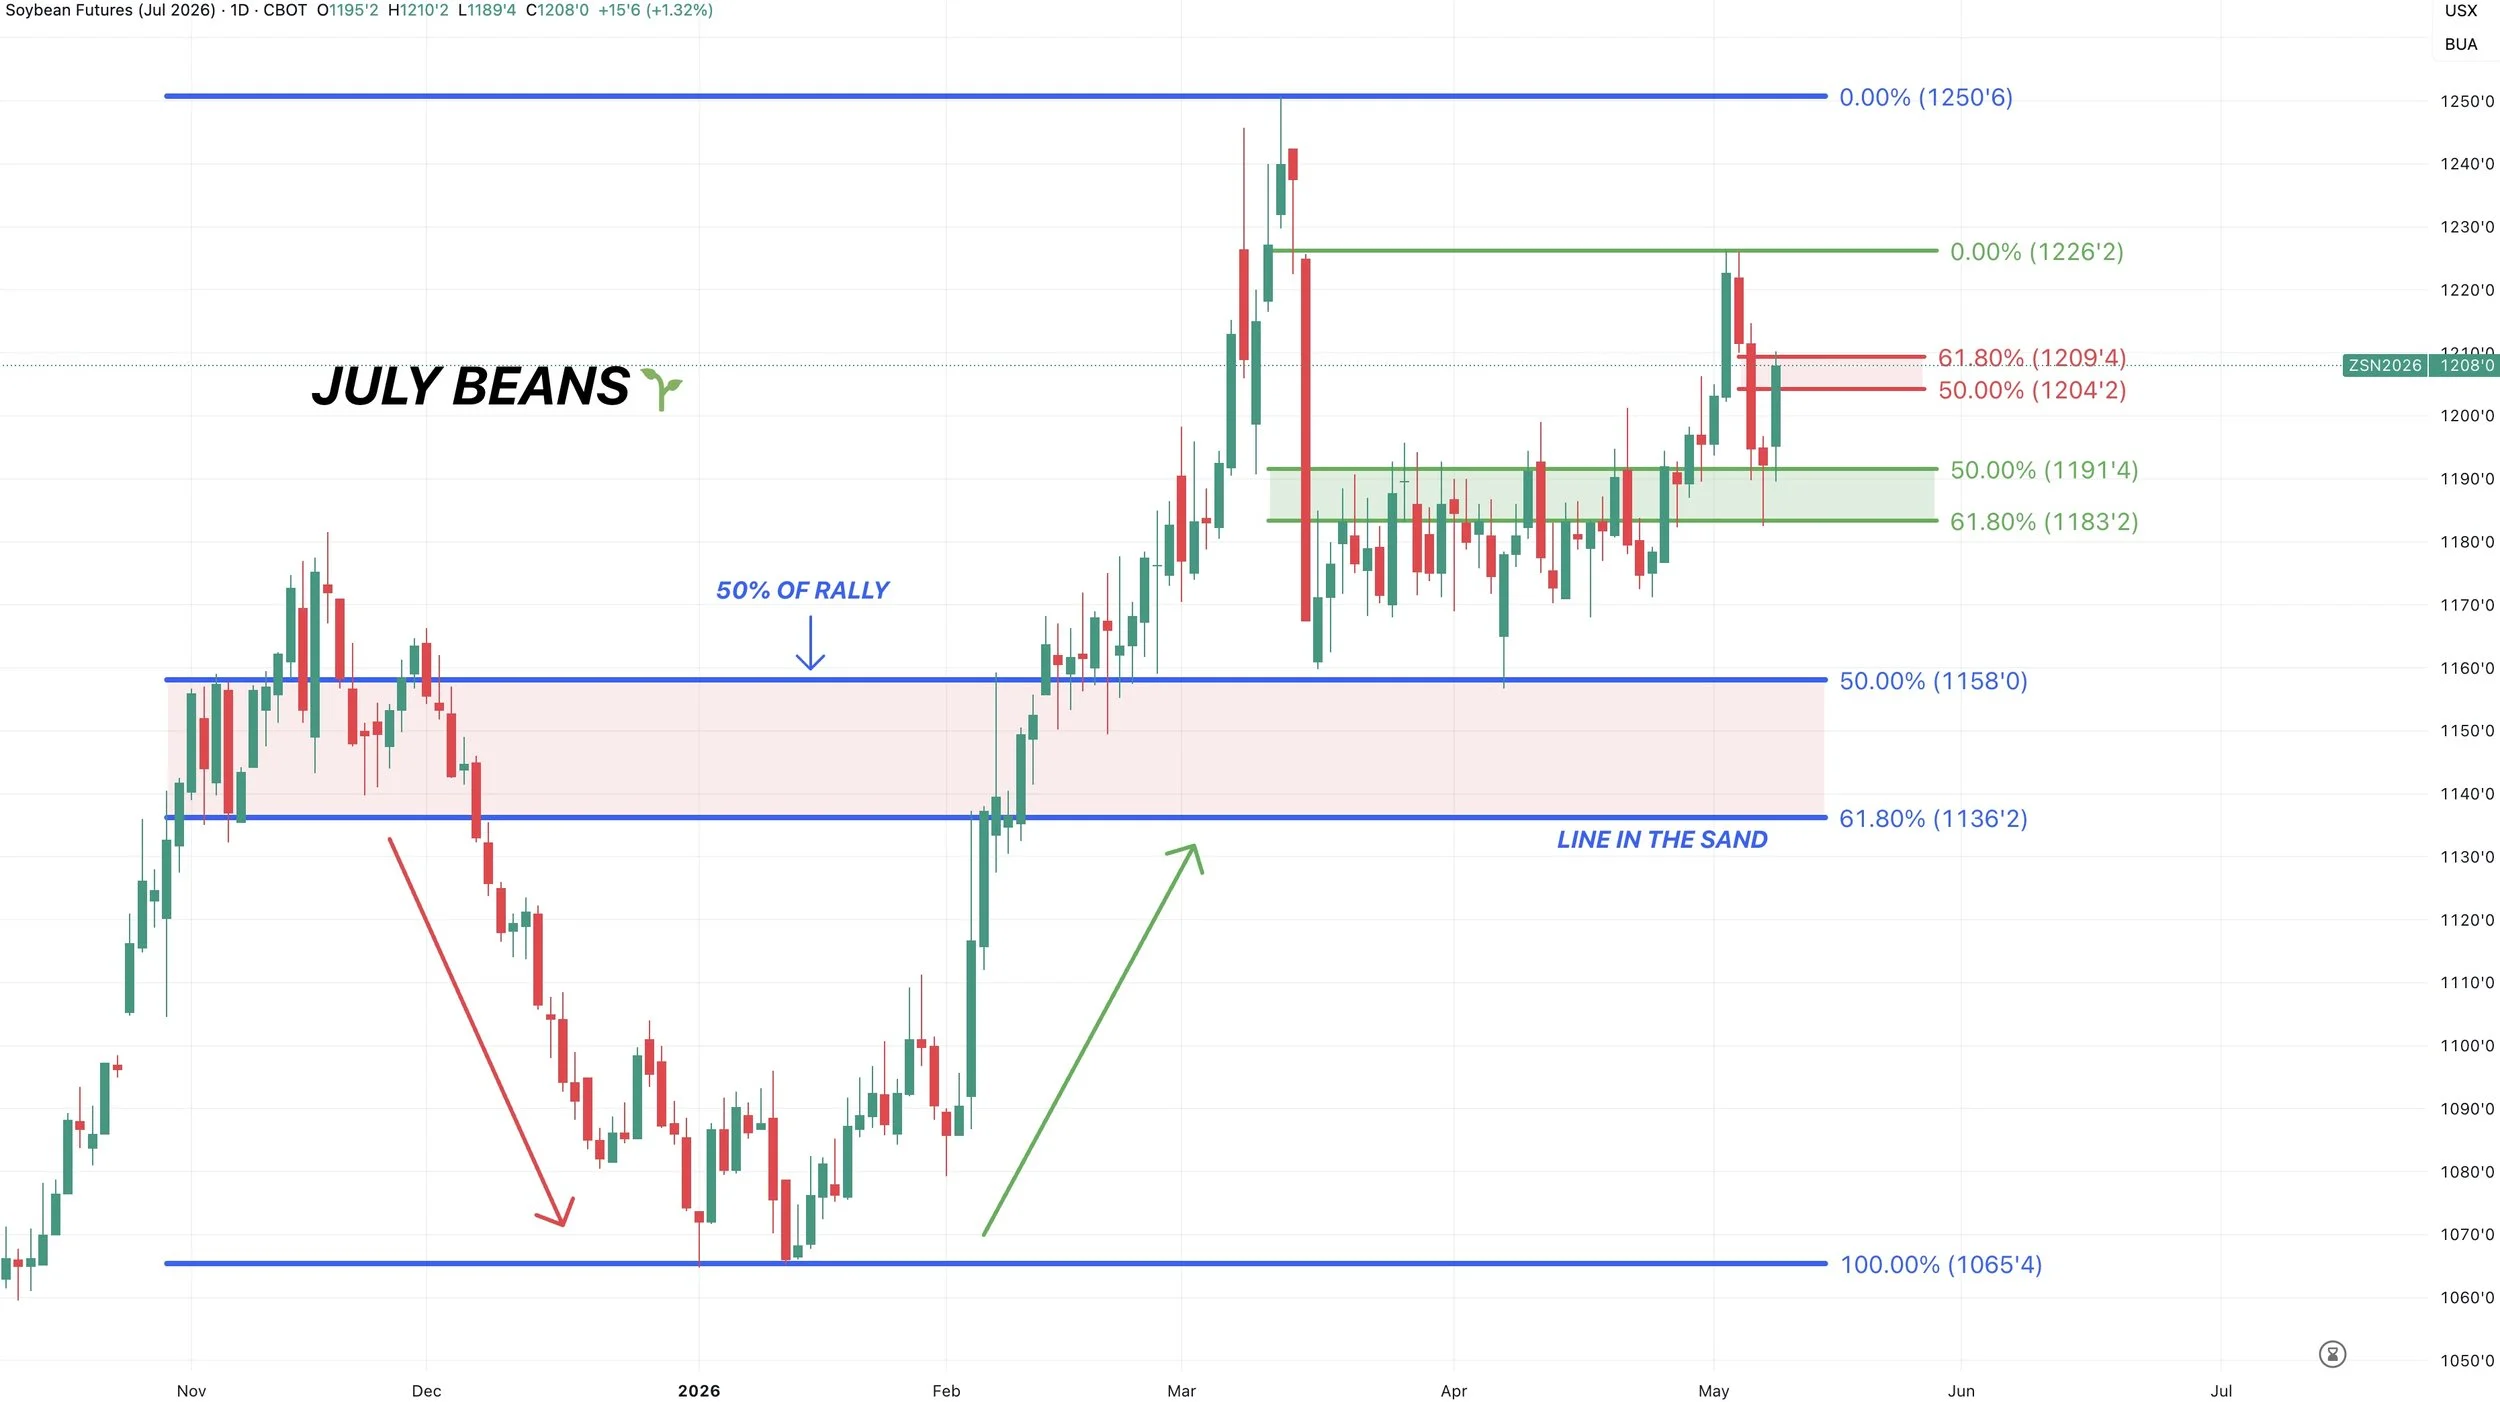
July Beans Chart:
Like in corn, we held that key support we'd been talking about perfectly.
Tapping the 61.8% level of the rally exactly.
We were just trapped in a range, that 61.8% level was prior resistance. So it's positive that we're trying to turn it into new support like we talked about Wednesday.
We've now clawed back 61.8% of the recent little sell off.
If we break above this level, the next resistance is the recent $12.25 highs.
Break above that I think we can test the $12.50 highs.
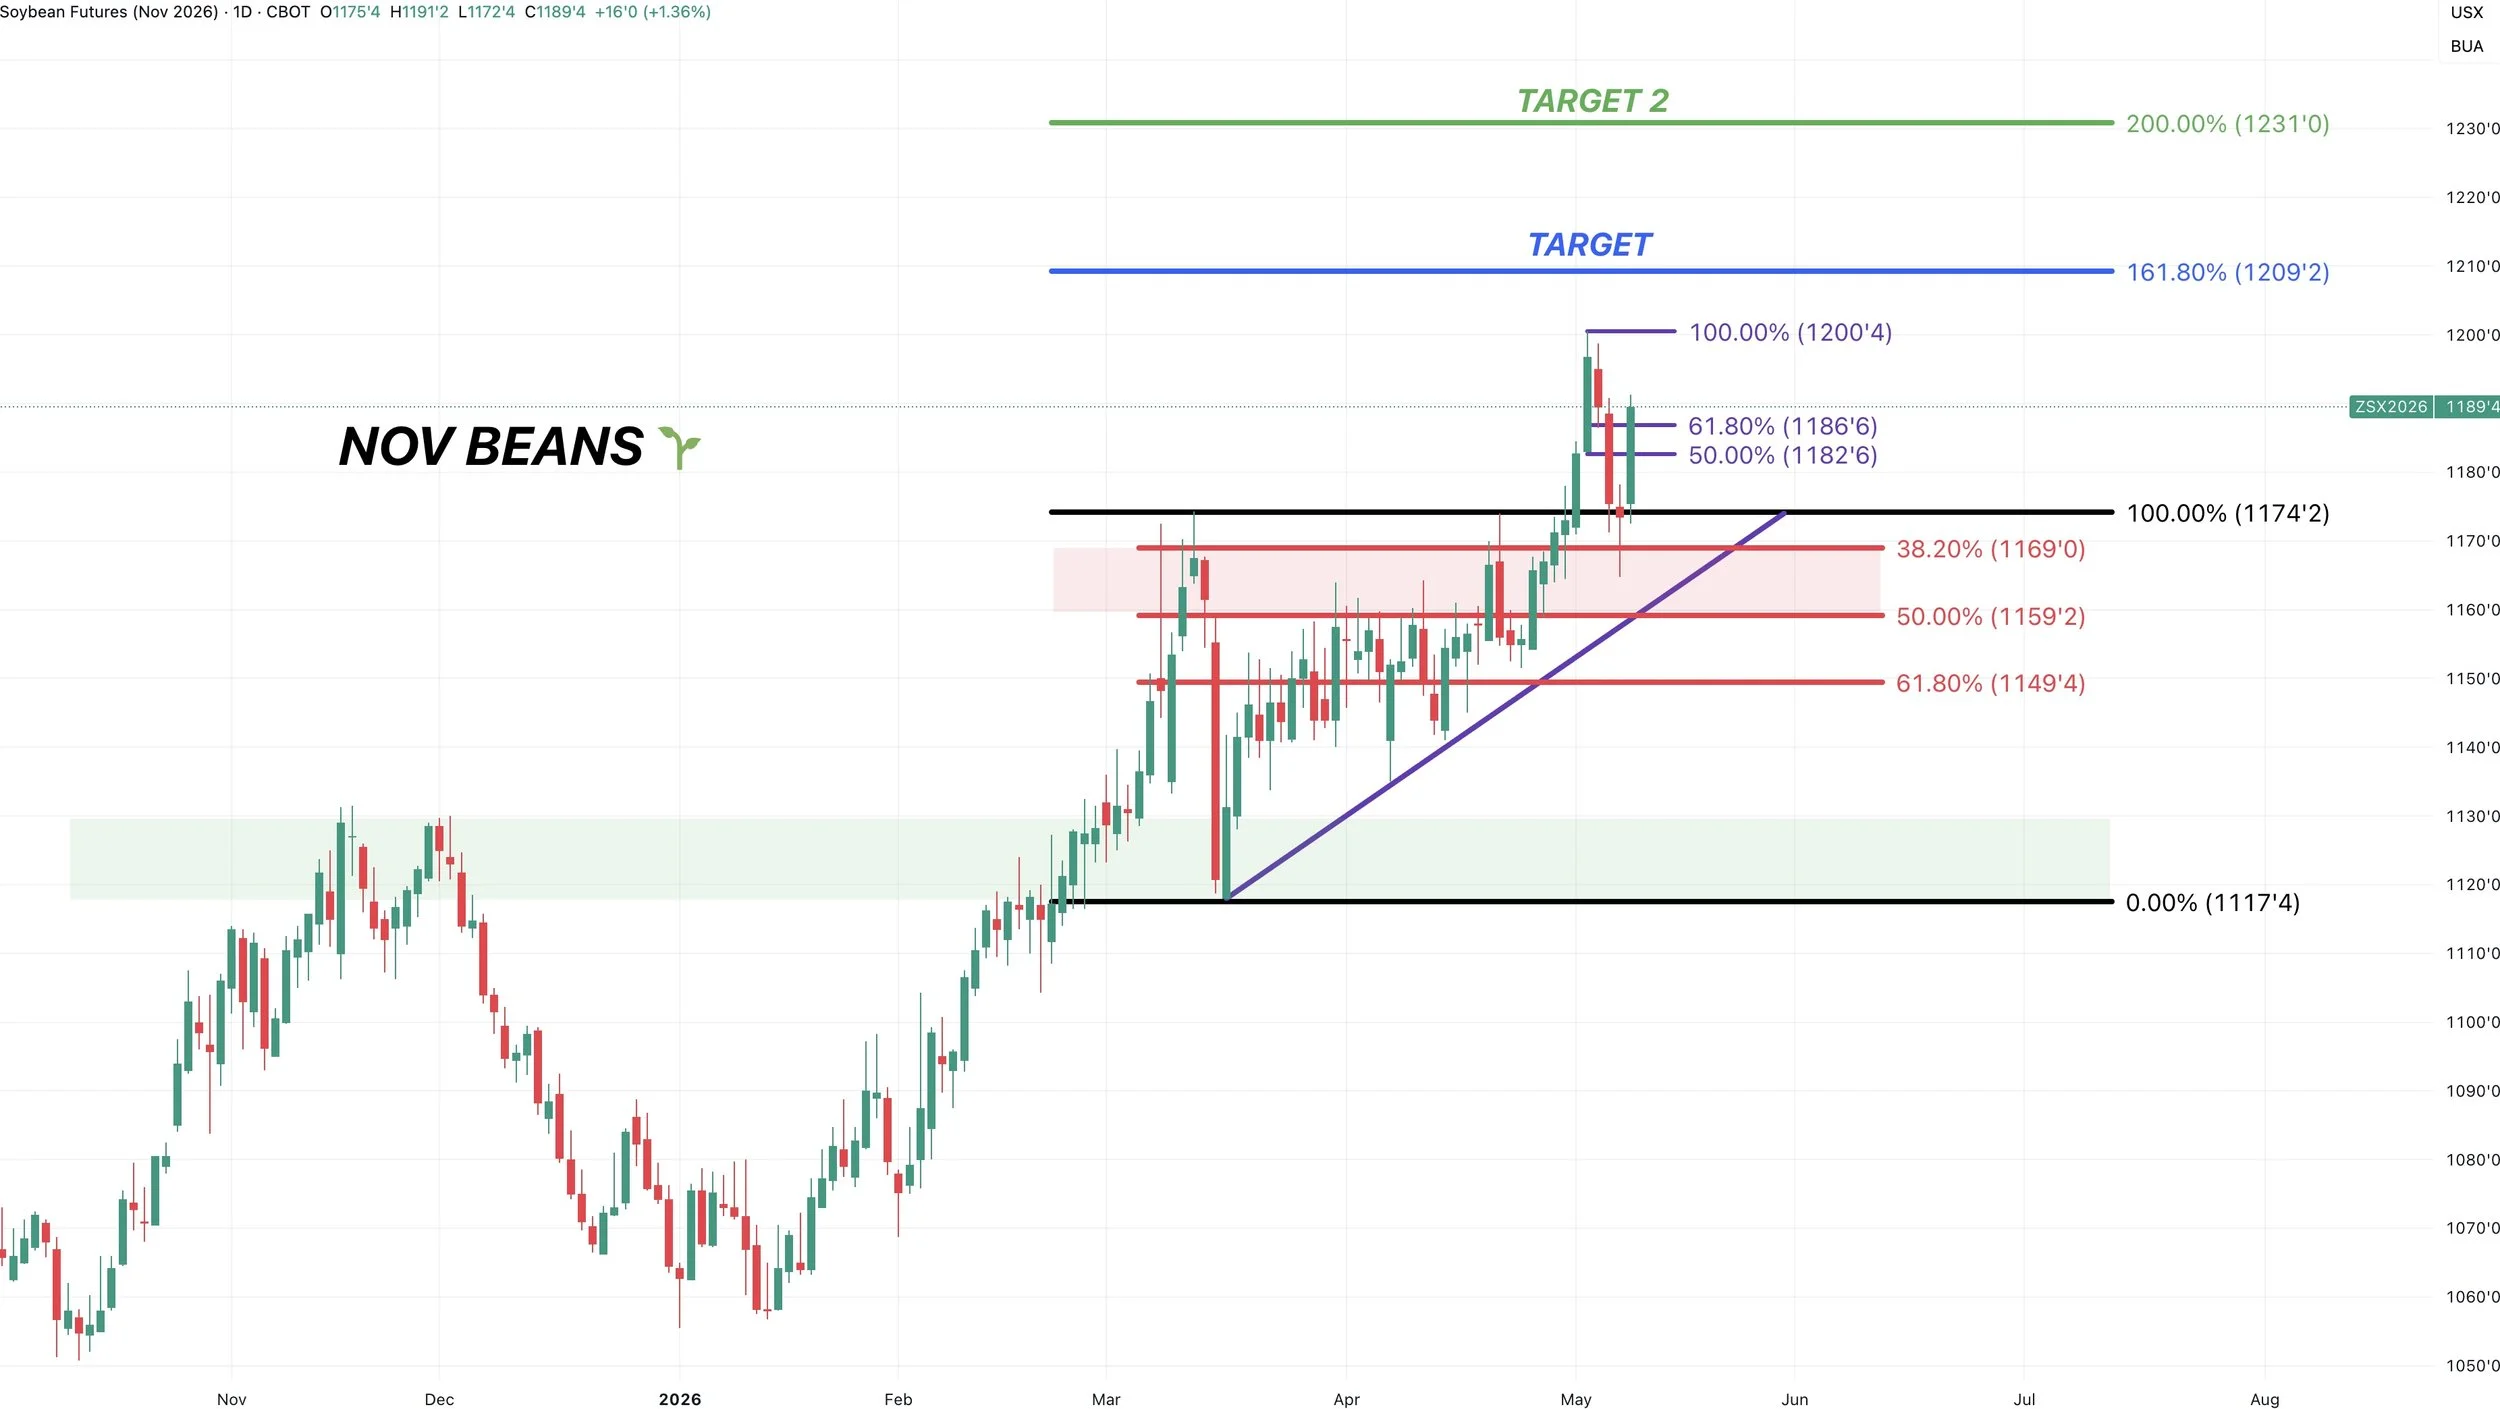
Nov Beans Chart:
Nov beans held where they needed as well.
Normally I look at the golden zone, which gives back 50% to 61.8% of a rally.
However, in a strong market, often times it can only be 38.2% to 50%.
Which is where Nov beans found their life, where as in a weaker market such as July we came down to the usual 61.8% level.
This same level was that prior resistance. So we are trying to turn it into support.
We've now already clawed back more than 61.8% of the sell off, so odds favor us going to challenge the highs or higher.
I am currently targeting $12.09 as target #1 and $12.30 as target #2.
That is the 161.8% and 200% fib levels from the limit down day lows, up to the highs in March.
However, these targets are always subject to change. As targets become harder and more complex up near contract highs in my opinion. As you have no actual support or resistance levels to work with.
But overall, the trend in this market is higher unless we break below $11.50
Wheat
We touched on this earlier this week, and have talked about how poor the HRW crop is several times. So we don’t have a ton of fresh news on wheat today.
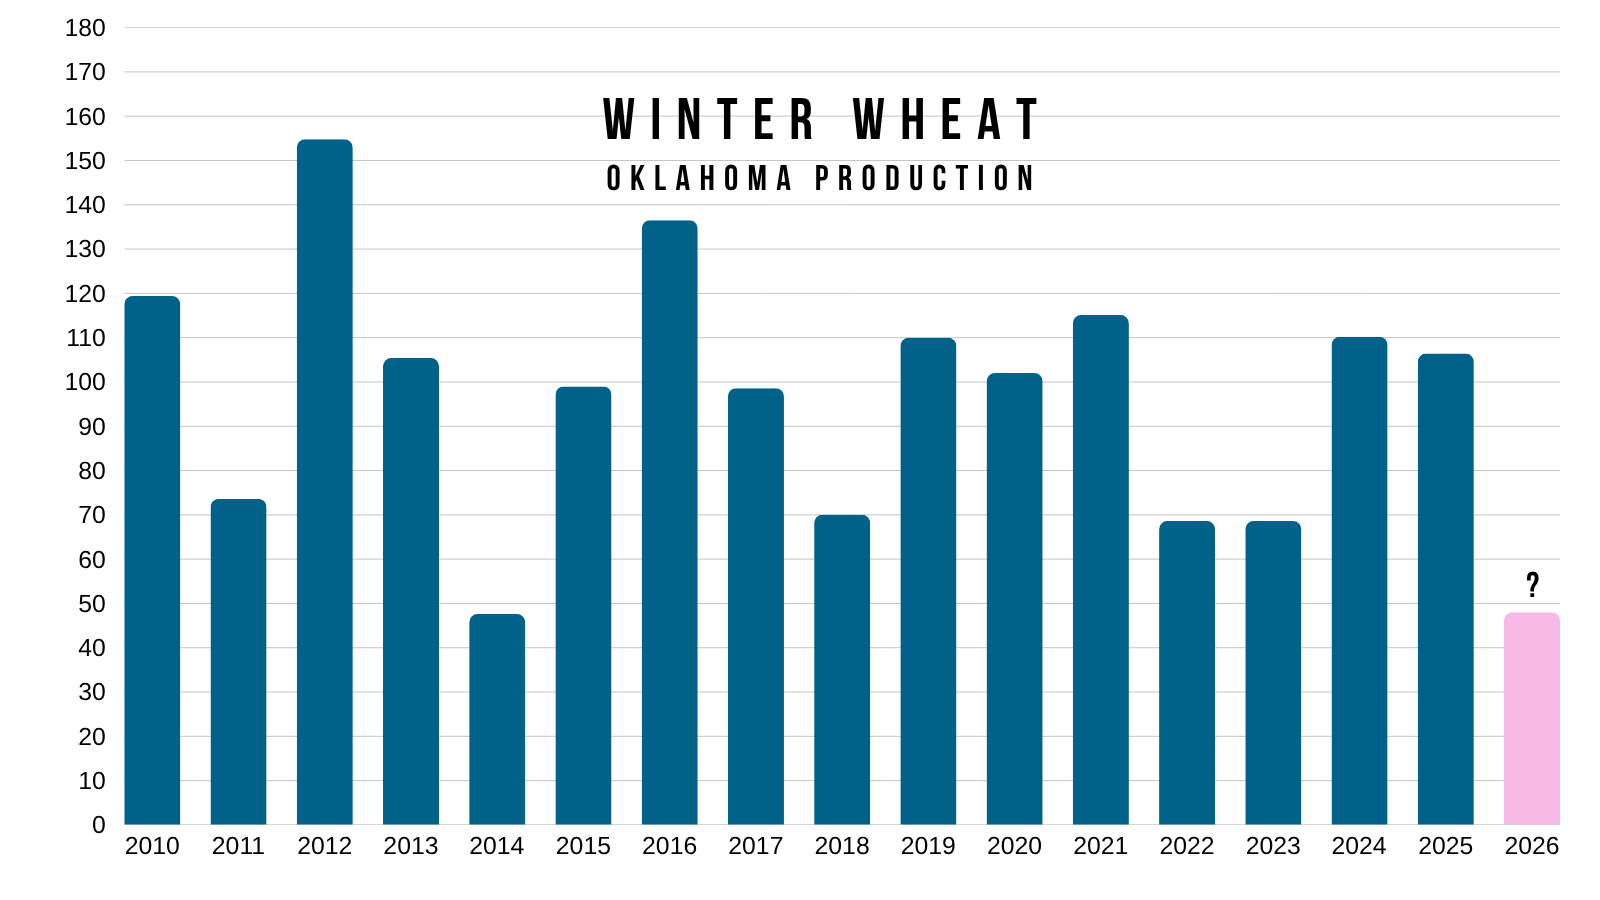
As mentioned on Wednesday, the tours in Oklahoma are estimating production to be 48 million bushels.
The 10-year average is 95 million.
Which means that this crop in Oklahoma is potentially half of what it normally is.
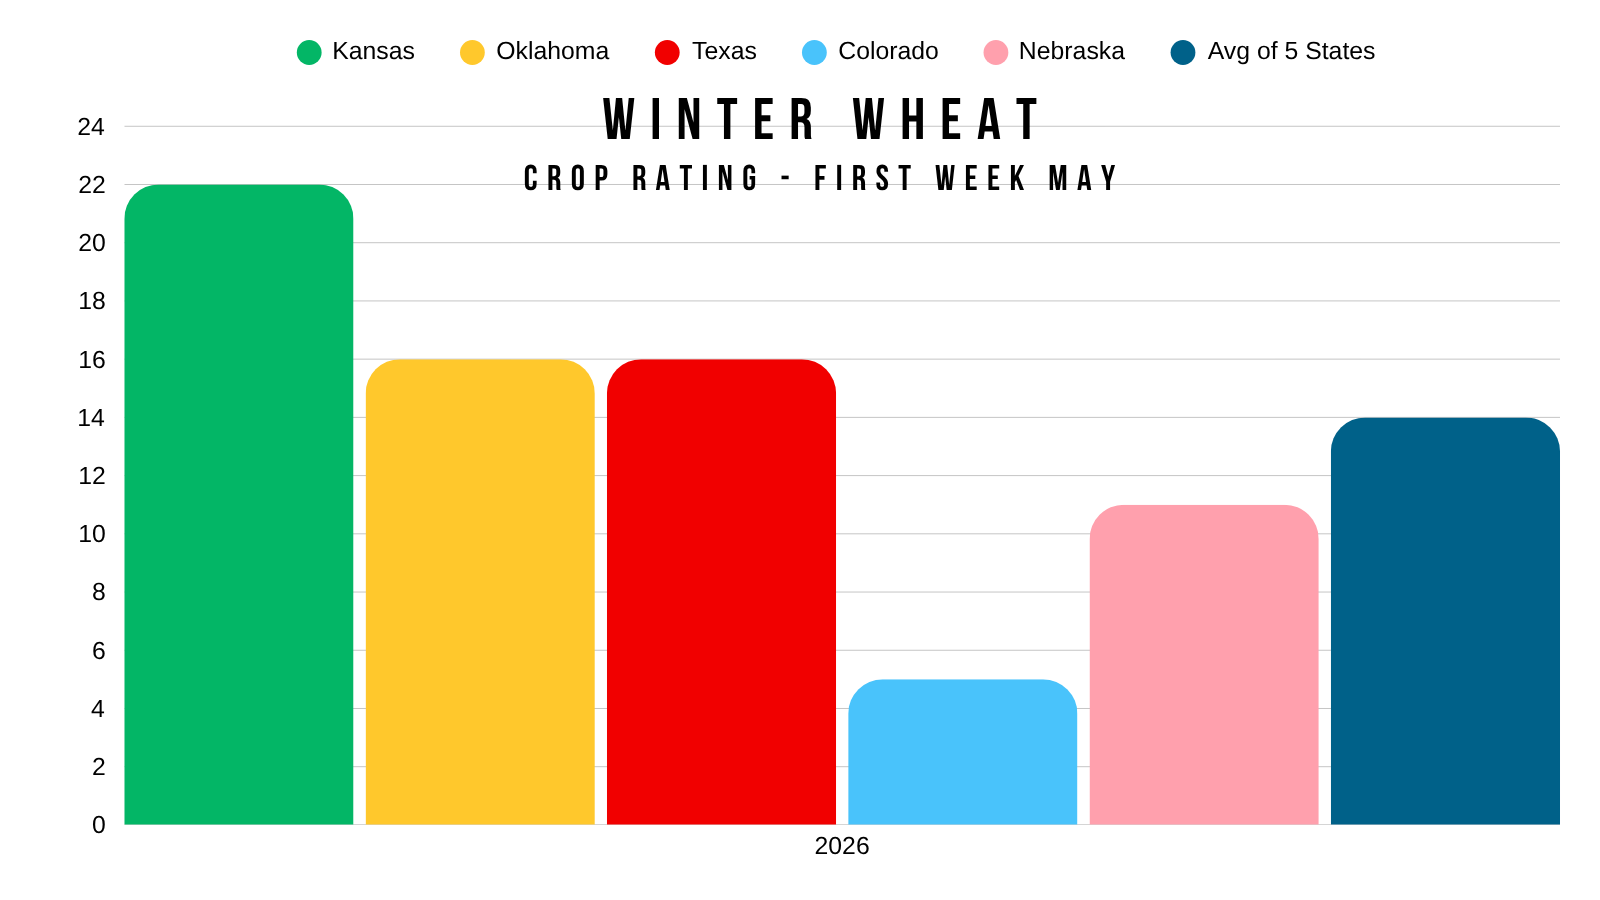
Oklahoma actually has a better rating than the other top states aside from Kansas.
So it's going to be interesting to see how the other states turn out.
The crop tours should be starting in Kansas next week.
The forecasts are still providing zero rain until at least mid-May for the key HRW regions.
Here is the outlook for the next 7 days.
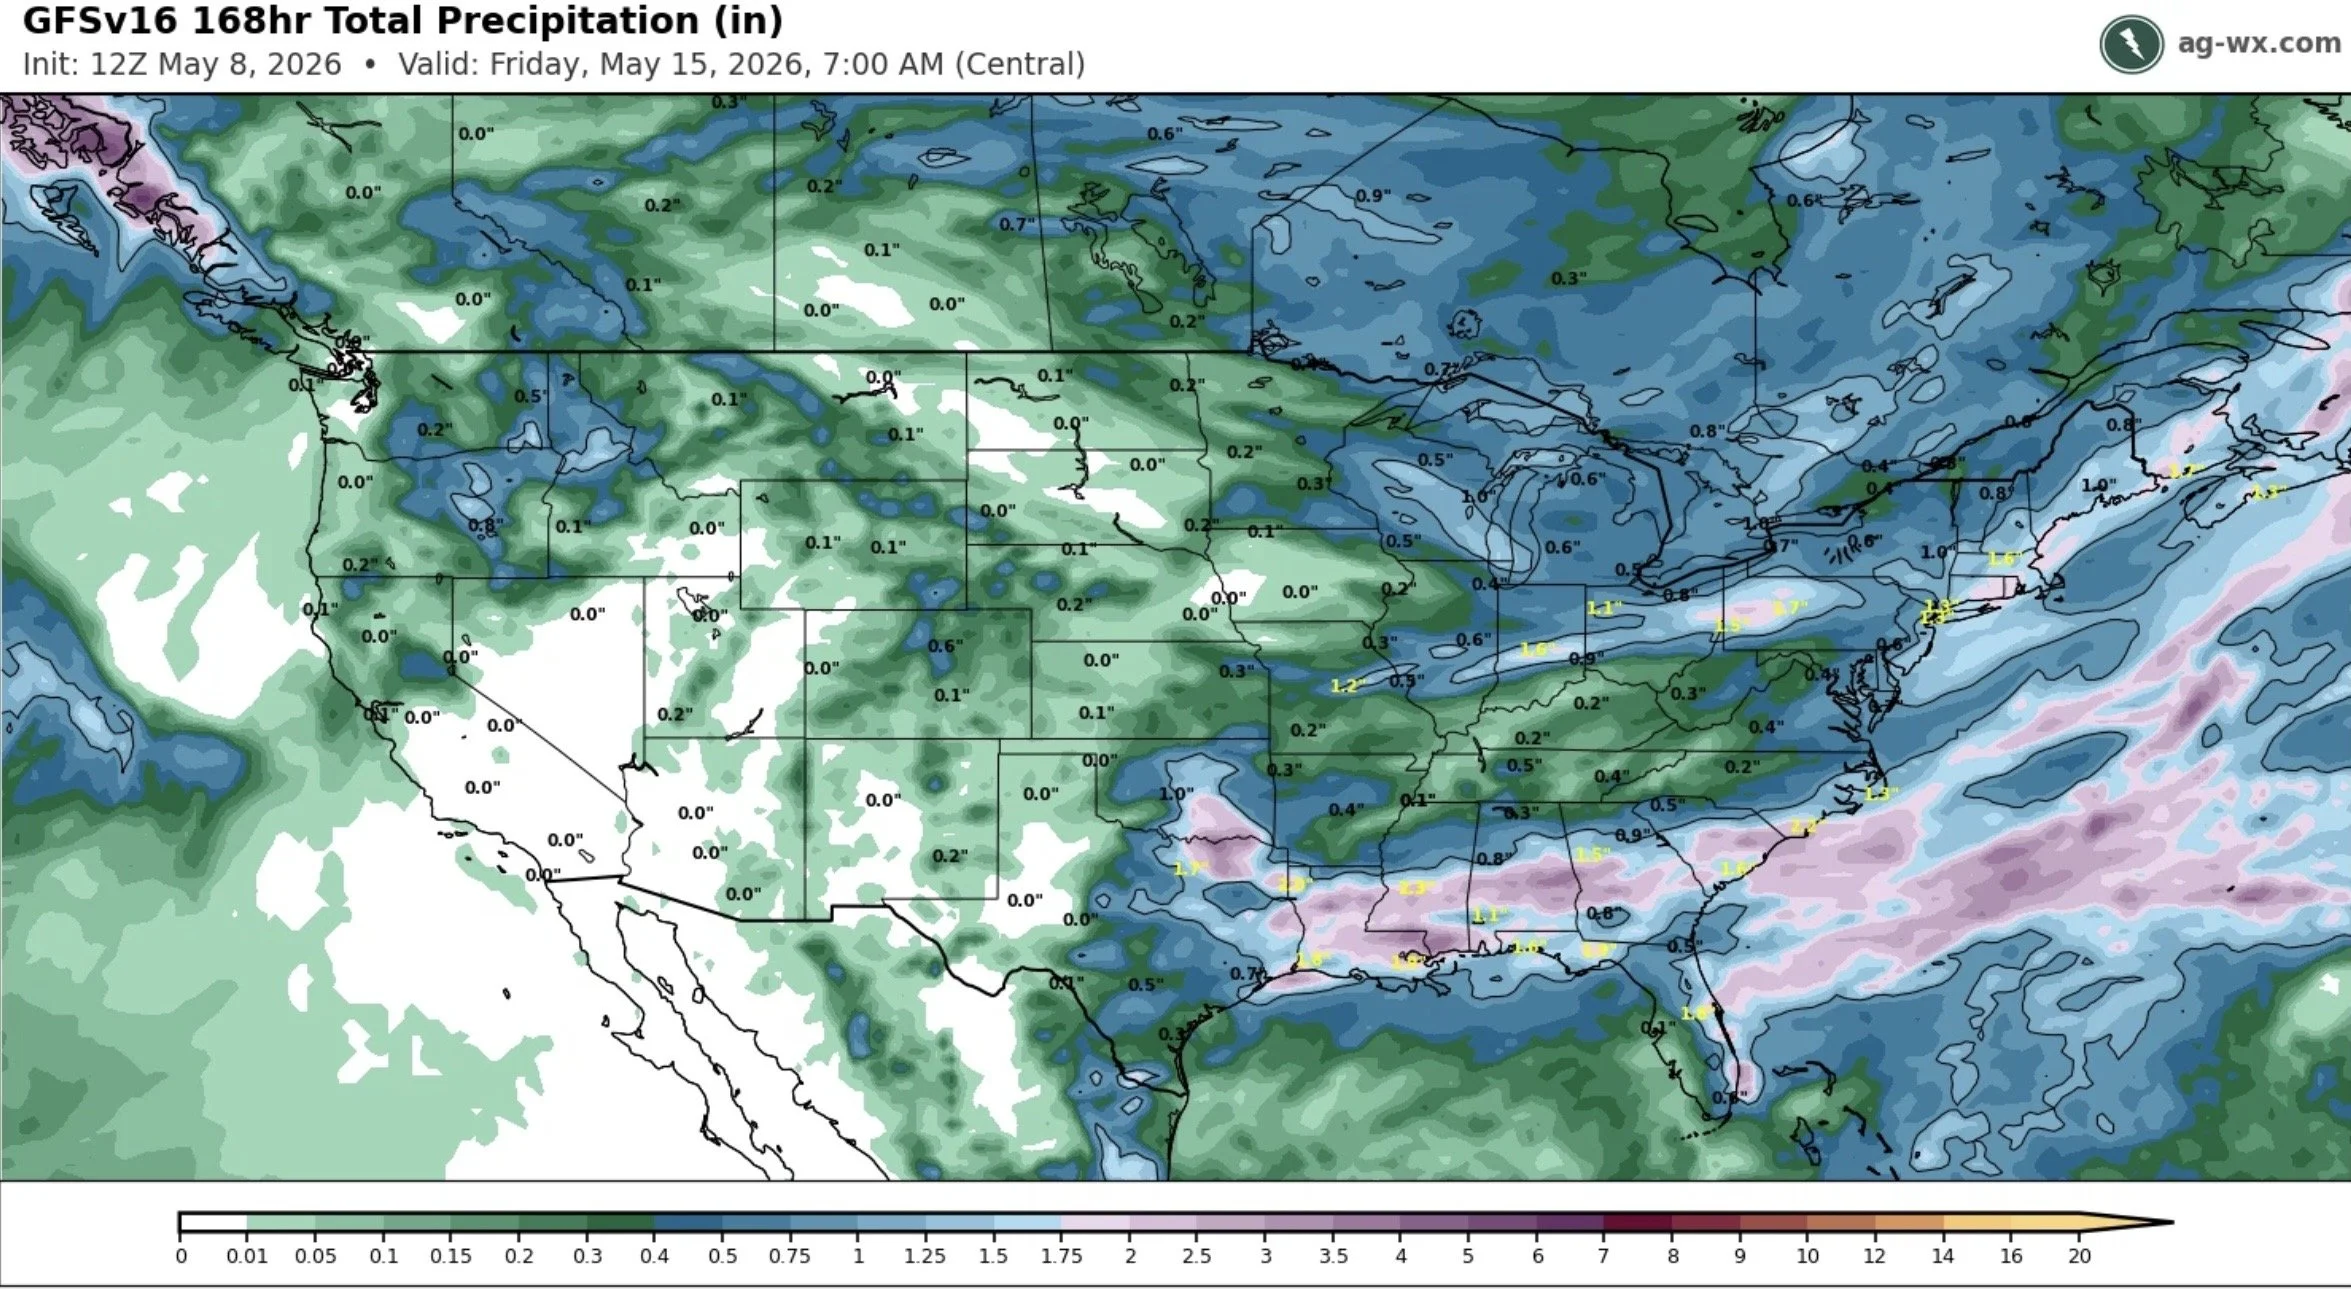
The extended 15-day outlook looks like it might some of rain towards the end of the month, but some areas are still looking like they'll miss out.
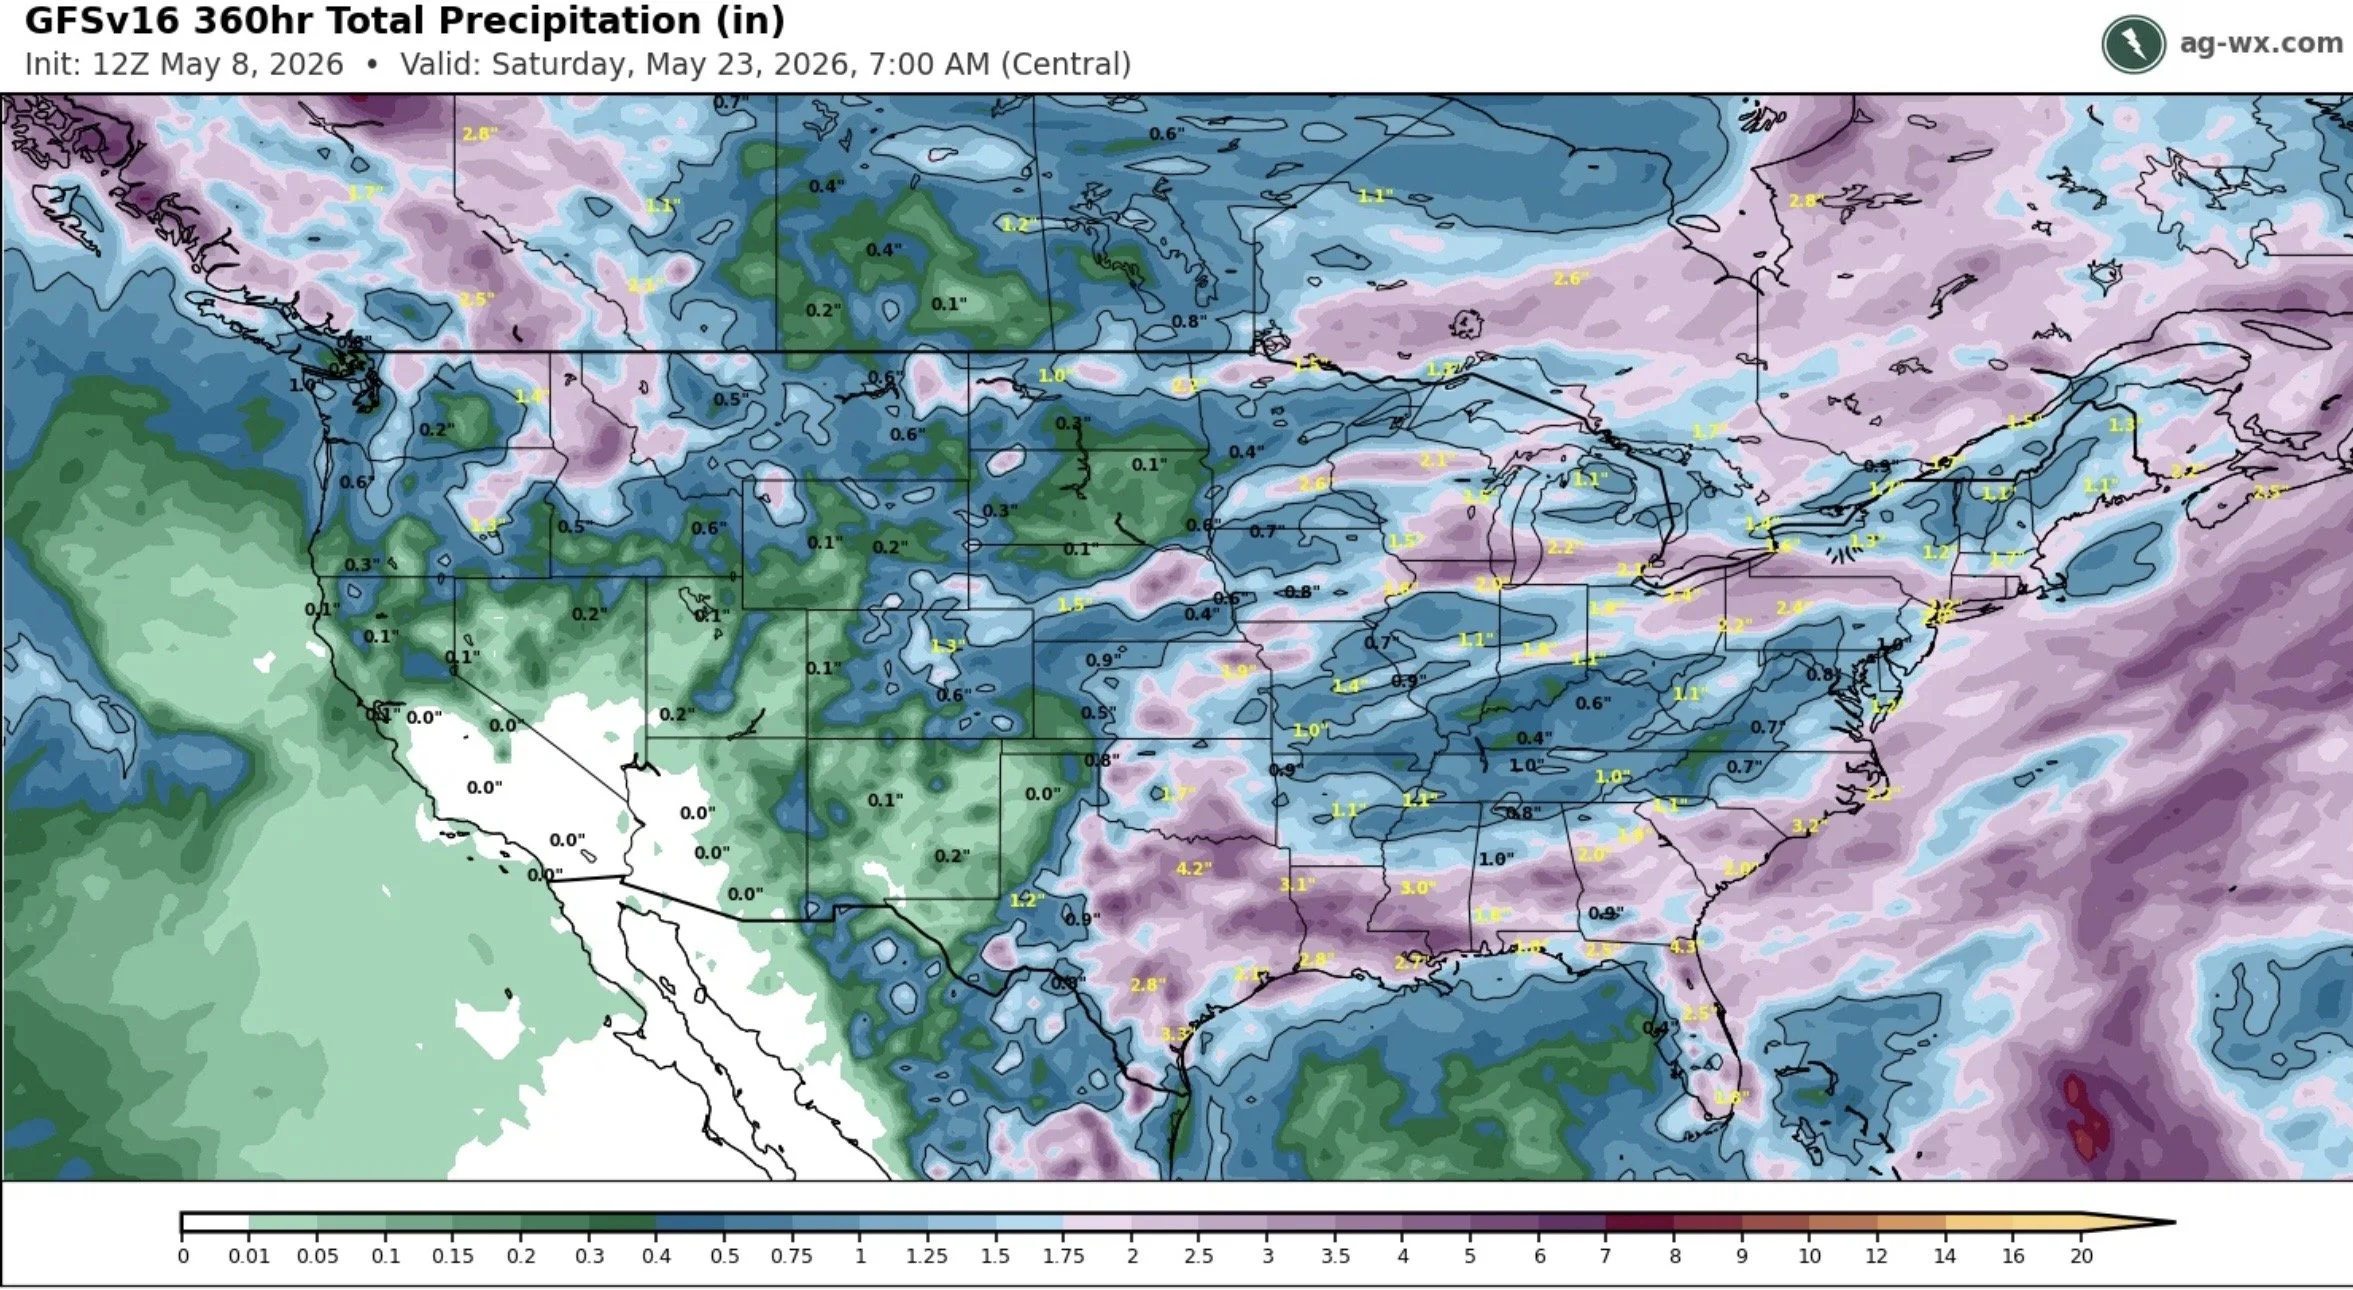
No rain until the middle of May after having the driest March and April ever isn’t good.
It's probably safe to say the damage is done here.
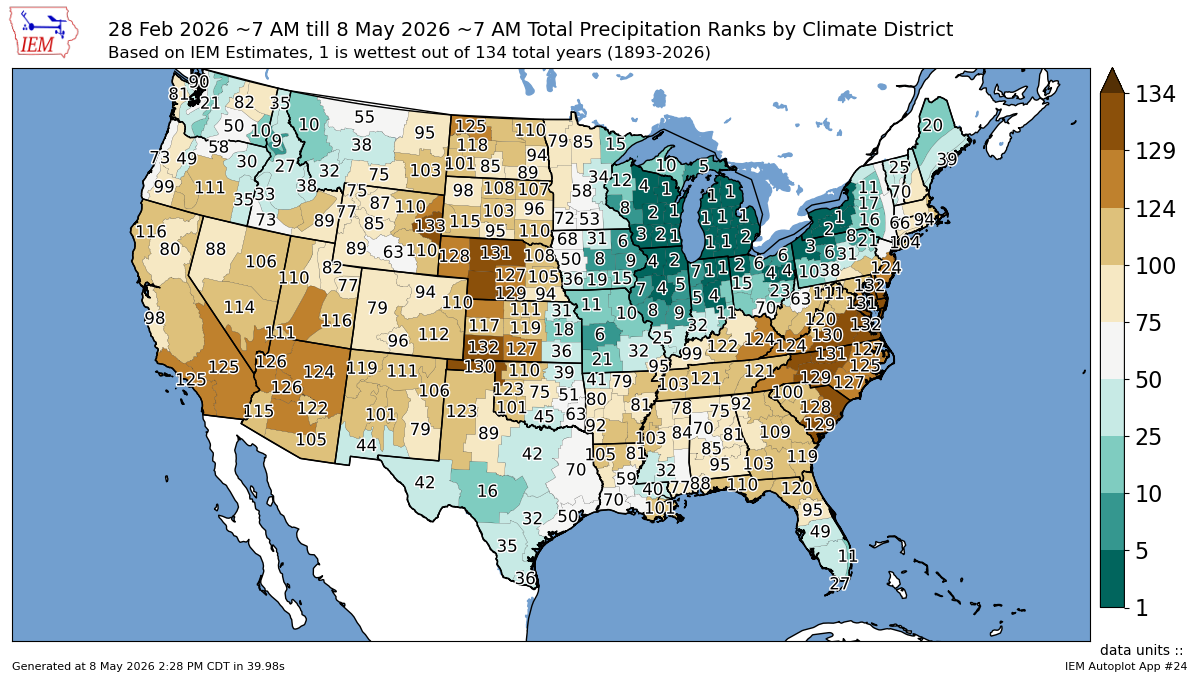
Yes, a large part of the drought story has clearly already been baked into this market.
However, this entire rally wasn’t completely driven by drought either.
If it was, then why is new crop corn sitting at 3-year highs despite a relatively bearish balance sheet?
It's the macros. We still have a war we need to resolve. Even if it does get resolved, that still leaves you with the fertilizer situation and how that's going to impact us long term. It definitely will impact countries outside the US more here for now.
Long term, I still think wheat has potential and a story.
But keep in mind that this is also the seasonal window to price some wheat.
So those who lack storage or need to move wheat, I wouldn’t ignore multi-year highs and price levels near $7.00, even though I think there is potential.
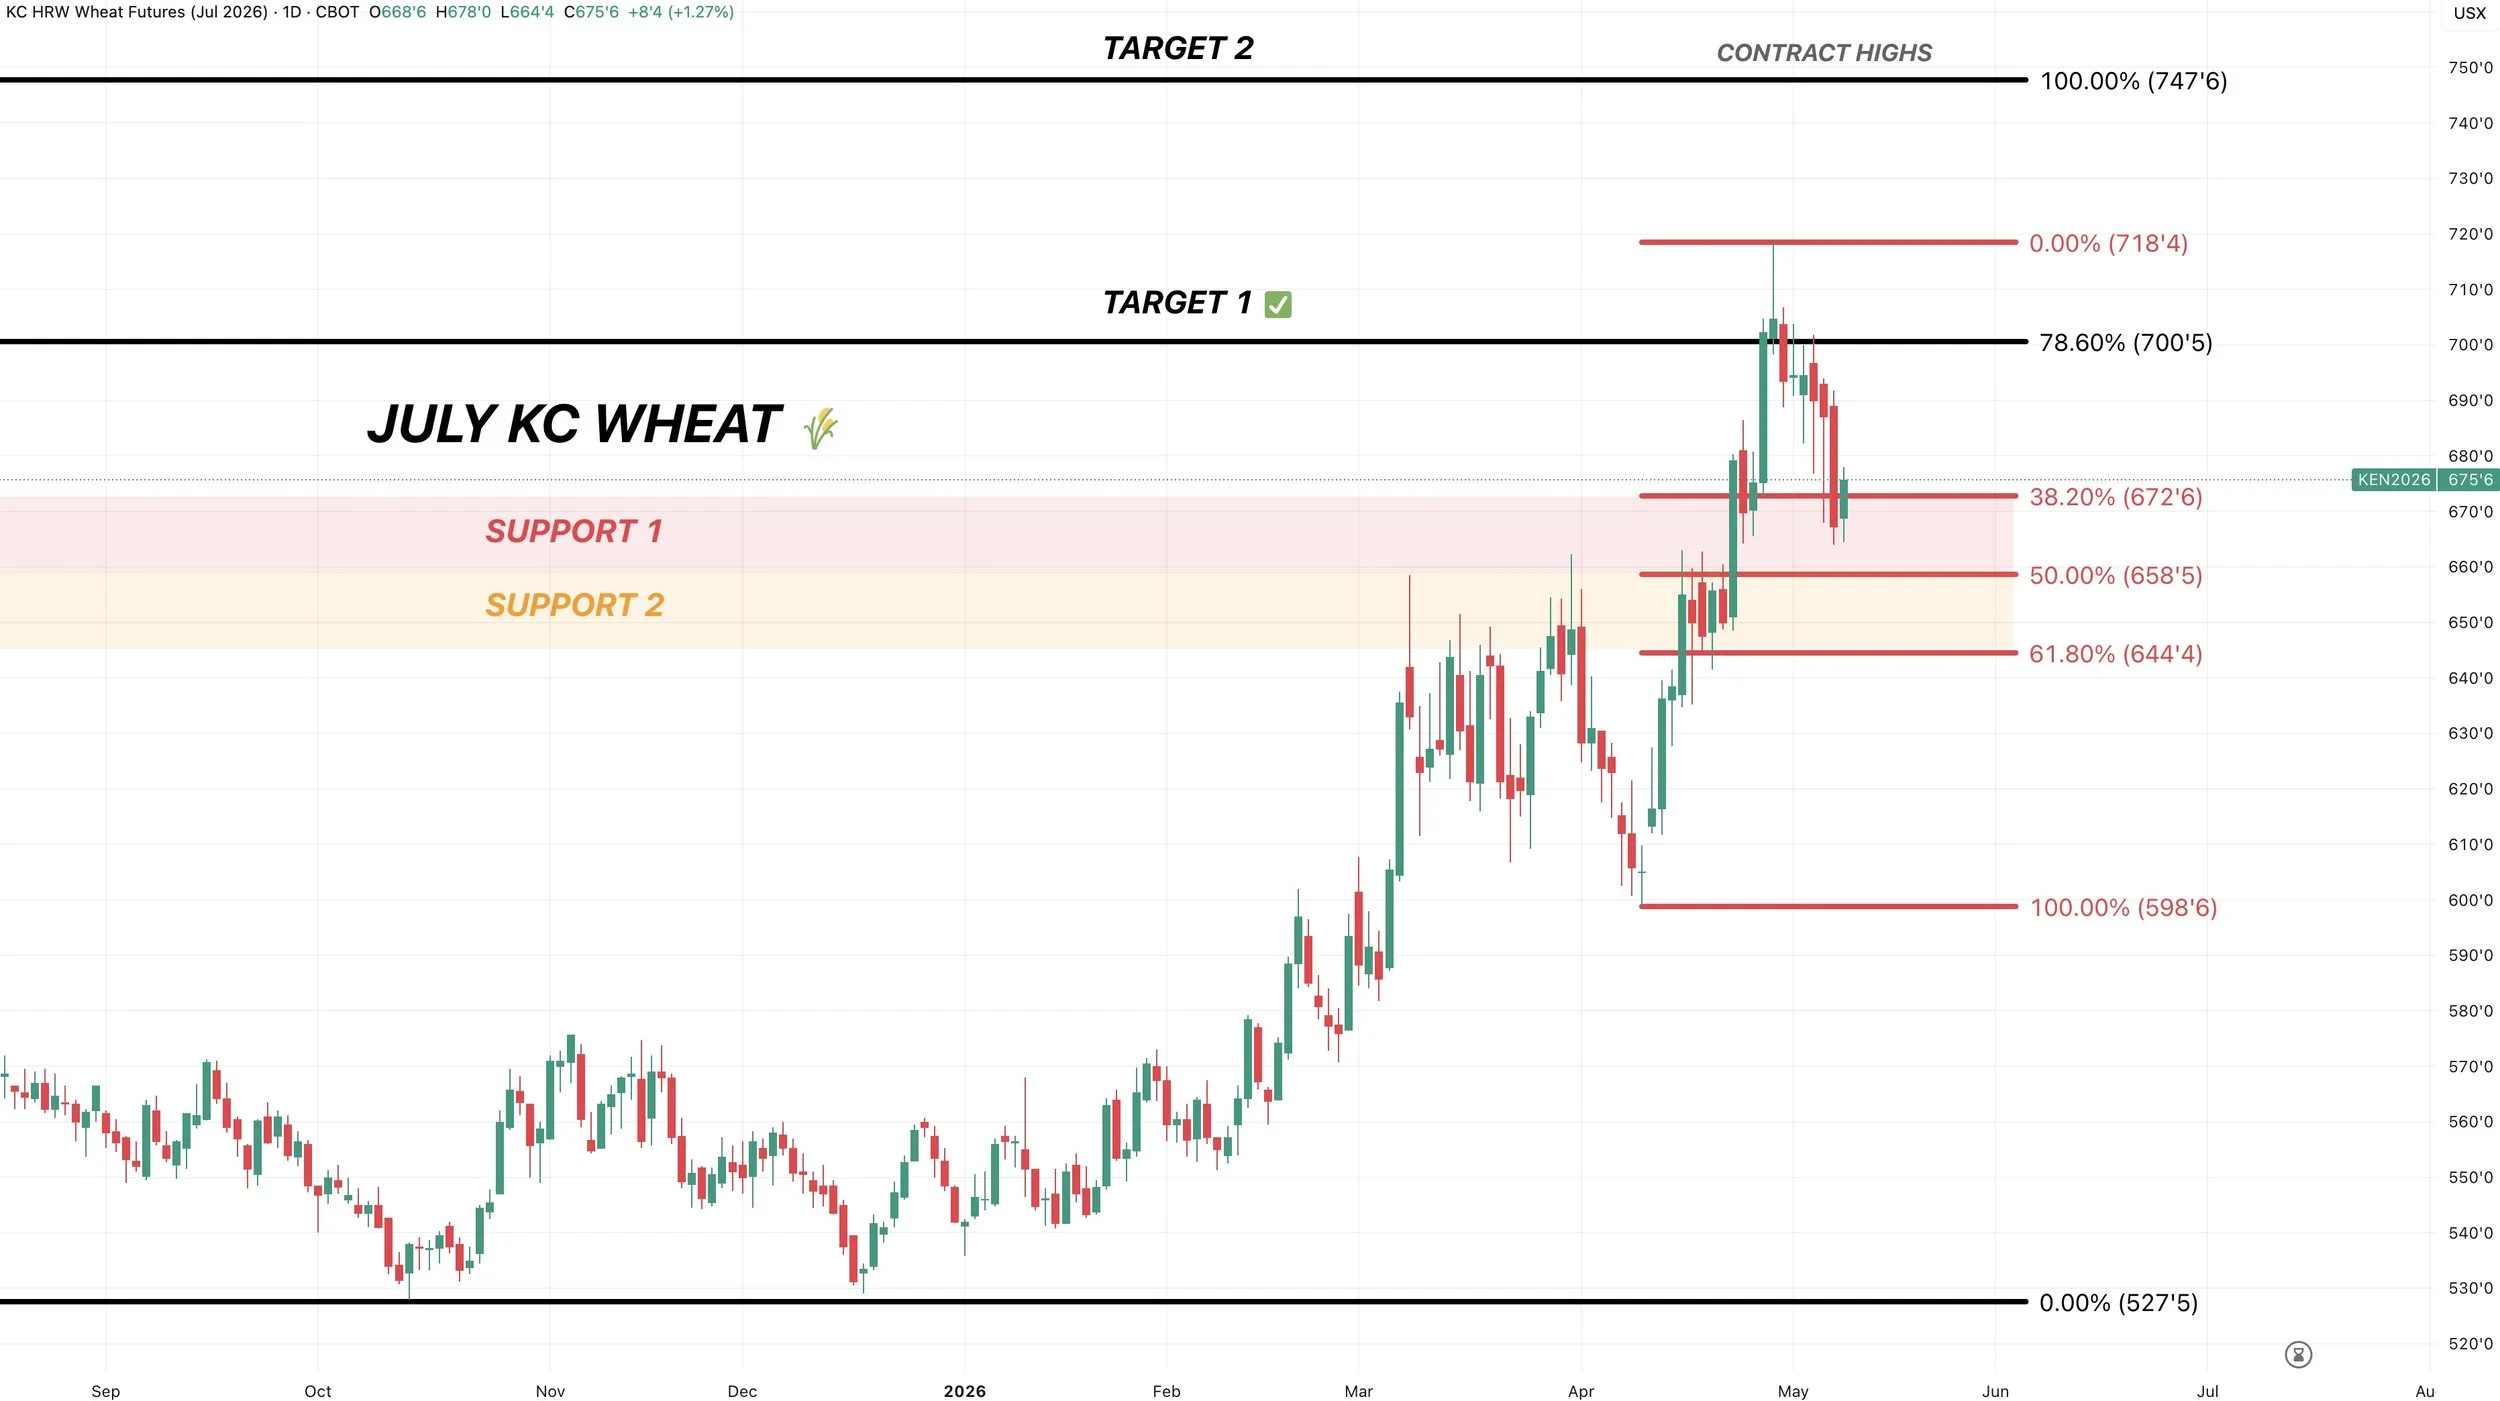
July KC Chart:
We failed at that first $7.00 target.
We are now in an area where it would make sense to find some life.
Like we talked about in Nov beans, a strong market doesn’t always have to go the golden zone (50% to 61.8%).
Sometimes it can be a shallower correction between 38.2% and 50%. Which is where KC wheat sits right now.
This same area is old resistance. Hopefully, it can be new support.
The trend remains higher unless we break below $6.44
$7.45 to $7.50 is still the next target.
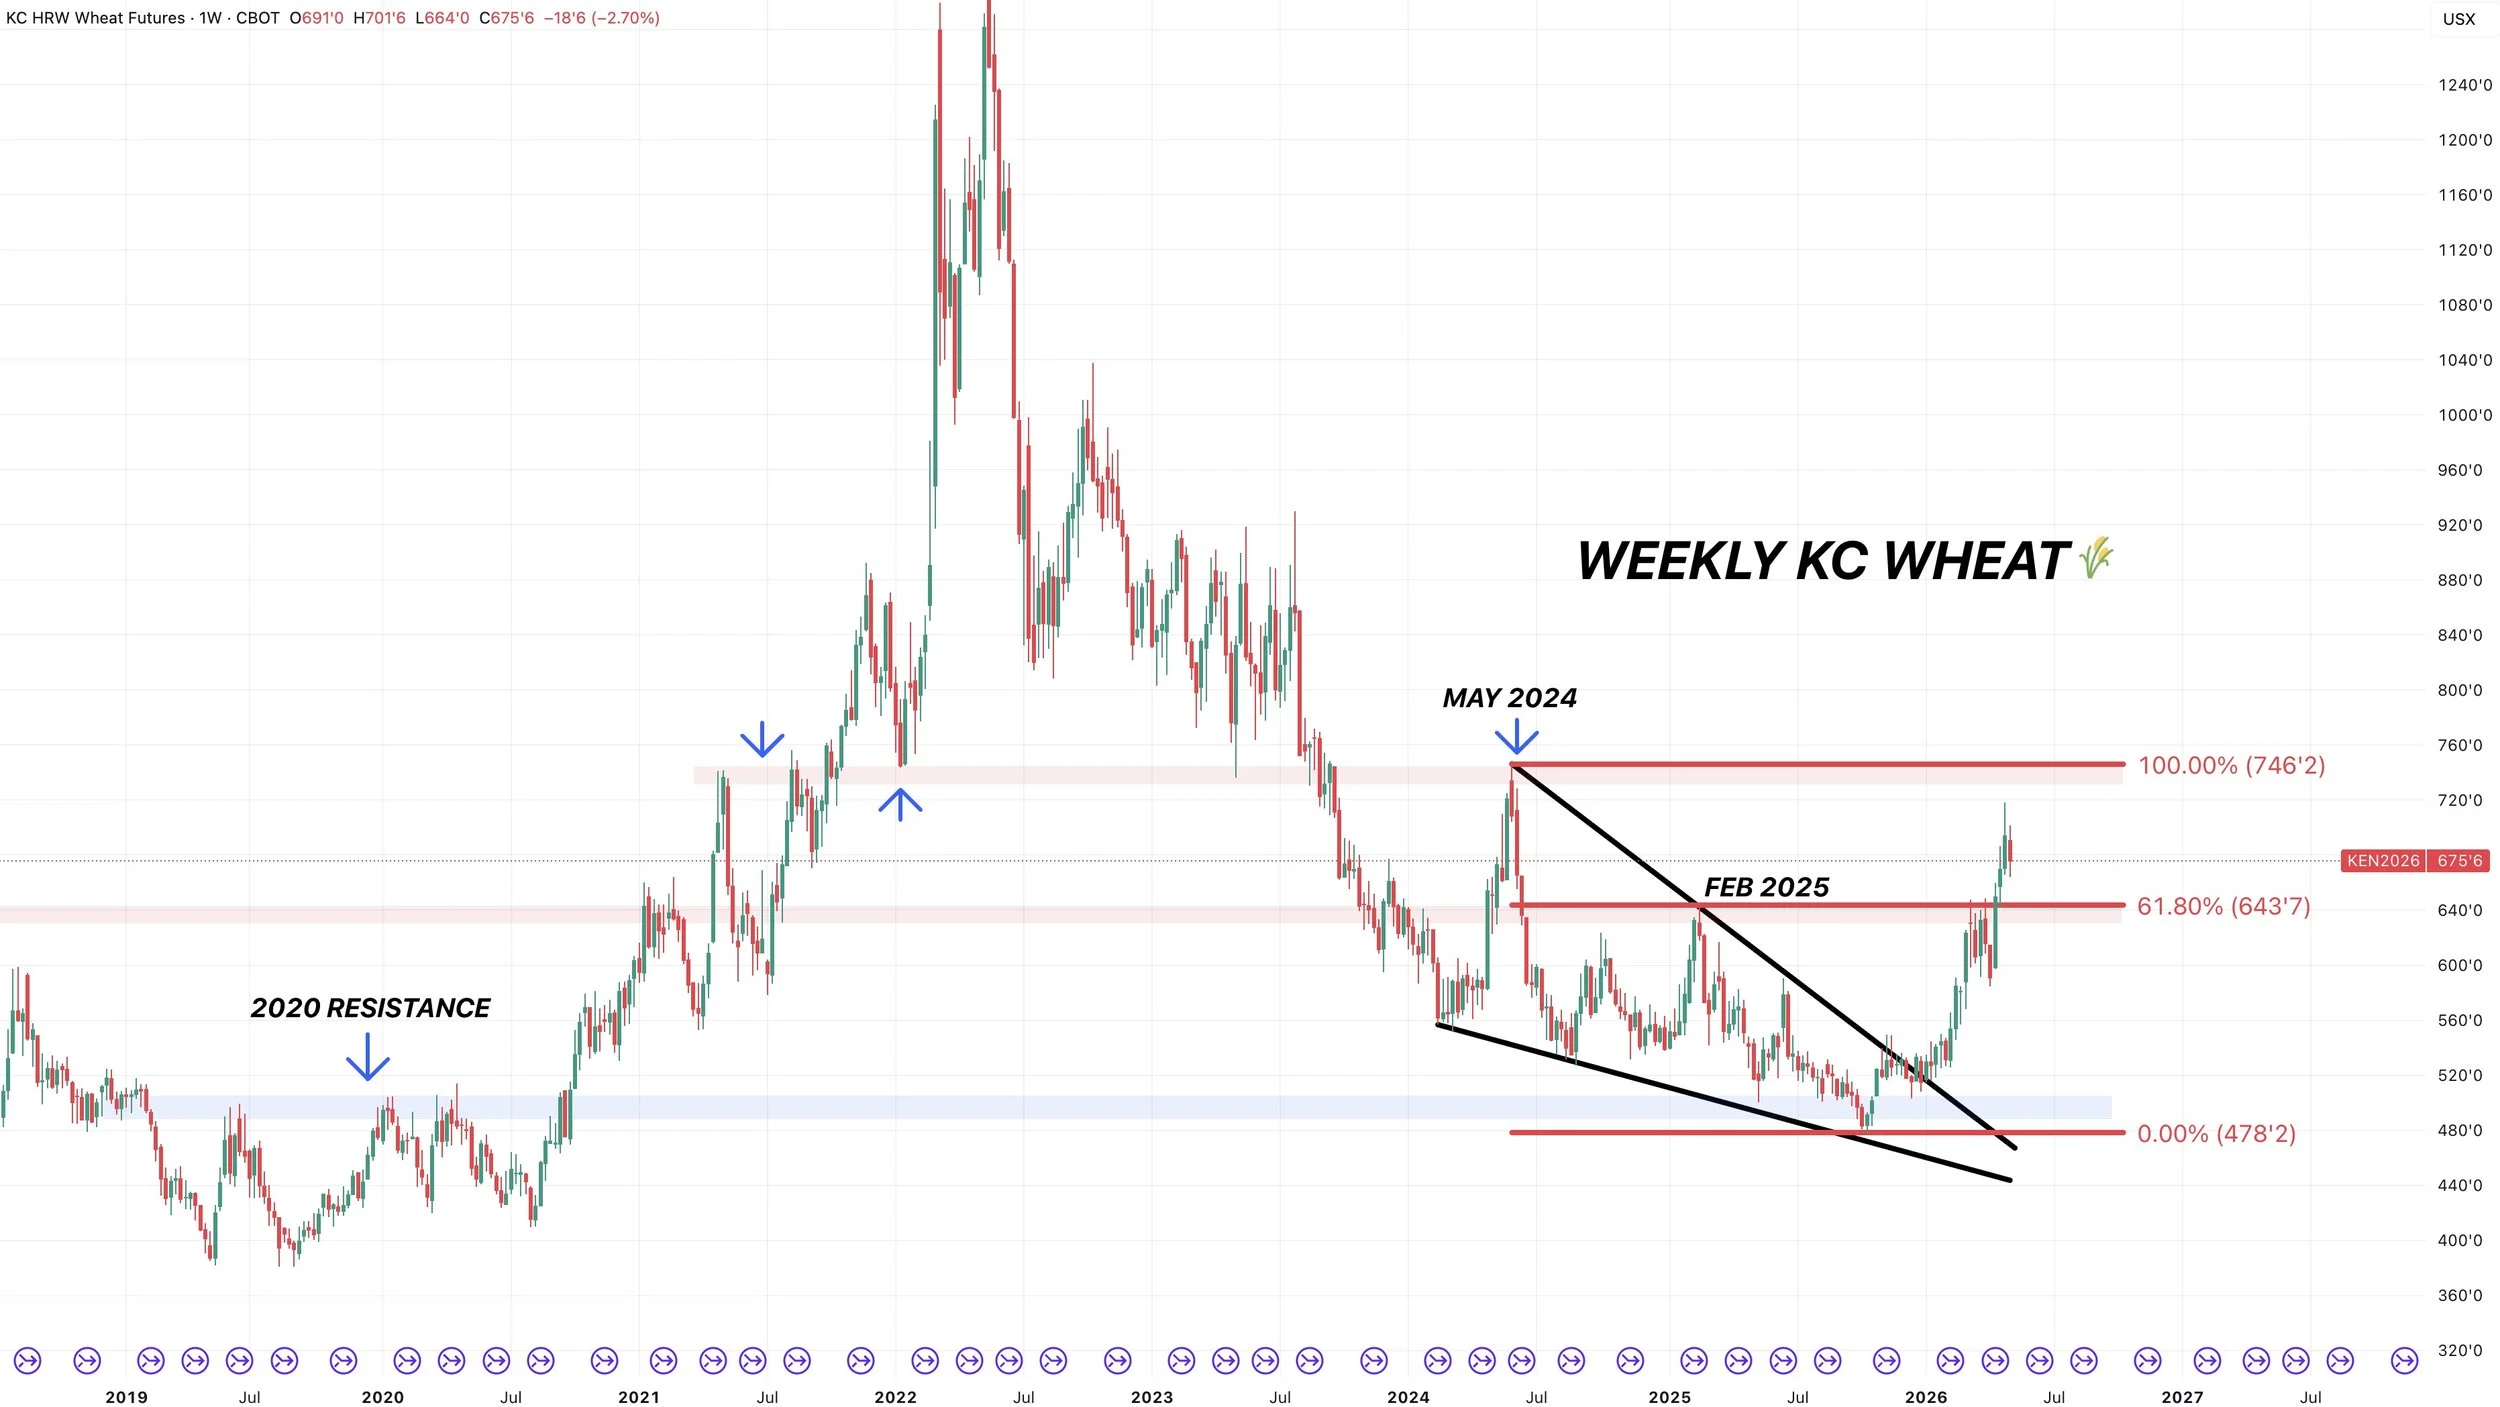
Big Picture Chart:
You can’t tell me this doesn’t look like a long term low has been set.
We found our lows right at those highs from 2020.
We've now traded to our highest levels in two years. Posting our FIRST higher high in 5 years.
Seems like a big deal to me after posting a series of lower high after lower high for half a decade.
This chart is another reason why $7.45 is that next big target if we can clear $7.00
That was the highs from May 2024 off the back of that Russia weather story.
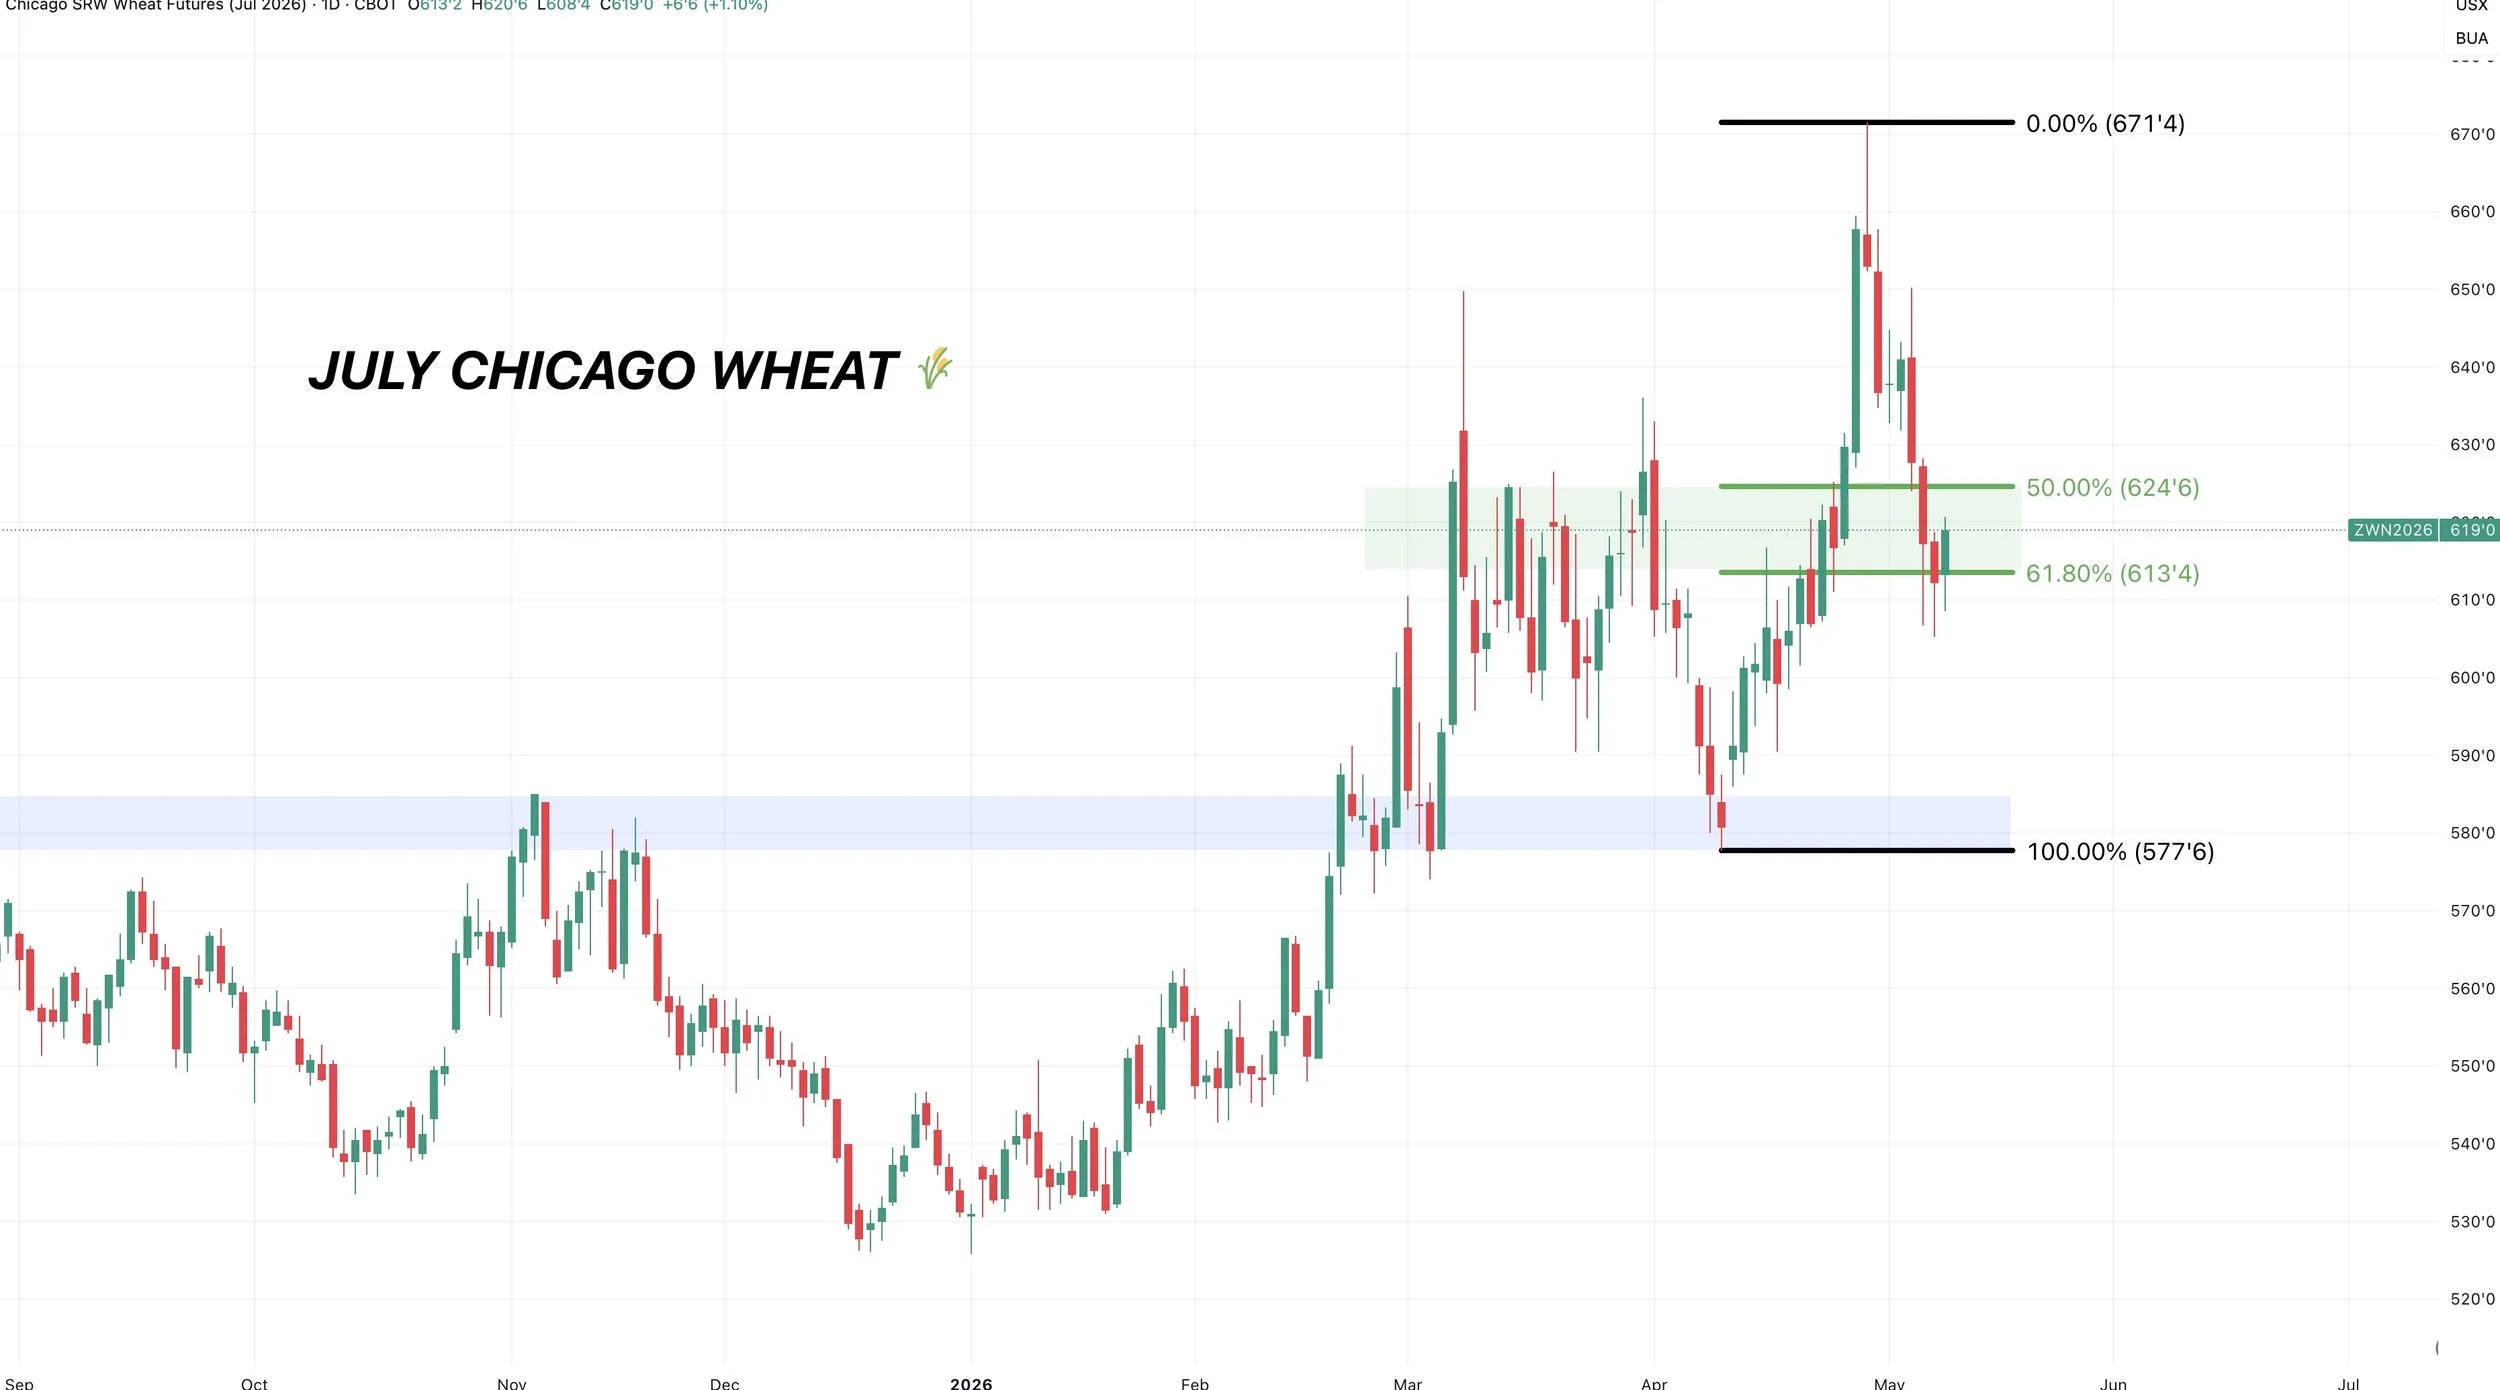
July Chicago Chart:
Finding life right at the 61.8% level.
Another reason why it might make sense for KC to find some support in the 38.2% to 50% range rather than the golden zone.
As this is pretty much a sink or swim level for Chicago.
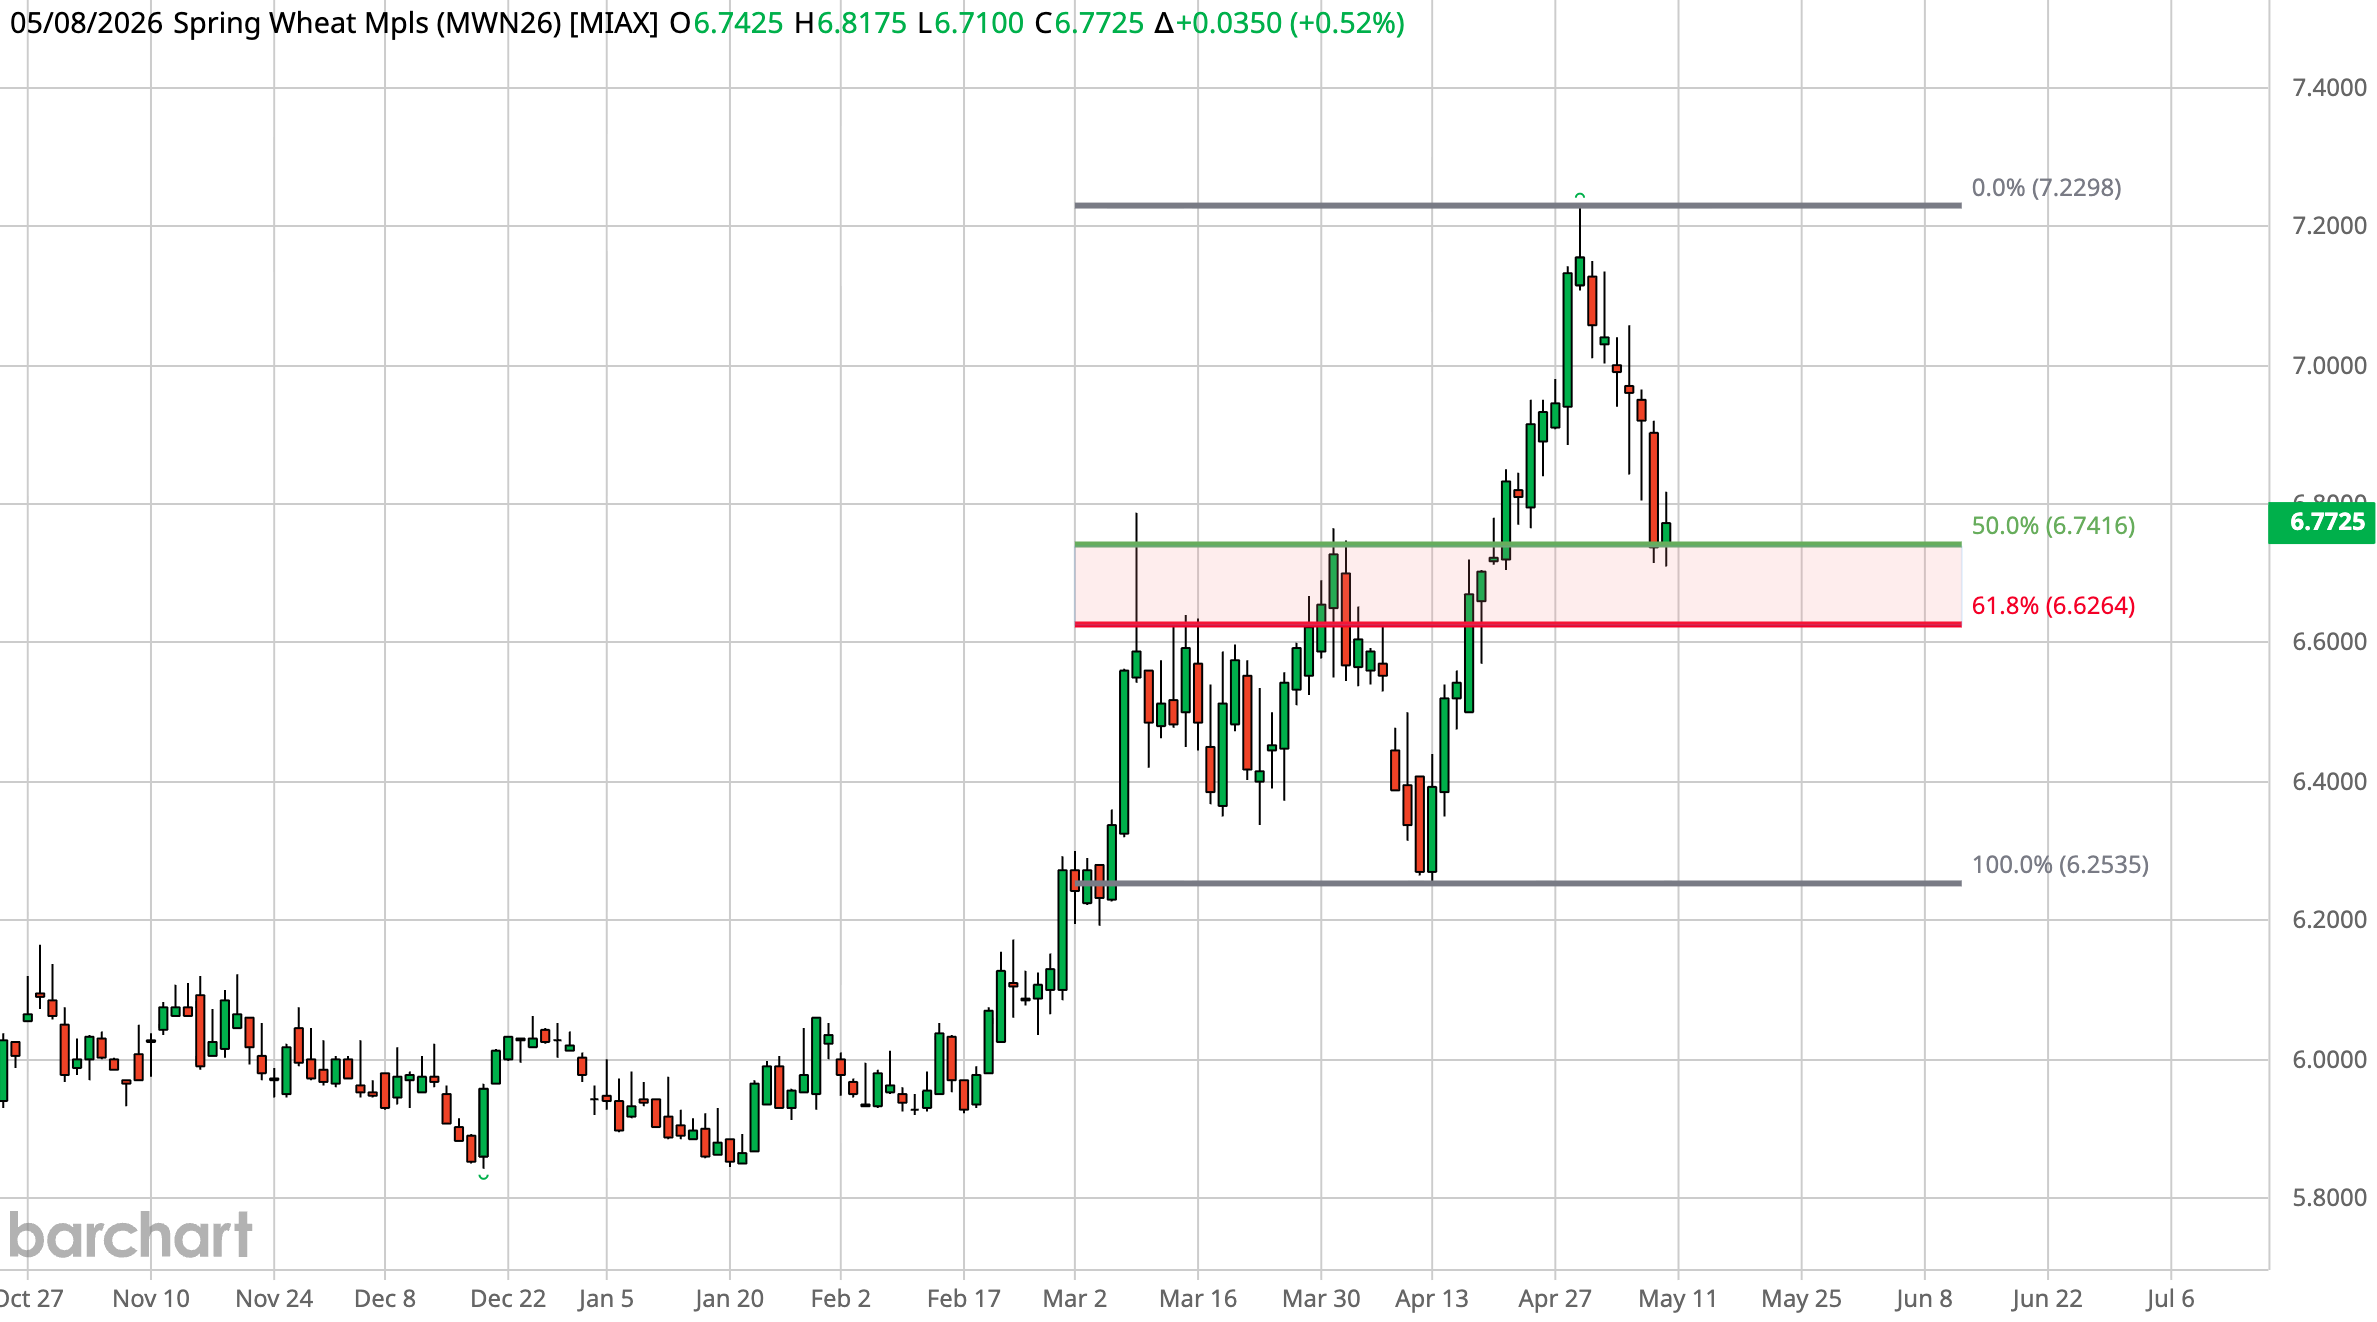
July MPLS Chart:
Sitting right at the golden zone. Tapping the 50% level before bouncing.
This same area was prior resistance. Trying to turn it into new support.
$6.62 is the key level to hold.
If we are going to bounce, bulls need it to be here.
Cattle
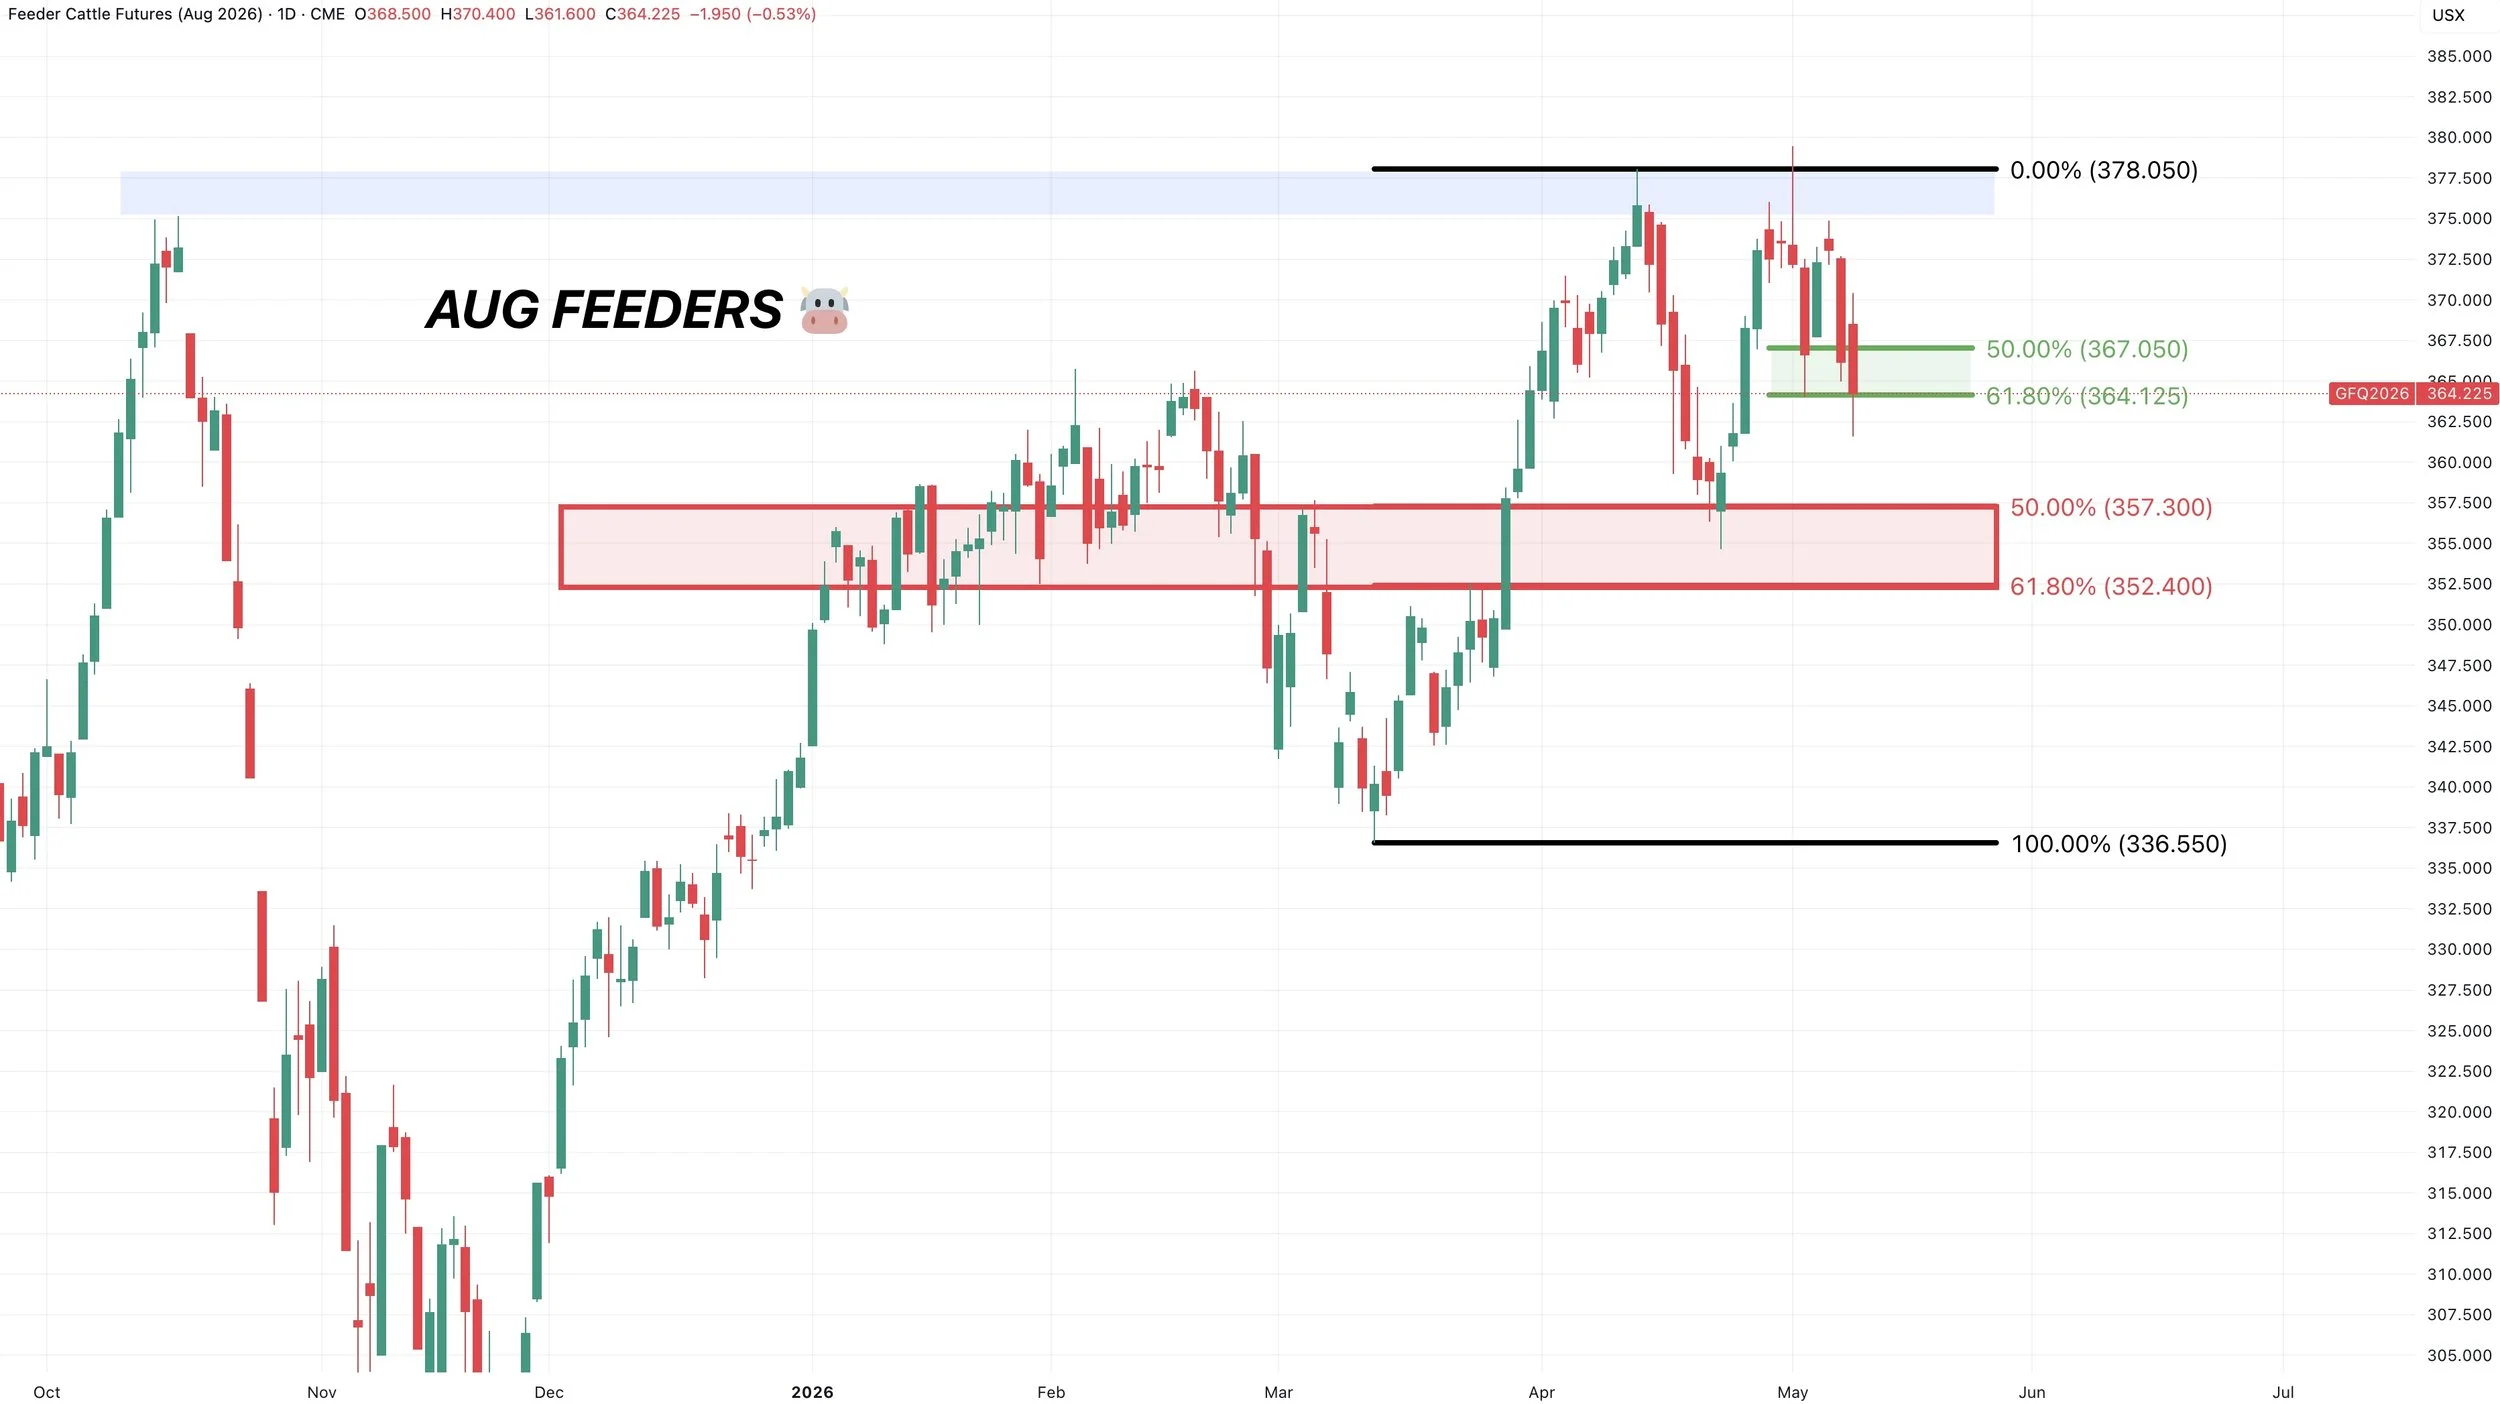
Aug Feeders Chart:
We rejected those previous highs.
We closed right at the 61.8% level of the recent bounce.
So big level here. Bulls need a bounce here or a break below would suggest further downside.
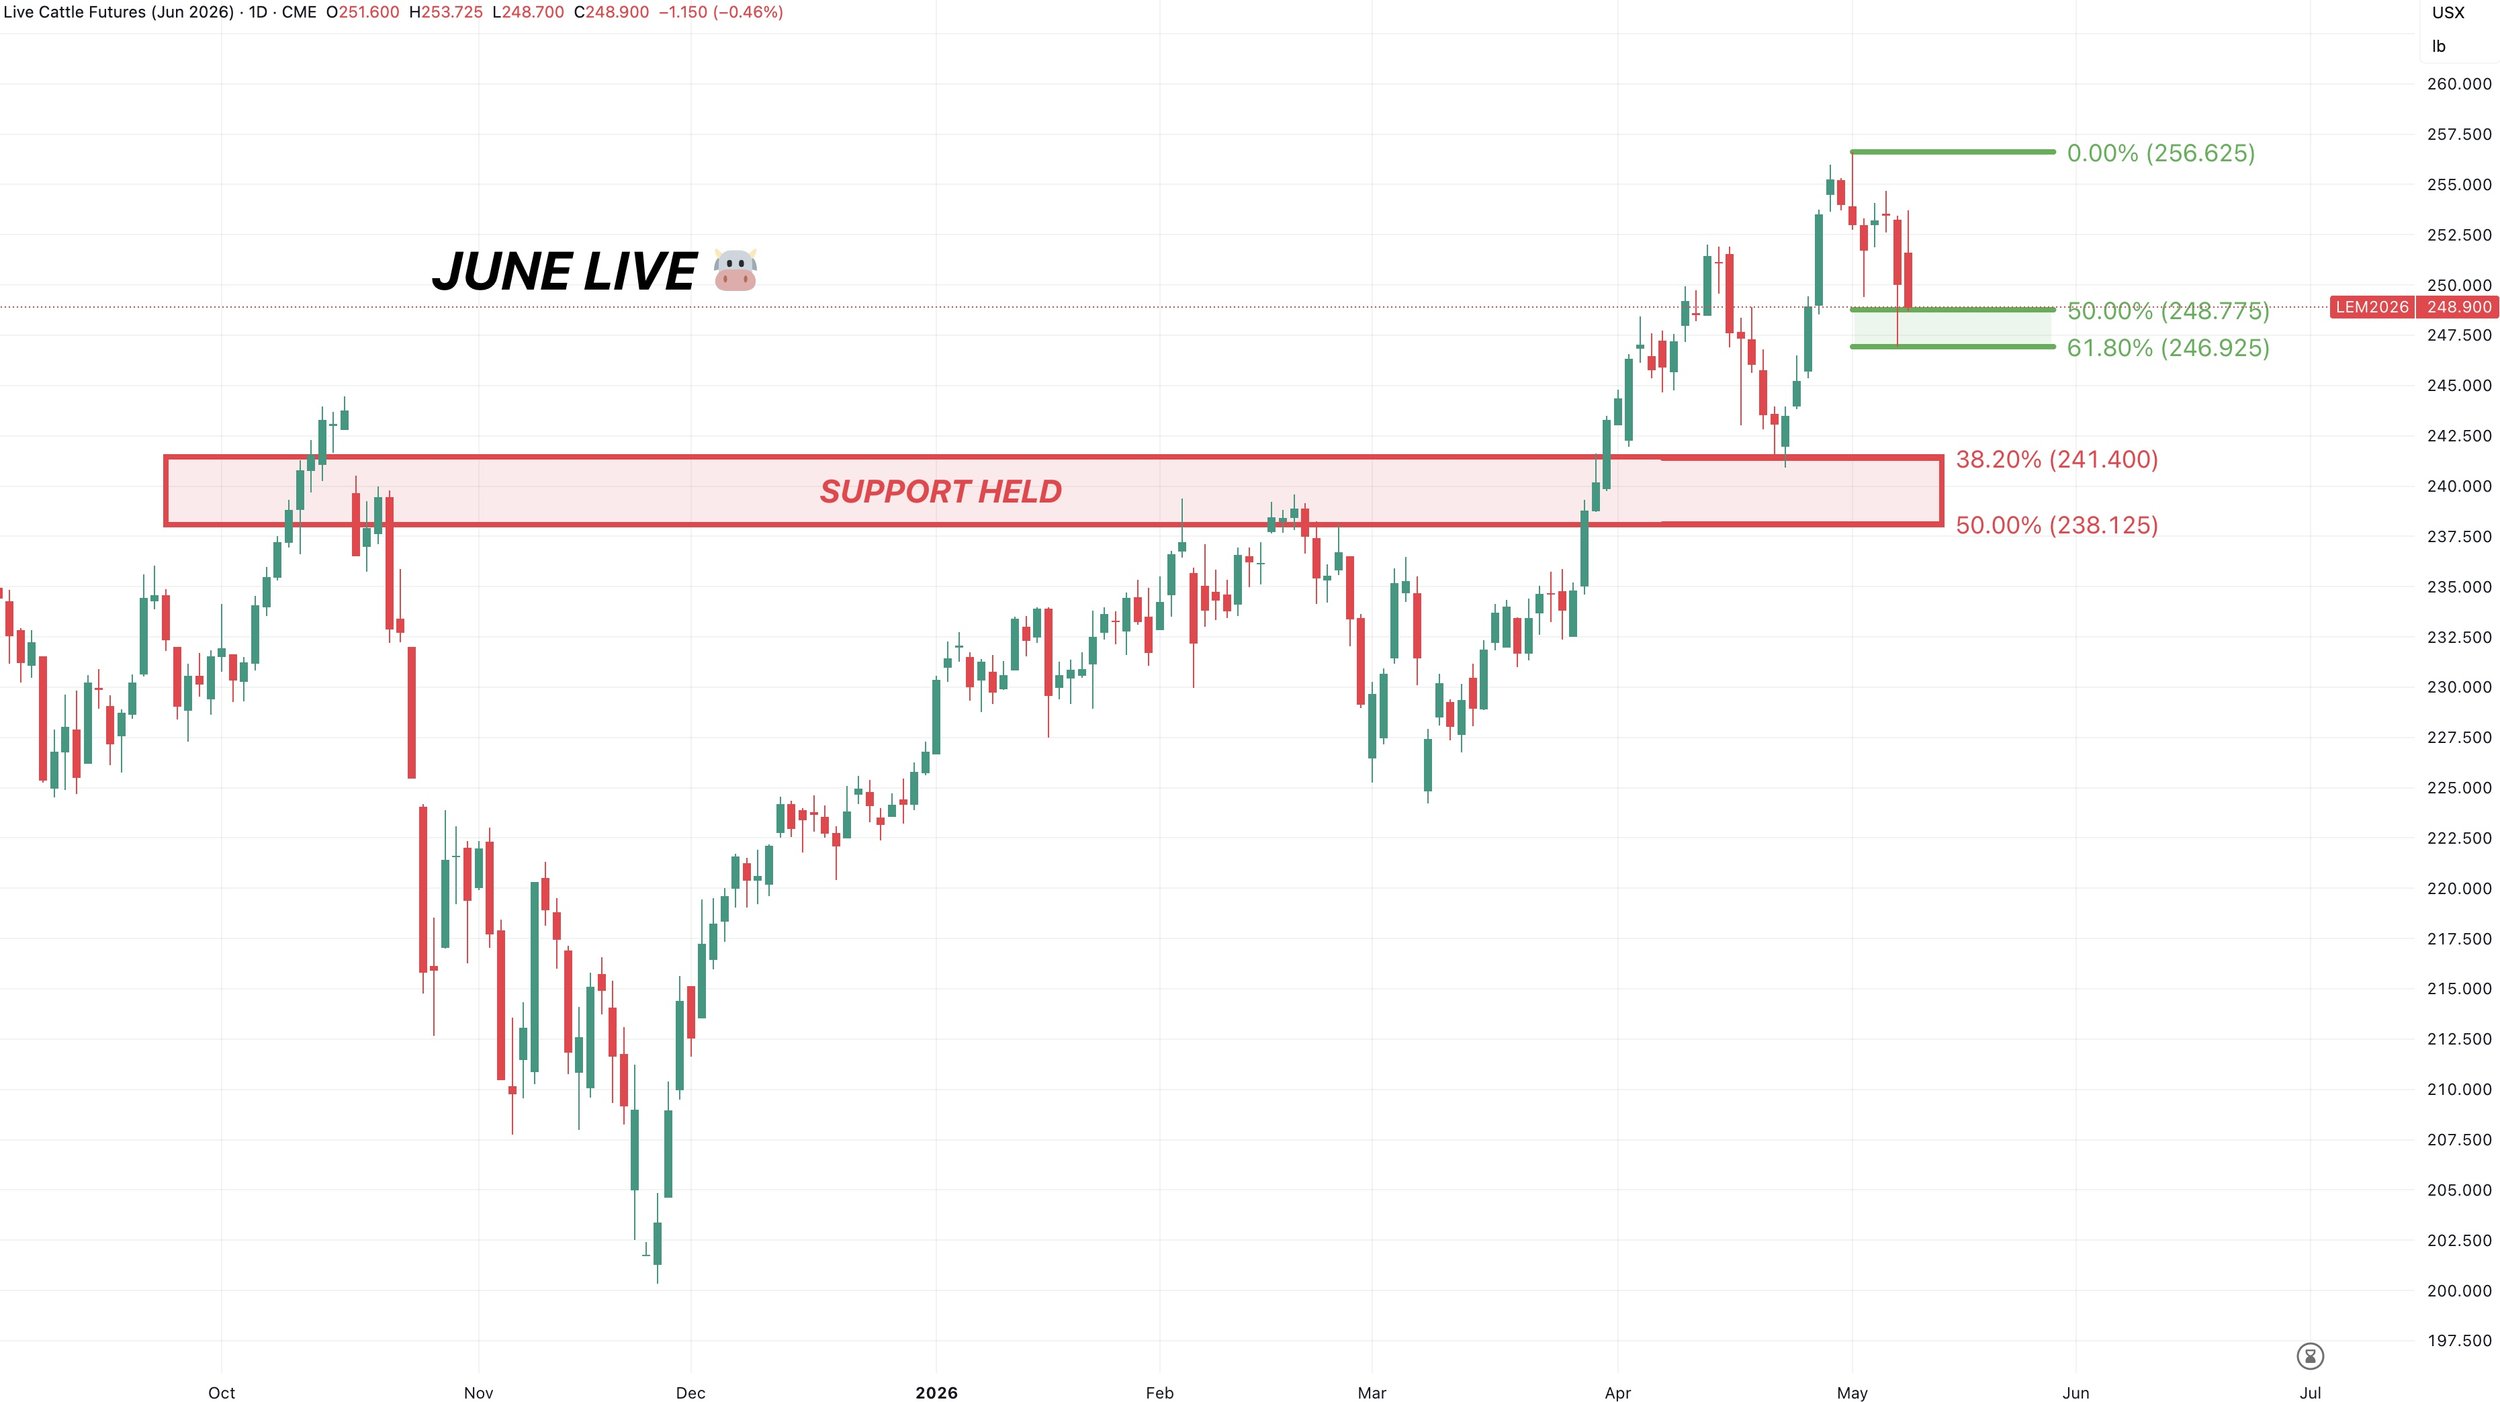
June Live Chart:
Nearing that golden zone again.
Would like to see us hold here or we could get a leg lower and go test those April lows.
Want to Talk?
Our phones are open 24/7 for you guys if you ever need anything or want to discuss your operation.
Jeremey & Office: (806)484-1214
Sebastian: (605)280-1186
Email: sfrost@dailymarketminute.com
Hedge Account
Interested in a hedge account? Use the link below to set up an account or give us a call.
Recent Signals
April 28th, 2026: 🌾
KC wheat specific signal.
CLICK HERE TO VIEW
April 27th, 2026: 🌽
Corn catch up sell signal.
CLICK HERE TO VIEW
April 10th, 2026: 🌽
Corn buy signal.
CLICK HERE TO VIEW
March 19th, 2026: 🌱
New crop soybeans signal & hedge alert.
CLICK HERE TO VIEW
March 9th, 2026: 🌱
Soybeans signal & hedge alert. Sent via text.
March 6th, 2026: 🌽 🌾
Corn & wheat sell signal & hedge alert.
March 3rd, 2026: 🌽
Old crop & new crop corn sell signal & hedge alert.
Feb 26th, 2026: 🌱
Old crop & new crop beans sell signal & hedge alert.
Feb 19th, 2026: 🌾
KC wheat sell signal & hedge alert.
Feb 6th, 2026: 🌽 🌱
Old crop corn & soybean sell signal & hedge alert.
Feb 4th, 2026: 🌱
Soybean sell signal & hedge alert.
Nov 17th, 2025: 🌱
Soybean sell signal & hedge alert.