
MARKET UPDATE
You can scroll to read the usual update as well. As the written version is the exact same as the video.
Timestamps for video:
Overview: 0:00min
2010 vs 2020: 0:55min
Corn Story: 3:15min
Beans Story: 5:15min
Corn Charts: 8:15min
Bean Charts: 12:15min
Wheat Charts: 13:00min
Cattle Charts: 14:35min
Want to talk?
Office: (806)484-1214
Futures Prices Close
Overview
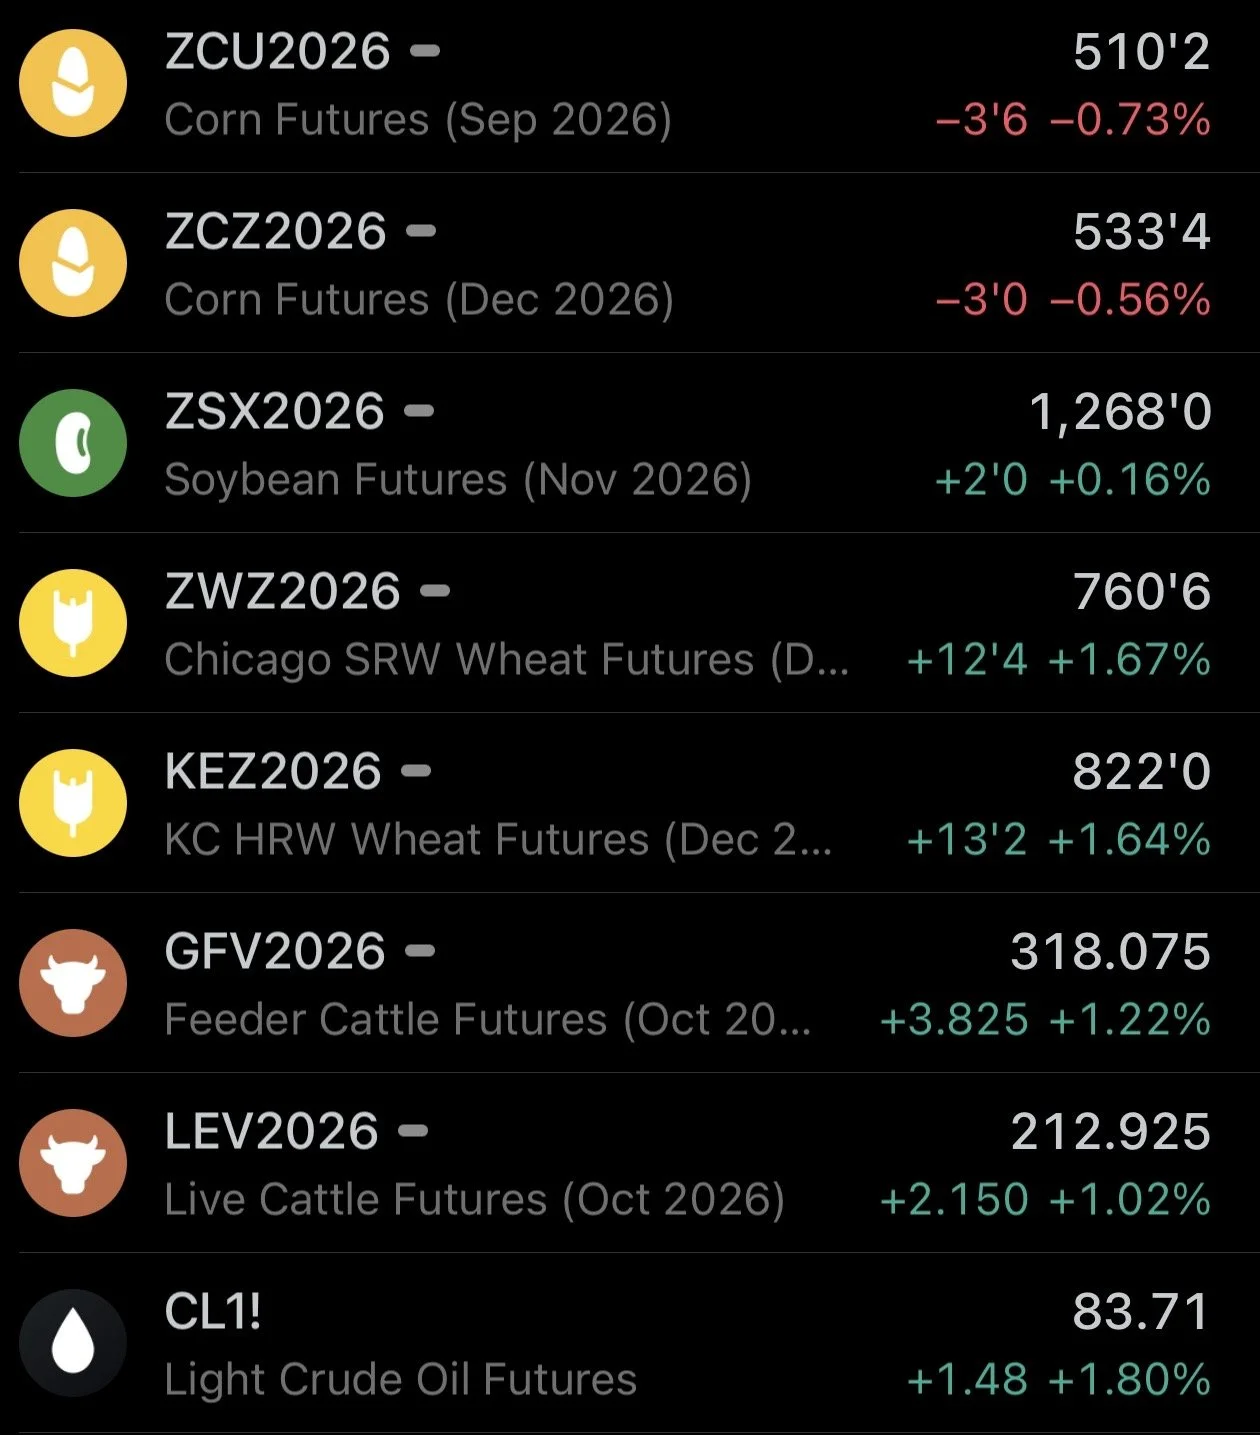
Grains mostly higher led by the wheat market following wheat's limit up day yesterday surrounding escalations over in the Black Sea.
The markets were under pressure overnight, but saw some buying and rallied well off the lows.
Soybeans were down -15 cents but ended the day higher.
Wheat was down around -6 cents but ended up double digits.
Corn was down almost -9 cents but closed down just -3 cents. Posting it's first day lower after 6 straight days of being higher.
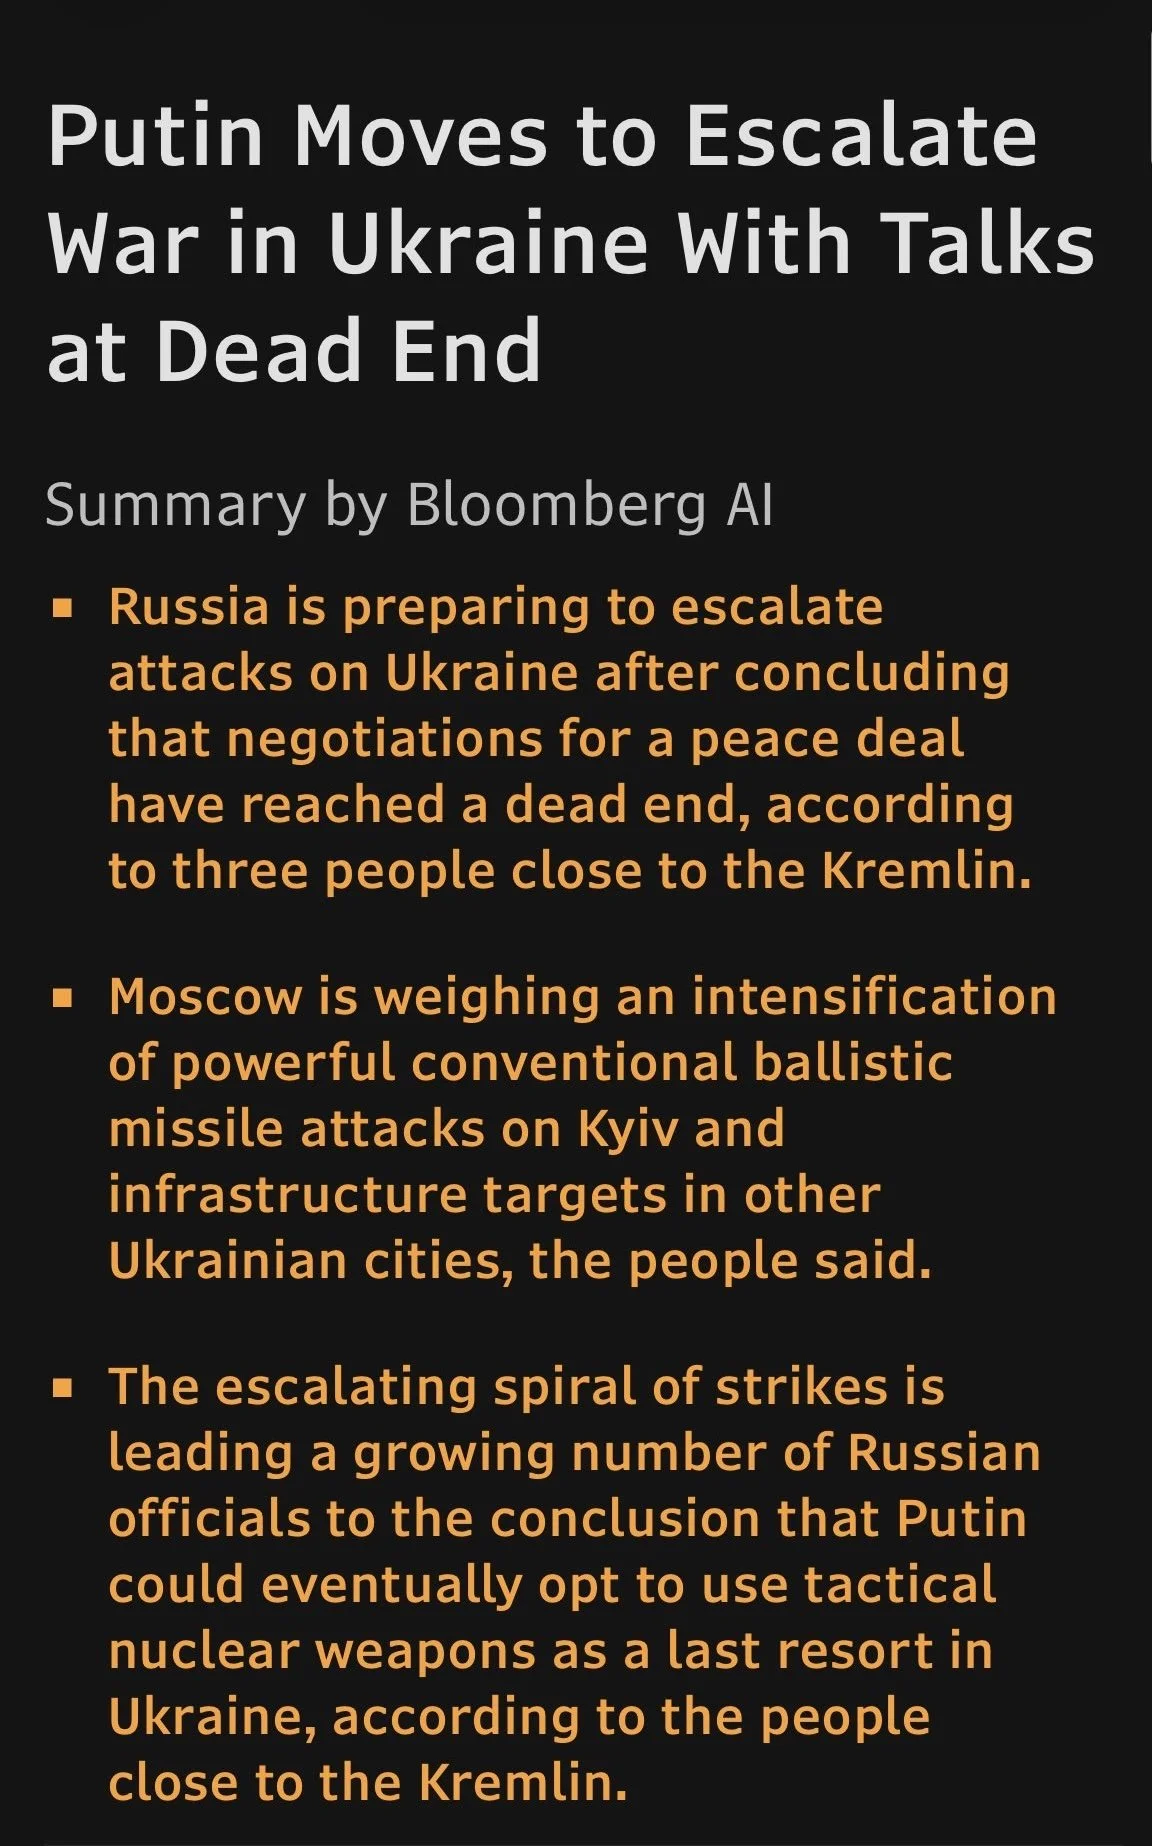
What's going on in the Black Sea?
The Black Sea issue was never resolved as we had been talking about, as it felt like the market was under pricing the risks.
Essentially, that wheat over there still can’t move with the ports being shut down, and there is no sign of any sort of resolution.
Russia and Putin said they are preparing to further escalate attacks on Ukraine
2026 vs 2020 vs 2010
This is the main topic I want to talk about today.
Is it possible to see a repeat of 2020 or 2010?
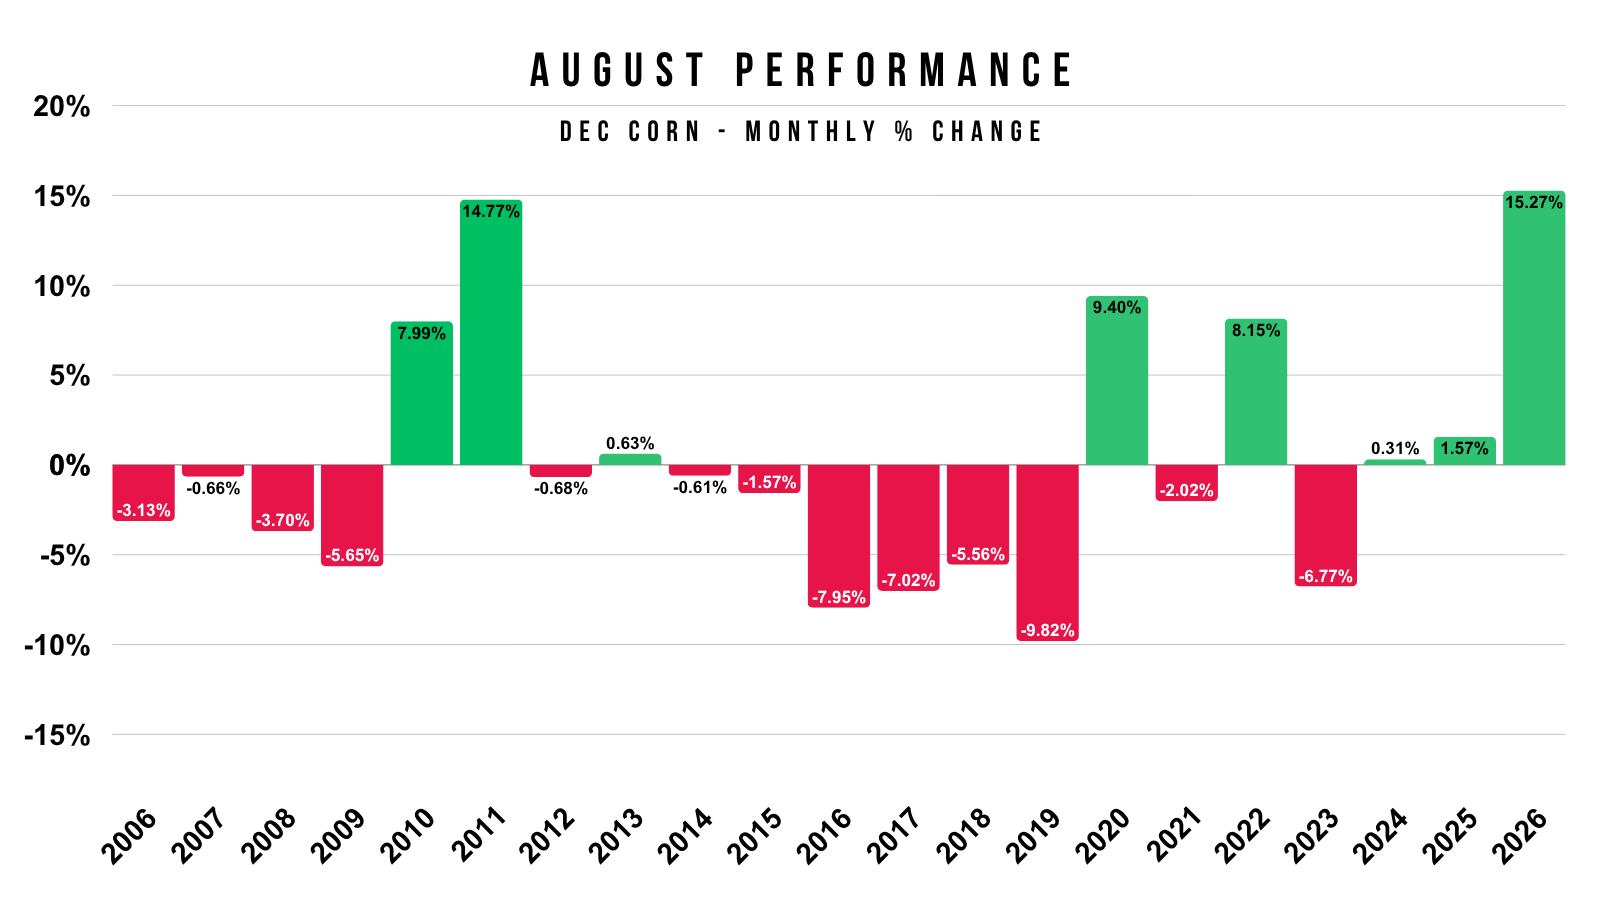
Corn is on track to have it's strongest August of ALL-TIME.
Up +15.3% on the month.
Surpassing 2011's record.
What are the only years we saw similar strength in August?
2022, 2020, 2011, 2010
Two of those were during a bull market. 2022 and 2011.
Two of them came right before a bull market. 2020 and 2010.
Which brings me to my next point of discussion..
Now let's get into some other data.
I've shown this chart recently.
Corn has only posted it's highs in August or later a few times.
2011 and 2012 both topped in August. That's the only two year's we've ever seen our highs in August.
We have never seen our highs printed in September or October.
2010 and 2020's highs came in November at the end of the year. As they simply ran the rest of the year.
What happened after both 2010 and 2020?
We saw a bull market.
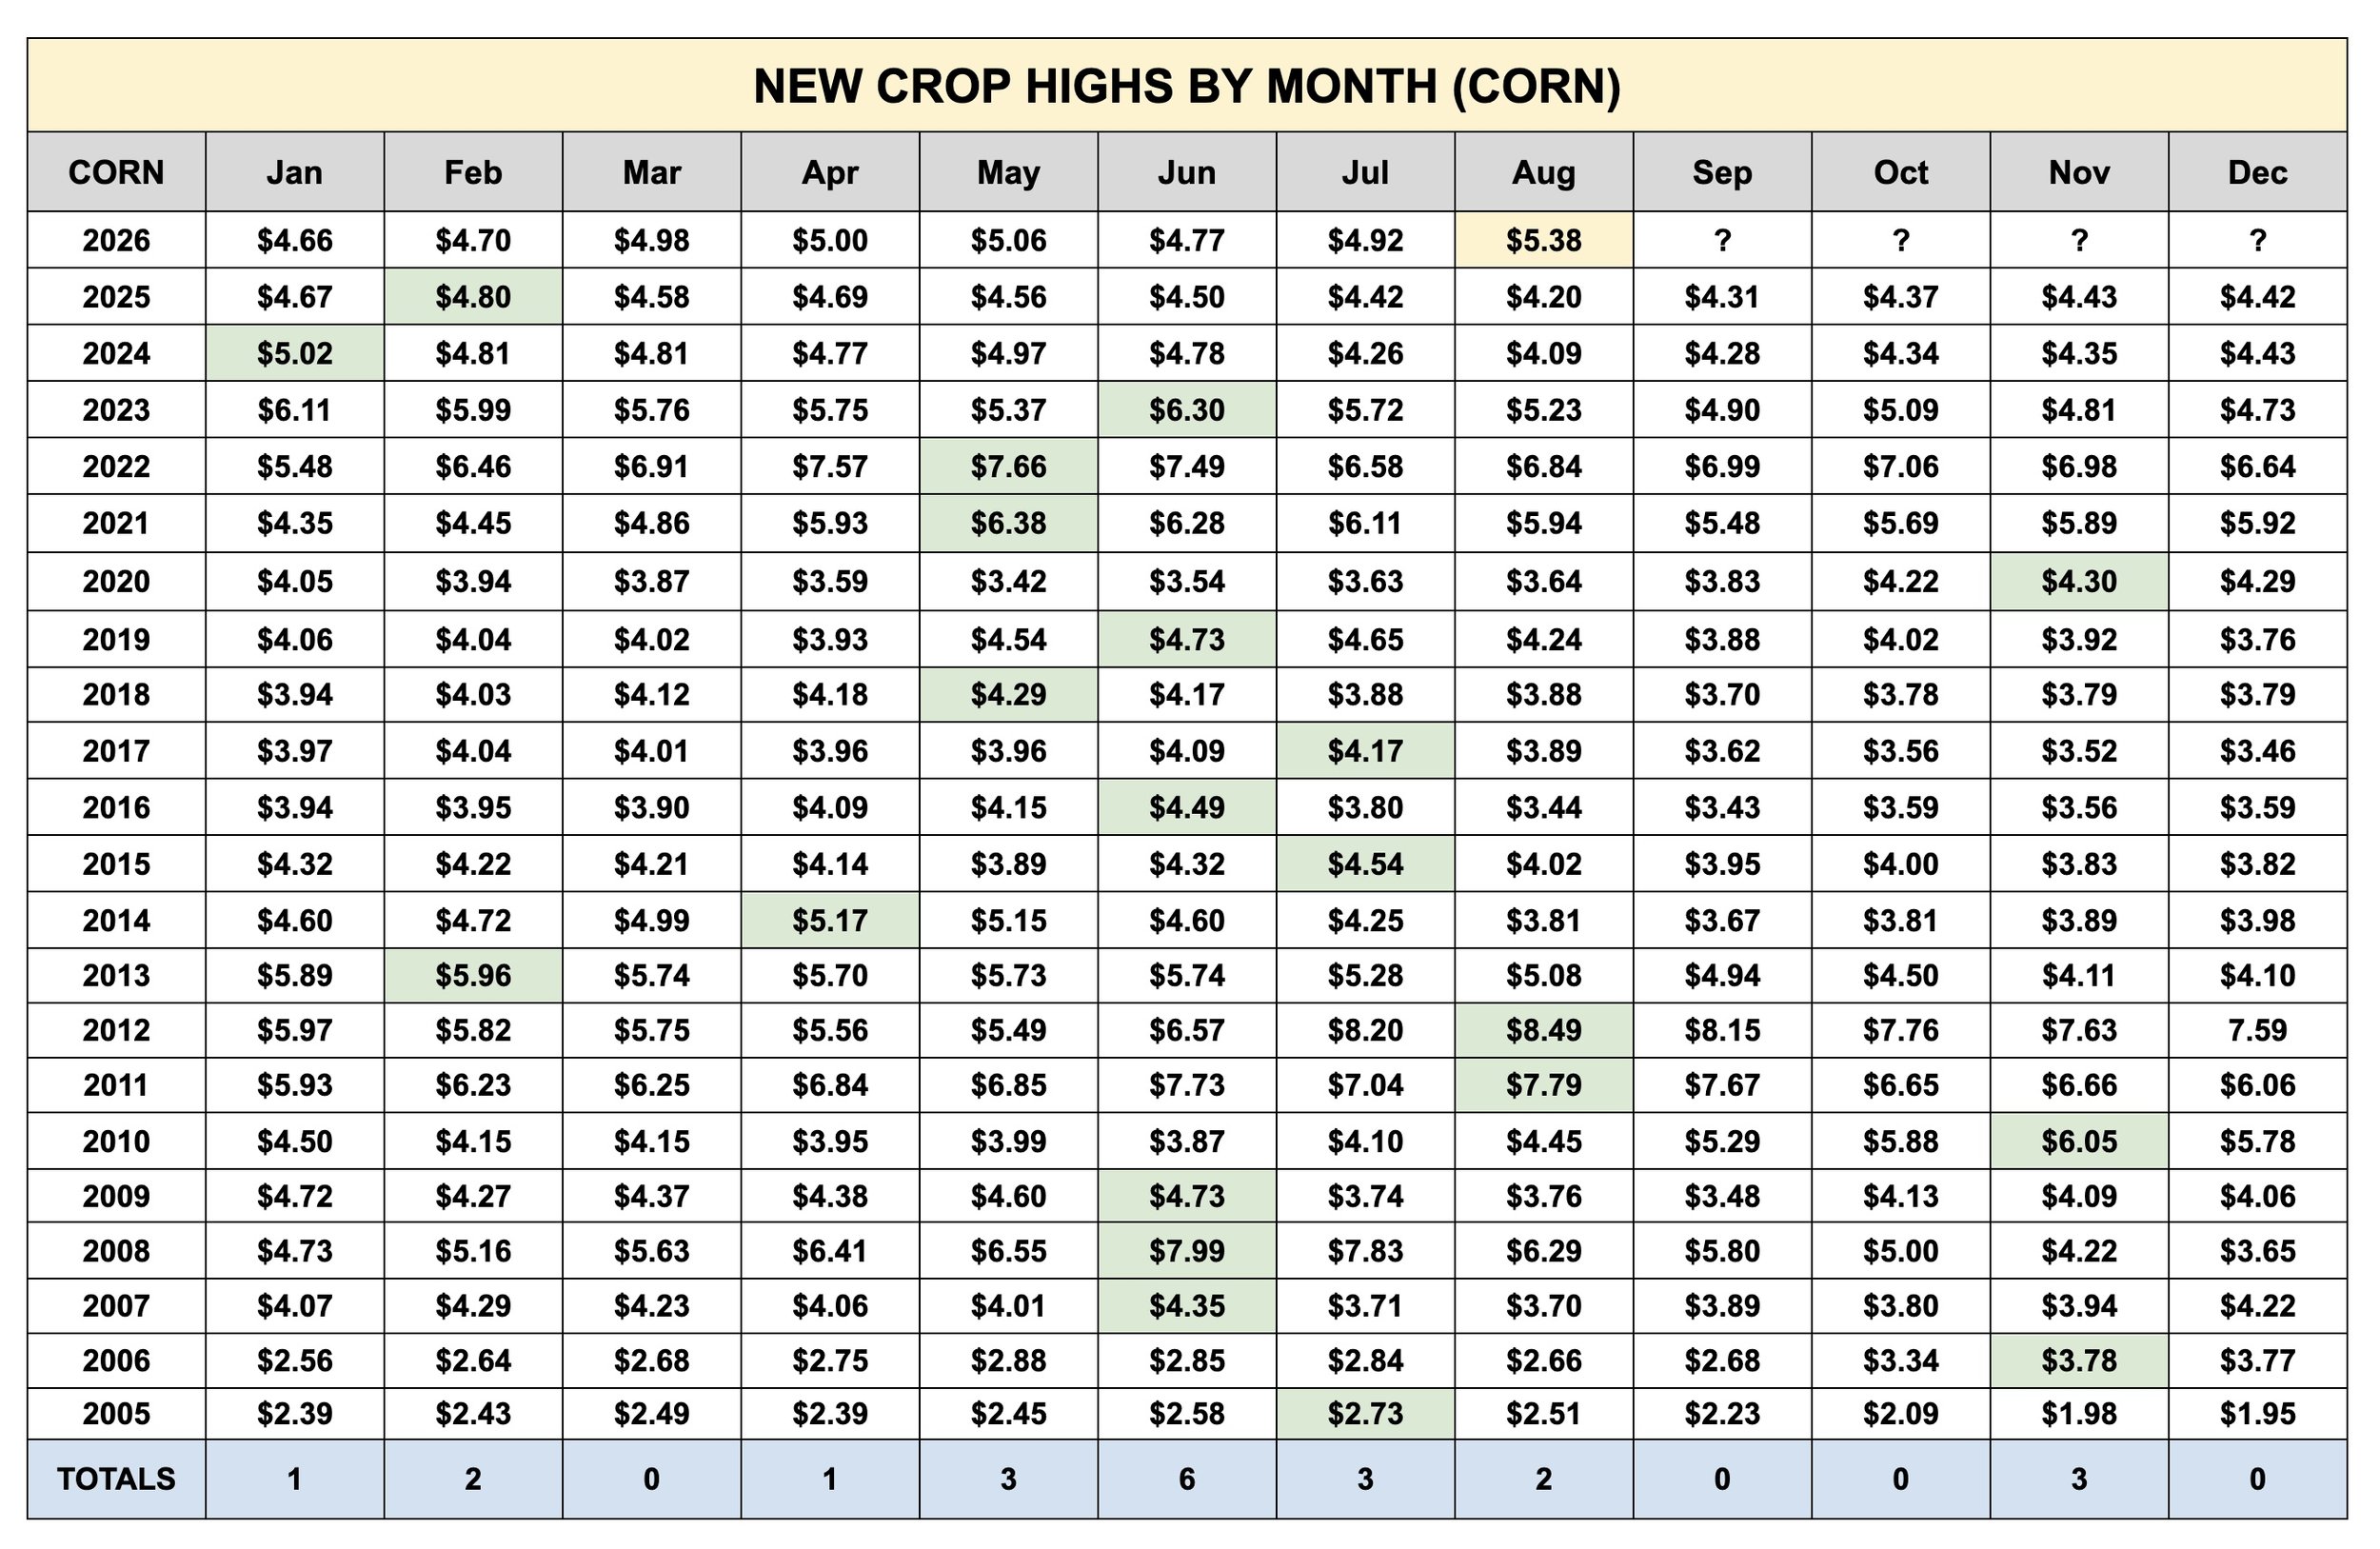
So we have four years that featured a high in August or later.
2020, 2012, 2011, and 2010.
Which year does this more closely resemble?
I'd argue this year is a lot more similar to 2010 and 2020.
In 2011 and 2012, we were already in a bull market
2020 and 2010 were in a bear market and then started the bull market.
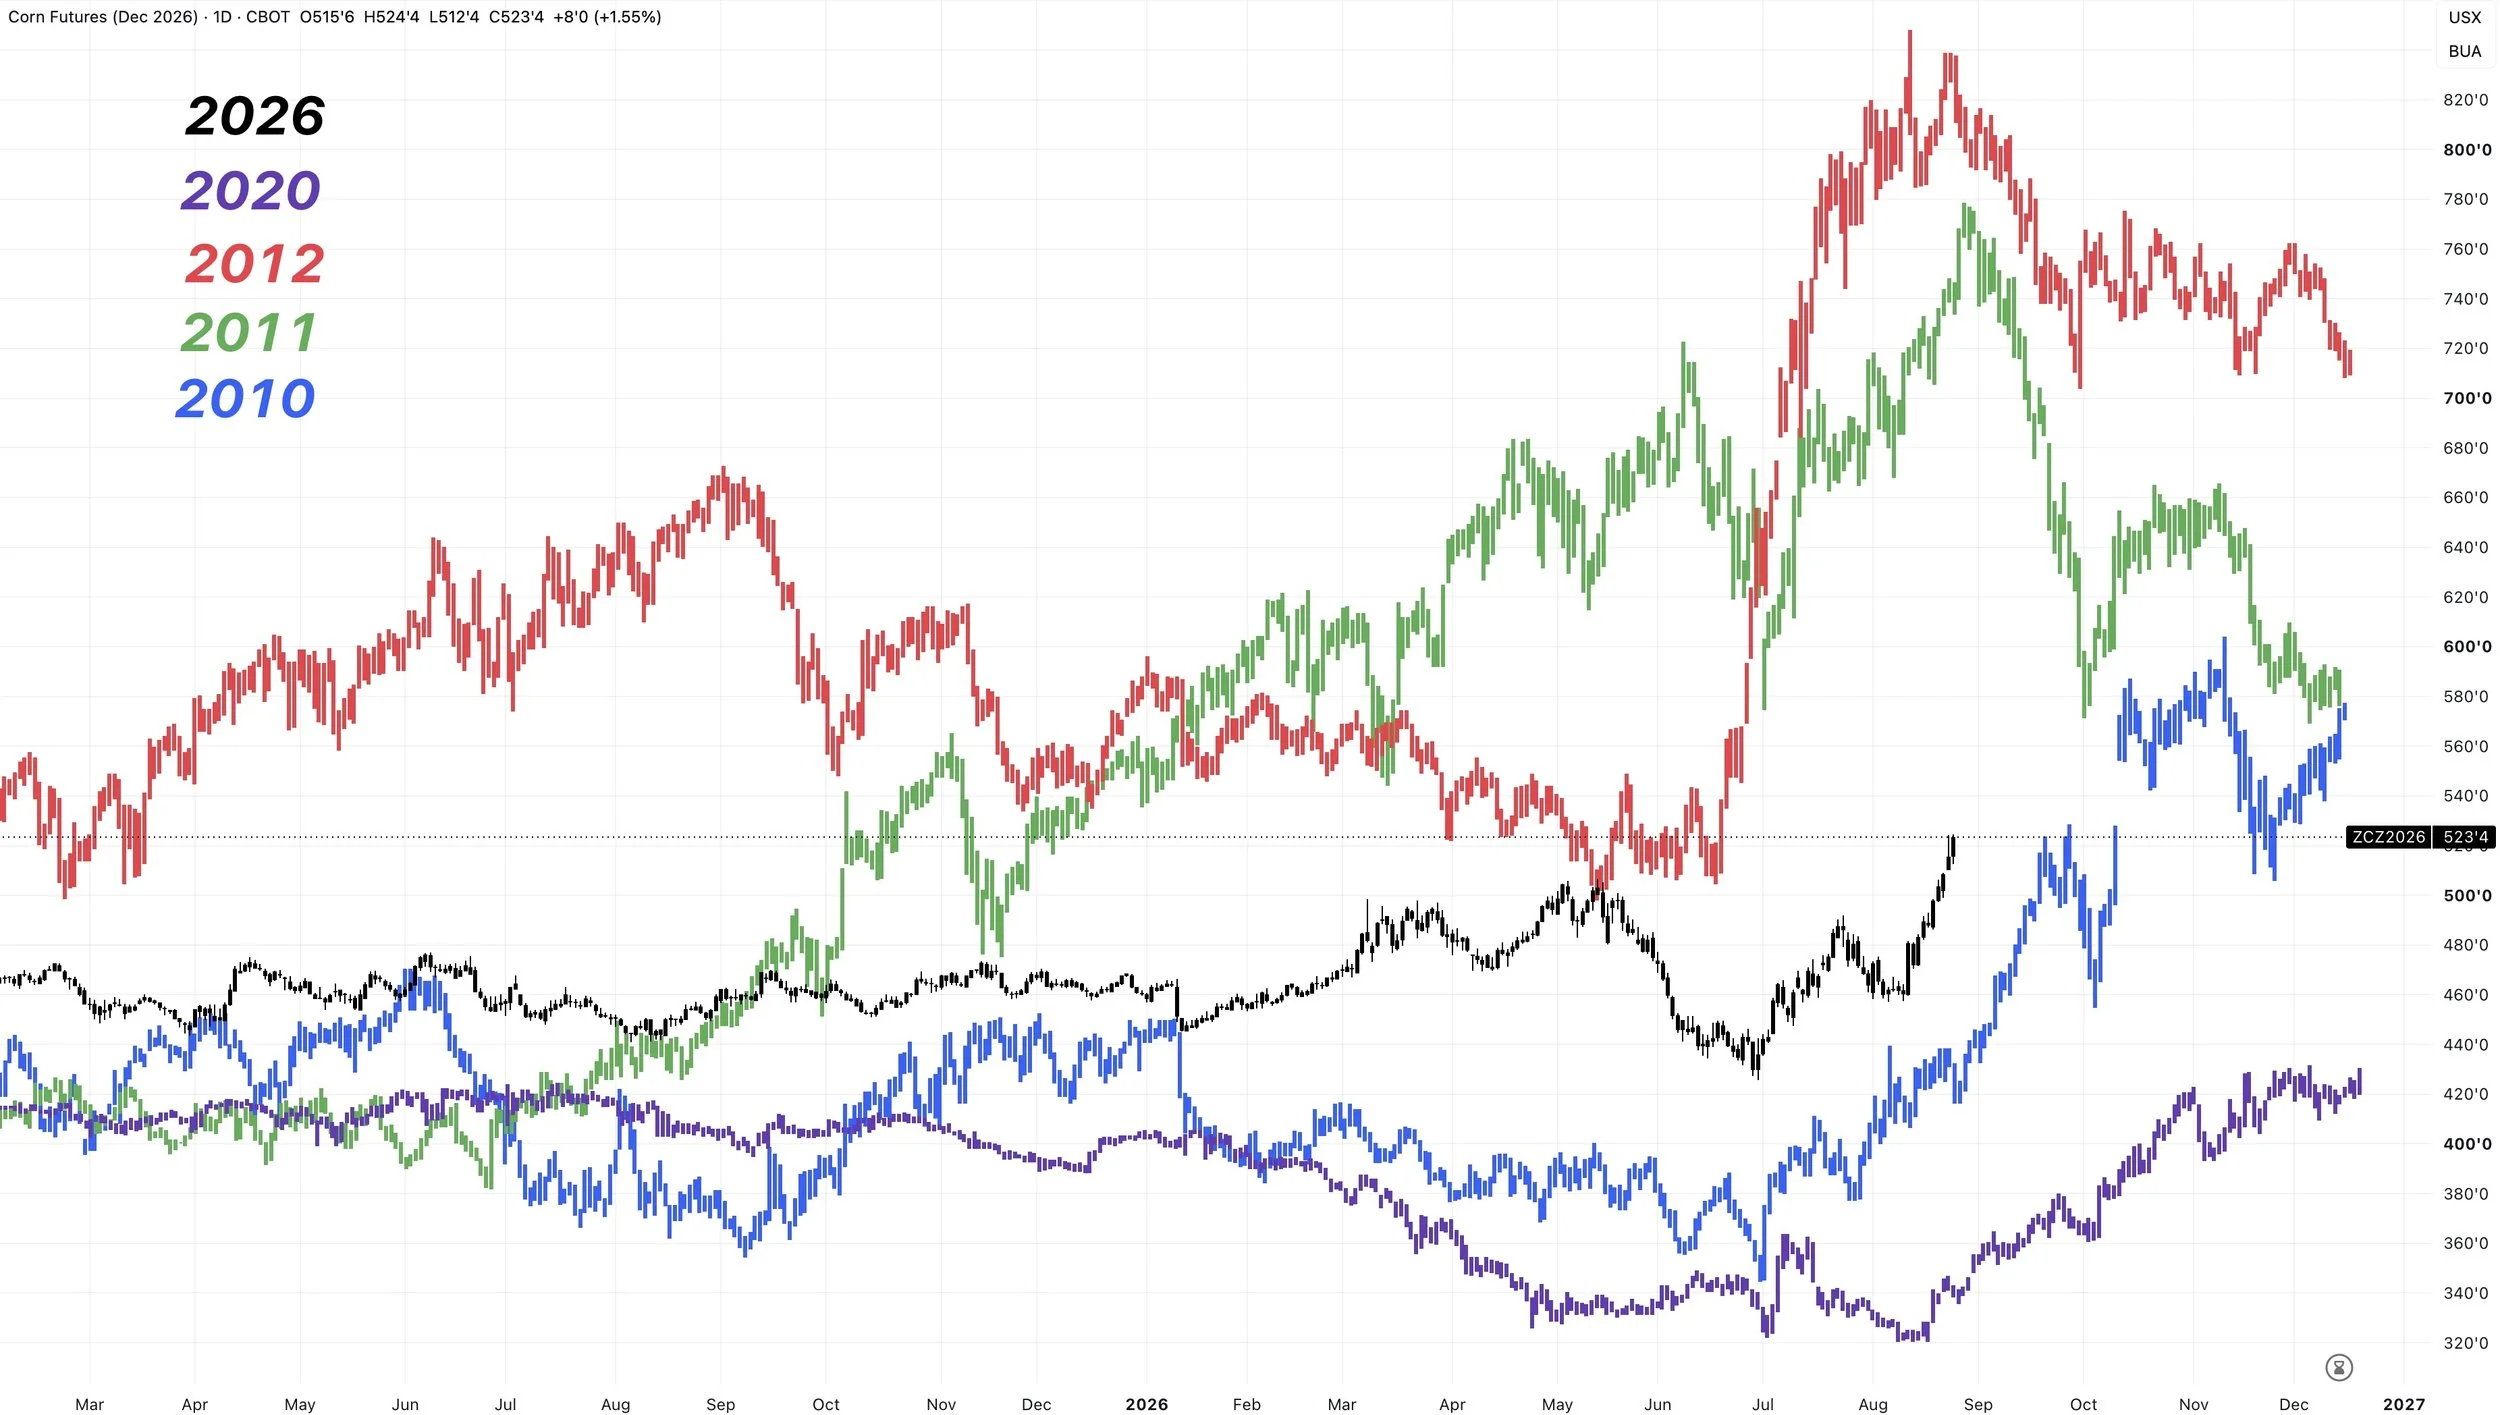
Here is chart comparision of Dec corn for 2026, 2020, and 2010.
Very similar price action.
We bottomed right around that USDA report at the end of June in all three years.
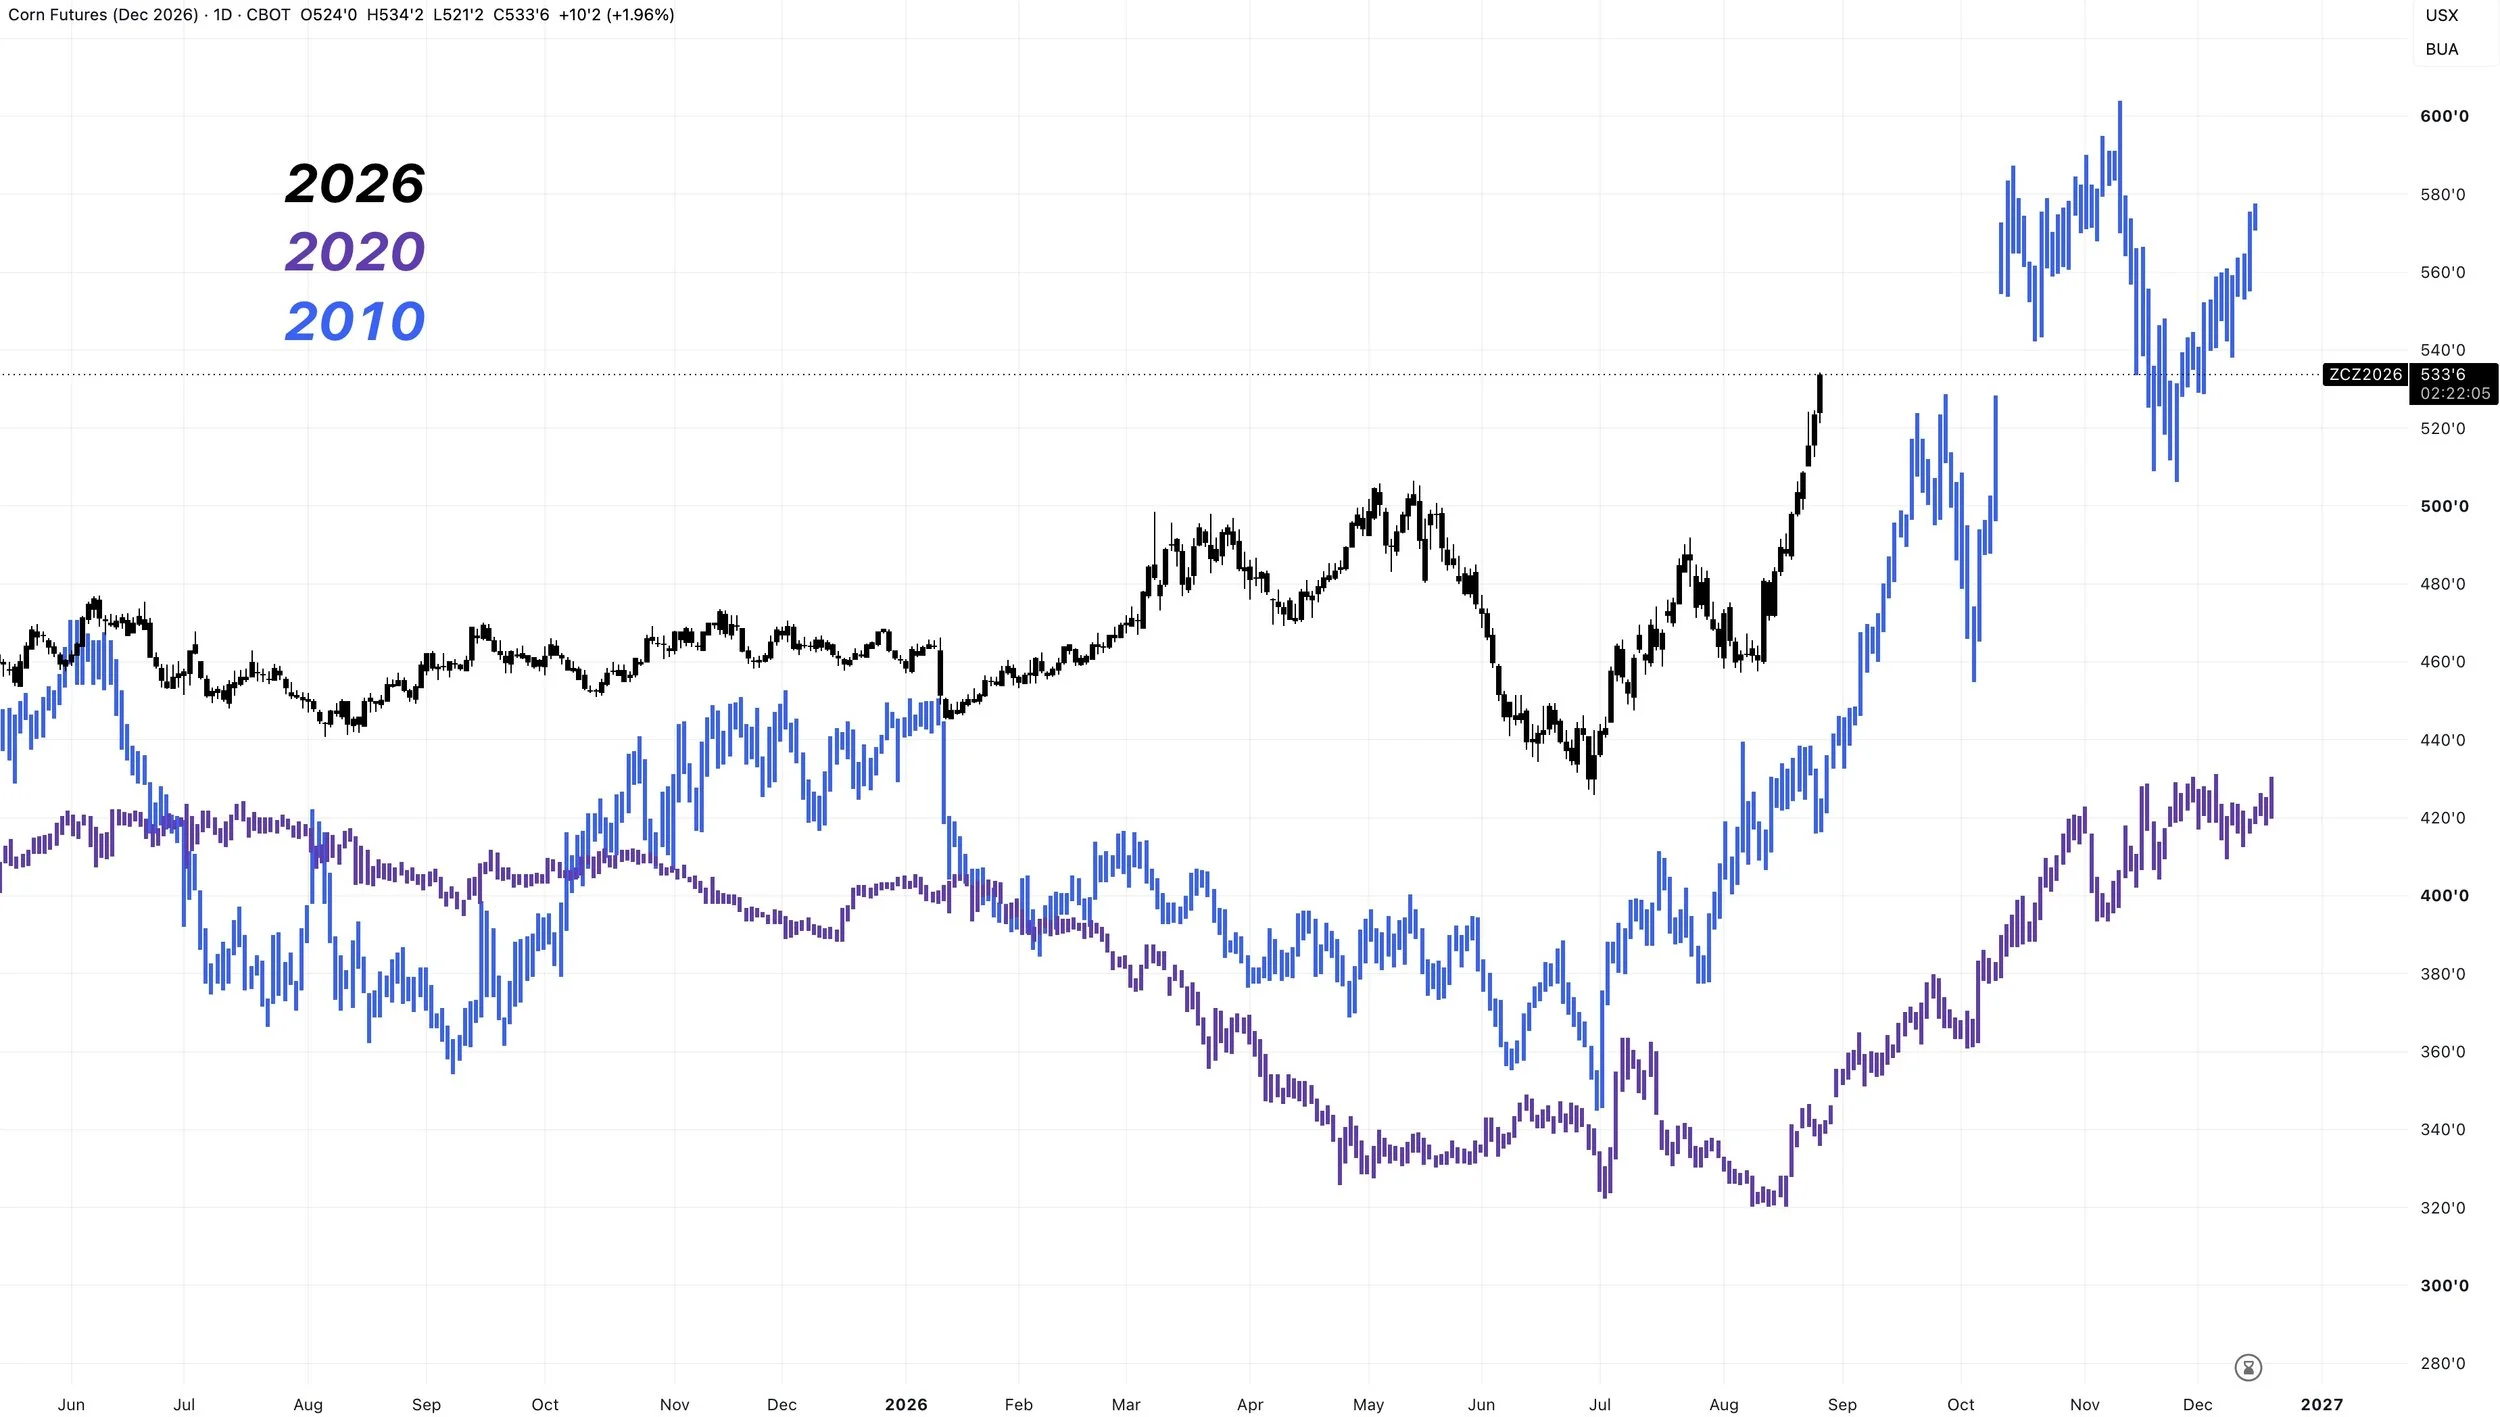
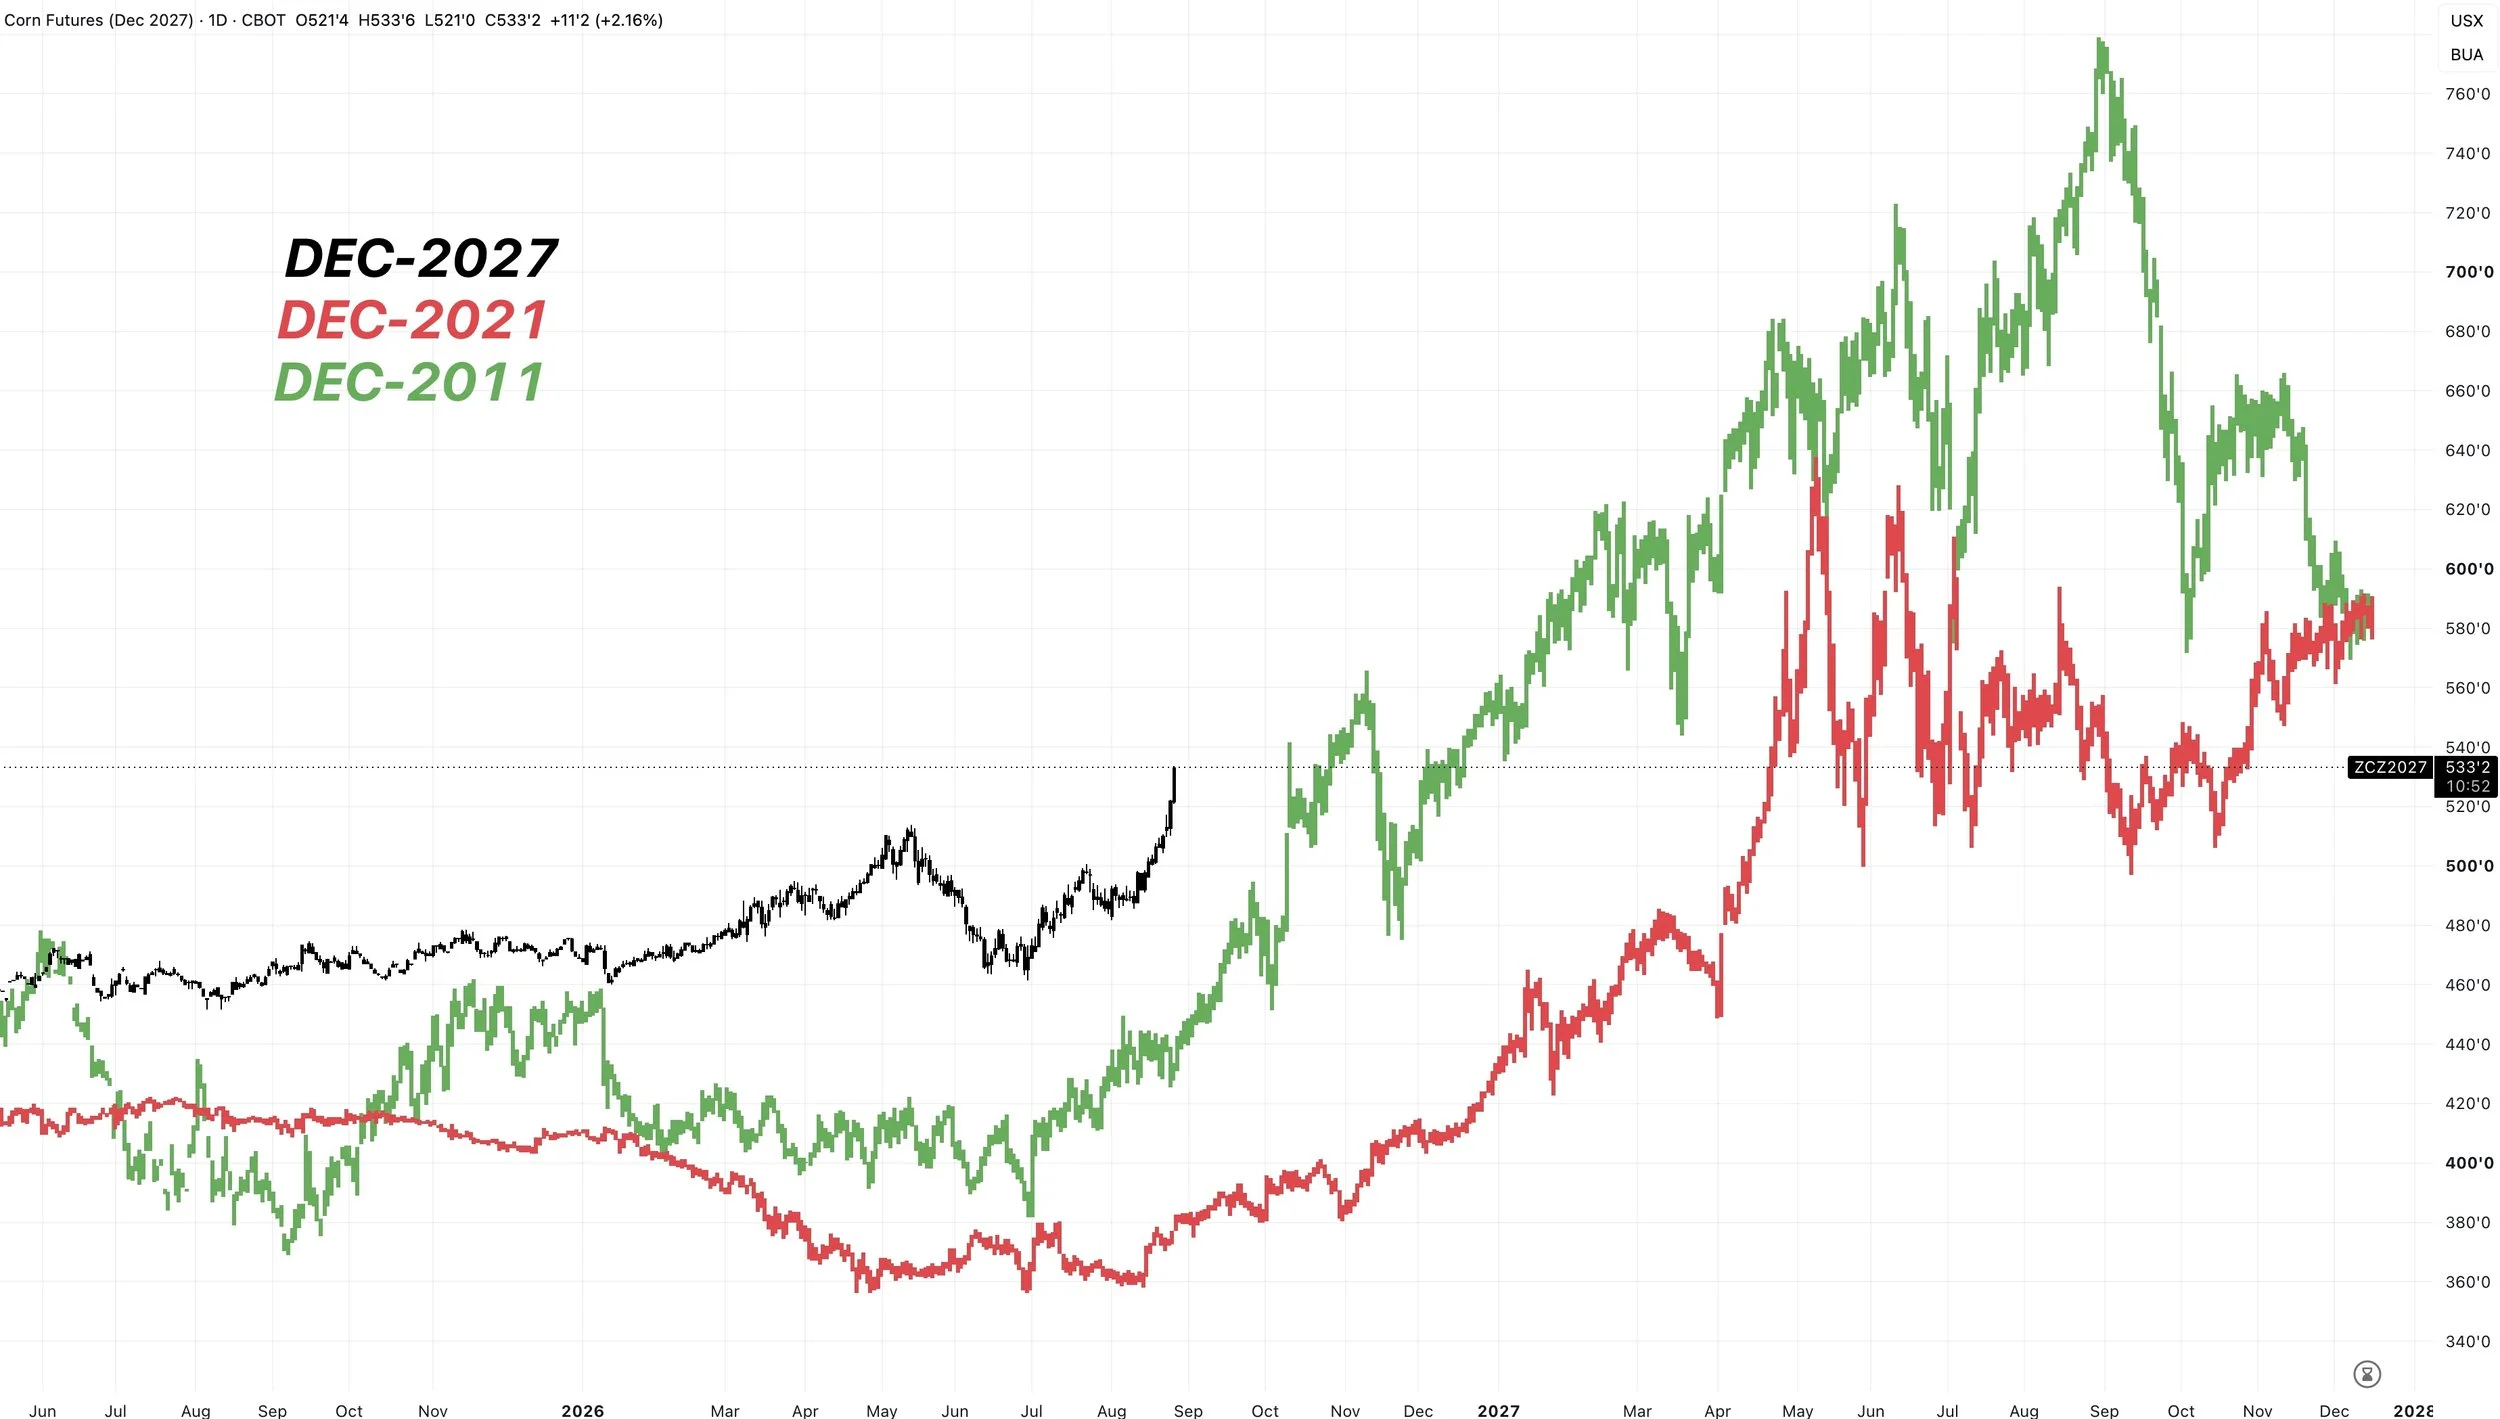
To give you a better visual representation of what happened after those years.
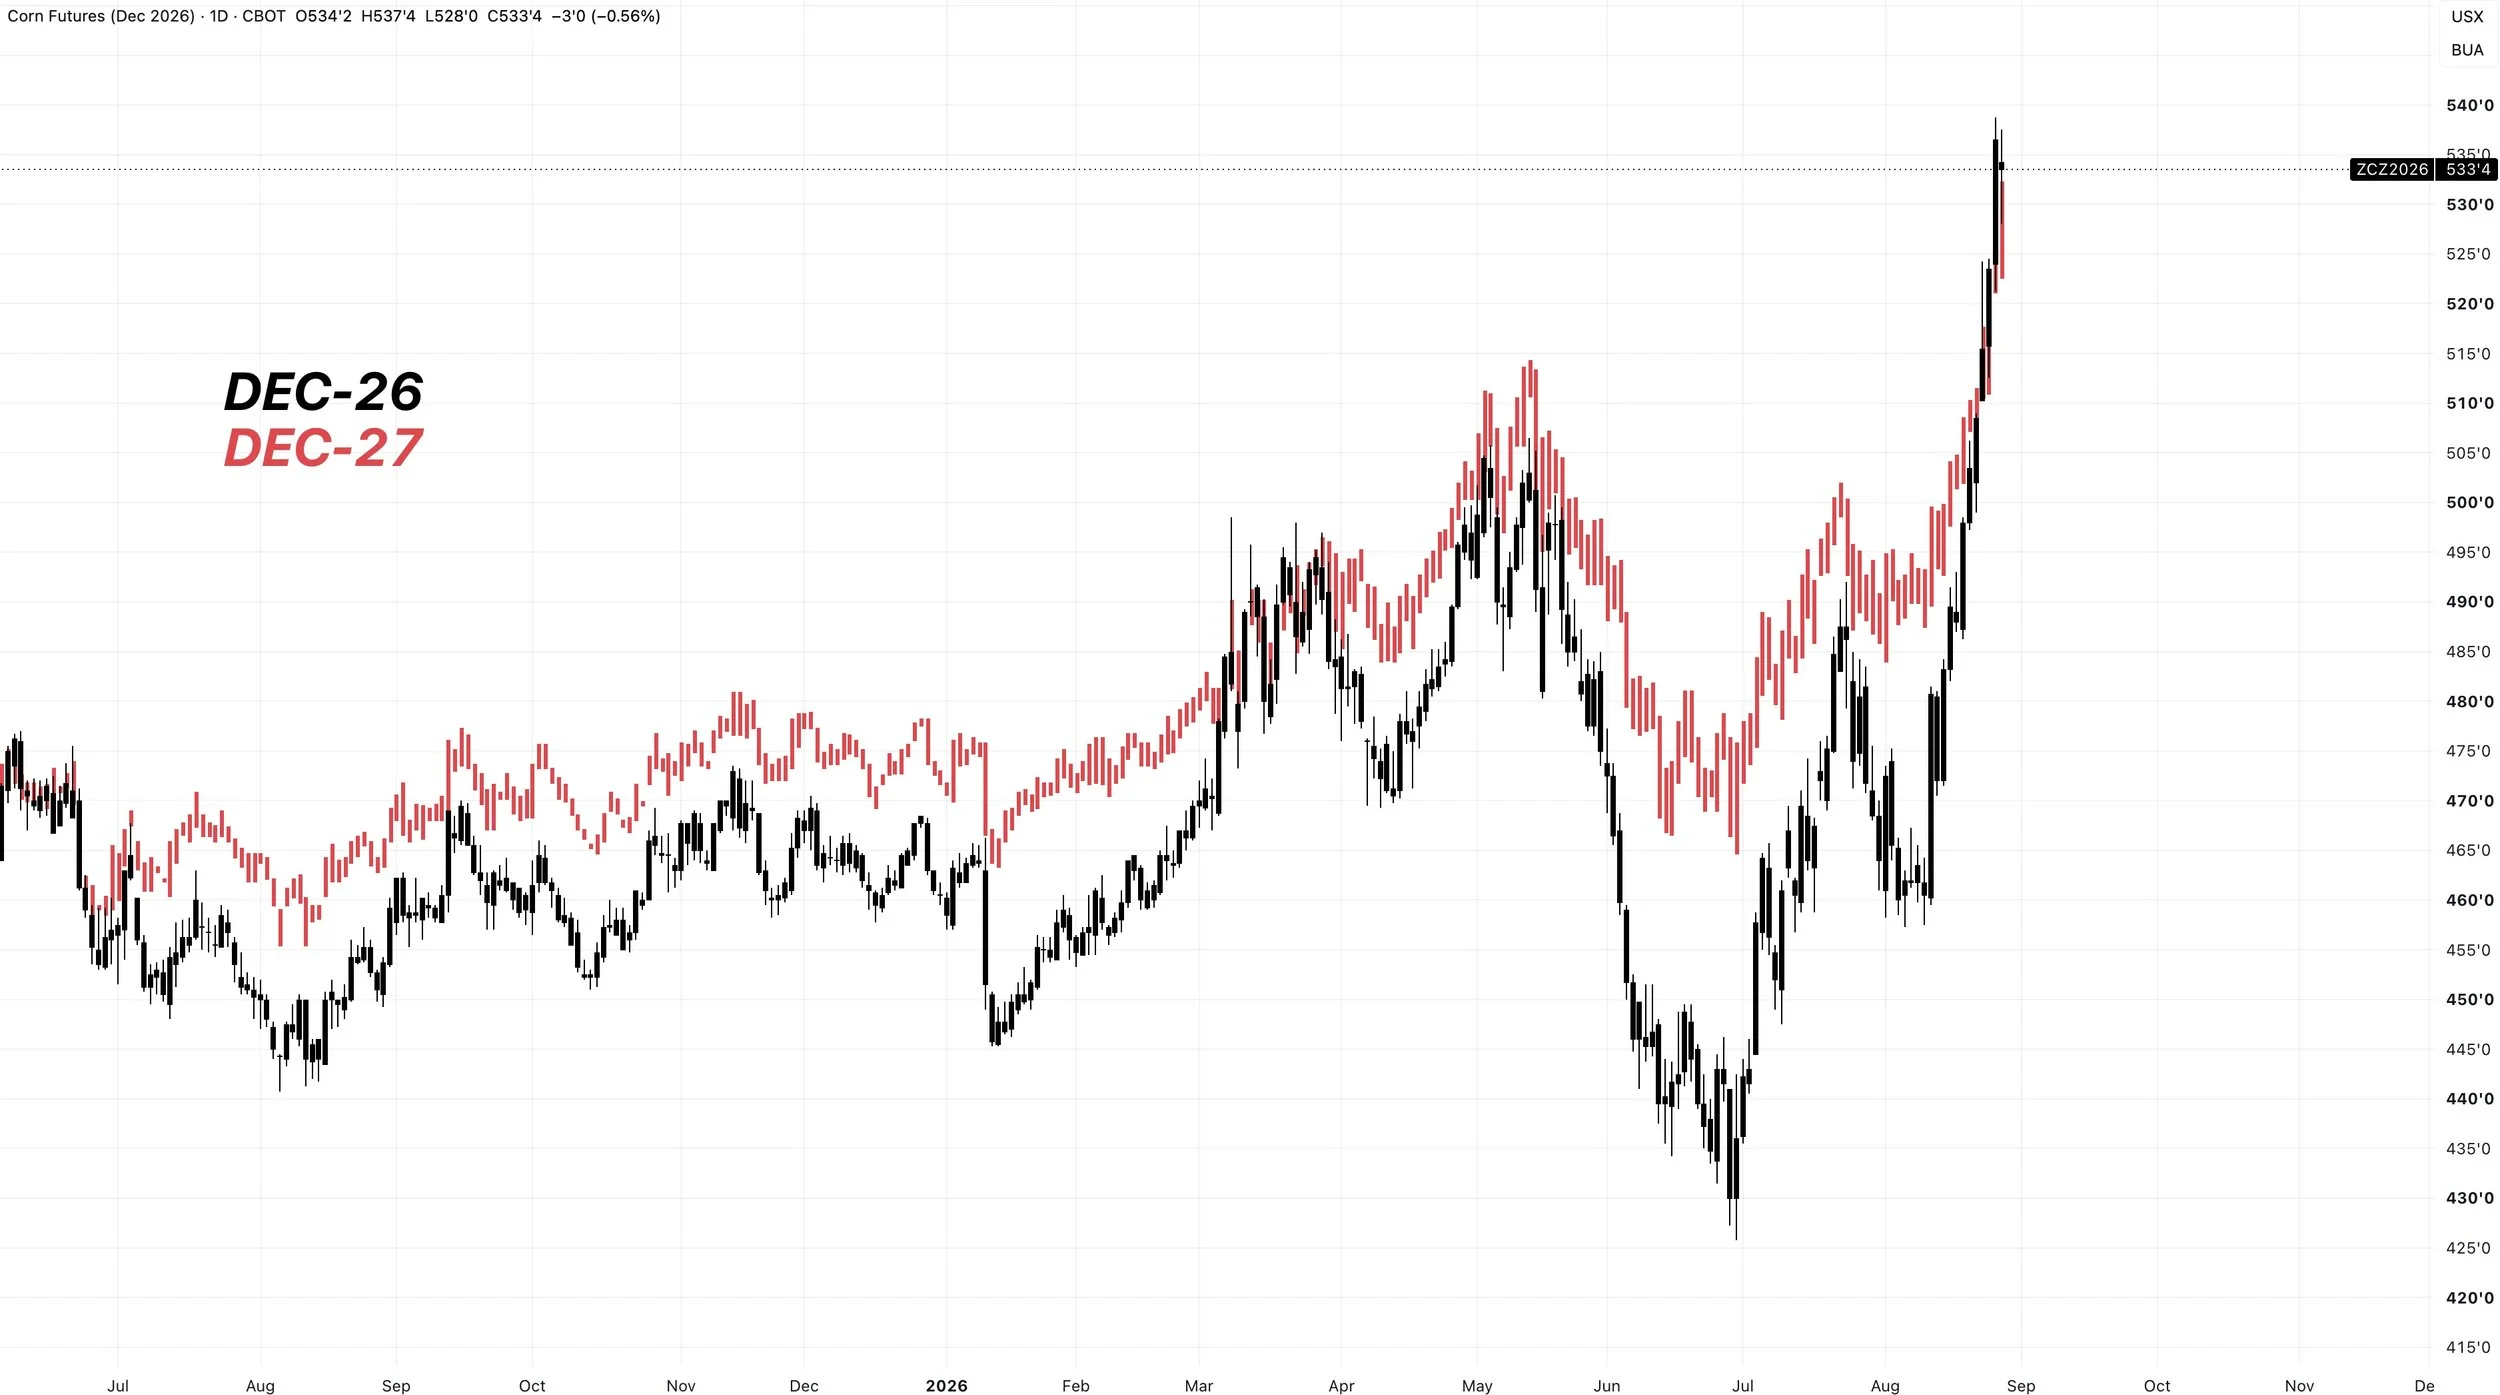
Here is Dec-27 vs Dec-21 and Dec-11.
Does this mean we "have" to see a repeat of 2010 or 2020? No.
But there are several friendly things going for the corn market, and definitely some similarities to those years.
Quick Bull Cases
Fundamentally, there is plenty of potential as we've went over countless times.
We've already talked about the majority of this before, but let's go through it quick.
Corn: Bull Case
Yield:
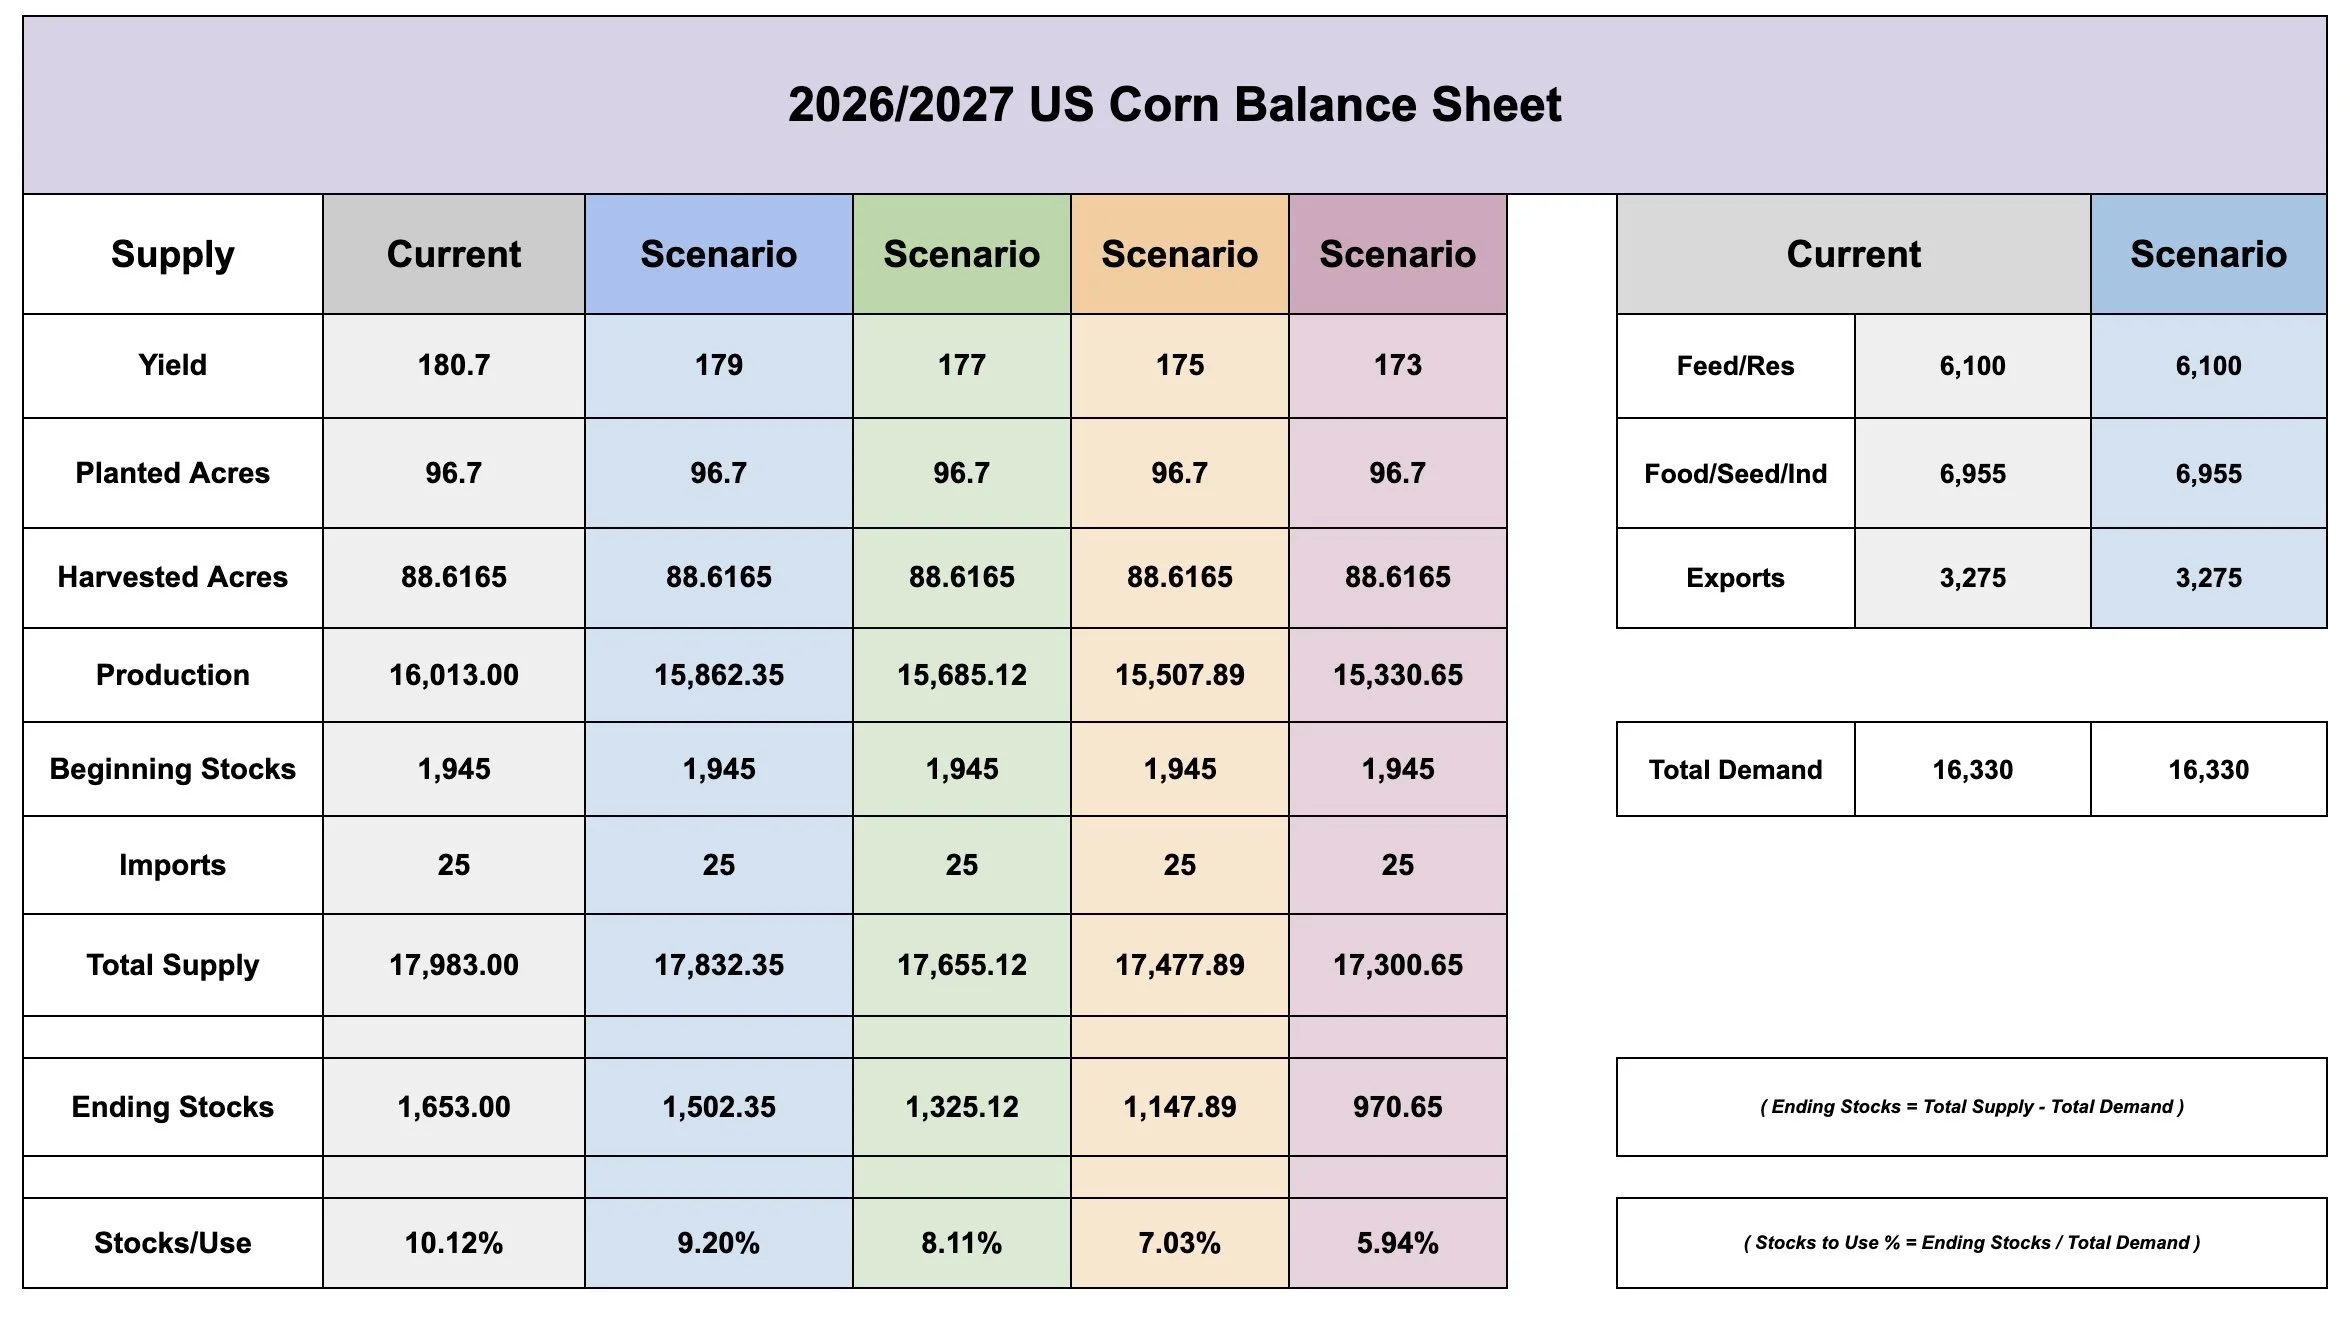
For starters, corn simply can’t afford a sub 180 yield without the balance sheet getting awfully tight.
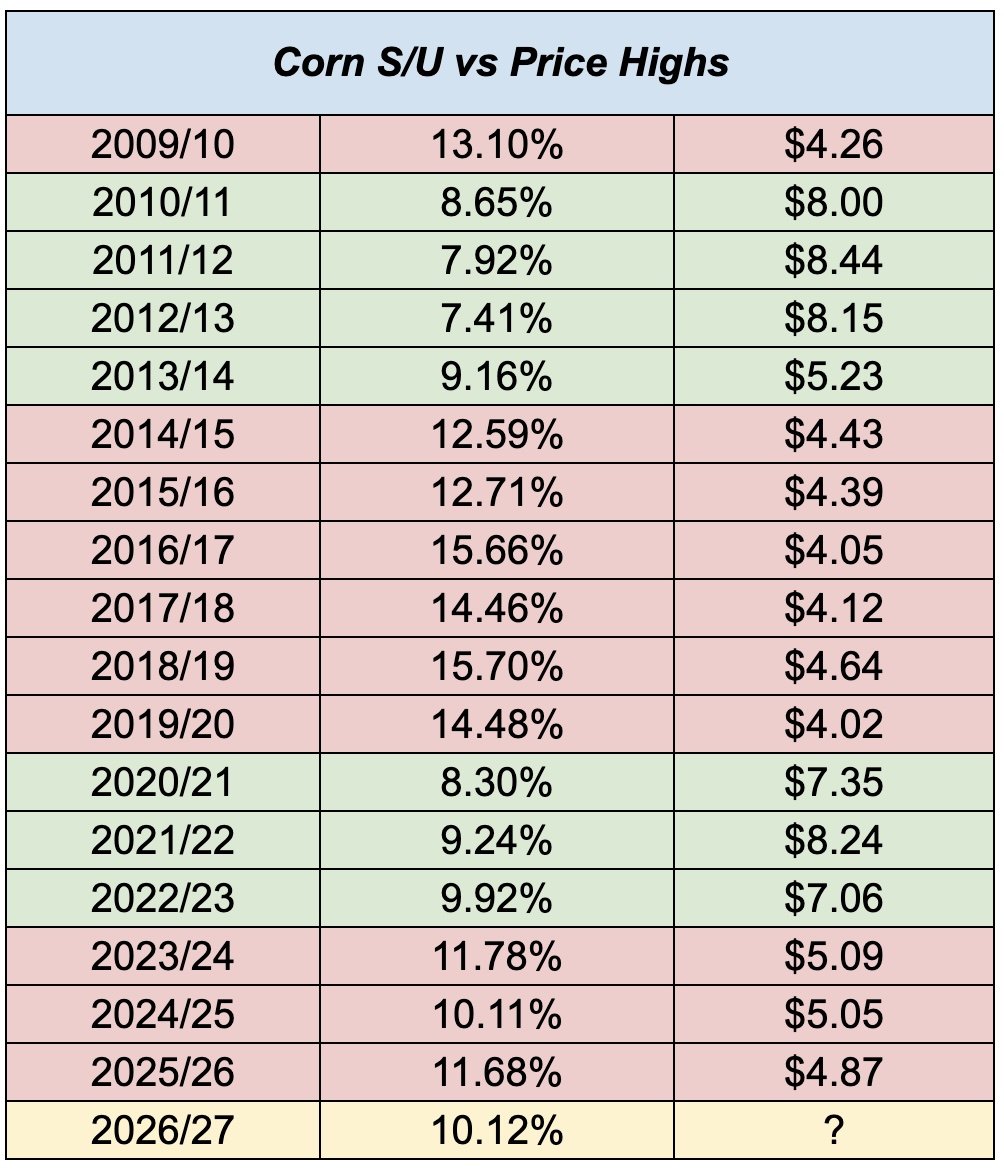
As it's already sitting on the verge of bullish territory at a 10% stocks to use.
Stocks to Use:
Anything in that 8-9% range is usually associated with a lot higher prices.
What if the stocks use stays around 10%?
Well then corn is probably fairly priced around this $5.00 or so range. Take 2024/25 as an example.
Pro Farmer vs USDA:
We went over this earlier this week, but if you look at the history of the Pro Farmer and USDA data correlation, it would suggest yield is lower.
Pro Farmer has correctly predicted where yield went from August to the final in the last 10 of 12 years.
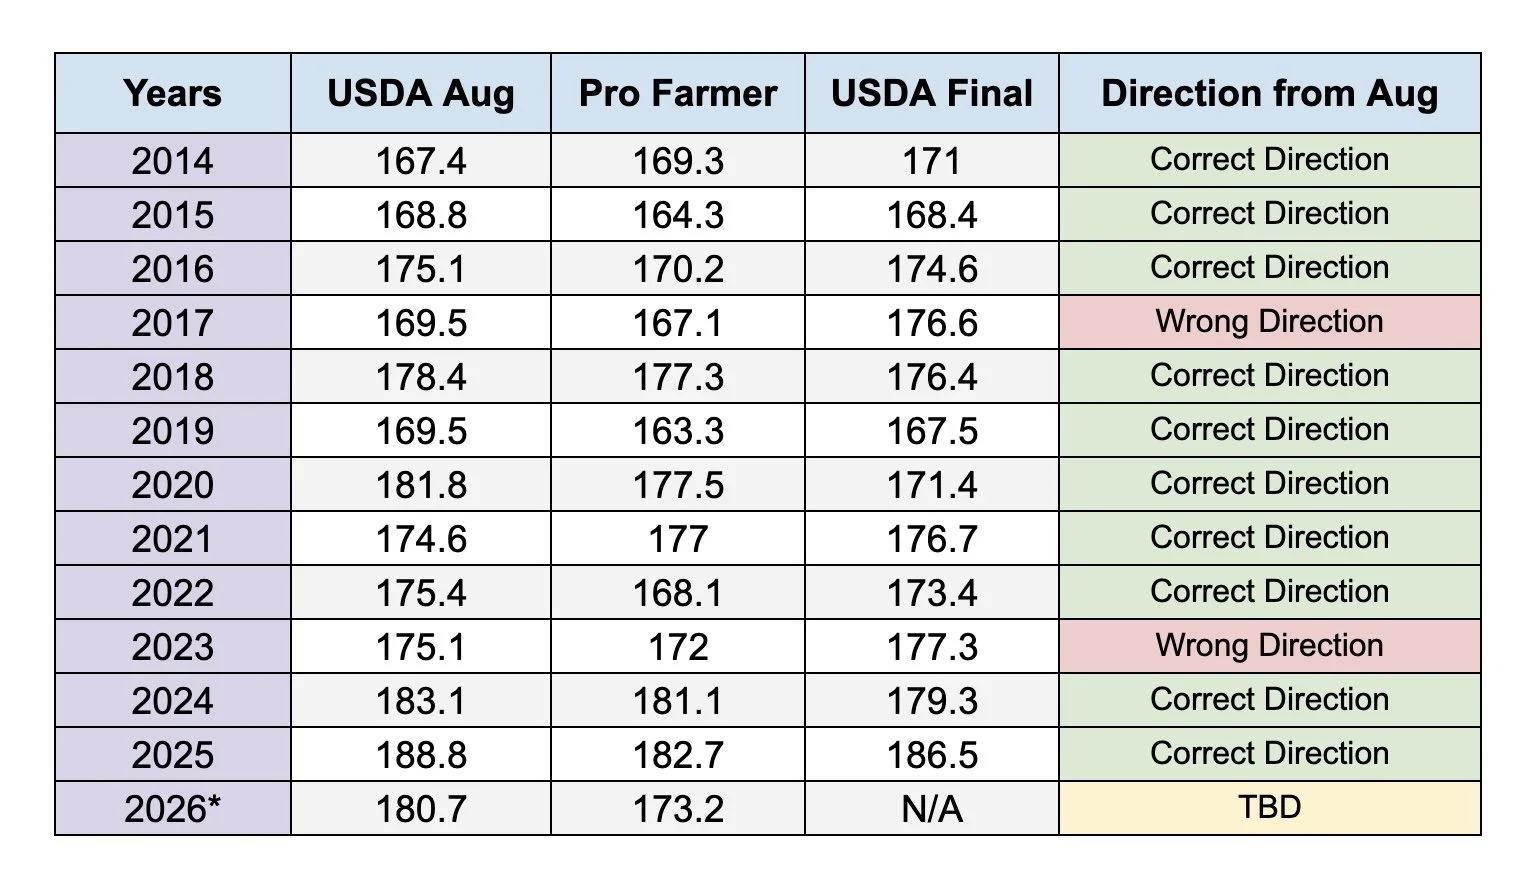
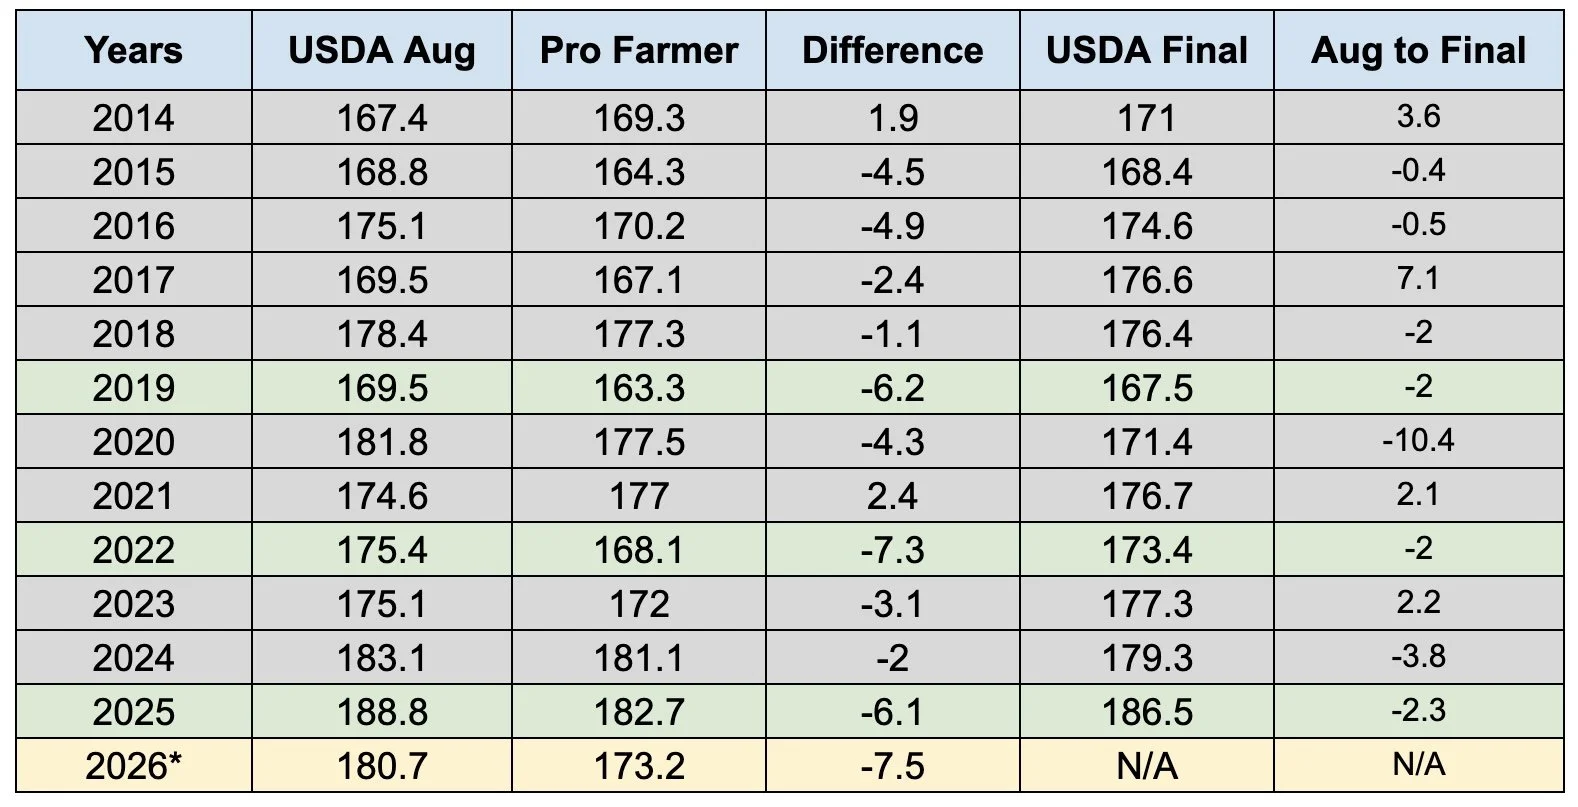
Pro Farmer's 173 yield was -7.5 bpa below the USDA's August estimate of 180.7
That would be the largest difference between the two ever.
We've only seen the tour come in 5 bpa below the USDA in three years.
2019, 2022, and 2025.
In all three of those years, the USDA lowered yield from August by at least -2 bpa.
Based on all of the data, it would suggest a yield lower than the USDA but not quiet as low as Pro Farmer.
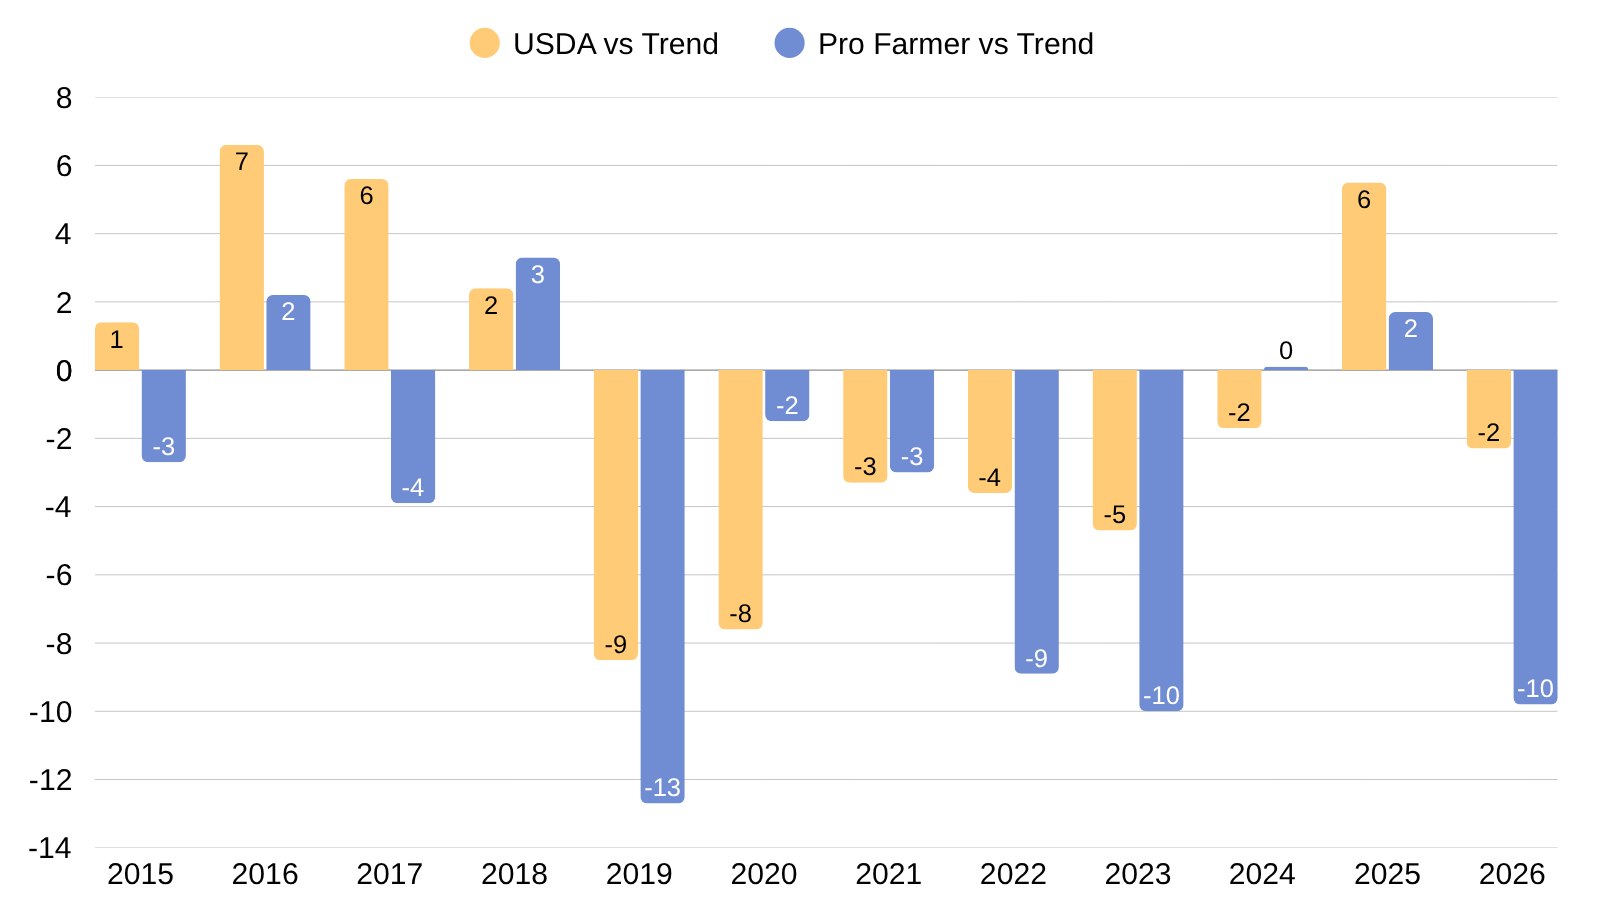
Here is another good way to look at it.
This chart shows the USDA's final yield deviation from trend along with how Pro Farmer's yield deviated from the USDA's trend.
Pro Farmer tends to get the direction right, but tend to slightly over shoot things to the downside.
Soybeans Bull Case:
Soybeans had recently been lagging corn due to some biofuel headlines as well as the ideas about the crop being big.
We've already talked about most of these possibilities before, so again, there isn’t much new here. It's the same stuff we've talked about before.
Brazil:
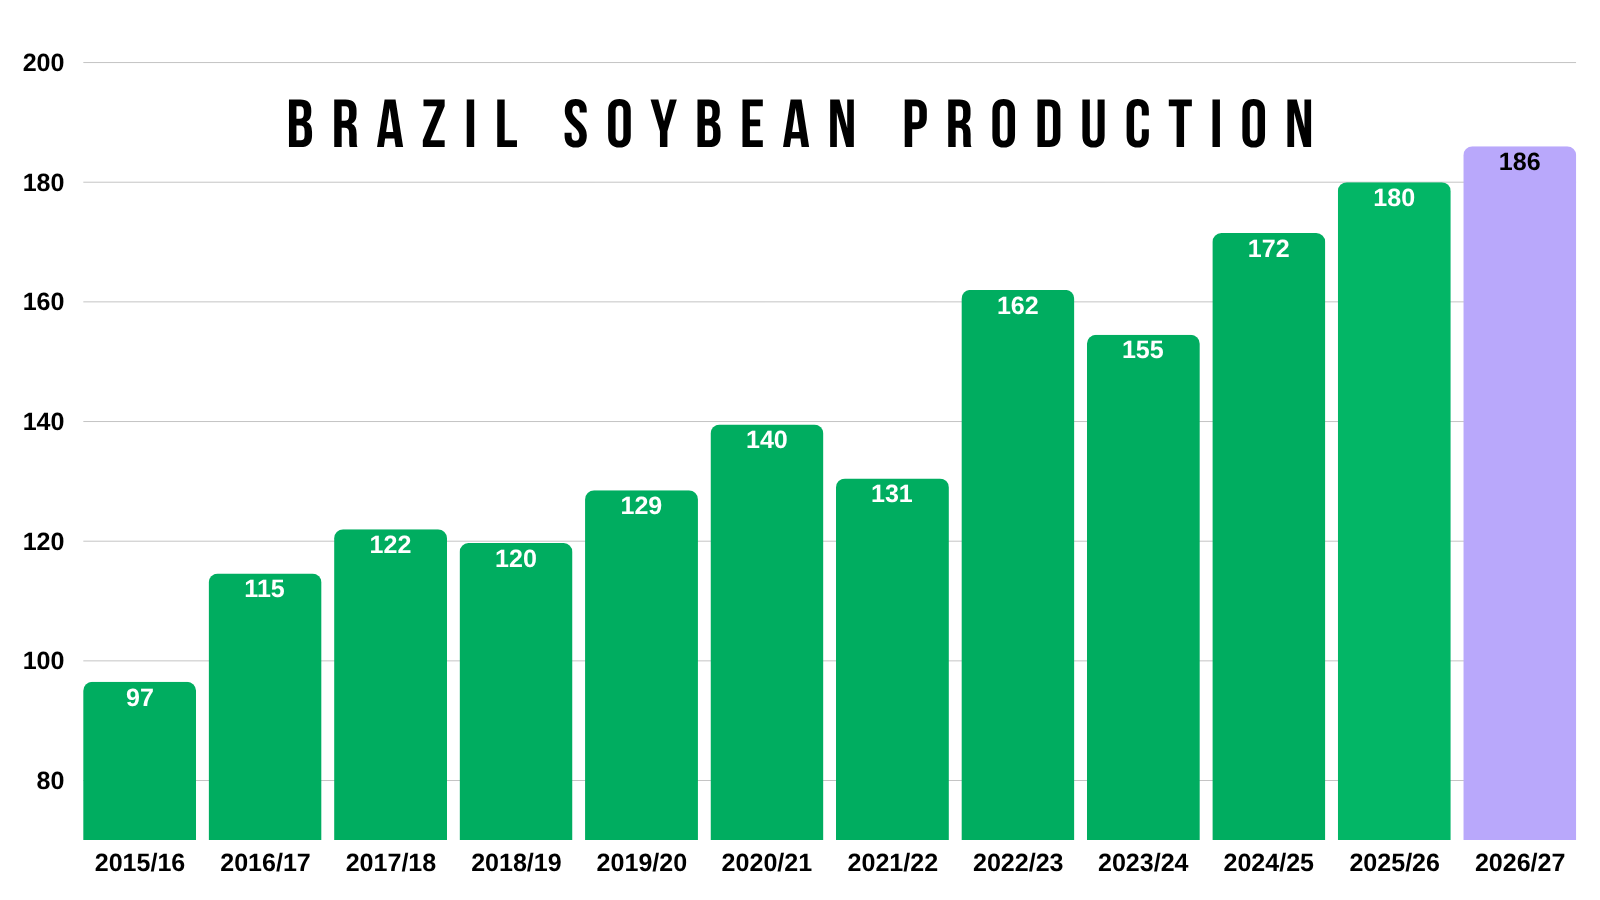
Brazil has consistently been pumping out record crop after record crop.
Tight World Story:
Yet.. that's not enough to add to the world balance sheet.
It continues to shrink. Despite a projected big crop in the US and the record crops in Brazil.
That's not bearish.
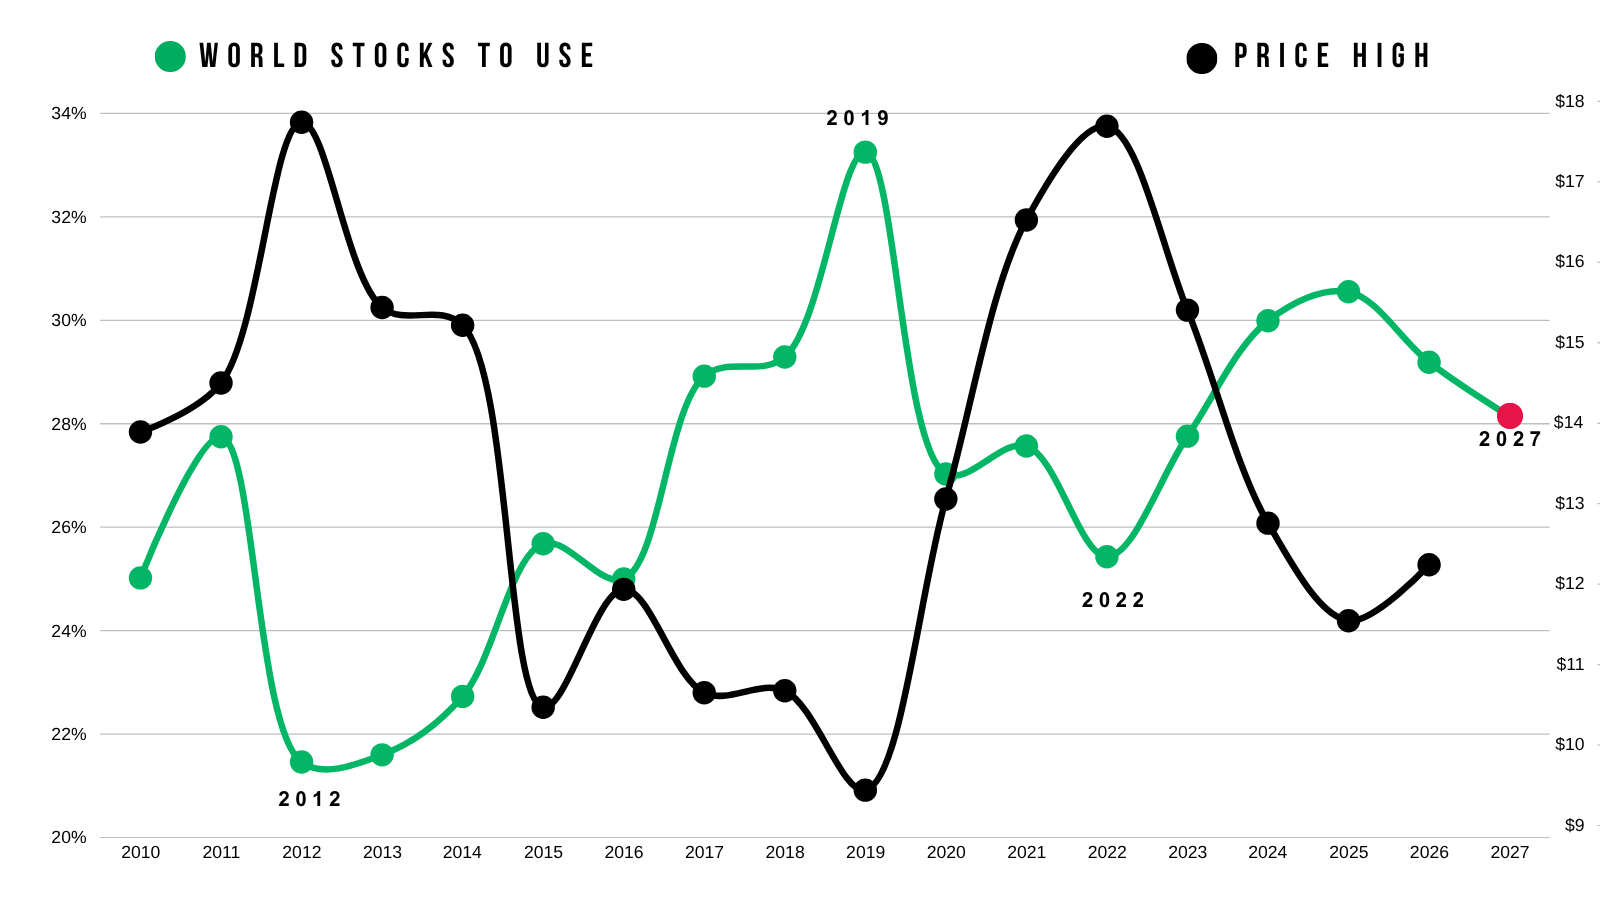
The world situation has a very high correlation to soybean prices.
Prime Examples:
2012: Low S/U and high prices
2019: High S/U and low prices
2022: Low S/U and high prices
2025 has the highest S/U since 2019, as a result we saw the lowest prices since then.
That S/U has now been consistently getting tighter the last few years.
Super El Nino:
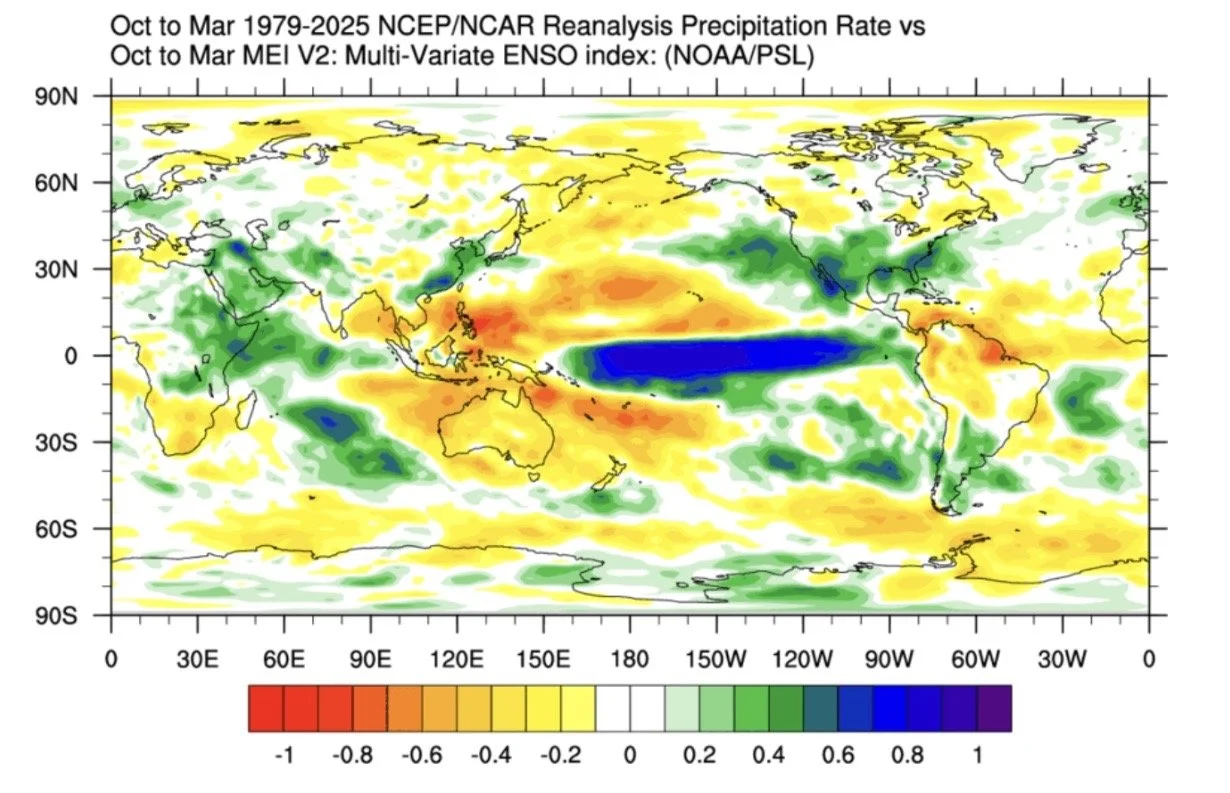
They say we have the strongest Super El Nino of all-time coming.
This has historically led to Brazil being dry during October to March.
Great Demand:
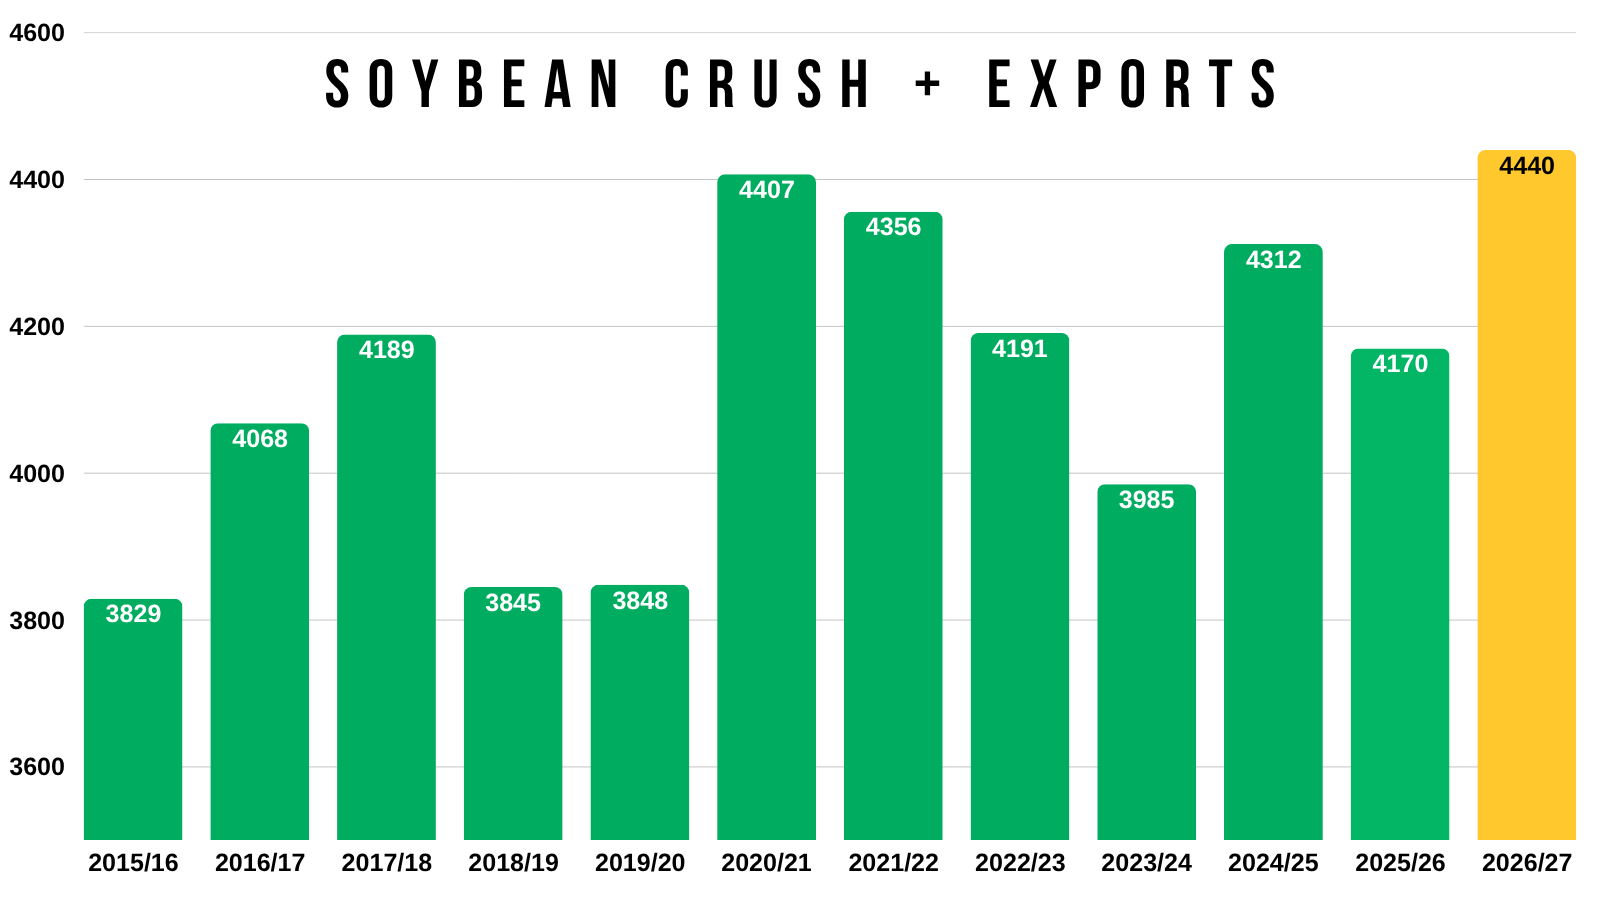
Crush demand remains at a record.
It's not going anywhere.
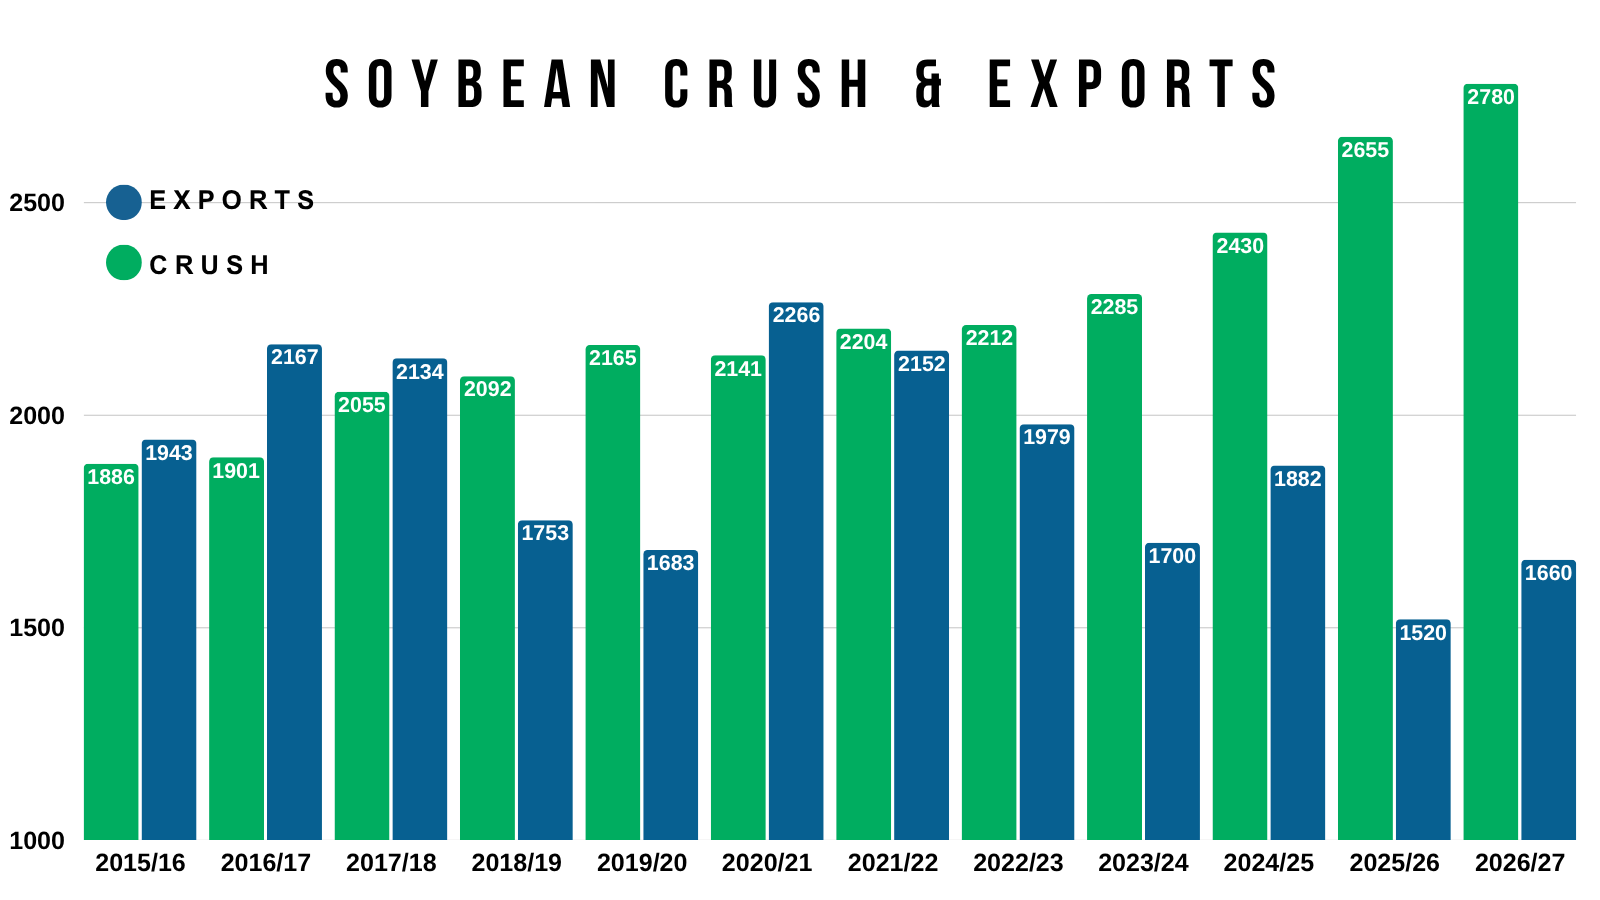
There is a reason our domestic demand is the best it's ever been despite relative low expectations for exports.
Because crush is that strong.
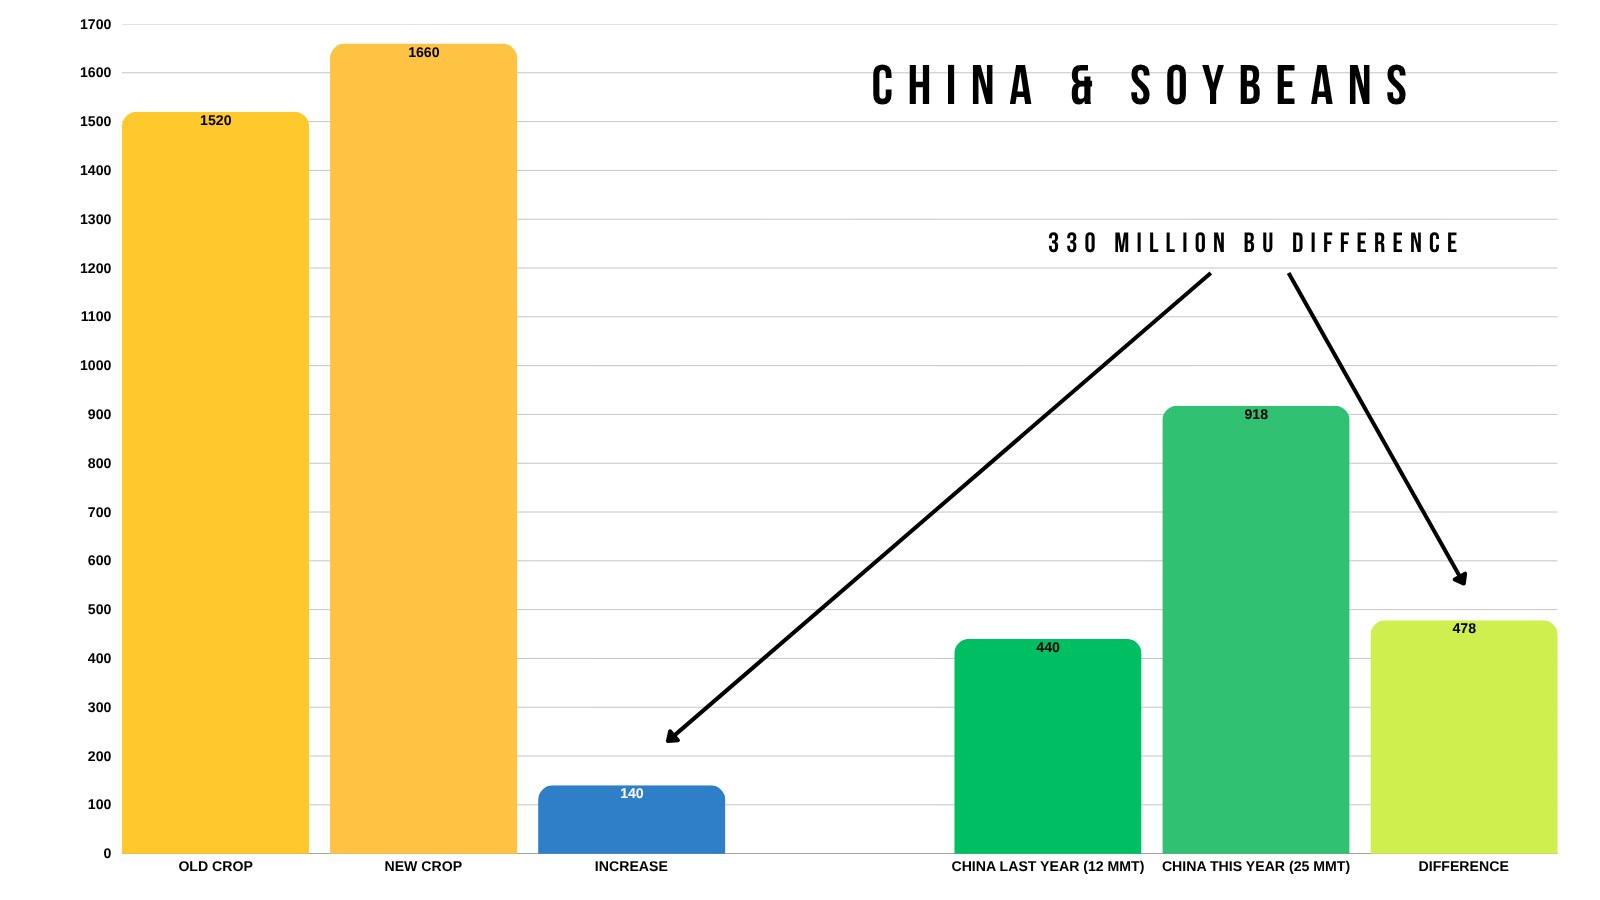
China's Promise:
If China agrees to buy what they said they would, we simply do not have the available supply to fulfill that goal without rationing demand.
Because the USDA only expects our exports to be up 140 million vs last year.
Yet China said they are going to be buying 480 milllion more than last year.
That's a pretty massive difference. The size of our entire carryout.
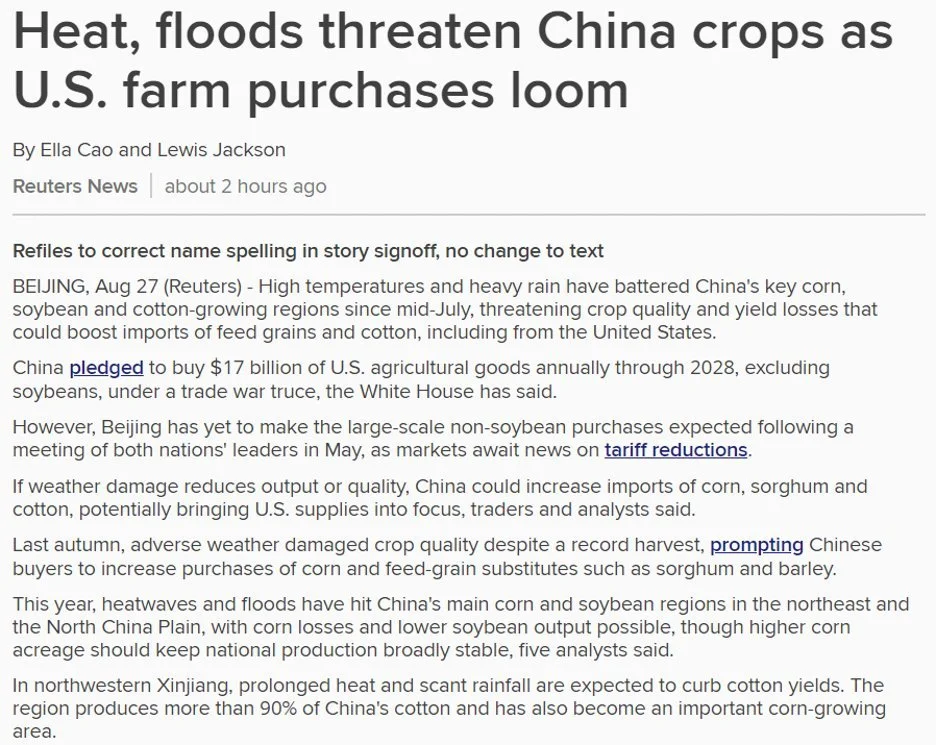
There was some new surrounding China crops today.
Reports are saying that heat and floods are threatening their corn and soybean crops.
We have yet to see them make any of those non-soybean purchases they agreed to yet.
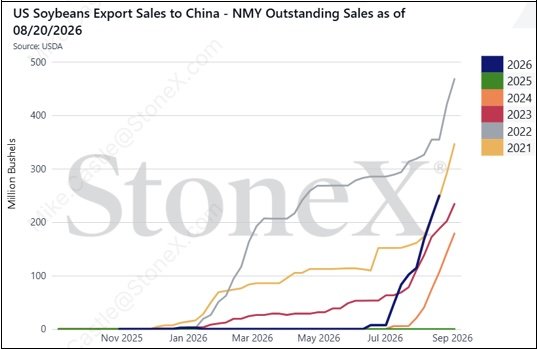
Soybean exports have actually been pretty impressive.
Look at our soybean exports to China.
They are on their best pace since 2021 and 2022.
So we have a world situation that is shrinking despite bigger crops year after year.
We have record crush demand.
China is buying, and if they want to meet that goal, we'll likely have to ration demand to non-China destinations.
That is why soybeans have potential.
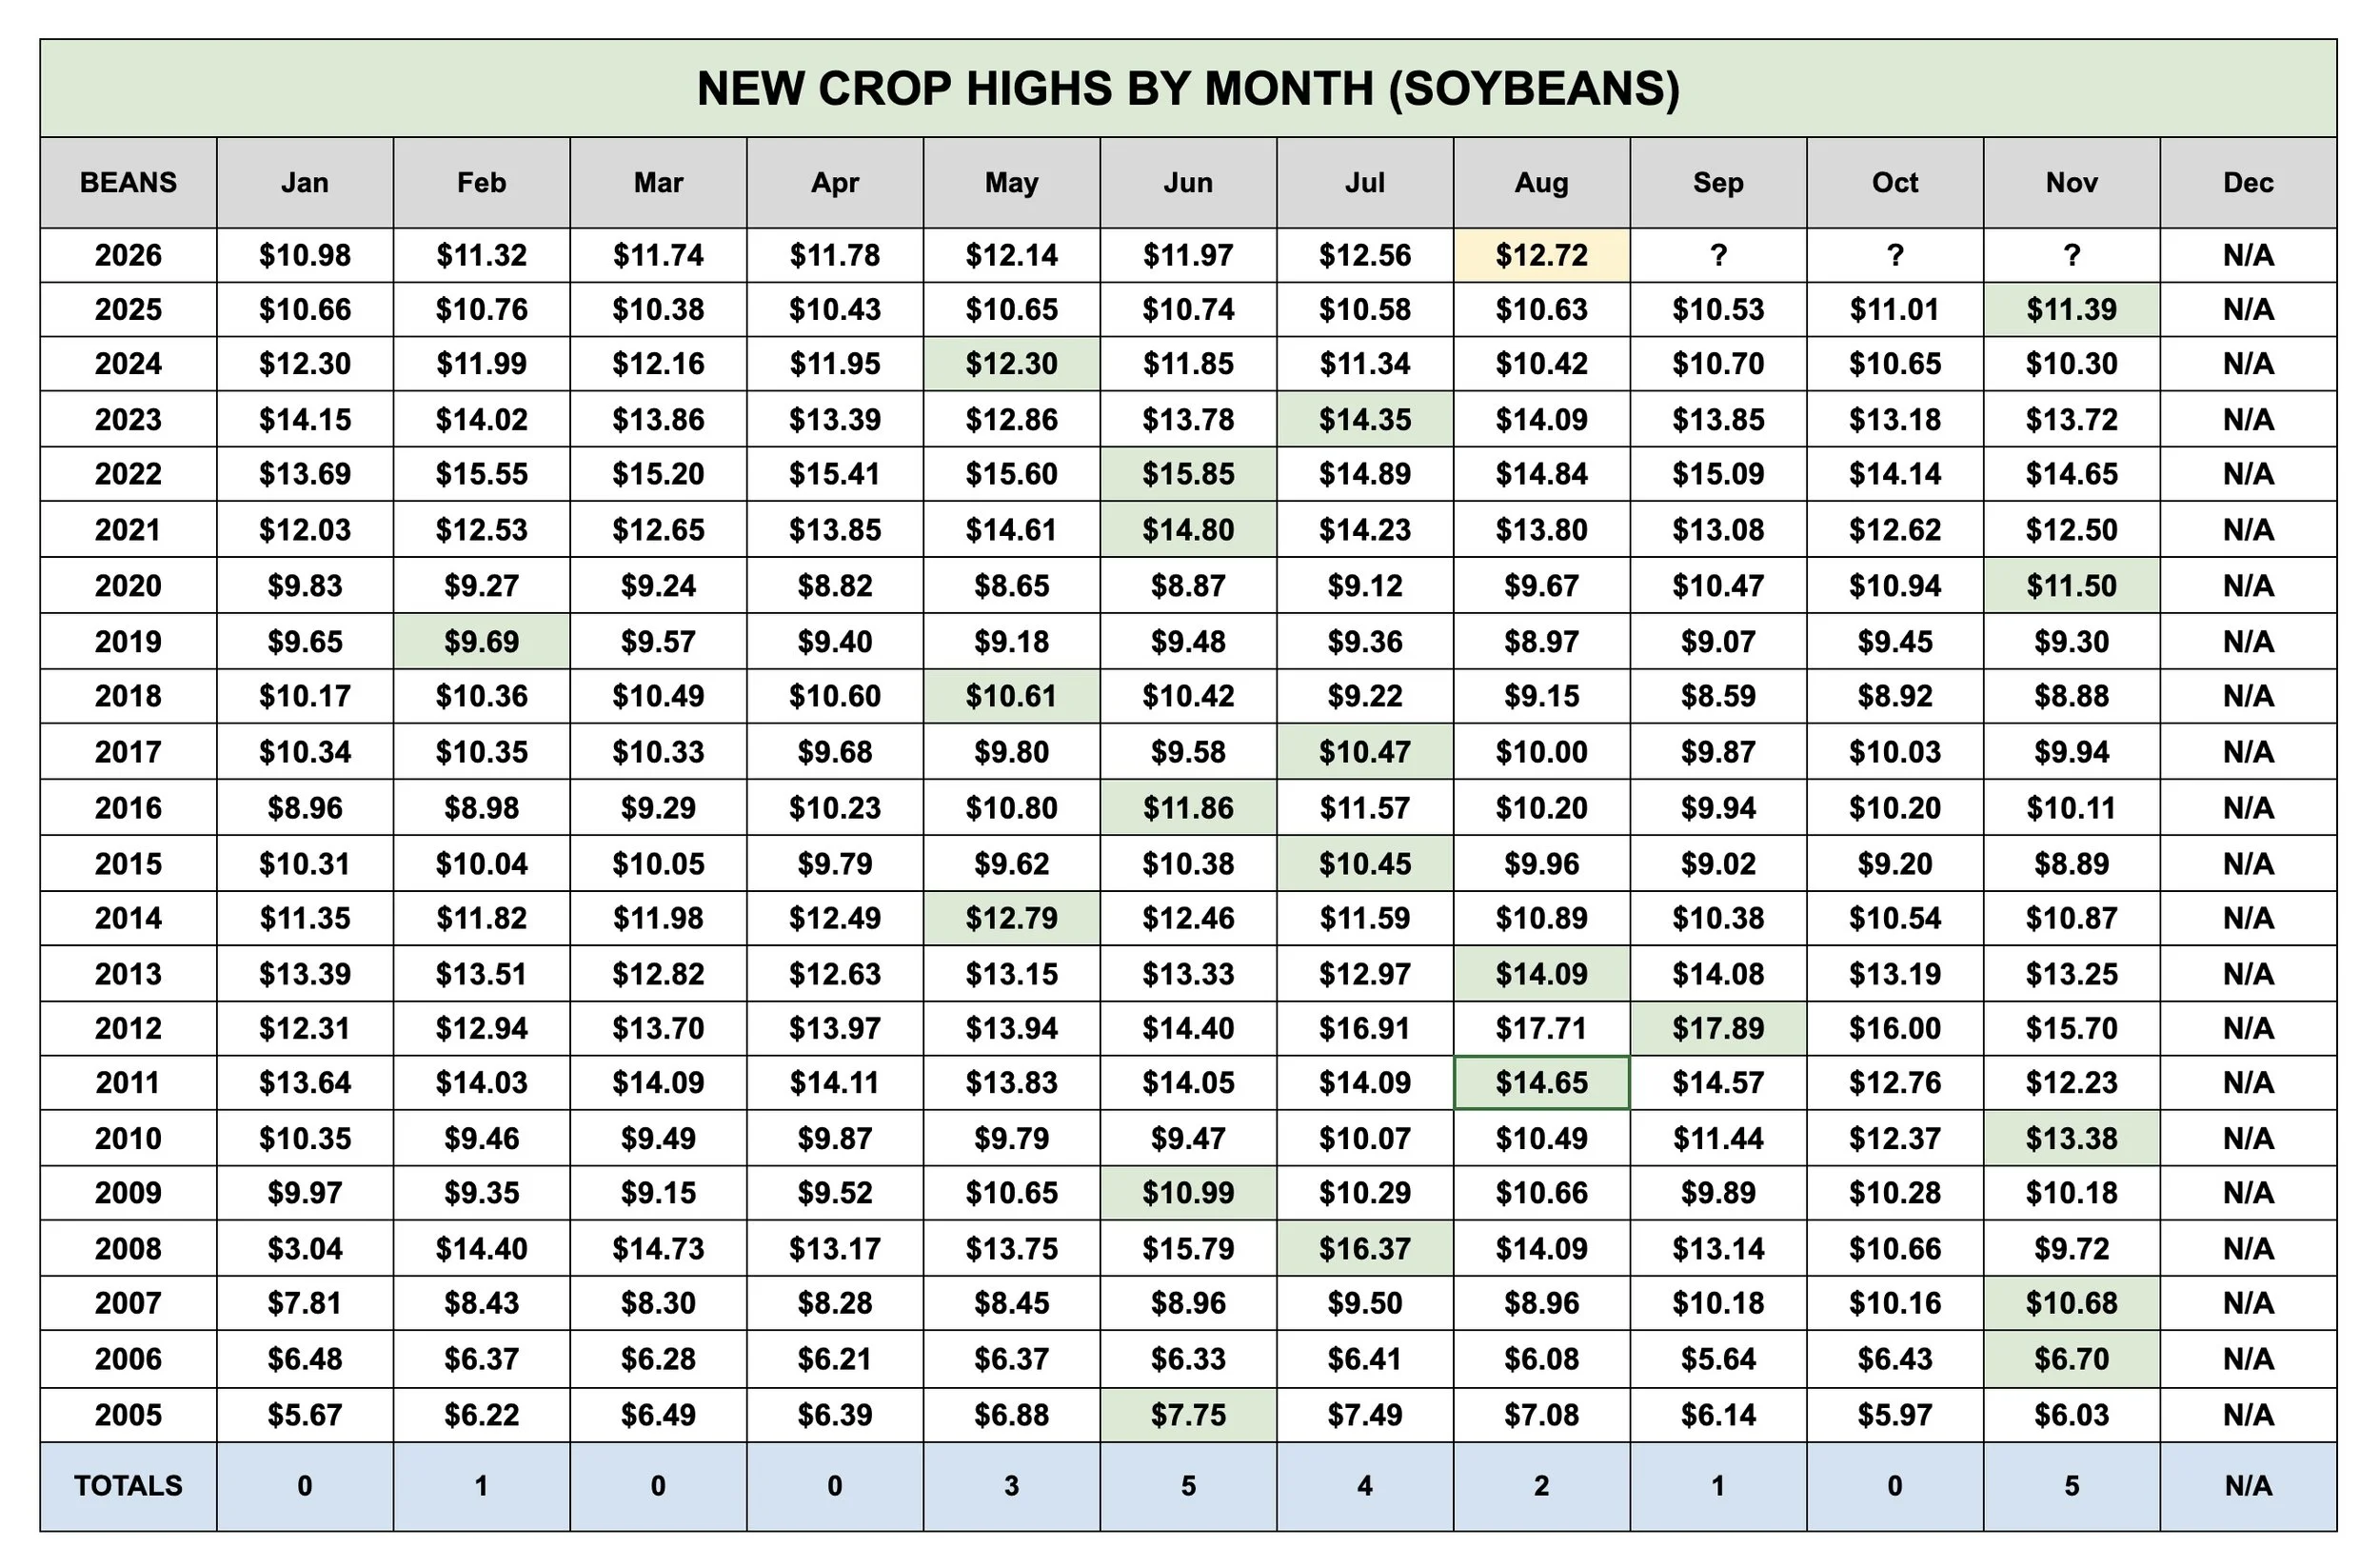
Soybean Highs by Month:
I had some requests for this chart after sharing the corn one.
Here is Nov soybeans highest price for every single month since 2005.
We have only posted our highs in August twice. 2011 and 2013.
We have only posted our highs in September once. 2012.
We have never posted them in October.
Charts: Weekly Breakouts?
Corn
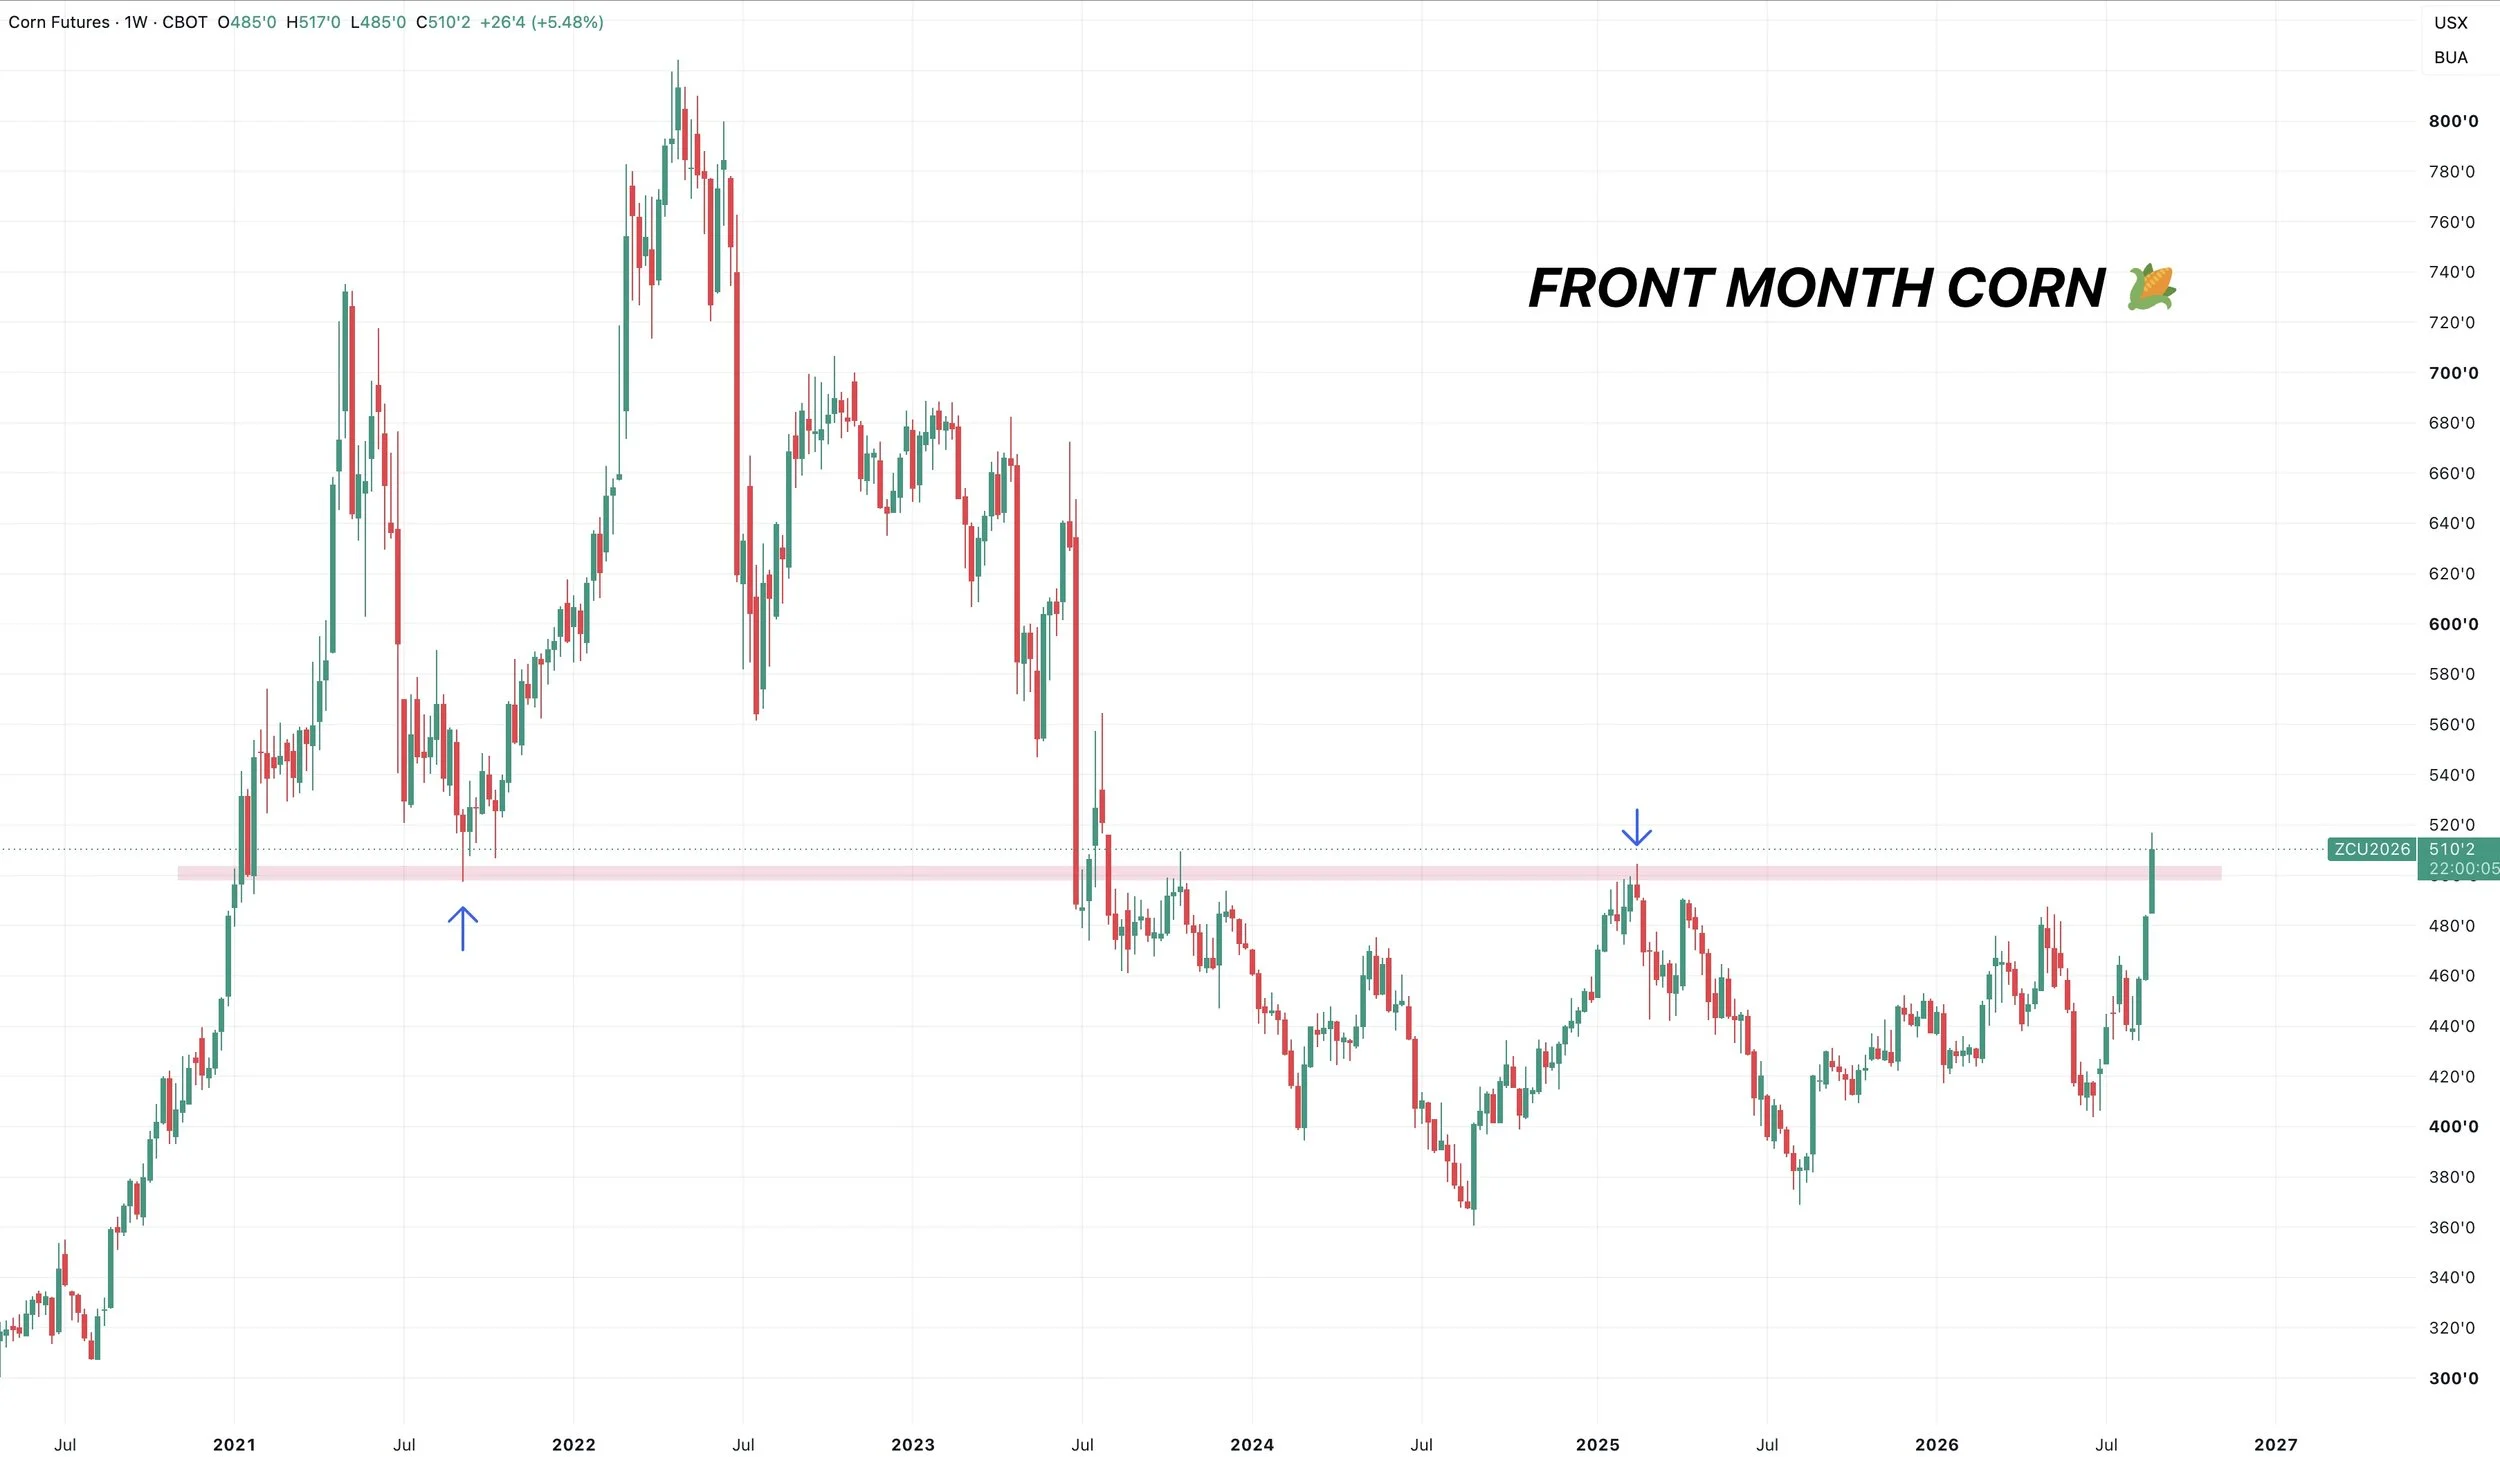
Weekly Chart:
Corn just posted it's first series of higher lows and higher highs of the entire bear market.
Seems like a big deal to me.
We broke above $5.00 for the first time since July 2023.
Breaking above those 2025 highs as well as the 2021 lows. So it was a pretty clear level of resistance we just cleared.
Which opens the door to further upside potential.
So it's starting to look promising for corn. And appears like the long term trend has possibly shifted higher.
Monthly Chart:
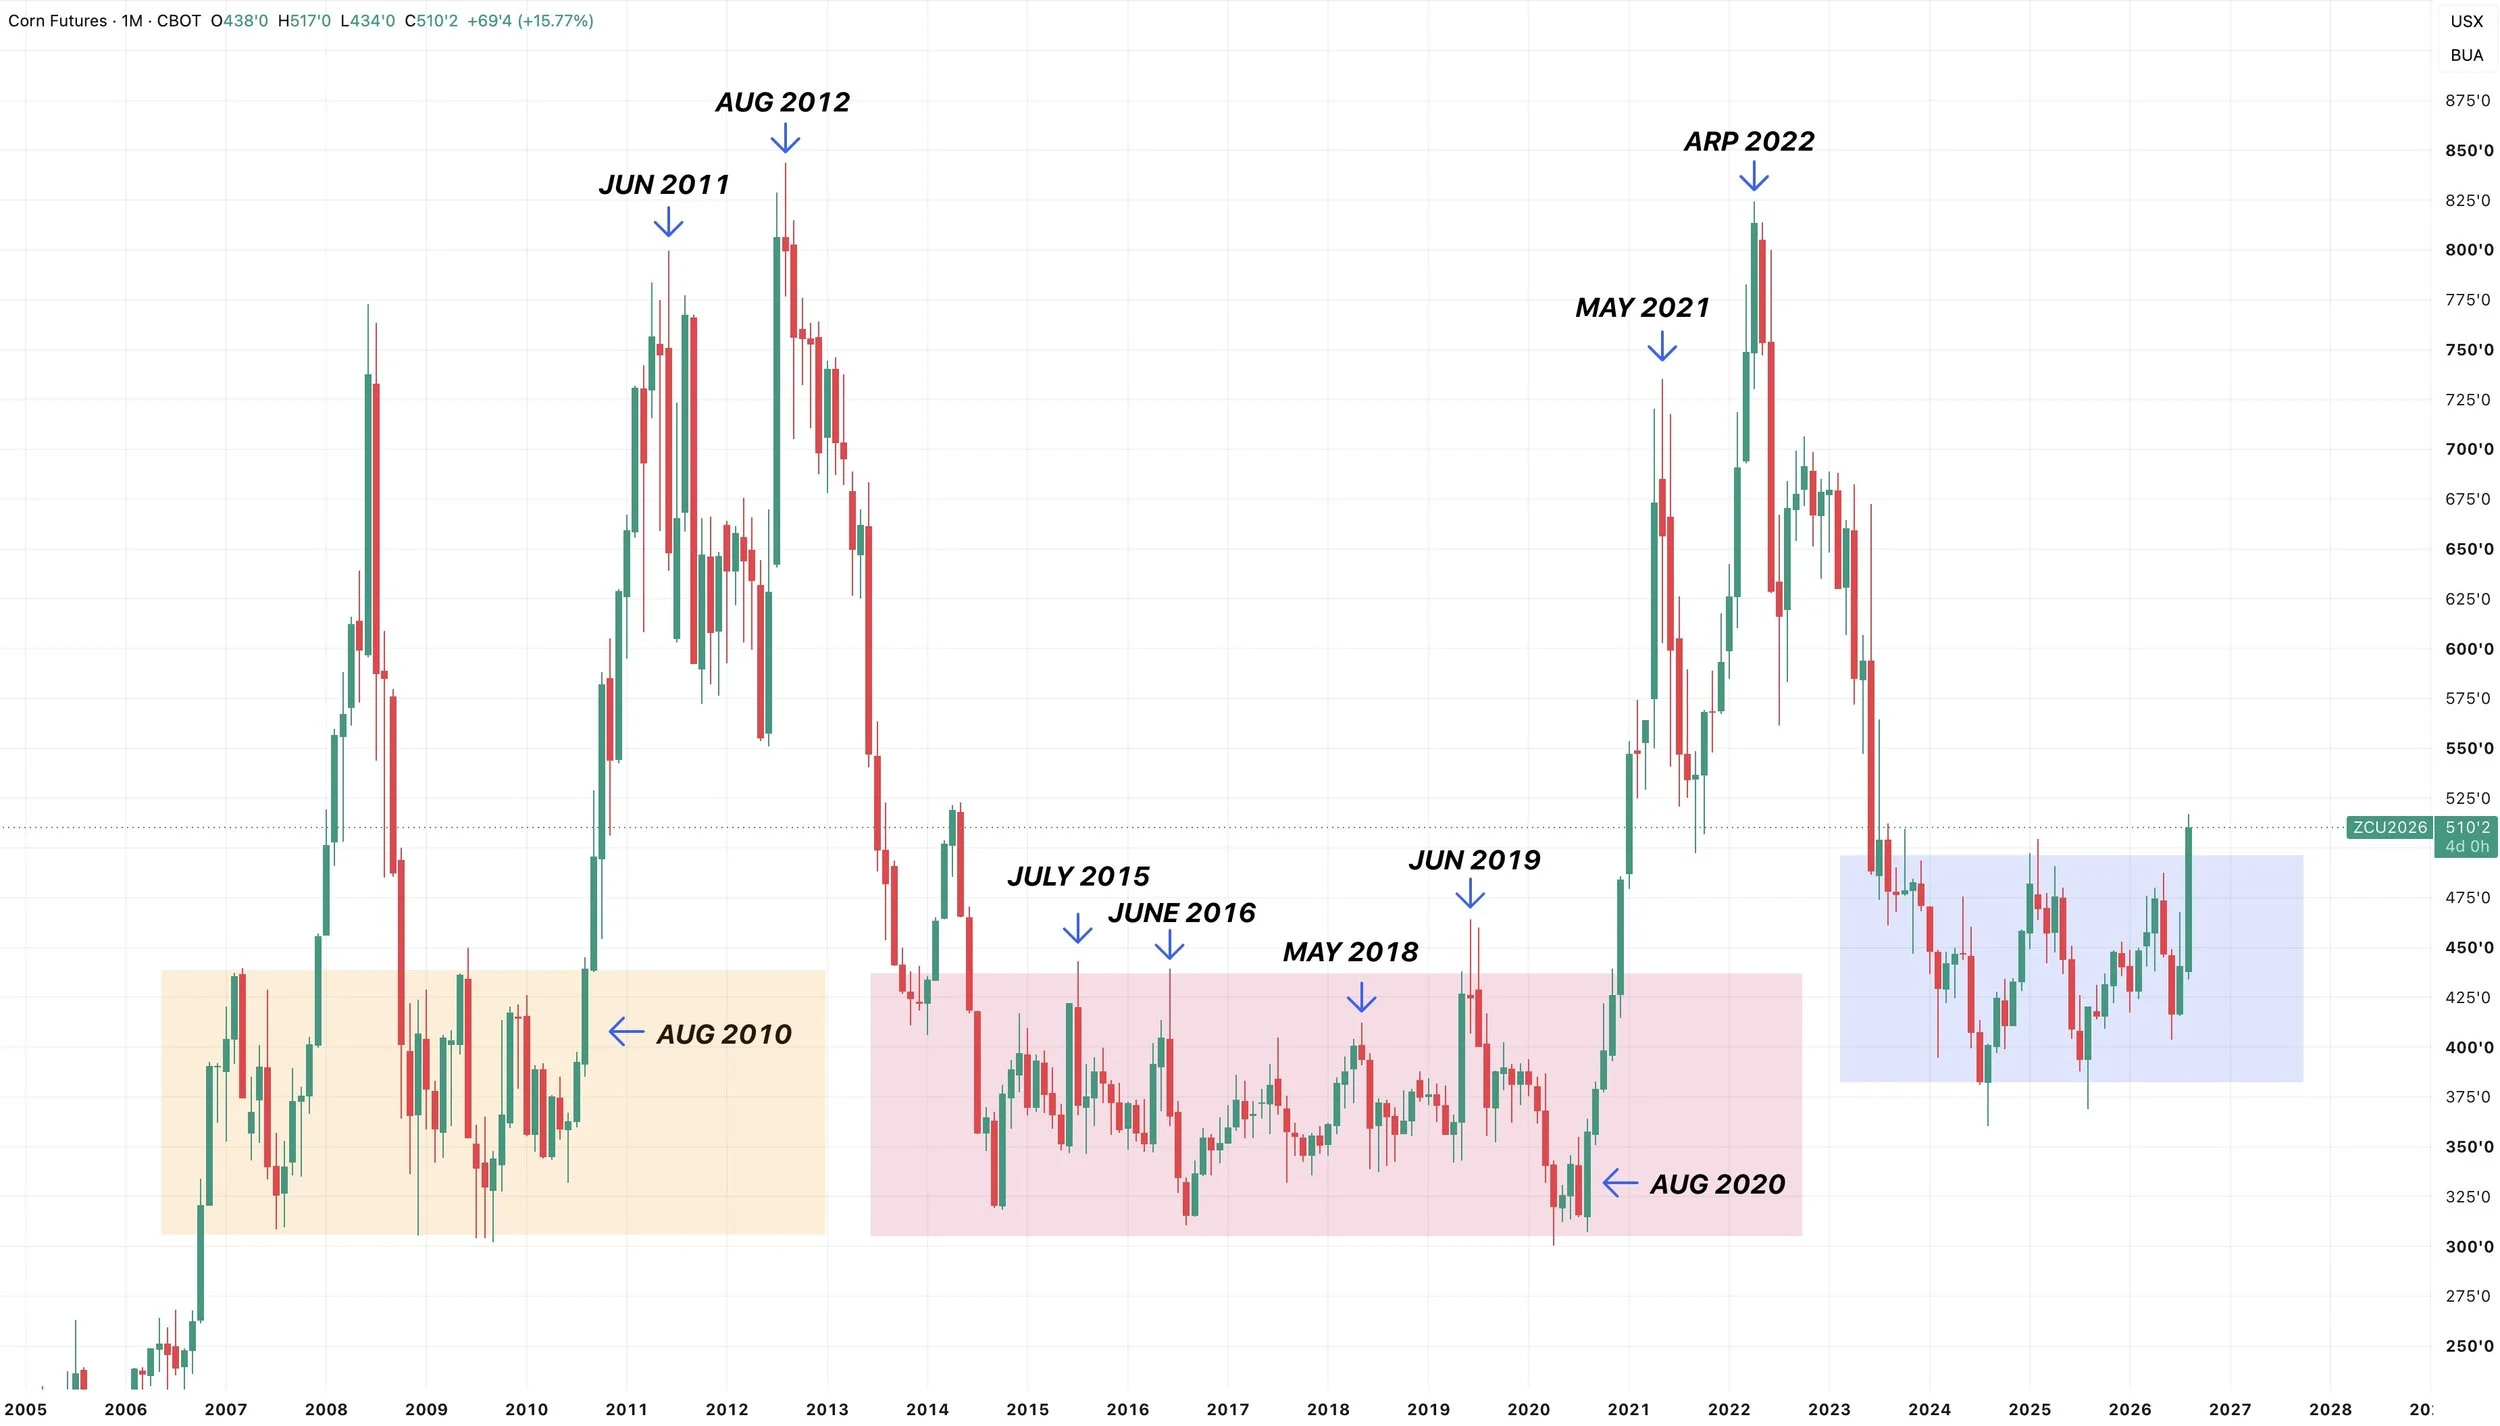
We could also be potentially breaking out on a monthly basis.
Corn tends to be trapped in a $1.00 range, and we could be breaking out of that range.
I outlined every major spike over the years.
If you notice, most of those spikes that fade often occur between May to July. As they are typically associated with a weather scare and where the market seasonally posts it's highs.
We rarely just randomly top out in August. Because it's usually not some traditional weather scare that dies out.
I marked August in 2010 and 2020 for reference.
On a front month basis, corn has only topped in August once which was 2012. But again, this doesn’t feel the same as that year for obvious reasons.
In 2012 we were already in a bull market.
Right now we are busting out of a range, similar to 2010.
So the chart does look optimistic.
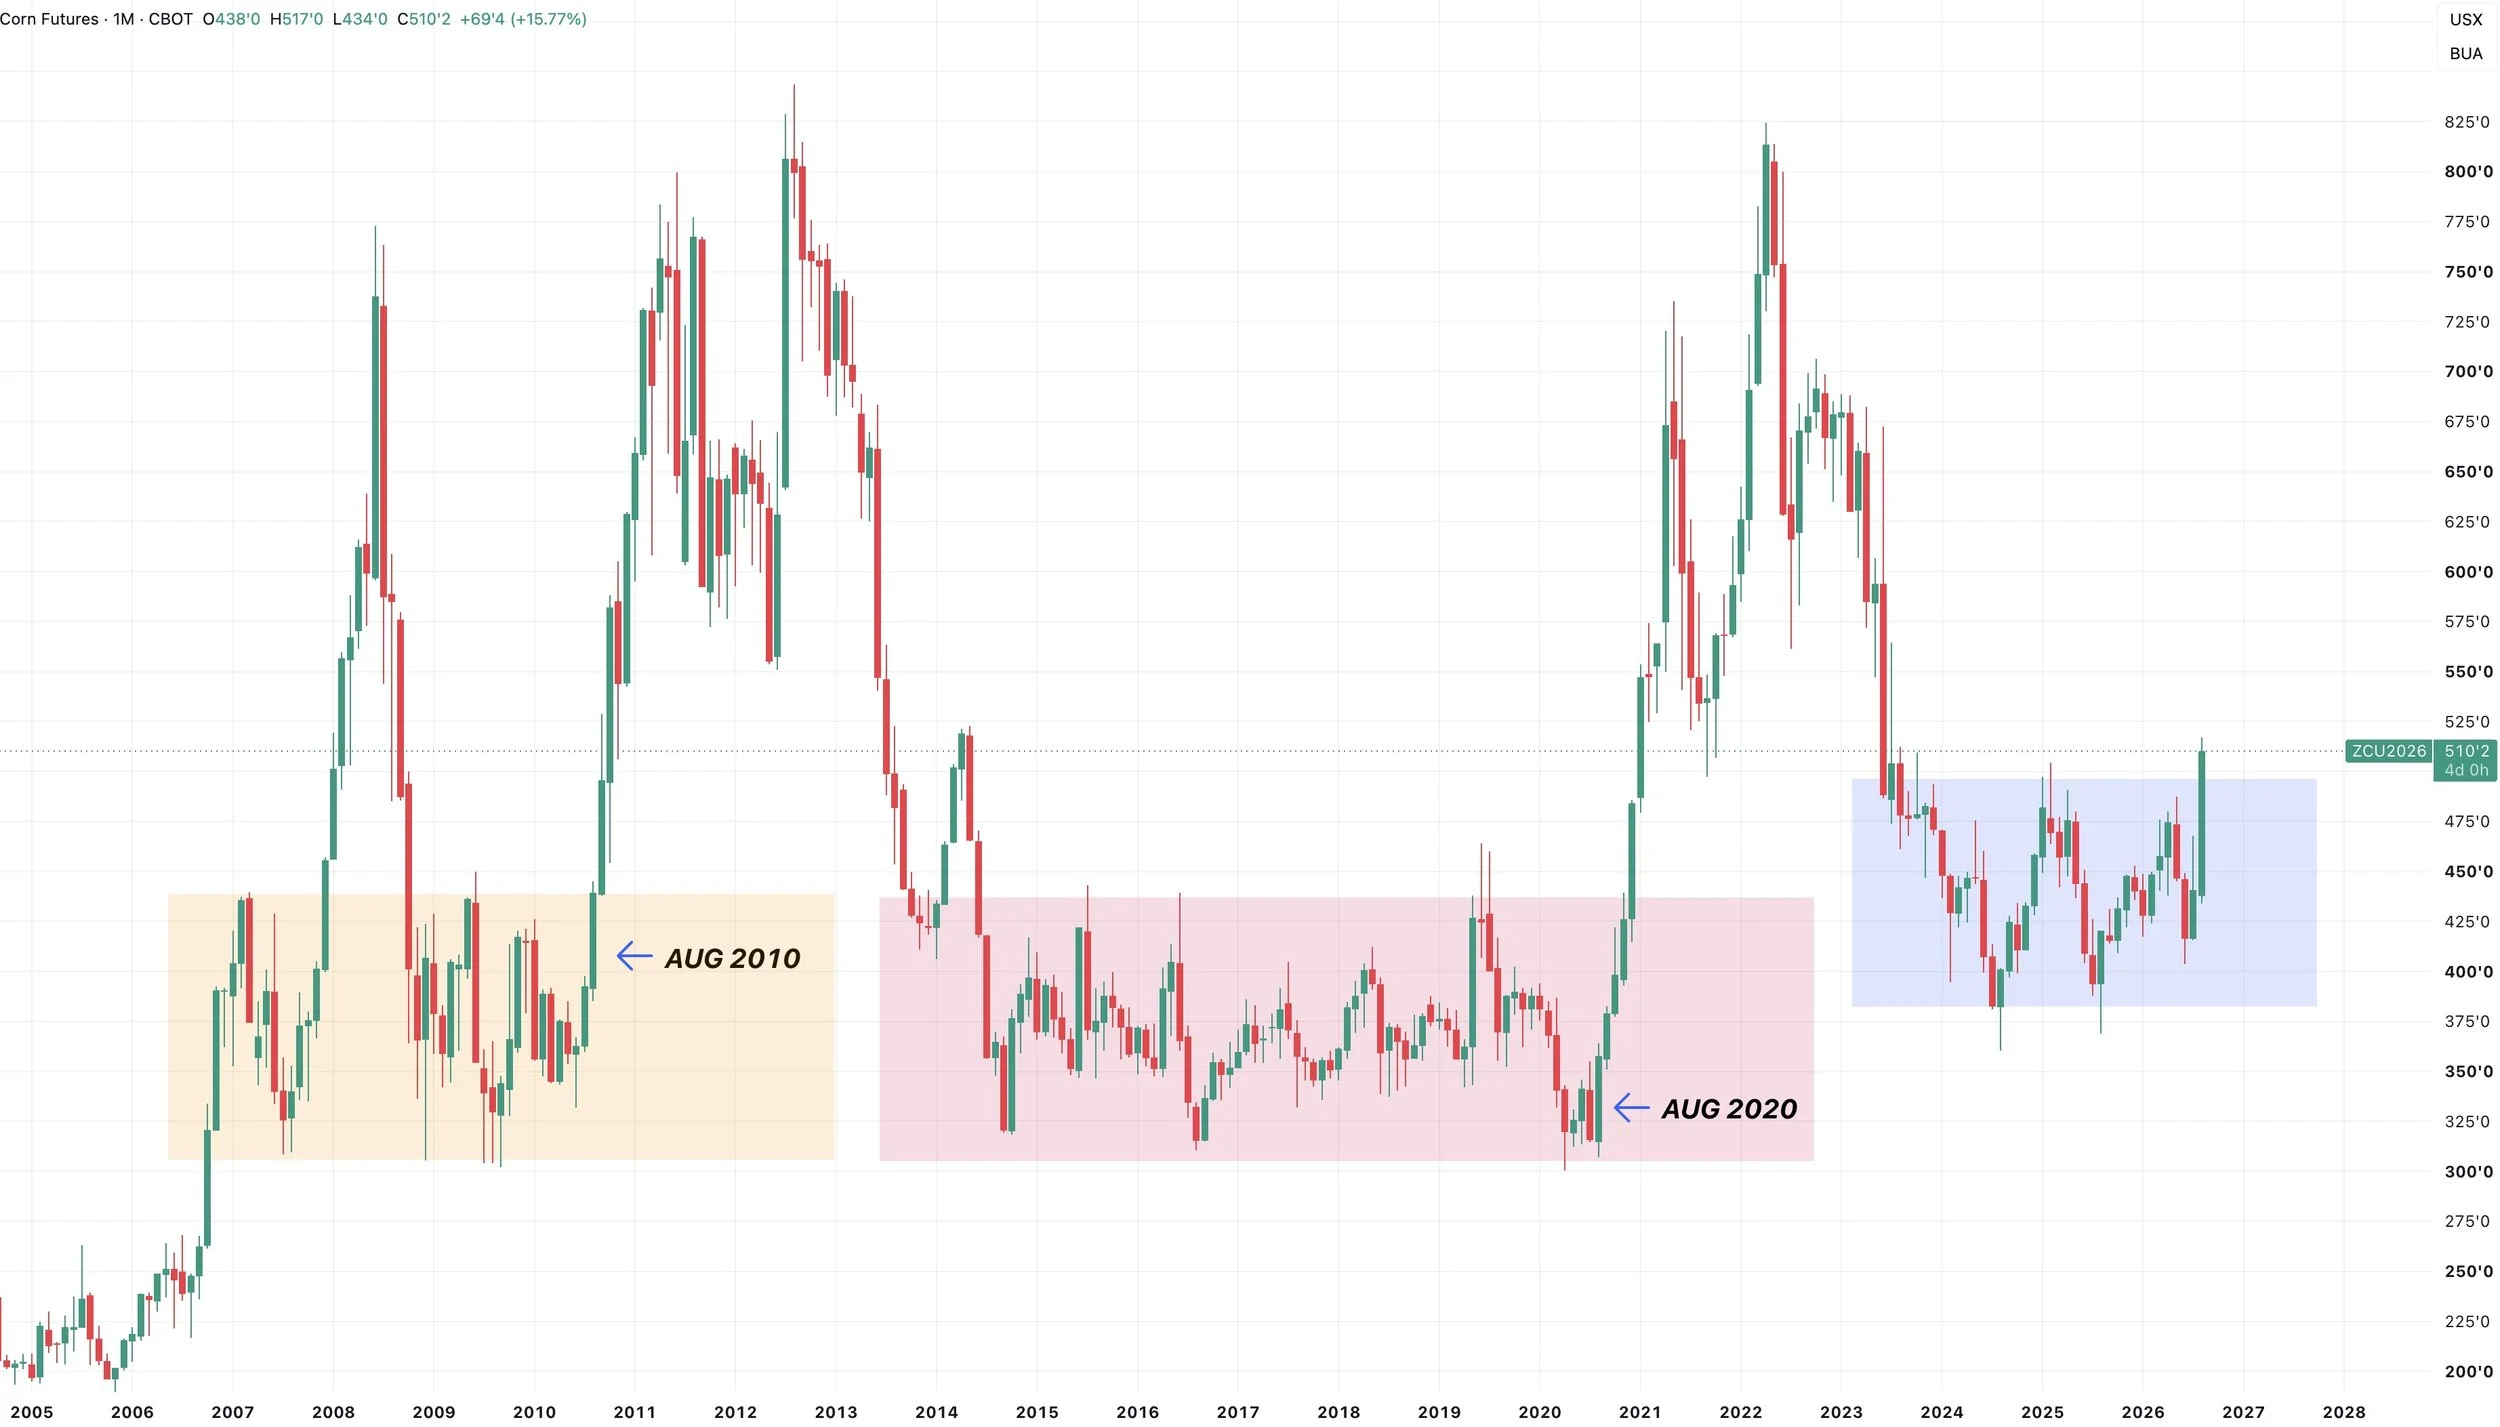
Here is a chart with the noise removed.
Obviously this does not have to happen.
But there are definitely some similarities to 2010 and 2020.
As both broke out of their bear market ranges.
Dec Corn Daily Chart:
The next target is that $5.50 range.
$5.56 is the golden fib from the contract lows up to the May highs.
That's probably good area to consider doing some de-risking.
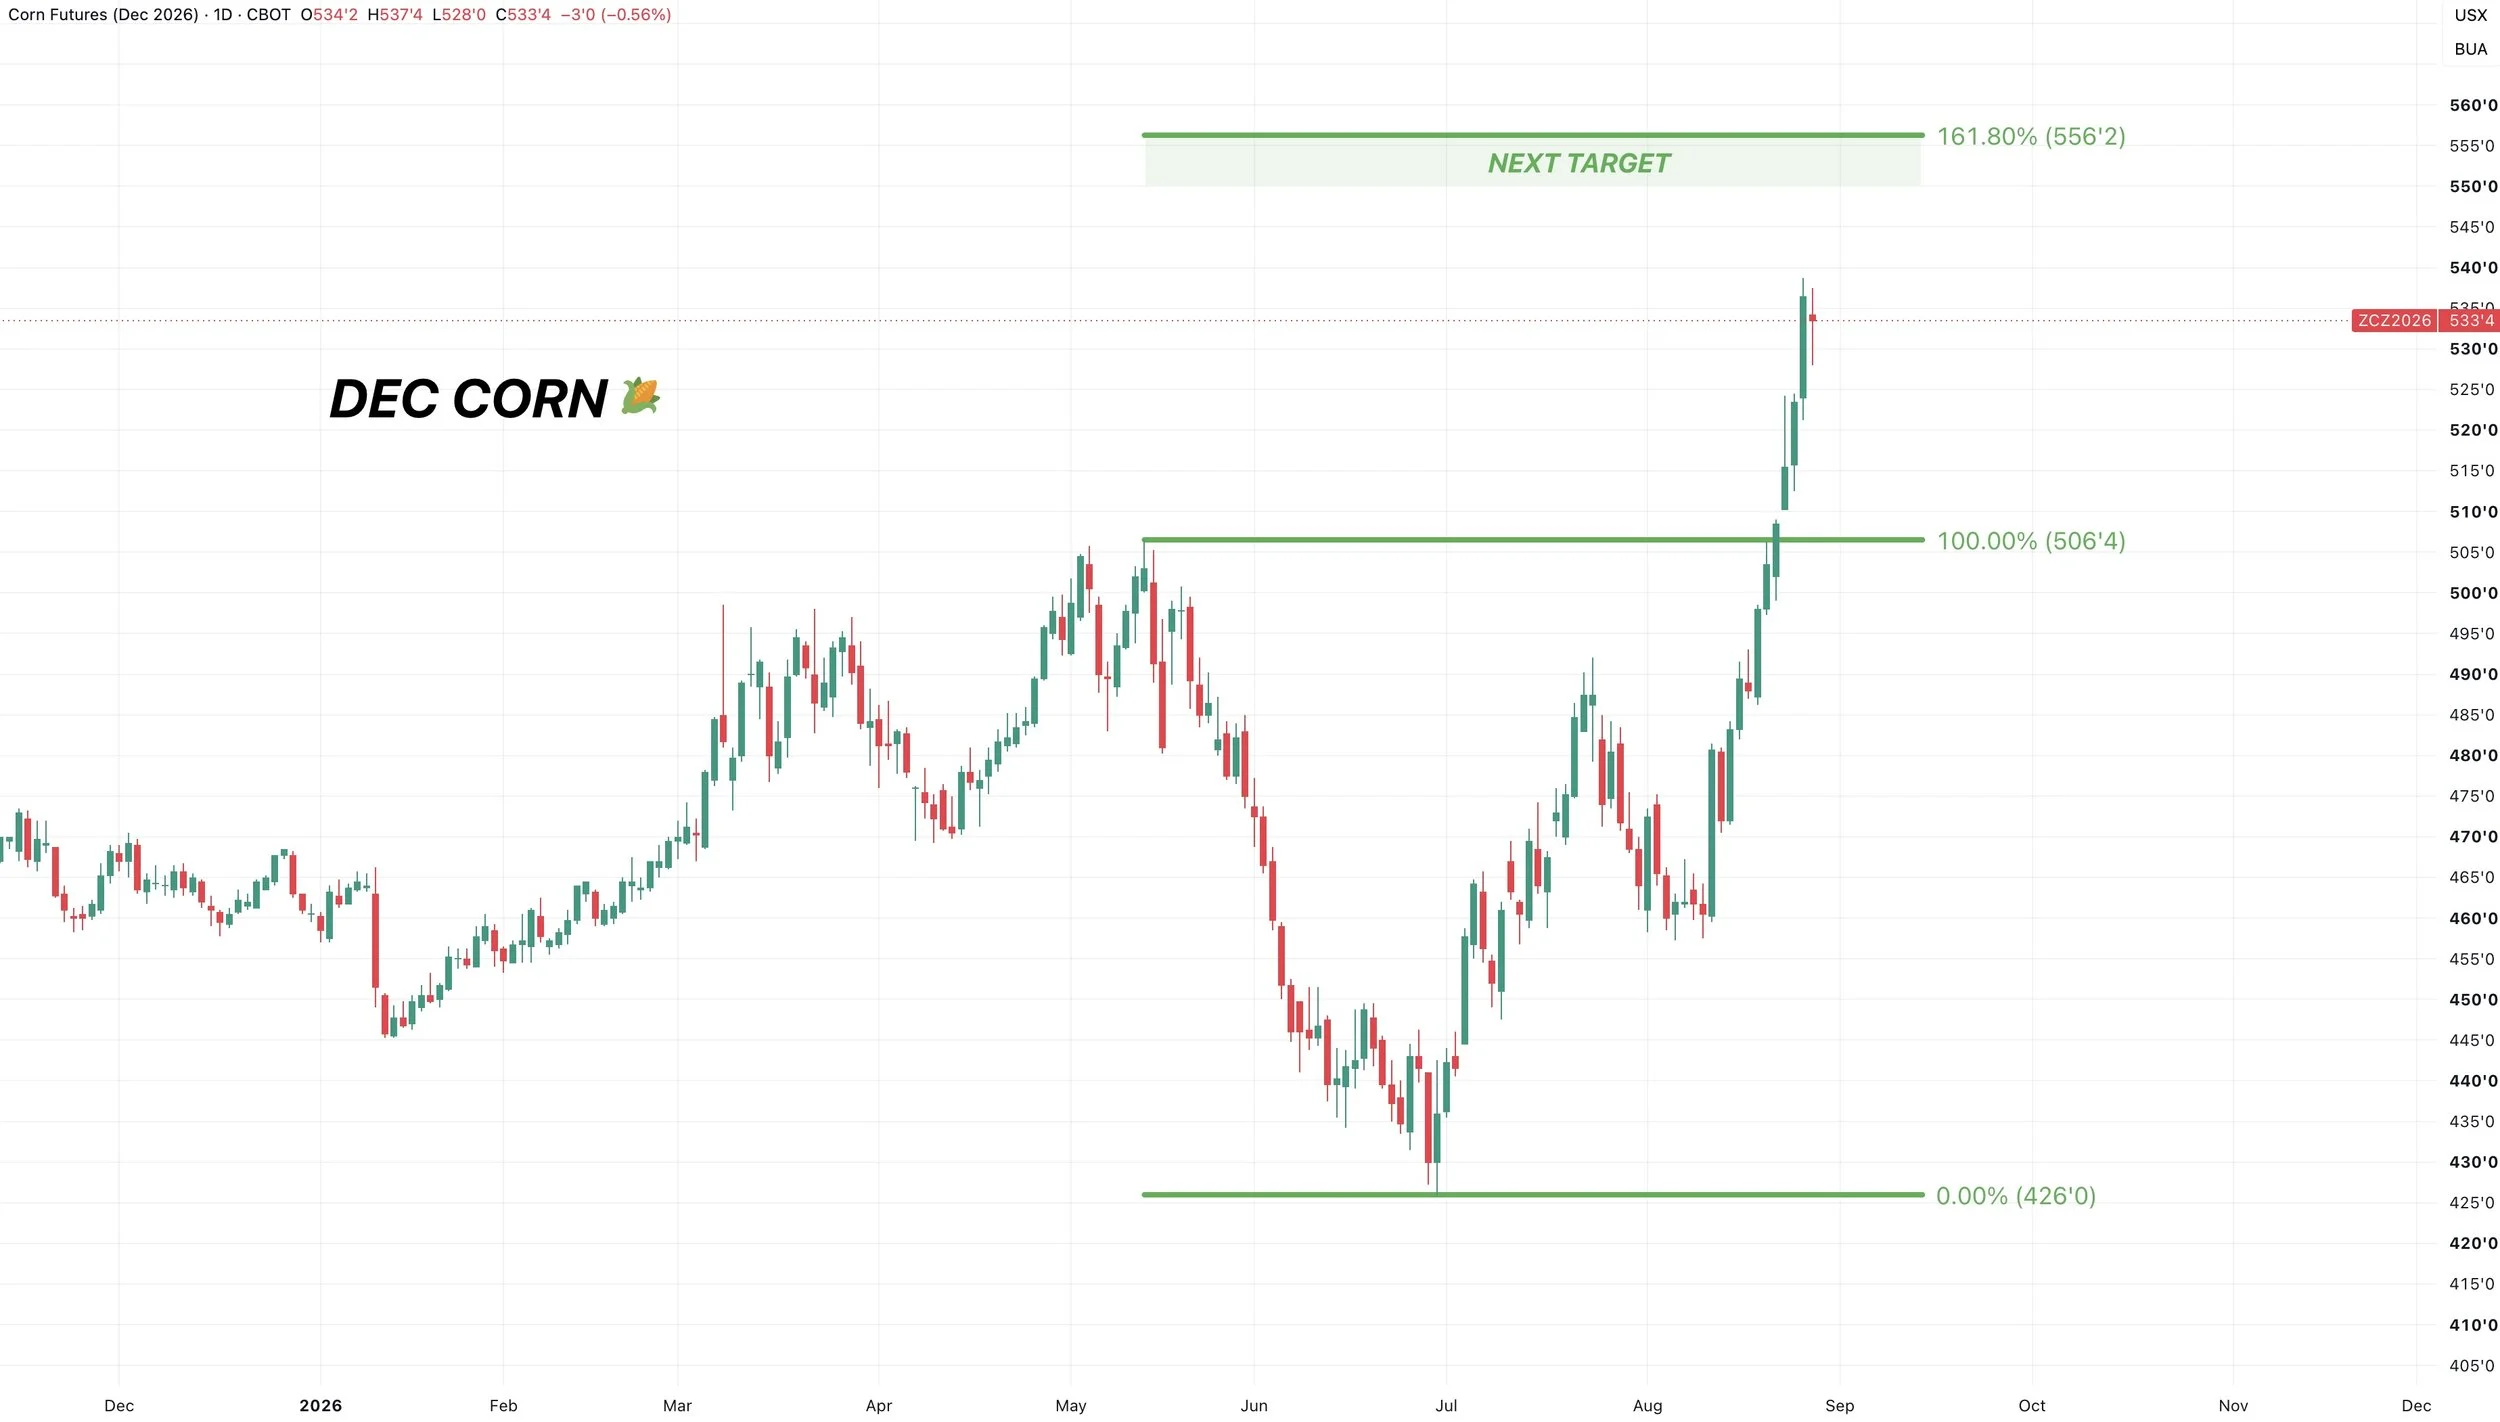
This market could stall out short term at anytime.
We have rallied +80 cents in two weeks and gone straight up.
This market could drop a lot and still be completely fine and still hold a bullish structure.
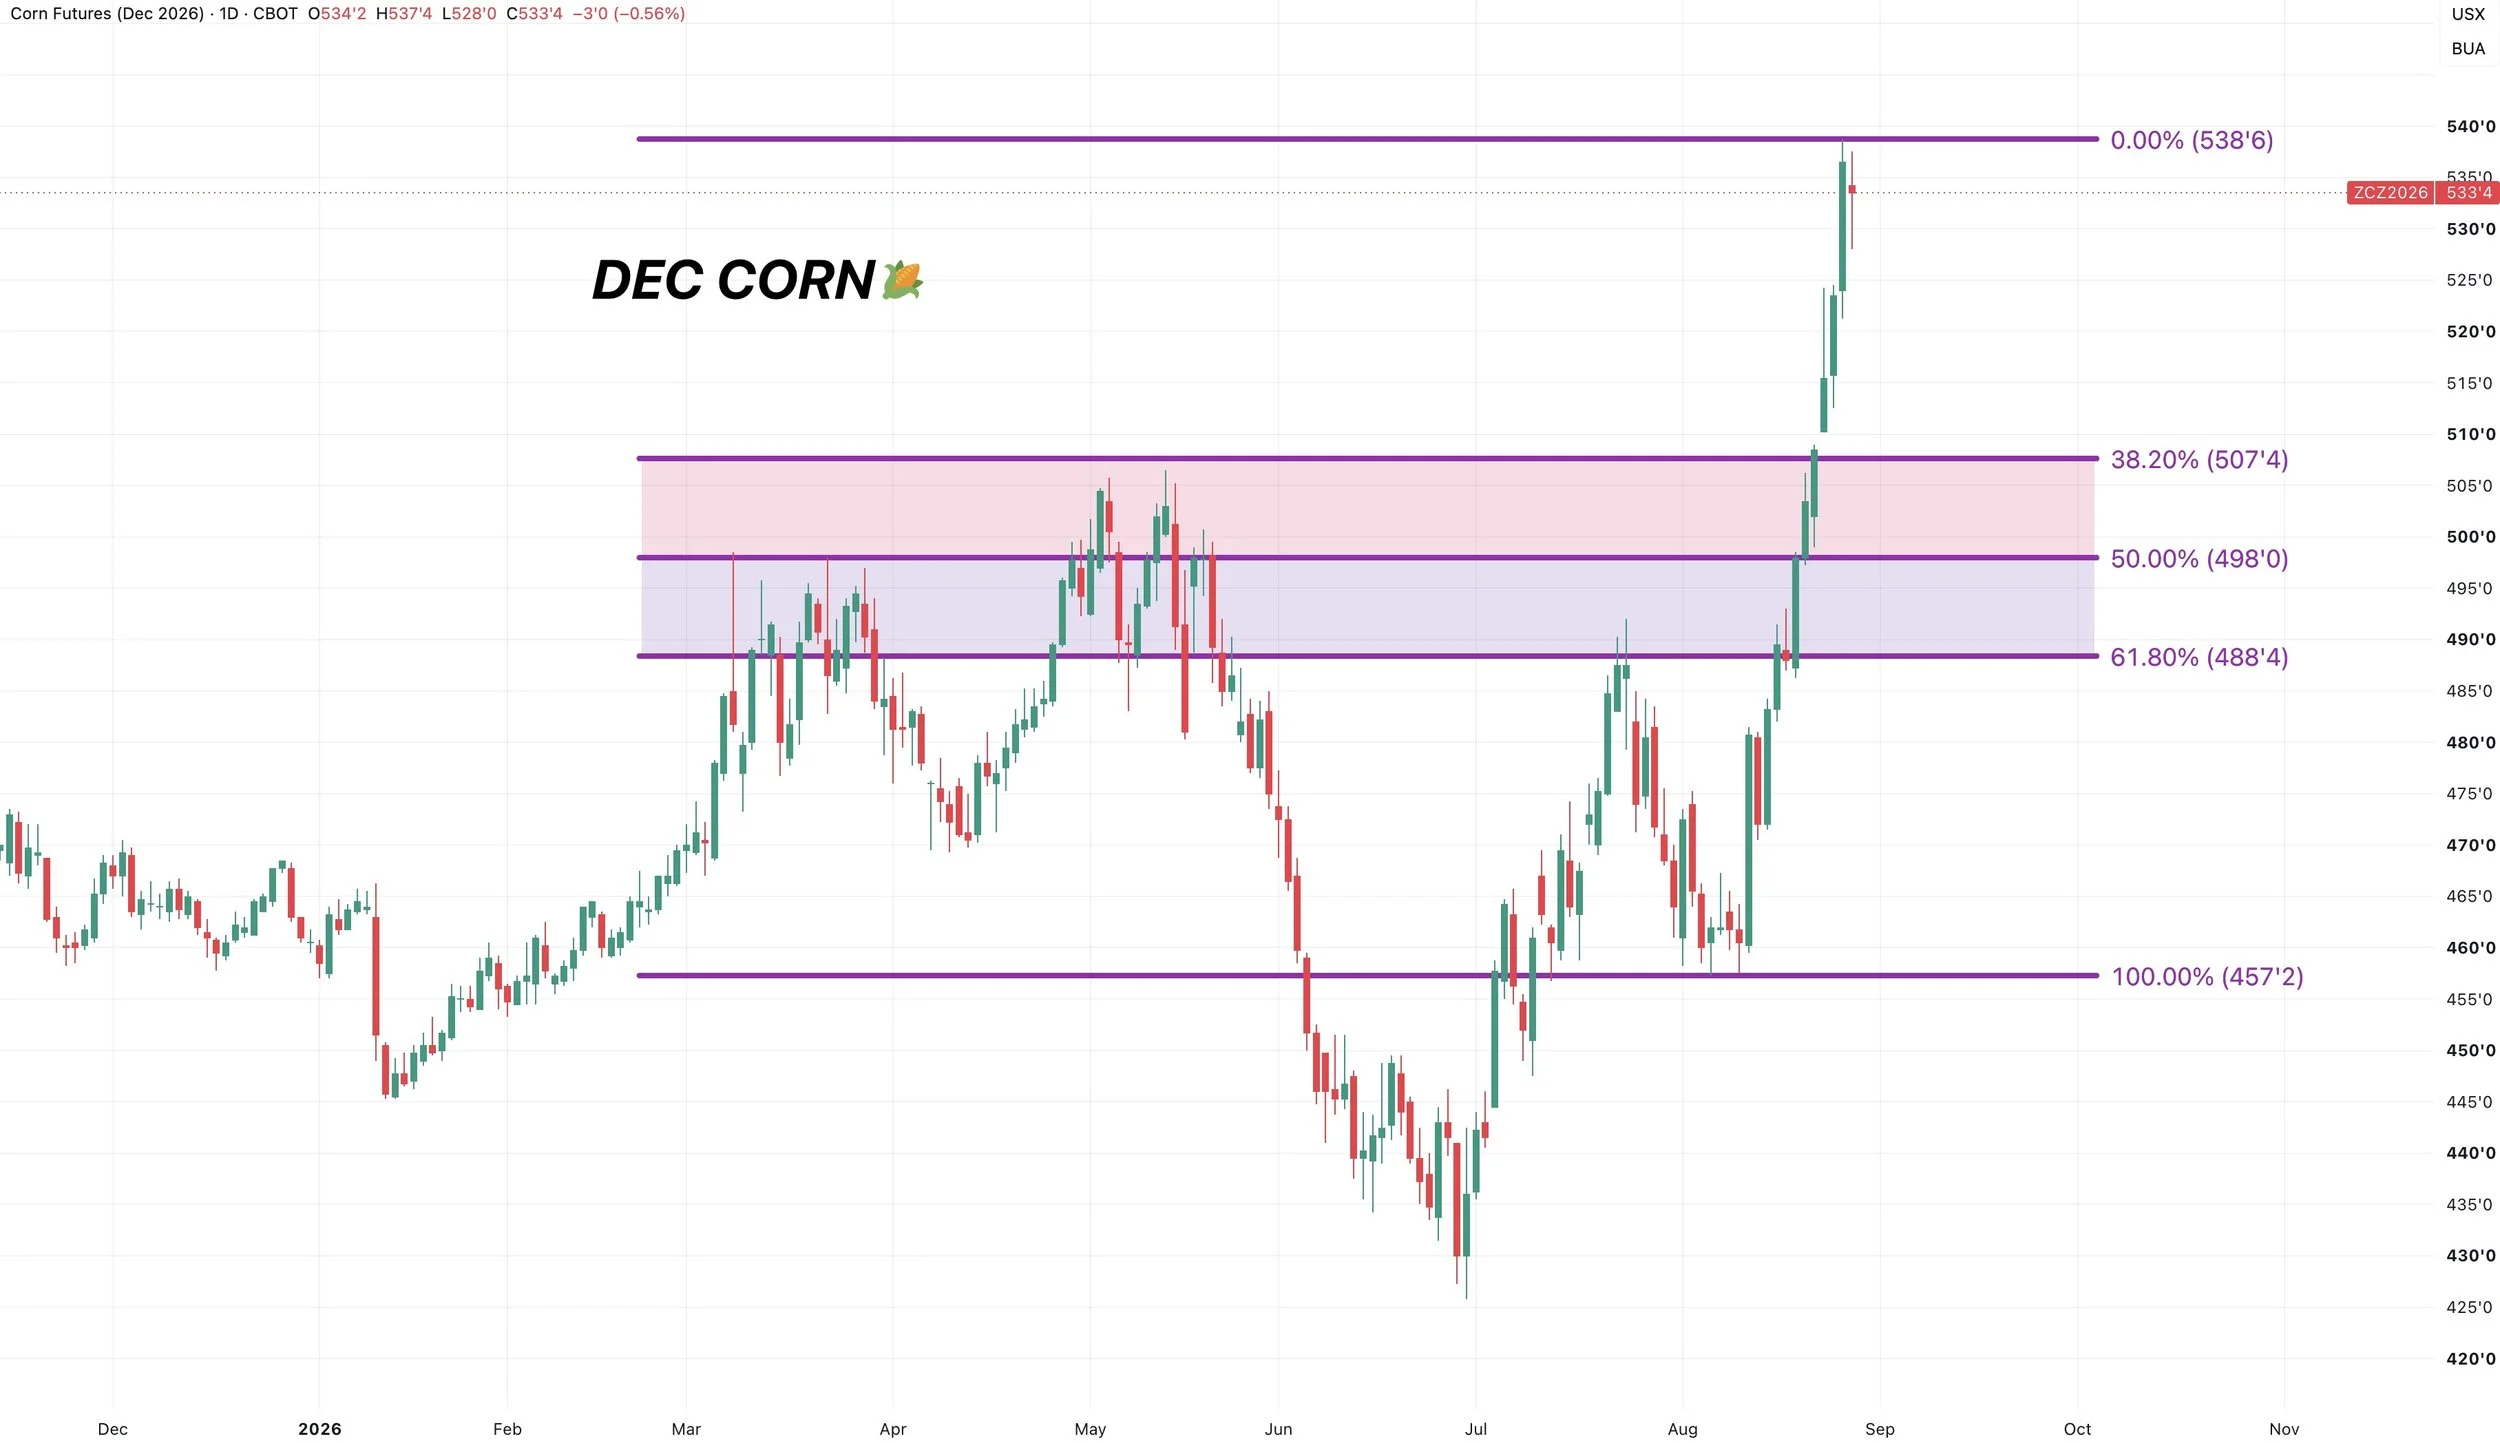
We could drop all the way back down to $4.90, which is 40 cents lower than we are today, and it would still be considered a healthy pull back.
A standard pullback to the 38.2% to 61.8% retracements would also be a simple re-test of prior resistance.
So I'd view that as an opportunity if it happened.
Corn Marketing Thoughts:
1) If you lack storage, need to move stuff off the combine, or are behind in your marketing etc:
You should probably be doing something here and getting yourself to a comfortable spot.
Just scale into something whether that's some sales or some protection.
We are at multi-year highs heading into harvest, which rarely happens, given we are usually posting our lows right about now.
So this isn’t a rally you want to completely ignore if that's you.
2) Those with plenty of time:
We like being mostly patient. We don’t mind doing something such as small sales or some downside protection, but we do not want to get carried away or put ourselves in an oversold situation given the potential.
Would you be more mad if...
1) you did nothing and corn went back to $4.00
2) you sold everything and corn ran to $6.00
That's a question you have to ask yourself, but I'd assume plenty of you would be more mad with scenario two.
There is potential for the first time in a long time. It does not have to shake out. But if it does, we do not want to miss out on it. So we like keeping plenty of bullets in the chamber in case it does.
We just want to have some flexibility.
If you're someone who needs to some help, whether that's getting upside exposure because you are oversold, or if you want to protect your downside, reach out and we'd be happy to help.
Office: (806)484-1214
2027 Crop:
We are not a fan yet.
Dec-27 isn’t that attractive here with the input costs to begin with.
The only way we'd consider doing something is if you have your inputs locked in.
There is more risk for Dec-26 corn than there is for Dec-27. As 26 will lead the market higher or lower.
Soybeans
Weekly Chart:
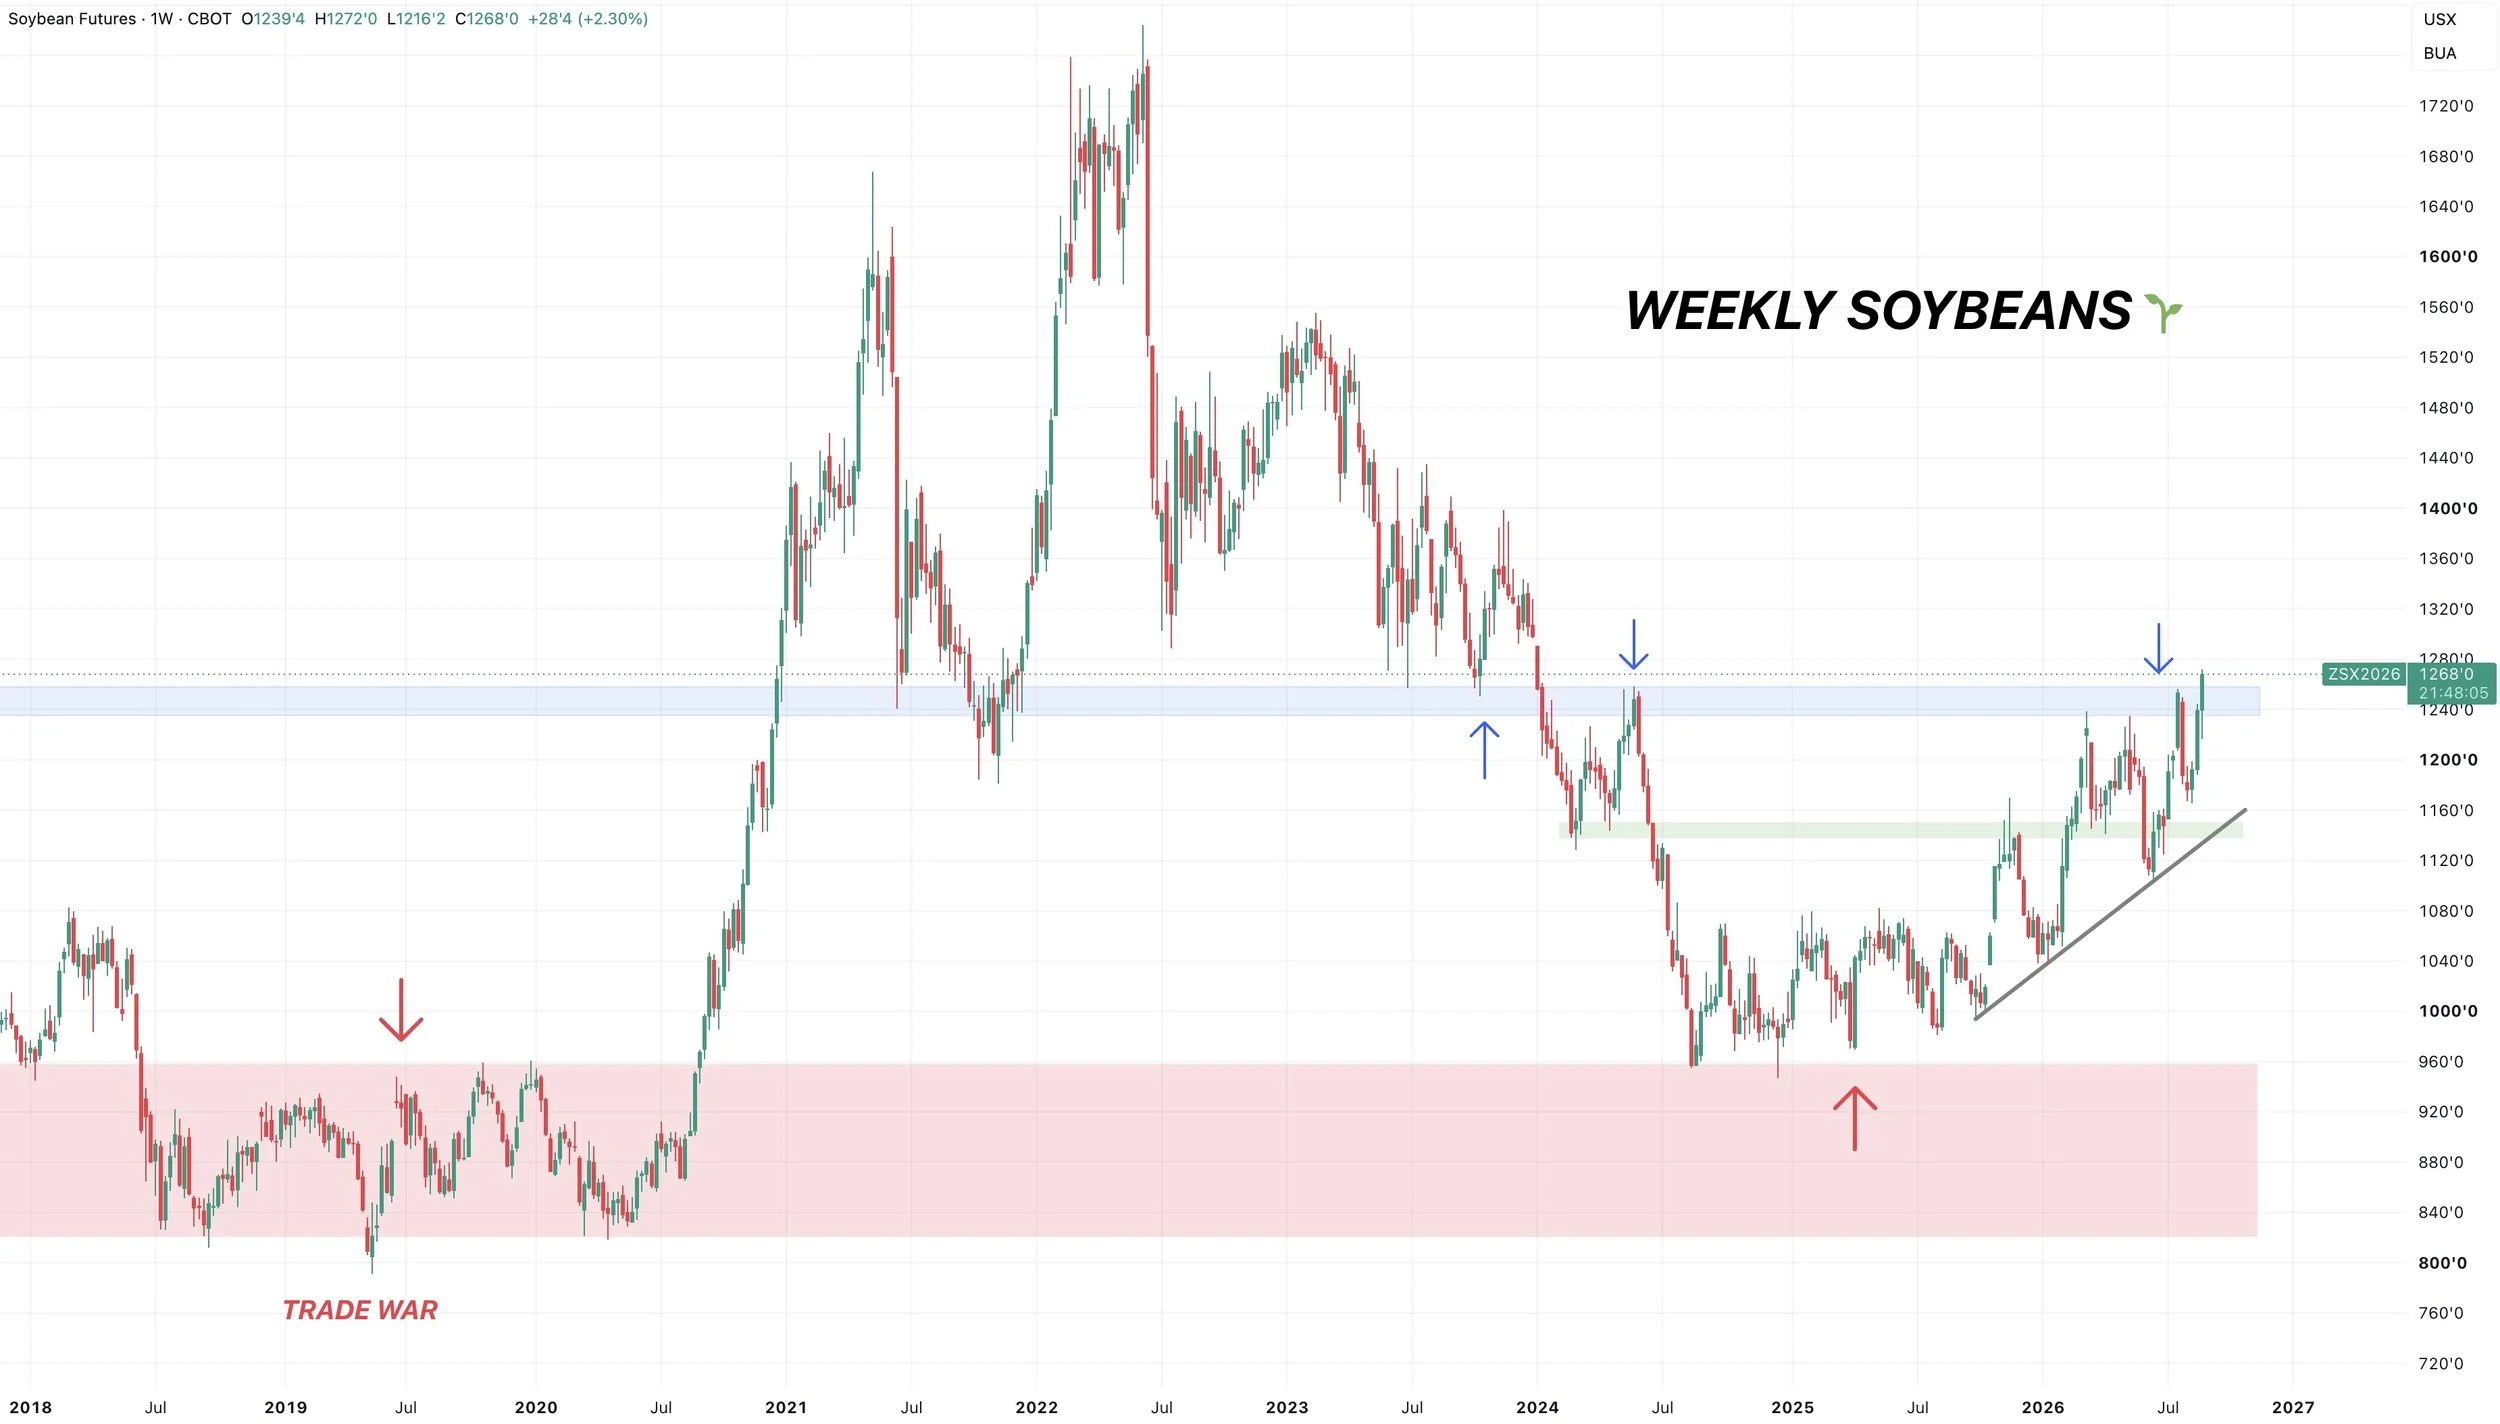
Potentially breaking out here.
We broke above those recent highs which was a pretty important level.
Not only is it the recent highs, but it's the highs from 2024 and the lows from 2023.
So breaking above this level would look good and potentially open the door to more upside.
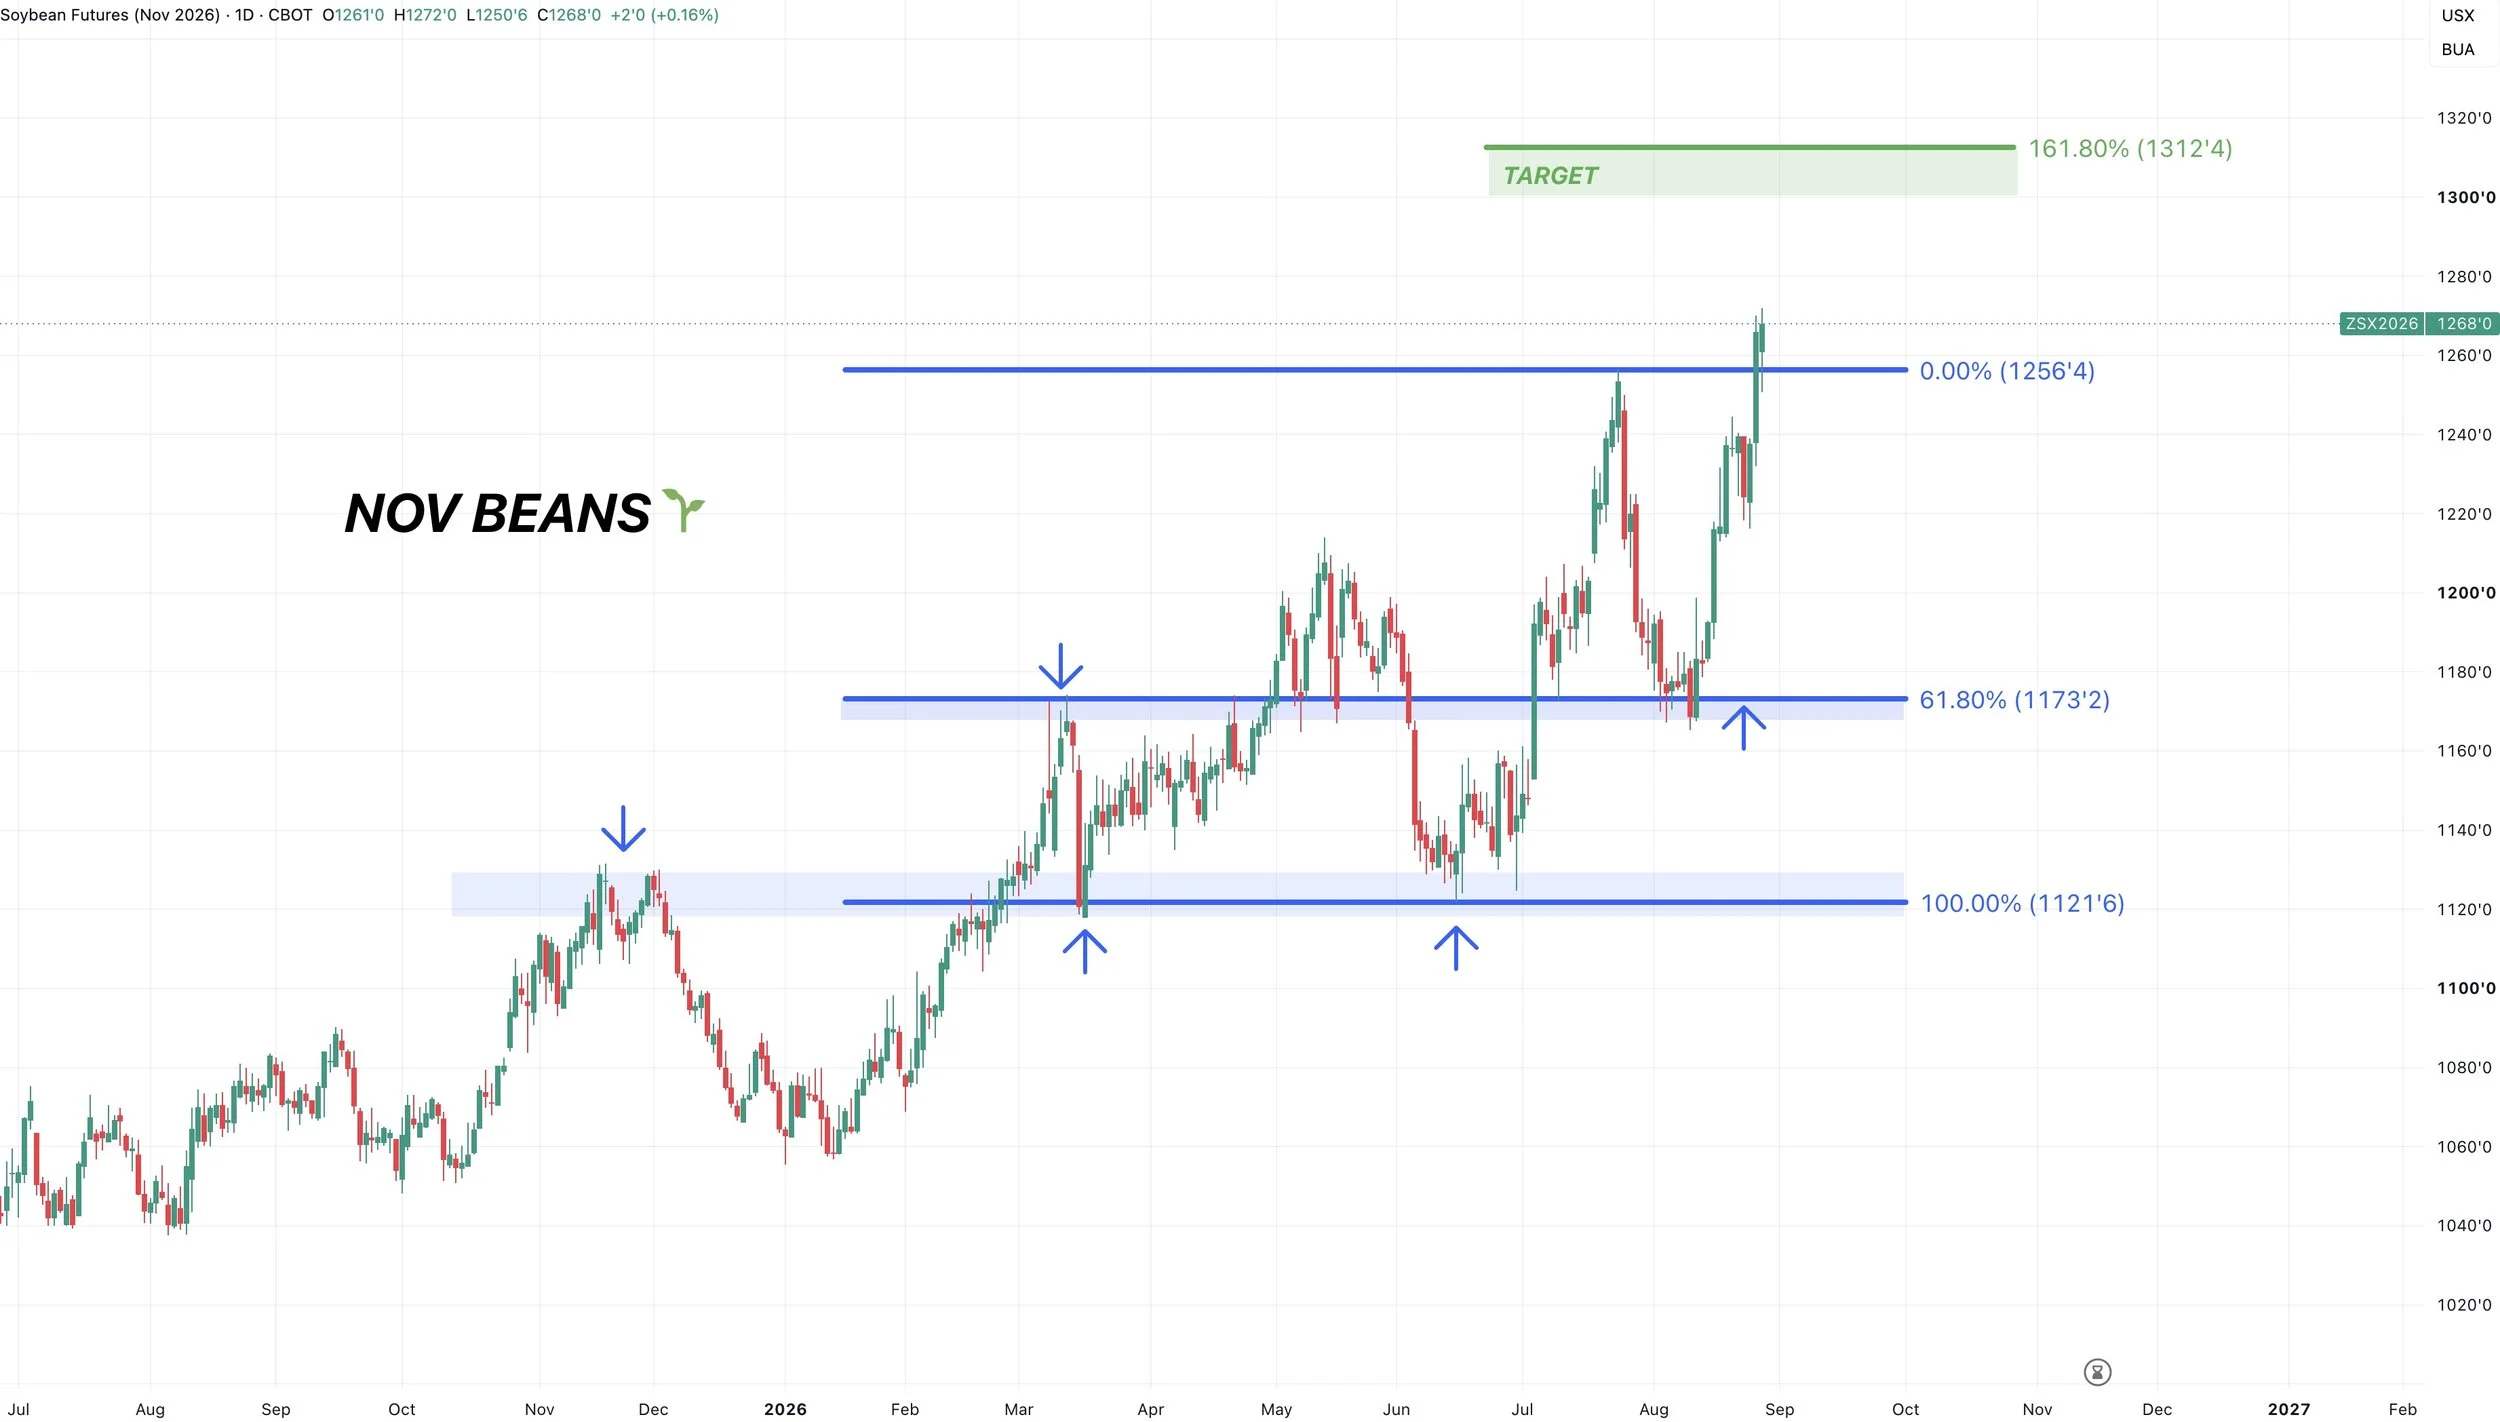
Nov Beans Daily Chart:
We broke above those July highs.
I am currently targeting the $13.00 area to take a few chips off the table.
$13.12 is the golden fib from the recent lows up to the July highs.
The golden fib means it's the 161.8% retracement of that move. Which is a common continuation target.
Wheat
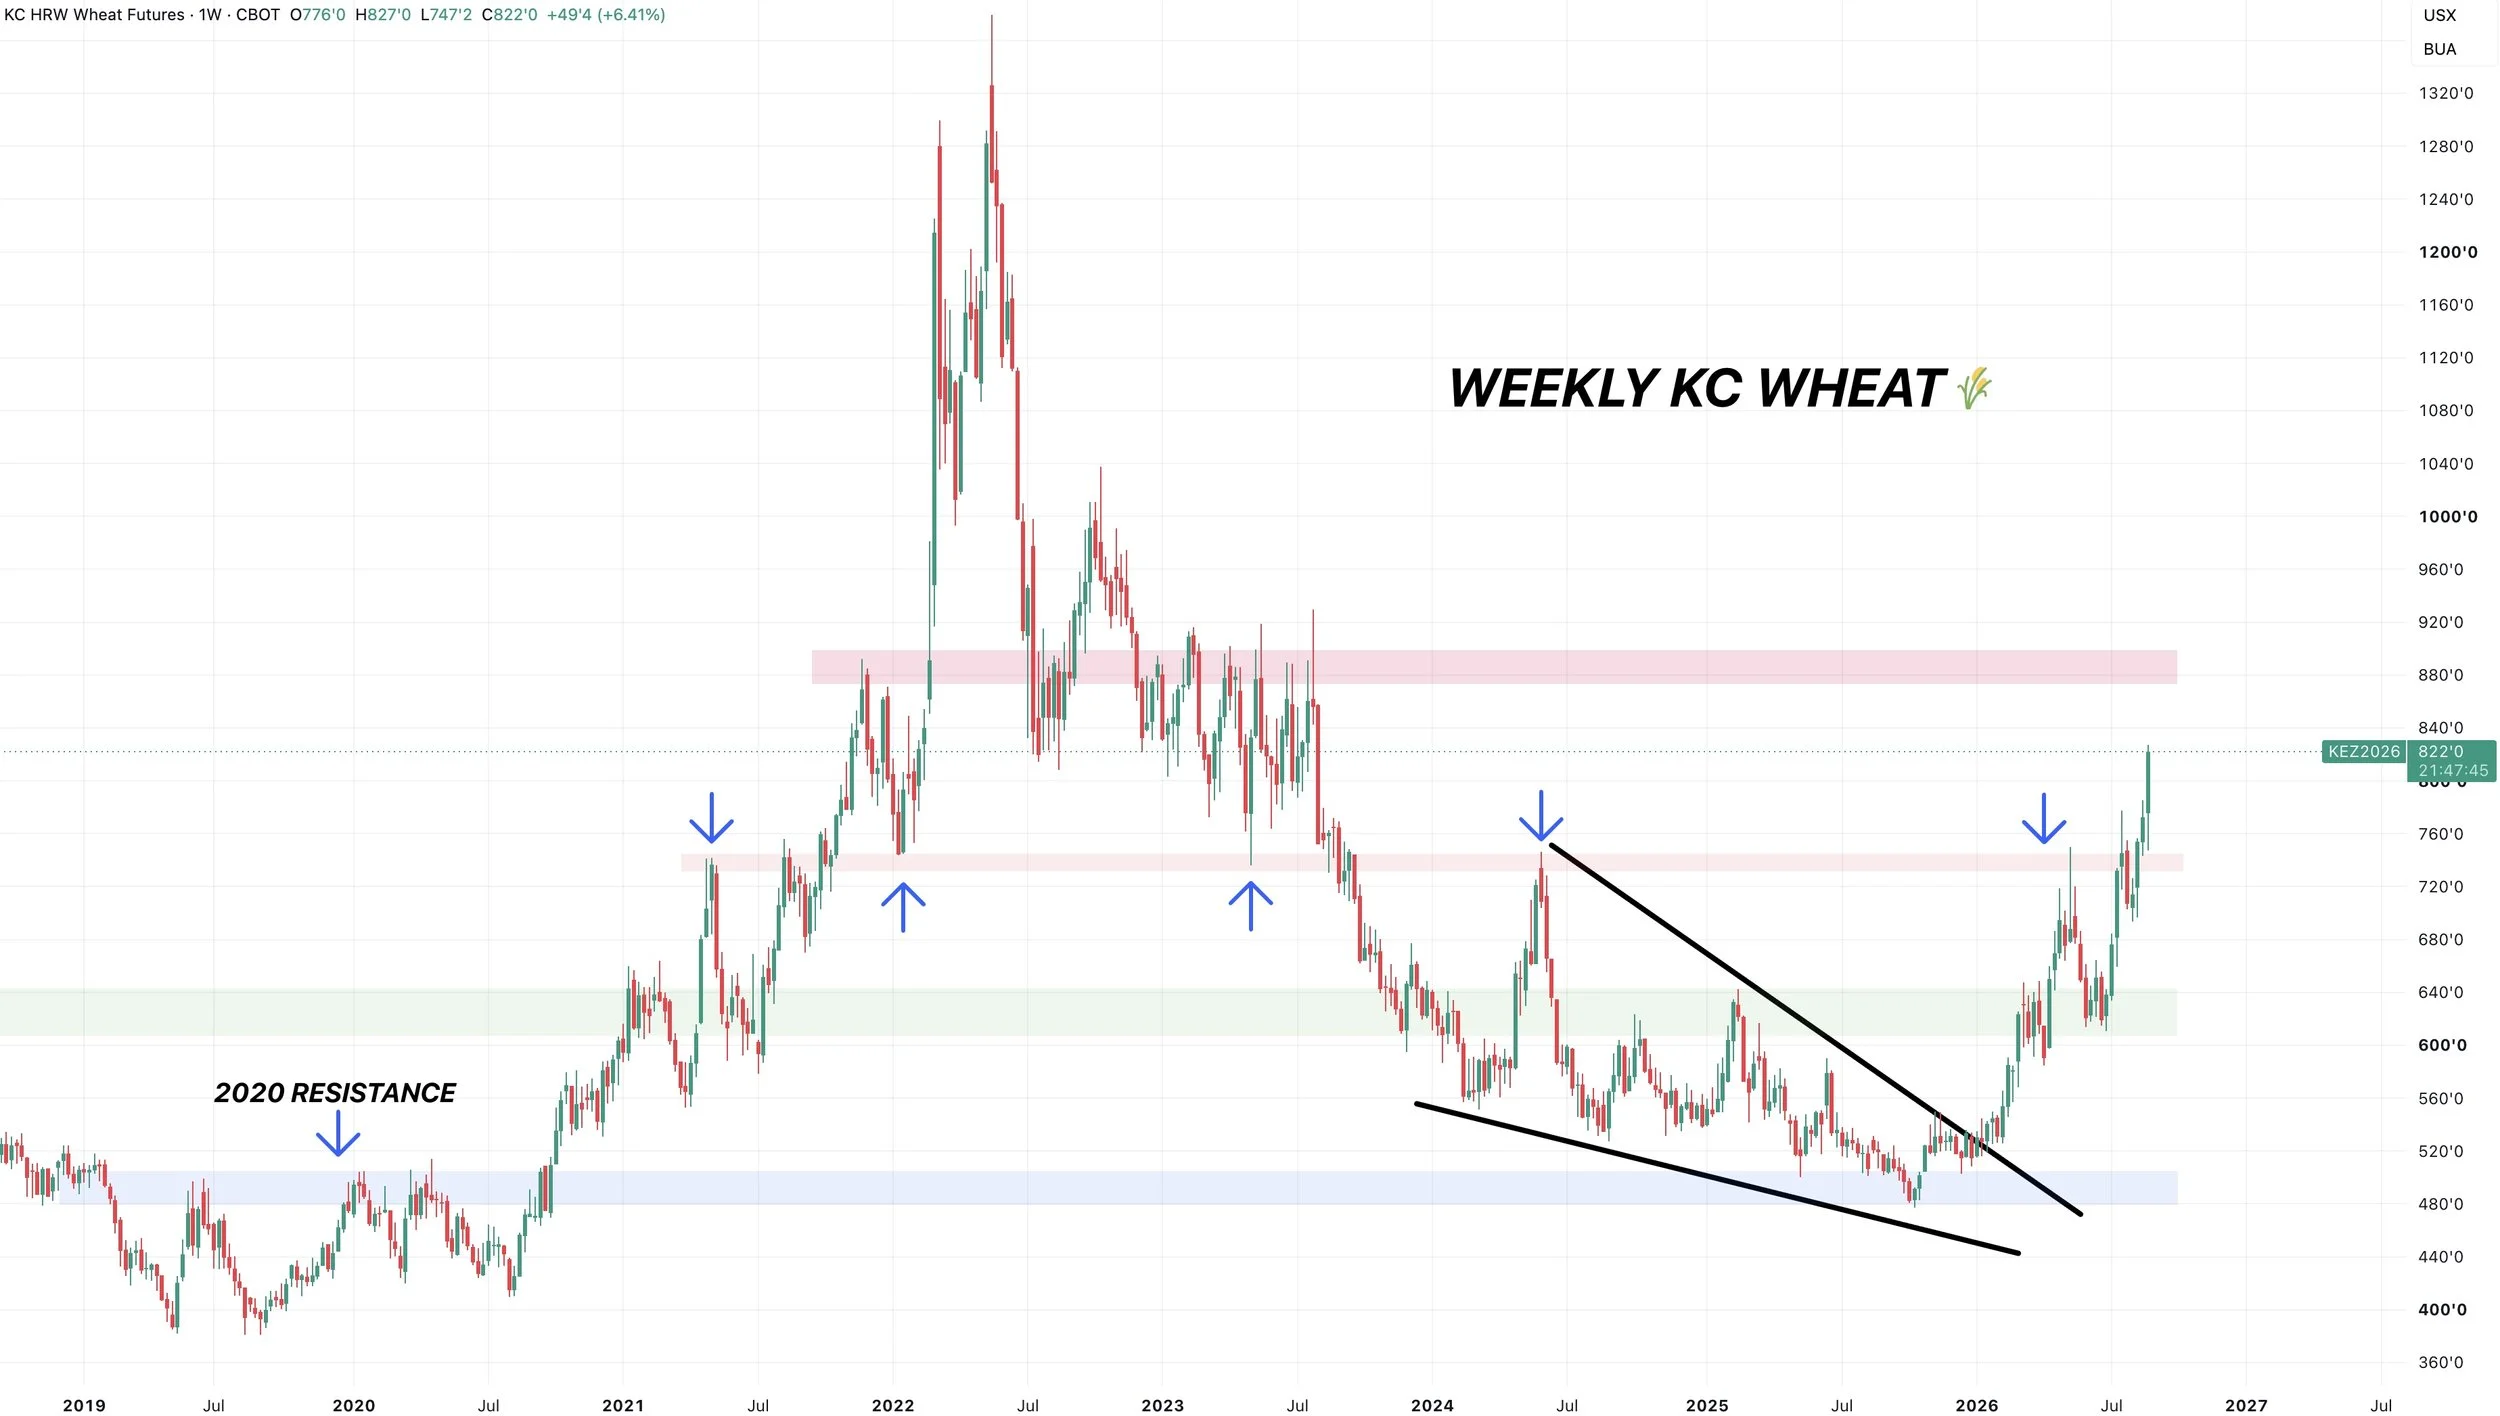
Weekly KC Chart:
We broke that key level a few weeks ago and are running as a result.
That $7.50 range was:
The recent highs.
Highs from 2024.
Lows from 2023 and 2022.
Highs from 2021.
So the chart looks great. And it's opening the door higher.
Monthly KC Chart:
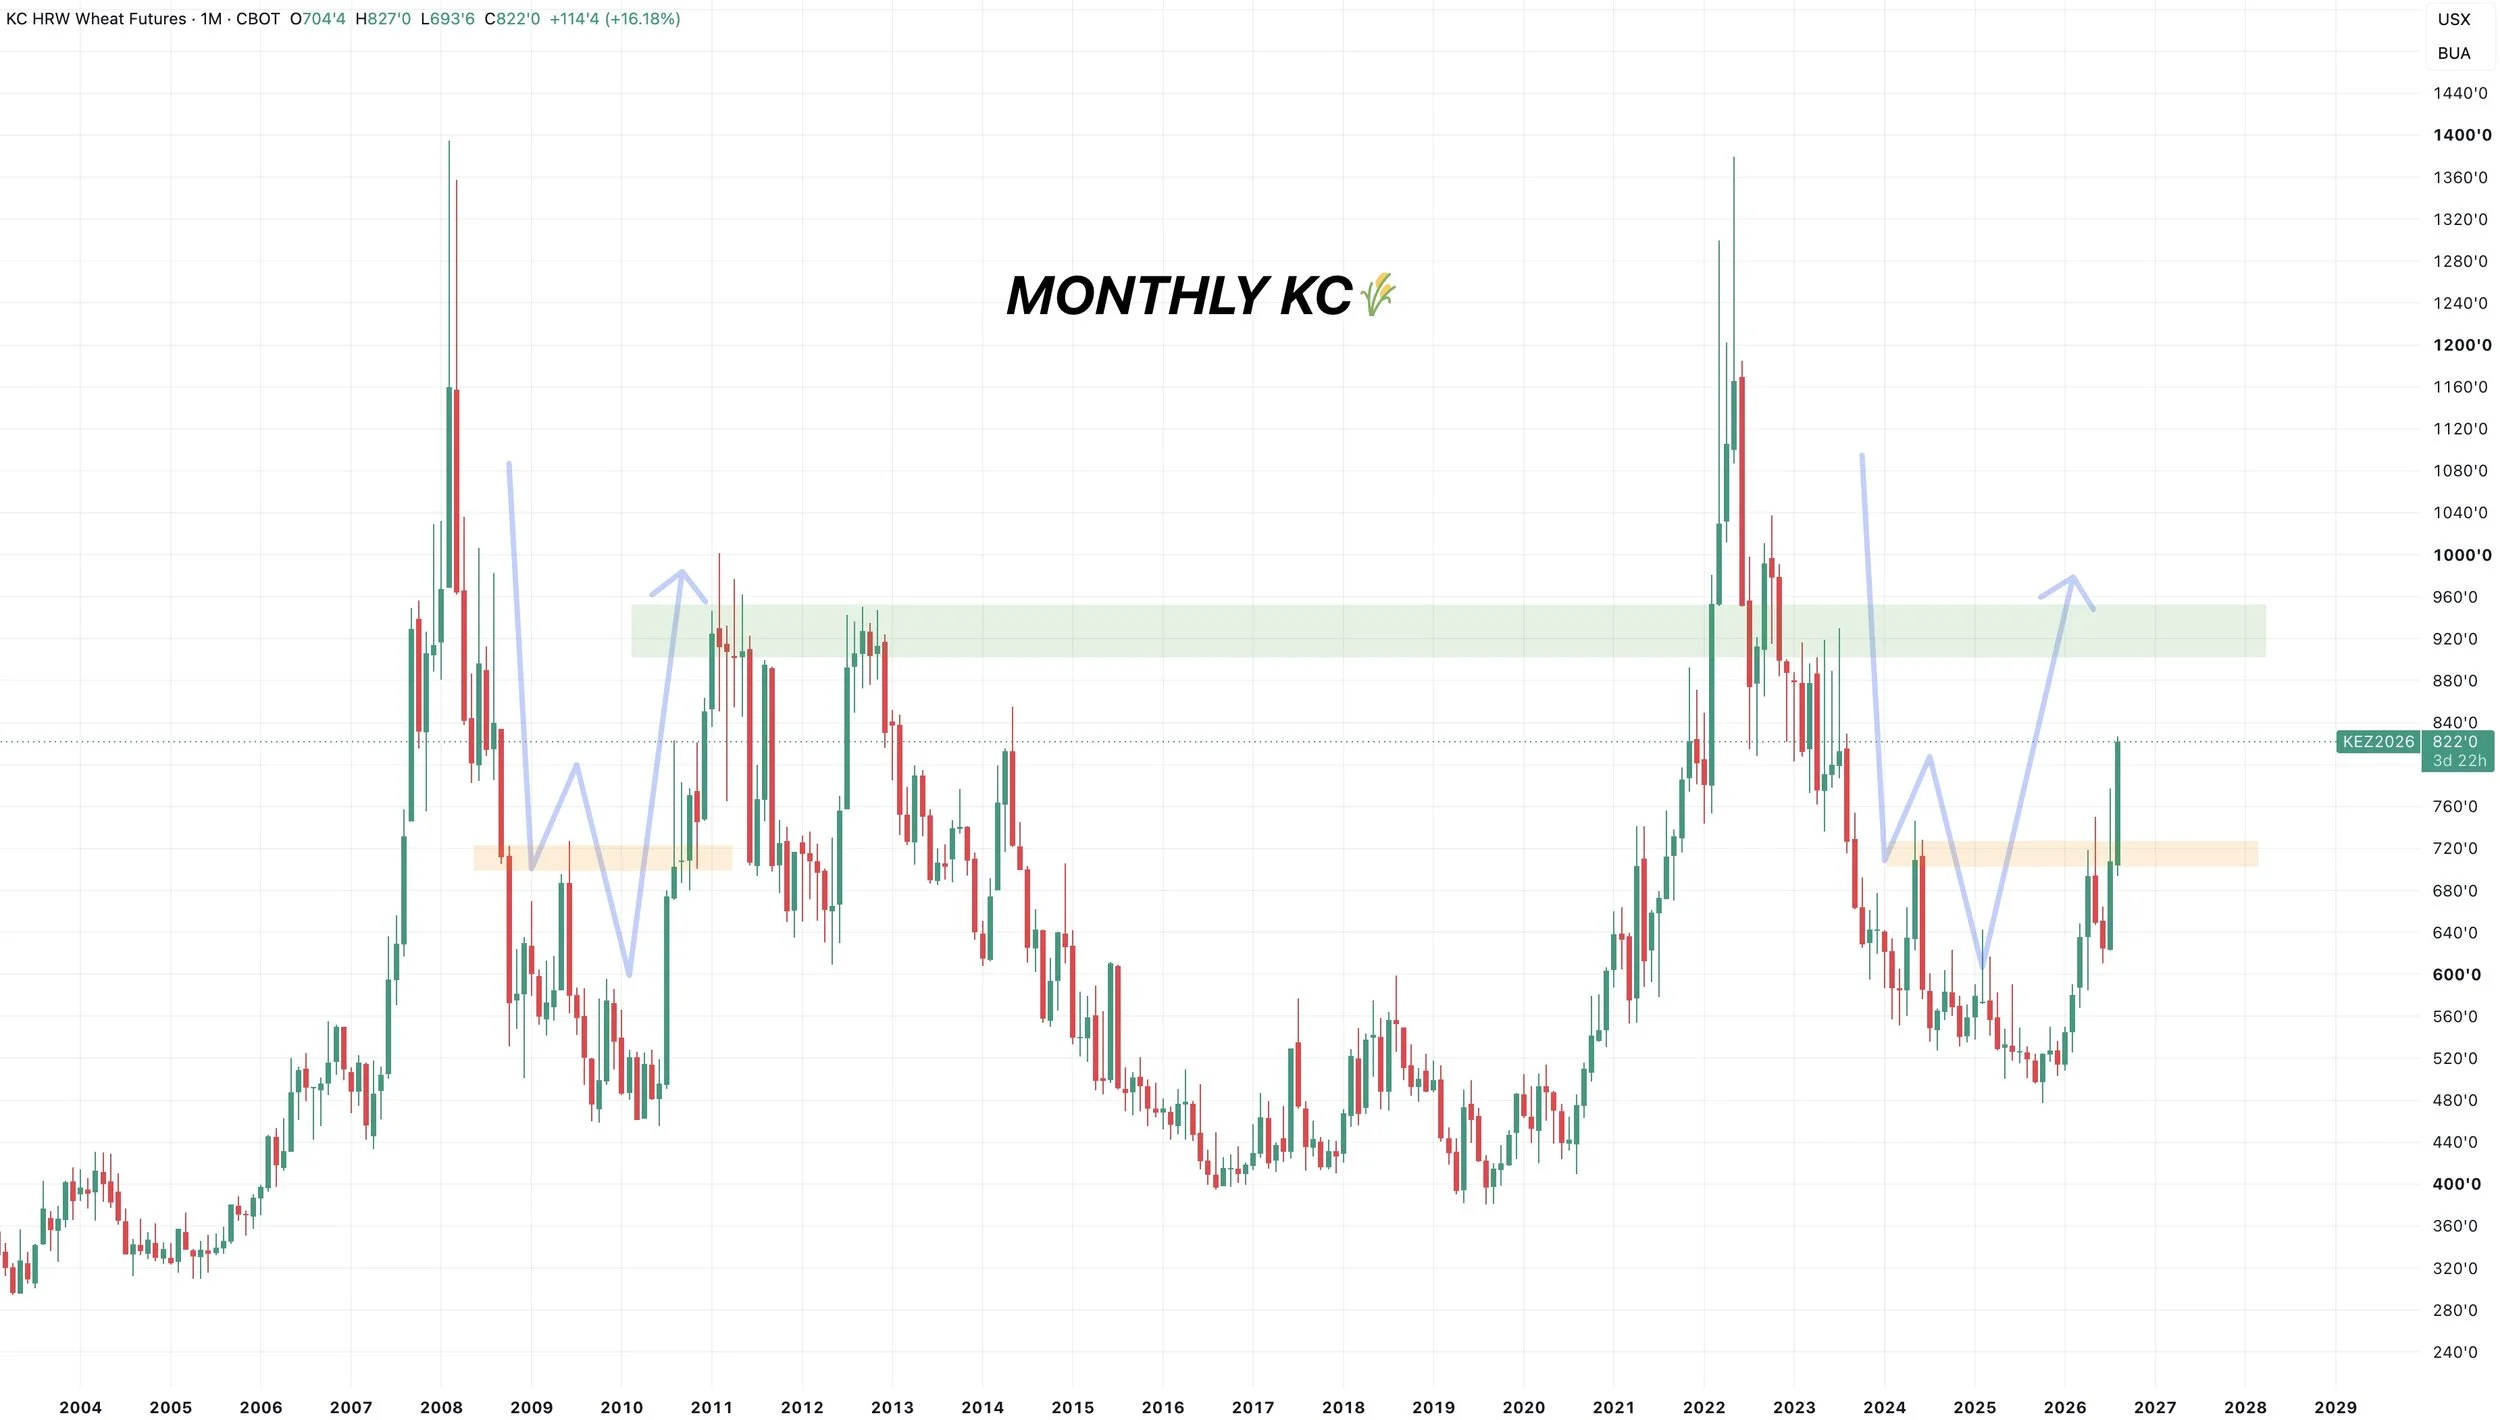
Here is an interesting chart that compares the current rally to the rally from 2008 to 2011.
Up until this point, they do look very similar.
We had that big spike, followed by a massive drop.
We then got a mini pop, followed by one last leg lower.
We then turned the market around.
On that 2011 run, we ran up towards that $9.00 range.
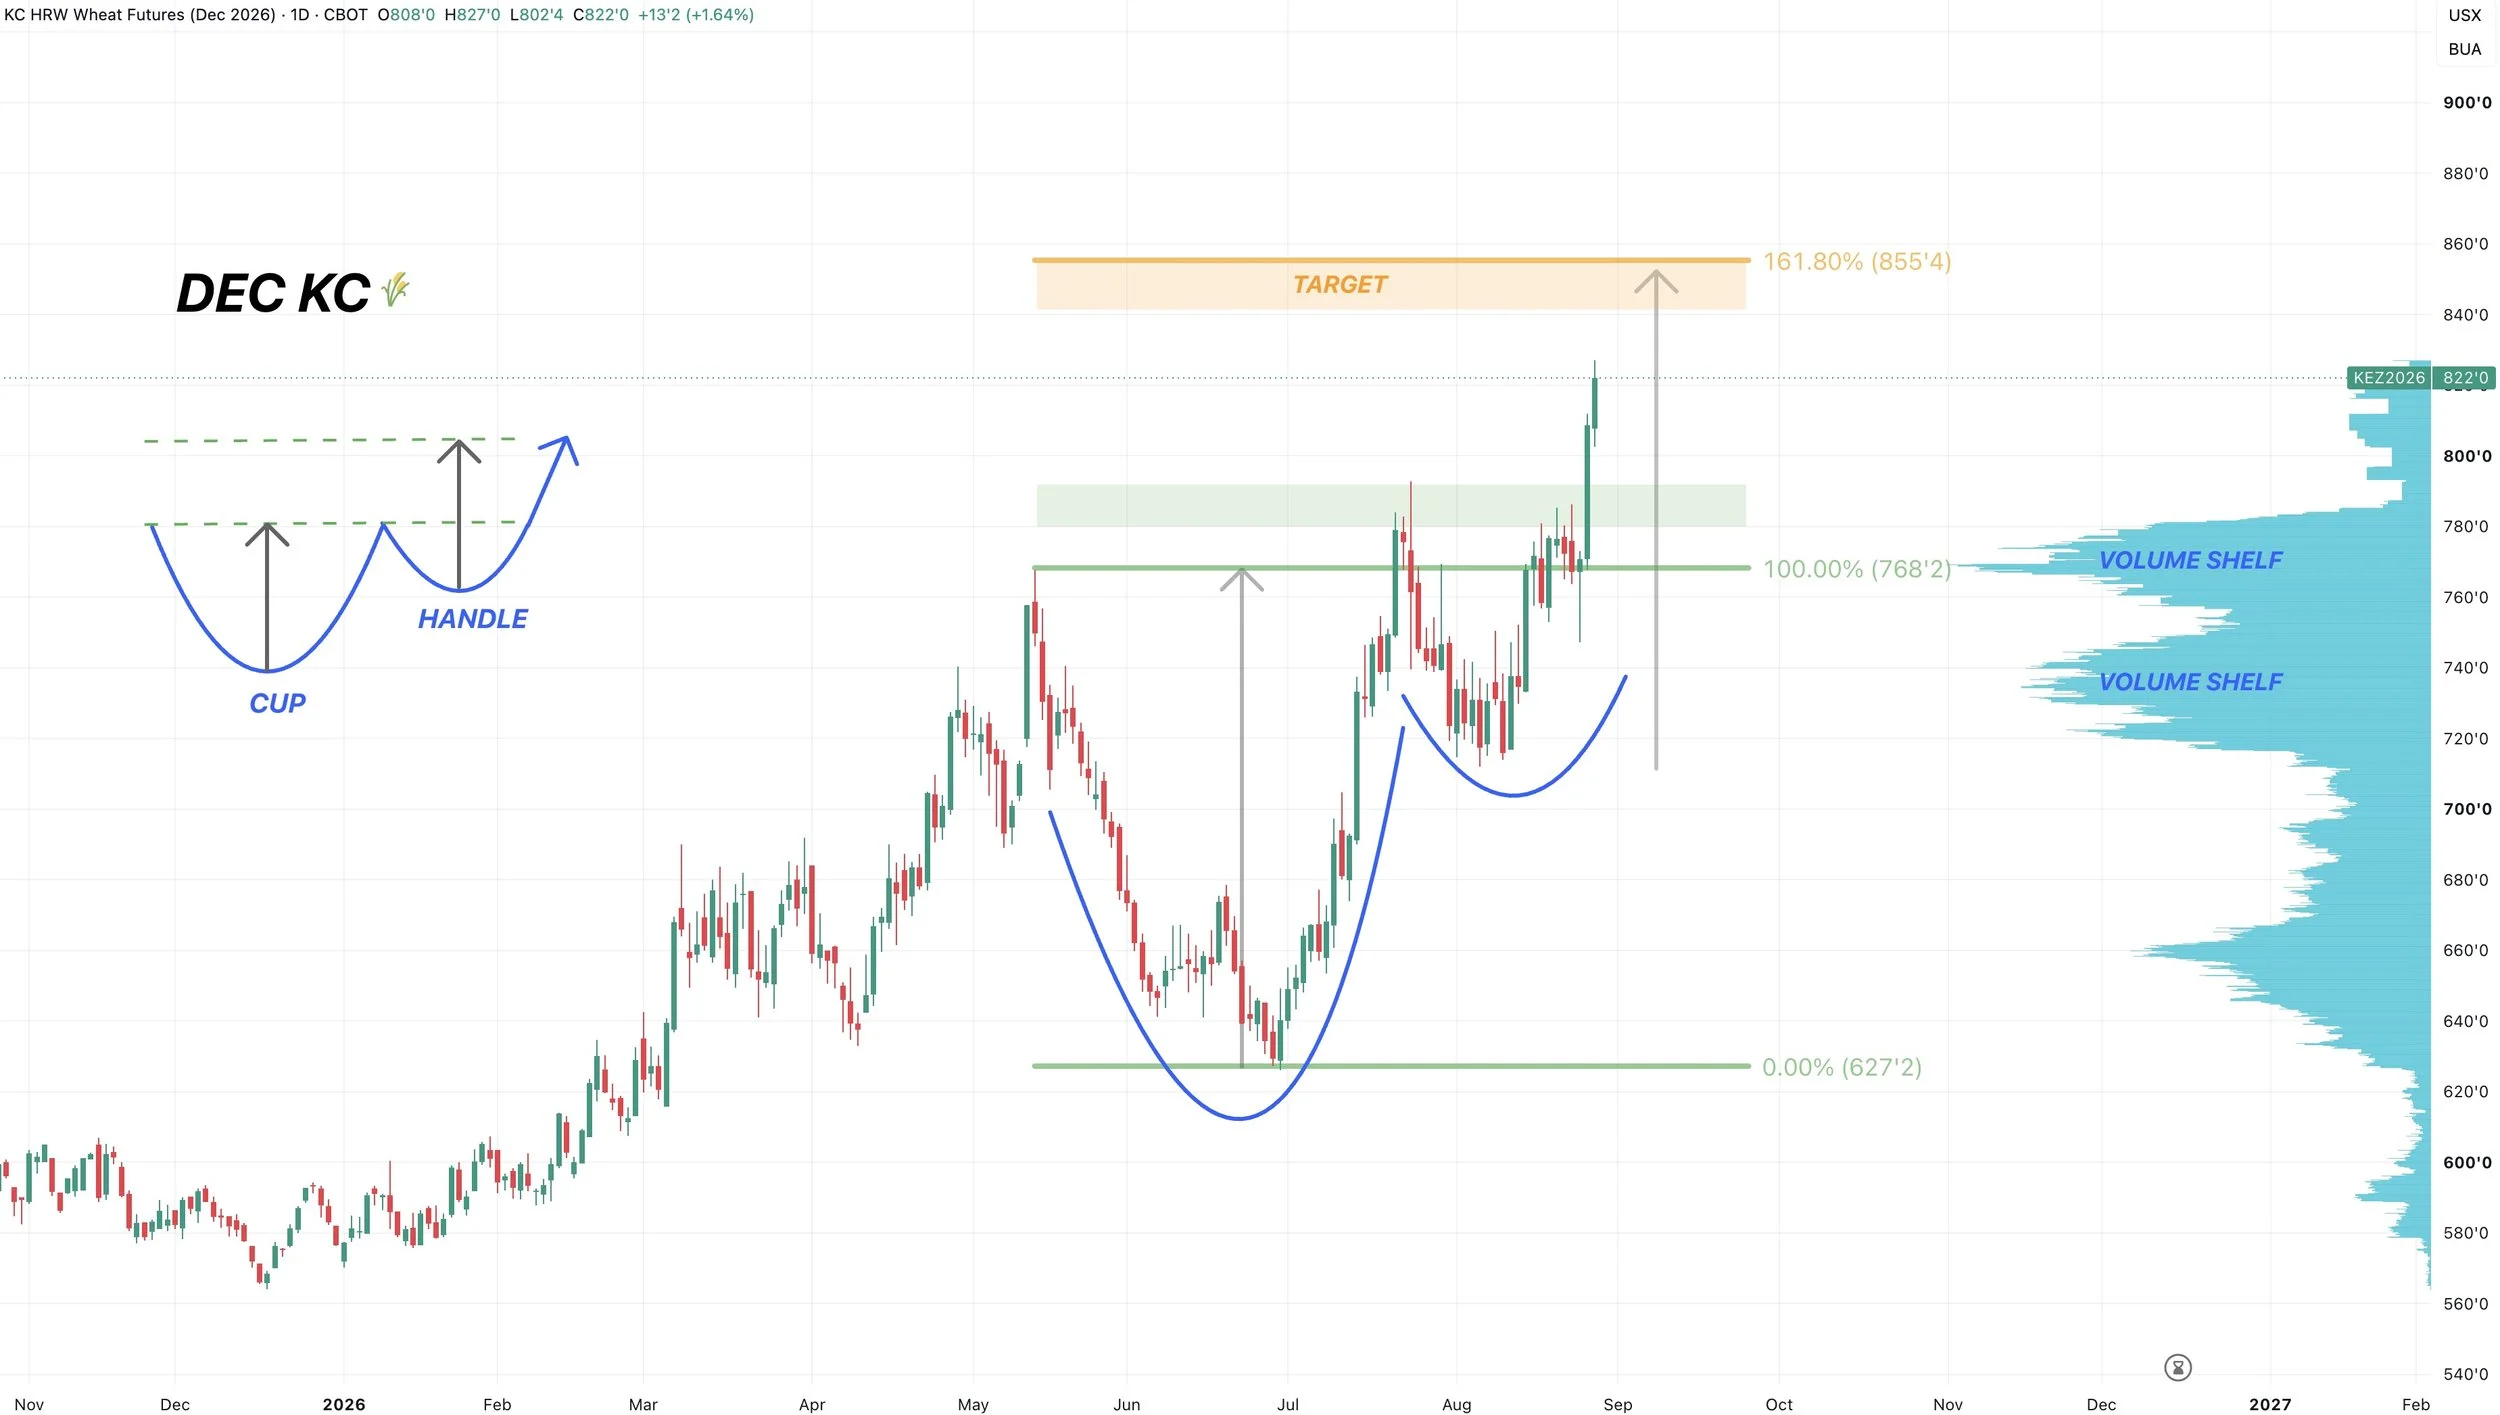
Dec KC Daily Chart:
We blasted off the volume shelf, posting new highs.
We still have this cup and handle pattern.
The implied move takes you to $8.40 to $8.50
That same range is the golden fib from the summer lows up to the May highs.
So that's going to be an area of interest and where I'd like to do something if it came.
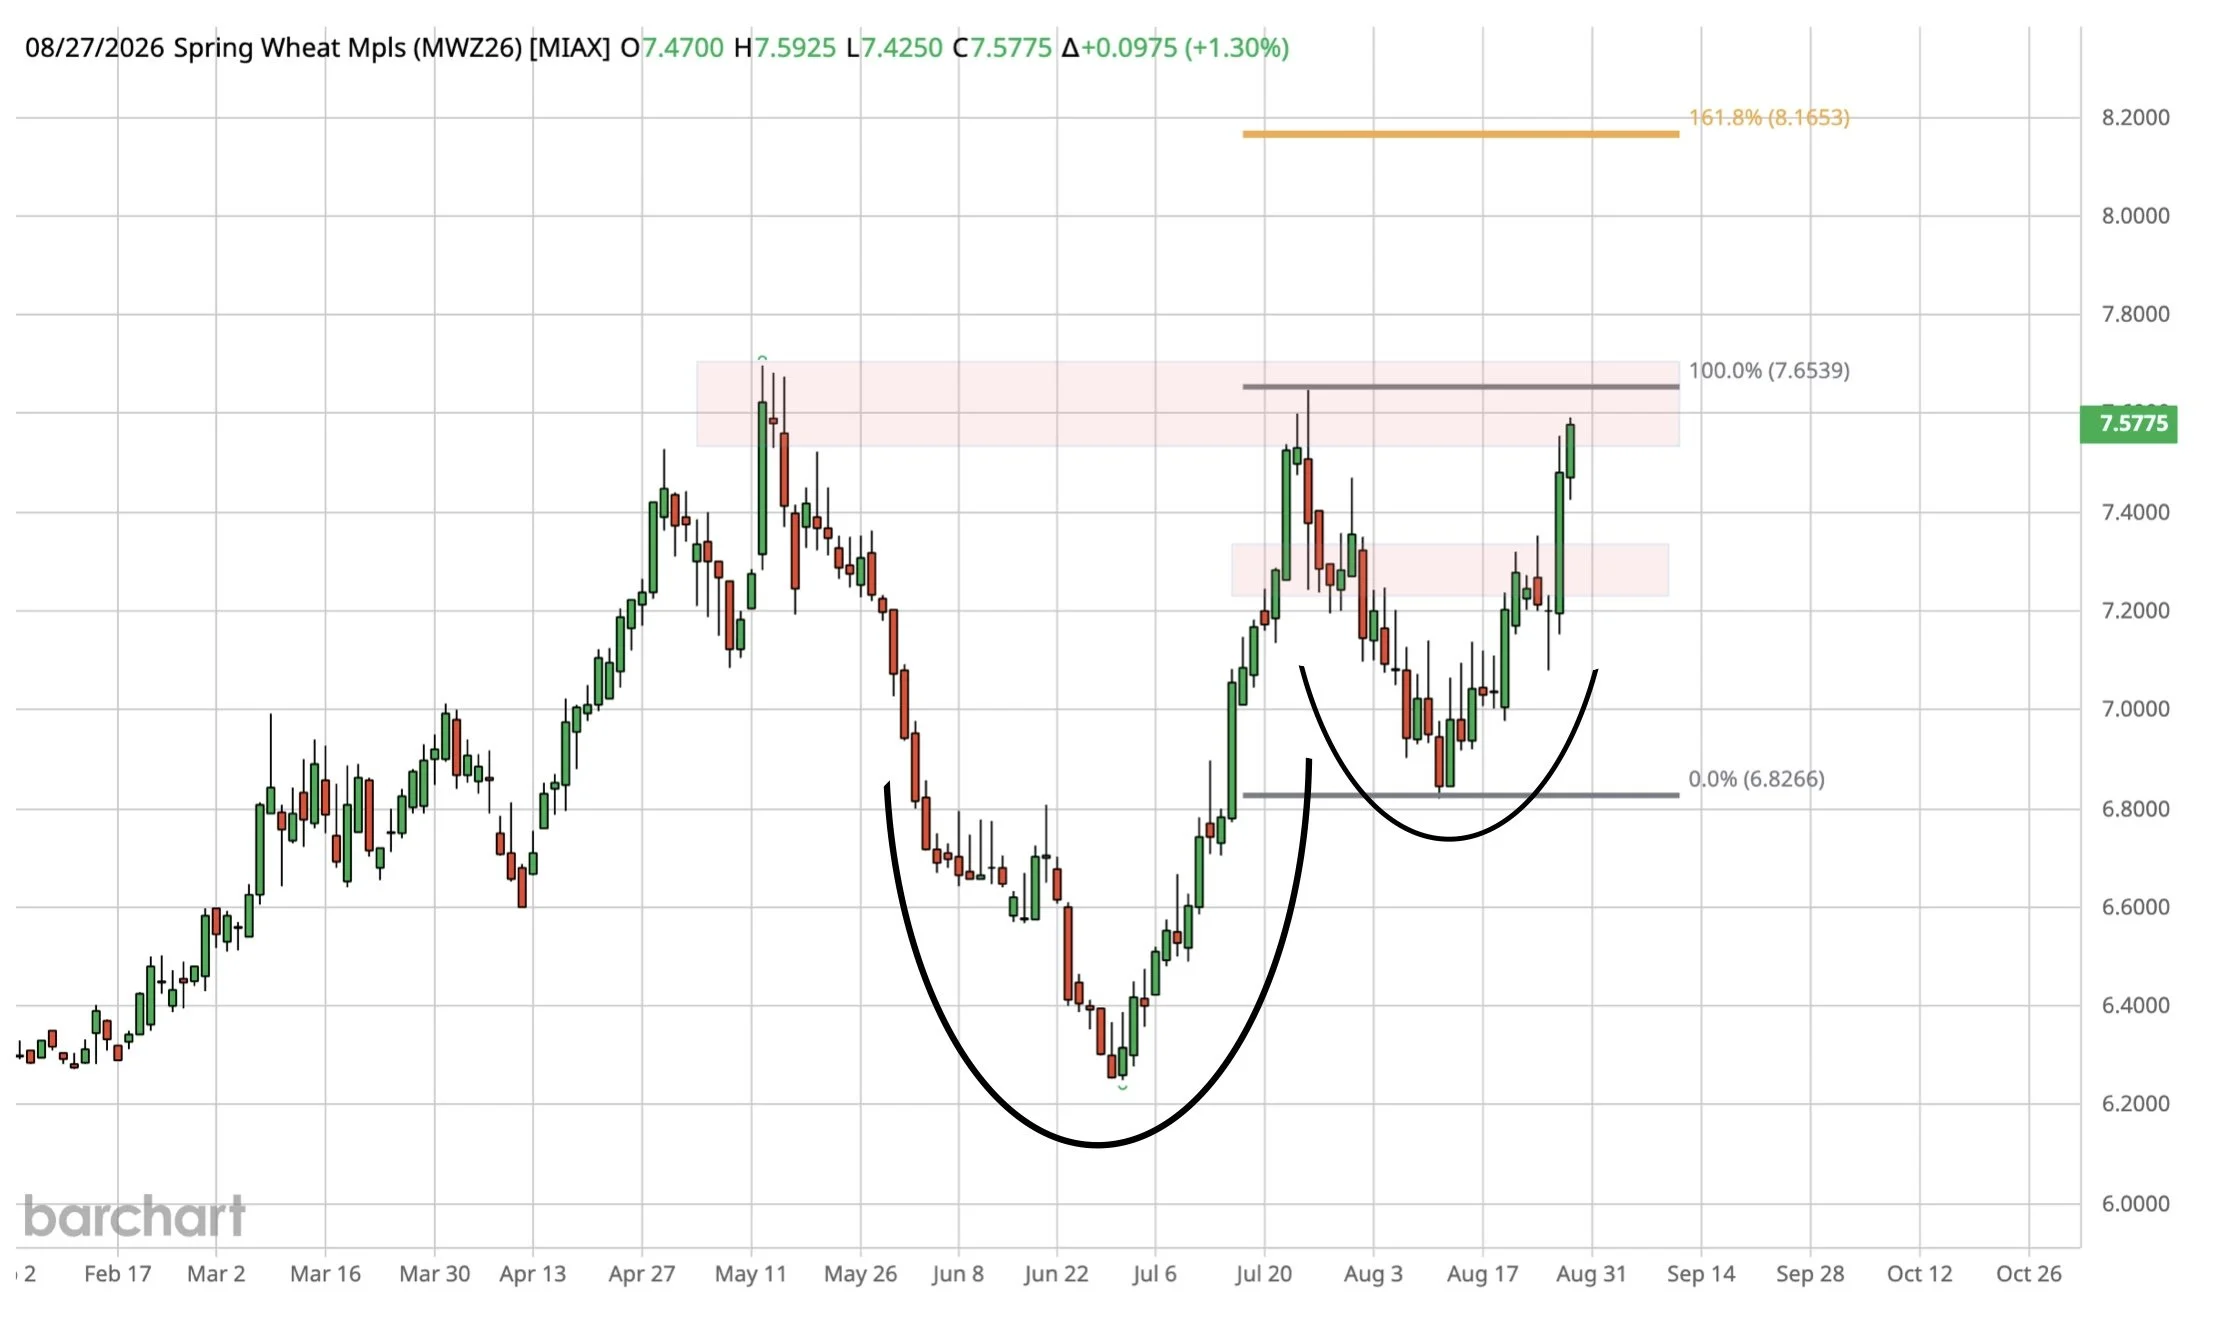
MPLS Wheat Chart:
Testing this high time frame resistance once again for the 3rd time.
If we can get the breakout, it could spark a leg higher.
We still have this cup and handle pattern here as well.
We have the golden fib that sits around $8.15 which is going to be an area of interest if we break out.
Cattle
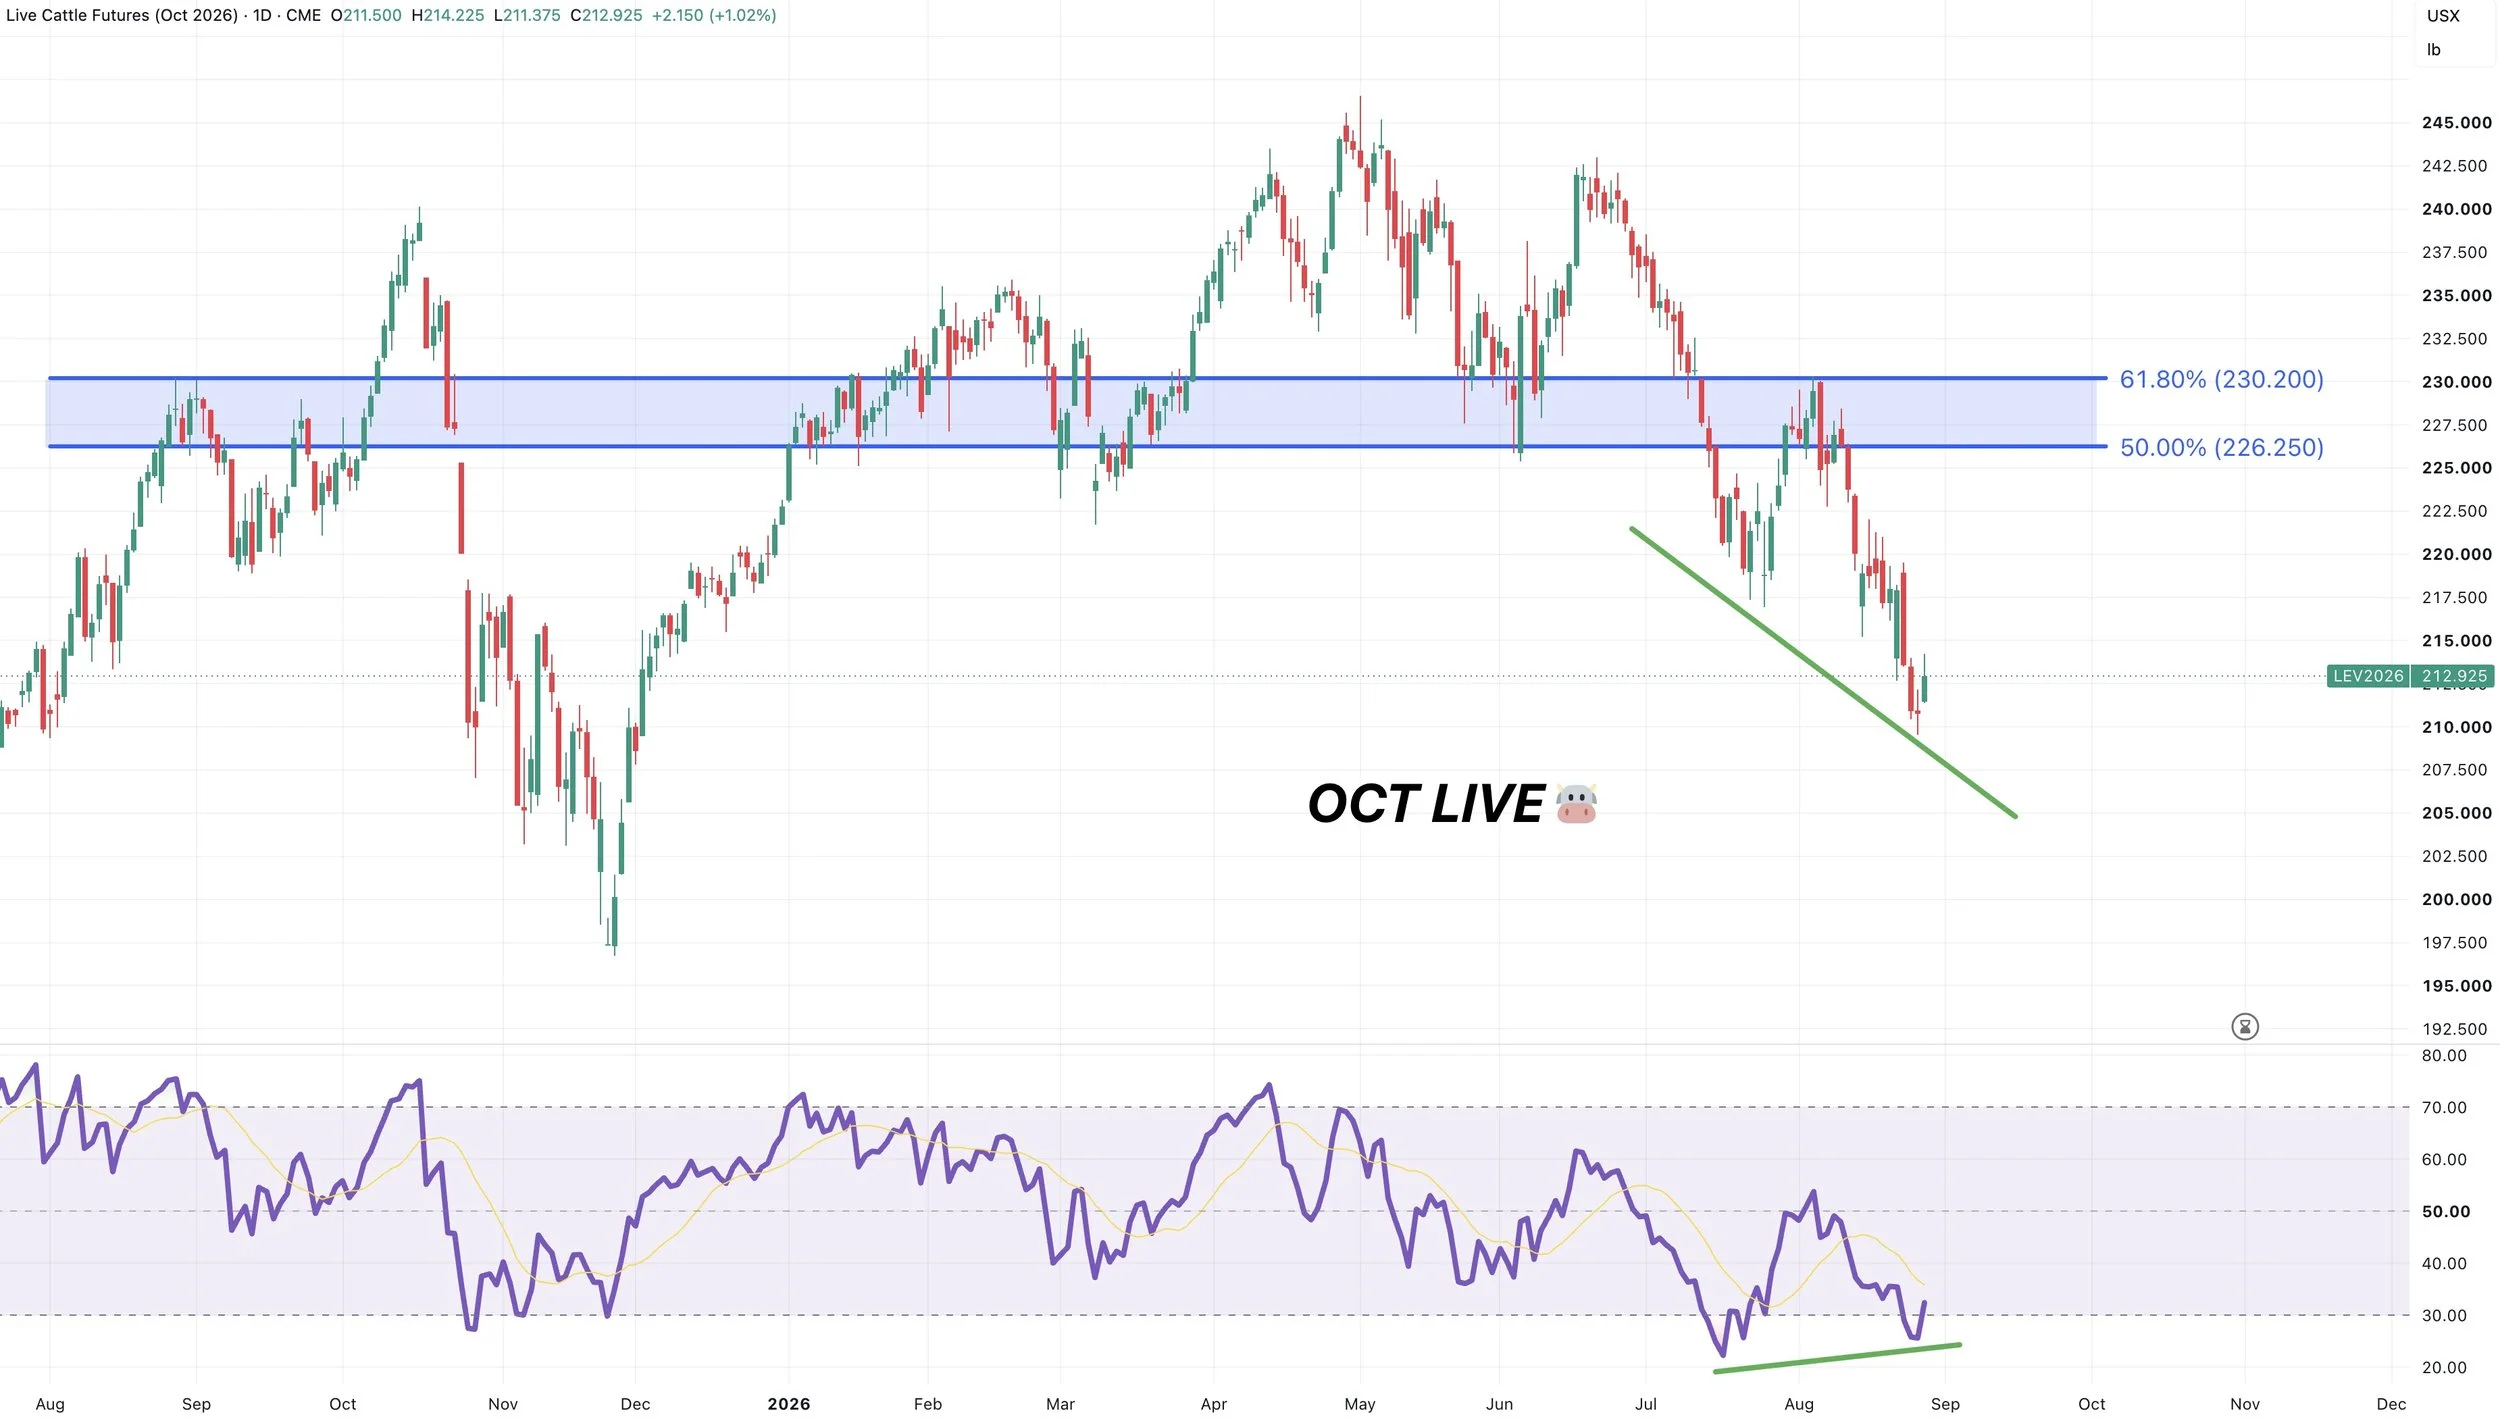
Oct Live Chart:
Cattle still free falling, but had a decent day today.
I'd want to protect any sizeable rally towards the 50-61.8% retracements.
That same level is prior support and resistance.
We are still showing some bullish divergence on the RSI, so that gives some optimism for at least a dead cat bounce out of here.
But overall the trend in cattle is clearly lower unless you managed to break above that blue box.
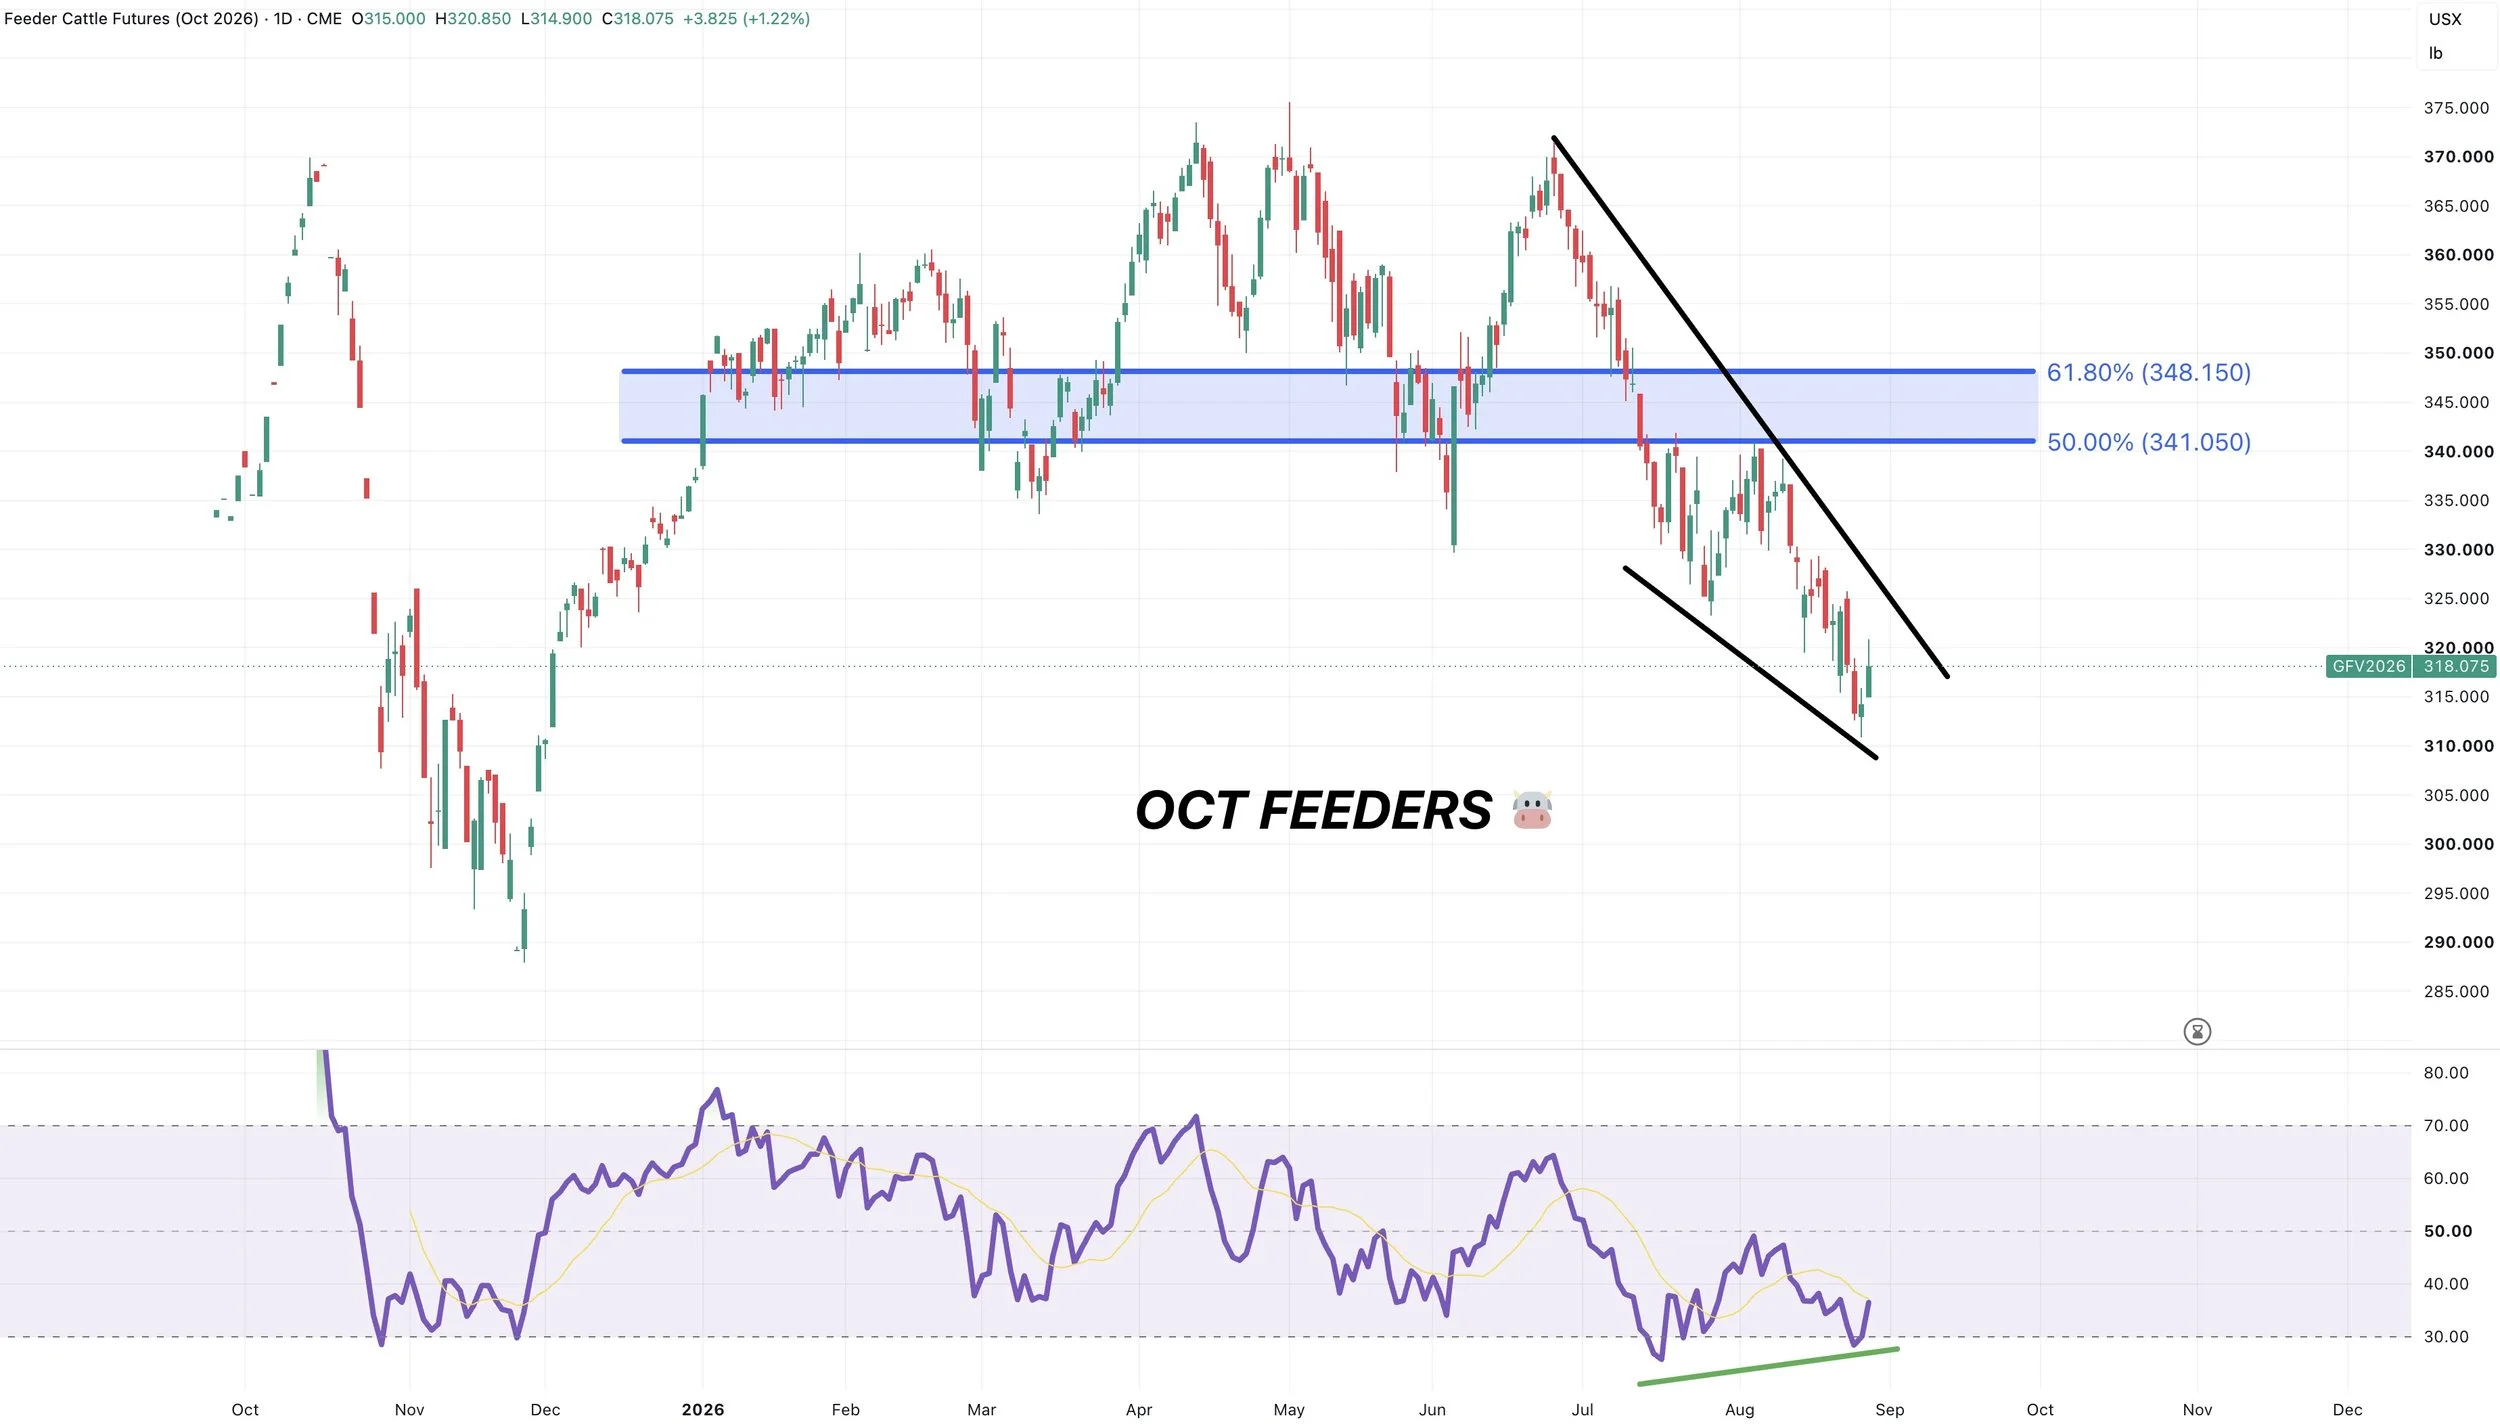
Oct Feeders Chart:
Same thing here.
Looking to reward any sizeable rally.
We do have somewhat of a wedge pattern to watch if we get a breakout.
Also still showing bullish divergence which is about the only positive thing down here.
Want to Talk?
Our phones are open 24/7 for you guys if you ever need anything or want to discuss your operation.
Jeremey & Office: (806)484-1214
Sebastian: (605)280-1186
Email: sfrost@dailymarketminute.com
Hedge Account
Interested in a hedge account? Use the link below to set up an account or give us a call.