
GRAINS KEEP RUNNING
AUDIO COMMENTARY
New highs across the grains
More issues in the Black Sea
Breakouts on the charts in grains
Yield debate continues to accelerate
There is plenty of farmer selling but someone is buying the dips in this market
If you have to move stuff then reward these prices. If you do not to move stuff then do not get carried away
Who should consider 27 sales or not?
If you know you are oversold. What to do?
The simplest strategy for being oversold
Could this be similar to 2010 or 2020?
Don’t be afraid to protect yourself. But do not let buyers talk you into fear selling
Make the buyers pay up. Don’t give grain away
We have some issues around the world
Prices need to go higehr to slow demand
There is a ton of potential. The options agree
Tools that add to your bottom line
Using premium to lock in worse case scenarios
Market thinks crops are getting smaller
Balance sheet can’t afford Pro Farmer yield
This market is why marketing isn’t one size fits all
Turning the odds in your favor
How to use targets and floors
Weekly corn breaking out? (Chart below)*
Next targets below audio*
2026 vs 2020 vs 2010 comps below audio*
Listen to today’s audio below
Want to talk?
Office: (806)484-1214
2026 vs 2020 vs 2010
I’ll be diving into these more in tomorrow’s video update but thought I’d throw them in here today.
Here is Dec-26 compared to Dec-20 and Dec-10.
They do look pretty similar.
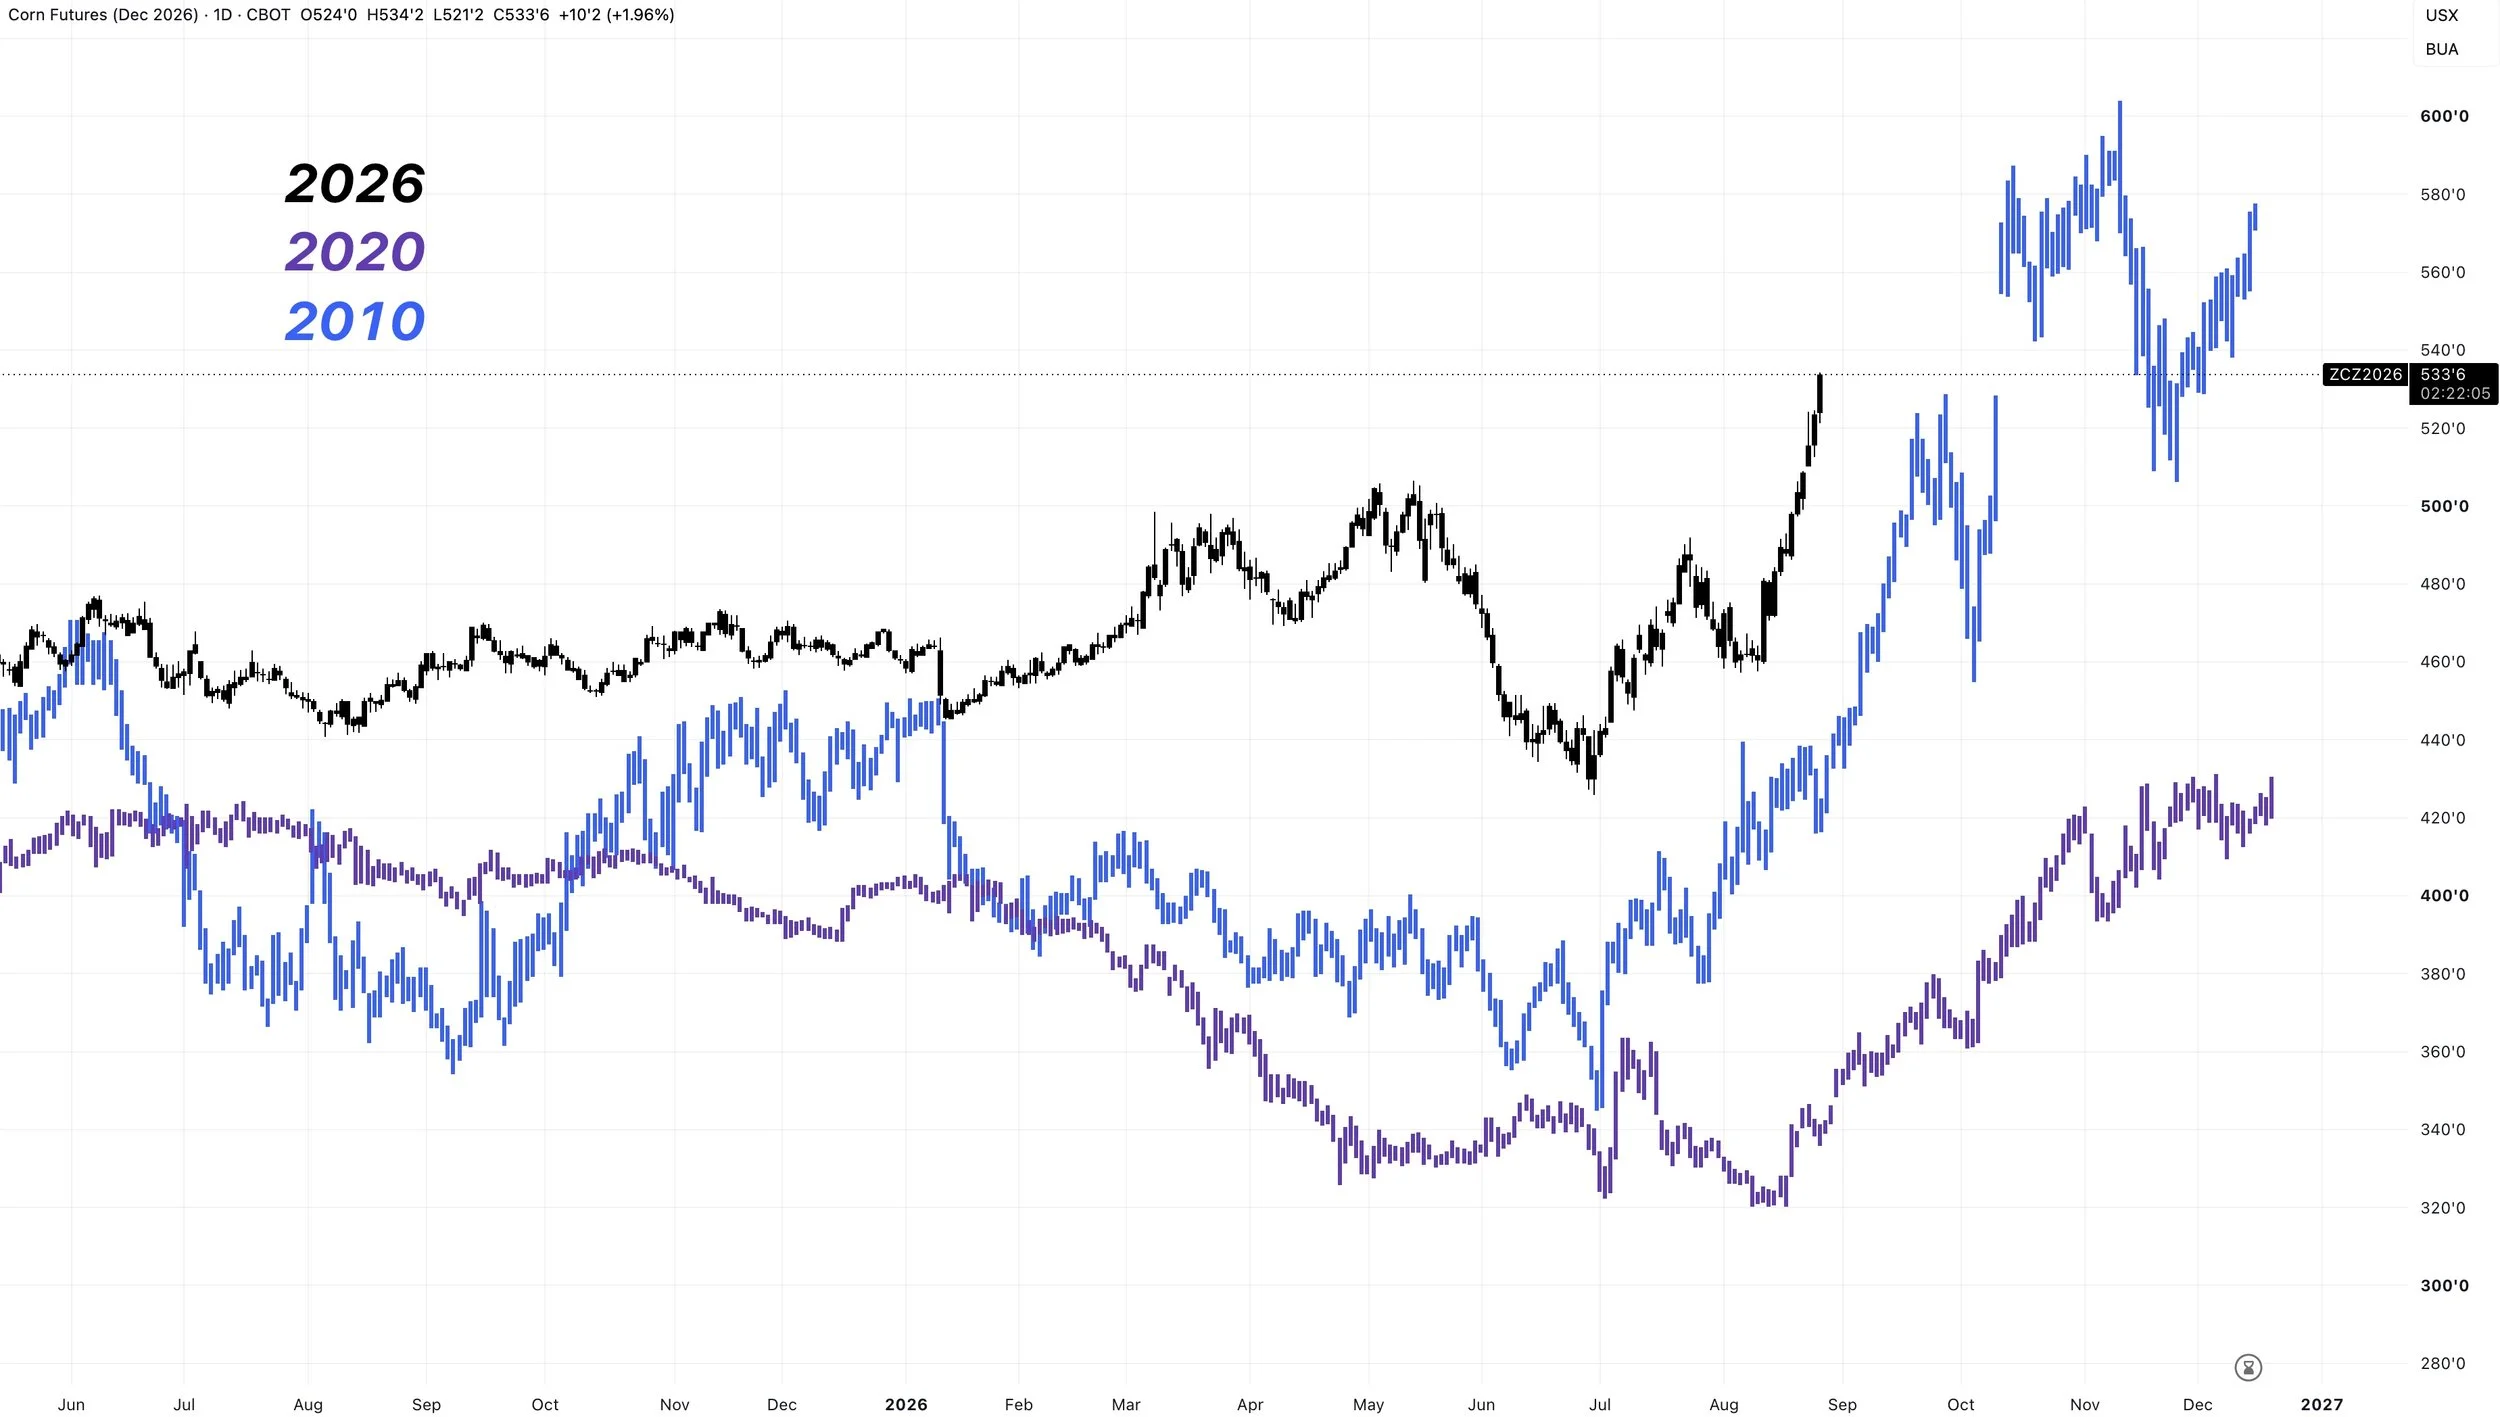
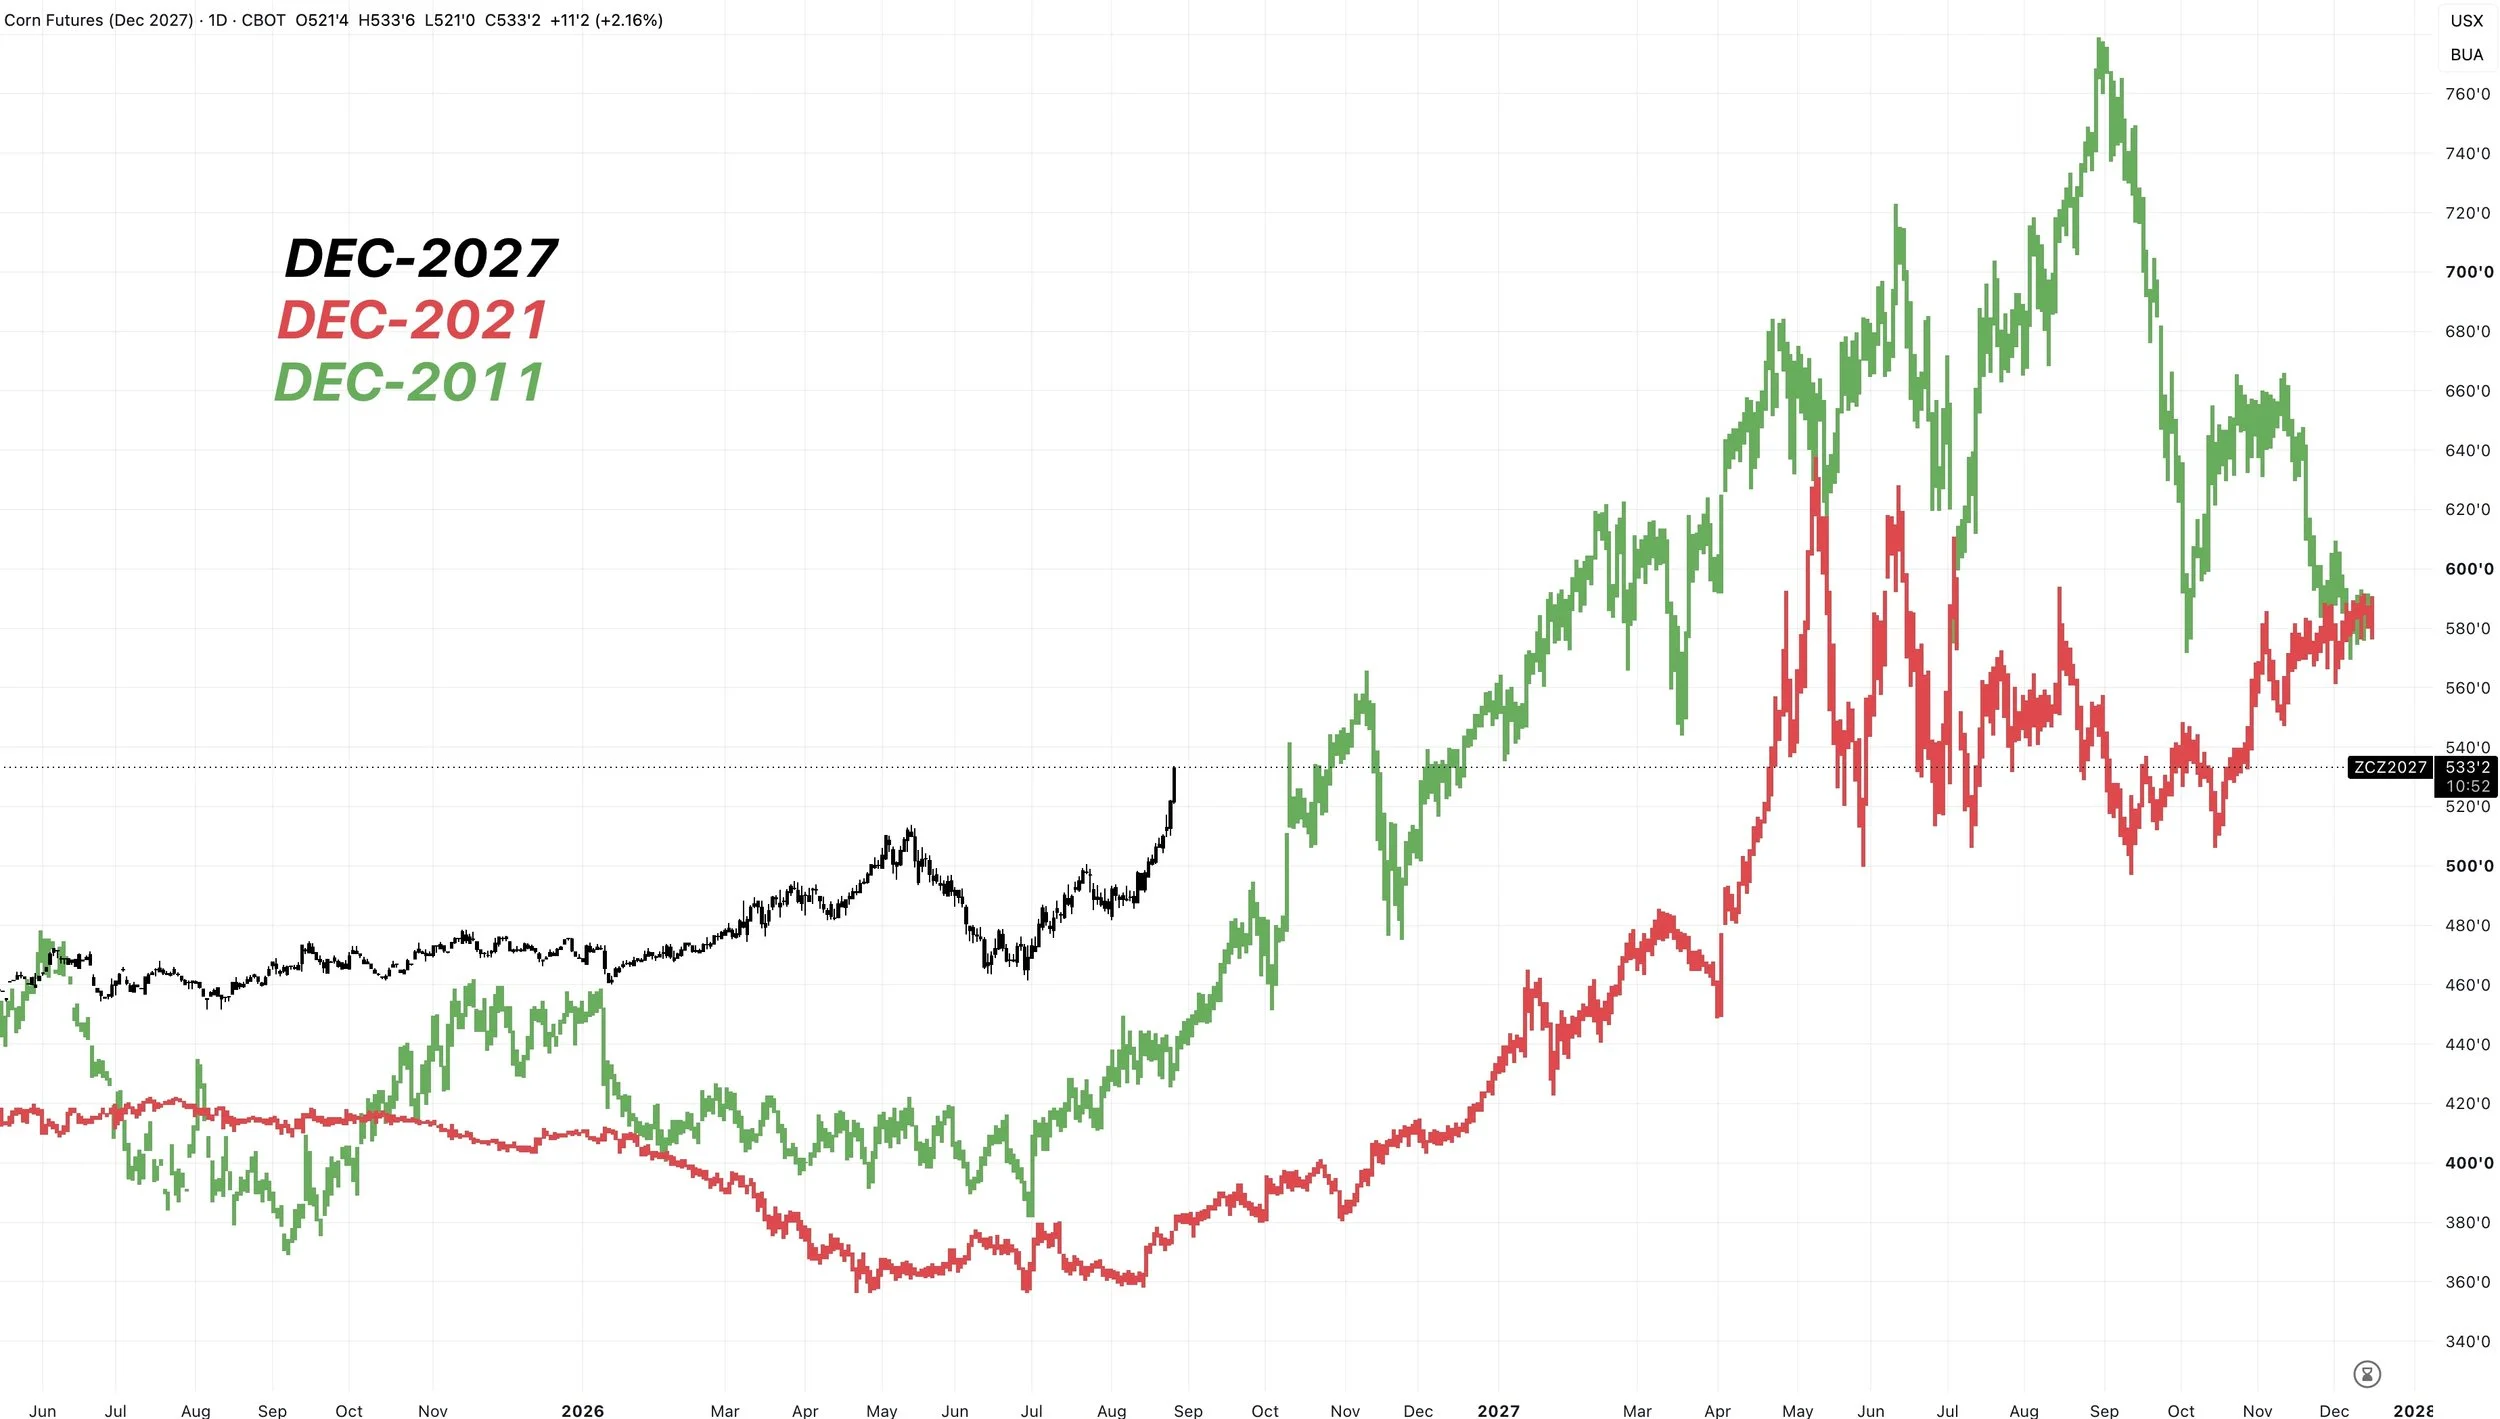
This next chart gives you a better visual of the continuation of the rally from 2020 and 2010.
This is Dec-27 vs Dec-21 vs Dec-11.
Again, I’ll be going over a lot more details about this in tomorrow’s market update.
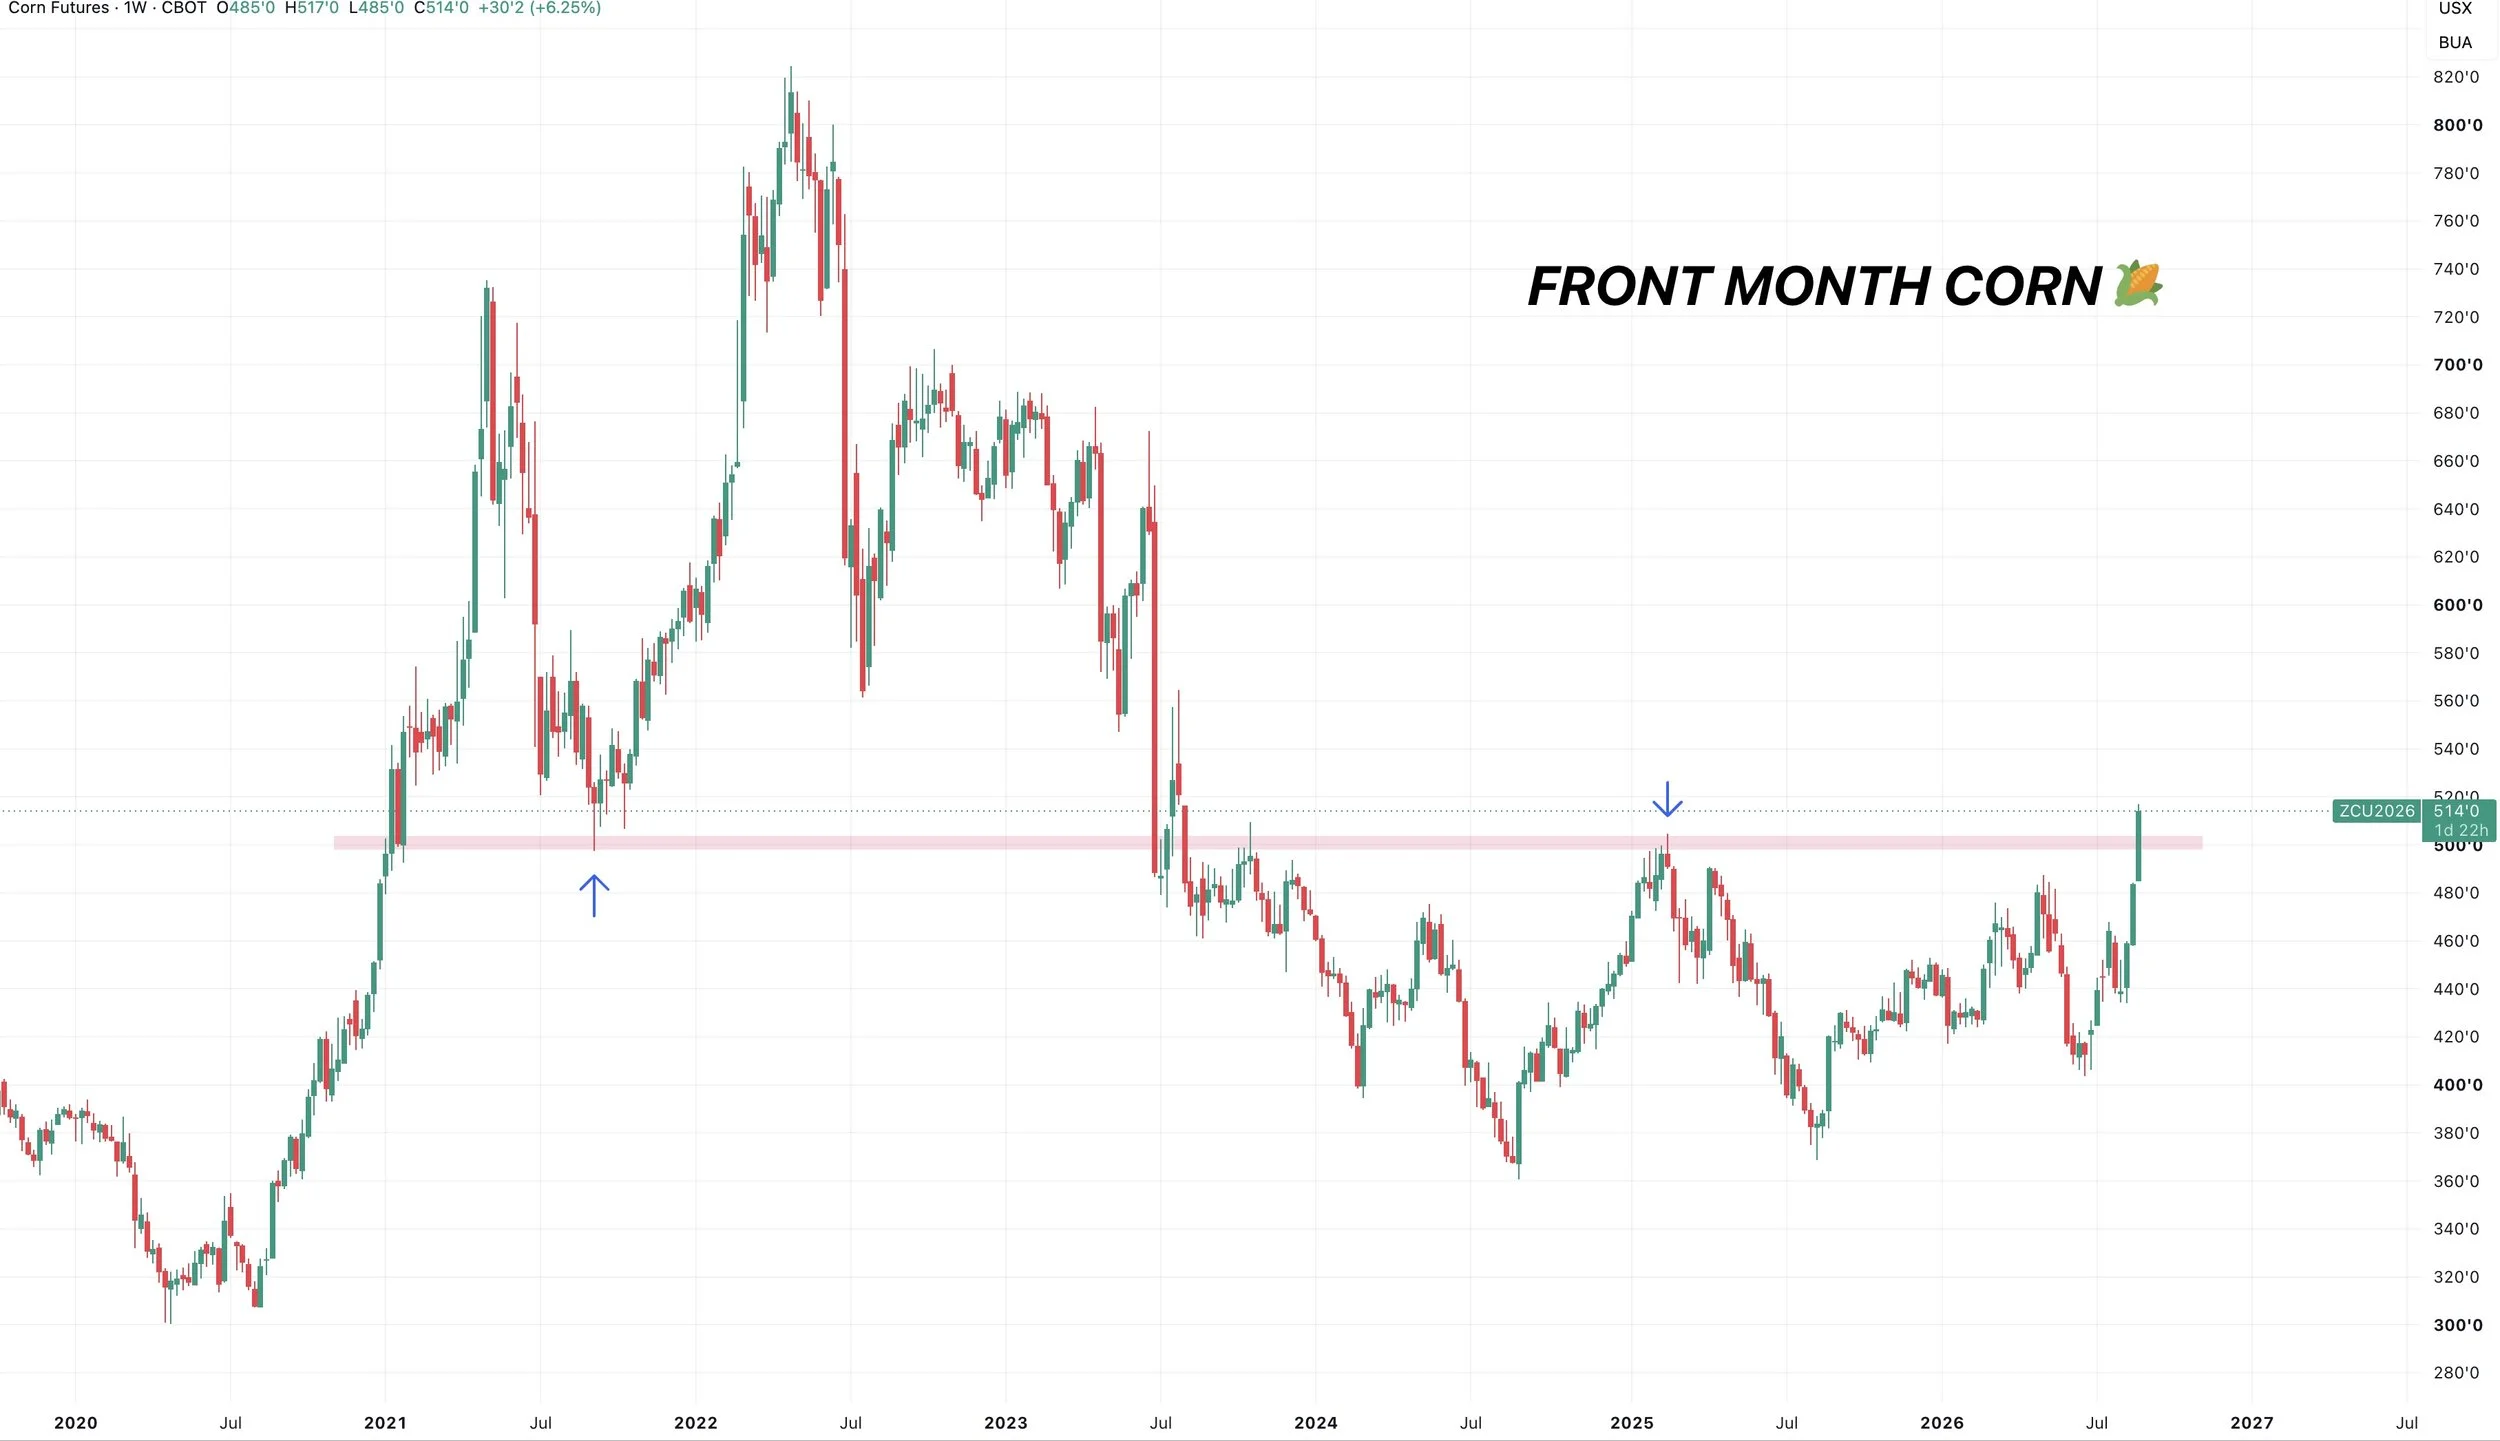
WEEKLY BREAKOUTS?
Weekly Corn 🌽
We broke those highs from 2025.
This is a big deal. As this would be our very first series or higher lows and higher highs during this entire bear market.
Not only that, this $5.00 level was a big level of resistance we just broke through.
It was the highs from 2025 and the lows from 2021.
We have not had a weekly close above $5.00 since July 2023.
This looks promising long term for corn.
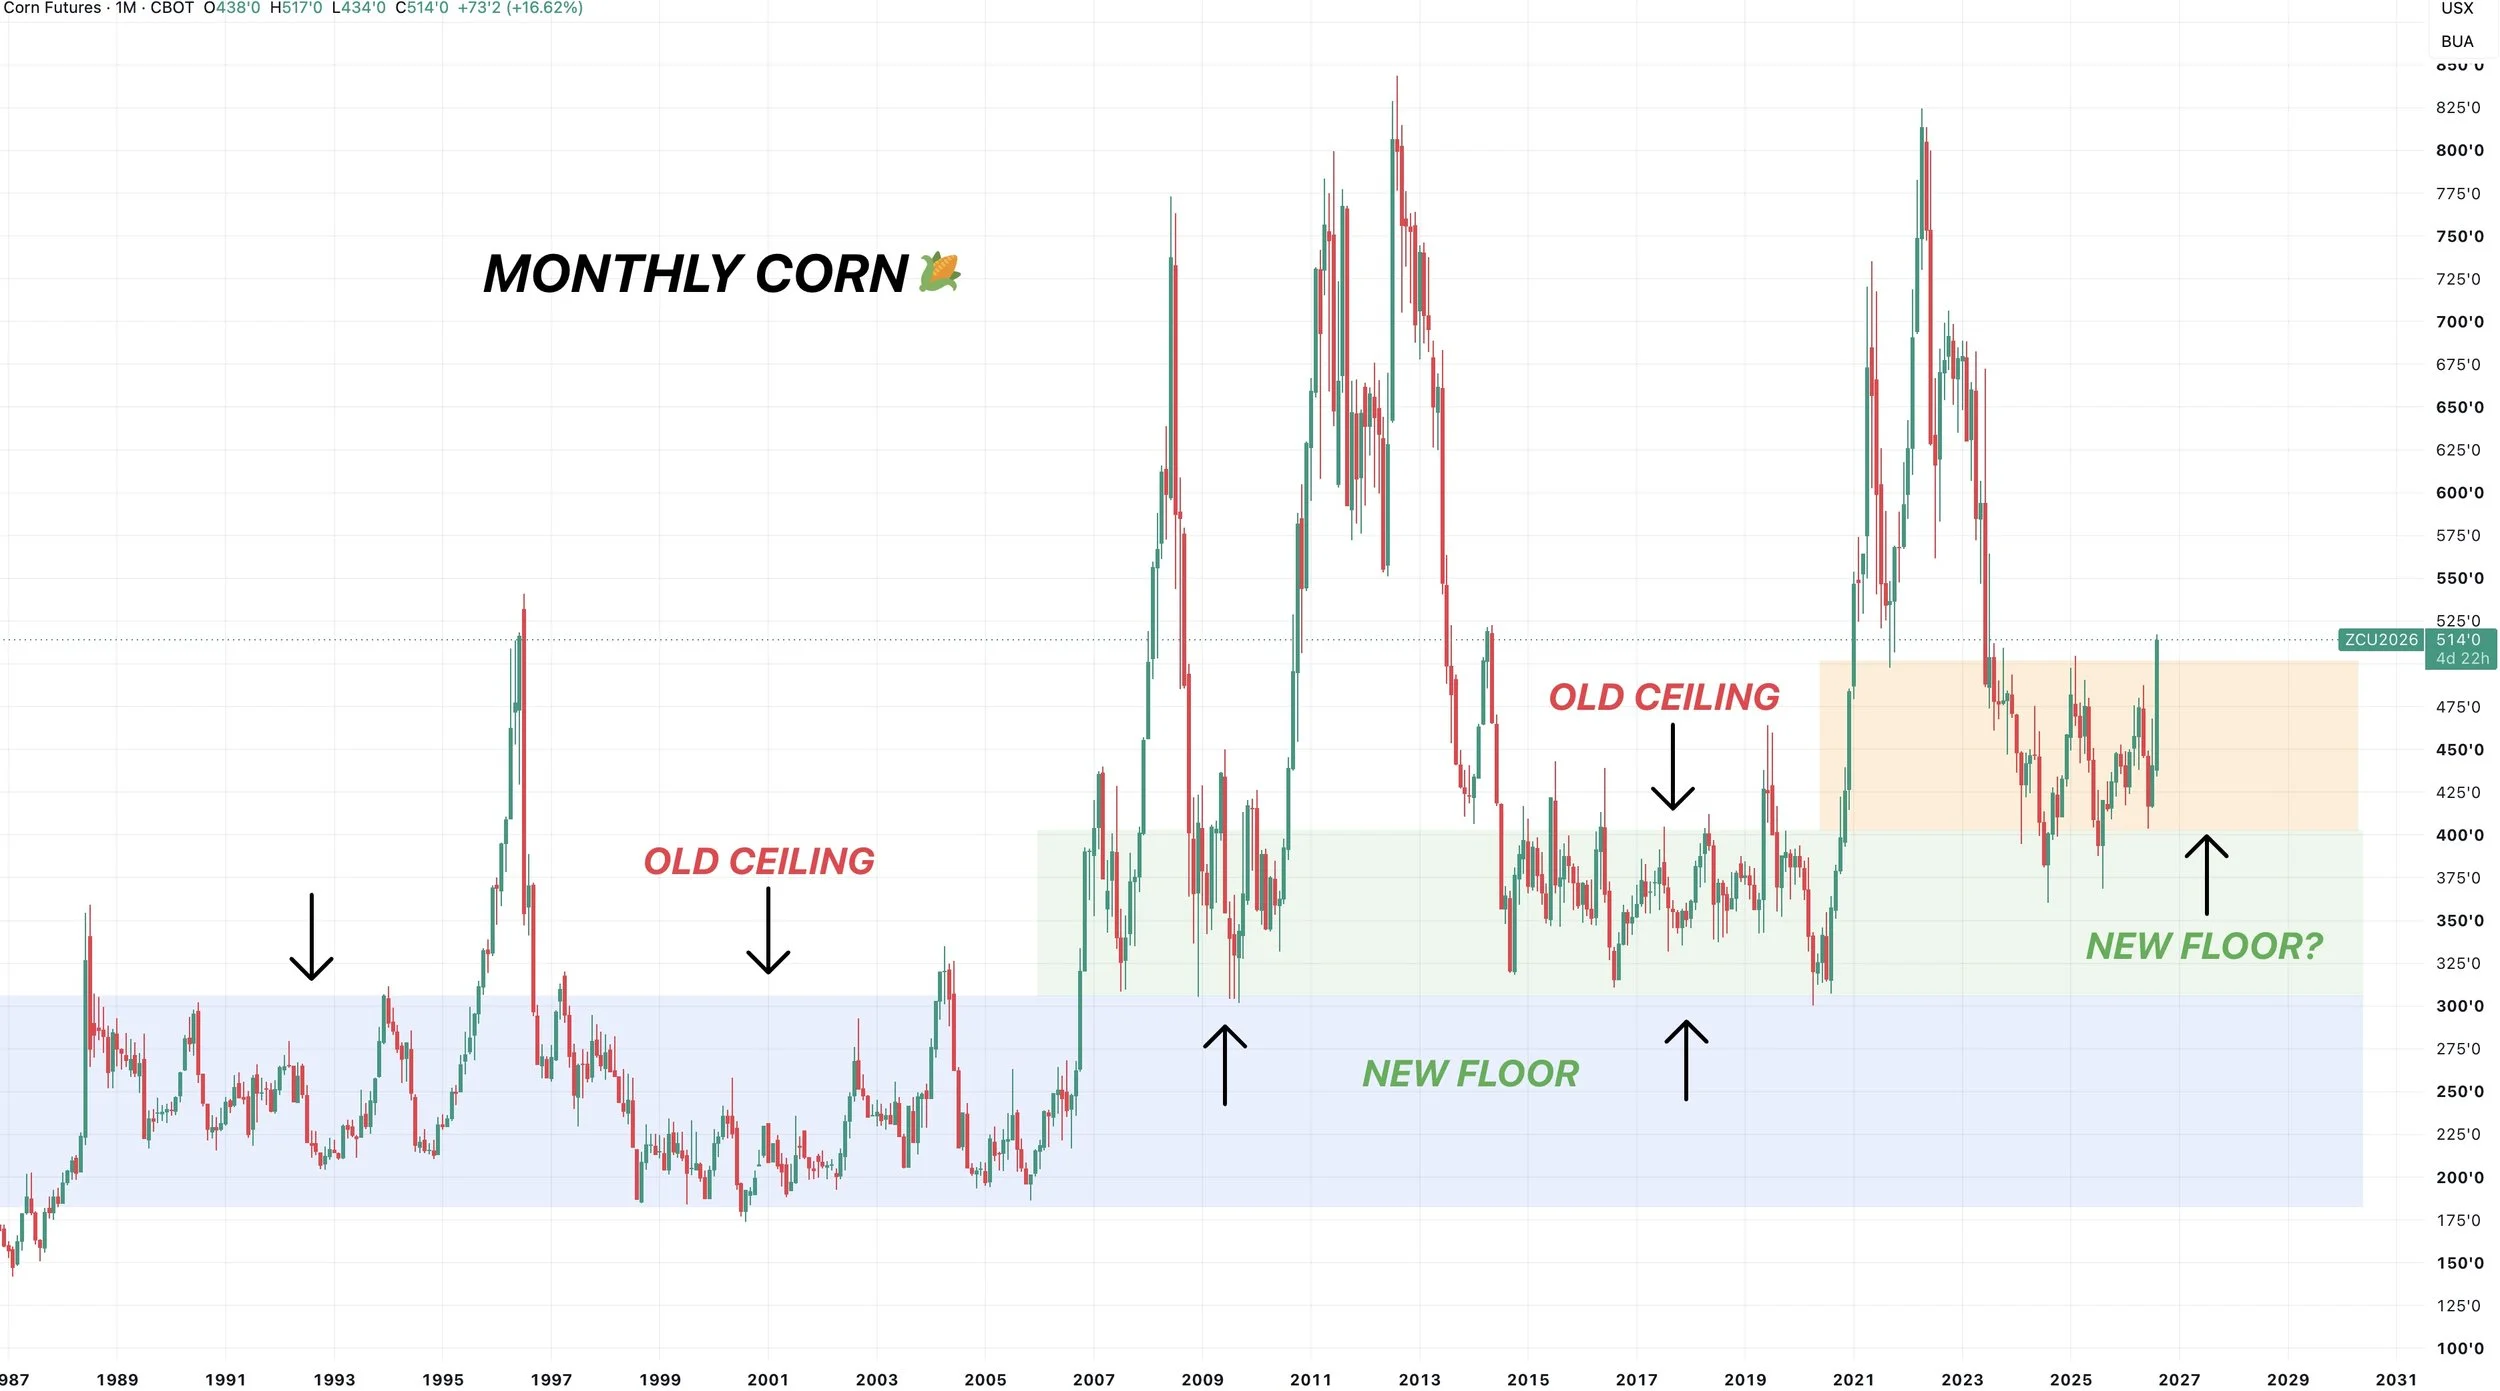
Monthly Corn 🌽
Here is the monthly chart for another view.
We’ve shown this before.
Corn is always trapped in a $1.00 range before it breaks out.
The old ceiling is always the new floor.
It’s still a little early, but it looks like we could very well be breaking out of this $4.00 to $5.00 range.
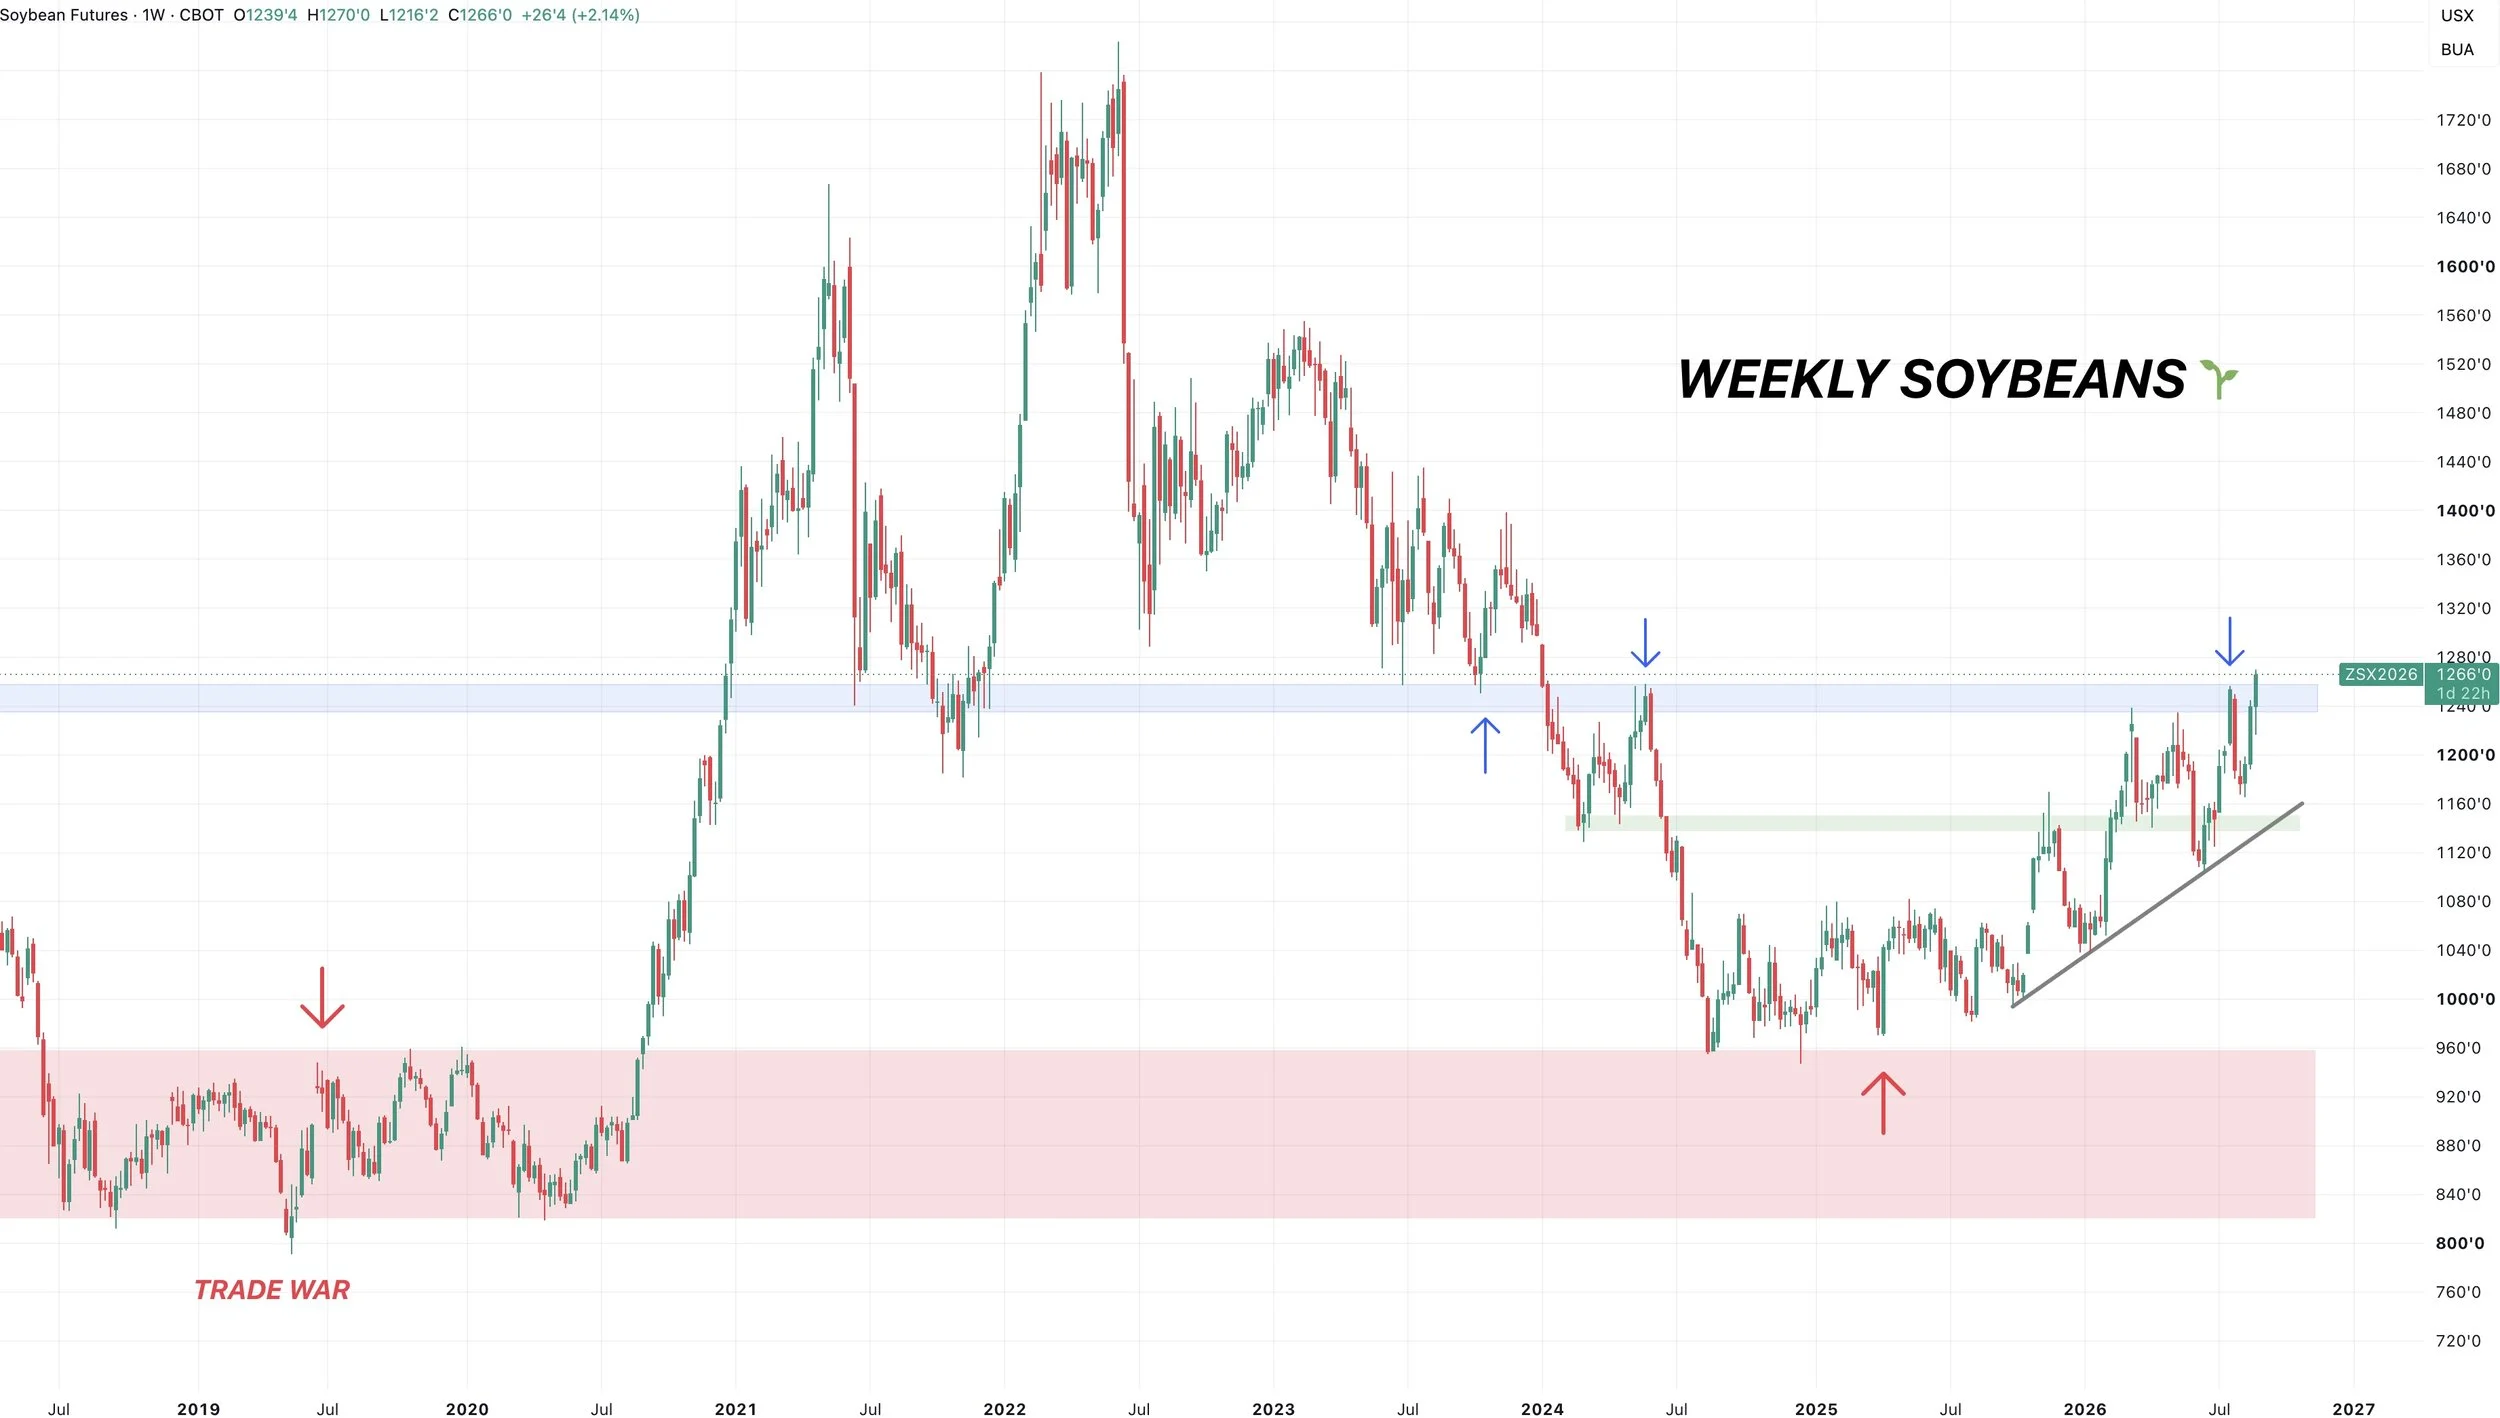
Weekly Beans 🌱
A little early here as well, but if we break above this level it would look very constructive for soybeans.
Like we’ve talked about for months, the long term structure of this chart is very bullish.
If we are able to bust above this level it would look very good.
As this was the recent highs. It was the highs in 2024. It was the lows in 2023 and 2021.
It’s been a clear level of support and resistance.
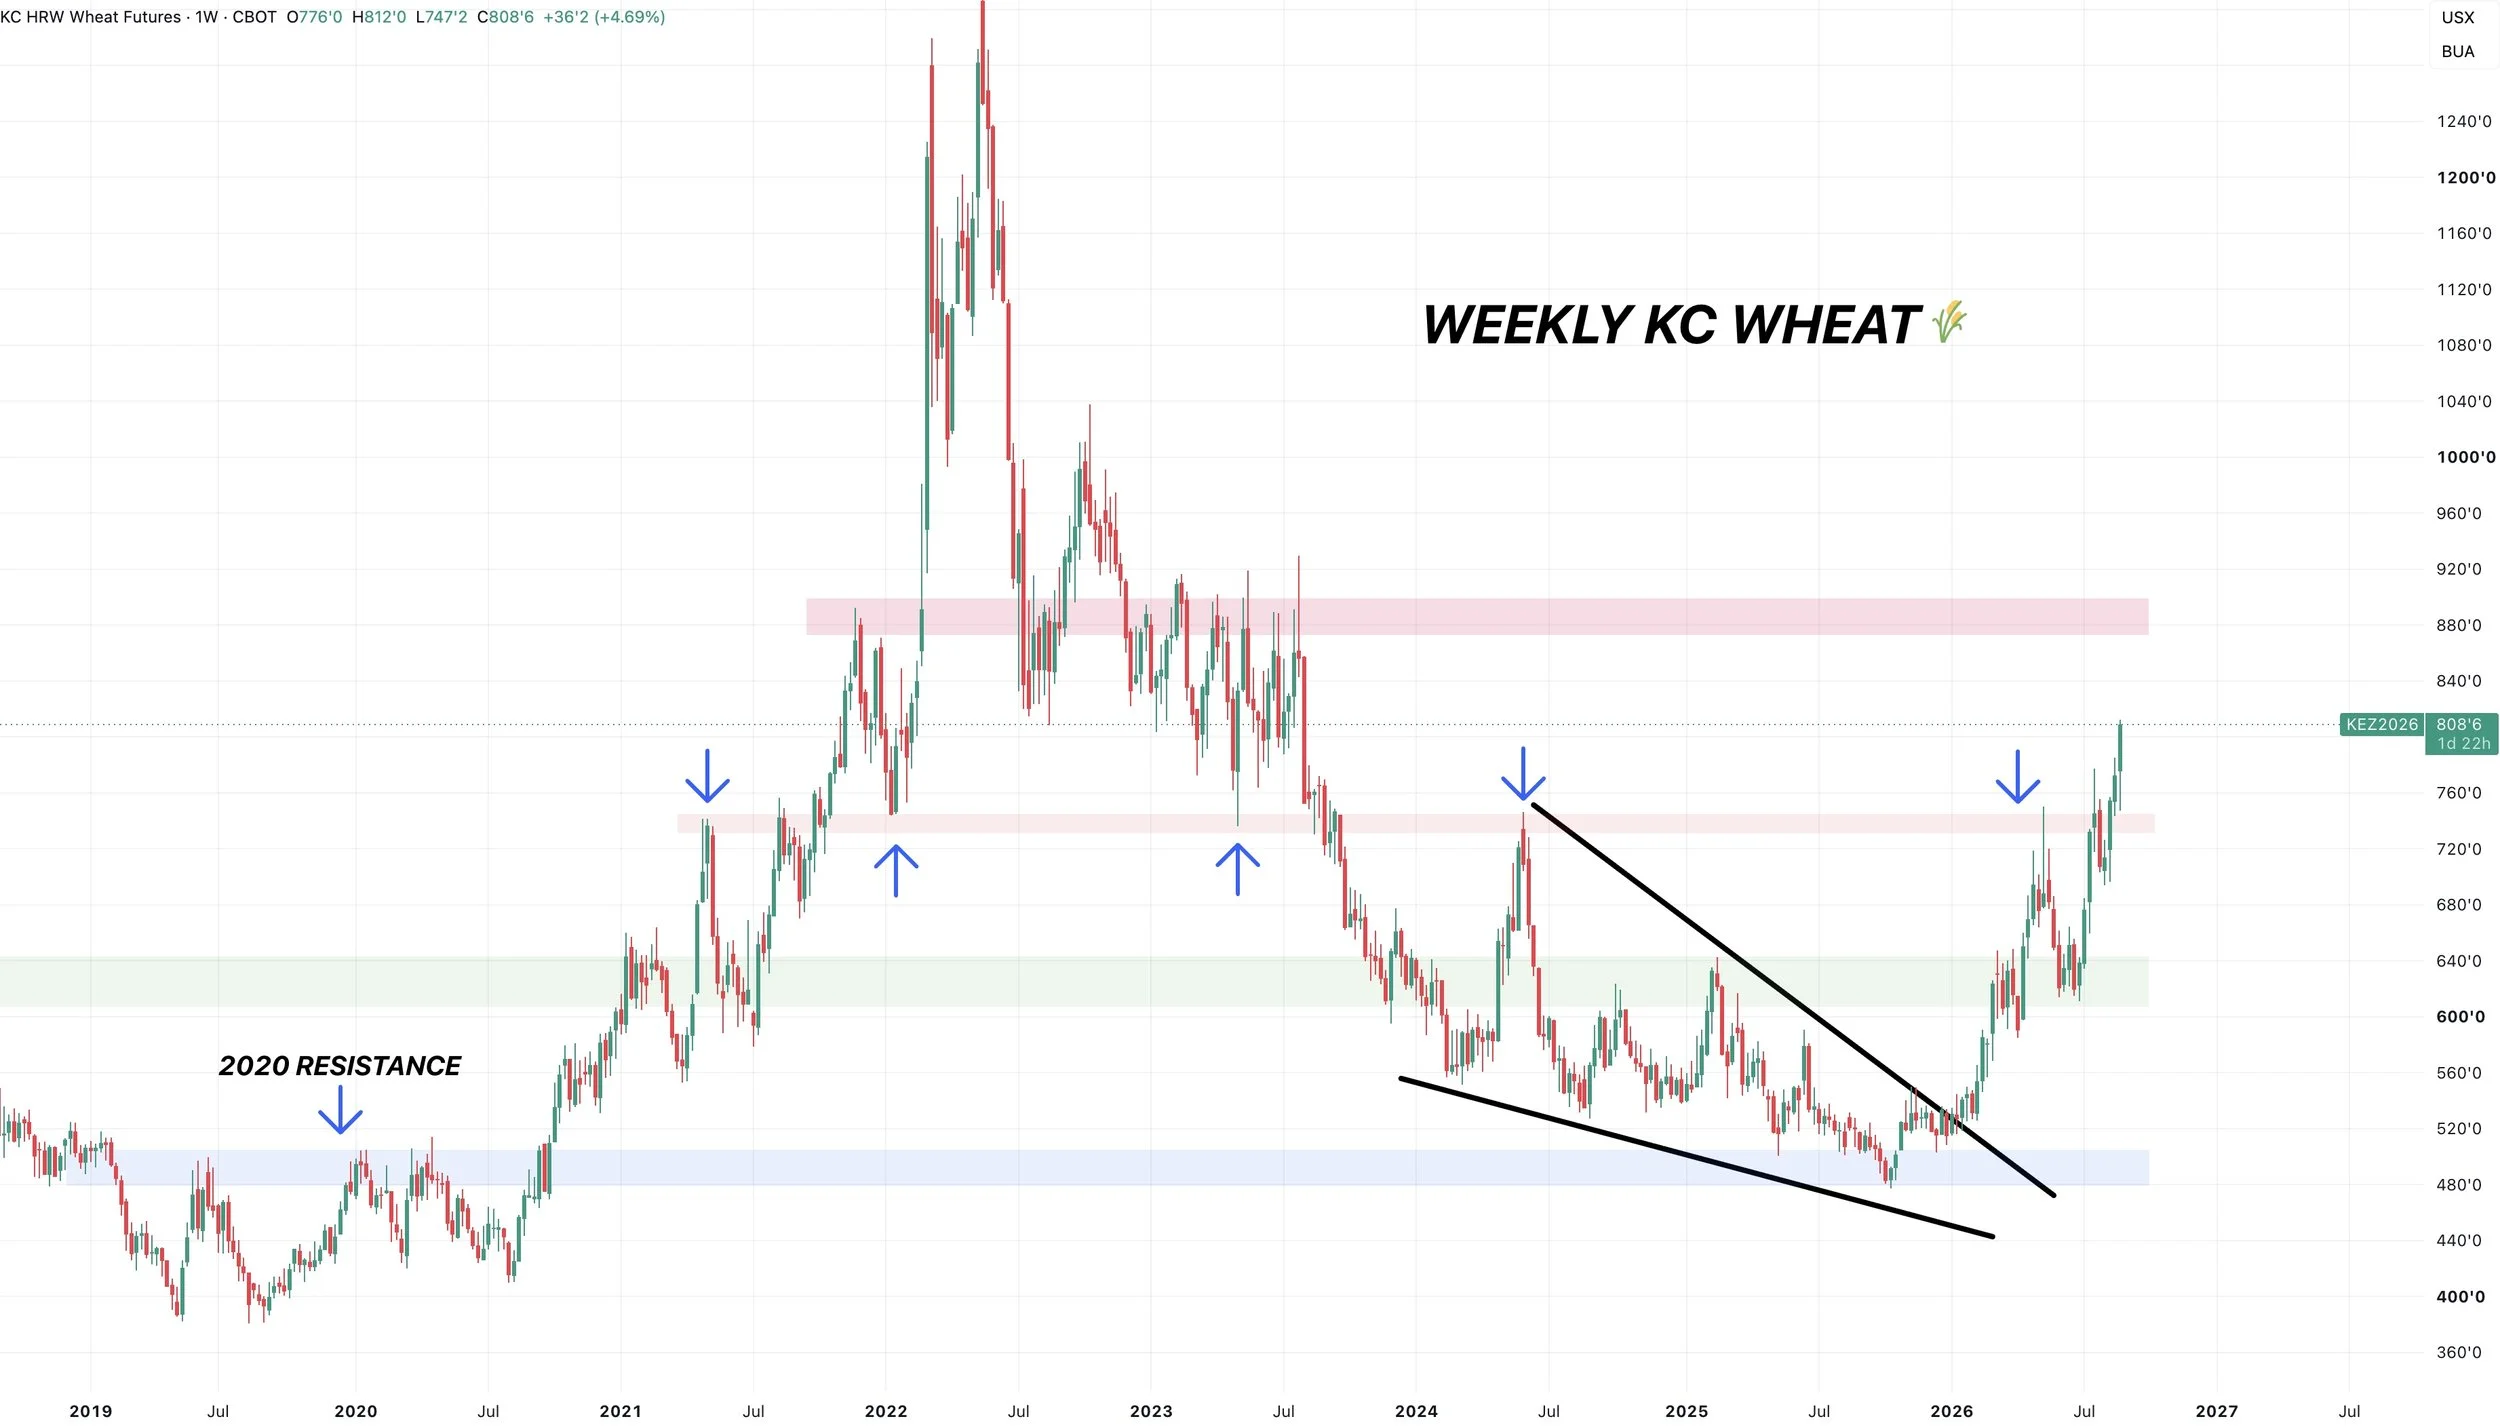
Weekly KC Wheat 🌾
We finally broke that key resistance.
That $7.50 range was the highs from 2024. It was the lows from 2023 and 2022. It was the highs from 2021.
We broke the resistance, as a result we are seeing more upside.
Could very well still have room to run when taking a long term view.
NEXT POSSIBLE TARGETS
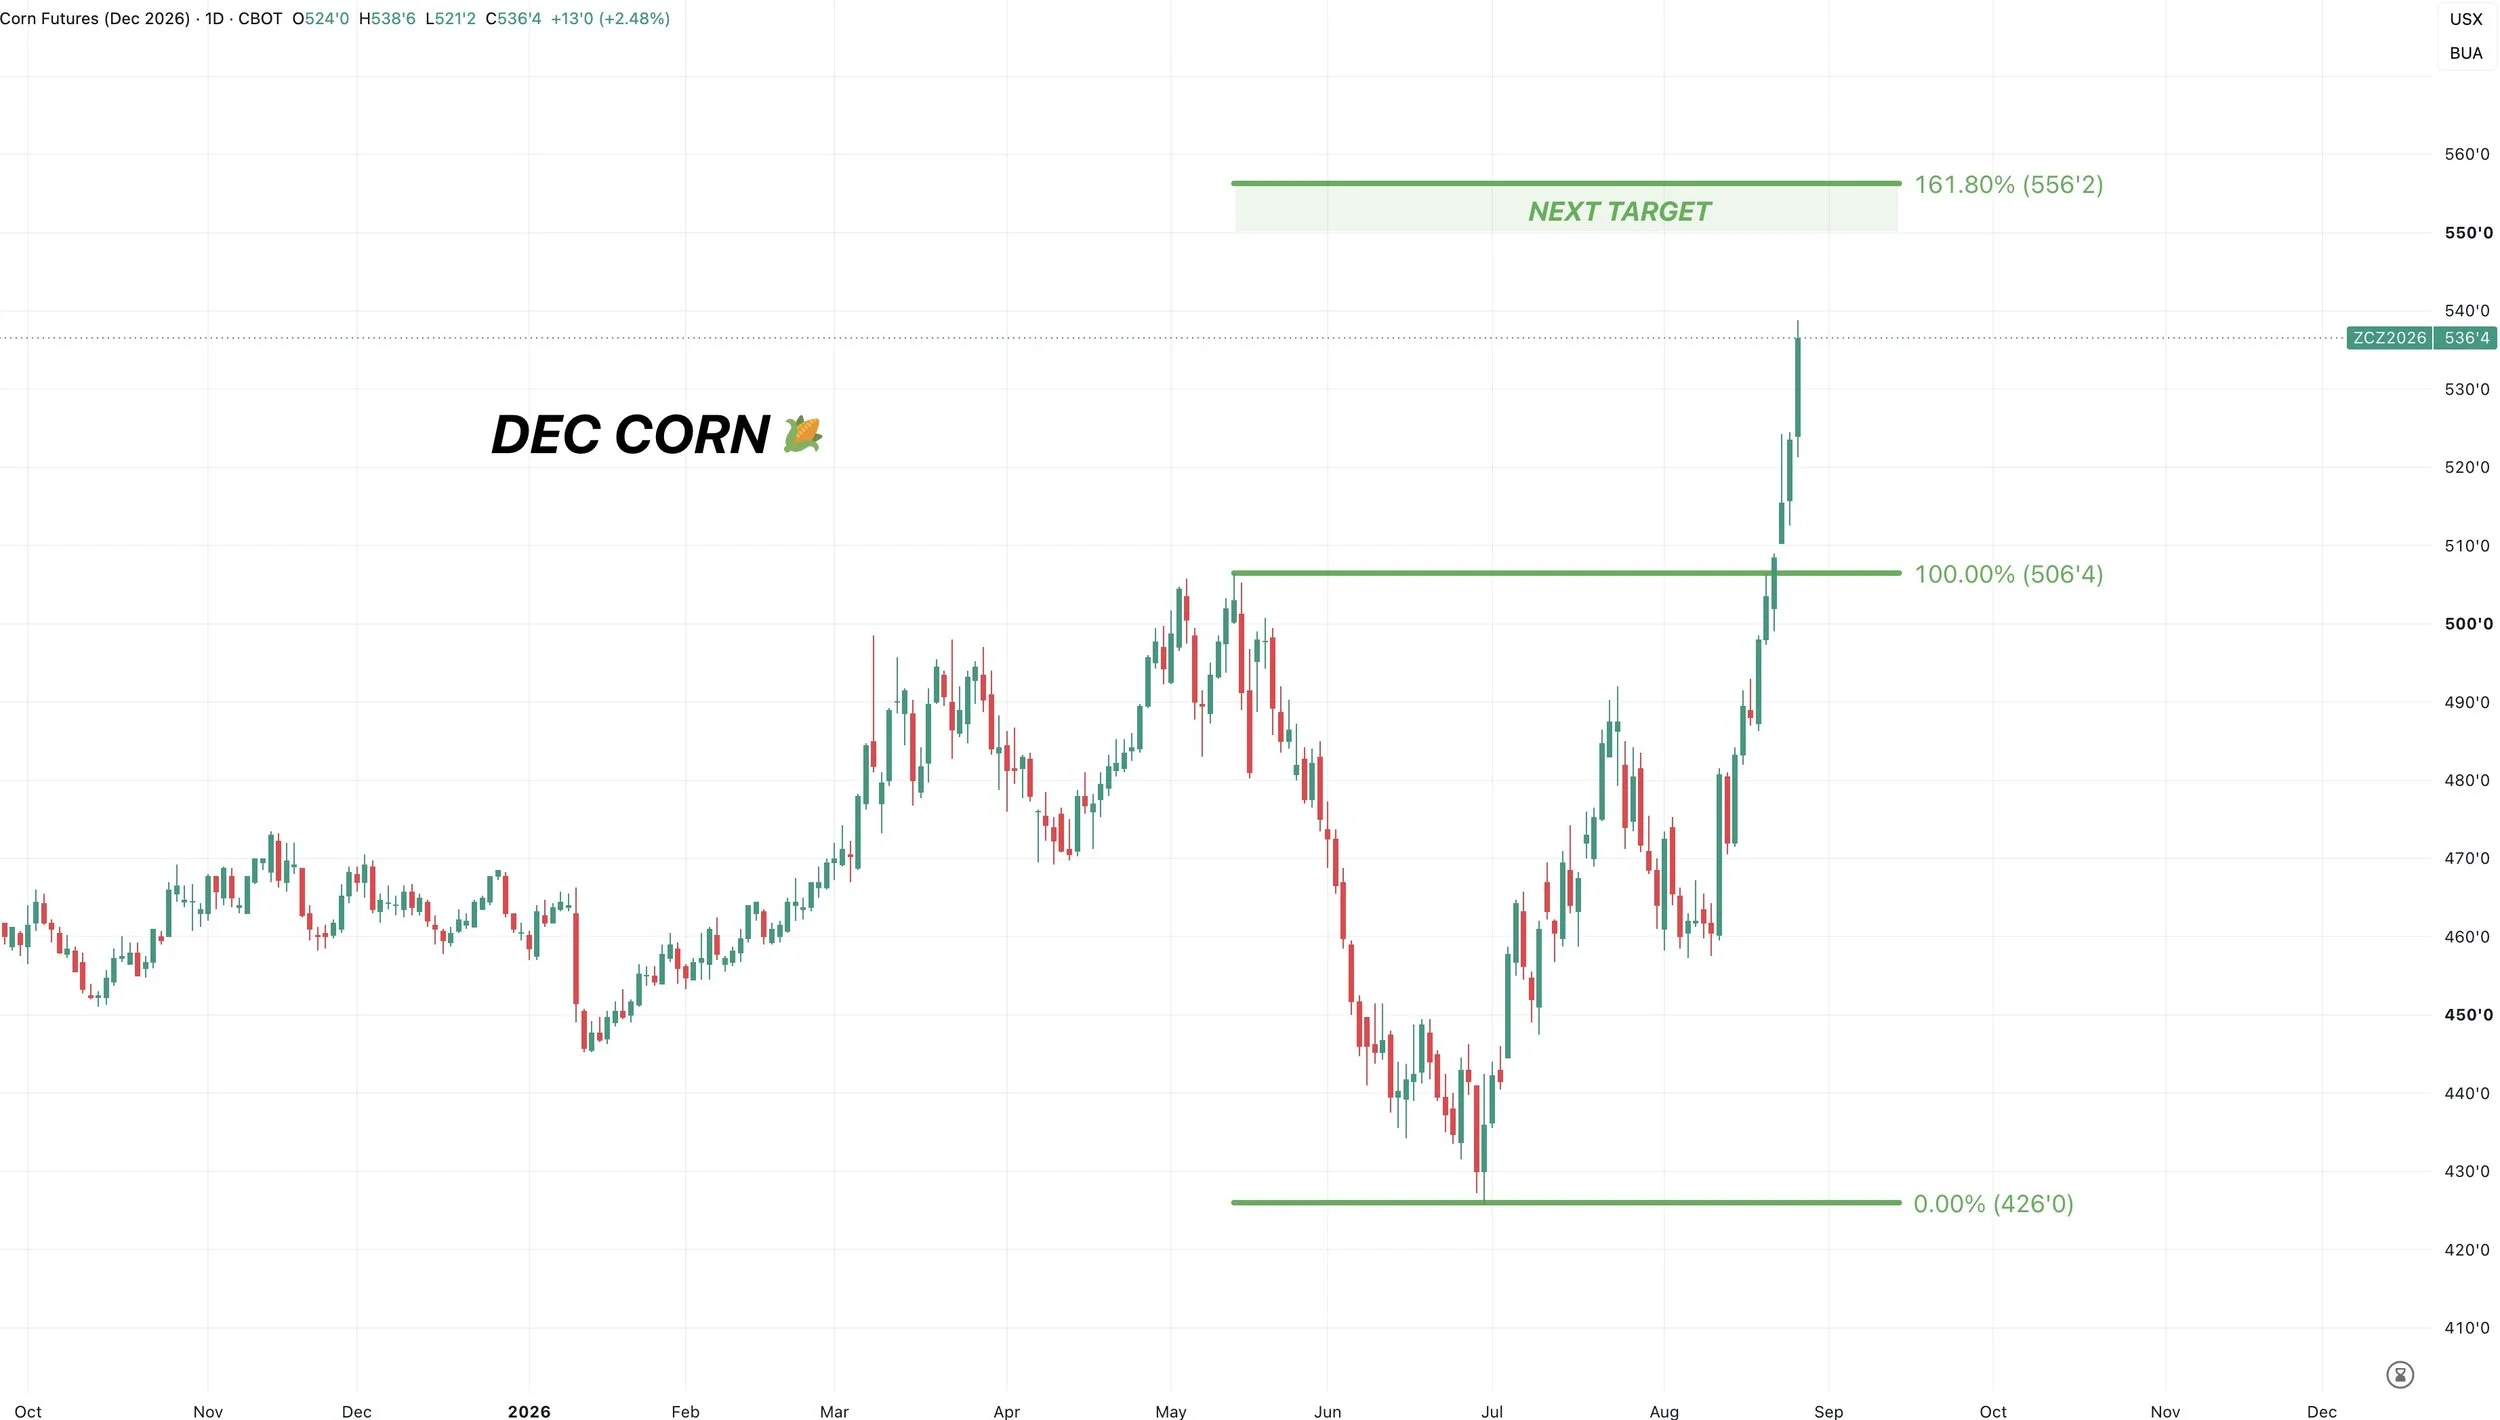
Dec Corn 🌽
Clearly breaking out.
$5.50 range is the next target.
$5.56 is the golden fib from the contract lows up to the May highs.
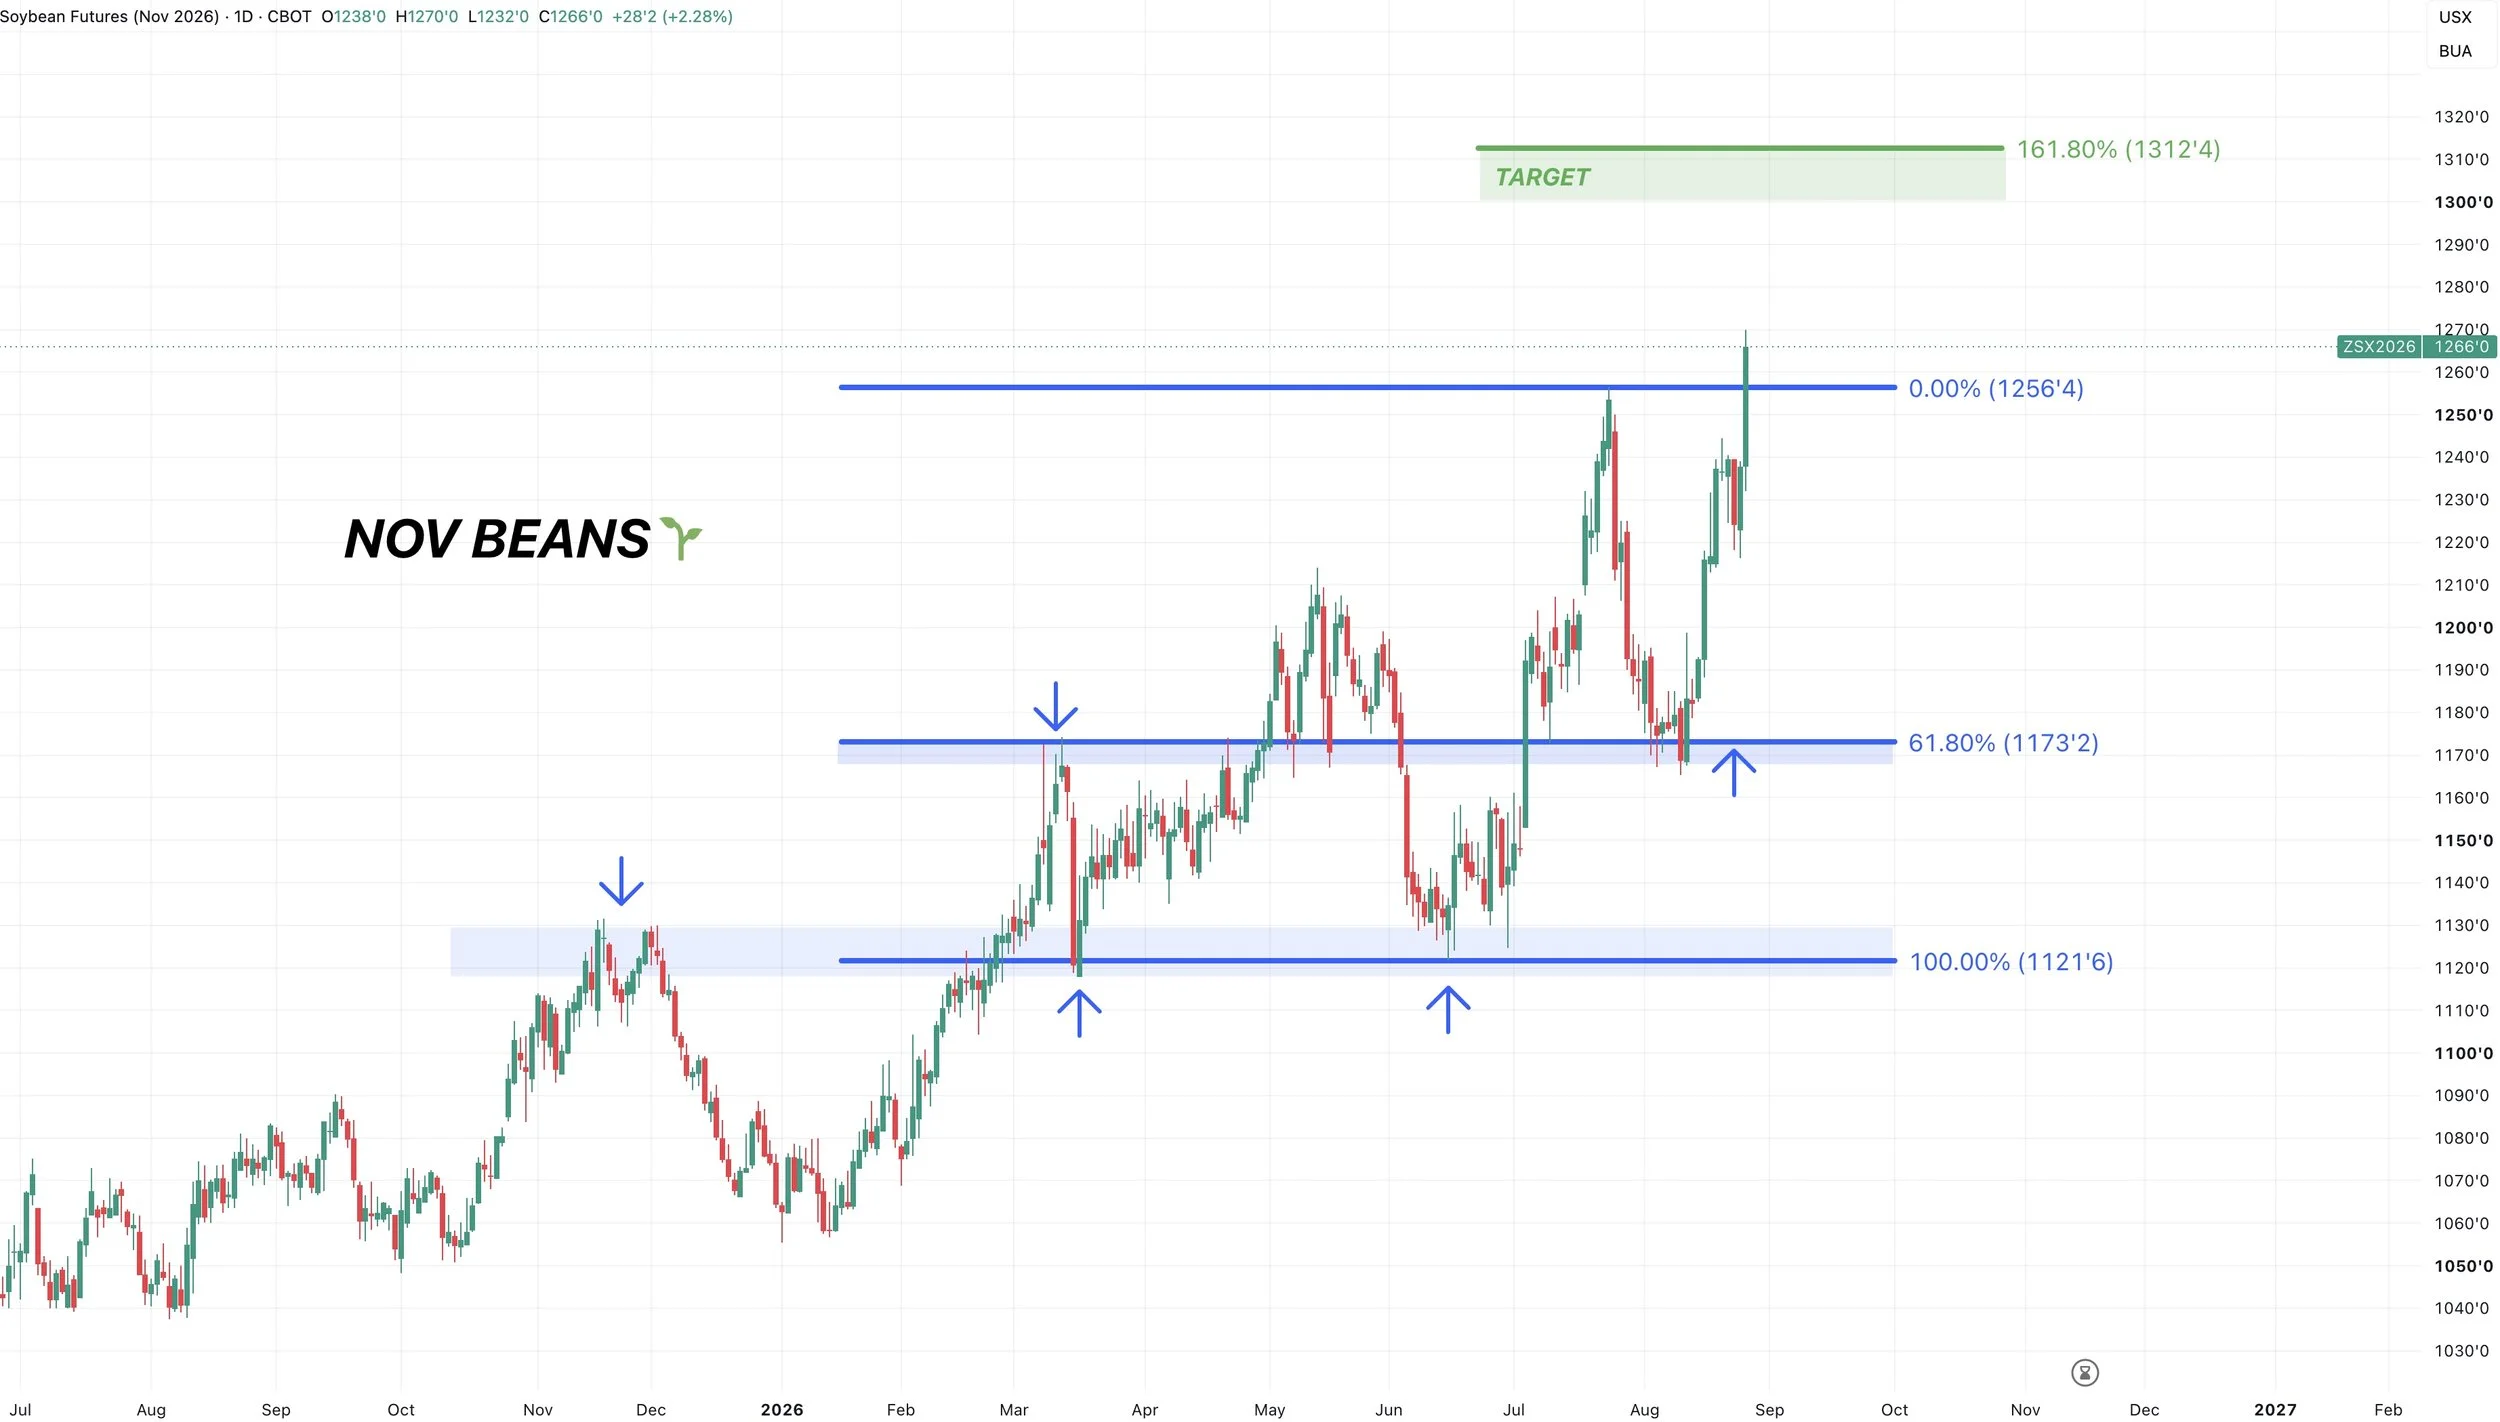
Nov Beans 🌱
We broke above the July highs.
$13.00 range is the next target.
$13.12 is the golden fib from the recent lows up to the July highs.
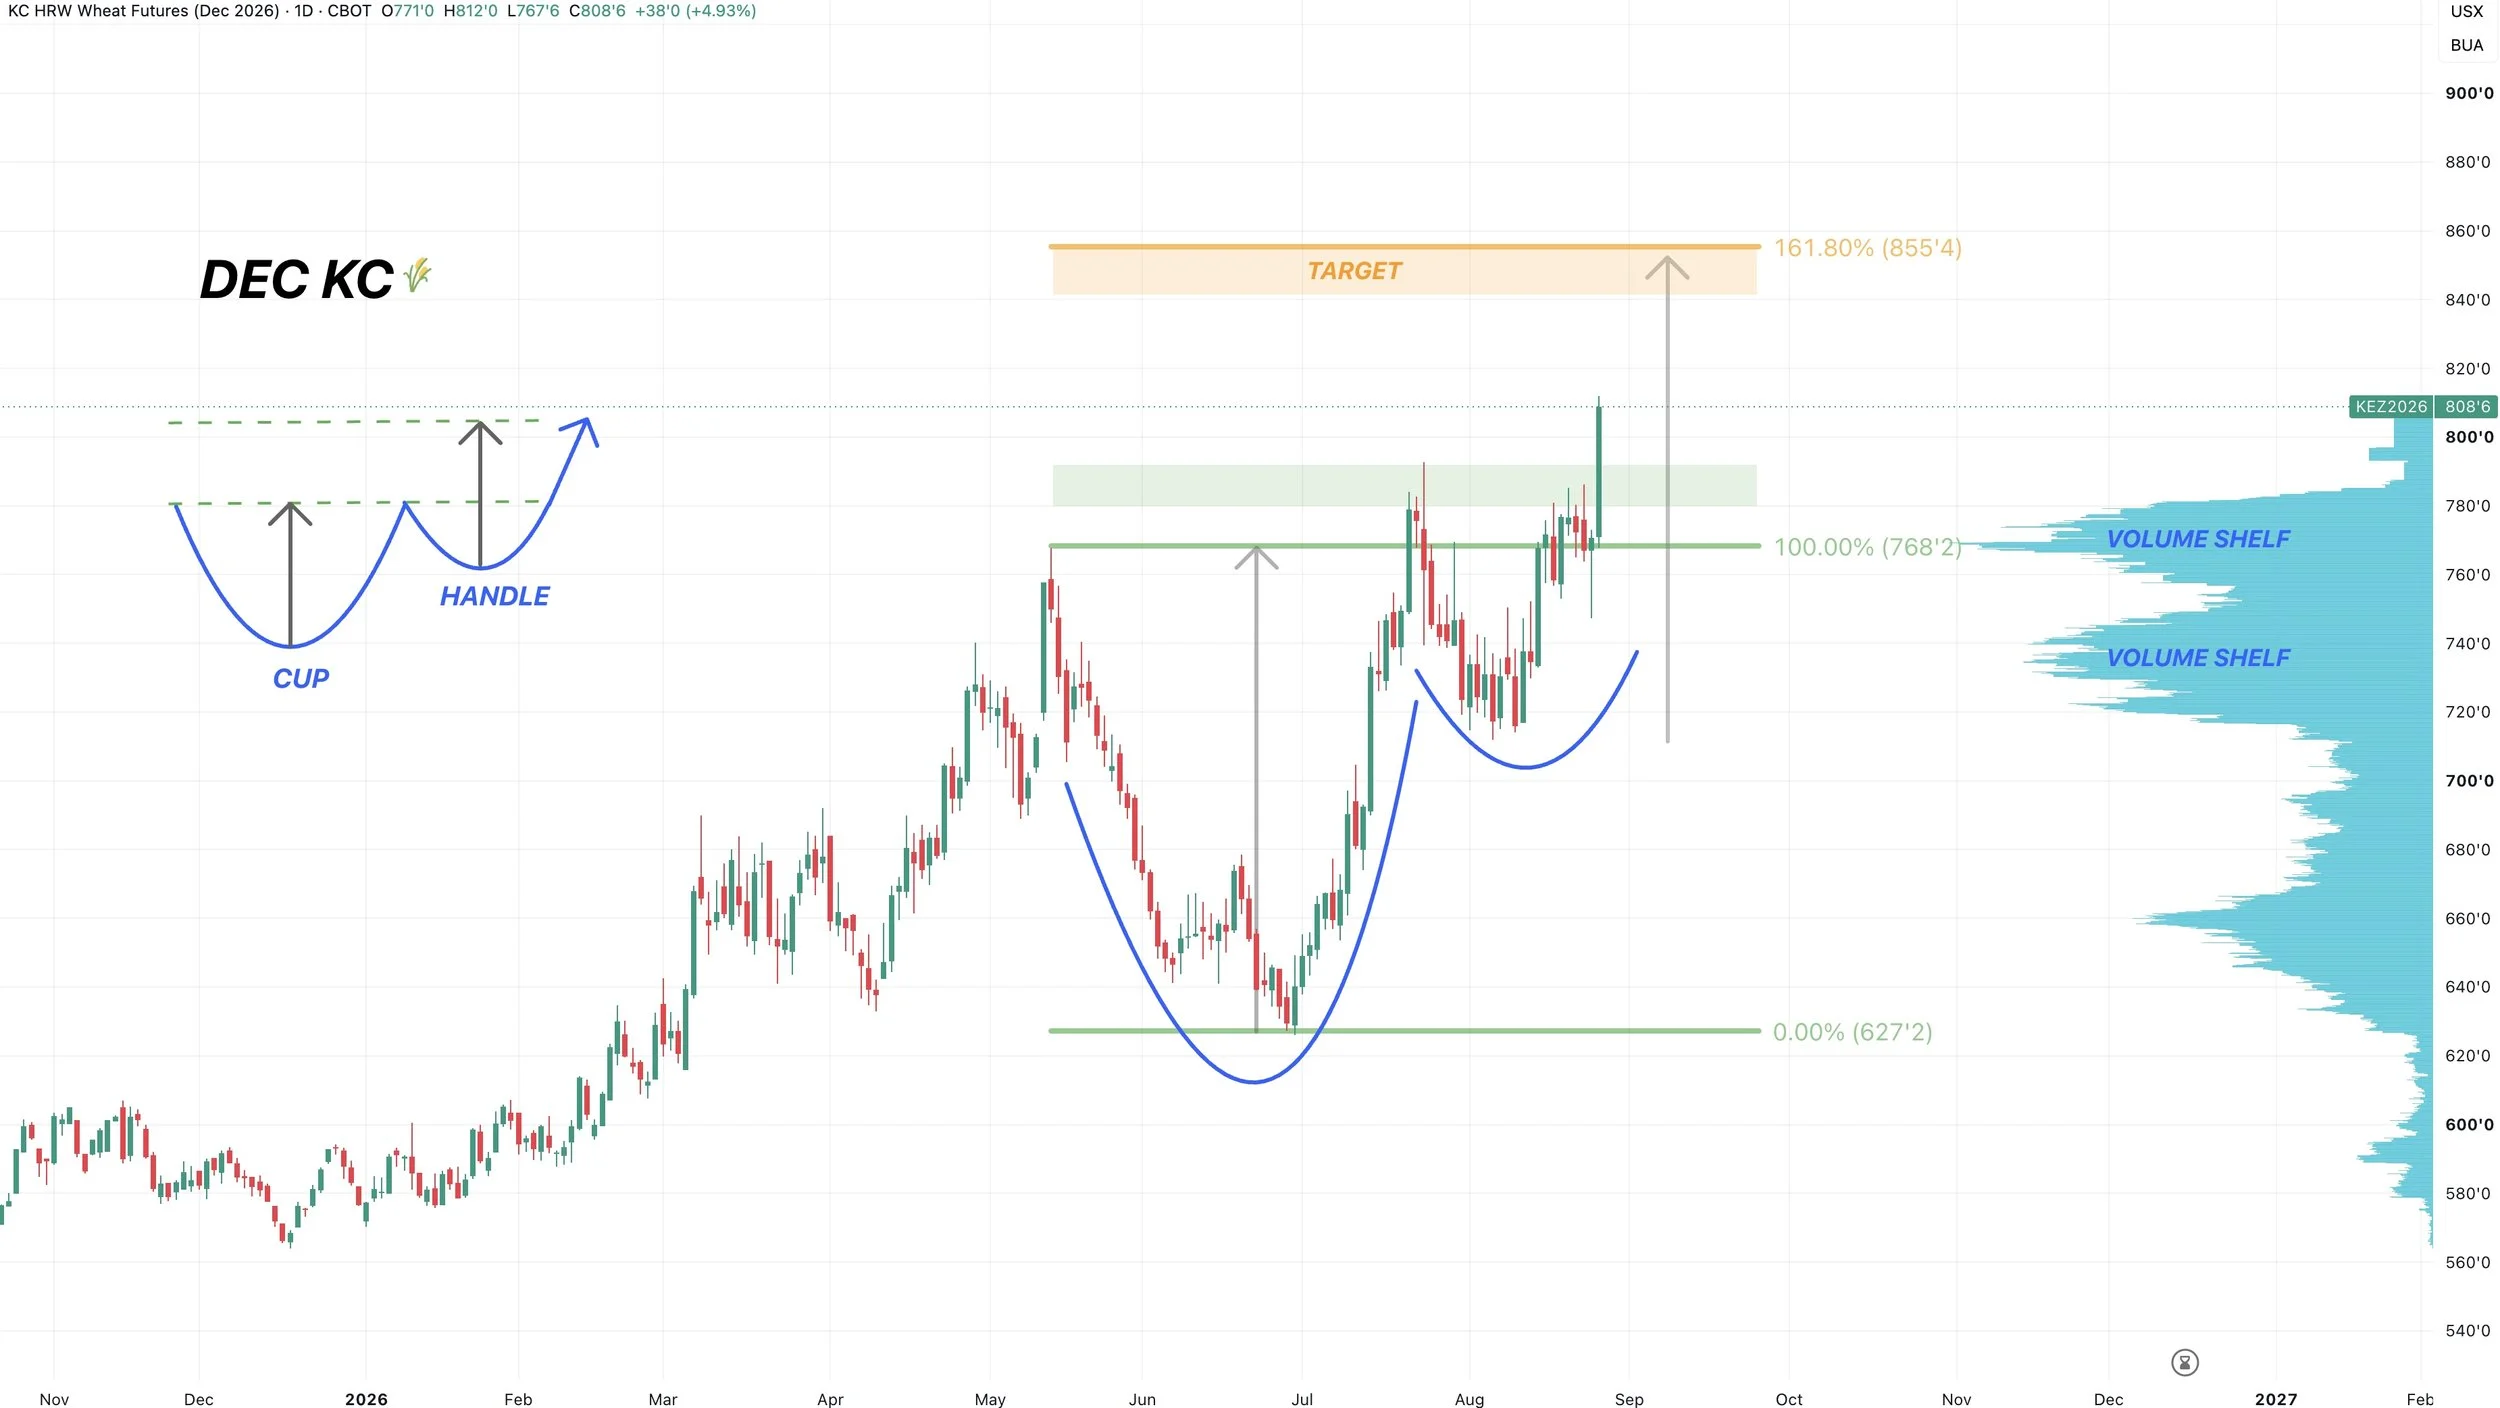
Dec KC Wheat 🌾
Breaking out. Blasting off that volume shelf.
$8.40 to $8.50 is the next target.
That is the implied move from this cup and handle pattern we are breaking out of.
It’s also the golden fib from the June lows up to the May highs.
Want to Talk?
Our phones are open 24/7 for you guys if you ever need anything or want to discuss your operation.
Jeremey & Office: (806)484-1214
Sebastian: (605)280-1186
Email: sfrost@dailymarketminute.com
Hedge Account
Interested in a hedge account? Use the link below to set up an account or give us a call.