
HARVEST LOWS?
AUDIO COMMENTARY
Still no confirmation of a top in cattle
Cattle still in a bull market
First notice day pressure gone
Corn might’ve posted it’s harvest low (chart below)*
Who is left to sell here?
If you have to move bushels off combine
Beans & wheat broke key levels (charts below)*
I still like re-owning wheat here
Last year wheat rallied hard soon
Seasonally wheat finds life here
Everyone knows China hasn’t bought beans. Business everywhere else has been great
Super solid demand across the board
Corn rallies in Sep 8 of last 10 years so they can avoid the insurance payments etc
If a 20-30 cent rally hurts your bottom line, do something so it doesn’t. Do not get hurt in an upward market
We don’t want to pre-sell 26 & 27 below cost of production
Corn, beans & wheat charts below audio*
Listen to todays audio below
Want to talk? (605)295-3100
Labor Day Sale Ends Tomorrow
If you’re enjoying your free trial, make sure you take advantage of our Labor Day sale before it ends.
Don’t miss future updates or our next signal.
CHARTS
Dec Corn 🌽
We closed above $4.16. Which was the 61.8% retracement to those mid-July highs.
This makes me more confident that the harvest lows have indeed been posted. As this is no longer seen as a correctional bounce.
However, we are now up against a big hurdle.
The downtrend that has marked every high since April. So I expect us to reject there.
But if we bust through, the next target is that big green box in the $4.30 to $4.35 area. That is an area I will likely be looking to de-risk in.
I’ll share more thoughts early next week. But the chart looks great here and has now built a longer term friendlier structure.

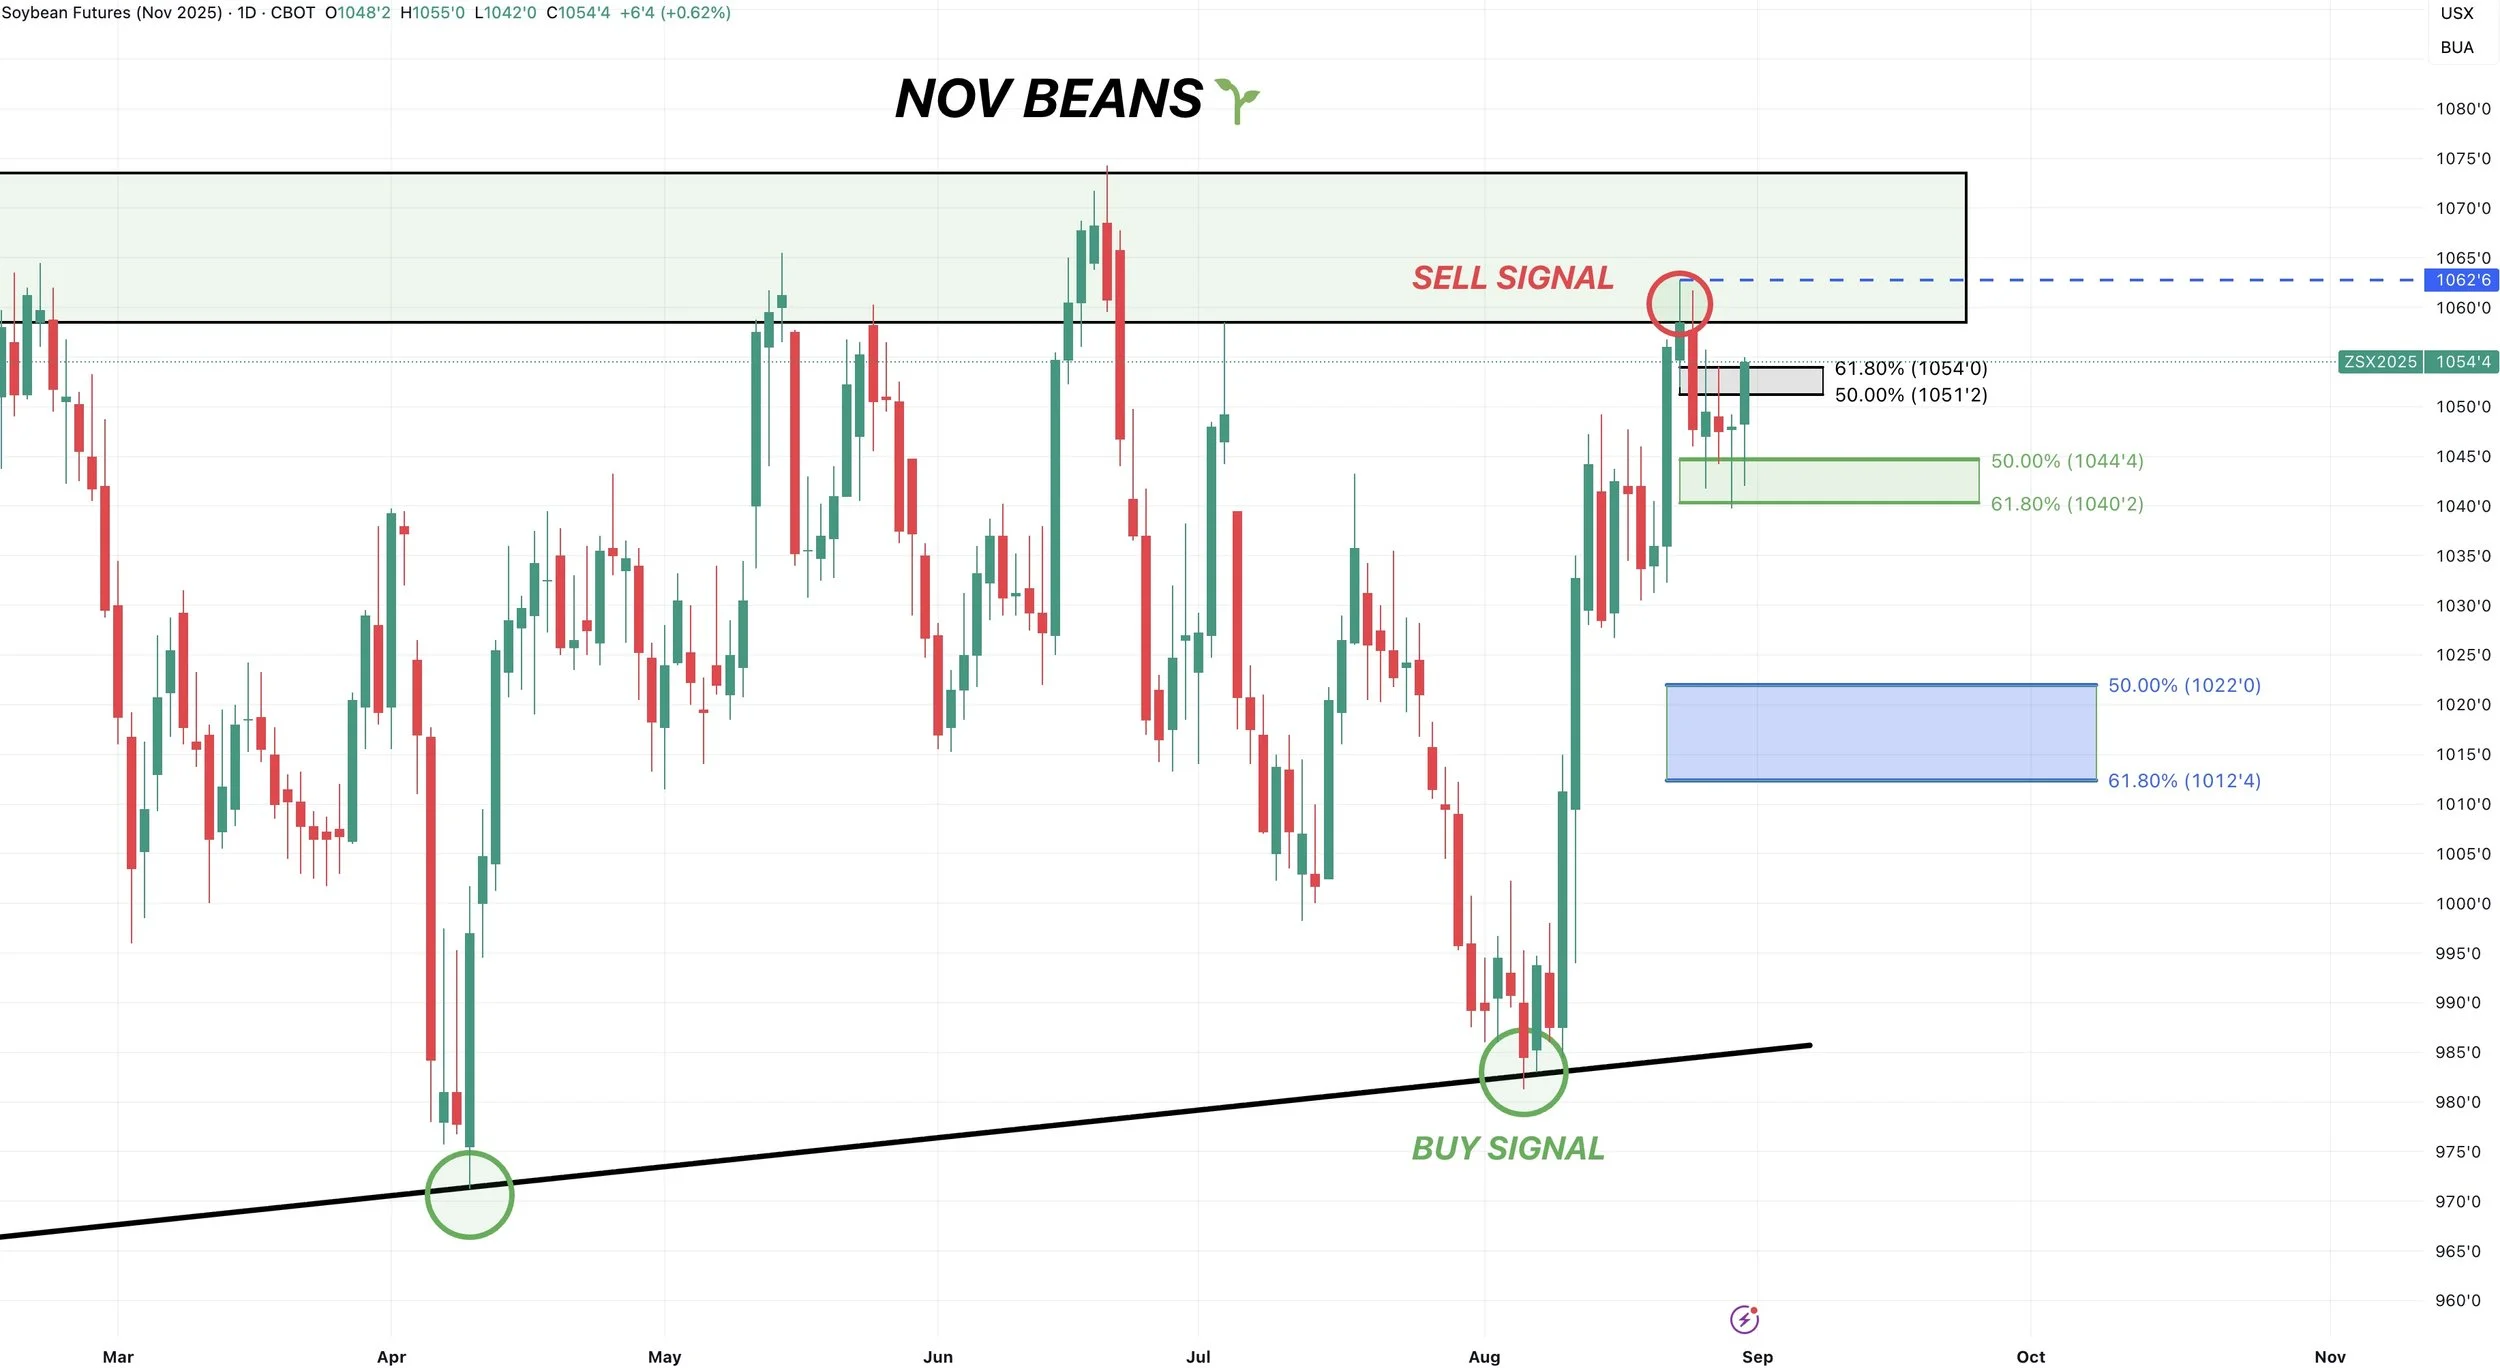
Nov Beans 🌱
I apologize if this is hard to follow along with here.
But we have 3 different sets of retracements on this chart.
Black is the 50-61.8% retracement from last weeks highs, down to those $10.40 recent lows from yesterday.
We closed above the 61.8% level. So that is a good sign and indicates we might now try to test those highs.
The small green box is the 50-61.8% retracements from the recent rally.
We touched the 61.8% level and bounced. That is a friendly sign. That is a must hold short term for bulls or it opens the downside up to test the blue box if it fails to hold.
The blue box is the 50-61.8% retracement of the entire rally since $9.80. That is the target if we fail to hold the green box. This blue box is the line in the sand to keep the big picture bullish structure in place.
Dec Chicago Wheat 🌾
We closed above the 61.8% retracement up to those recent early August highs.
This indicates more upside.
We rejected that 61.8% level 5 seperate times. We now closed above it.
I would like to think we have room to run to at least the small blue box.
That box is an area of support & resistance in the past, it also claws back 38.2% of the June highs.
Our bigger picture target is the blue box. Which gives back 50-61.8% of the June highs and is also right at the top of this wedge.
We are also breaking out of a falling wedge pattern which is viewed as bullish (green line).

Past Sell or Protection Signals
We recently incorporated these. Here are our past signals.
Aug 22nd: 🌱
Soybean sell signal & hedge alert.
July 31st: 🐮
Cattle sell signal & hedge alert.
July 10th: 🐮
Cattle sell signal & hedge alert.
CLICK HERE TO VIEW
June 5th: 🐮
Cattle sell signal & hedge alert.
June 2nd: 🌾
MPLS wheat sell signal.
April 10th: 🌽
Old crop corn sell signal.
March 19th: 🐮
Cattle hedge & sell signal.
Feb 18th: 🌽 🌾
Old crop KC wheat & old crop corn signal.
Jan 23rd: 🌽 🌱
Corn & beans old crop sell signal.
CLICK HERE TO VIEW
Jan 15th: 🌽 🌱
Corn & beans hedge alert/sell signal.
Jan 2nd: 🐮
Cattle hedge alert at new all-time highs & target.
Dec 11th: 🌽
Corn sell signal at $4.51 200-day MA
CLICK HERE TO VIEW
Oct 2nd: 🌾
Wheat sell signal at $6.12 target
Sep 30th: 🌽
Corn protection signal at $4.23-26
Sep 27th: 🌱
Soybean sell & protection signal at $10.65
Sep 13th: 🌾
Wheat sell signal at $5.98
May 22nd: 🌾
Wheat sell signal when wheat traded +$7.00
Want to Talk?
Our phones are open 24/7 for you guys if you ever need anything or want to discuss your operation.
Hedge Account
Interested in a hedge account? Use the link below to set up an account or shoot Jeremey a call at (605)295-3100.