
CHINA MEETING RESCHEDULED
MARKET UPDATE
You can scroll to read the usual update as well. As the written version is the exact same as the video.
Timestamps for video:
Overview: 0:00min
Cotton: 2:45min
Corn: 3:20min
Beans: 9:30min
Wheat: 14:45min
Cattle: 16:15min
Want to talk?
Office: (806)484-1214
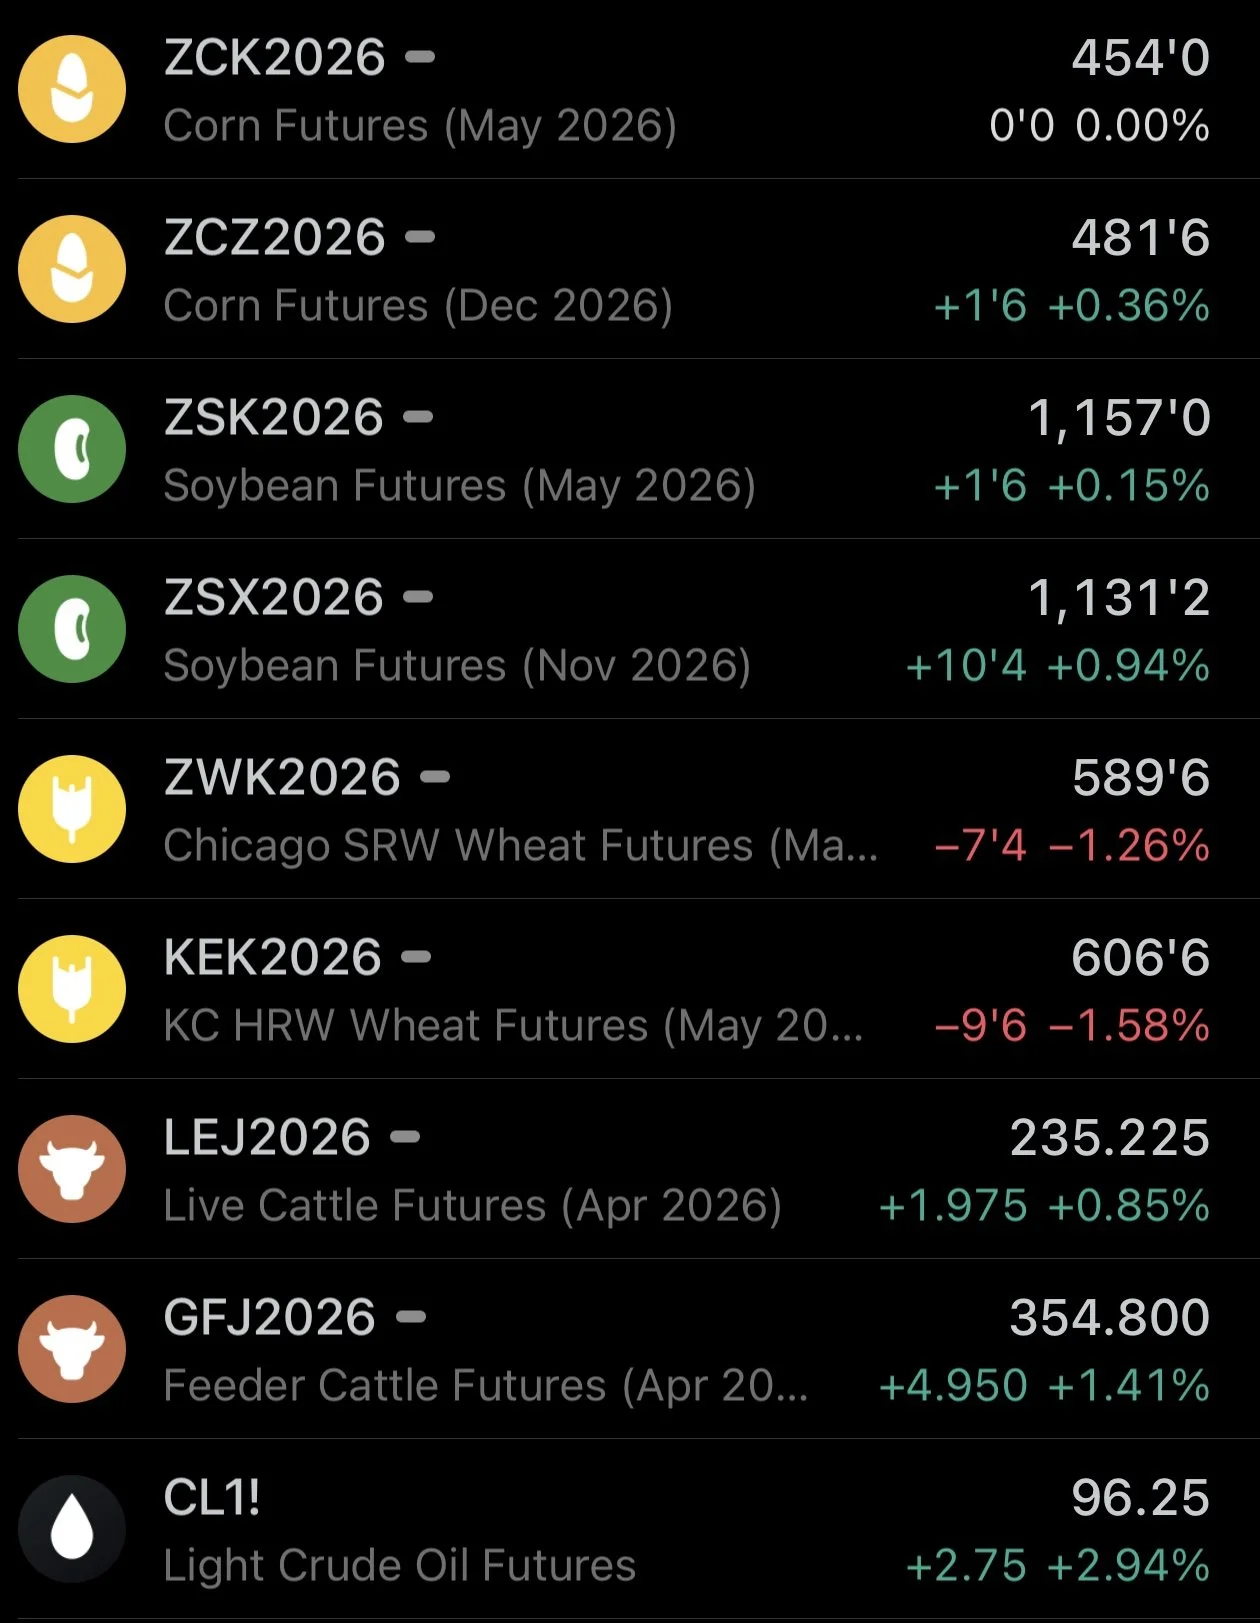
Futures Prices Close
Overview
Grains mixed following yesterday’s blood bath.
Yesterday we saw the first limit down day in soybeans in 17 years.
Corn caught some sympathy selling from soybeans, but actually held up a lot better than most would’ve thought. With soybeans down 70 cents, it wouldn’t have been surprising to see corn down over 20.
Today, soybeans saw a little relief bounce, while new crop led today's bounce. We will touch on why this happened later.
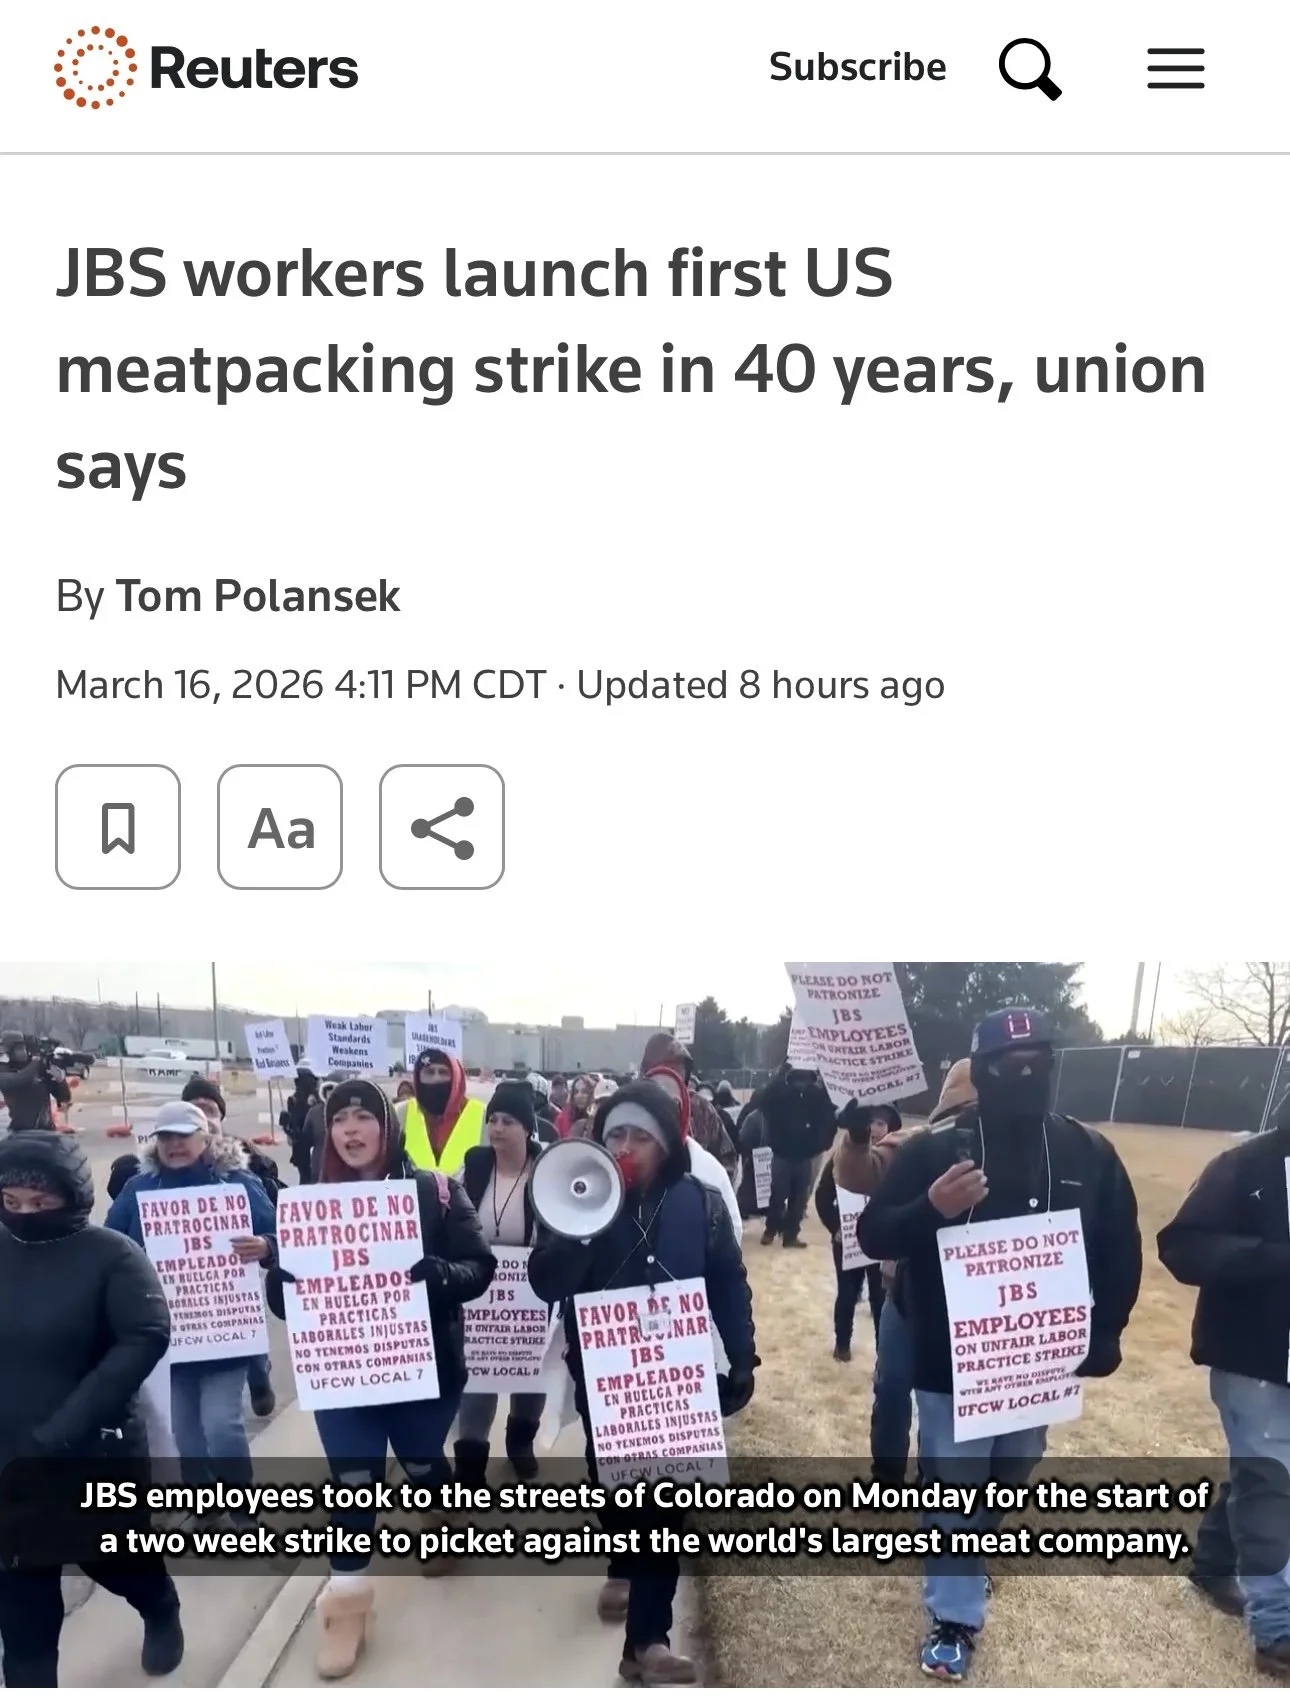
The cattle market was strong today. The JBS workers are officially on strike, but it seems like a sell the rumor buy the fact event that was somewhat priced into the market last week.
Trump & China
We have to start with the China news.
Jeremey talked about this in yesterday's audio, but let's go over it.
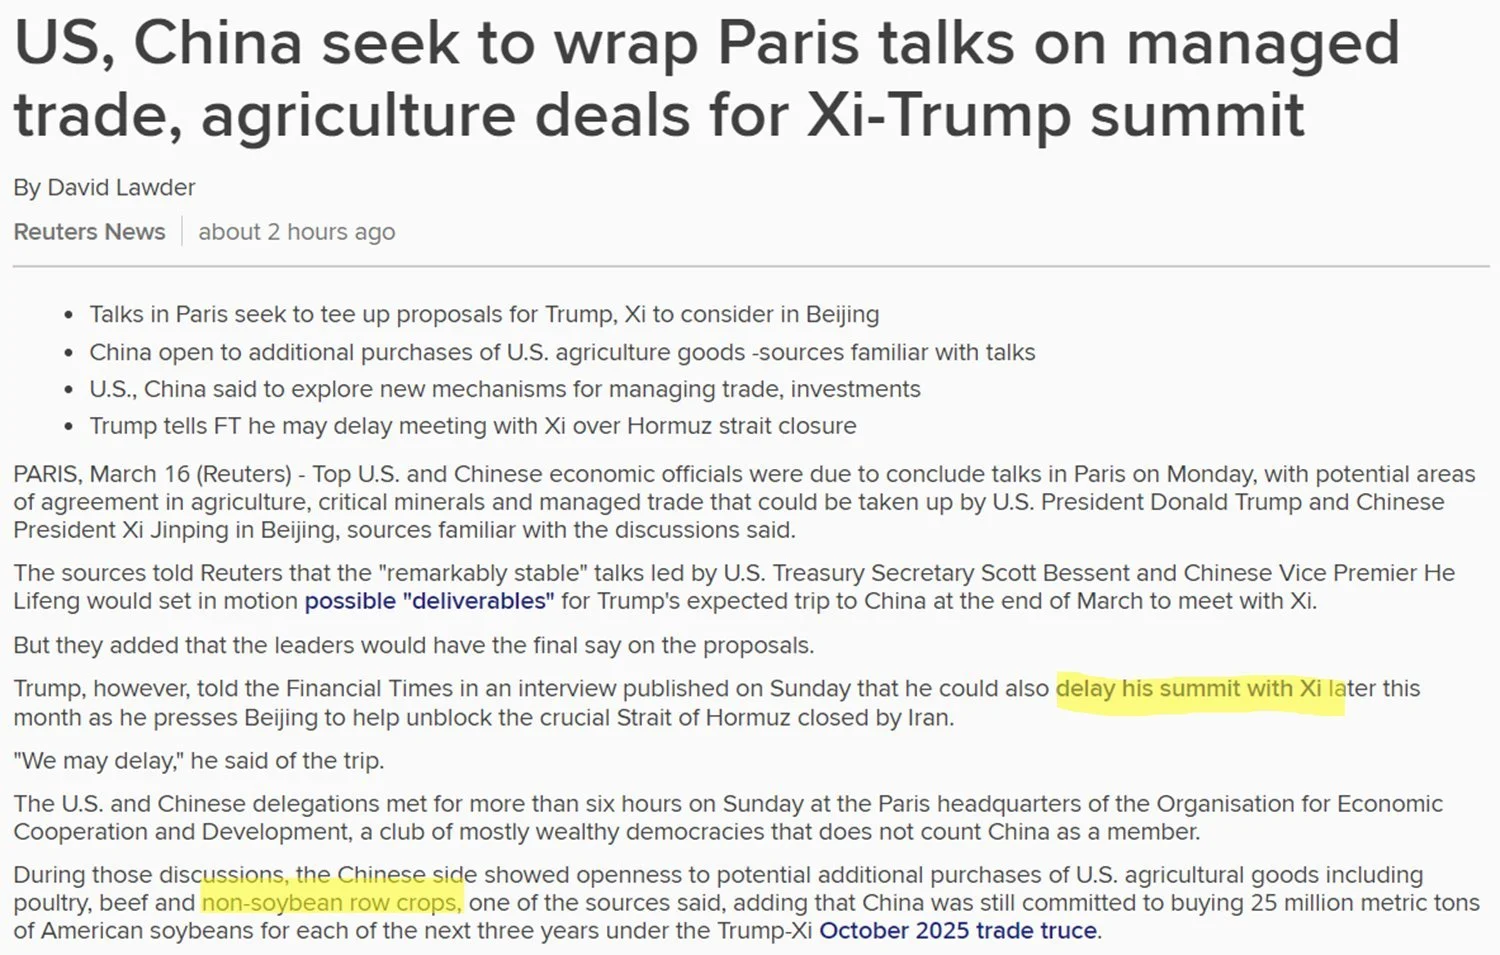
There was two announcements yesterday that led to that limit down move.
The first was that Trump said he was going to delay the meeting with China if China does not help the US re-open the Strait of Hormuz.
Basically, Trump is trying to pressure China into helping us solve the Strait issue and wants to delay the meeting so he can focus on fixing the war first.
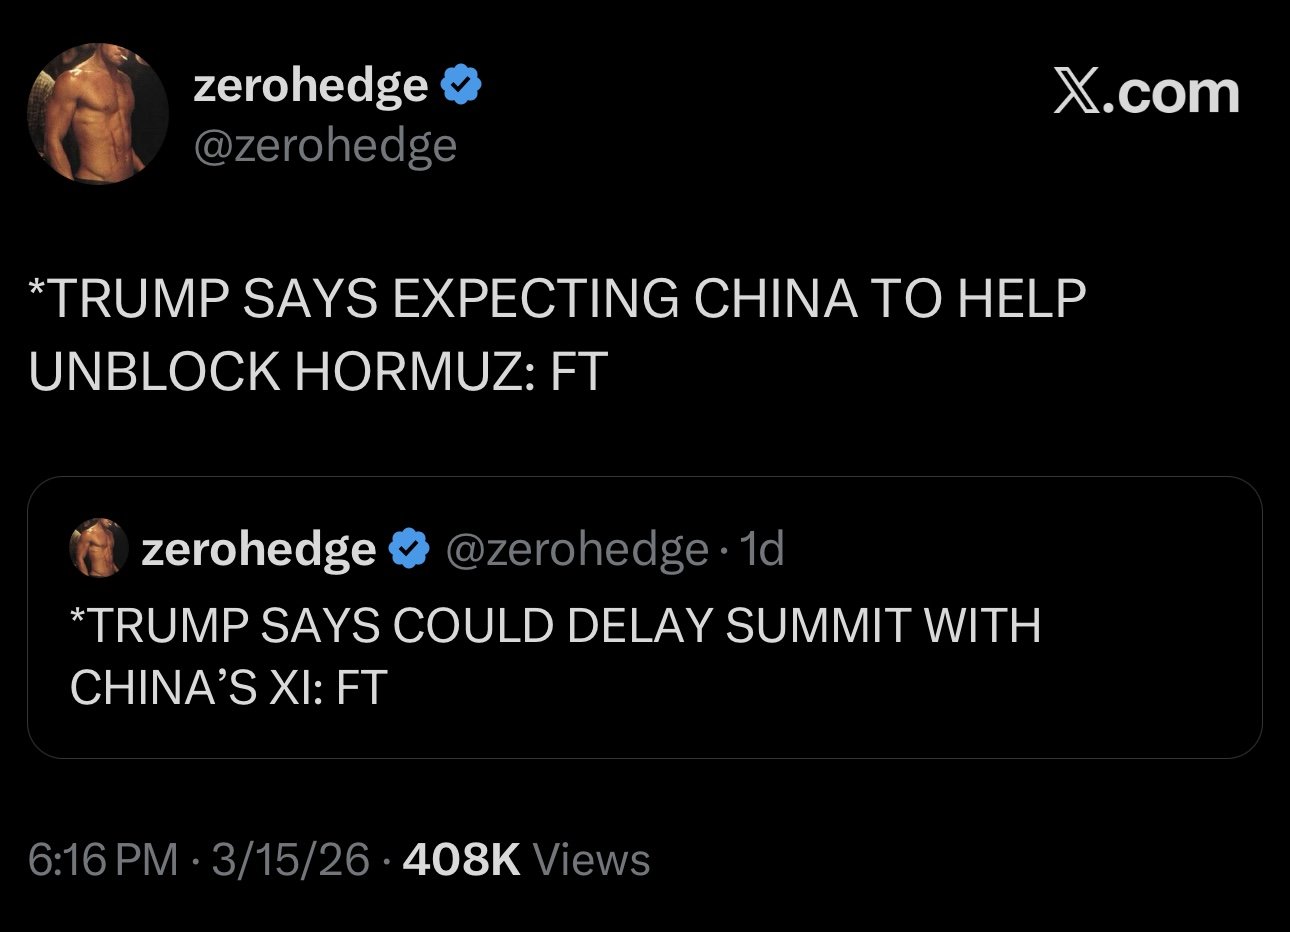
The next announcement was that China is open to buying non-soybean crops.
They indicated that they are still willing to buy that 25 MMT for new crop, but did not mention that extra 8 MMT of old crop for this year.
So this has the market thinking that China is no longer going to buy those extra beans Trump said they would. A lot of this rally was based off the anticipation of those purchases.
Instead, it sounds like China is more interested in buying other ag products instead.
Your intial thought has to be could China buy corn?
Or maybe, China is being strategic about buying soybeans. They said they would buy soybeans $1.00 ago. Maybe they wanted to get them cheaper. Guess we will find out within the next few weeks.
But the headlines did make it sound like China was not buying additional soybeans they haven’t already commited to.
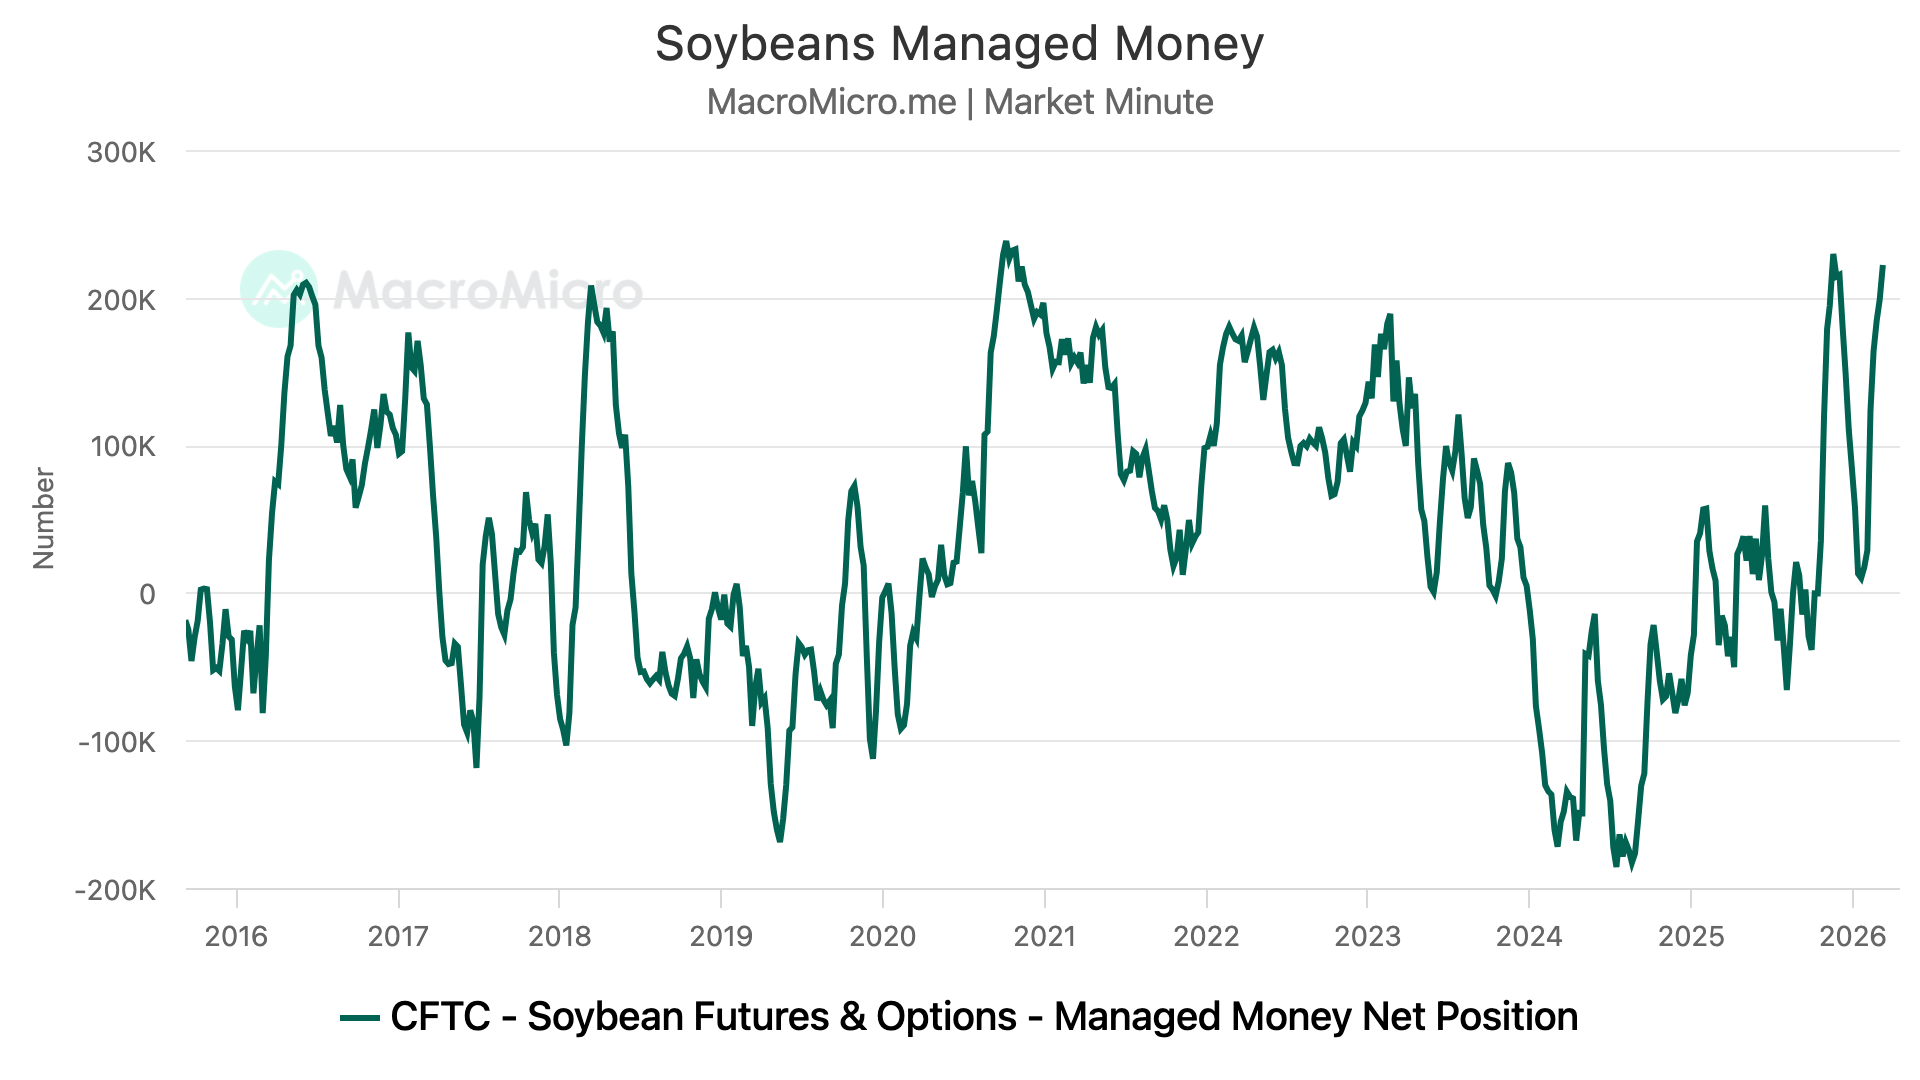
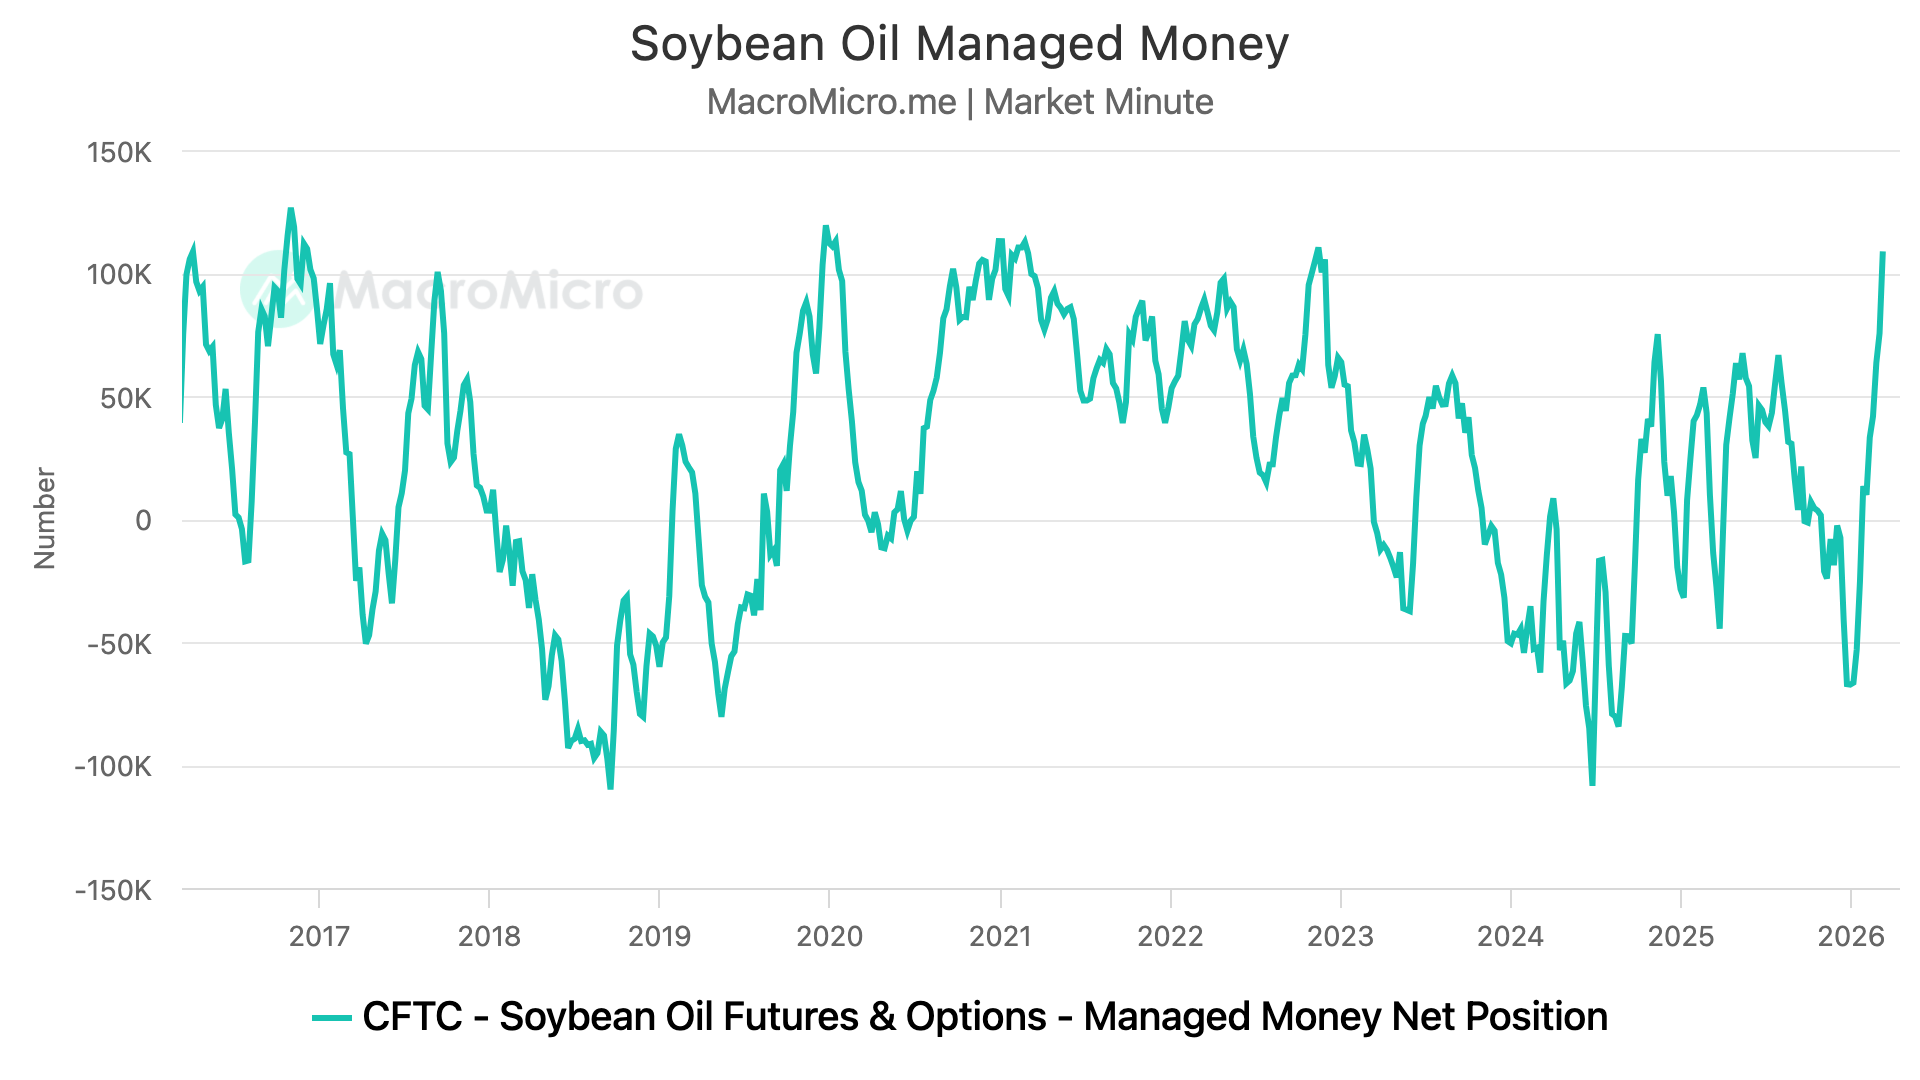
The funds were heavily long the entire soybean complex.
Near record long both soybeans and soybean oil.
So when this news hit the headlines, it triggered a ton of selling.
Last week, we talked about the funds being that long was a risk.
Although I don’t think anyone had a limit down move on a random Monday from one Sunday night headline on their bingo card.
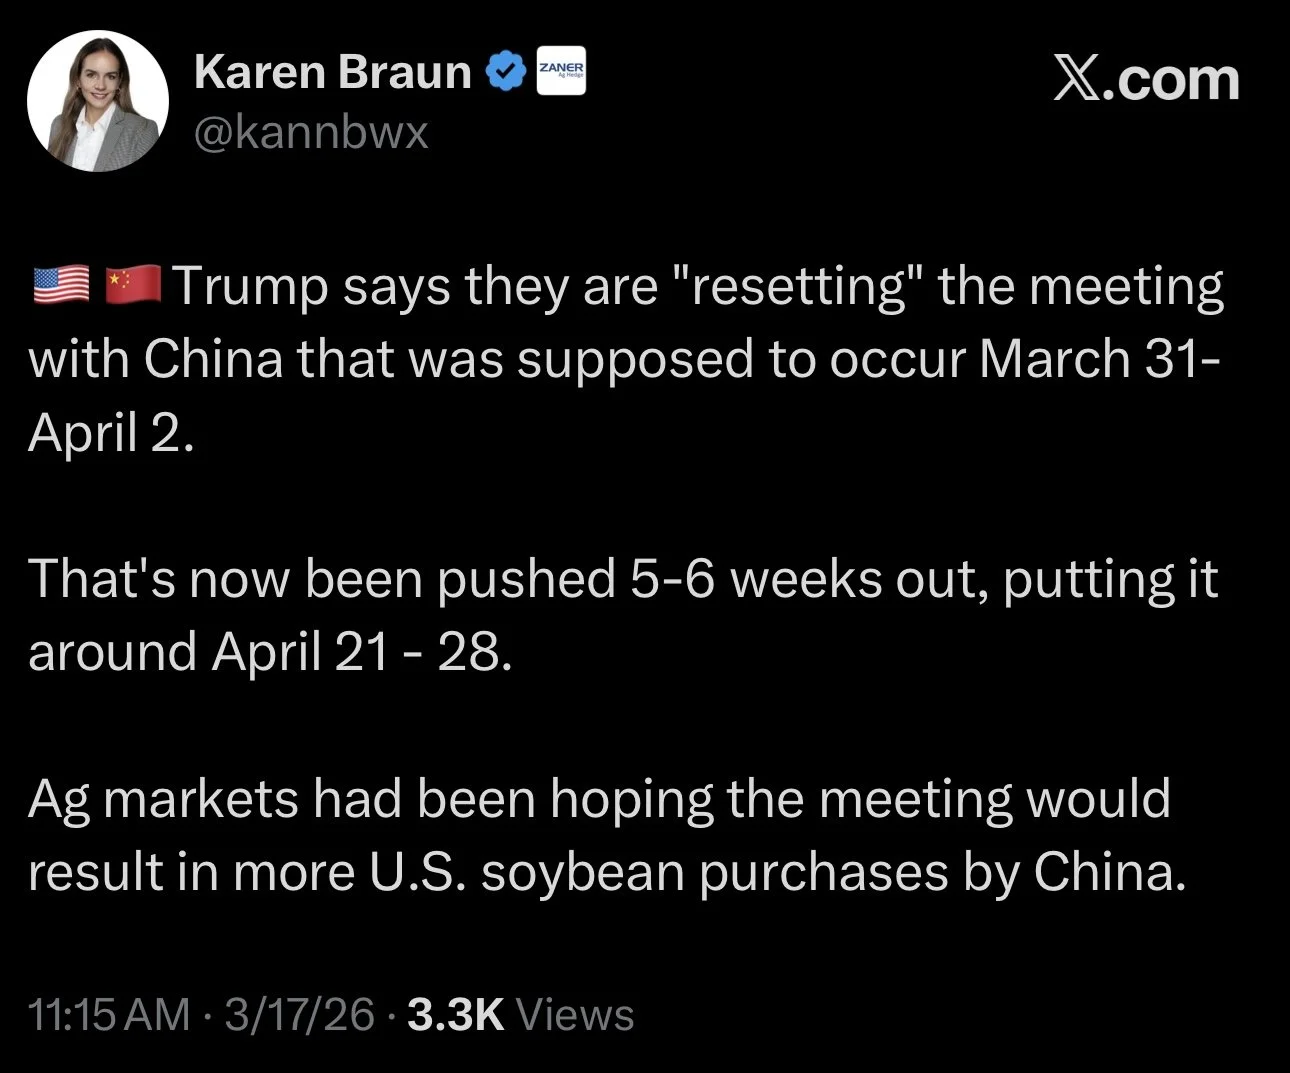
Meeting Rescheduled
Trump did then announce today that they will be resetting the meeting with China.
He said it will take place in 5 weeks.
Originally, the meeting was suppose to happen in 2 weeks, on March 31st.
5 weeks from today would be April 21st instead.
The good news is that the meeting is still on.
5 weeks leaves a lot of time for things to happen.
But this does indicate that Trump expects the Iran war to be over by then. As he was waiting for the war to be over before meeting with China.
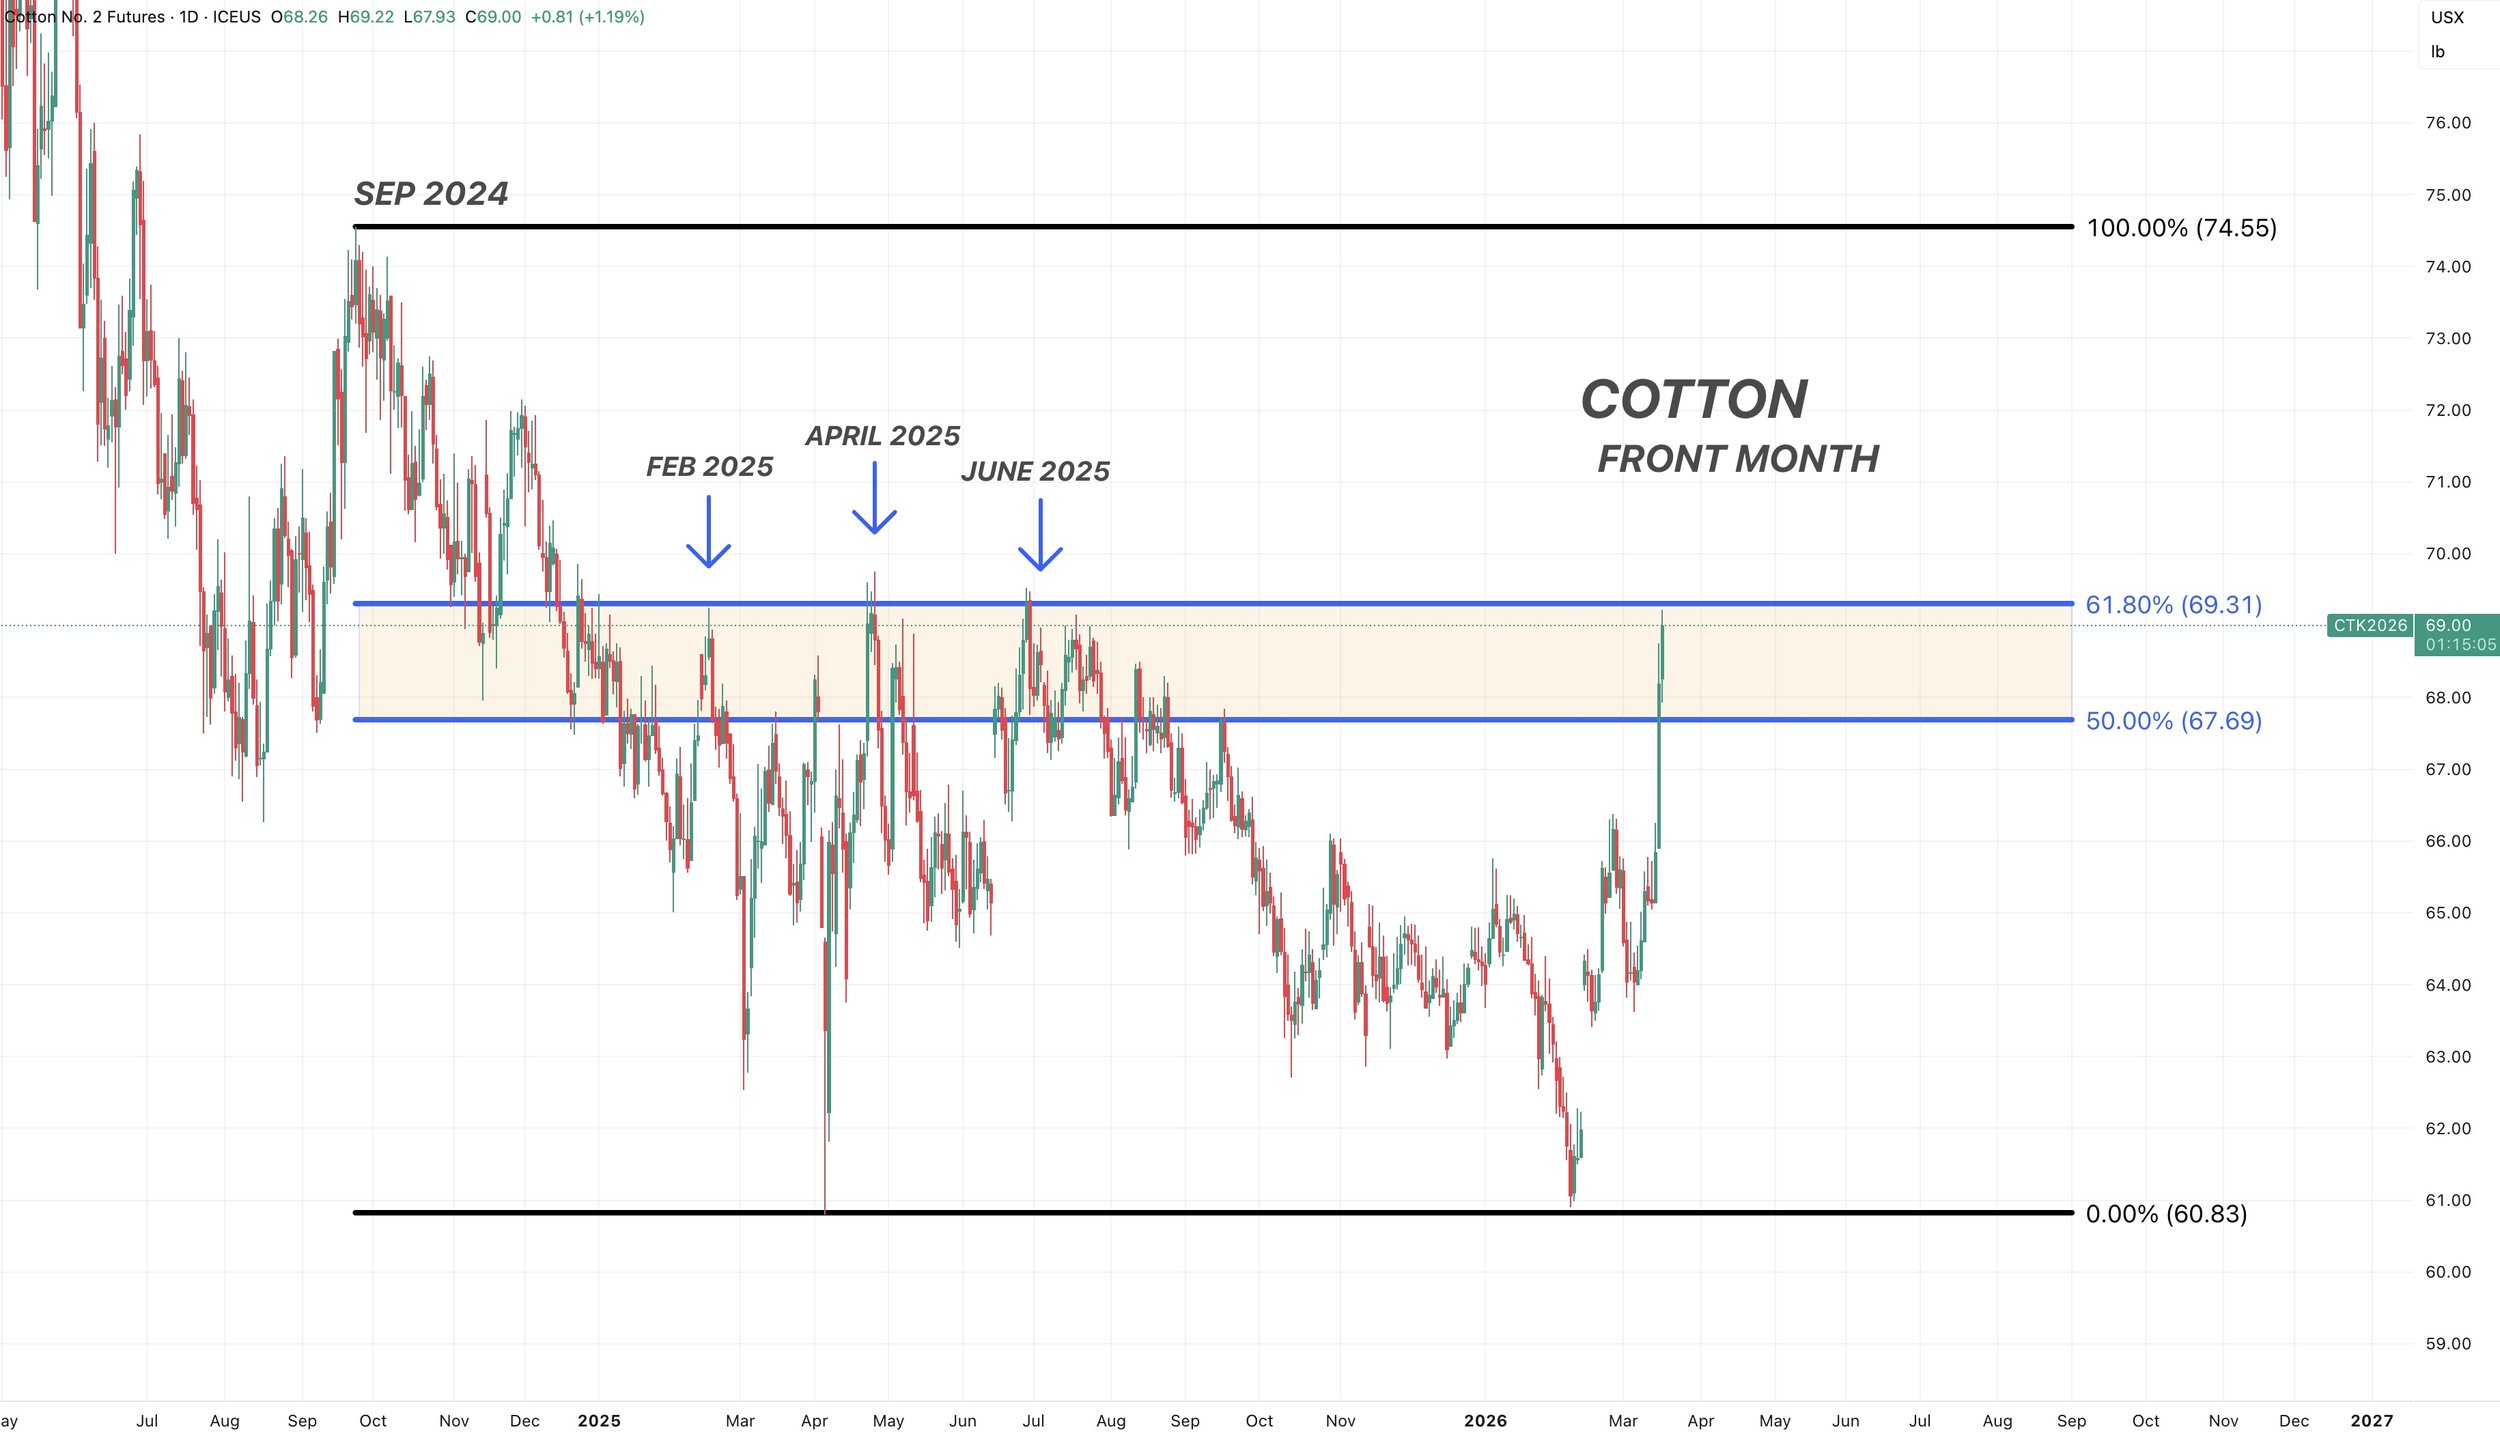
Cotton
We rarely touch on the cotton market, but it's roaring to 6-month highs on reports that China is entering the US export market.
It probably makes sense to reward this rally.
Here is the front month chart.
We've clawed back 61.8% of those highs from back in September 2024.
Right up against the 2025 highs, where we failed on 3 separate occasions.
Today's Main Takeaways
Corn
High Crude = High Corn or Not?
What would it take for crude to have a major impact on corn?
I showed this chart last week.
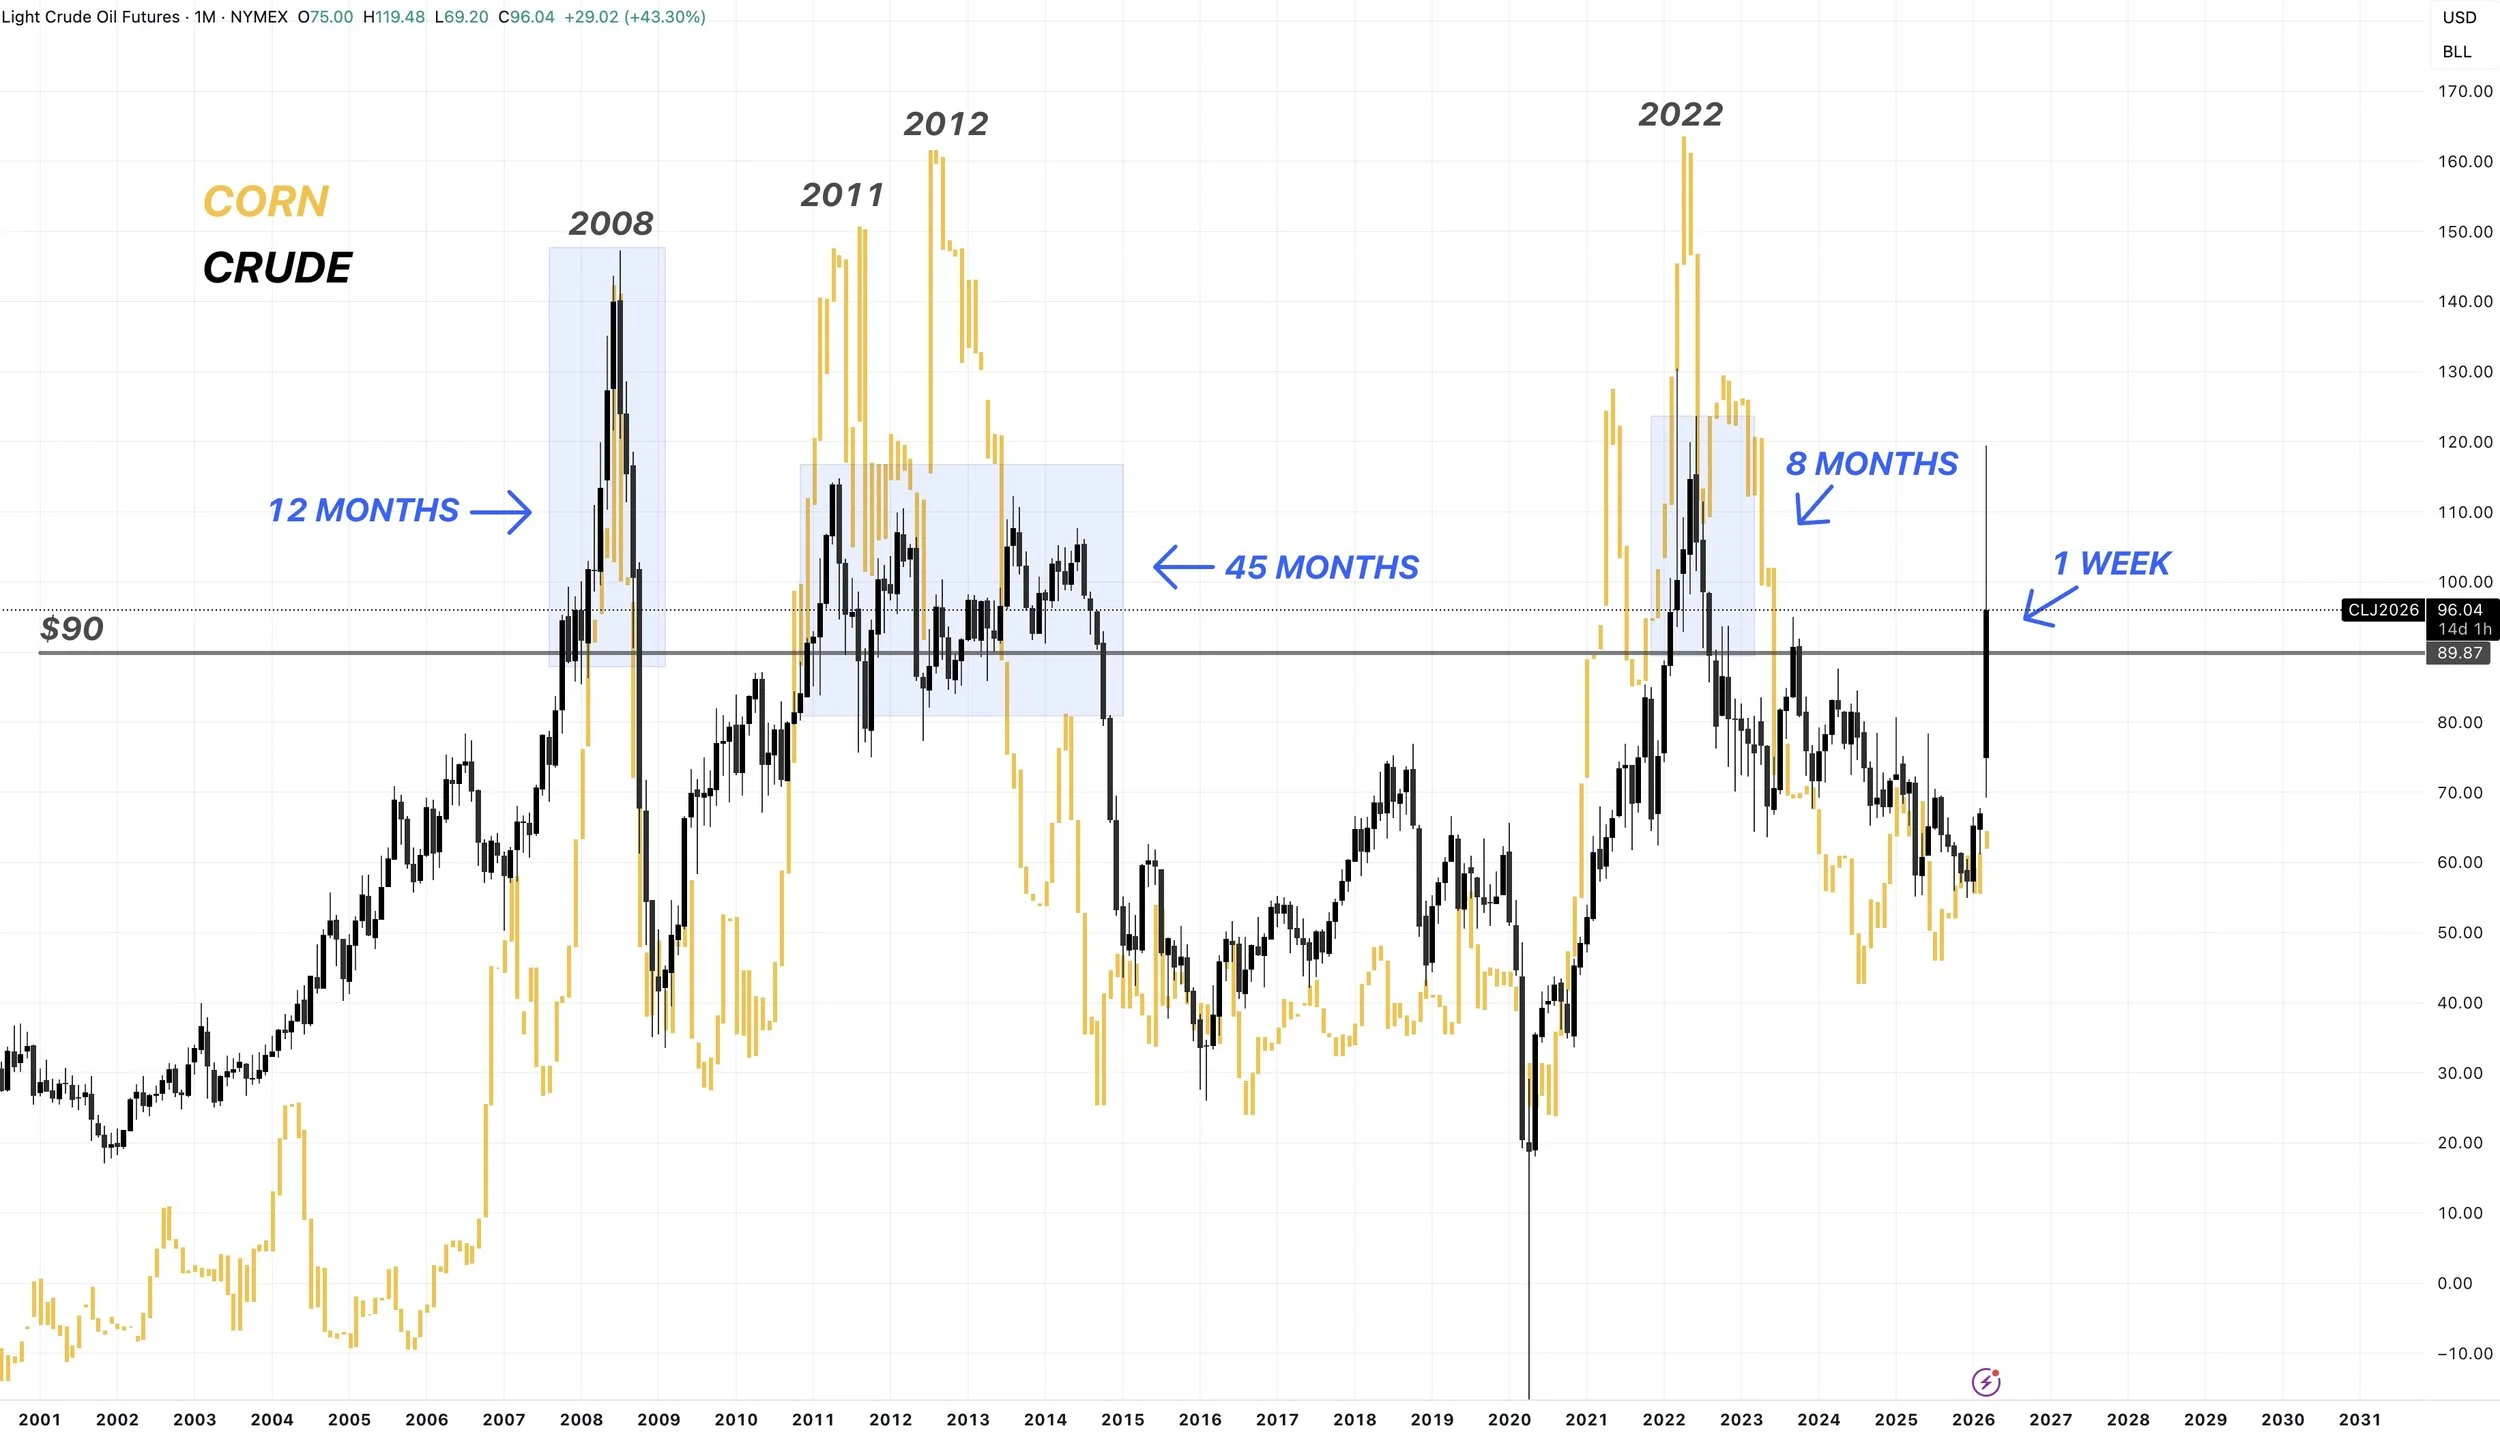
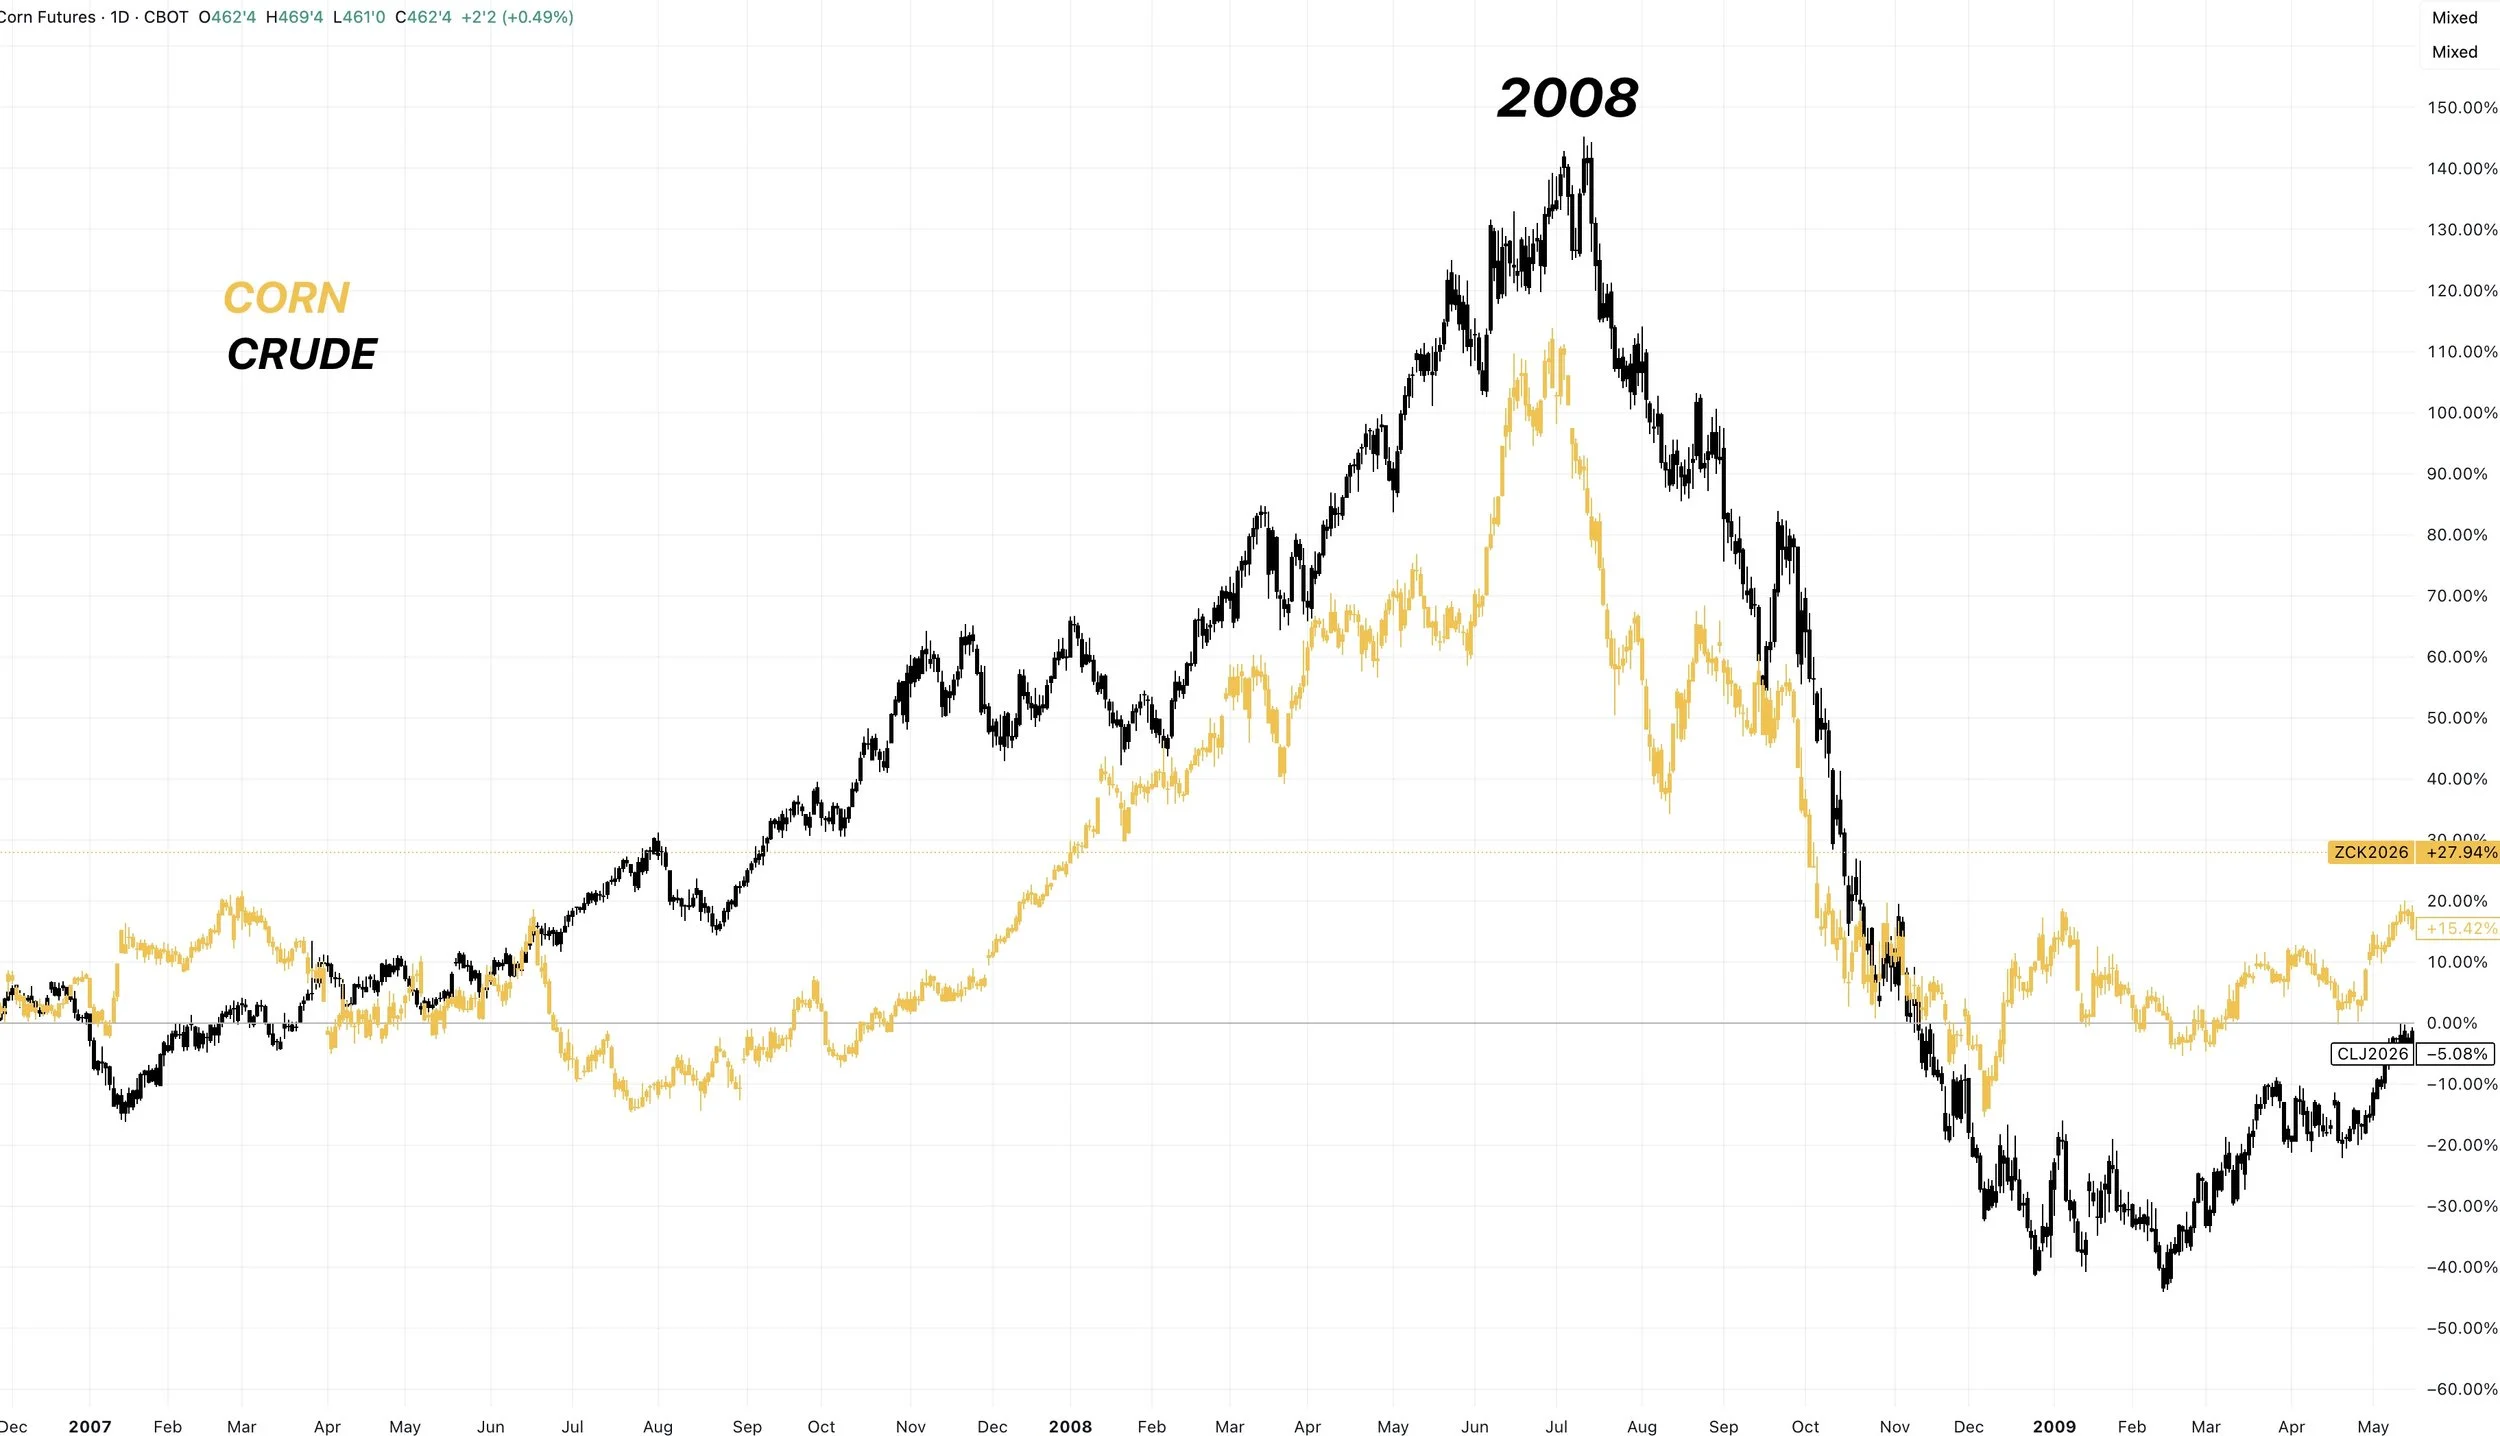
This is crude vs corn.
Usually when crude goes above $90, corn follows higher.
I mean the last 3 times crude went above $90, corn traded above $7.
Looking at this chart, you'd think corn is pretty undervalued in comparison to crude based on what we've previously seen.
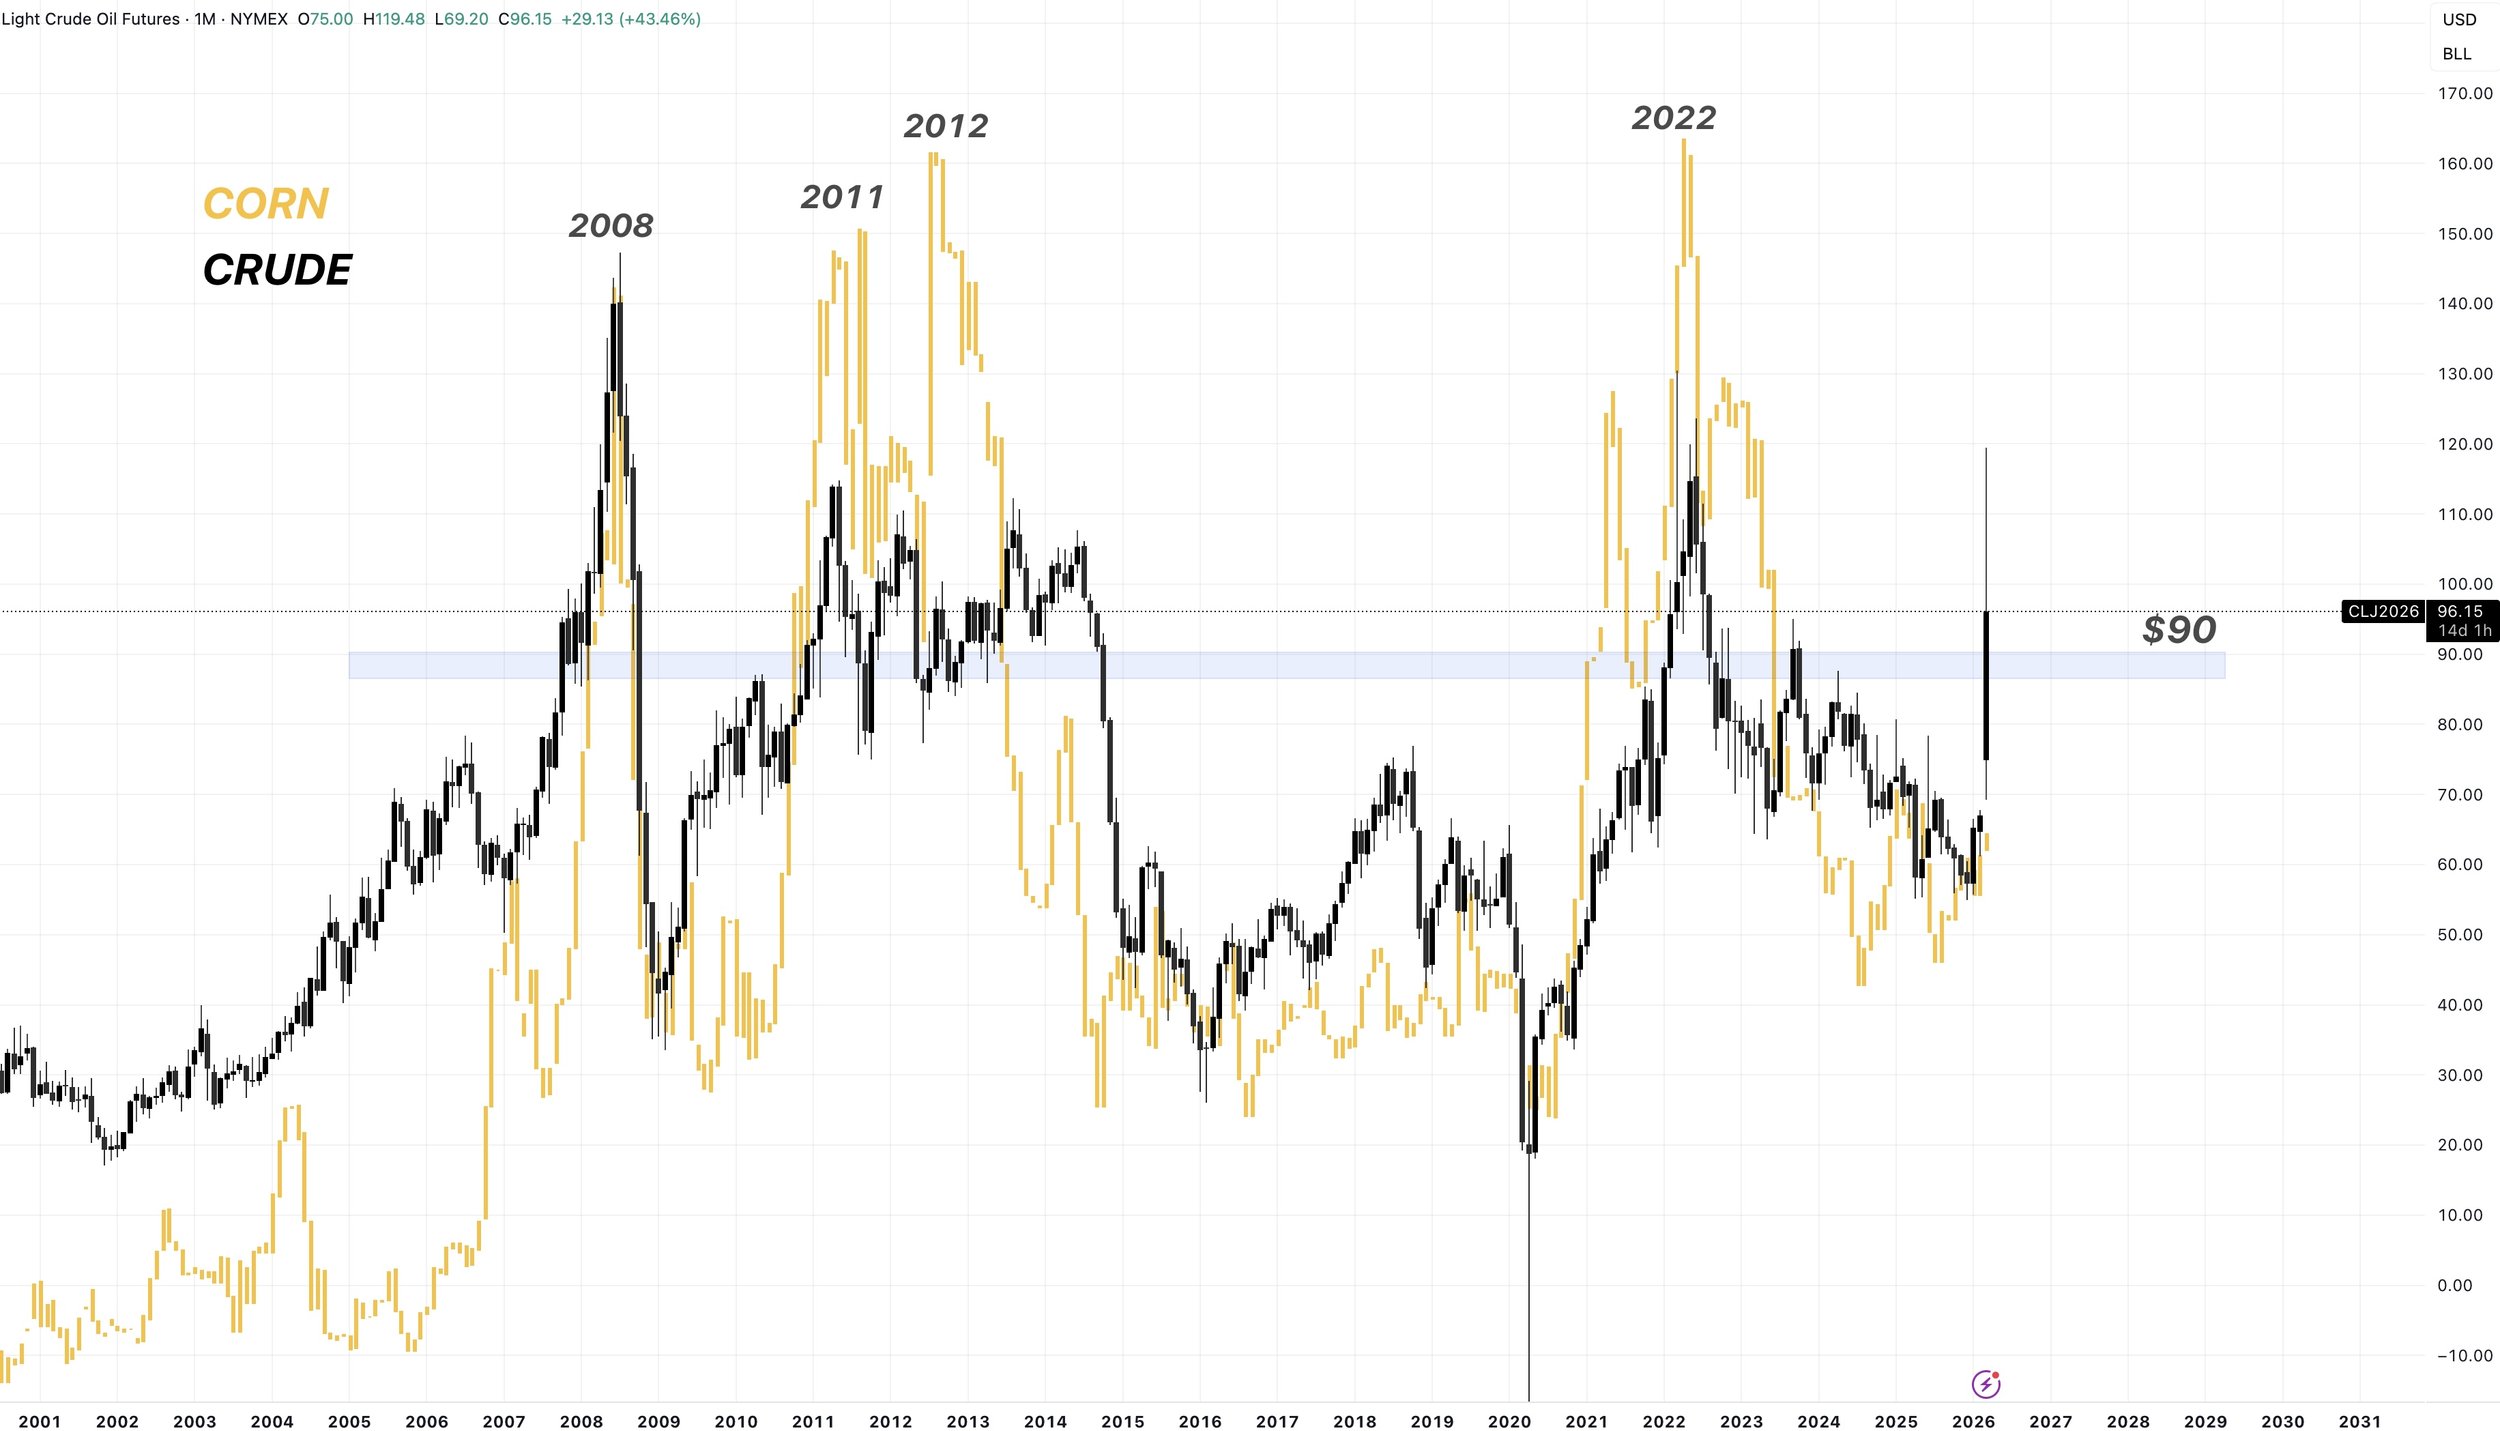
The key here is IF crude stays elevated.
All of the previous rallies in crude lasted a long time.
In 2008 crude was above $90 for 12 months straight.
From 2010 to 2013, crude was above $90 for 45 months, nearly 4 years.
In 2022, it was above $90 for about 8 months.
Today, we've only been above $90 for about a week.
For corn to follow crude, this rally in crude would likely have to be a sustained rally like the previous ones.
Not a rally that only lasts for a few weeks.
Yes. It is "possible" that crude stays above $90 to $100 for months or an extended period of time. Thus bringing corn for the ride. Maybe the war situation somehow gets out of hand.
However, I do not think that happens.
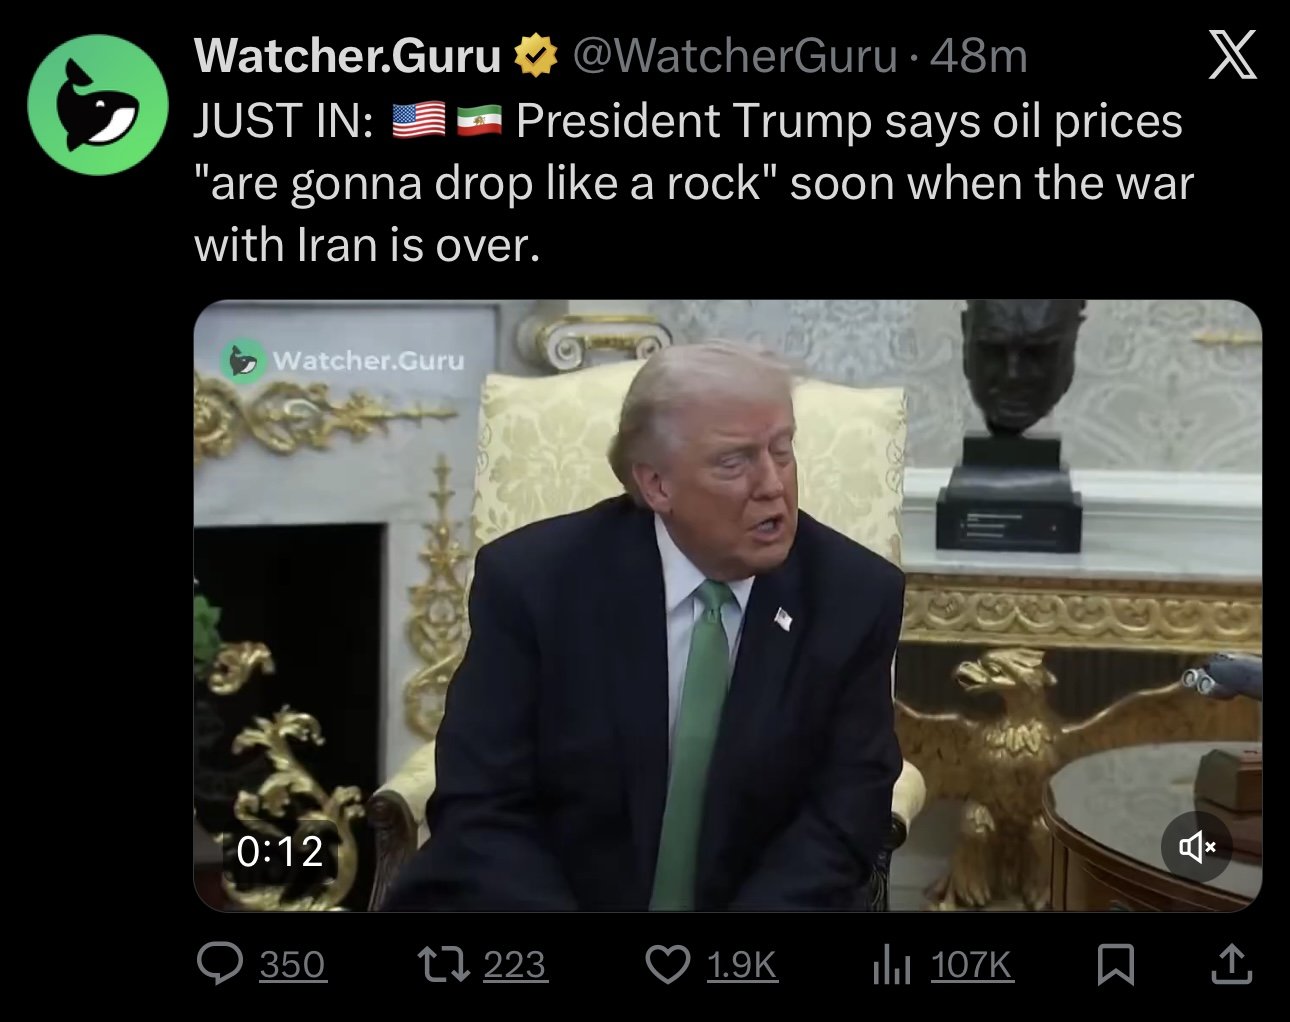
Trump does not want high crude prices. At all.
It's bad for inflation. It's bad for gas prices.
He literally said this today:
Oil prices will "drop like a rock" when the war is over.
He will do anything he can to keep oil low.
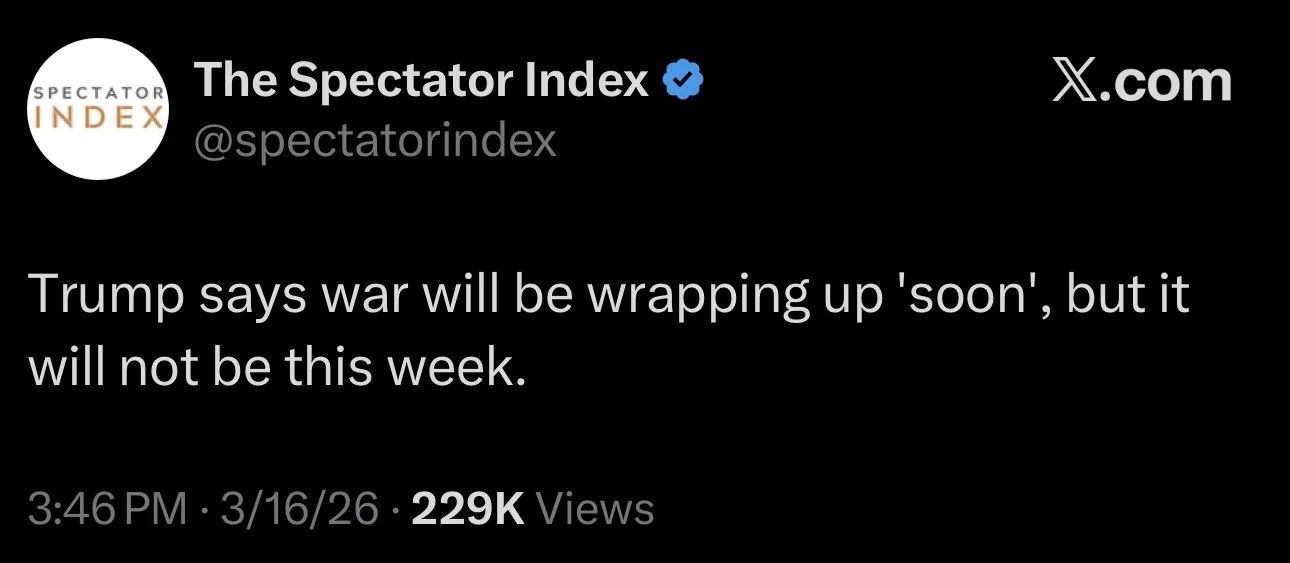
He also stated that:
The war will "be over soon, but not this week".
Acres Are a Big Deal
We have a huge USDA report at the end of the month.
It's on Tuesday March 31st. Exactly two weeks from today.
This report is going to give us our first look at acres.
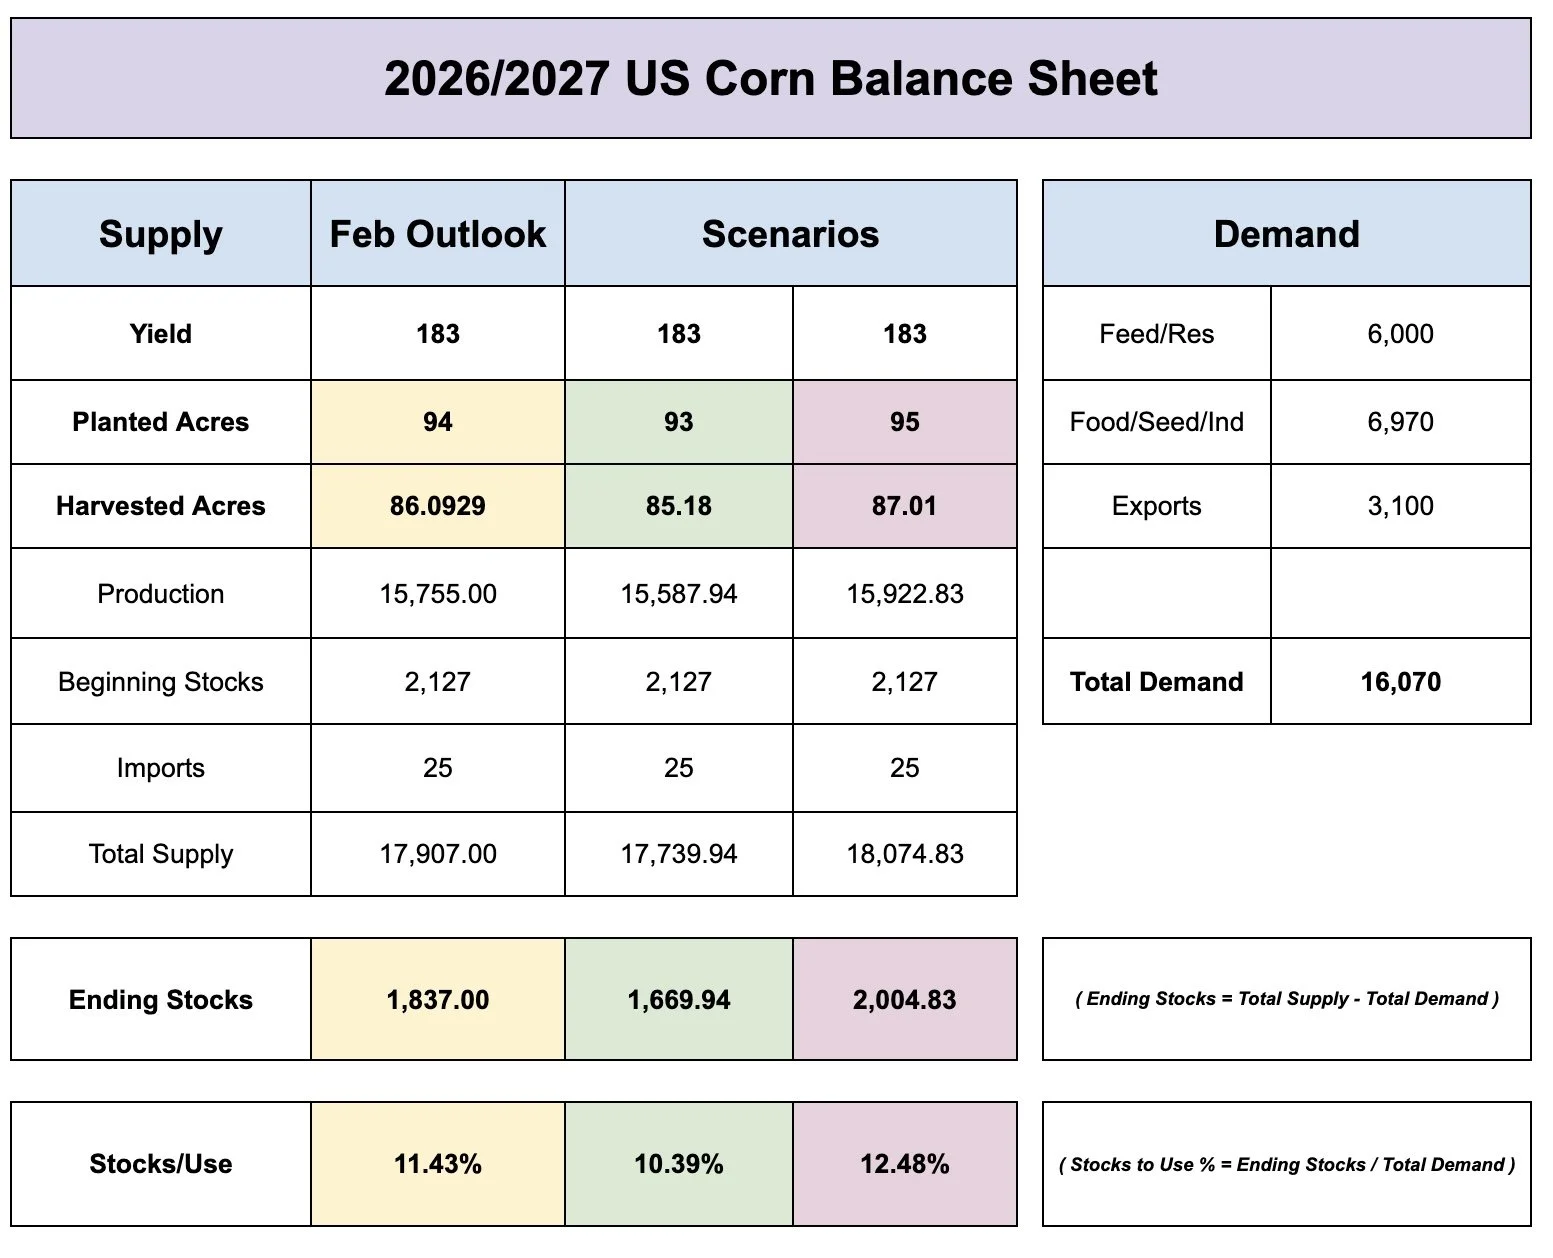
The Feb outlook had 94 million acres.
Below are 3 separate scenarios for the corn balance sheet.
All 3 use the Feb outlook demand numbers and a 183 yield to show you the impact acres have.
If we get less than 94 million acres, it would be a huge deal for corn. The funds just got pretty long corn. If acres are low, they are probably going to stick to their long position knowing that things could tight with any sort of hiccup this summer.
Without changing demand, 93 million acres would give you a near 10% stocks to use even with a 183 yield. That does not leave much room for error.
On the other hand, if acres come in high, it could very easily keep a lid on us. We would probably need some sort of weather scare this summer to get a huge opportunity.
Because if you use the same demand numbers and a 183 yield, 95 million acres instead of 93 million prints a 2 billion bushel carryout.
So yes. Acres will be very important when it comes to deciding just how much upside this market has, and how big of an impact a weather scare could have.
Like we've talked about before. The US story isn’t considered super bullish as of right now.
But the world situation is extremely tight. Tightest in over a decade.
So the US has to perform and has to have a big crop.
If we don’t, things would get interesting fast.
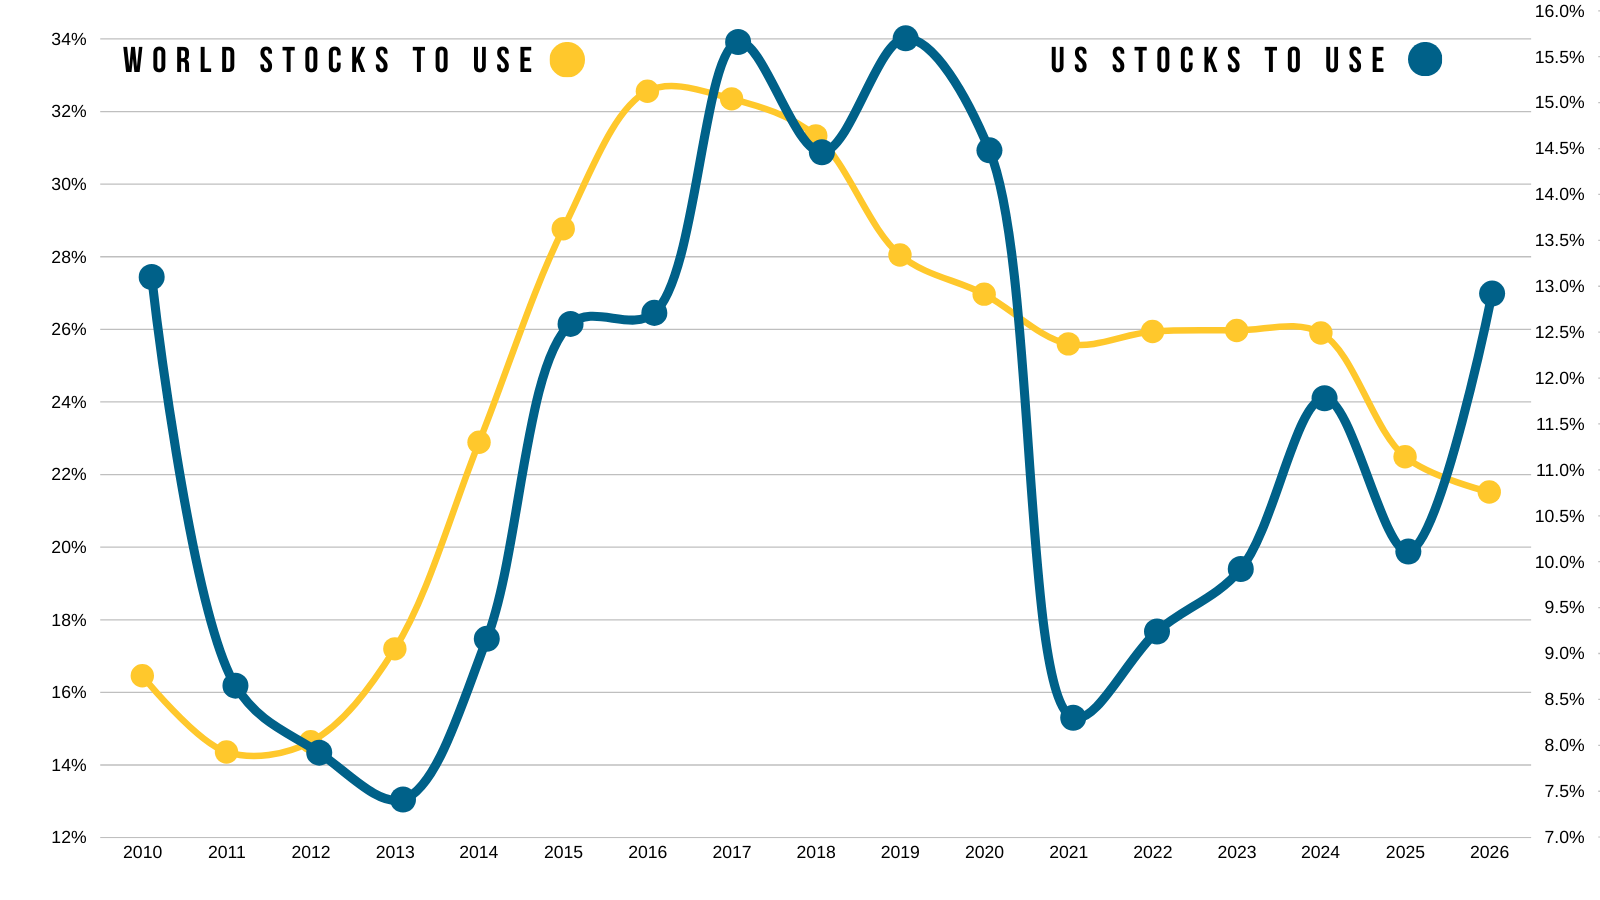
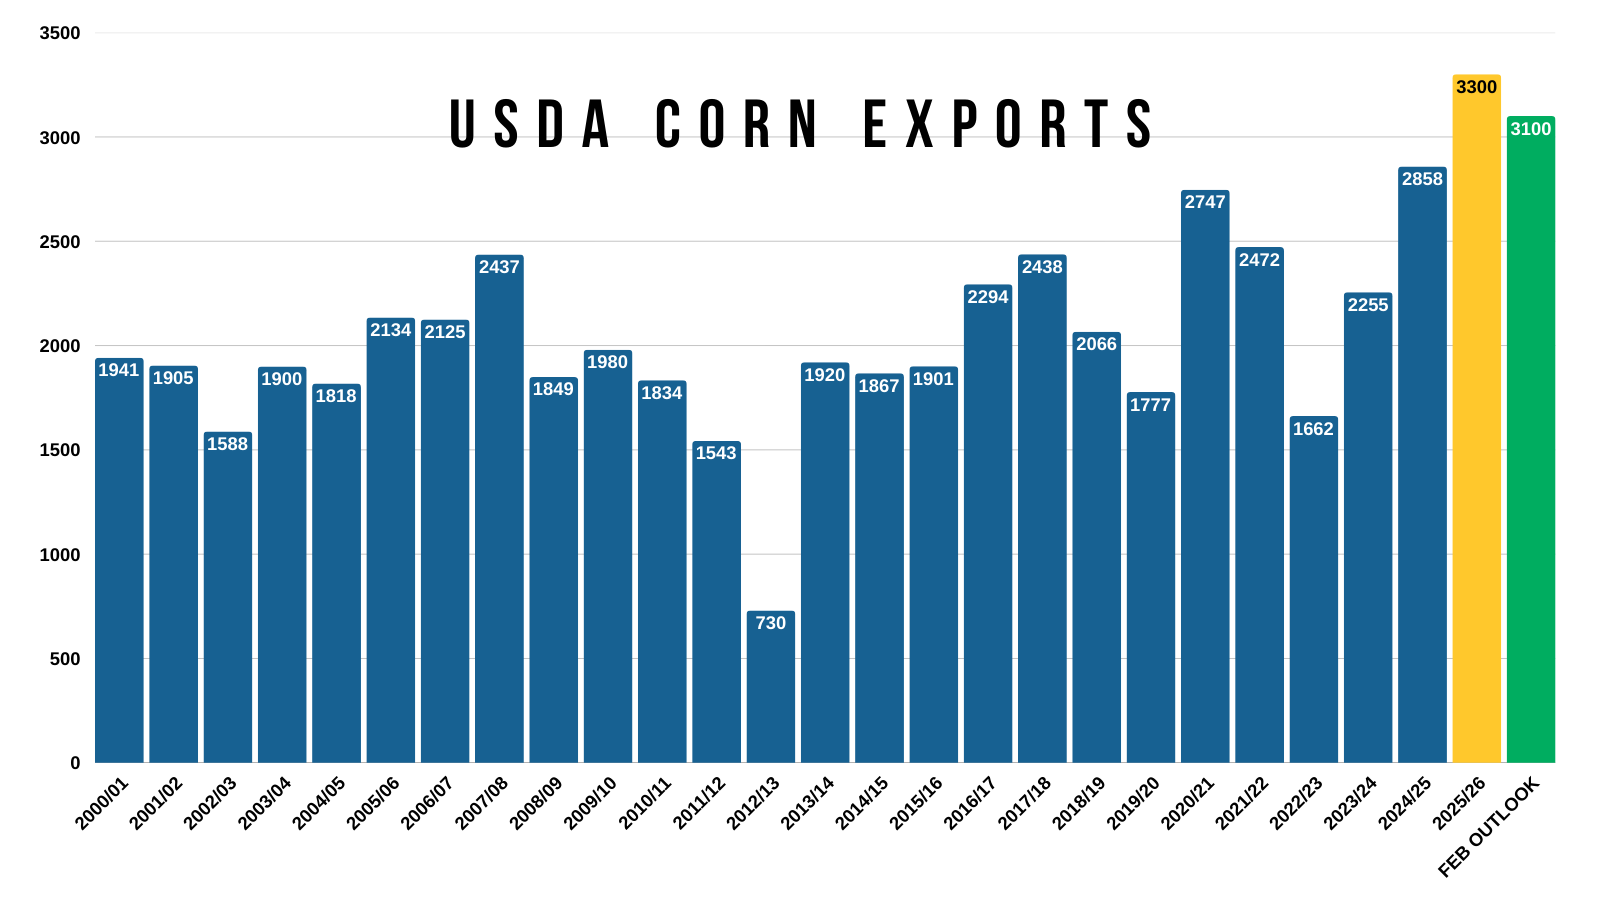
We have record demand.
We absolutely will need a big crop to meet that demand.
What happens if we can’t meet demand?
Prices usually have to higher to justify rationing demand lower.
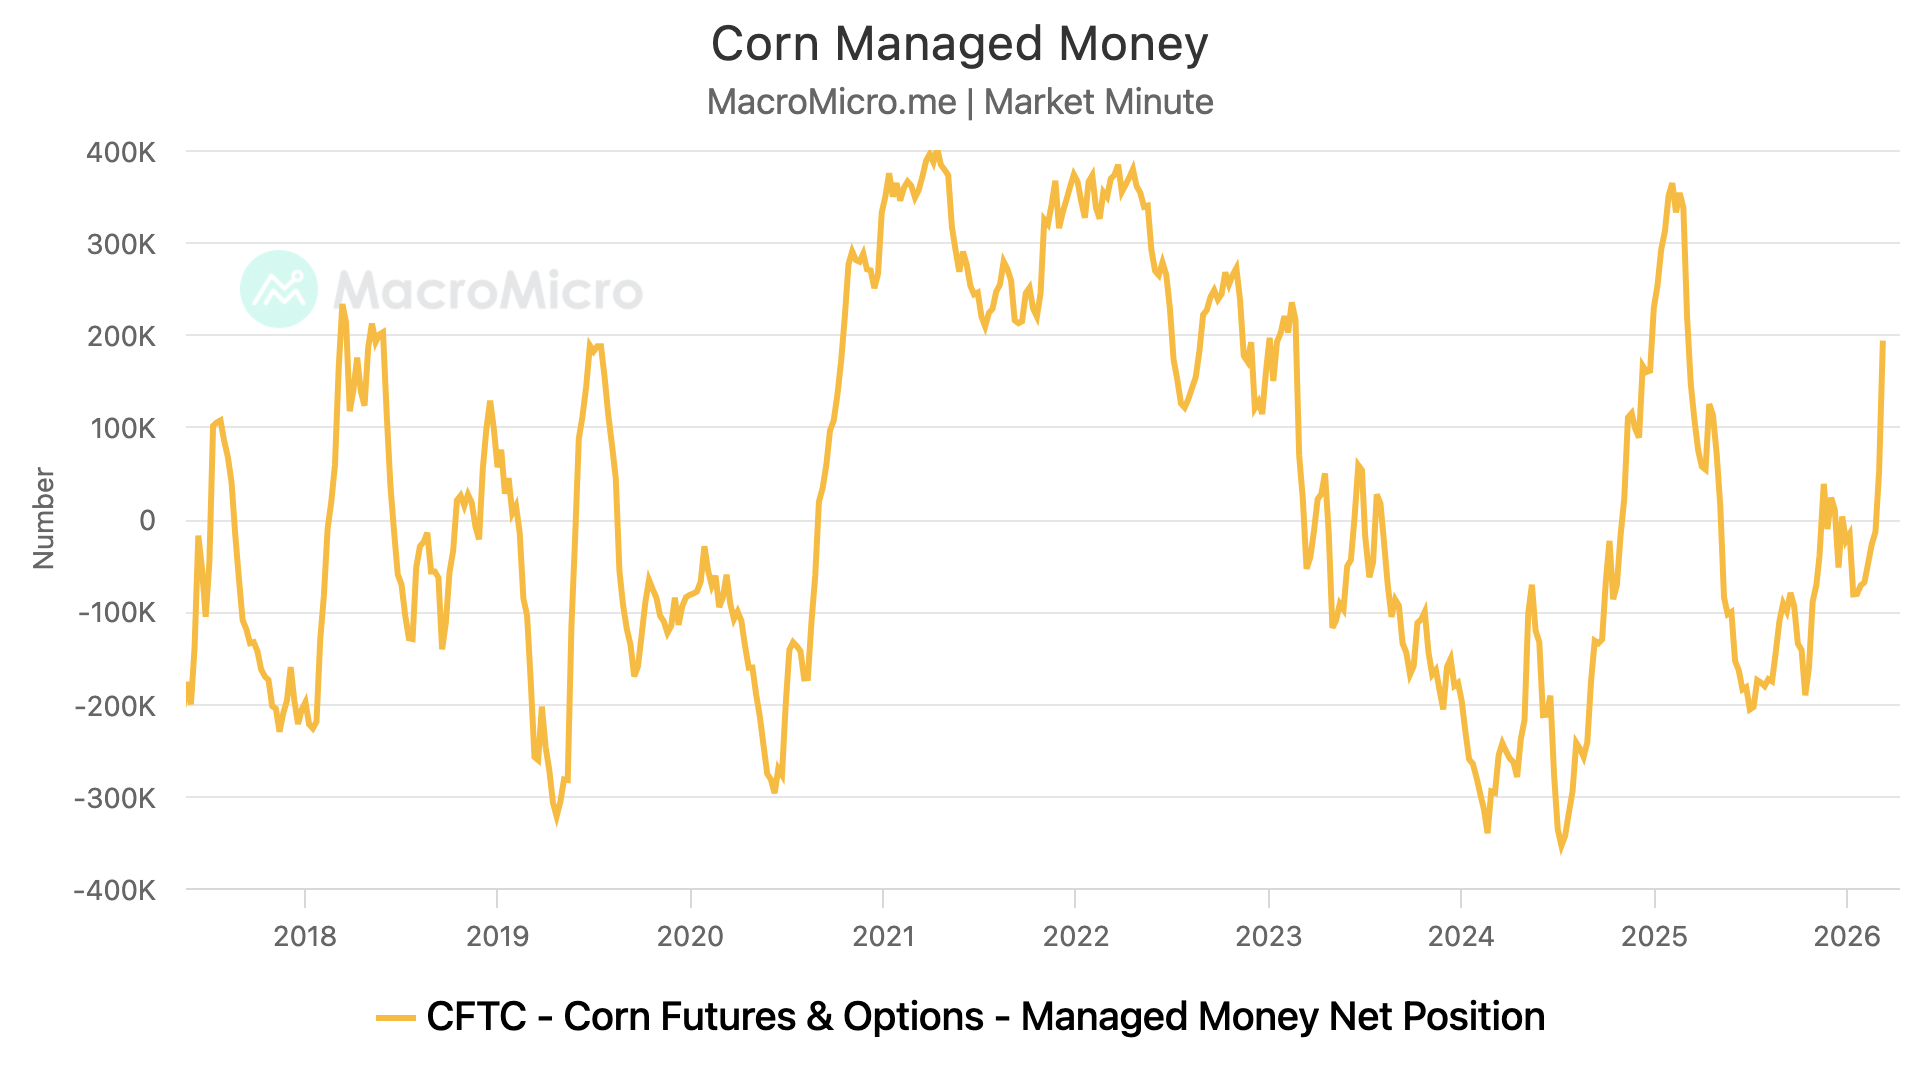
Record Fund Buying
Funds are now long 200k contracts of corn.
They were net buyers of almost 150k for the week ending March 10th.
That was the 4th largest week of buying ever..
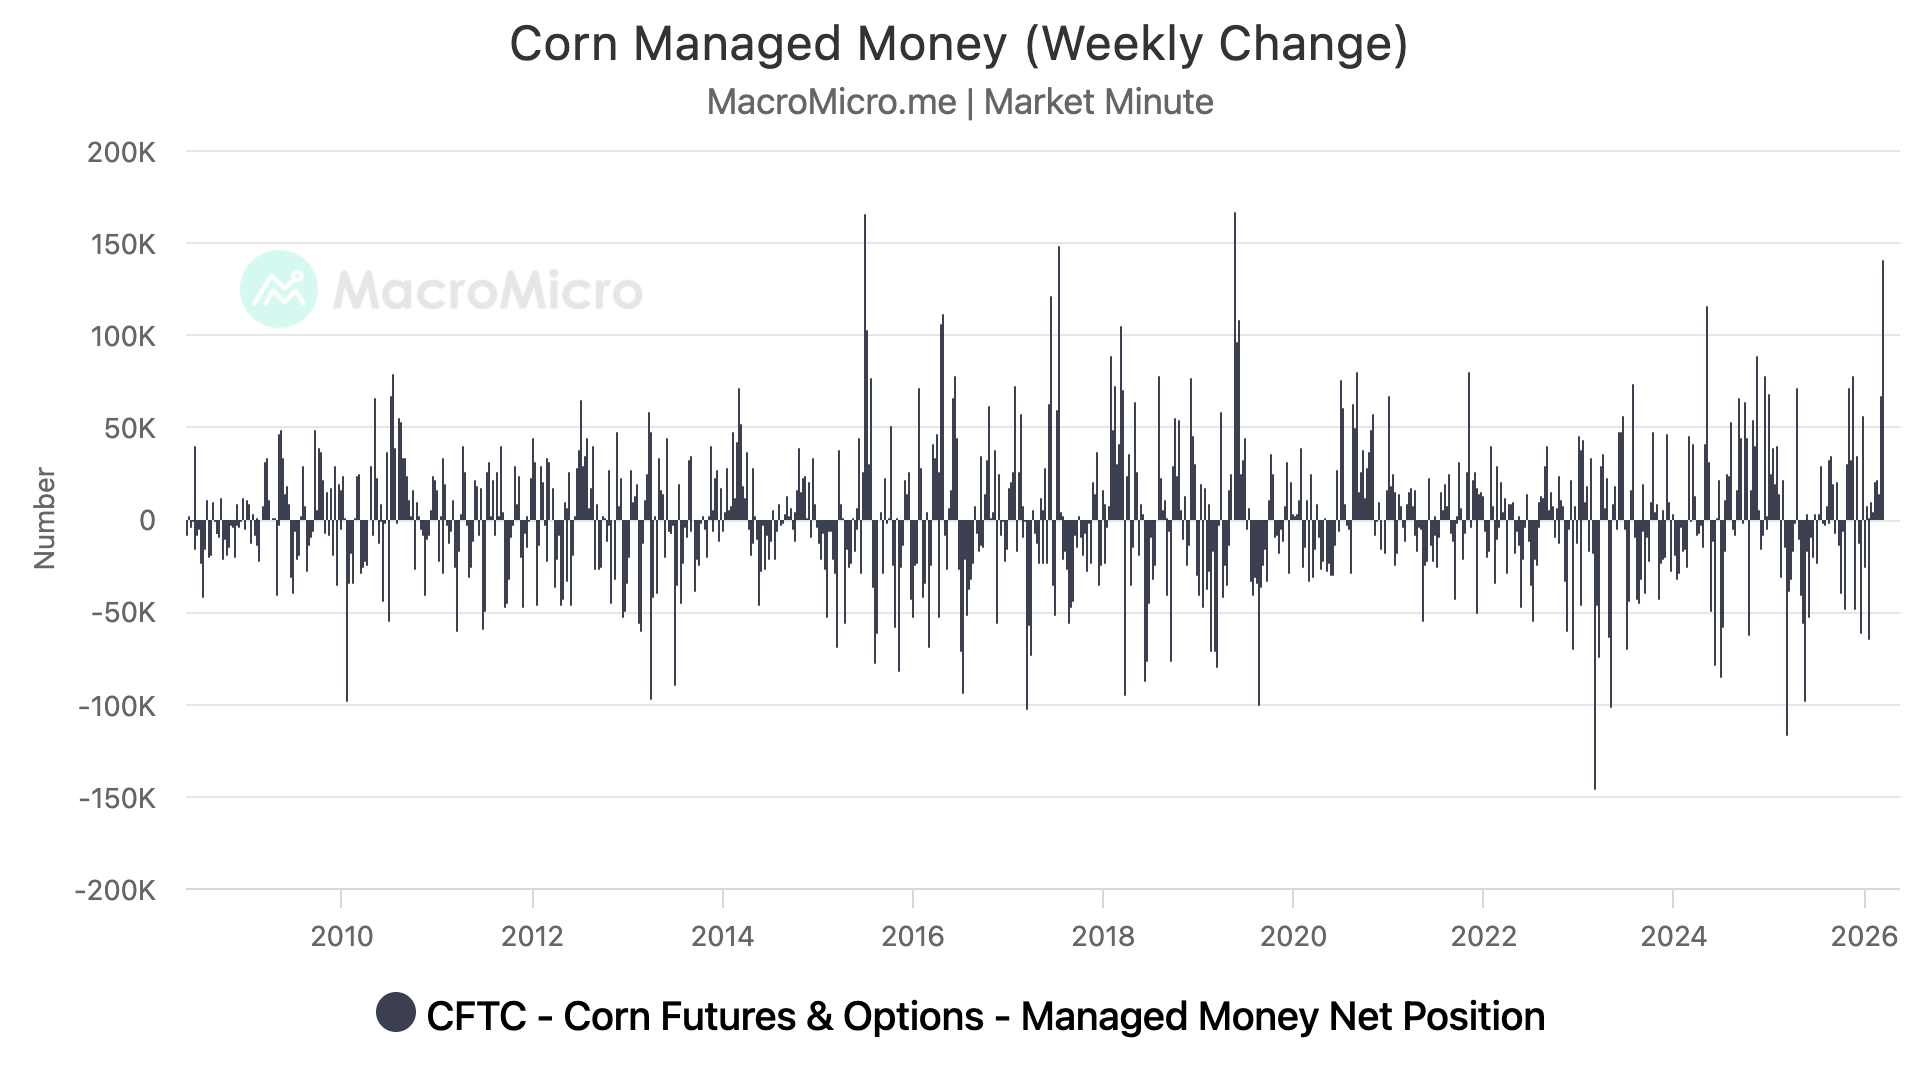
They are now the longest they've been since March 2025, a year ago.
Despite the record buying.. during this time frame corn was only up 6 cents.
So we didn’t see a massive rally despite one of the largest spurs of buying on record.
Why?
Farmer selling. A ton of it.
When farmers sell, commercials buy it, they then hedge it with futures. The funds then bought the commercials' hedges. Creating somewhat of a wash on the board.
You could argue that this is a positive thing.
The farmer owns less corn.
The record long position in the funds is around 400k contracts. Meaning they are only about halfway to the record and could have some more room to buy.
This rally hasn’t been a fundamental driven rally.
A lot of this rally and reason behind the fund buying has been due to the war and rally in crude.
So that has to be an obvious concern moving forward, and why we liked defending the rally.
If crude decides to fall apart, will corn follow?
That's what can often happen. Take 2008 for example.
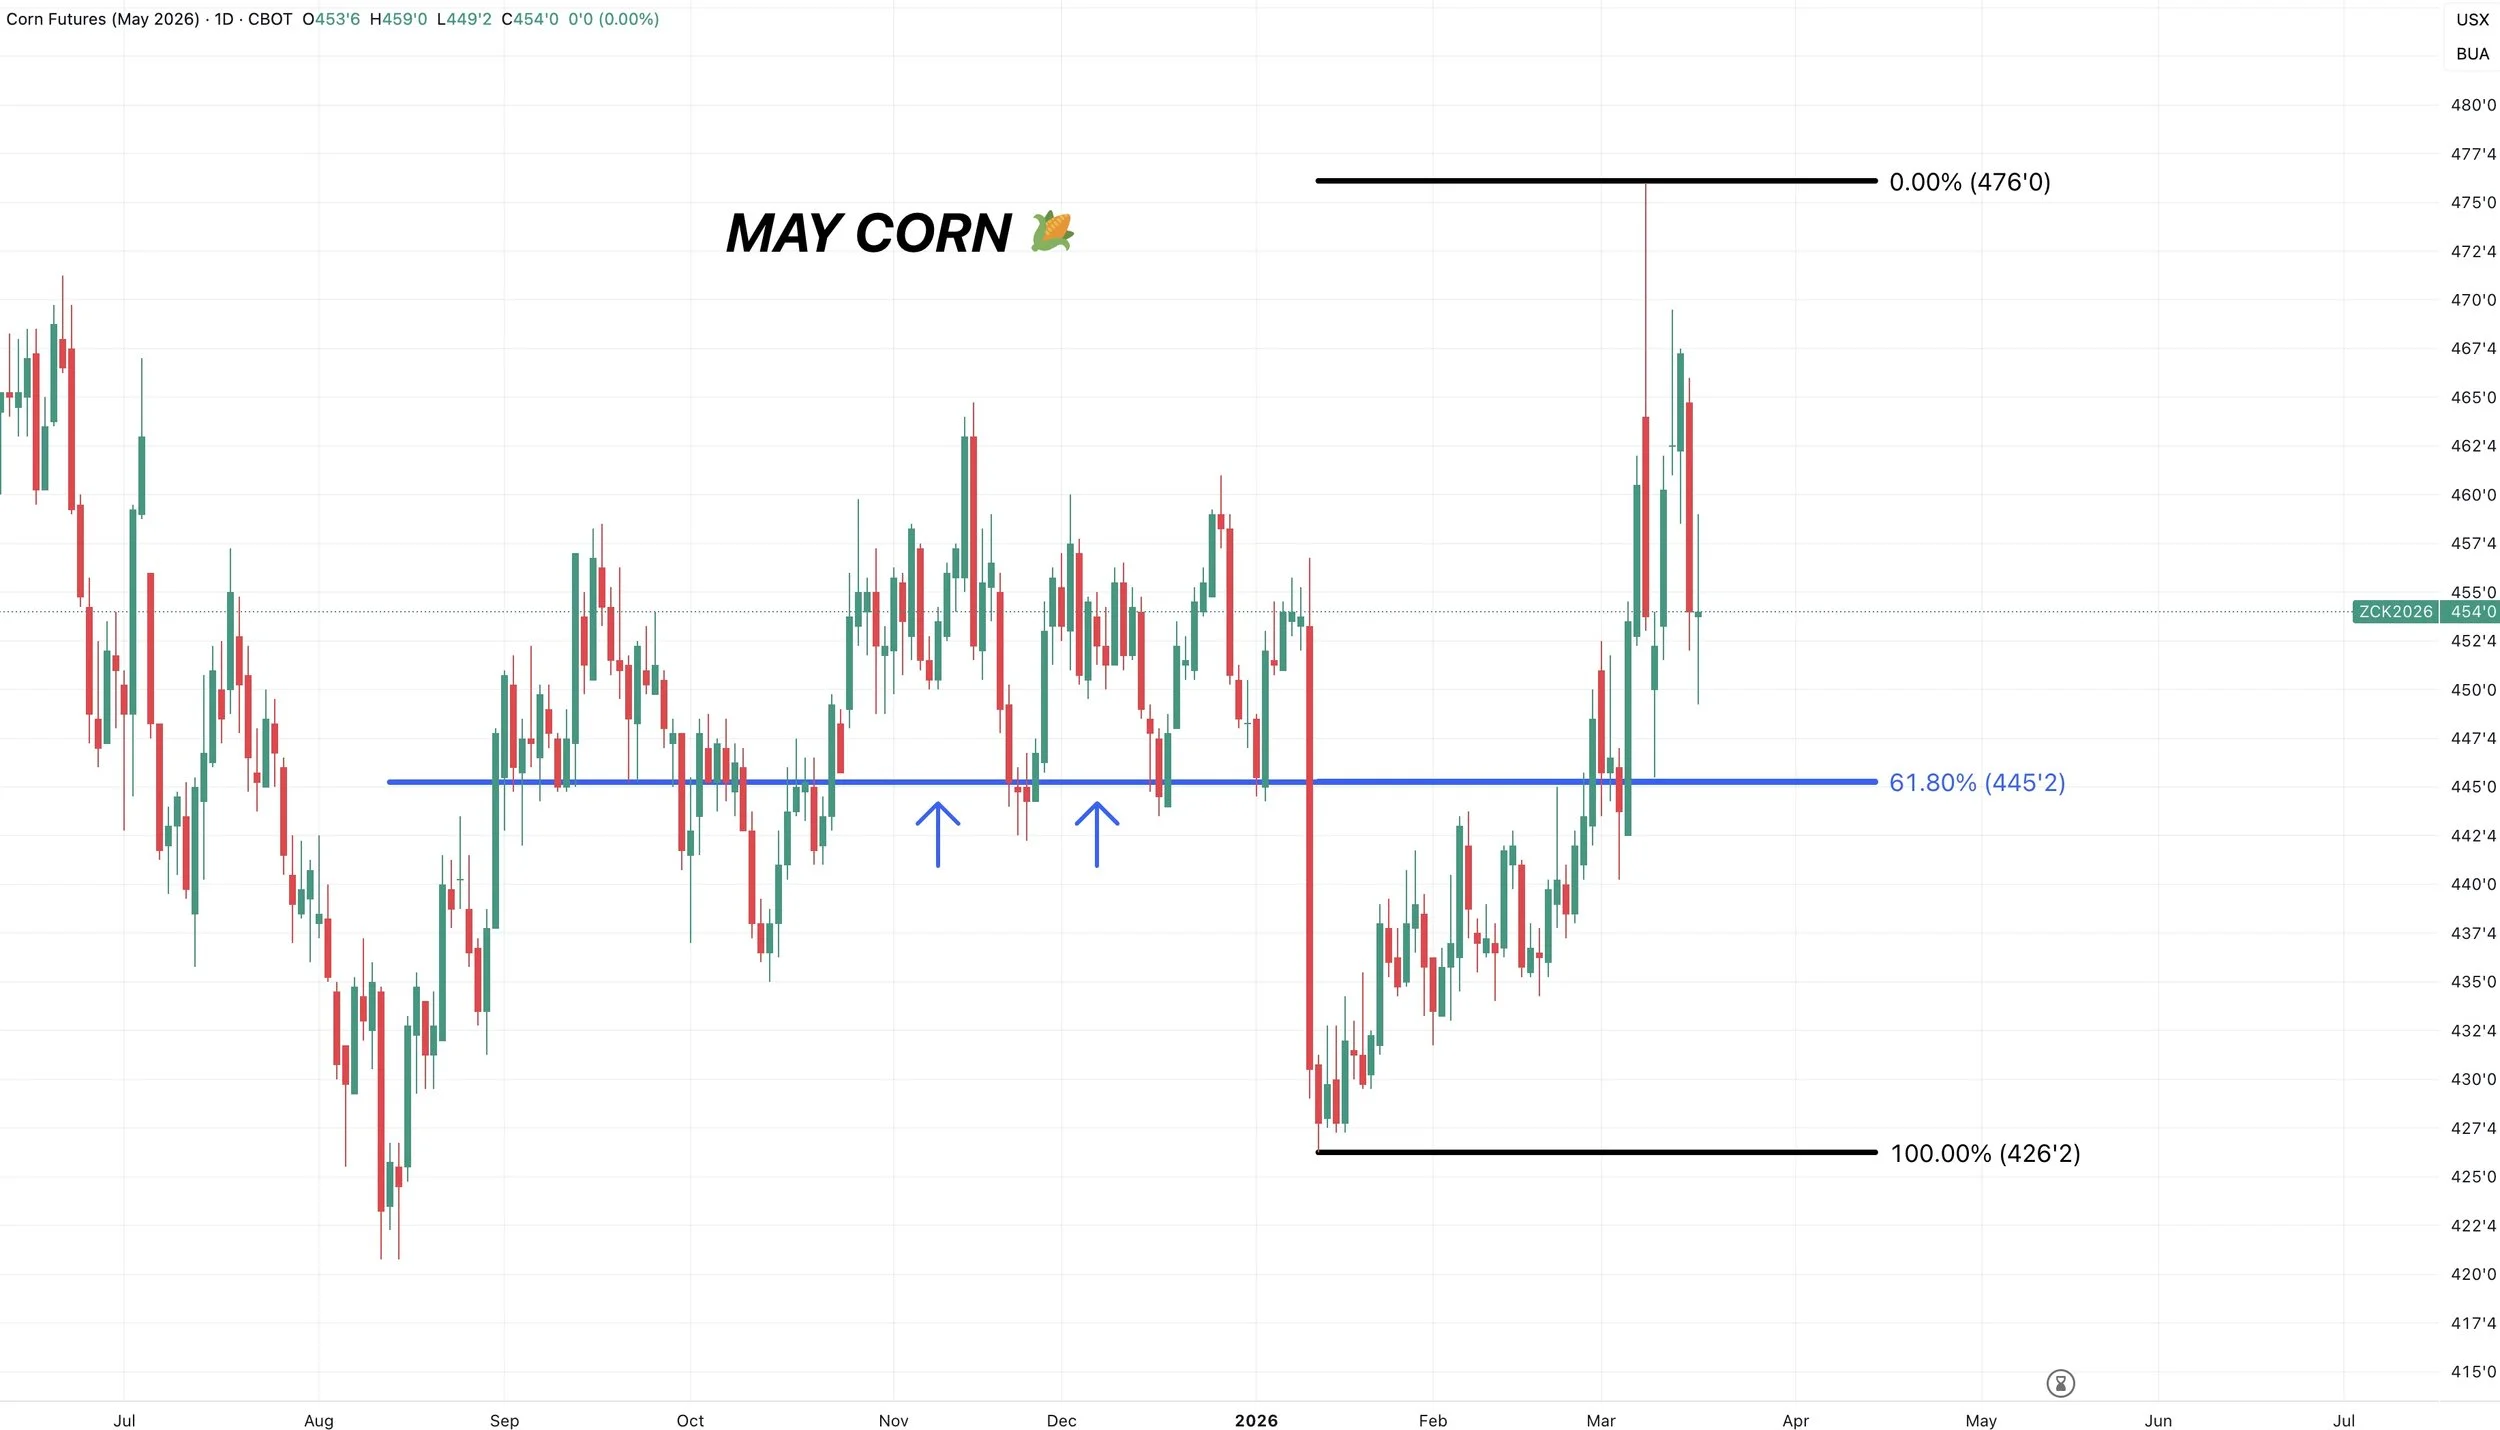
May Corn Chart:
The level in the sand is $4.45
That is the level we need to hold to keep the bias remaining higher.
That gives back 61.8% of the entire rally.
It's also that old key support from fall.
If we break below, it'd be a bad sign. But until then, the trend is higher for now.
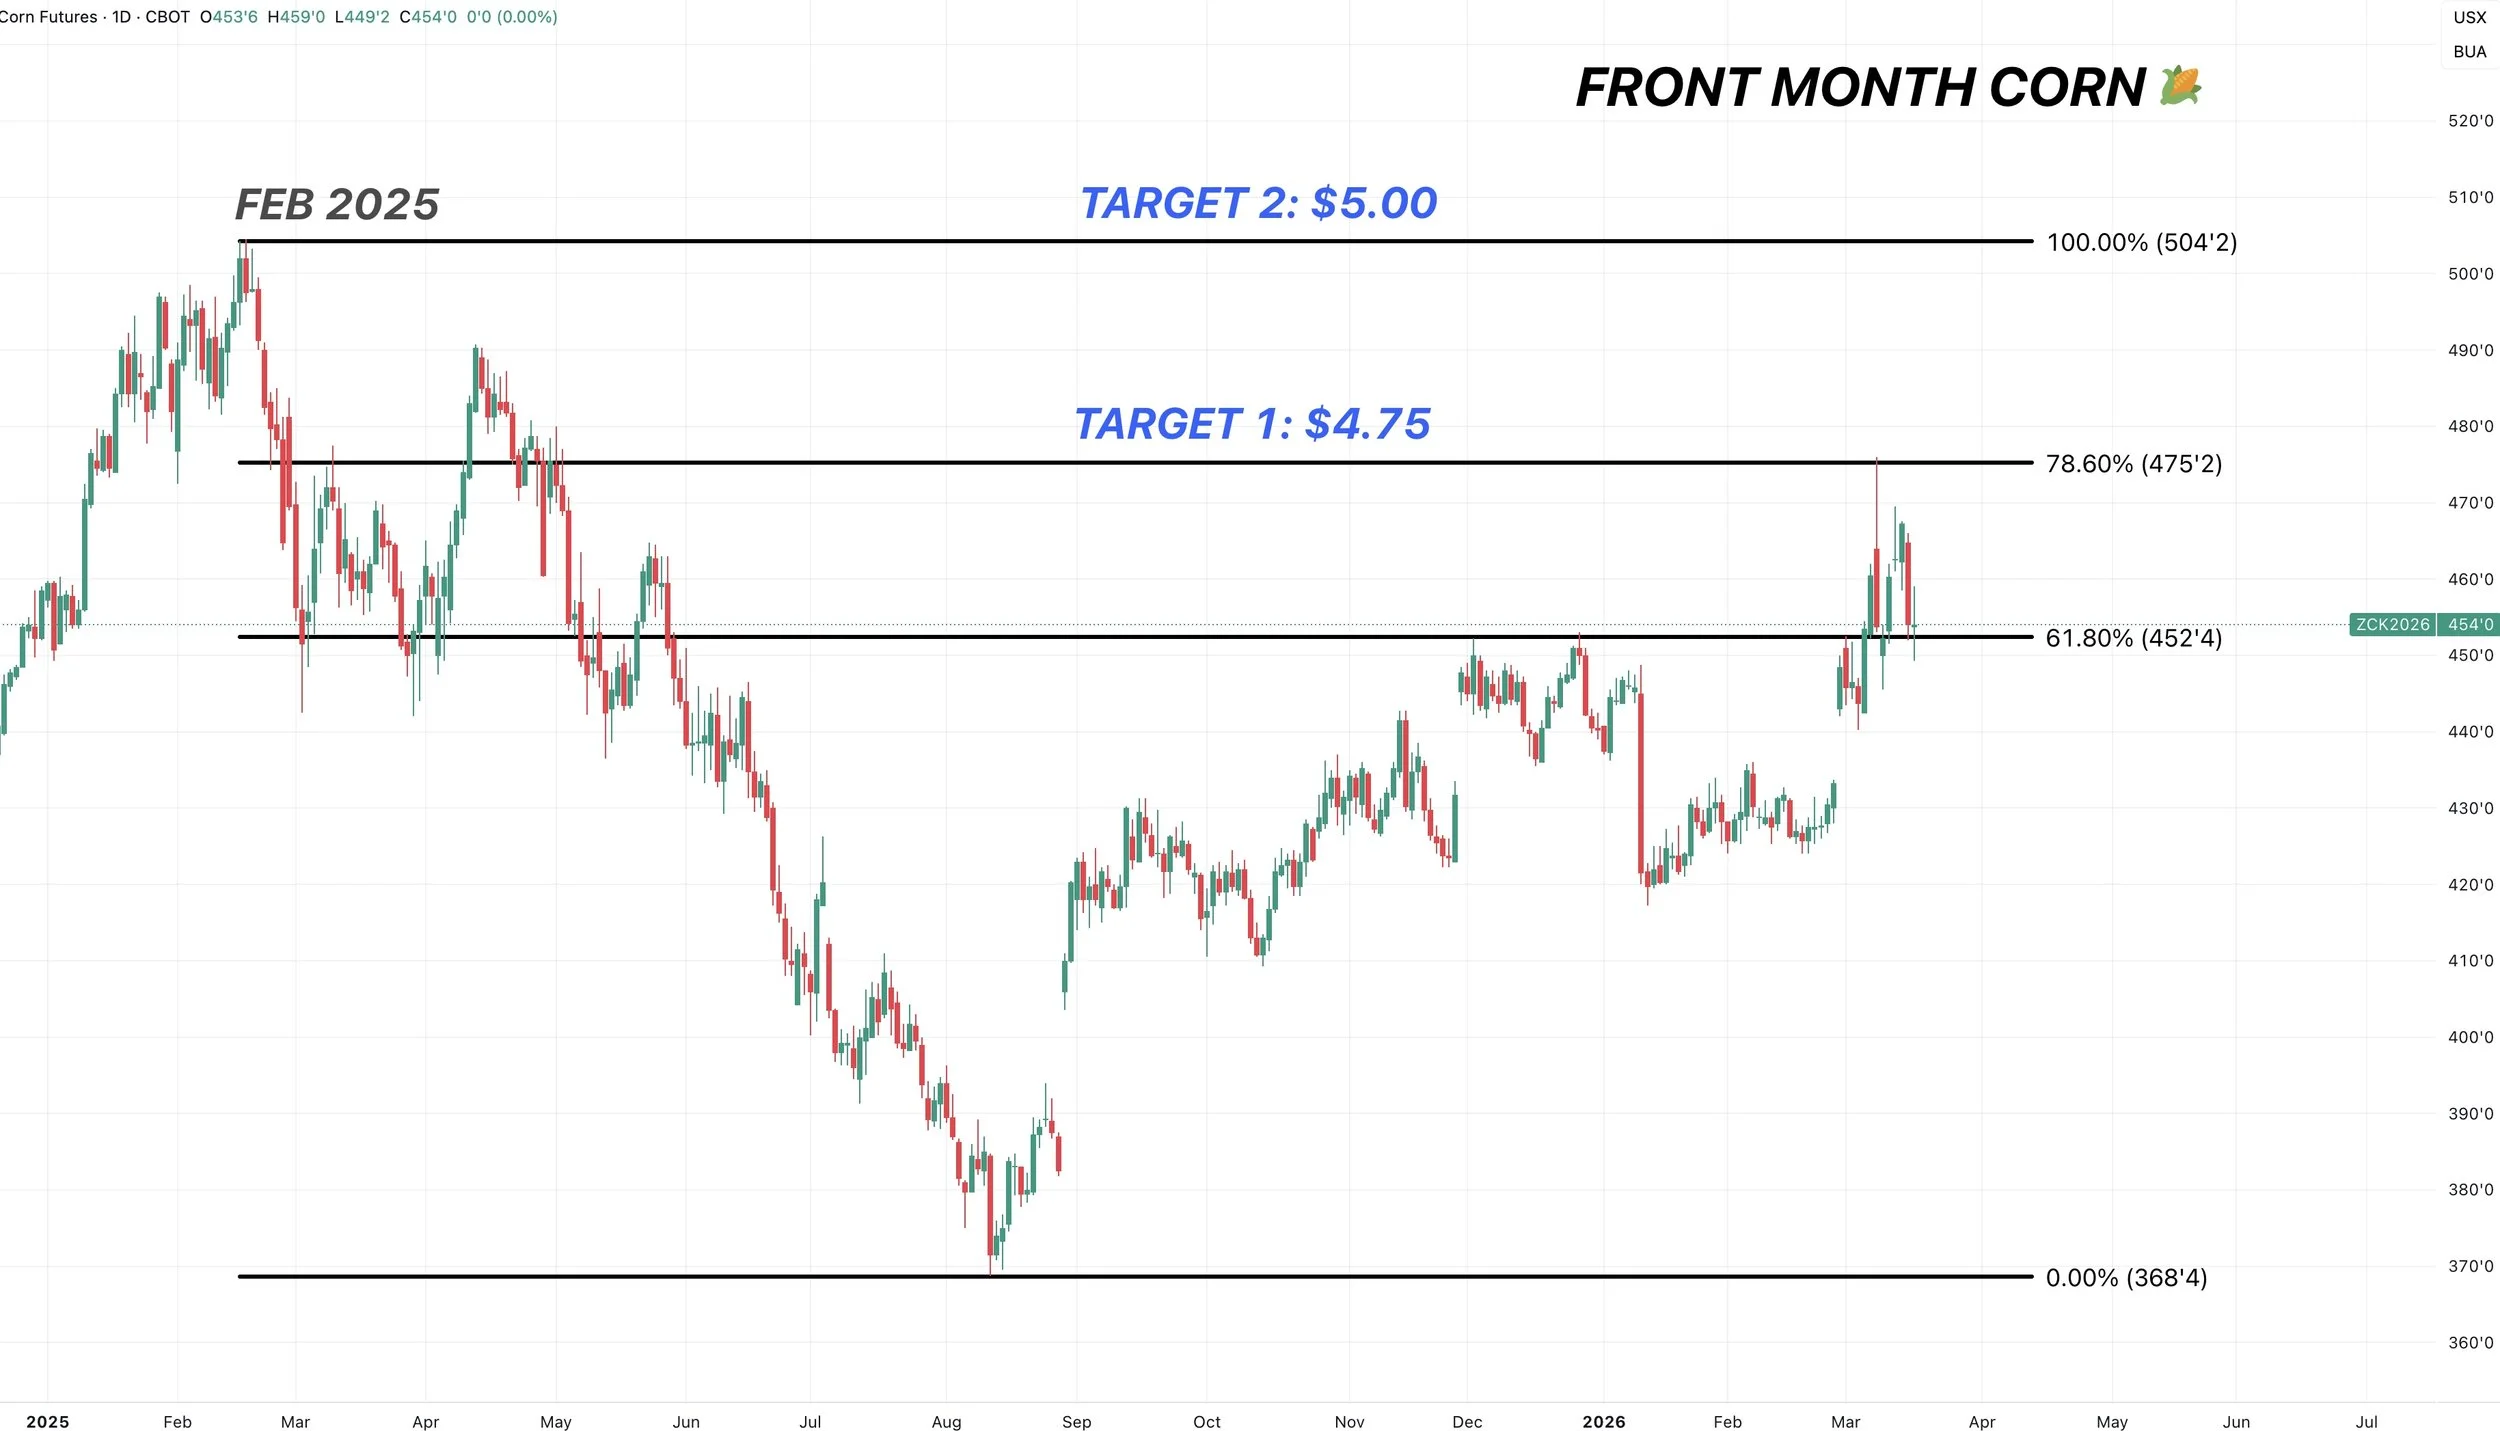
Front Month Corn Chart:
We already took some chips off the table with our sell signal and hedge alert on March 6th.
Next target is still going to be $4.75 and those highs from last Sunday.
Which is 78.6% of the Feb 2025 highs.
The target after that is $5.00 and those highs from last year.
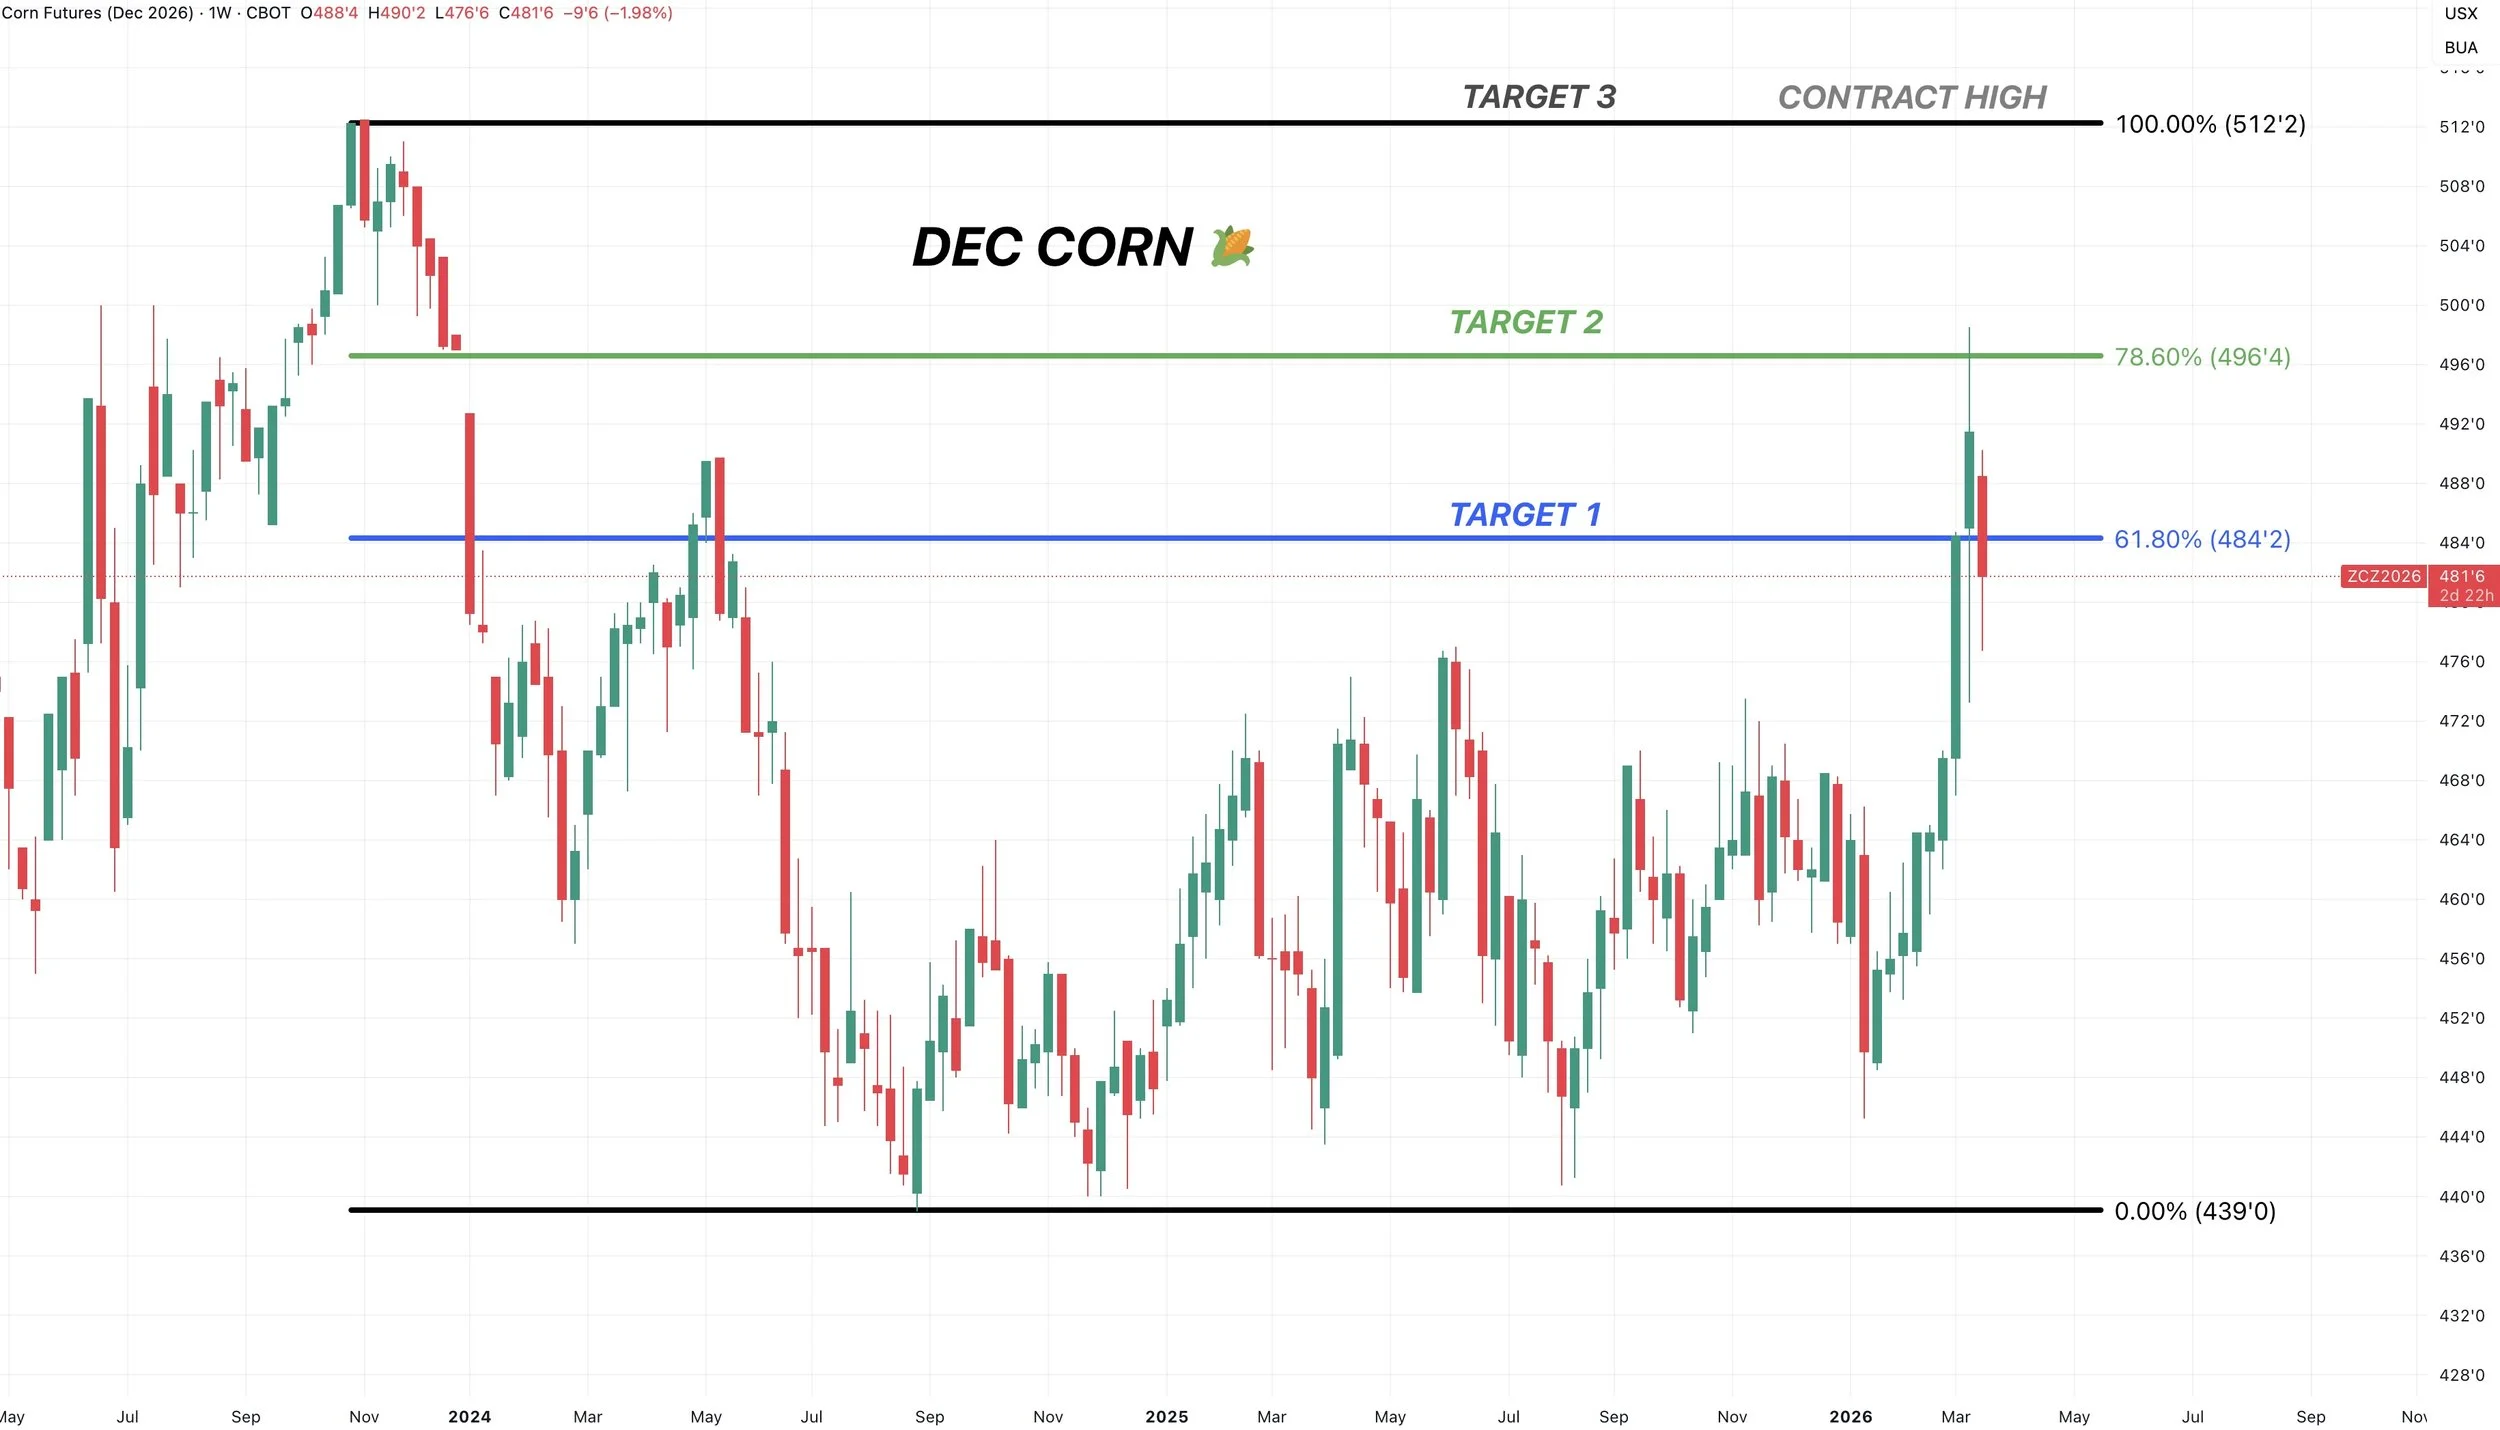
Dec Corn Weekly Chart:
The 1st and 2nd targets hit already hit ($4.84 and $4.96).
The 3rd target is the contract highs at $5.12
I like incrementally taking some small amounts of risk off the table at each target.
Soybeans
We already talked about the whole China meeting news.
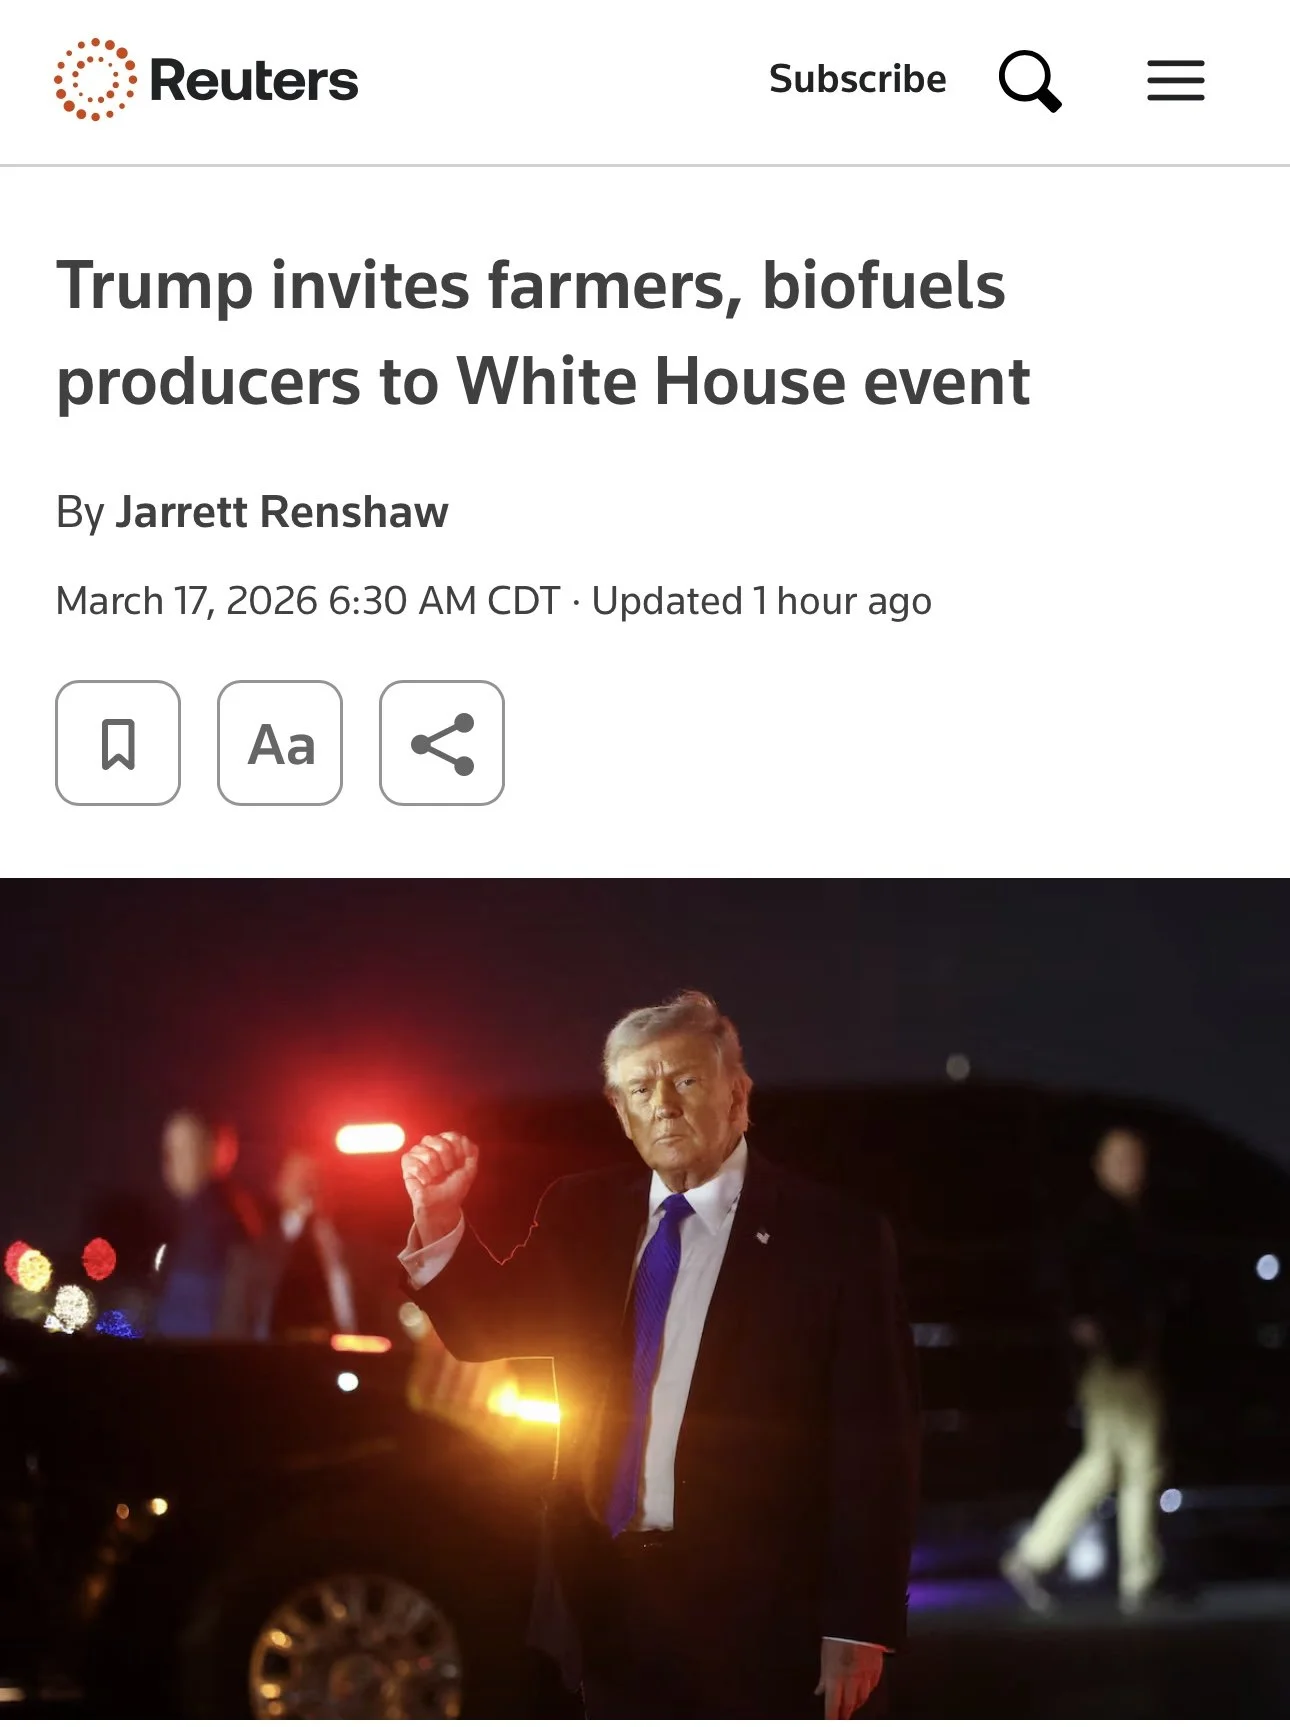
The other piece of news today was that Trump invited farmers to an ag event at the White House next week, on March 27th
CBS reported that it is unclear whether this meeting will coincide with the final rule for the blending quotas or not.
Which are supposed to be released before the end of the month.
Those RVO numbers could be released at any time, but the timing of this meeting does line up with the expected announcement.
Where the numbers come in at will be a pretty big factor.
If the numbers are better than the trade was expecting, it is going to add some strength.
If the numbers come in at the expectations or lower than expected, it could be a possible buy the rumor sell the fact.
Remember, we rallied last week on rumors of a reported leak on the numbers.
Trumps words rallied this market.
Trumps words crashed this market.
It sucks but it's a headline driven market. Filled with unpredictable events.
We built a lot of premium into this market over the thought that China would be buying another 300 million bushels of soybeans.
If we don’t sell any more beans to China for this marketing year, the USDA's export forecast is probably too high and the balance sheet could get bigger.
That is the clear risk.
New Crop Strength vs Old Crop Weakness
Yesterday old crop was down 70 cents. New crop was down 40 cents.
Today old crop was up 2 cents. New crop was up over 10 cents.
The old crop to new crop spread went from 65 cents to now just 25 cents.
Why?
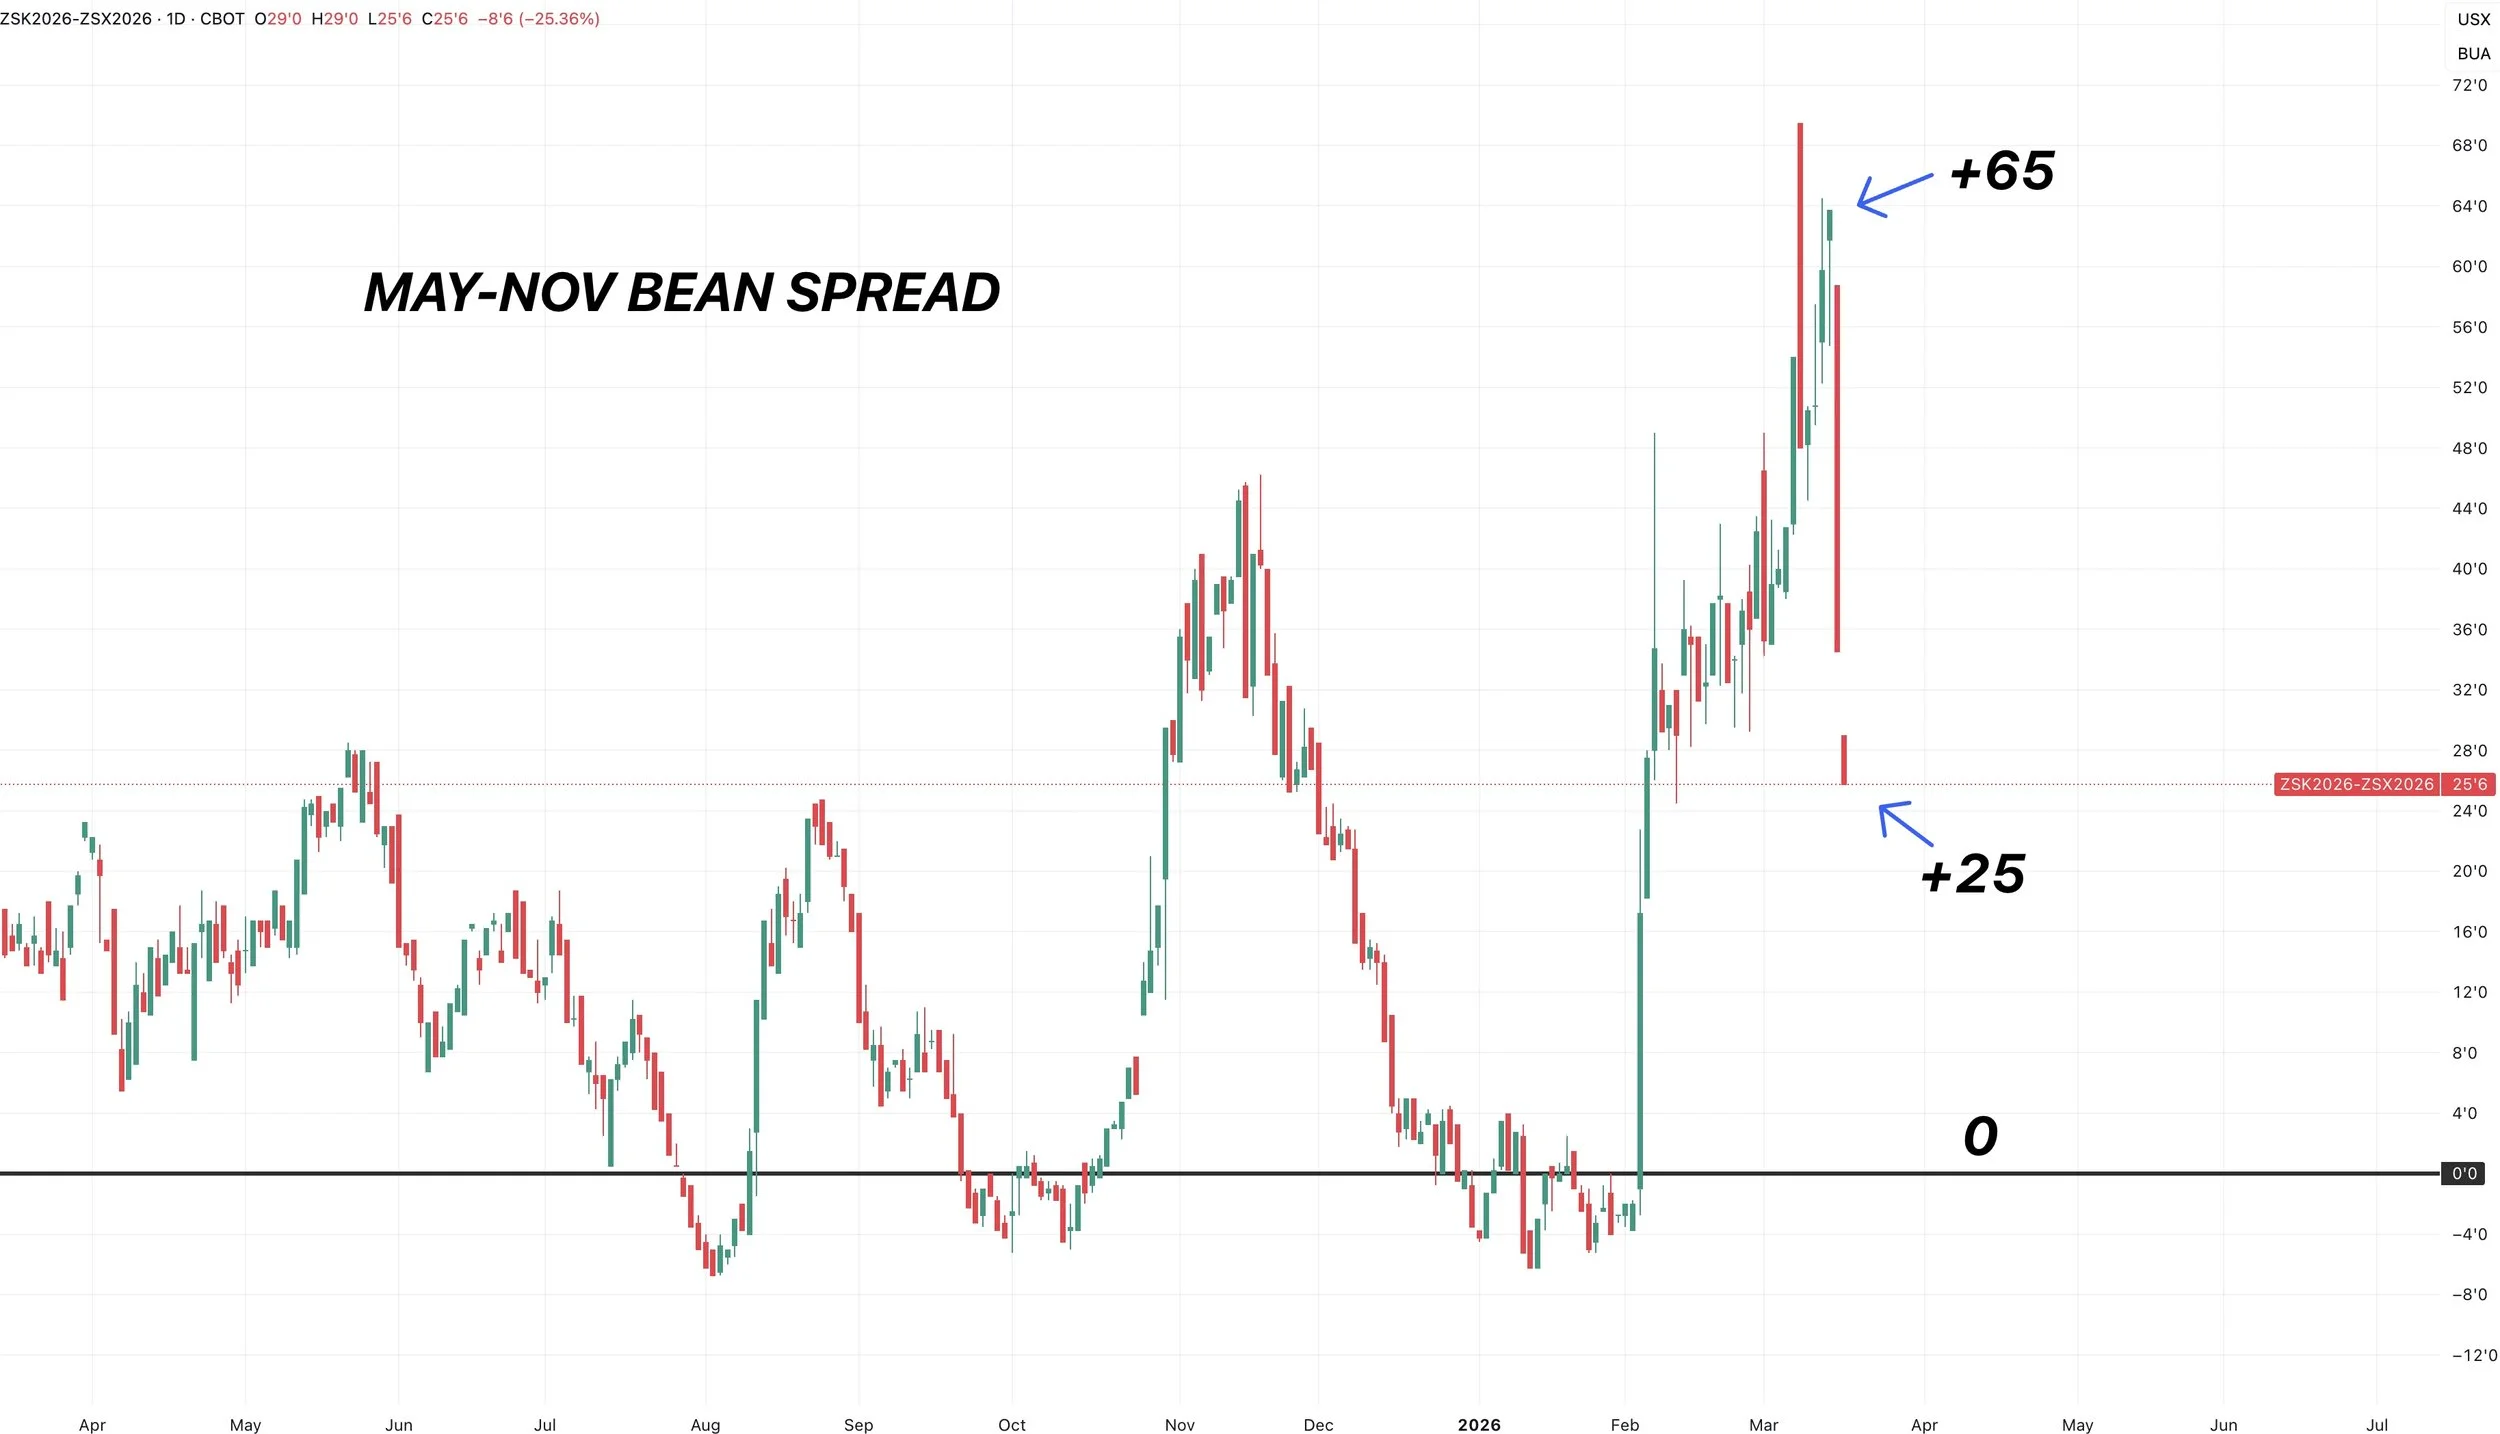
The funds were heavily long old crop.
When they puke out of their positions, some of them roll that position into new crop. Which keeps old crop down, but supports new crop.
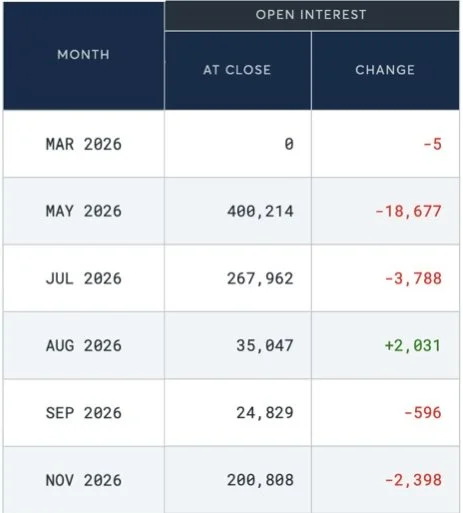
We know positions were rolled rather than completely being exited based on open interest.
Open interest dropped in old crop, but stayed steady in new crop.
Yesterday's OI Changes:
May Beans: -18.7k
Nov Beans: -2.4k
If money was entirely leaving soybeans, we would’ve seen more open interest dropping everywhere.
They puked out of the old crop, but still see a potential story in new crop. Perhaps driven by the RVO story.
On a day like today, where new crop rallies but old crop does not. It can sometimes be a sign that the puke selling is exhausted and close to an end.
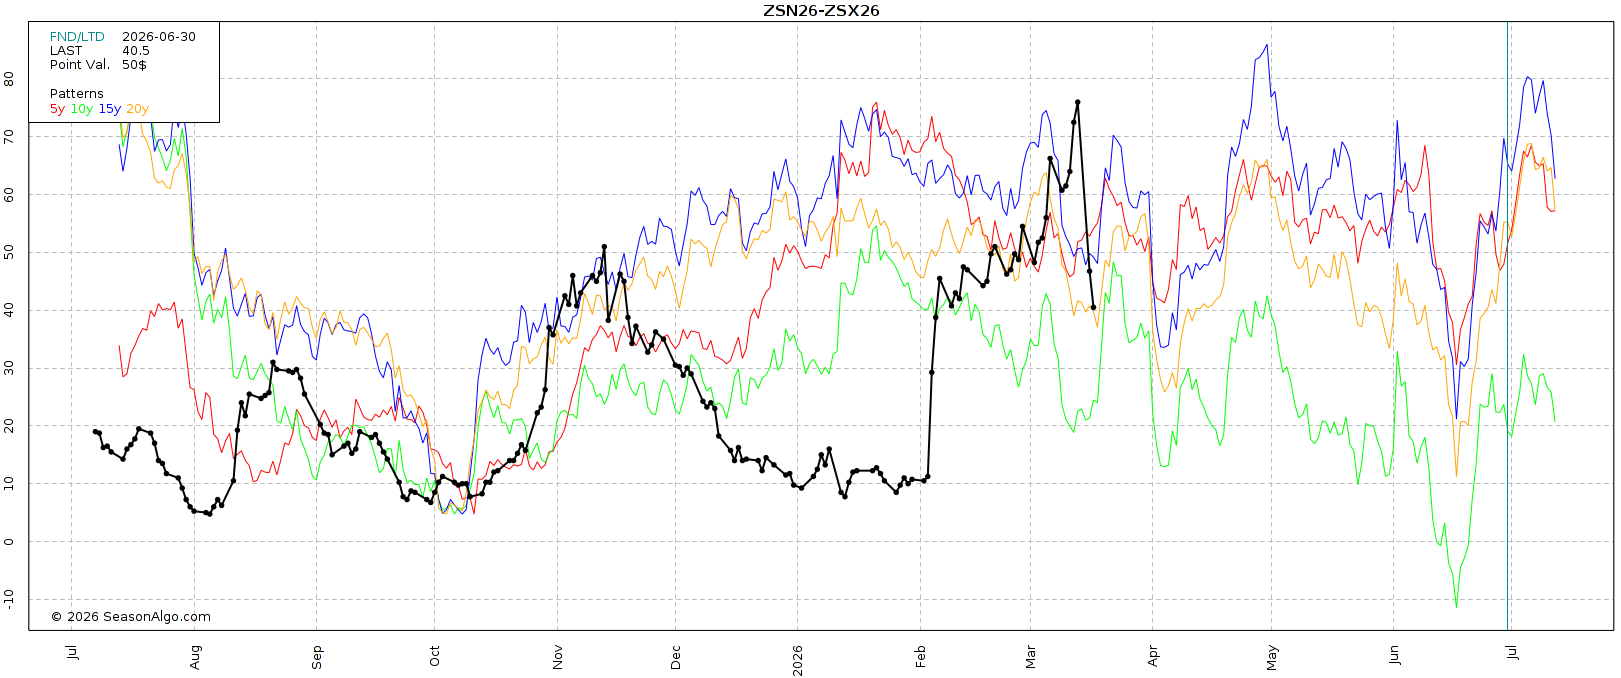
Spread Seasonal:
This is about the time of year when the July to Nov spread starts to fall.
It then usually finds a bottom in early April.
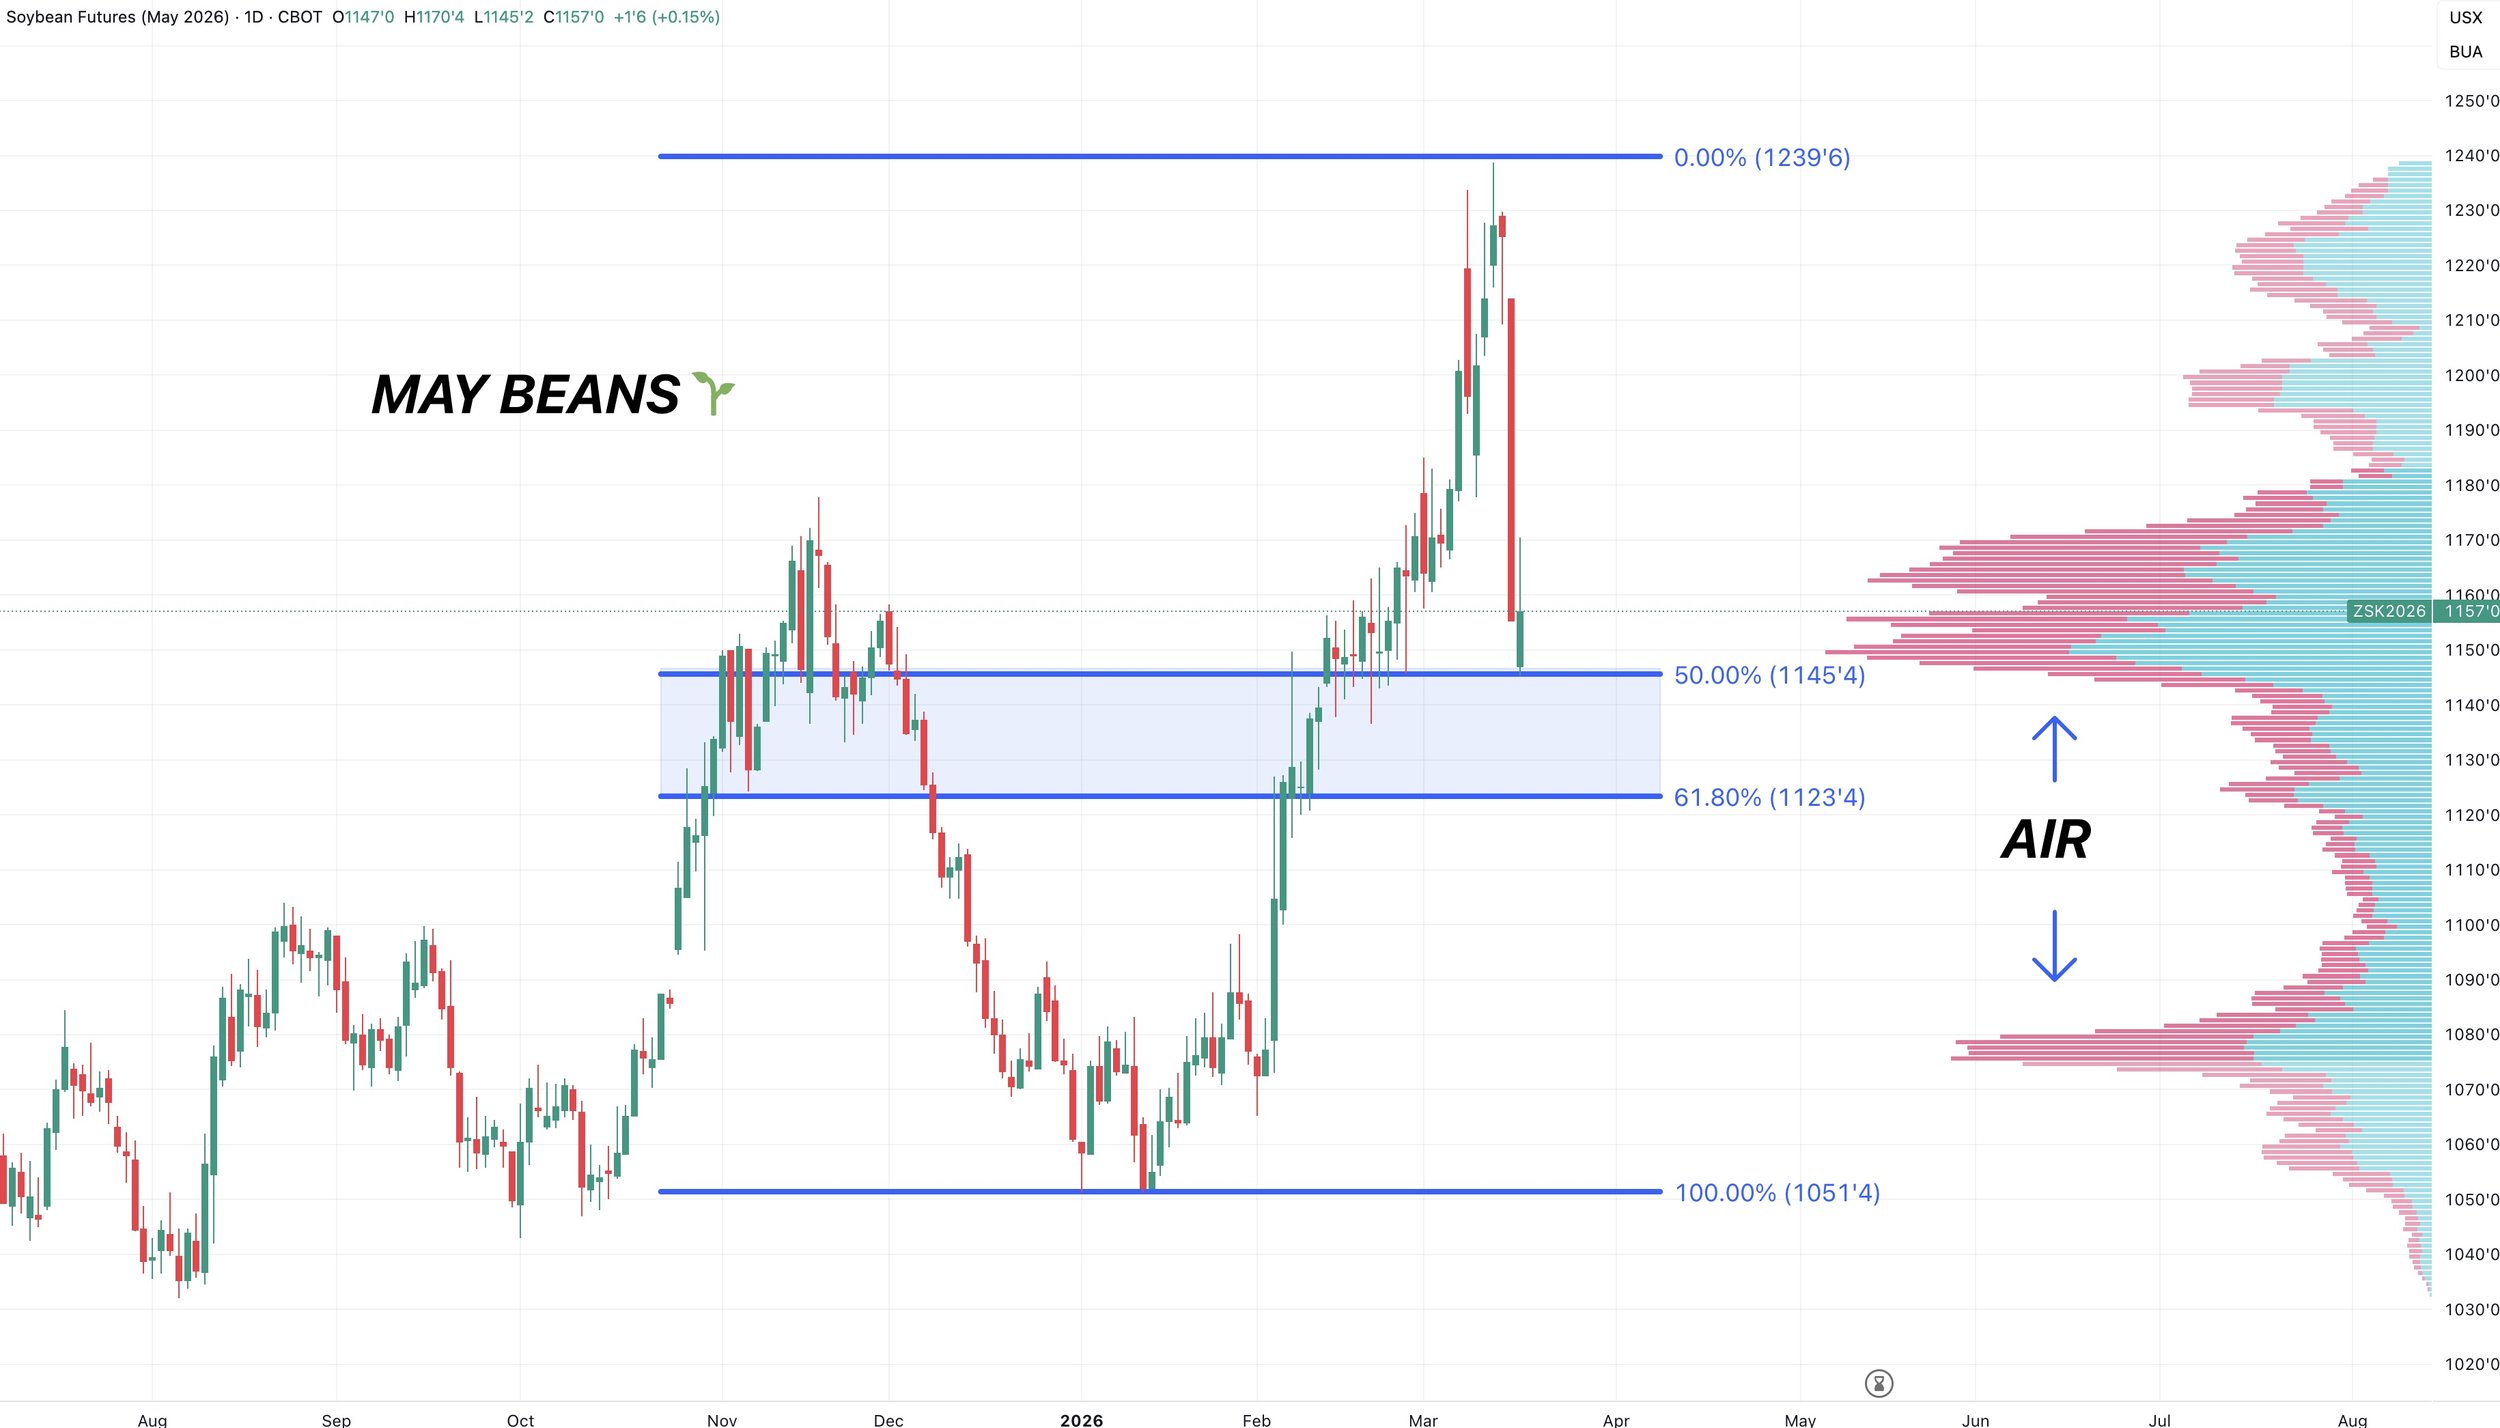
May Beans Chart:
We talked about protecting this rally last week in some sort of manner, along with that signal and hedge alert we texted out last Monday.
But I don’t think anyone was expecting that type of flush that fast, and I of course wish we had taken more chips off the table on Friday.
I'm sure we will get at the very least a dead cat bounce. The question is, how low do we go before we get that bounce?
We are at a pretty important spot here.
Last night's lows clawed back exactly 50% of the entire rally.
I attached the volume profile on the right side of the chart.
Areas of high volume act as support and resistance, and often magnets.
Areas of low volume can often lead to prices cutting through them easily.
If you notice, we are right at an area of high volume.
Below here, there is almost no volume.
This is because eveytime we traded below this level, we either fell right through it or rallied right through it. Creating no resistance or support.
So this is a crucial spot we want to hold.
If we break below $11.45 we likely go test the 61.8% retracement of the entire rallly. Which is at $11.23, another 20 cents lower.
$11.23 would then be essentially the line in the sand to keep the structure friendly.
I personally don’t think we break below that line in the sand and find a bottom here at this blue box. But a break below would be a bad sign.
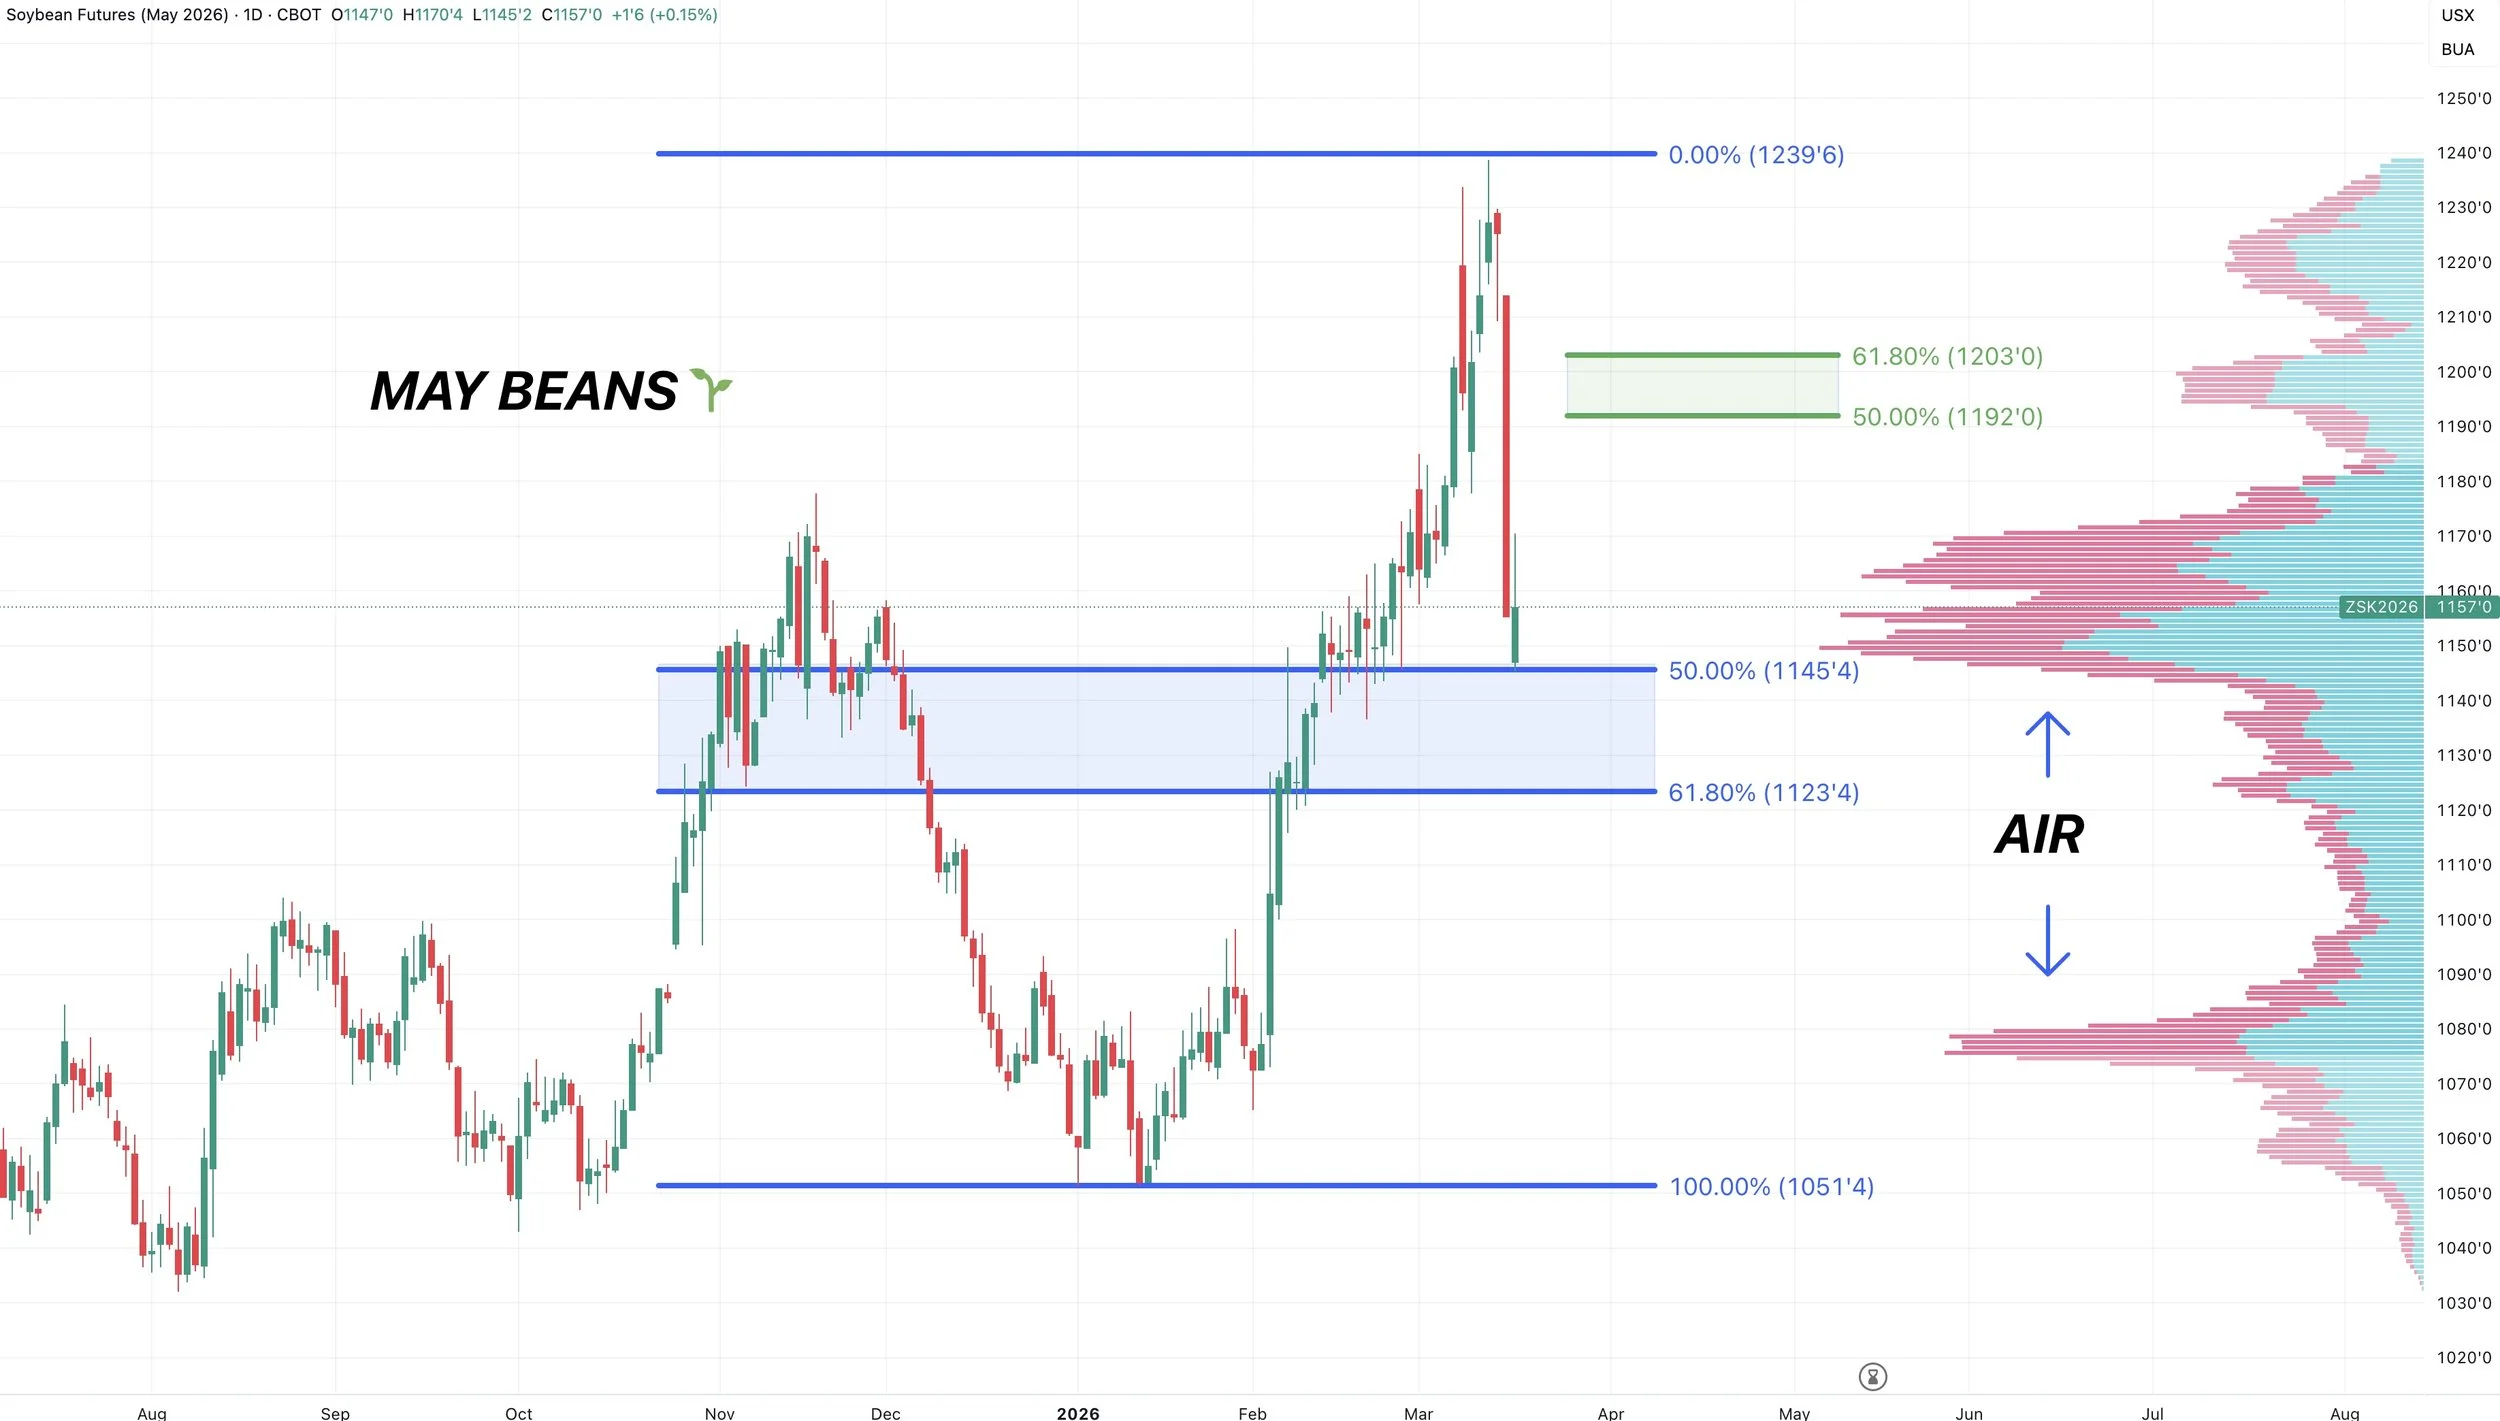
What if this is the bottom?
If this truly was the bottom, and we get a bounce of out here.. we want to look to reward a move towards $11.90 to $12.00
That claws back 50% to 61.8% of the sell off.
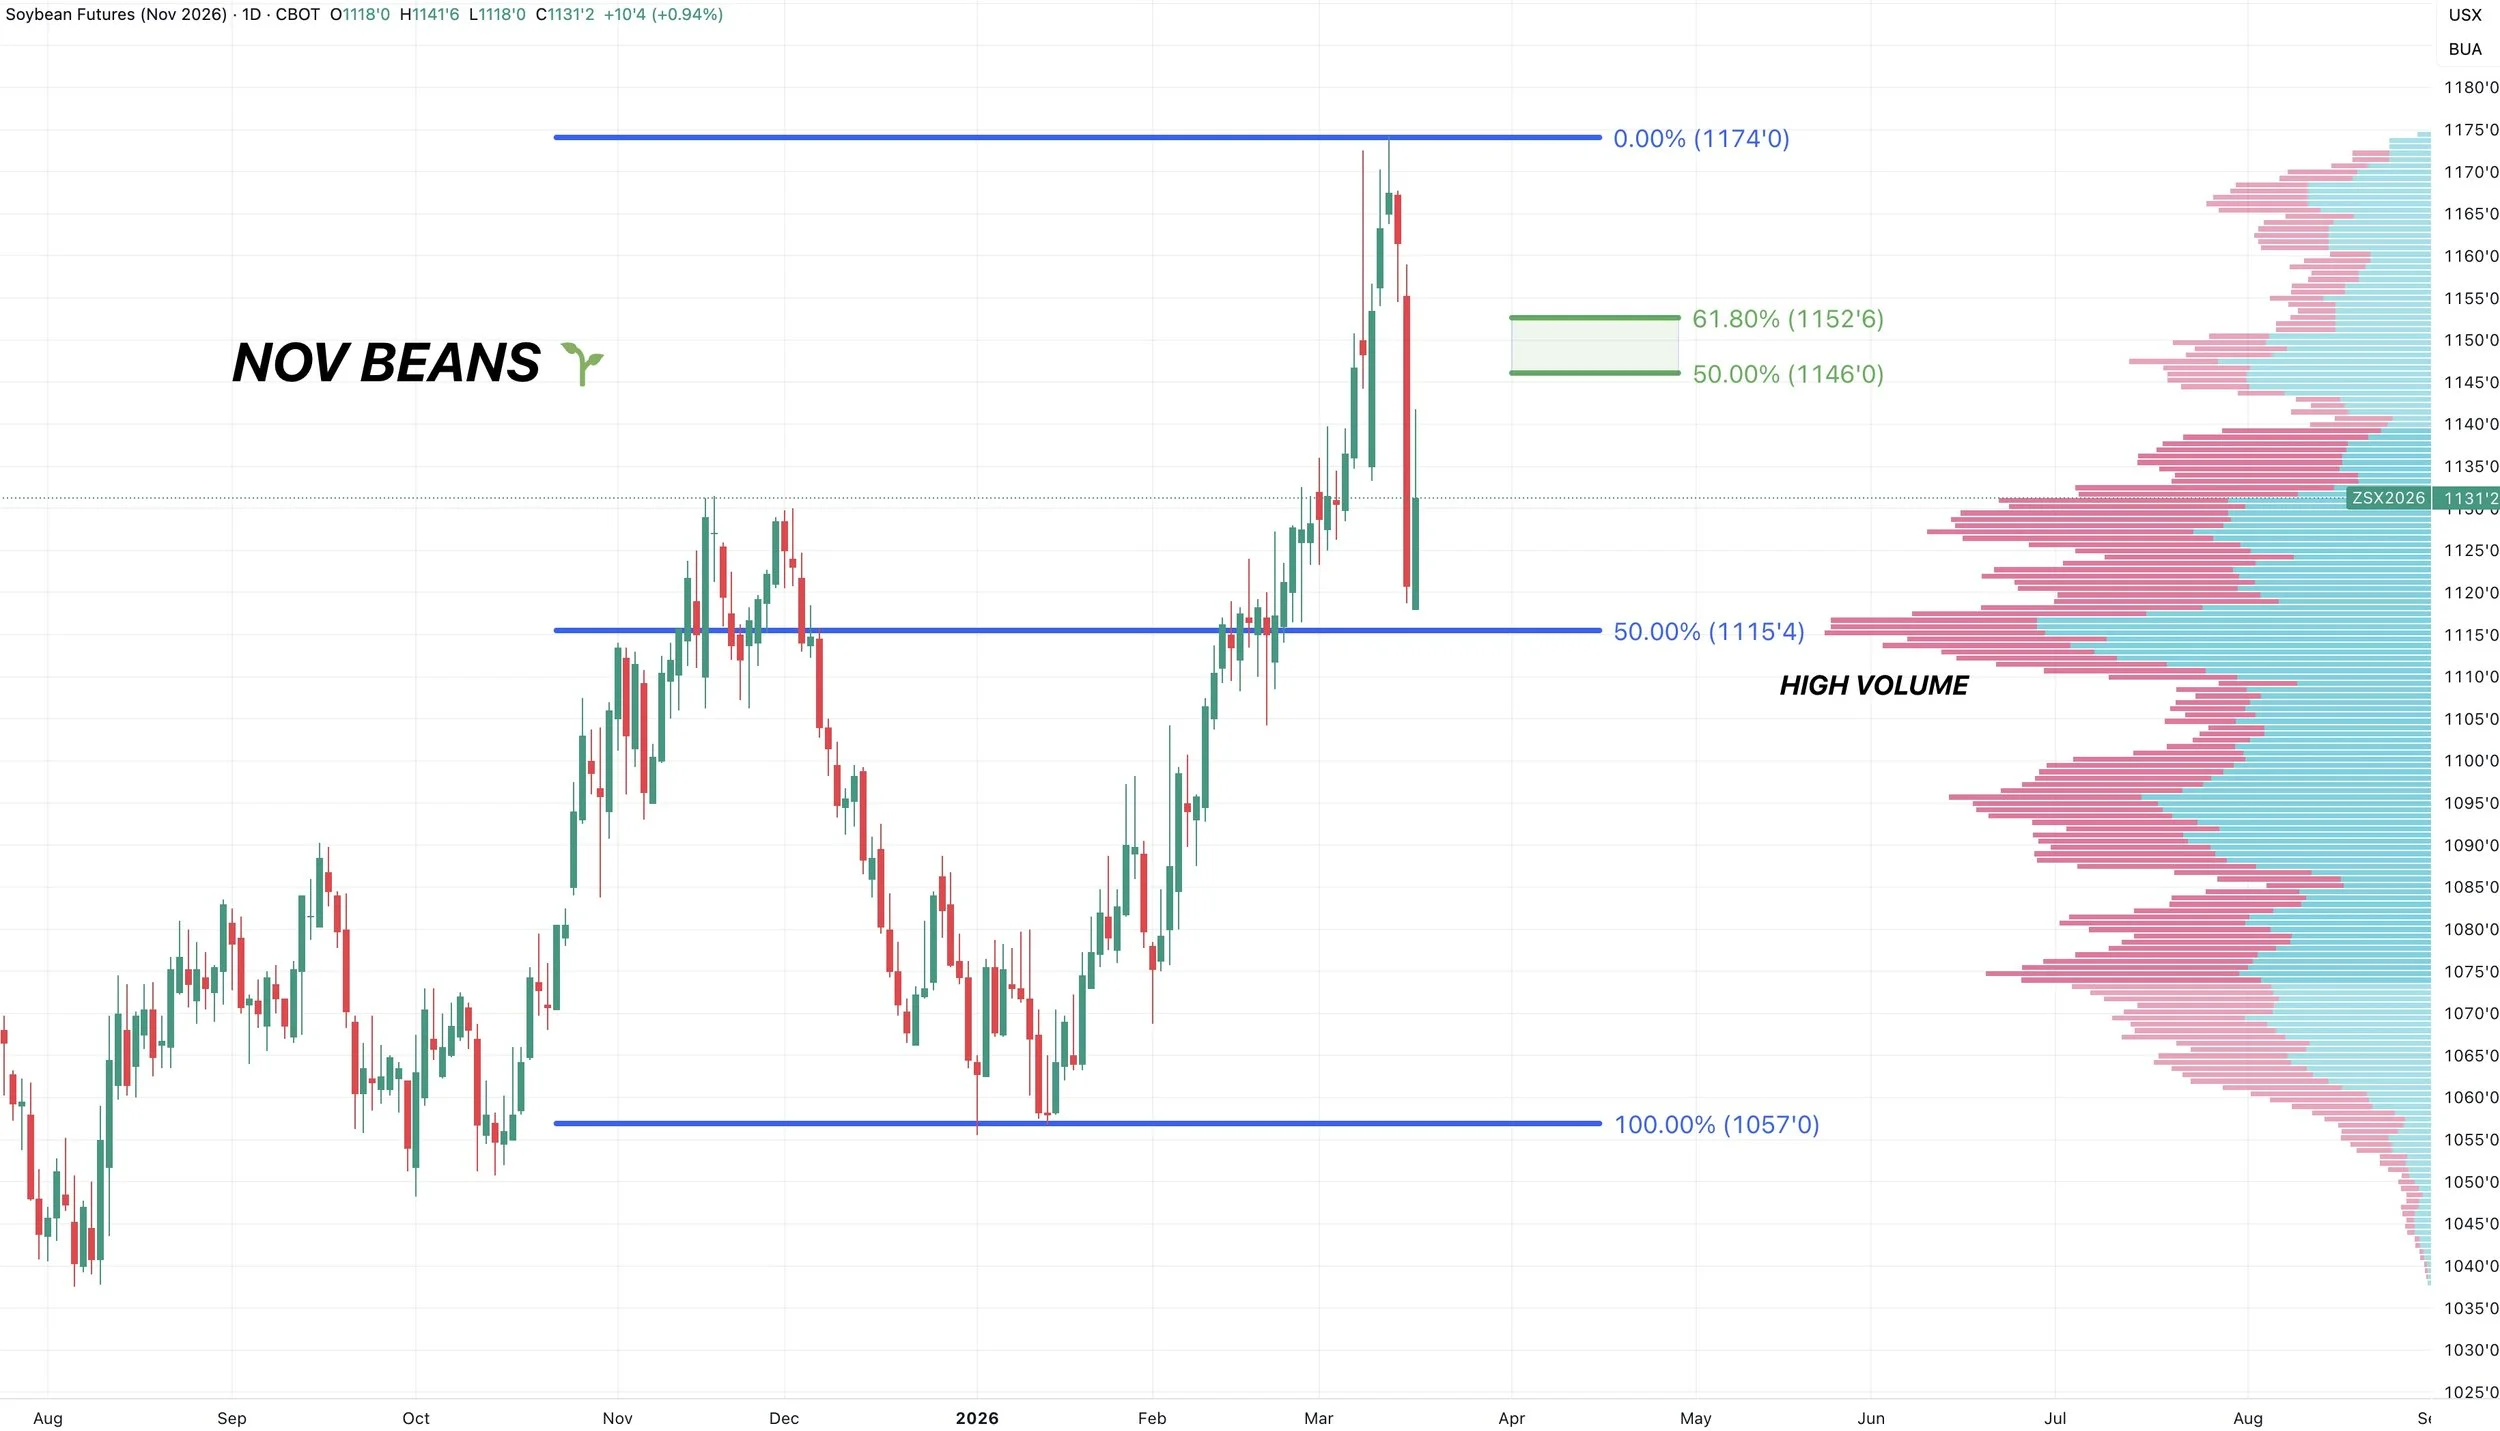
Nov Beans Chart:
On the bright side, even with yesterday's sell-off, Nov beans still just had their 9th highest close in 2 years.
We are still above those highs from November, and are only trading at the same levels we were two weeks ago. Still sitting 75 cents off the Jan lows.
So all things considered, it could be worse in new crop. As many of you don’t have a massive amount of old crop left.
The chart has a similar set up as May.
We gave back almost 50% of the rally before bouncing. This same level is an area of high volume.
So if we are going to bounce, this would be an area where it would make sense. Failure to hold here opens the door lower.
If this is the bottom.. $11.45 to $11.50 claws back 50% to 61.8% of the sell off. That would be an area to reward, as relief bounces can often fail there.
Wheat
I'm not going to spend much time on wheat today.
We had that sell signal two Friday's ago and like defending the rally in some manner if you have not yet done so.
A lot of what happens next in wheat is going to be dictated by the war headlines.
I'm still in the camp that the war rally will "eventually" be faded as most are.
But that doesn’t mean things can’t get worse before they get better in the war.
Long term I still think wheat is undervalued. Short term I see some risks with the geopolitical headlines.
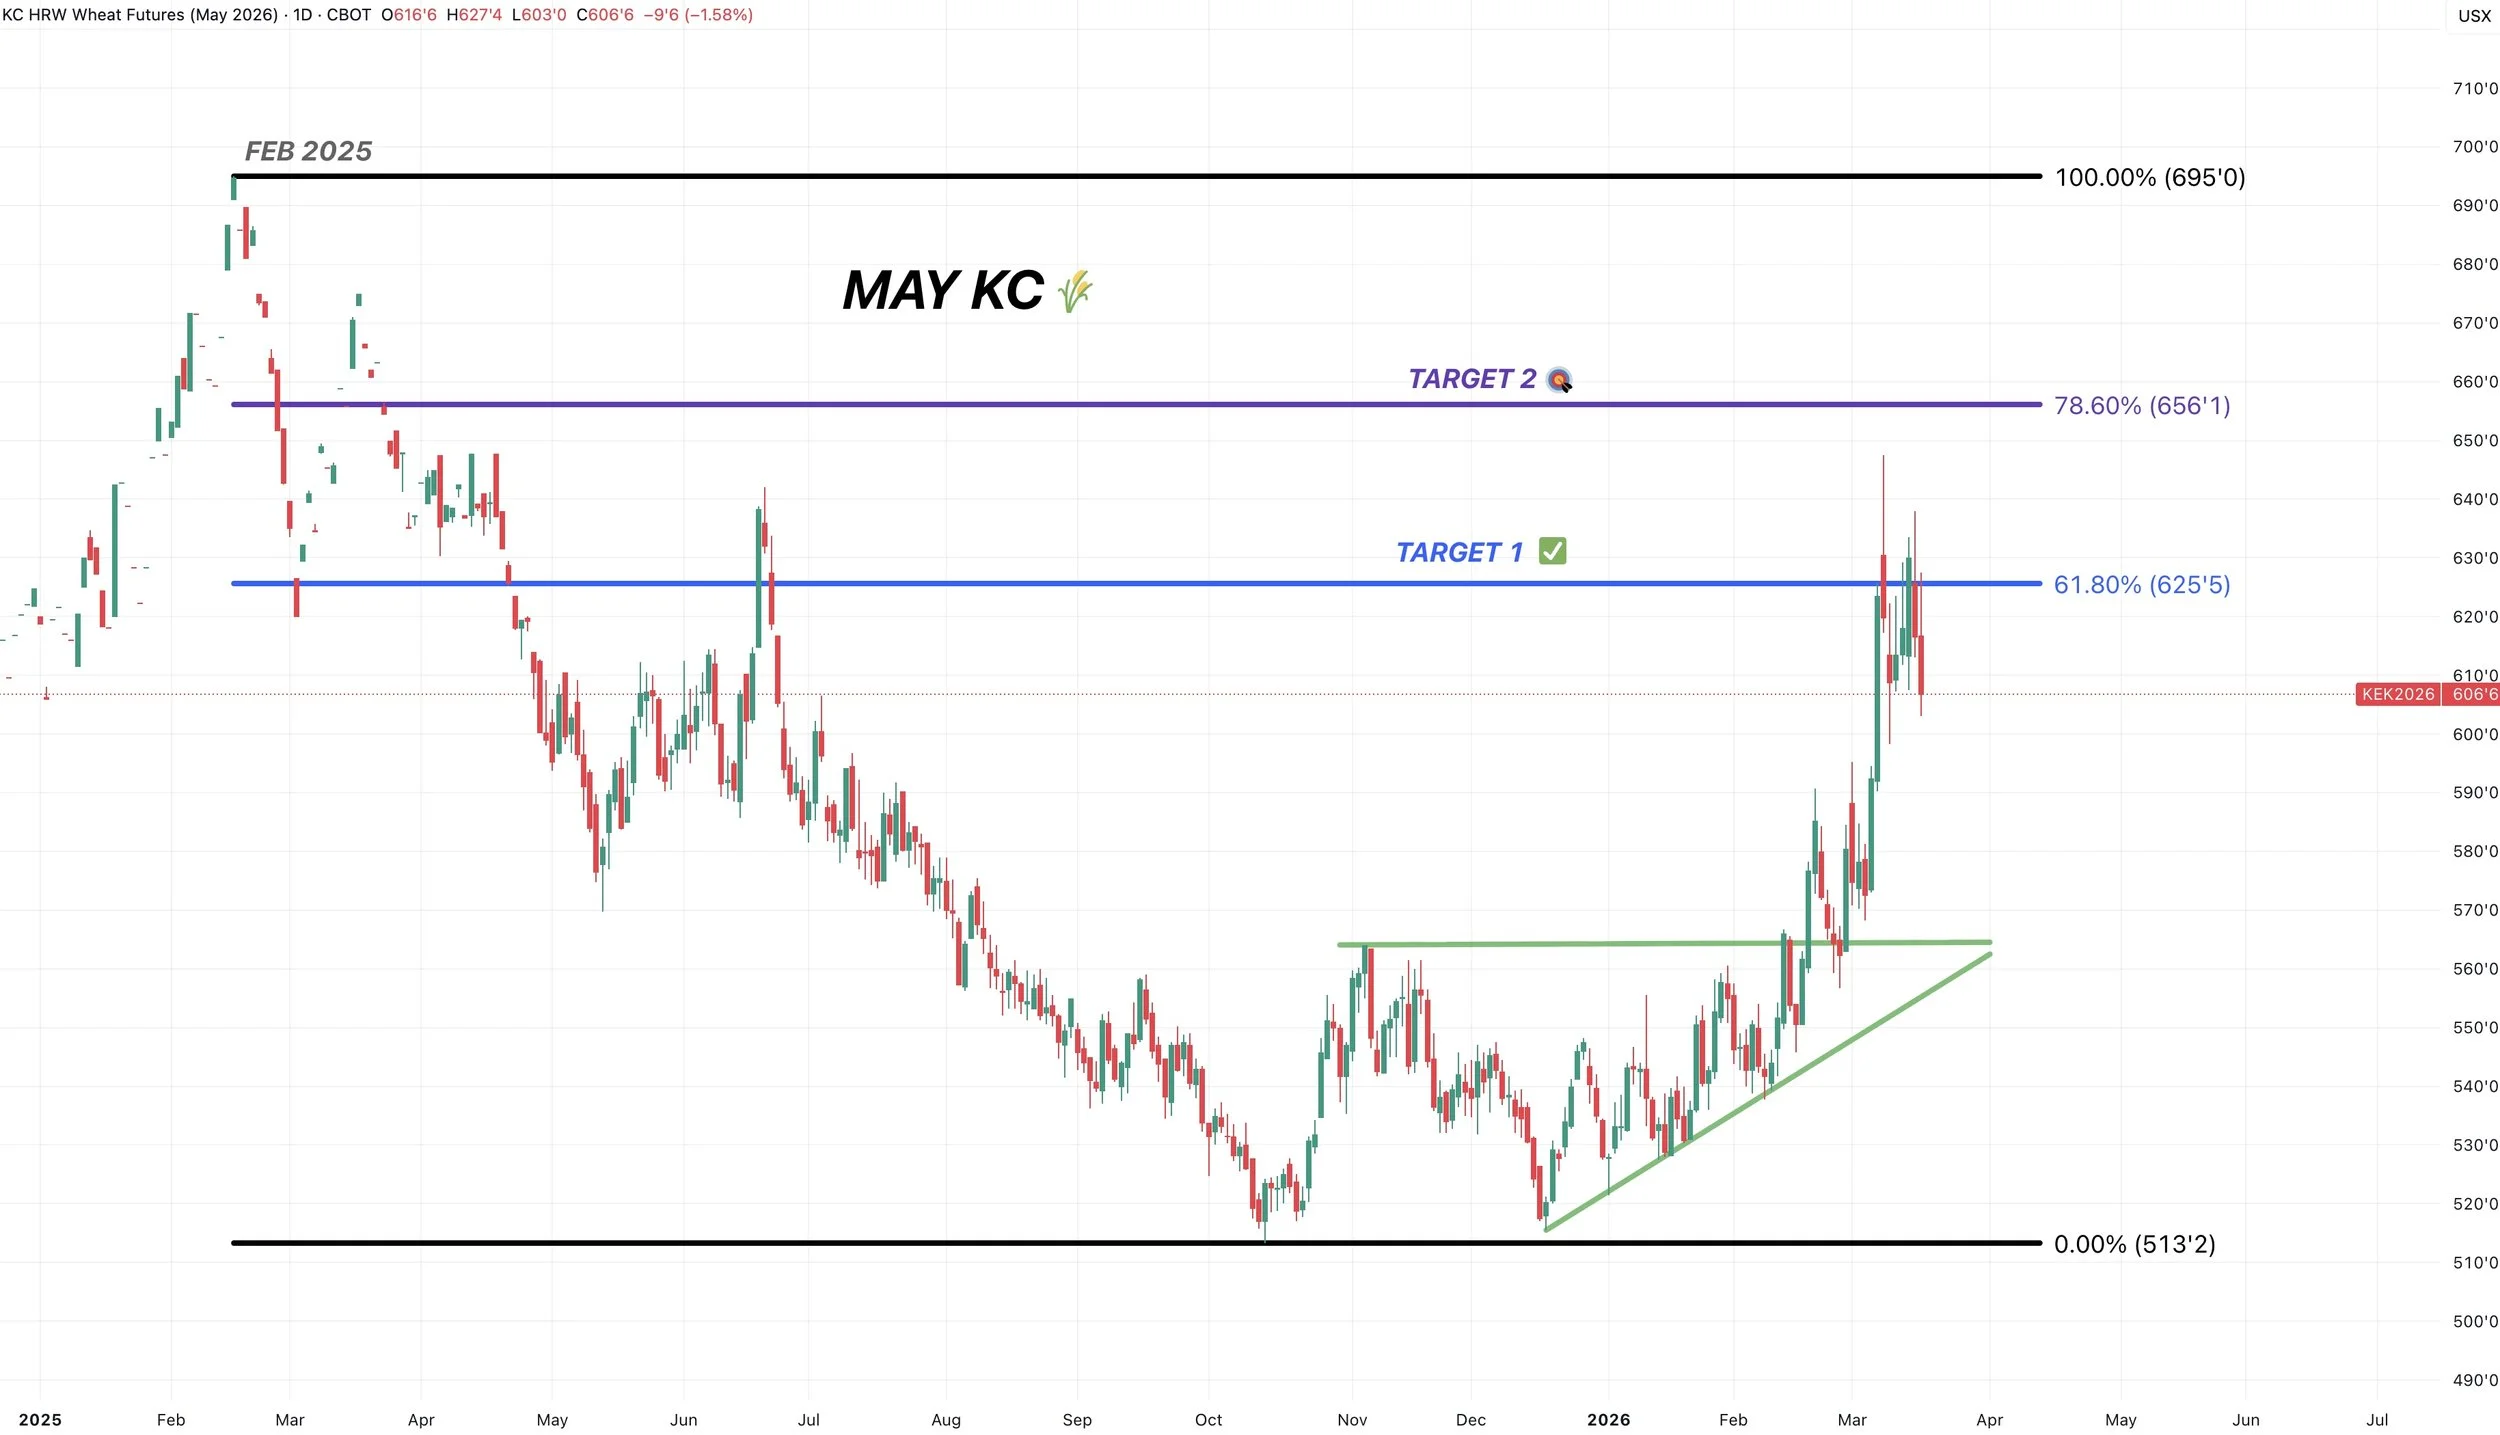
May KC Chart:
The level we want to hold is $6.00
It's an area of high volume. If we fail there, it could open the door down towards that $5.65 to $5.80 range.
That would give back 50% to 61.8% of the entire rally and is the next area of high volume.
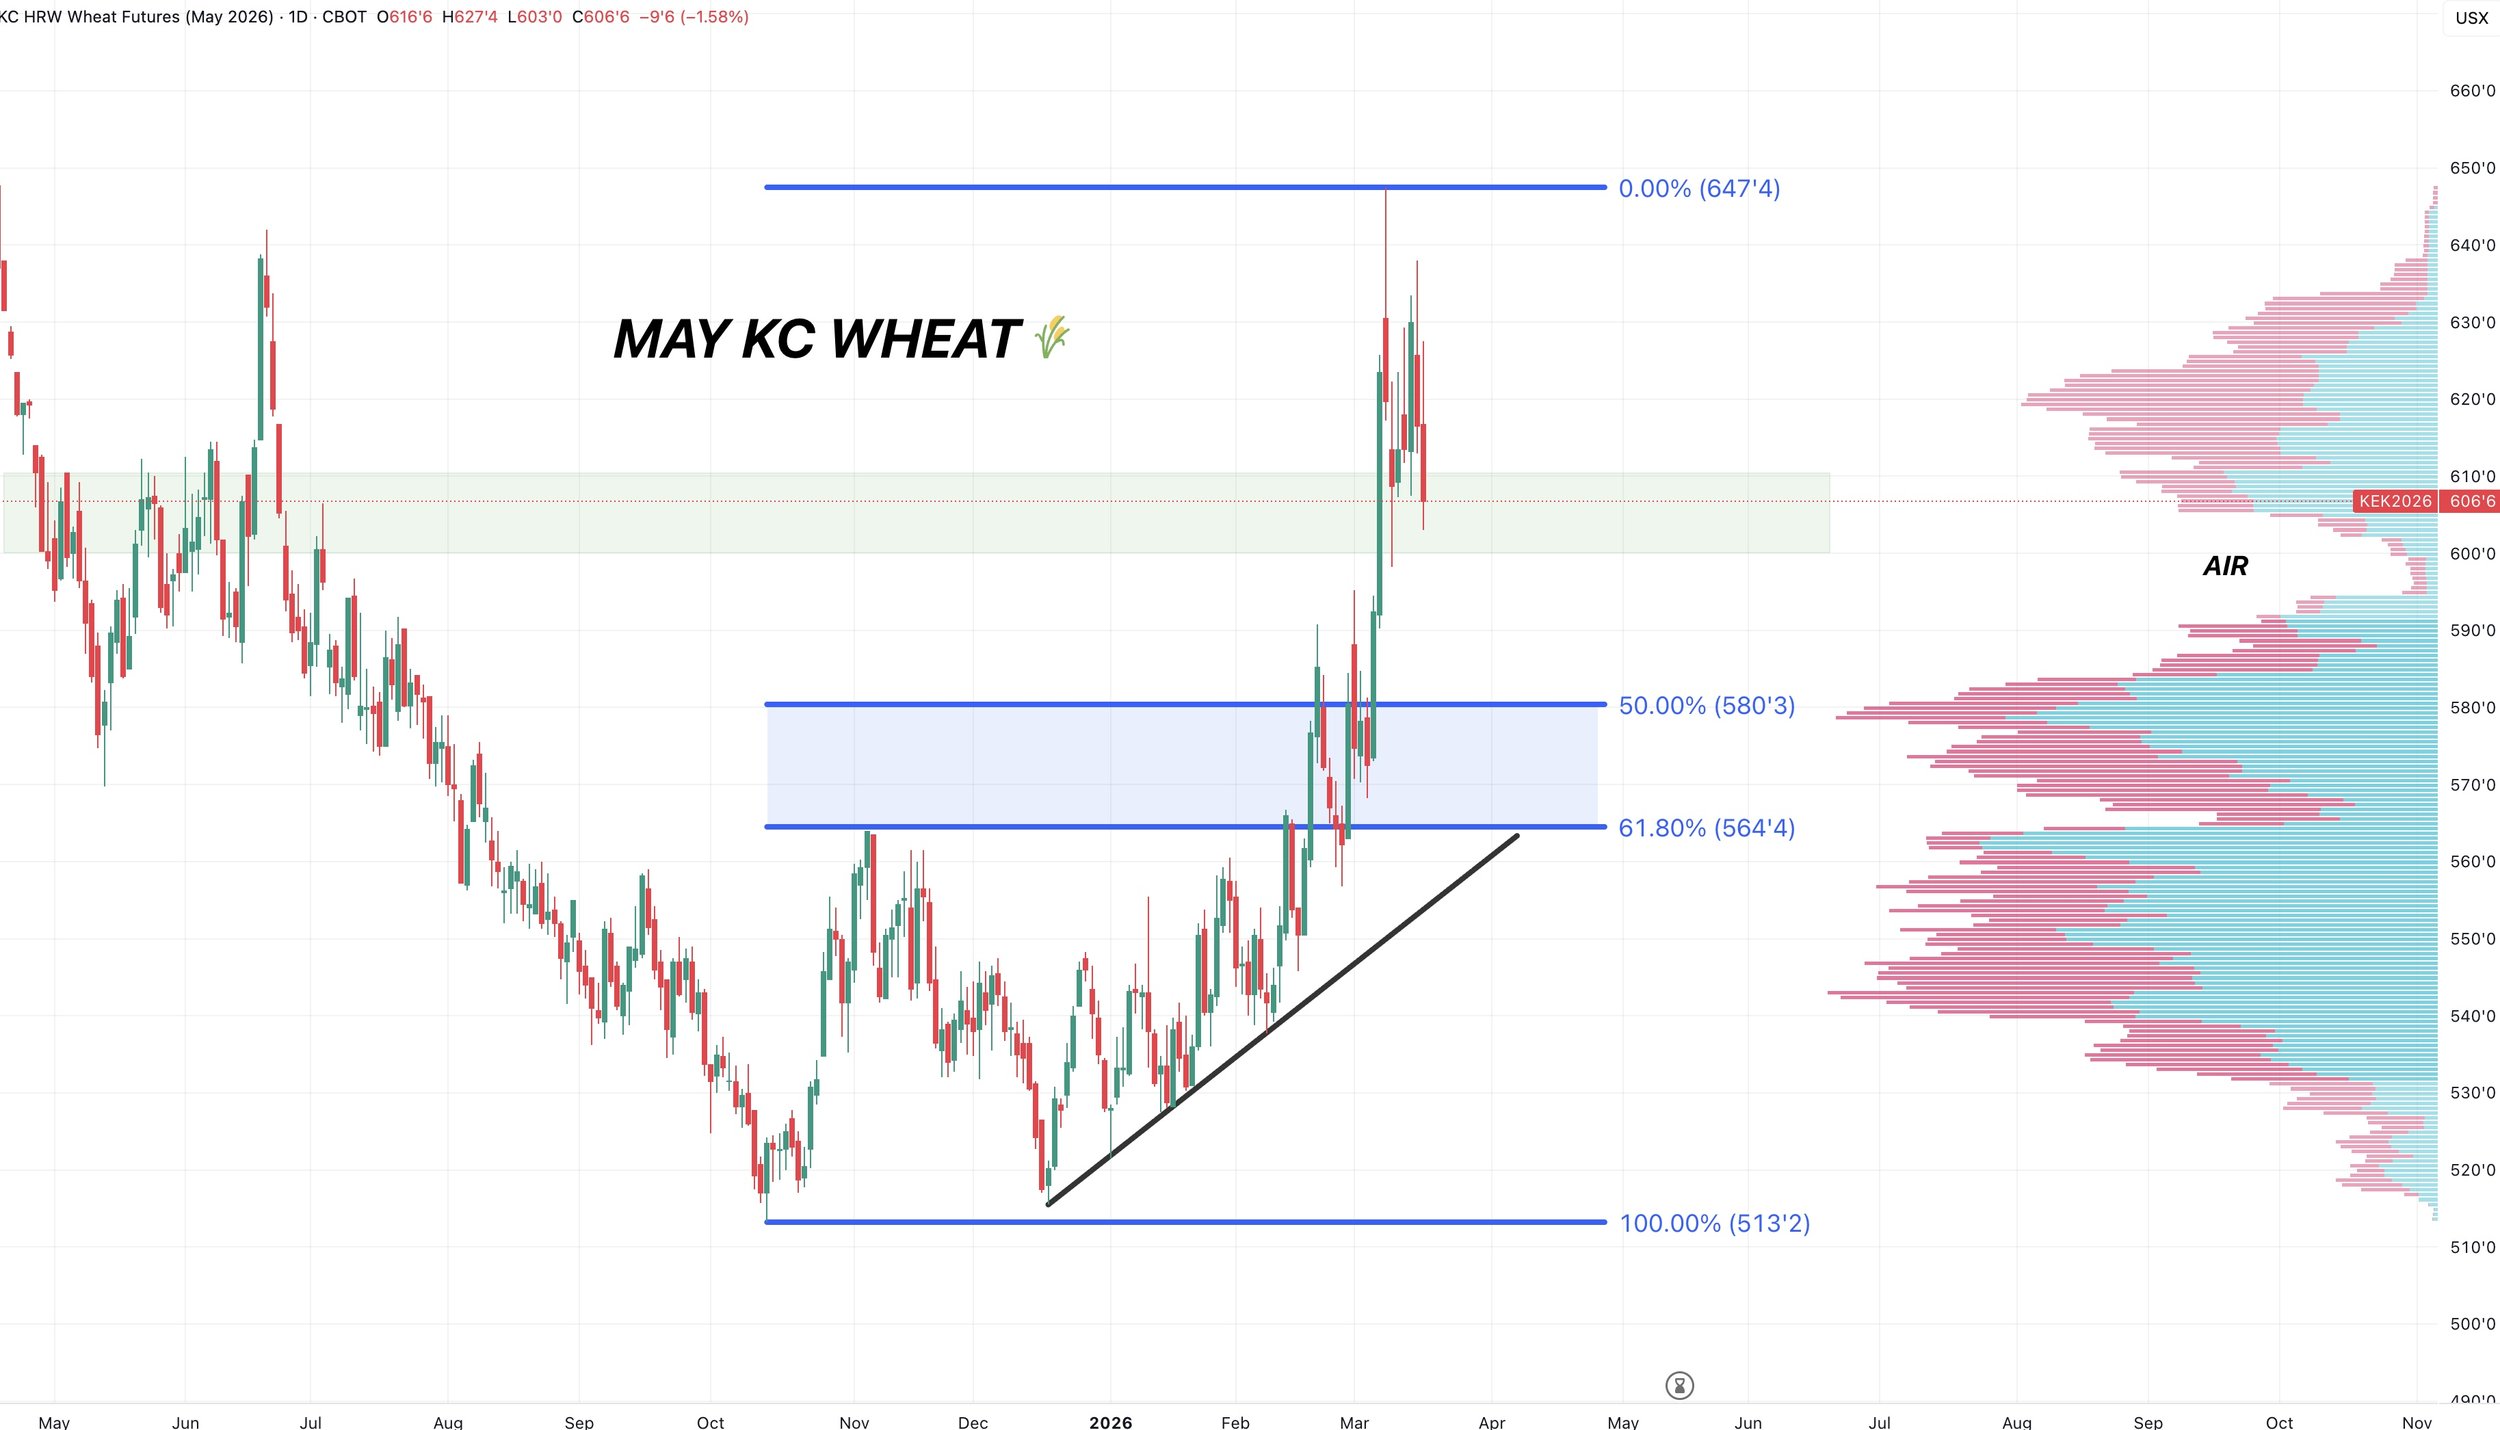
The reason behind the last sell signal was that we clawed back 61.8% of the highs from last February.
The next target is the 78.6% level at $6.55
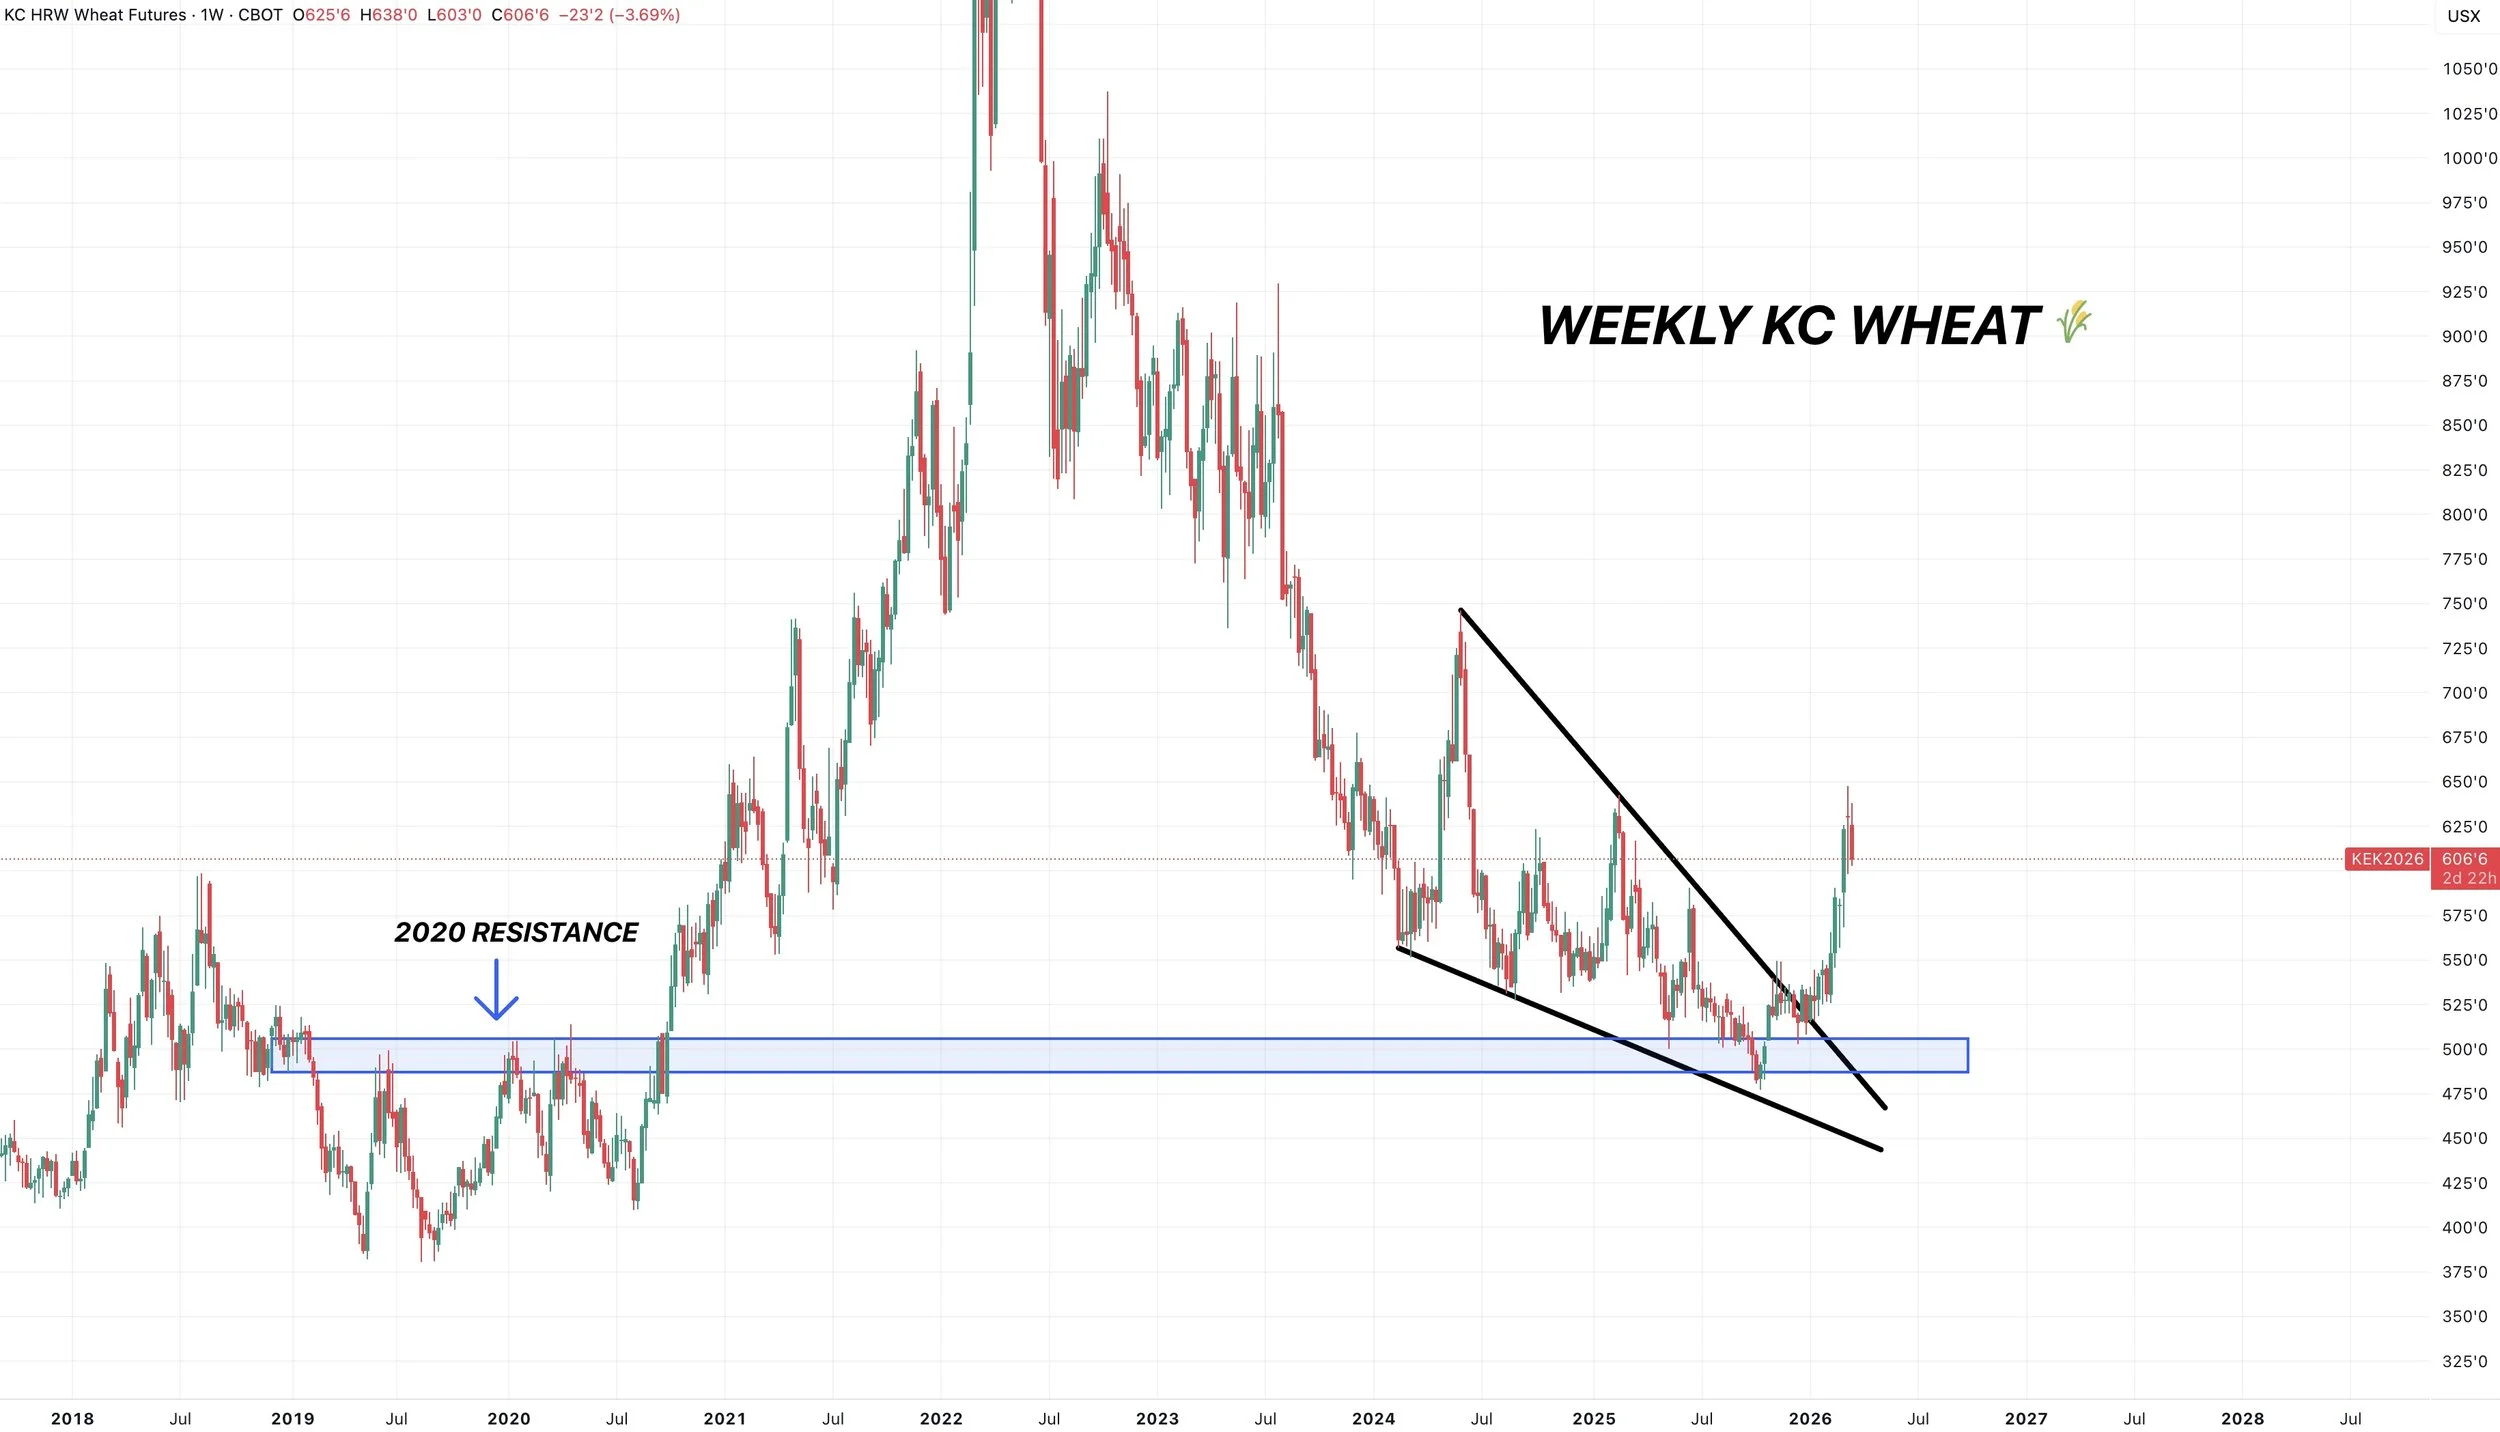
Big Picture Chart:
Taking a bigger picture approach, the trend is still higher.
The chart looks good and I think we've carved out some meaningful long term lows in this market.
Short term, we can’t forget wheat sometimes likes the take the elevator back down following a rally.
Cattle
JBS Strike:
The workers did officially go on strike. However, it looks like this isn’t going to be a major factor from here. It seems like it was somewhat of a sell the rumor buy the fact event.
Last week we sold off on the news and rumors of the strike. The plant was already closed last week anyways.
This week, once the strikes started, we found some life.
So it looks like it's at least been partially priced in.
Overall it does feel like the recent bounce in cattle could simply be more macro driven than fundamentally driven. With the stock market bouncing back.
We have a cattle on feed report on Friday. Which could show some big heavy weight inventory. So that's a possible risk.
Packer margins have improved which is friendly.
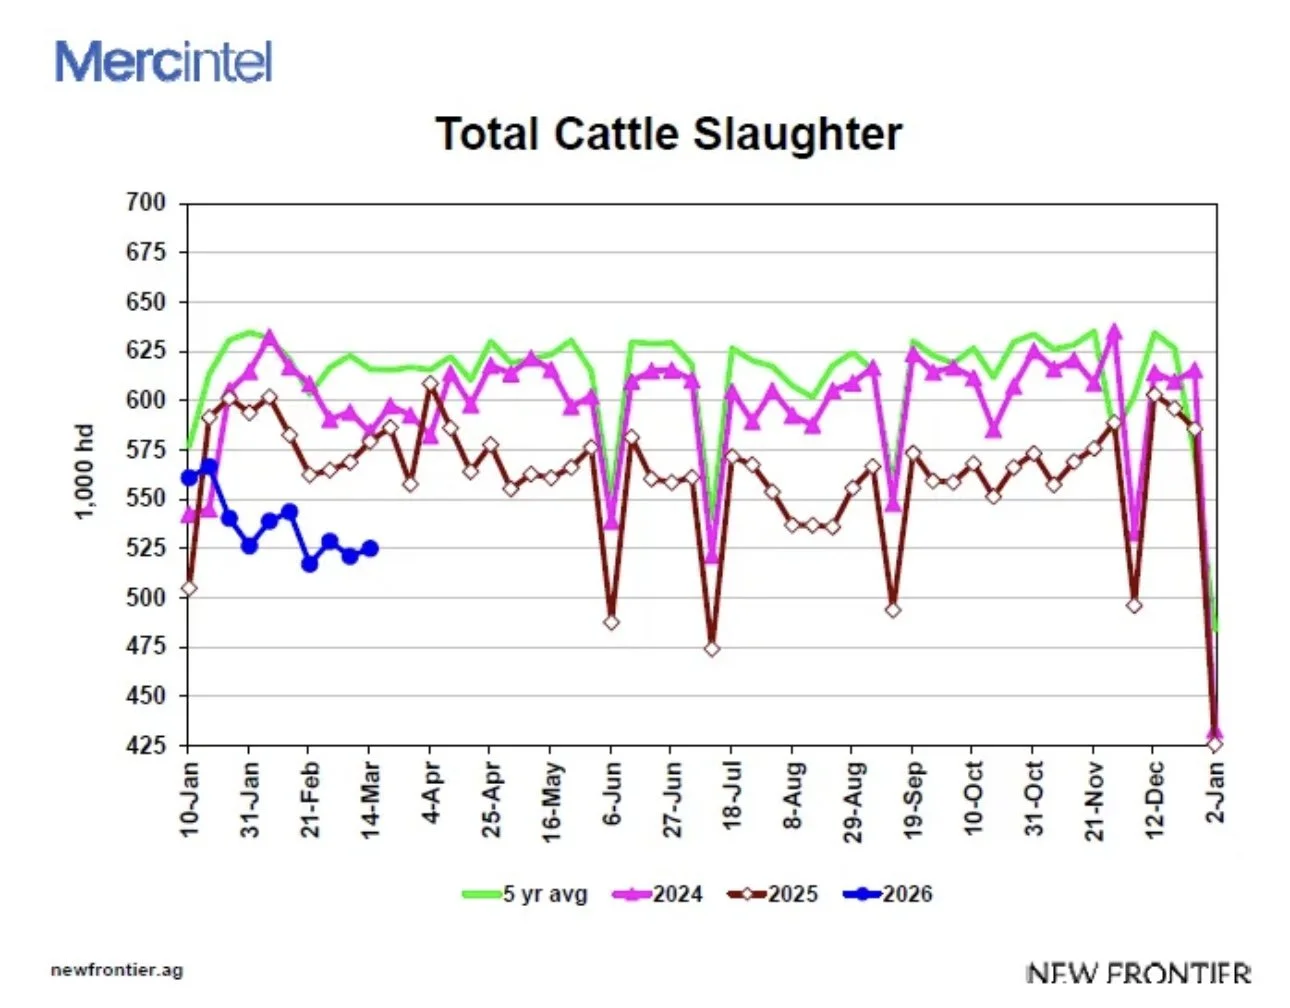
We have the smallest cattle slaughter in a decade, that is sending boxed beef prices to their highest levels in since September.
Which means we've been building front end supply.
So overall, I still feel like there is downside risk in this market.
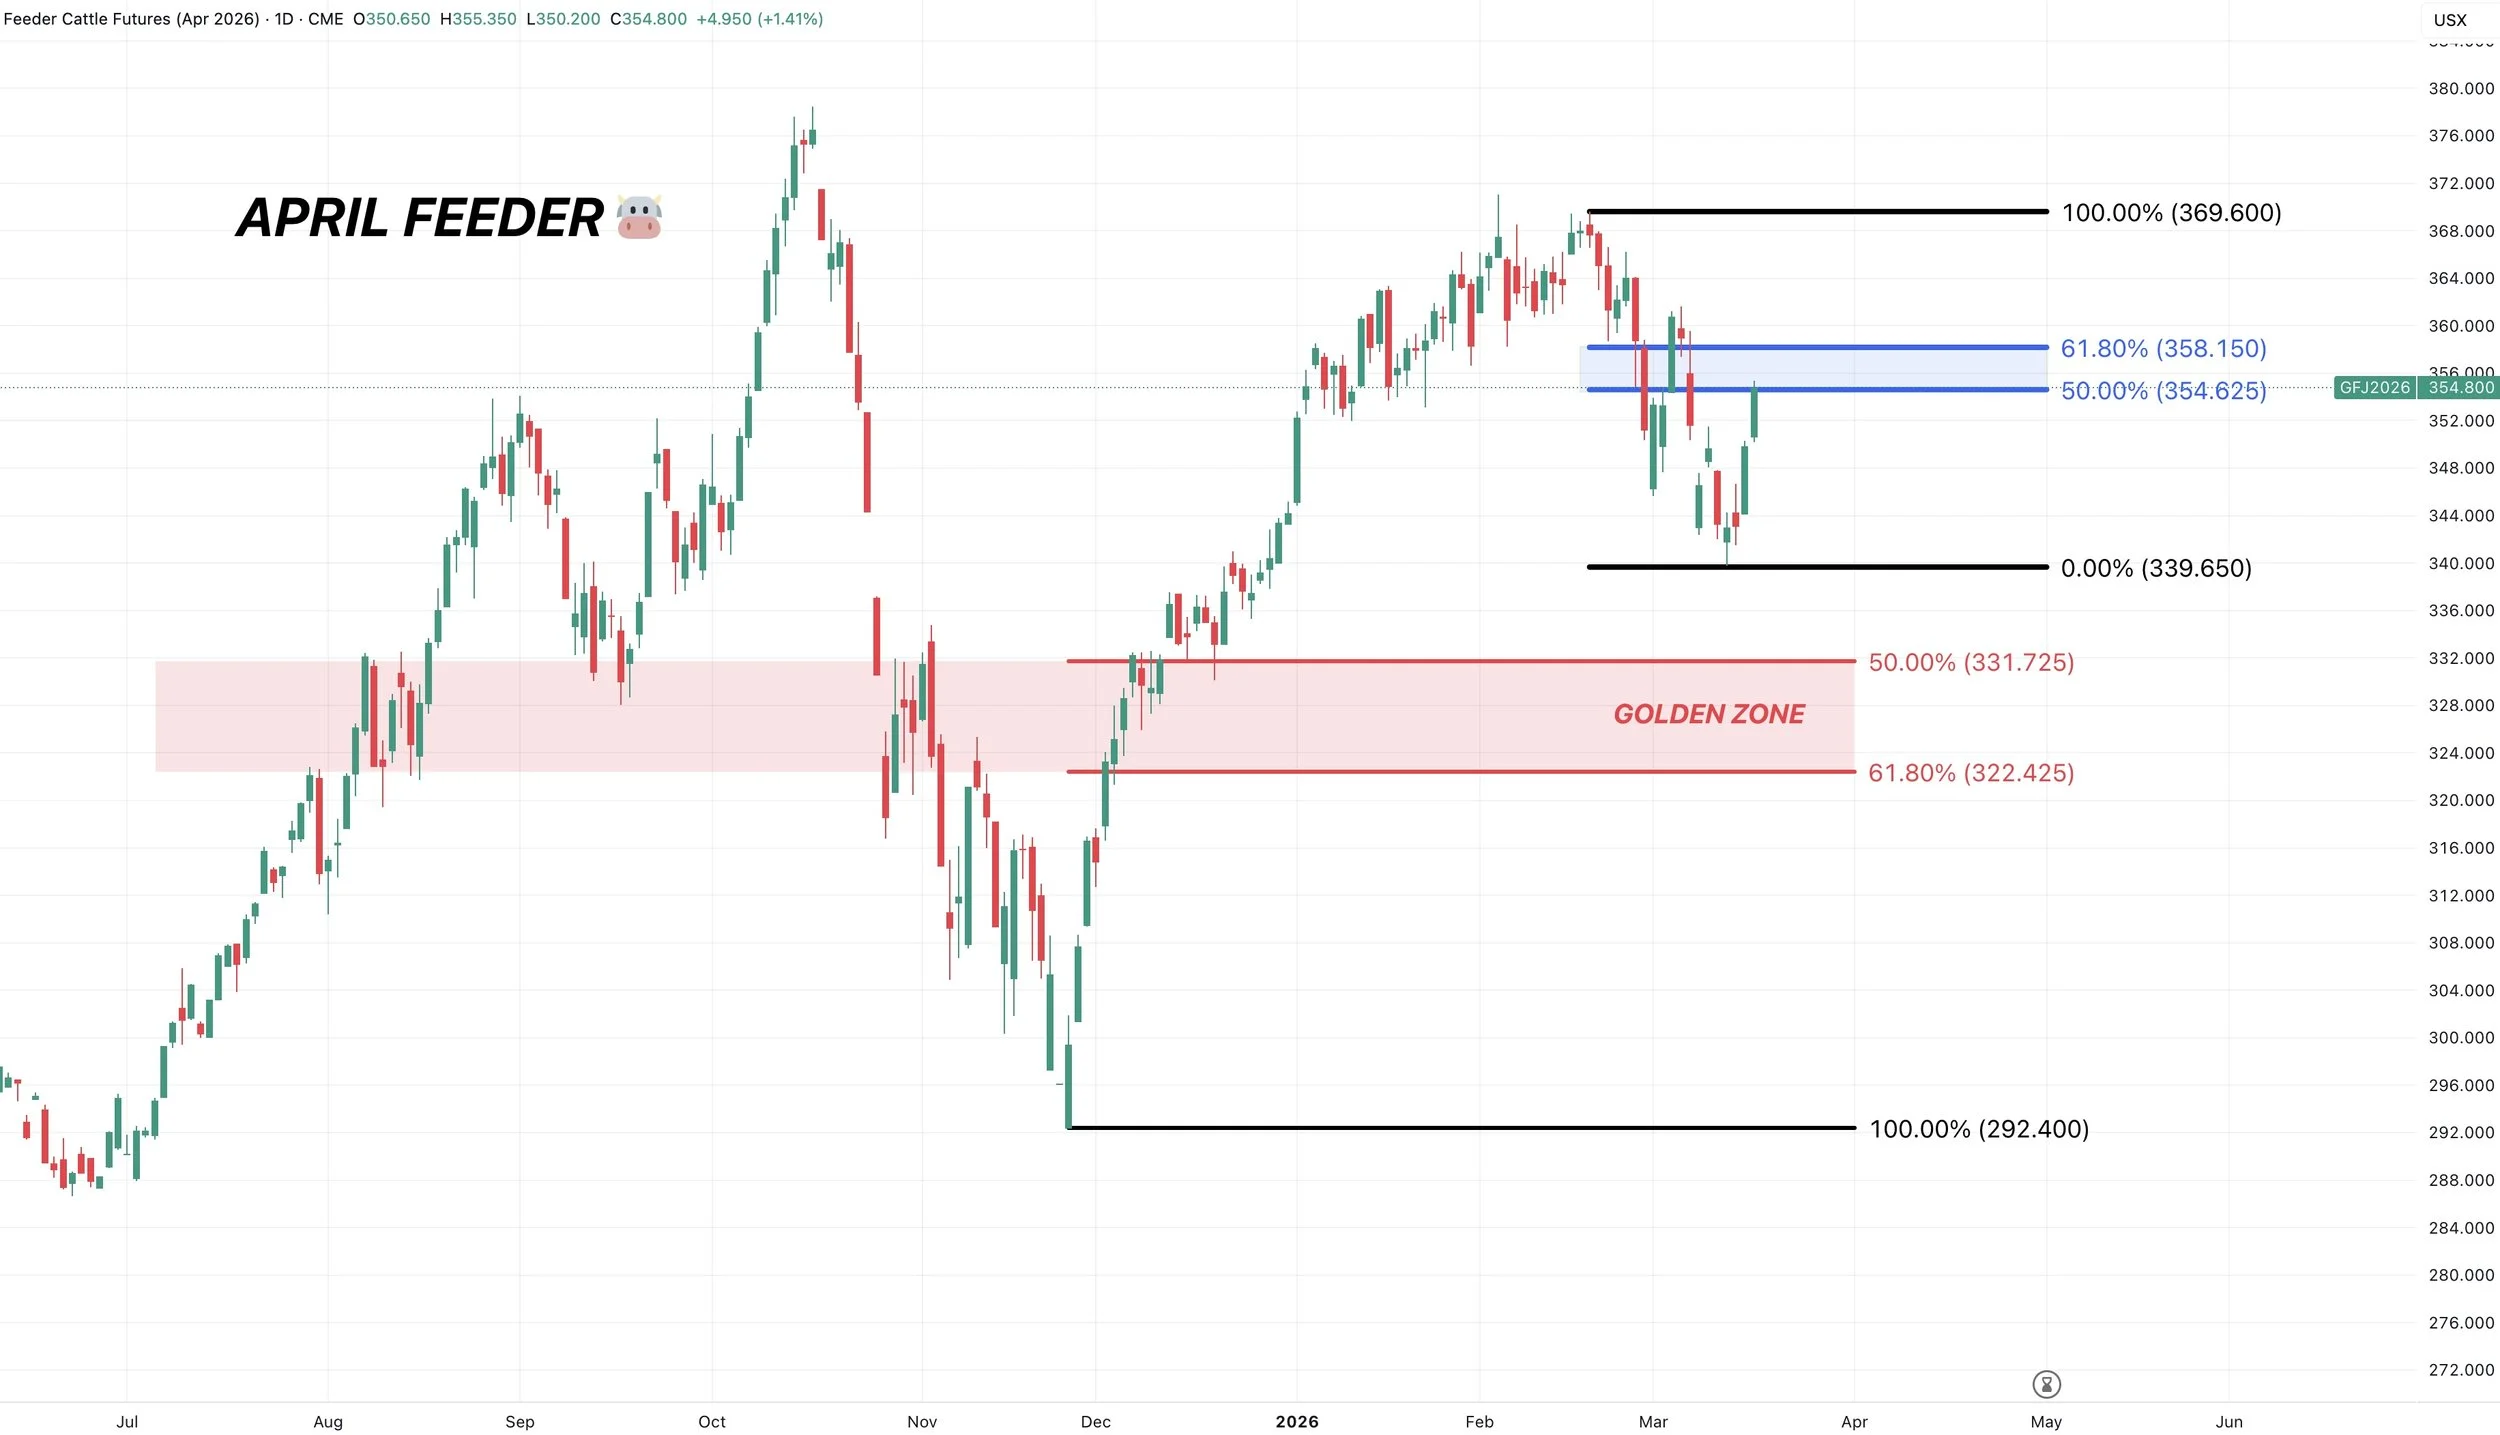
April Feeders Chart:
We've clawed back 50% of the entire sell off.
Relief bounces can often tend to fail here. So not the worst idea to defend this recent rally.
If we take out 358 then the chart woulld suggest a move back towards the Feb highs is possible.
But for now, the trend still remains lower in my opinion.
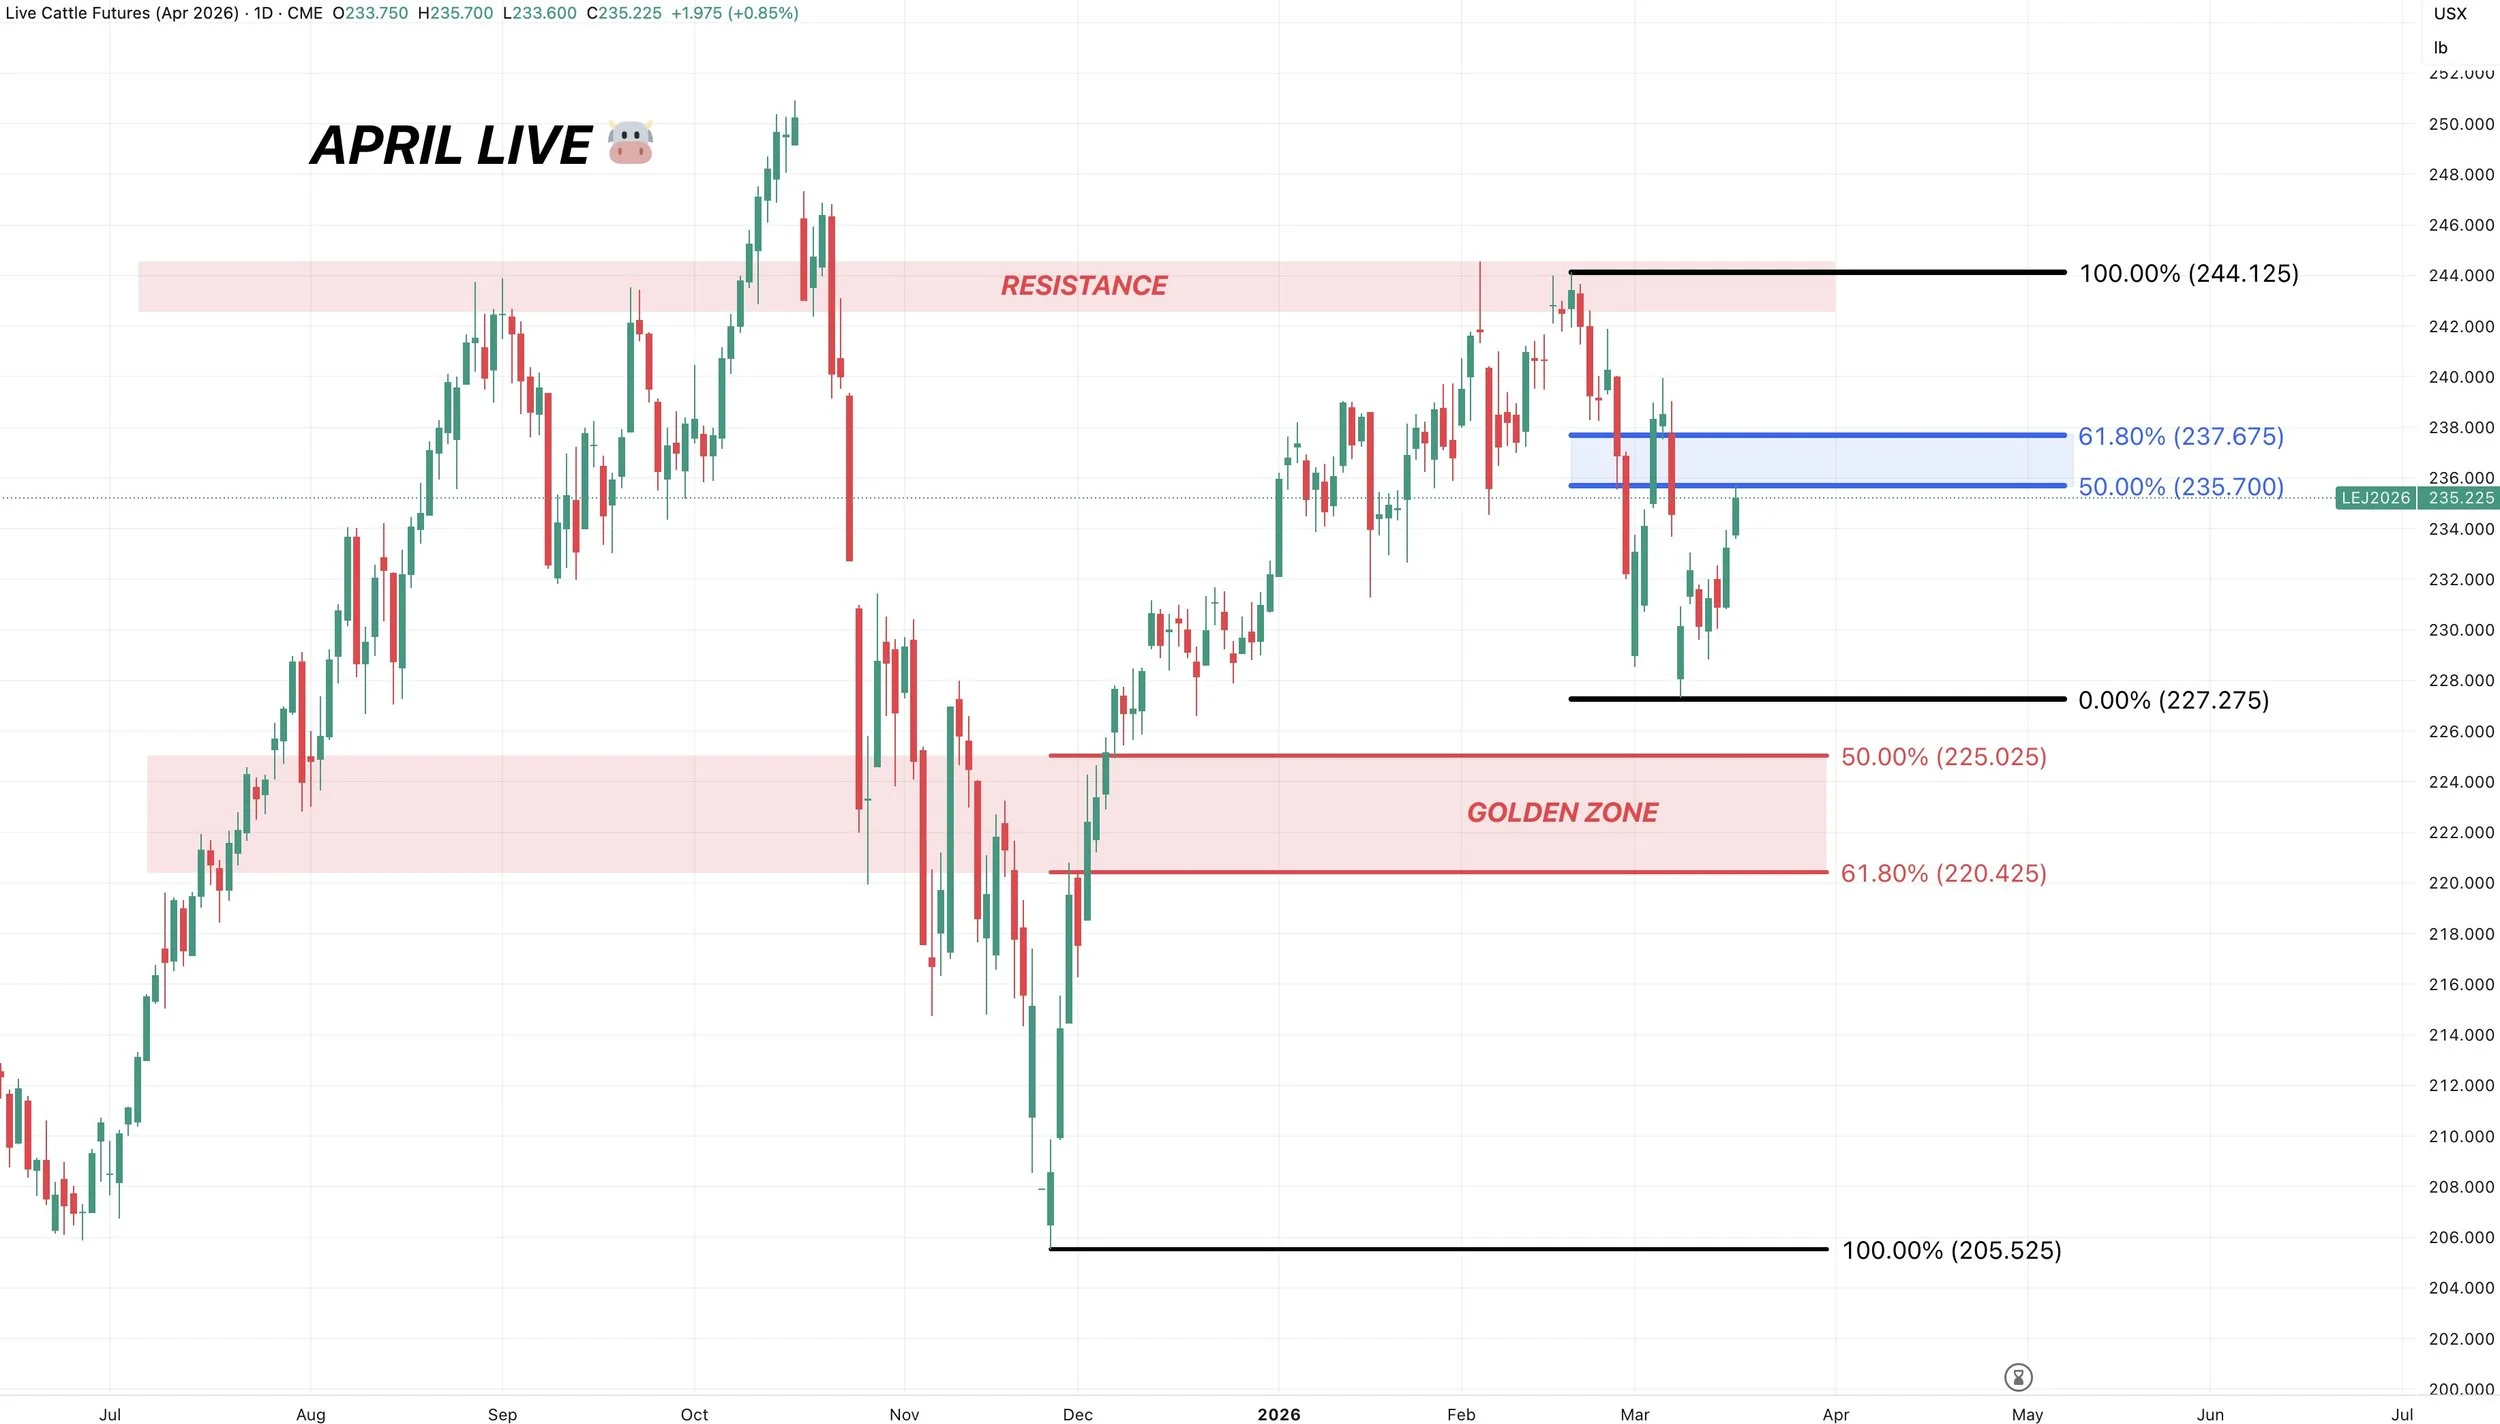
April Live Chart:
Same story here.
Clawed back 50% of the sell off.
Big point of interest and where we can often fail.
Take out 238, then the outlook can change, but for now the risk remains lower.
Want to Talk?
Our phones are open 24/7 for you guys if you ever need anything or want to discuss your operation.
Jeremey, Lauren & Office: (806)484-1214
Sebastian: (605)280-1186
Email: sfrost@dailymarketminute.com
Hedge Account
Interested in a hedge account? Use the link below to set up an account or give us a call.
Recent Signals
March 9th, 2026: 🌱
Soybeans signal & hedge alert. Sent via text.
March 6th, 2026: 🌽 🌾
Corn & wheat sell signal & hedge alert.
March 3rd, 2026: 🌽
Old crop & new crop corn sell signal & hedge alert.
Feb 26th, 2026: 🌱
Old crop & new crop beans sell signal & hedge alert.
Feb 19th, 2026: 🌾
KC wheat sell signal & hedge alert.
Feb 6th, 2026: 🌽 🌱
Old crop corn & soybean sell signal & hedge alert.
Feb 4th, 2026: 🌱
Soybean sell signal & hedge alert.
Nov 17th, 2025: 🌱
Soybean sell signal & hedge alert.