
ALL ABOUT TOMORROW’S USDA
MARKET UPDATE
You can scroll to read the usual update as well. As the written version is the exact same as the video.
Timestamps for video:
USDA Preview: 0:00min
China & Soybeans: 8:45min
Corn Charts: 11:50min
Bean Chart: 13:00min
Wheat Chart: 14:00min
Cattle Charts: 14:55min
Want to talk?
Office: (806)484-1214
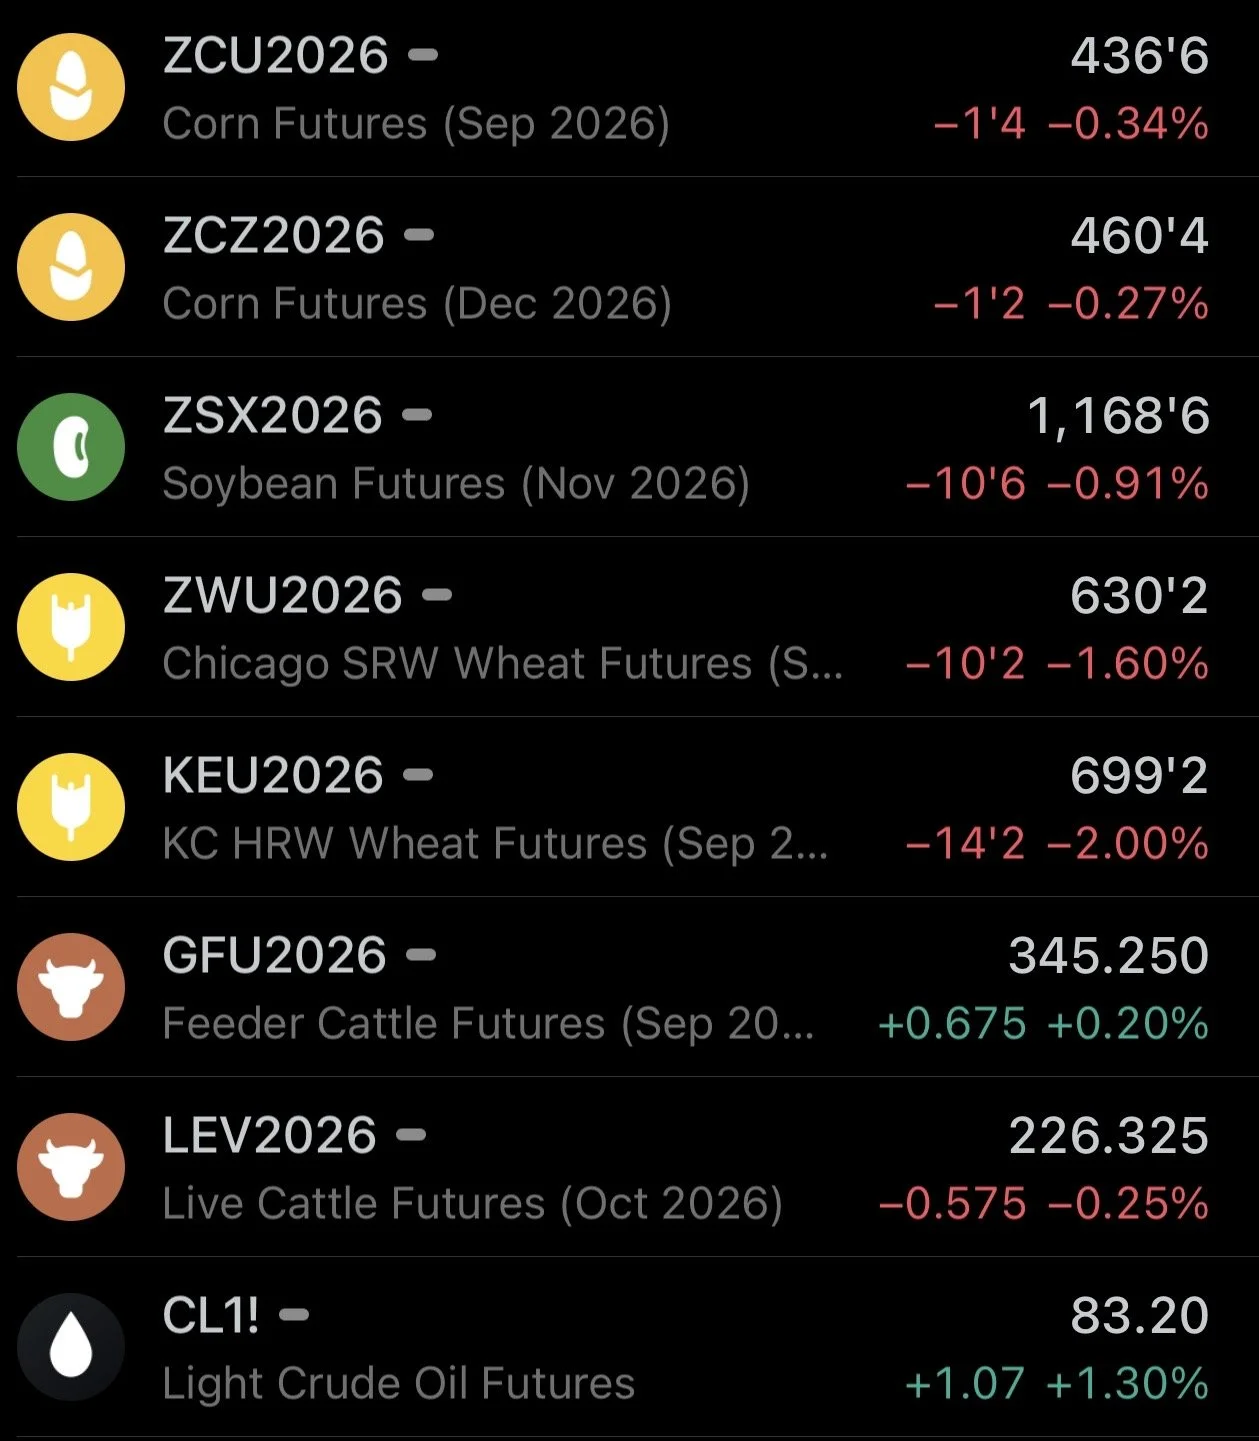
Futures Prices Close
Overview
Grains on the weak side with soybeans and wheat leading the way lower while corn held in better in comparison.
Today's price action was mostly just pre-report positioning.
It's all about tomorrow's big report.
Where we are going to get our first real yield estimates for new crop.
The 183 and 53 they've been using were just the starting baseline numbers. These numbers they are using tomorrow are producer survey based. So more accurate than the baseline, but the October and Jan yield numbers will be more accurate once we get into the fields.
This report could provide plenty of surprises, whether they are good or bad.
Aside from the new crop supply changes, we're going to be getting updated demand numbers from old crop.
Not only are we going to be getting the yield adjustments, but there is still a lot of debate surrounding the acreage numbers.
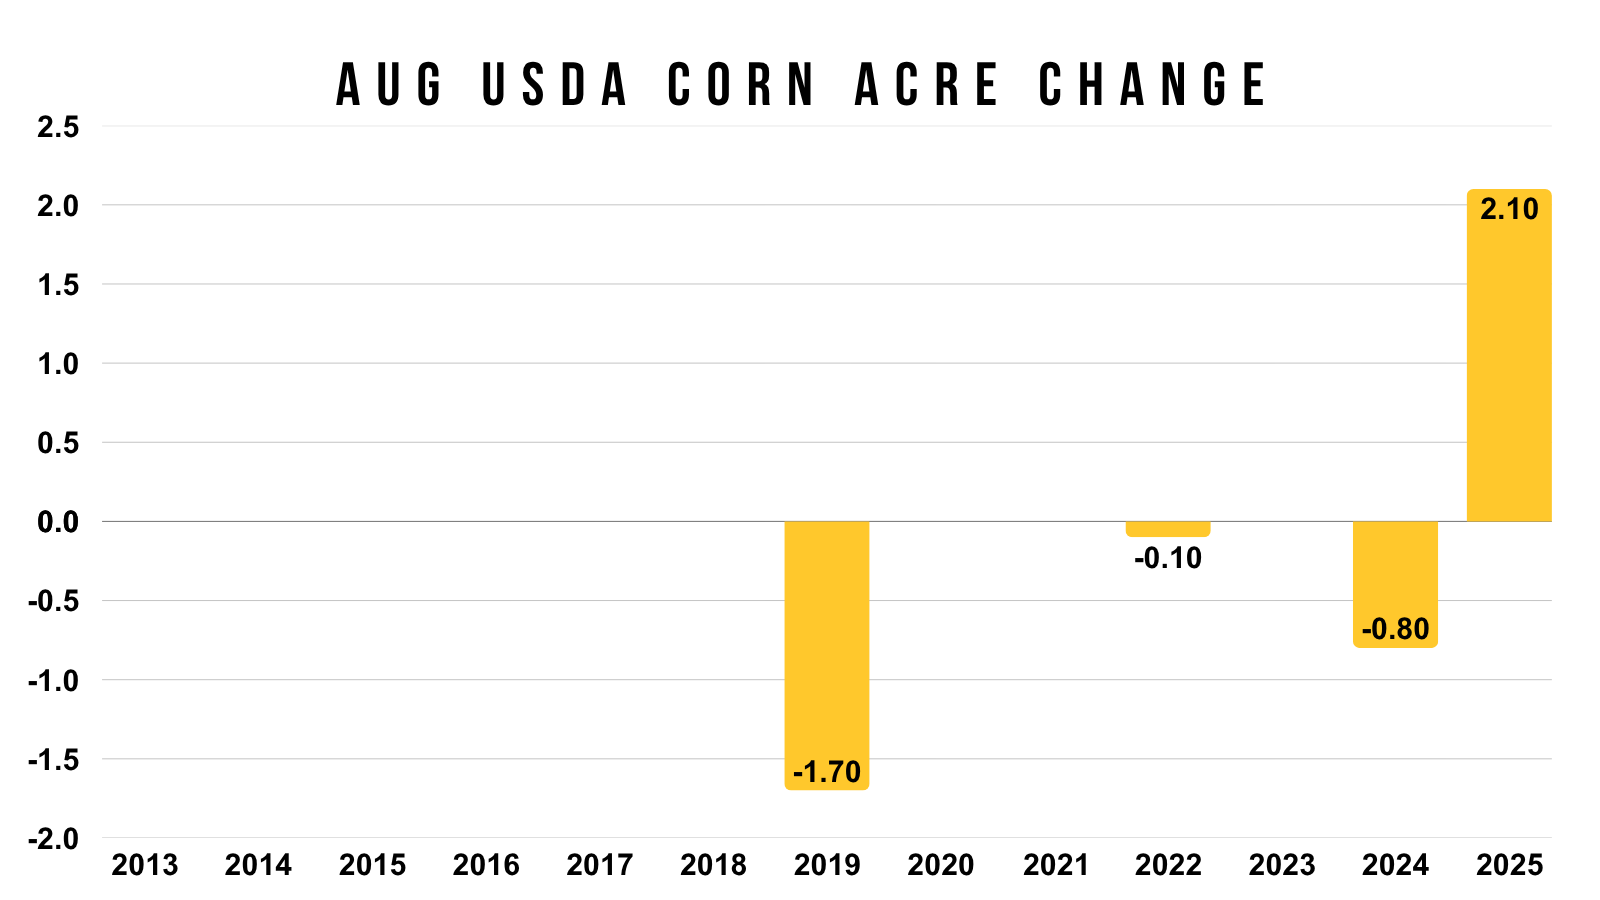
If you remember, we had that big surprise in acres last year. As corn added 2 million and soybeans lost 2.5 million.
We really have to be prepared for anything. Last year, not many were expecting a near +8 bpa increase to corn yield along with the extra acres.
If you want to discuss ways you can protect yourself or any other strategies ahead of the report. Feel free to reach out.
Office: (806)484-1214
USDA Preview
How big of a market mover is this report?
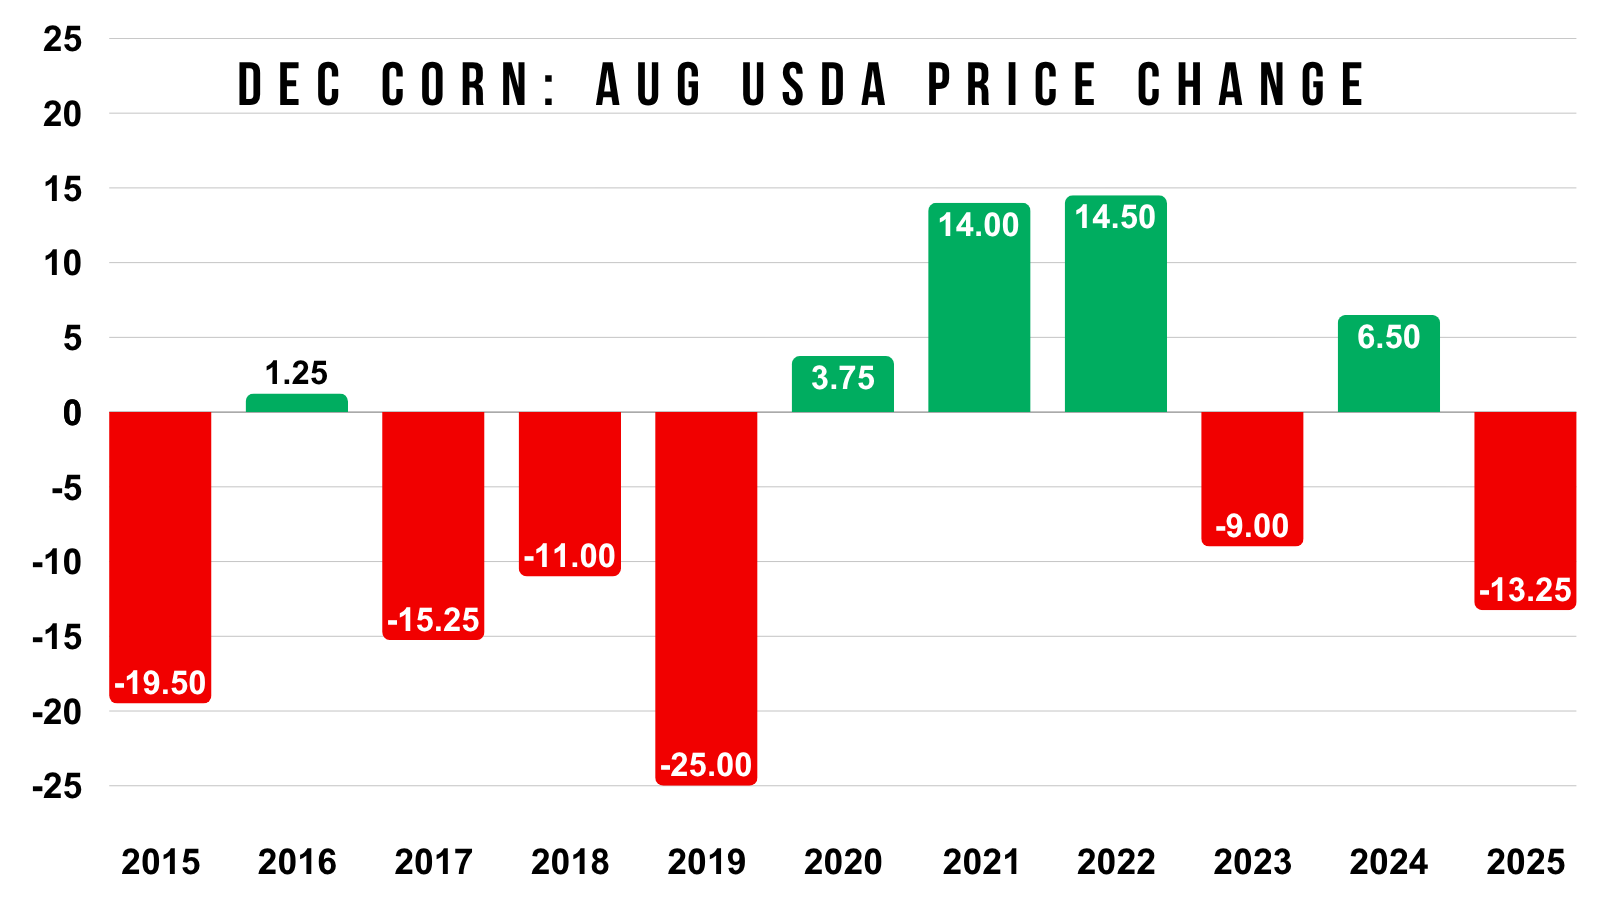
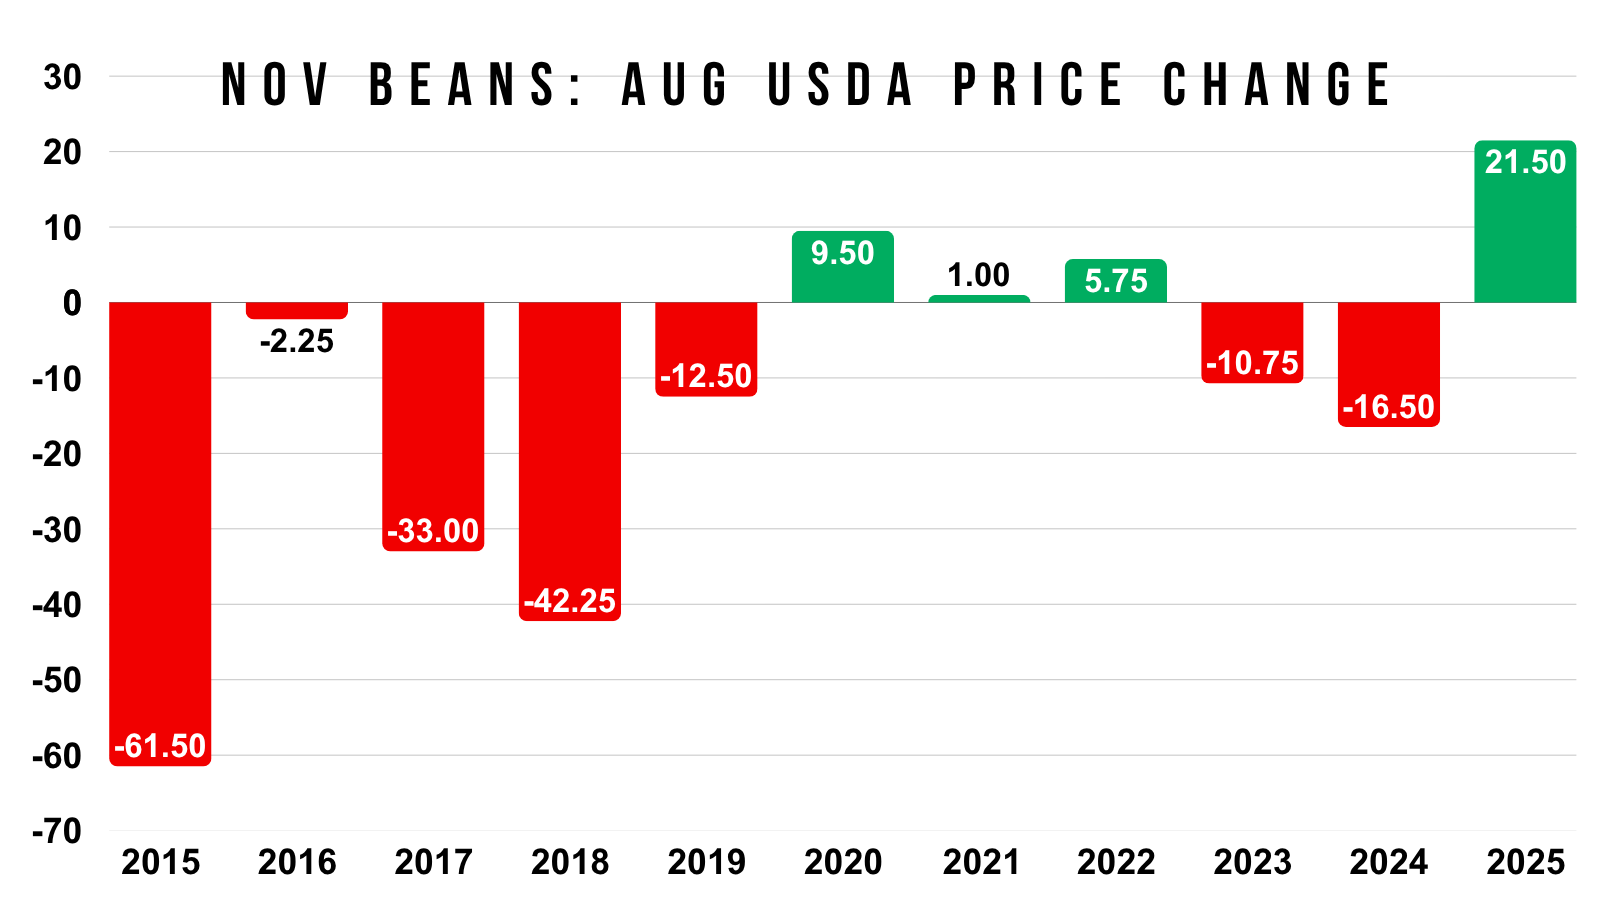
Here is the past price changes for the day of this report.
Dec Corn:
It's been a coin toss the last decade.
Average Move since 2015 is +/- 13 cents.
It clearly can be a pretty big mover.
The options are pricing in around a 9 to 10 cent move in corn tomorrow.
Nov Beans:
Average Move since 2015 is +/- 20 cents.
The options are pricing in around an 11 cent move for tomorrow.
Trade Estimates
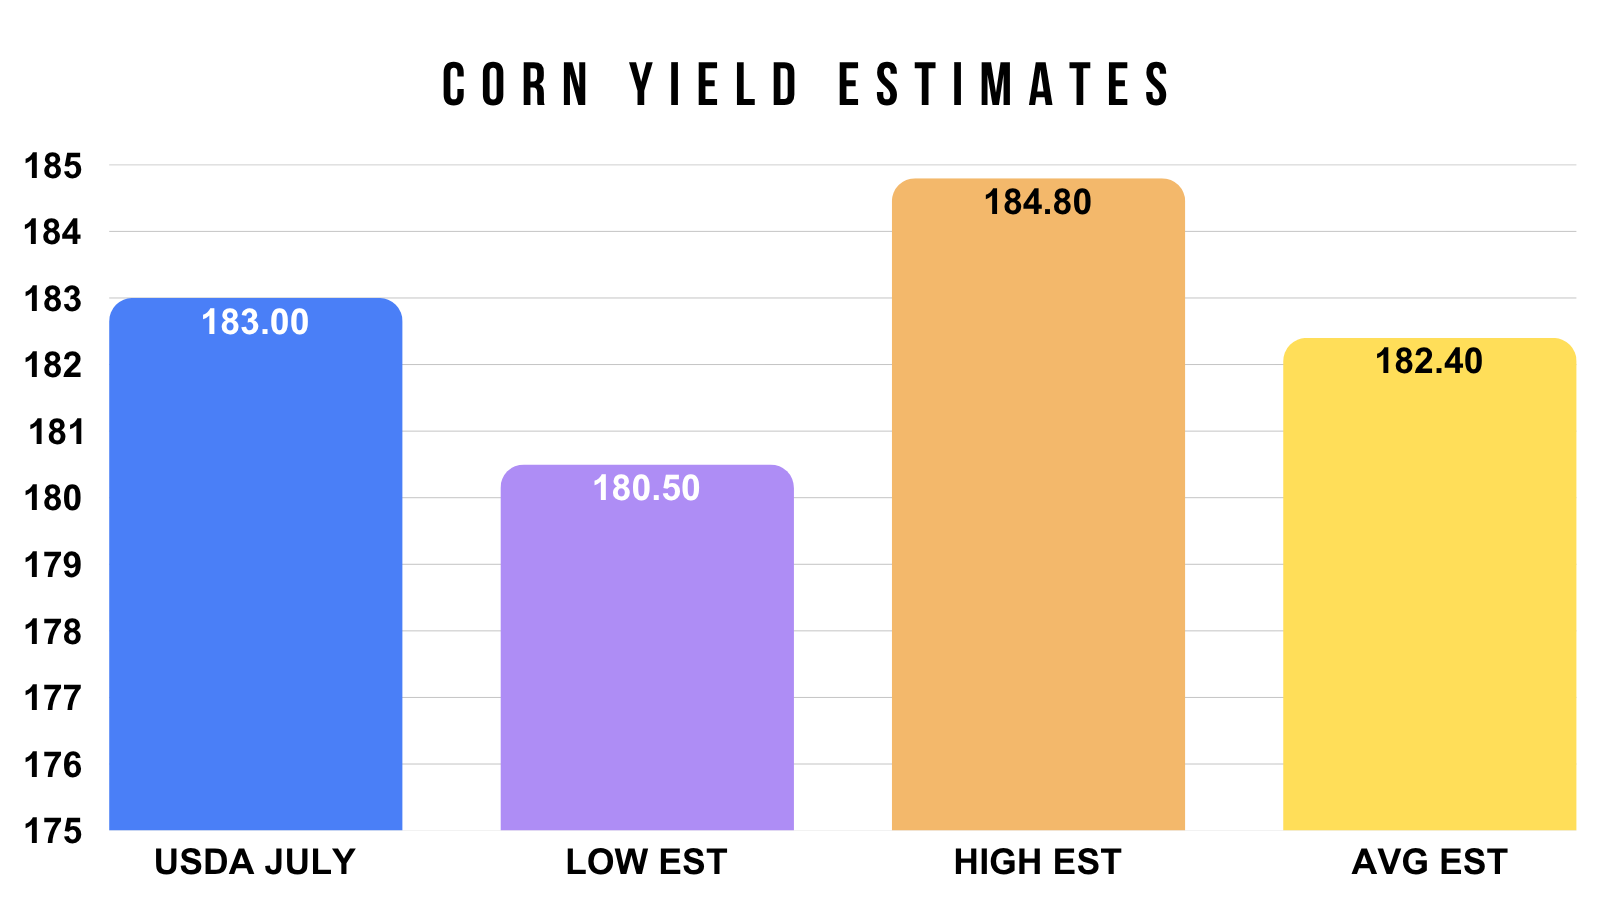
Corn Yield Estimate:
The trade is expecting a 182.4 yield in corn vs the prior 183.
The low guess is 180.5.
The high guess is 184.8.
DTN Corn:
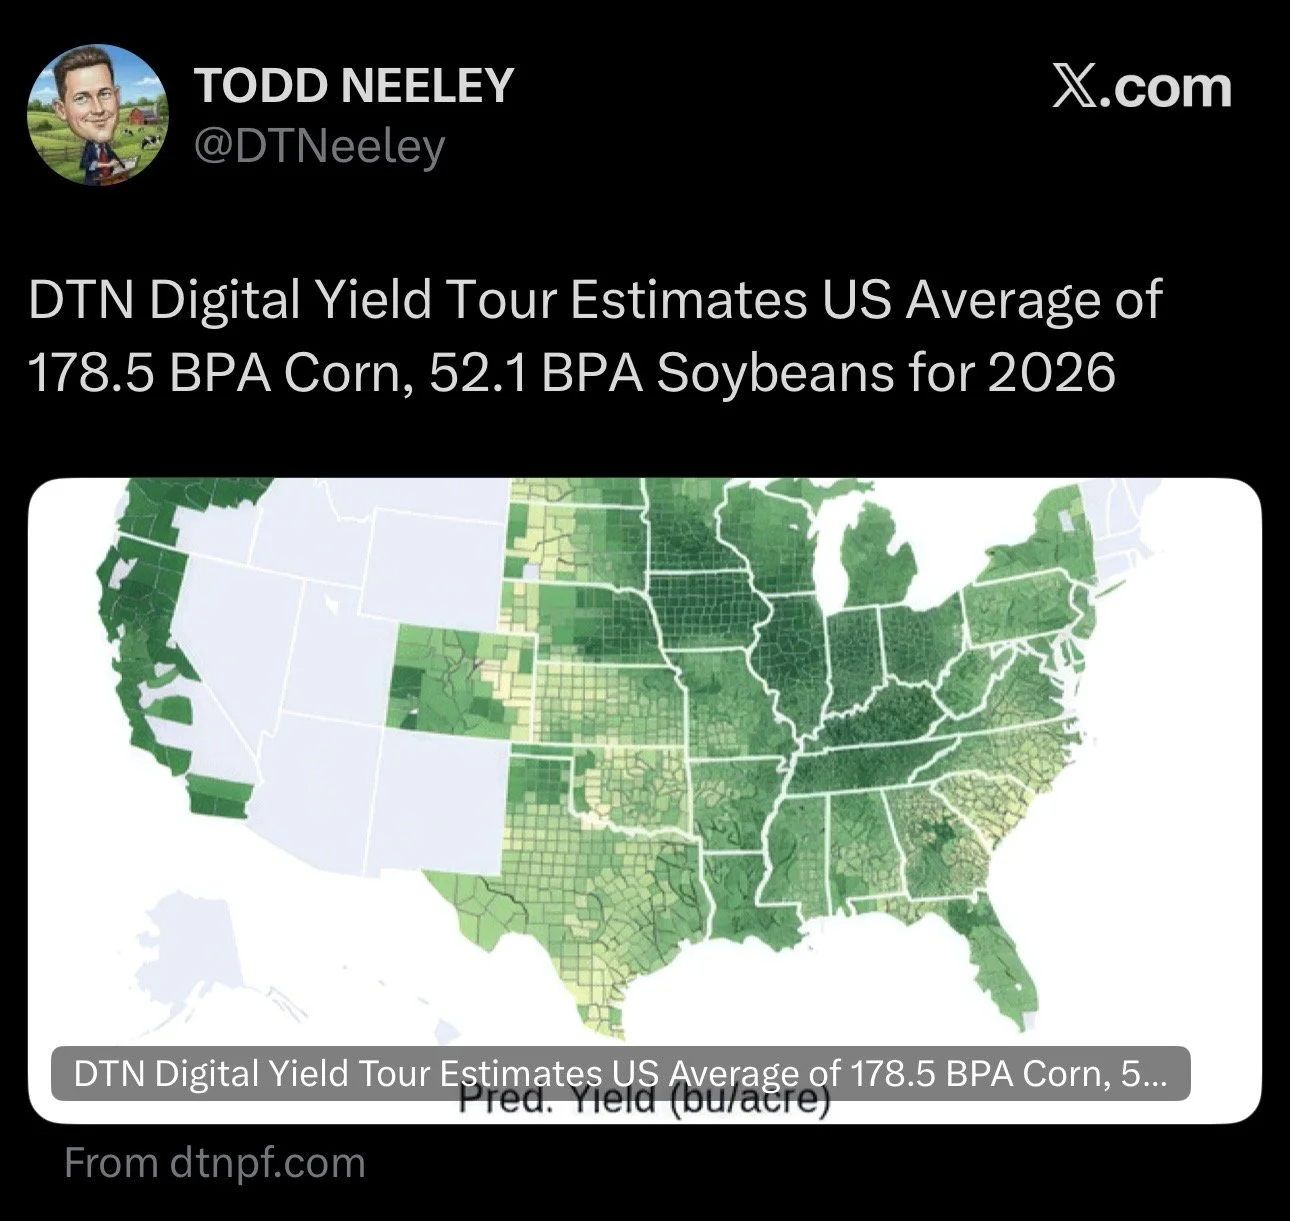
Then we had DTN put out their estimate yesterday.
Their number is lower than every single trade analyst.
With a 178.5 bpa estimate.
Which would of course be very bullish if realized.
Soybean Yield Estimate:
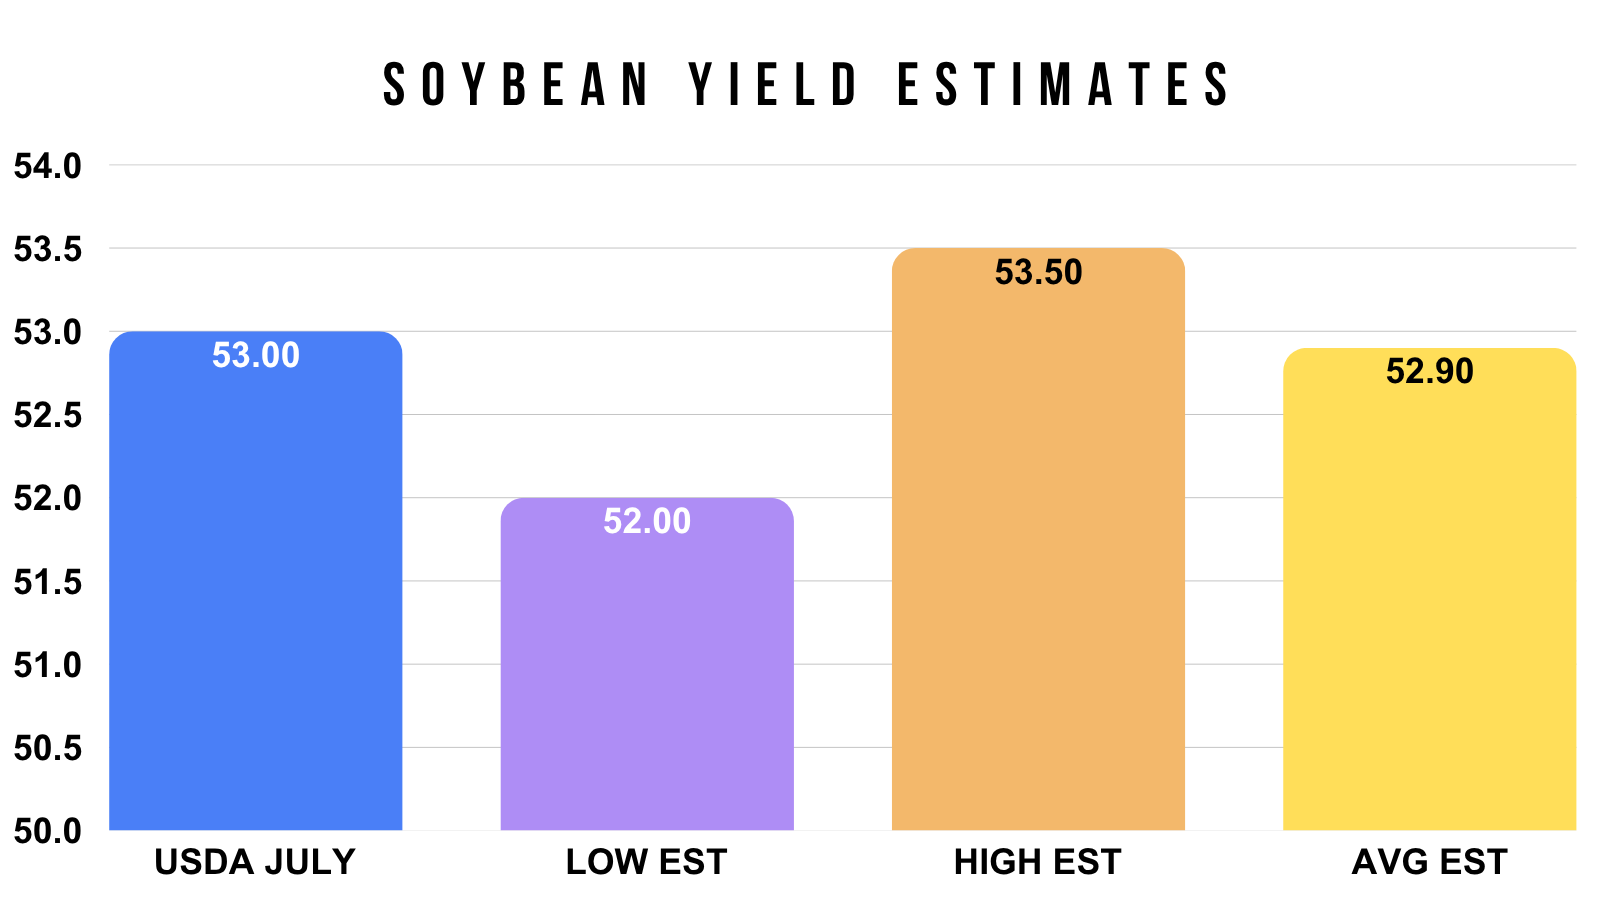
For soybeans, the average guess is 52.9. Virtually unchanged from the starting 53.
The low guess is 52.
The high guess is 53.5.
Acres:
The trade is actually not expecting any sizeable changes to acres.
However, the last two years have included some big changes.
So it could obviously happen and it's going to be a possible wild card.
I wouldn’t rule it out. If we do see acre changes, it can shake up the balance sheets pretty drastically.
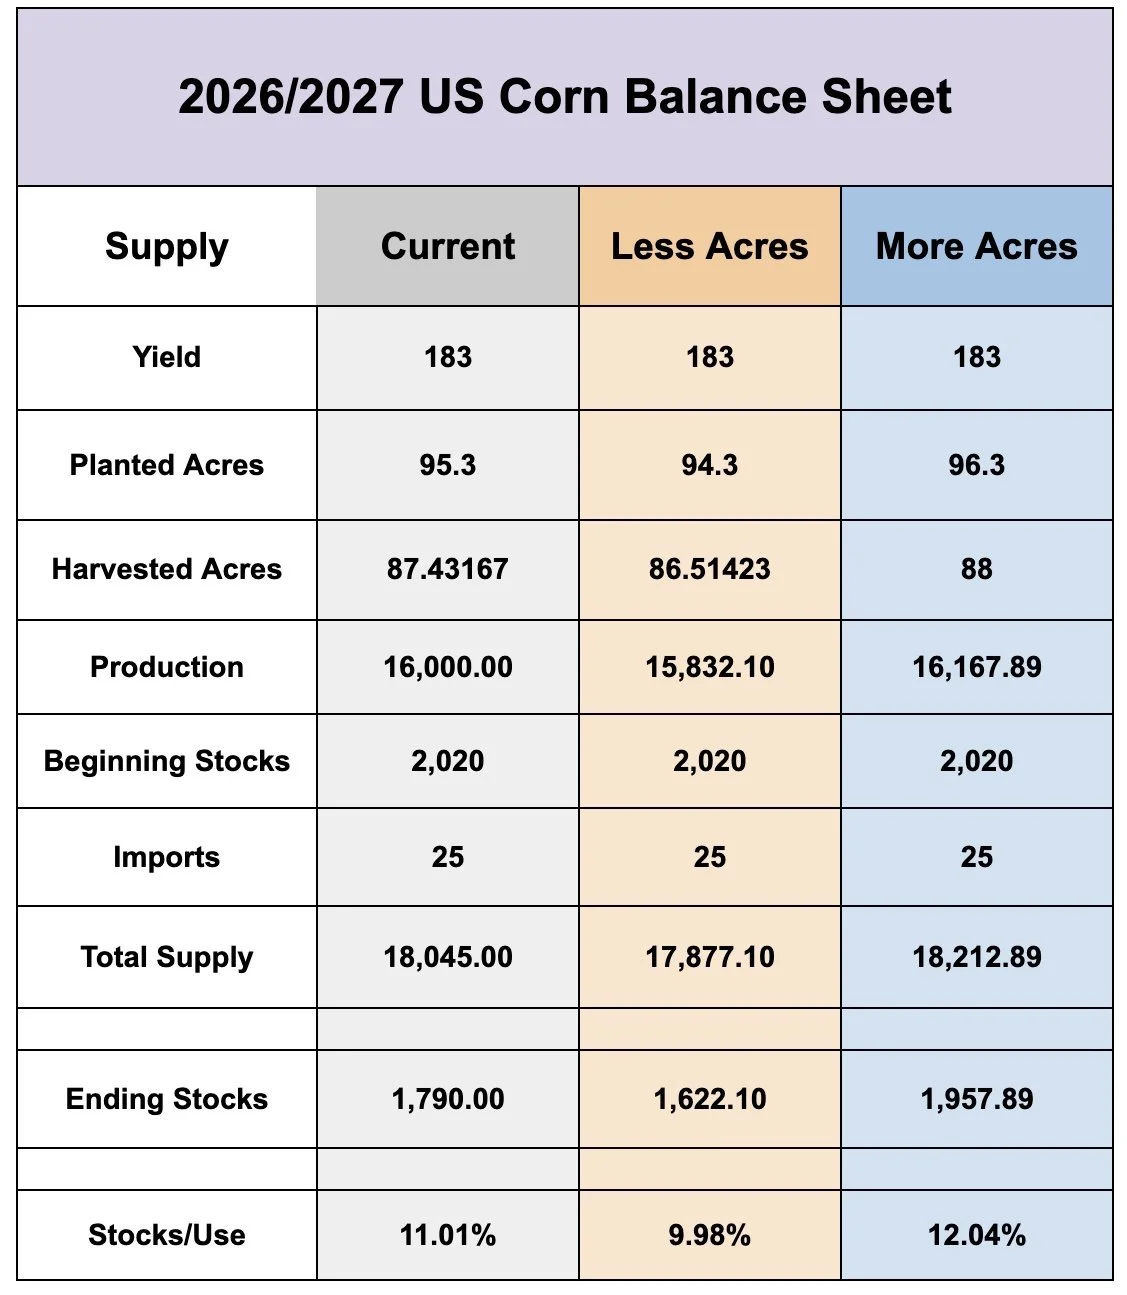
Just for reference, every 1 million change in acres equates to roughly a 170 million bushel swing on the balance sheet.
We currently have a carryout of 1.79 billion.
Before touching anything else or demand, a 1 million swing in acres higher or lower is the difference between a 1.62 billion carryout vs a 1.95 billion carryout.
So it'll be a big deal if they get adjusted.
Past Yield Changes
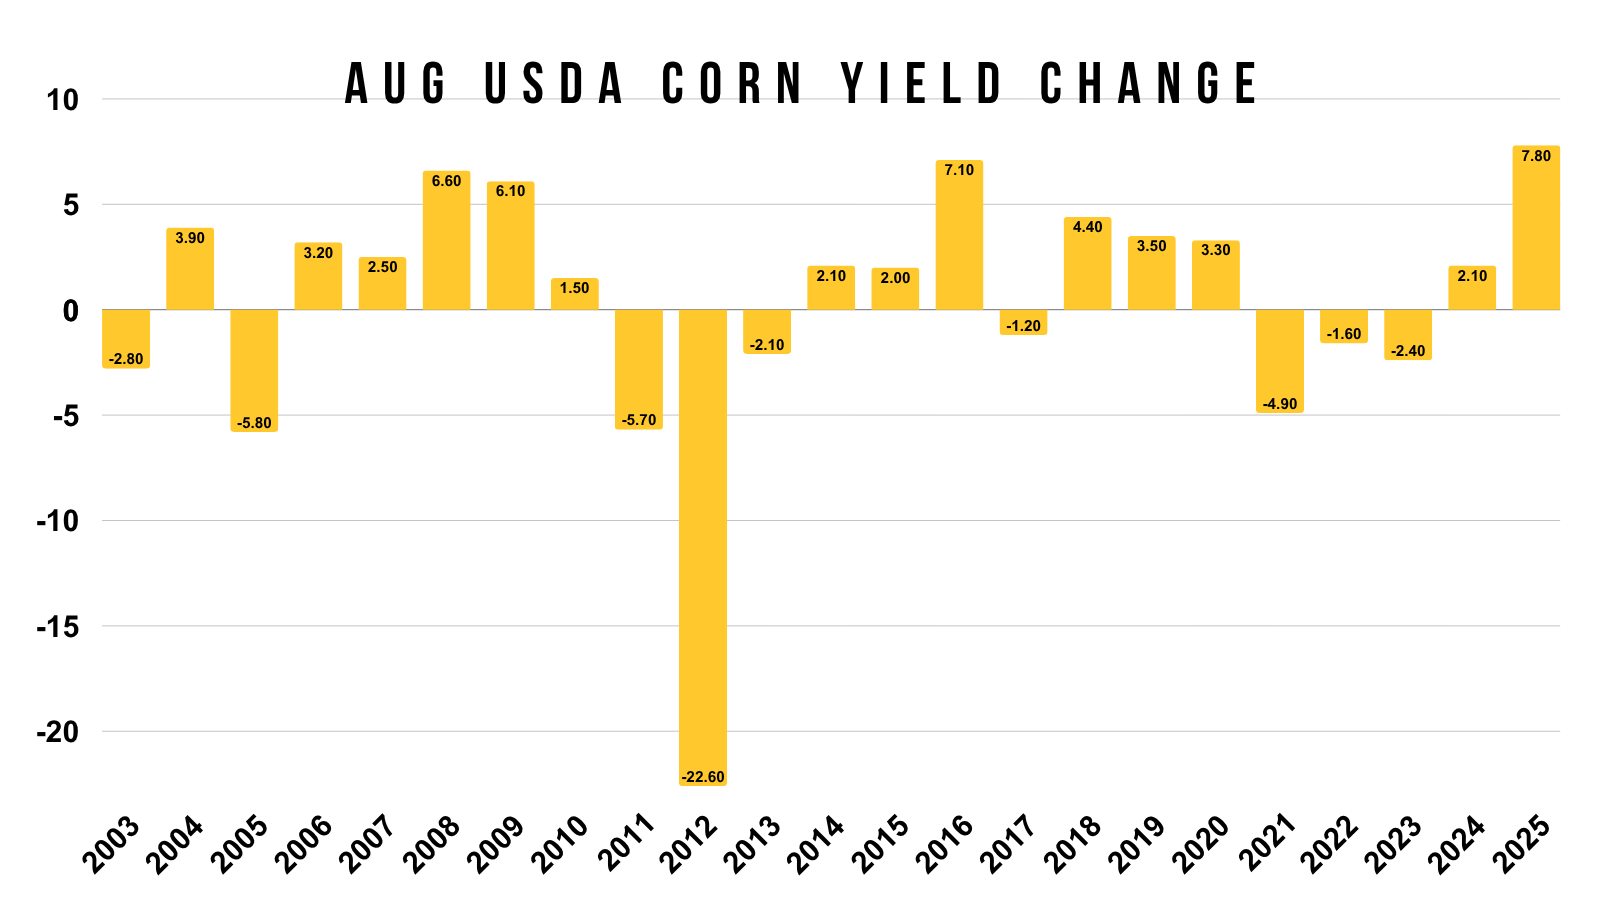
Here is the past yield changes from this report.
Corn:
We have never seen less than a 1 bpa change.
We started at 183. Which means if we continue this trend, yield is either going to be +184 or sub 182.
The USDA has only moved yield less than 2 bpa three times. (2010, 2017, and 2022).
The average move since 2012 = 3.40 bpa.
So we could see some big changes tomorrow.
The trade is only expecting a 0.6 bpa change tomorrow. We've never seen that small of a change before.
Soybeans:
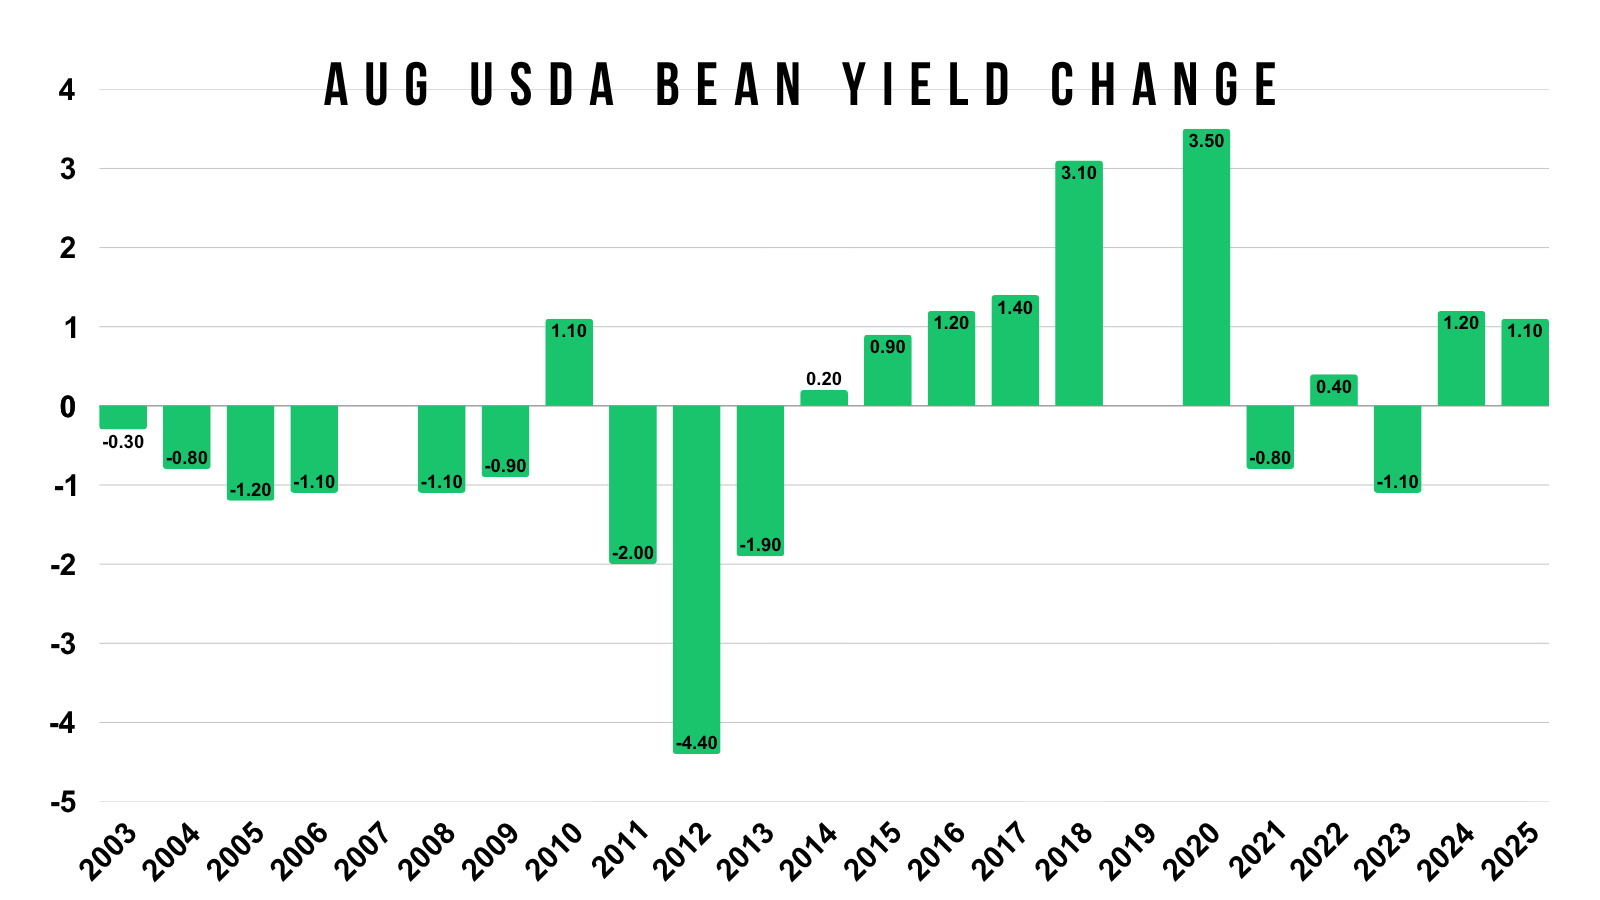
Here is the past August yield changes for soybeans.
We have seen yield move in all but two years since 2003. (2007 and 2019. In 2019 they made the rare changes in July rather than August).
Something to be aware of is that yield has increased in this report 9 of the last 12 years.
Average change since 2012 = 1.30 bpa.
Why I think corn yield is "eventually" below 183:
Based on years where ratings were this low, we have historically seen the USDA lower yield in this report.
The only time we've had ratings this low, yet the USDA raised yield in August was in 2019. Which is skewed given they made that rare cut in July.
However, we all know the USDA likes to play things slow.
So it would not surprise me at all to see them not lower it by much or maybe they actually even increase it slightly.
They just might not really have the data to comfortably make a massive adjustment lower this early.
I would love for them to give us a bullish surprise, but I just have my doubts they give us the real yield this early as we all know how they tend to operate.
I think we'll see lower yields once they get into the fields, which I'll go over next.
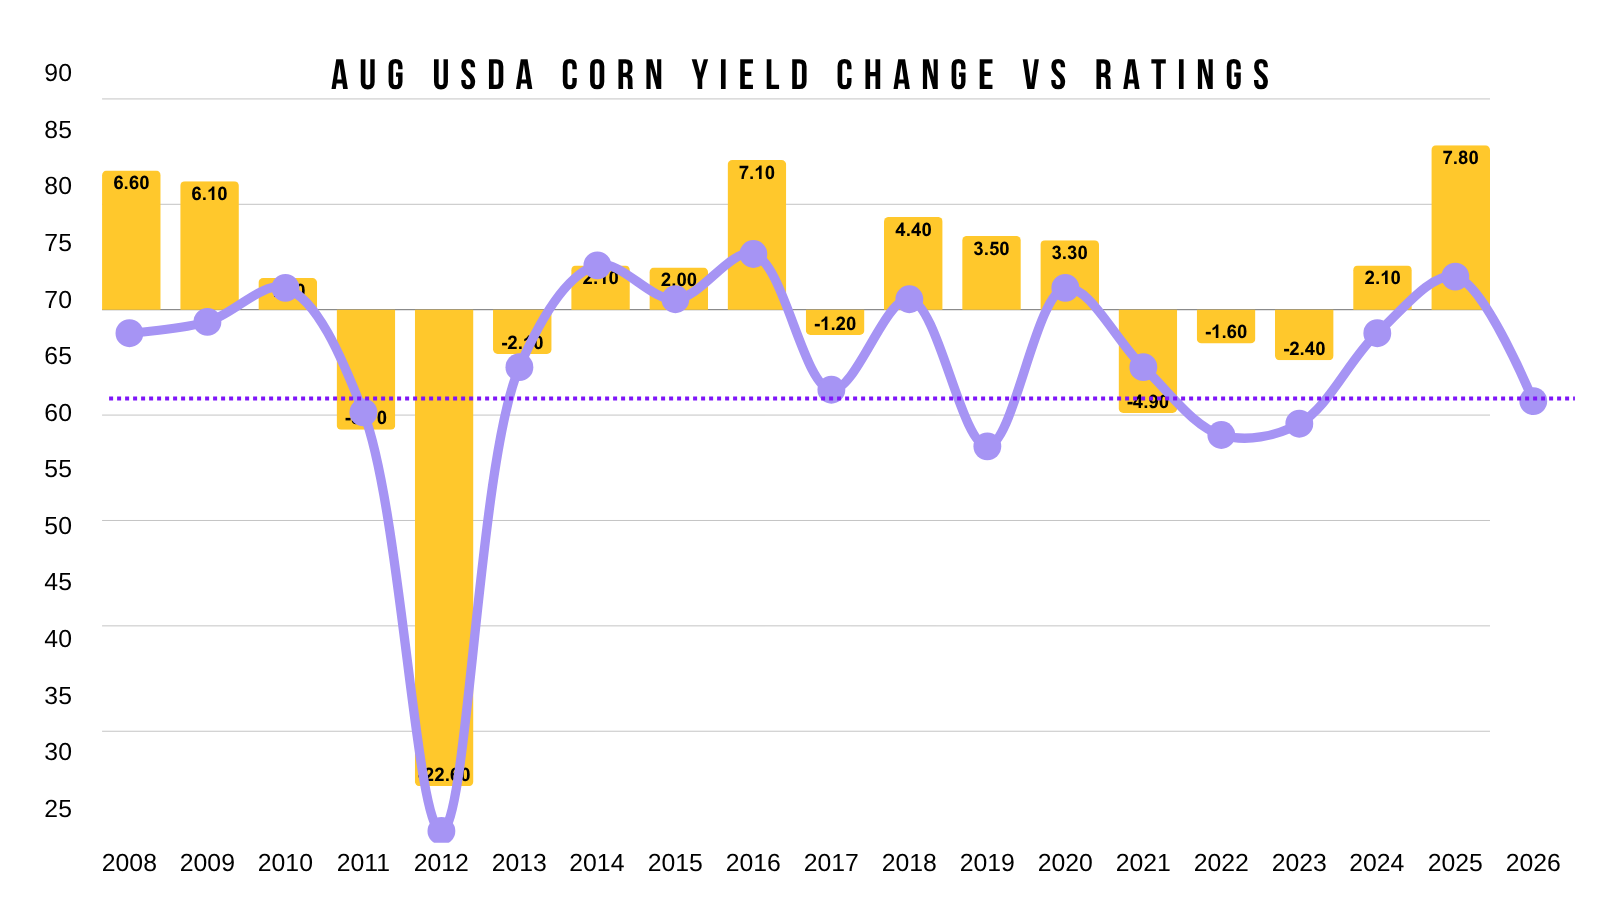
I've shown this data the last week or two.
This is the current crop ratings for today's date vs how yield changed from the starting numbers.
There is a pretty decent correlation here.
Most years where ratings were good, resulted in above trend yield.
Most where ratings were bad, resulted in below trend yield.
The only two years that defied this data were 2017 and 2020.
2017 had poor ratings yet above trend. 2020 had good ratings yet below trend.
Which brings me to my next set of data.
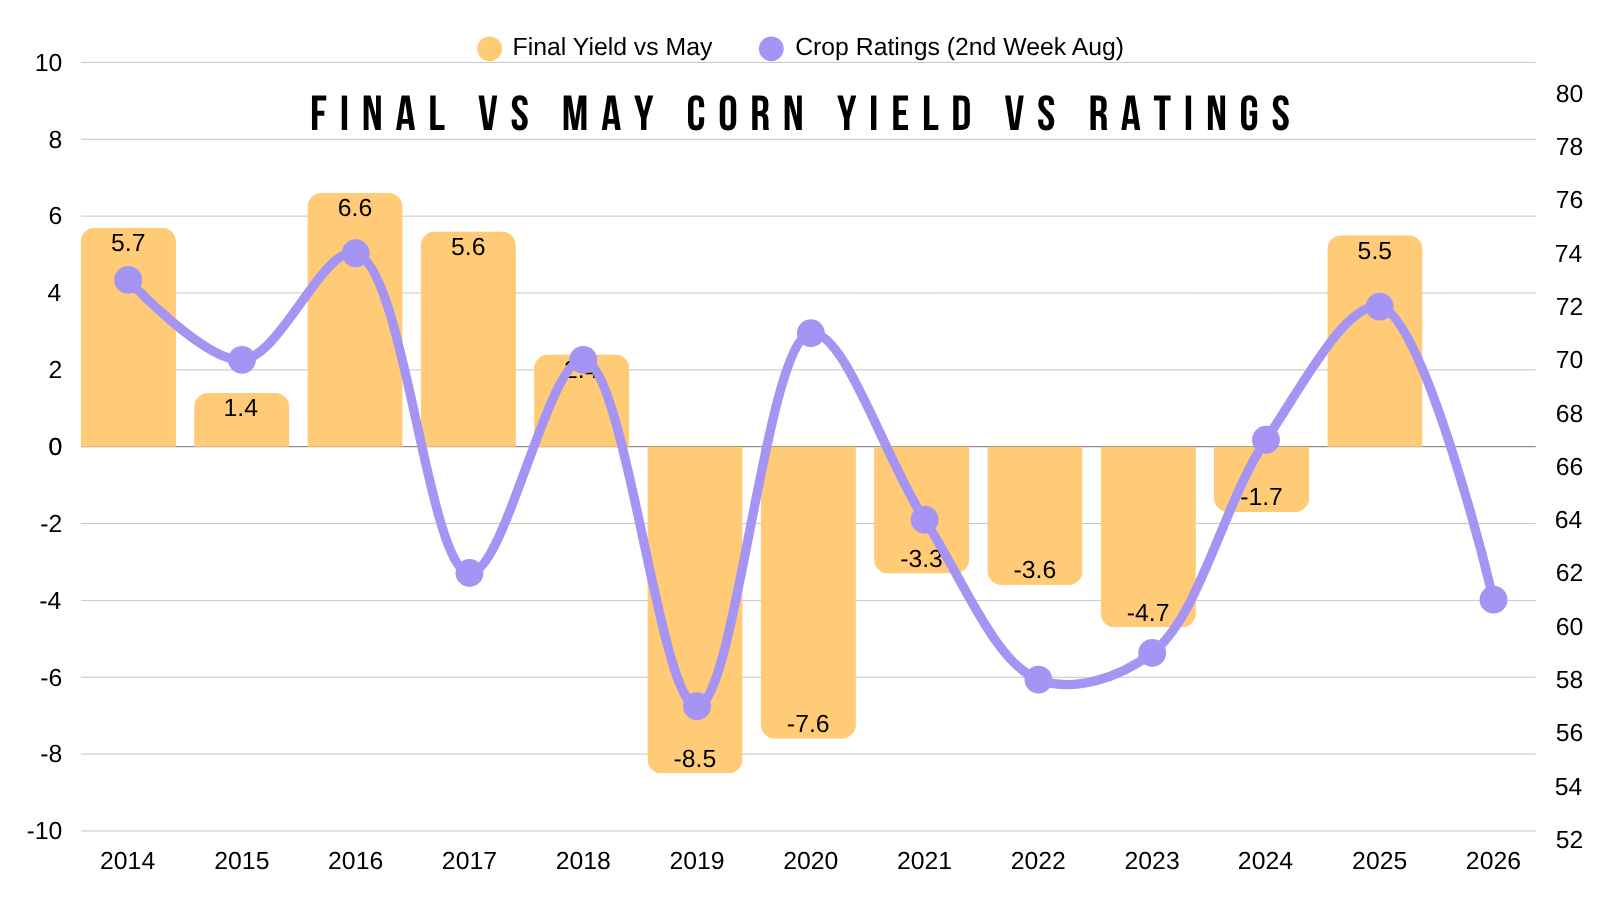
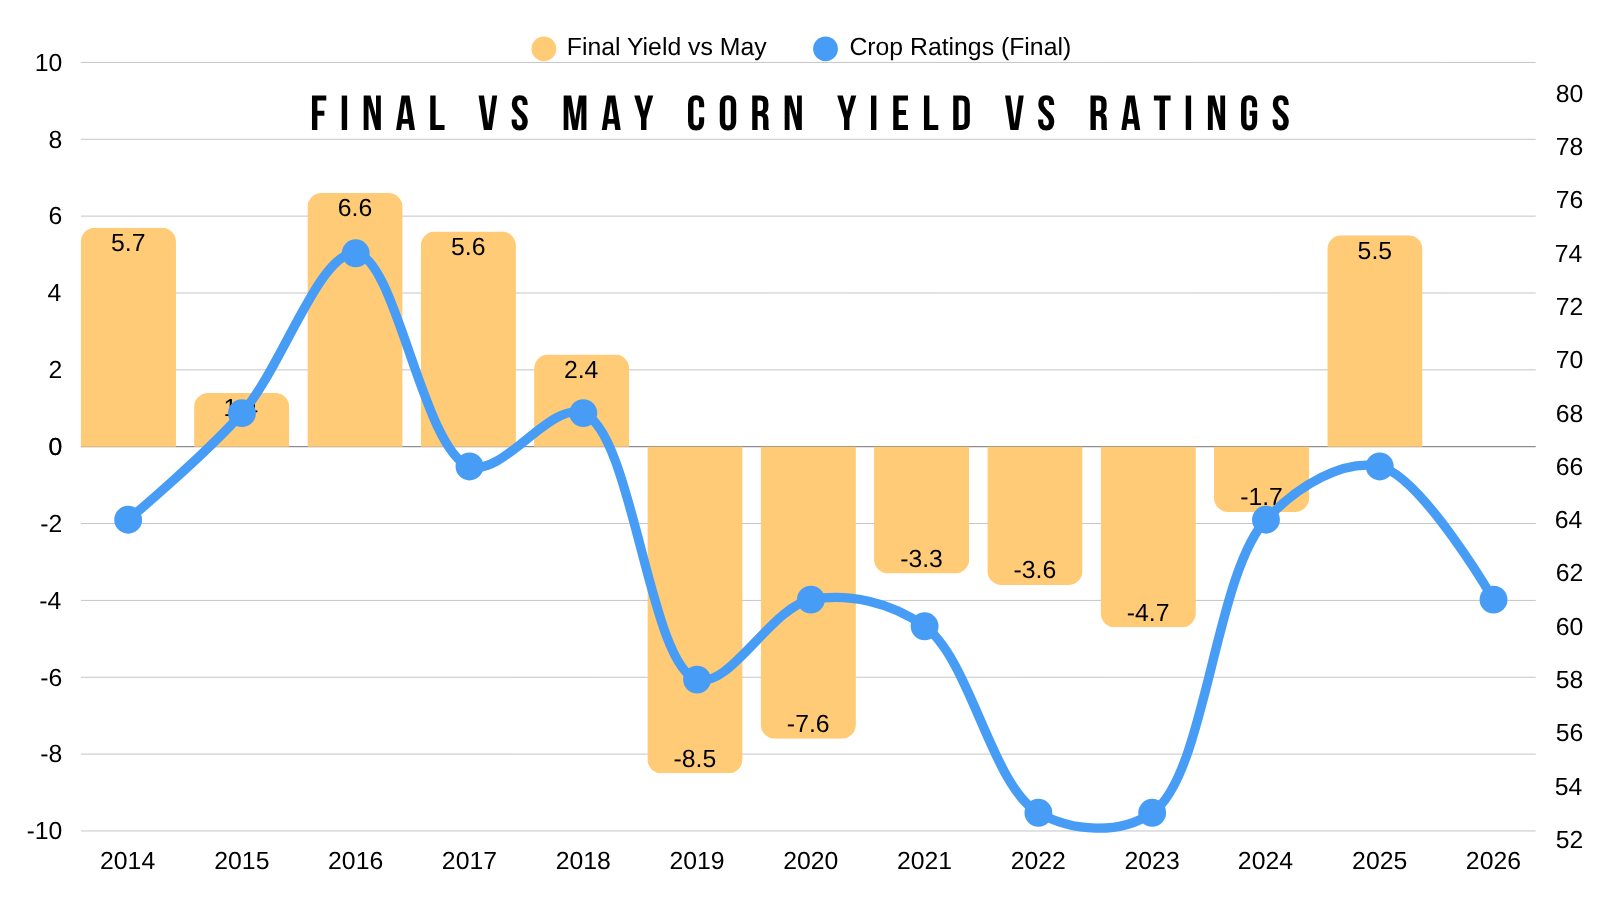
Here is the final crop ratings vs how yield changed from the start.
So instead of using today's date, I used the last crop ratings.
This one provides an even more compelling arguement.
In the data set before, 2017 and 2020 were outliers.
But in this set, the data corrects.
2017 we saw conditions improve. Yield was then above trend.
2020 we saw conditions fall a lot with the end of year issues. Yield was then below trend.
So based on this, unless crop conditions improve, you would expect yield to be below trend.
If condtions improve like we saw in 2017, then perhaps you could achieve above trend.
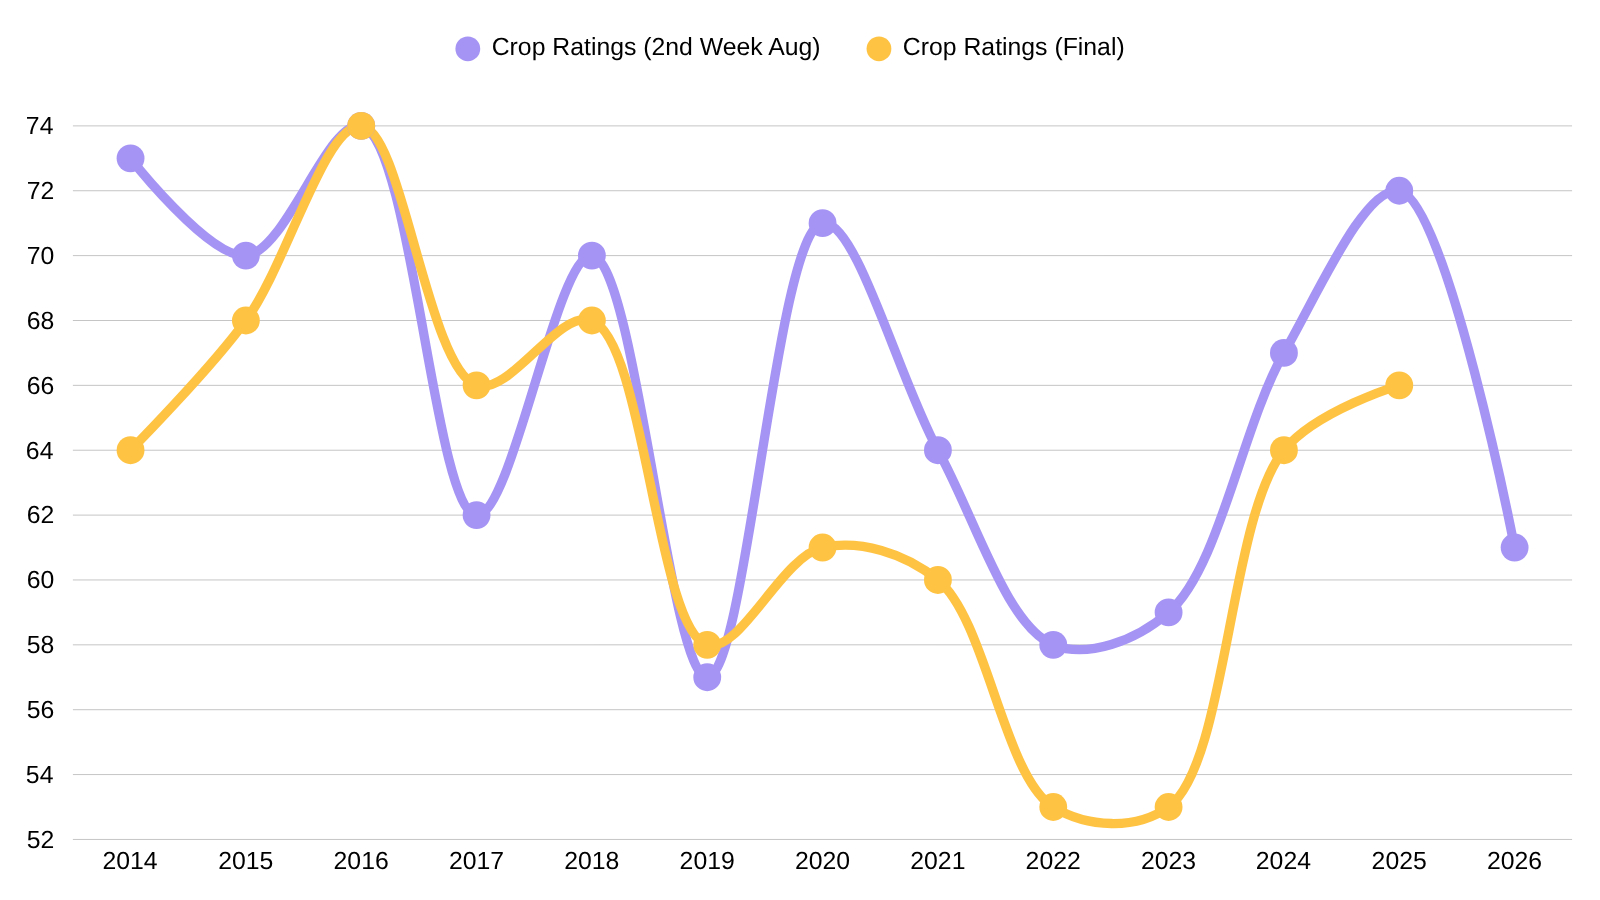
But historically, crop conditions tend to decrease heading into harvest and as we progress through the year.
Here is today's ratings vs the final ratings.
Final ratings haven’t been better than today's ratings since all the way back in 2019.
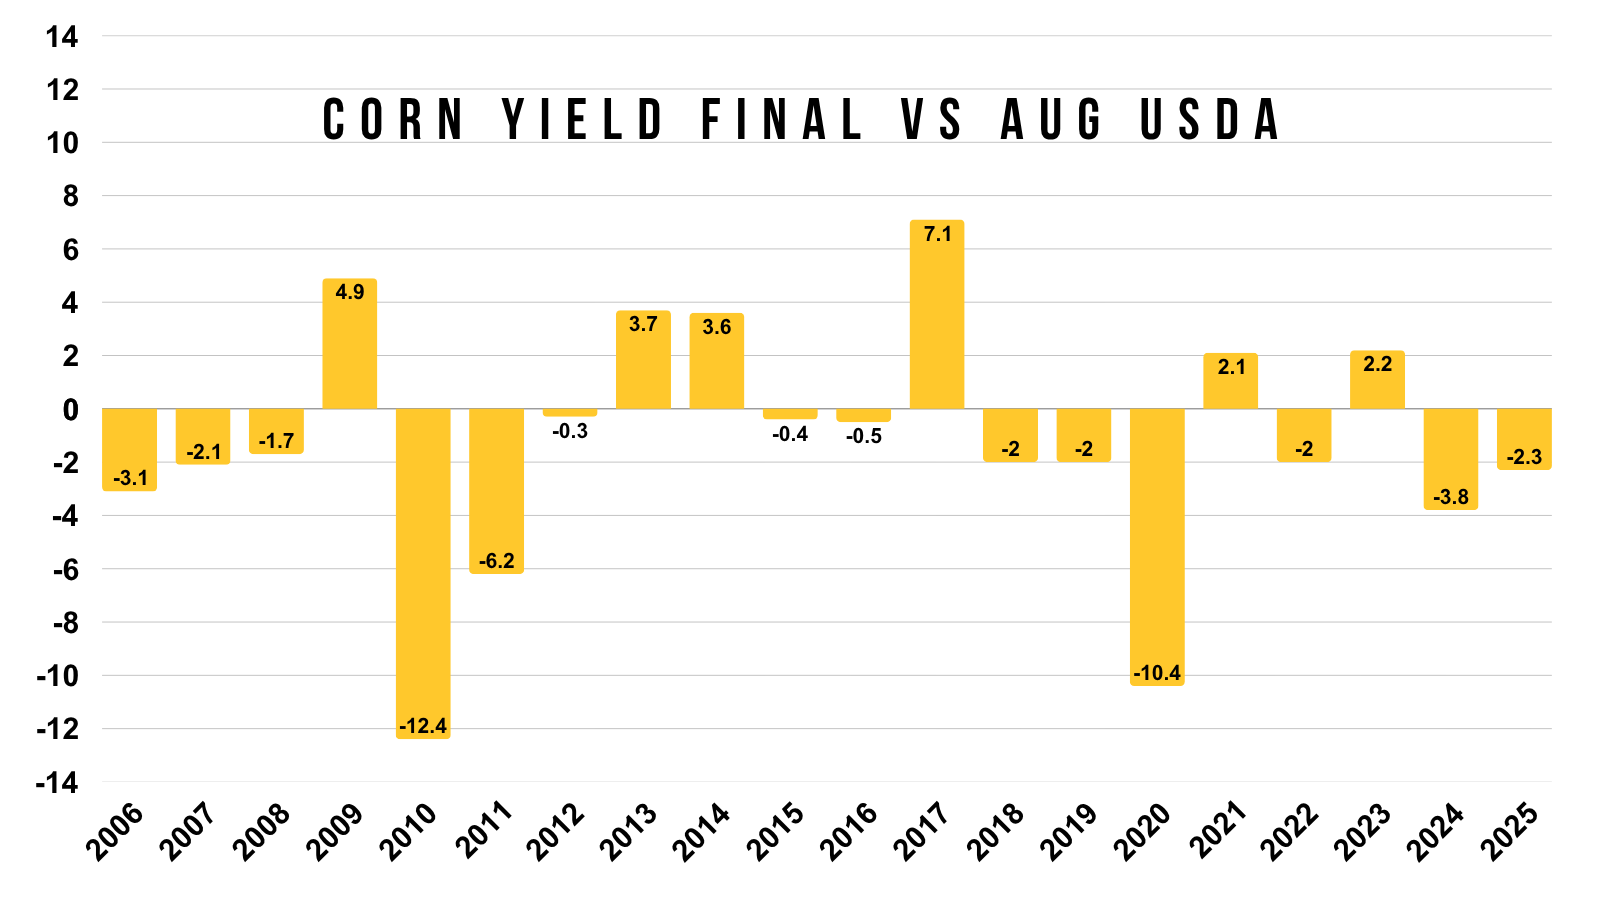
Here is how yield has changed from August to final.
This again supports the arguement that the USDA probably does not give us the true yield tomorrow.
As most years, the final is at least 2 bpa away from the August number.
The August number has only came within 1 bpa of the final yield three times. (2012, 2015, and 2016).
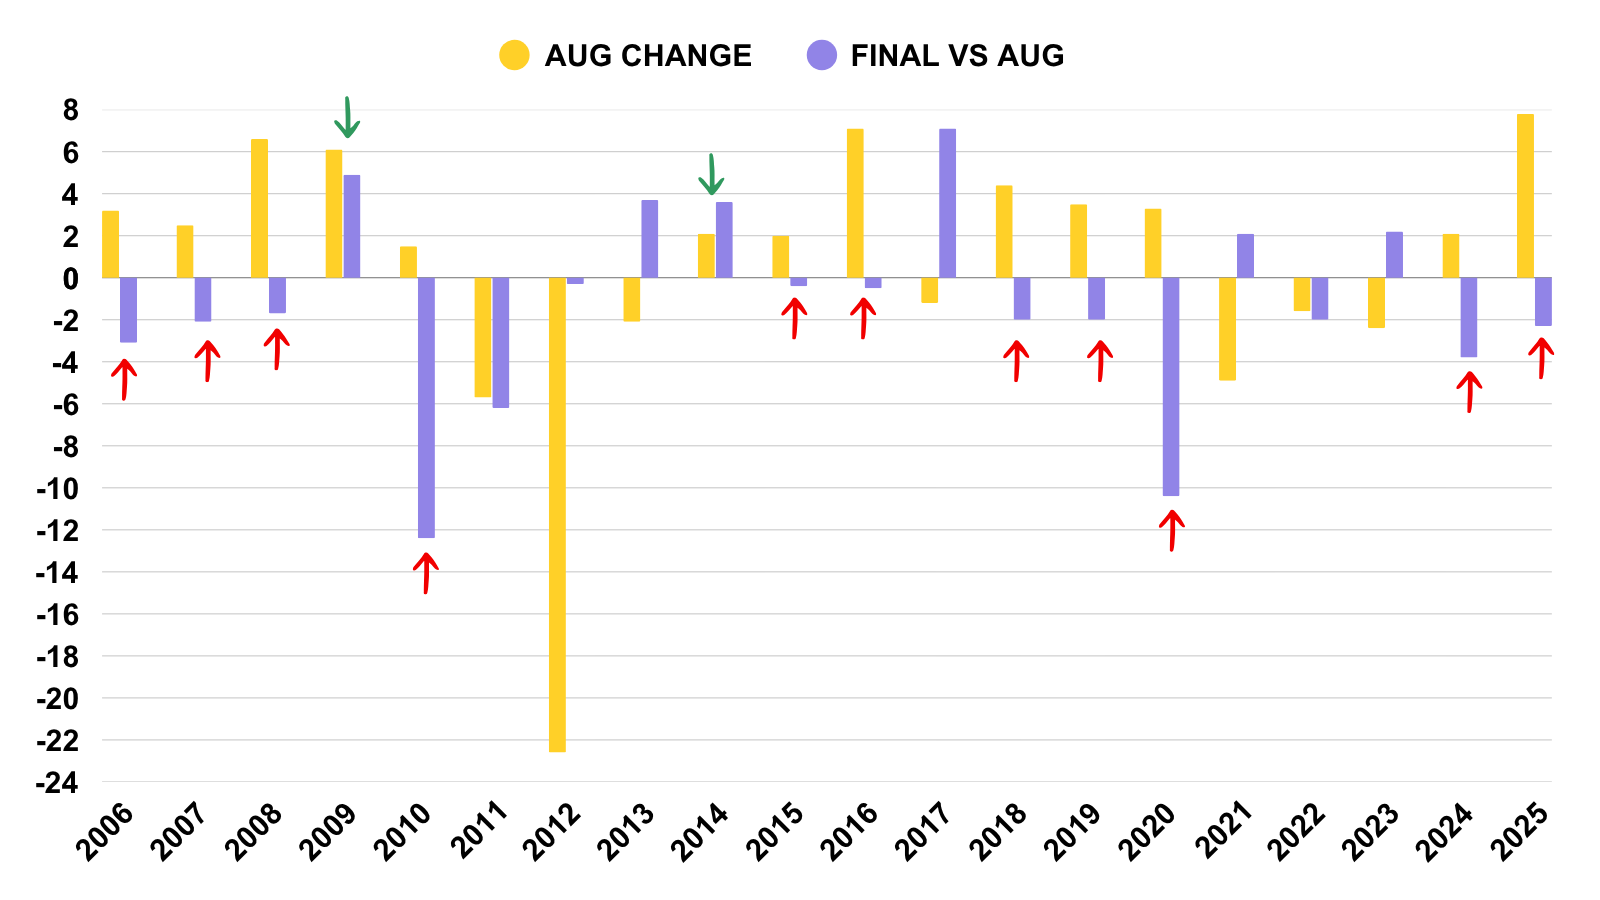
If you narrow down the data further.
In years where the USDA raised yield in August, the final yield was ultimately lower in 11 of 13 years.
So if the USDA raises it tomorrow, odds favor it coming down later on.
(Higher yellow bars are typically followed by lower purple bars. Indicating higher Aug yield but lower final yield).
Bottom Line for Corn Yield:
So all in all, who knows what the USDA has in store tomorrow.
Either way, I think we come in below 183 when it is all said and done later on. It just might not be tomorrow.
I could of course be wrong, and yield ends up in the realm of 185 again, but that's my thought process and take.
What the USDA comes up with tomorrow and what they say come January are going to be two completely different things.
There is always the chance that the USDA simply kicks the can down the road until they see where ratings go from here, and whether they improve or continue to fall.
As they might not have the data they need to make a major concrete cut to yield this early just yet.
Maybe they come in with a StoneX 185 type of yield. That doesn’t mean that's our final yield.
Overall, I have high hopes but low expectations going into the report.
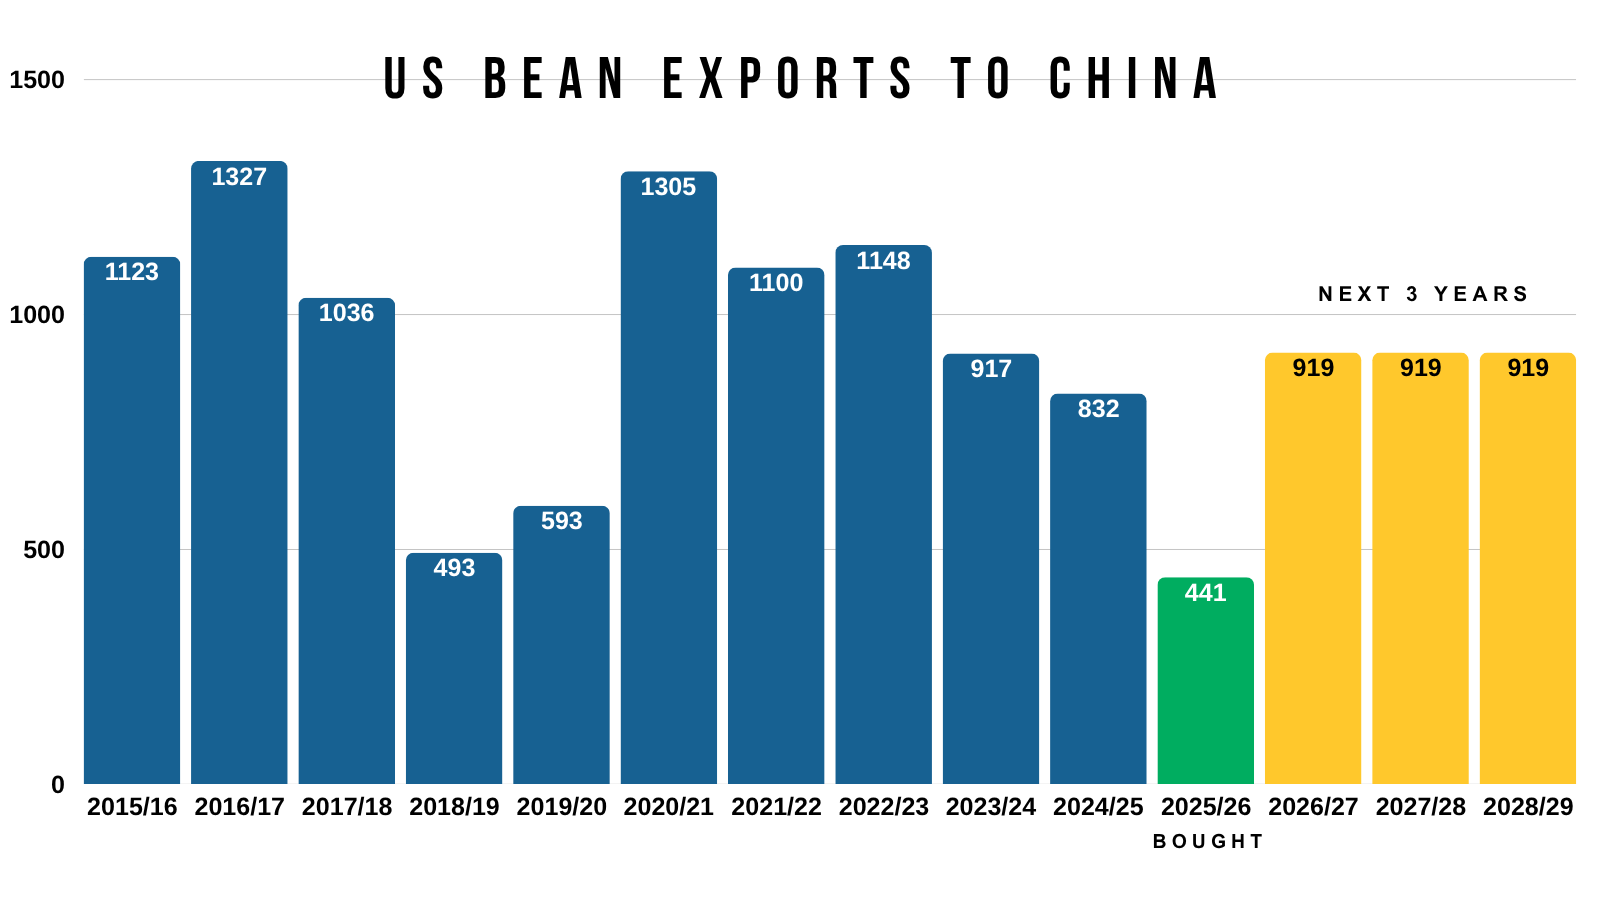
Long term soybean demand market?
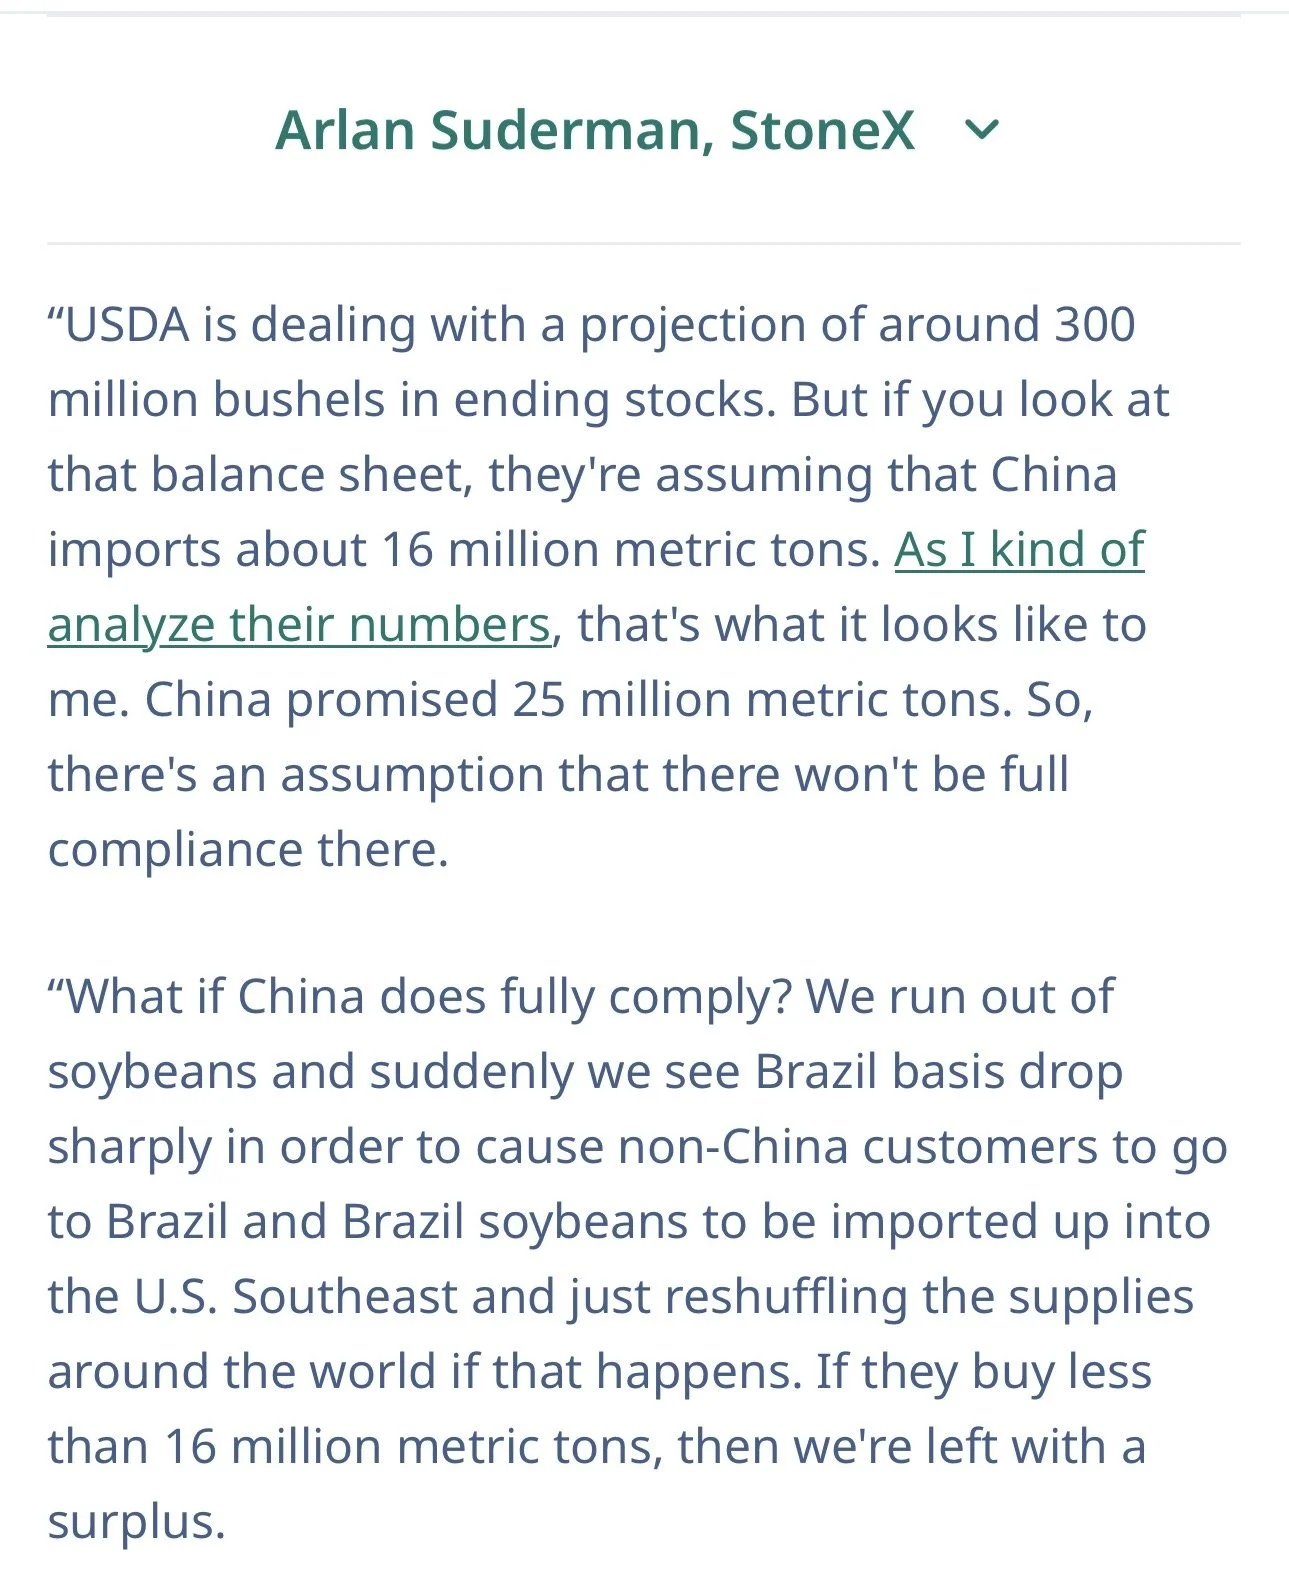
I saw this interesting snippet from Arlan Suderman regarding soybean exports to China.
He said the USDA is assuming China is only going to buy 16 MMT of our soybeans this year.
If you remember, China agreed to buy 25 MMT.
Below is what he had to say on farmprogress.com
How did he find this number?
As it is not explicitly labeled in the USDA report or on the balance sheets.
The way you find this:
The USDA expects total US soybean exports to be up 3.8 MMT vs last year.
Old Crop Exports: 41.37 MMT
New Crop Exports: 45.18 MMT
Increase: 3.81 MMT
China bought 12 MMT of old crop.
12 + 3.8 = 15.8 MMT.
So the USDA roughly expects China to buy around 16 MMT assuming that exports to every other country remain the same.
Why is this is a big deal?
Well if China actually bought 25 MMT. That would be 9 MMT more than the 16 MMT USDA is currently implying.
9 MMT eqautes to roughly 300 million bushels.
(1 MMT = 36.5 million bushels)
If you added those exports to the balance, our carryout would mathematically be zero. Given our carryout is 300 million.
Which clearly cannot happen.
So if China did buy all of those beans, we would need to see demand rationing.
Prices would need to go higher to justify losing the non-China demand.
The USDA isn’t going to account for this tomorrow in a big way if at all, but this is a very plausible friendly factor when taking a long term view on this market. As this would be one way to get into a demand led market.
As unless we see some type of monster production here in the US, we simply just do not have the soybeans to meet that demand on top of record crush demand that isn’t going anywhere.
And I personally think that when it's all said and done, China is going to buy what they agreed to buy.
Again, this is a LONGER term factor. This won’t matter tomorrow. So there are still short term risks.
We'll go into this in more depth another time, I just think soybeans have a pretty solid story going for them in the long run.
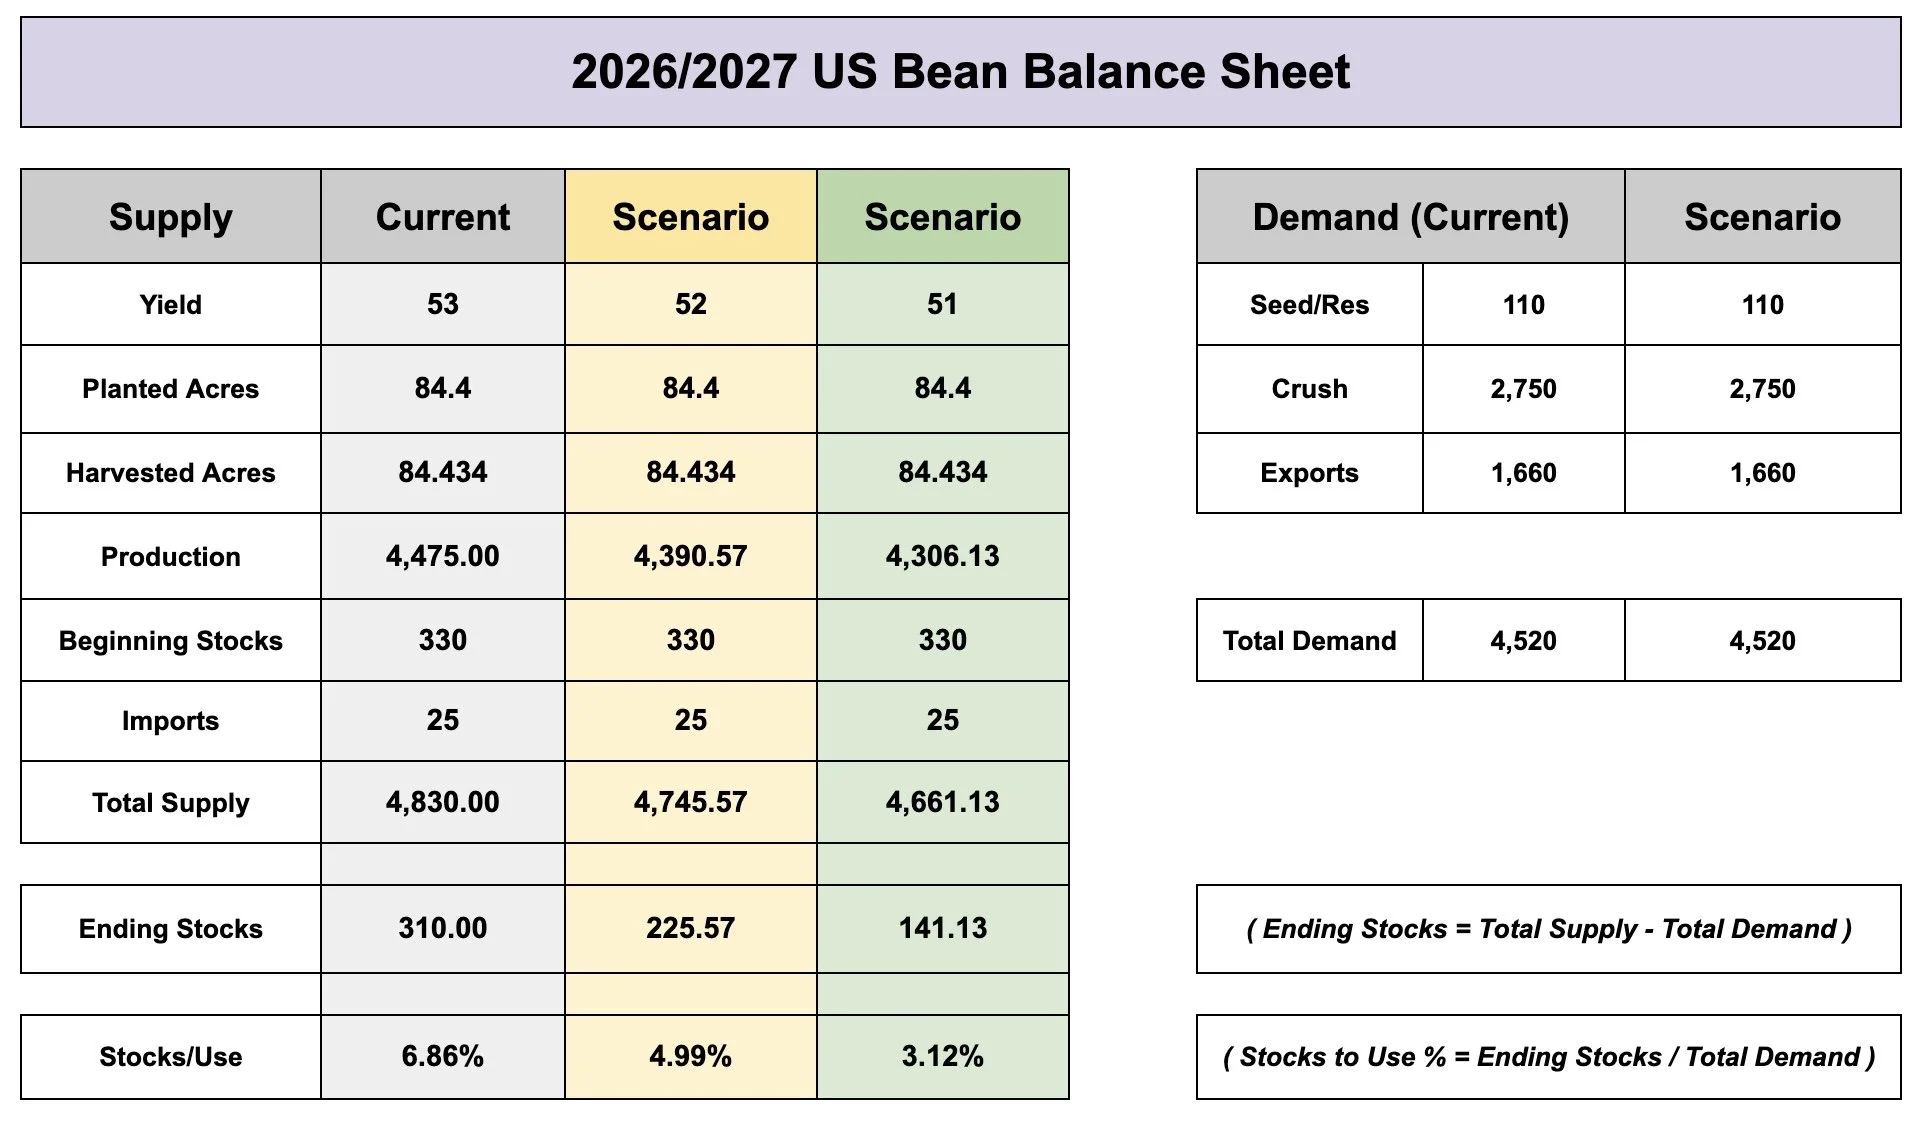
As for tomorrow, any yield below 53 would be very bullish for soybeans.
Simply given how tight the room for error is on the balance sheet.
Is that going to happen tomorrow?
That is anyone's guess. I'd argue the USDA likely doesn’t make any big adjustment lower this early. But I'd love to be wrong.
Honestly it wouldn’t shock me to see them bump the yield slightly to give themselves some room to work with later on.
Guess we will find out tomorrow.
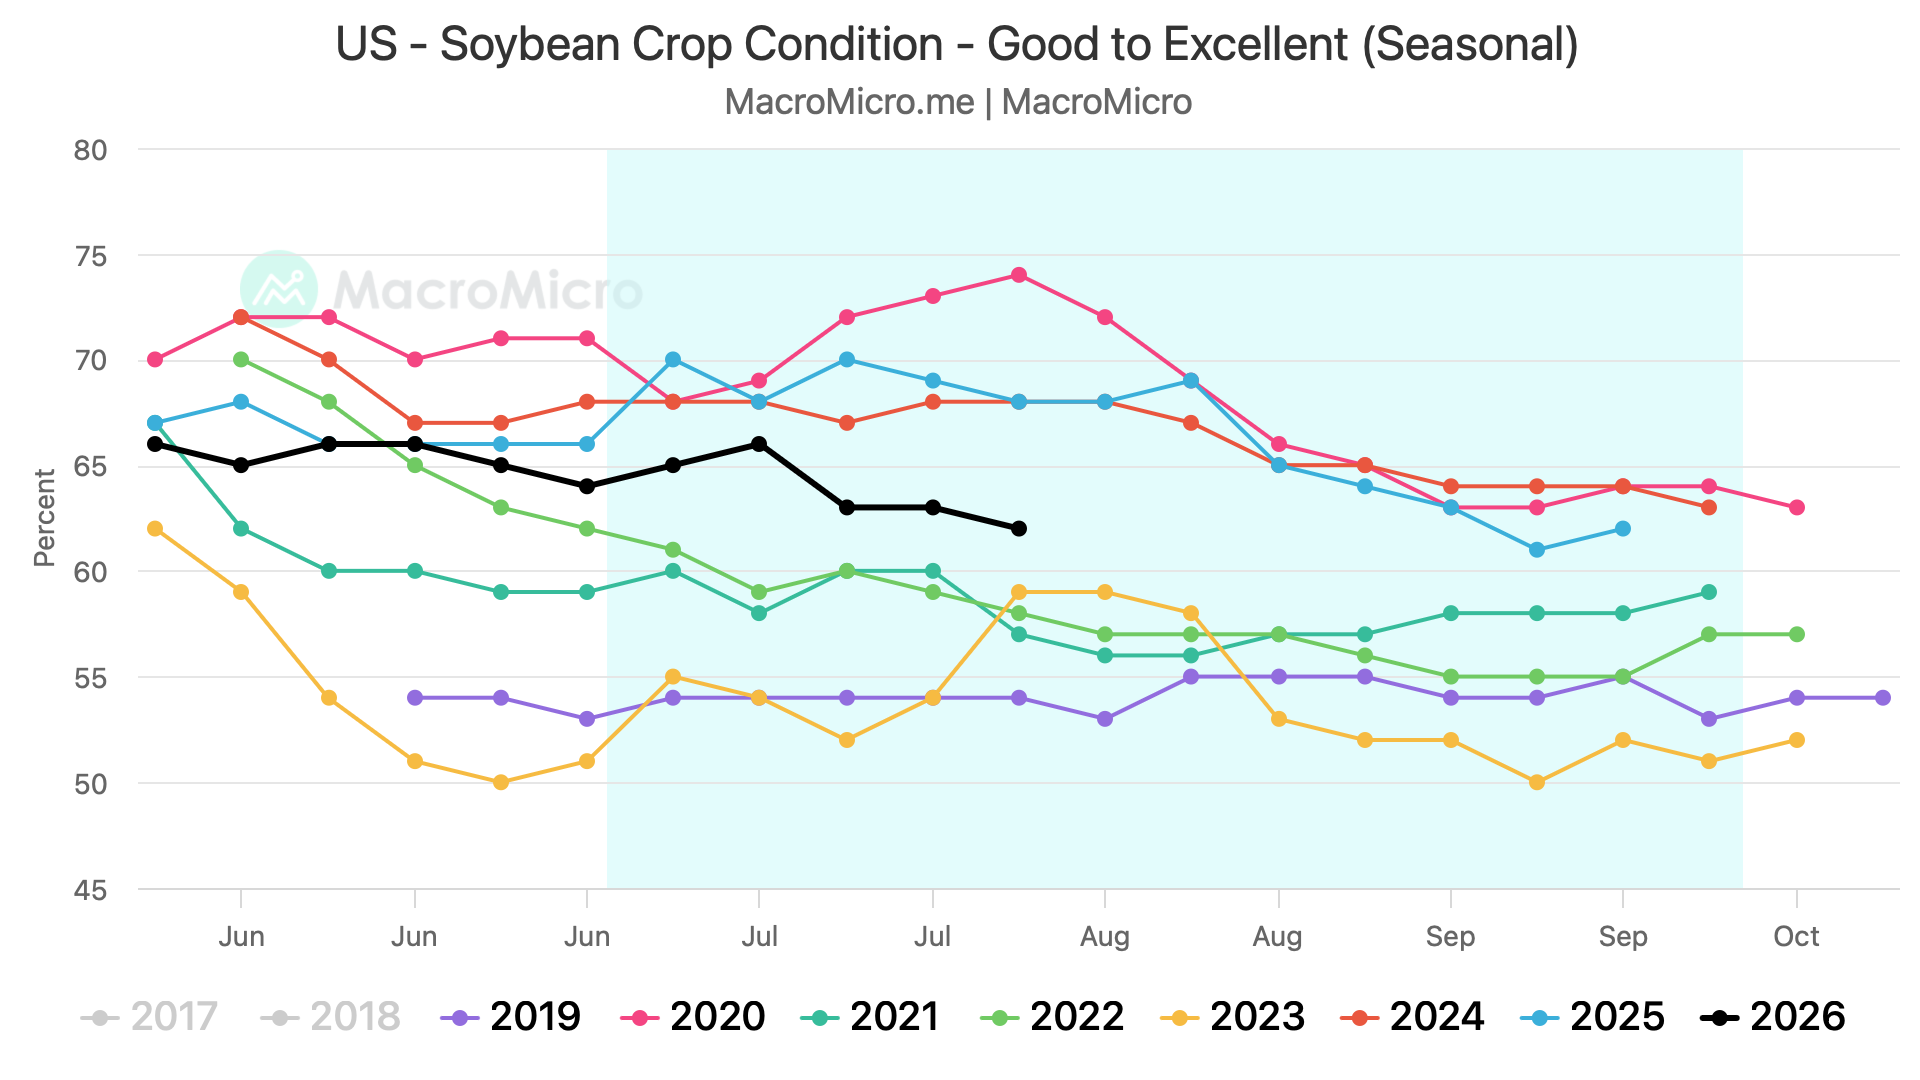
Soybean ratings are far worse than they were last year.
So I don’t know why yield would have to better than last year at the end of the day.
As these crop ratings don’t scream record yield better than last year.
But the USDA can say whatever they want tomorrow, and that's the numbers we have to work with.
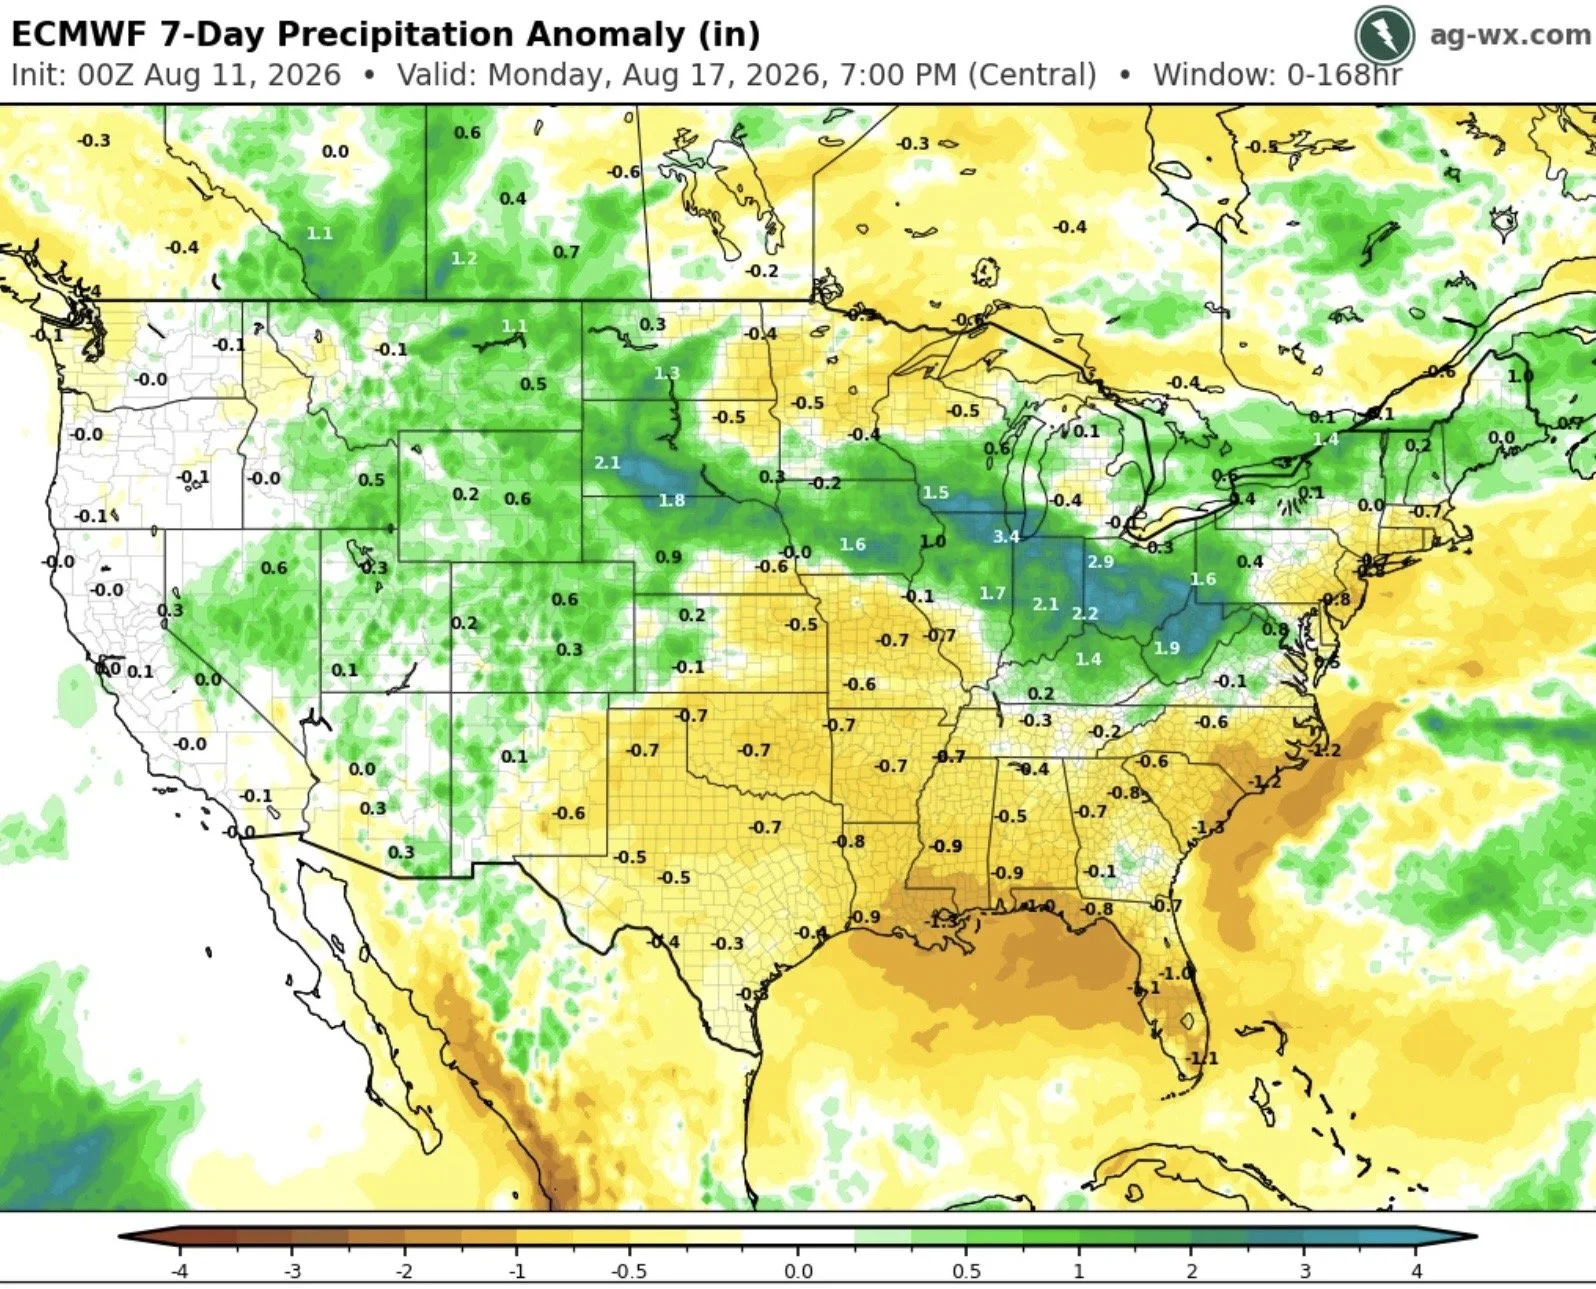
Weather Isn’t Bullish Right Now:
We do currently have plenty of rain in the forecasts.
So this is not bullish short term for soybeans.
With rain smack dab across the heart of the corn belt.
Charts
Corn
Dec Corn Chart:
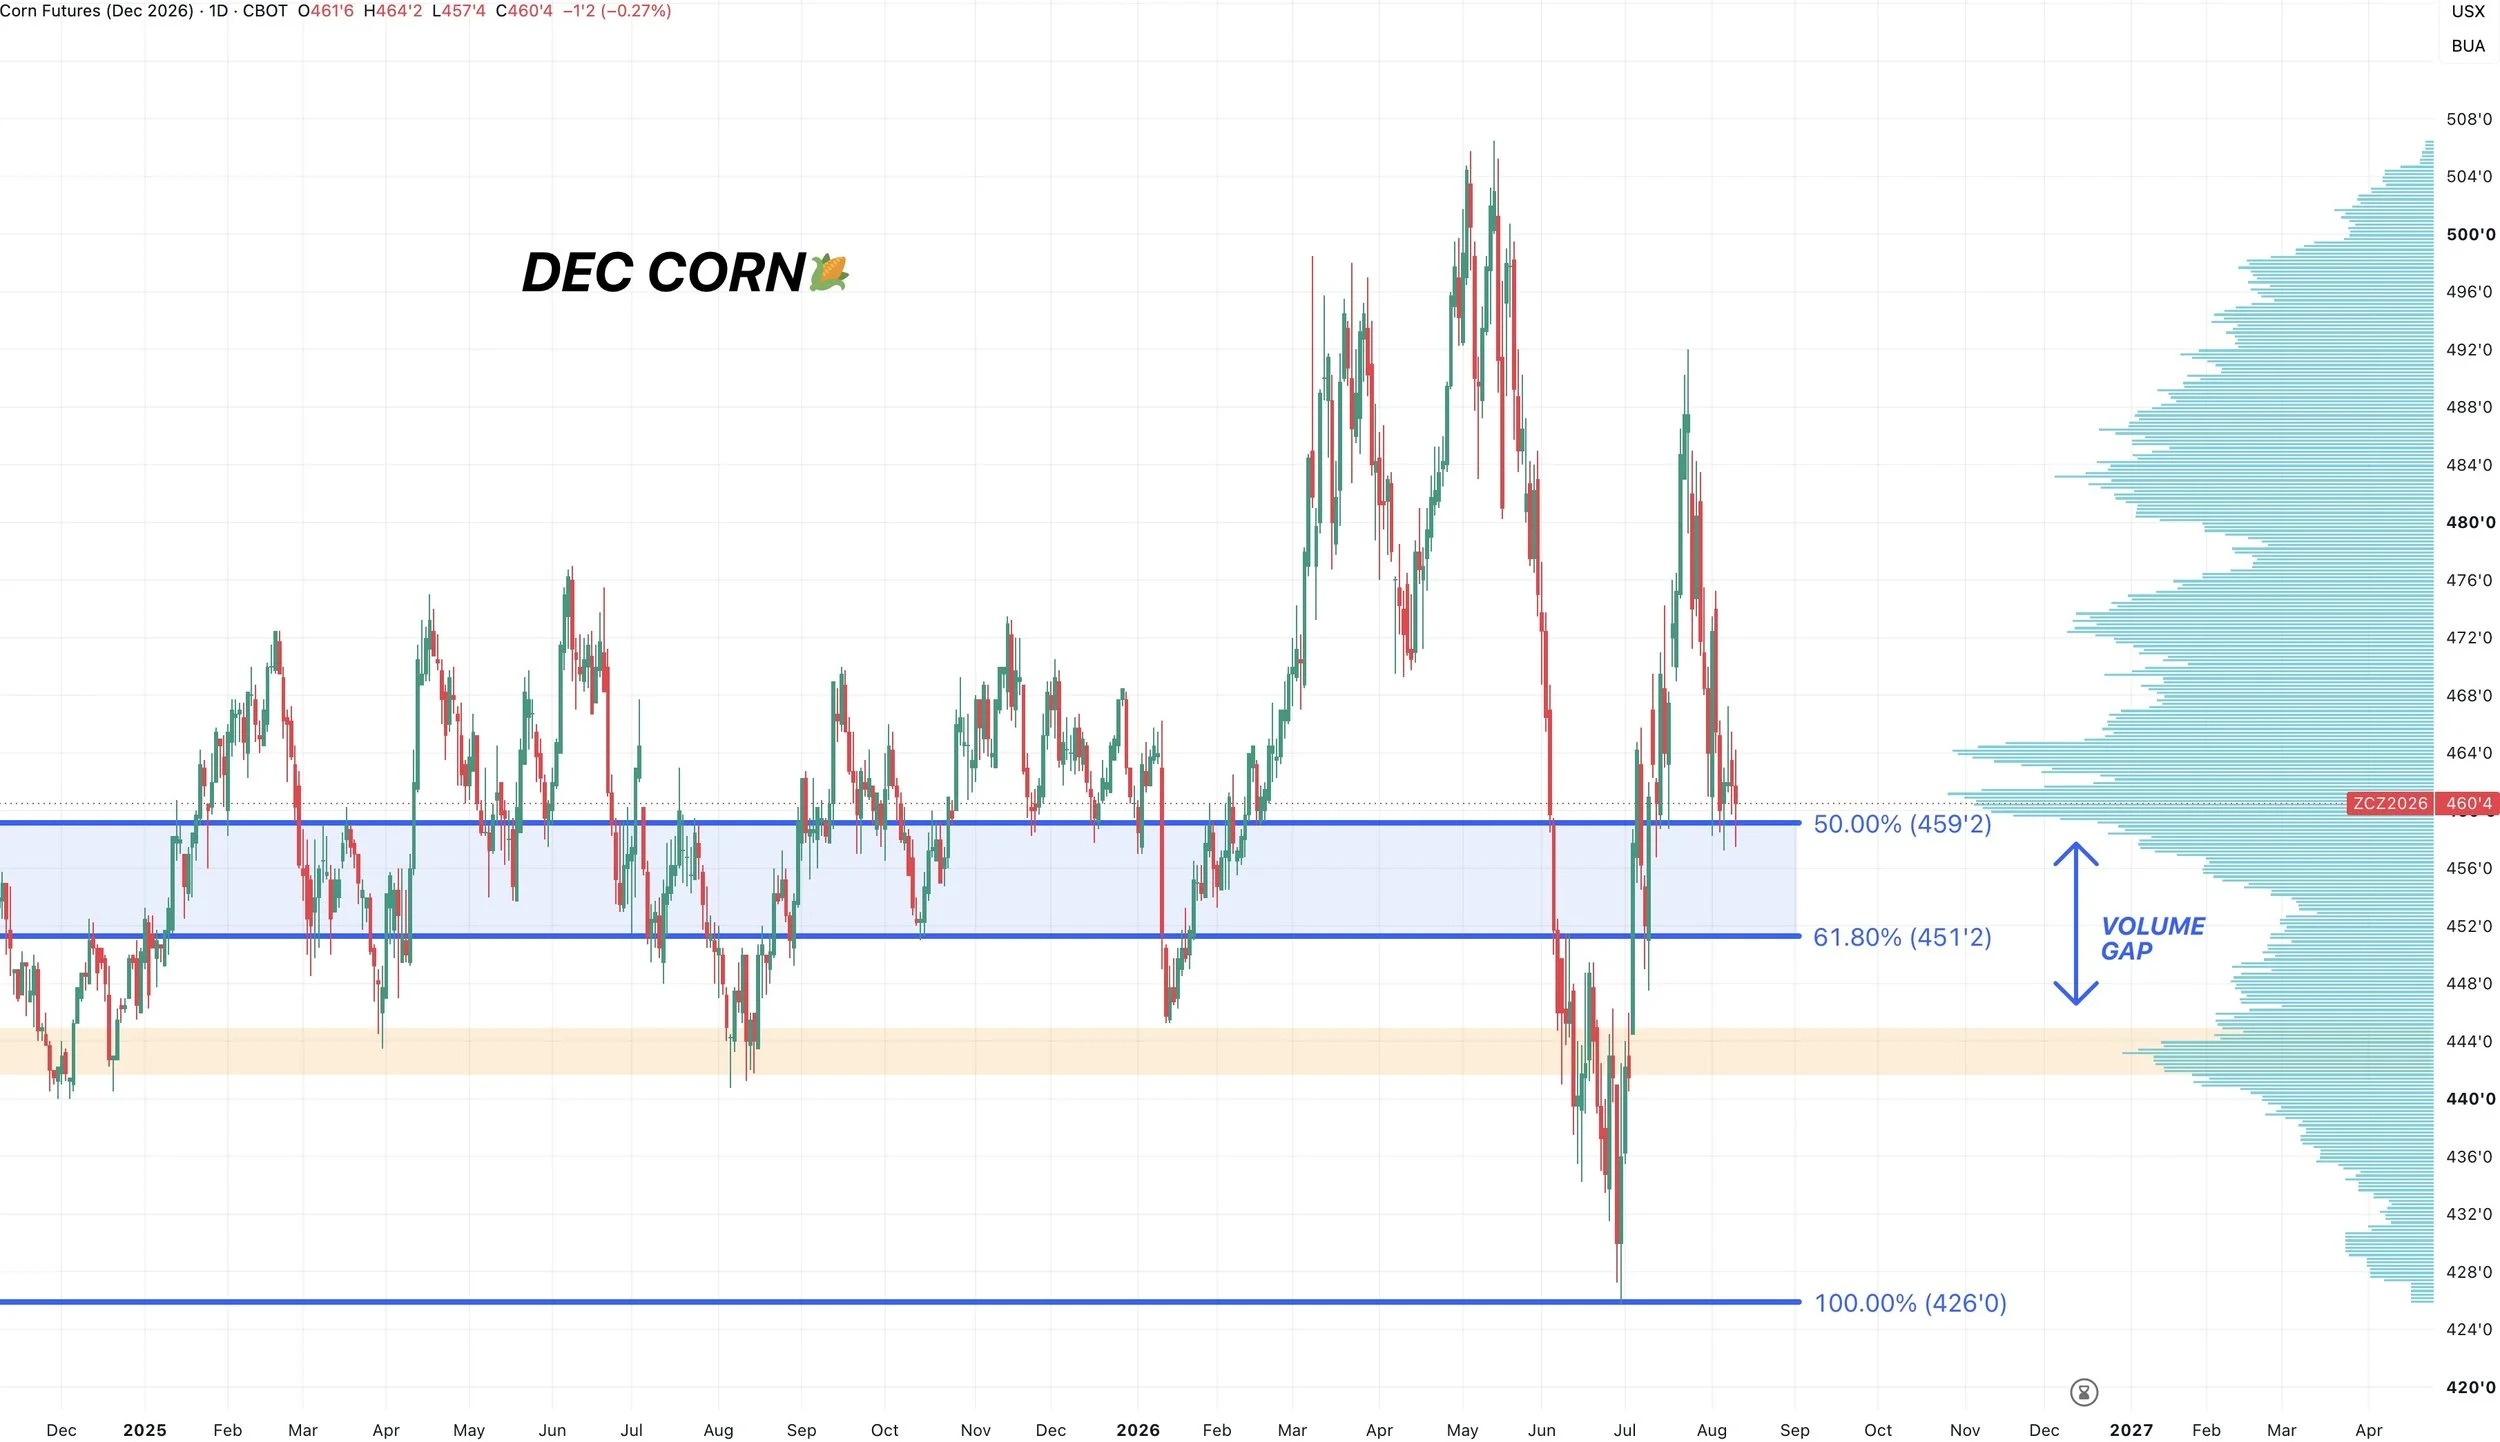
The biggest thing to watch is this golden zone.
Let's say we do get a bearish report tomorrow.
If we are not able to break below that $4.51 level at 61.8% over the next week or so, that would be a very friendly sign.
This zone is the most common level for a normal pullback to end. And would be considered a "buy zone".
On the other hand, if we do break below that 61.8% retracement from the contract lows, it would open the door lower potentially towards those contract lows.
But unless we break below that level, my bias does lean higher and I would personally expect to bounce between here and $4.50
Either way, I am remaining patient on sales here. I am not interested until we're closer to the top end of the range.
Ideally, we would like to see us hold here at the 50% level. As we are currently sitting at peak volume. If we lose this level there is a volume gap to the downside meaning there isn’t a ton of support.
Sep Corn Chart:
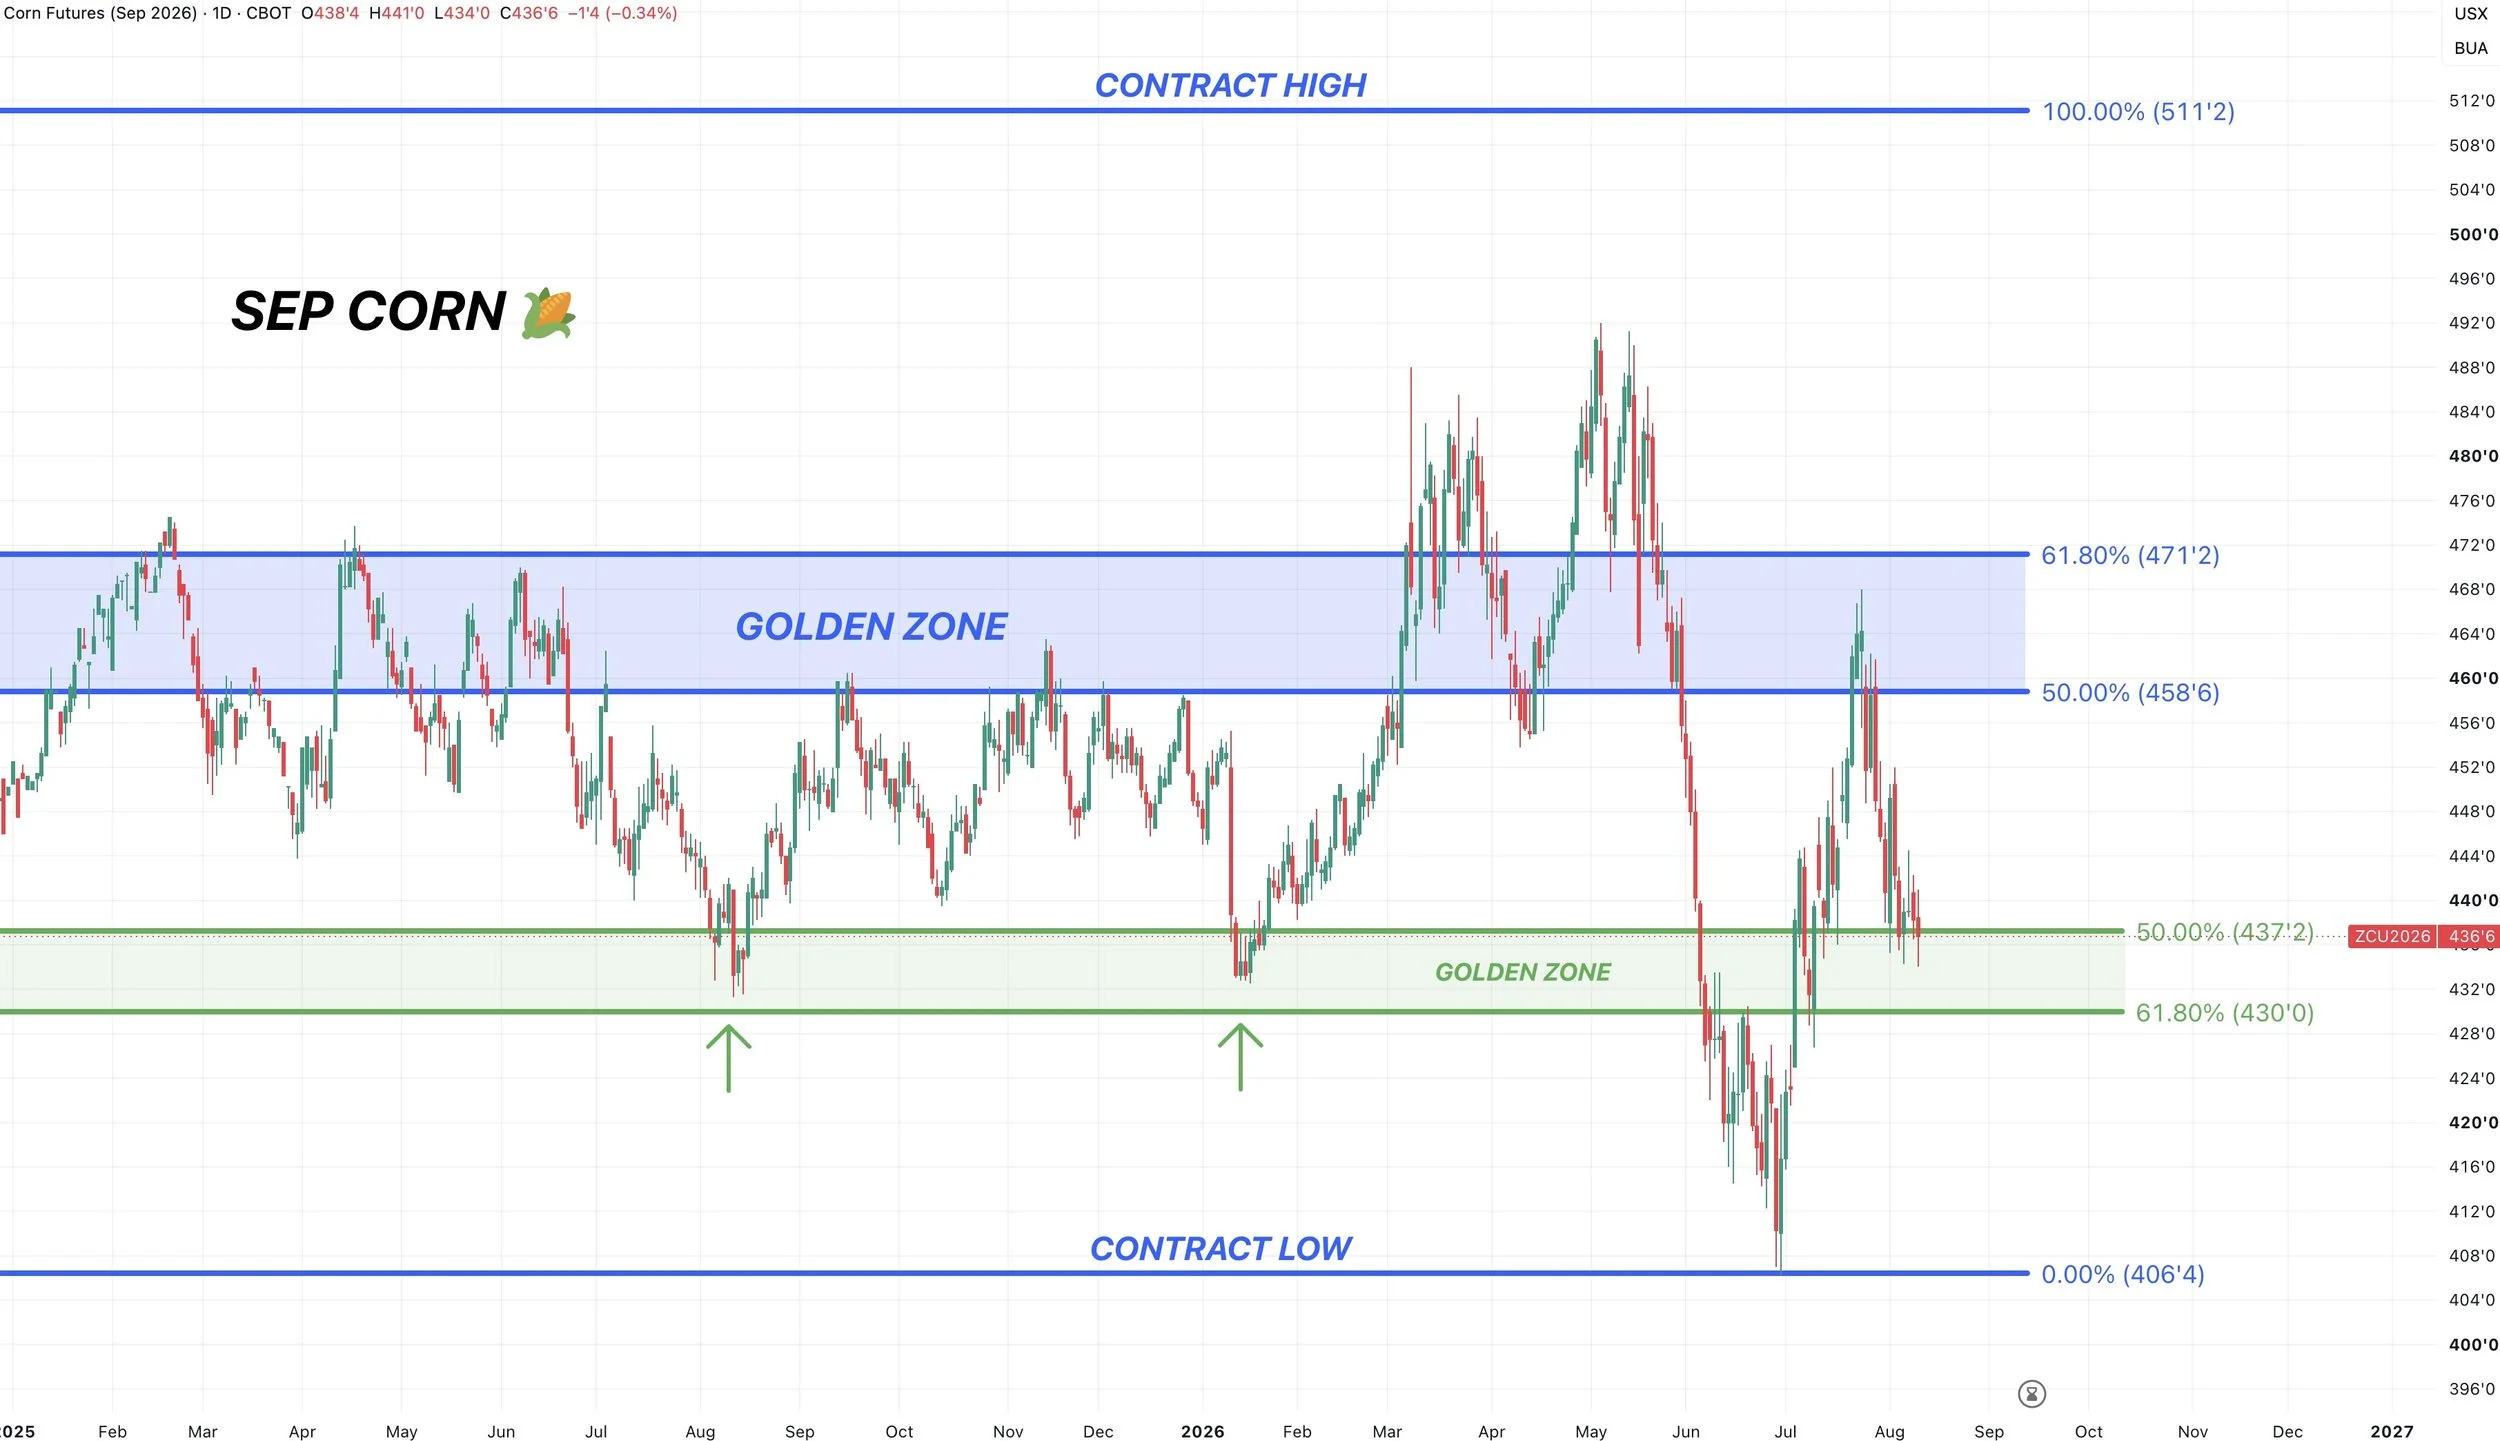
Same story here.
Just need to see us hold the 61.8% level at $4.30
This golden zone has marked two major bottoms before as well.
So it's a pretty clear key level heading into the USDA report.
Soybeans
Nov Beans Chart:
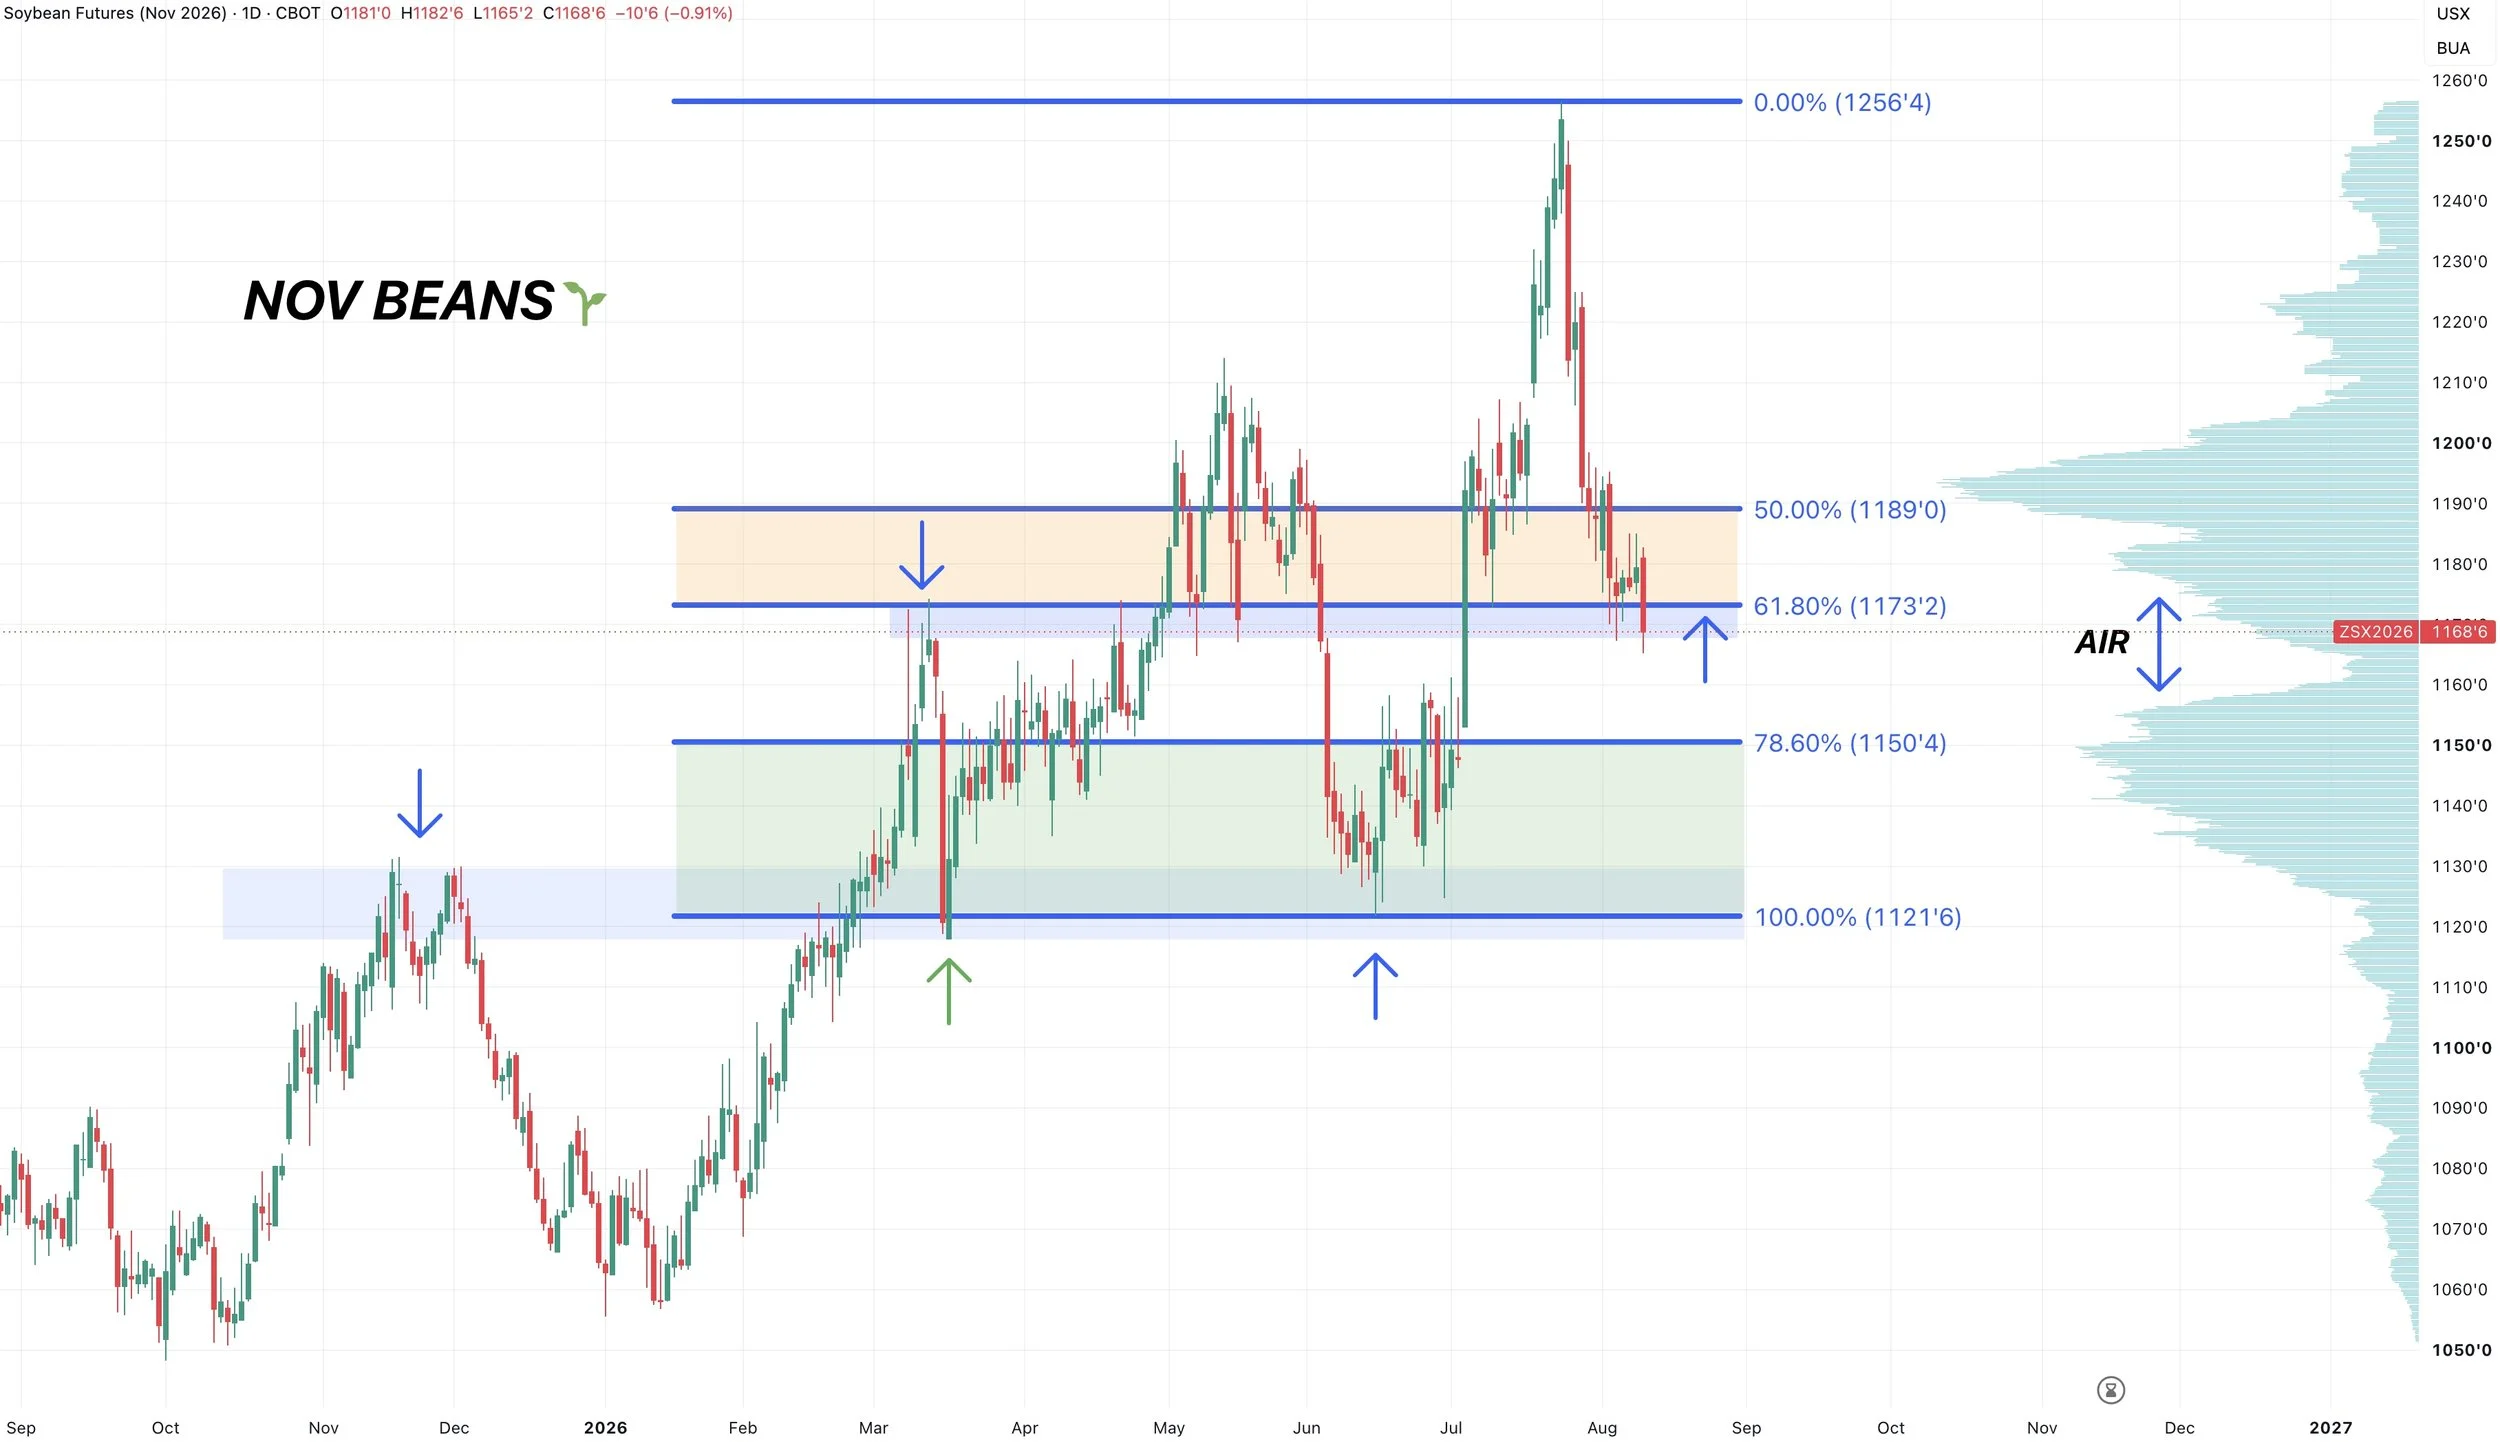
We are sitting right at key support still.
But we are on the verge of breaking down.
We closed below the 61.8% retracement down to the recent lows.
Not only that, but we are sitting right at those highs from March.
So this market needs the USDA to provide us with some support tomorrow, or we are likely going to be making the next leg lower.
As we have that gap of volume to the downside, down towards that old range from June.
Markets can move through areas of low volume fast given that there's no support. Where as areas of high volume act as magnets.
So if we lose this area, we could gravitate towards that old range.
But if the USDA gives us a friendly surprise, this could be a simple bear trap.
Tomorrow's price action should tell us a lot. As it's essentially do or die time for soybeans short term on the chart. And the ball is in the USDA's court.
Wheat
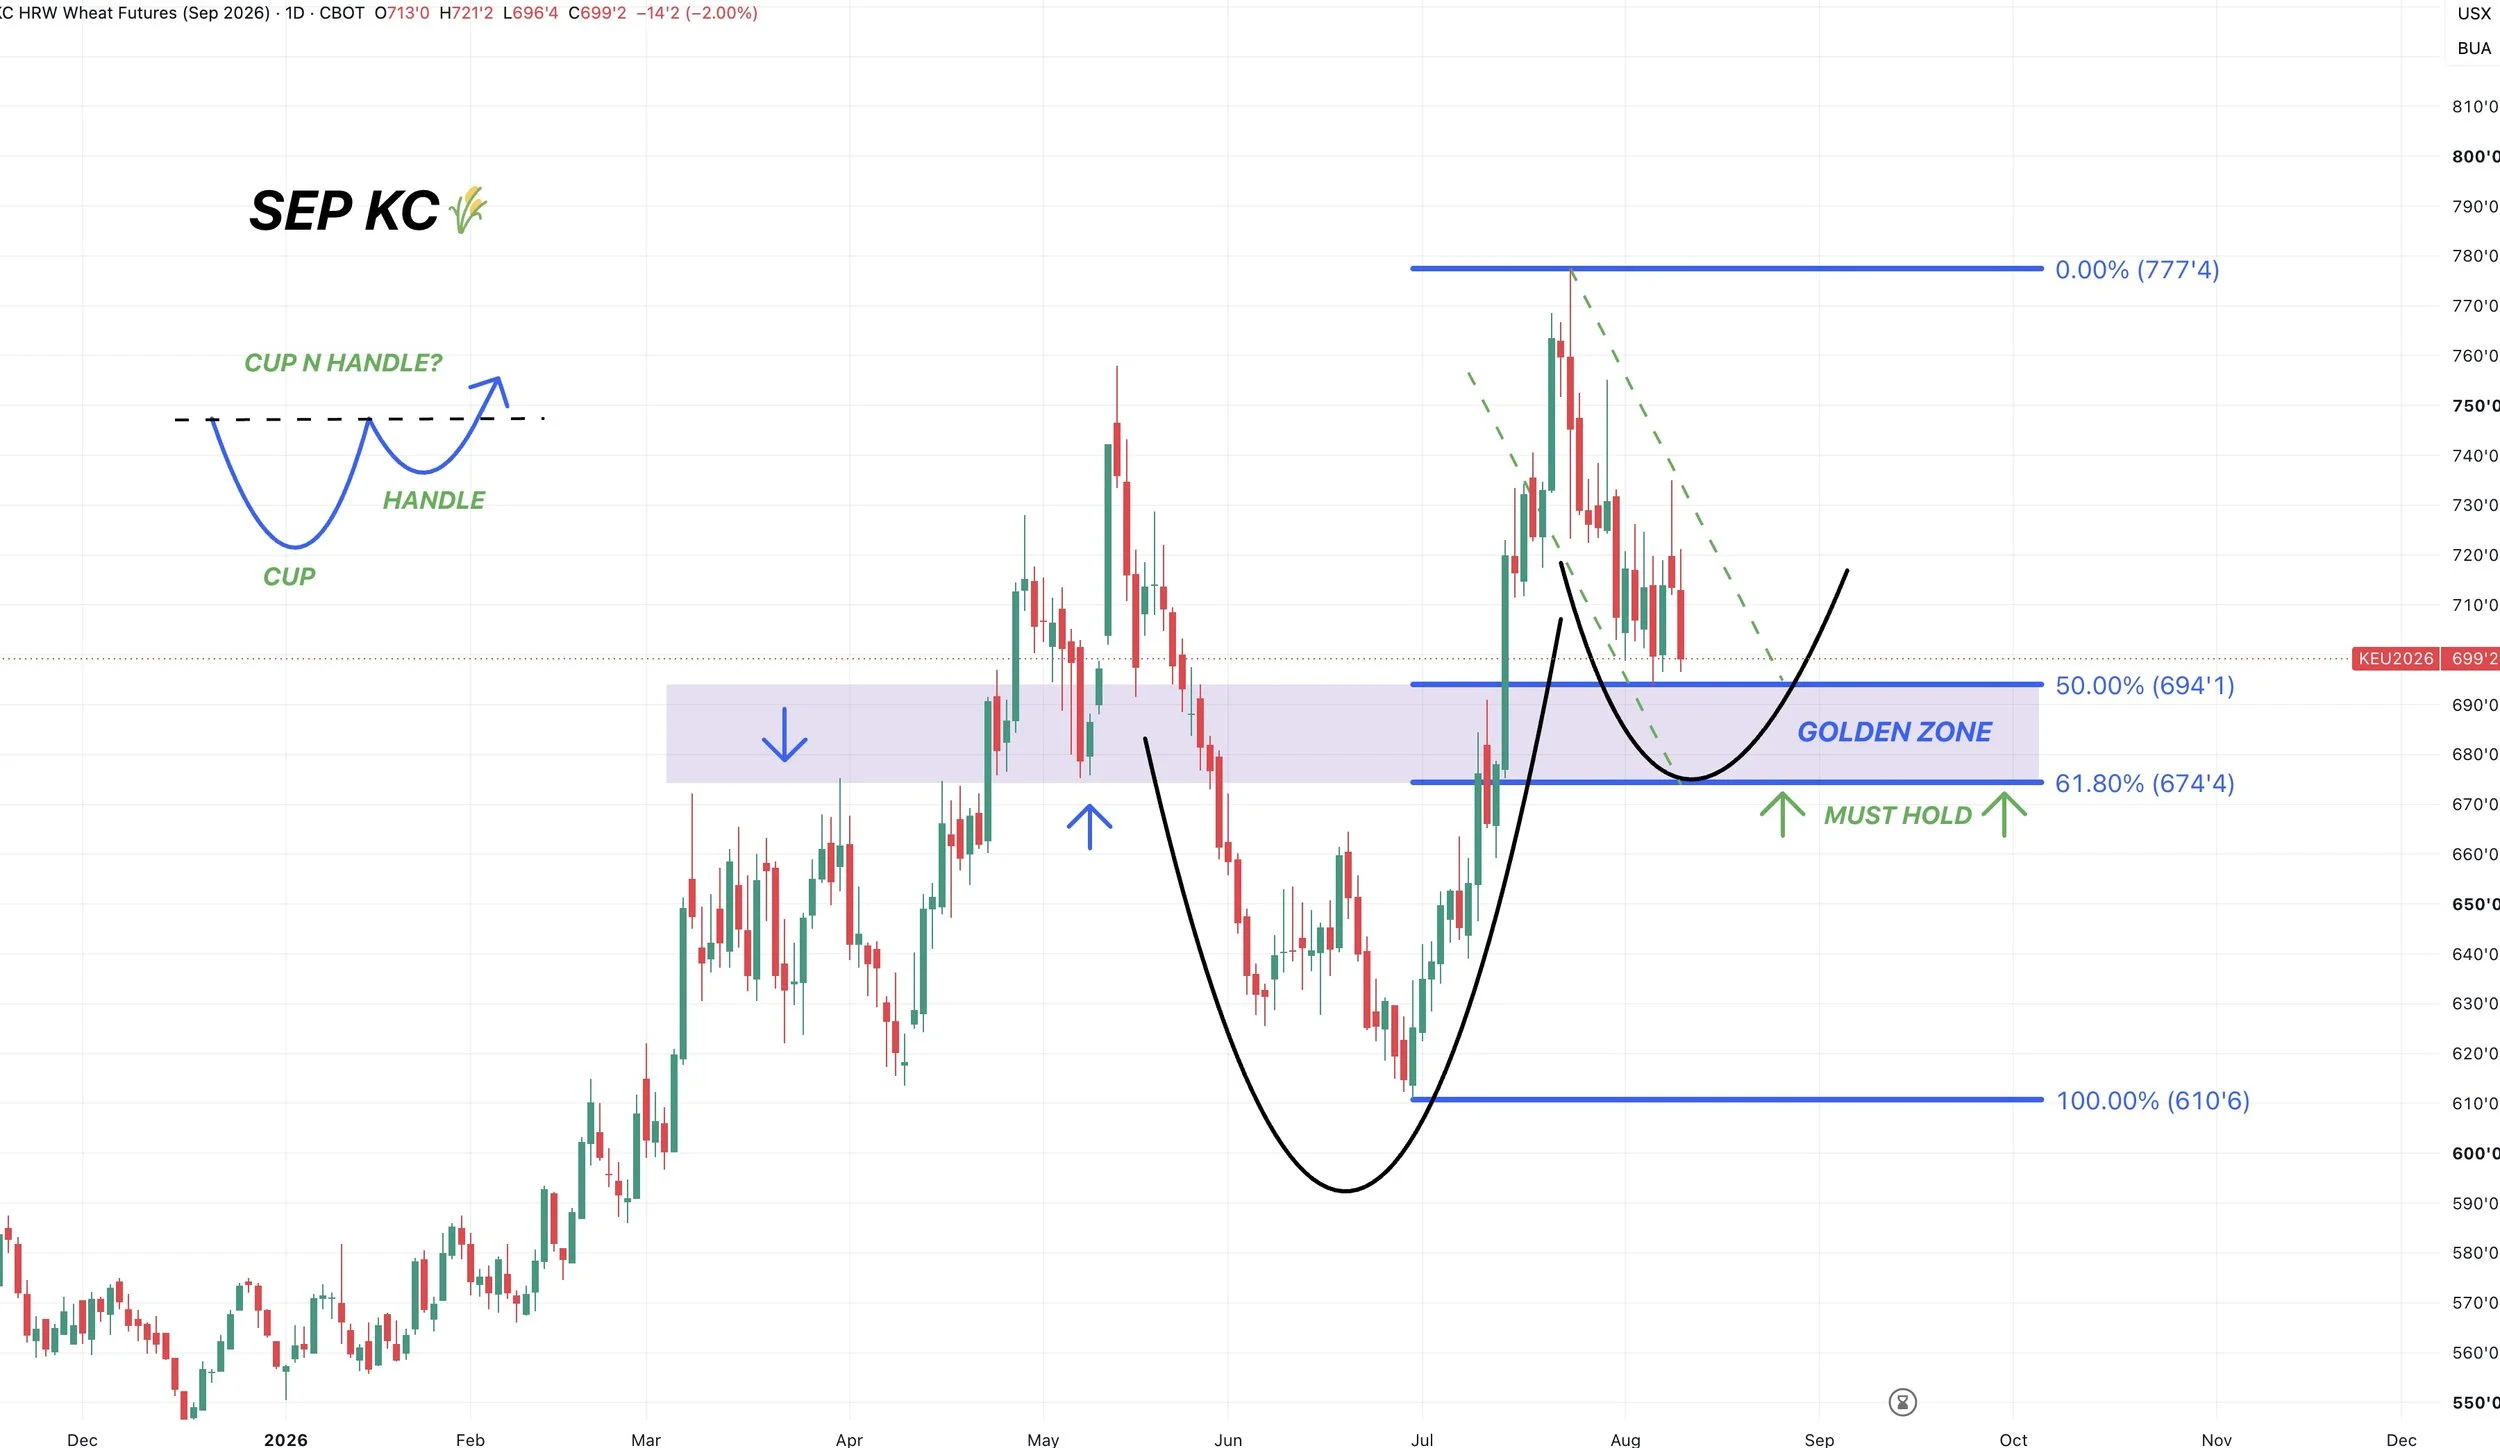
Sep KC Wheat Chart:
I think the situation over in the Black Sea is being somewhat overlooked when it comes down to how it's fundamentally going to impact things long term. But for now, the market doesn’t seem too interested.
Nonetheless, KC wheat is fine from a technical standpoint as long as we hold the 61.8% level.
This golden zone would be where we'd expect some support.
If we start to break below, then you'd have a reason for caution.
Right now, we could be setting up for a classic cup and handle pattern if we hold the zone.
It also looks somewhat like a bull flag. Usually we want to see those hold the 61.8% level.
Cattle
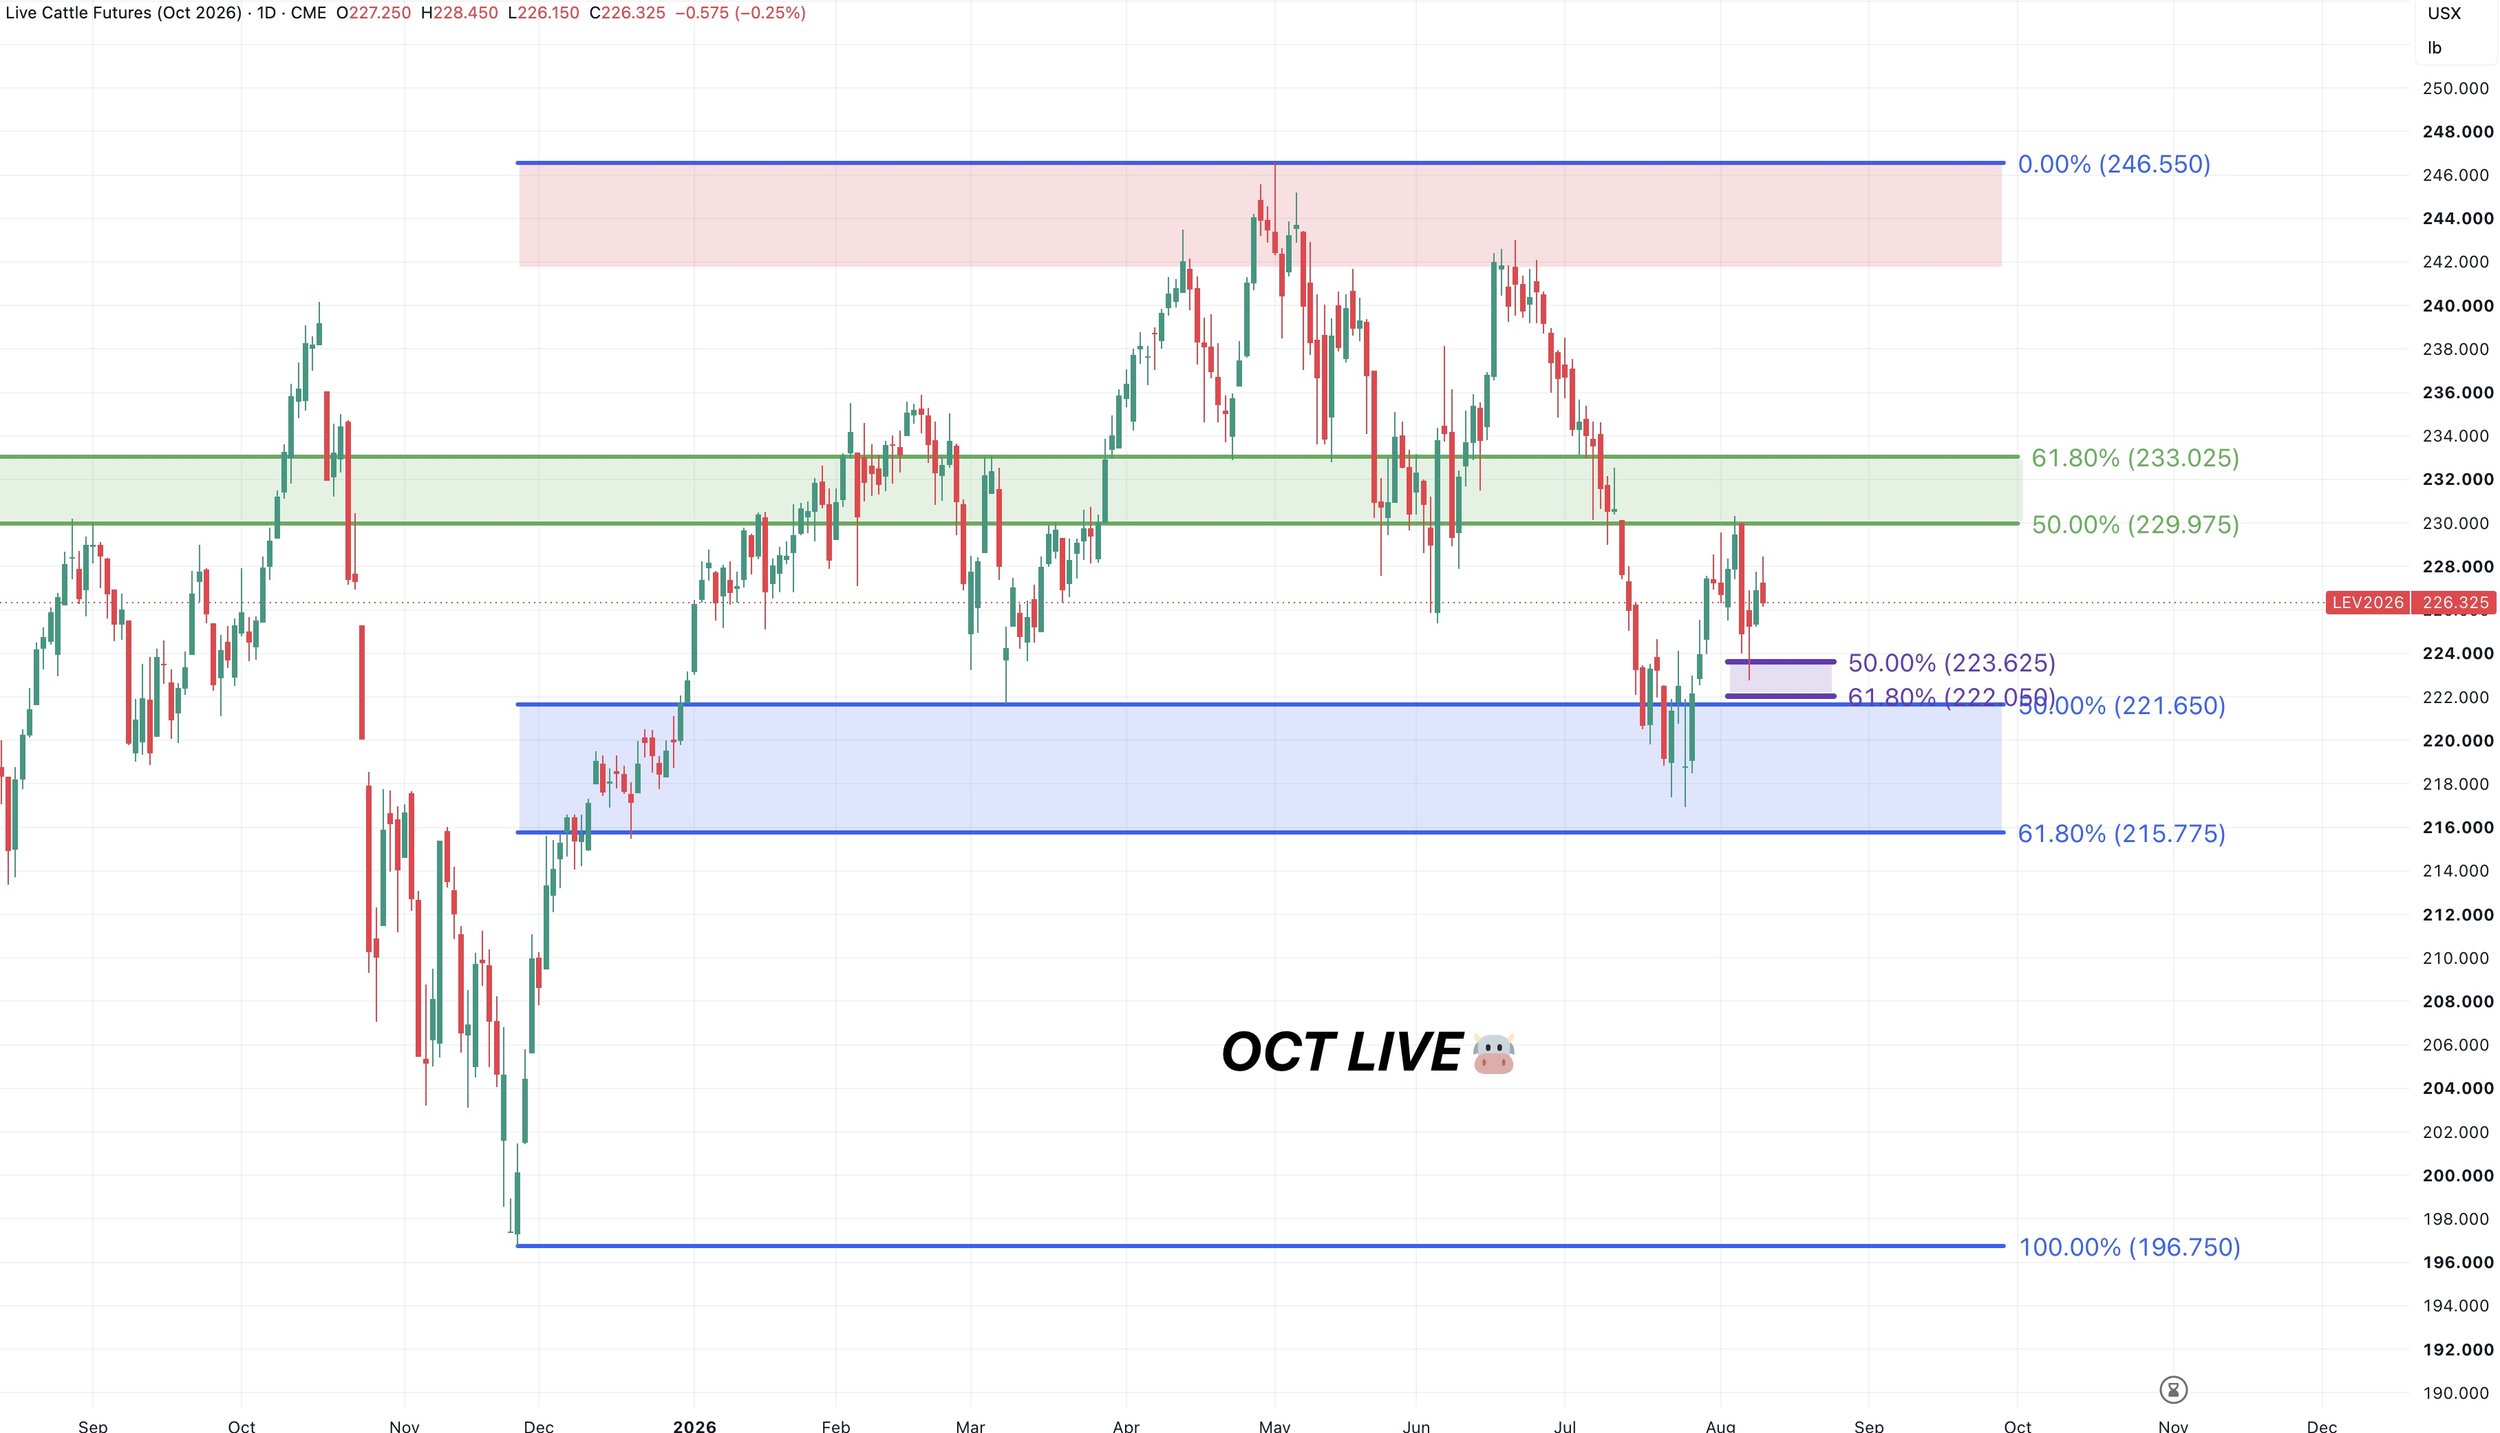
Oct Live Chart:
On the recent pullback, we held the mini golden zone from the recent rally. Which was good to see.
We need to hold the July lows or we could be in for another big leg lower.
To the upside, I want to protect any sort of move up towards that golden zone.
Which claws back 50-61.8% of the sell off. As that would be a very common level for a relief bounce to stall out.
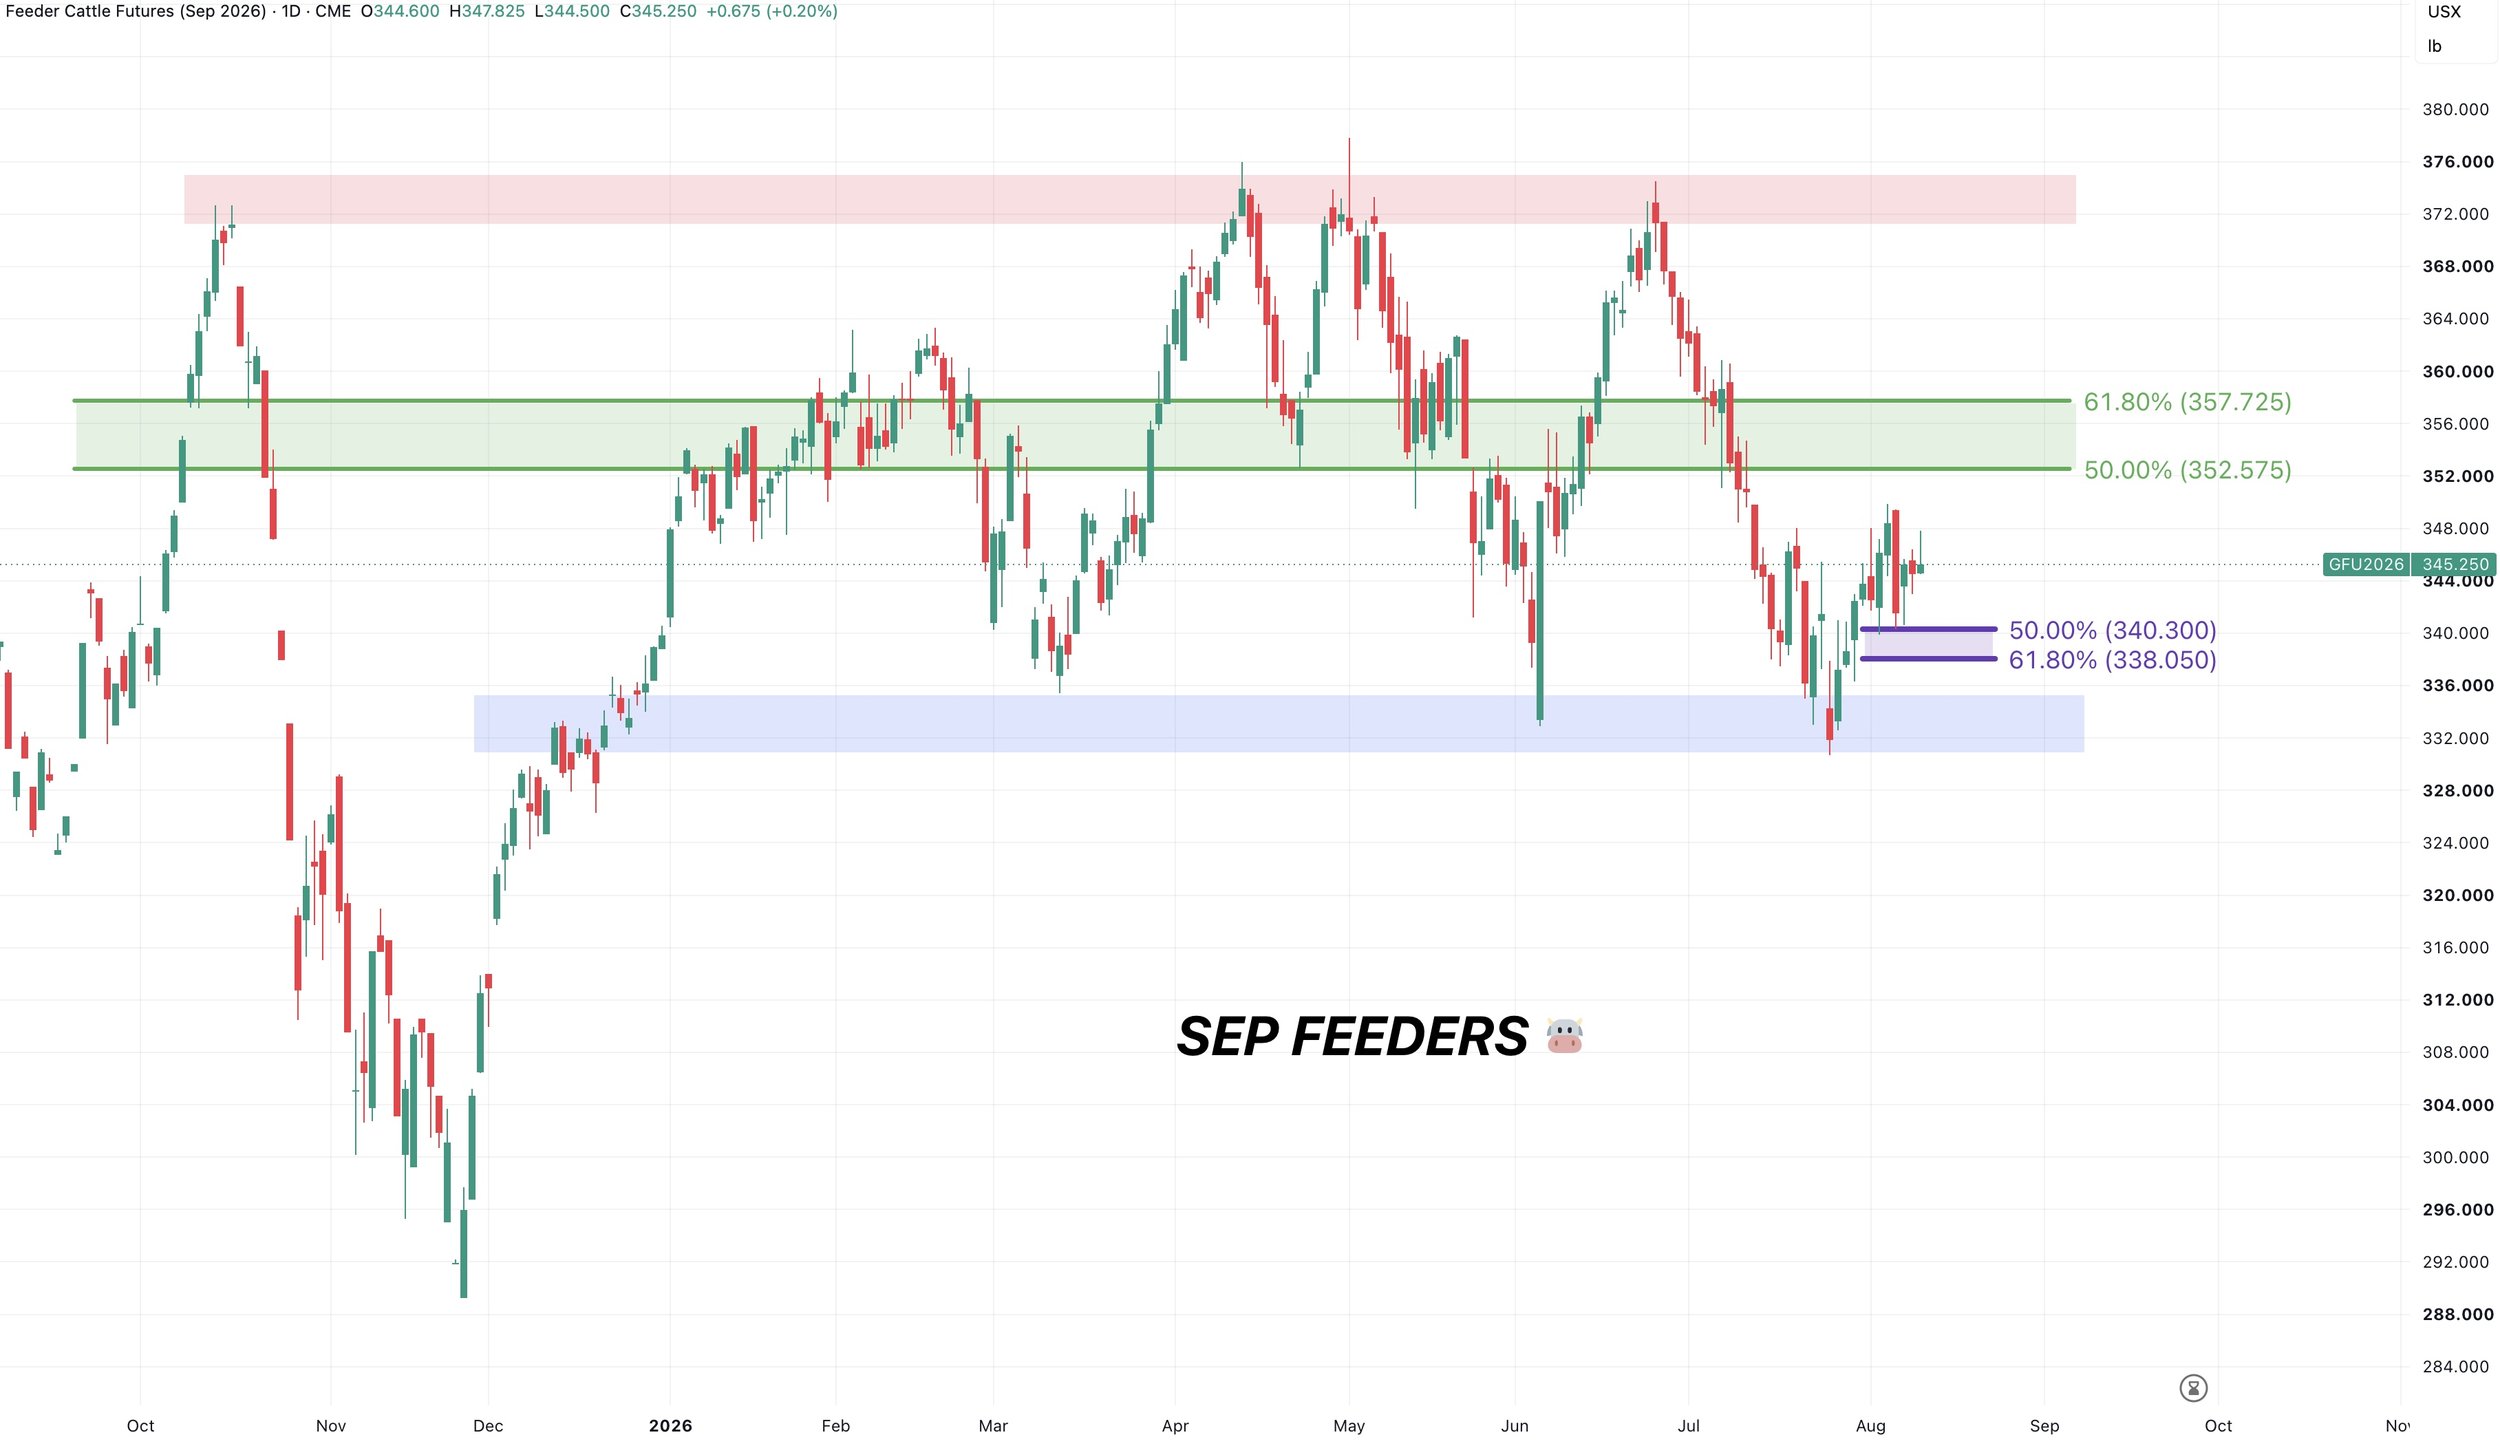
Sep Feeders Chart:
Same exact set up here.
We held the mini golden zone down to the recent lows which is a good sign.
We desperately need to hold those recent lows or there is a massive amount of downside risk.
To the upside, I would look to protect any sort of move into that golden zone.
Want to Talk?
Our phones are open 24/7 for you guys if you ever need anything or want to discuss your operation.
Jeremey & Office: (806)484-1214
Sebastian: (605)280-1186
Email: sfrost@dailymarketminute.com
Hedge Account
Interested in a hedge account? Use the link below to set up an account or give us a call.