
WAR ROLLERCOASTER, CHINA MEETING, USDA TUESDAY
MARKET UPDATE
You can scroll to read the usual update as well. As the written version is the exact same as the video.
Timestamps for video:
War: 0:00min
USDA: 1:55min
Protection Strategies: 4:15min
Corn: 6:55min
Beans: 11:45min
Wheat: 13:30min
Cattle: 14:50min
Want to talk?
Office: (806)484-1214
Futures Prices Close
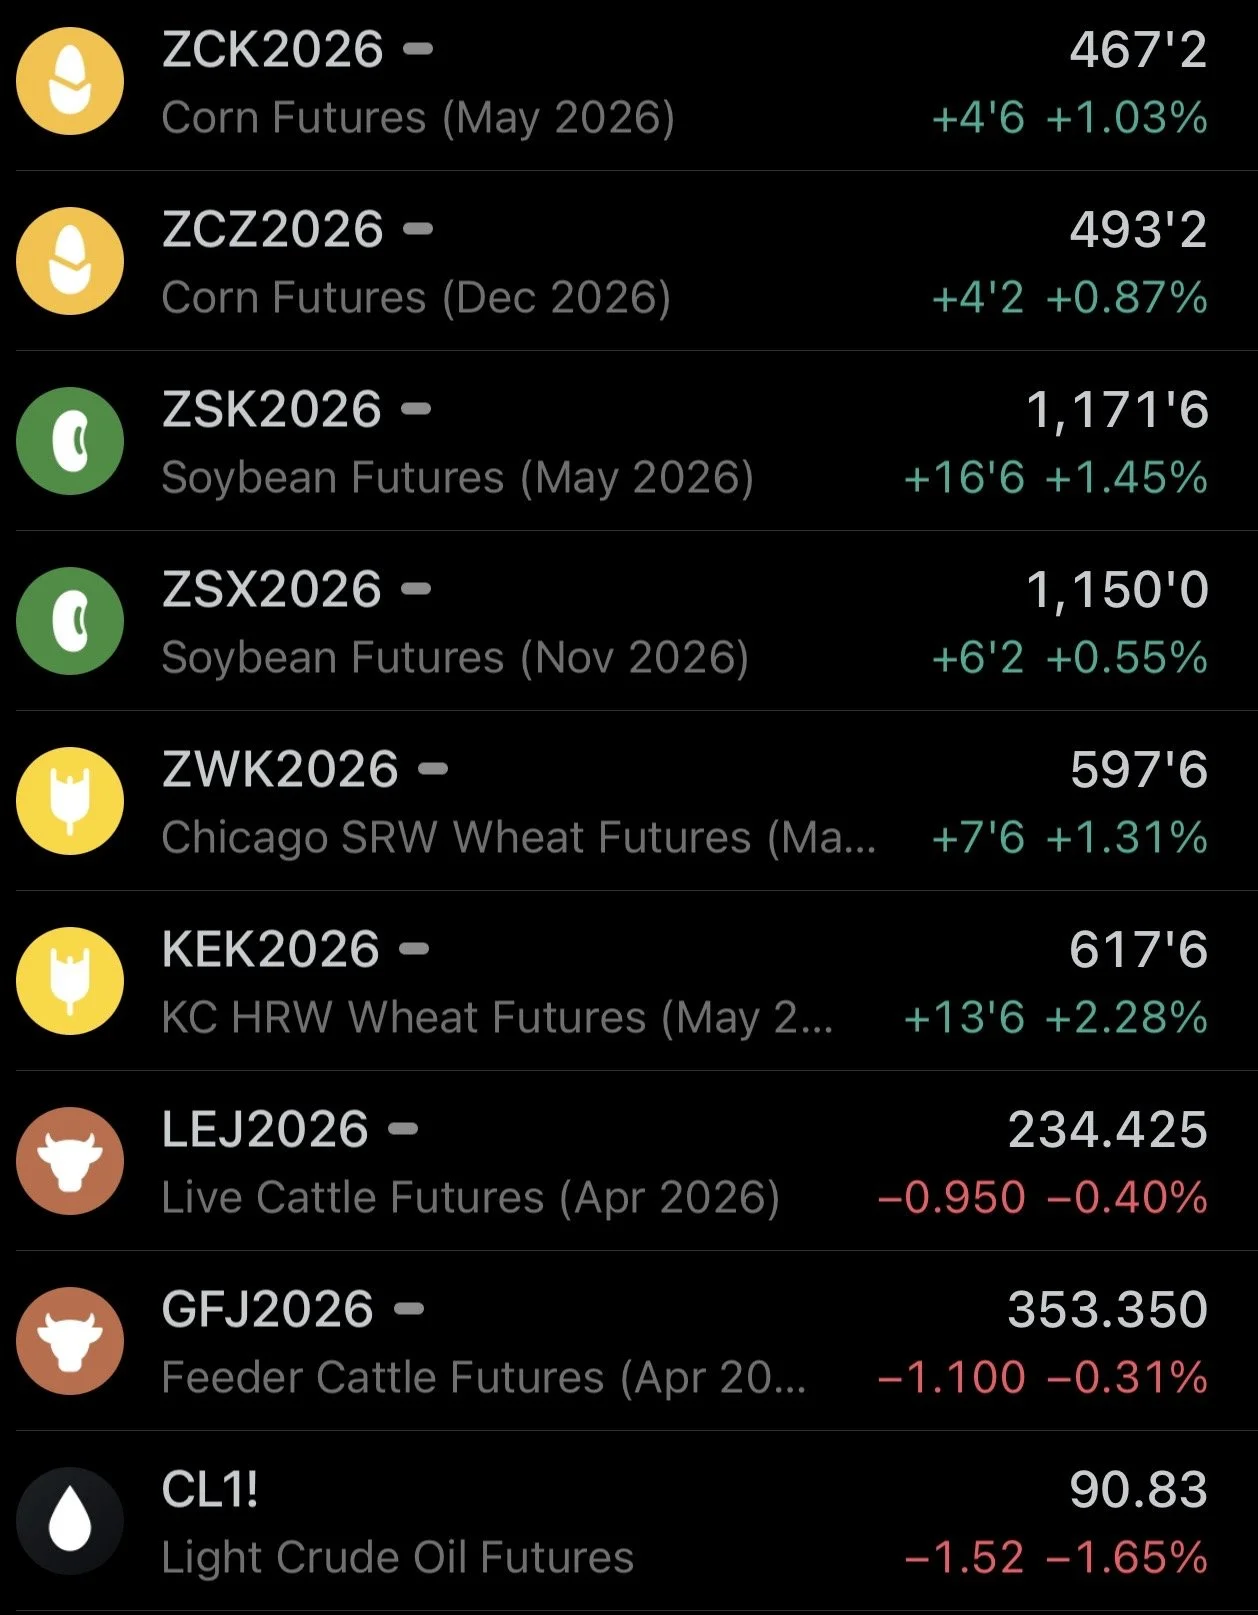
Overview
Grains mostly higher today as the Iran war situation continues to flip back and forth.
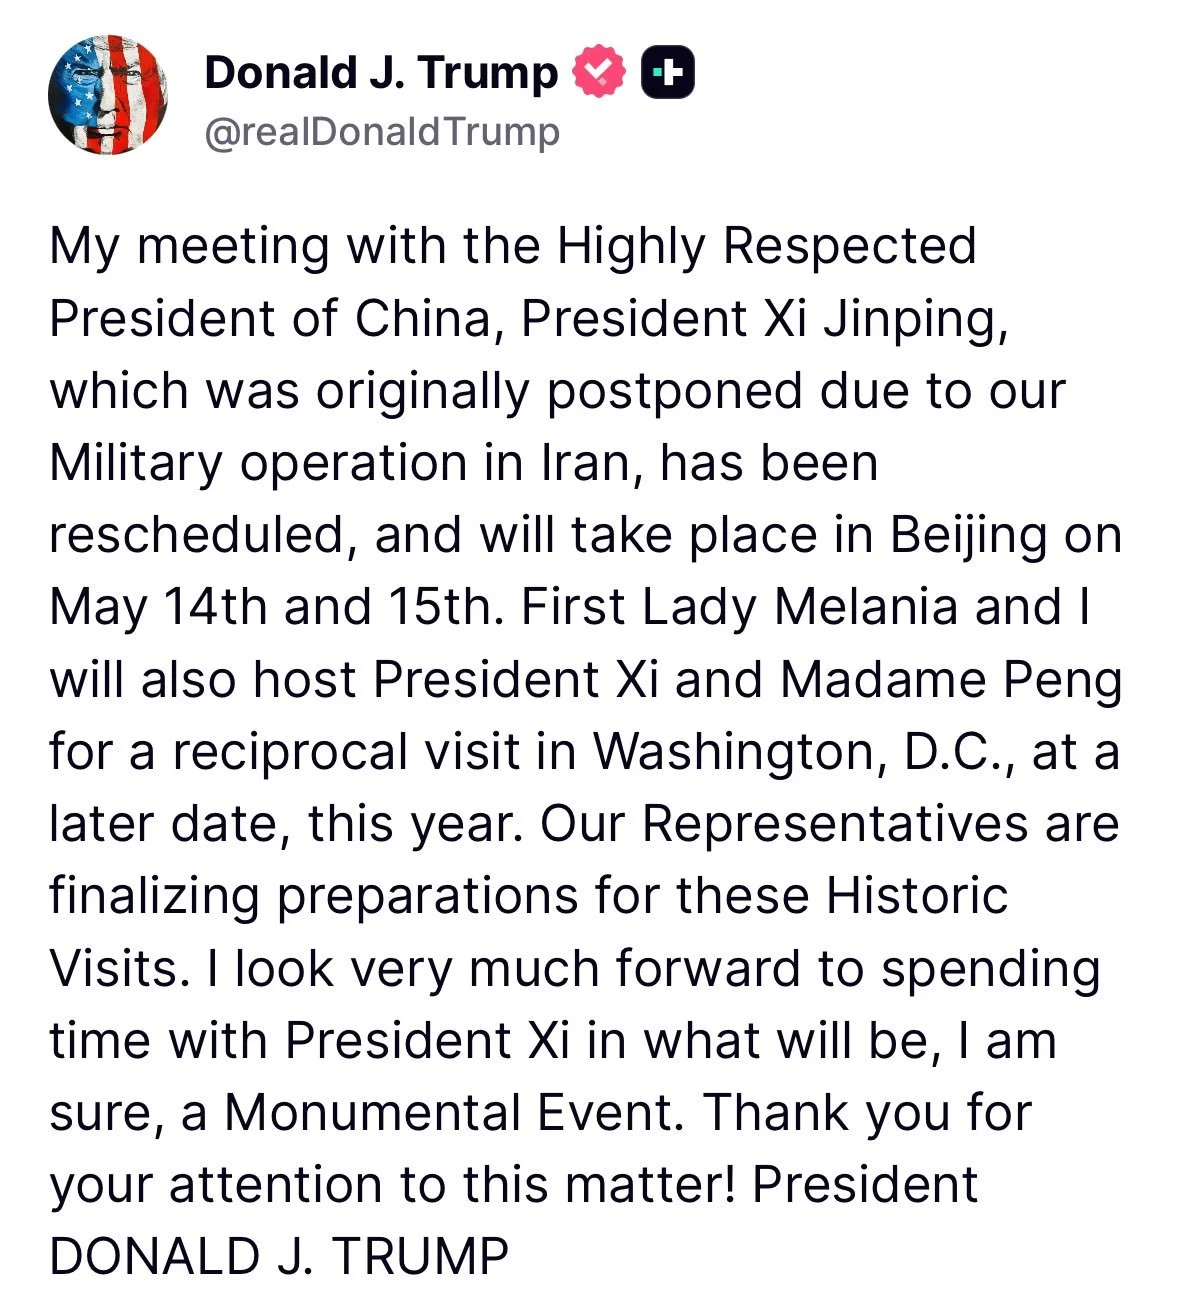
Soybeans led the way today today as we received the exact dates Trump will be meeting with China.
It was announced they will meet May 14th.
They were orginally scheduled to meet March 31st.
We got that limit down day when it was announced the meeting would be postponed due to the war.
Soybeans immediately traded higher today when we got those exact dates today.
Iran & Trump Flip Flopping
The war headlines have been everywhere.
One day Trump says he wants peace, the next he says we won the war, the next day he says he is going to obliterate Iran's power plants.
So what's the latest update?
There are so many headlines, but let's run through the timeline quick.
Monday:
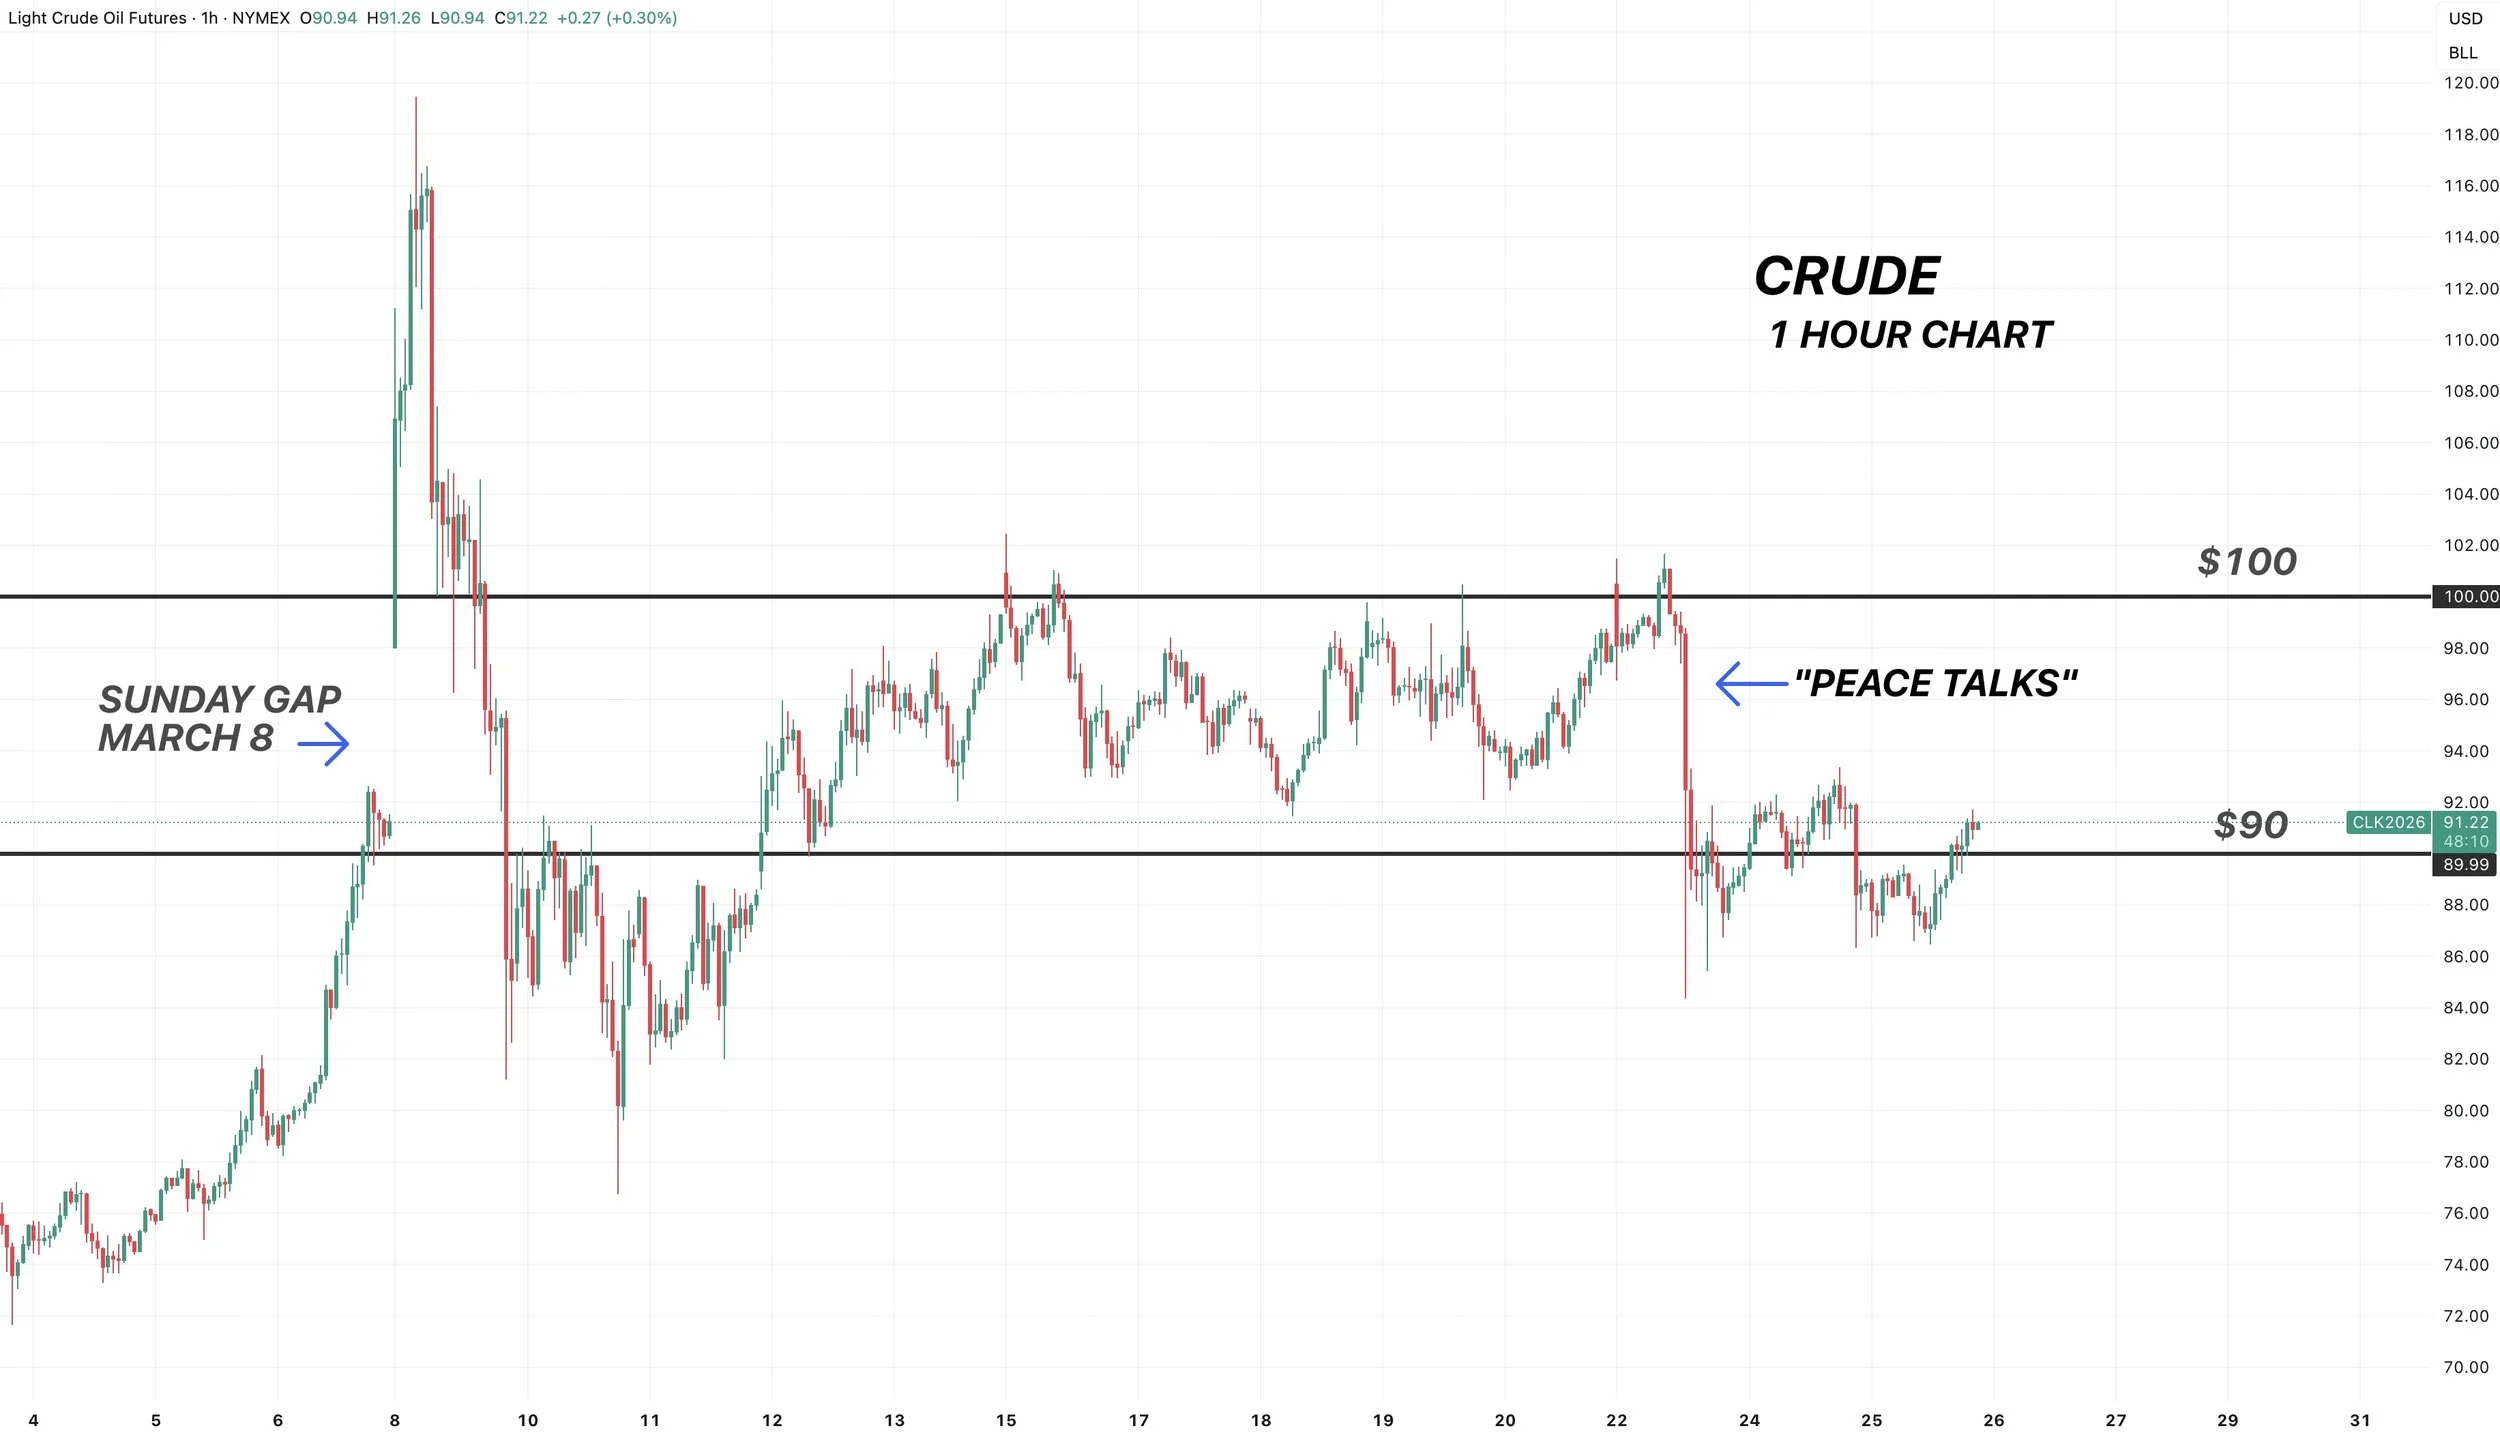
On Monday, Trump claimed that he and Iran had had great talks to end the war.
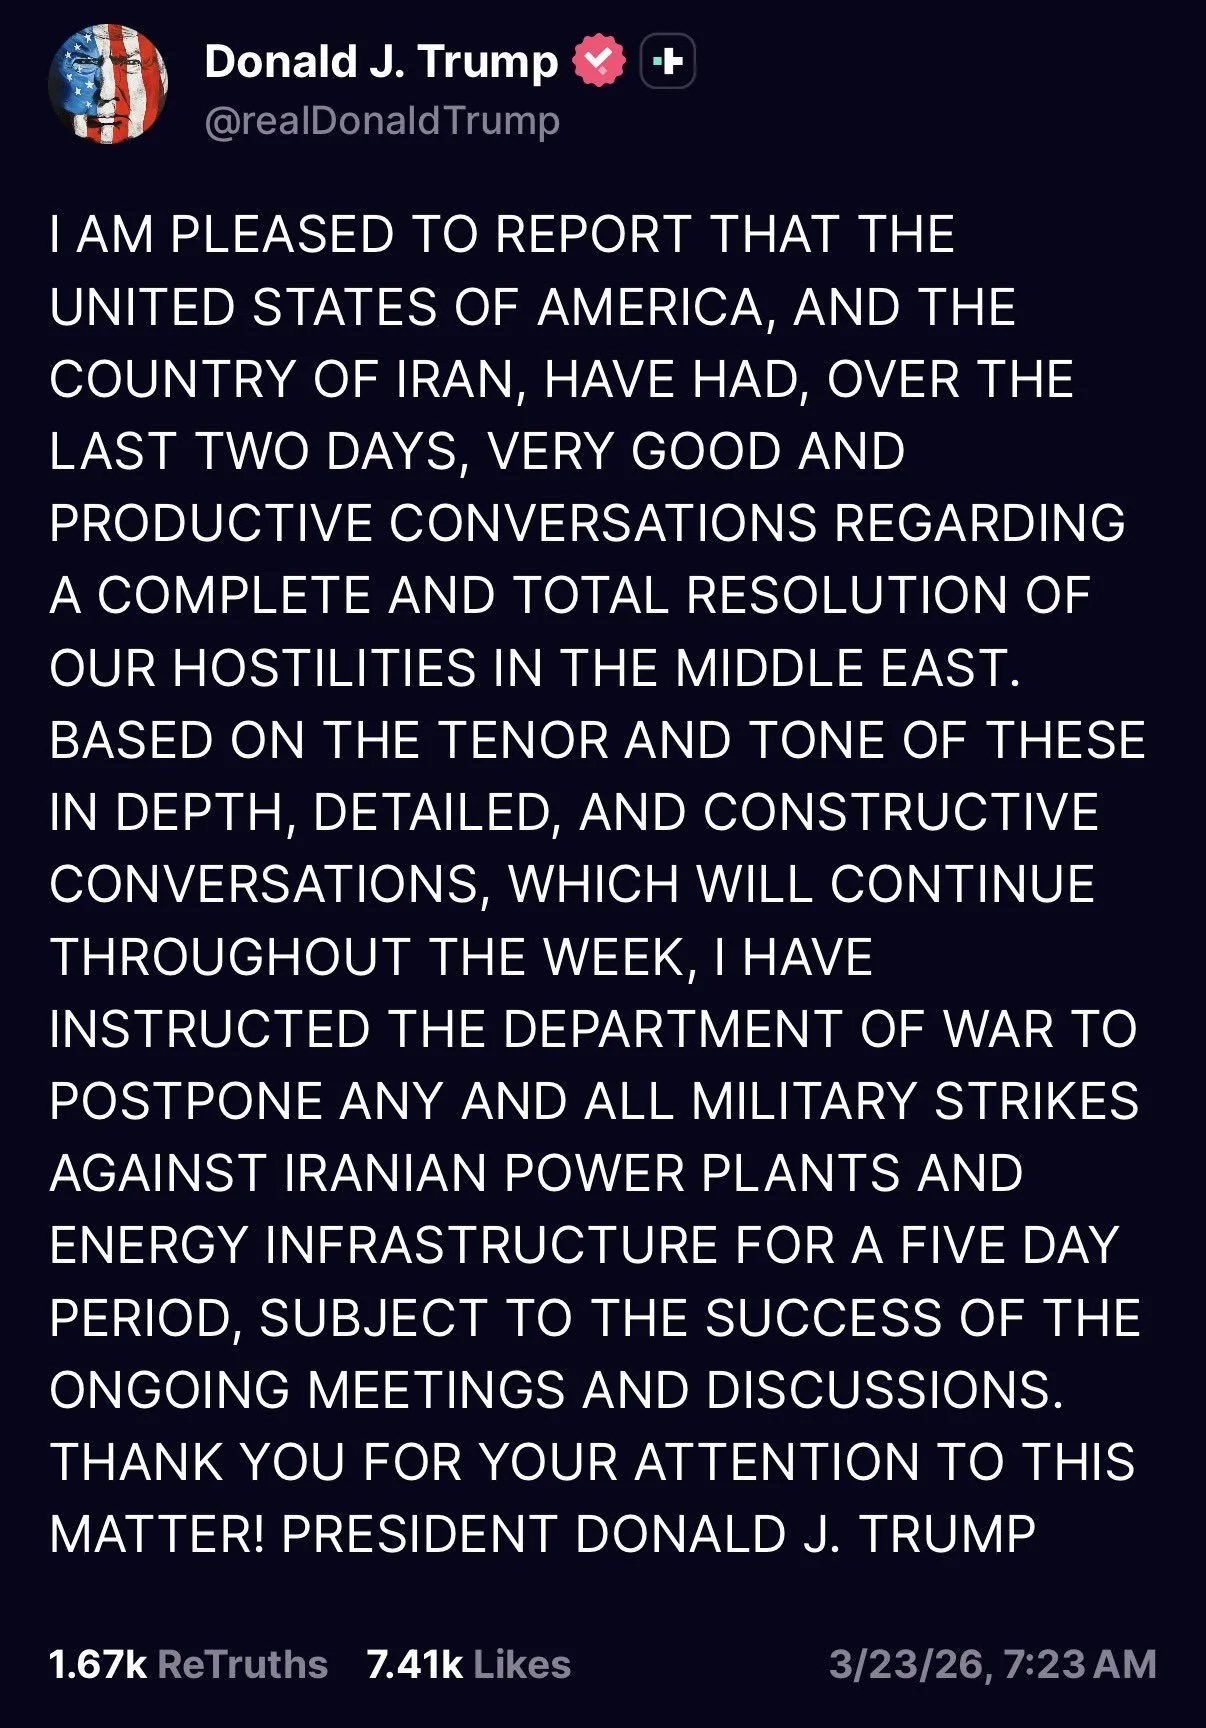
As a result, crude dropped heavily.
Initially we dropped -$14 in an hour.
So that has to be a warning sign at just how nasty crude "could" get if this war did truly come to an end.
But clearly it doesn’t appear the end will be that simple.
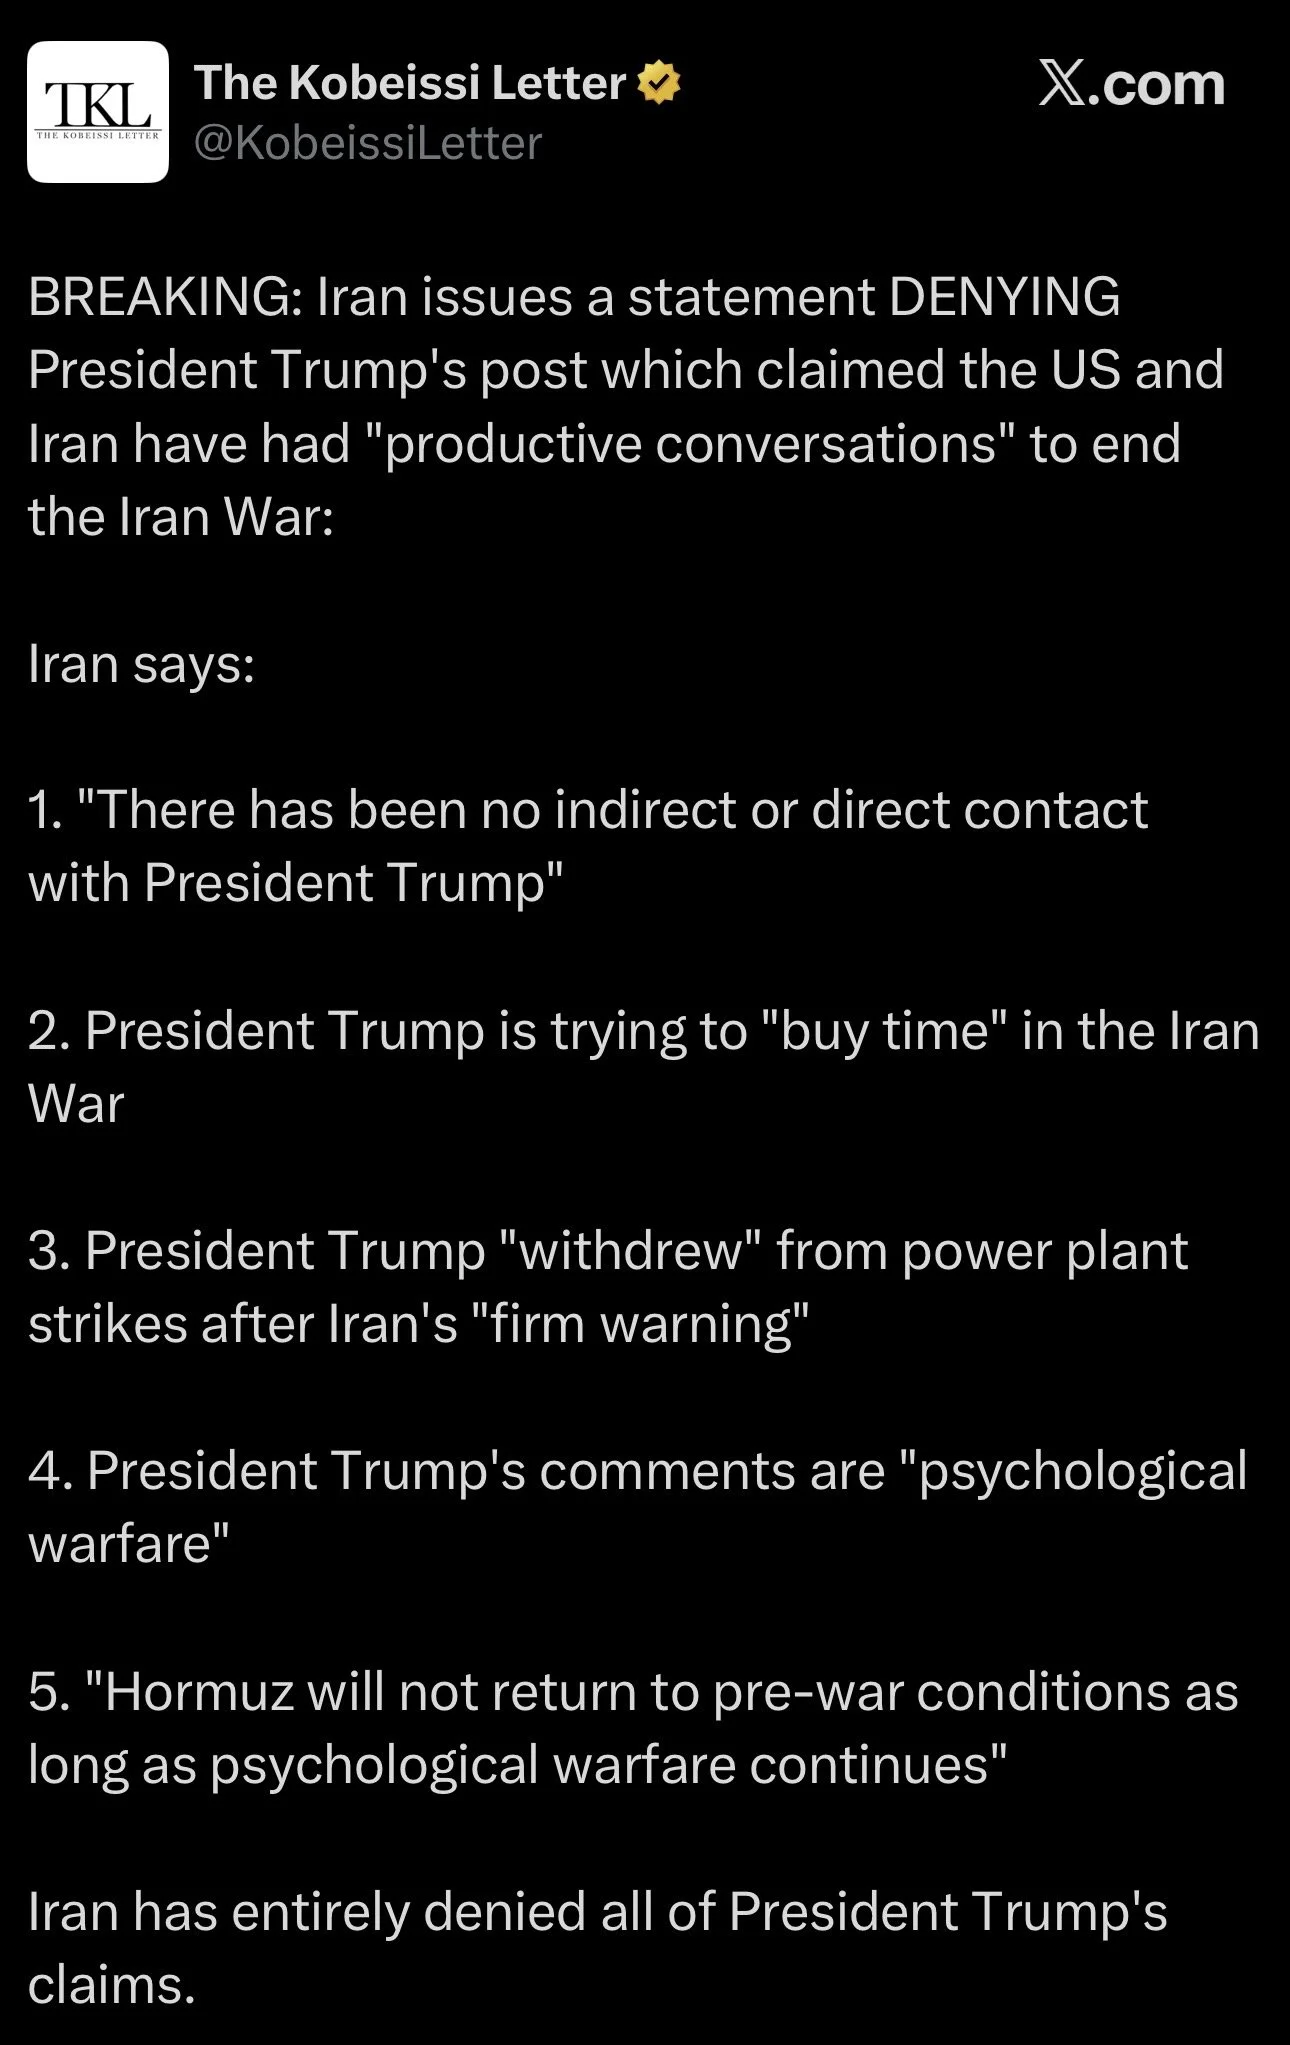
However, Iran then completely denied Trump's claims.
They said they had zero contact with the US and that all of Trump's claims were false.
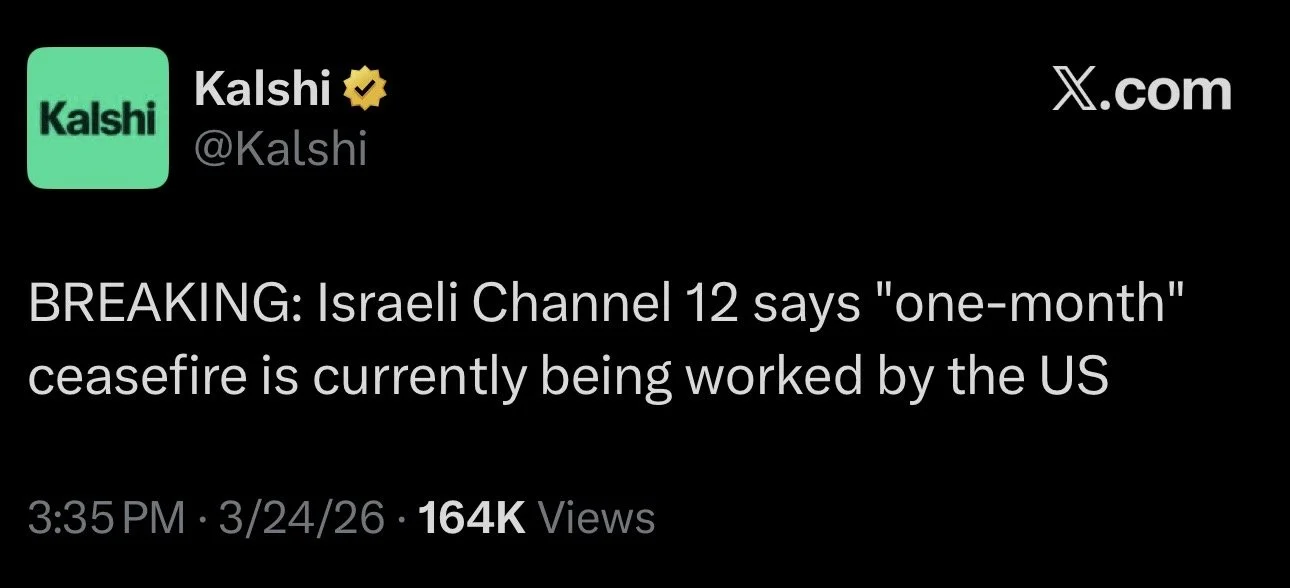
Yesterday:
Then last night, the US said they proposed a one-month ceasefire to Iran.
Today:
Iran then rejected the ceasefire this morning.
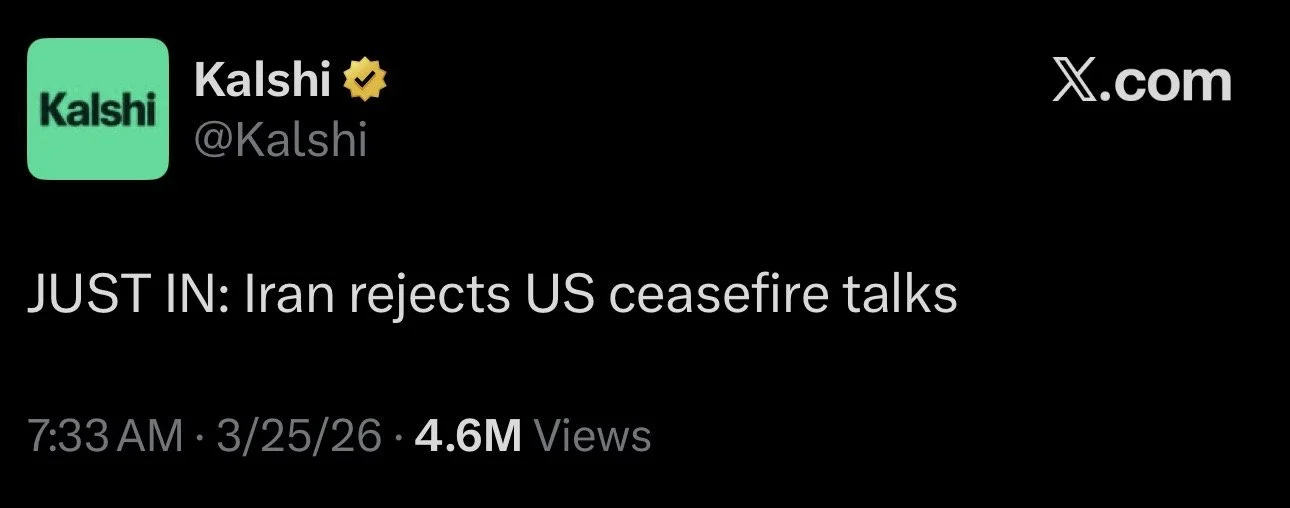
Iran says they want a full end to the war.
Not just a ceasefire.
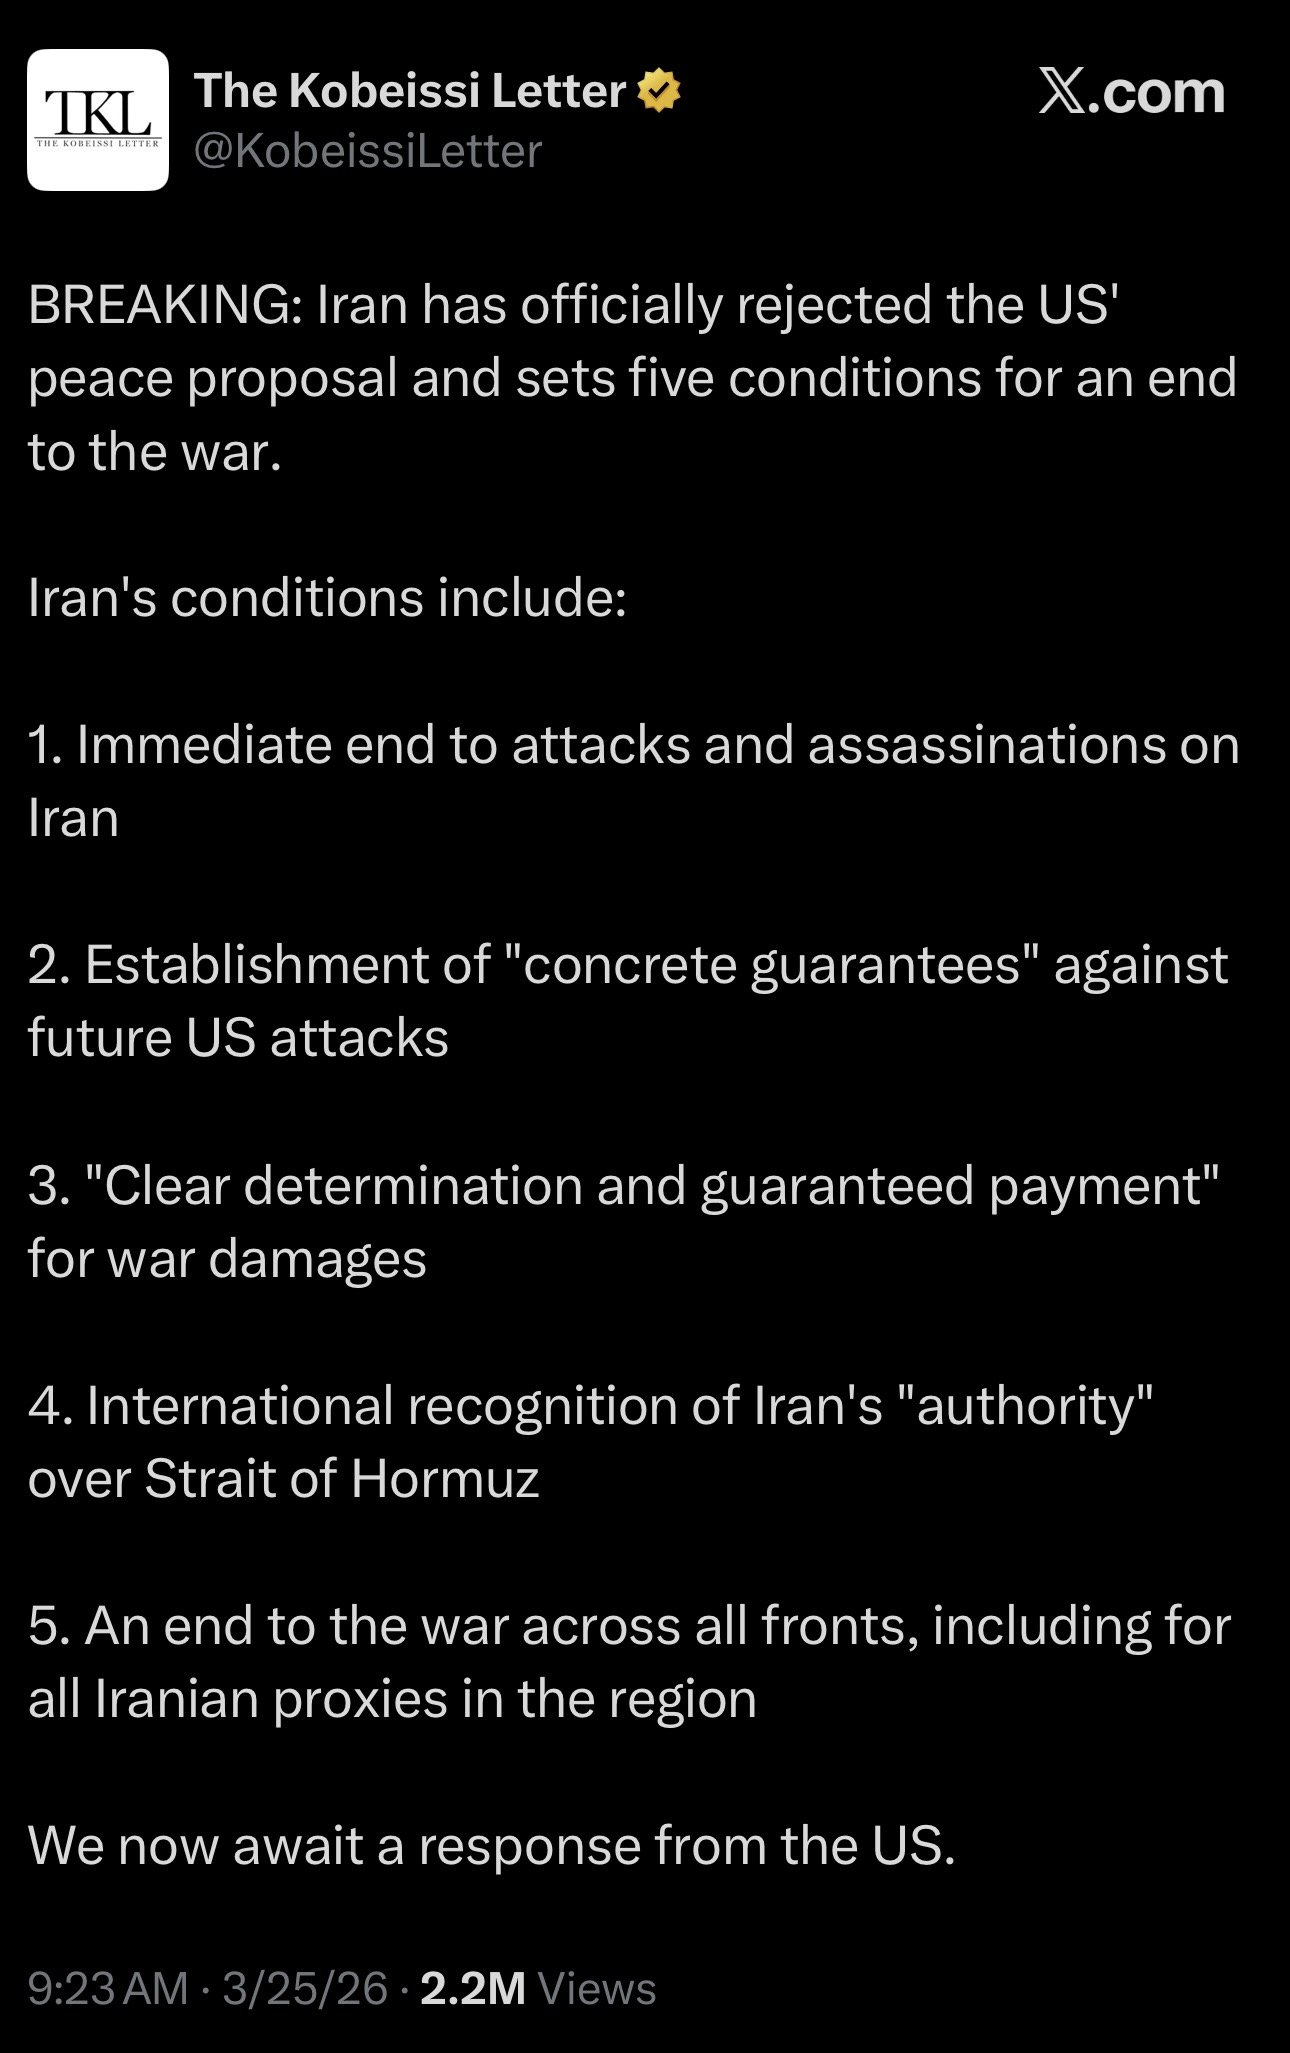
They said that Trump will not be allowed to decide when the war ends.
They sent a set of 5 conditions that have to be met for the war to end.
They said they will not talk until the 5 conditions are met.
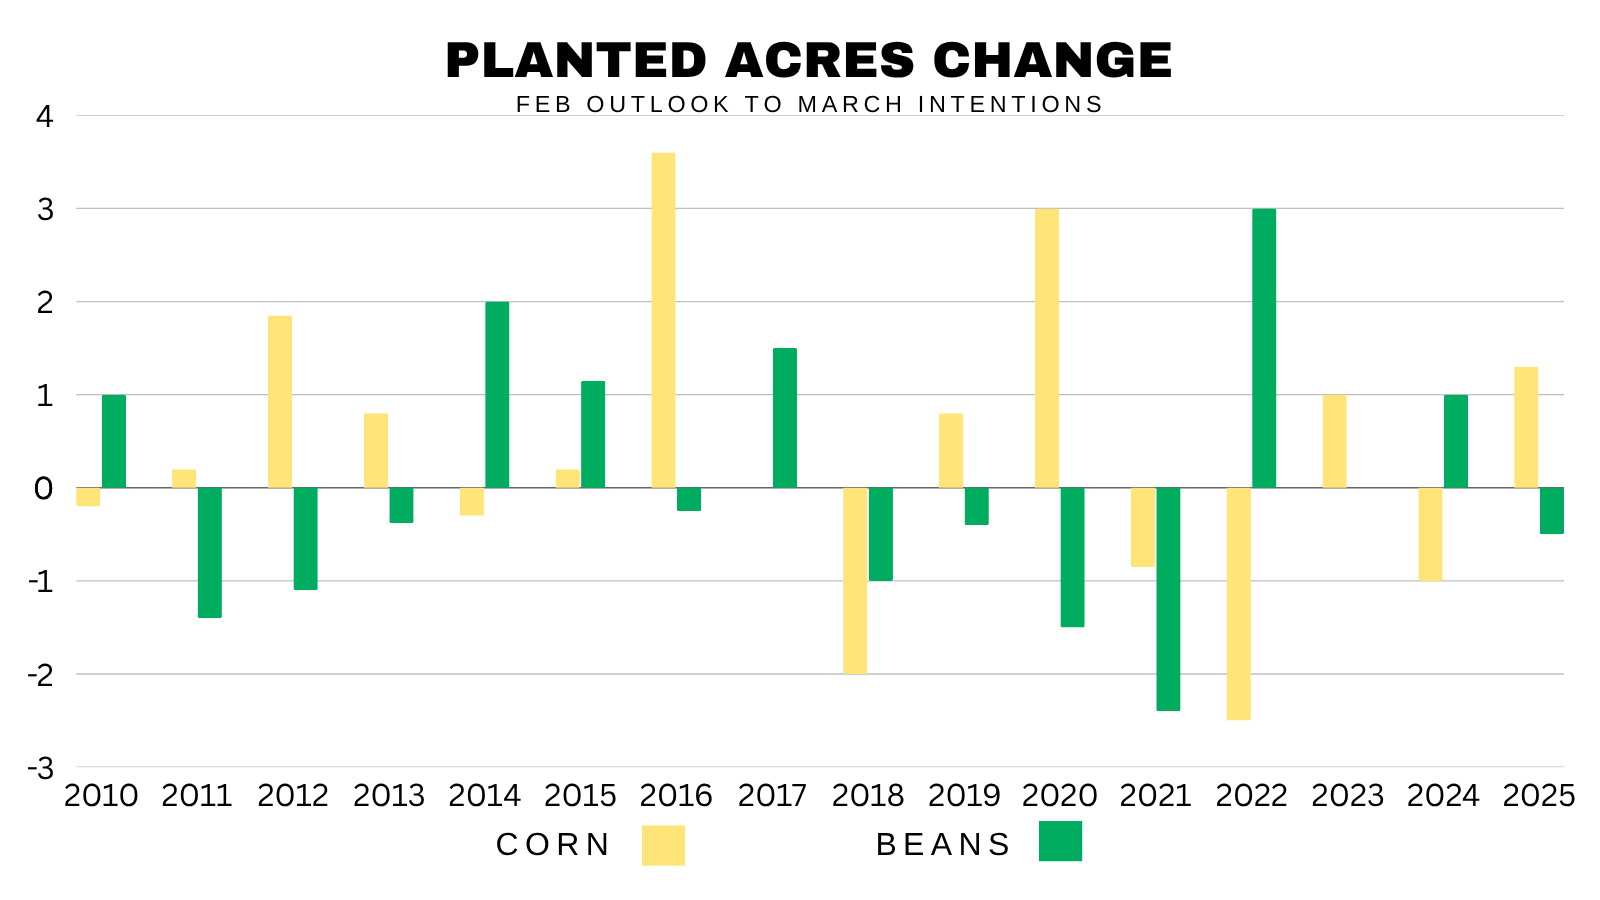
USDA History: March Stocks & Acres
We have the USDA report out next Tuesday.
Here is the acre changes from the Feb Outlook to the March Intentions.
If you notice, no real correlation here. It's really been a coin toss.
The only thing to note is that most of the time we don’t see both corn and soybeans jump or fall from the Feb Outlook.
Usually, one falls while the other jumps.
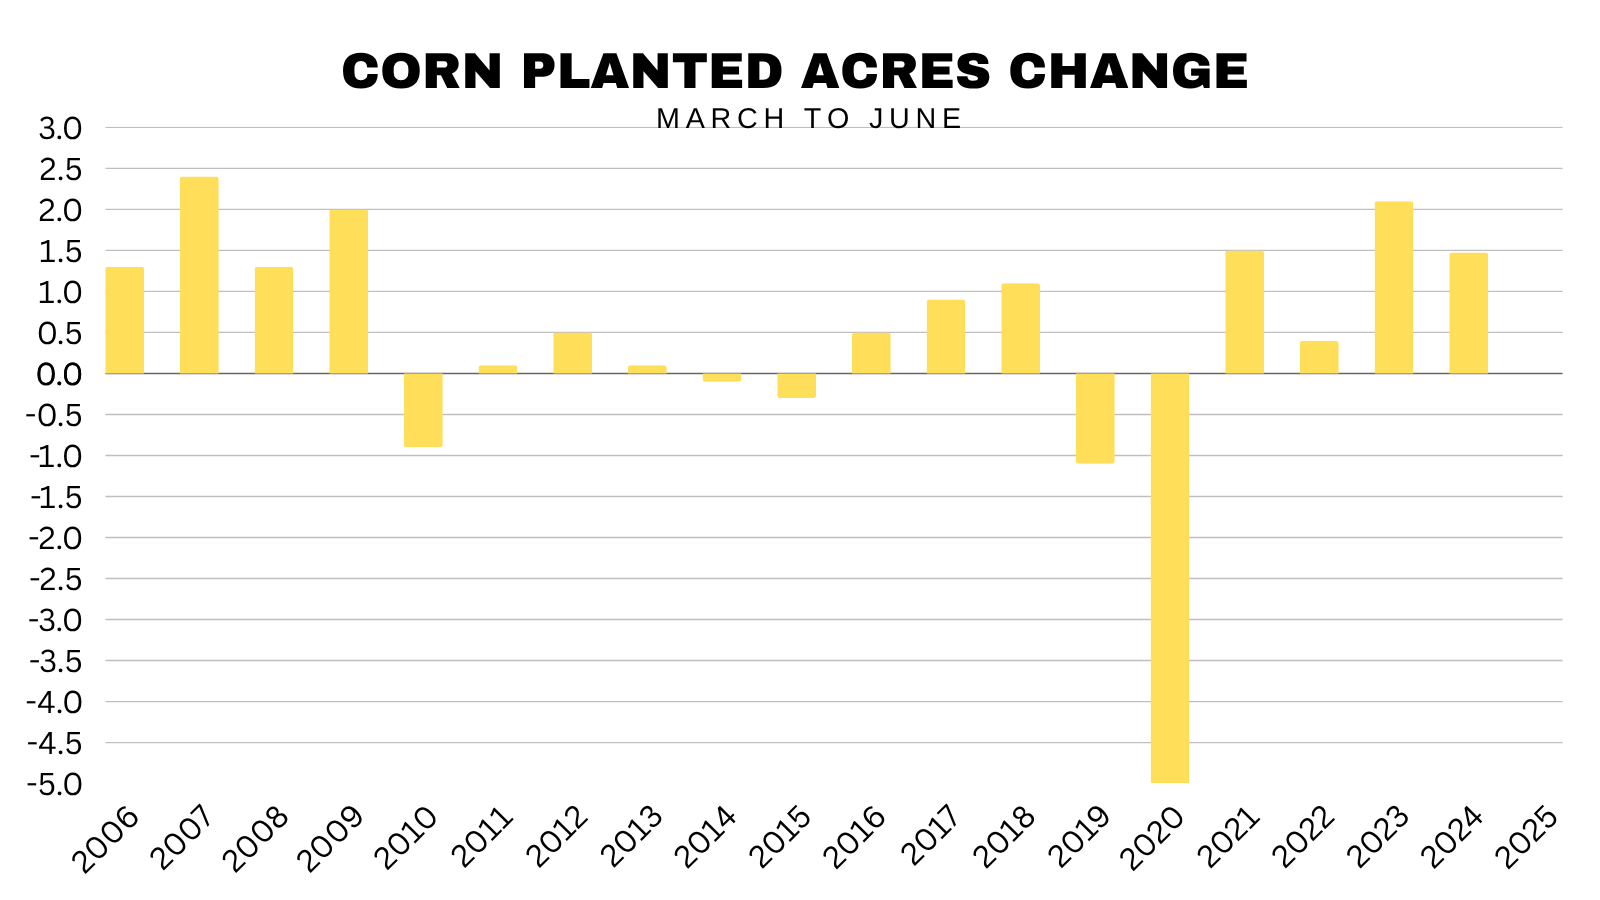
However, here is another set of data.
This is the change in March acres to June acres for corn.
Whatever number they come up with next week, does tend to be less than the number we see come June.
They've jumped from March to June the last 7 of 10 years.
Last year was the first time since 2020 they did not increase.
But last year they found extra acres later on anyways.
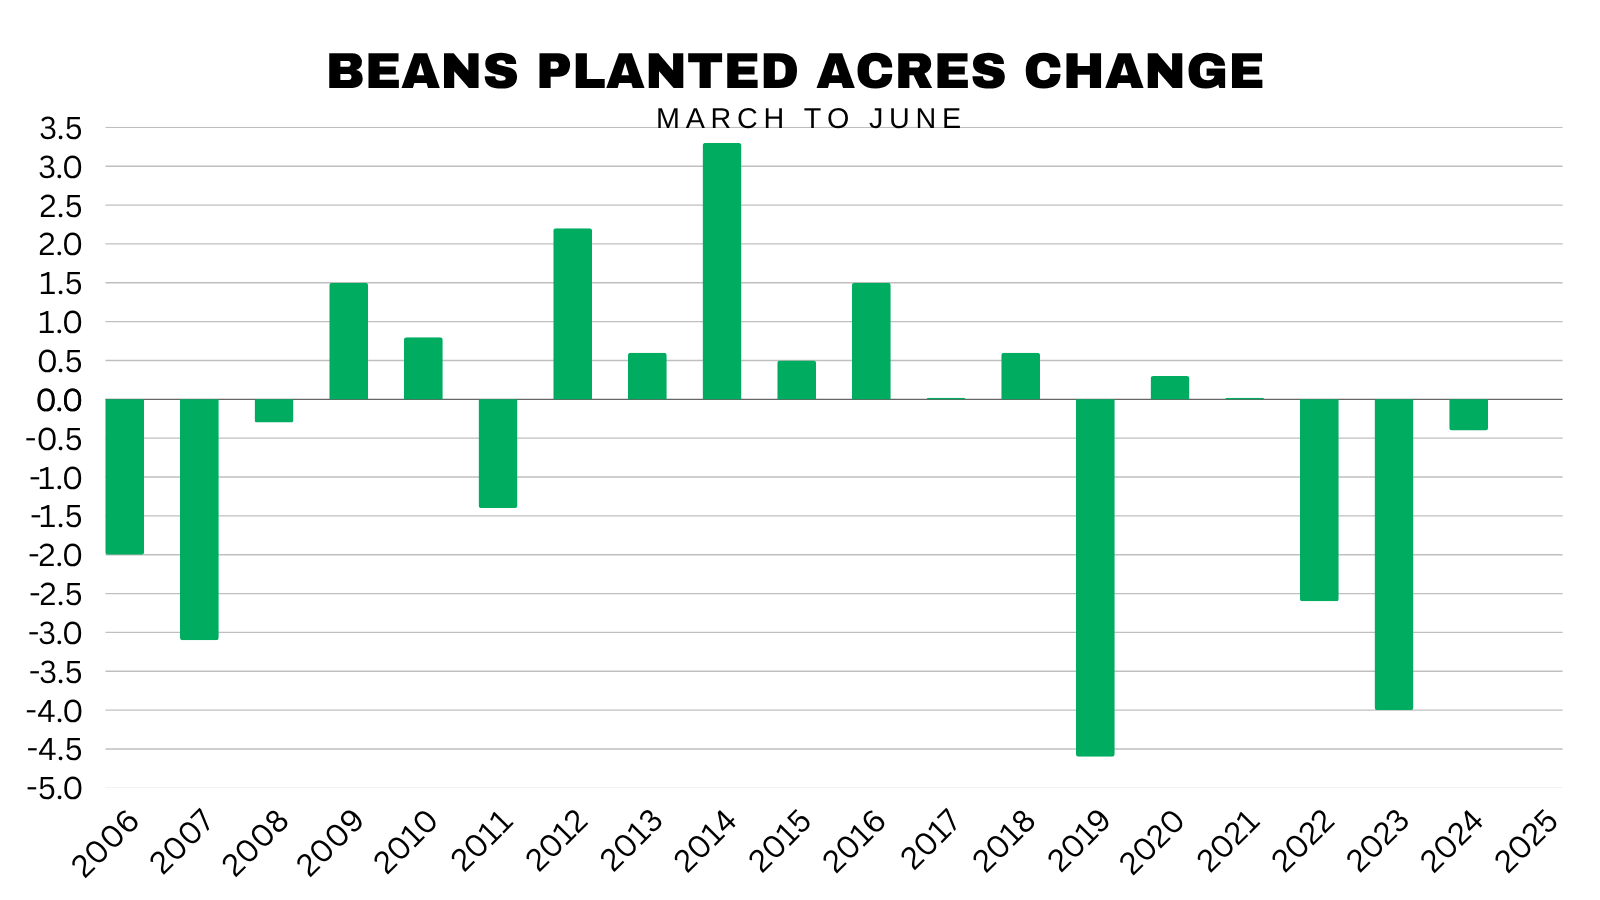
Soybeans on the other hand have a little different tendency.
Since 2016, acres tend to drop or stay the same from March to June.
They've only jumped 3 times in the last 10 years.
However, from 2009 to 2016 we had a streak where they increased for 7 of 8 years in a row.
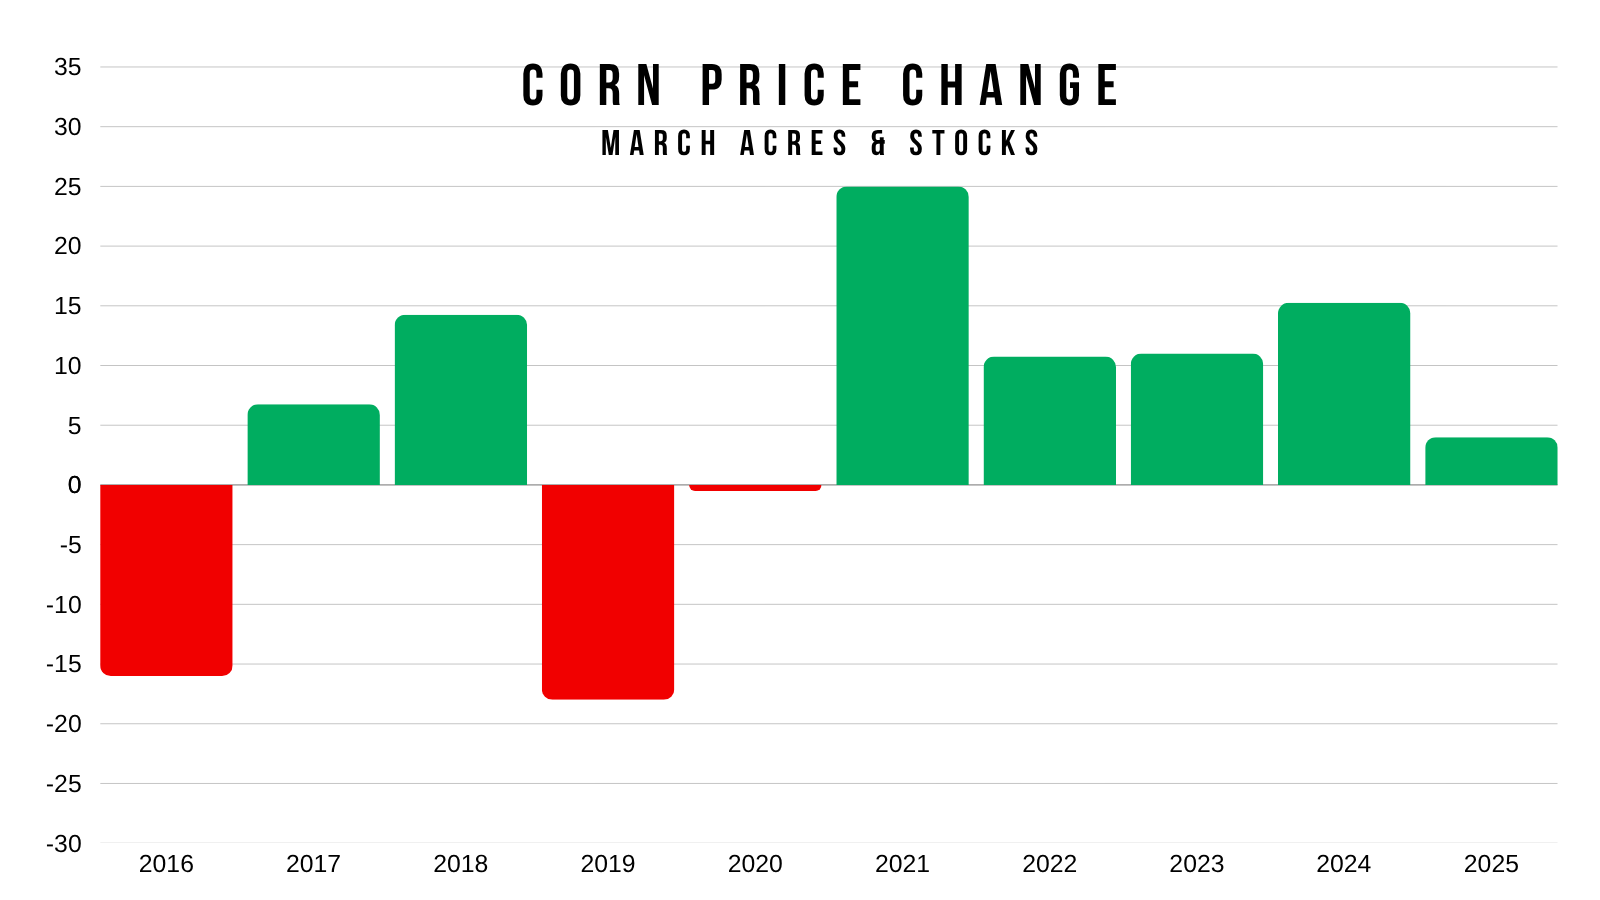
How big of a market mover is this report?
The last 2 years have been quiet in comparison to how this report historically can move the market.
First for corn.
It actually has tended to be on the friendly side. It's been positive 5 years in a row. We haven’t traded lower on the day of this report since 2020.
🟢 2025: +4
🟢 2024: +15 1/4
🟢 2023: +11
🟢 2022: +10 3/4
🟢 2021: +25
🔴 2020: -1/2
🔴 2019: -17 1/2
🟢 2018: +14 1/4
🟢 2017: +6 3/4
🔴 2016: -15 1/2
Average Move Past 10 Years = 12 cents
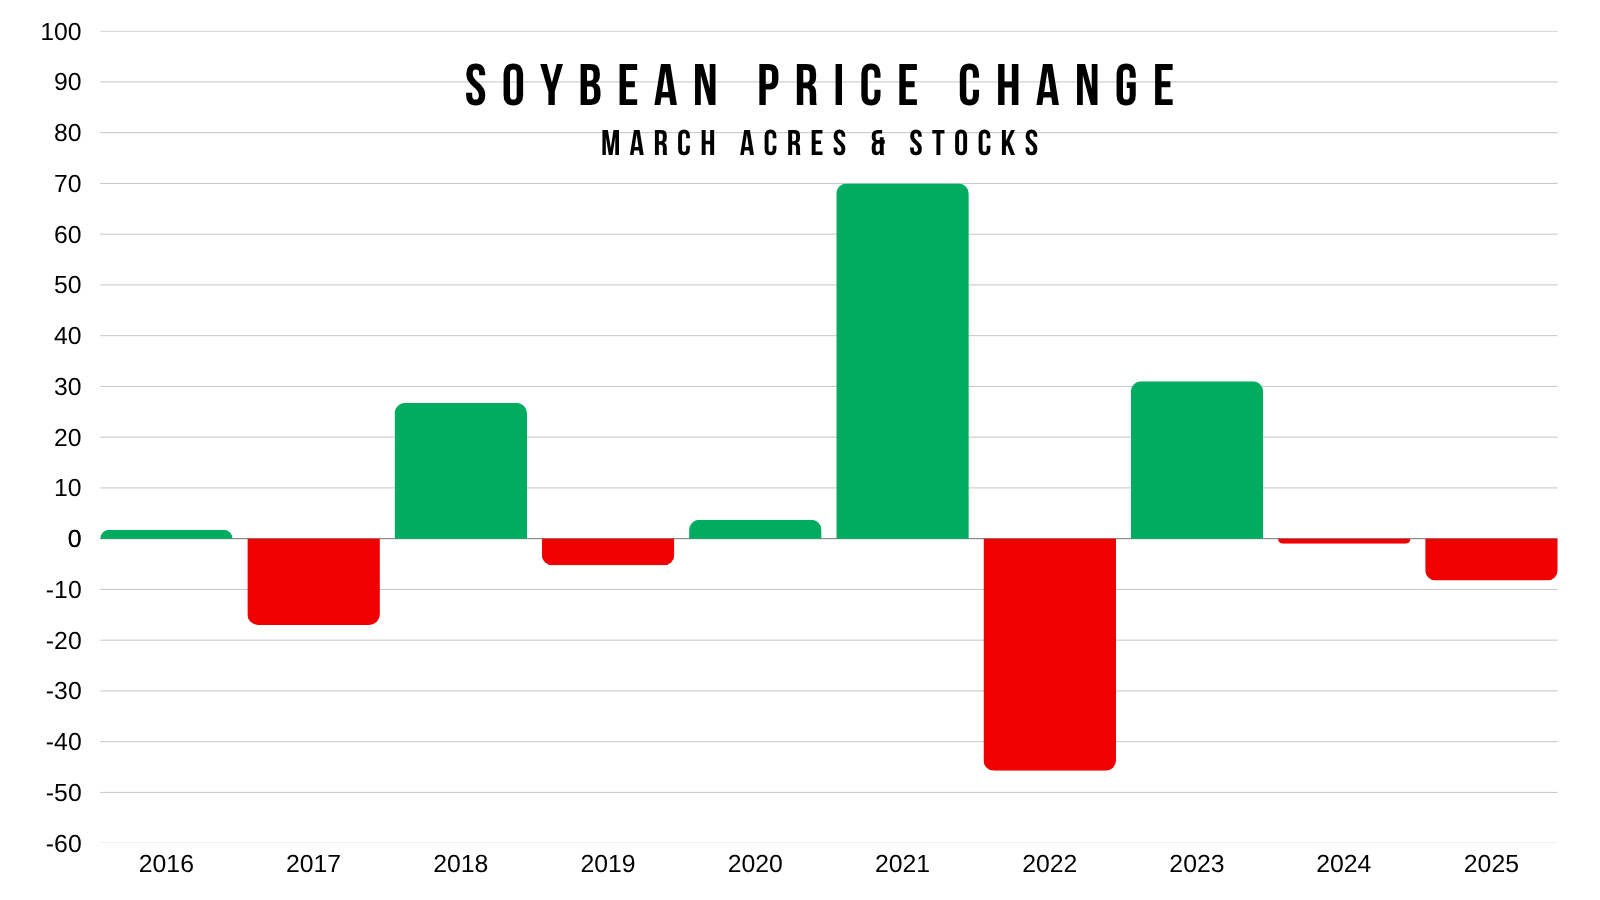
Next for soybeans.
Like corn, the last two years have been tame in comparison to some others.
However, this report has been a coin flip the last decade.
We've traded higher 5 times. We've traded lower 5 times.
🔴 2025: -8 1/4
🔴 2024: -1
🟢 2023: +31
🔴 2022: -45 3/4
🟢 2021: +70
🟢 2020: +3 3/4
🔴 2019: -5 1/4
🟢 2018: +26 3/4
🔴 2017: -17
🟢 2016: +1 3/4
Average Move Past 10 Years = 21 cents
Downside Protection for USDA
The USDA report is on Tuesday.
We've been trading headlines not fundamentals, but a USDA report always offers risks.
If you want upside exposure, you typically buy calls or sell puts.
If you want downside protection, you usually buy puts or sell calls.
Here are a few ways you could protect yourself heading into the report.
First for corn.
Last week we went over a new crop corn strategy that lets you collect over 30 cents with a breakeven between $4.10 and $6.10
If you missed it here are some more details on it.
New Crop Strategy: Click Here to Read
Below is a visual of that strategy*
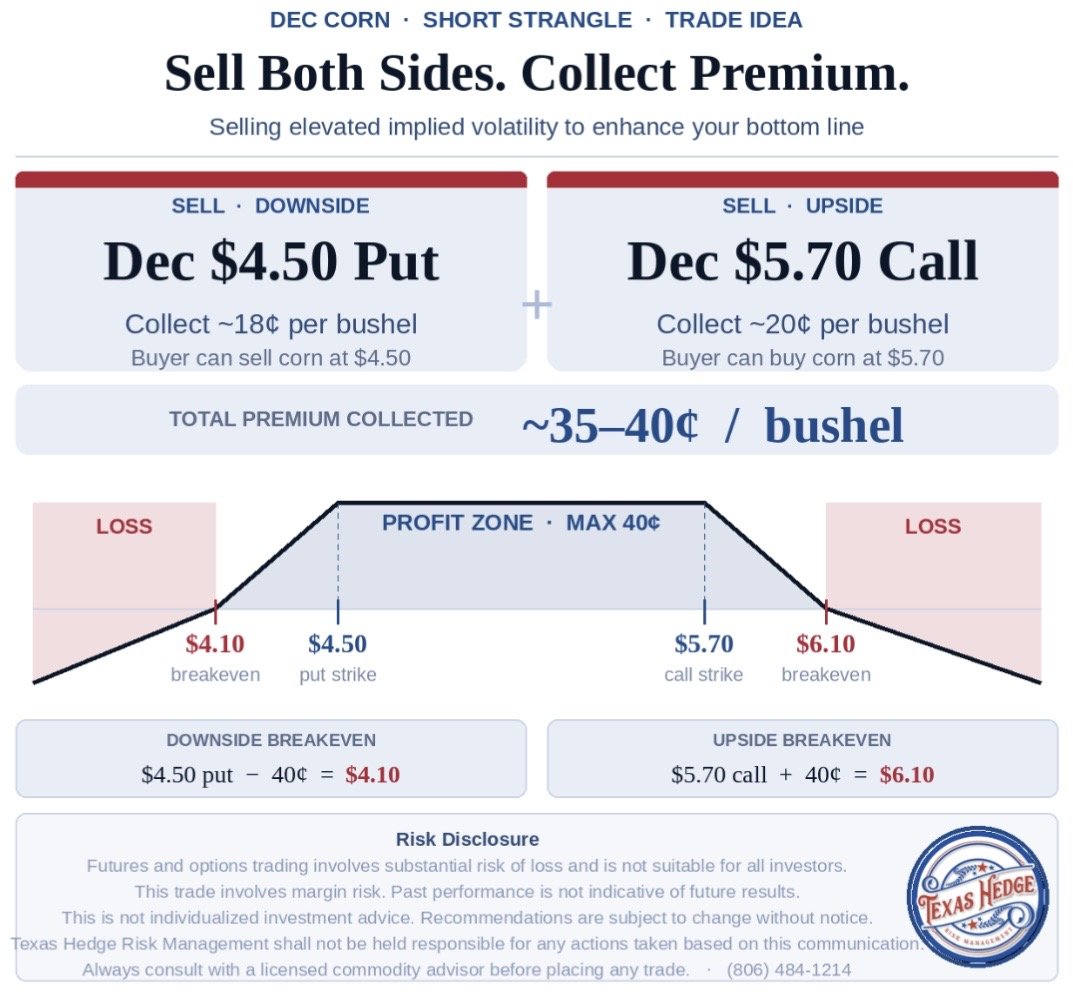
Here are some other strategies for corn.
Strategy 1: Buying May Corn Put
May puts expire April 24th. So they cover you for this USDA report as well as the April 10th USDA report.
Put Strike = $4.70
Put Cost = 14 cents
$4.70 - $0.14 = $4.56 floor
Strategy 2: Sell Dec Call & Buy May Put
Call Strike = $5.30
Call Premium = 25 cents
If you chose to buy May puts, you could consider selling a Dec $5.30 at the same time.
You would collect 25 cents in premium for selling the call.
This would nearly cover the costs of two May puts.
So essentially you get cheap protection for the report while the Dec call premium pays for it.
If the report is neutral or bullish, the May puts expire and you keep the Dec call premiuim to roll or offset storage.
If the report is bearish, the May puts would gain in value.
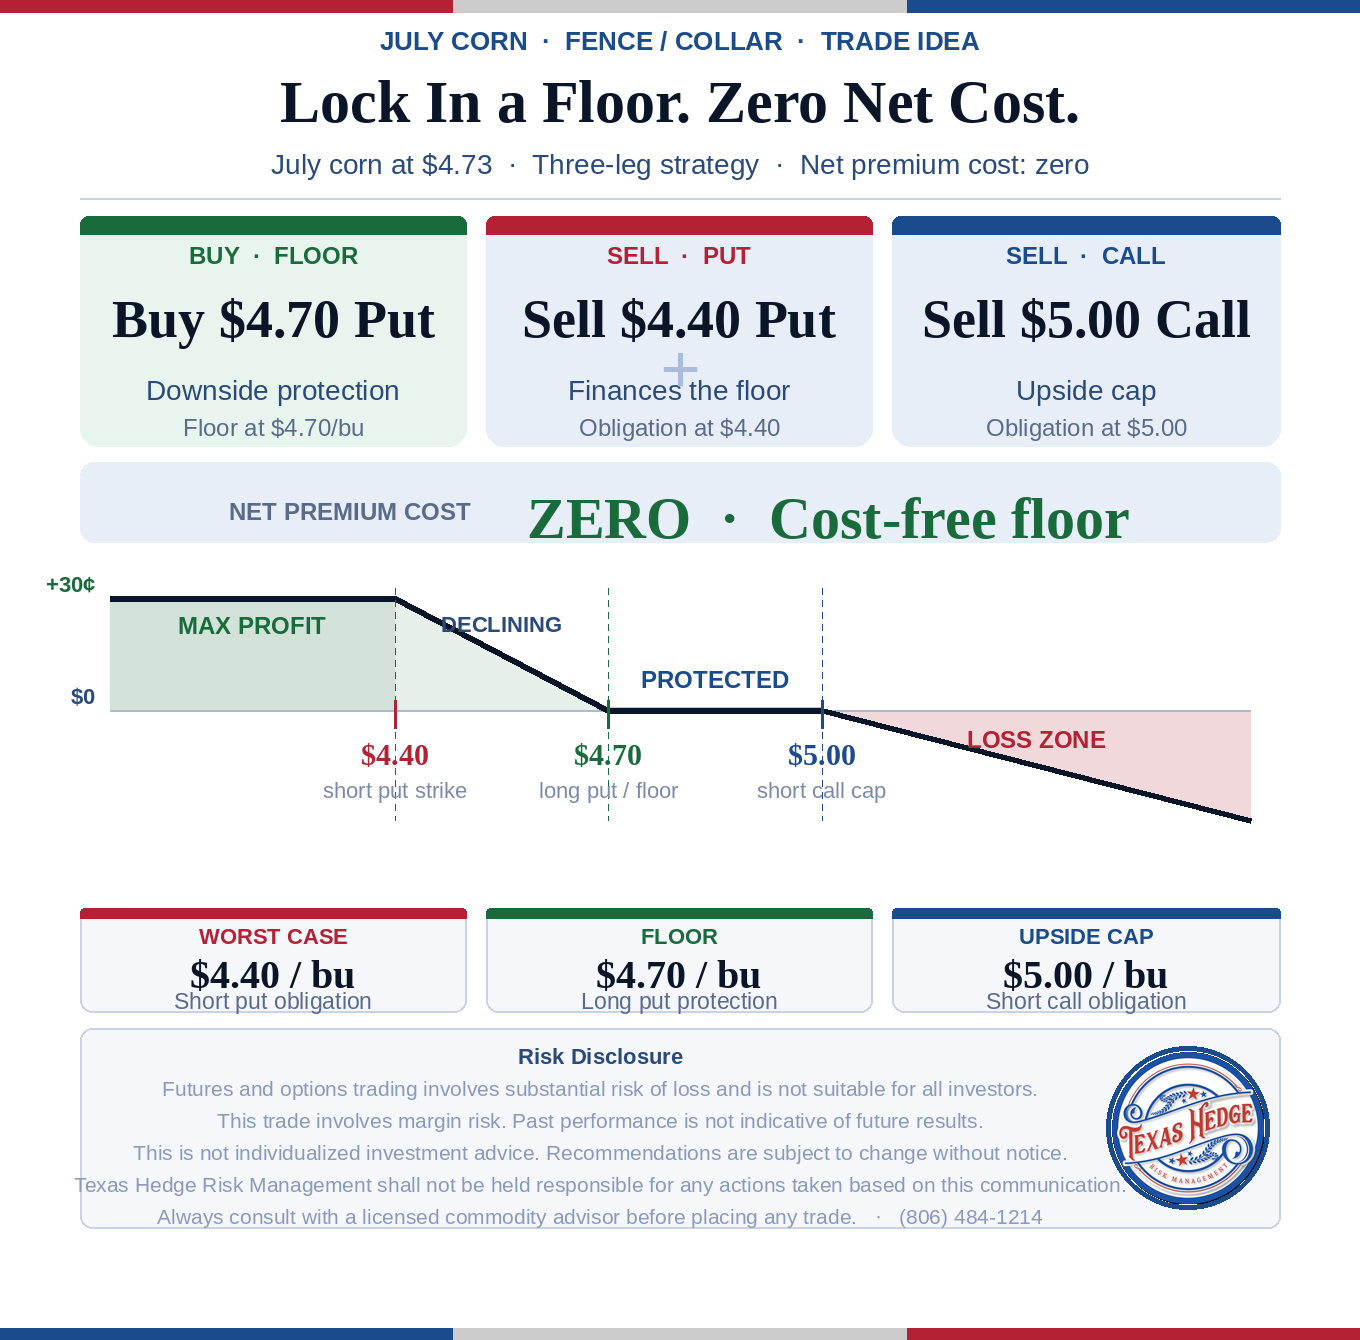
Strategy 3:
Here is another strategy you could consider.
This gives you 30 cents of downside protection for zero cost.
Buy: July $4.70 put
Cost = 25 cents
Sell: July $4.40 put
Credit = 7 cents
Sell: July $5.00 call
Credit = 15 cents
Total Cost = 0 to 3 cents
So you have protection from $4.40 to $4.70, and the trade pays for the protection.
This trade loses money if July corn starts to trade above $5.00, but in the event that happens, you would raise your ceiling via rolling out and or up.
Not everyone should be doing these, as they all offer different risks.
Call or text us if you want to talk it through or put together a game plan.
Office: (806)484-1214
Nex here are some potential downside protection strategies in soybeans.
Strategy 1: Buy May Put
Put Strike = $11.70
Put Cost = 23 cents
$11.70 - $0.23 = $11.47 floor
Strategy 2: Sell Nov Call & Buy May Put
The puts are somewhat expensive, so if you choose to buy a May put, you could also consider selling a Nov $13.00 call for a 20 credit.
Which would pay for the May put if you are comfortable selling calls.
Again this isn’t for everyone and offers risks, so reach out if you have questions.
Office: (806)484-1214
Today's Main Takeaways
Corn
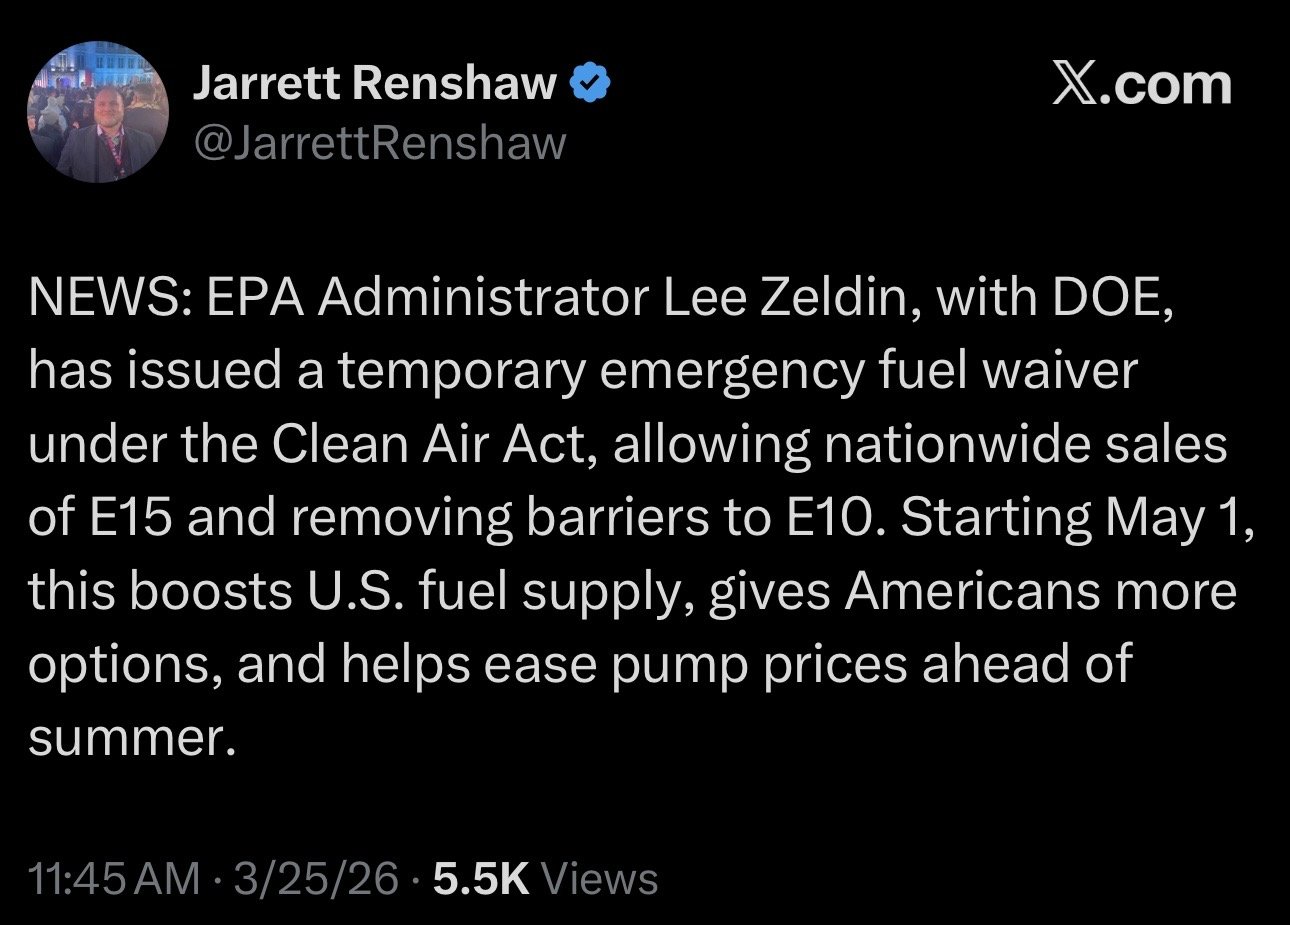
E-15 Story Today:
This morning the EPA announced a temporary emergency fuel waiver today to compact surging gas prices.
This allows the nationwide sales of E15 and allows it to run through the summer.
But in all honesty this isn’t something that is new.
We've seen this happen several years now since 2019, and I view this as mostly a non event.
Where the acres and stocks come in next week will be important.
But this is currently still a headline-driven market being driven by the funds.
I do not know when this war will end or how high crude will or won’t go.
My biggest concern is that when this war subsides, crude falls apart and corn follows along for the ride at least short term.
You could argue that if crude stays above $100 for a few months, corn should catch a bid.
But you could also argue that if crude falls out of bed, corn should follow.
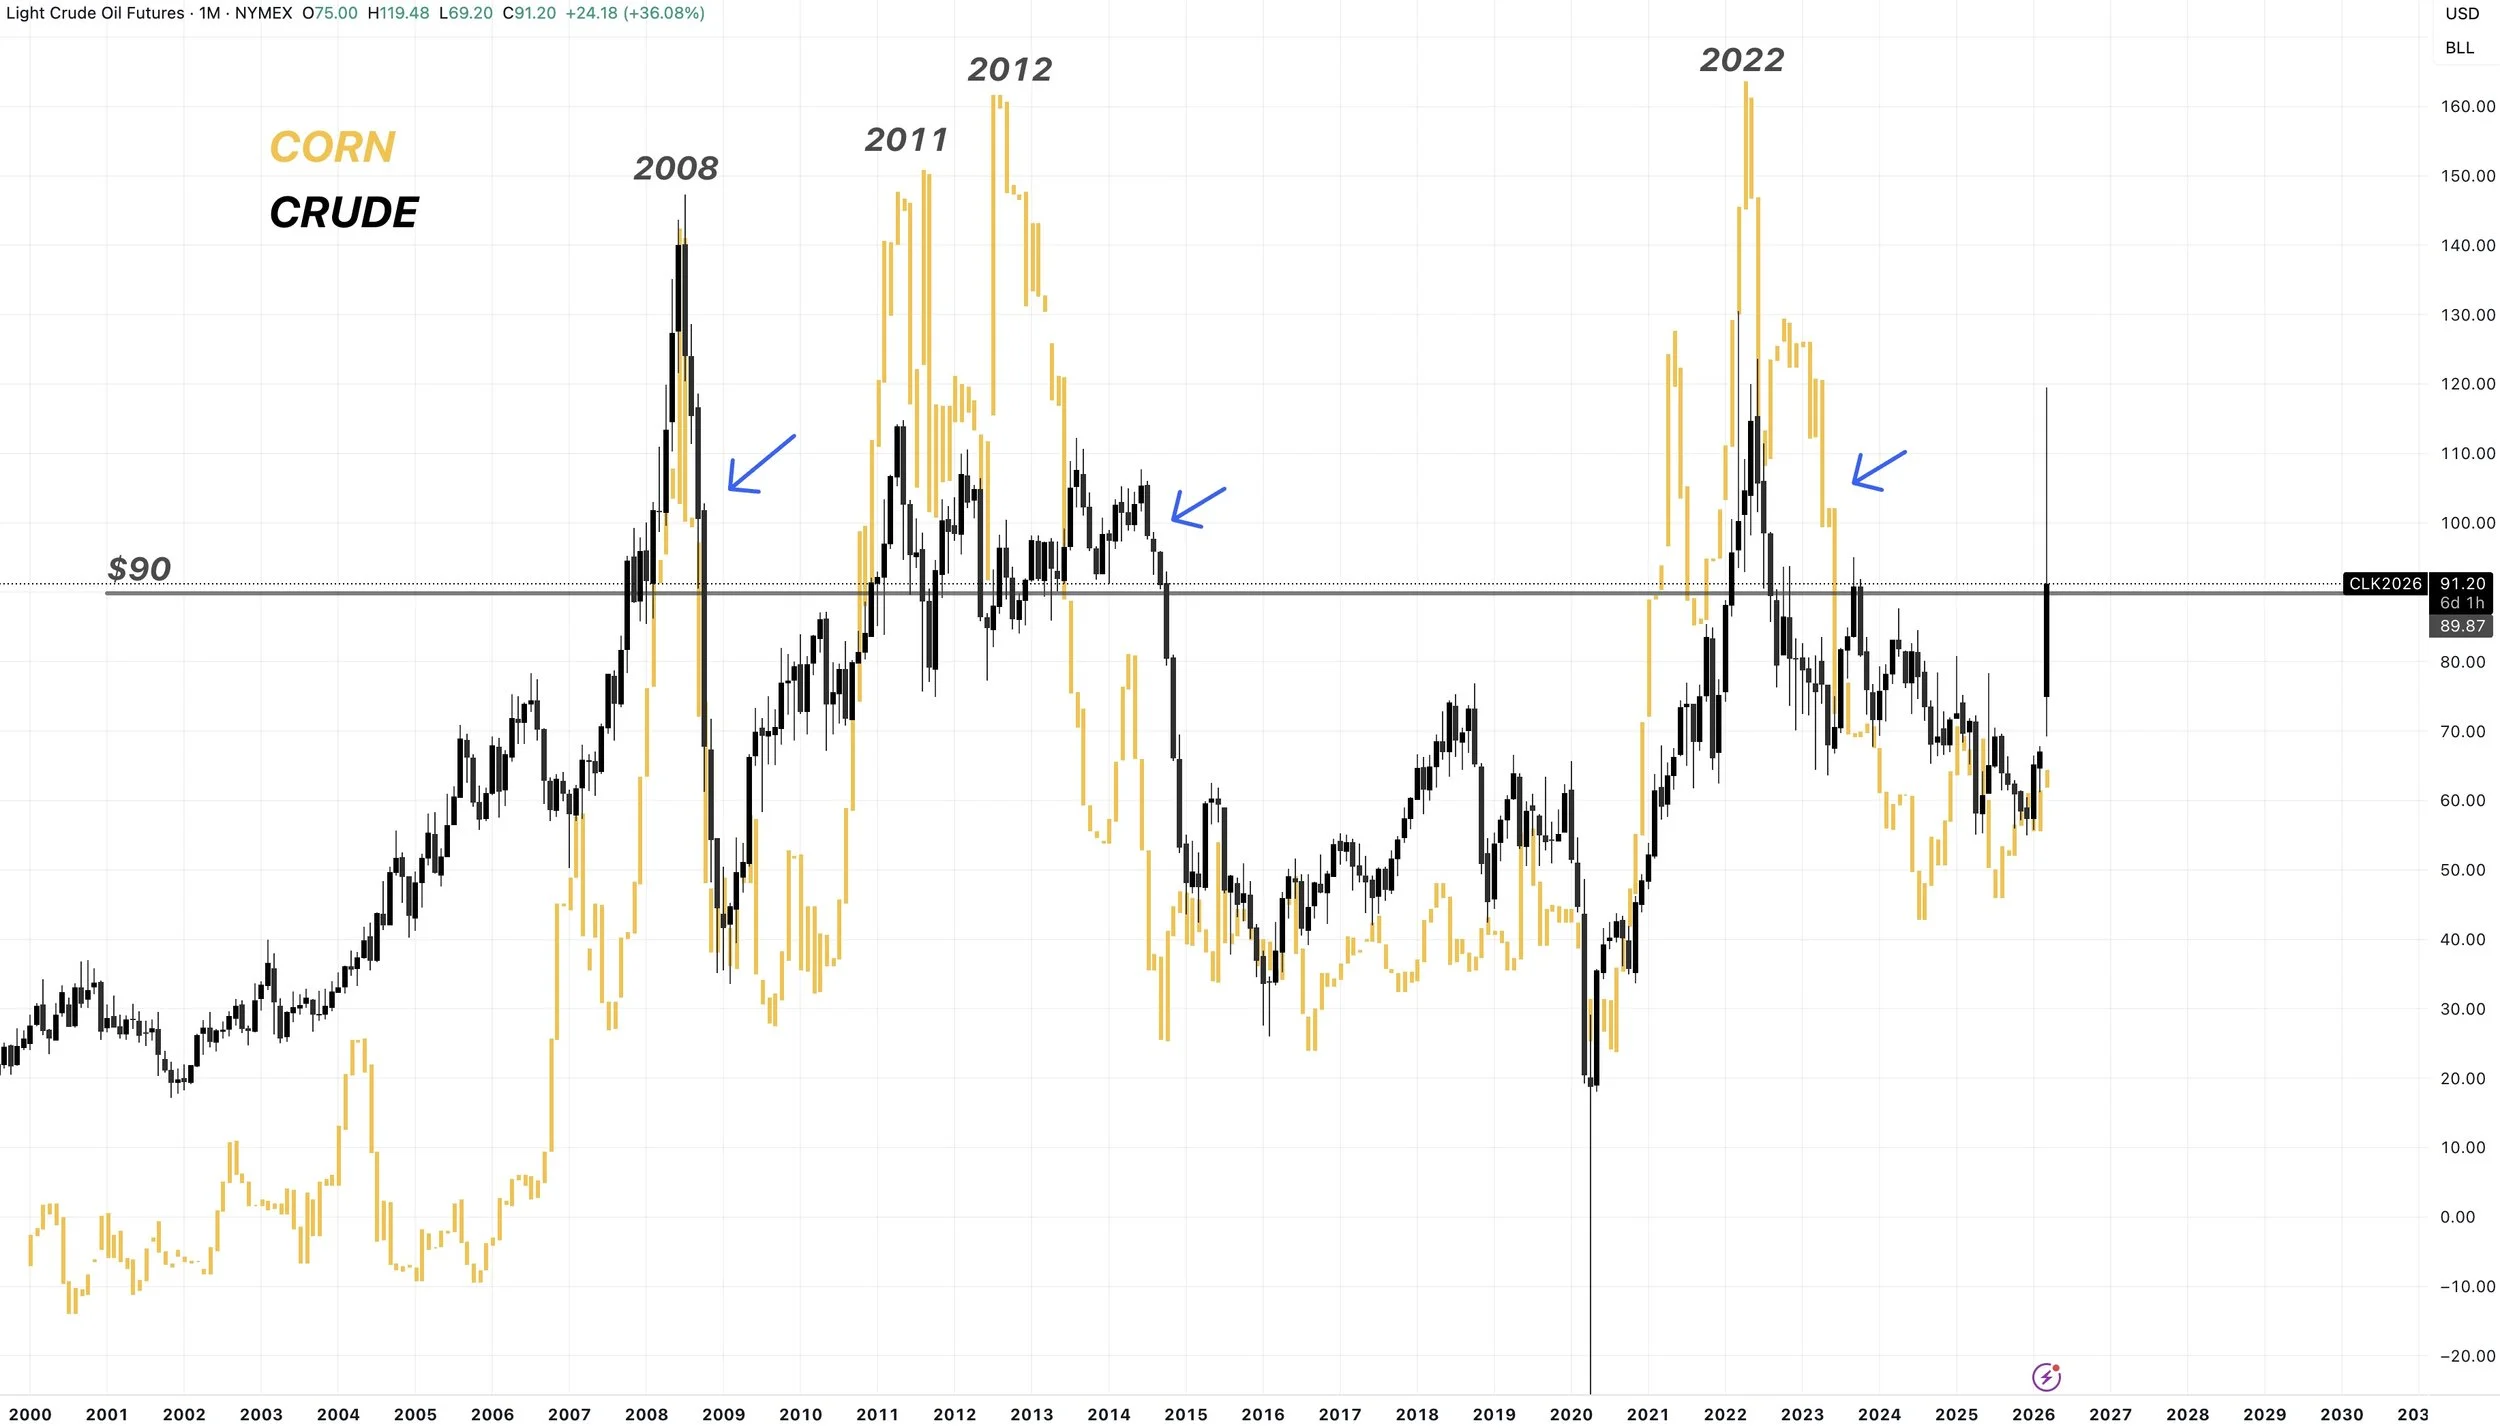
Crude absolutely could stay elevated or go to $150 if this war doesn’t get resolved. Totally possible.
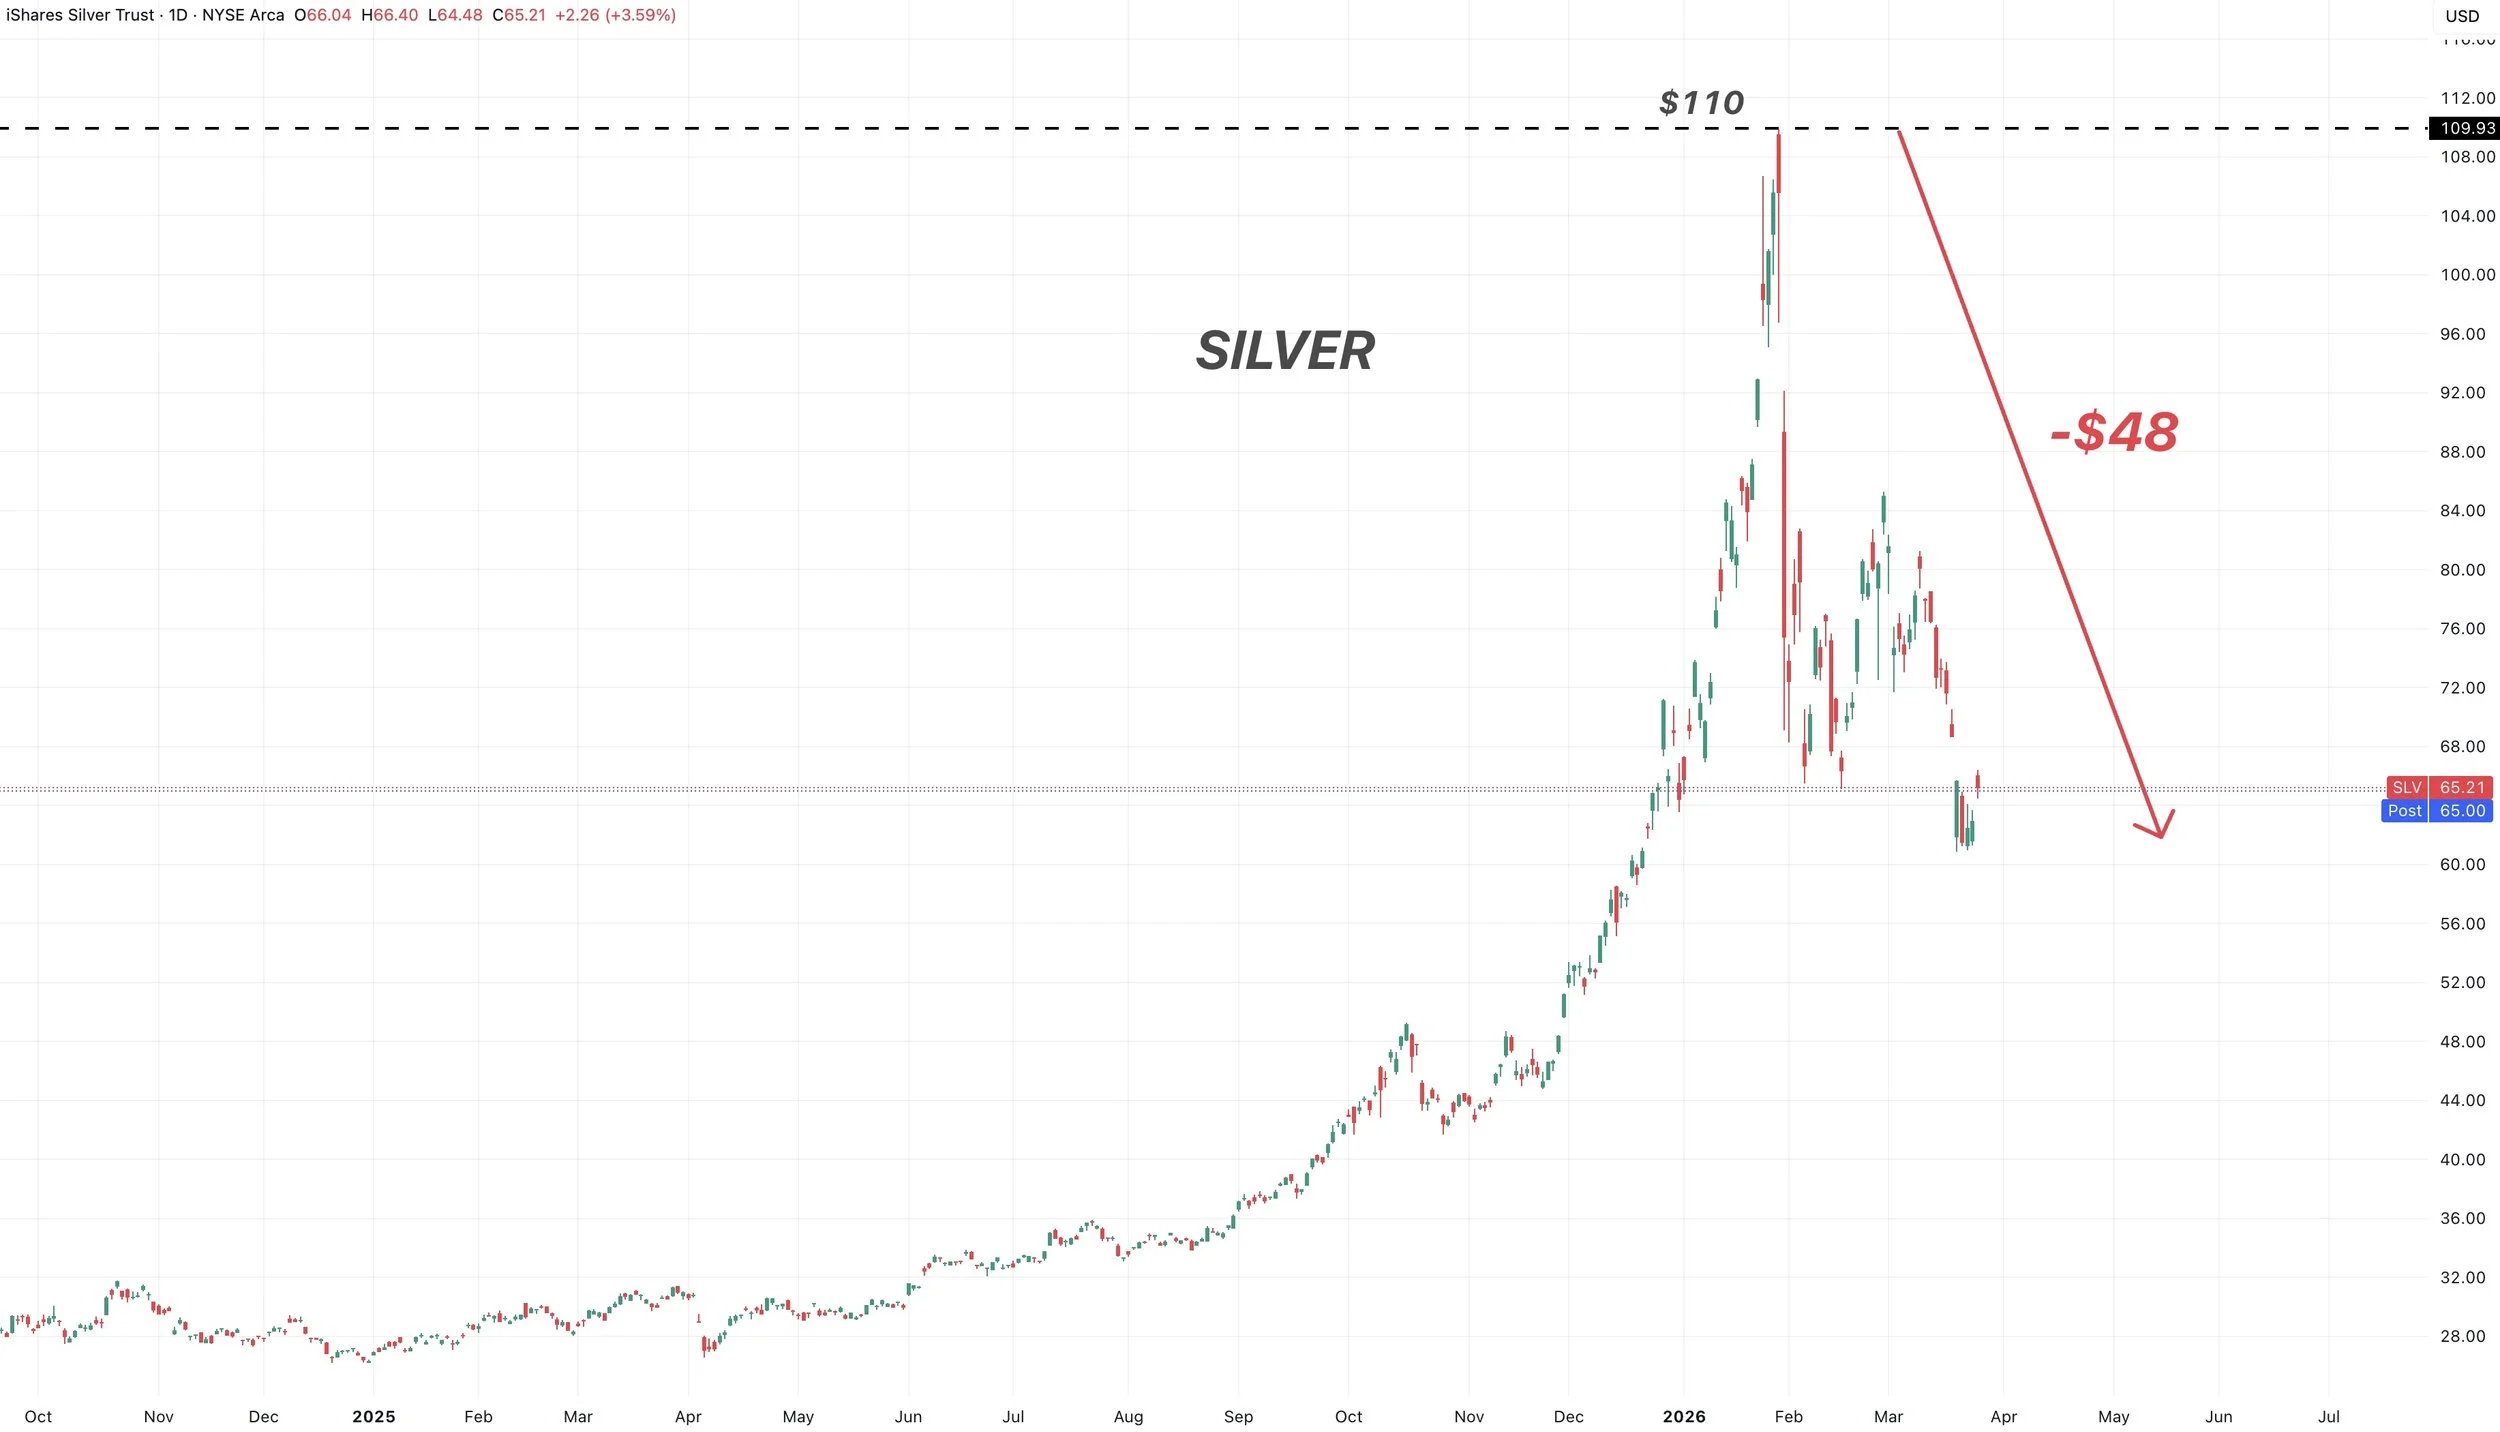
But to me, this has a somewhat similar feeling to silver not too long ago.
The rallies in the two are completely different, but when silver got to $100, everyone was super bullish and calling for $200.
Silver is now down $45 of those highs and trading at $65.
We have to keep in mind just how fast some of these things like crude can turn around.
This has not been a rally driven by fundamentals.
It's been driven by money flow.
So there has to be a reason for caution if and when this war story fades.
Now yes.. there could at some point be a reason for a fundamental rally that isn’t driven by war.
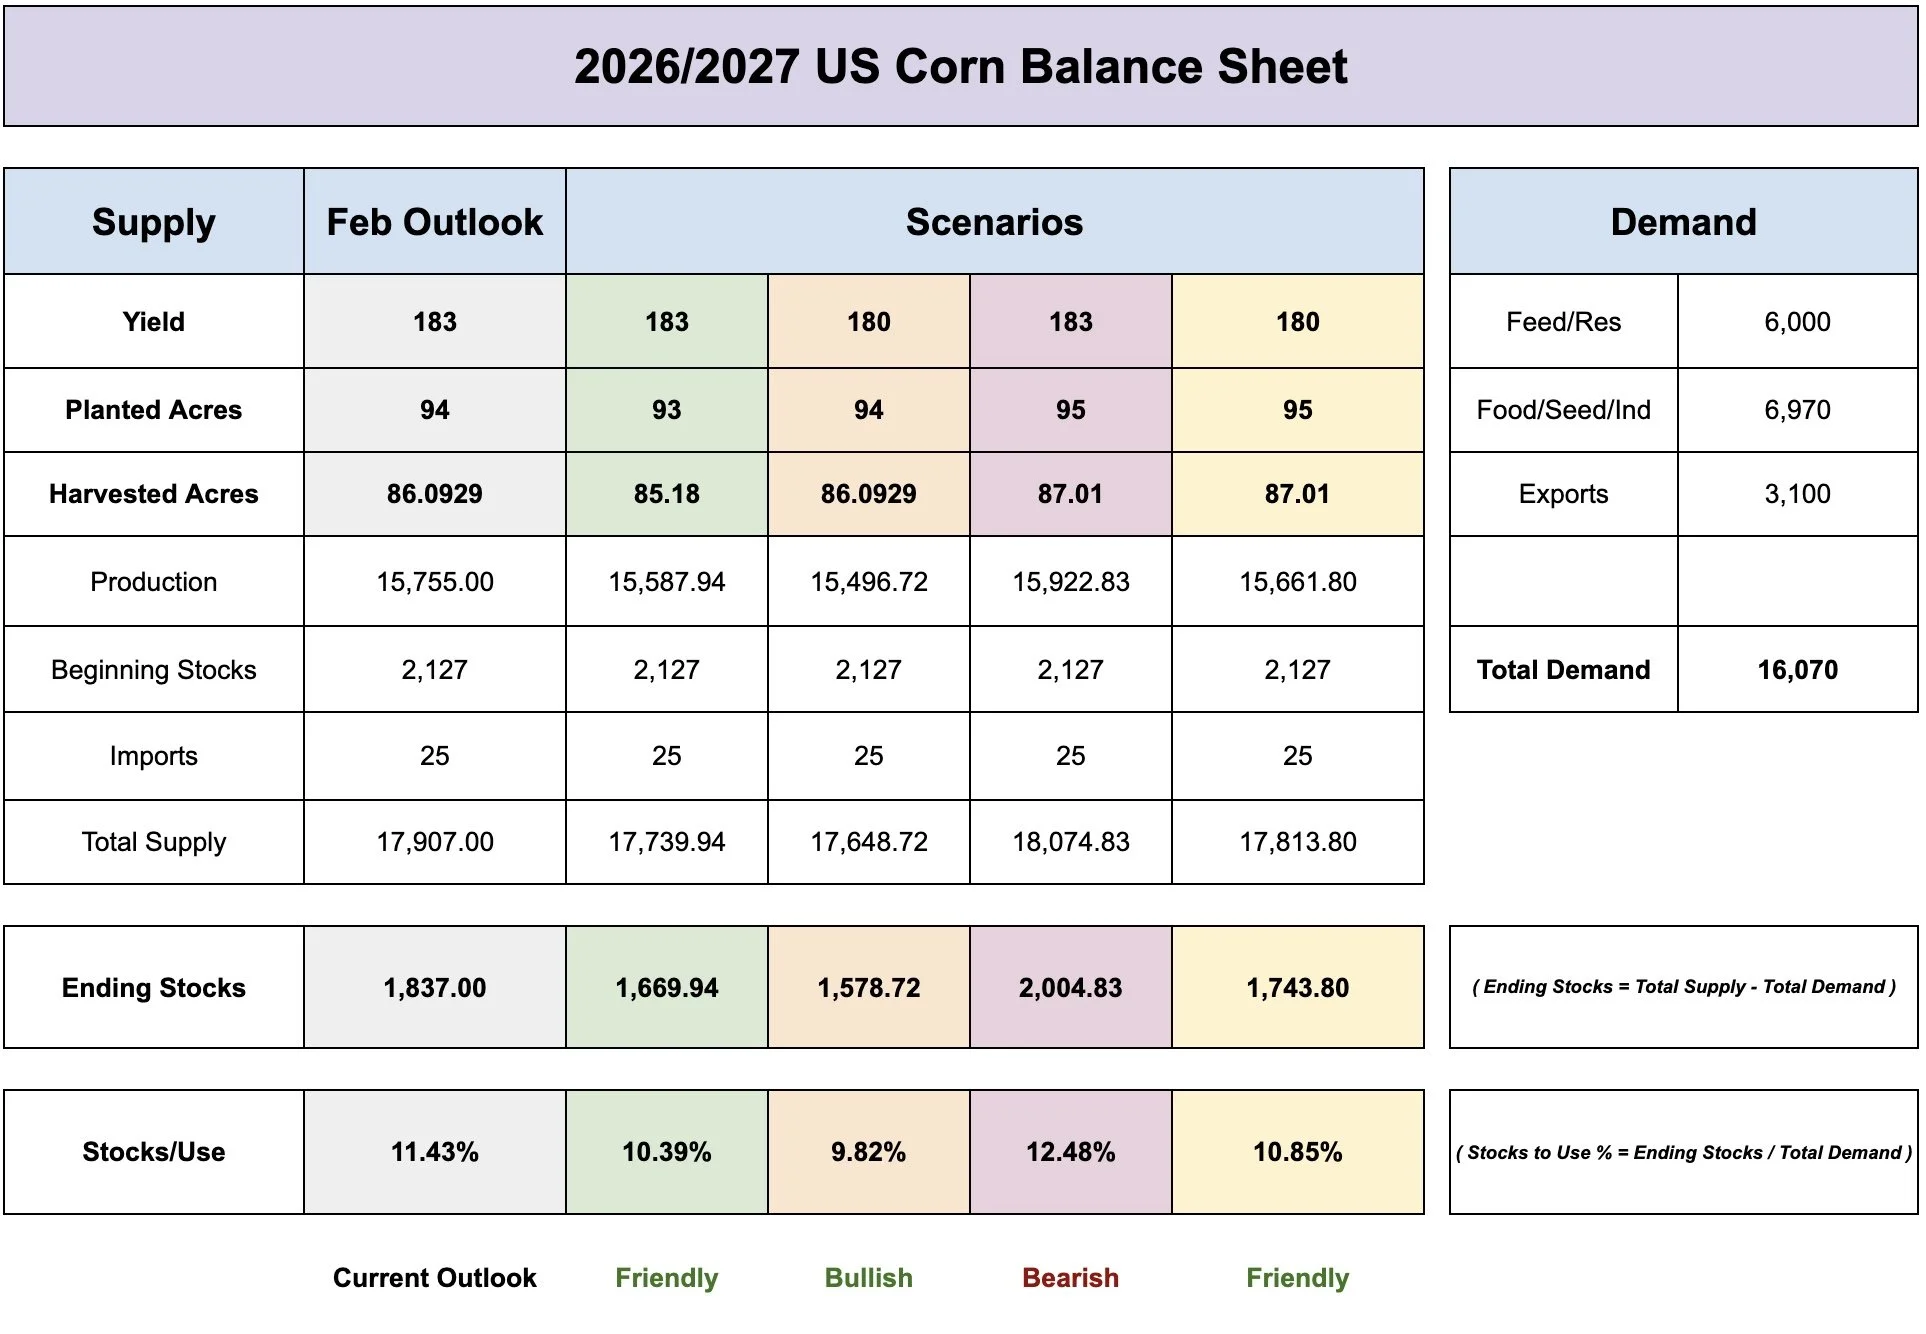
I mean, there is still a "potential path" for a relatively tight situation in new crop corn.
We have an entire growing season still ahead of us.
What if we don’t raise a big crop? What if we run into some weather issues? What if acres come down?
I've gone over these balance sheet scenarios before. Below is a few of them based on the Feb Outlook demand numbers.
A lot will hinge on acres. If acres do come in on the light side, things get interesting fast.
Either way, we might need a big yield to keep the balance sheet large.
So at some point, we might have a reason besides war to rally, but for now that is what it's all about.
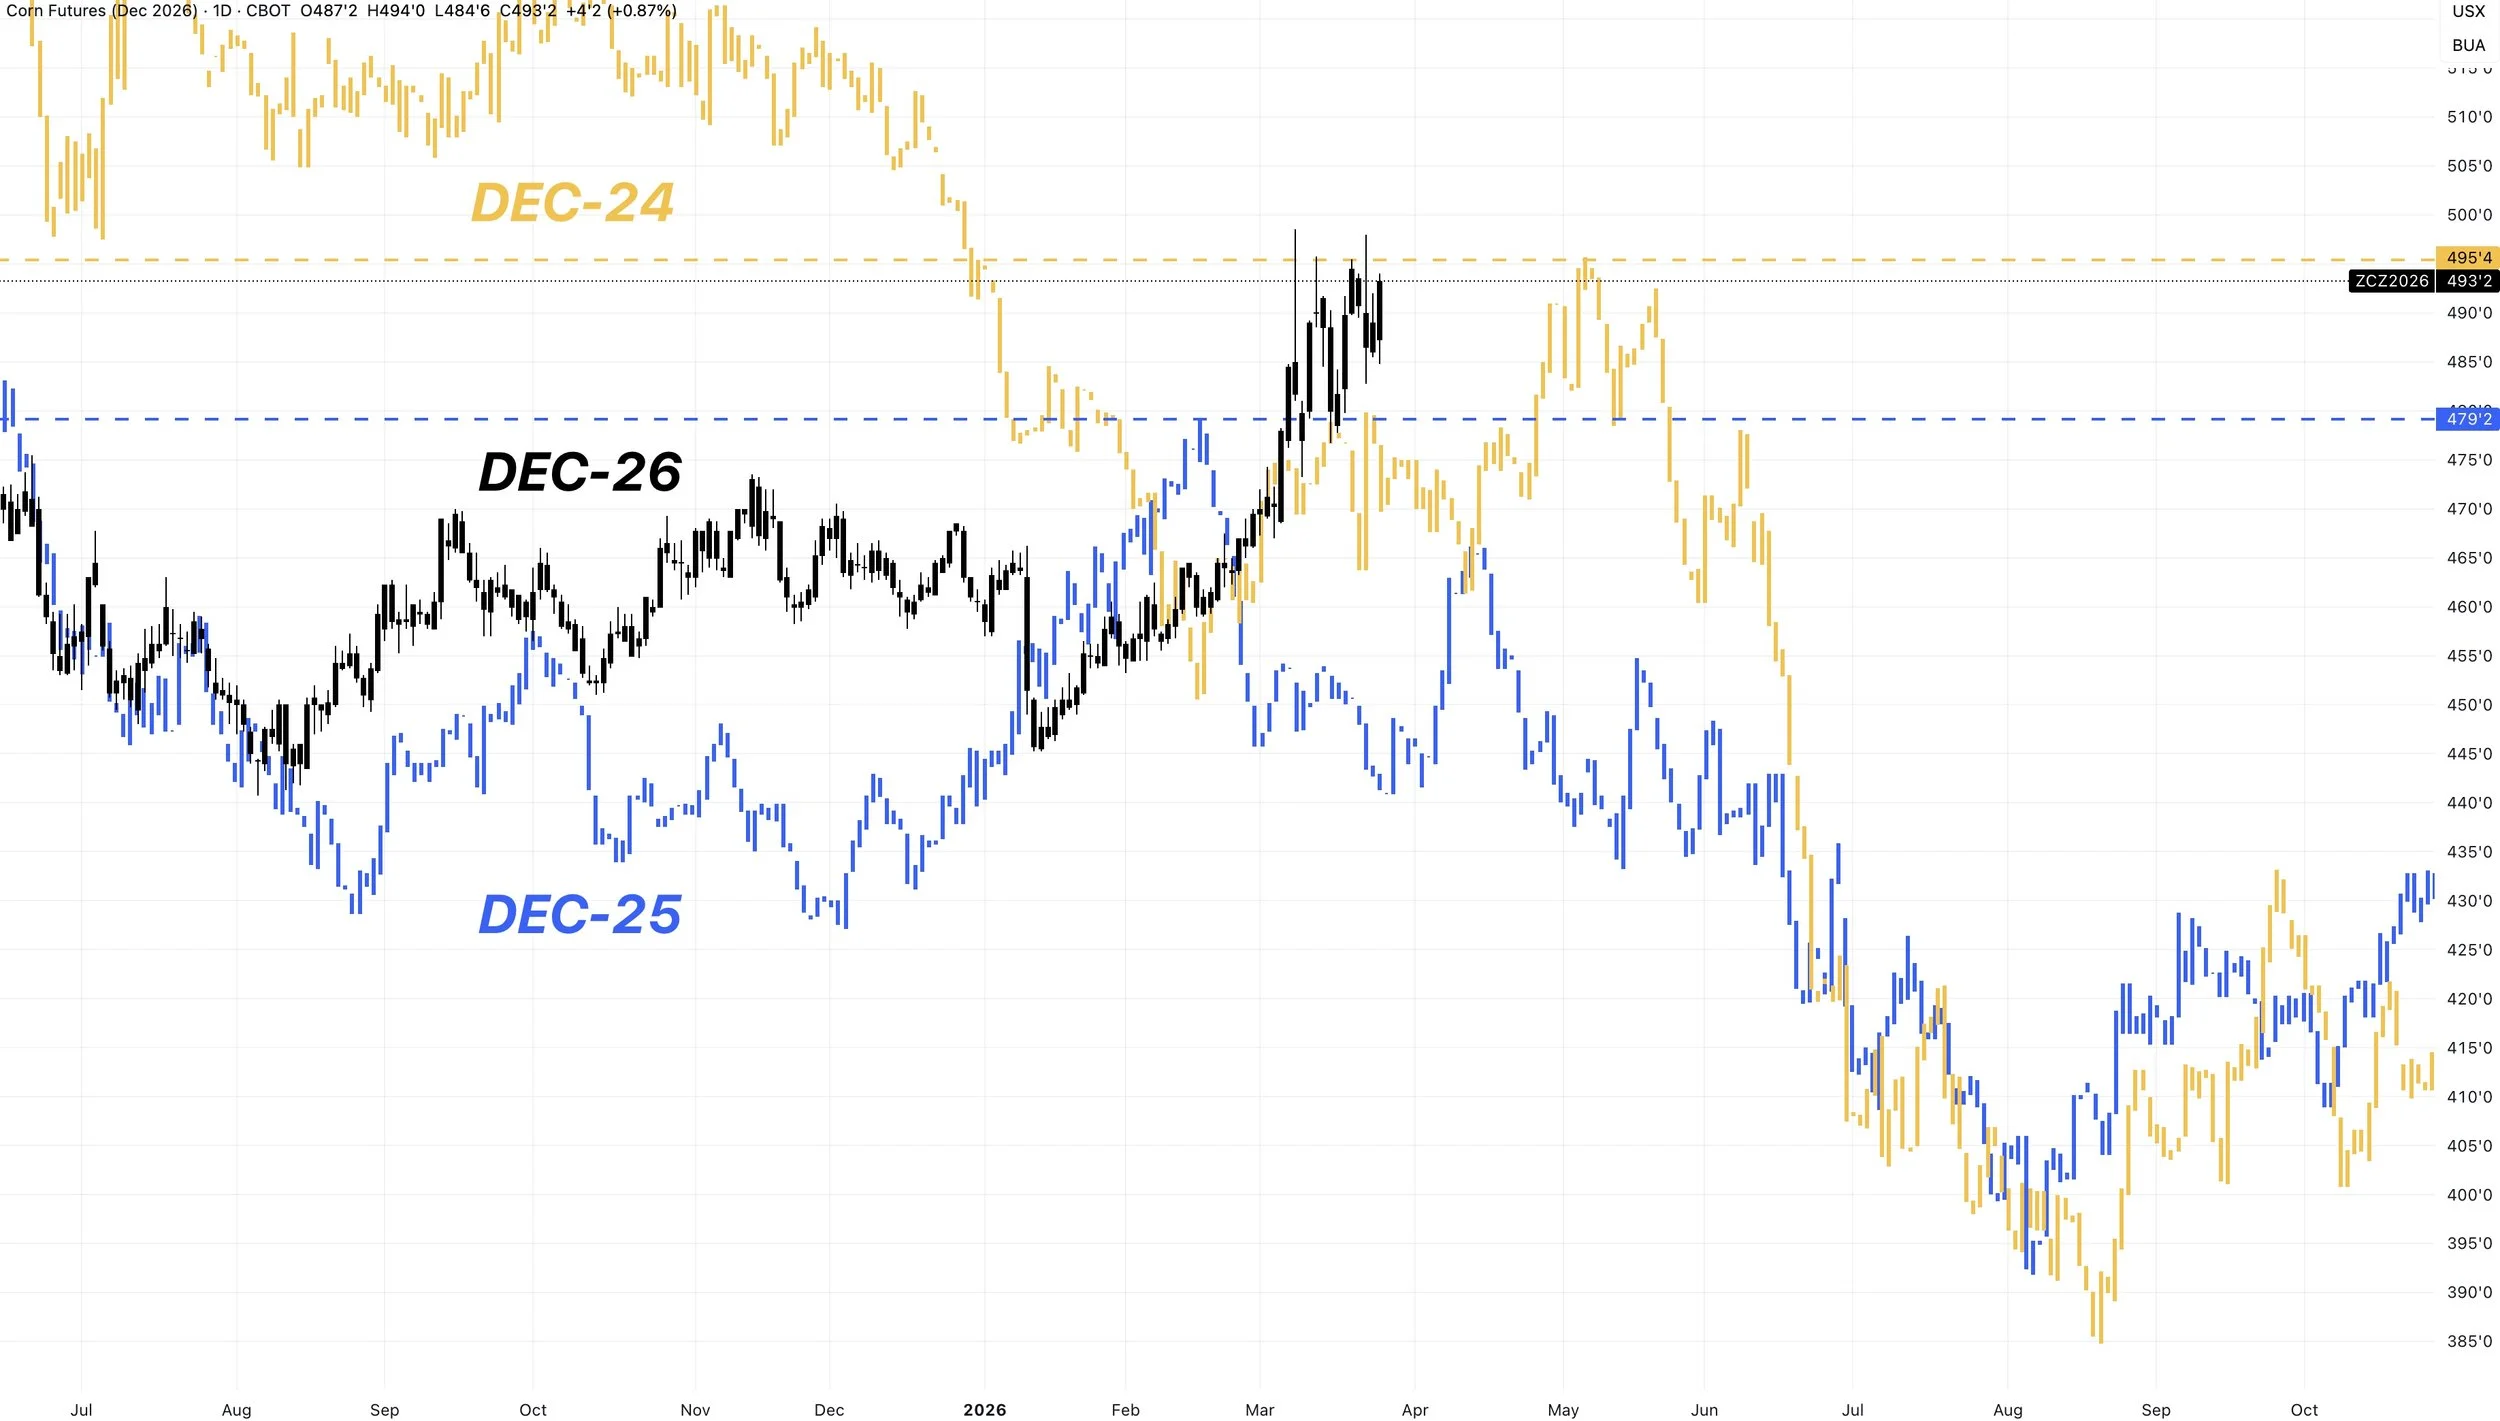
I've shown this next chart recently.
Dec corn is sitting at 2-year highs.
We are higher than we were the entire year last year.
In 2024, this was as high as we got.
2026
Current Price: $4.93
2025
Highest Price: $4.79
2024
Highest Price: $4.96
I am not saying go out and sell everything or get yourselves oversold at all. Especially if you are someone who doesn’t have your inputs locked in.
The price "potential" is certainly higher this year than in the past two years.
However, 2-year highs are a reason to do something if you are behind or haven’t done much of anything at all.
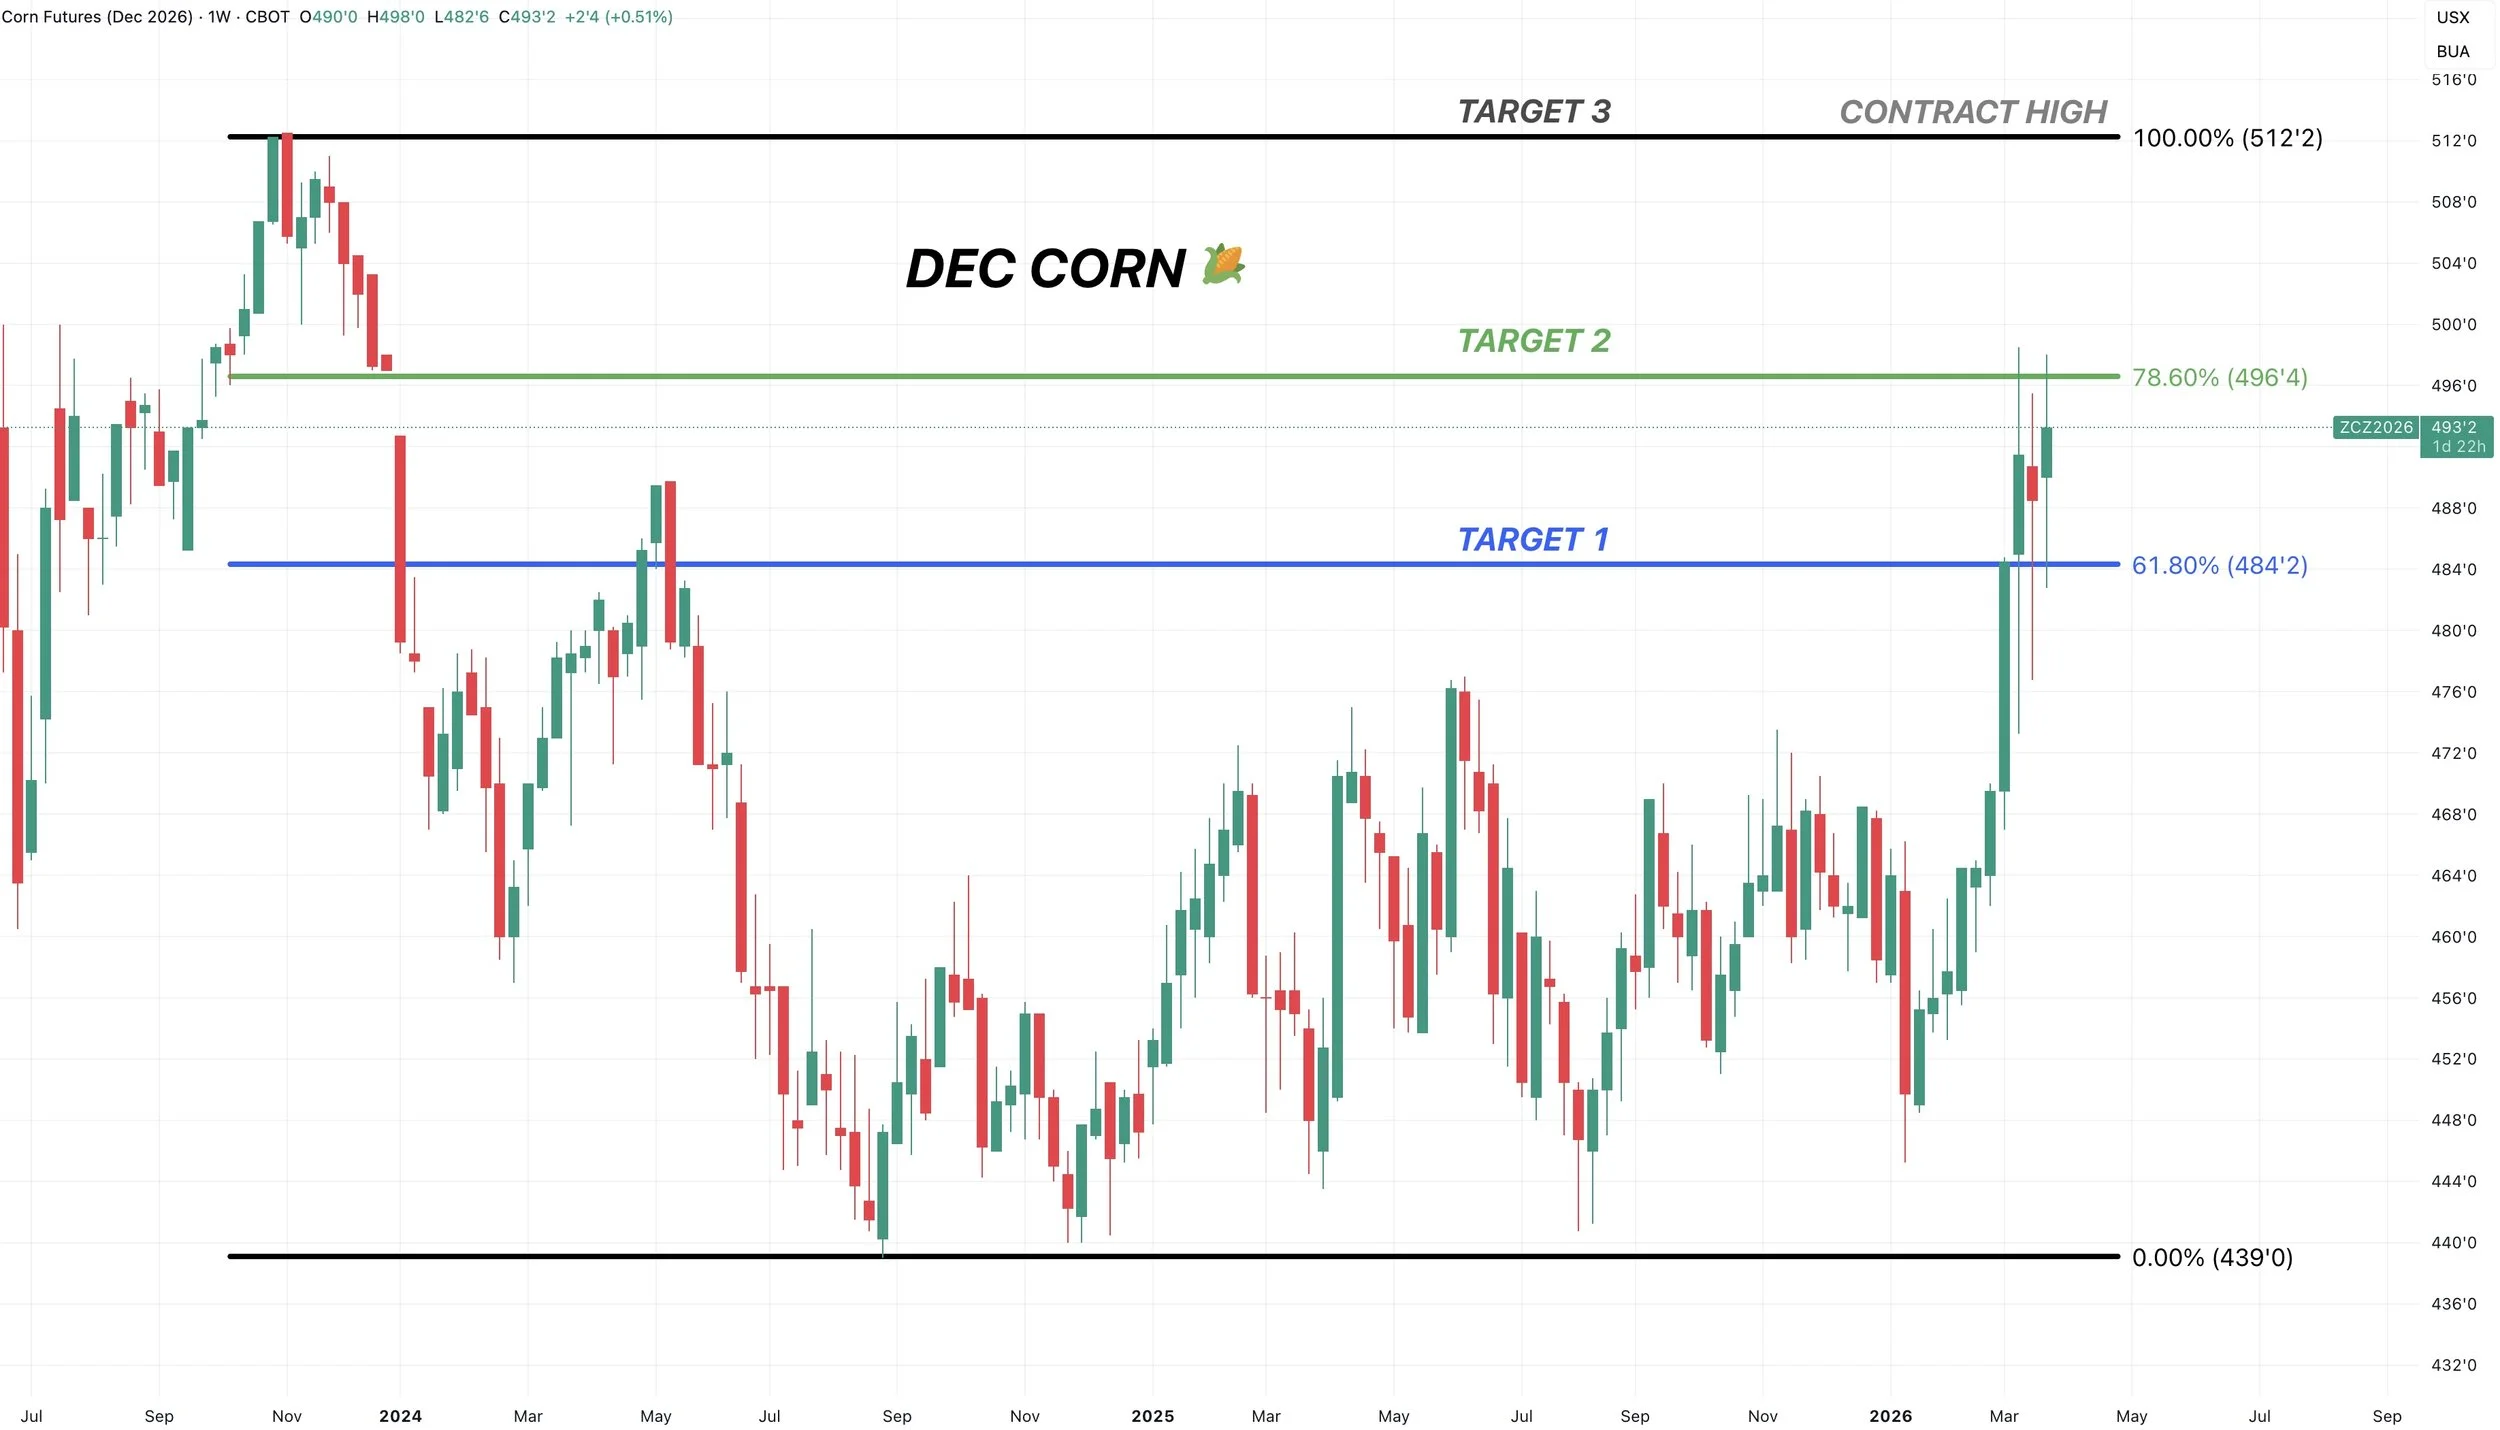
Dec Weekly Corn:
We once again hit that 2nd target on Sunday night.
I have yet to issue a sell signal at that level as each time has been on a Sunday night.
So if you haven’t taken risk off at this level, that is still the target.
$4.96 is 78.6% of the contract highs and where we left a big gap.
Next target after this is contract highs at $5.12
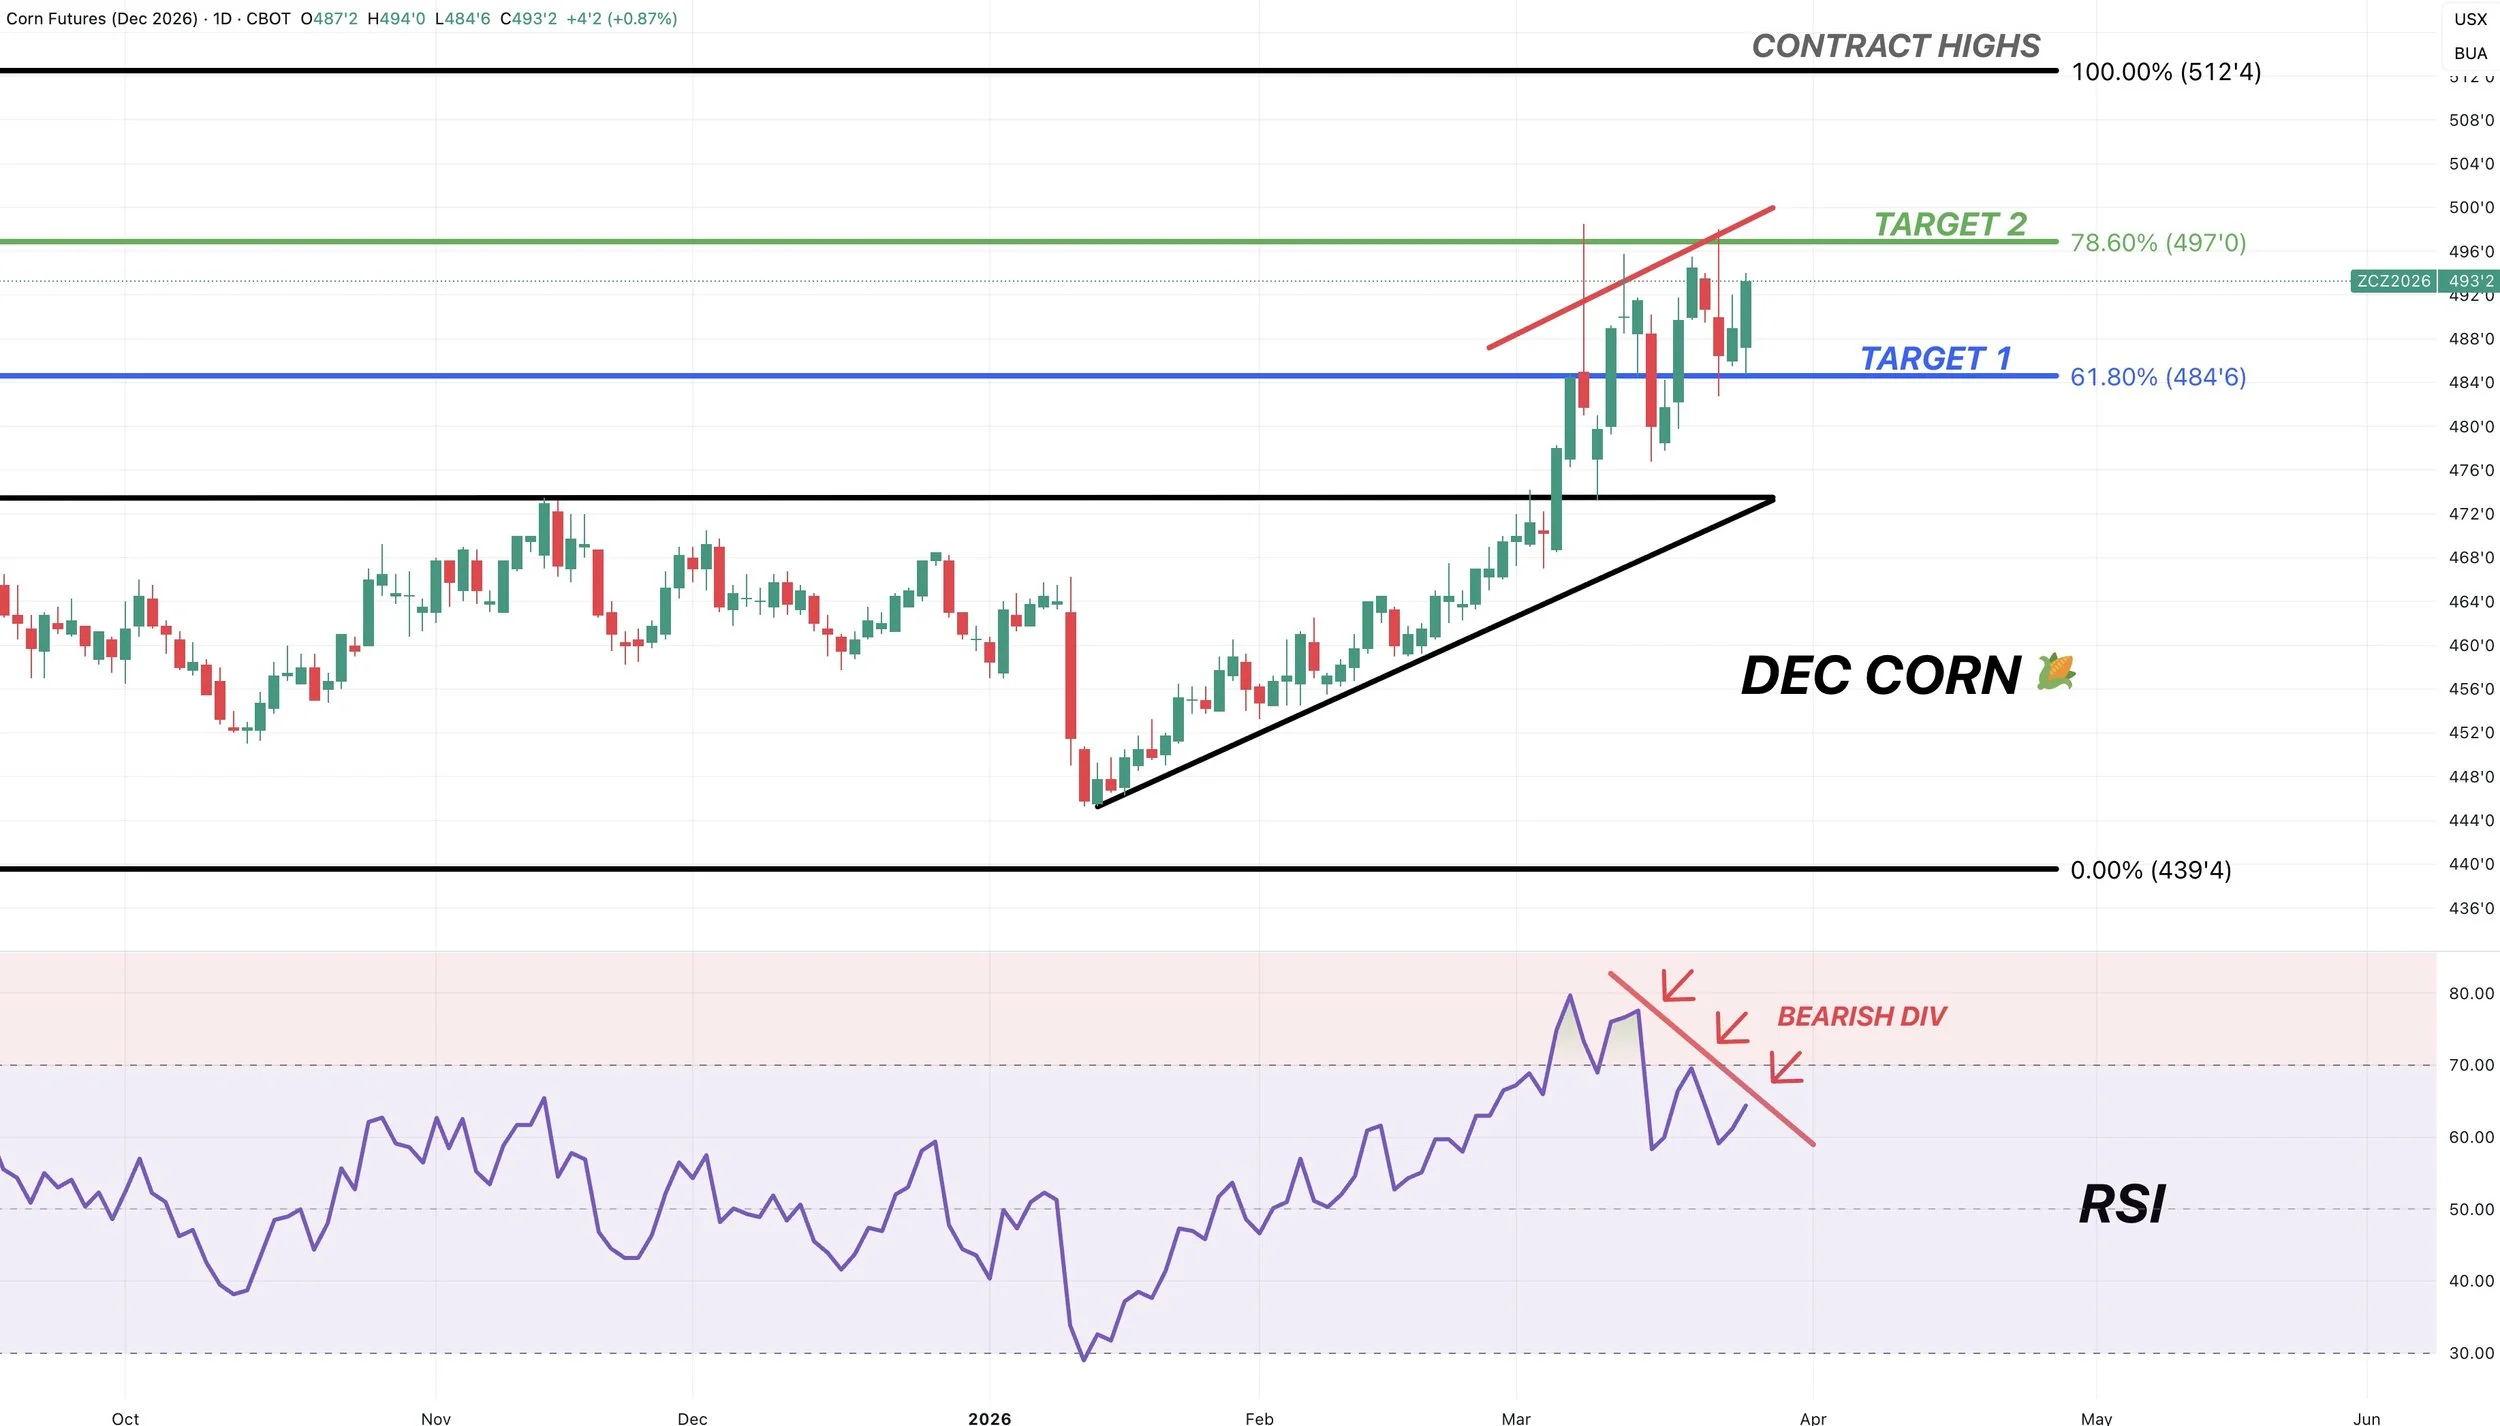
Dec Daily Chart:
We posted an outside up day on all the contracts today. We took out yesterday’s lows but closed above yesterday’s highs. So that is often a good sign.
However, we are showing some clear bearish divergence on the RSI.
This doesn’t mean we have to crash tomorrow.
This is often just a warning sign that upside momentum is starting to slow down.
A reason to start considering defending these levels.
If we get an up day tomorrow, I will likely be sending a signal and looking to take some additional chips off the table.
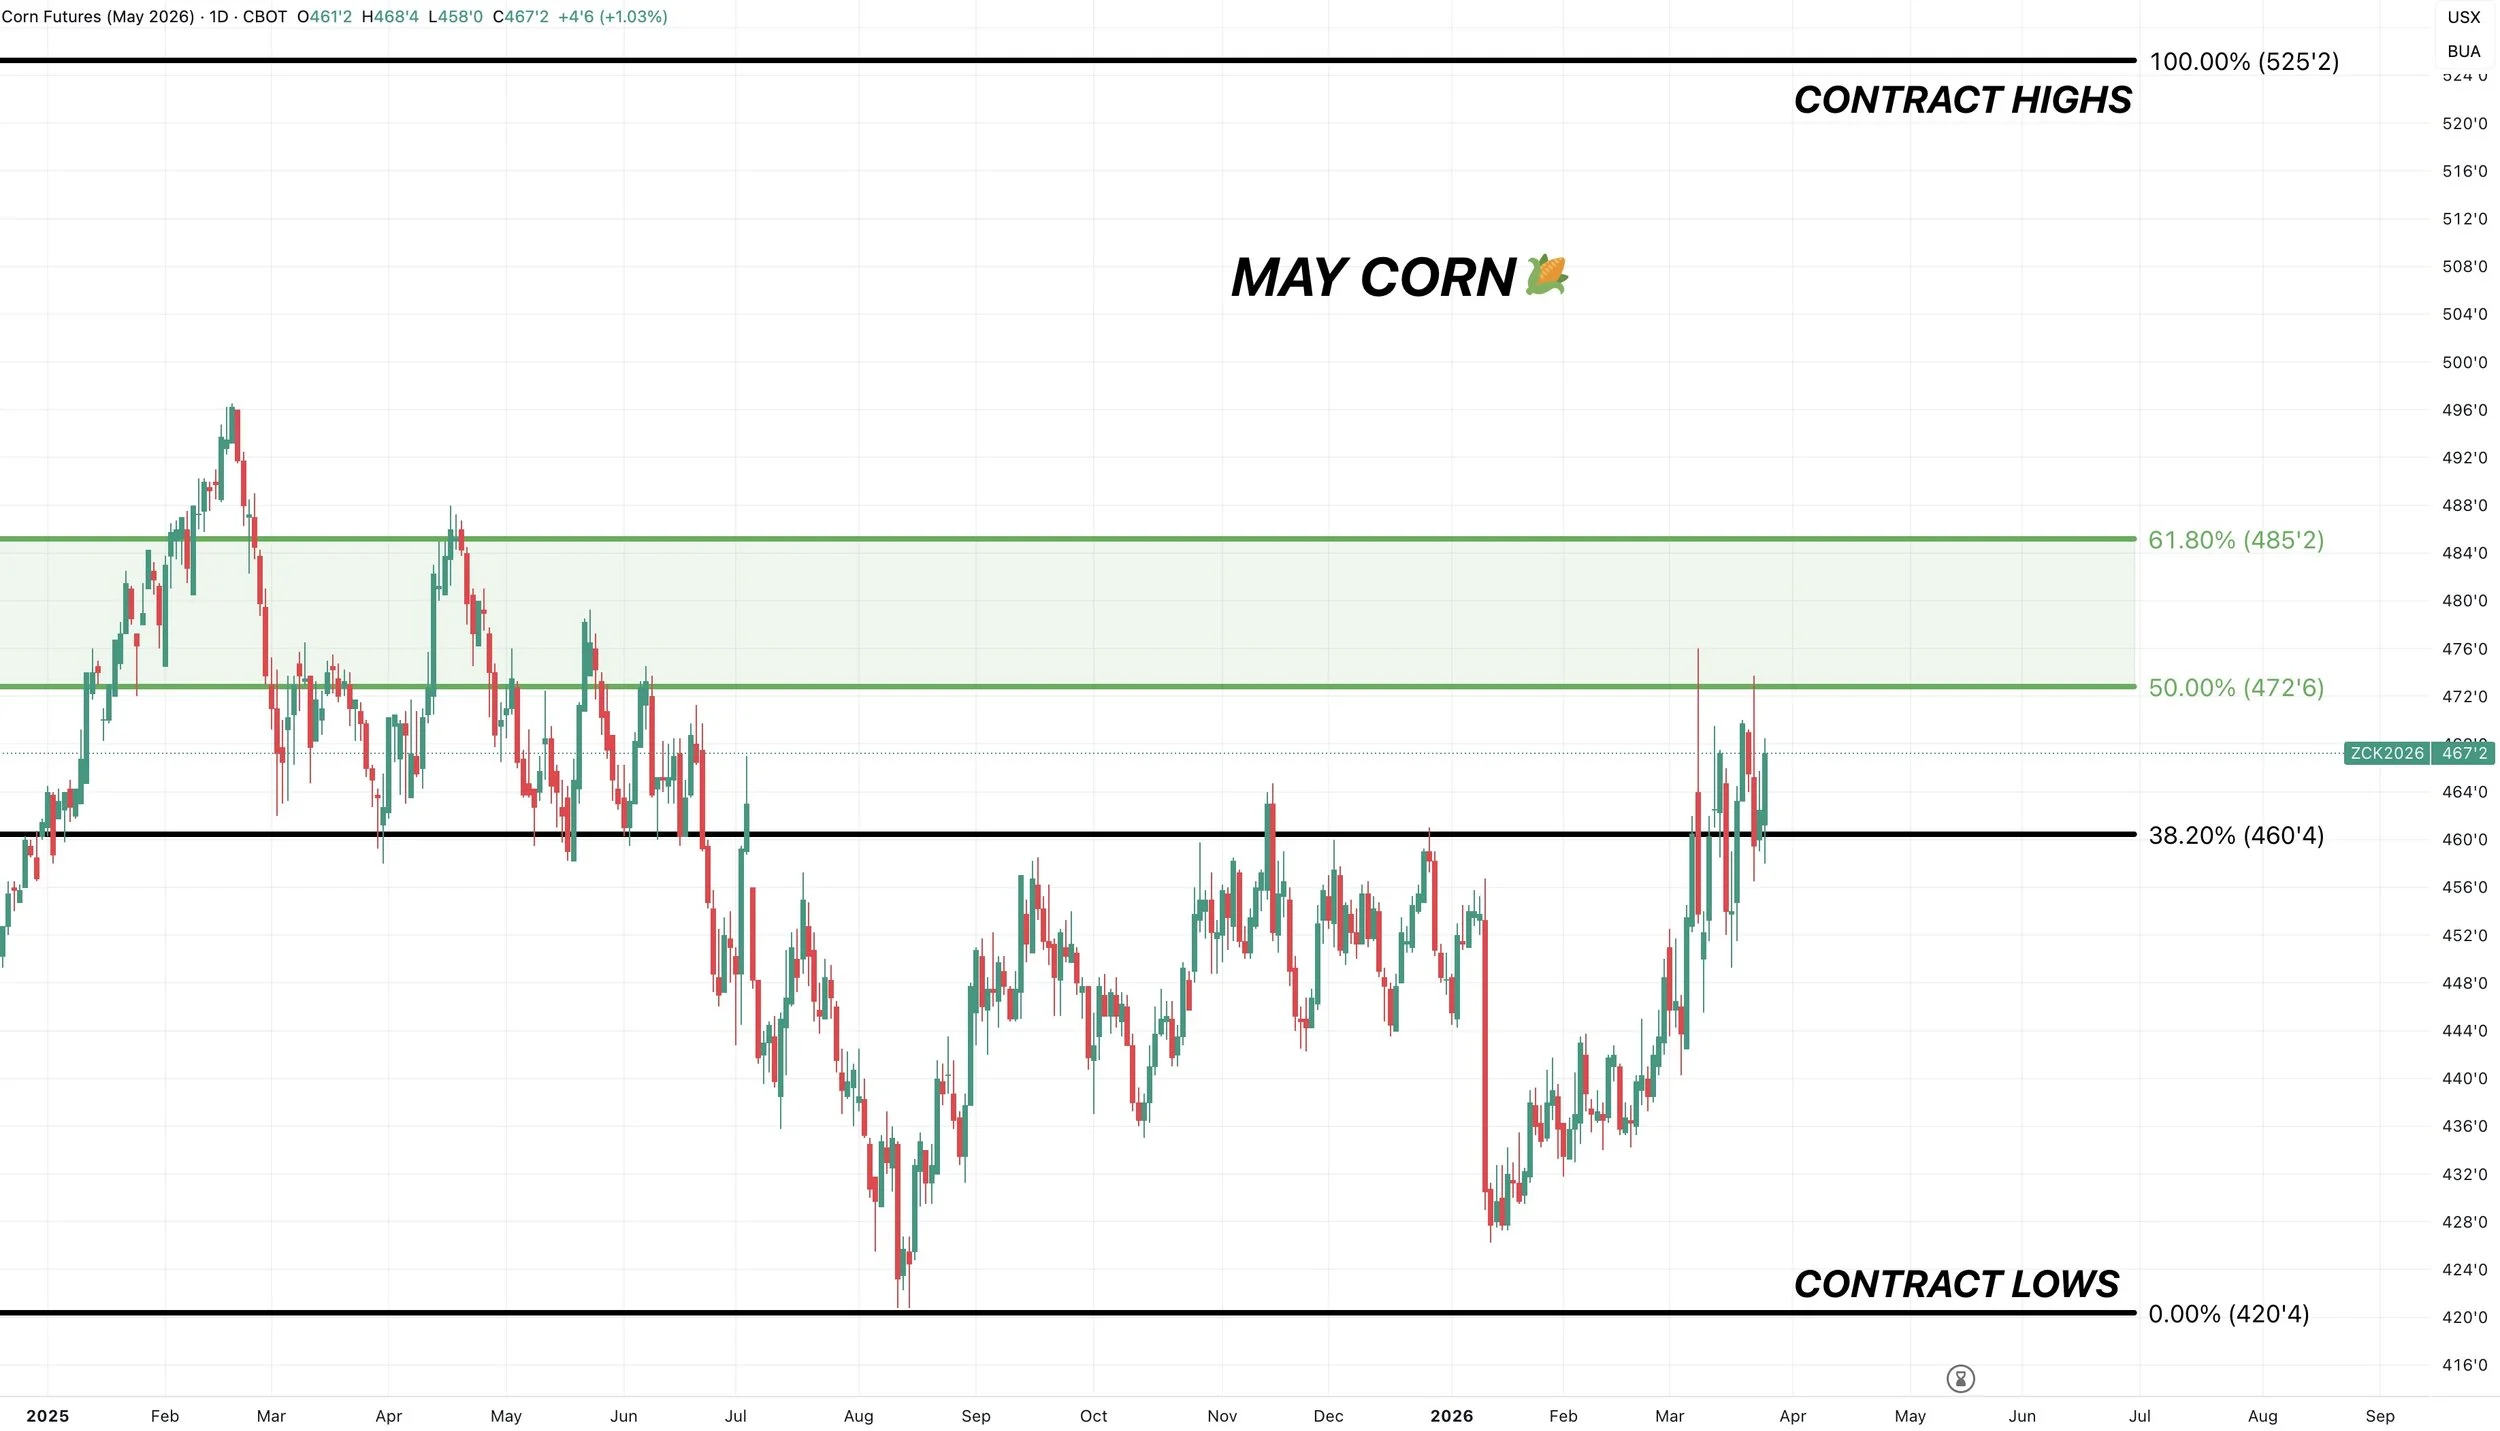
May Corn:
I still like rewarding a move between $4.73 to $4.85
That is 50% to 61.8% from the contract lows to the contract highs. Aka the golden zone.
A common area to struggle.
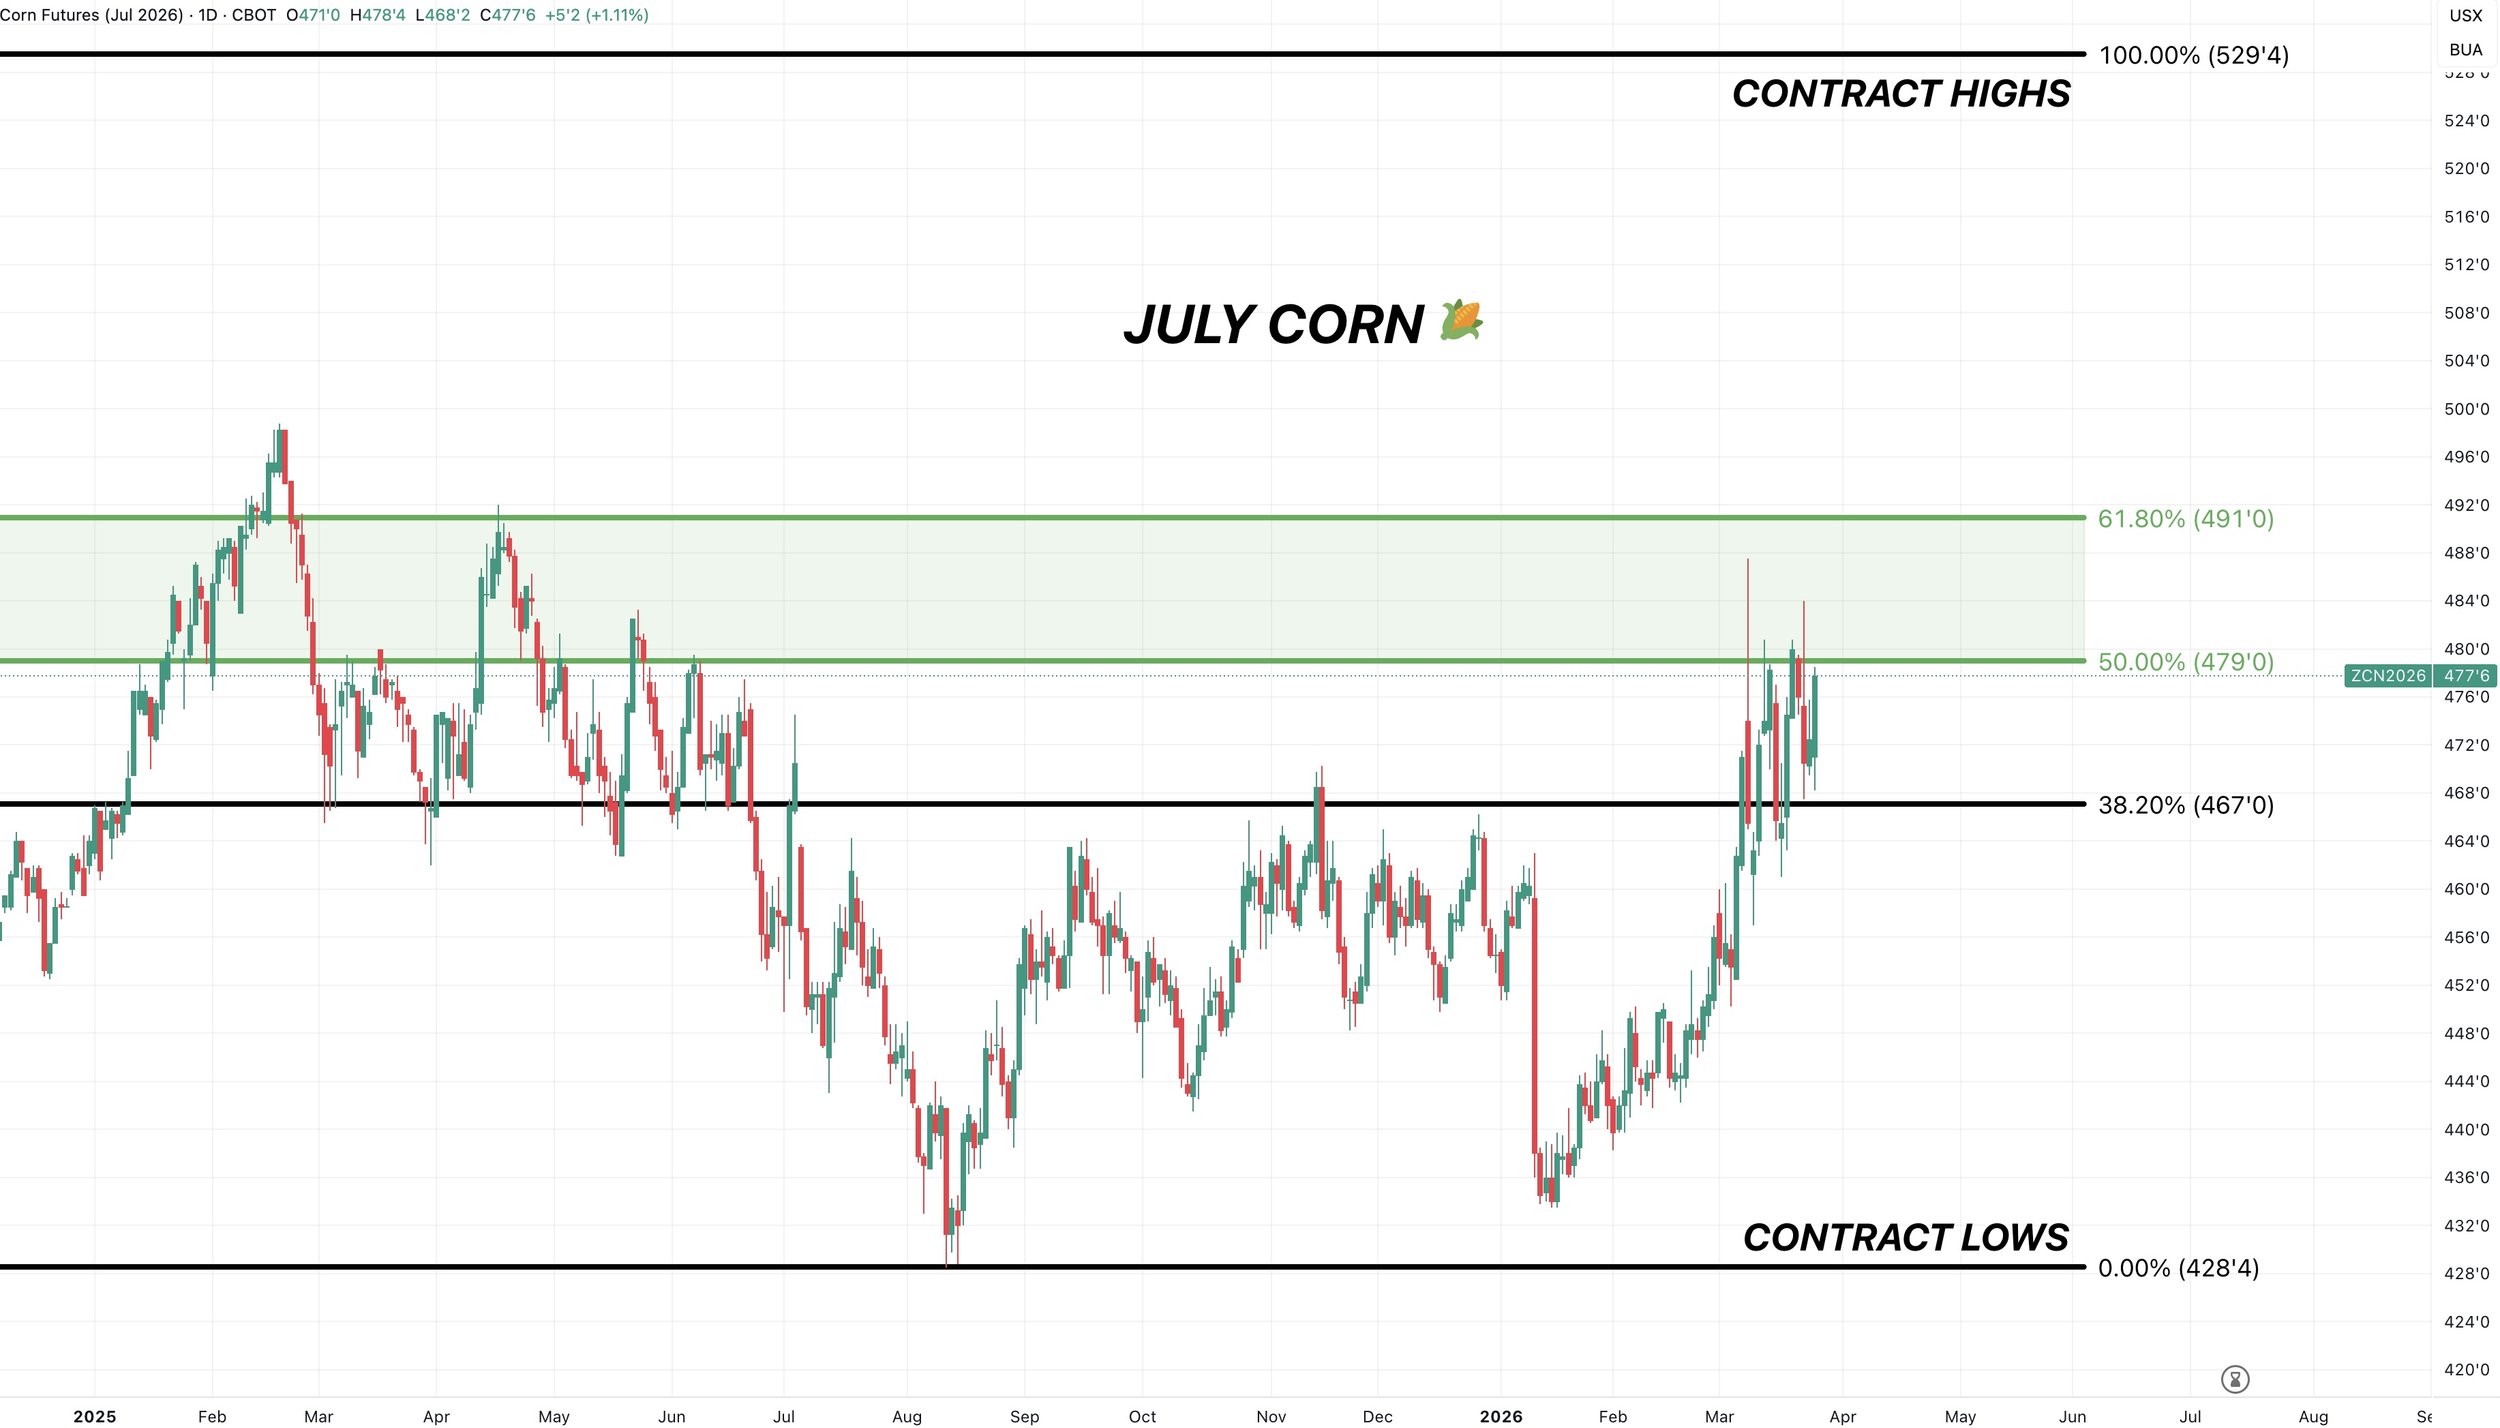
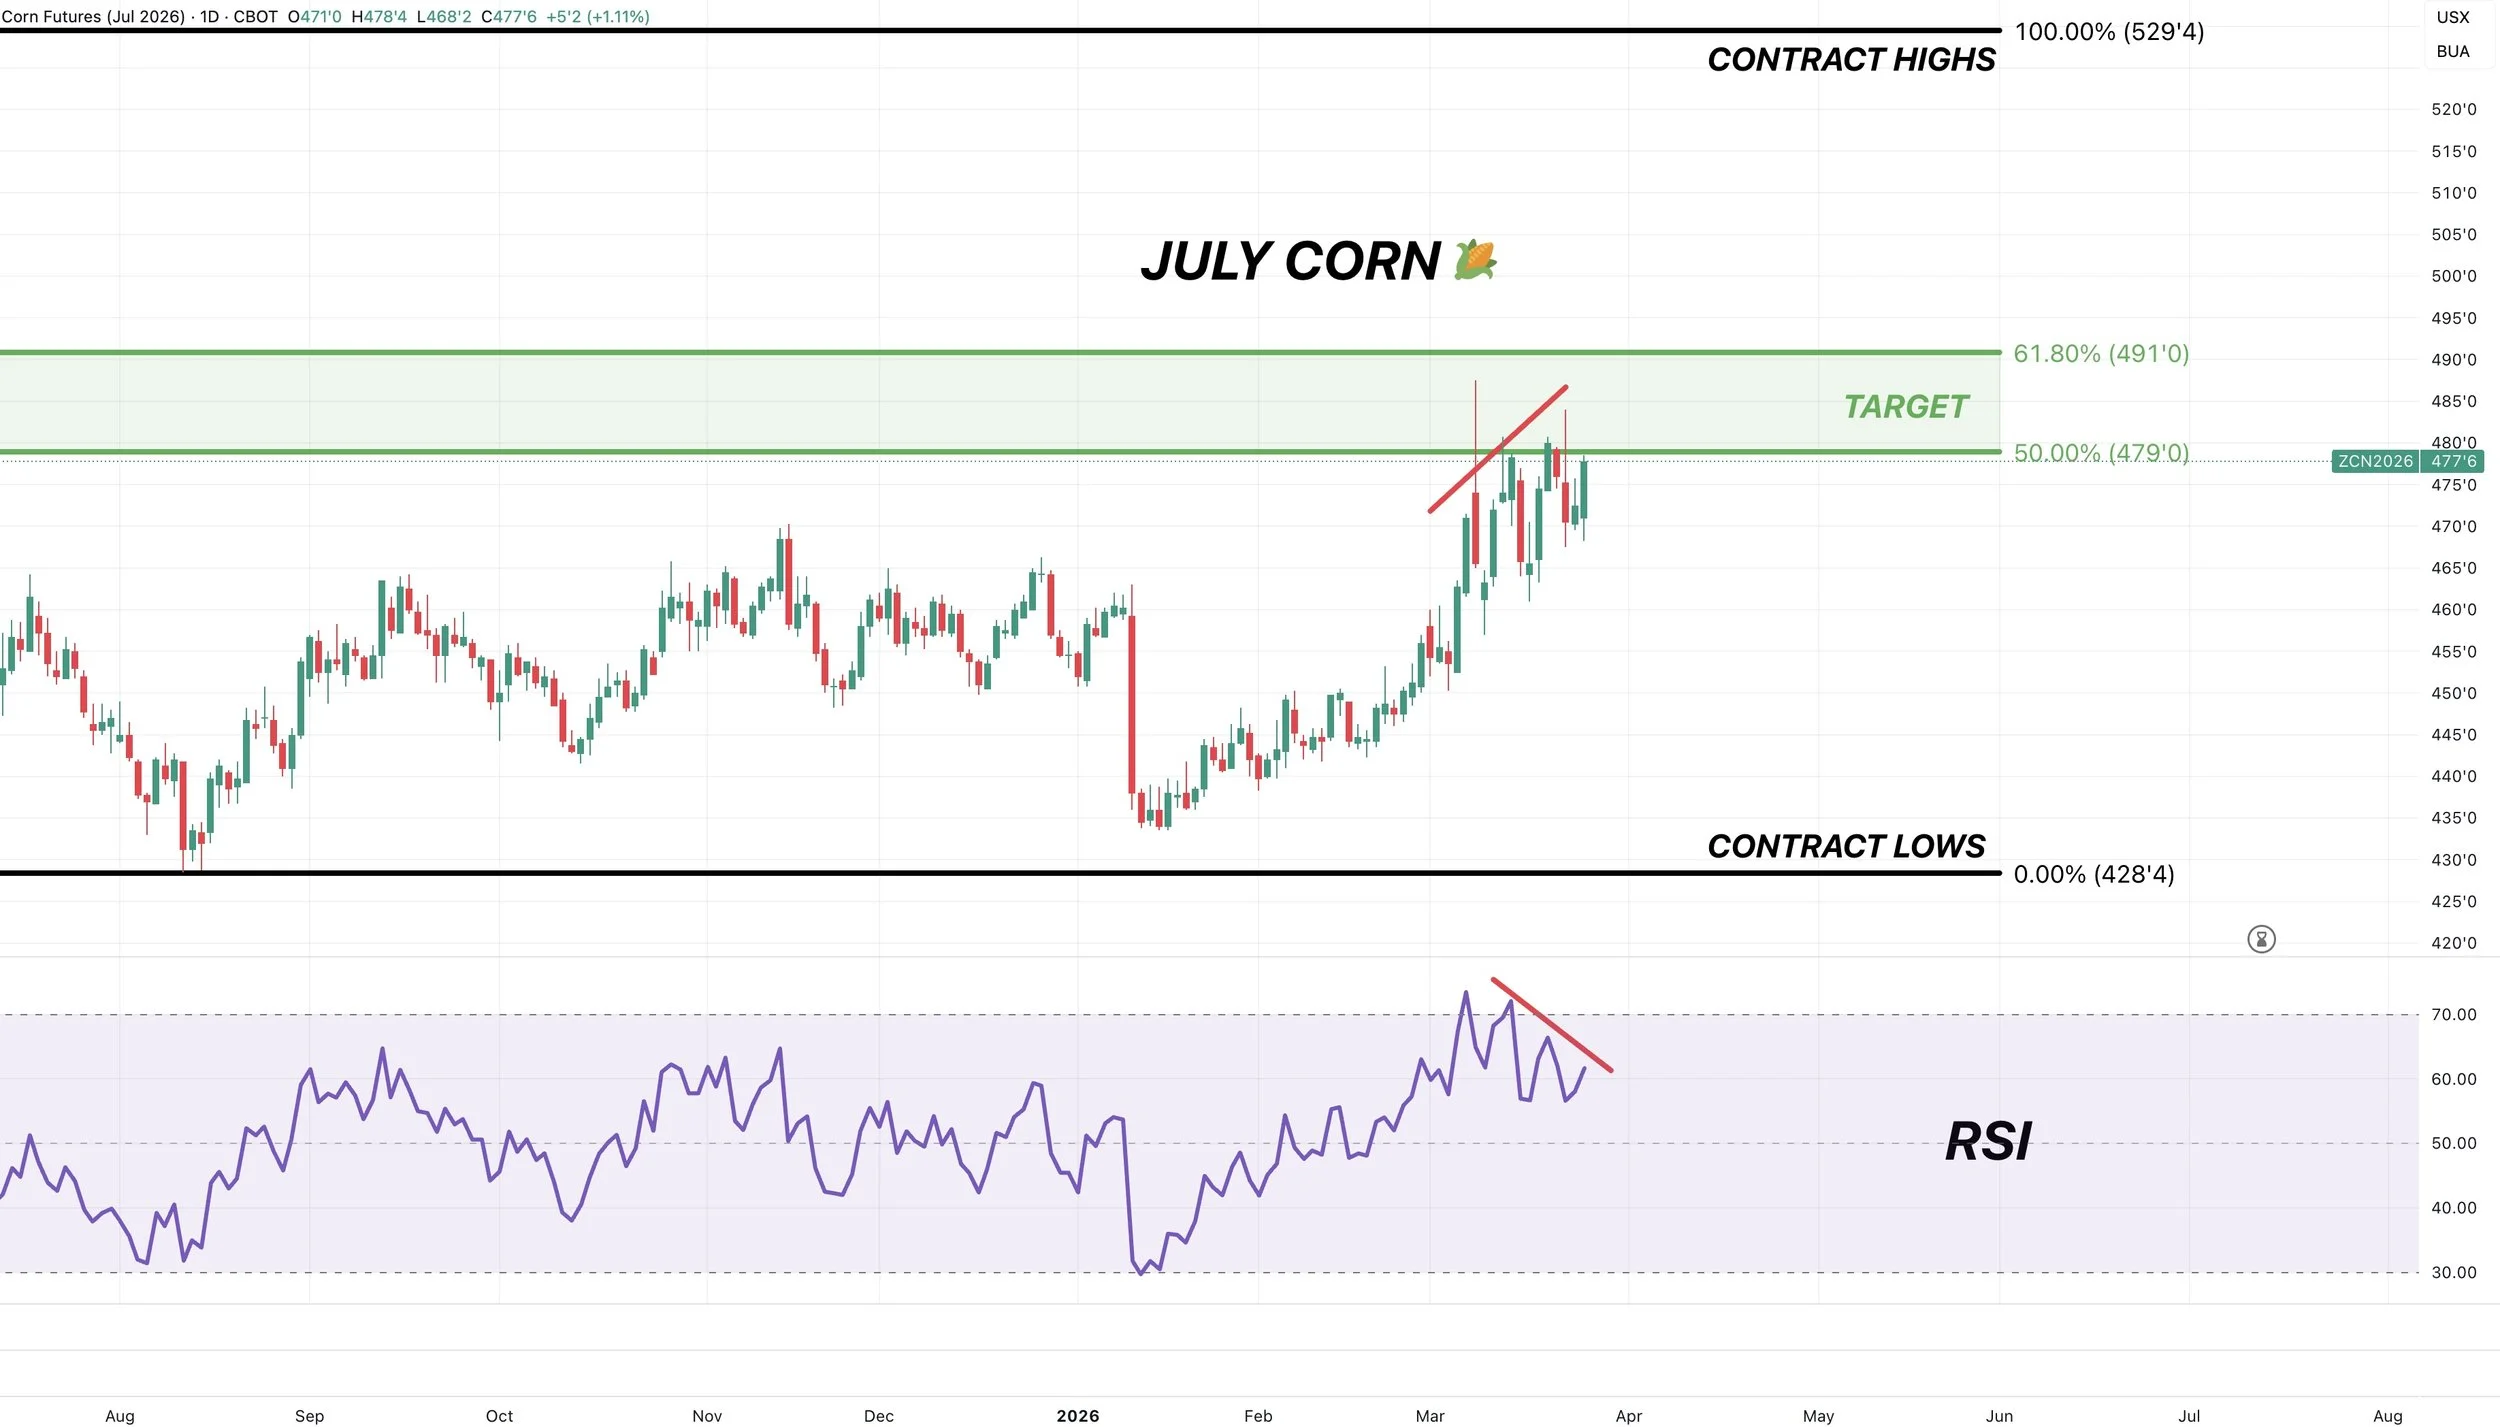
July Corn:
I like rewarding a move between $4.80 and $4.90
The golden zone from contract lows up to the contract highs.
Again, a very common area to struggle.
Old crop corn is also showing bearish divergence.
While prices make new highs, the RSI is not.
Another reason to look to reward these levels soon and prepare to defend.
Soybeans
As I mentioned, today's strength was behind us getting exact dates for the China meeting.
That meeting is now a month and a half away.
The biofuel meeting at the White House is still scheduled for Friday despite the war headlines.
The risk there has to be a buy the rumor, sell the fact event.
As we have been recently rallying on the rumors of the leaked numbers.
So if the numbers aren’t surprisingly strong, it could provide some initial weakness.
Outside of that, all eyes are still on China.
It doesn’t sound like they are going to be buying any more old crop soybeans like the market originally thought.
Normally, this is about the time of year when they start buying some new crop soybeans, but we haven’t seen any yet.
It would make sense for them to step in and buy some before that meeting, as oftentimes they will make a good faith purchase beforehand.
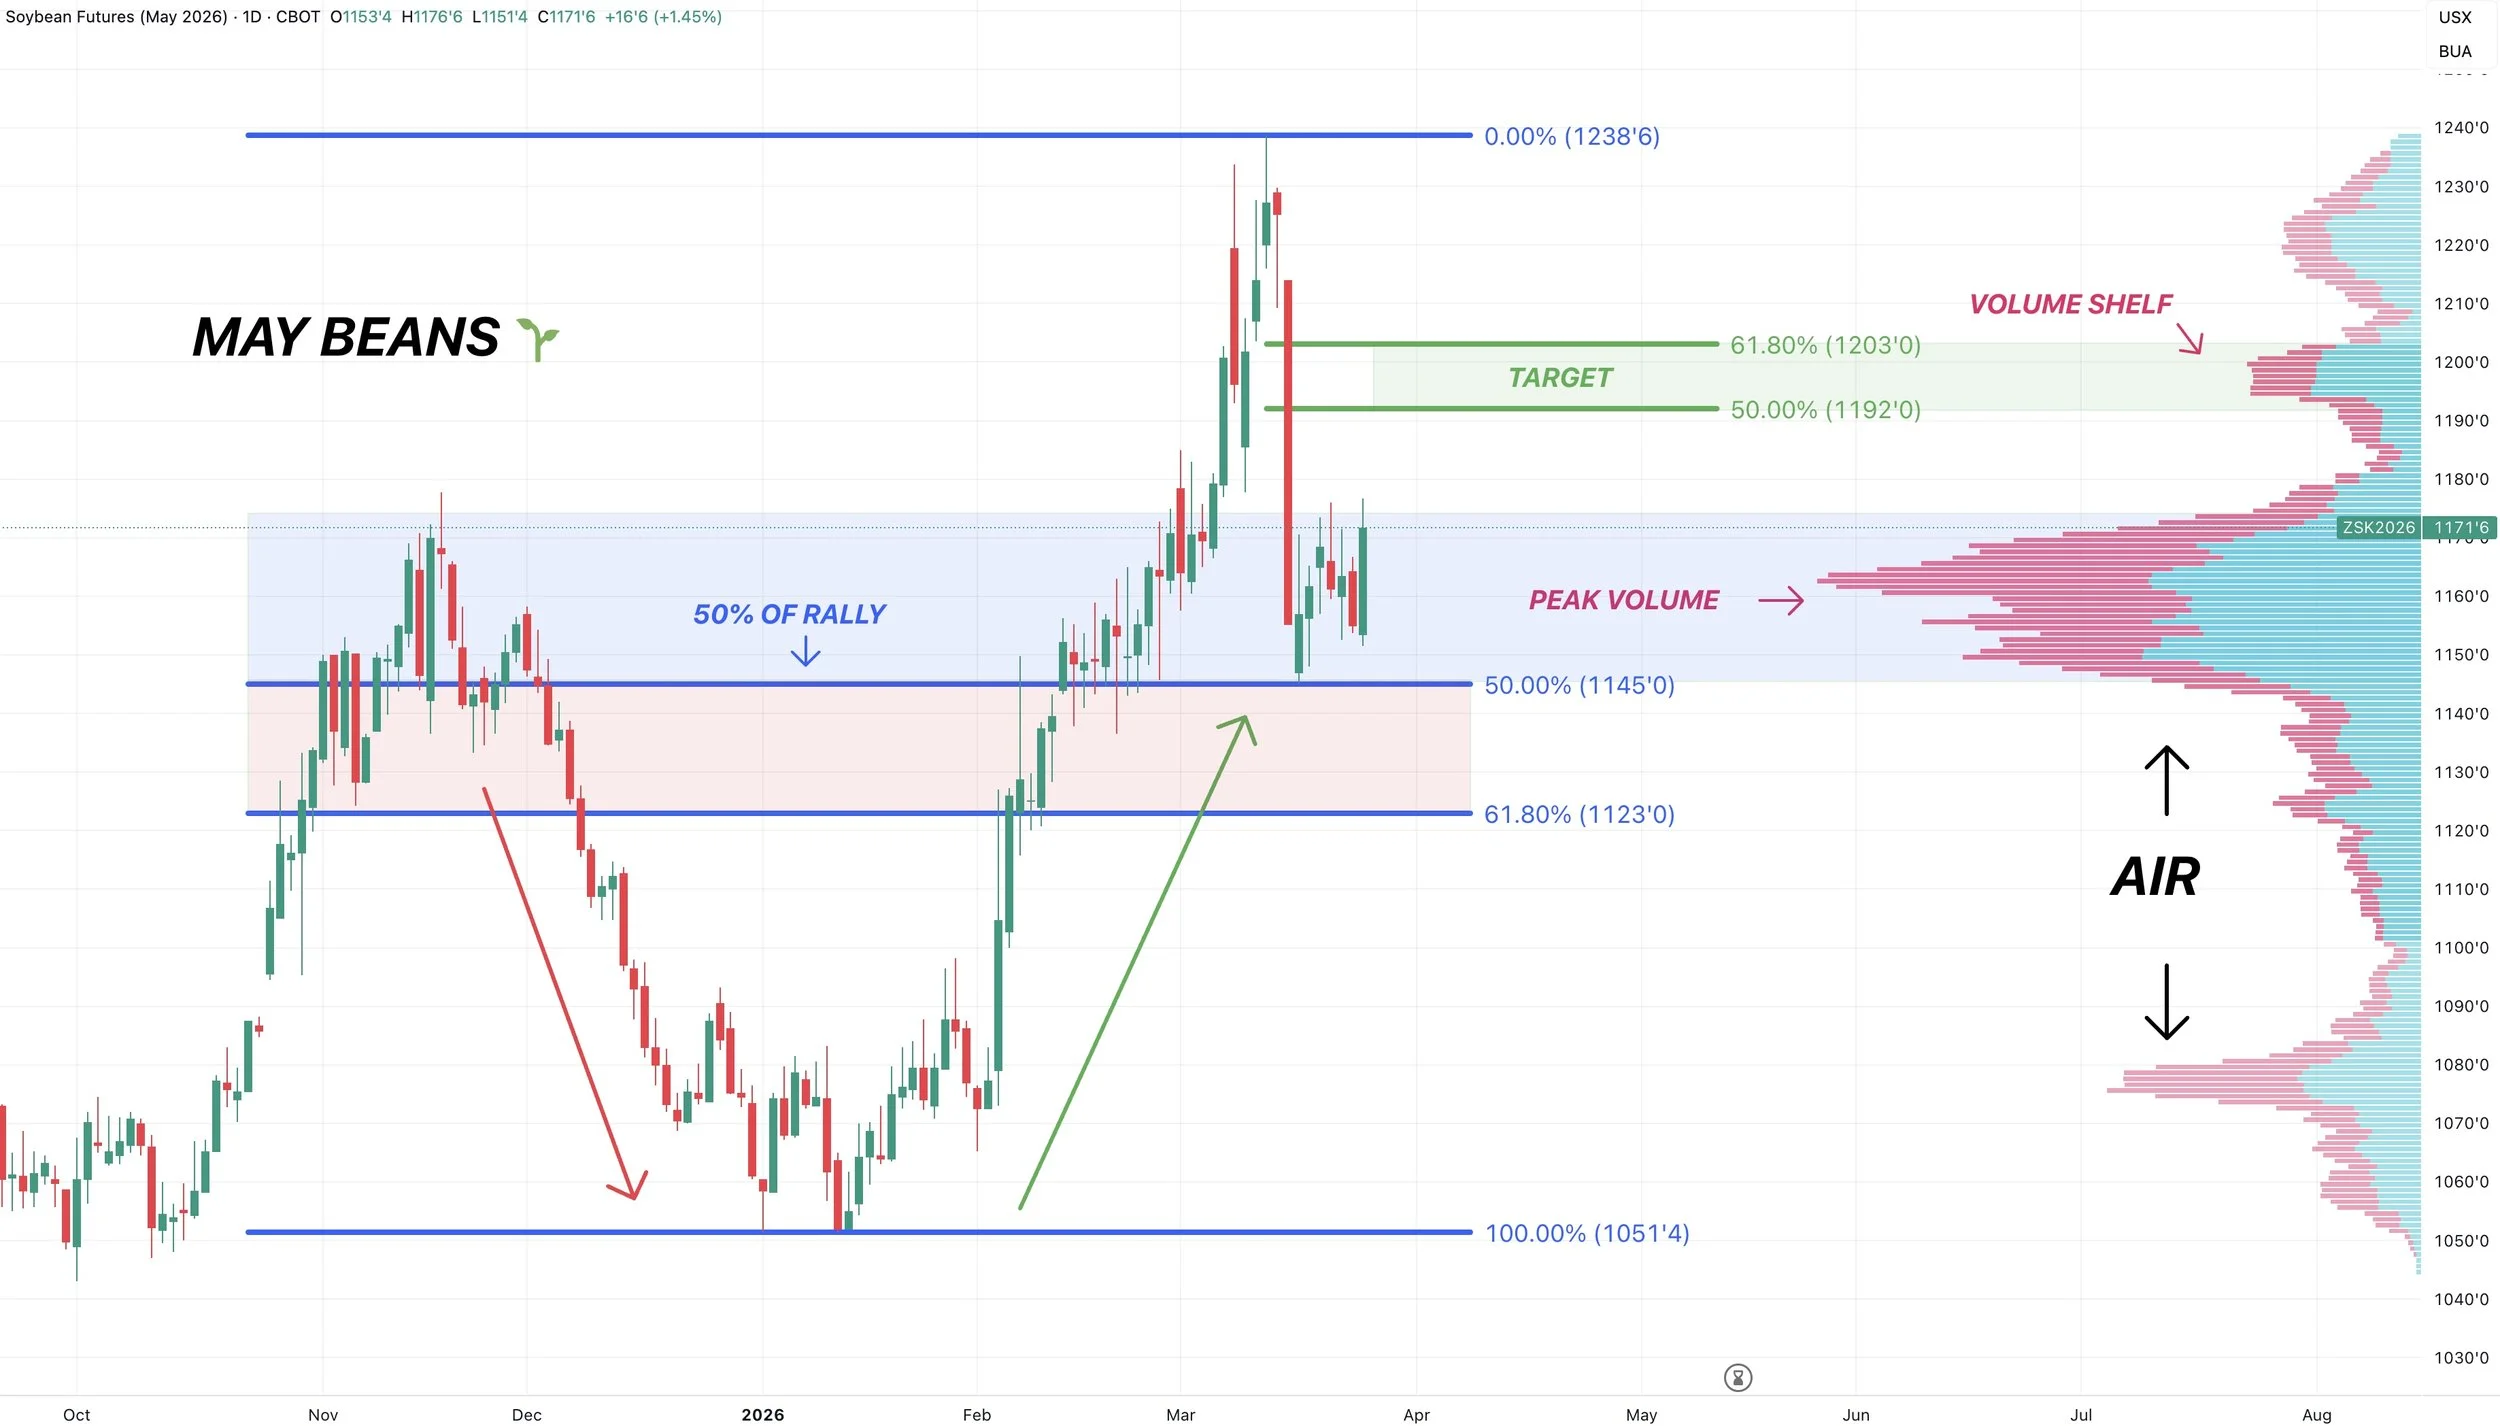
May Beans Chart:
Like I talked about last week, finding a local bottom here makes sense.
We gave back 50% of the entire rally.
This same level is an area of high volume.
But we need to hold those recent lows. If we do not, there is zero support or volume under here.
Still looking to reward a sizeable bounce from $11.90 to $12.00 if it comes.
That claws back 50% to 61.8% of the entire sell off. The most common level for a relief bounce.
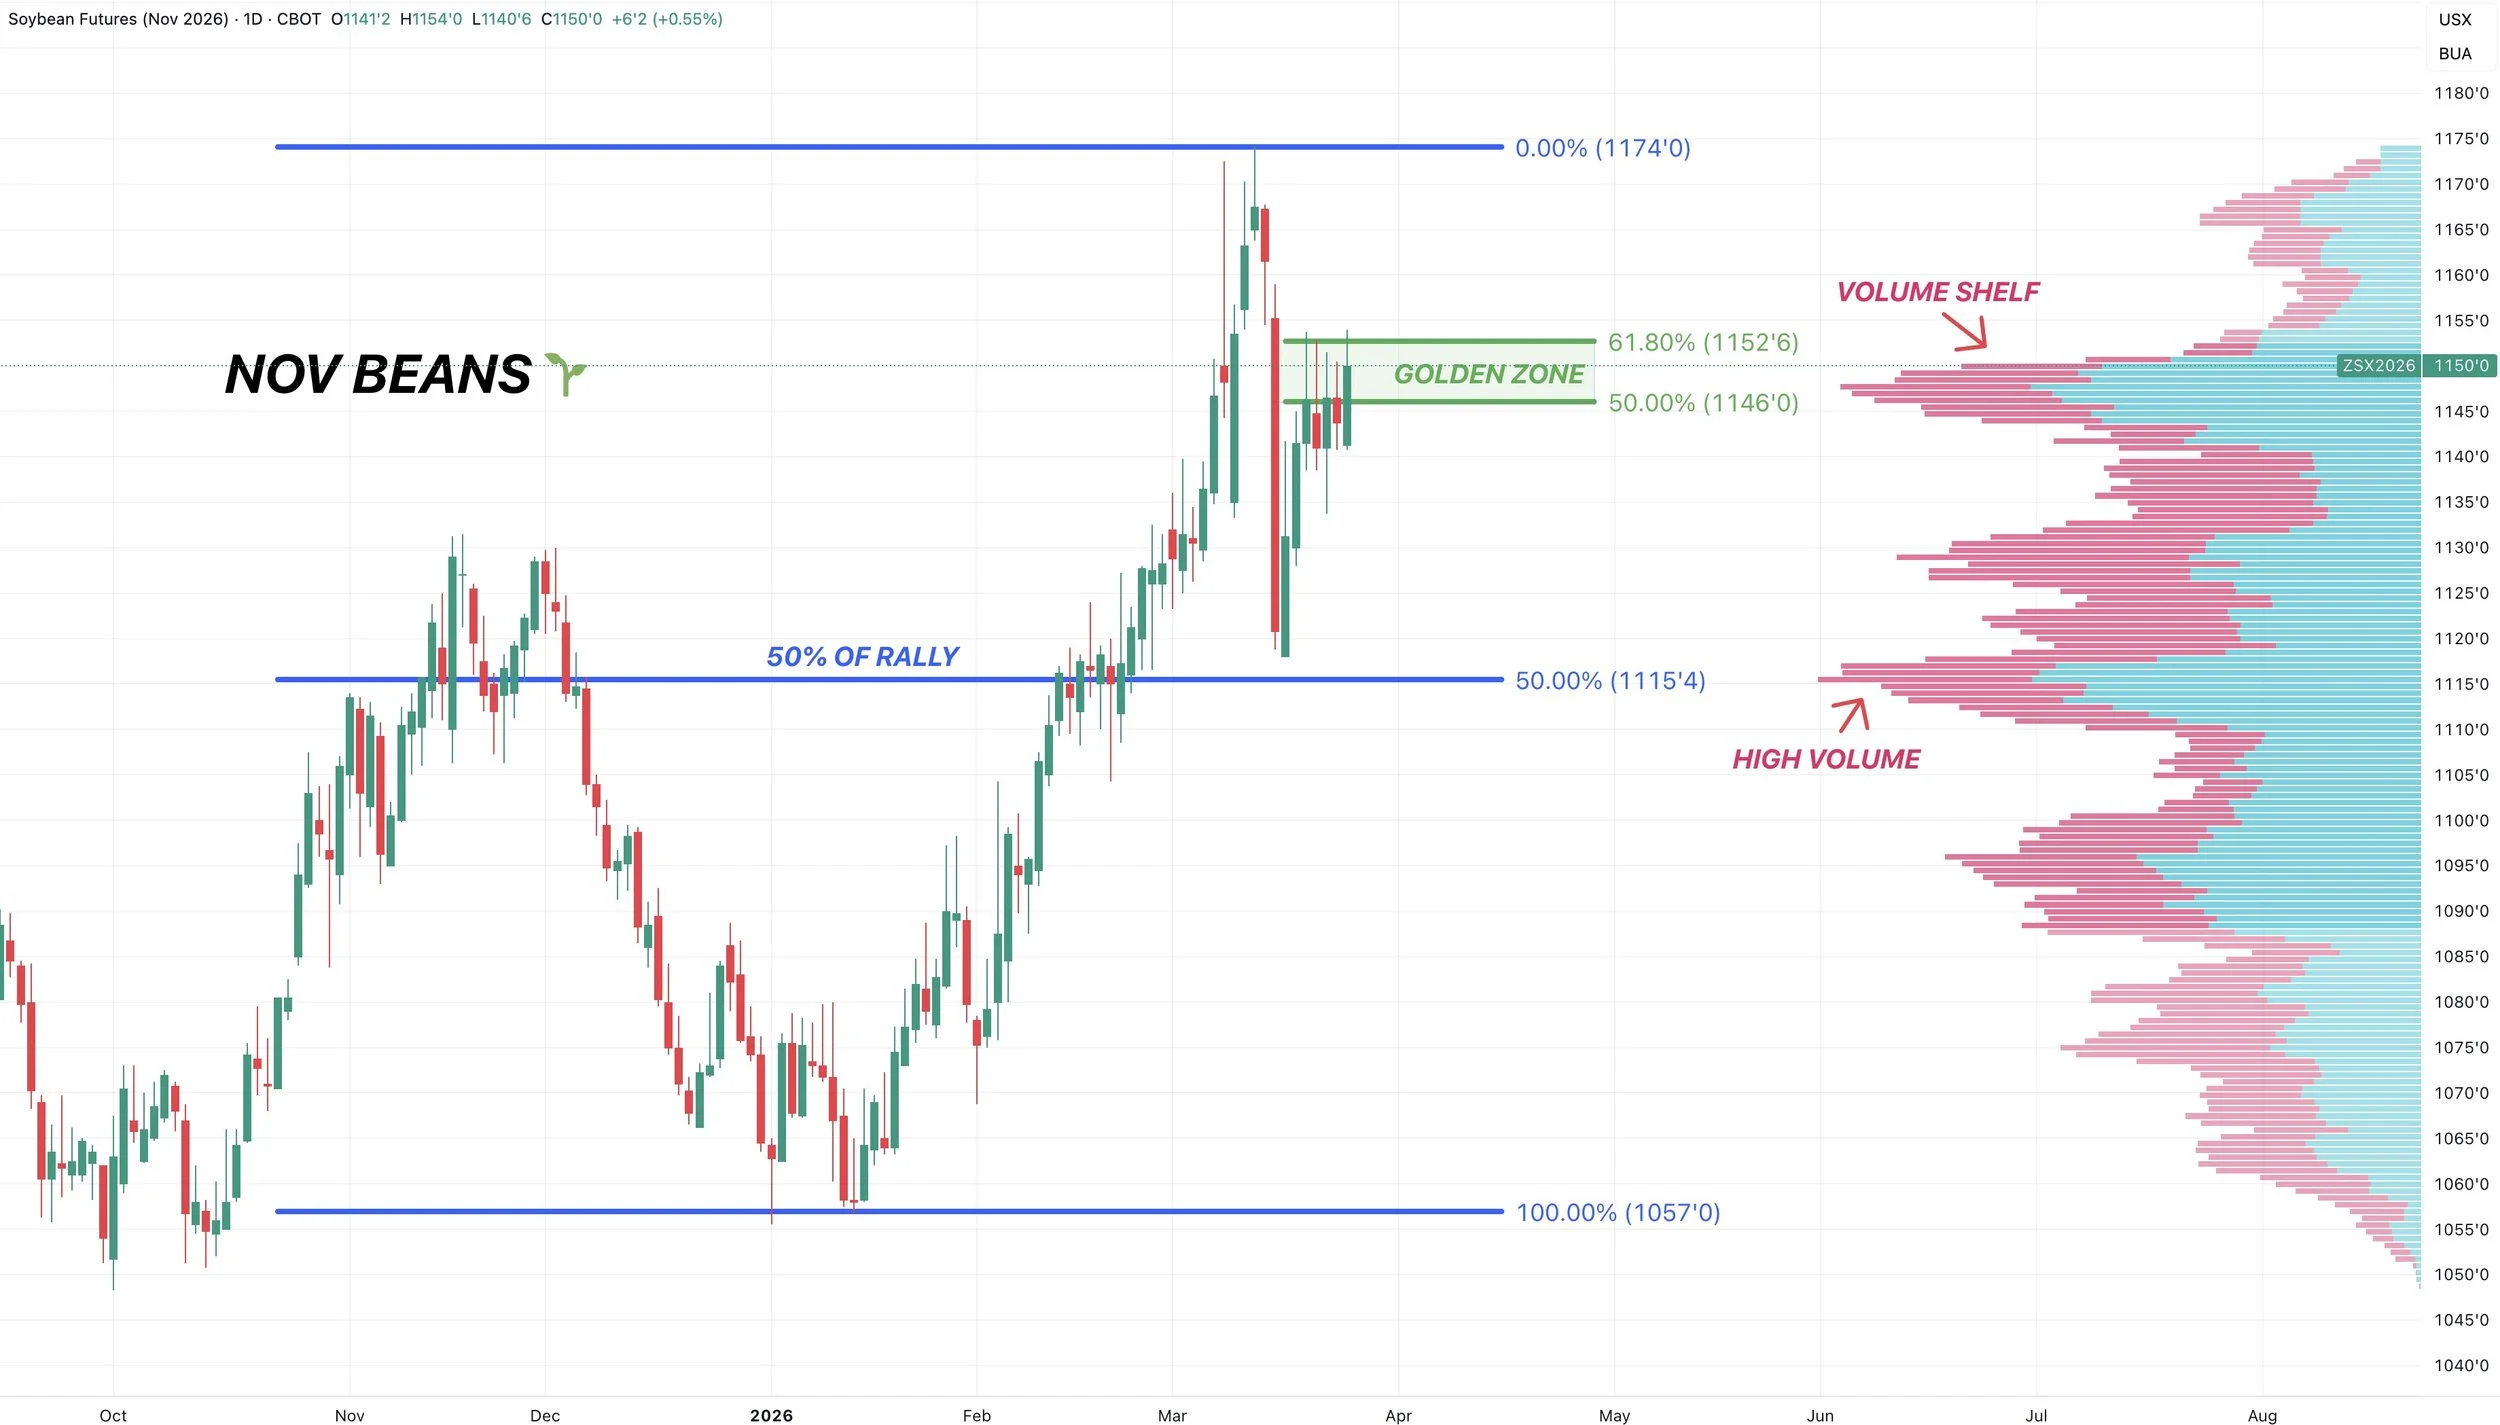
Nov Beans Chart:
We issued a sell signal at this level last week.
So if you haven’t protected or rewarded this rally I still like doing so at this $11.50 level.
We've clawed back 61.8% of the entire sell off.
This is usually where the market decides if this is simply a dead cat bounce or the start of something bigger.
It's the most common level for a bounce to stall, but if we break above the odds favor us going to test the highs.
Wheat
This rally has been mostly geopolitically driven.
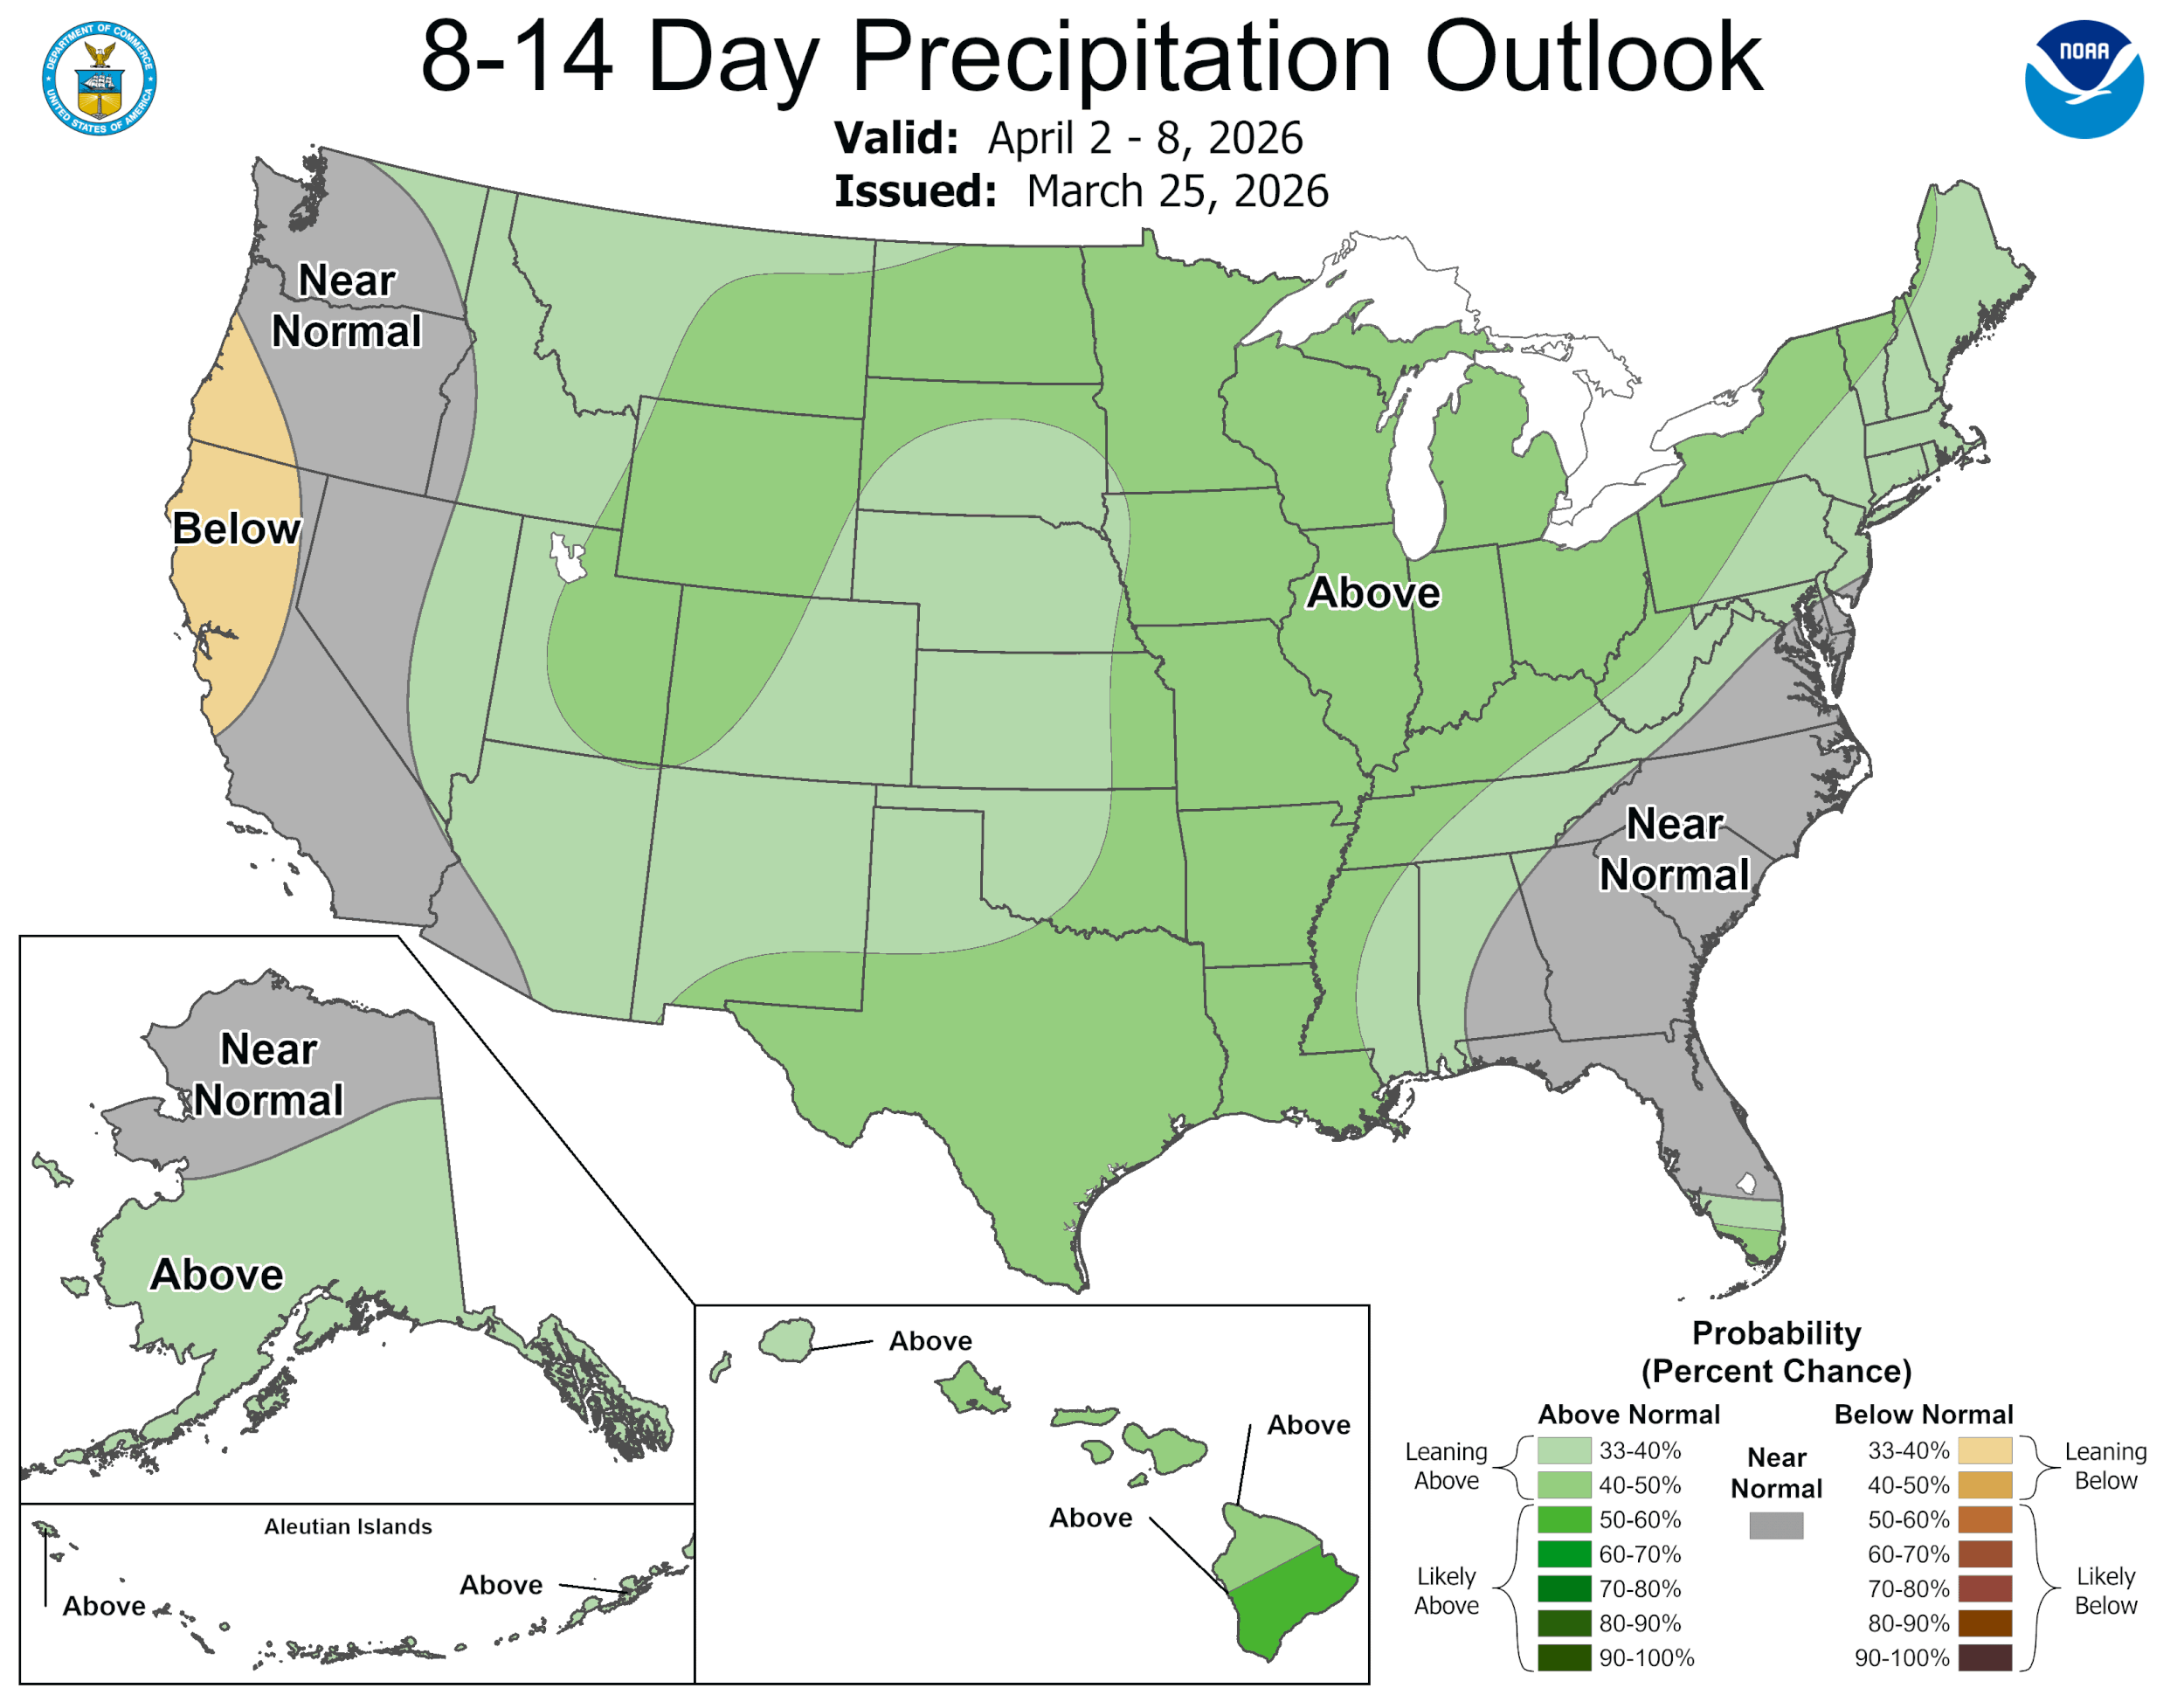
However, wheat does have somewhat of a weather going for it as well.
Take a look at the drought monitor.
It's pretty colorful, especially in the plains.
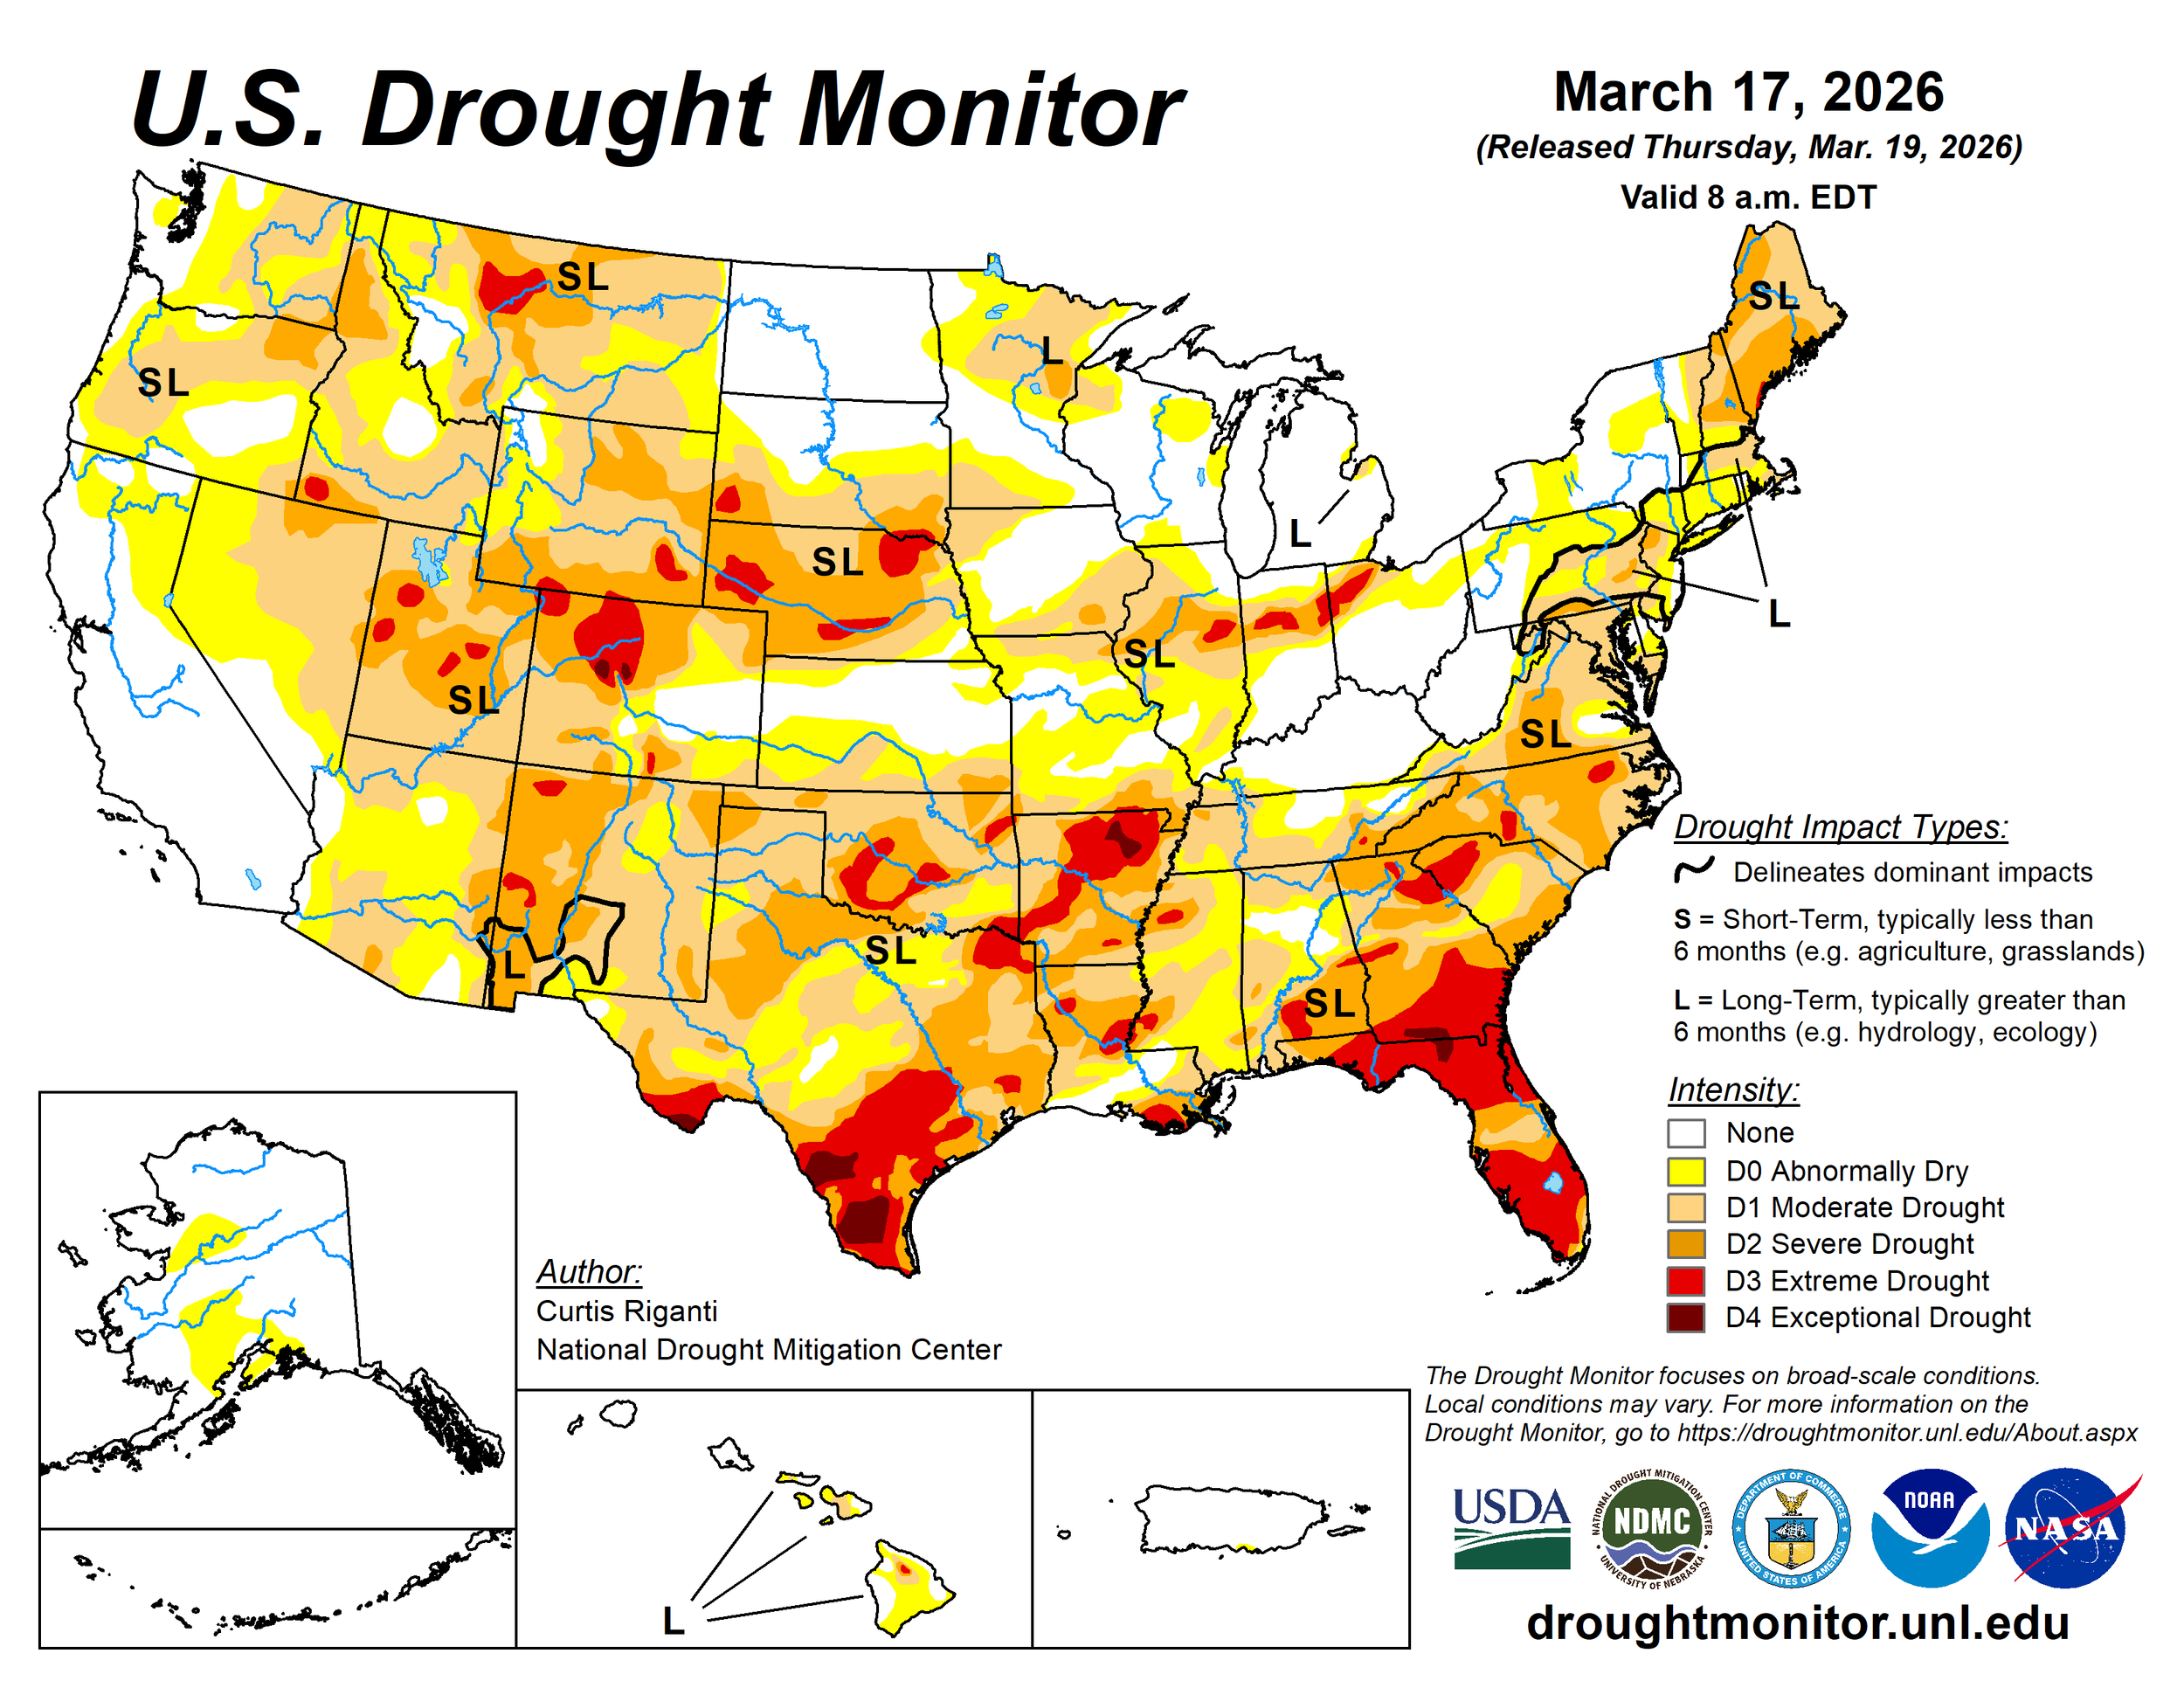
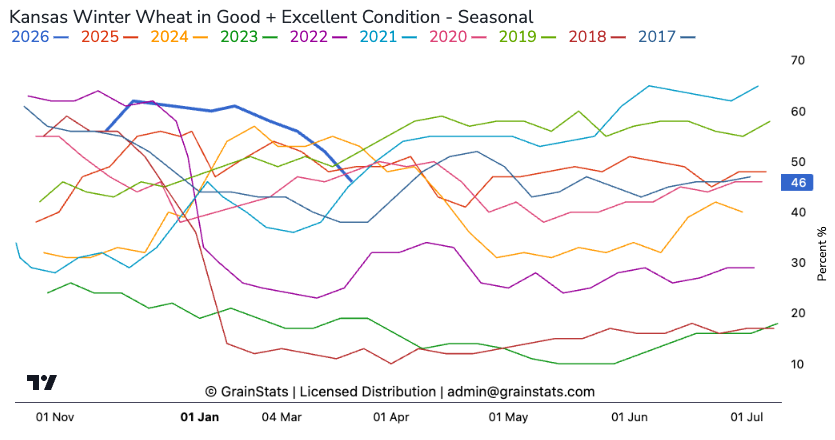
Winter wheat ratings in Kansas have continued to drop week over week.
Sitting at 46% G/E and falling.
Chart from GrainStats
However, we are expected to get some decent rains over the next two weeks.
So this might help mute that weather story for now.
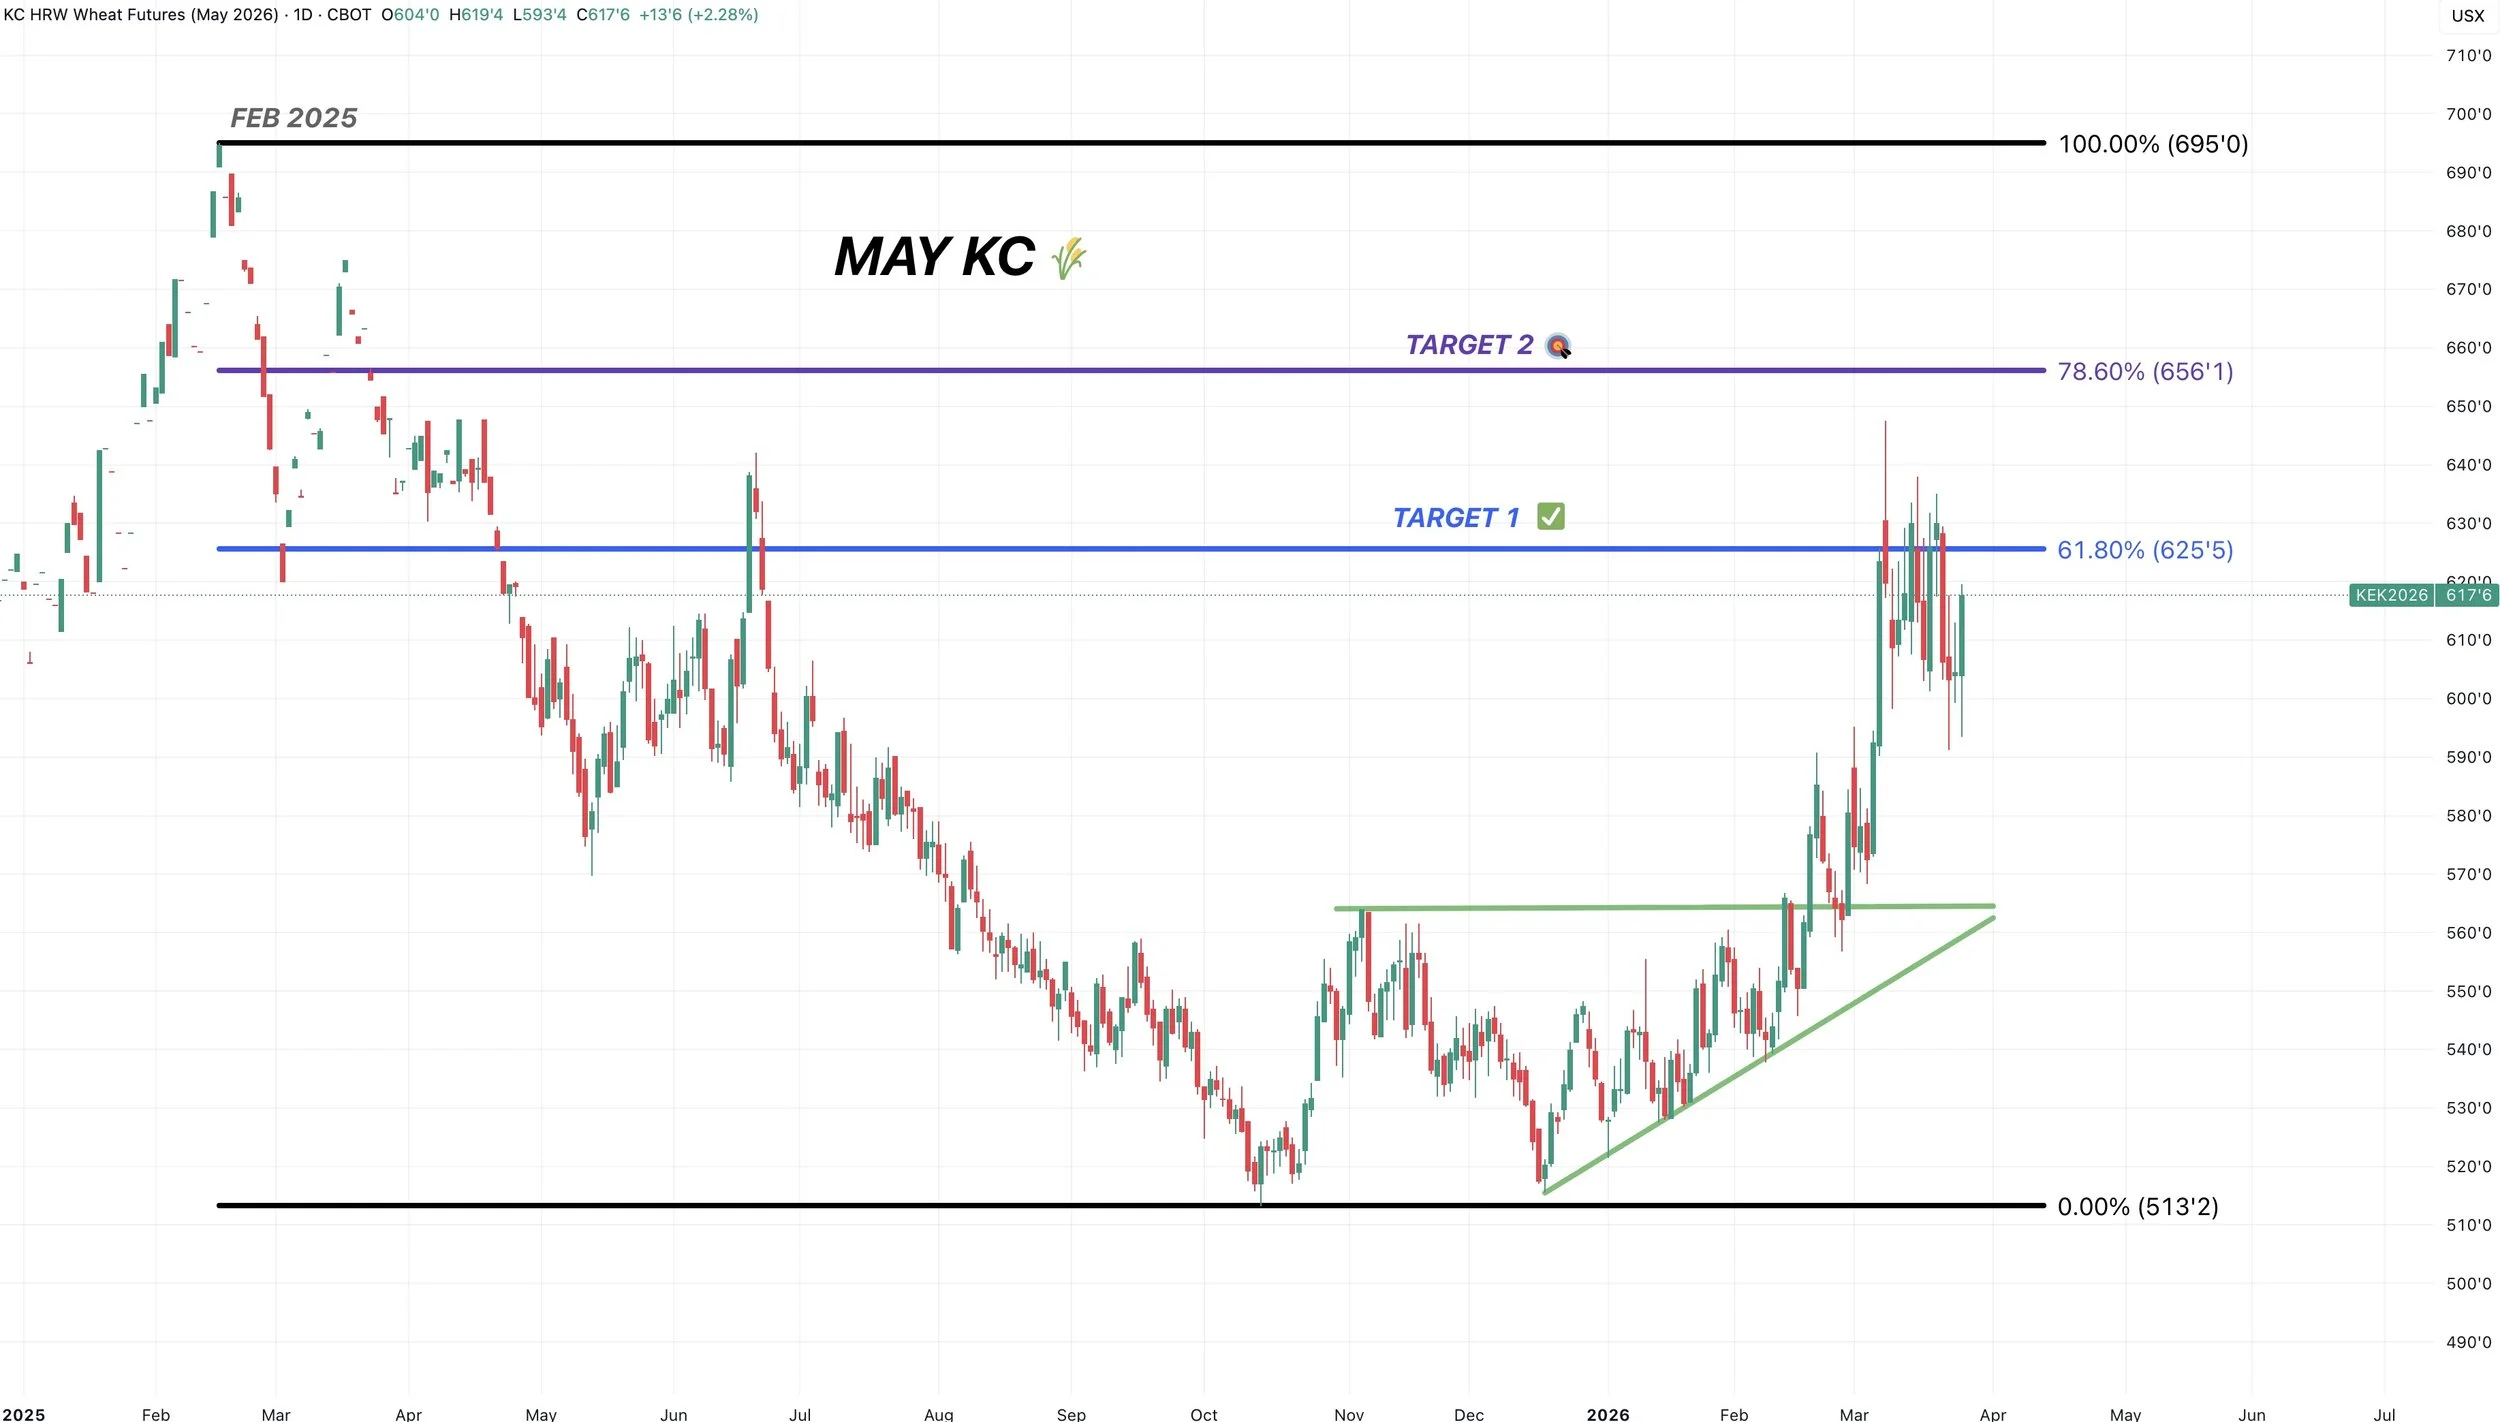
May KC Chart:
We continue to bounce around in a 30 cent range.
$6.00 is still the level we want to see us hold to prevent further downside.
So far we've been able to hang on, bouncing every time.
Right now we are sitting an an area of high volume and support.
If we break below $6.00 there is virtually zero support until $5.80 to $5.65
Critical spot we want to continue to see us hold.
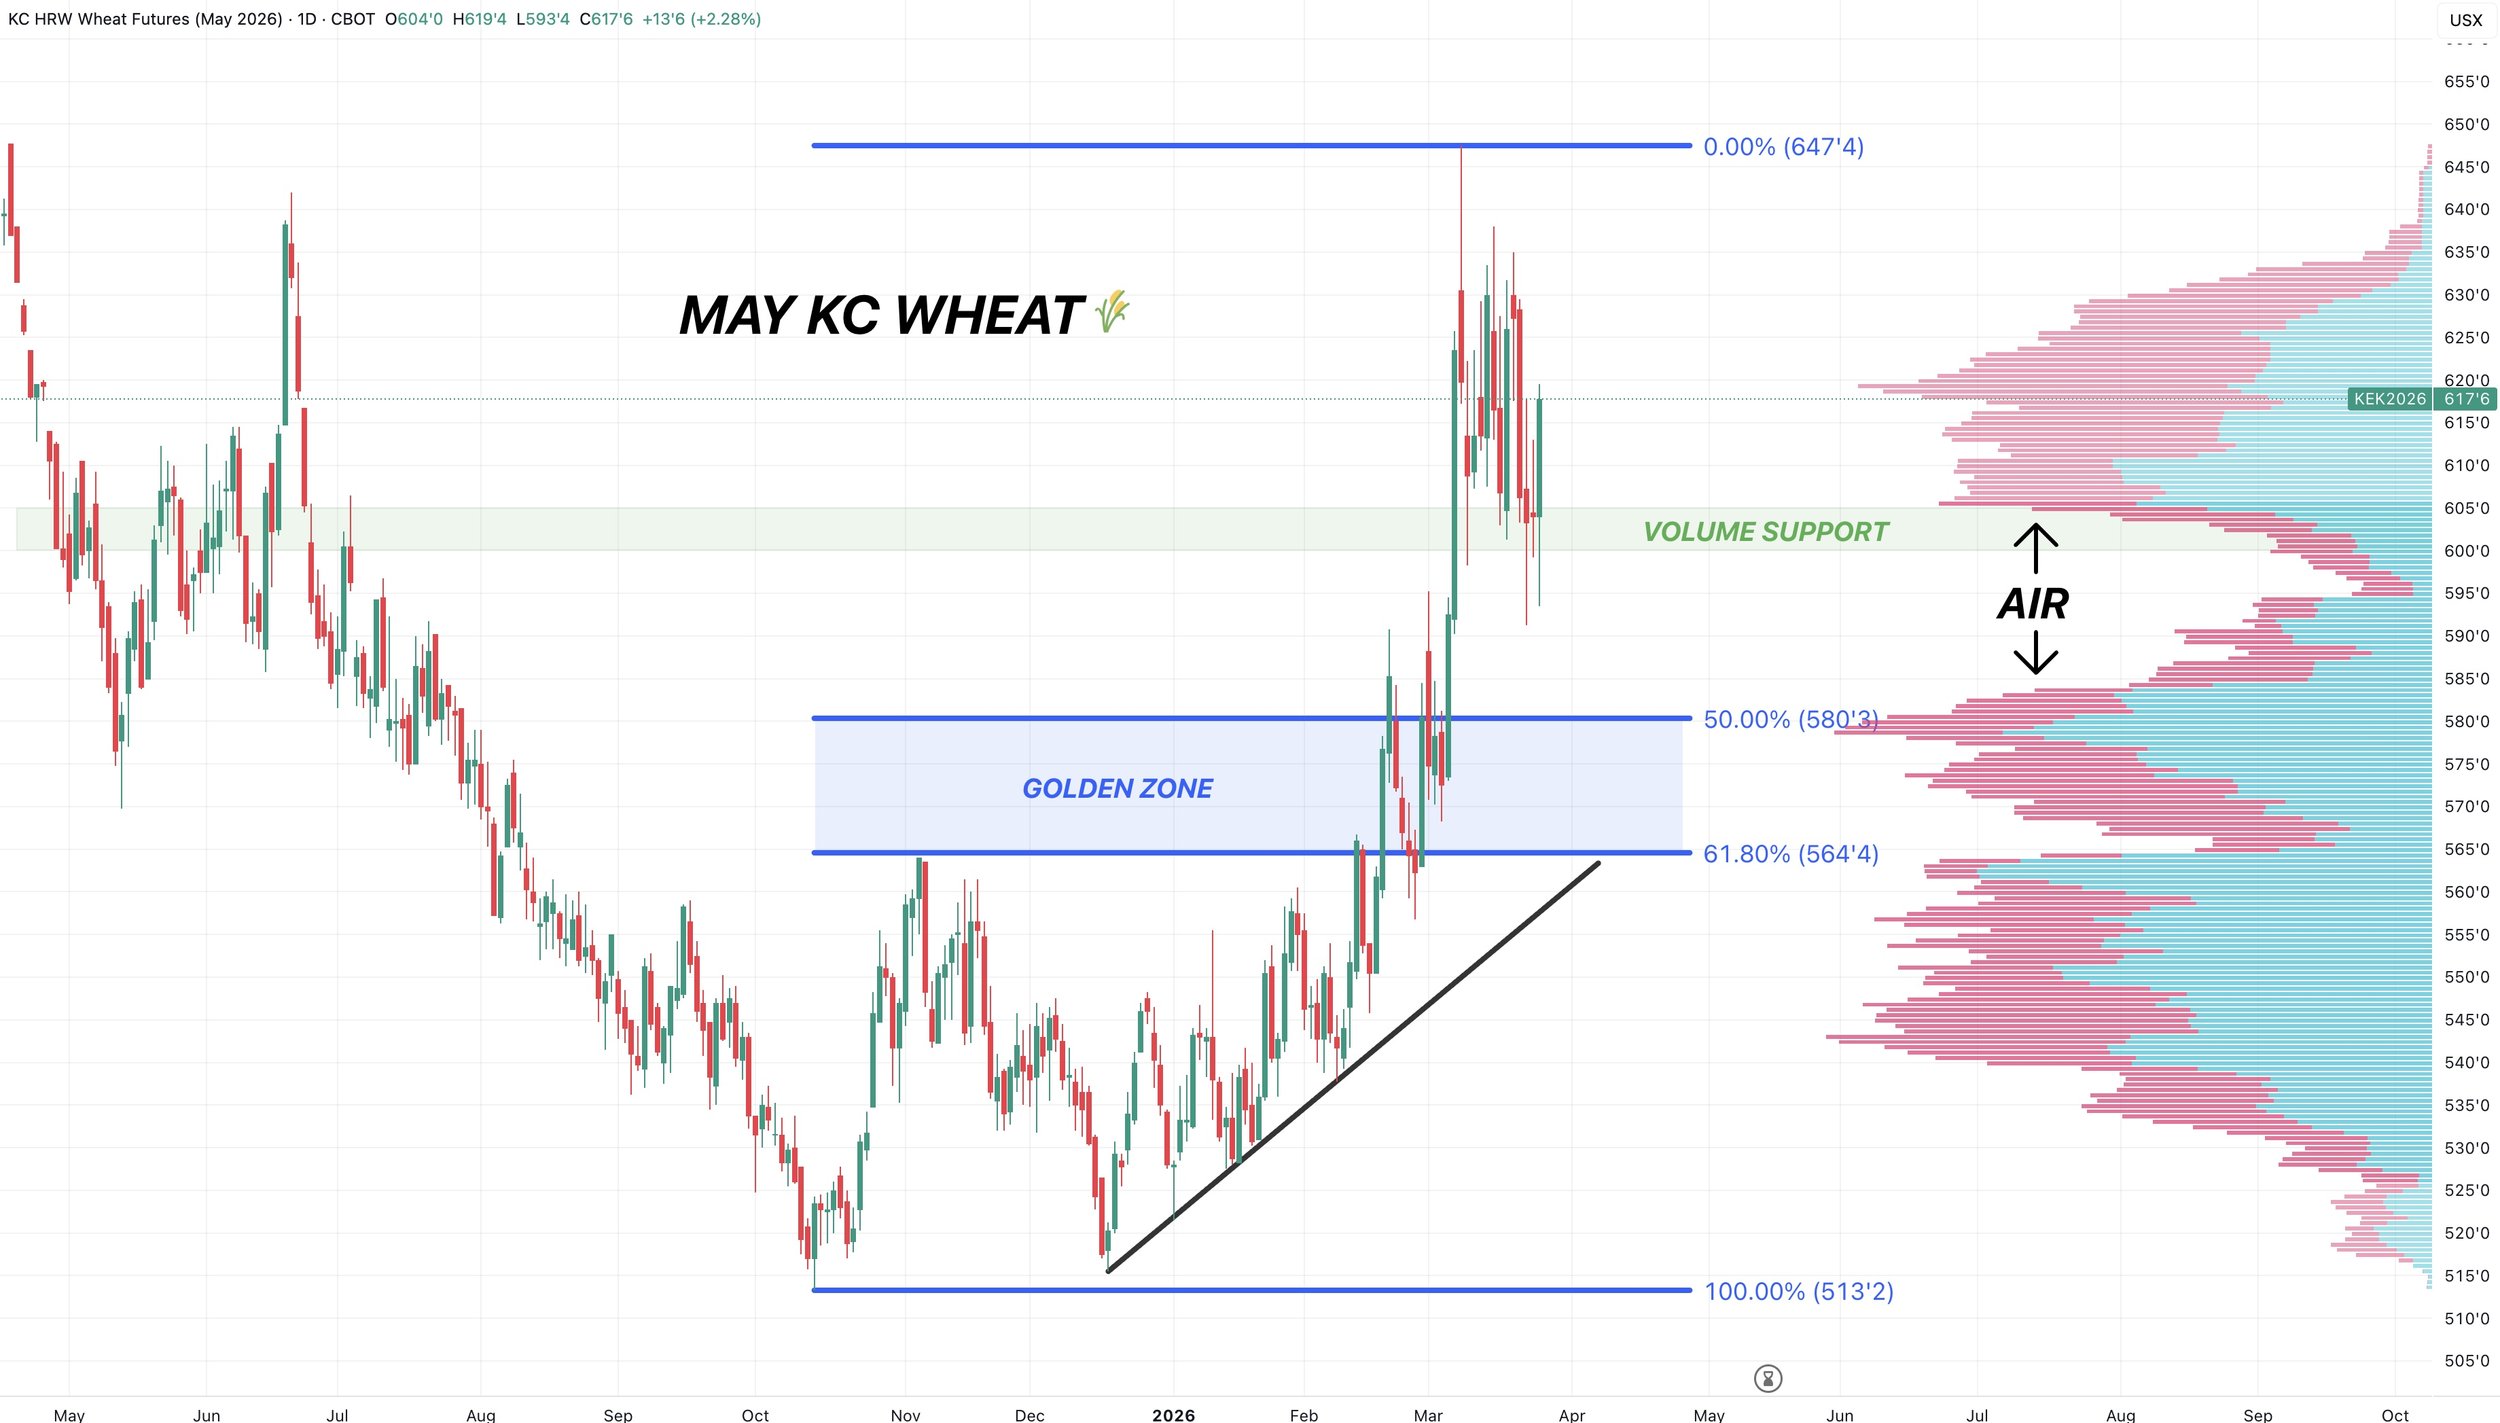
We already rewarded this rally at this level a few weeks ago when we hit 61.8% of the Feb 2025 highs.
$6.55 is the next target for now but subject to change.
It's the next retracement level up to those Feb 2025 highs.
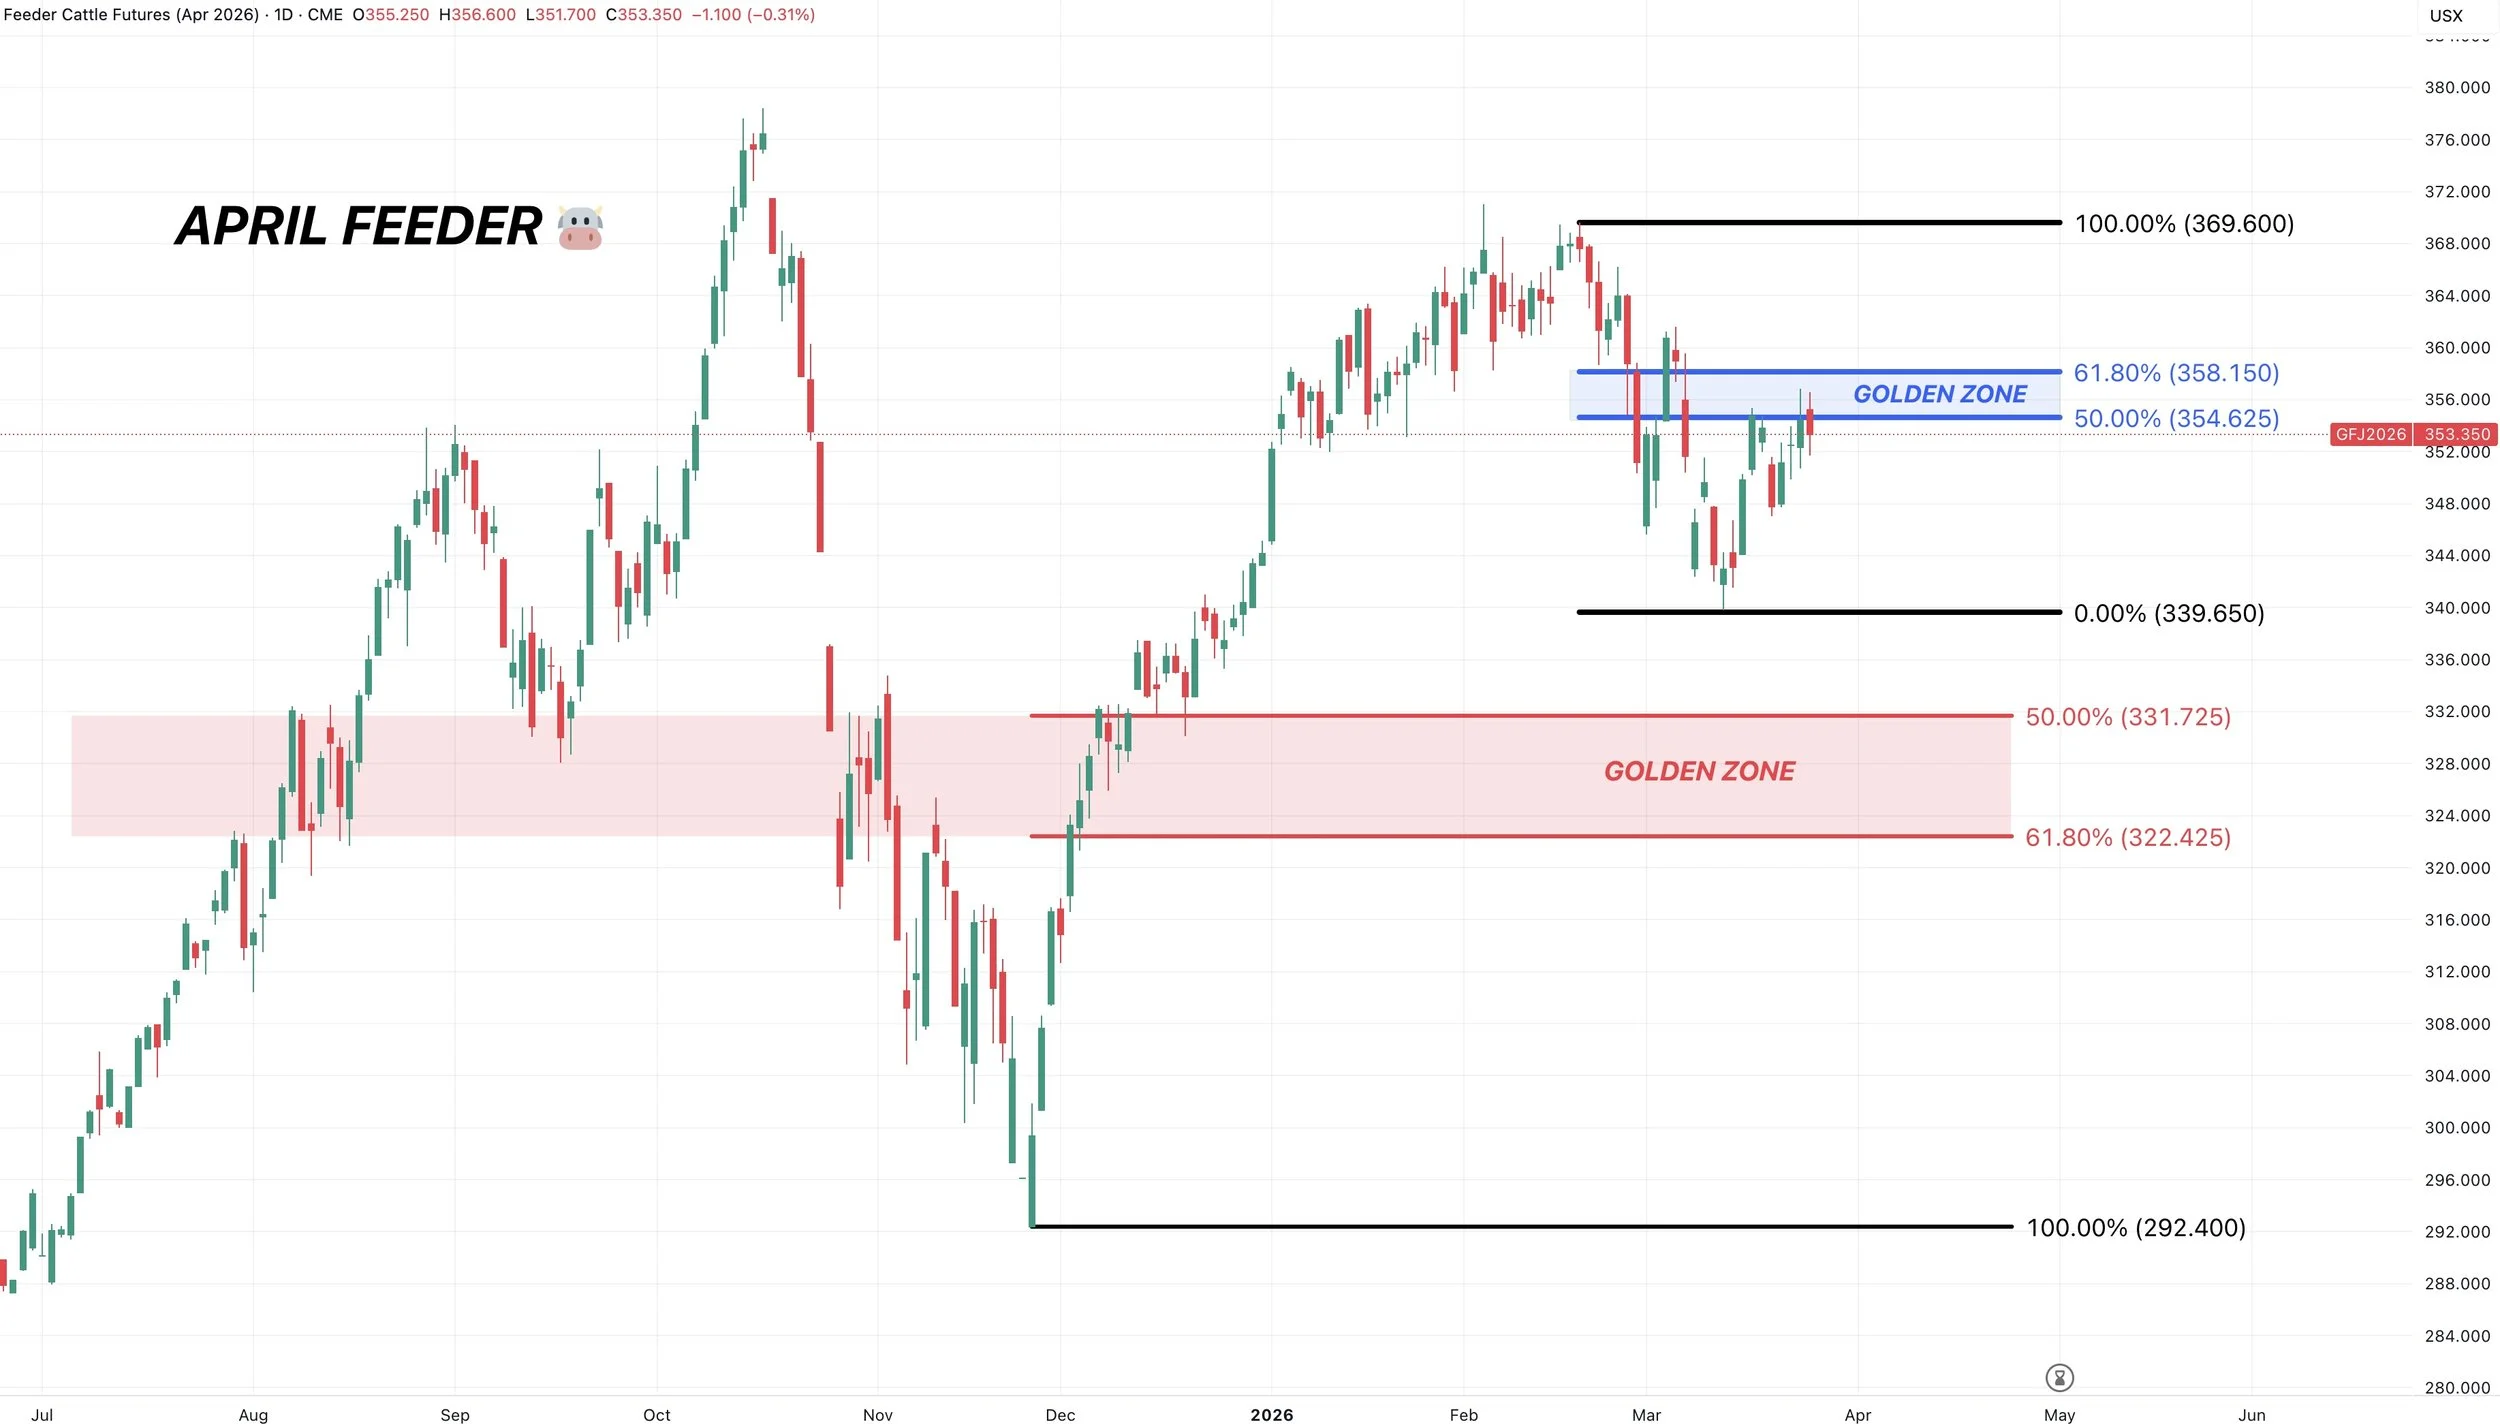
Cattle
April Feeders Chart:
Not going to touch on the fundamentals today.
We are sitting right in the golden zone of the sell off.
I view this bounce as a level to protect.
This is where most bounces struggle.
It's where the market makes a decision.
The trend remains lower unless we take out 358 and the 61.8% retracement of this entire sell off.
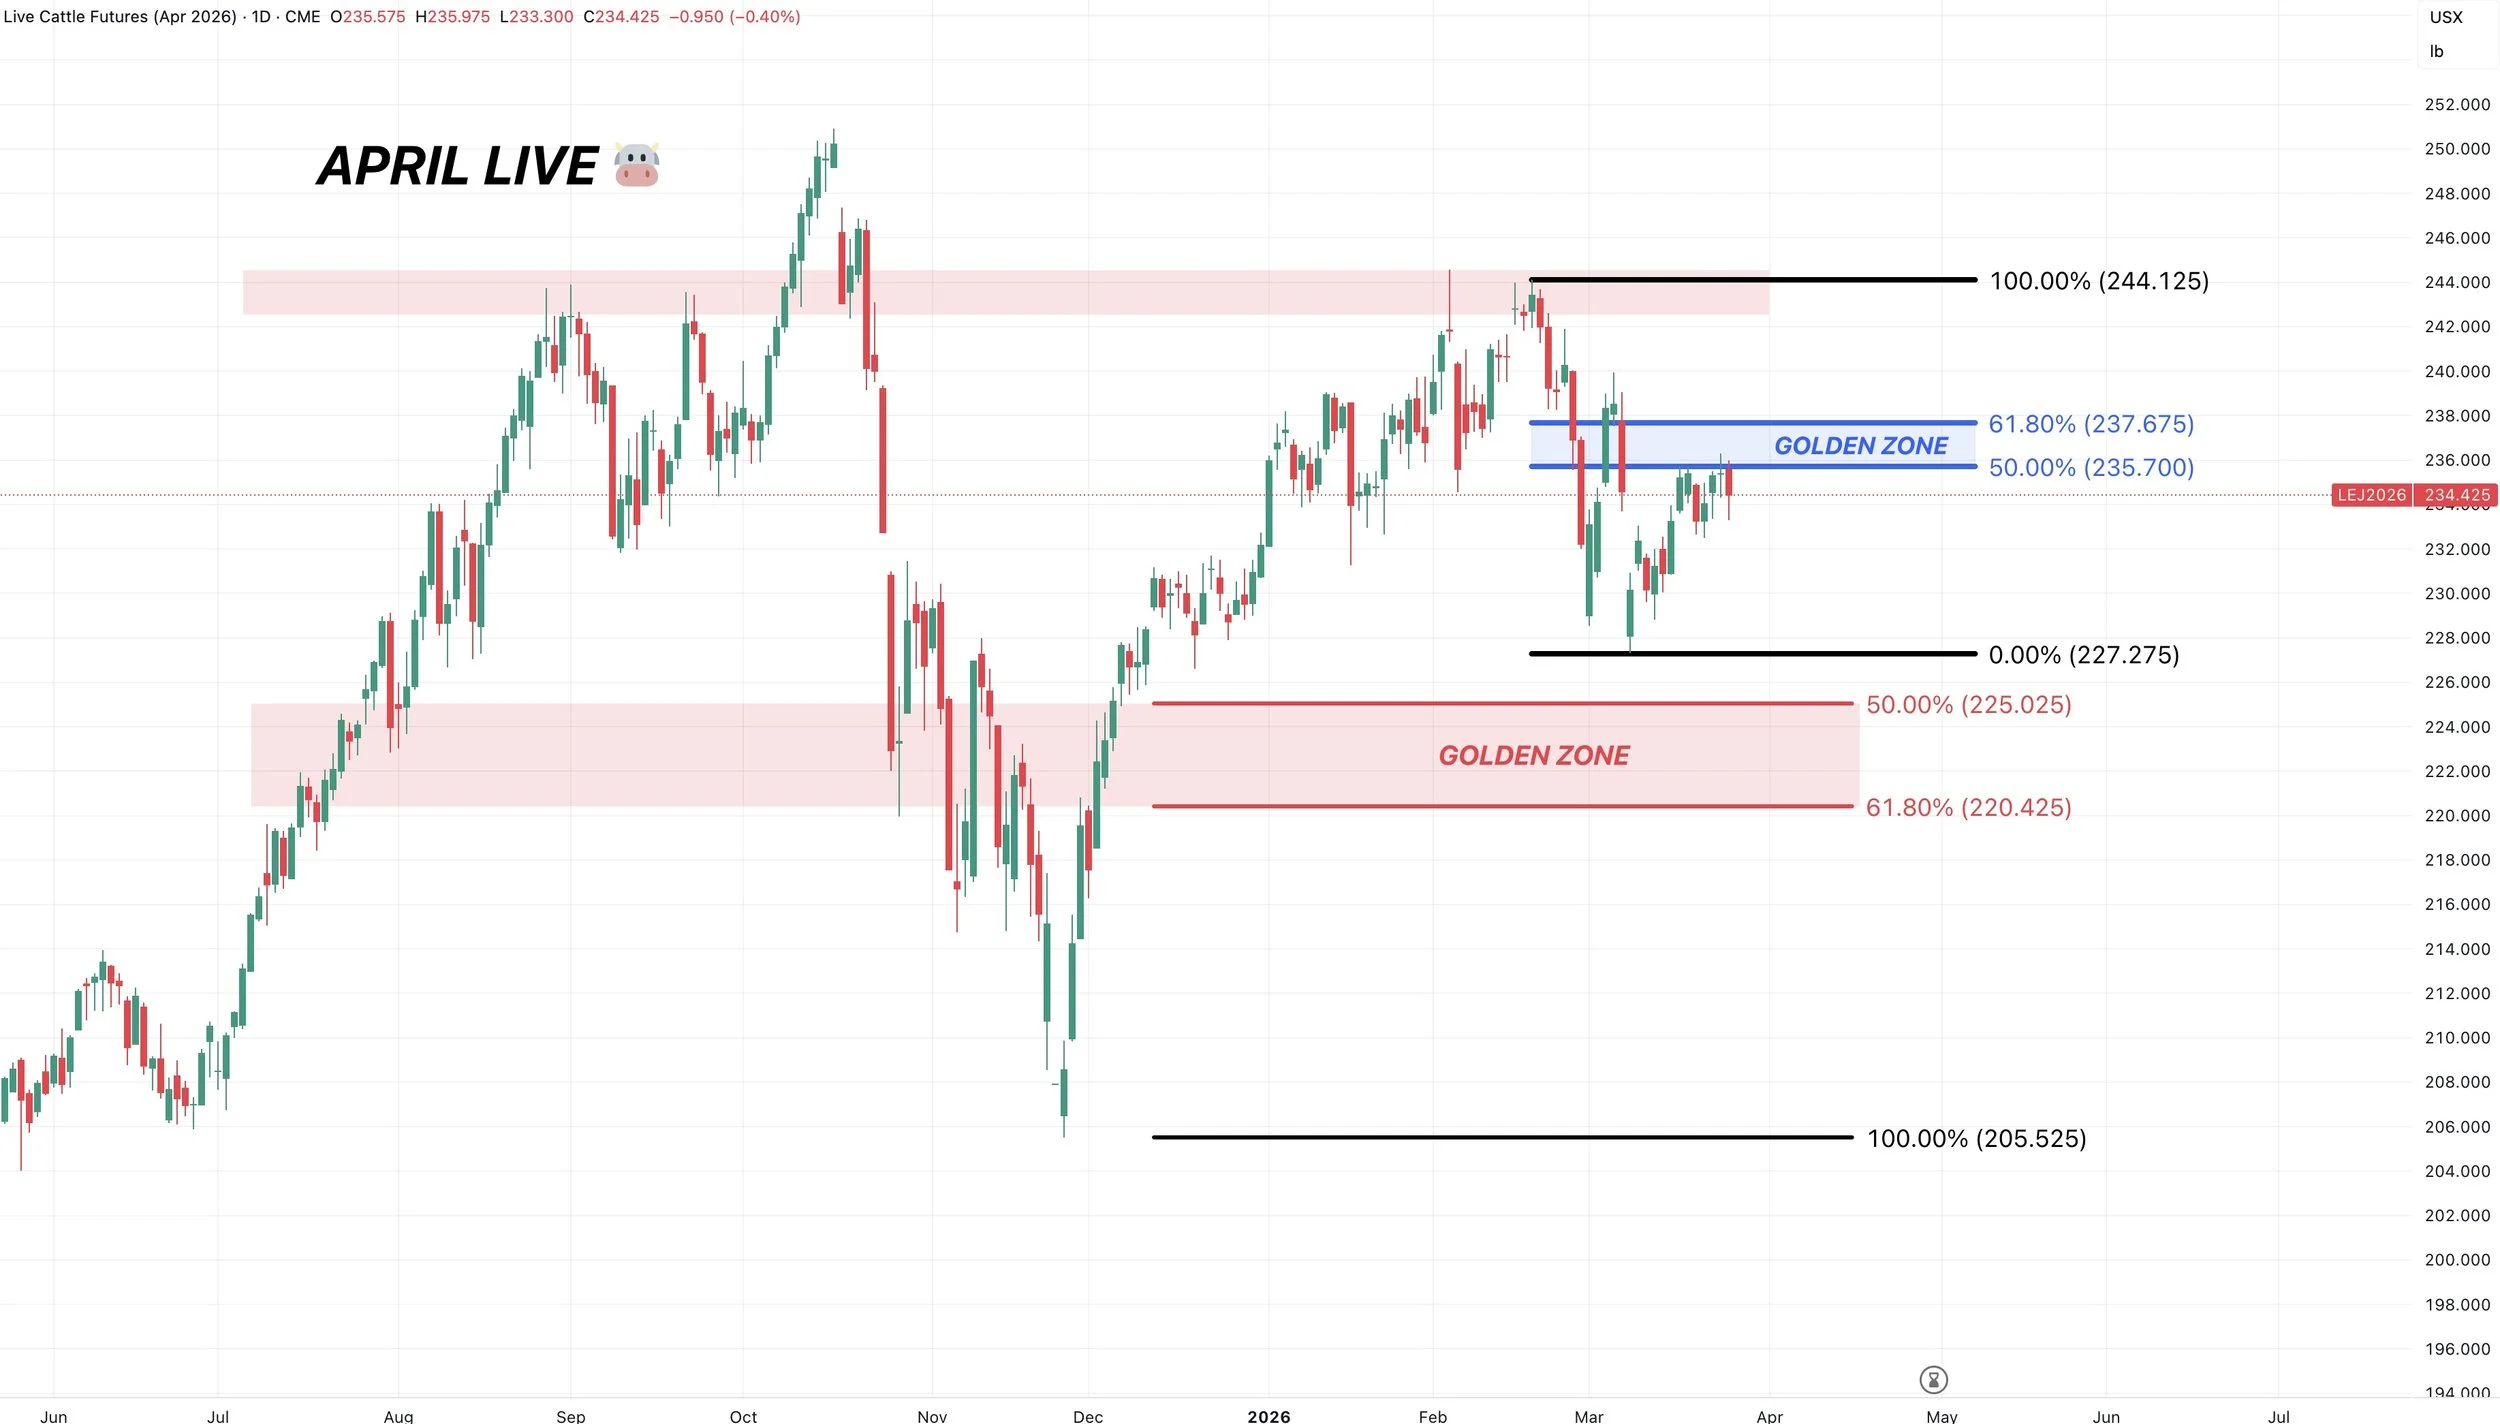
April Live Chart:
Also sitting in the golden zone.
This is viewed as a correctional bounce unless we break above the blue box.
Want to Talk?
Our phones are open 24/7 for you guys if you ever need anything or want to discuss your operation.
Jeremey, Lauren & Office: (806)484-1214
Sebastian: (605)280-1186
Email: sfrost@dailymarketminute.com
Hedge Account
Interested in a hedge account? Use the link below to set up an account or give us a call.
Recent Signals
March 19th, 2026: 🌱
New crop soybeans signal & hedge alert.
March 9th, 2026: 🌱
Soybeans signal & hedge alert. Sent via text.
March 6th, 2026: 🌽 🌾
Corn & wheat sell signal & hedge alert.
March 3rd, 2026: 🌽
Old crop & new crop corn sell signal & hedge alert.
Feb 26th, 2026: 🌱
Old crop & new crop beans sell signal & hedge alert.
Feb 19th, 2026: 🌾
KC wheat sell signal & hedge alert.
Feb 6th, 2026: 🌽 🌱
Old crop corn & soybean sell signal & hedge alert.
Feb 4th, 2026: 🌱
Soybean sell signal & hedge alert.
Nov 17th, 2025: 🌱
Soybean sell signal & hedge alert.