
CRUDE RUNS WHILE GRAINS FADE
MARKET UPDATE
You can scroll to read the usual update as well. As the written version is the exact same as the video.
Timestamps for video:
Overview: 0:00min
Corn: 2:45min
Beans: 8:45min
Wheat: 12:10min
Cattle: 14:10min
Want to talk?
Office: (806)484-1214
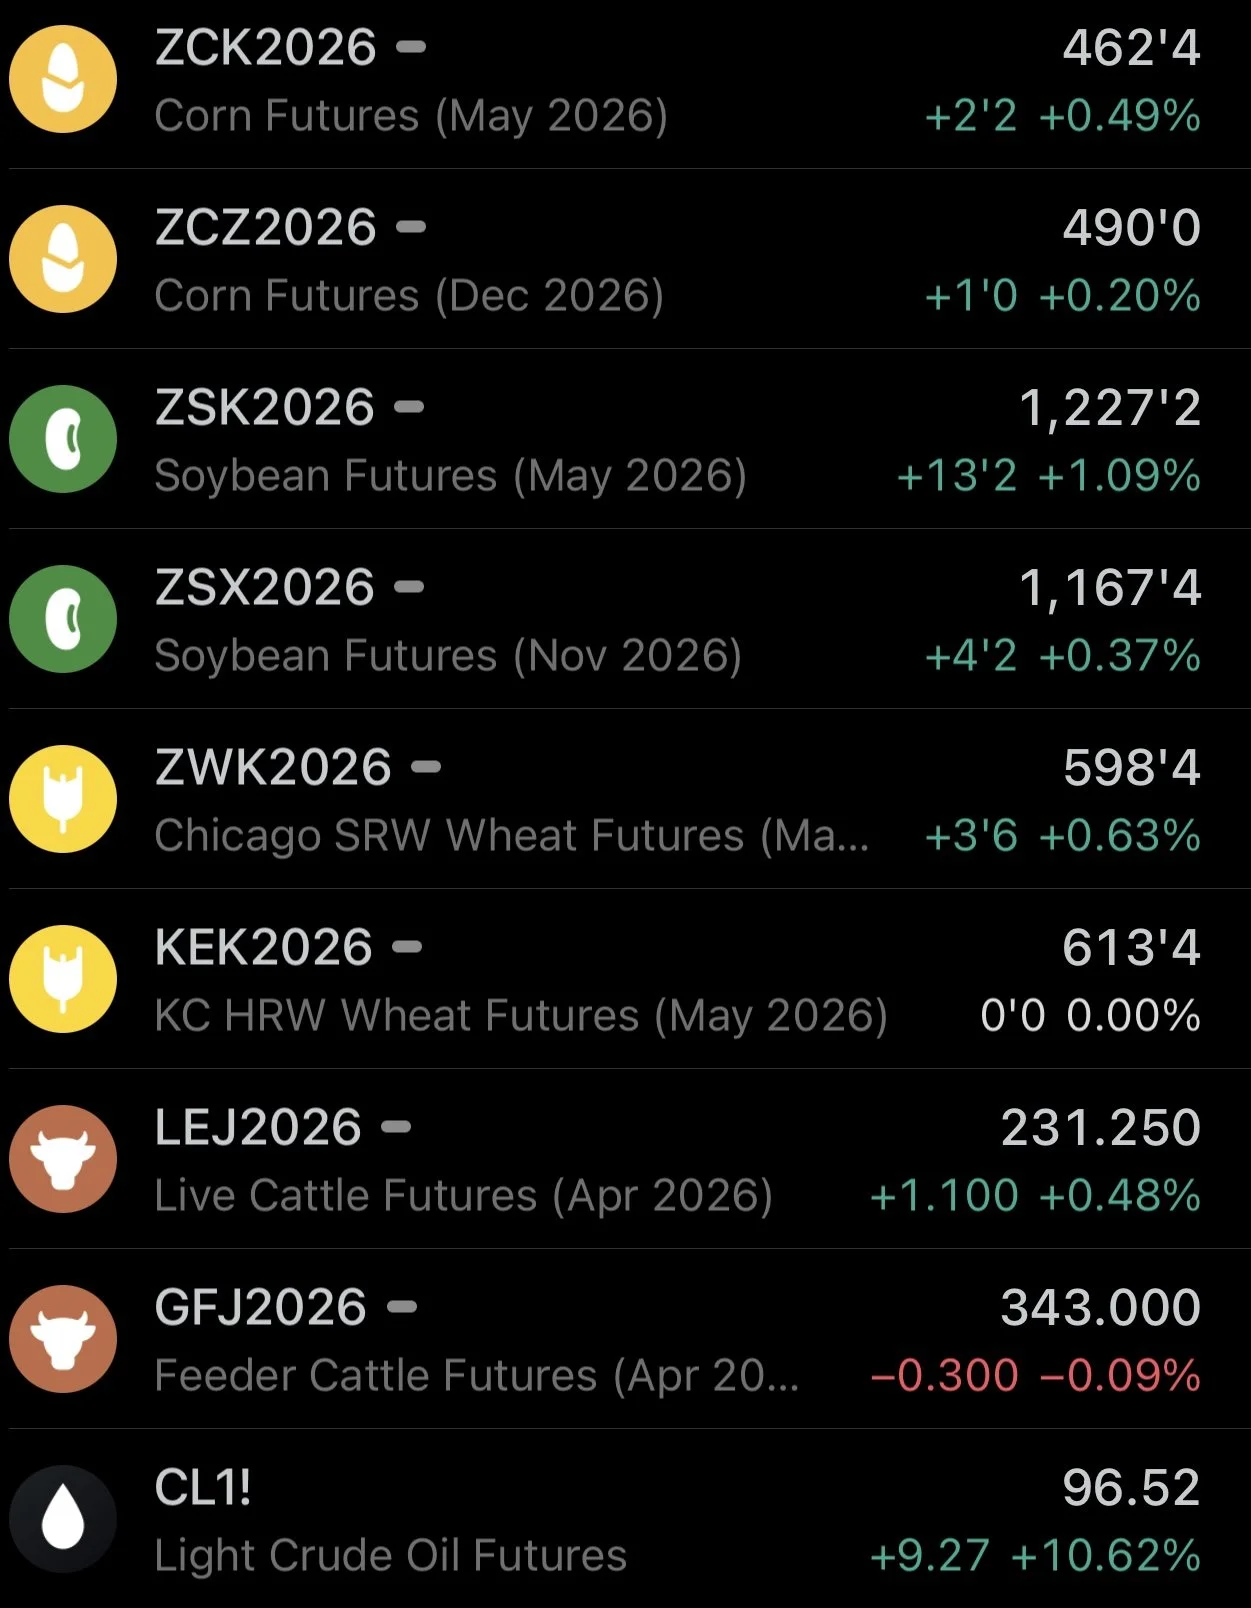
Futures Prices Close
Overview
Grains on the firm side while cattle was mixed.
Grains initially followed crude higher, but eventually faded off the early highs.
So not the best closes all around.
Corn closed -7 cents off it's highs.
Beans closed -11 cents off their highs.
Wheat was -15 cents off it's highs.
It was disappointing we failed to follow crude higher, and does make you kind of cautious up here.
Crude oil is back above $95 today, at one point we were up over $10 a barrel.
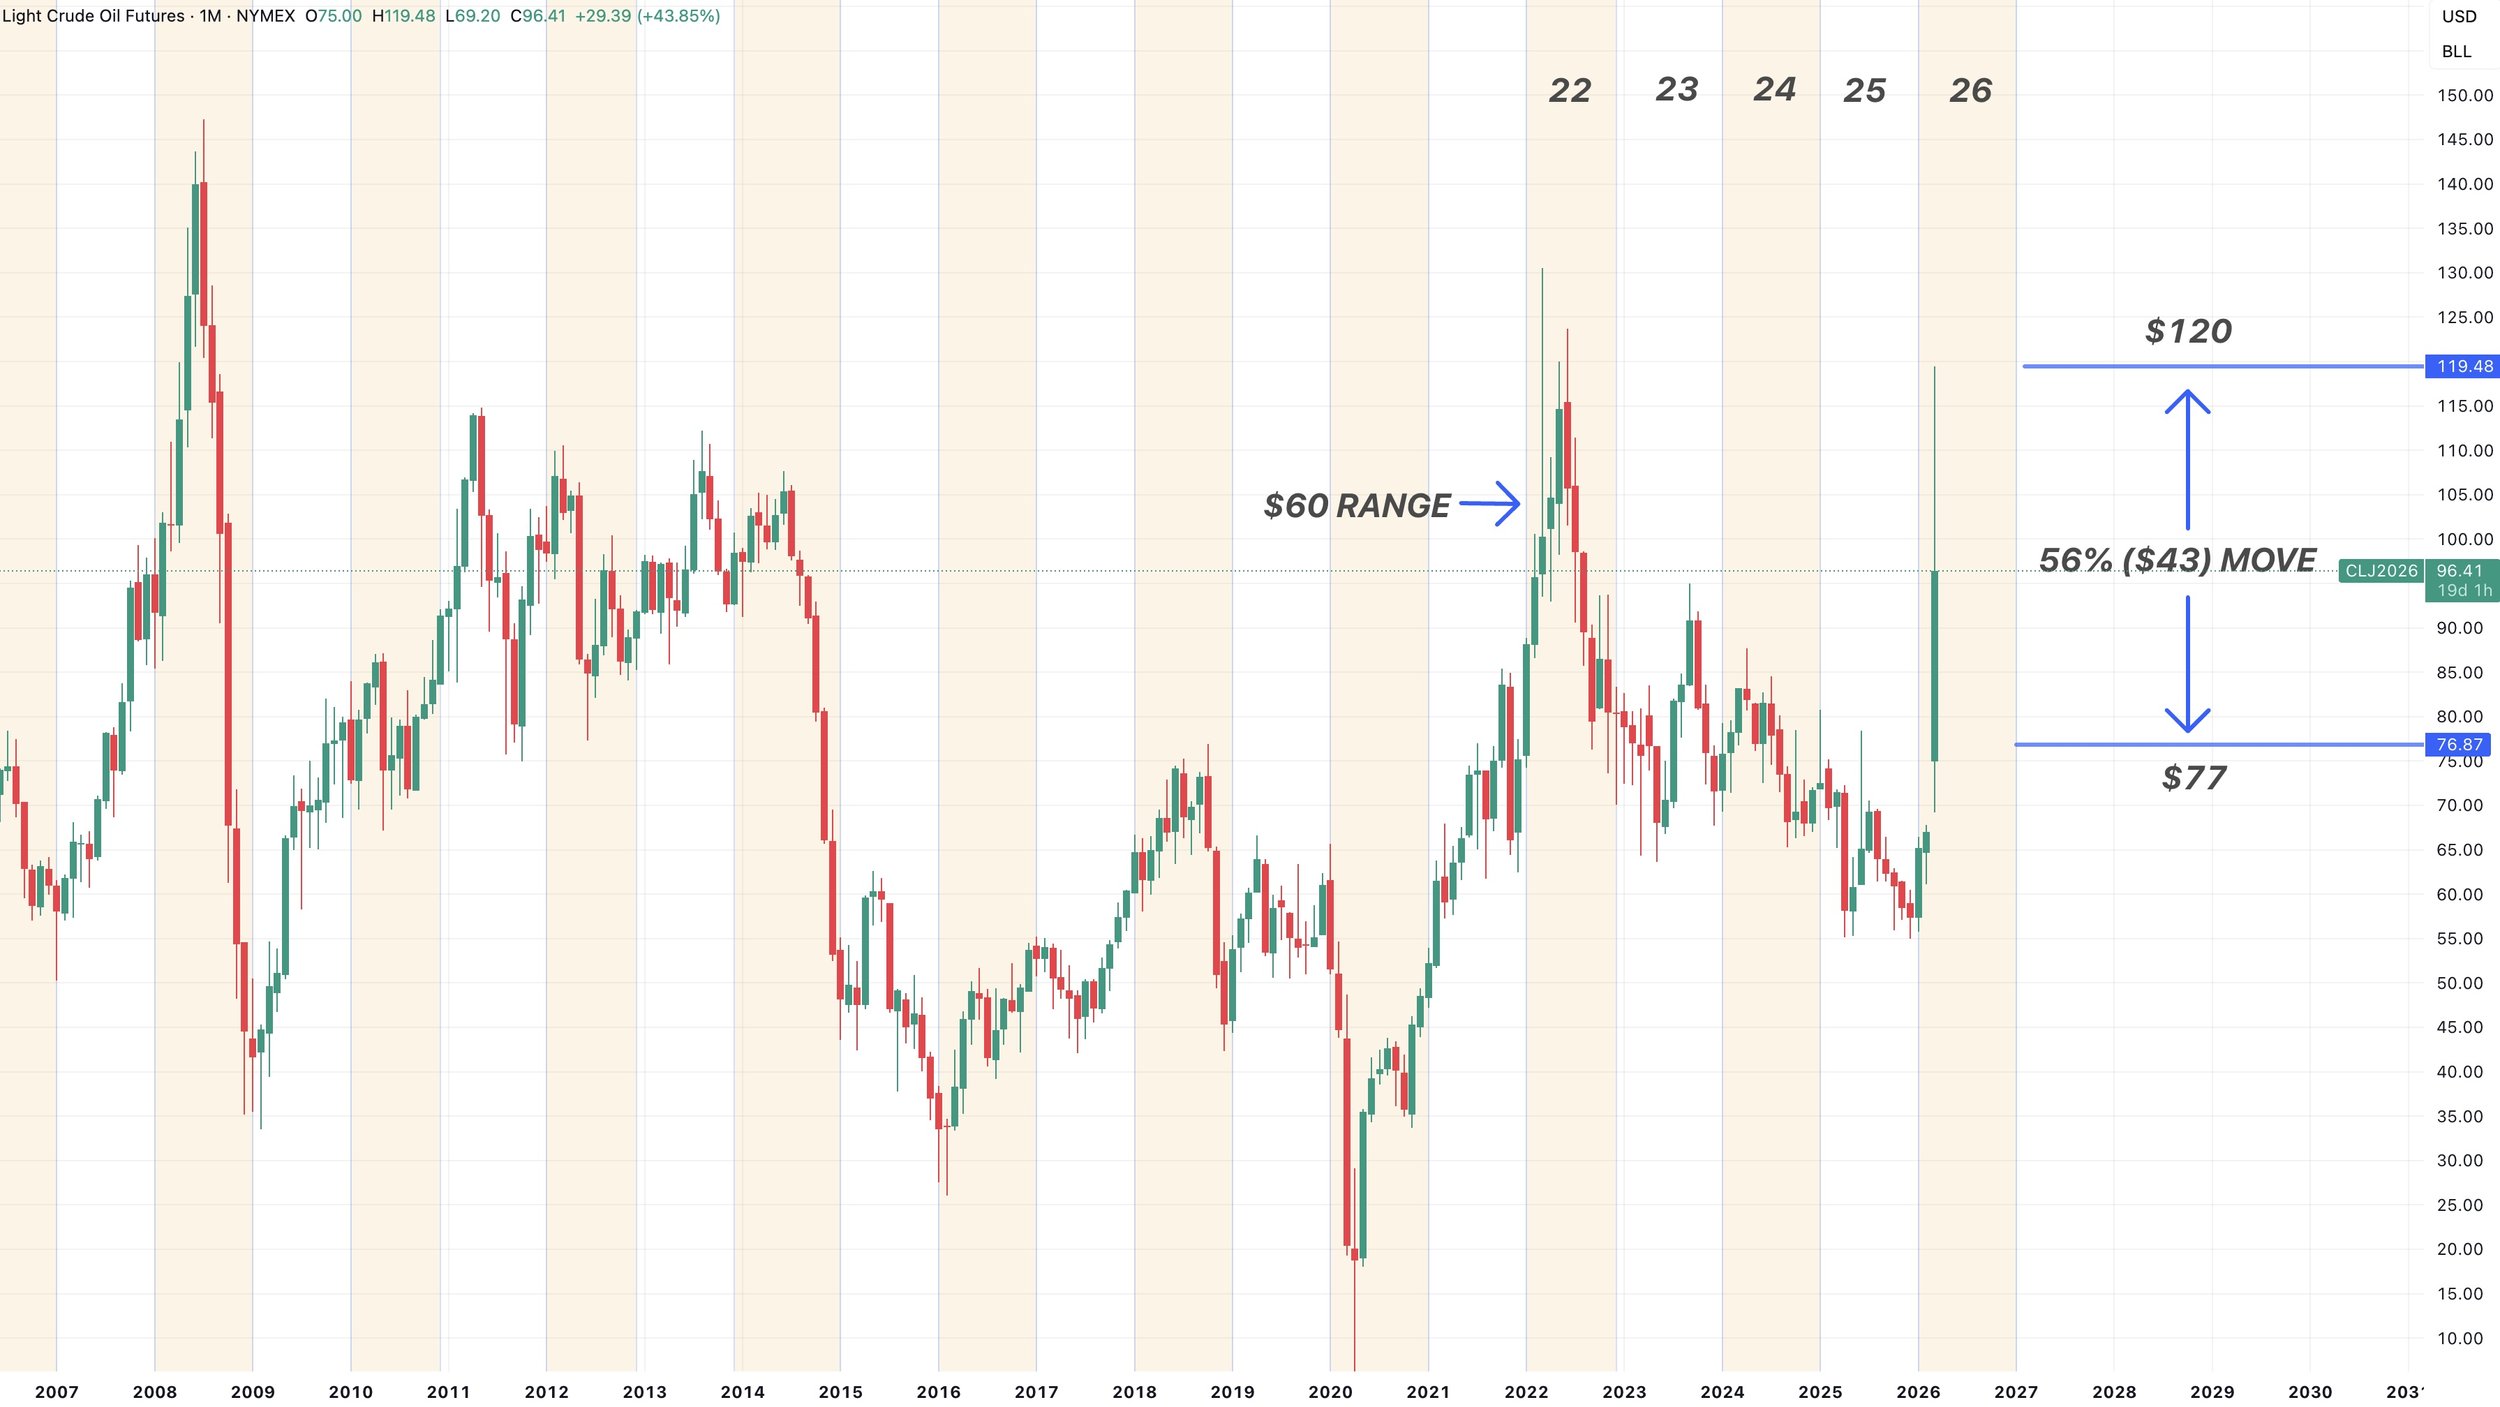
This week alone, crude has had a trading range of $43 a barrel.
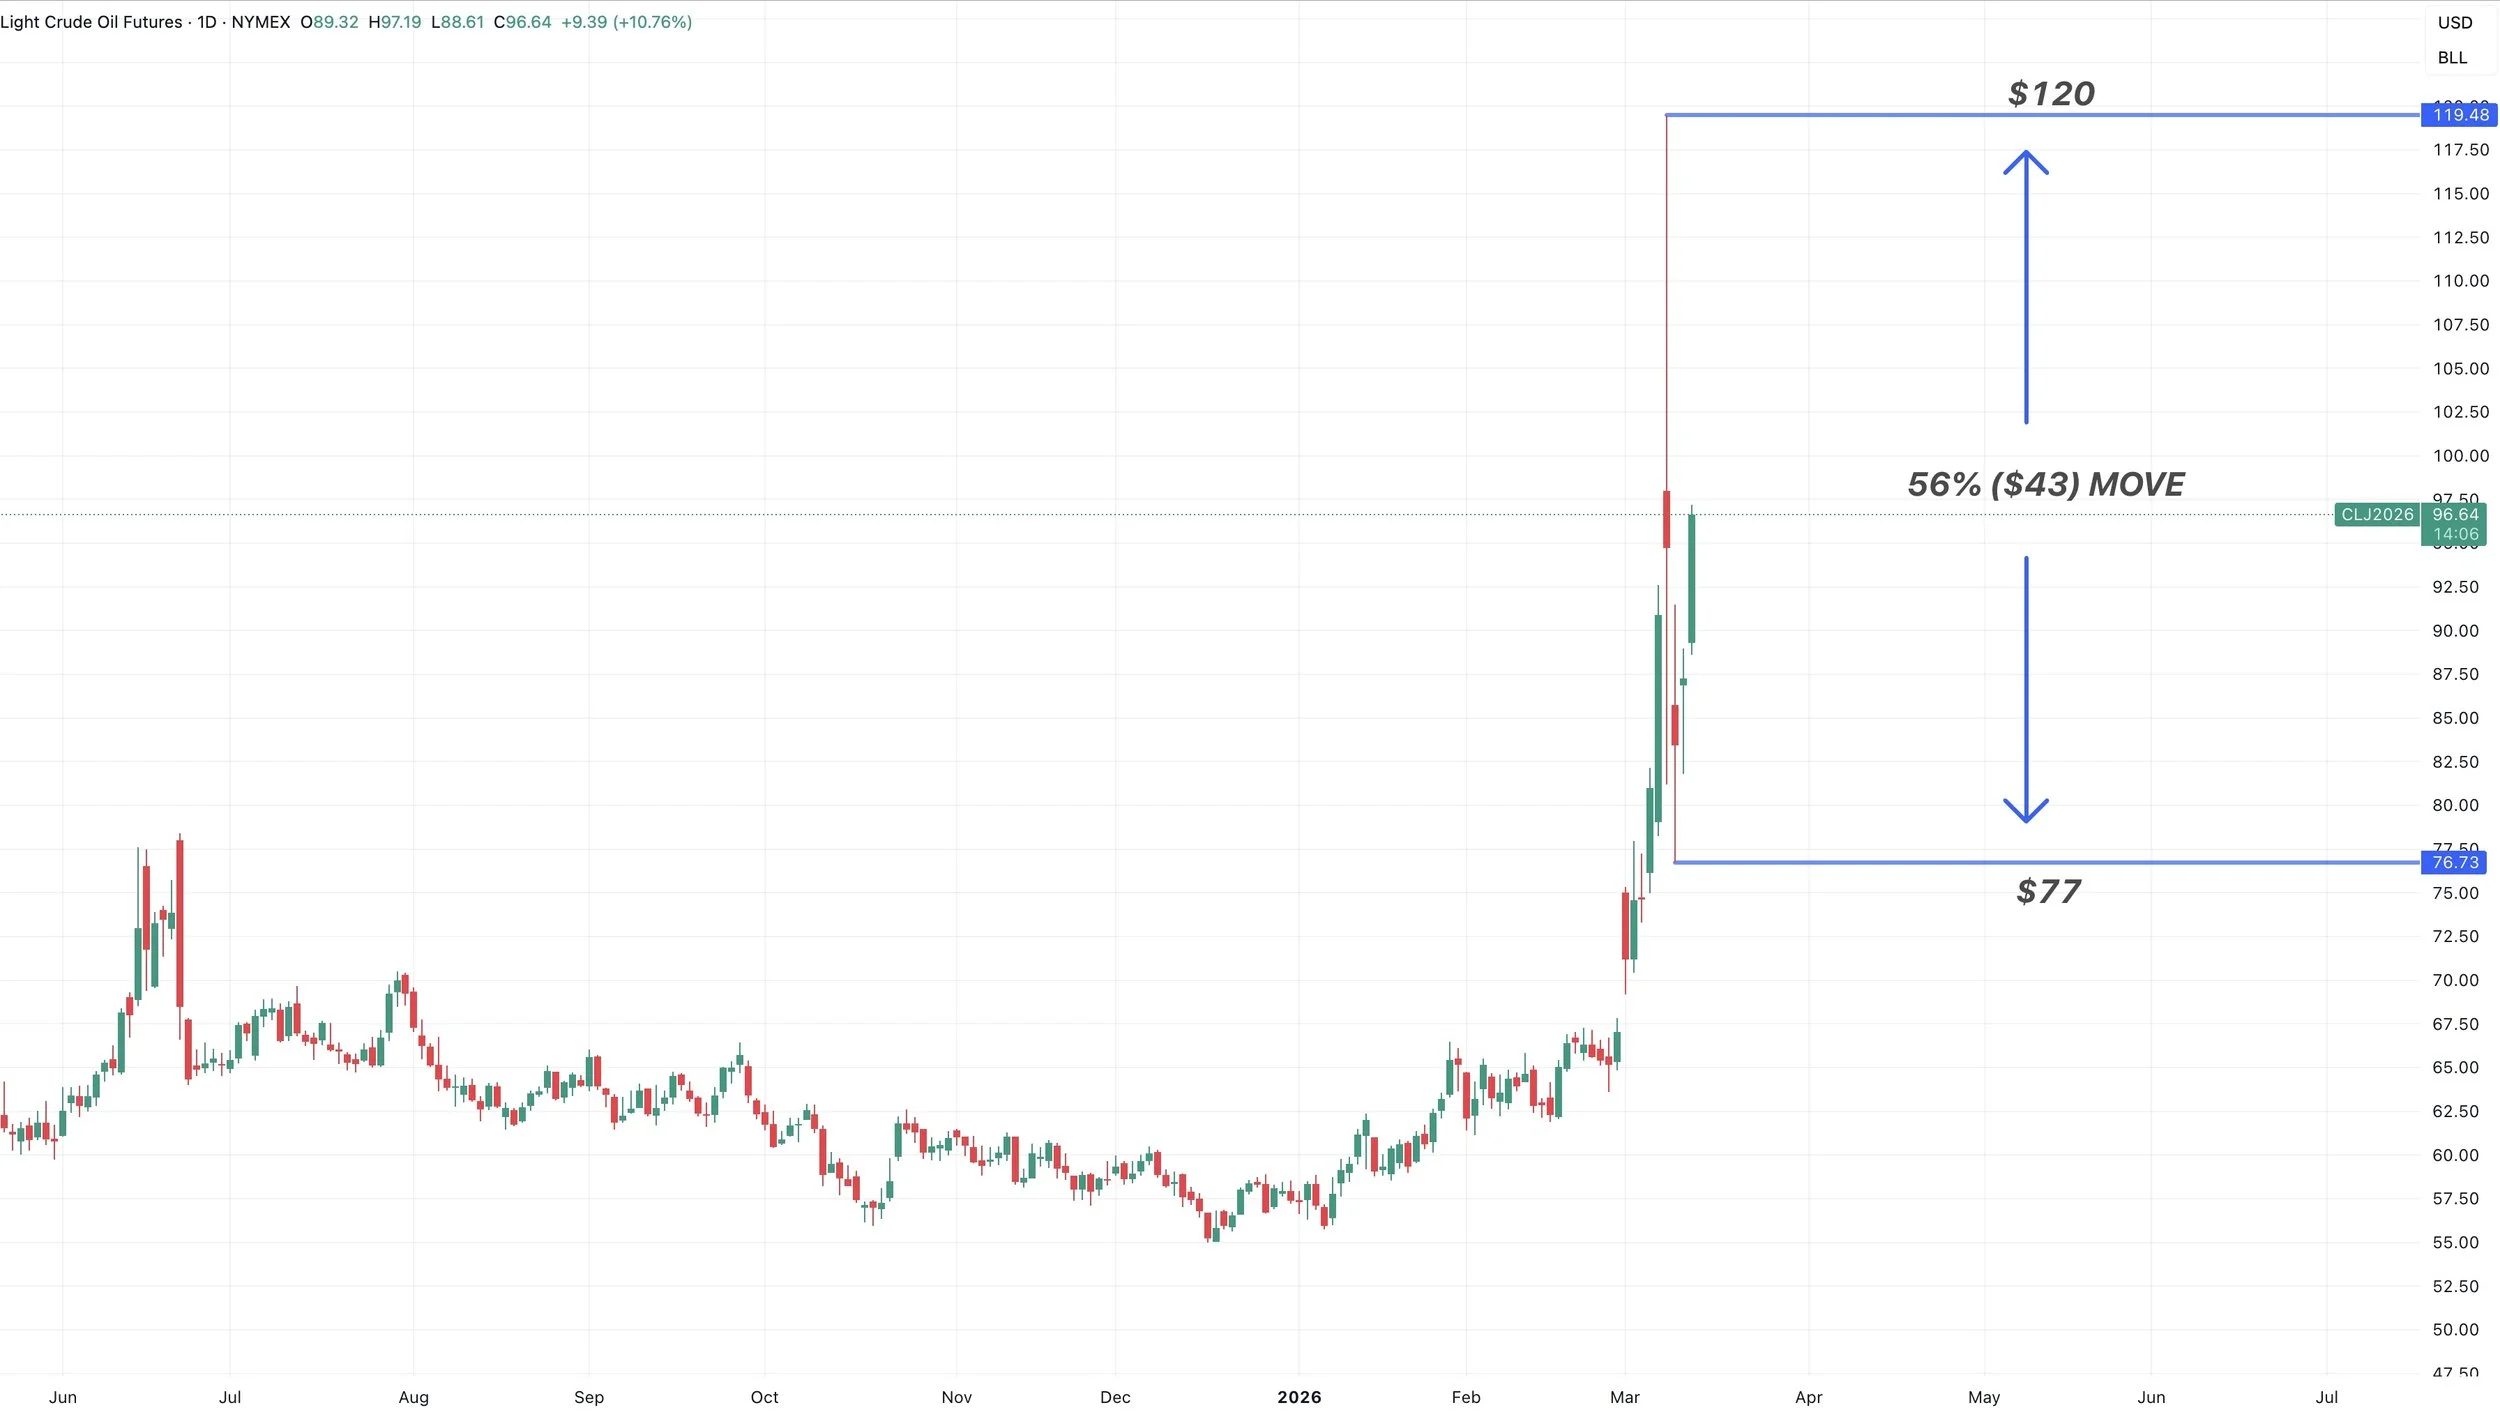
Most years don’t even see a trading range of $43 for the entire year.
The last year crude has a trading range larger than the range we saw this week was back in 2022.
Where we had a trading range of $60 for the entire year.
That is how historic the last week has been.
How high can oil go?
It's really anyone's guess, and I'd say it's in the hands of Trump.
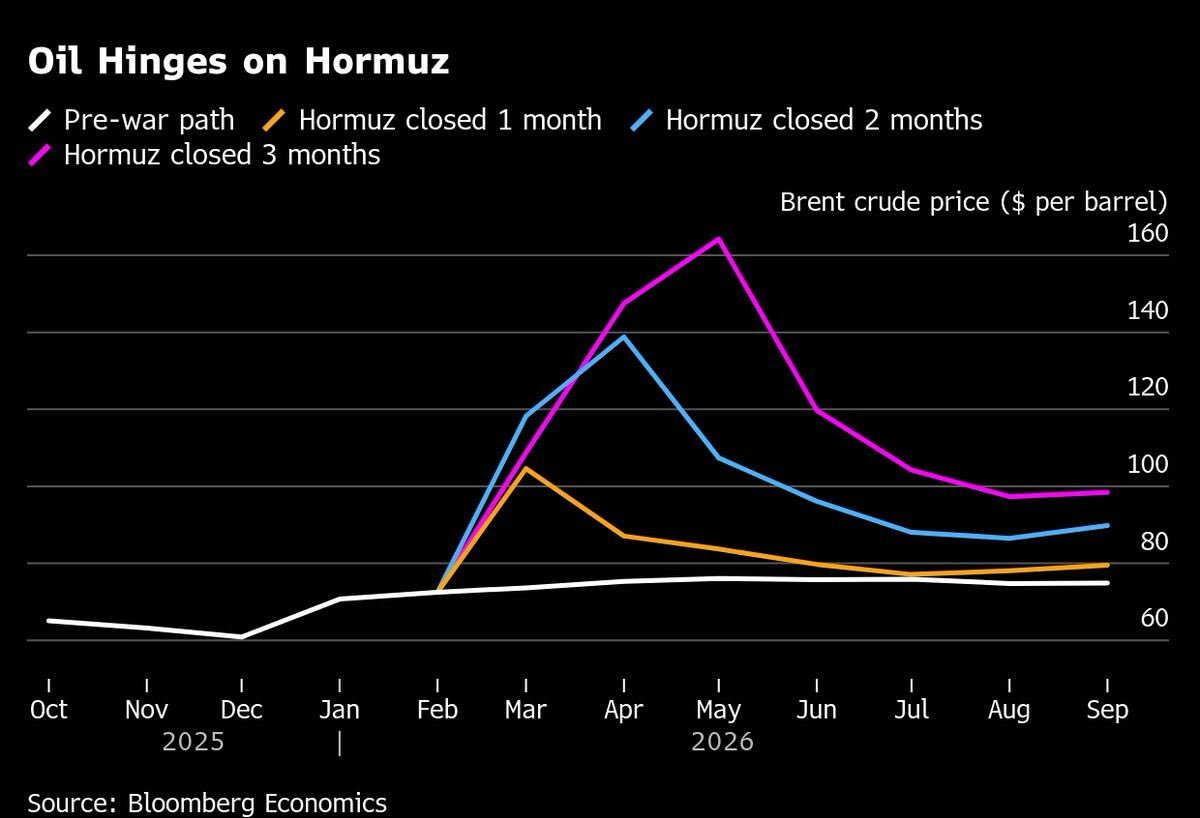
But here is a nice graph I found from Bloomberg.
It shows how the price of crude could be impacted based on how long the Strait of Hormuz stays shut down.
It has been closed for 13 days now.
So for reference, if it stays closed for another 2 weeks (1 month total), we could expect crude in that $100 range based on their chart.
If it stays closed for 2 months total, so until the end of April, we could expect crude in that $140 range.
If it stays closed for 3 months total, or until the end of May, we could expect crude in that $160 range.
If you notice on the chart. Not only would they expect crude to go higher the longer it stays open, but they would also expect the new floor to stay higher as well. So it really does hinge on fast or prolonged this war lasts.
I personally don’t think the war lasts several months.
But let's just say it did, and crude went a lot higher, and the situation doesn’t get resolved soon.
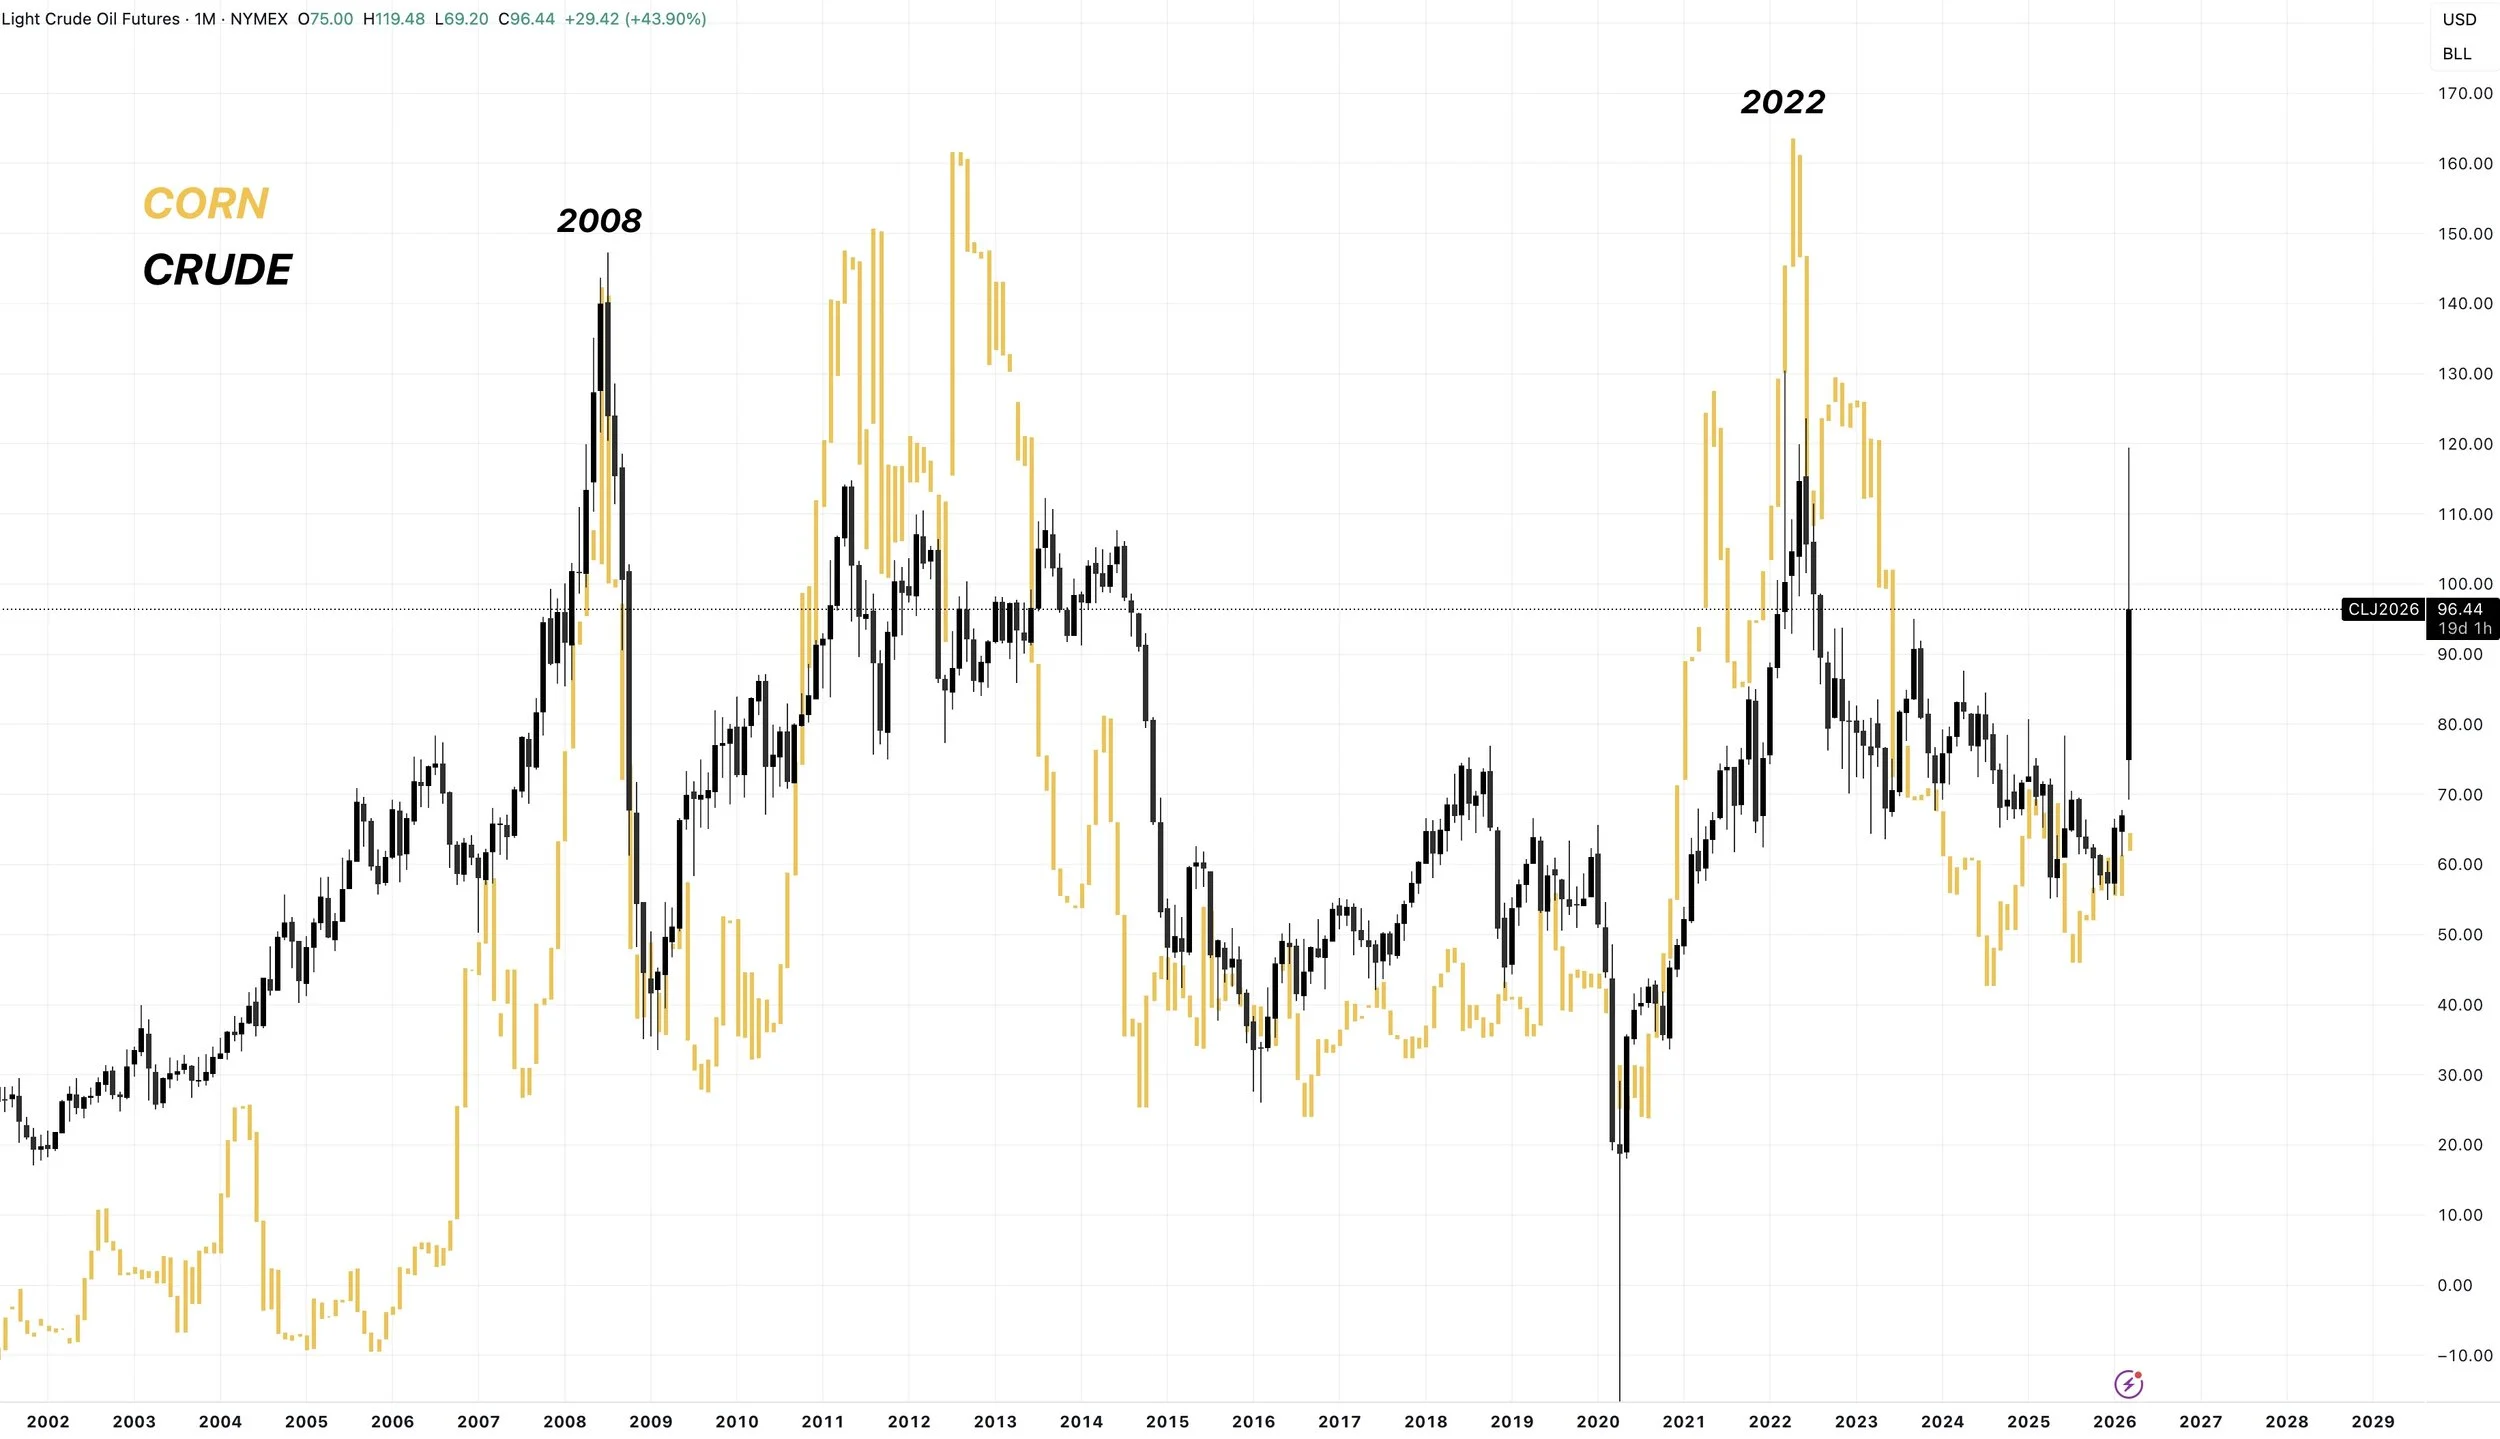
Here is the big picture crude oil vs corn chart comparison.
I mean, if crude does stay that elevated, we could expect corn and the grains to follow suit.
Fundamentals haven’t changed for grains.
But sometimes it's all about where big money wants to place their bets. If energy and oil keep going higher, it's going to take grains along for the ride.
Not only is higher crude bullish for biofuels, but higher crude could make grains an inflationary play.
Because when crude goes up, so does inflation and the cost of absolutely everything.
Consequently, if oil tanks, grains could lose the recent premium.
Today's Main Takeaways
Corn
The war doesn’t change the fundamental story in corn.
But.. if it does last for a while, and if the price of crude stays elevated, and if this all leads to higher inflation.
Then yes, corn can still go a lot higher despite the fundamentals not necessarily saying corn has to go higher.
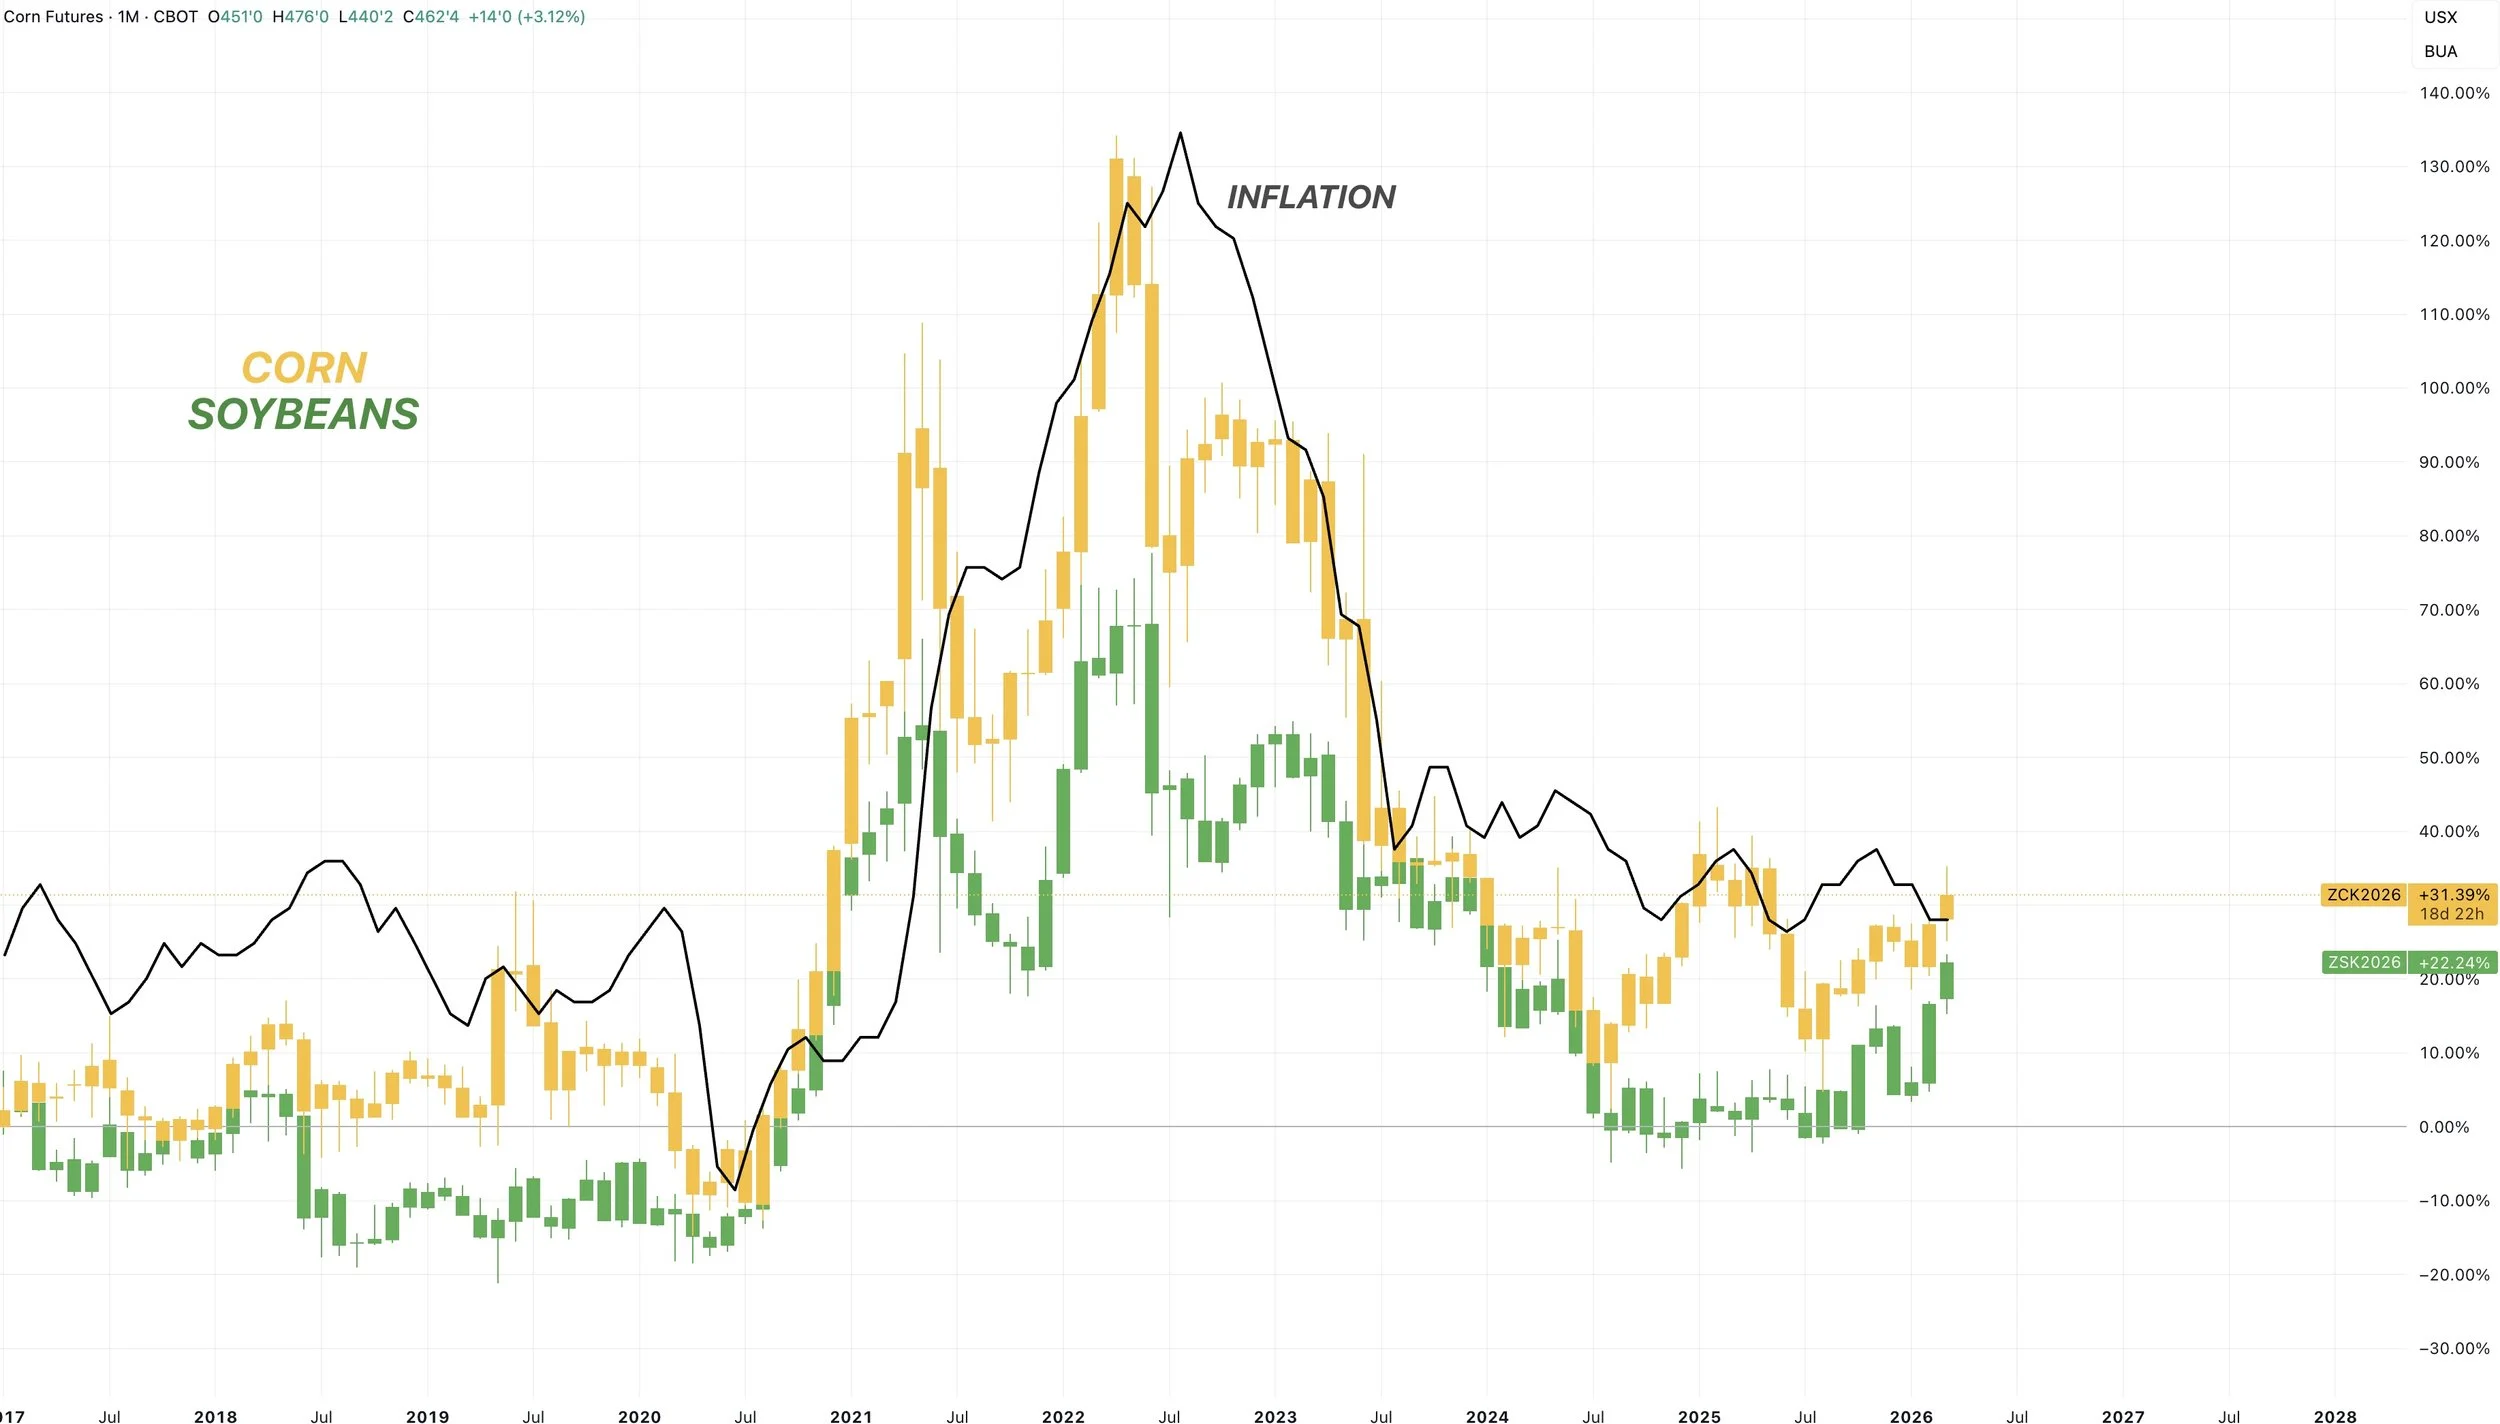
I've shown this chart before.
This is a chart that compared inflation to the price of corn and beans.
In 2022, we followed inflation higher and lower. Coincidence? Maybe, maybe not.
The risk is of course, that everyone gets long corn, then the war comes to an end. Crude falls apart. Corn follows it, those longs hit the exits. This crazy volatility can go both ways.
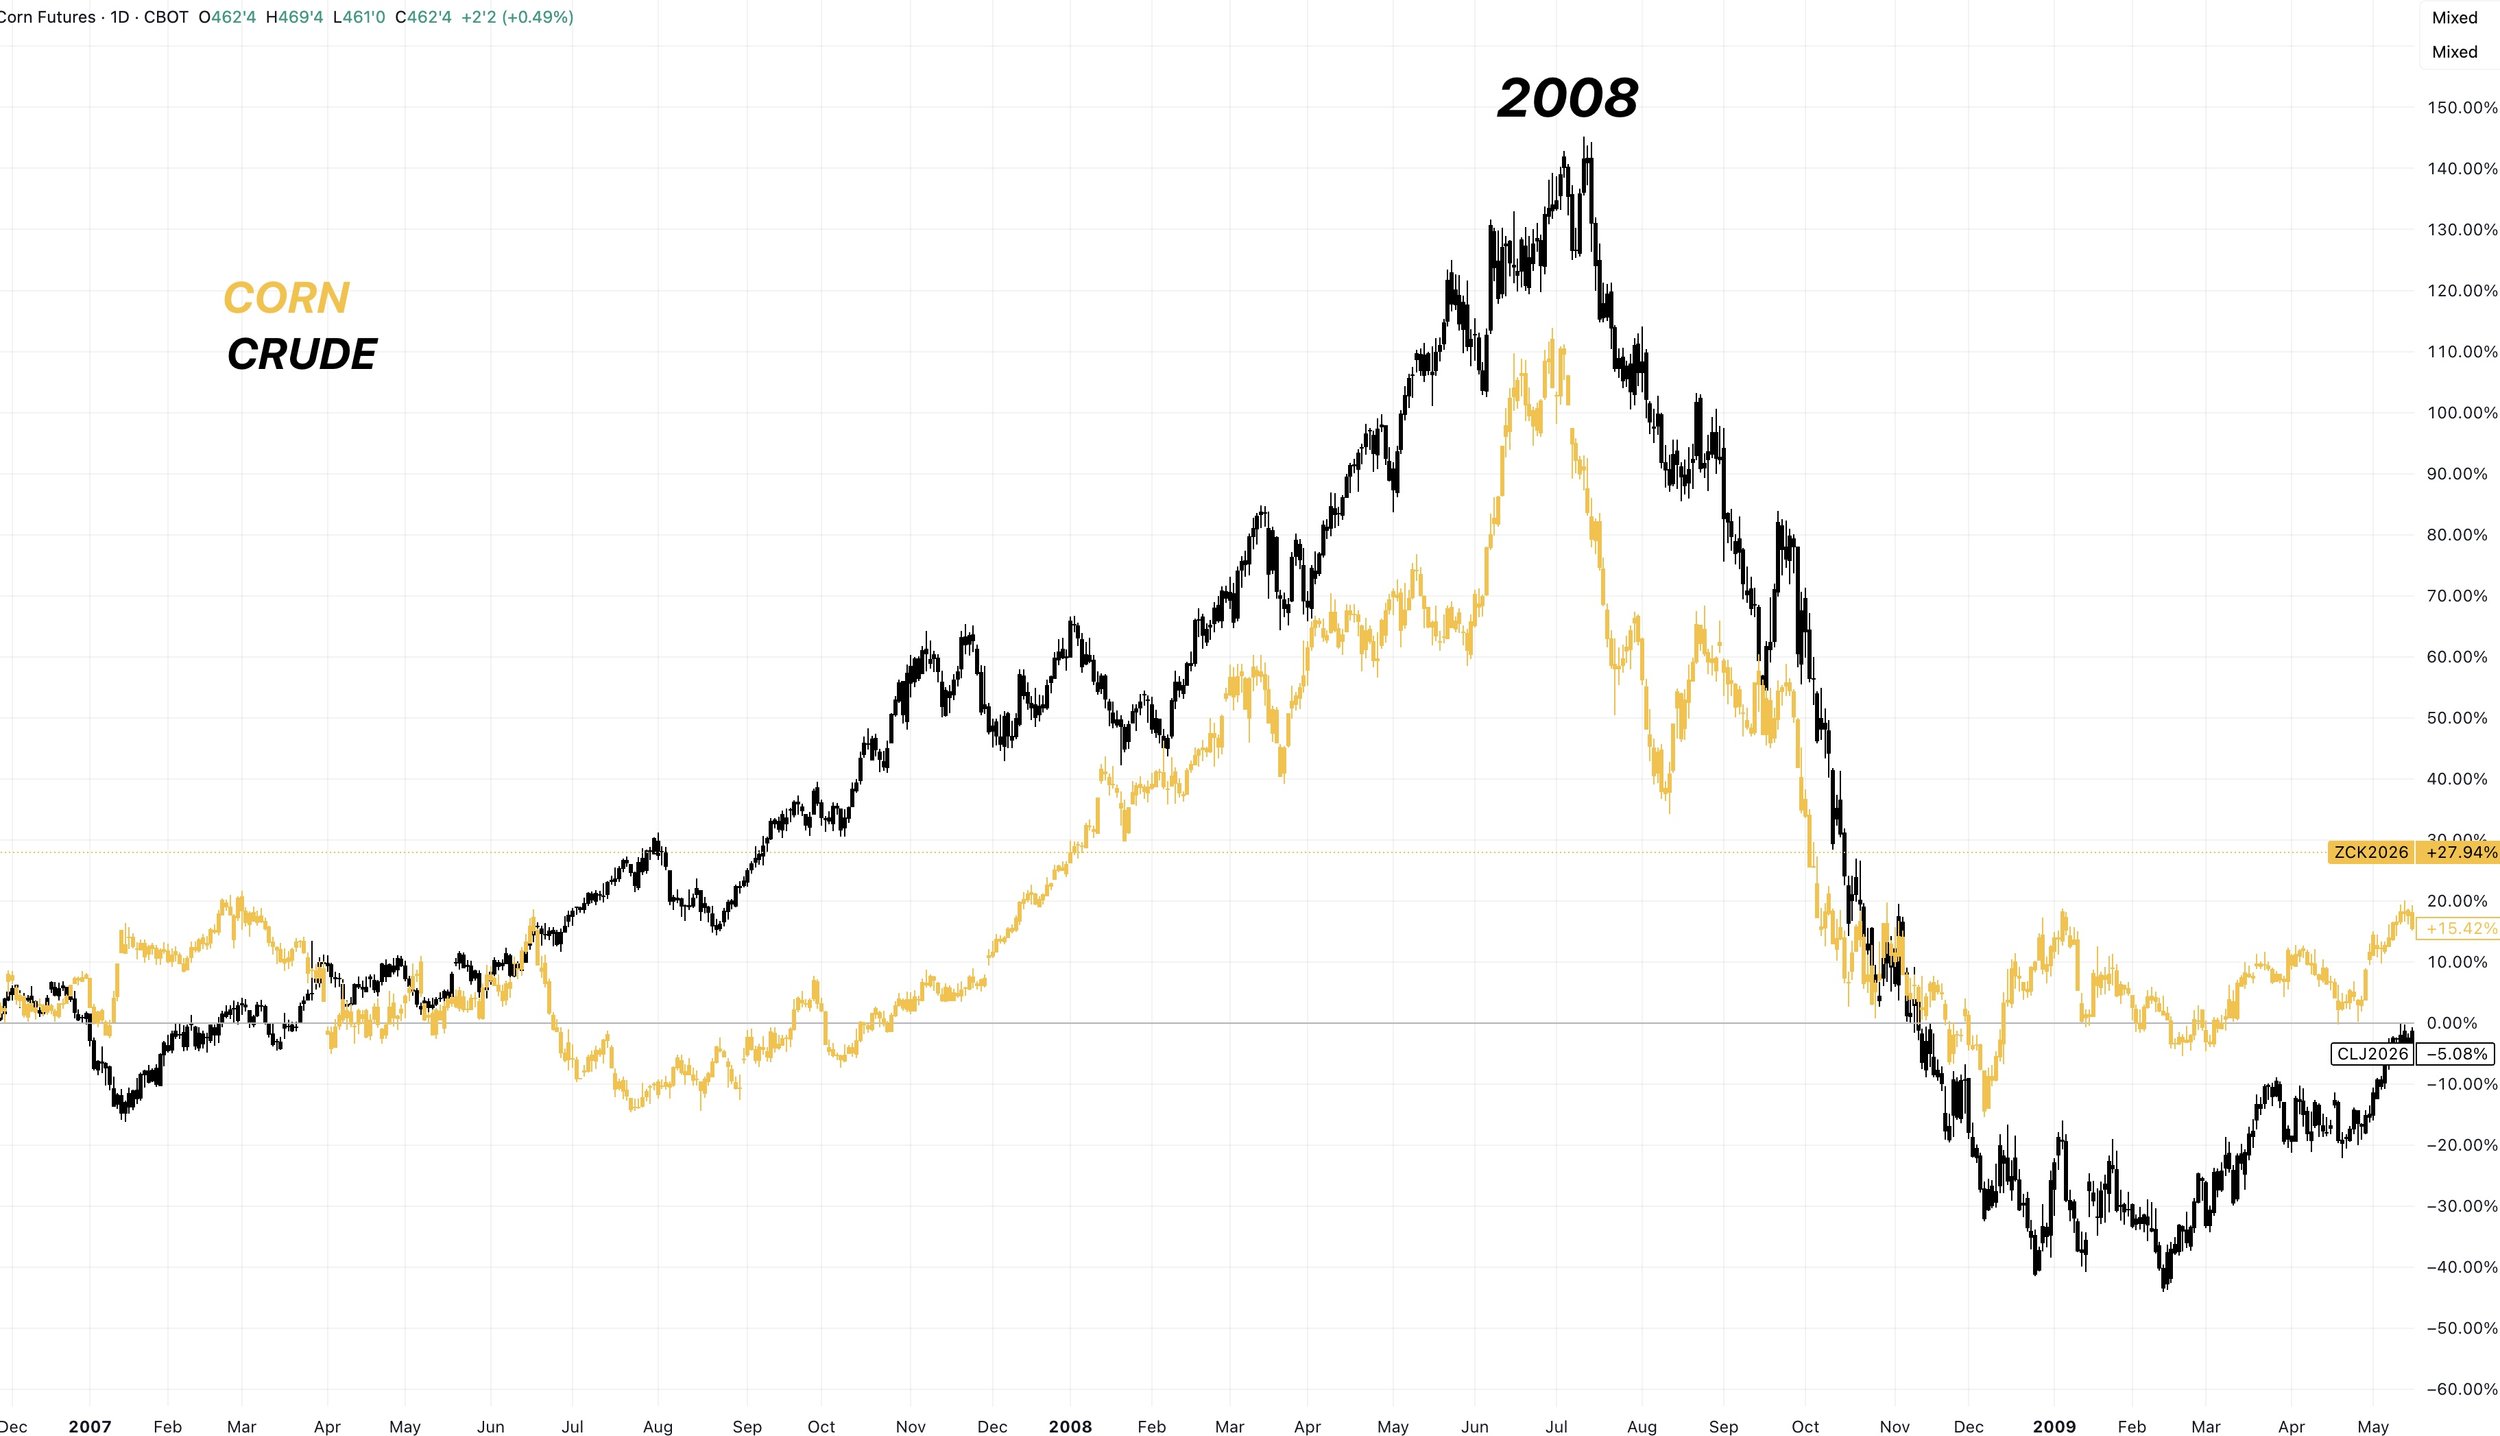
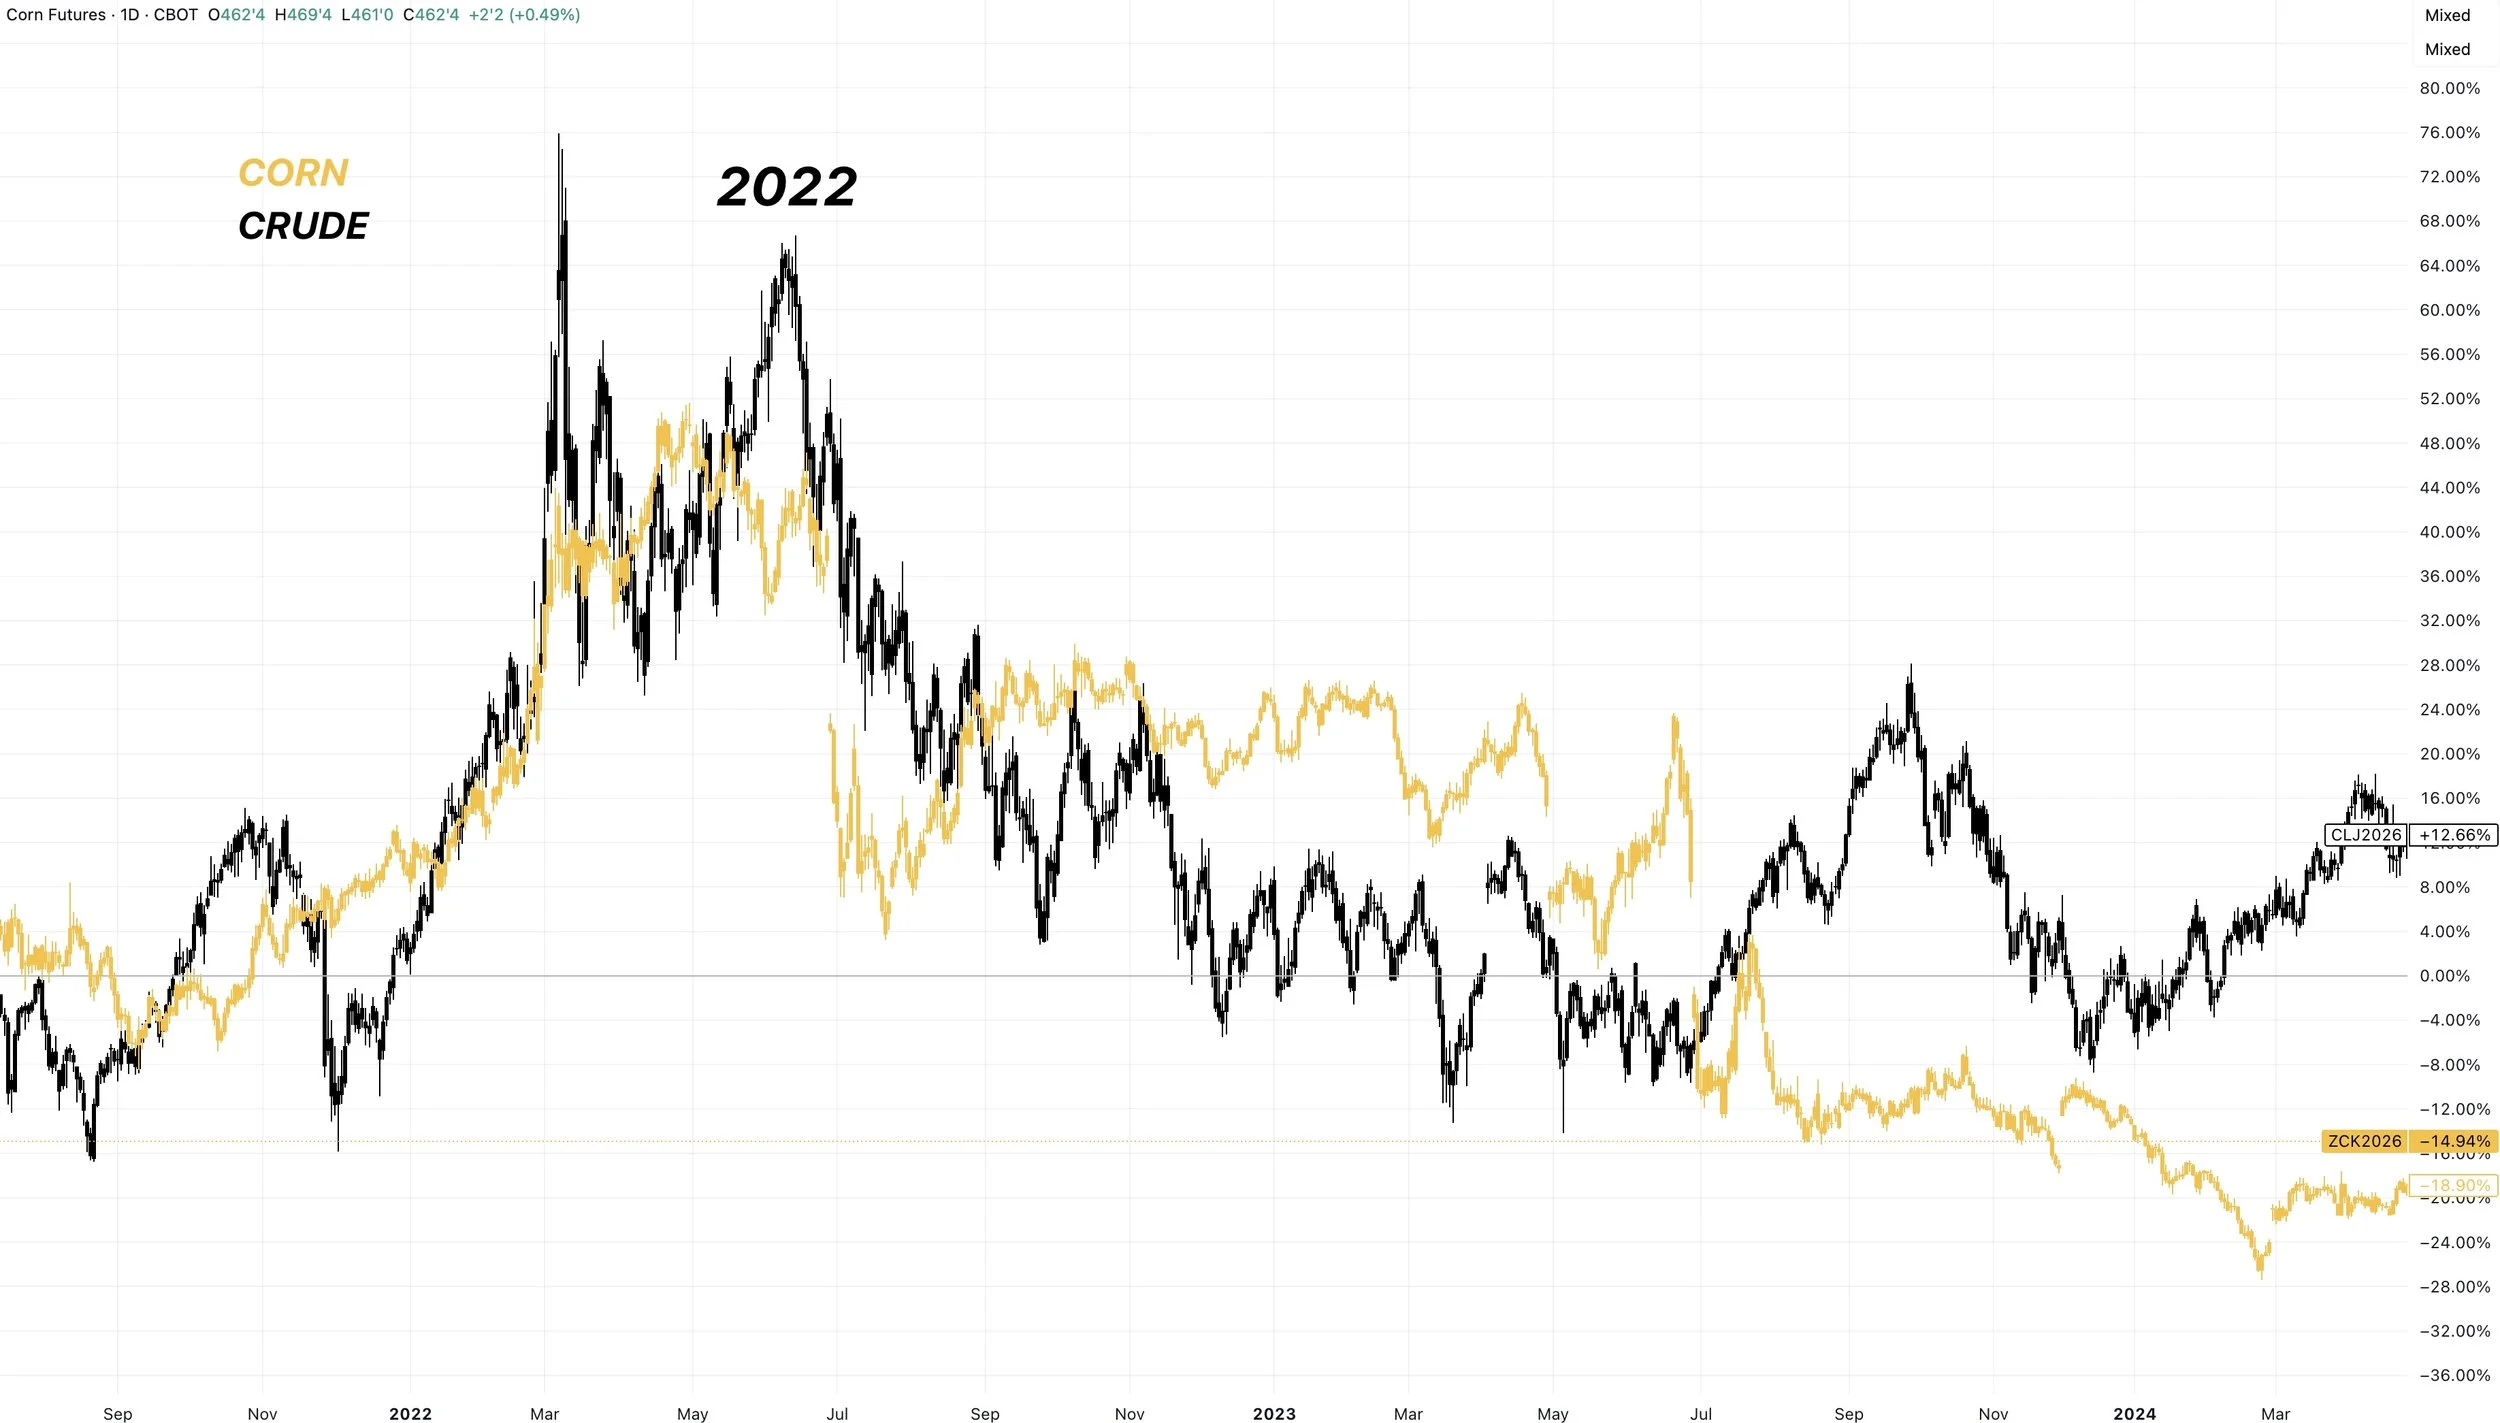
Take a look at 2008 for example, or even 2022.
We followed crude higher.
When crude fell apart, so did corn.
So that has to be something to be aware of moving forward.
If the war dies down, old crop corn is still going to have some headwinds to battle. We did just have record production after all.
However, even without war propping up the market, new crop corn does still have a potential fundamental story.
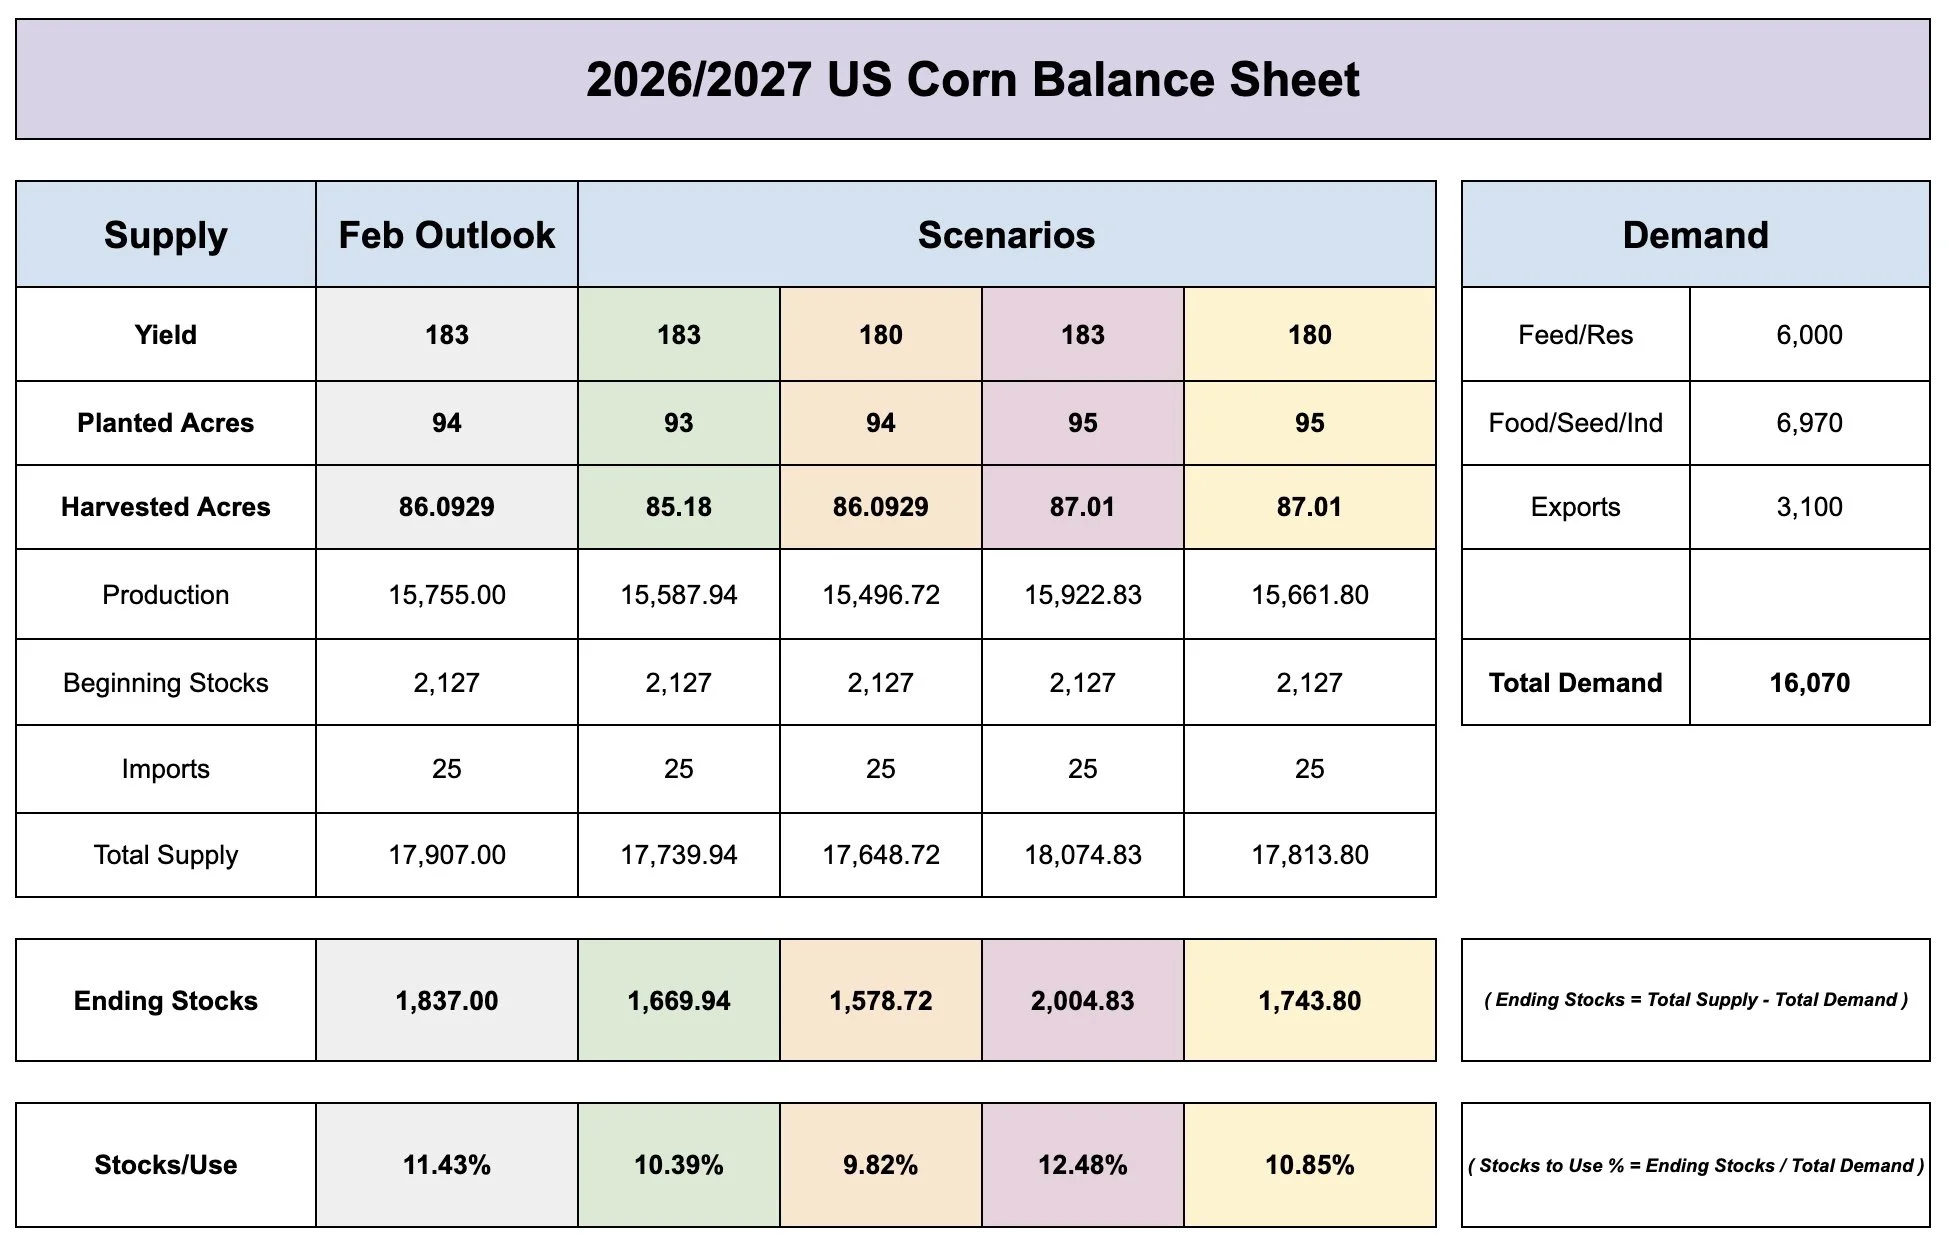
Friday I went over different examples on how yield could impact the new crop balance sheet, based on the February Outlook numbers.
But what if we change acres?
Here are some examples. None of these take into account demand. If supply drops, you could expect some demand cuts to offset the supply loss. But you get the idea.
(Visual Examples Below)
Original Feb Outlook:
183 Yield + 94 Acres = 11.4% S/U
If we did lose a million acres, and kept yield at 183. It paints a somewhat friendly scenario.
183 Yield + 93 Acres = 10.4% S/U
If we kept acres at 94, but dropped yield to 180. It paints a decently bullish scenario. With a sub 10% stocks to use.
180 Yield + 94 Acres = 9.8% S/U
If acres come up a million, and yield stays at 183. We still have a bearish balance sheet. With over a 2 billion bushel carryout.
183 Yield + 95 Acres = 12.5% S/U
If we bumped acres up a million, but yield came in at 180. It wouldn’t be a super bullish, but I wouldn’t say it's bearish.
180 Yield + 95 Acres = 10.8% S/U
So we are still going to need a big yield to keep the new crop balance sheet large like it is in old crop.
But acres are going to play a big part as well. Just an extra 1 million acres adds almost 200 million bushels of supply to the balance sheet.
Here is all of the examples mentioned above.
Downside Protection:
We had a sell signal last Friday.
If you have not yet taken any risk off the table, we still like doing so.
The same goes for new crop. We are not yet getting carried away with new crop, but it makes sense to reward the highest prices we've seen in a year in some fashion given the uncertainties.
It's a headline driven market, and extremely volatile.
We want to ride the rally, knowing we could at some point take the elevator back down if things go a certain way.
What we prefer to do is to simply keep a floor under this thing.
It's the only way to eliminate your downside risk while keeping your upside open.
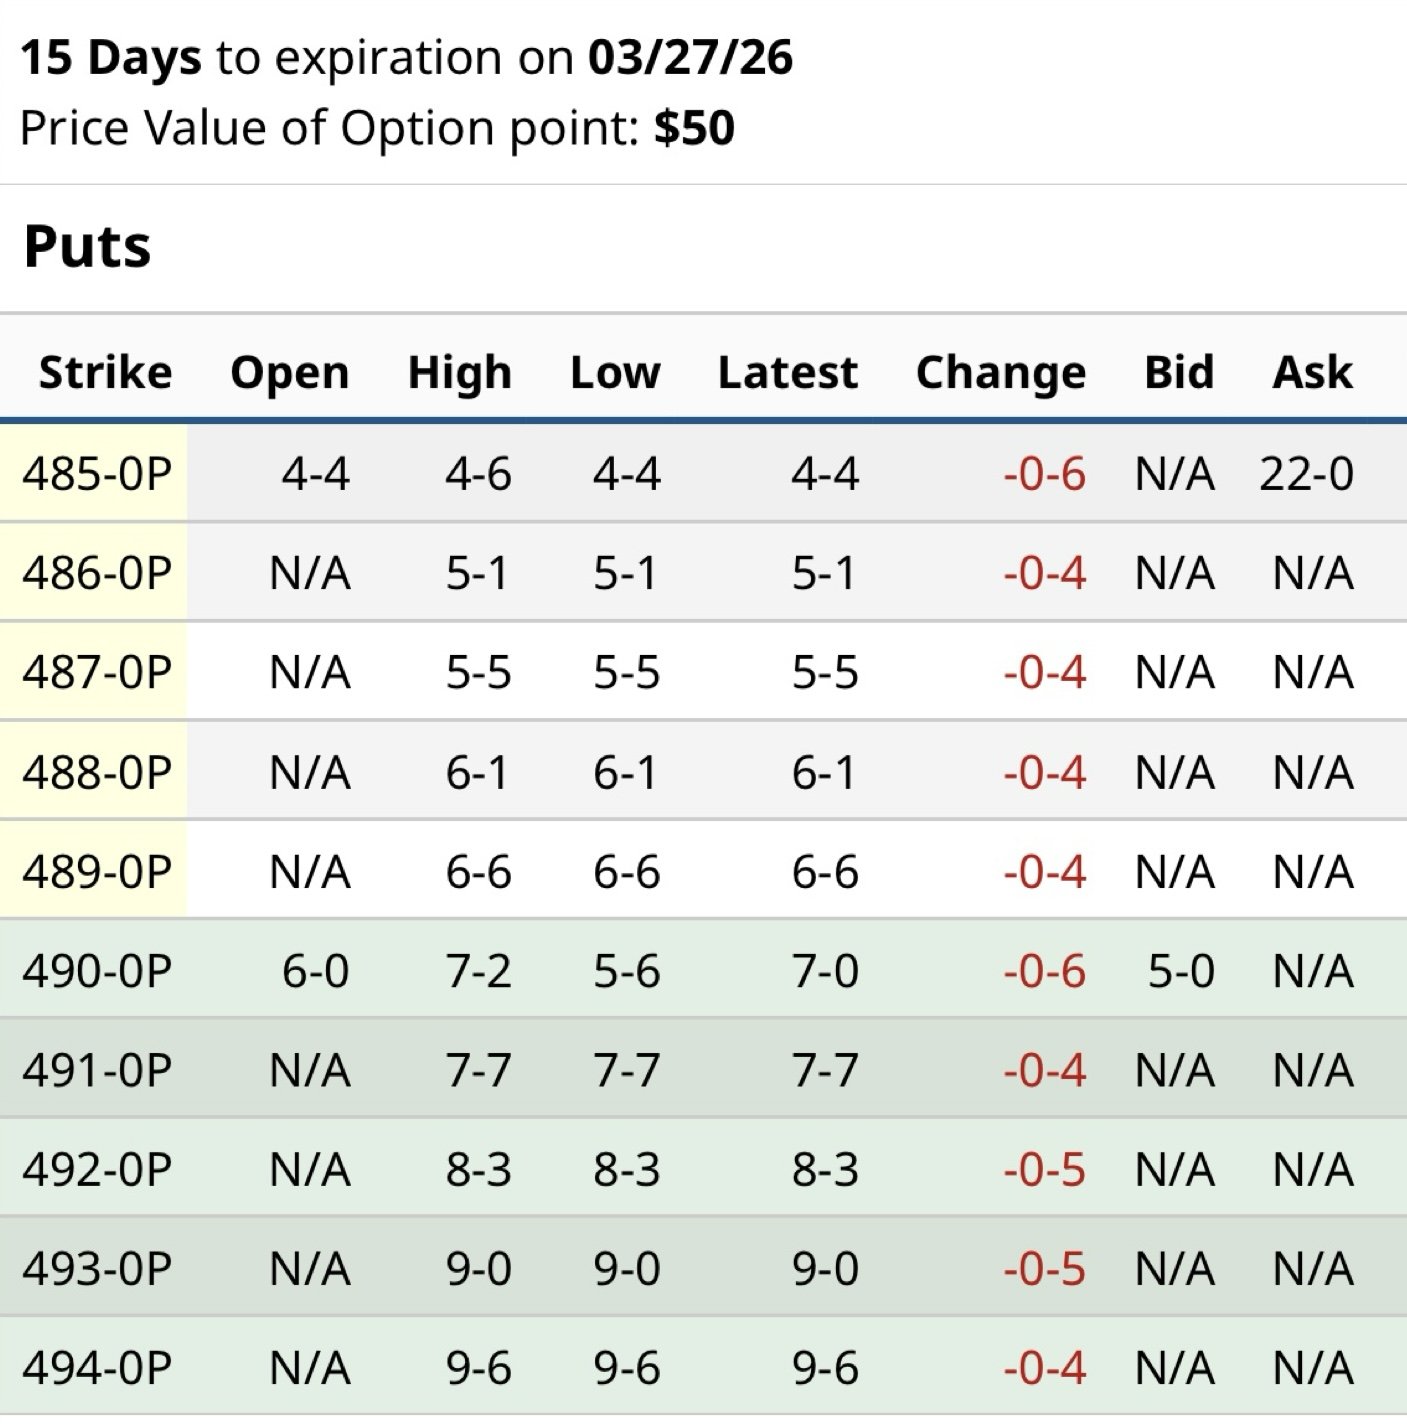
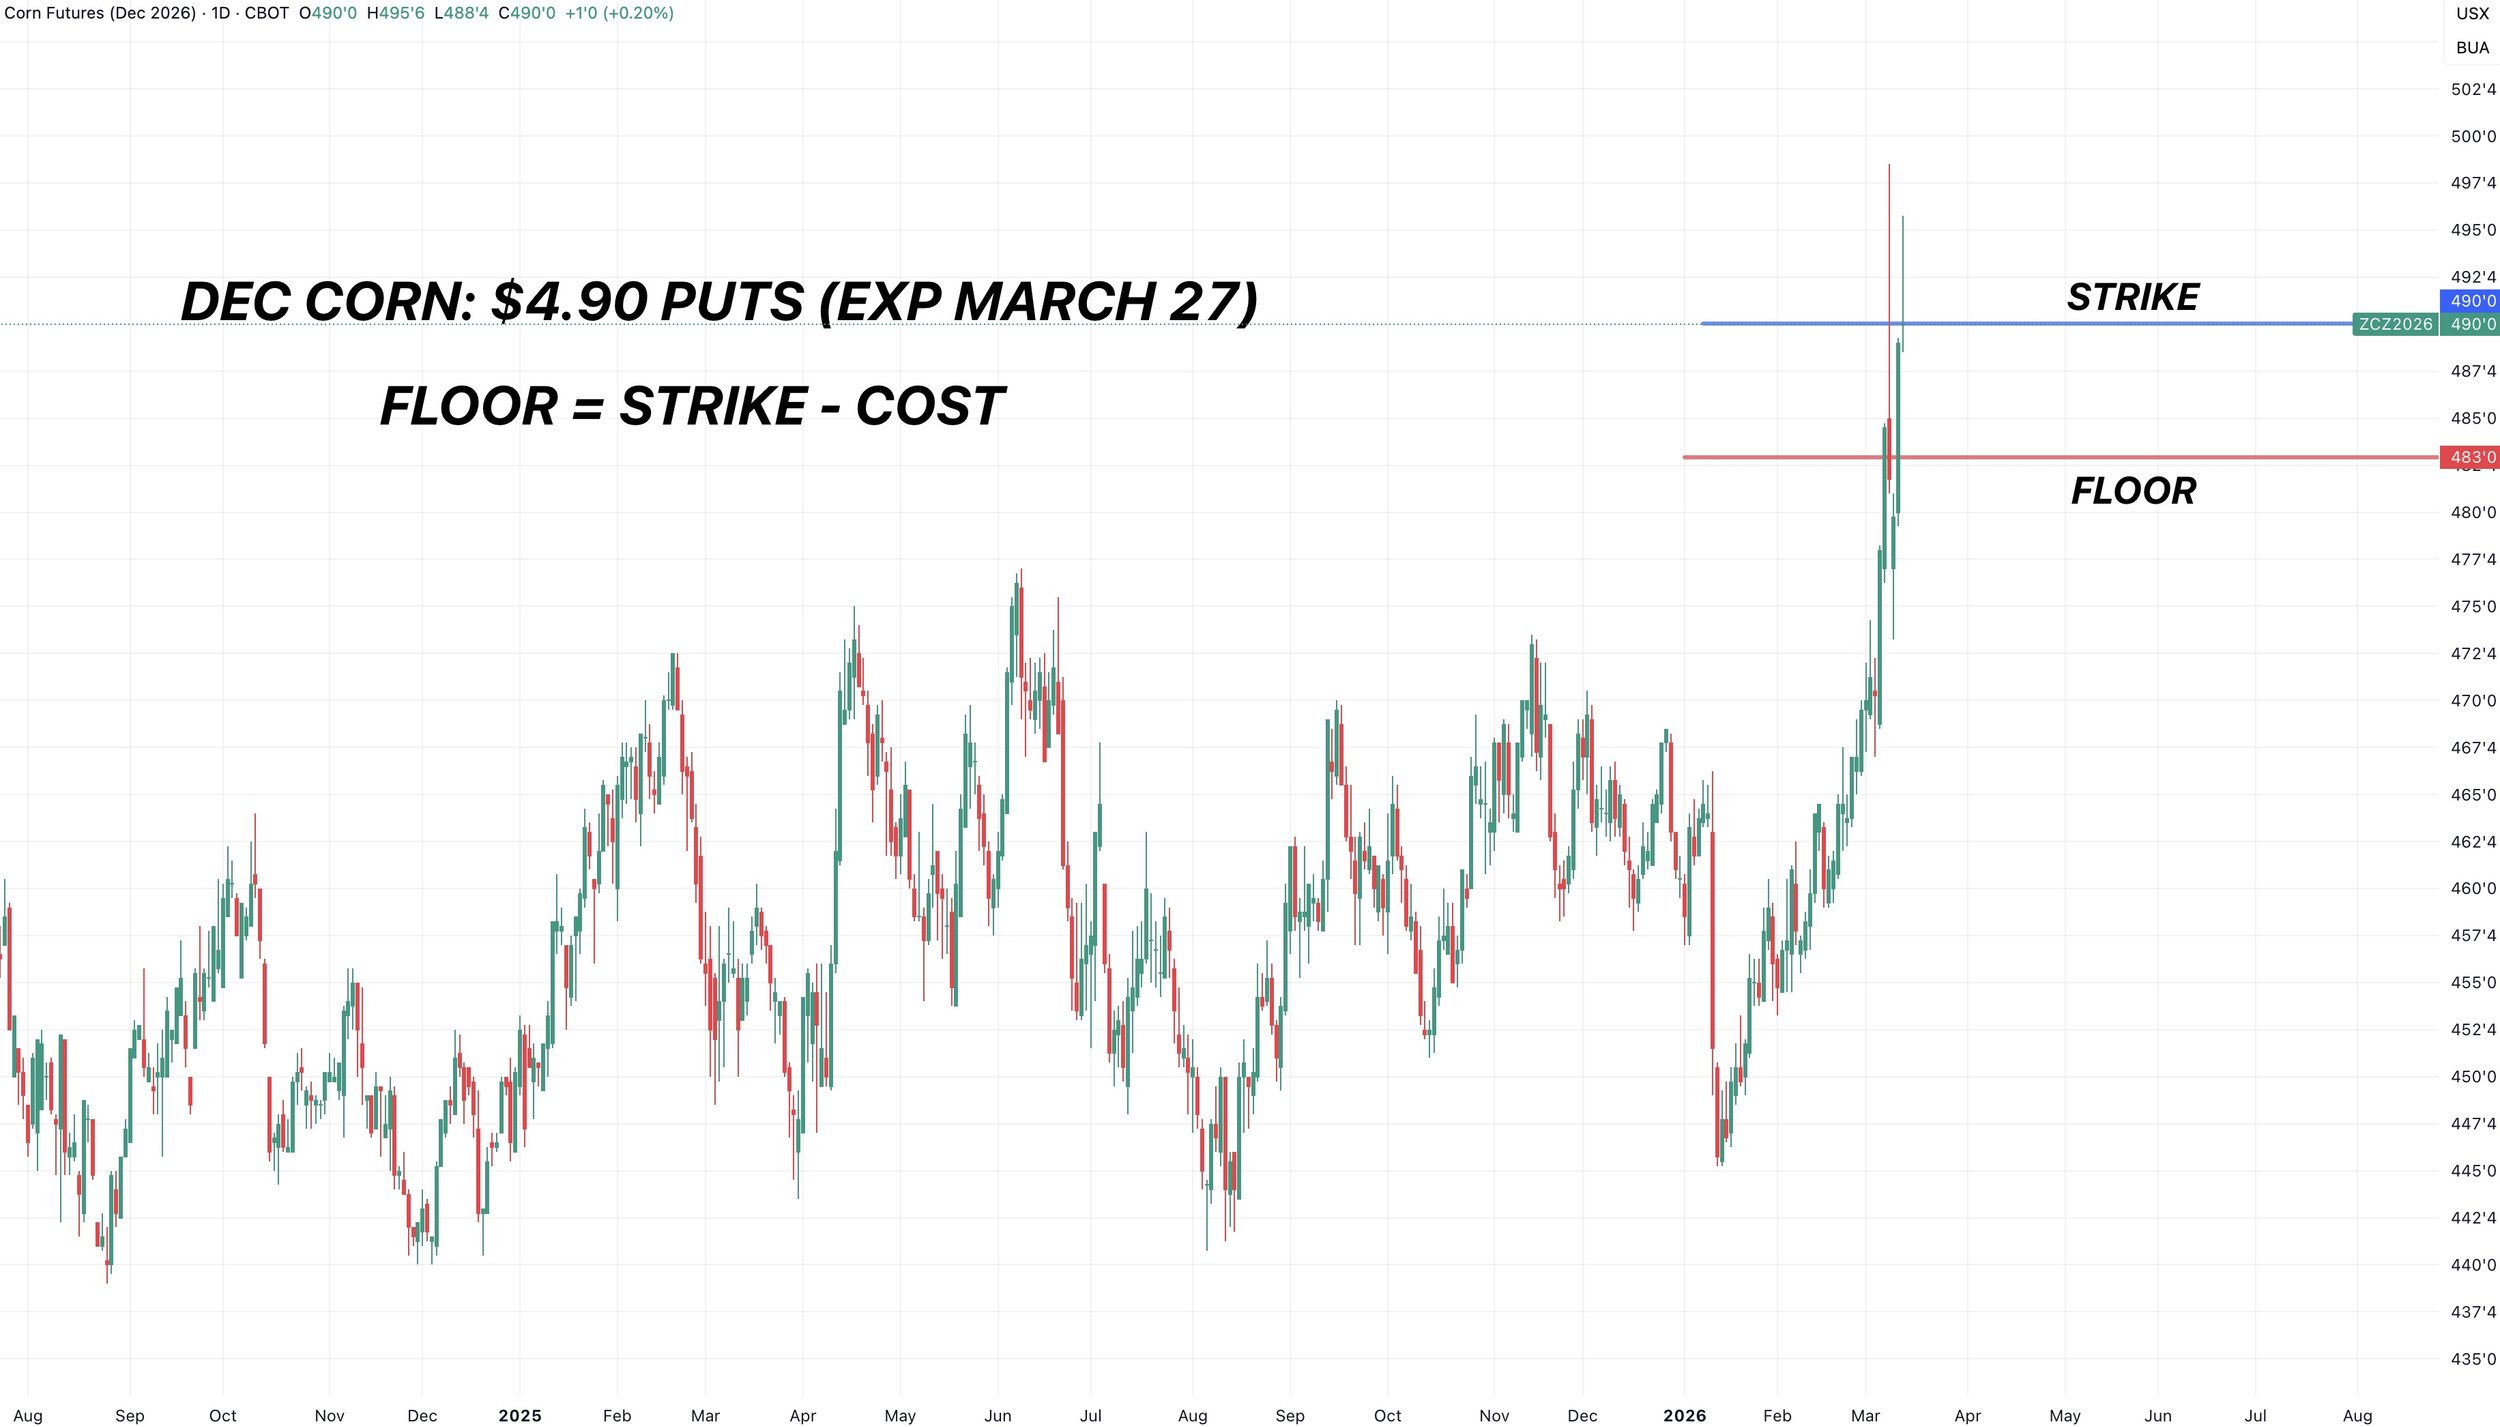
Here is an example:
You can get a $4.90 new crop put that expires at the end of March for around 7 cents.
This gives you a floor and worst case scenario of $4.83 until the end of the month.
The same concept applies to old crop.
Selling Calls:
Another thing we like doing is selling calls here for some of you.
Implied volatility has ramped up with the headlines.
Which means options are now more expensive than before.
When something is expensive, it often makes more sense to sell it than it does to buy it.
Vice versa, when options are cheap, it often makes more sense to buy them than it does to sell them.
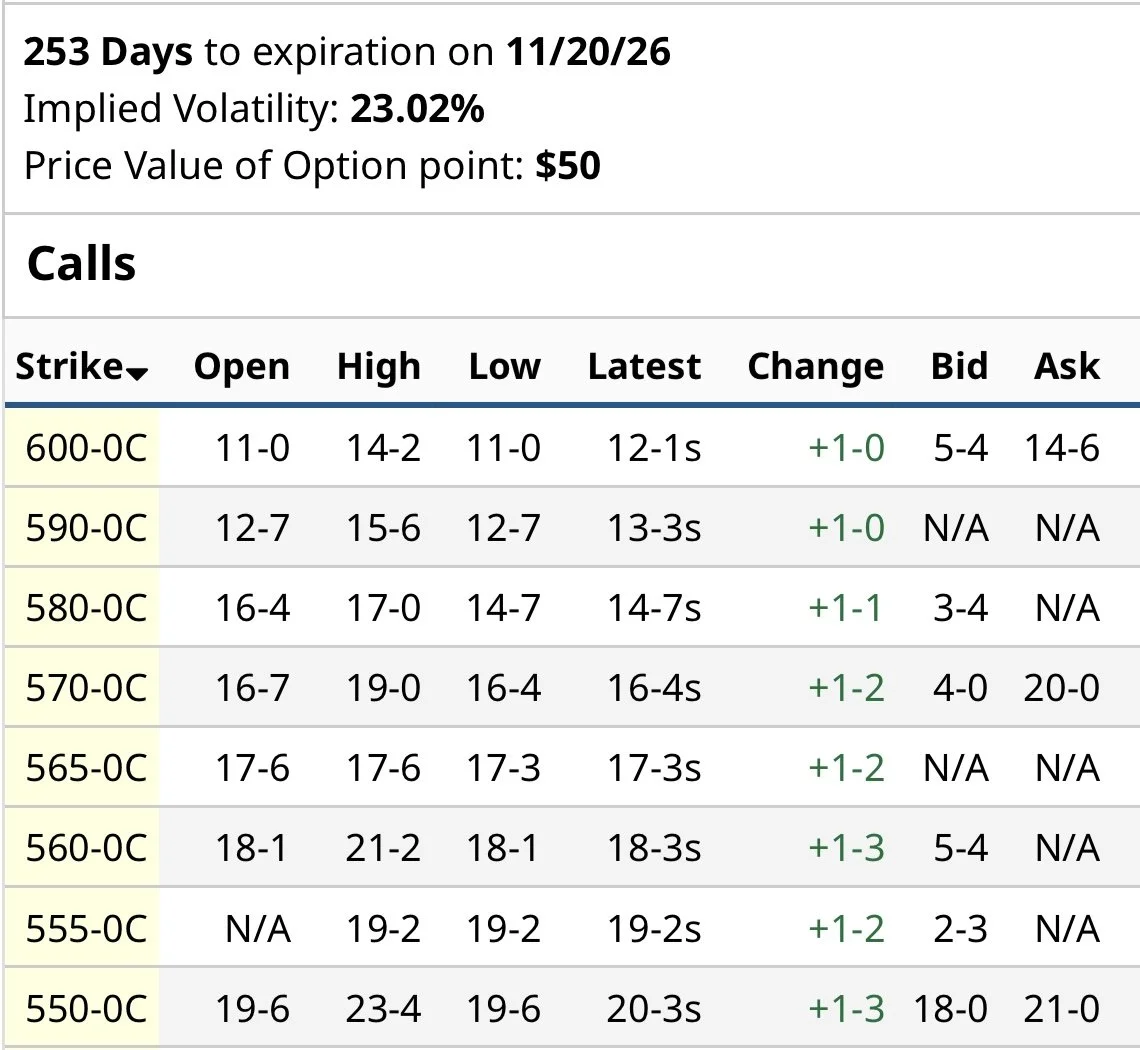
So for an example, you could sell a $6.00 new crop call that expires at the end of November and collect 12 cents.
Essentially, you get paid to have an offer out there.
If you have questions on any of this, feel free to reach out anytime. As not everyone should be doing this.
Office: (806)484-1214
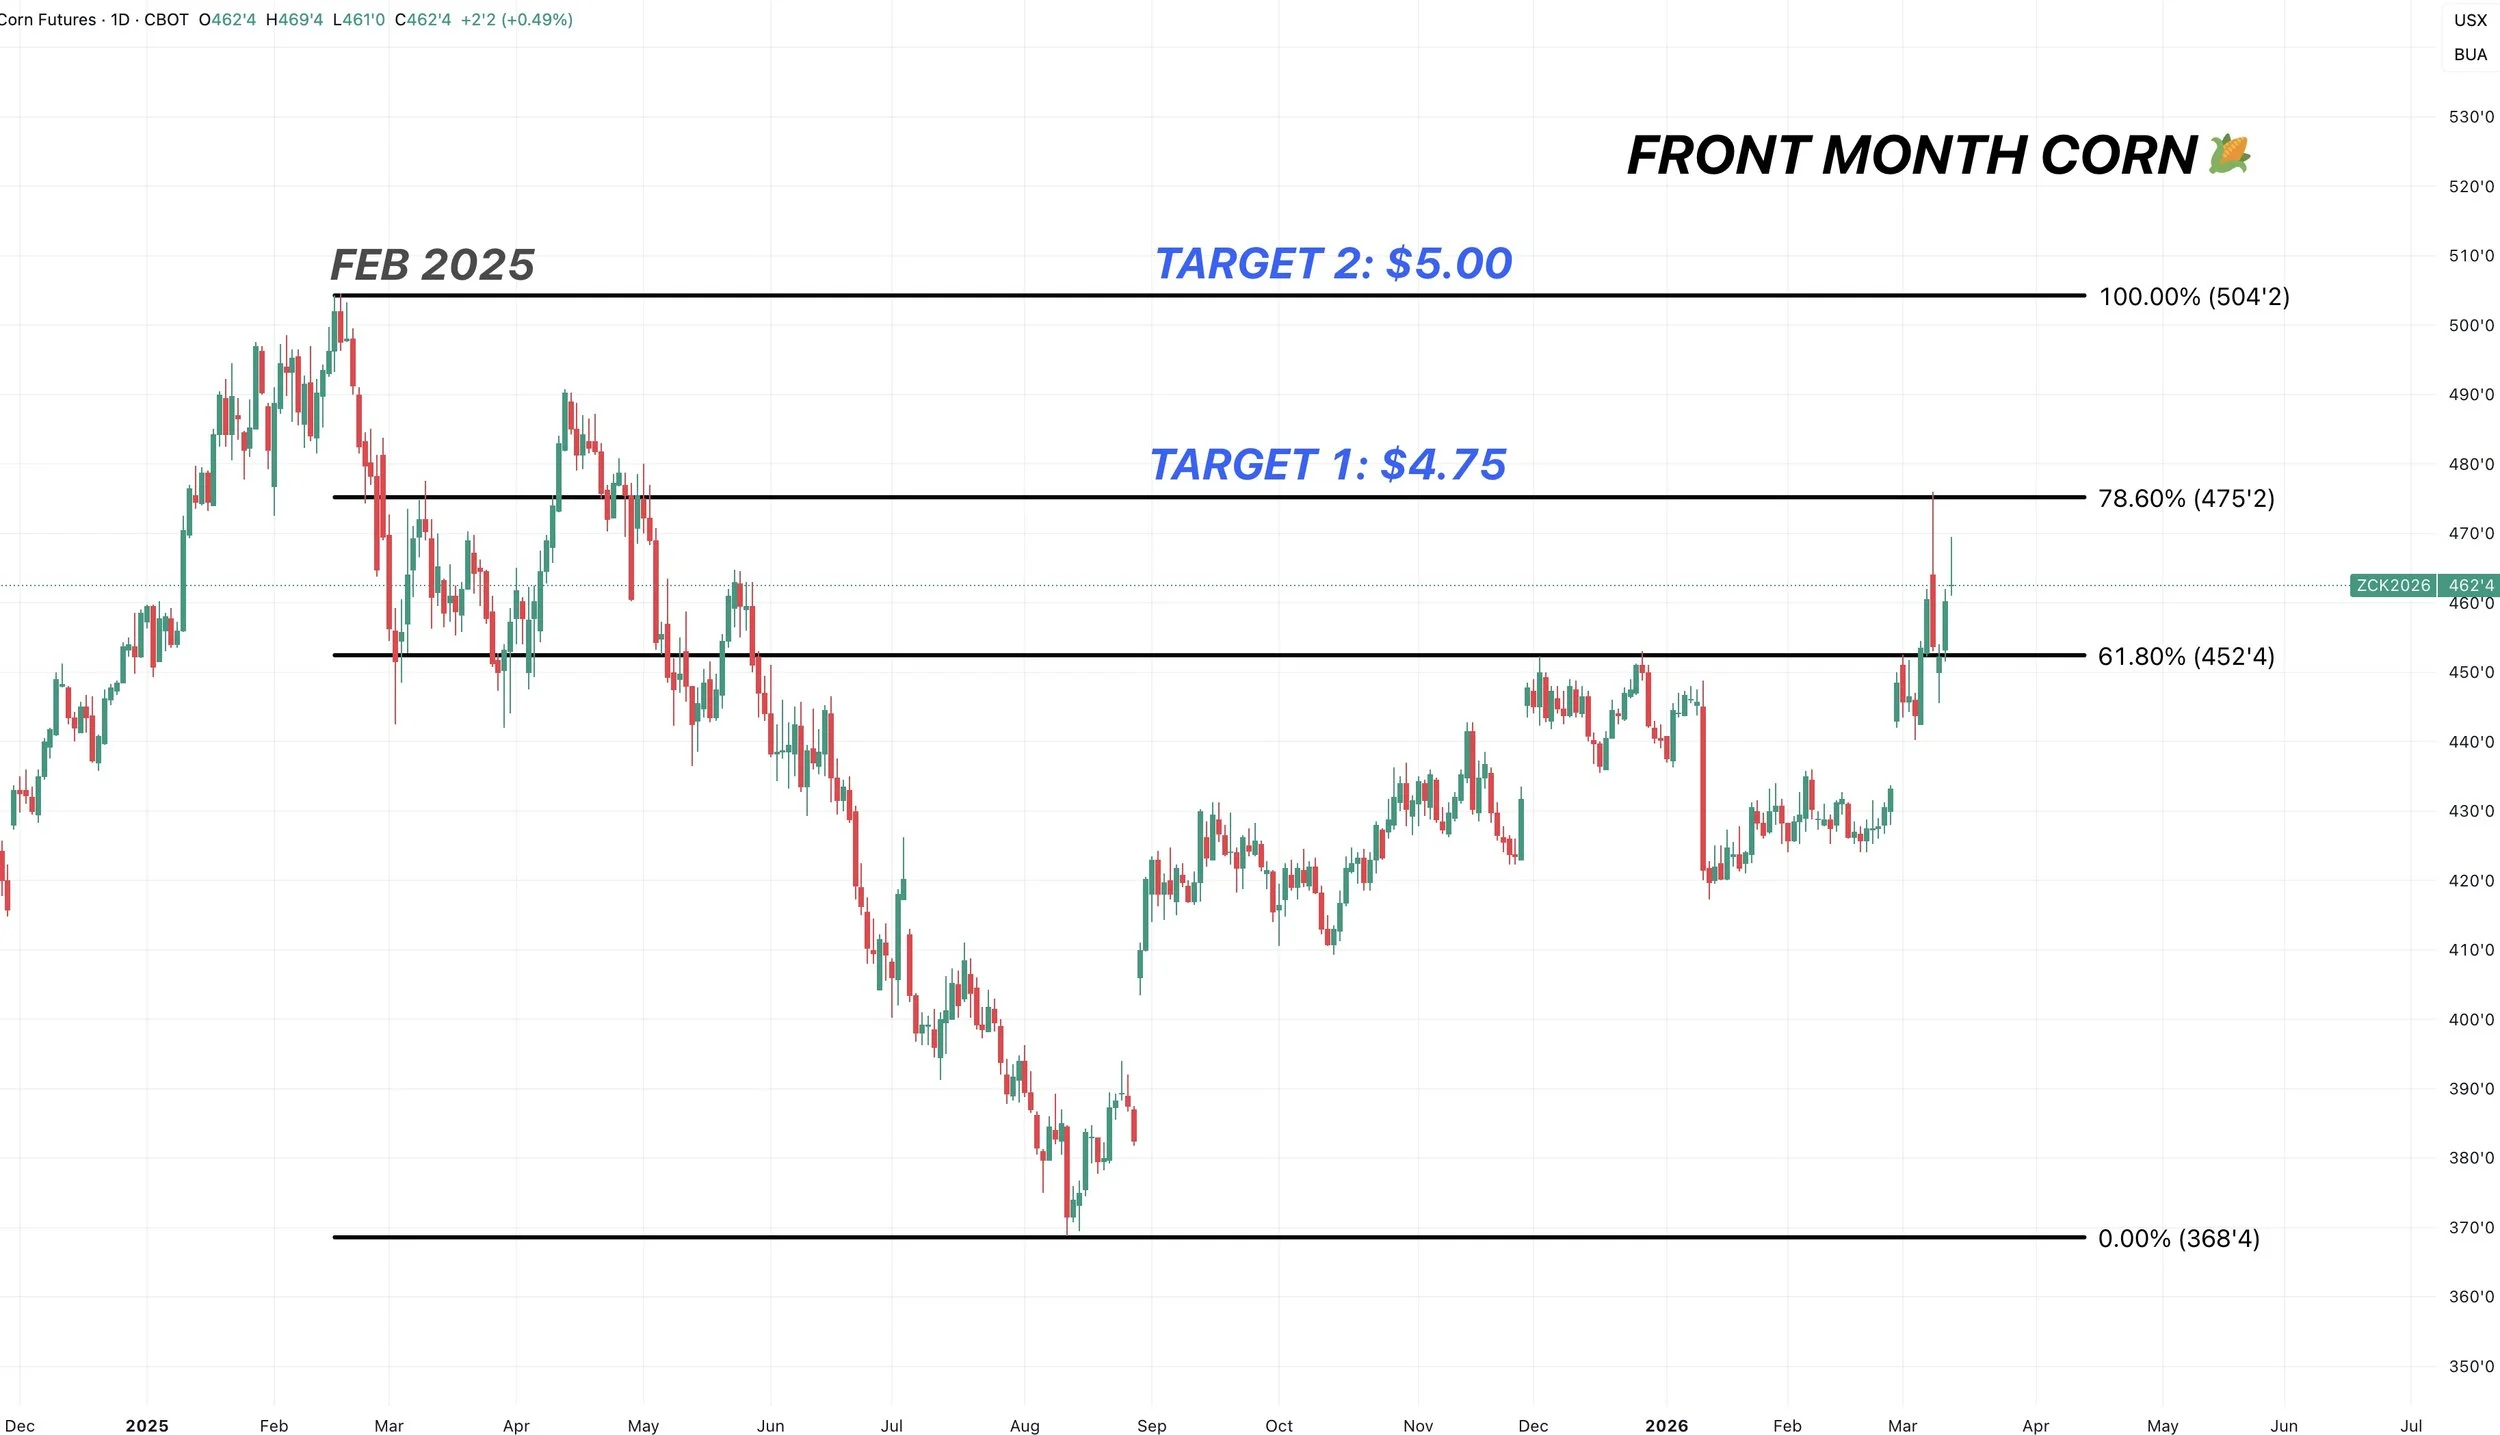
Front Month Corn (May):
Here is the front month chart.
Currently it shows May.
The next target is going to $4.75. Which is those highs from Sunday night.
That gives back 78.6% of the Feb 2025 highs.
When March was the front contract, it struggled at that 61.8% level. We've now broken above so $4.75 is the next target.
The target afterwards would be right around $5.00
Those are the next levels we want to de-risk at.
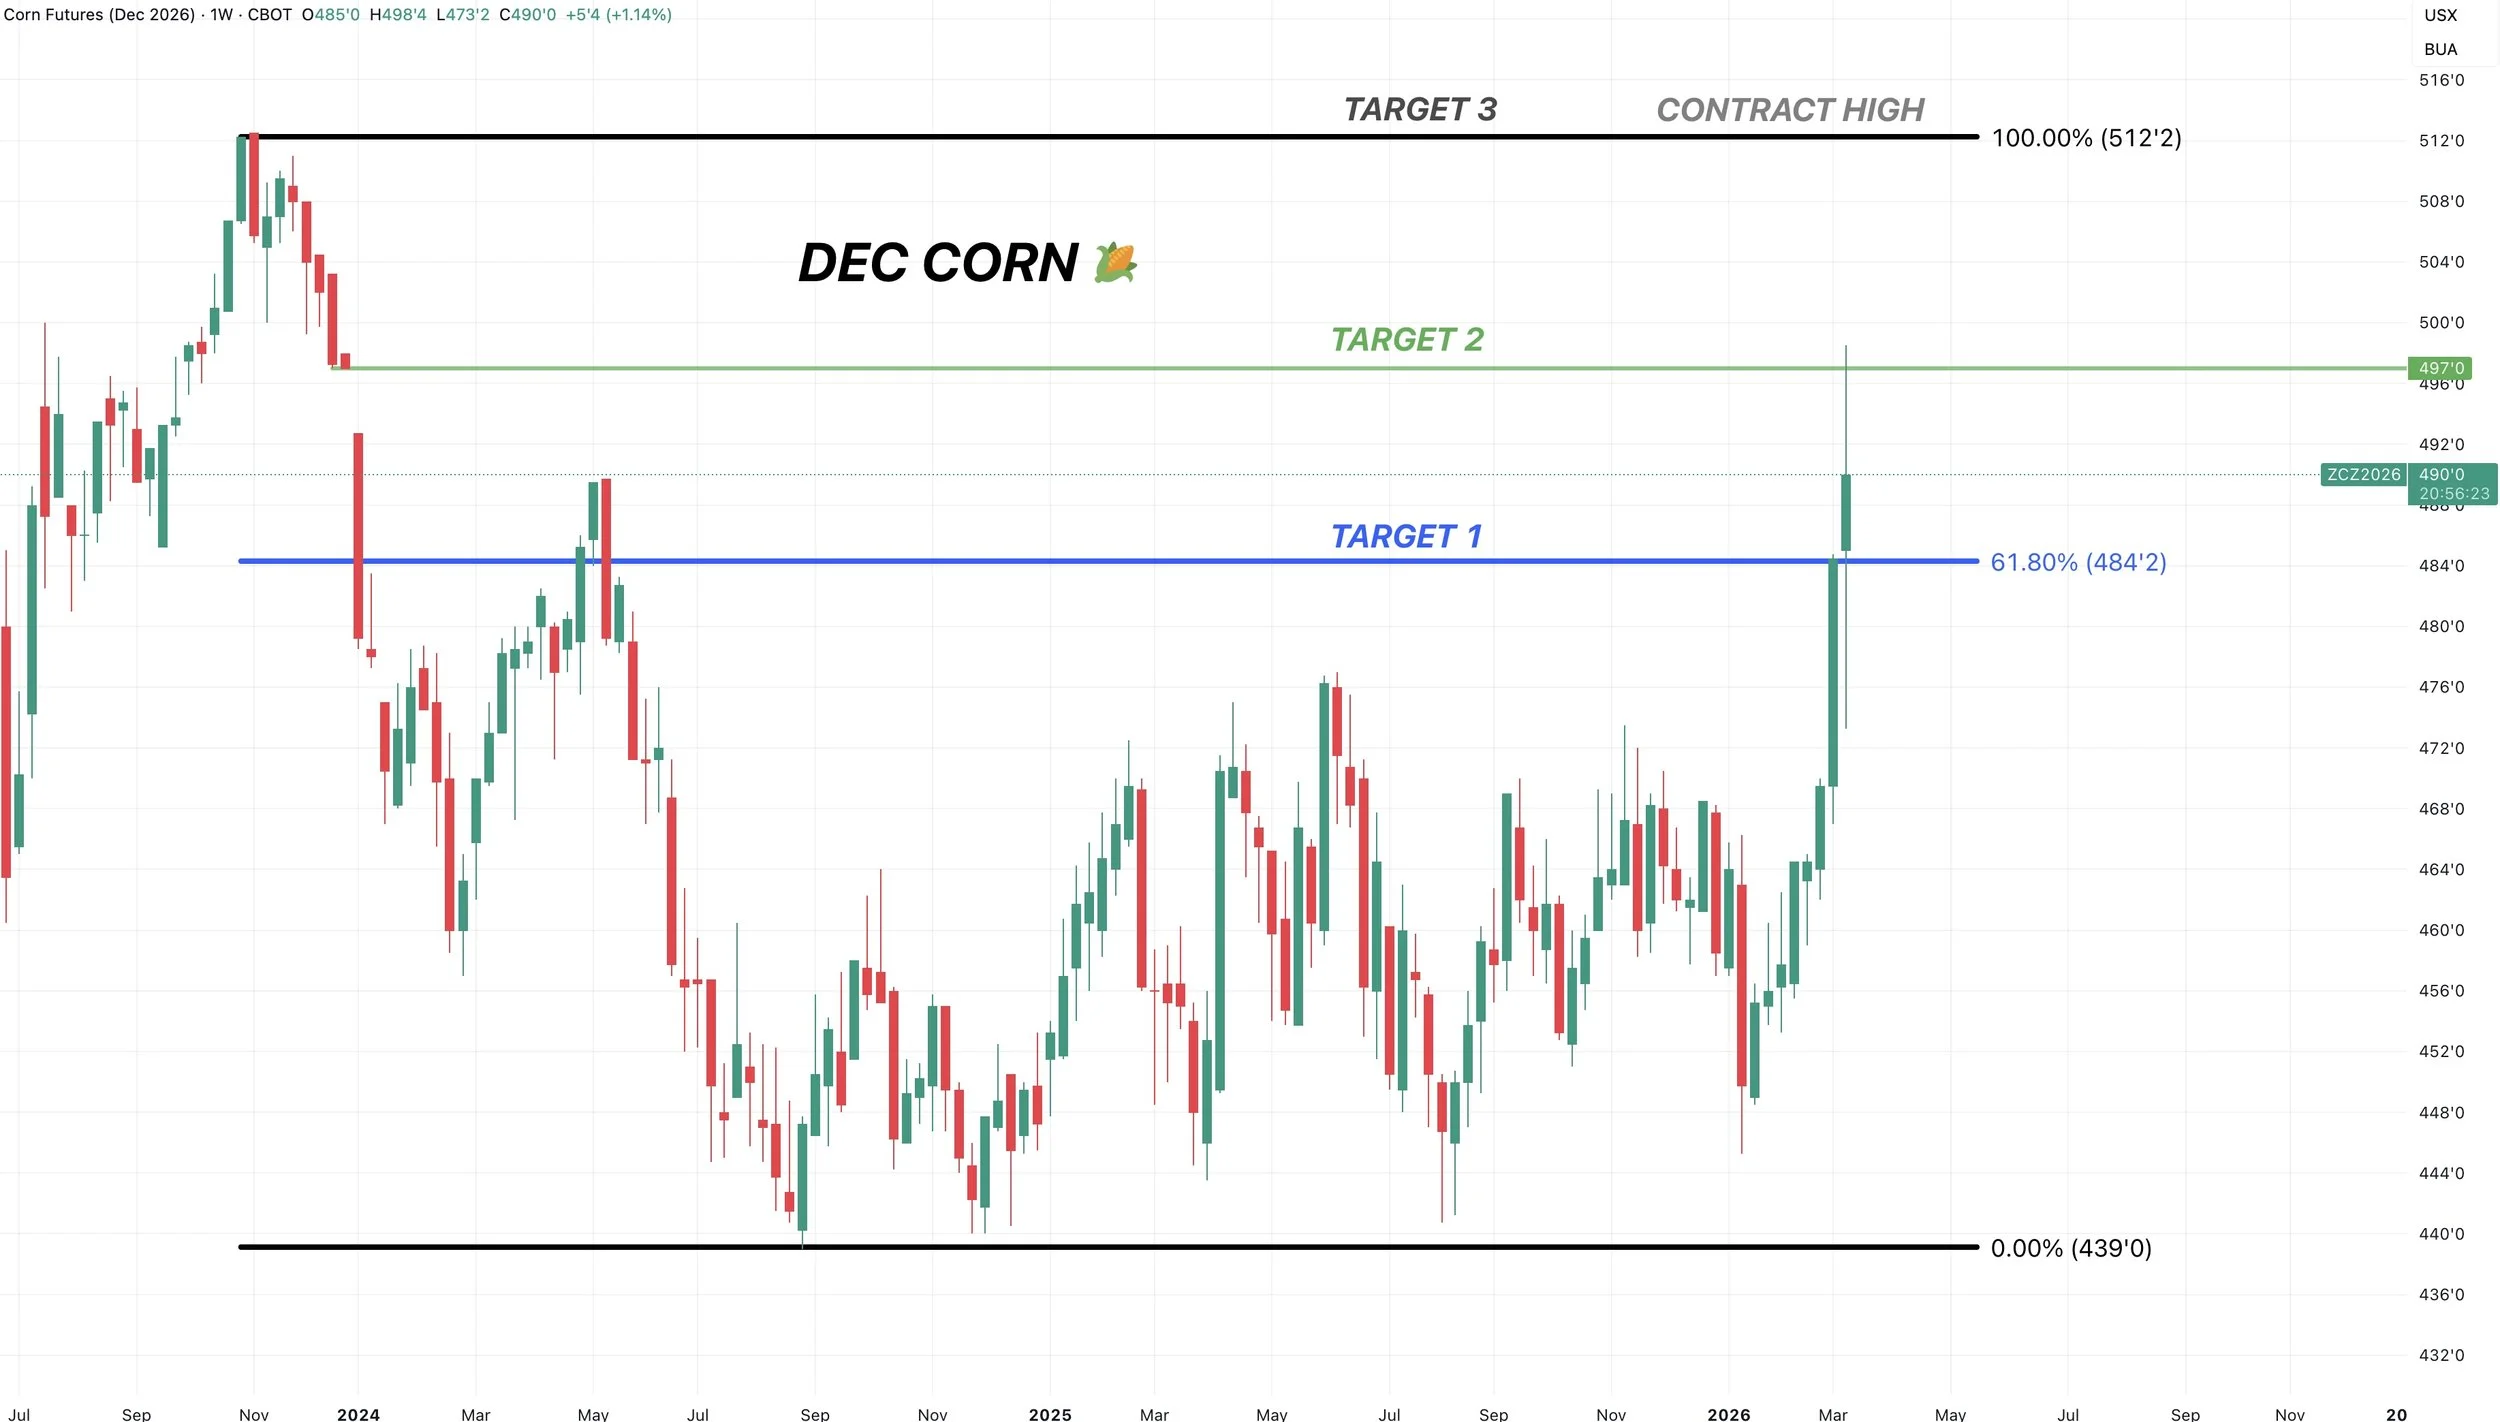
Dec Corn:
Target 1 and 2 both hit already.
Target 1 was $4.84 and 61.8% of the contract highs.
Target 2 was that big gap we had on the weekly chart at $4.97.
Target 3 is the contract highs at $5.12
If you did not take risk off when the targets hit, then we still like doing so if they hit again.
Soybeans
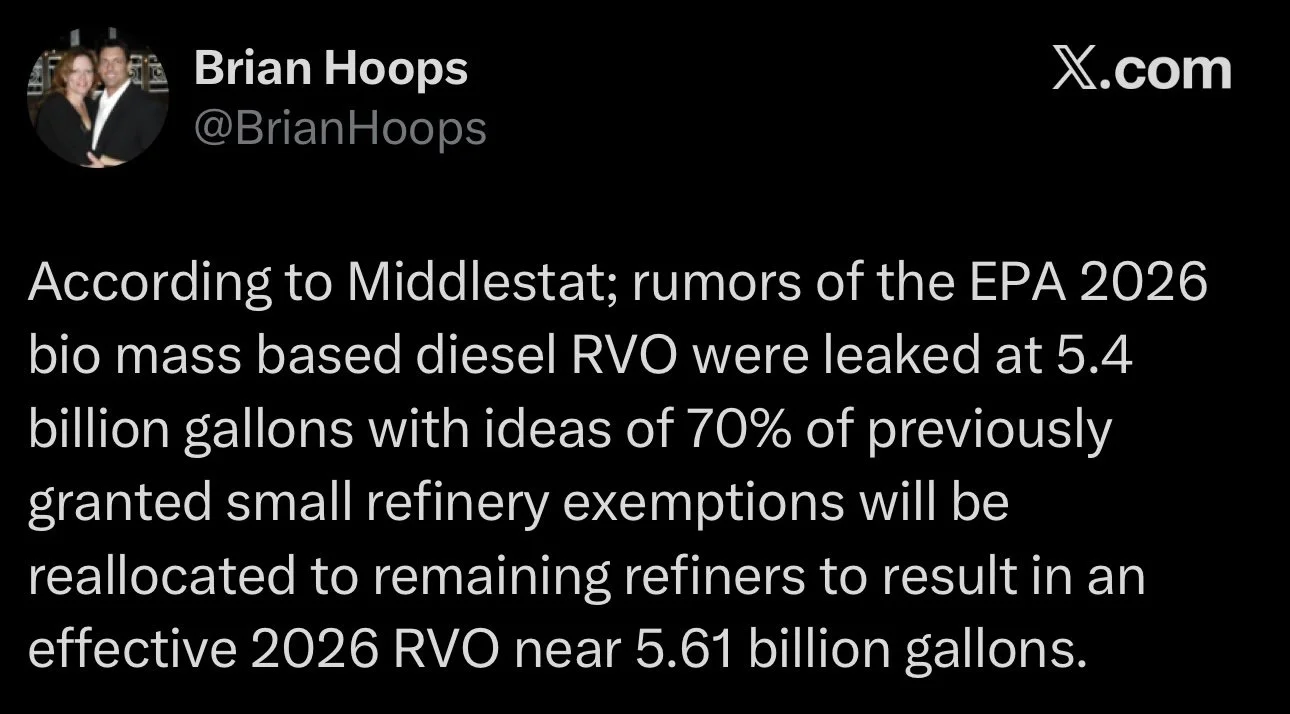
Yesterday, soybeans caught a bid from the RVO rumors.
The rumor was a reported leak of the EPA's RVO numbers for 2026.
The number was 5.4 billion gallons.
If true, that would be a friendly number.
One of the biggest things in the rumor is that there is chatter that 70% of the small refinery exemptions will get passed on to the larger refineries.
So what this means is that, for every 100 gallons a small refinery is exempted from, 70 of those gallons will legally be forced onto the big guys. Essentially, it guarantees the demand, rather than letting the small guys not chip in, and the industry just simply loses that demand.
However, the risk here is that it's a buy the rumor sell the fact type of event.
Where we rally on these rumors, only to sell off after it's actually announced. Or if the numbers aren’t as bullish as the rumors say they could be.
The real numbers are expected to be released before the end of the month.
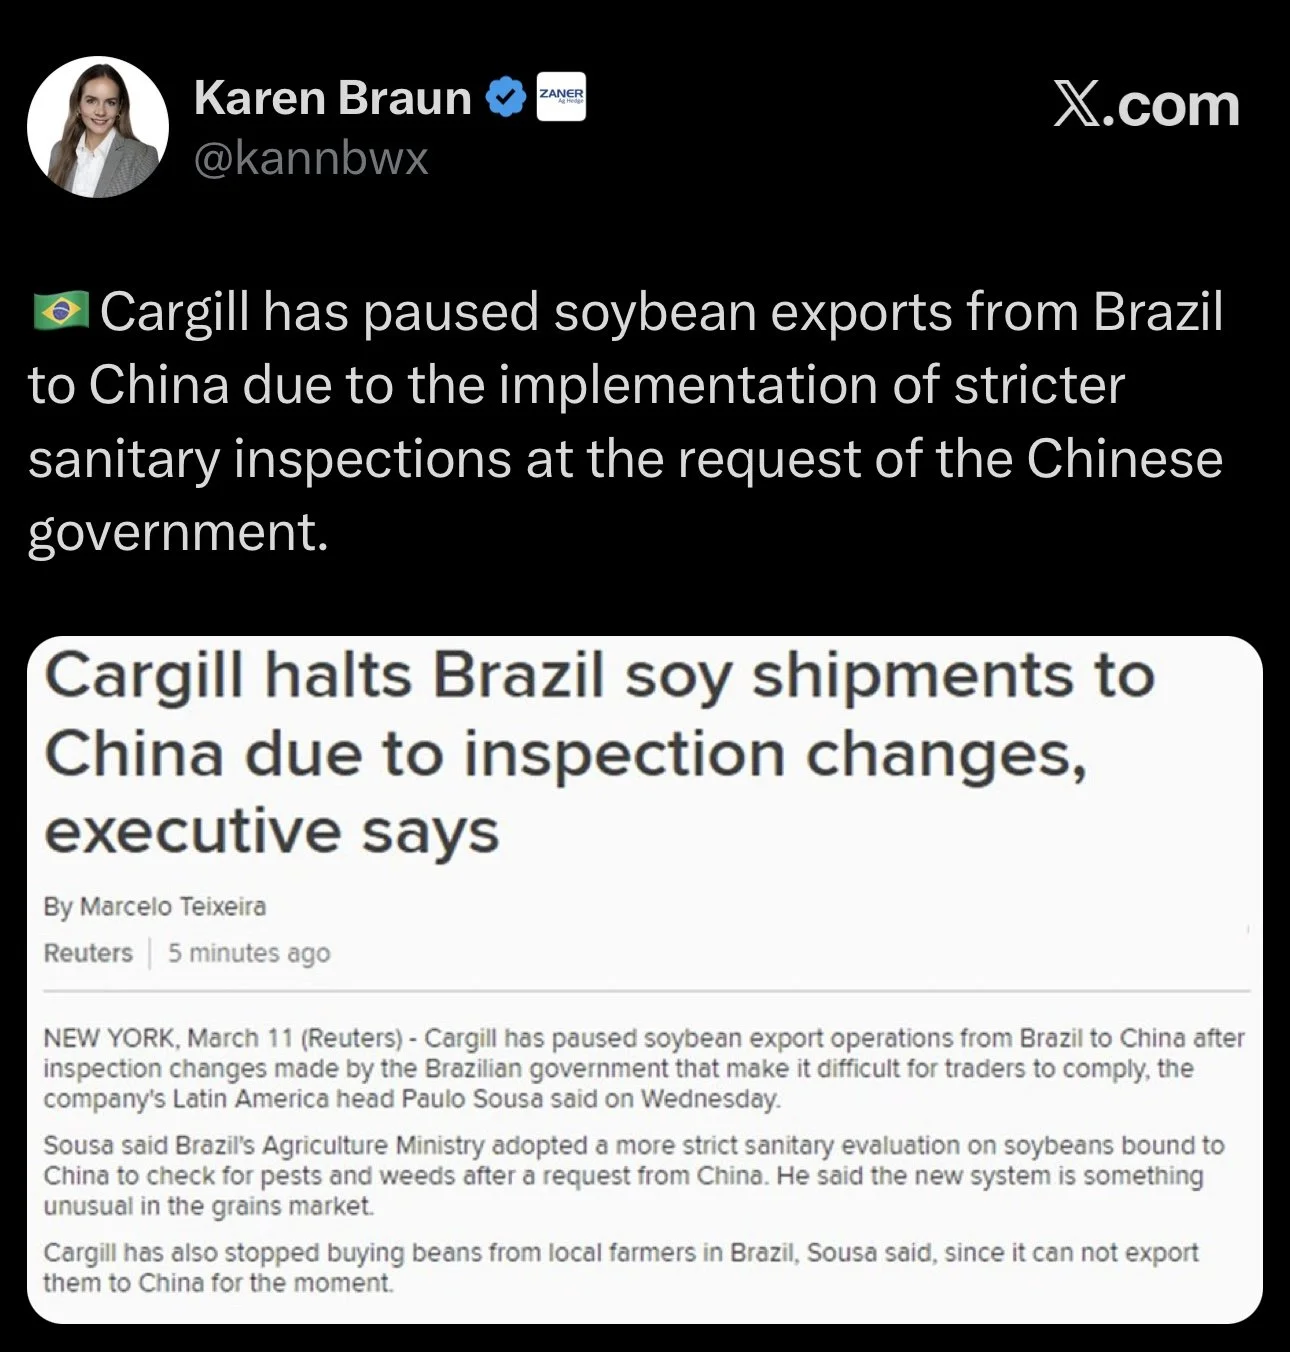
We also had news out that Cargill has halted their soybeans exports from Brazil to China due to sanitary inspections.
So this was a friendly headline.
As if Brazil's shipments get halted, China might have to shift to next source which would be the US.
If you feel like you missed the move on Sunday, we are back up near those highs.
This isn’t a rally we want to totally ignore.
So if you haven’t rewarded or protected this rally to $12.00 at all, we like doing so in some sort of fashion. With some protection or just rewarding it incrementally as we go.
I mean new crop soybeans are over $1.00 off their lows.
Rewarding a rally doesn’t make you bearish. It's just smart to defend the highest prices we've seen in 2 years. We can go higher, but don’t forget what this market looked like a few months ago.
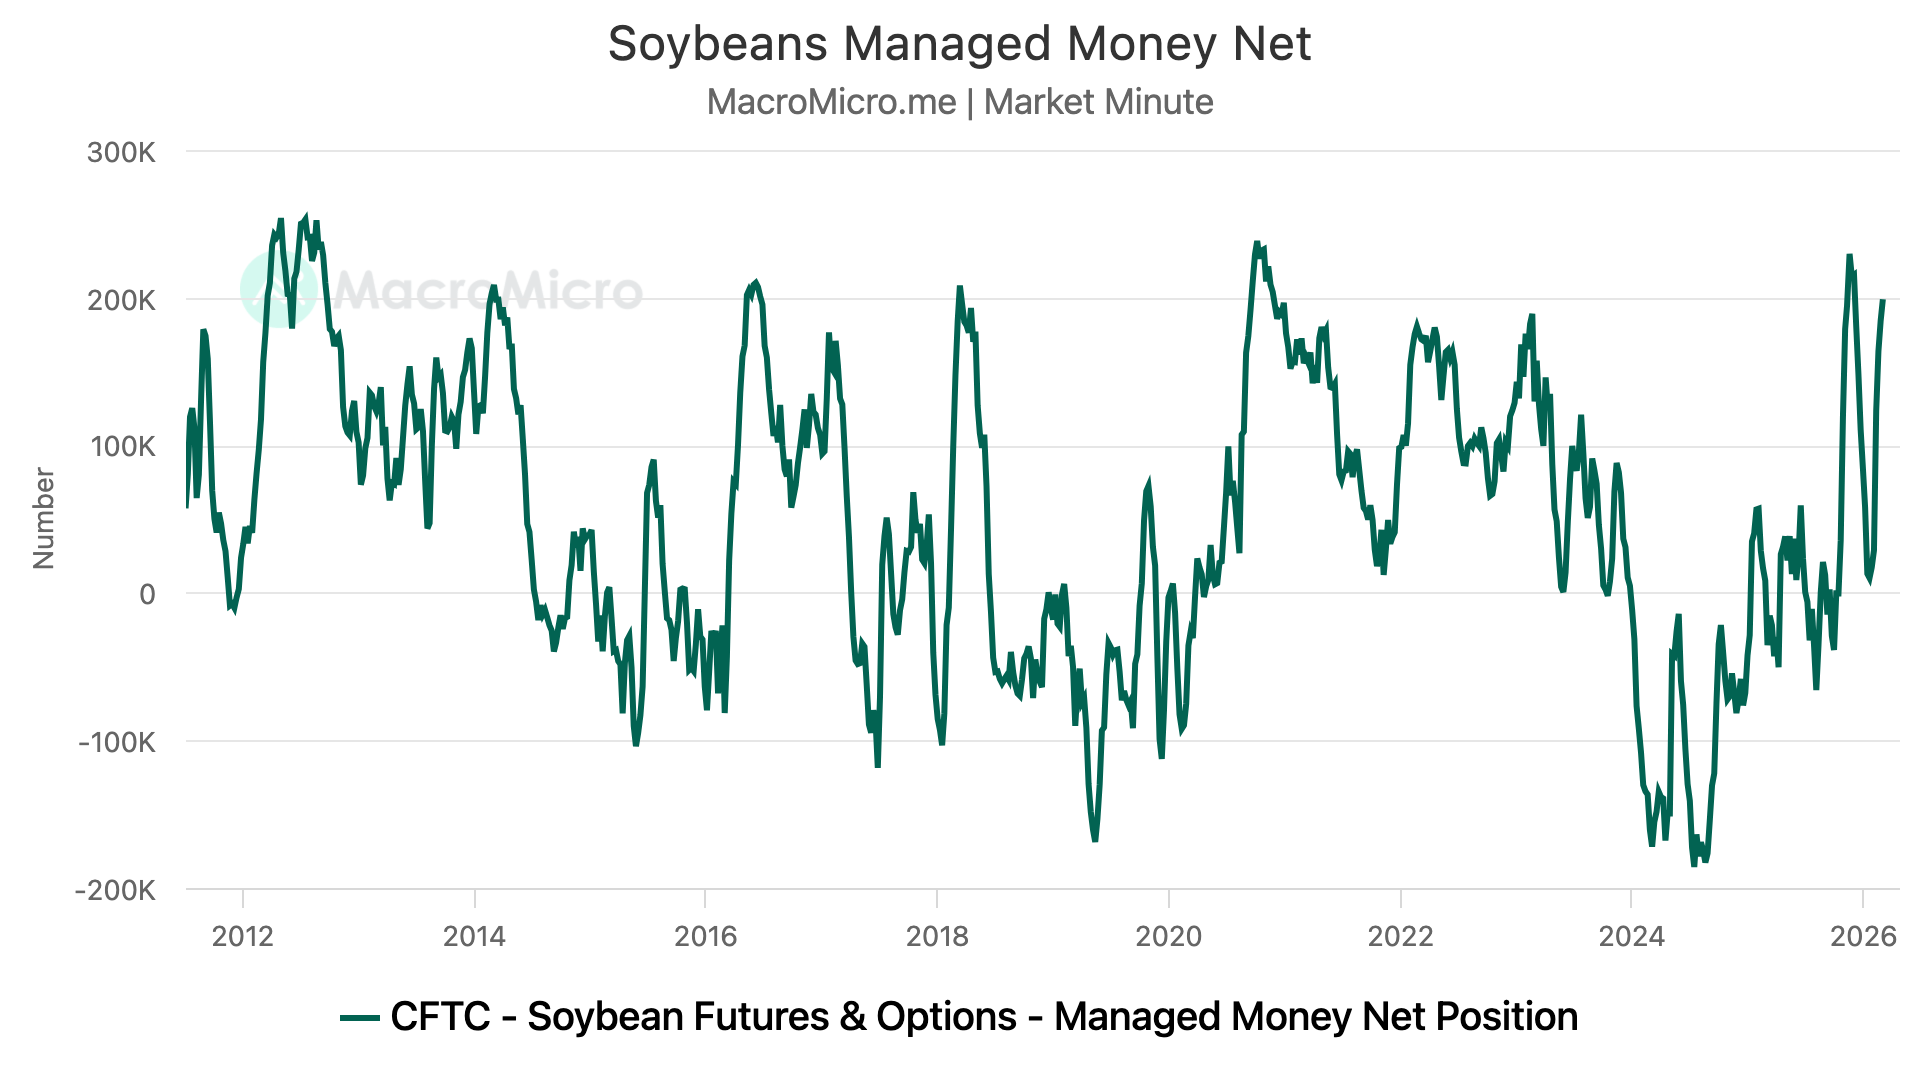
The funds are back near record long and continue to push this thing higher, but at a certain point if things turn and they decide to sell, there is a lot to unwind.
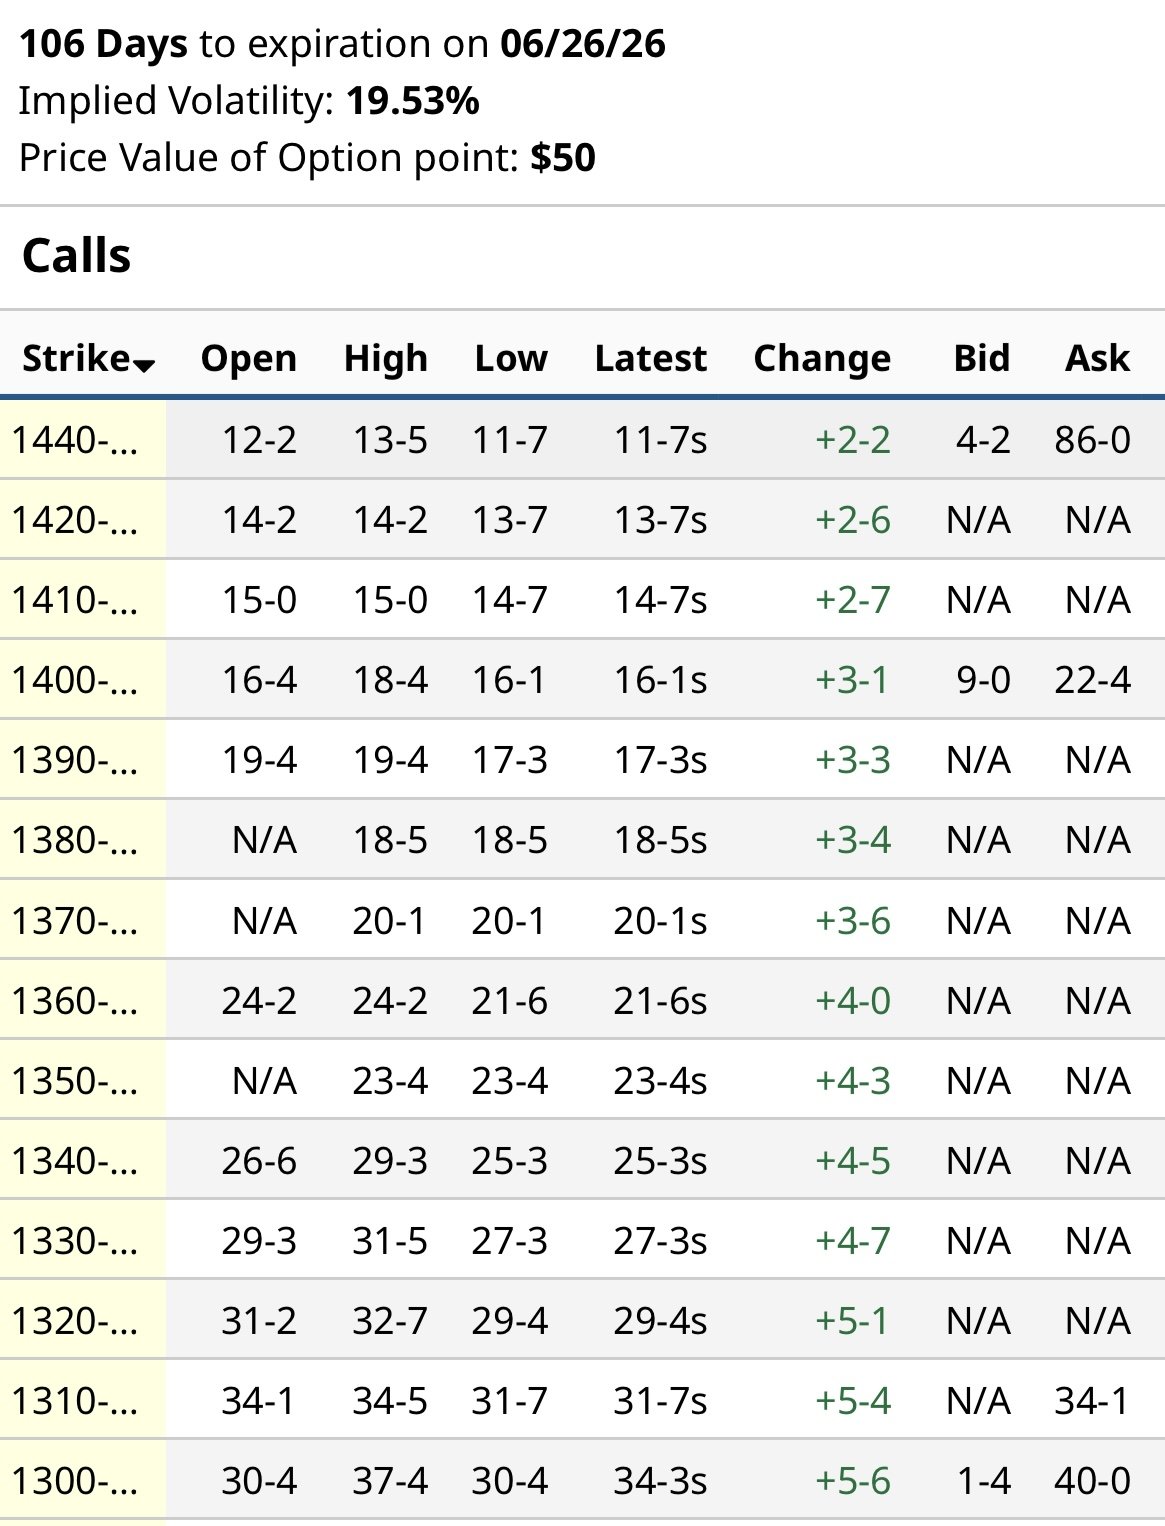
Selling Calls:
One strategy we do like doing here is selling calls.
Like we talked about in corn, options have gotten expensive. So you can use that to your advantage.
For example:
You could sell calls that expire in July.
$13 calls would collect 35 cents.
$14 calls would collect 16 cents.
Again, this might not be for everyone. So reach out if you have questions.
Office: (806)484-1214
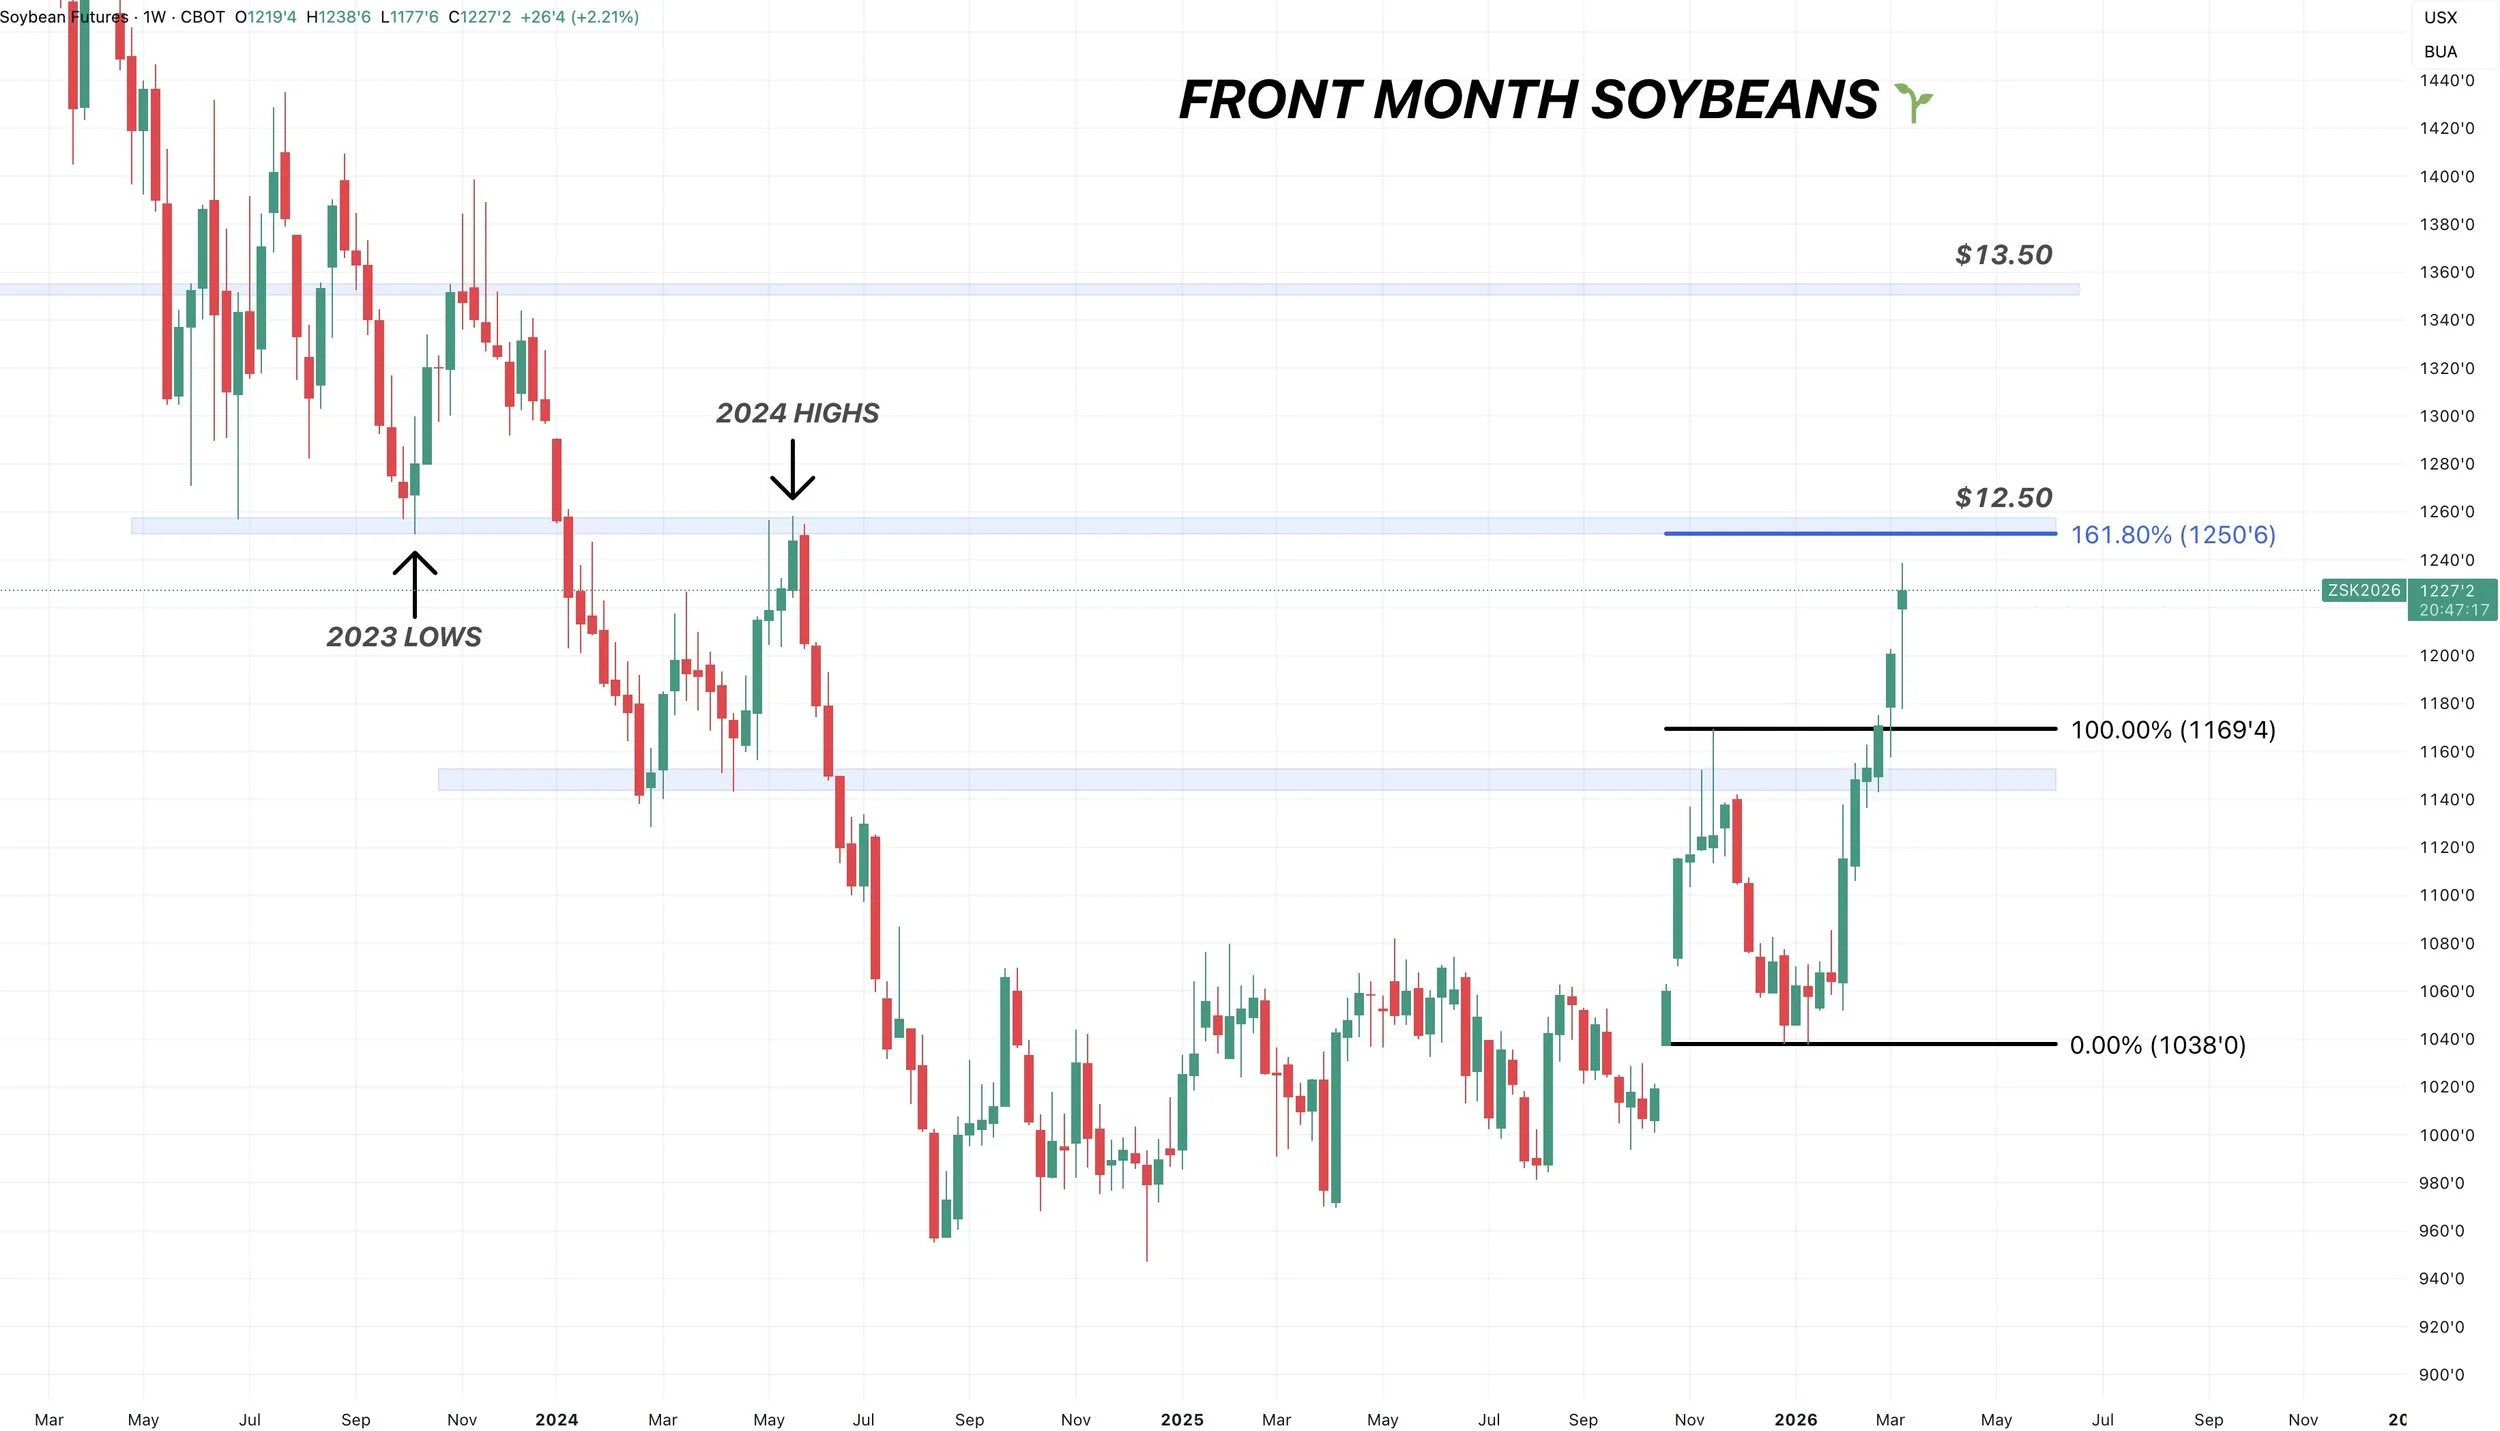
Front Month Beans:
We are getting close to that big target.
$12.50
That is where I want to de-risk even further if we get there.
That is the lows from 2023. It is the highs from 2024.
If you take the recent lows up to the November highs, 161.8% of that move comes in at $12.50 as well. Known as the golden fib extension.
I also want to de-risk in new crop as we get closer to this target on old crop.
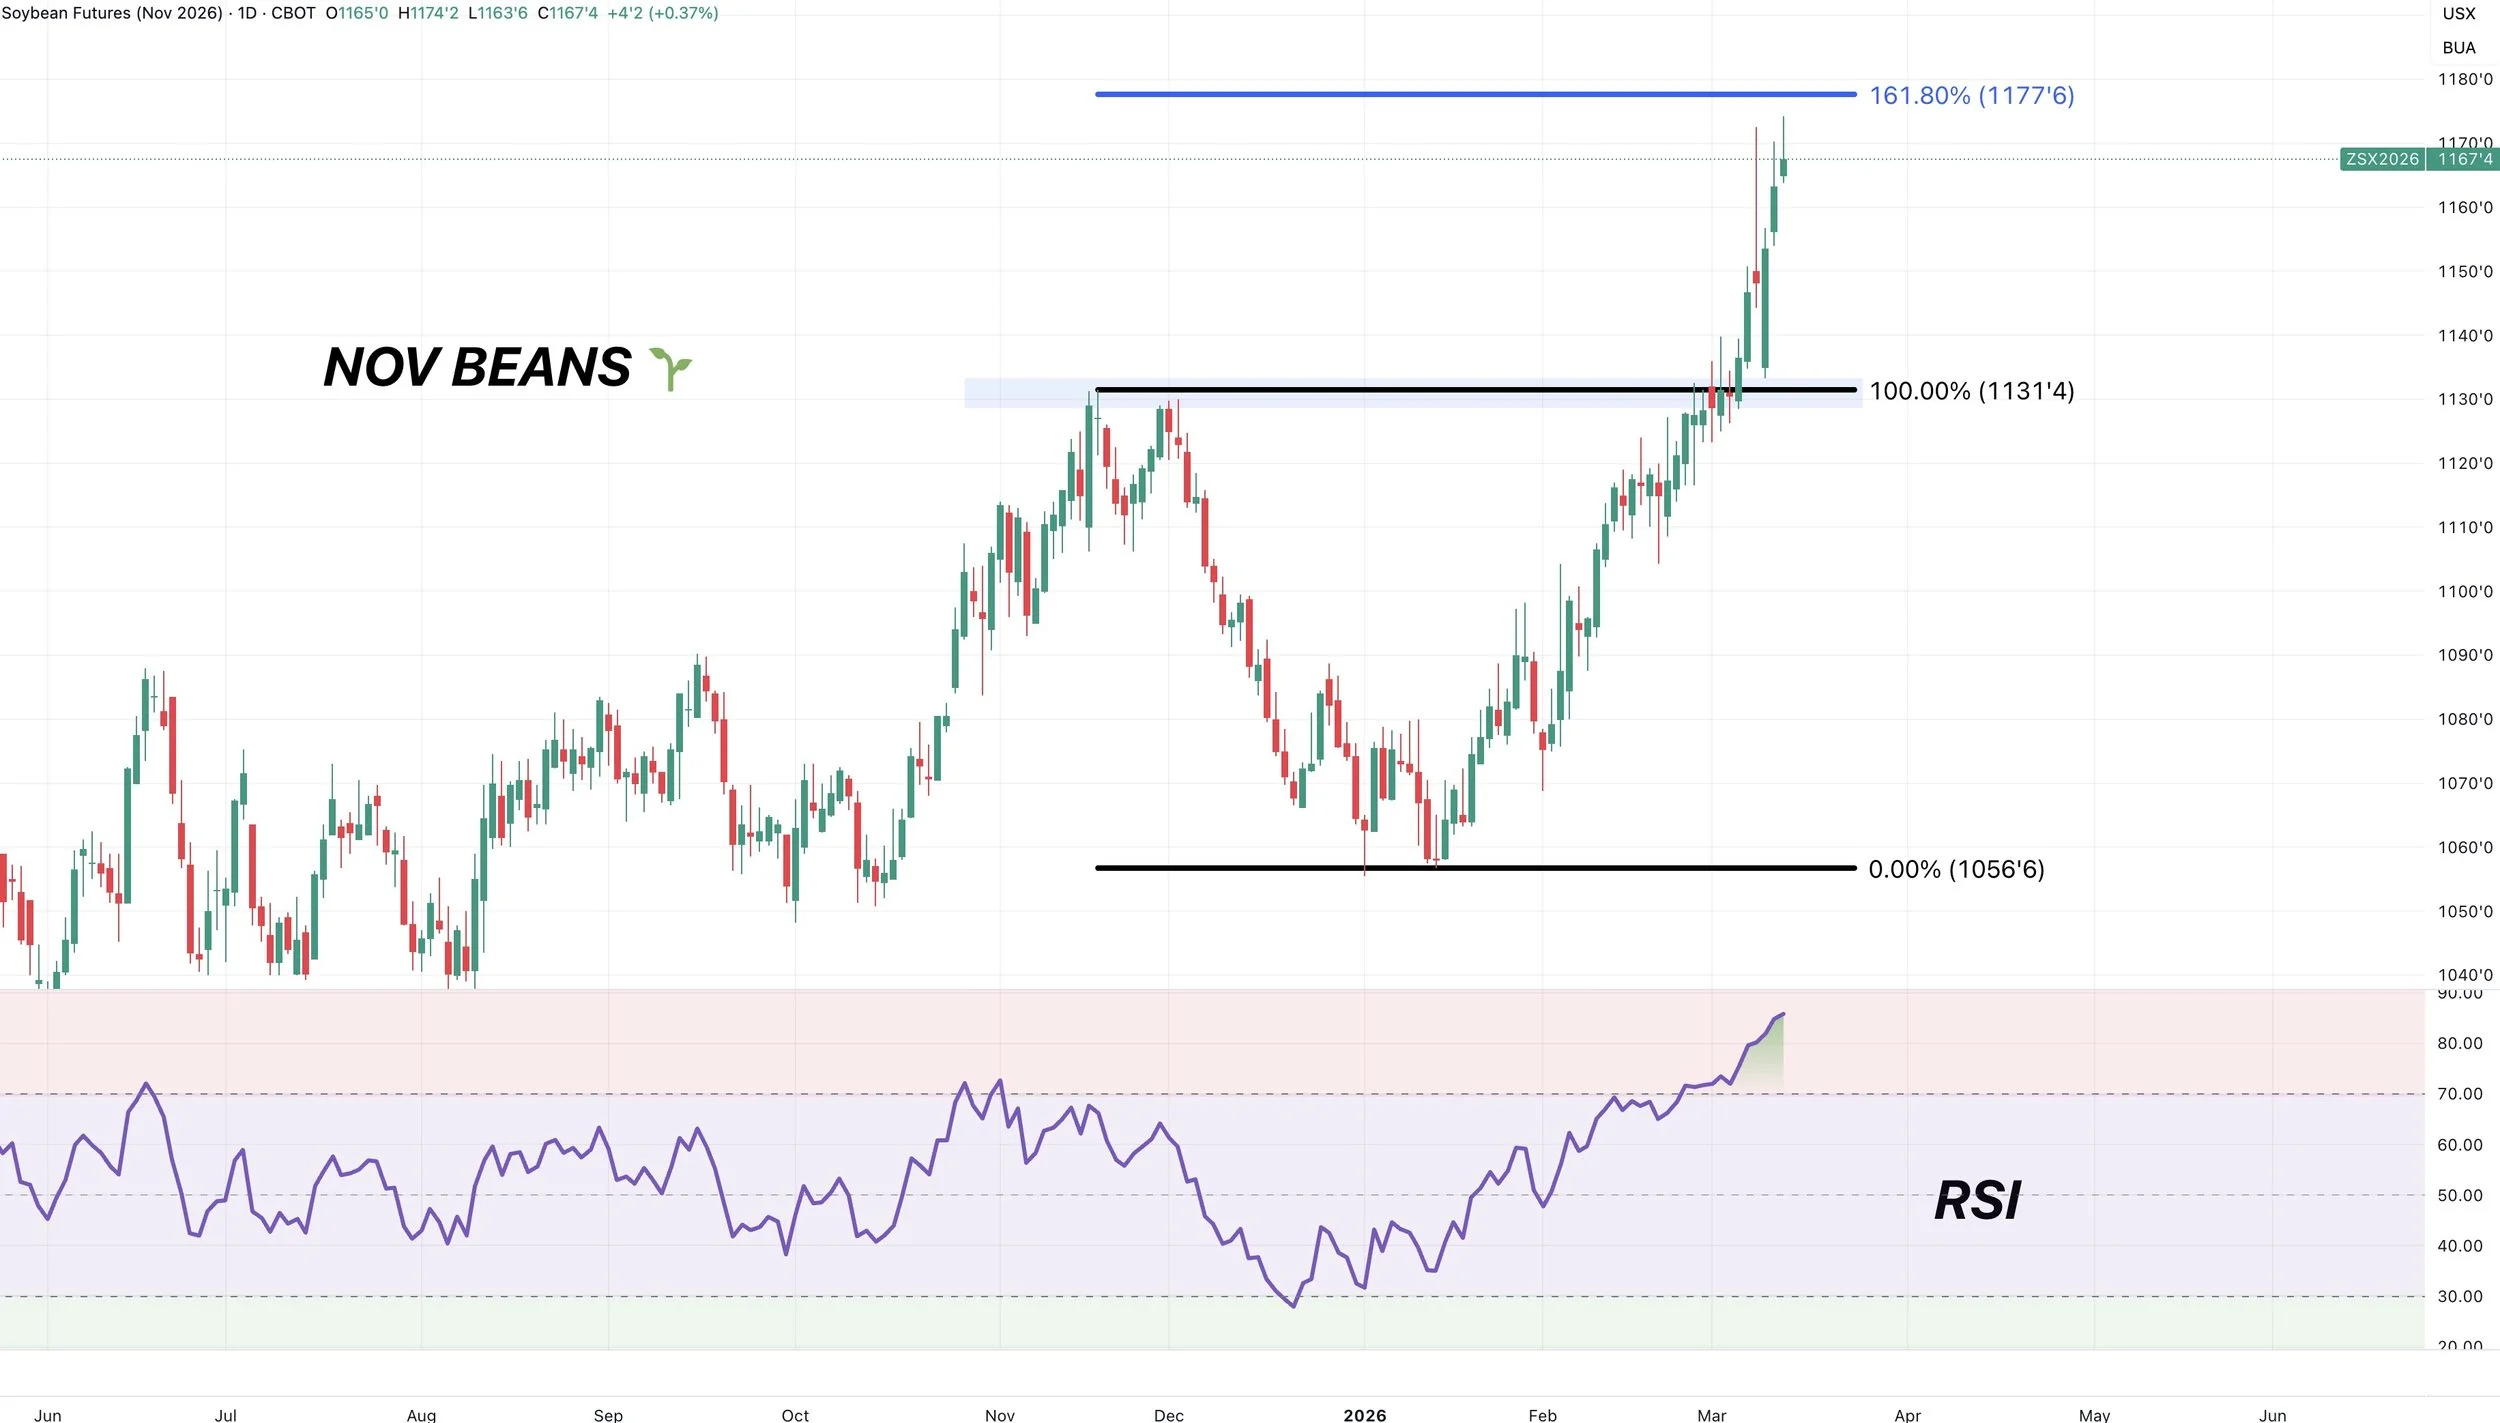
Nov Beans:
Something that makes me nervous is that new crop is extremely overbought.
The RSI is the most overbought since 2021.
We are also getting close to that golden fib extension. Which is 161.8% of the recent lows up to the November highs.
So we might be getting overextended here soon. Another thing I'm watching closely, and reason why it makes sense to defend these levels soon.
Wheat
We had that sell signal and hedge alert on Friday.
I still like rewarding this rally if you have not yet done so.
Wheat is the most sensitive to geopolitics.
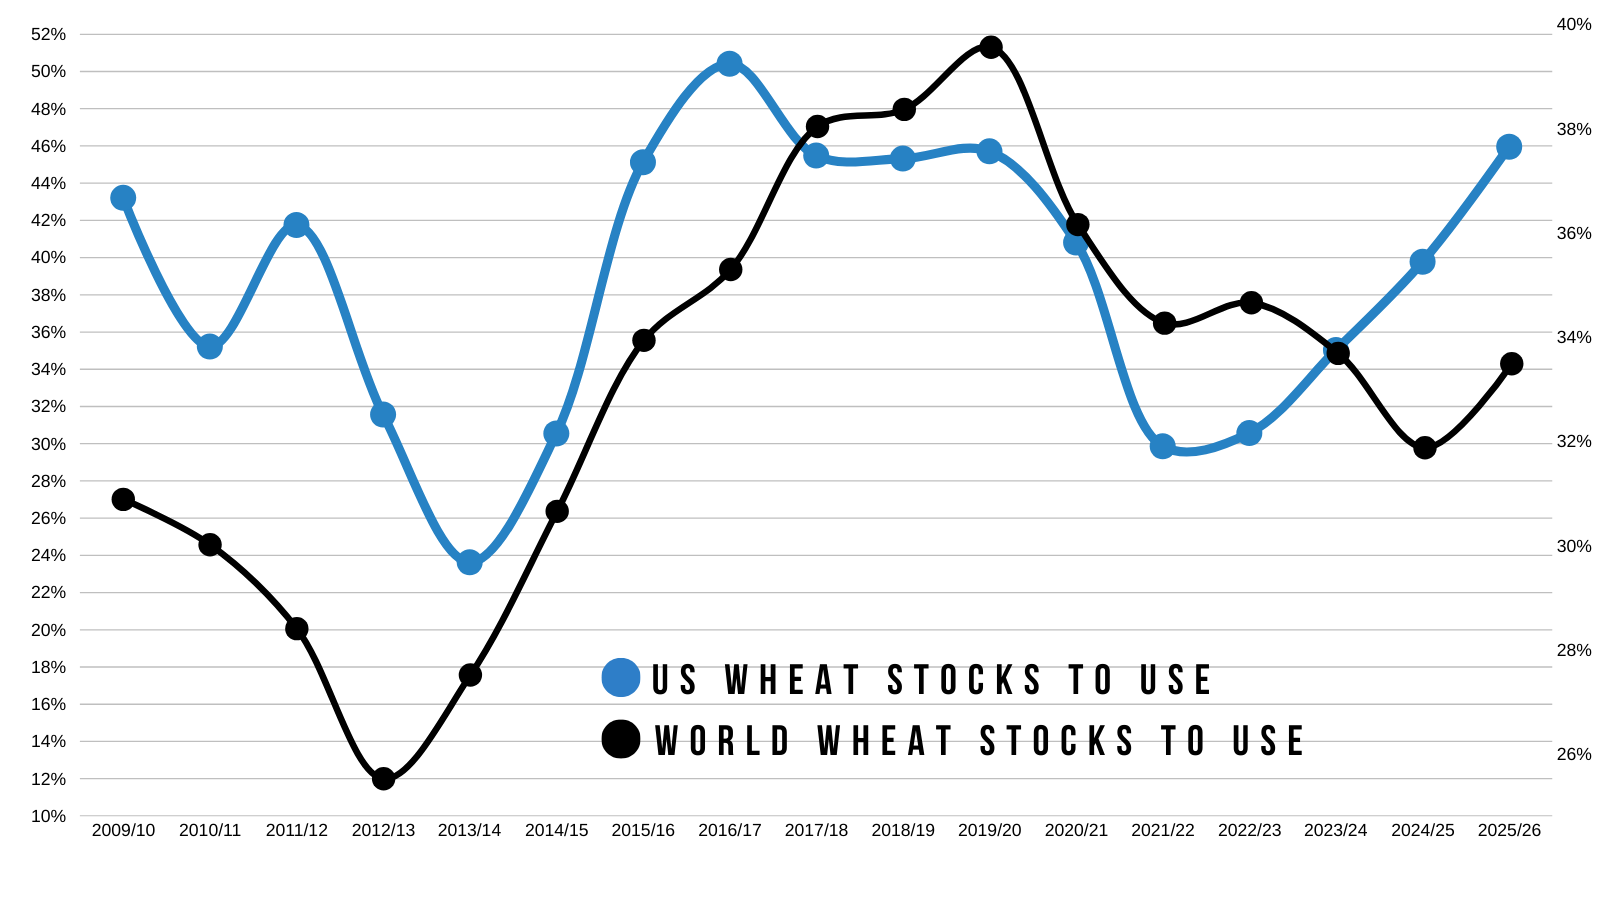
Fundamentally, no the wheat rally doesn’t make sense.
The US and world stories aren’t considered bullish.
But sometimes, that doesn’t matter.
Sometimes all that matters is money flow.
We are headline trading. We aren’t trading the fundamentals or technicals.
If money wants to keep piling in, it can.
However, unless this war truly gets drug out. There is plenty of downside risk in the wheat market following this big run up.
If things escalate and crude goes well beyond $100 we probably follow higher. But if thing's de-escalate wheat will probably head lower.
Most of this rally was driven by war premium.
So you have to be aware that we would just as easily take the elevator back down if the war gets resolved.
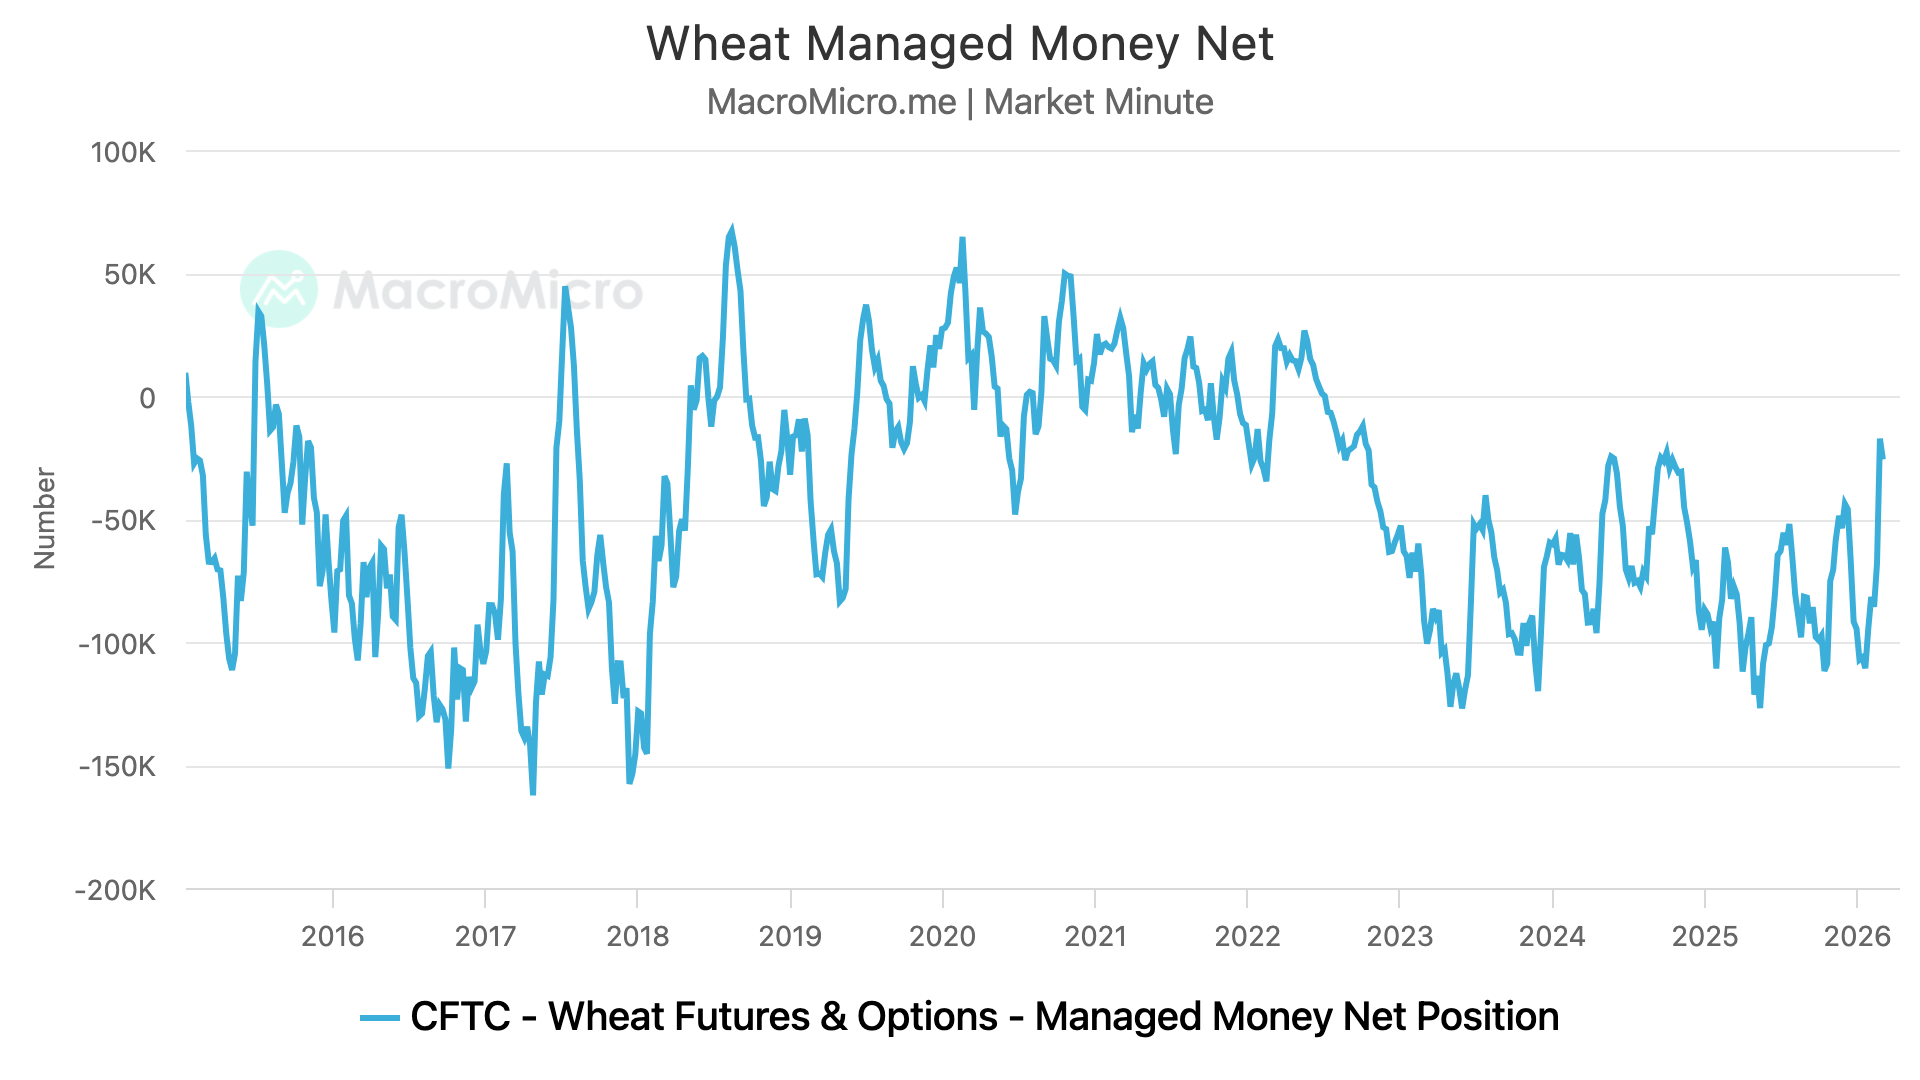
The funds have not been long in the wheat market since 2022.
They've covered their shorts heavily and are now almost long.
Will they finally flip long and drive us higher?
Or will they go back to being short like usual?
I'd say it depends on how long this war lasts.
I'm still in the camp that Trump doesn’t let the war go on too long.
As it's really not in his best interest to see high oil, high gas prices, and high inflation. Those are all things he doesn’t want.
That's not me saying things can’t get crazier from here. I just don’t think it'll last several months. This isn’t Russia and Ukraine, and it doesn’t have nearly the impact on grains.
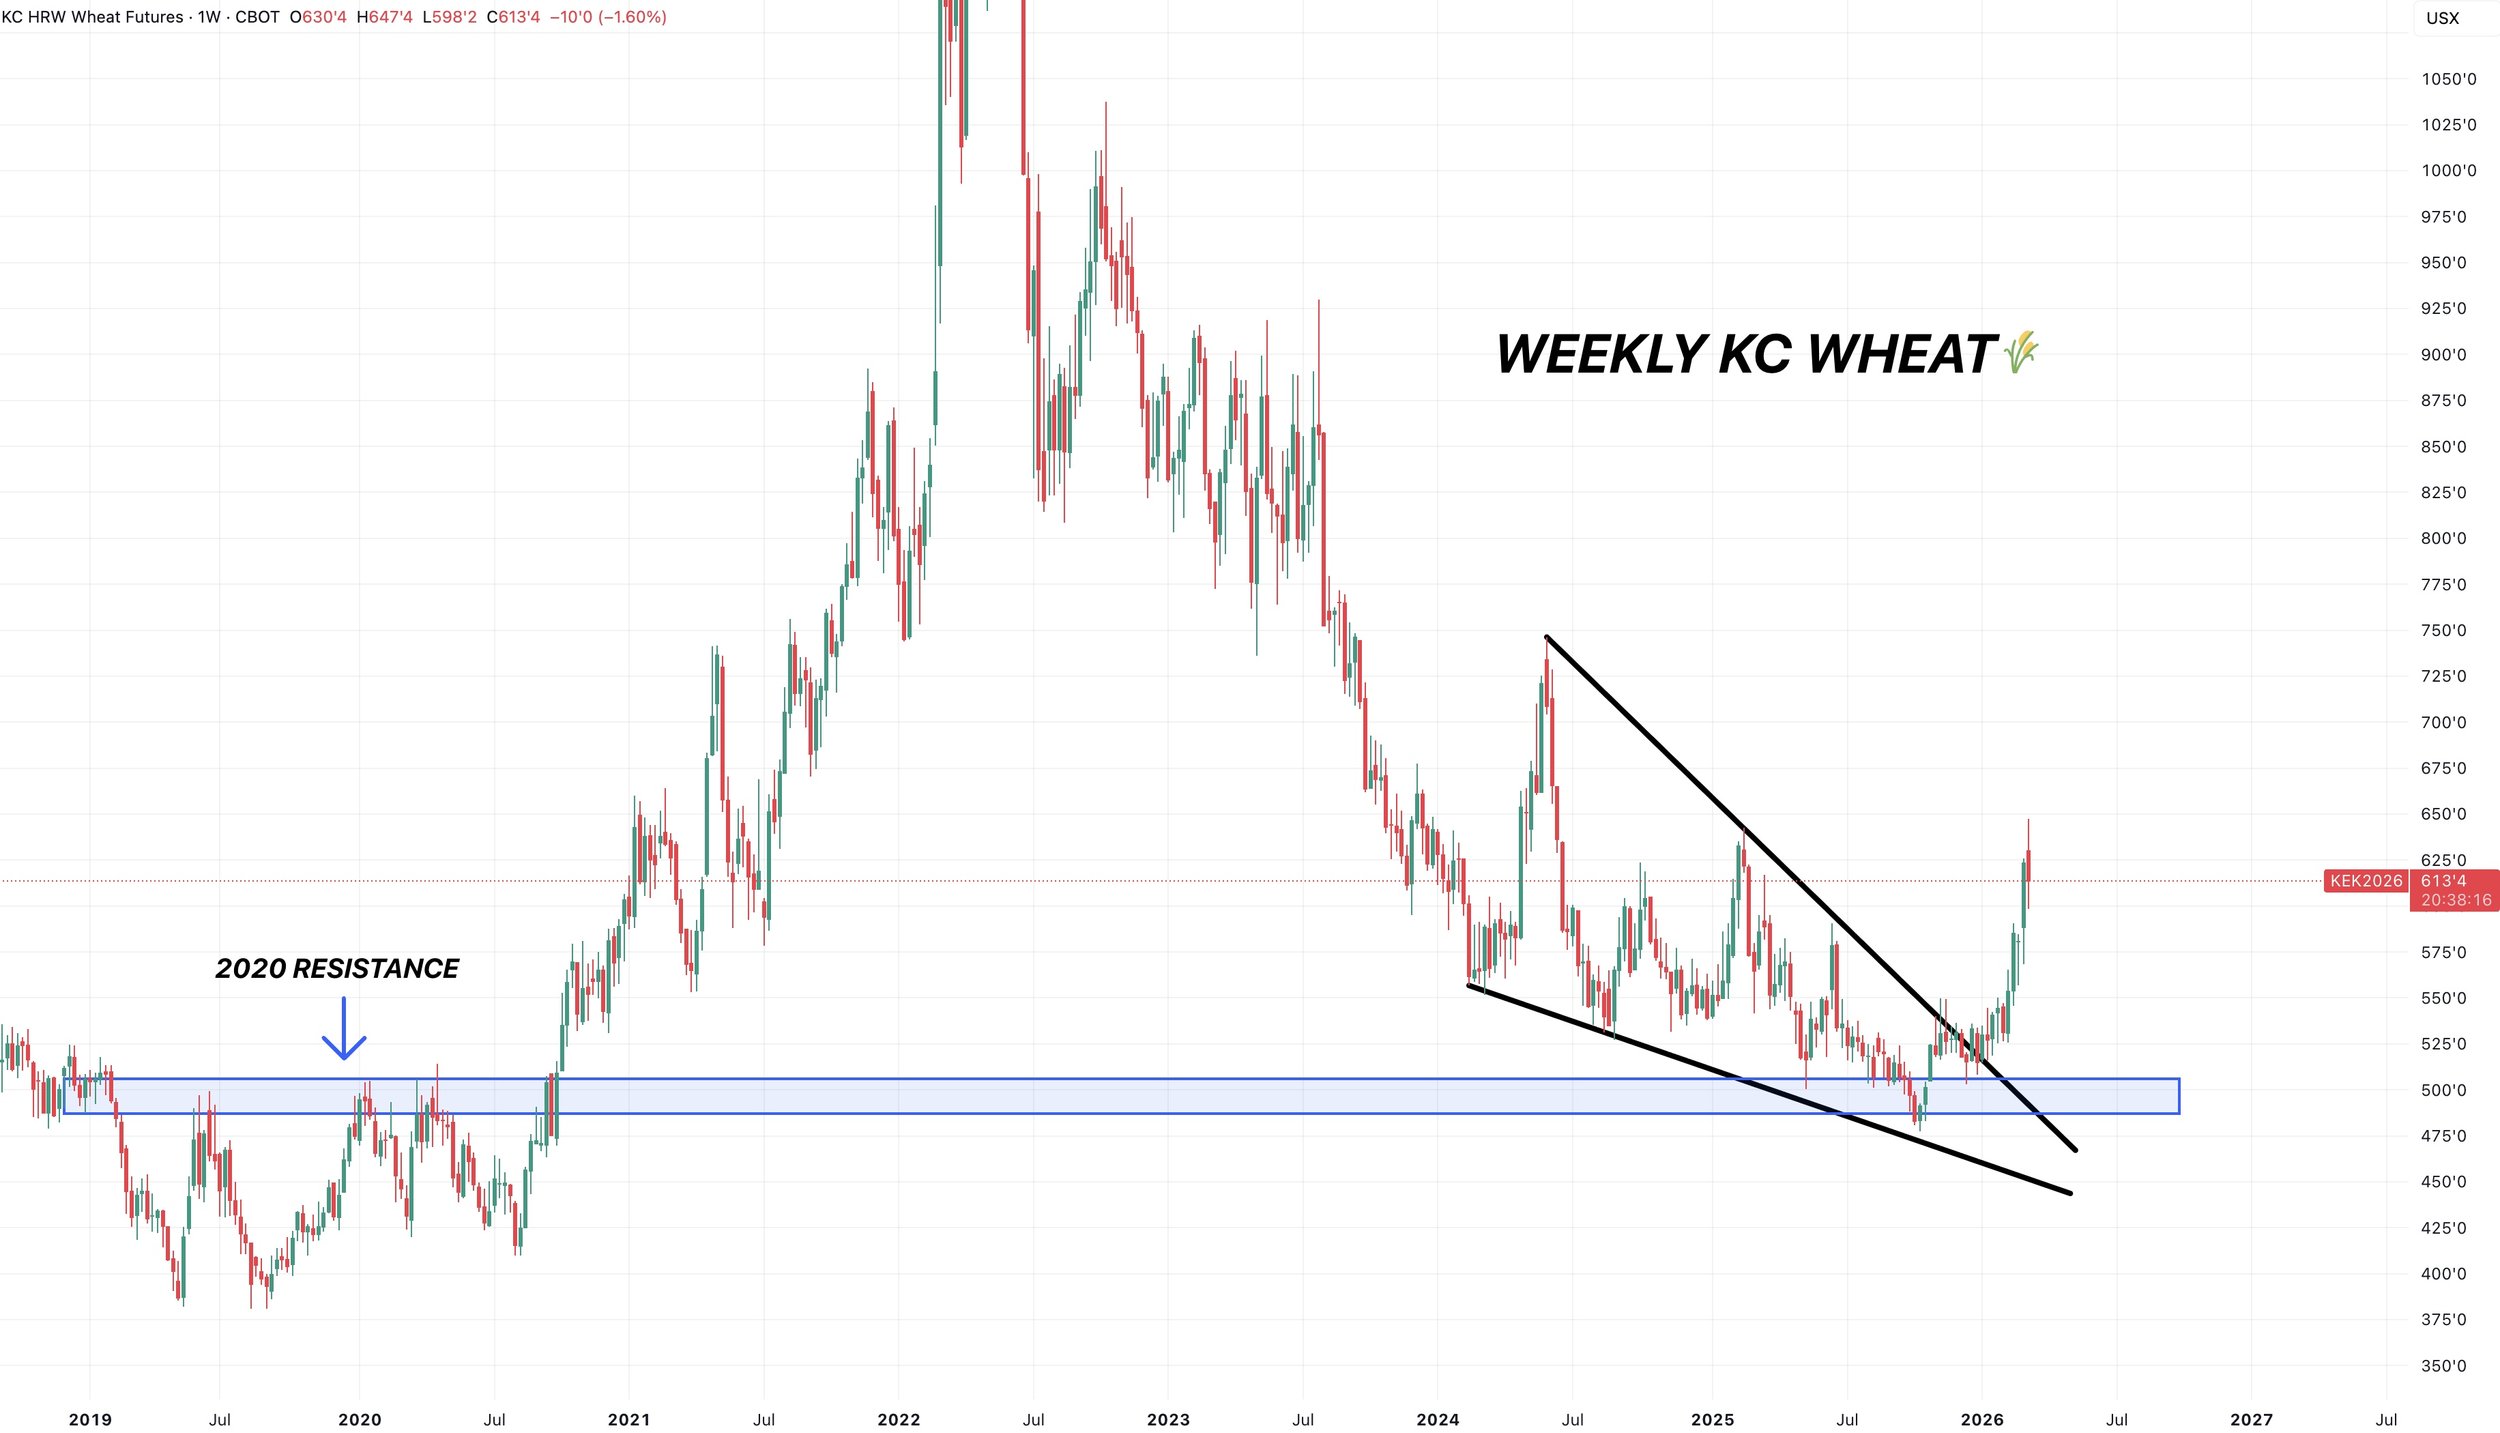
Long term, I think wheat has carved out a meaningful bottom and has all the potential in the world.
Short term, I'm cautious and like defending the opportunity. As eventually, the war will be faded.
The question is how long until that happens?
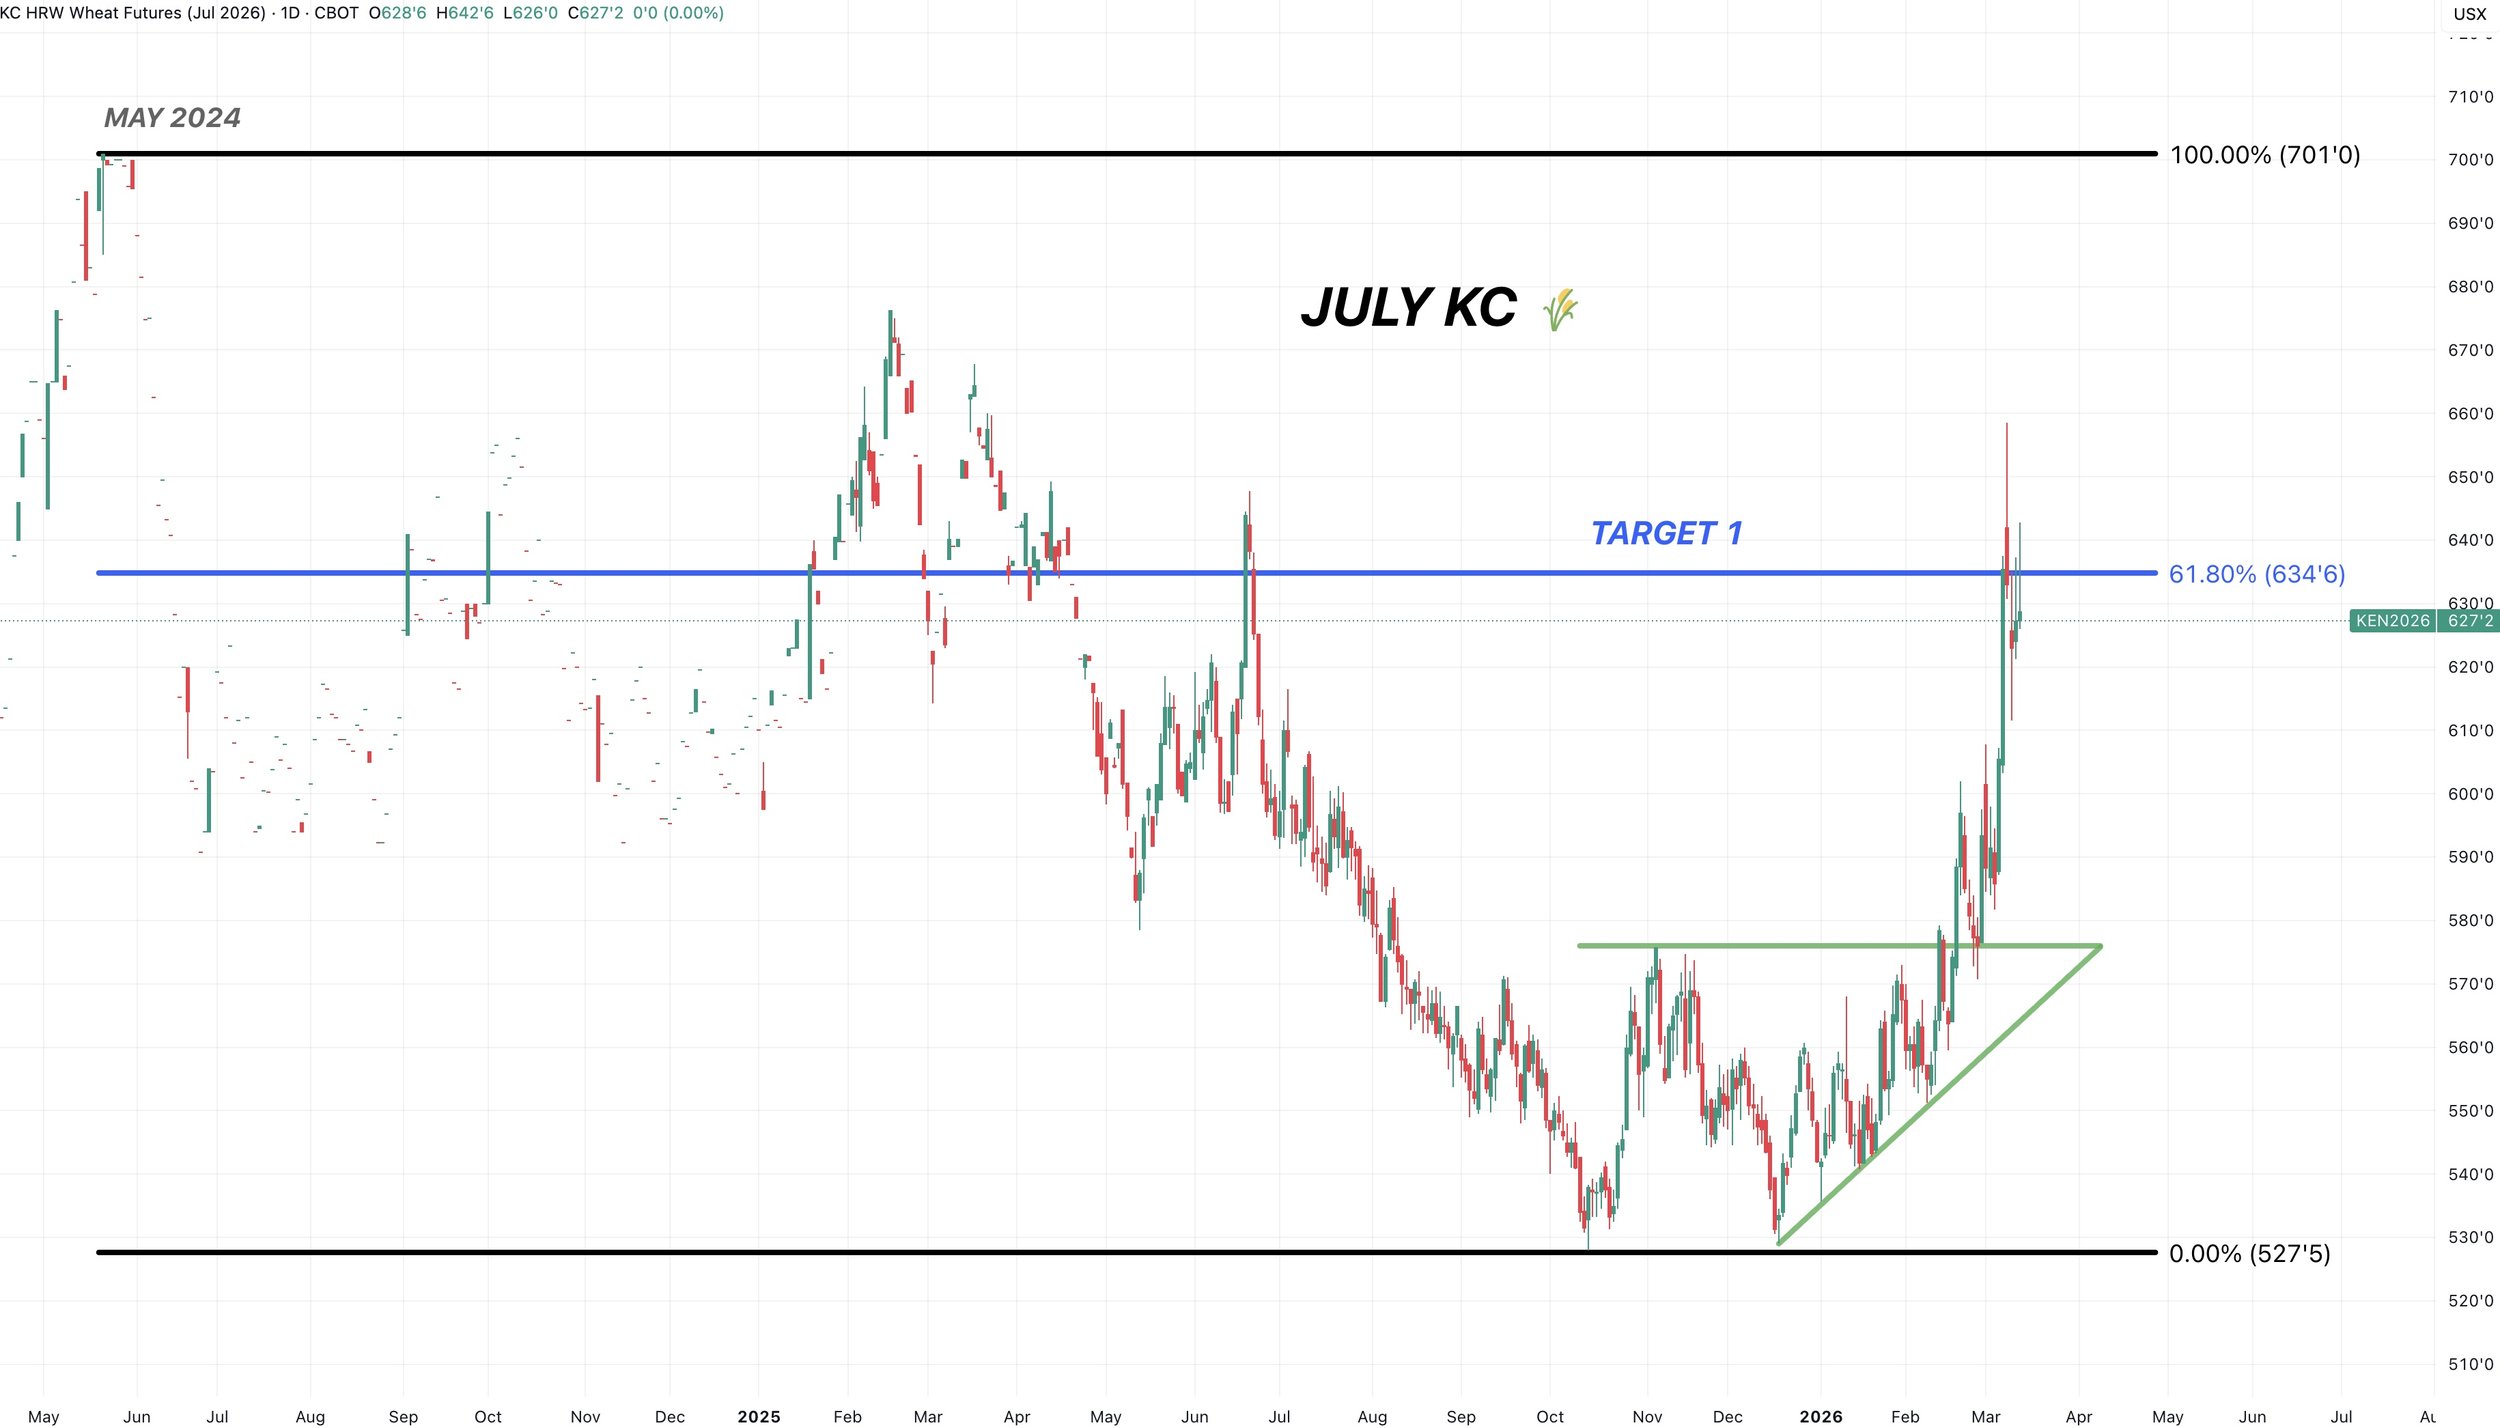
July KC:
We clawed back 61.8% of the May 2024 highs, which was the methodology behind Friday's alert.
Close above that level and it might open the door higher.
Cattle
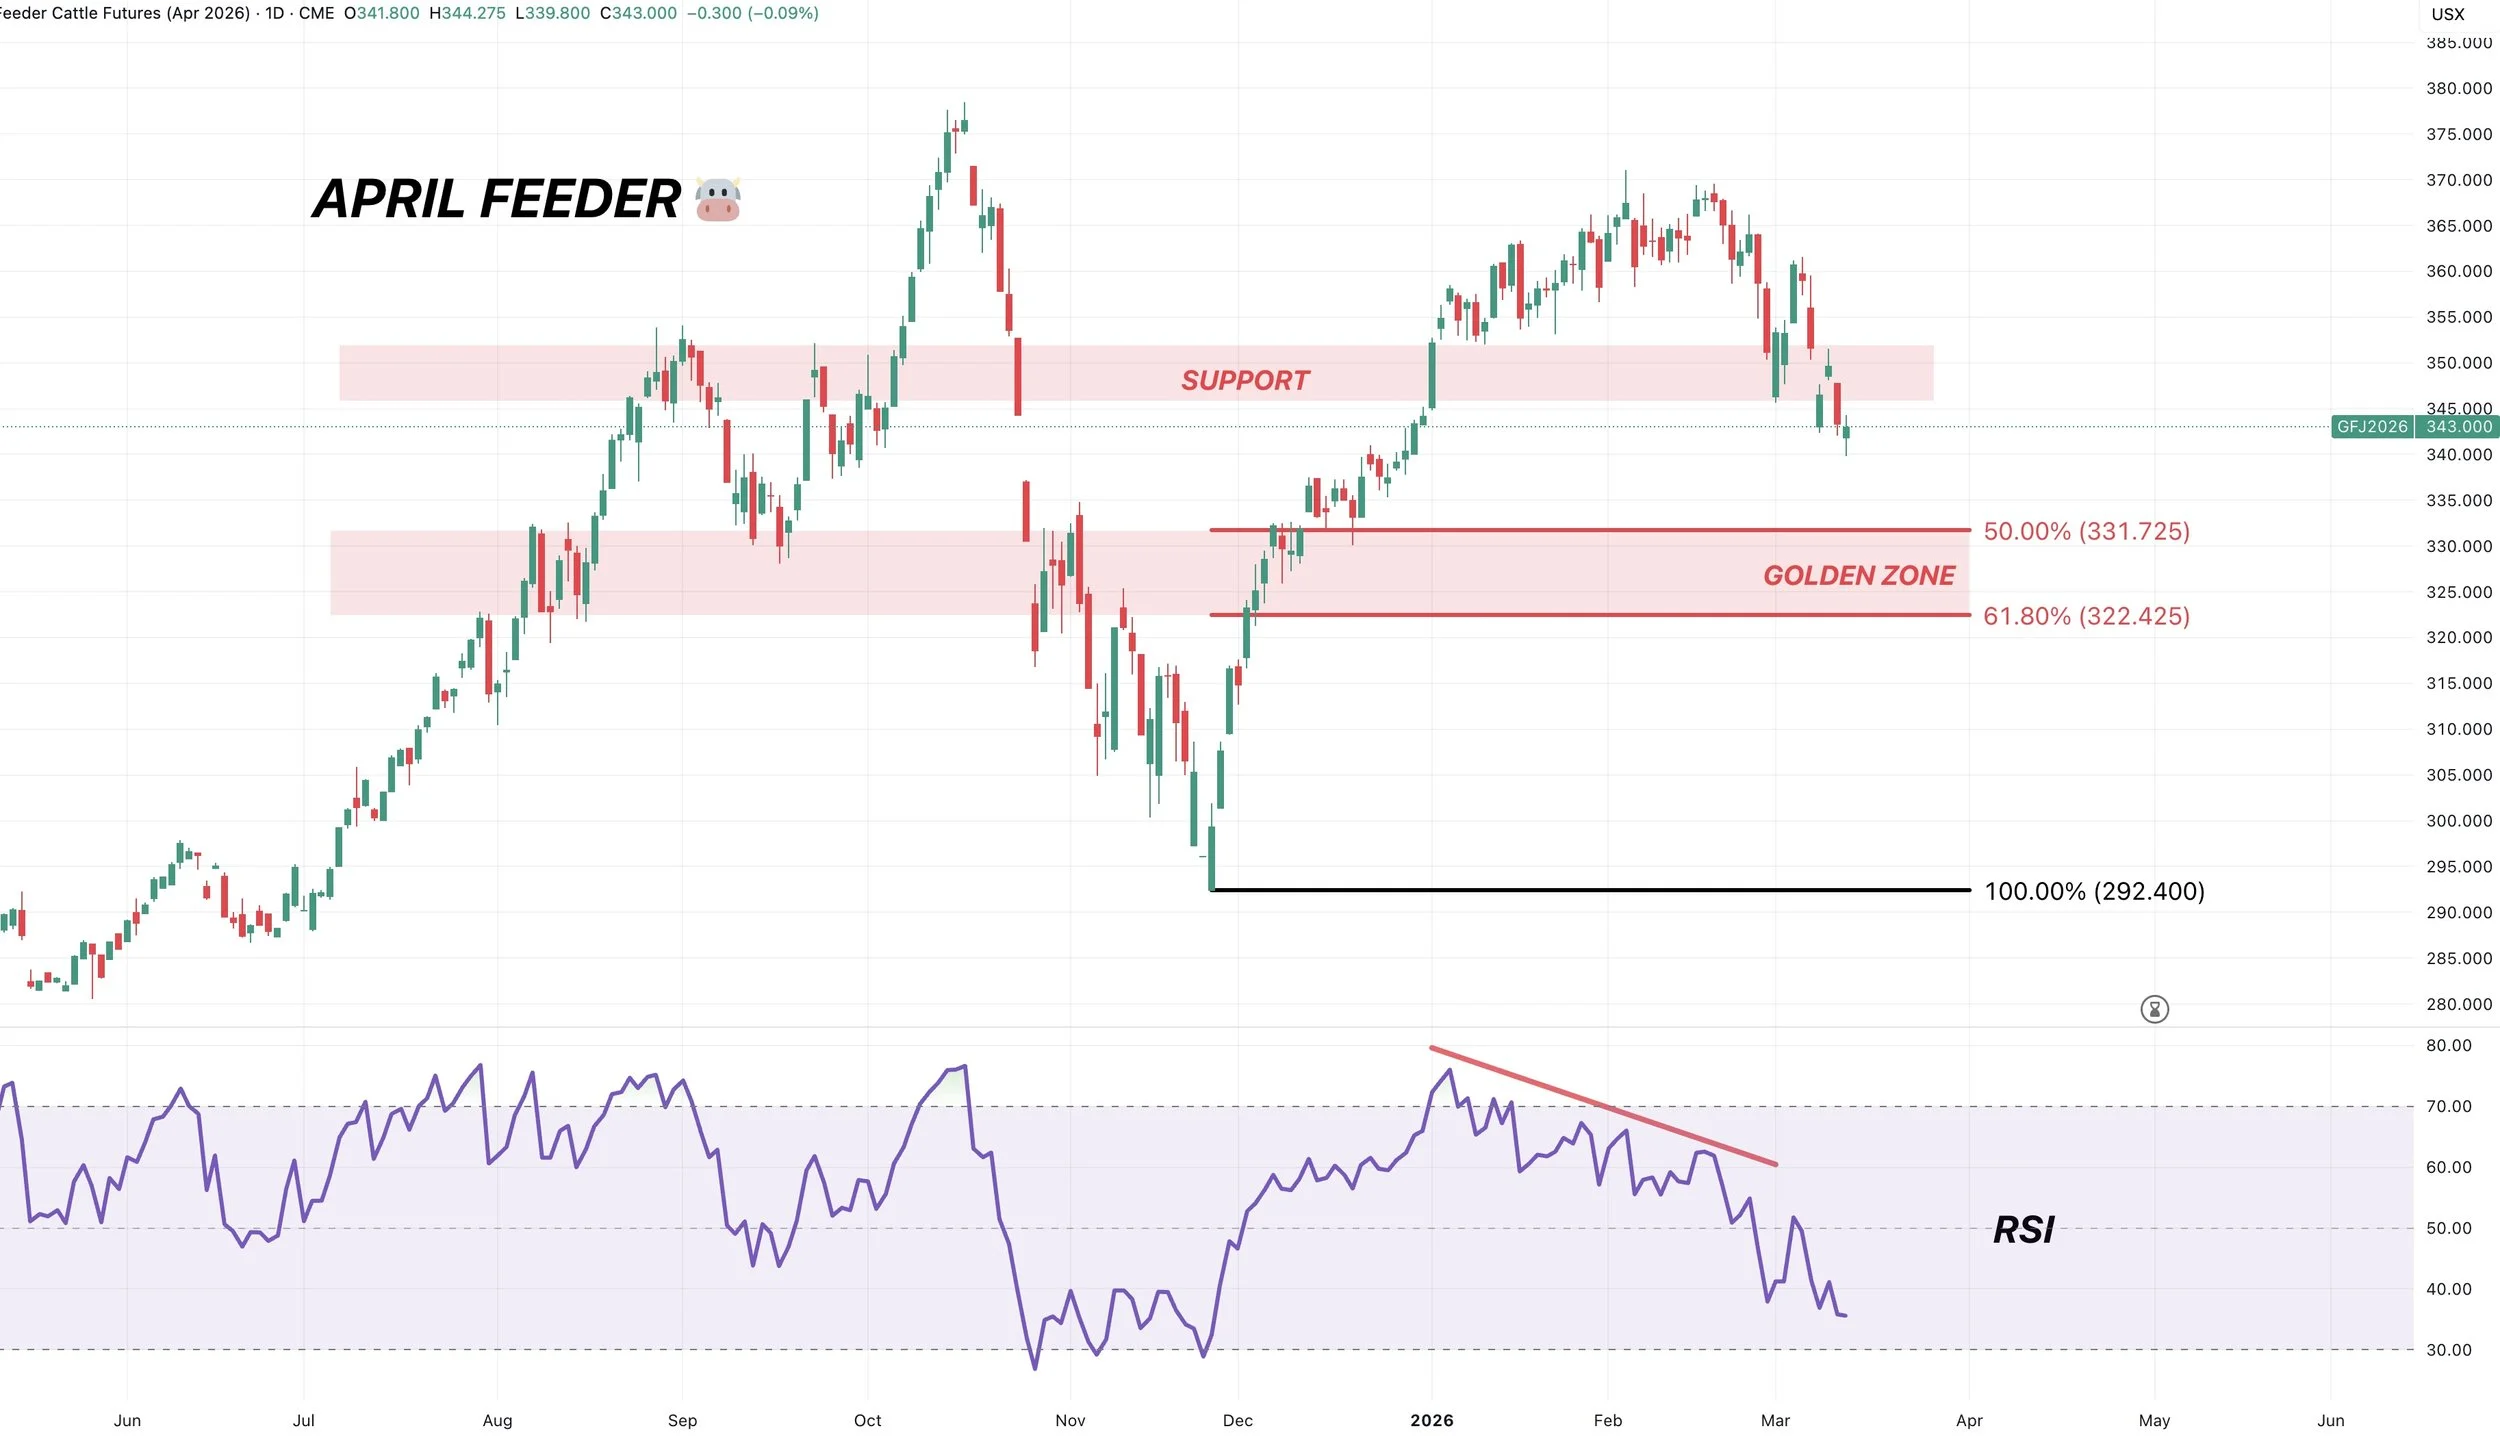
April Feeders
We had talked about that bearish divergence for a long time in February.
Not a great look here as we broke that local support.
Coming down to test that golden zone would make sense.
That would give back 50-61.8% of the entire rally. The most common spot for a correction to end.
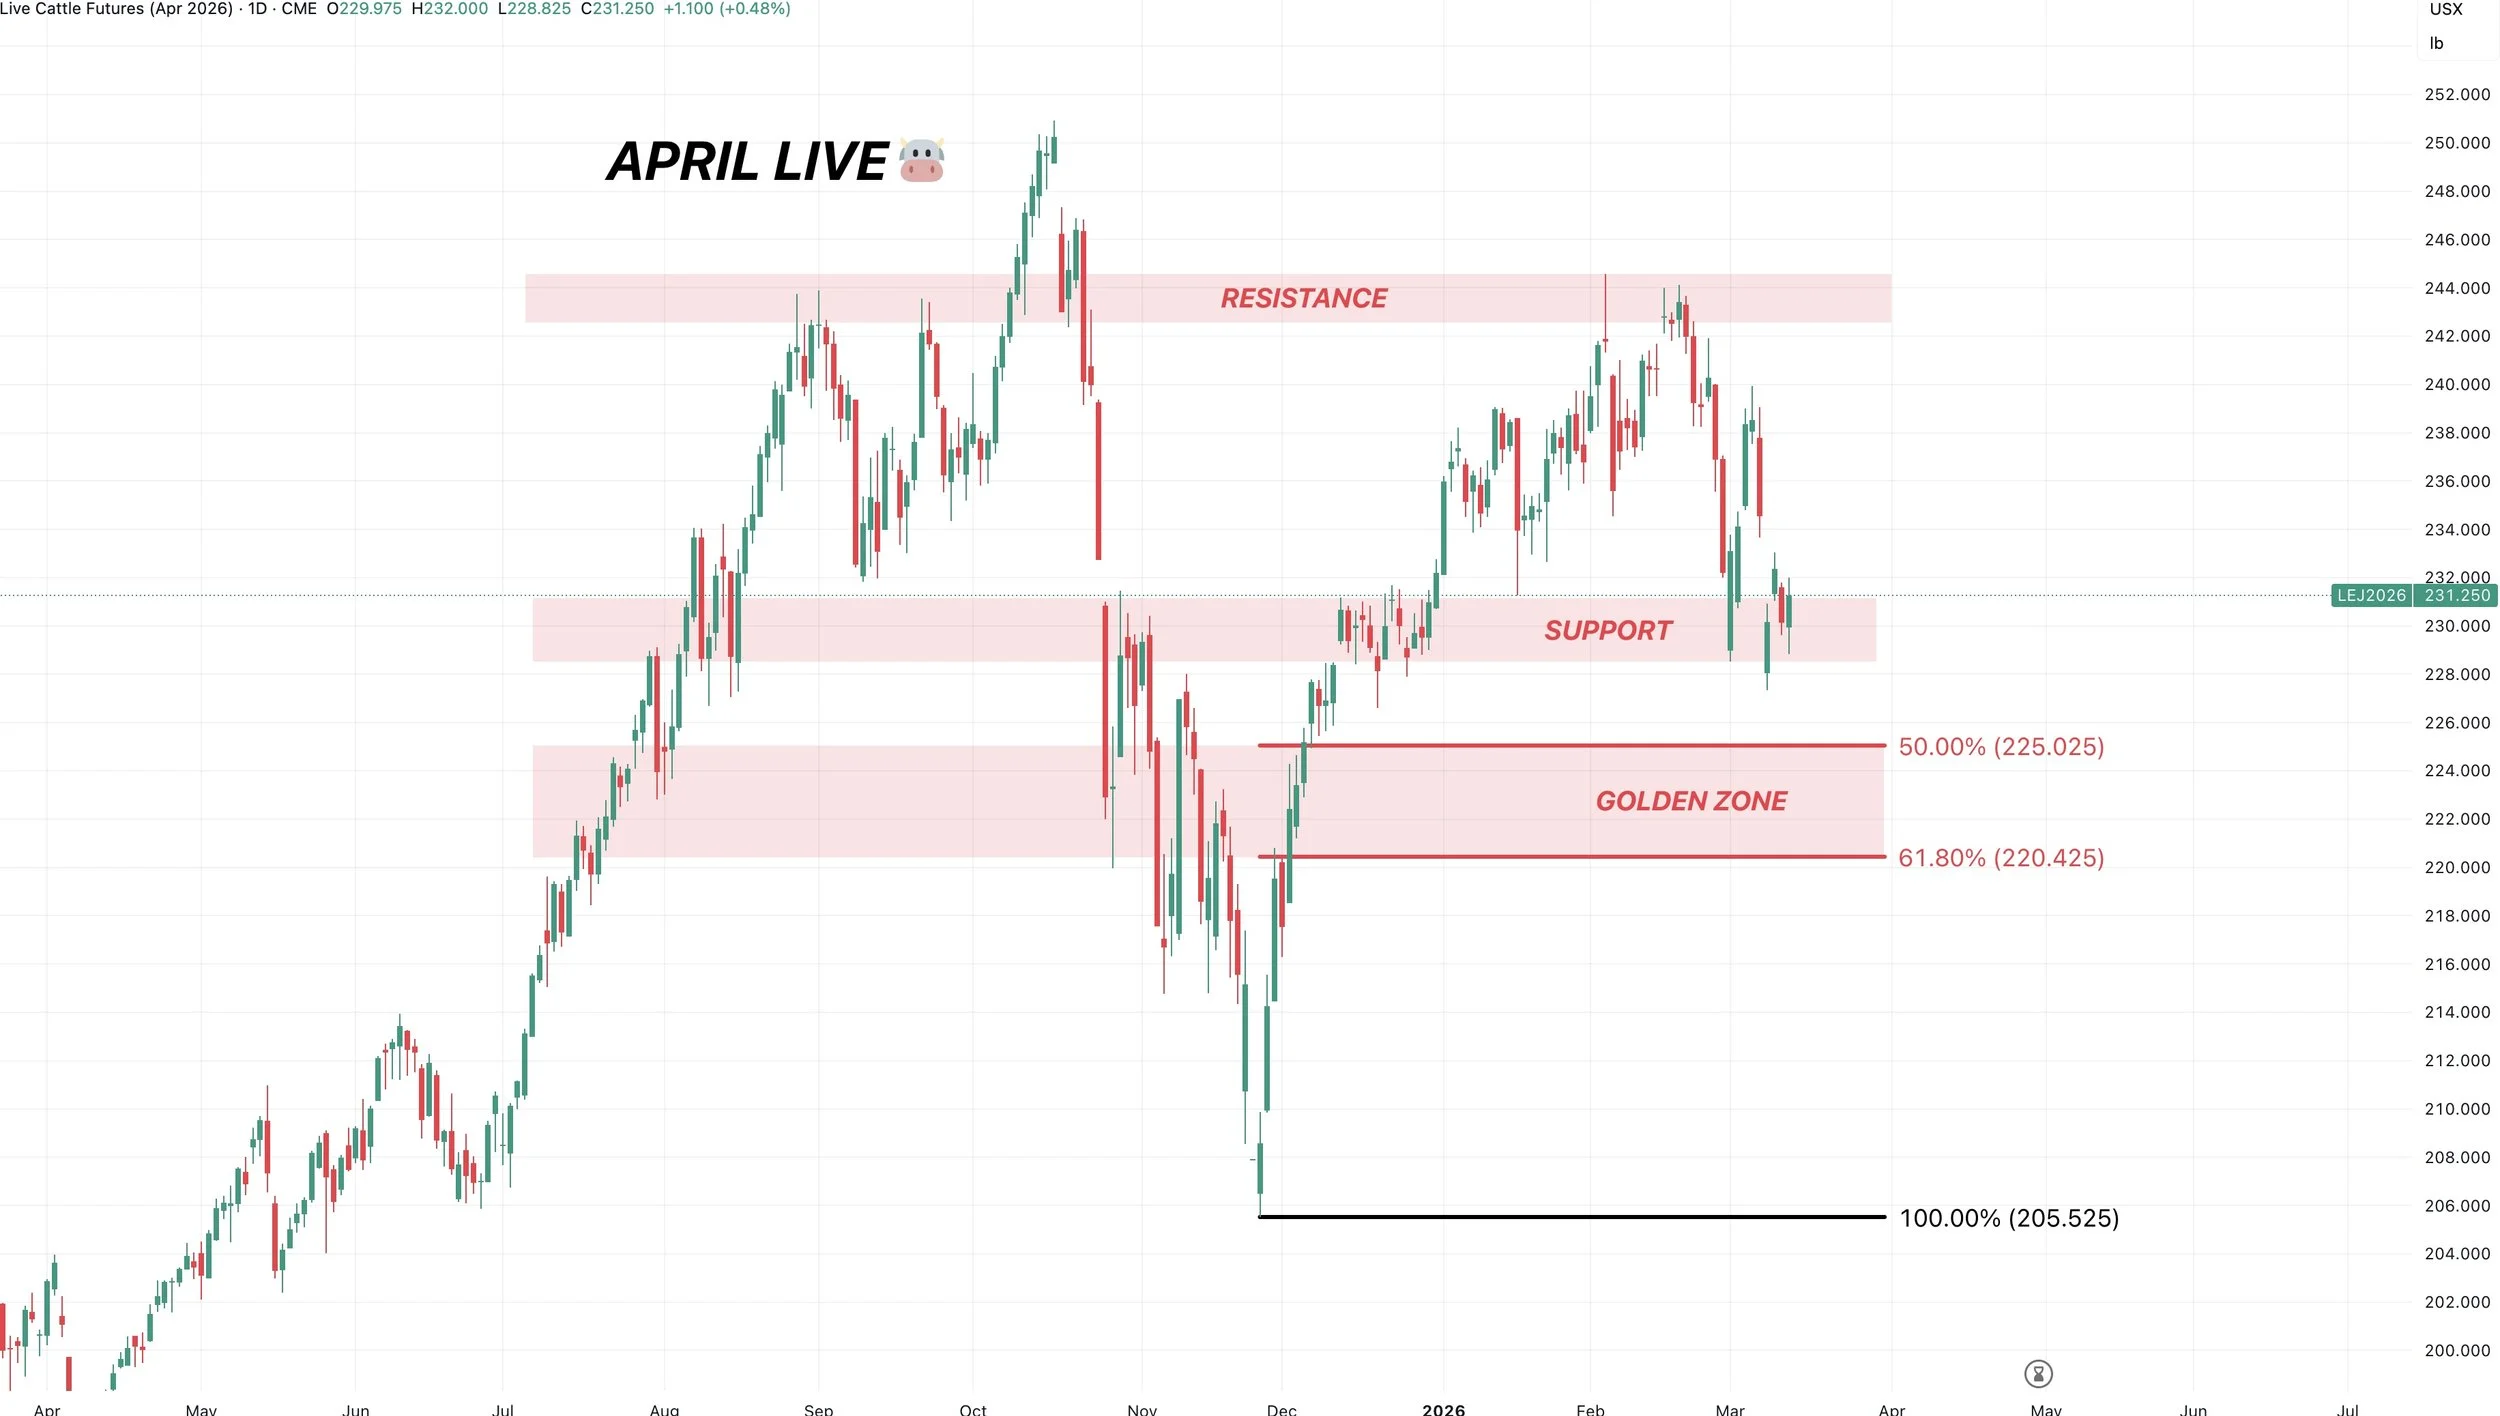
April Live
Live cattle barely holding on to the local support.
But like feeders, it would make sense to come down into that golden zone before finding a bottom.
Want to Talk?
Our phones are open 24/7 for you guys if you ever need anything or want to discuss your operation.
Jeremey, Lauren & Office: (806)484-1214
Sebastian: (605)280-1186
Email: sfrost@dailymarketminute.com
Hedge Account
Interested in a hedge account? Use the link below to set up an account or give us a call.
Recent Signals
March 9th, 2026: 🌱
Soybeans hedge alert.
March 6th, 2026: 🌽 🌾
Corn & wheat sell signal & hedge alert.
March 3rd, 2026: 🌽
Old crop & new crop corn sell signal & hedge alert.
Feb 26th, 2026: 🌱
Old crop & new crop beans sell signal & hedge alert.
Feb 19th, 2026: 🌾
KC wheat sell signal & hedge alert.
Feb 6th, 2026: 🌽 🌱
Old crop corn & soybean sell signal & hedge alert.
Feb 4th, 2026: 🌱
Soybean sell signal & hedge alert.
Nov 17th, 2025: 🌱
Soybean sell signal & hedge alert.