
PROBLEMS IN THE PLAINS
MARKET UPDATE
You can scroll to read the usual update as well. As the written version is the exact same as the video.
Timestamps for video:
Overview: 0:00min
Corn: 3:20min
Beans: 7:55min
Wheat: 11:15min
Cattle: 15:45min
Want to talk?
Office: (806)484-1214
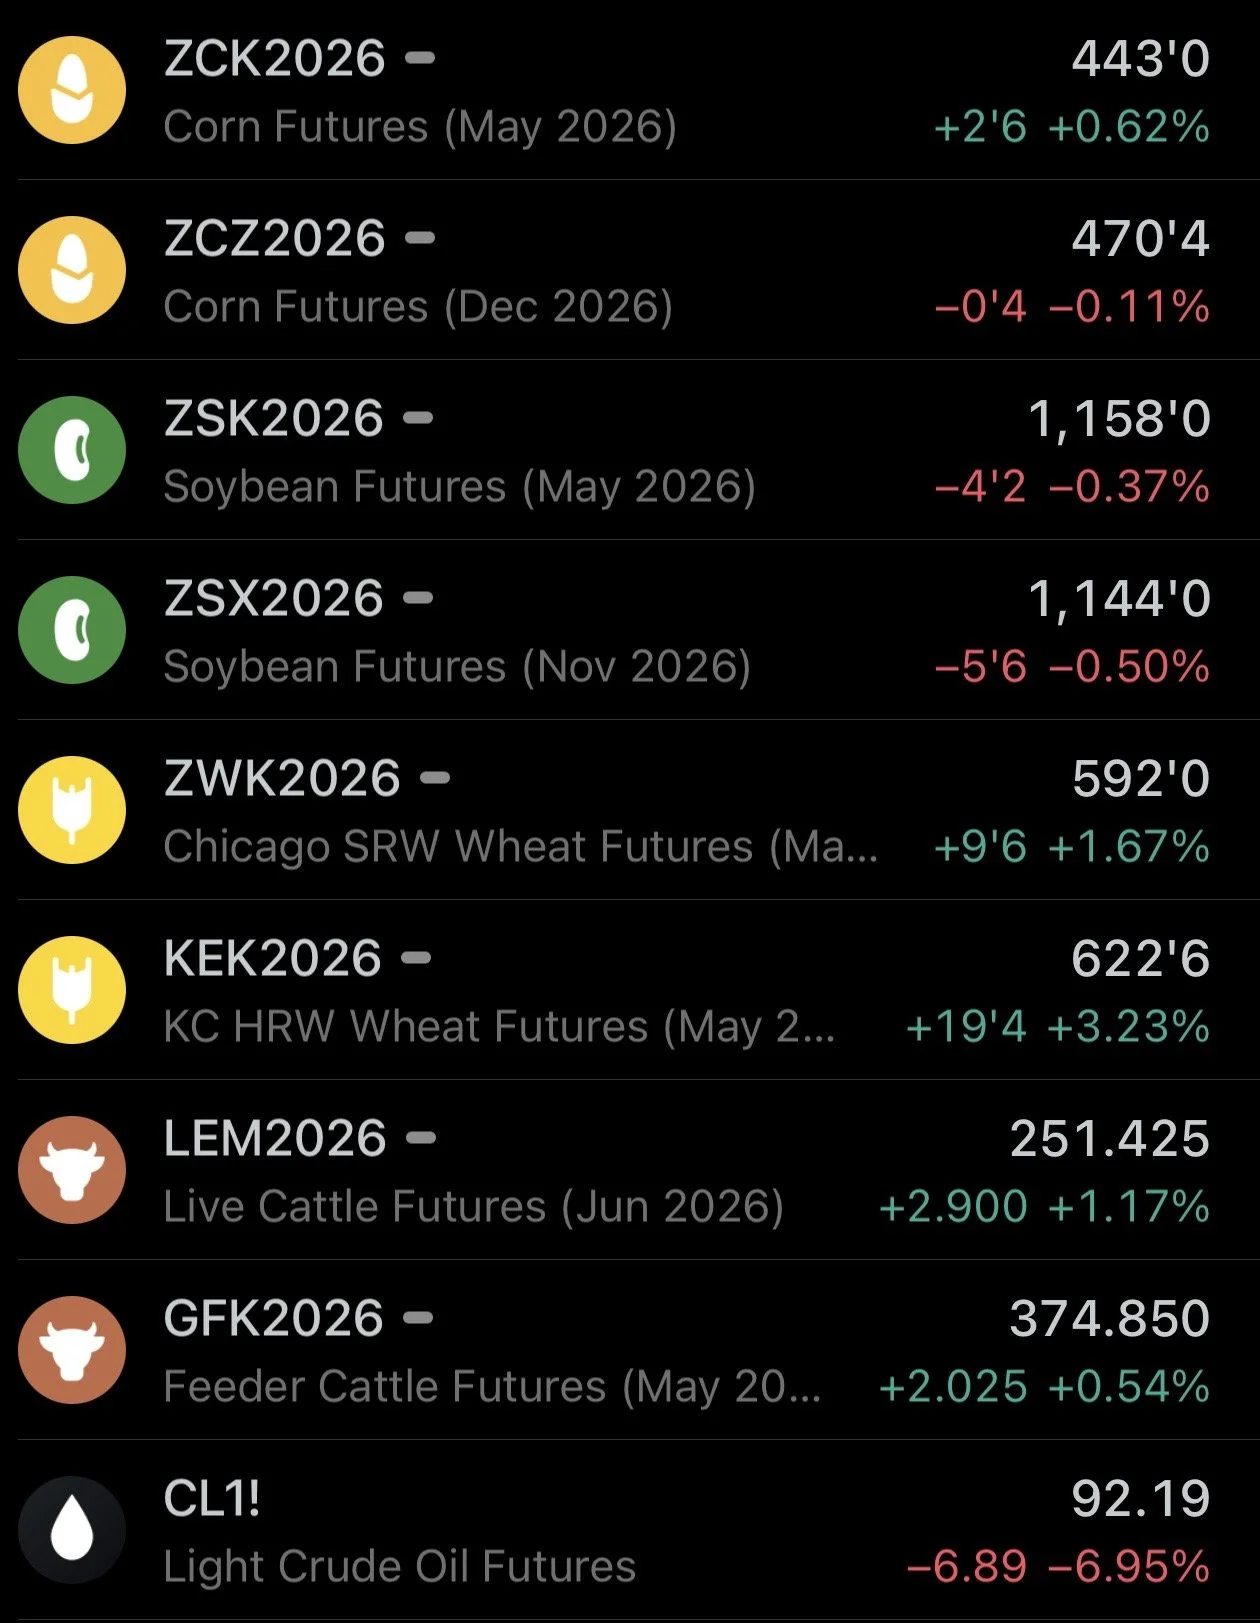
Futures Prices Close
Overview
Grains mixed with wheat leading the way higher.
Grains held up well despite crude oil being under pressure, as crude was down around $7 a barrel today, amongst more geopolitical headlines.
Meanwhile, the cattle market continues to push higher, as live cattle is at all-time highs with feeders not too far behind.
Overall, there is a lack of fresh news taking the charge for either bulls or bears.
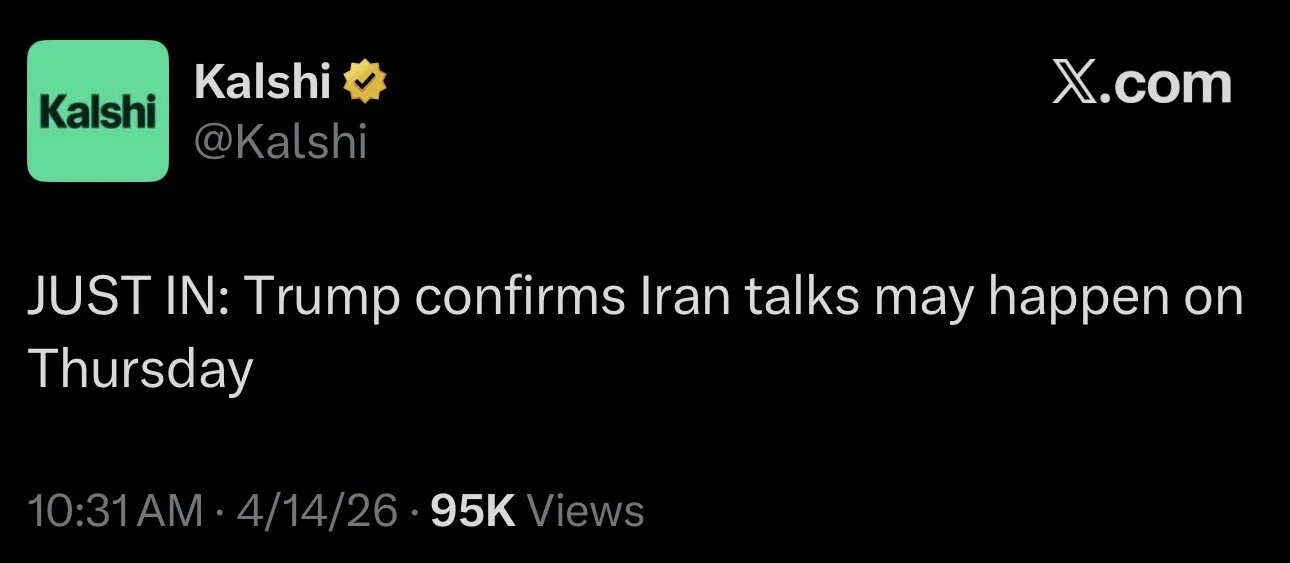
We did see further war headlines. Crude was under pressure as Trump said that the US and Iran could have talks happening over the next two days.
The US and Iran had peace talks on Saturday.
They ended up going nowhere.
Iran actually did offer a 5-year suspension on nuclear activity, but Trump rejected it as they were looking for a 20-year suspension.
But Iran even offering this means that they are willing to talk, and a deal is possible.
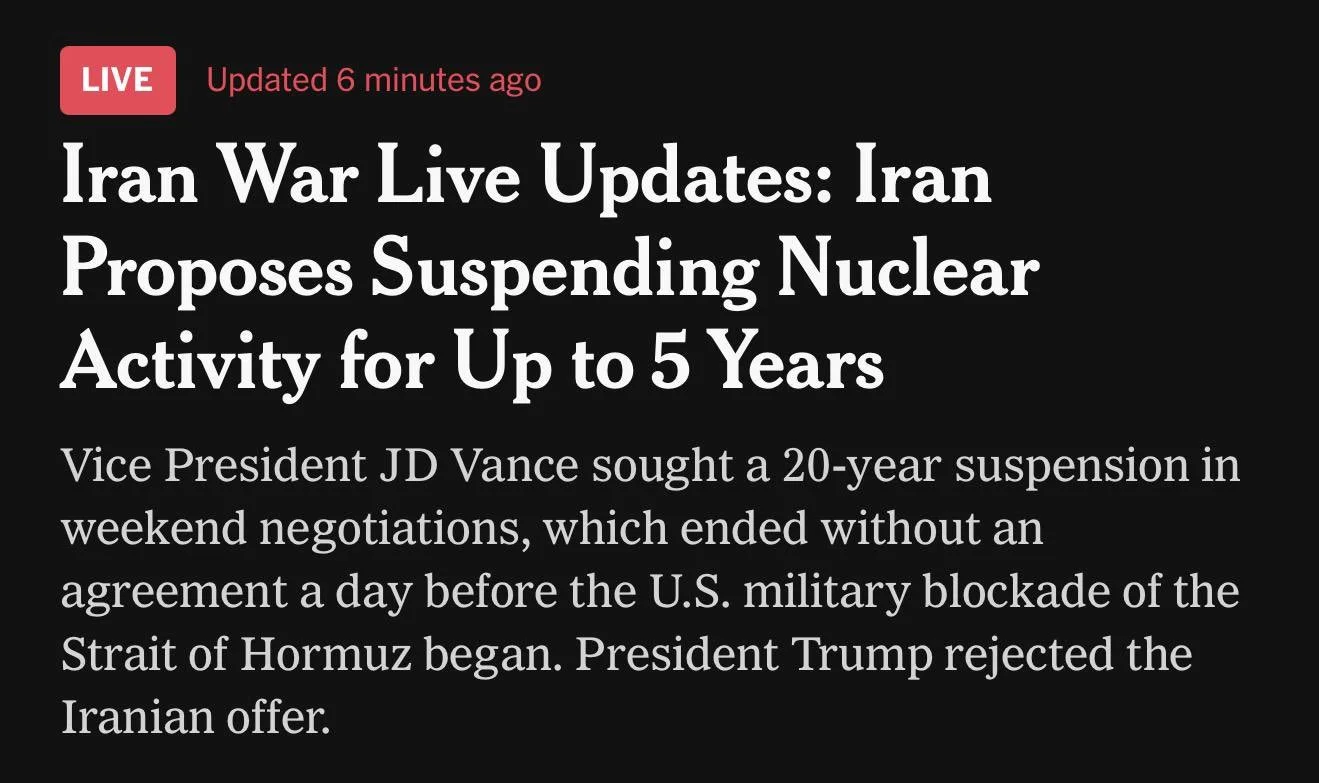
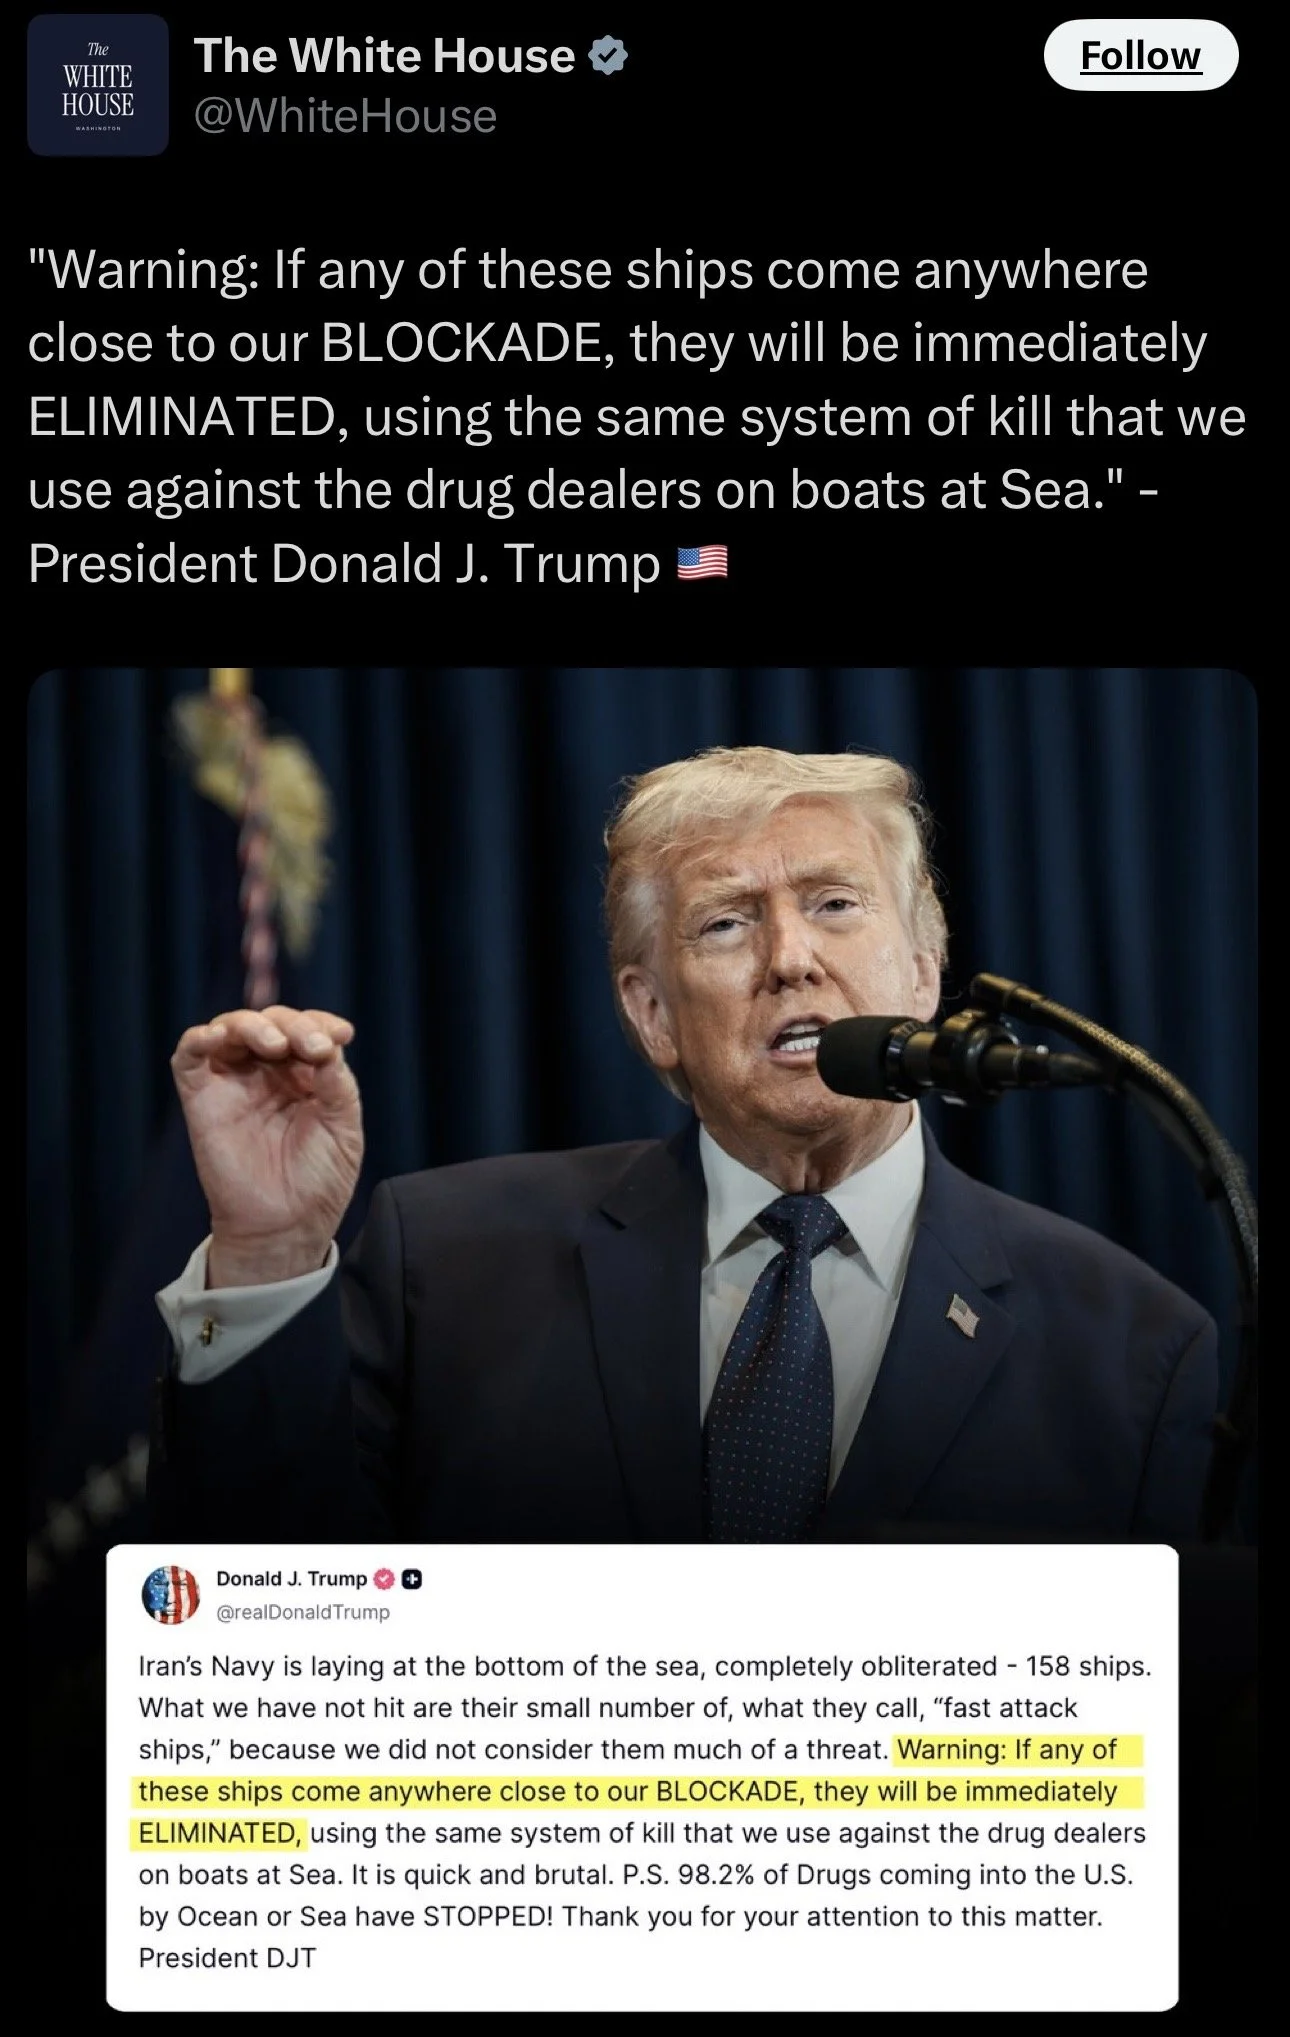
Iran's biggest bargaining chip has always been the Strait.
So Trump decided that he was going to block the Strait himself and take away their only bargaining chip.
I'm under the impression that the weekend news was part of the reason for the weakness in soybeans.
China wants a deal between the US and Iran. They've been trying to help us come to an agreement.
So you have to wonder that if the war persists, will we still have that meeting with China that is scheduled for May?
Will the US blocking the Strait make China mad?
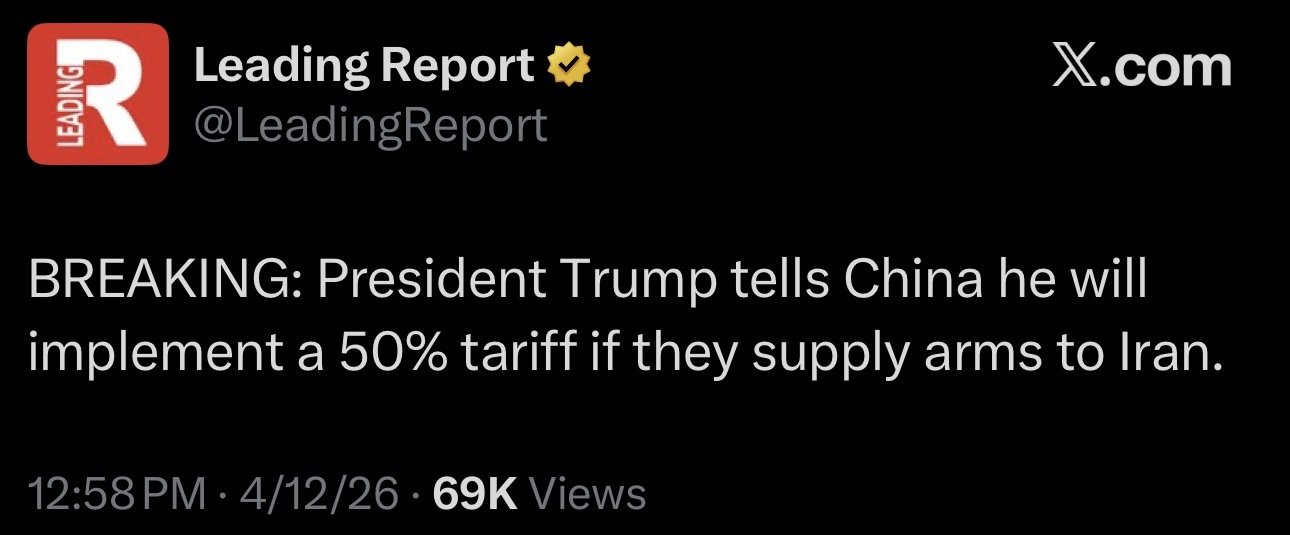
To add on to this, Trump threated to tariff China 50% if they supply arms to Iran.
But China came out and rejected the reports that they were preparing to supply to Iran.
Crude
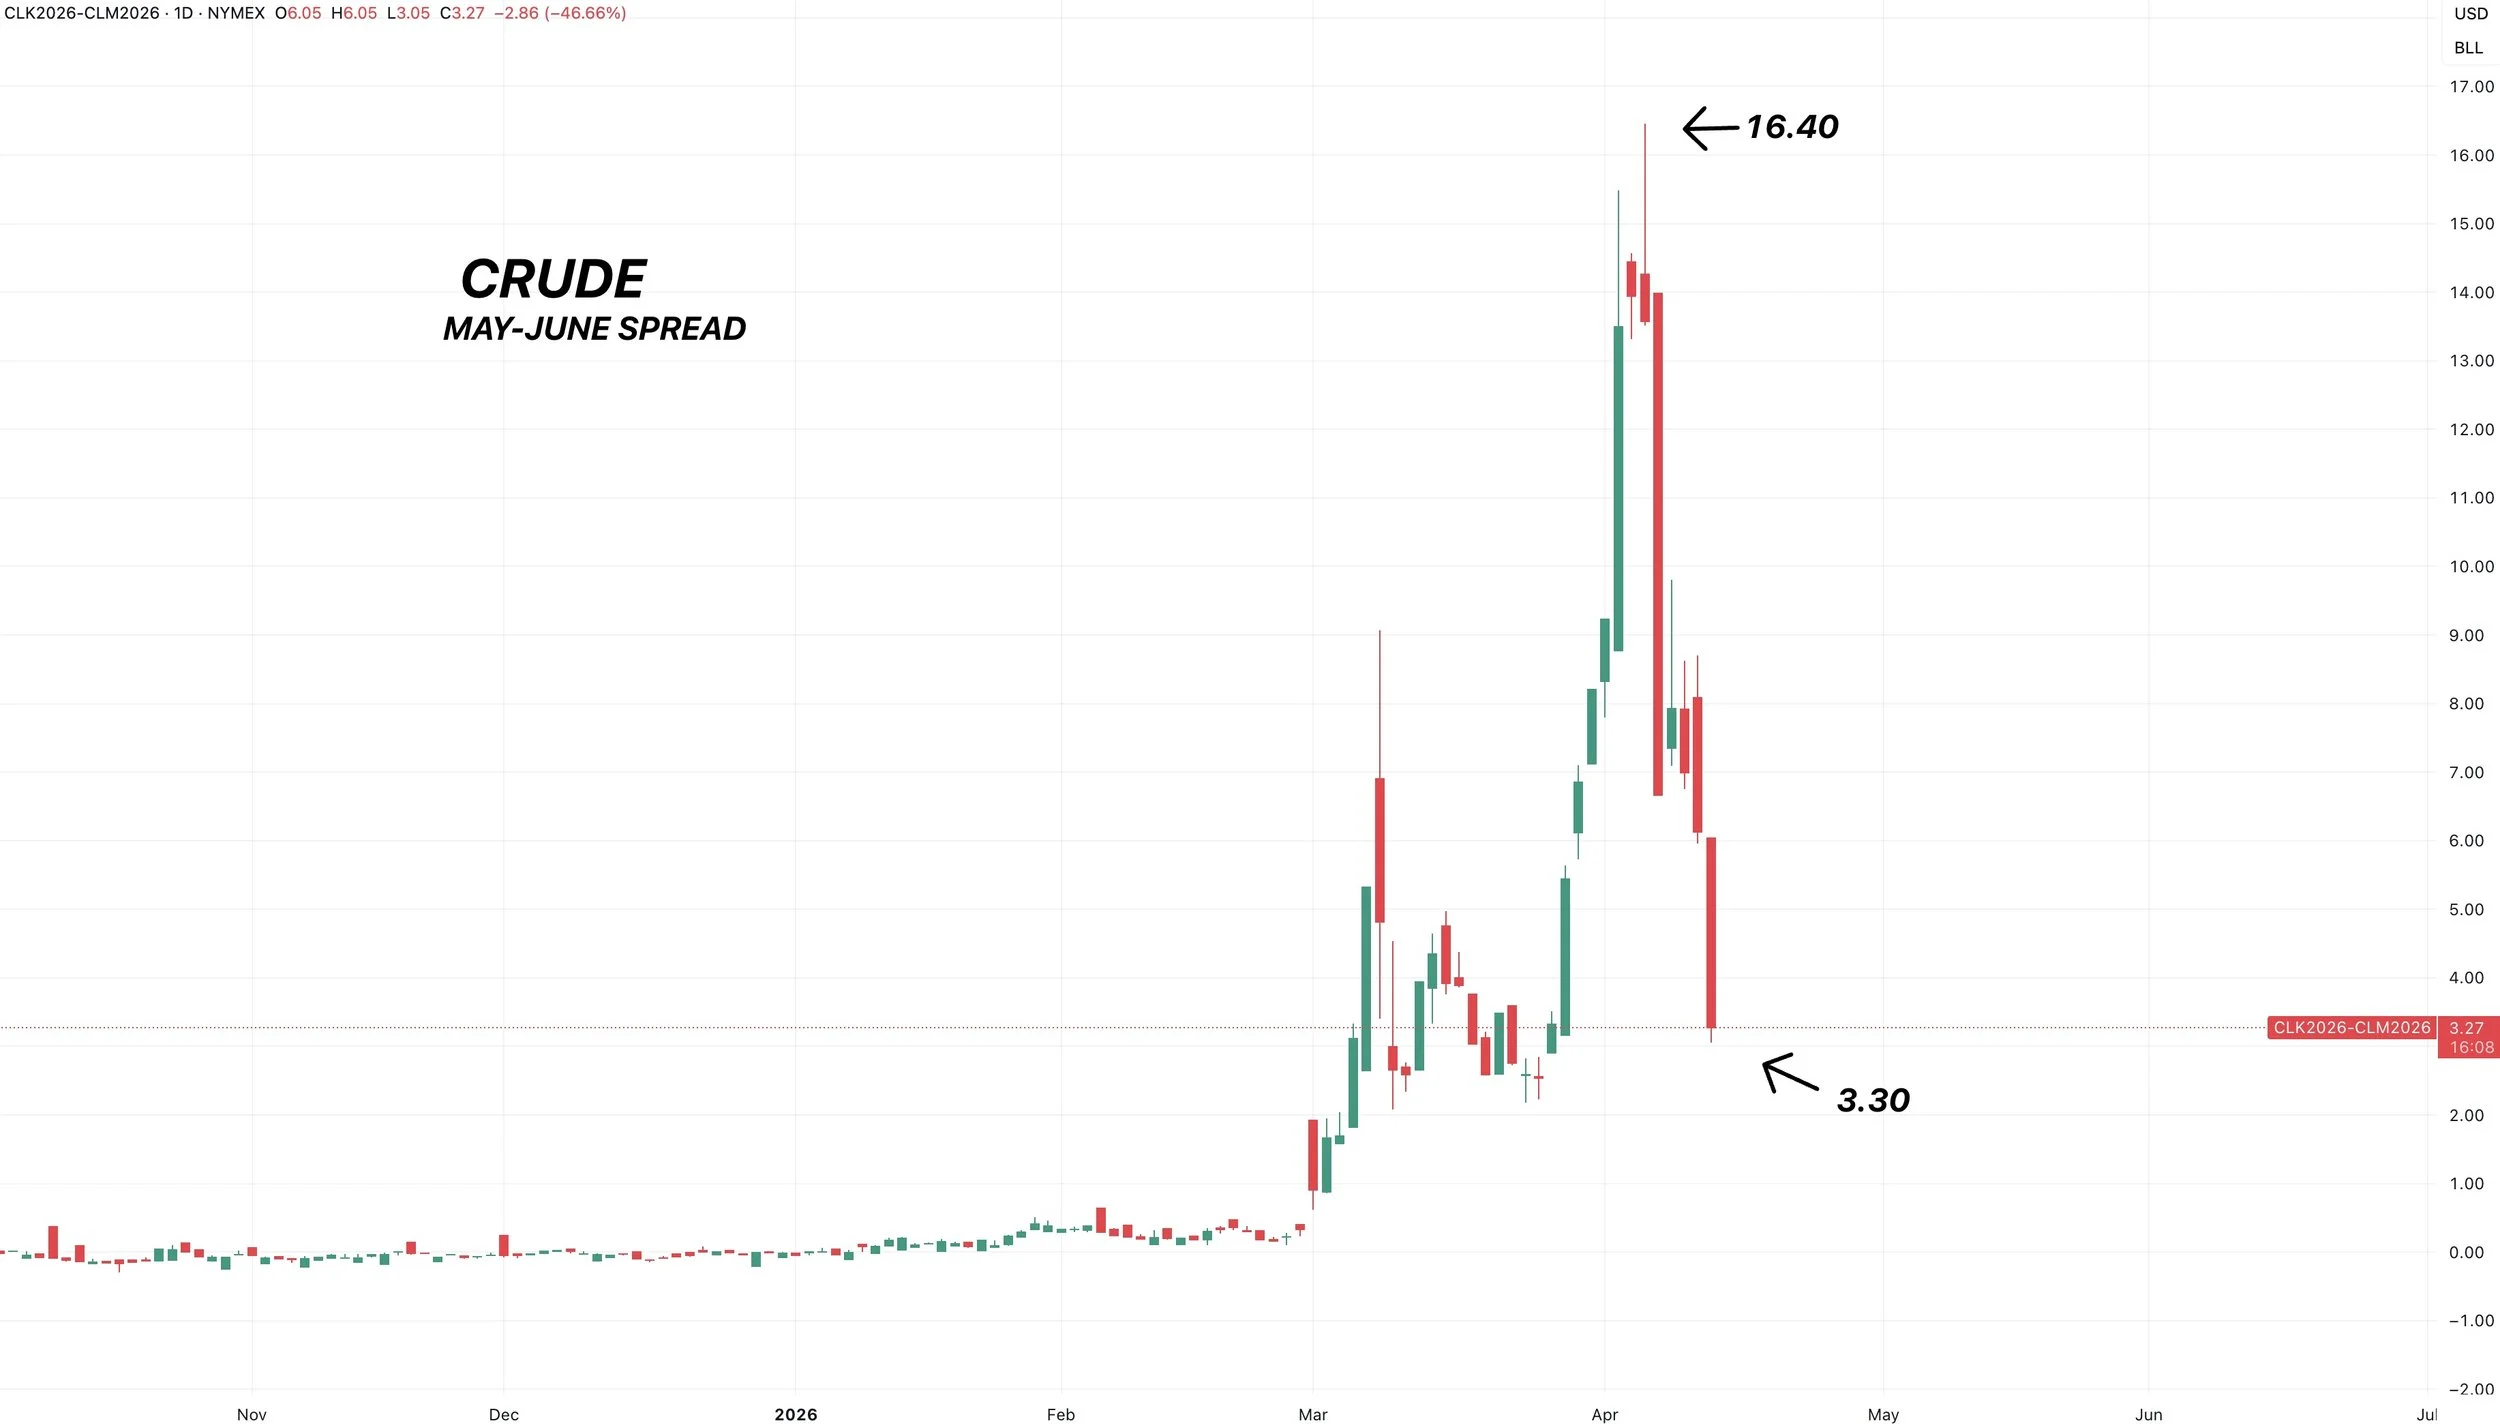
Here is the front month spread in crude.
This is one of the crazier moves you'll see.
We gave back pretty much all of that inverse.
When a spread unwinds like this, it can often be a sign that the major euphoria in a market is gone.
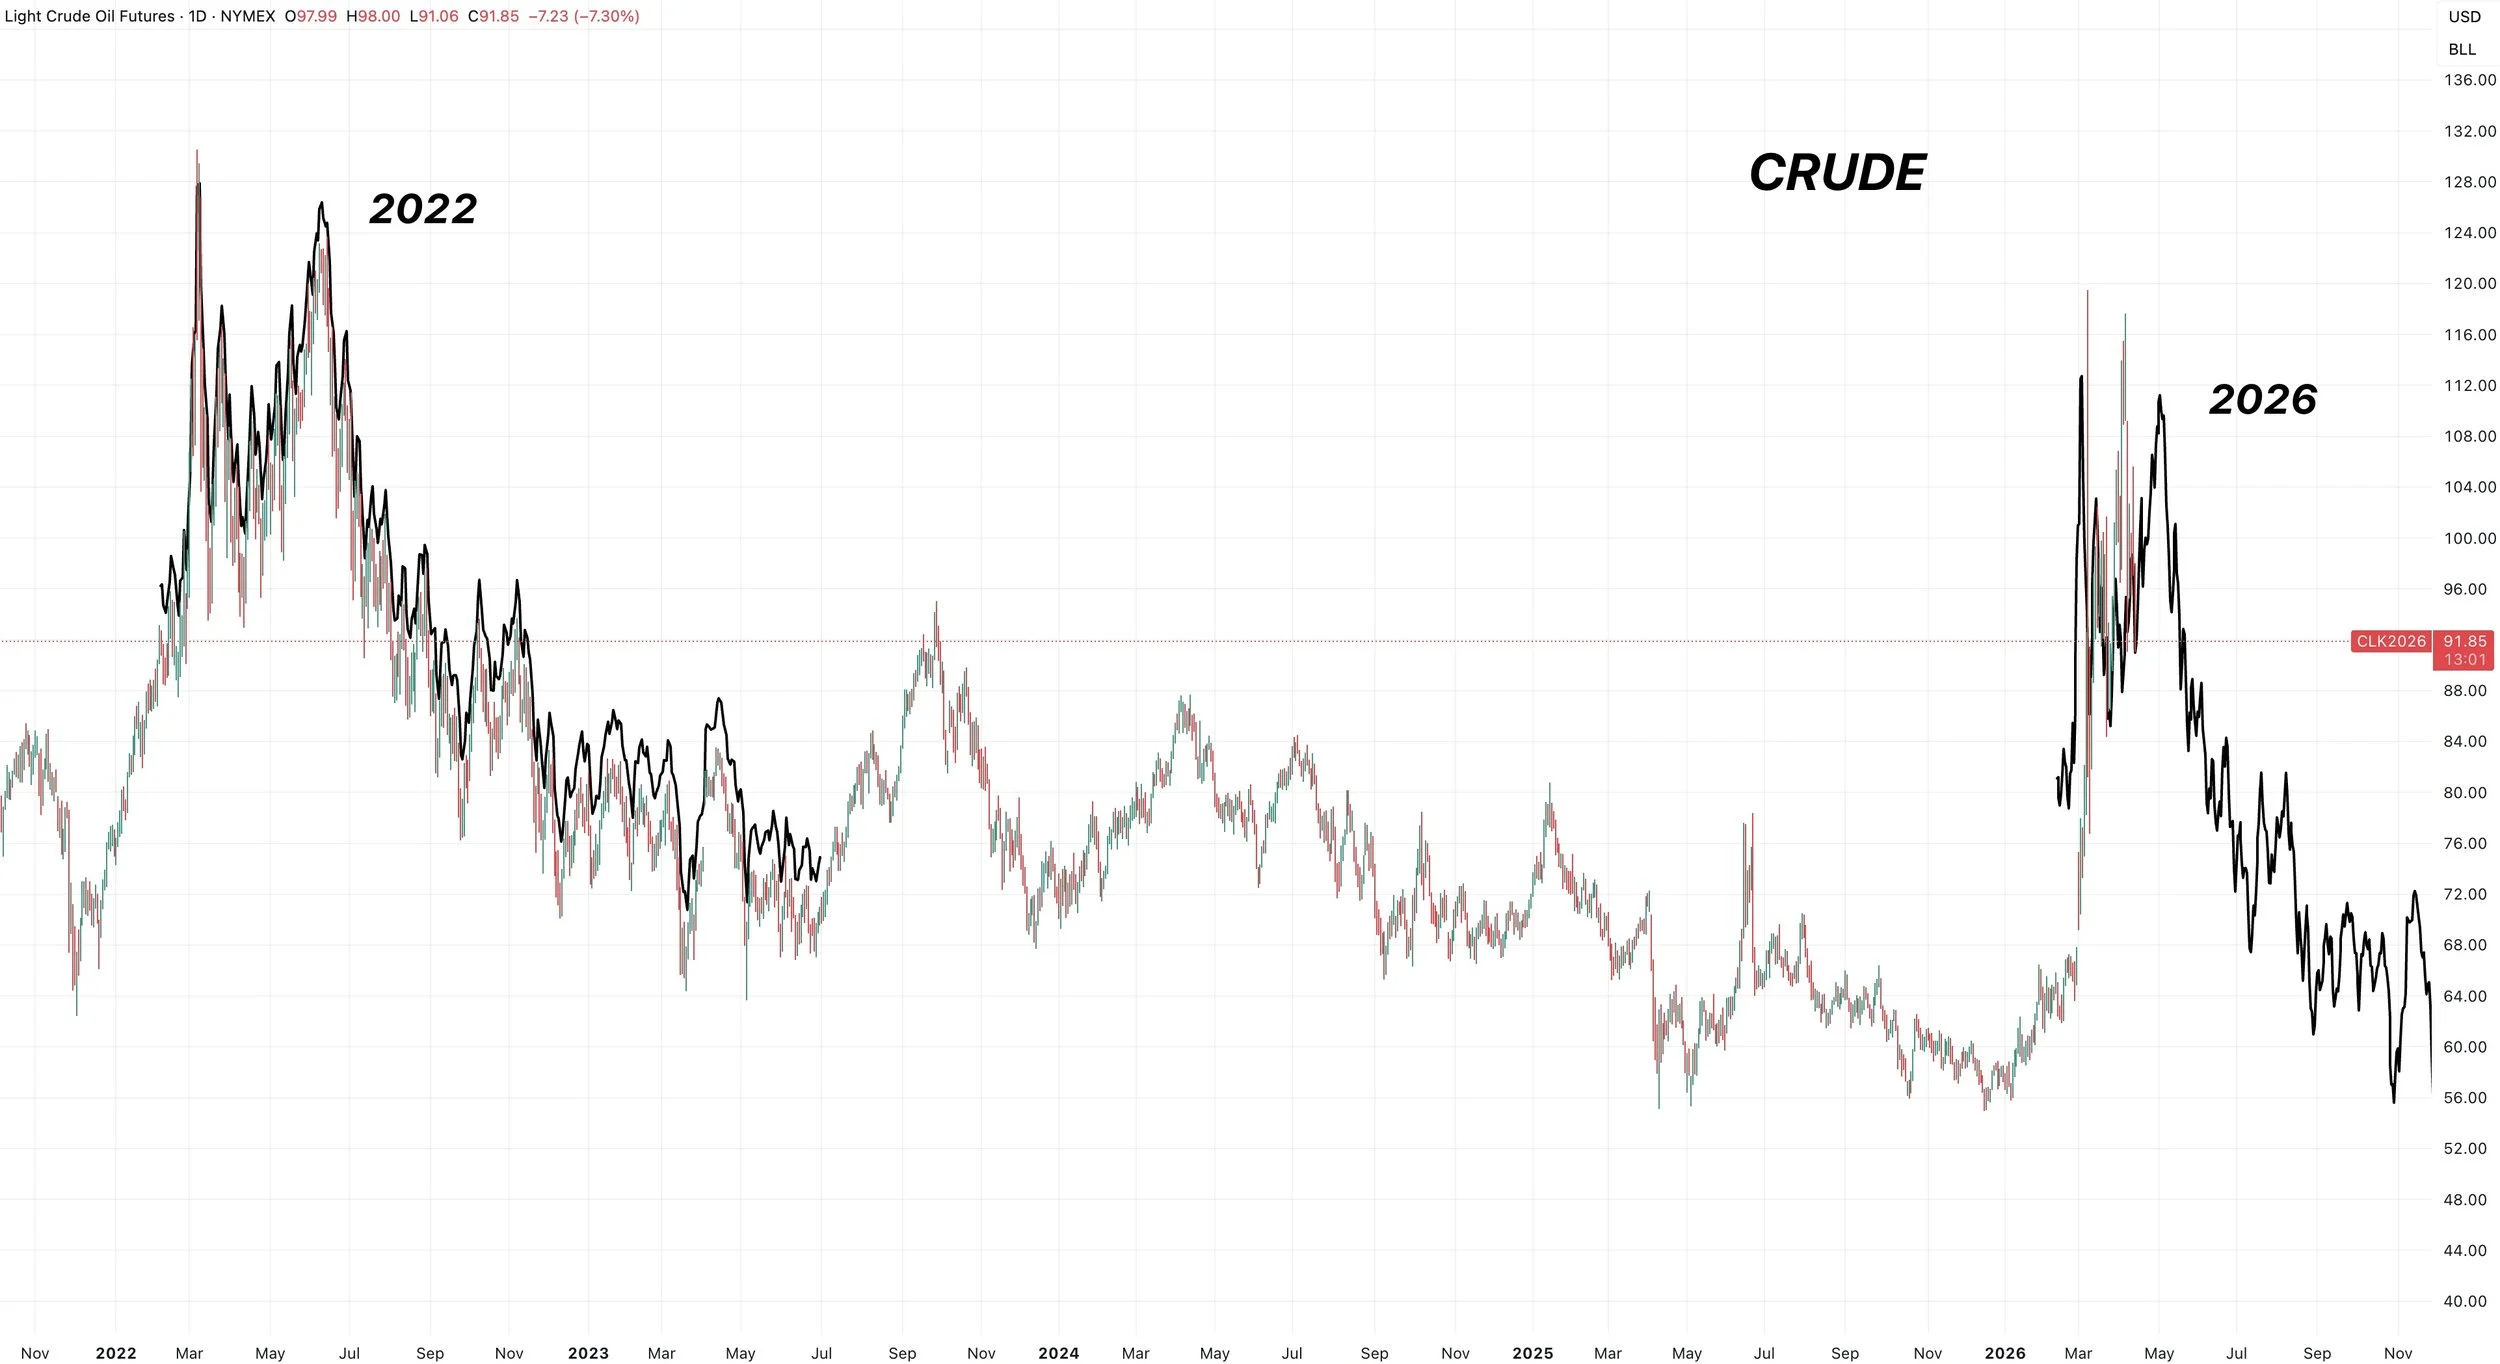
Here is what crude looks like if you compare it to 2022.
It doesn’t have to play out like this, but so far the price pattern has been eerily similar.
In 2022, we got the initial spike, we dipped, then ran it back to the highs before grinding lower the rest of the year.
In 2026, we got that initial spike, got the dip, and got the run back towards the high.
Inflation
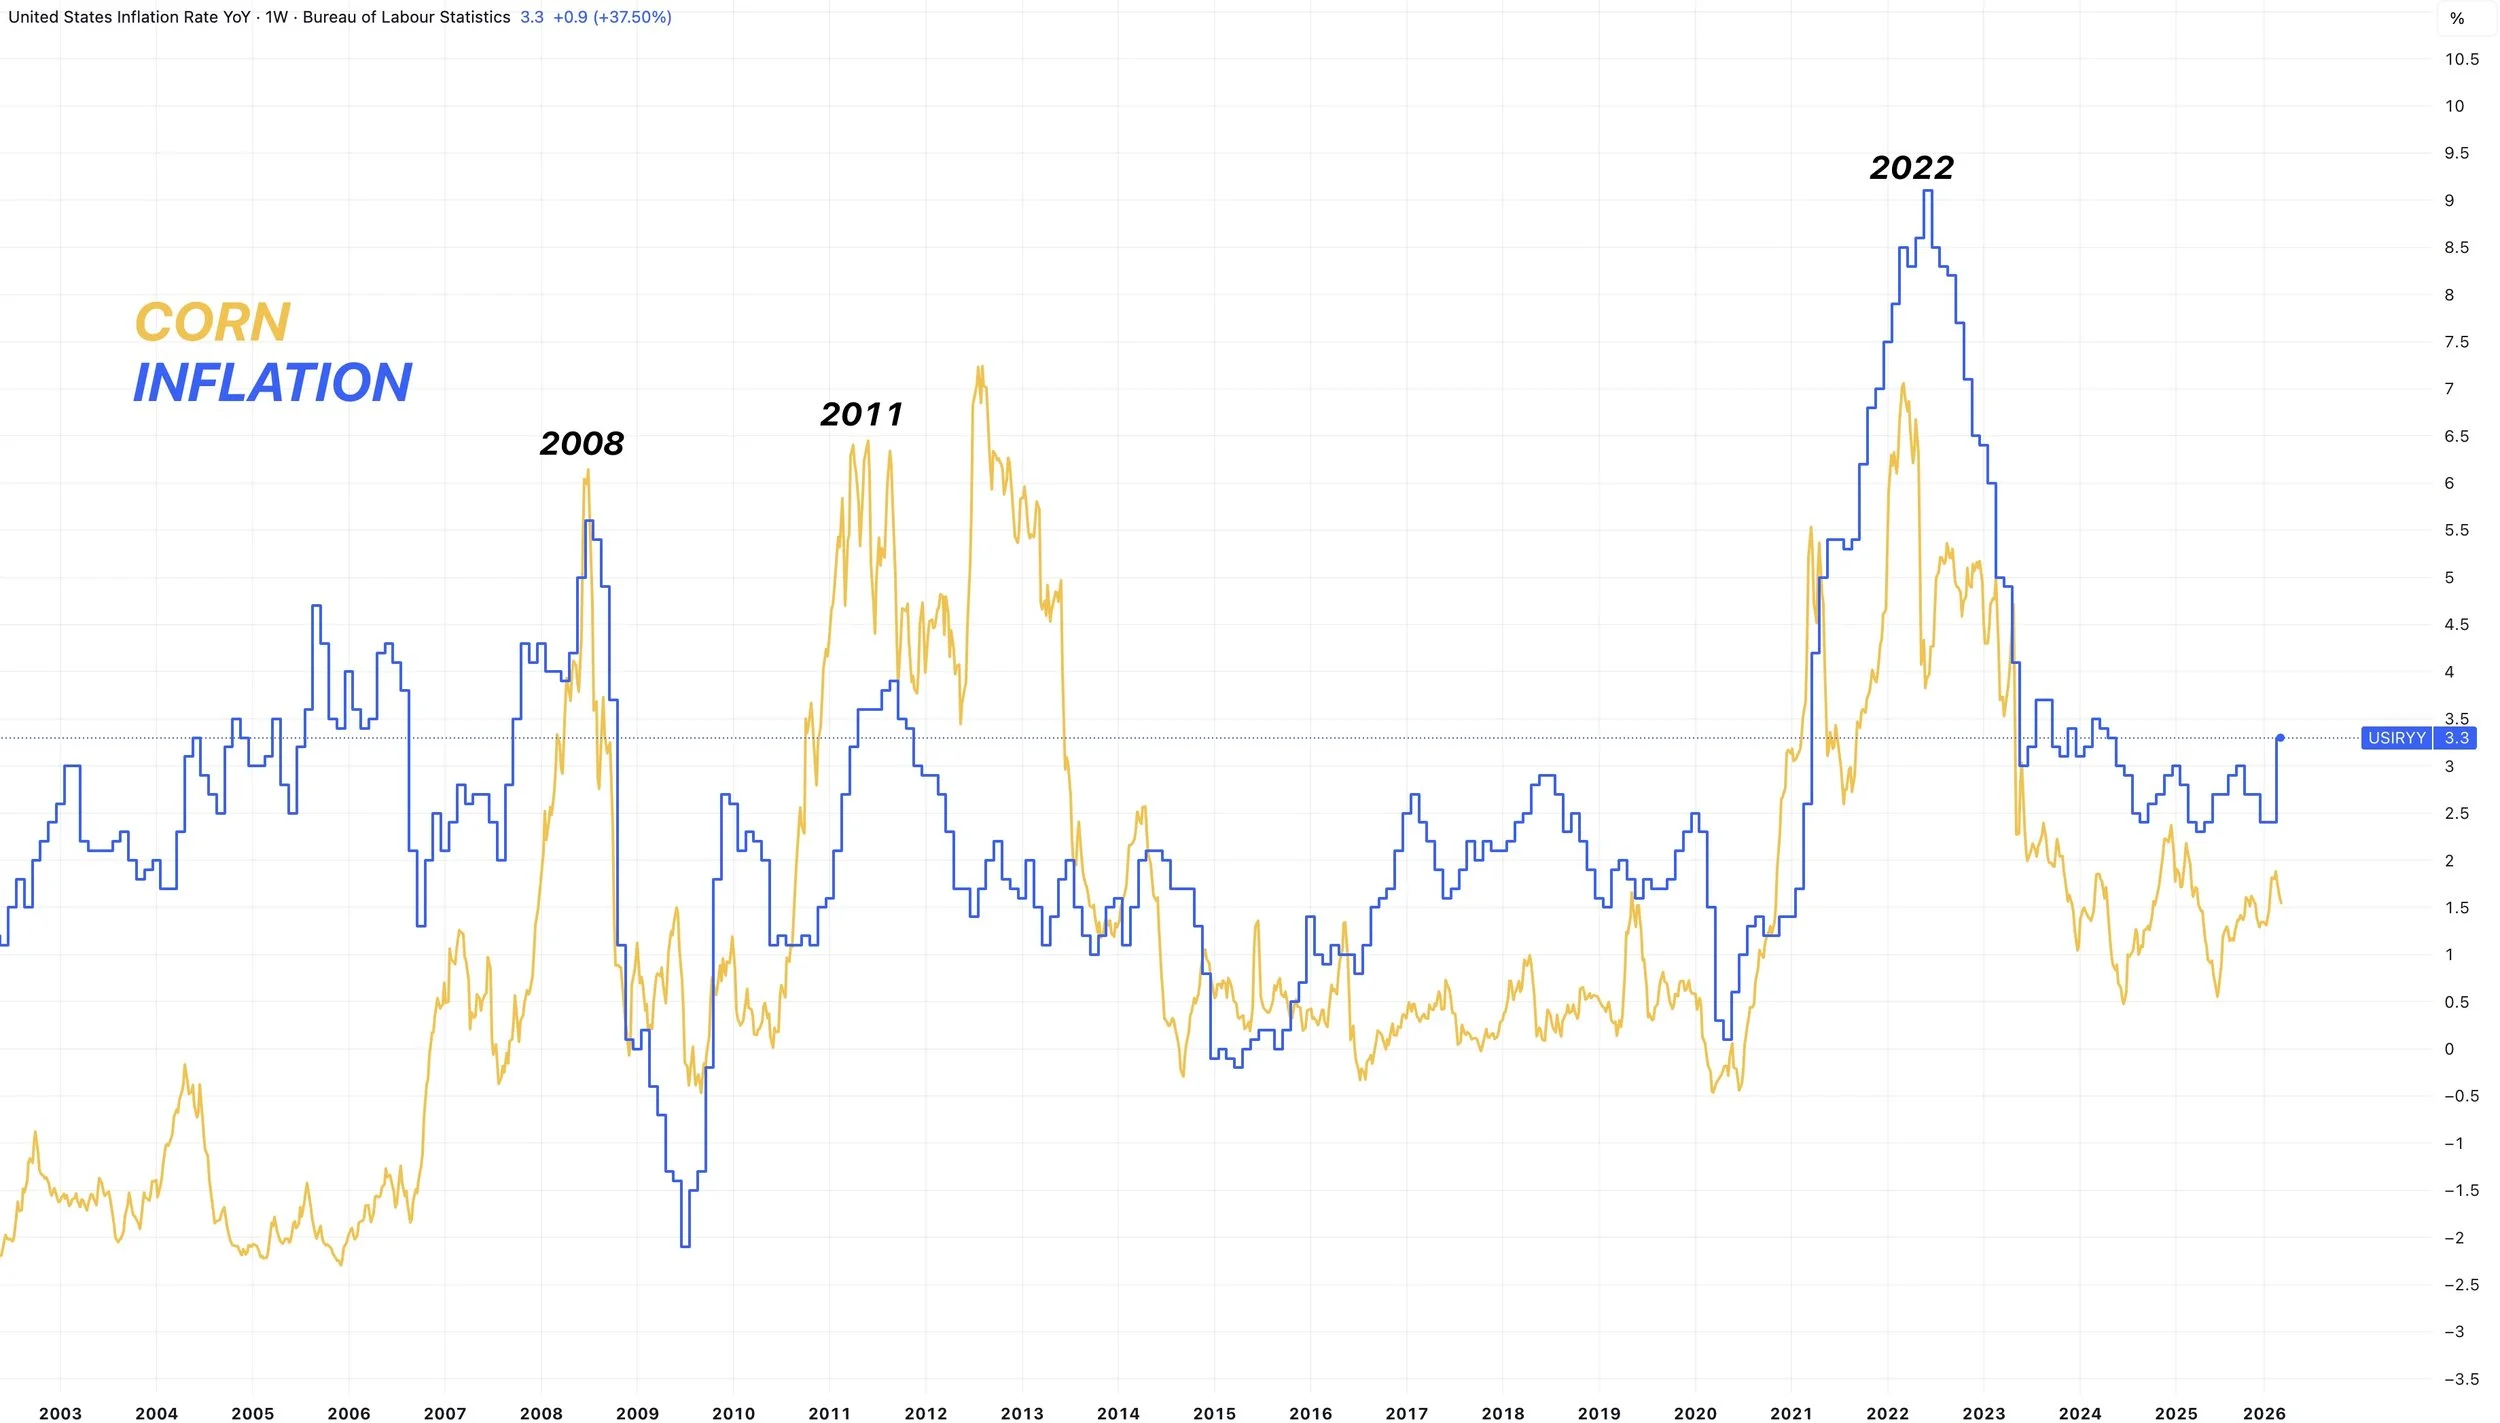
Inflation came in at 3.3% up from the previous 2.4%.
That isn’t crazy high, but it is the highest inflation rate we've seen since 2024.
I've talked about this countless times, so I am not going to go too into this today.
If inflation continues to ramp up, I am talking actually ramp up, grains will likely suit.
It's a "big if" and it will not be an immediate factor, but a possible long term factor if it happens.
The problem is that if inflation goes up, so does the cost of everything. Such as the cost to grow the crop.
But every "bull market" has been accompanied by a surge in inflation.
2008, 2011, and 2022 all featured high inflation.
Even though there were other factors such as the drought in 2012 and China buying back in 2021.
Today's Main Takeaways
Corn
I don’t have a ton new on corn today as there is just simply a lack of news as we get closer to that weather market and head further into planting.
I'm still skeptical that acres are actually 95.3 million.
Since 2018, the March acres have only came within 1 million of the final acres once.
The only time was back in 2024, they were 900k off.
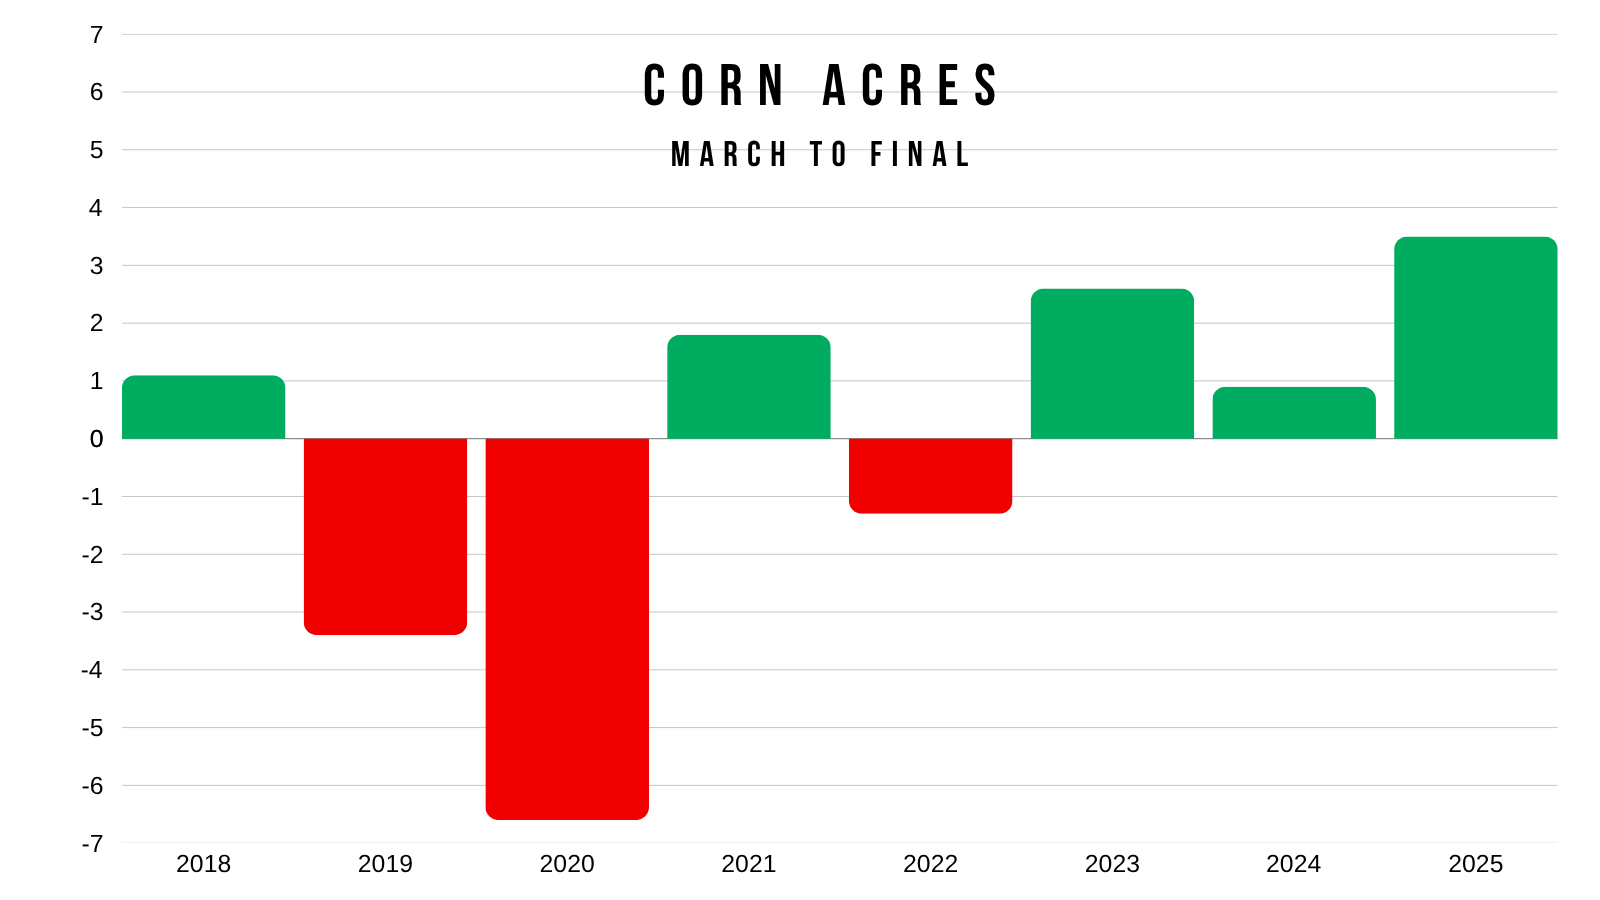
The problem is that we won’t get a good grasp on the actual acres until June.
By that time, the weather market is typically over.
As we seasonally fall out of bed after June, if there aren’t any issues with the crop.
A change in acres later this year might make a bigger impact on old crop next year if they do eventually come down. As it wouldn’t be realized on the balance sheet until later.
The same could be said about the fertilizer situation. It very well could have a larger impact on next year's planting decisions if it stays high. As I can’t imagine fertilizer is going to be exceptionally cheap by fall, even if the war situation gets fixed.
From here weather and war are going to be the biggest drivers.
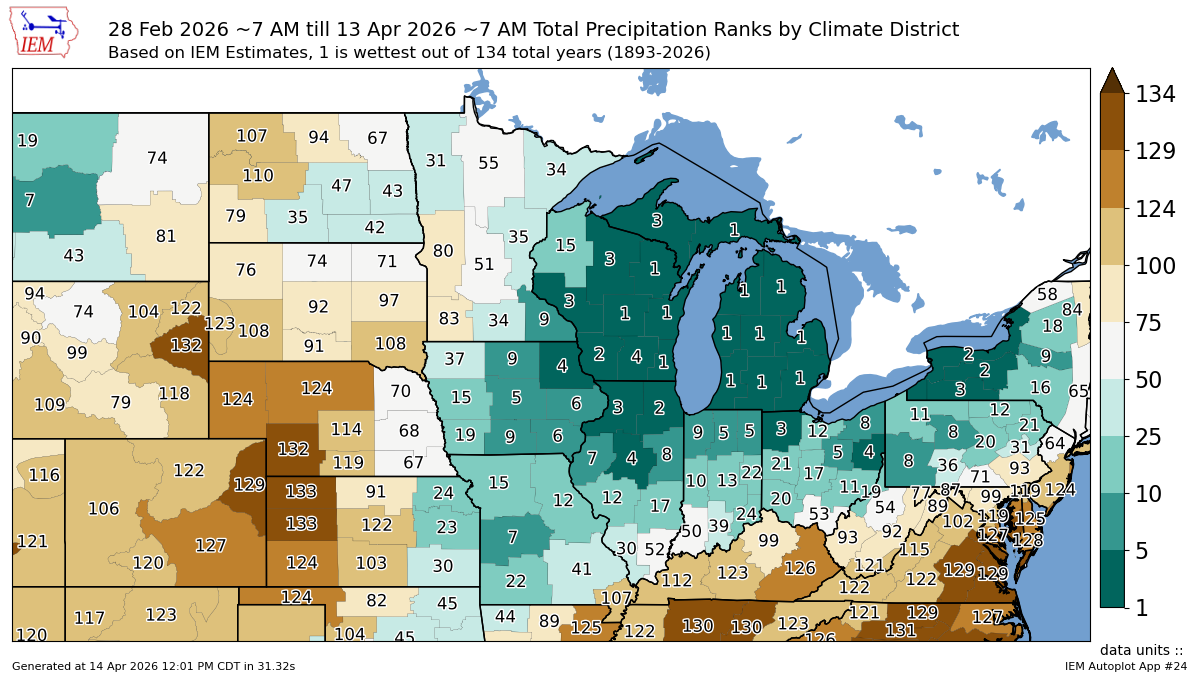
As for weather, we just had one of the wettest starts to spring we've ever had for the I-states.
There is still a ton of talk surrounding this possible "Super El Niño".
From what I've gathered, it just means some areas will be way too wet while others will be starving for rain.
Who knows how all of that will actually shake out.
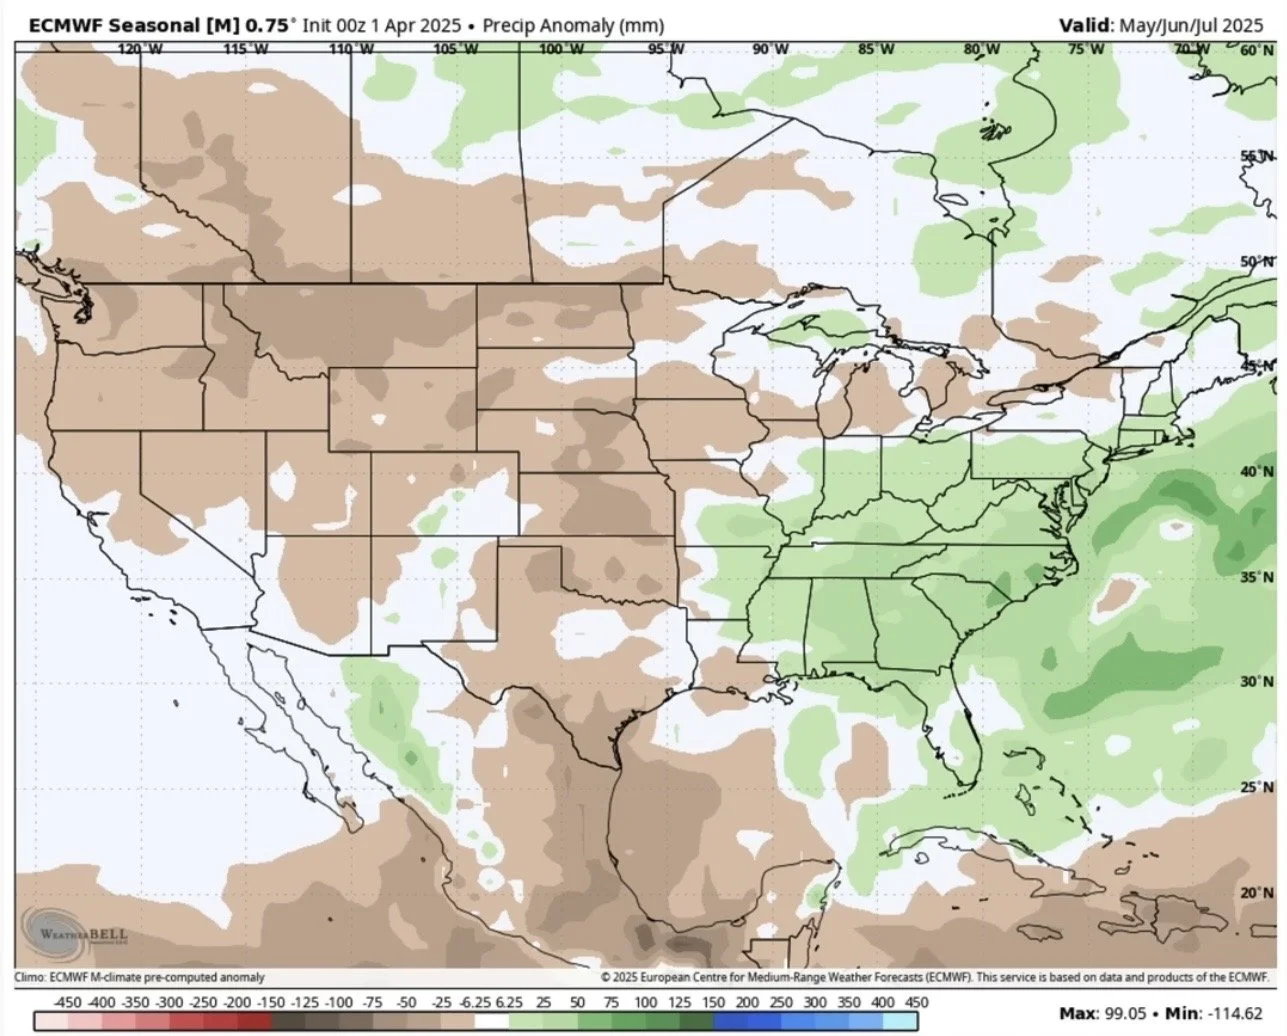
But right now the outlook for summer does look pretty wet for the central US, with dryness down in the southern to eastern corn belt.
Here is the outlook for May to July.
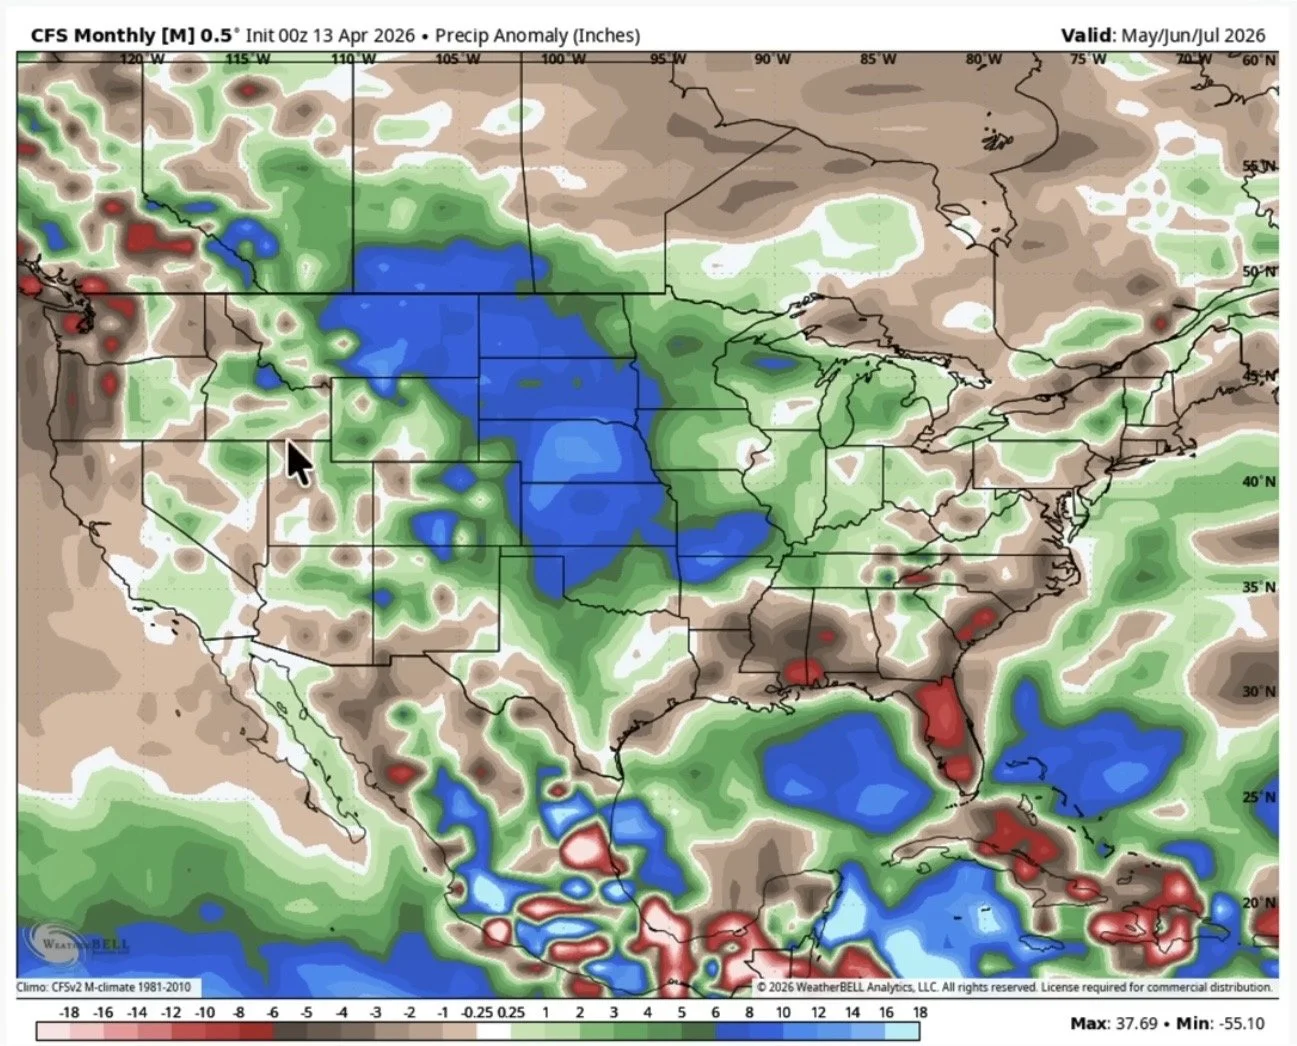
So the story might not be drought, but could potentially be a too wet problem.
But as always, you have to take any of these forecasts beyond a month with a complete grain of salt.
I was listening to a weather guru today and he said they wouldn’t have a good idea on how summer and this whole "Super El Niño" will shape up until May.
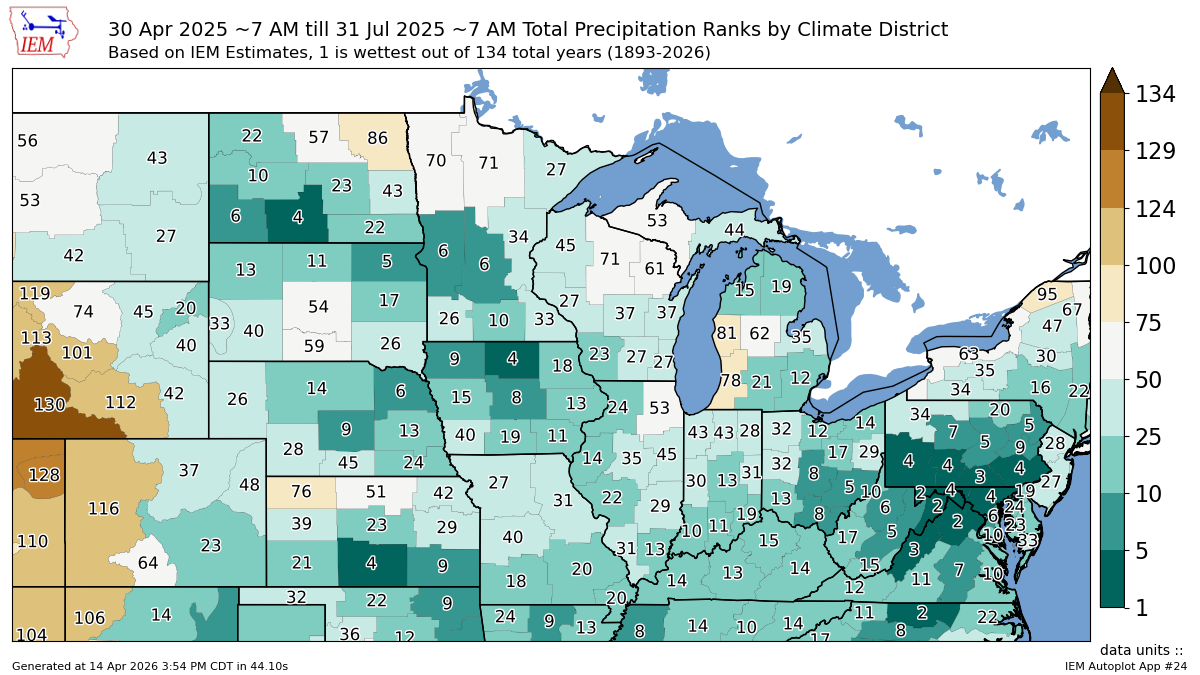
Here was what the May to July forecast looked like during April last year.
It was calling for a dry summer in the western corn belt.
Here was the actual precip rankings for May to July last year.
It was not even close to what the forecast was predicting. With plenty of rain across the entire corn belt.
So you can’t put much faith into the summer forecasts yet.
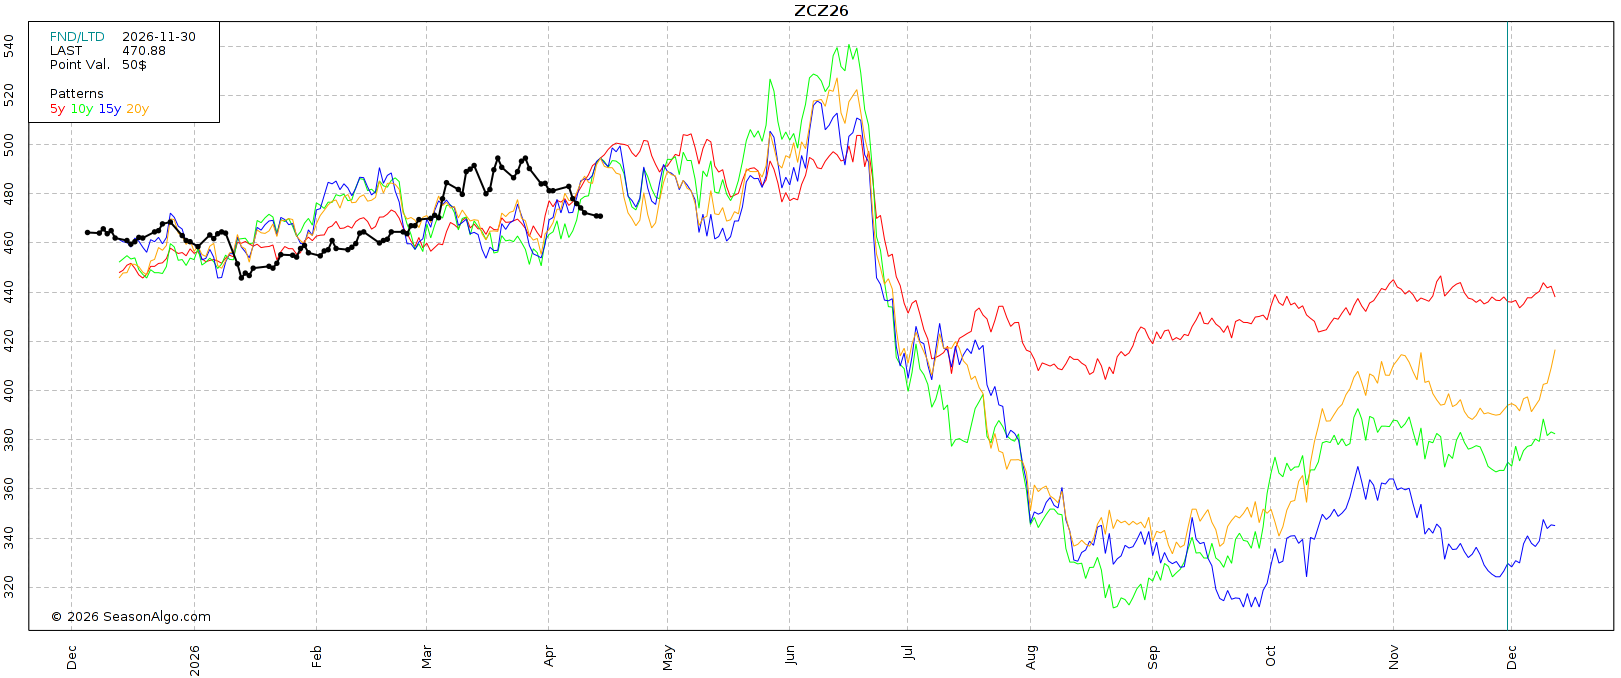
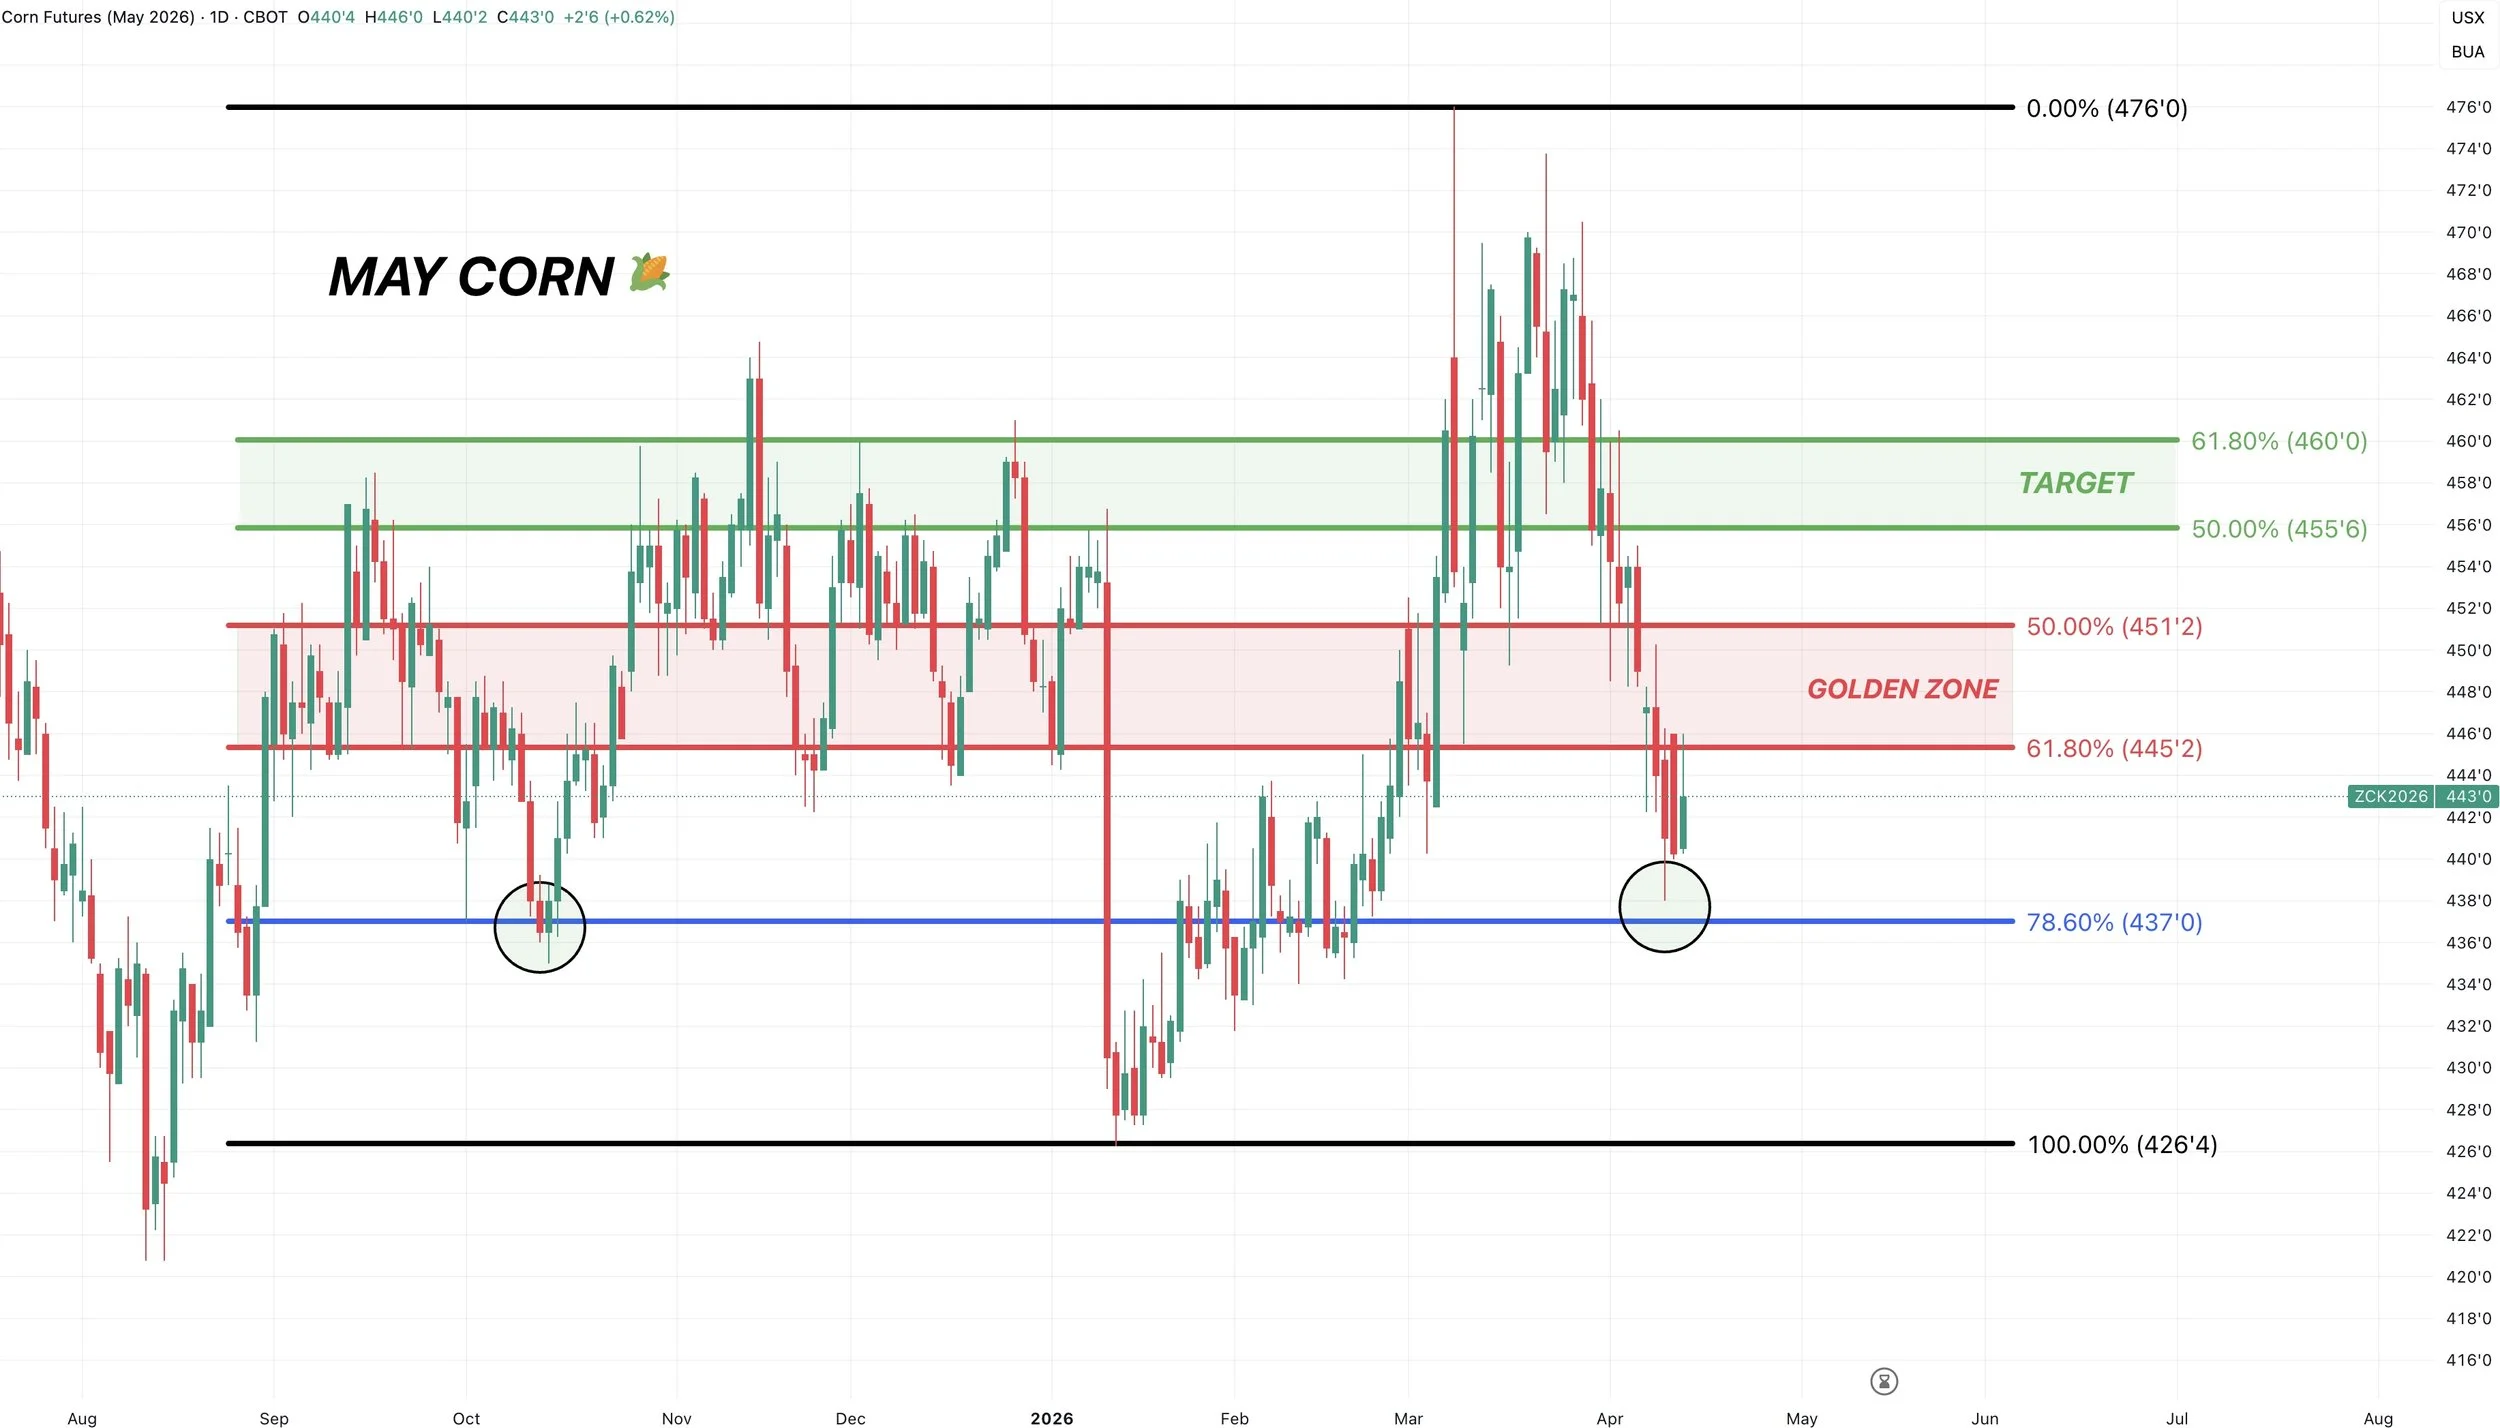
May Corn Chart:
I still think we are at the very least due for a relief bounce.
The story is going to be in new crop moving forward, but May corn is sitting at it's last line of defense before contract lows.
We will be looking to reward any sizeable bounce towards $4.55 to $4.60
That area lines up with that prior resistance from fall as well.
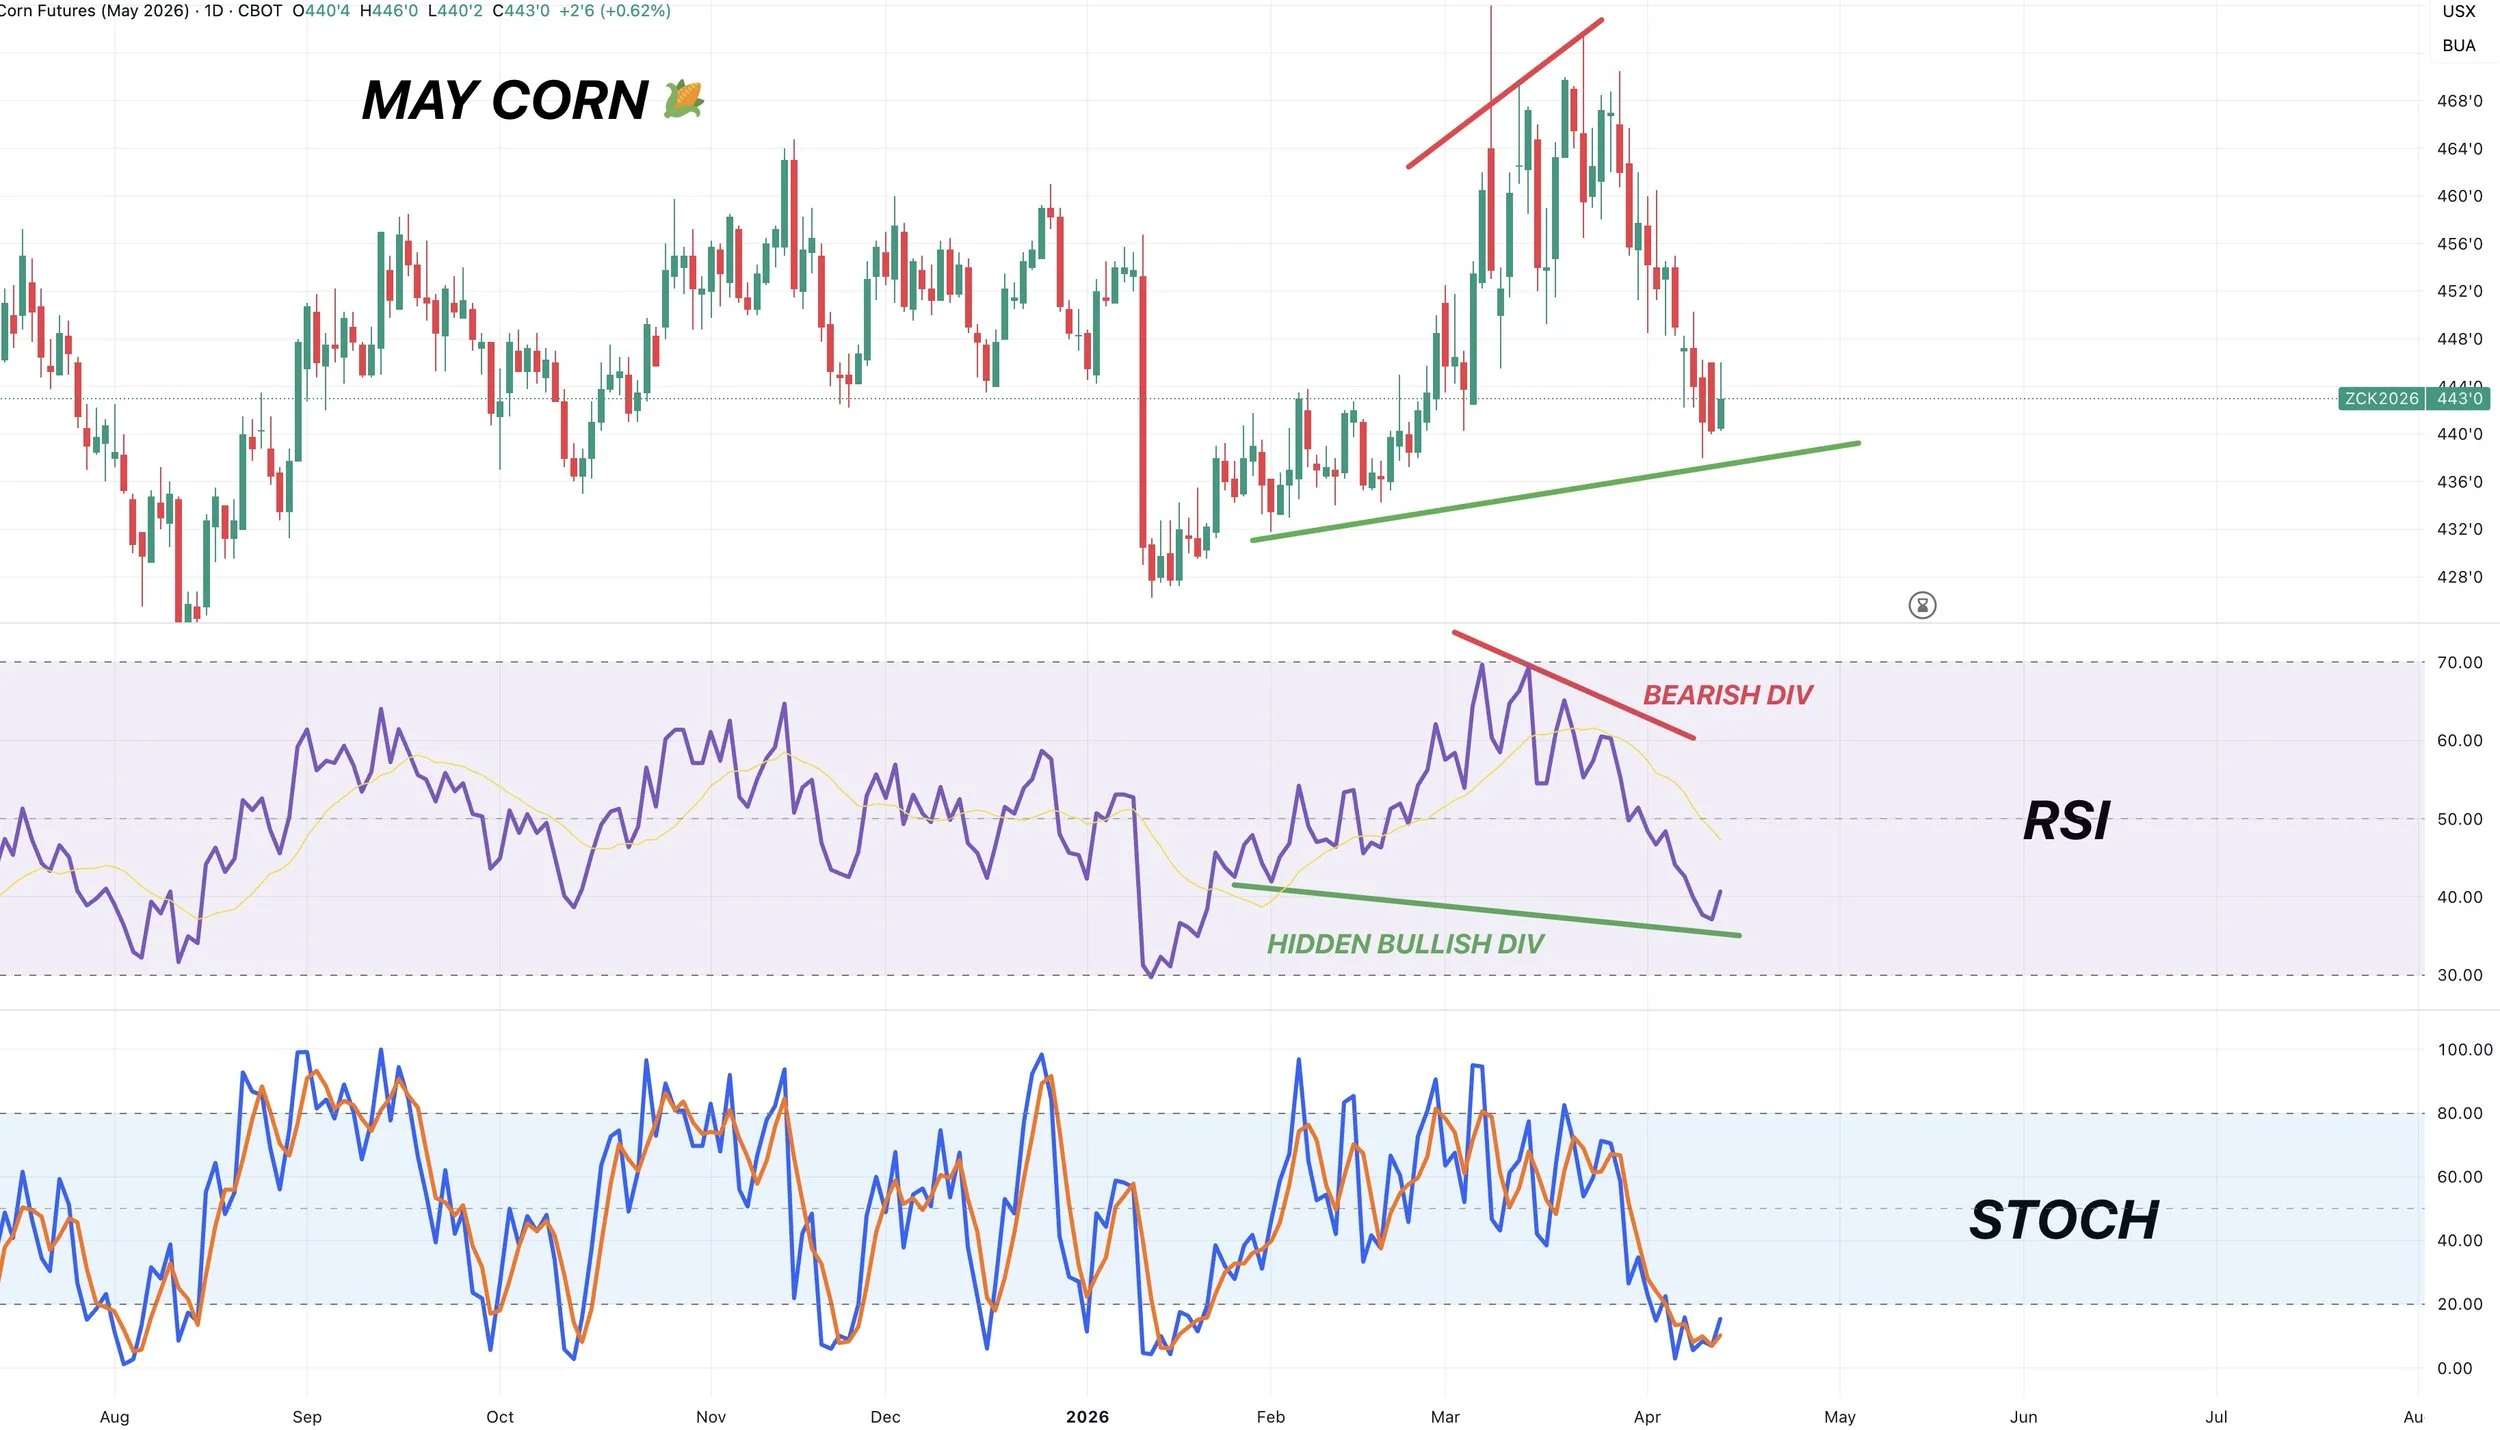
May Corn Indicators:
We still have some potential hidden bullish divergence. With the RSI posting new lows while prices have not.
The last time we were this oversold was after that January report.
We are also now in oversold territory on the stochastics.
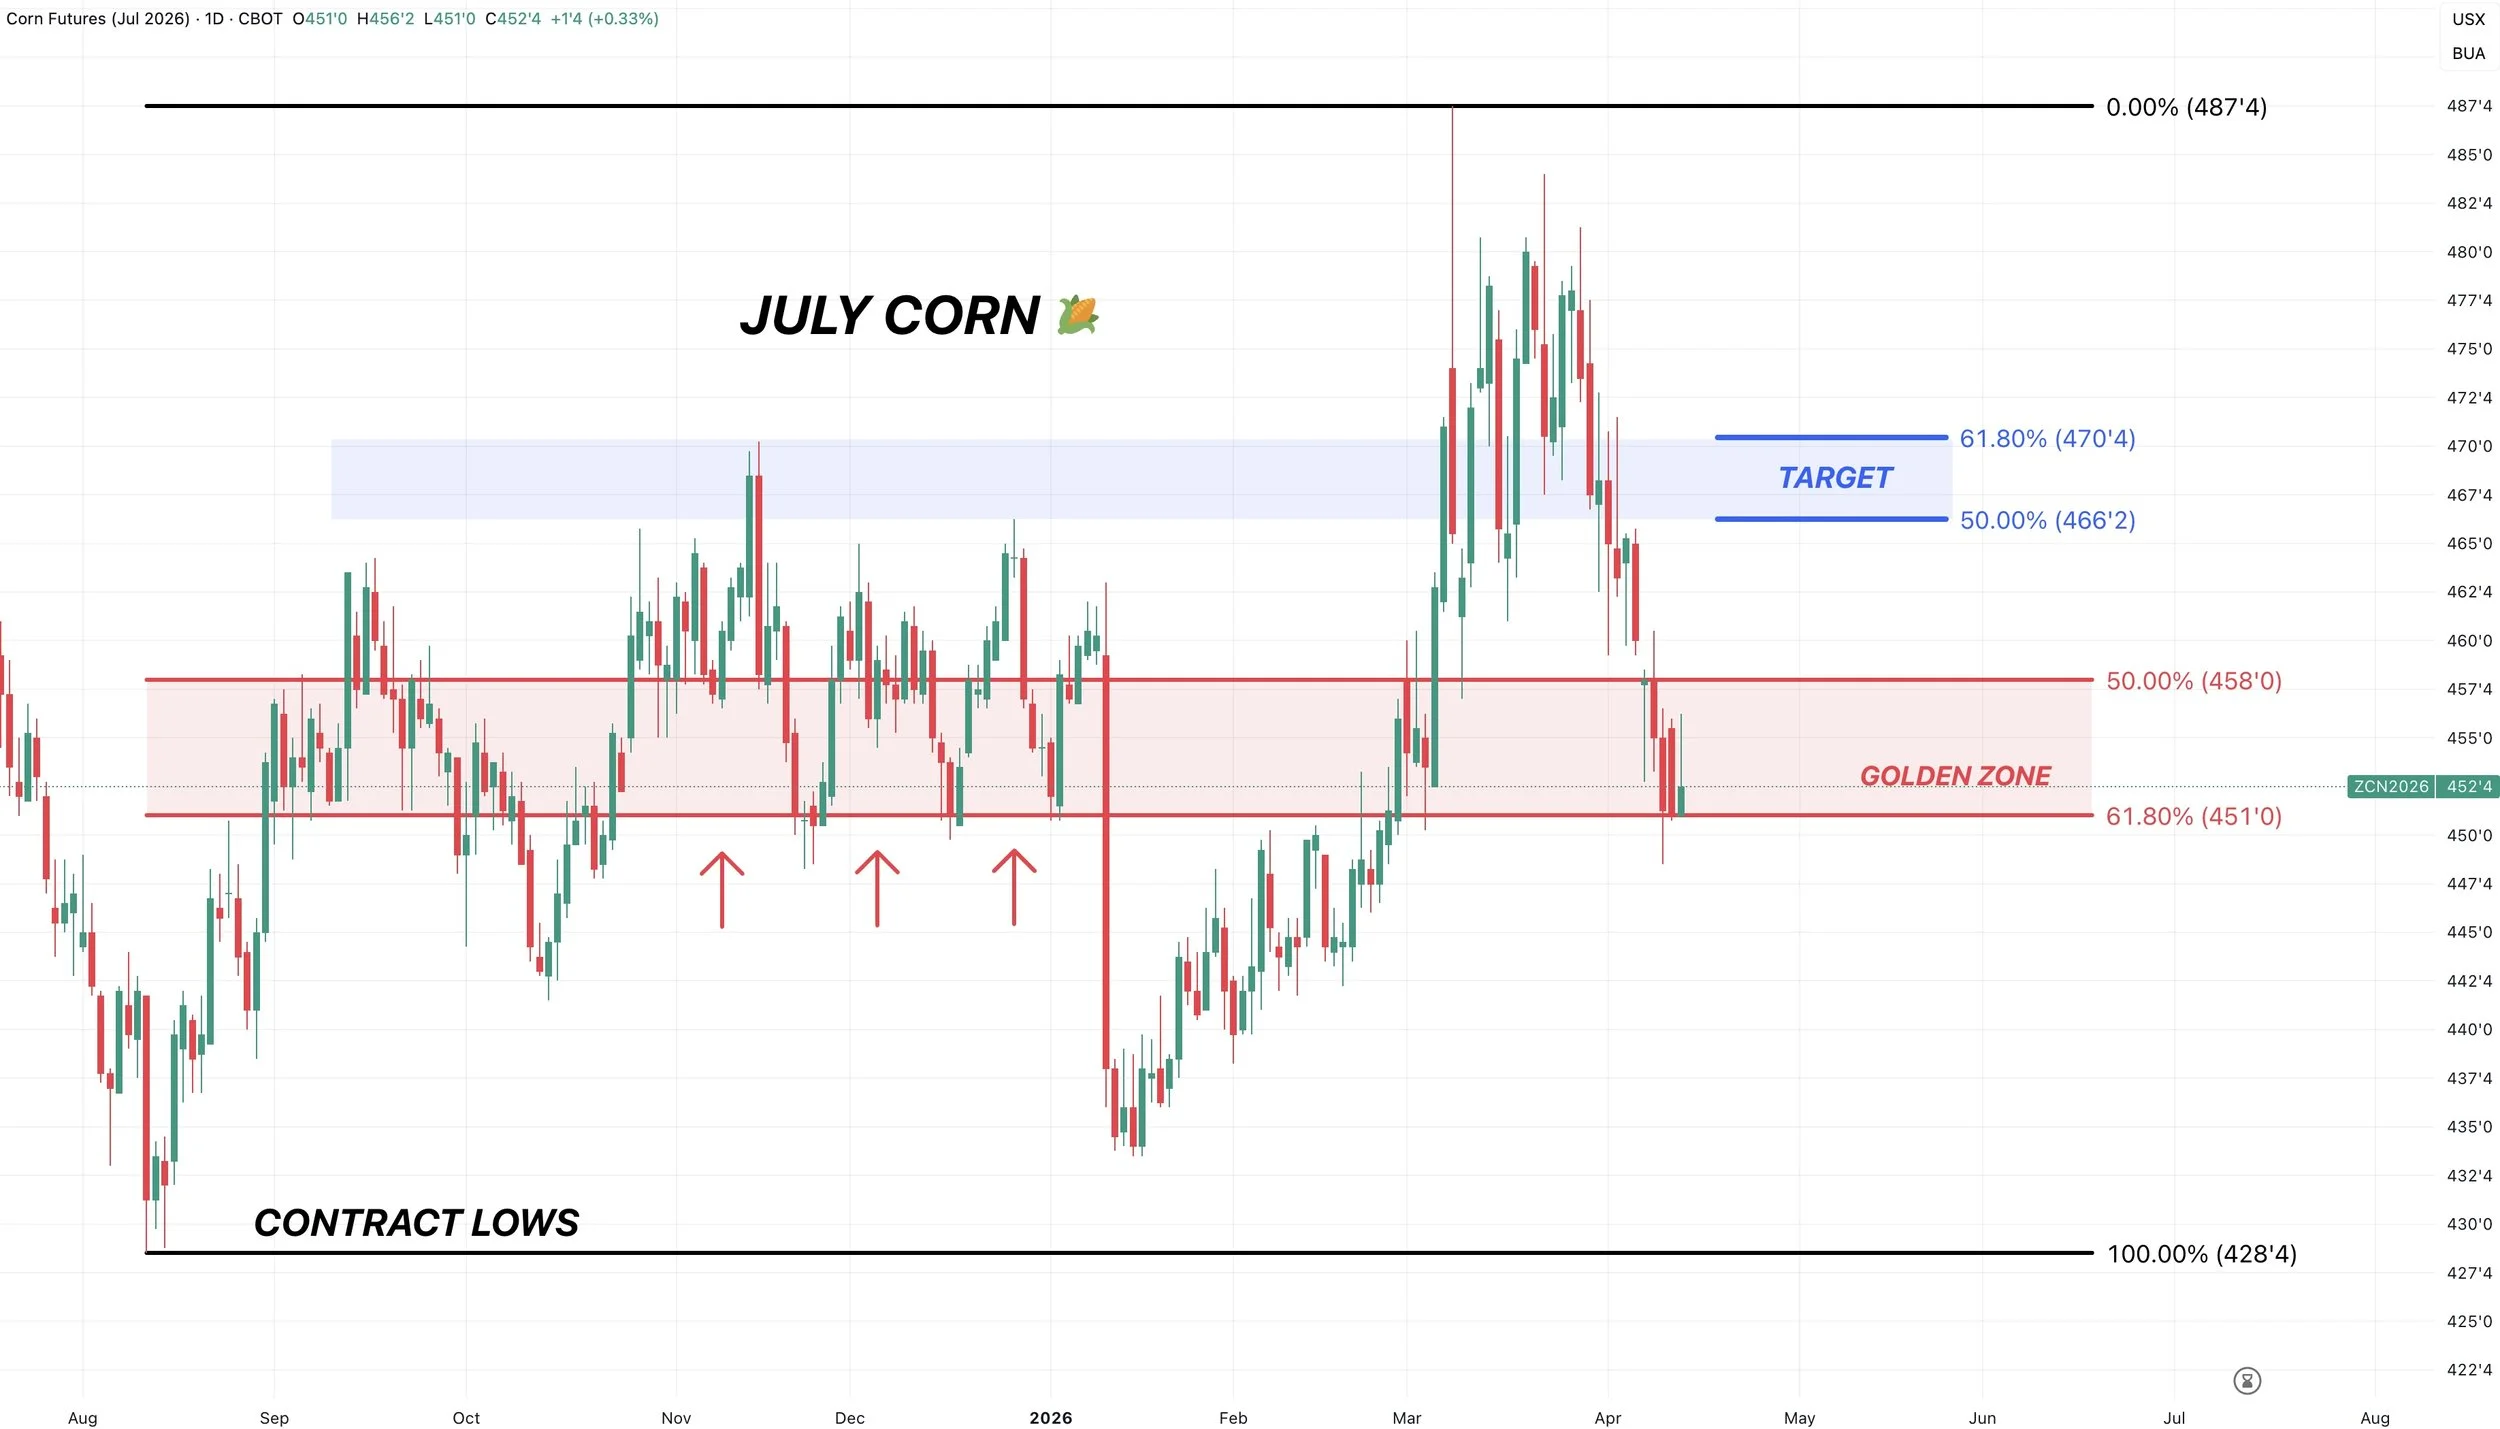
July Corn Chart:
Still hovering right at that golden fib from the recent highs all the way down to the contract lows.
This same level is key support from fall.
If we are going to bounce, here would make sense.
If not, it opens the door lower.
Looking to reward a move towards $4.65 to $4.70 if it comes.
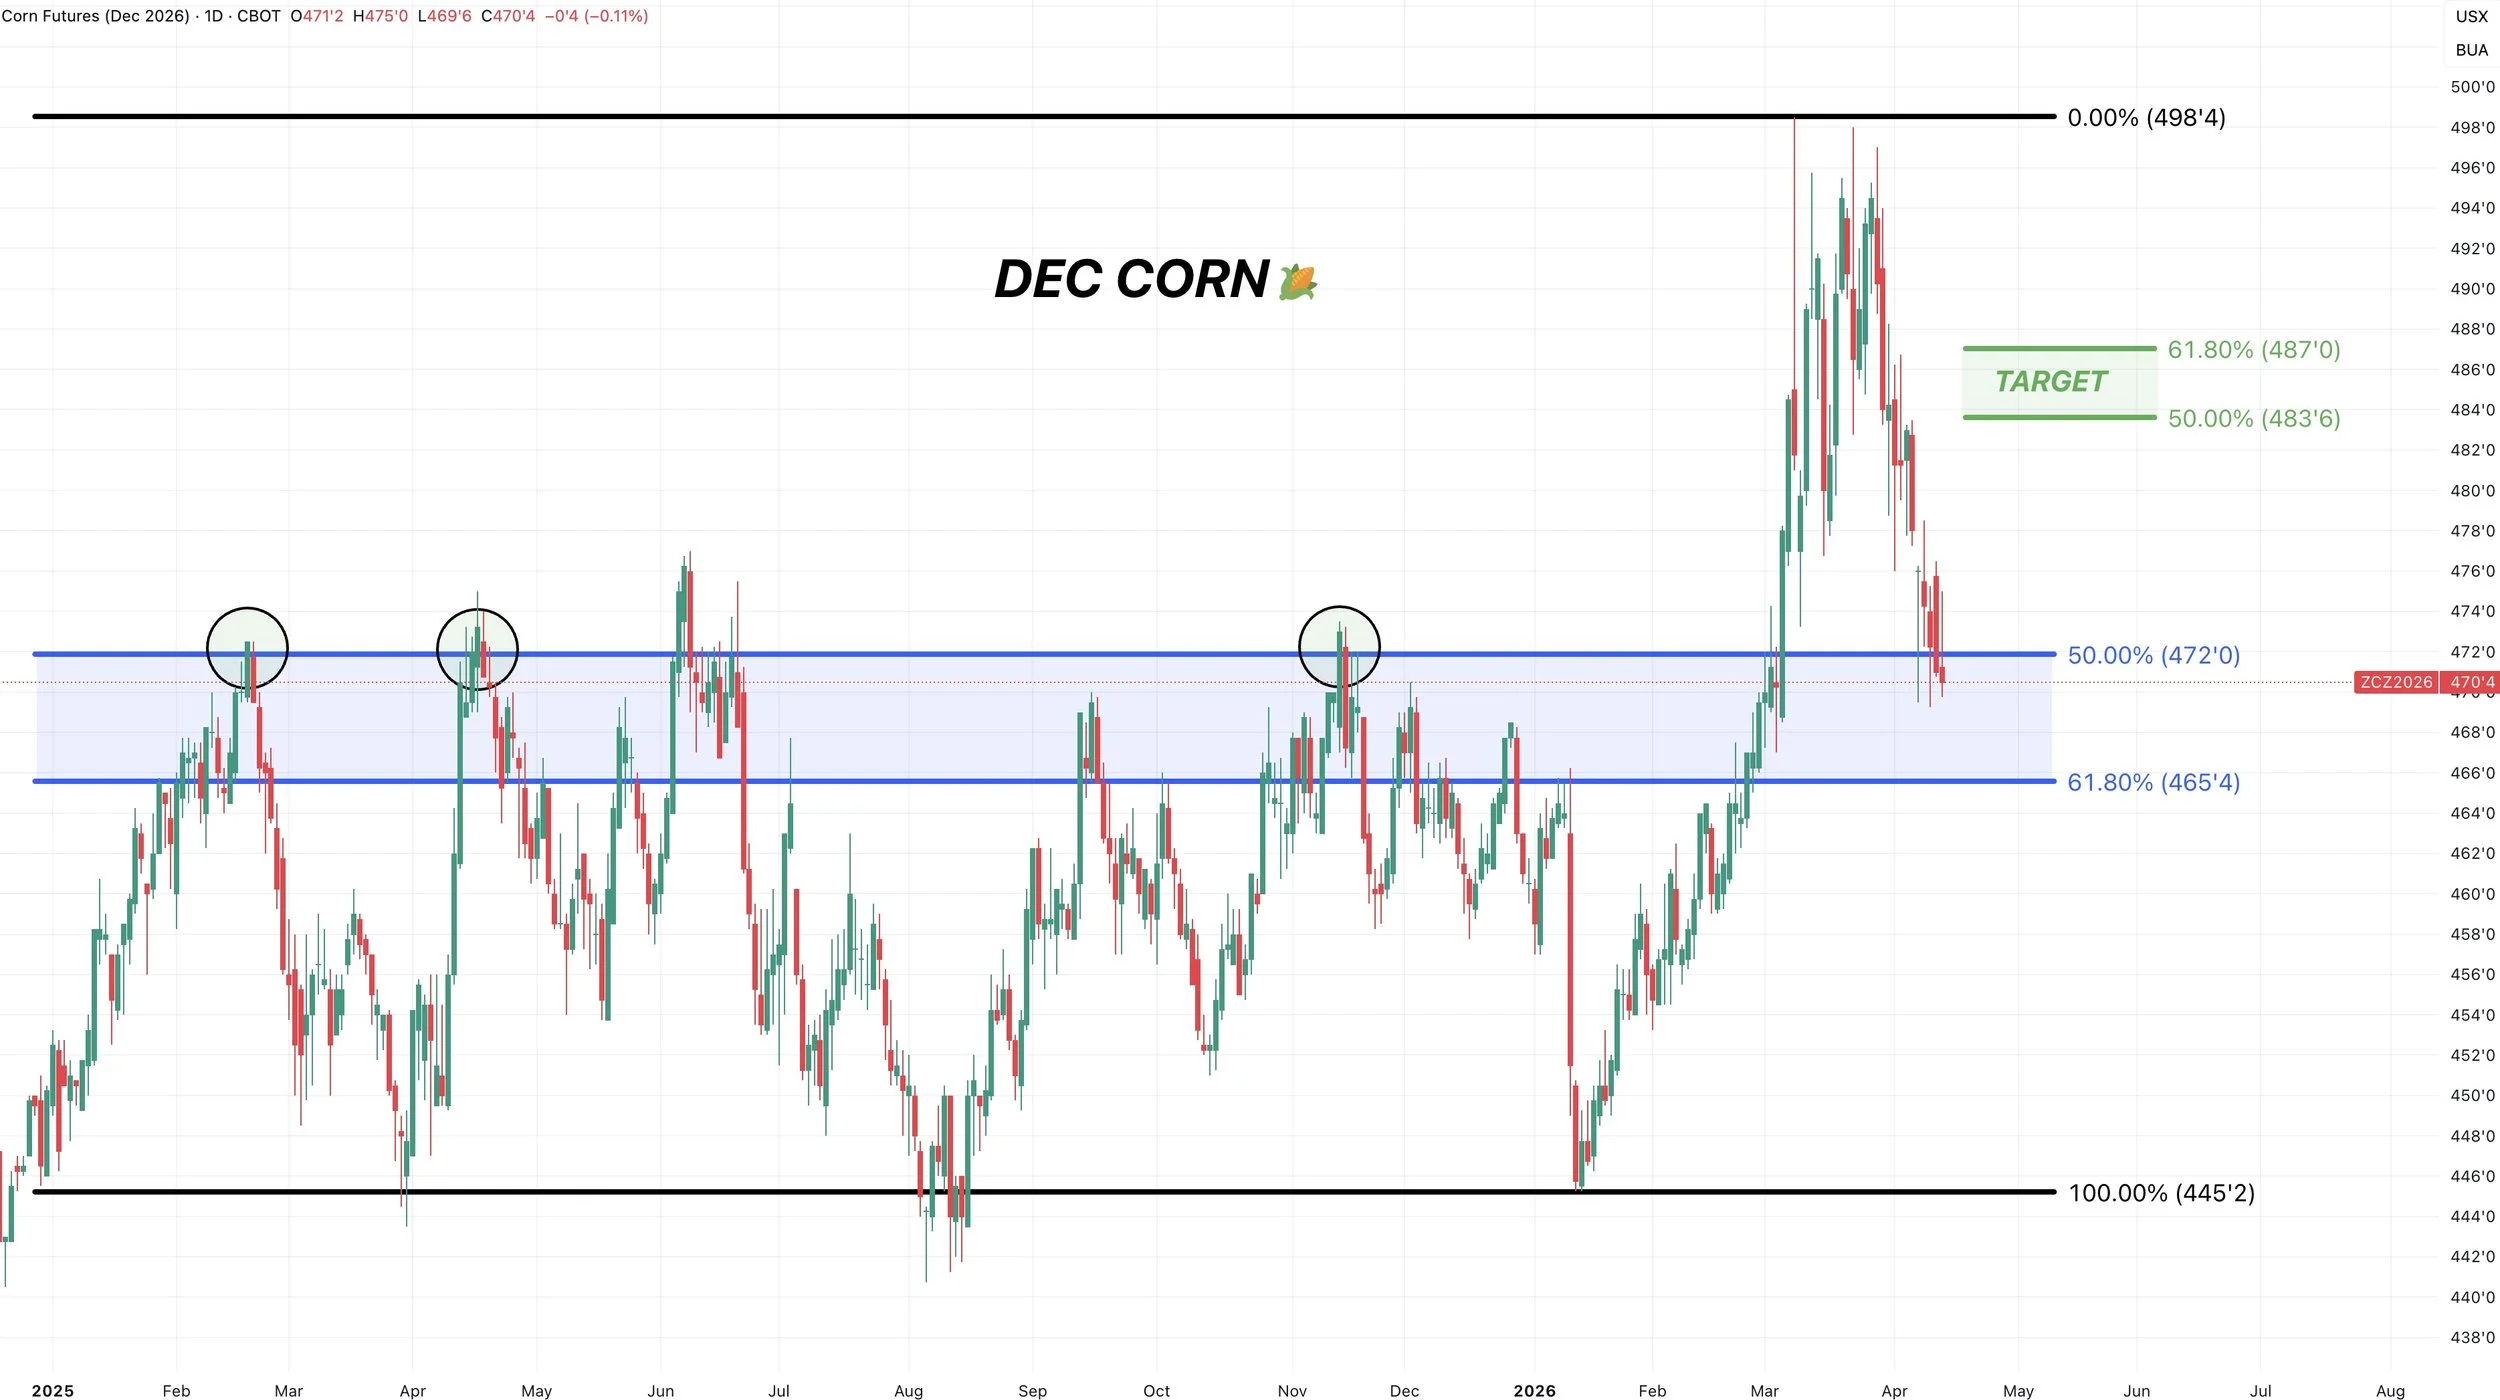
Dec Corn Chart:
Sitting right at this golden zone.
The same area where this market failed to break through on several rally attempts.
Again, it would make sense to find a bottom between here and $4.65.
If we get a bounce towards $4.84 to $4.87 we will want to reward it.
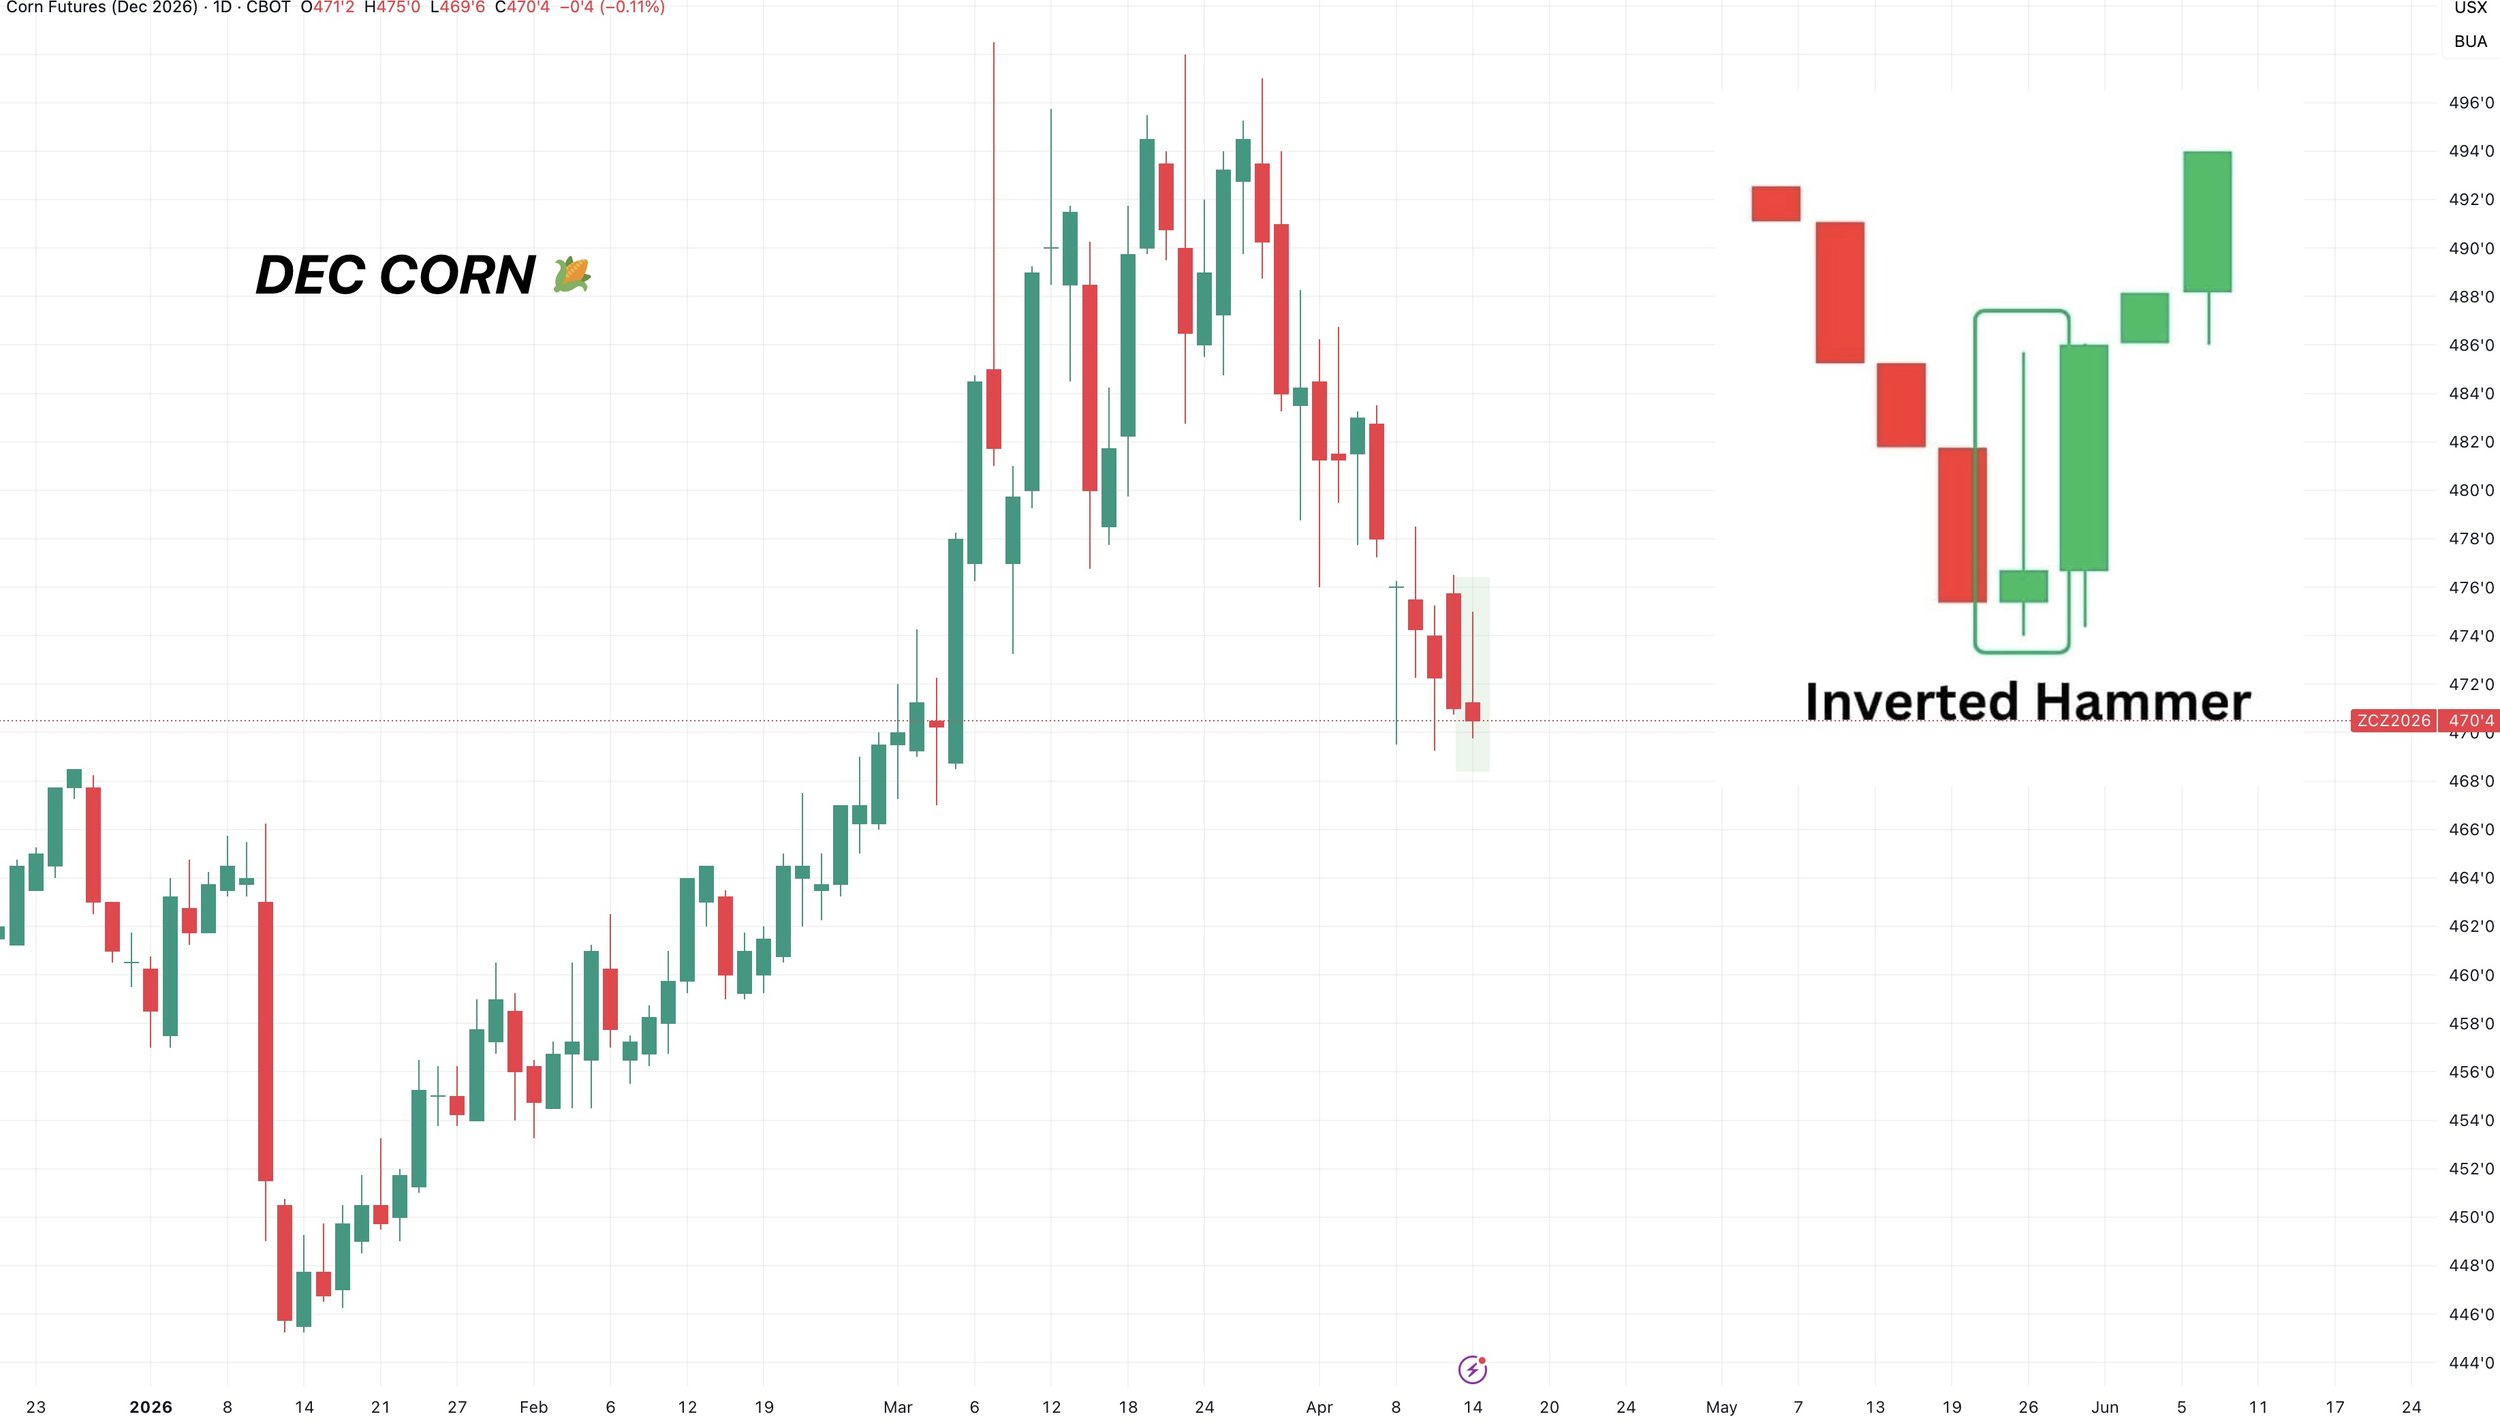
Inverted Hammer?
Corn closed well off the highs today.
Normally, this would be viewed as disappointing.
But closing well off the highs after a sell off is usually viewed differently than when it happens after a rally.
After a sell off, its known as an inverted hammer.
It can often mean that the market is trying to find some life down here. As it showed buyers were stepping in even though they failed today.
Another reason to have some optimism for a bounce.
Soybeans
Just going to be looking over some charts today.
From here it's going to come down to China and weather, and if this war impacts the relations with China or not.
That China meeting is still on for now.
It sounds like they won’t be buying any more old crop, but should still be buying new crop. Normally, this is about the time of year where we'd see them step in and start buying some new crop.
The funds are still near record long the entire soybean complex. So the charts are going to be an important thing to watch here.
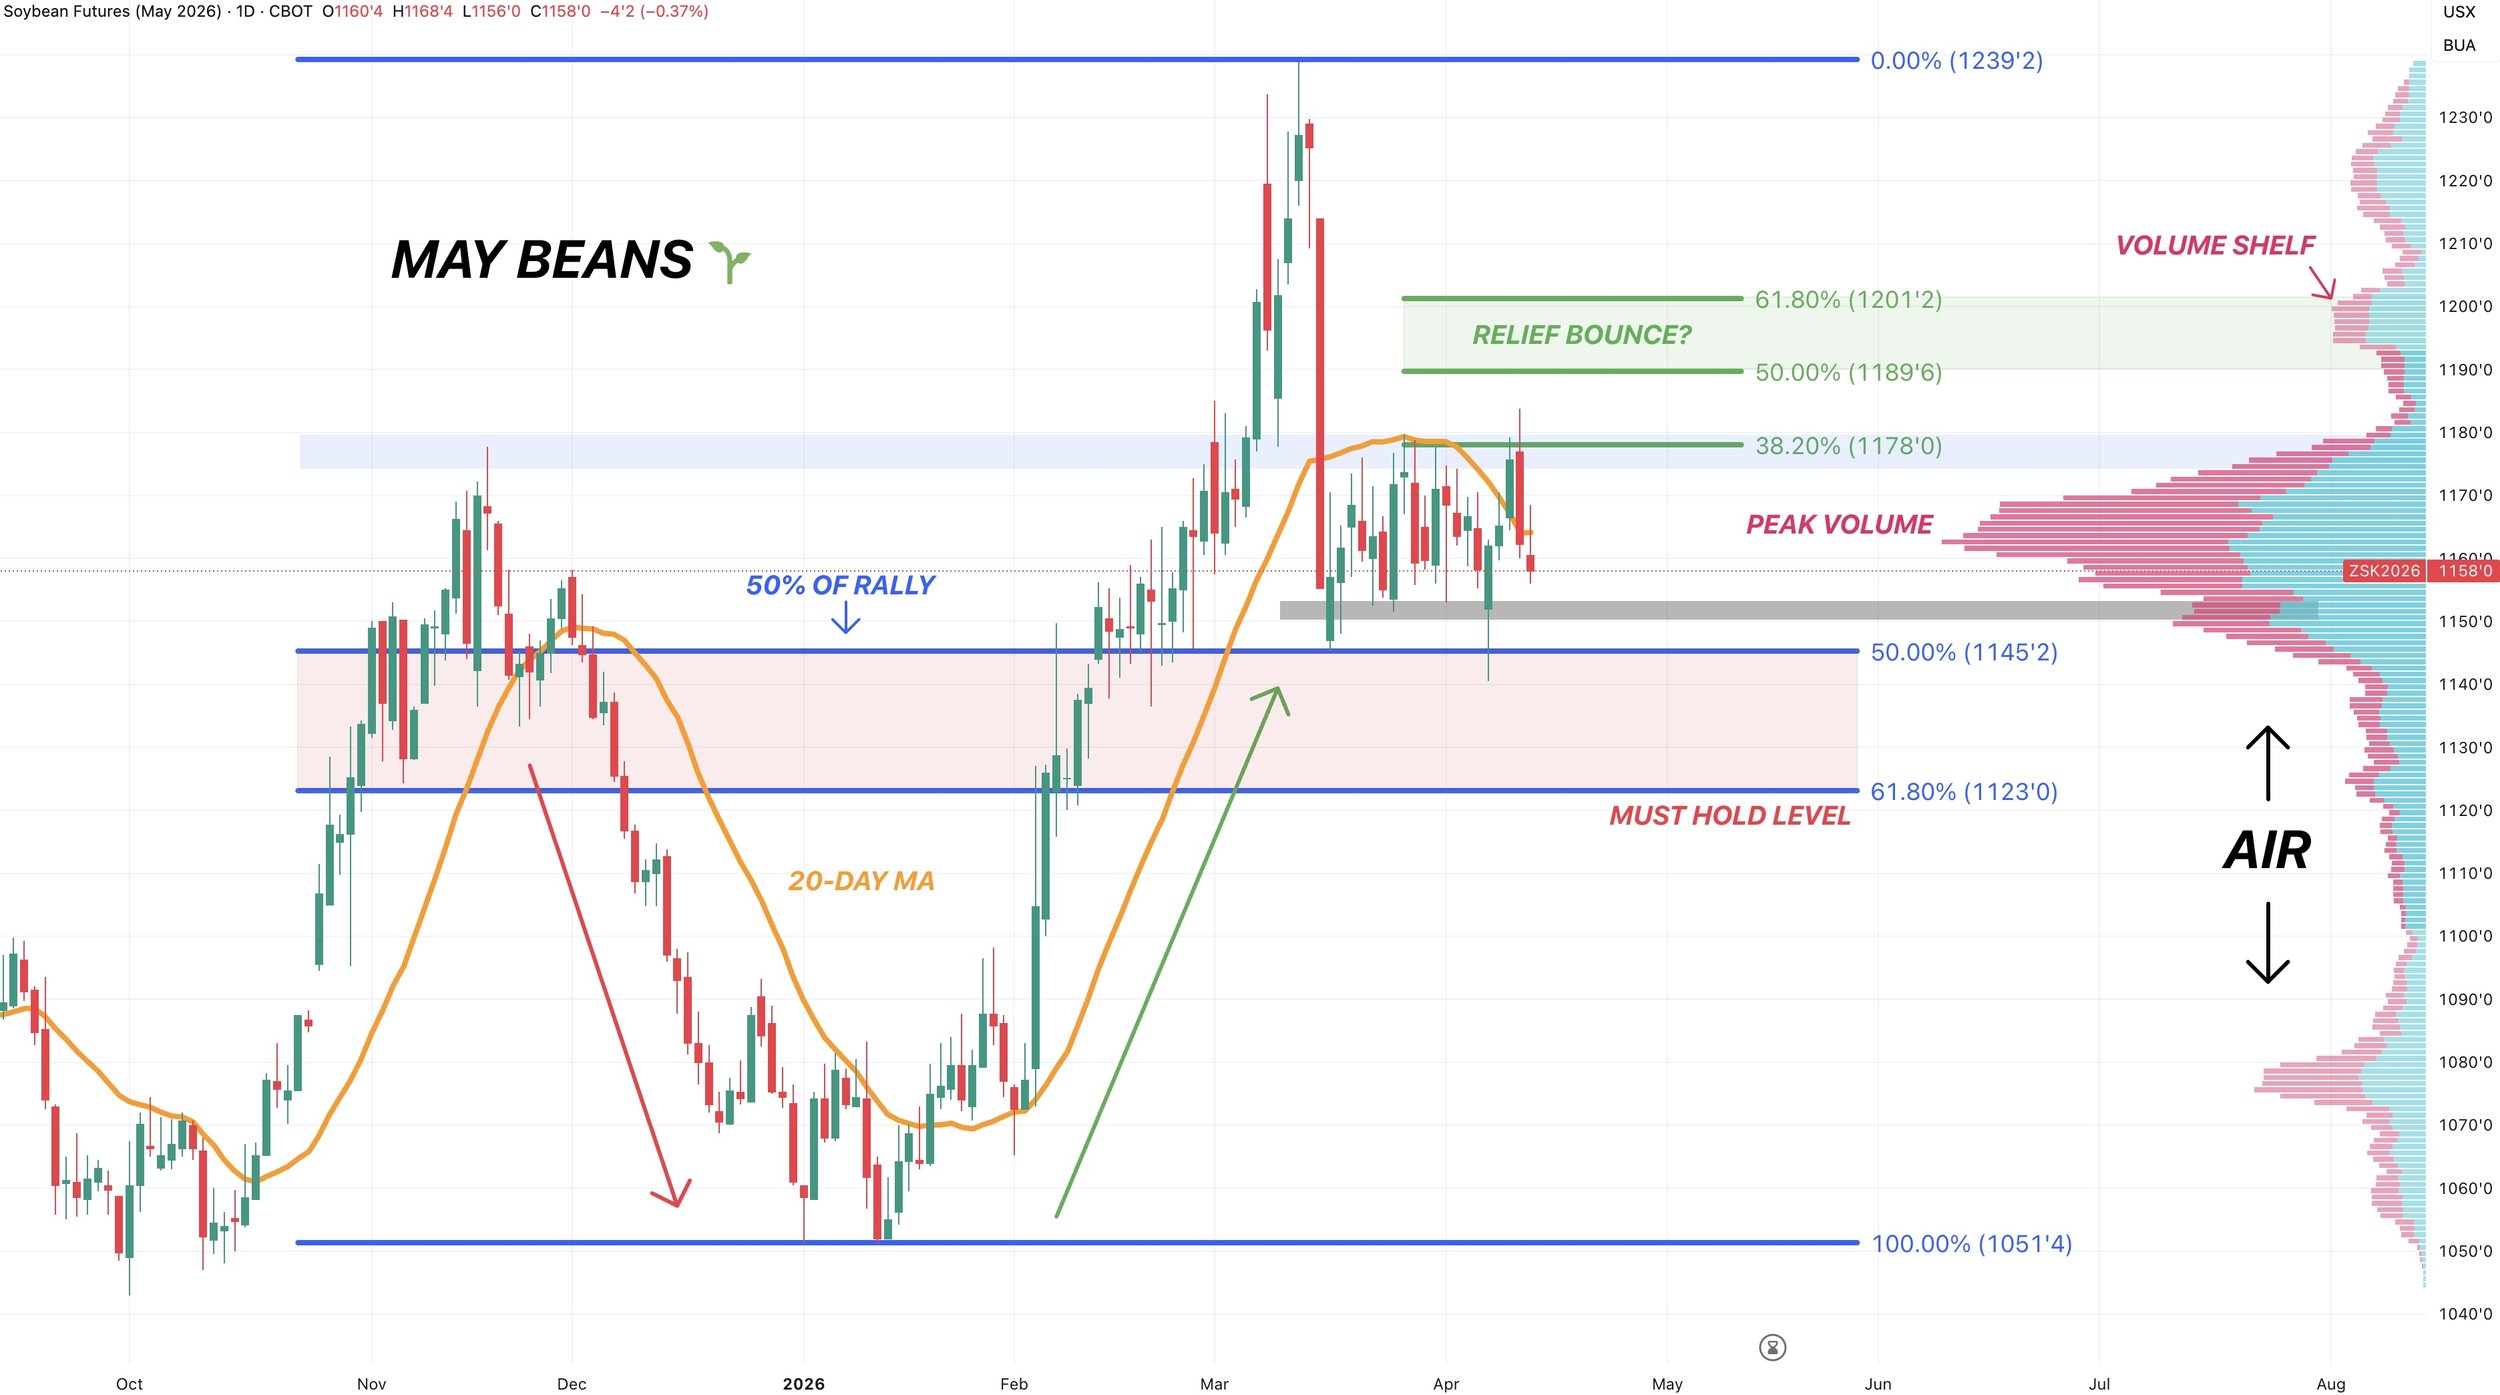
May Beans Chart:
We had a failed breakout on Friday which was disappointing to see.
Yesterday we then posted a key reversal lower and followed it up with some weakness today.
Overall not great price action, but we are still essentially sideways.
Stuck completely in no mans land.
So it's still too early to say this market is just going to fall apart. We are still in the same range we've been in for the last several weeks.
We are still at an area of high volume. The key level we've been talking about for weeks that we need to hold is $11.45. As that is 50% of the rally and where we bottomed after the limit down day.
But you could argue we need to hold $11.50, as we have not had a close below $11.50.
Below this area we do still have a large gap of air to the downside with virtually zero support beneath. So if we start to break down, it could spark a sizeable leg lower. Very important area to hold.
To the upside, if we get a nice bounce, we are still looking to reward a move towards $11.90 to $12.00 inside that golden zone.
We don't have to get there. It's simply a target to let you know it's time to de-risk if we do get there.
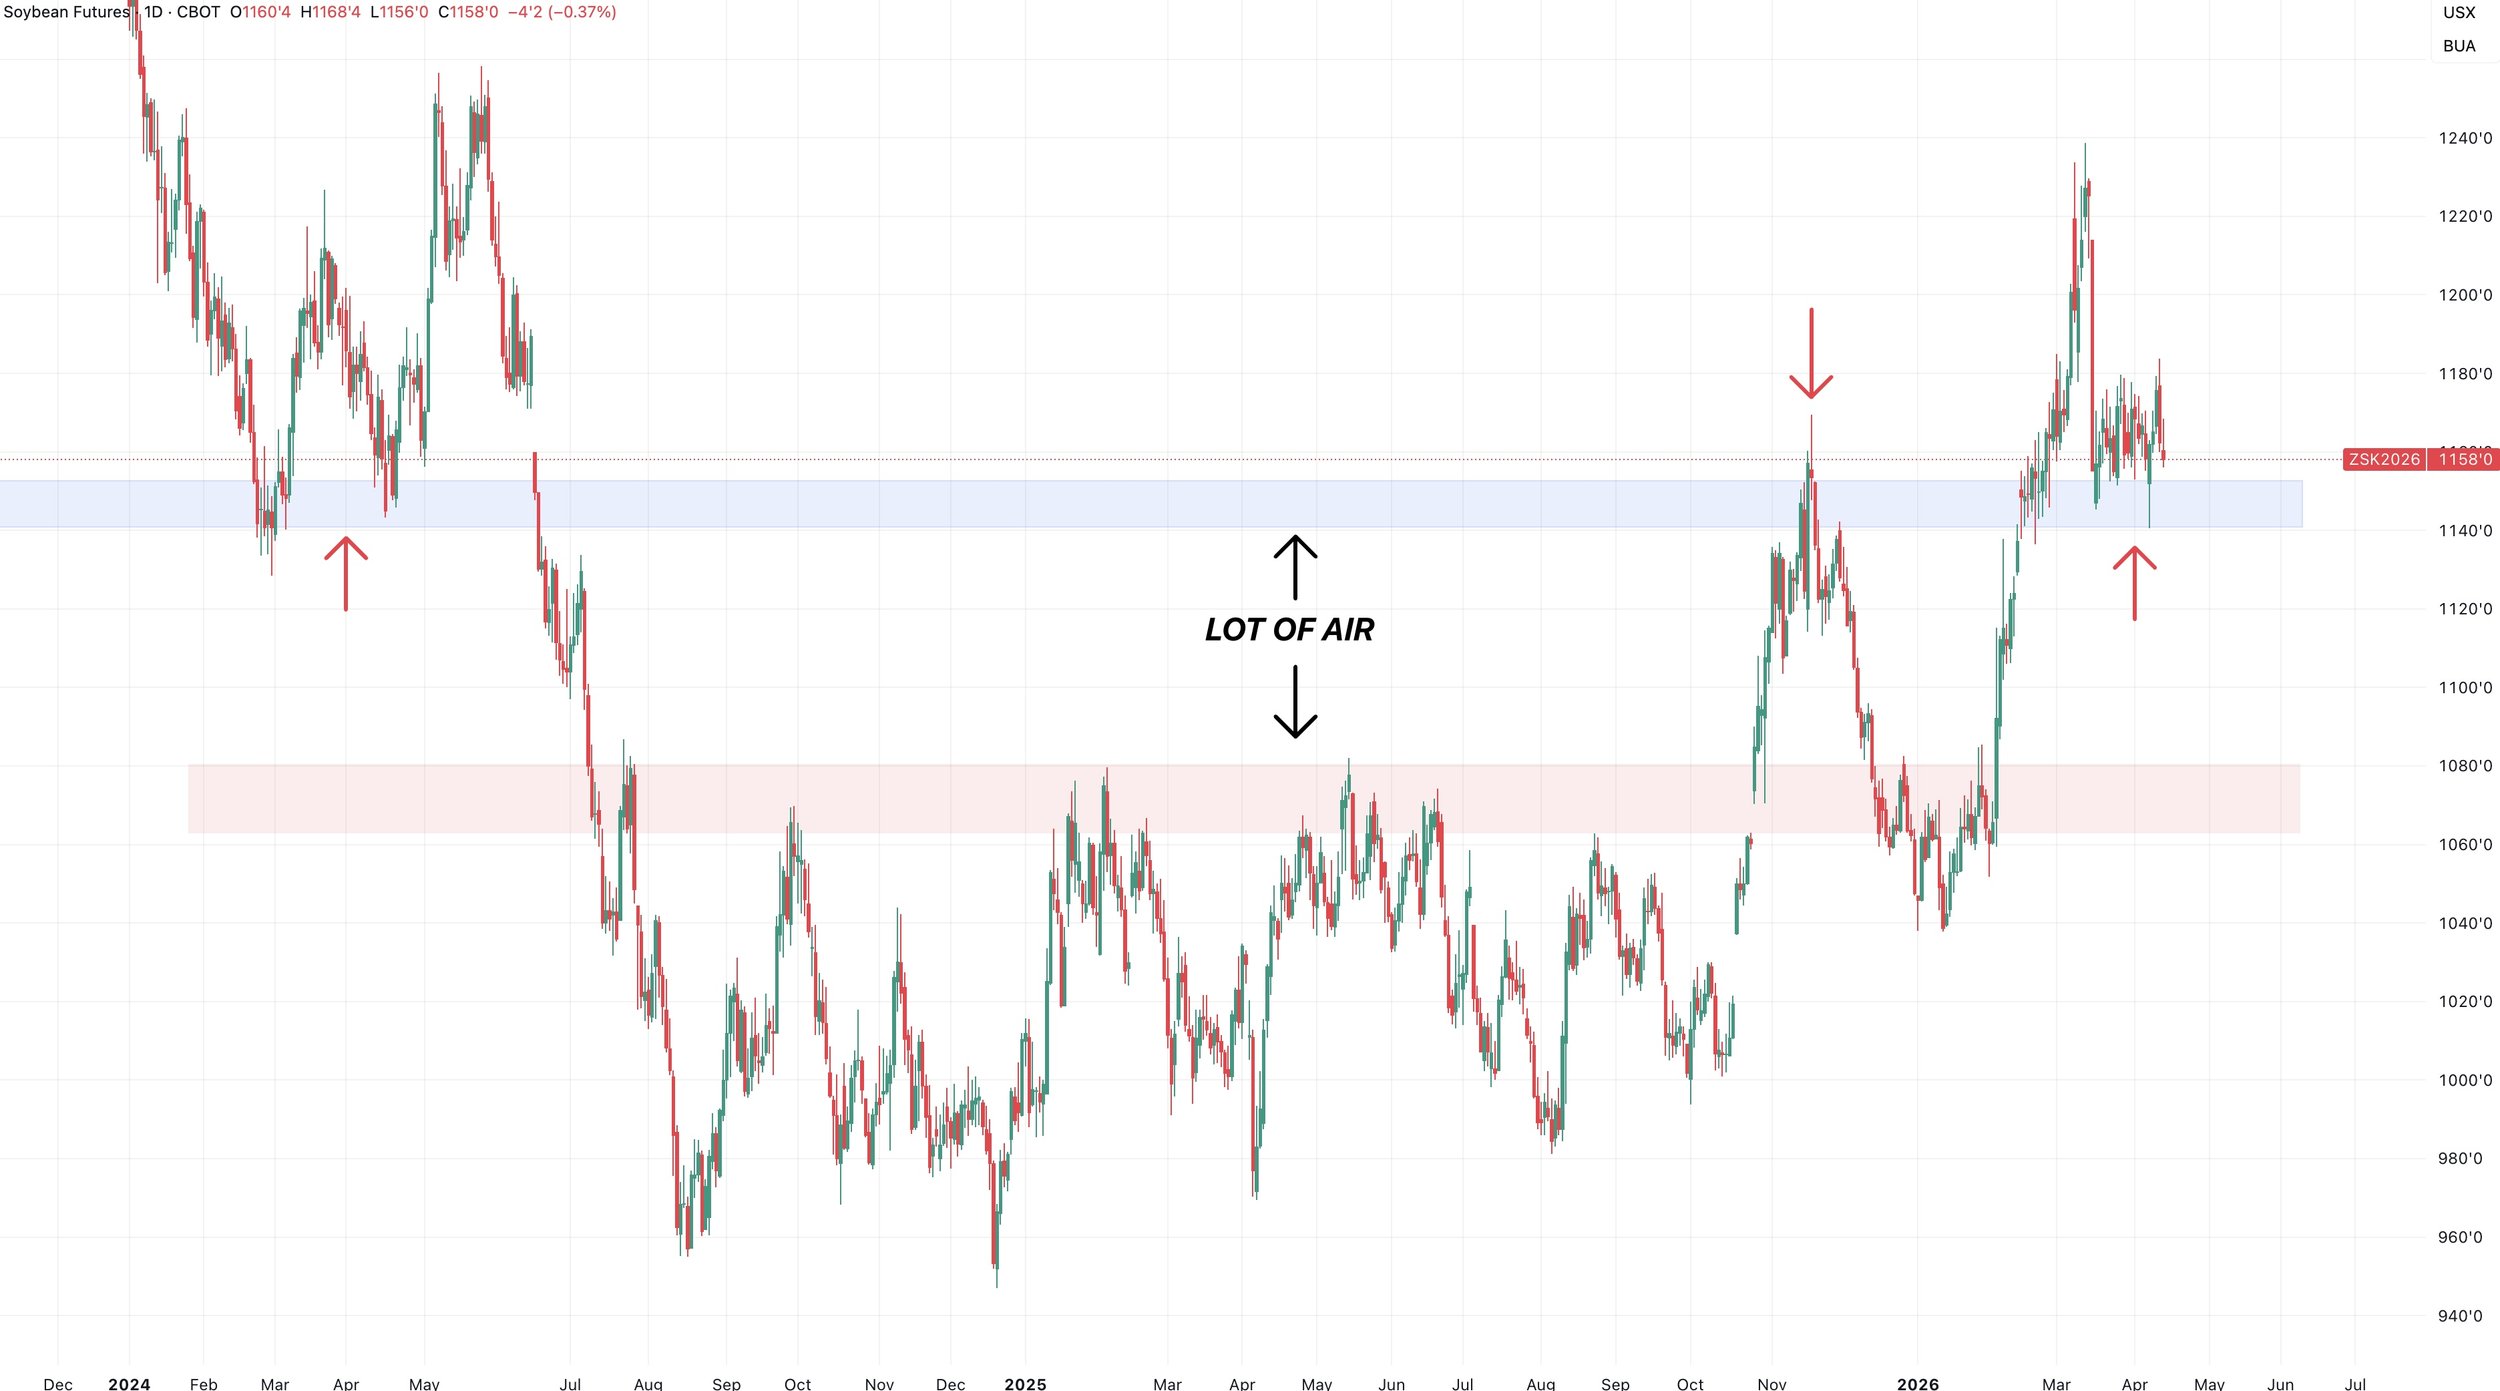
Big Picture Chart:
Here is front month beans.
Still sitting right at those highs from back in November.
This same level was key support back in 2024.
It's a pretty key support and resistance level.
If we start to break below this level, there is some clear air lower.
Key spot we'd like to hold.
Nov Beans Chart:
Nov beans also essentially sideways up near these contract highs.
We already rewarded this rally at these levels a few weeks ago. So if you haven’t taken any risk off the table yet and can make money doing so, there is nothing wrong with doing that.
The key level to hold is $11.40. It gives back 50% of the rally and we haven’t had a close below that level.
We've bounced off that level several times on this chop and it is the bottom of the recent range we've been trapped in.

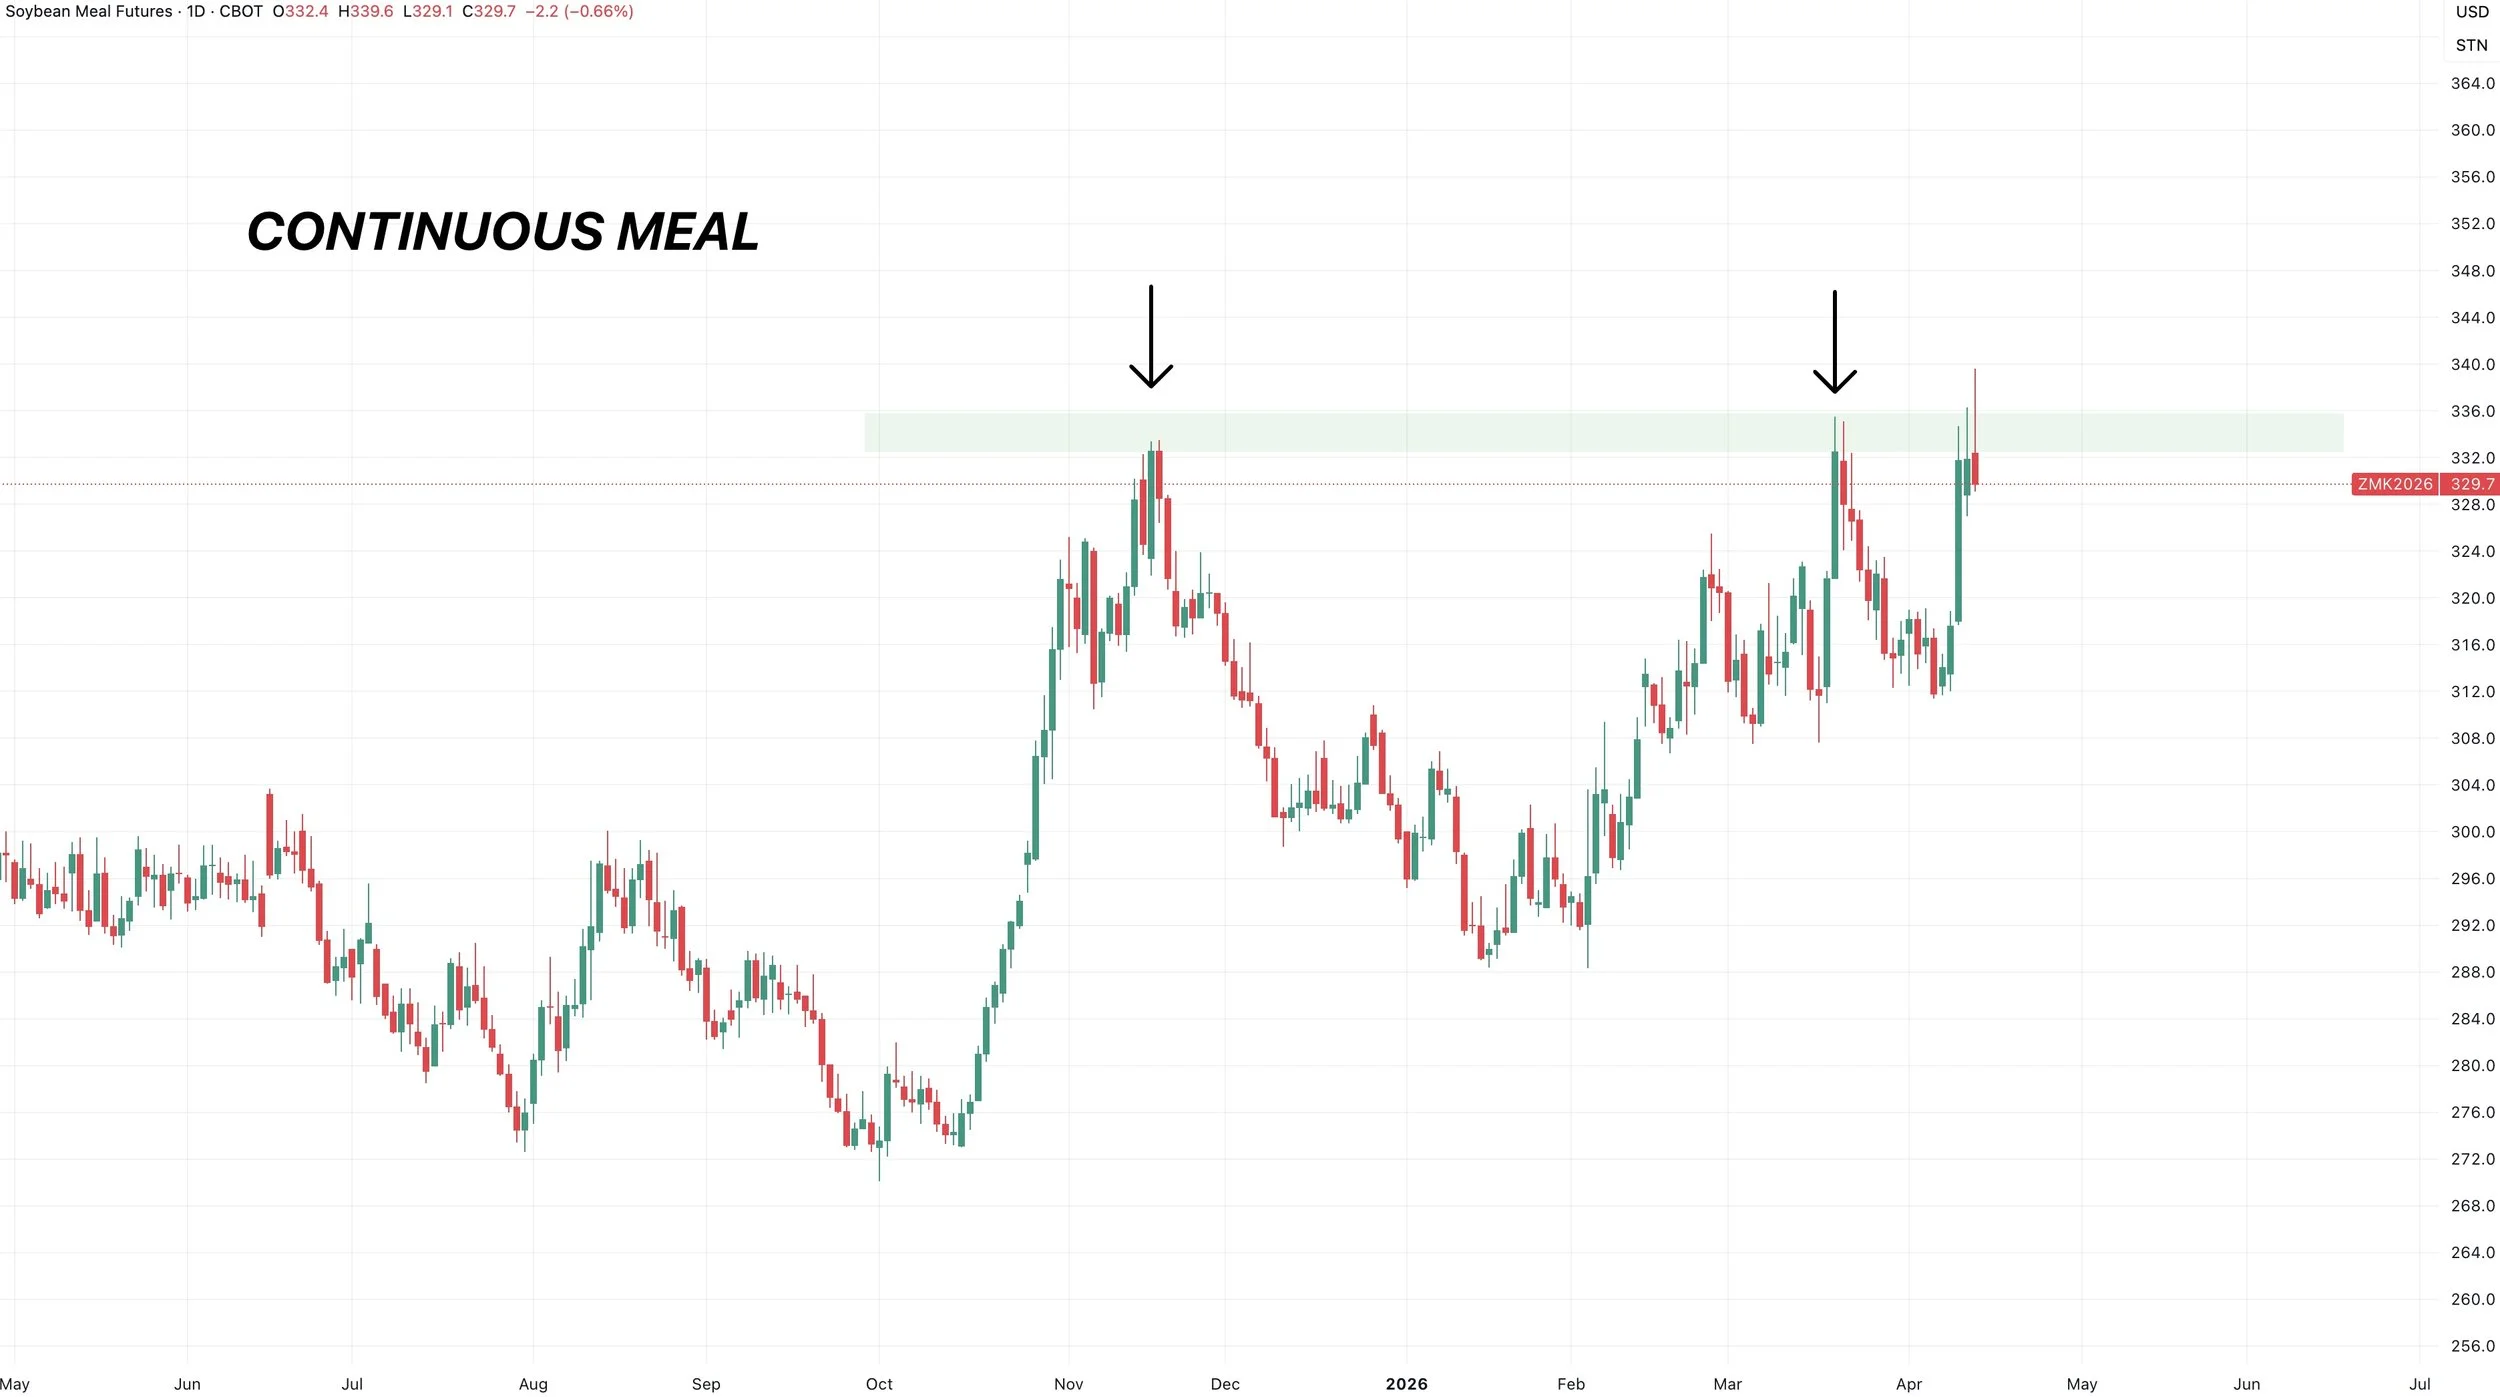
Front Month Meal Chart:
Front month meal left a shooting star on the chart, and rejected right where this market has failed at twice over the last year.
Objectively, that is not a great sign, so will need to see if we get follow through weakness or not.
But if we can take out this area of resistance, the upside is wide open.
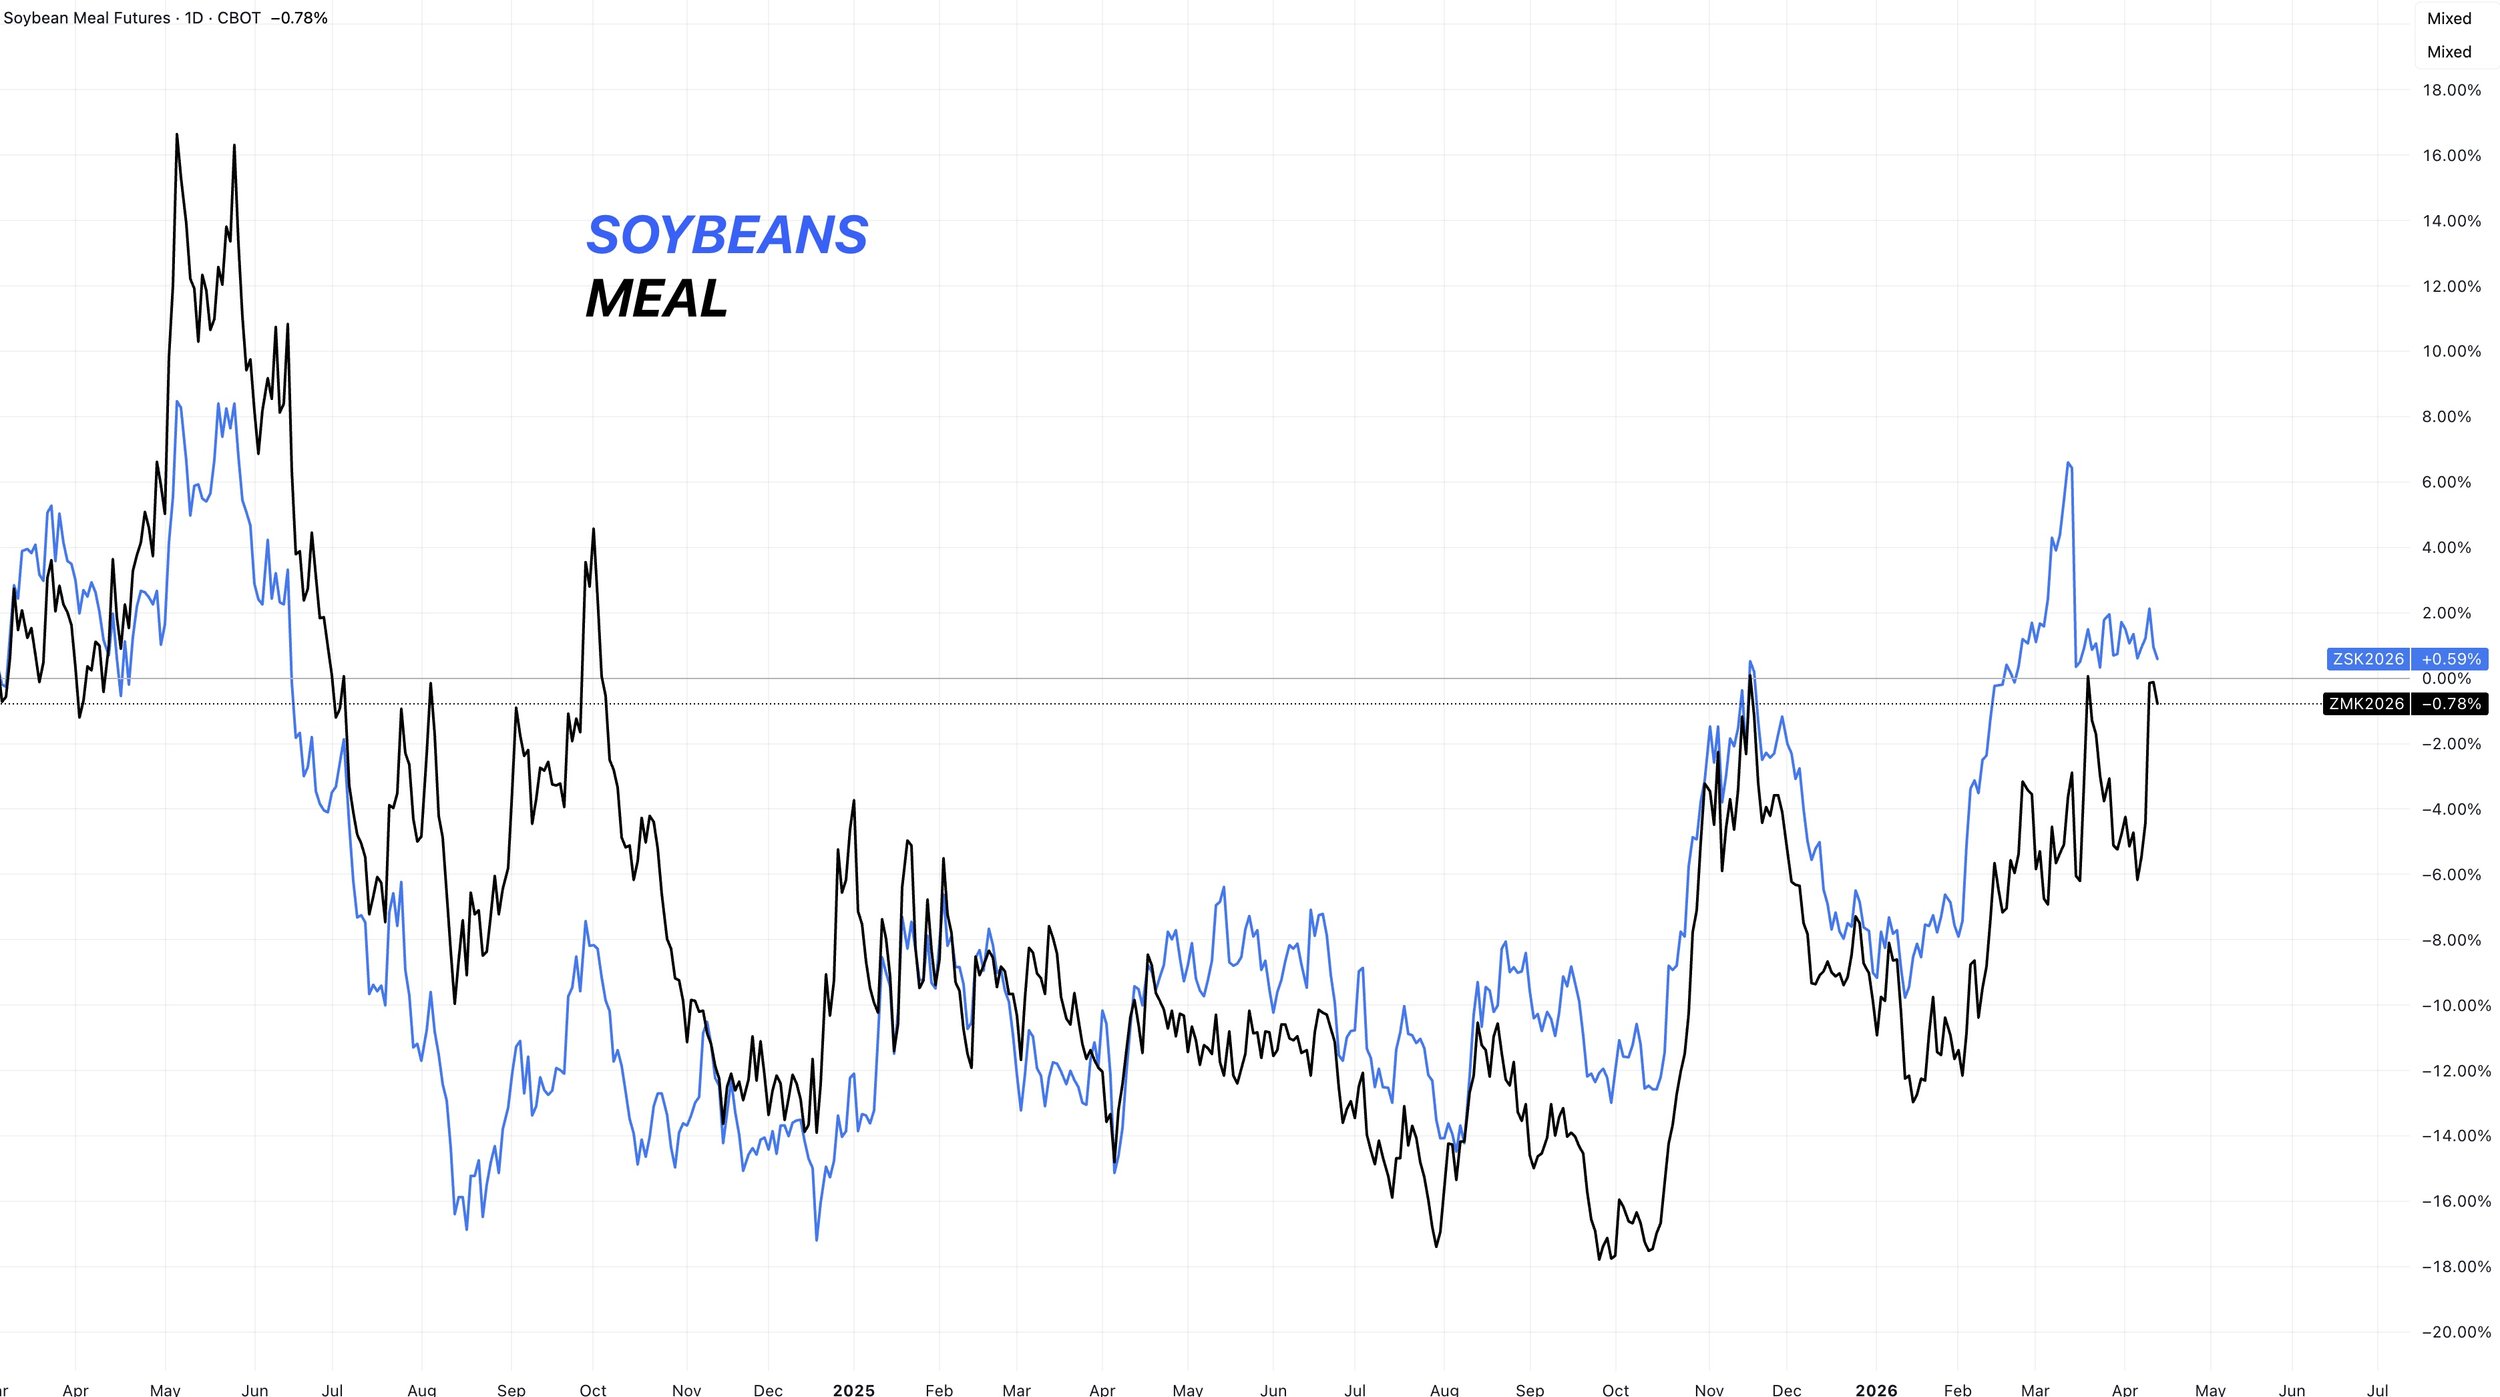
Soybeans vs Meal:
Soybeans and meal of course, track very similar to one another.
If meal gets the break out, you would assume soybeans should be well supported.
So the price action in meal will be important. Whether it's fails where it has the last year or finally gets the break through.
Wheat
Problems in the plains?
Wheat's put together a nice two run. Probably due to dry forecasts and crop ratings continuing to fall.
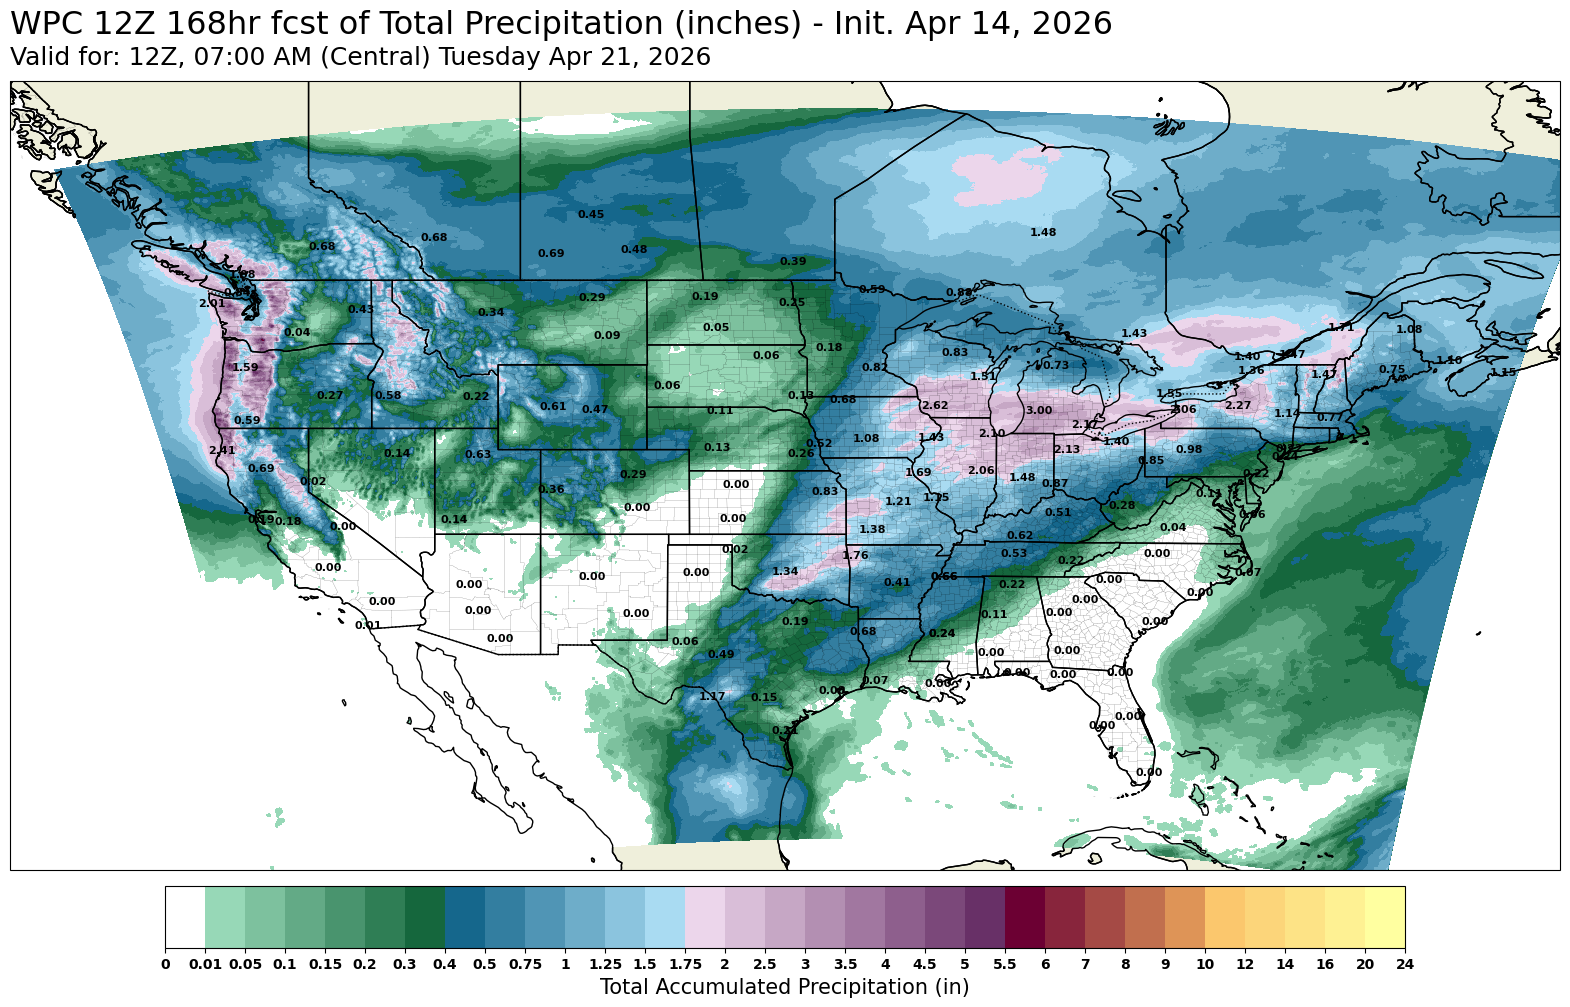
First let's look at the forecasts.
As I've been talking about, those rains continue to be too far east.
Here is the outlook for the next week.
A big chunk of that key region looks like it's going to miss out on rain once again and might not get decent rain until May.
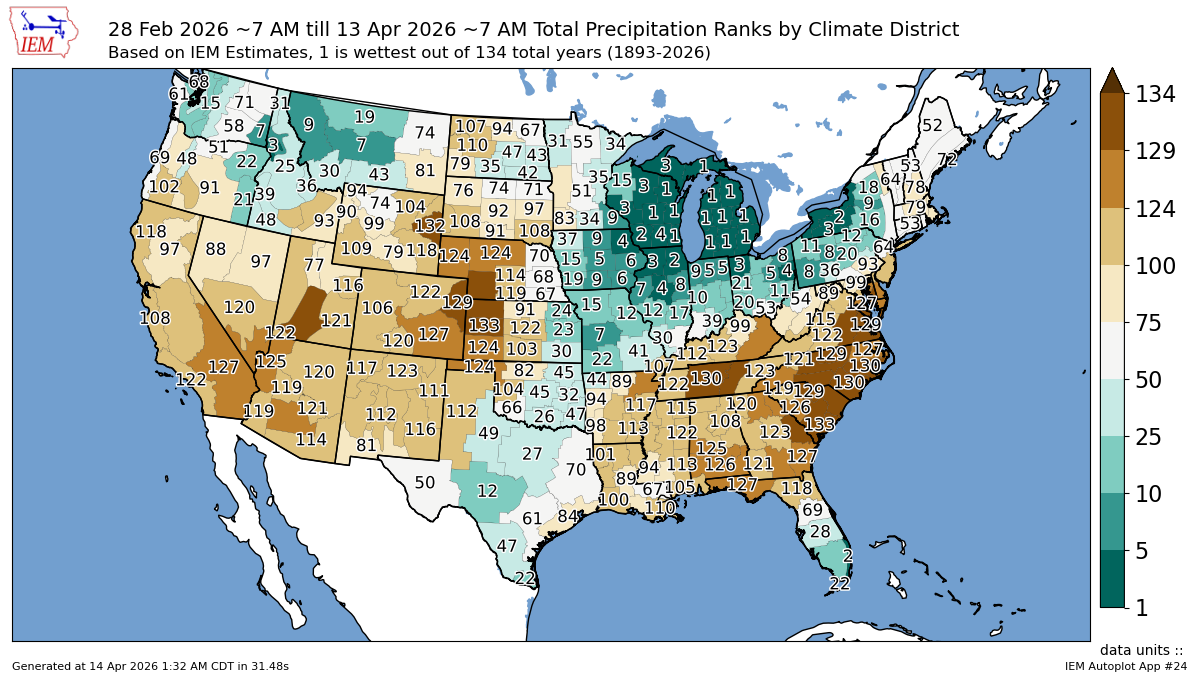
Here is the precip ranks from March 1st to today.
That same key region has seen one of it's driest stretches ever for this time of year.
Drought has continued to ramp up.
We'll get an offical number updated number this week.
If we don’t get some rains soon, we could surpass that record from back in 2022.
Breaking Down Crop Conditions:
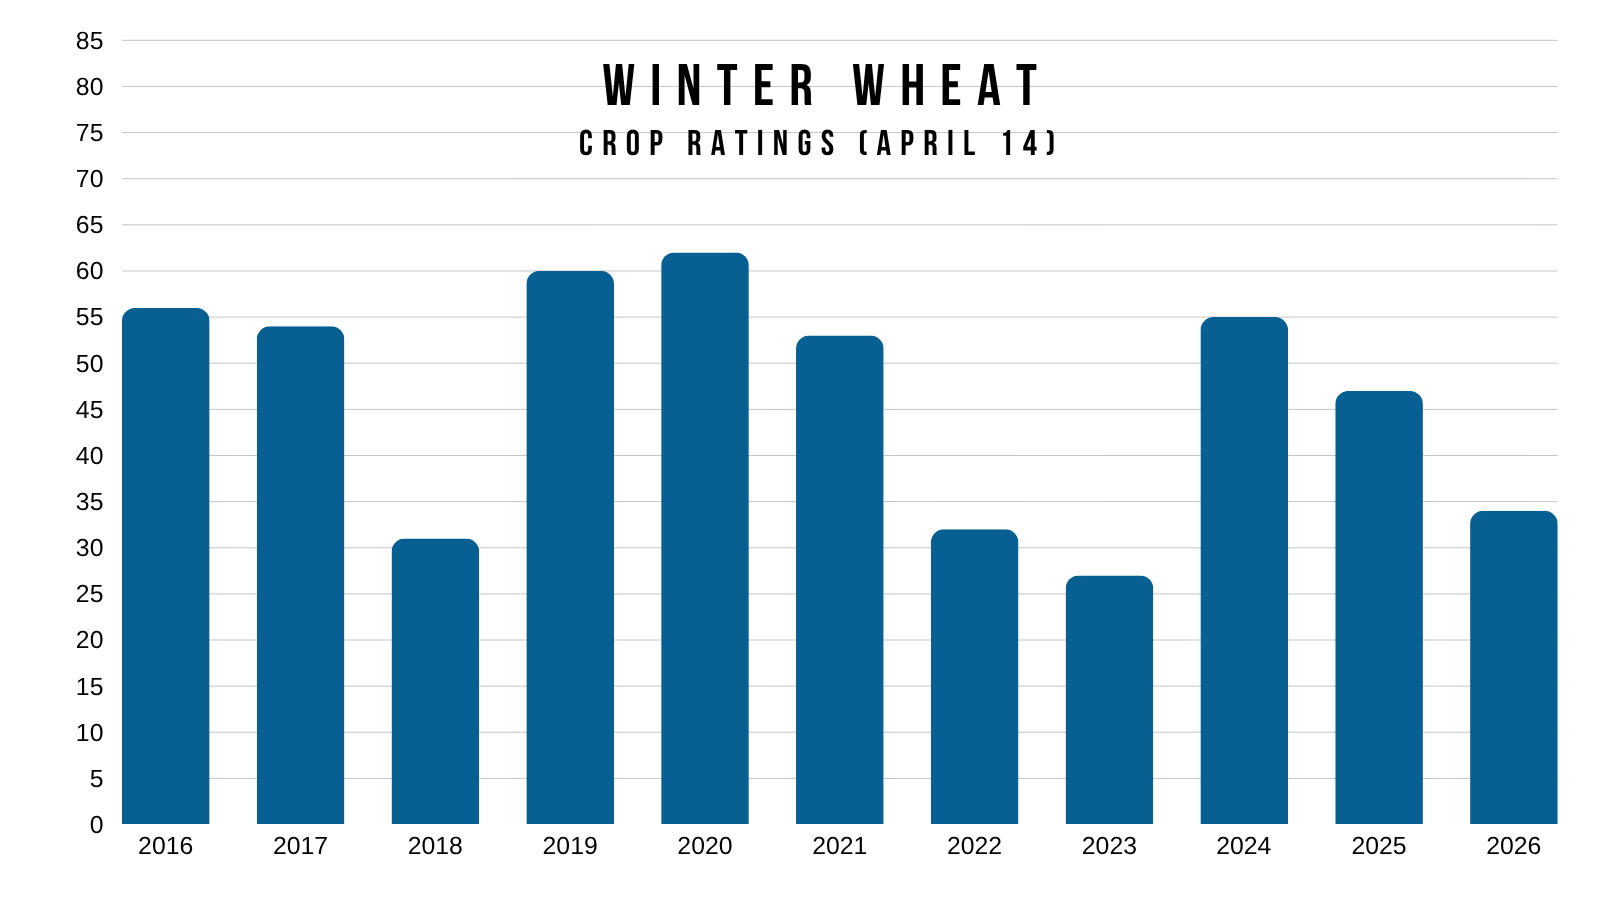
Crop conditions fell another point last week.
Sitting at 34% good to excellent.
This chart shows the ratings for today's date through the last decade.
We have one of the lowest readings of the last decade, but on the surface, you wouldn’t call this an anomaly.
2018, 2022, and 2023 all had worse ratings for this time of year.
The problem is that 34% is the national average.
But that number is slightly twisted due to the great crops out in Washington and Idaho for example.
The issue is the plains.
This chart shows each state's ratings for this year, last year, as well as their average.
There is a clear problem developing in the plains.
All are well below their average, despite the national rating not being that much lower than average.
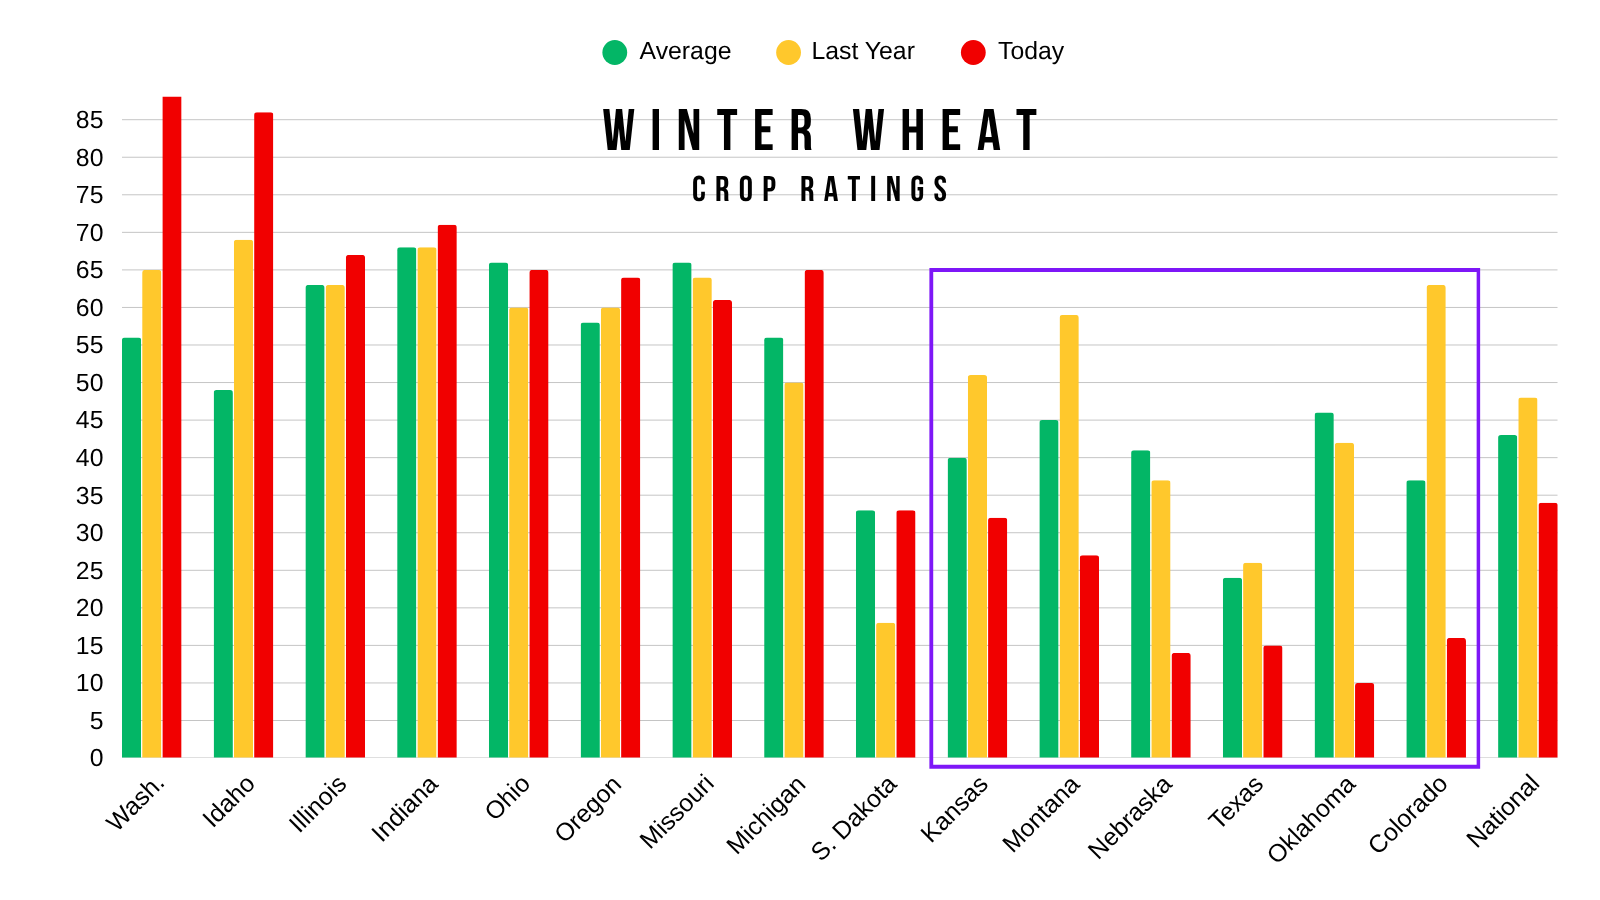
Many states like Washington where the ratings are great, produce SRW wheat, not HRW wheat.
The top 5 producing states of HRW wheat are:
Kansas, Oklahoma, Texas, Colorado, and Nebraska.
These are the states where the ratings really matter.
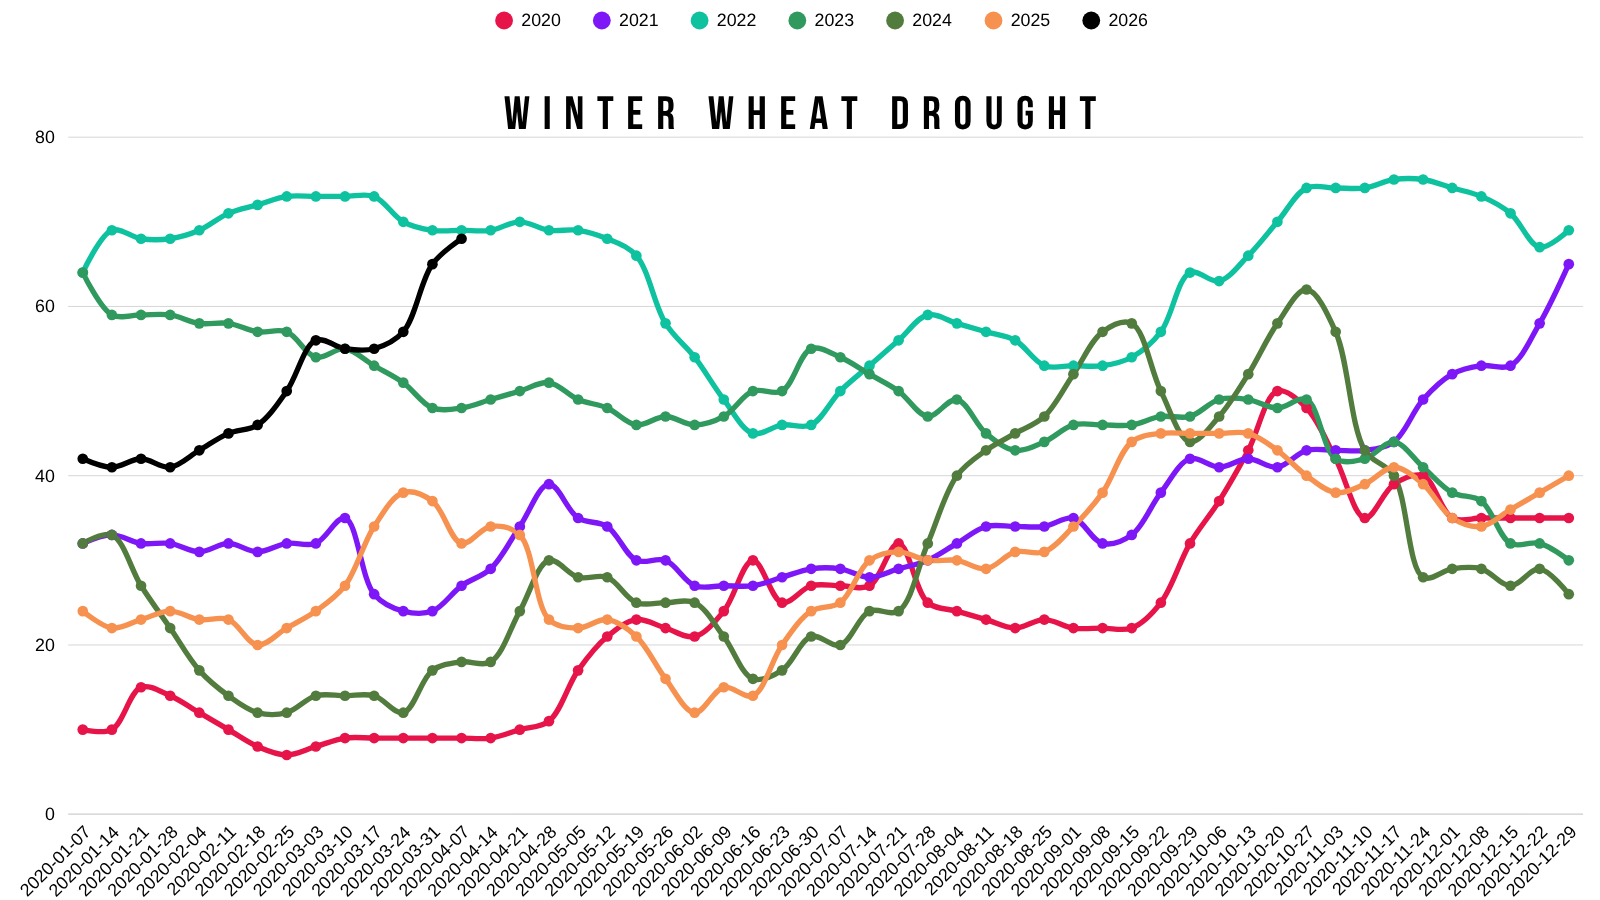
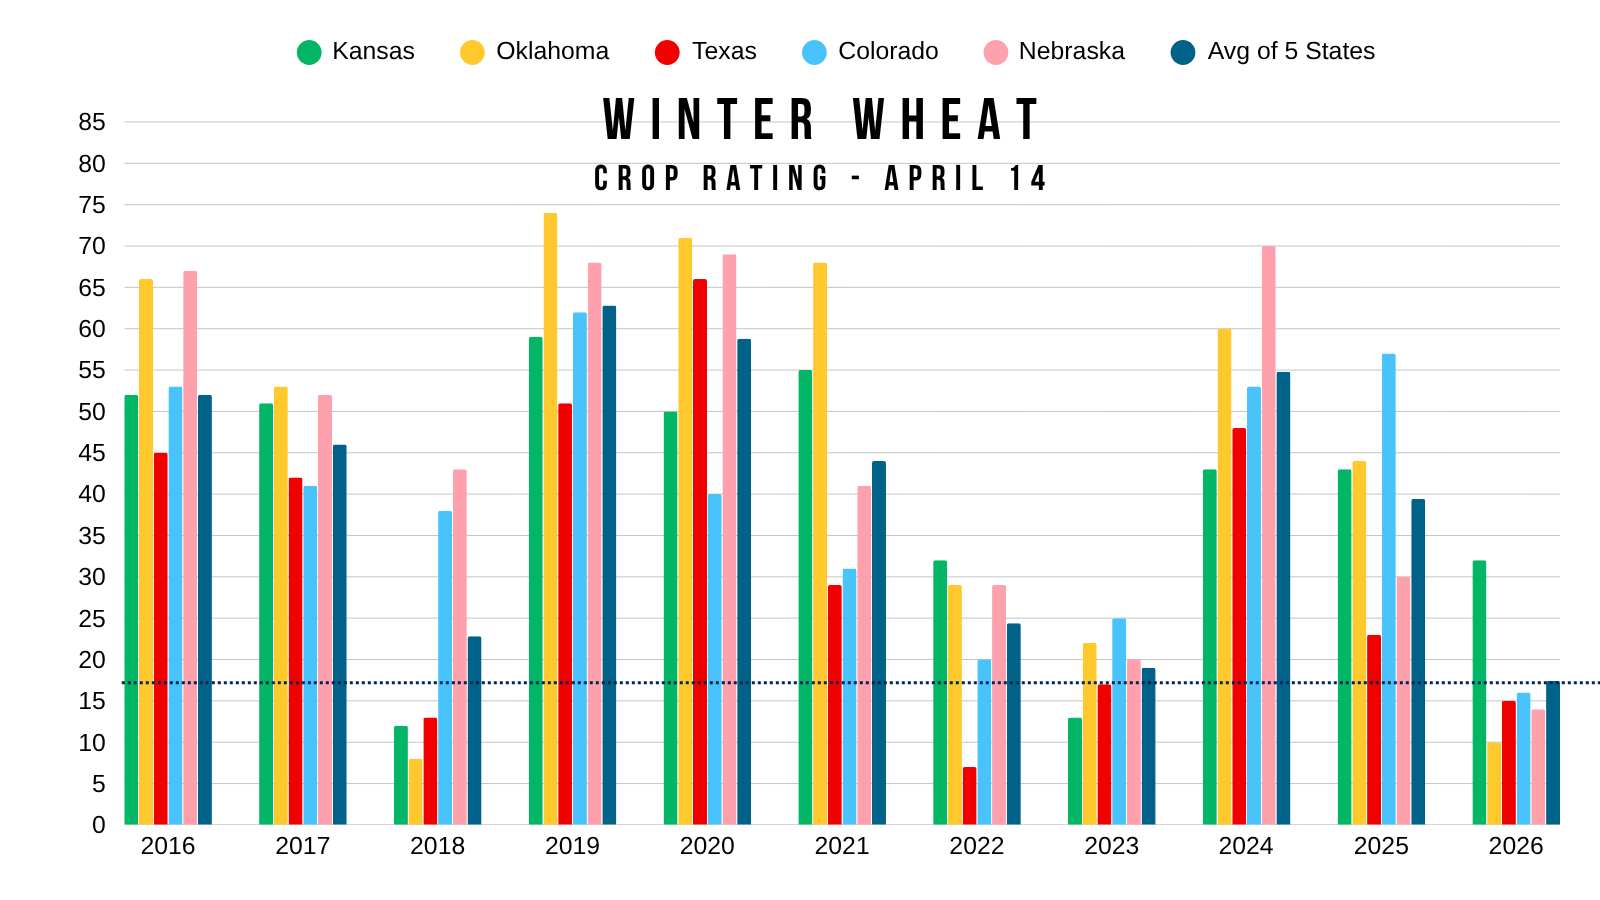
This next chart shows each states crop ratings for today's date over the last decade.
I also put together the average total rating for those 5 states during each year.
2026 is in a realm of its own.
Out of the five states, Kansas is the only one whose ratings aren’t virtually sitting at decade lows.
The average rating of these 5 states this year is 17.5% good to excellent.
That would be the lowest rating in at least the last decade.
So I'd argue there is definitely some real issues here.
May KC Chart:
Held where we needed to.
Back in the chop central area and this area of major volume where we've been chopping around for the last several weeks.
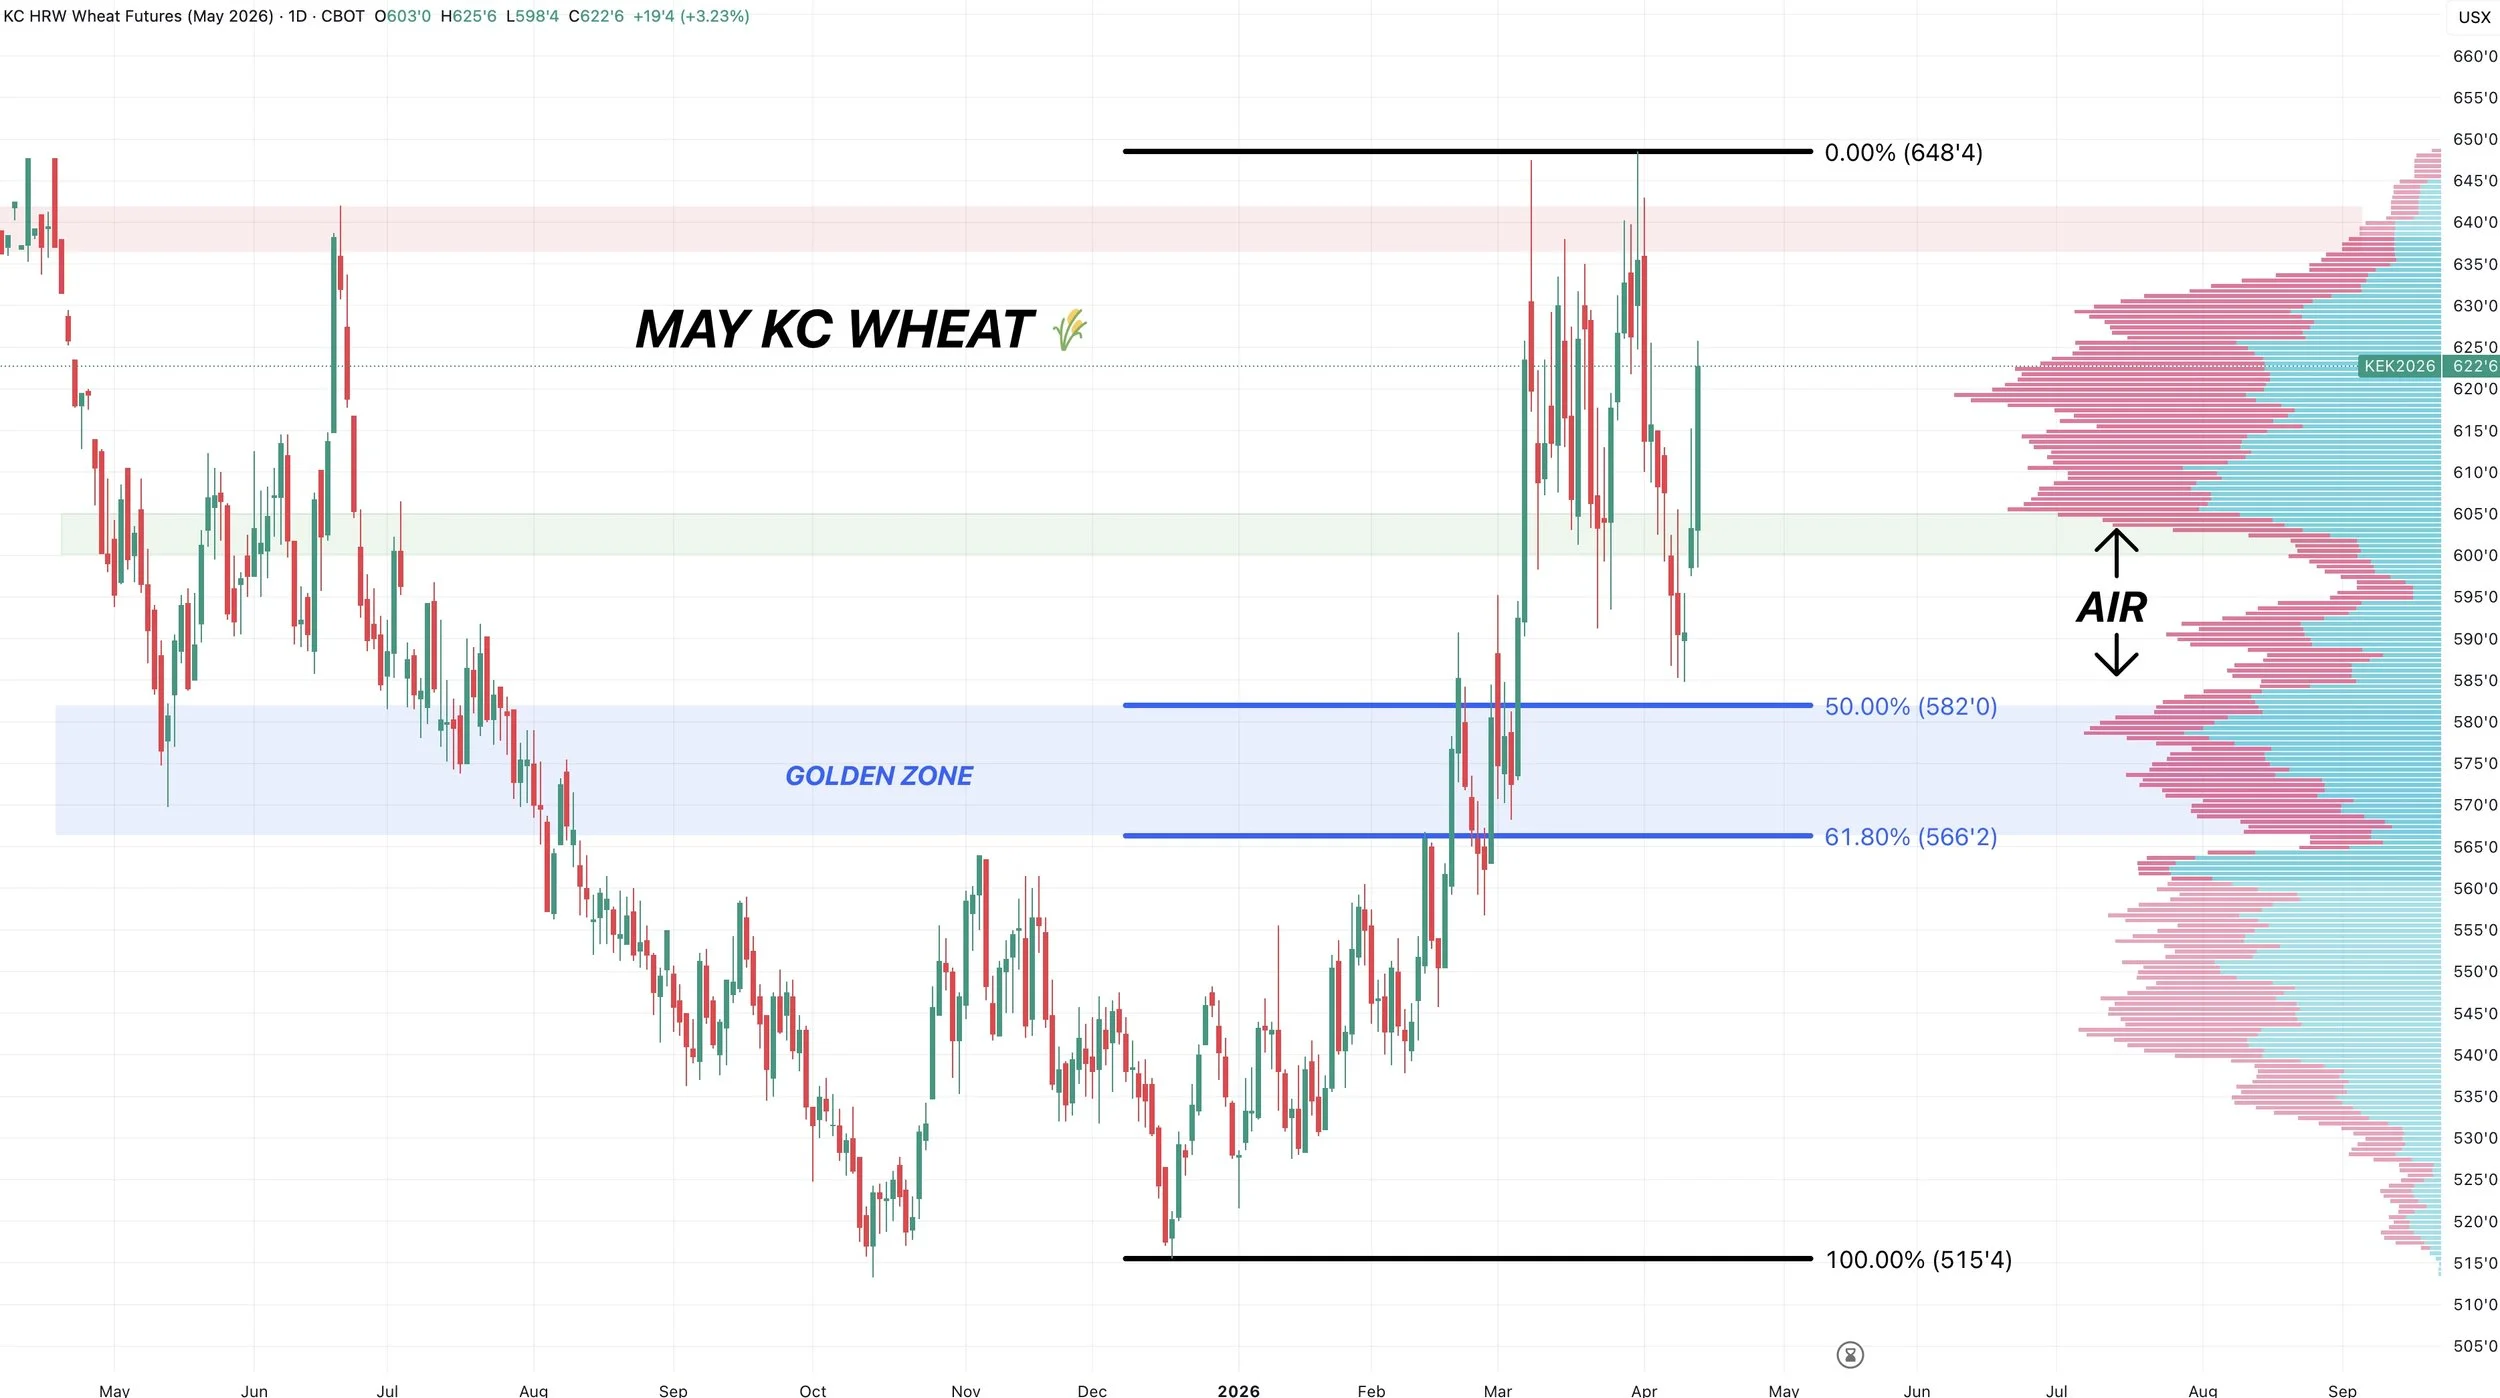
Next Target:
We already took risk off the table near the highs.
If you have not yet rewarded the rally in wheat, it probably makes sense to consider taking some chips off the table soon.
If you have already rewarded this to some extent, then the next target is $6.72 on May.
The recent rally failed after clawing back 50% of the contract highs.
The next level is the 61.8% level at $6.72
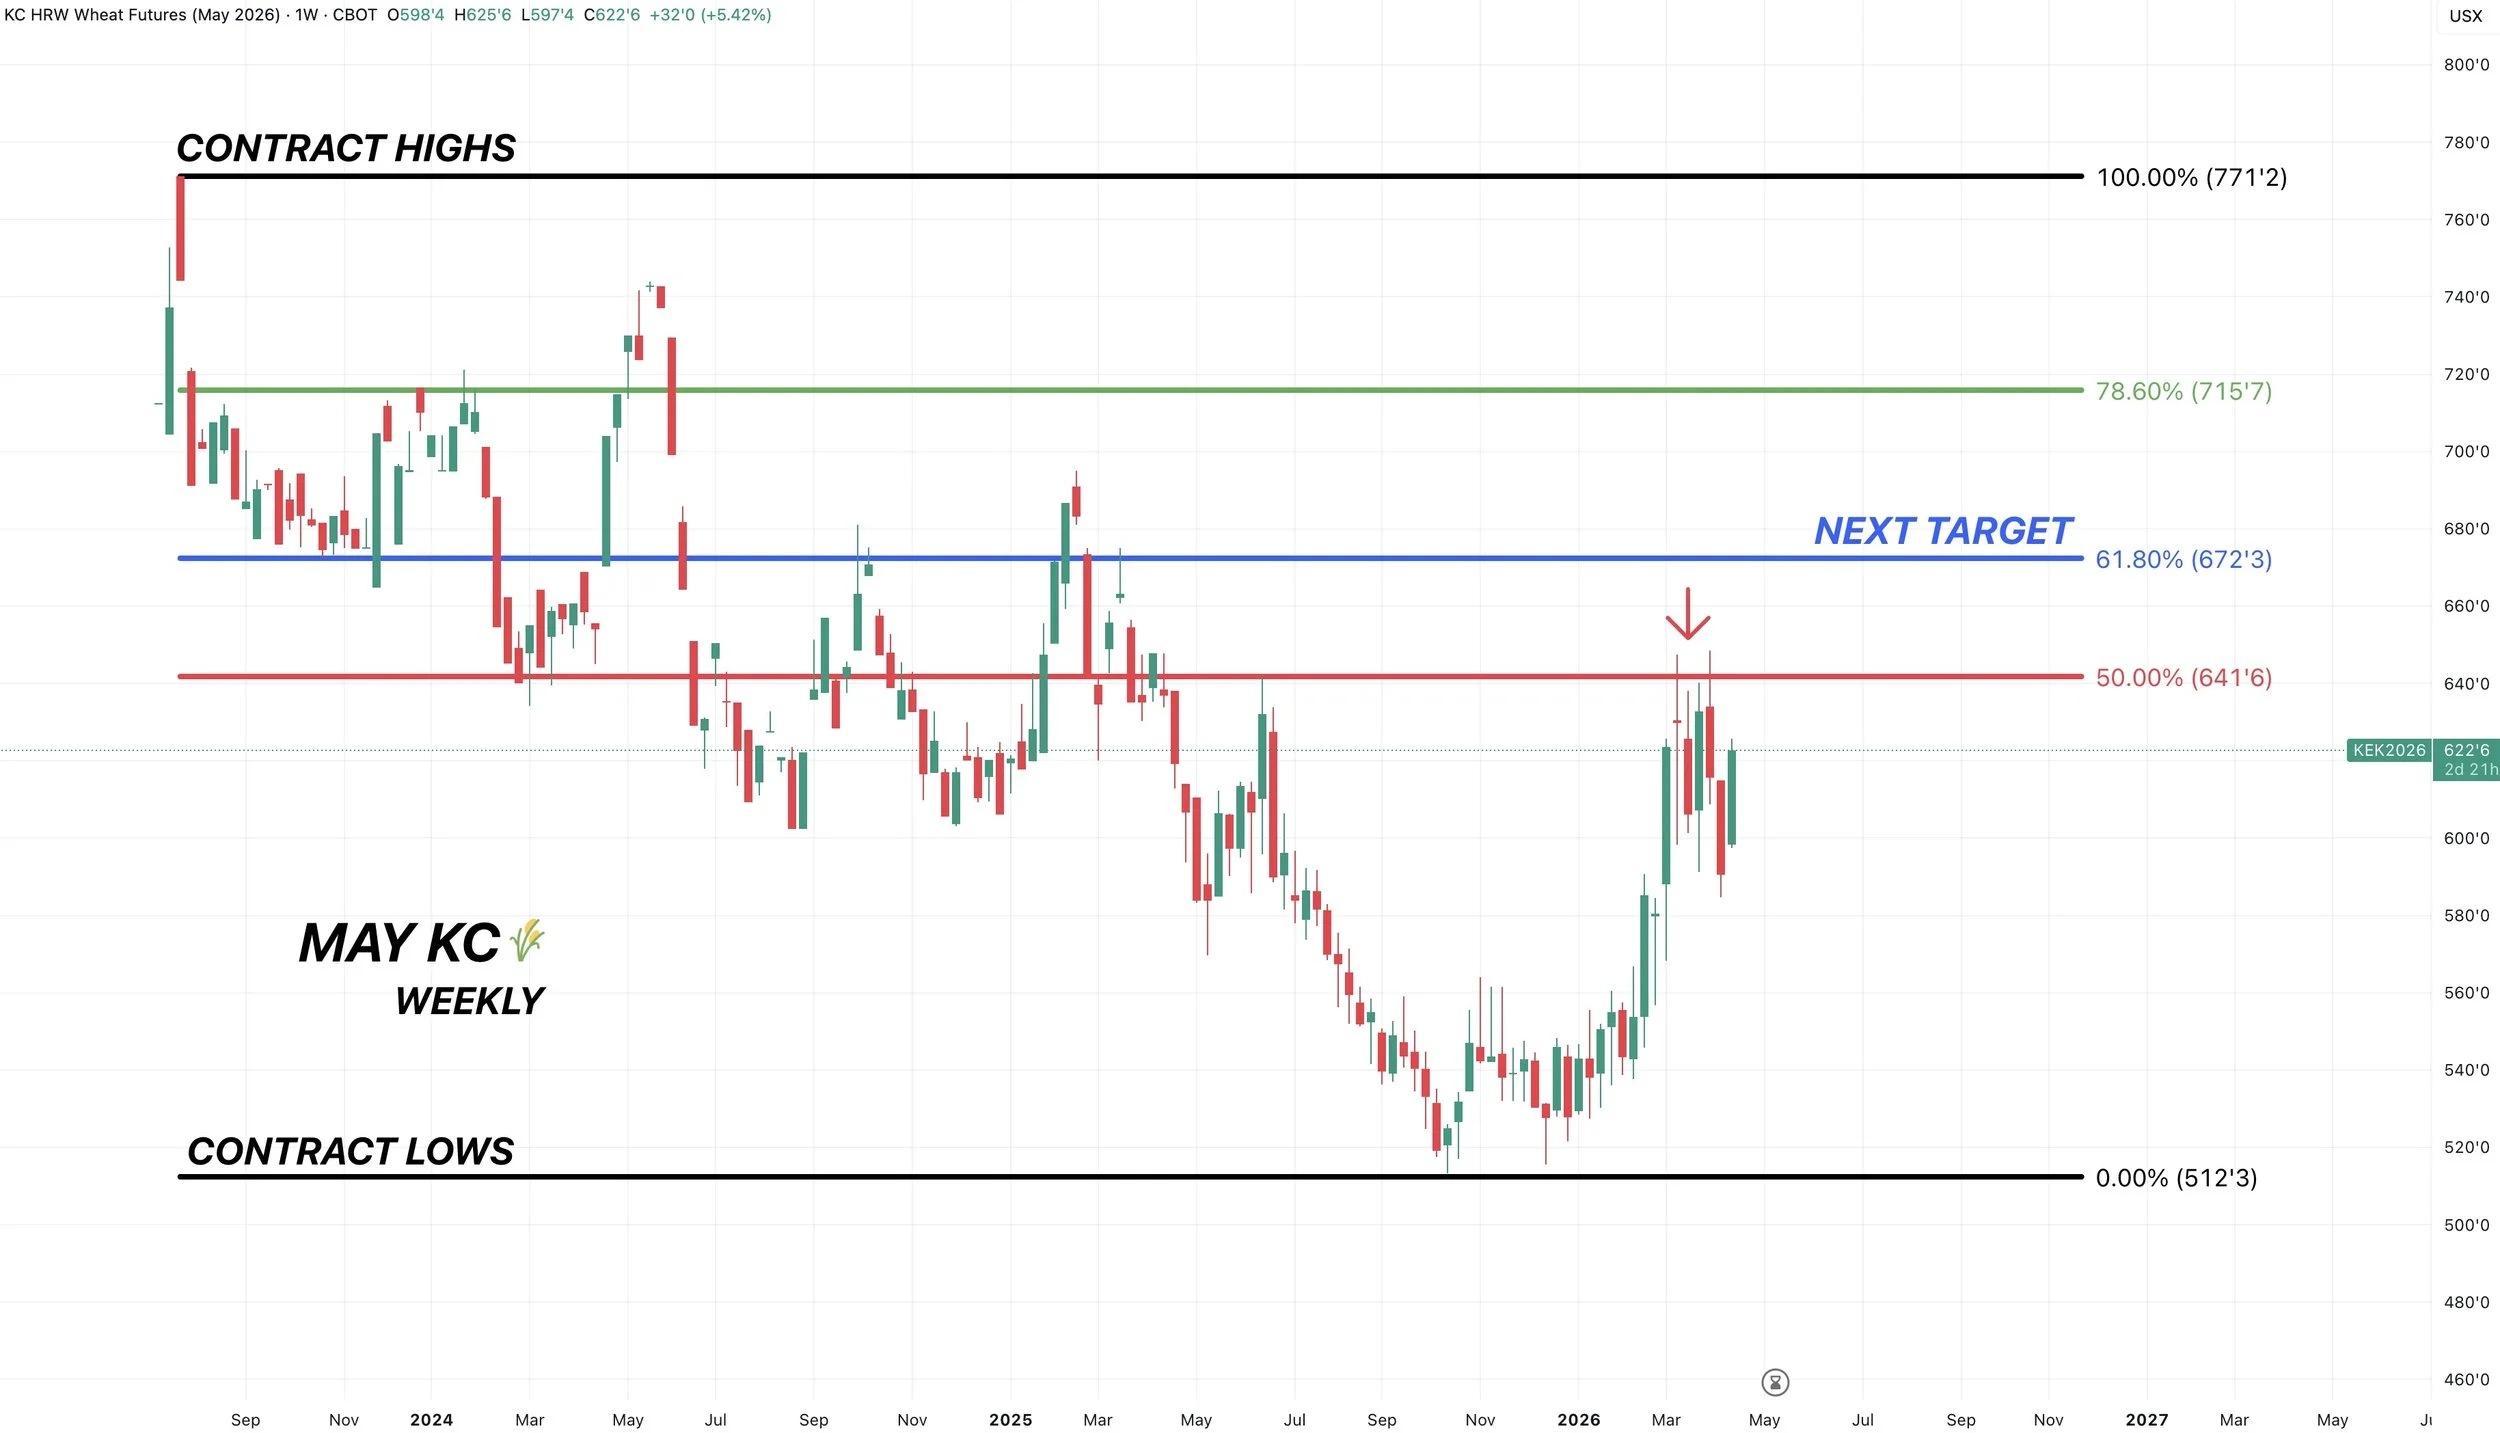
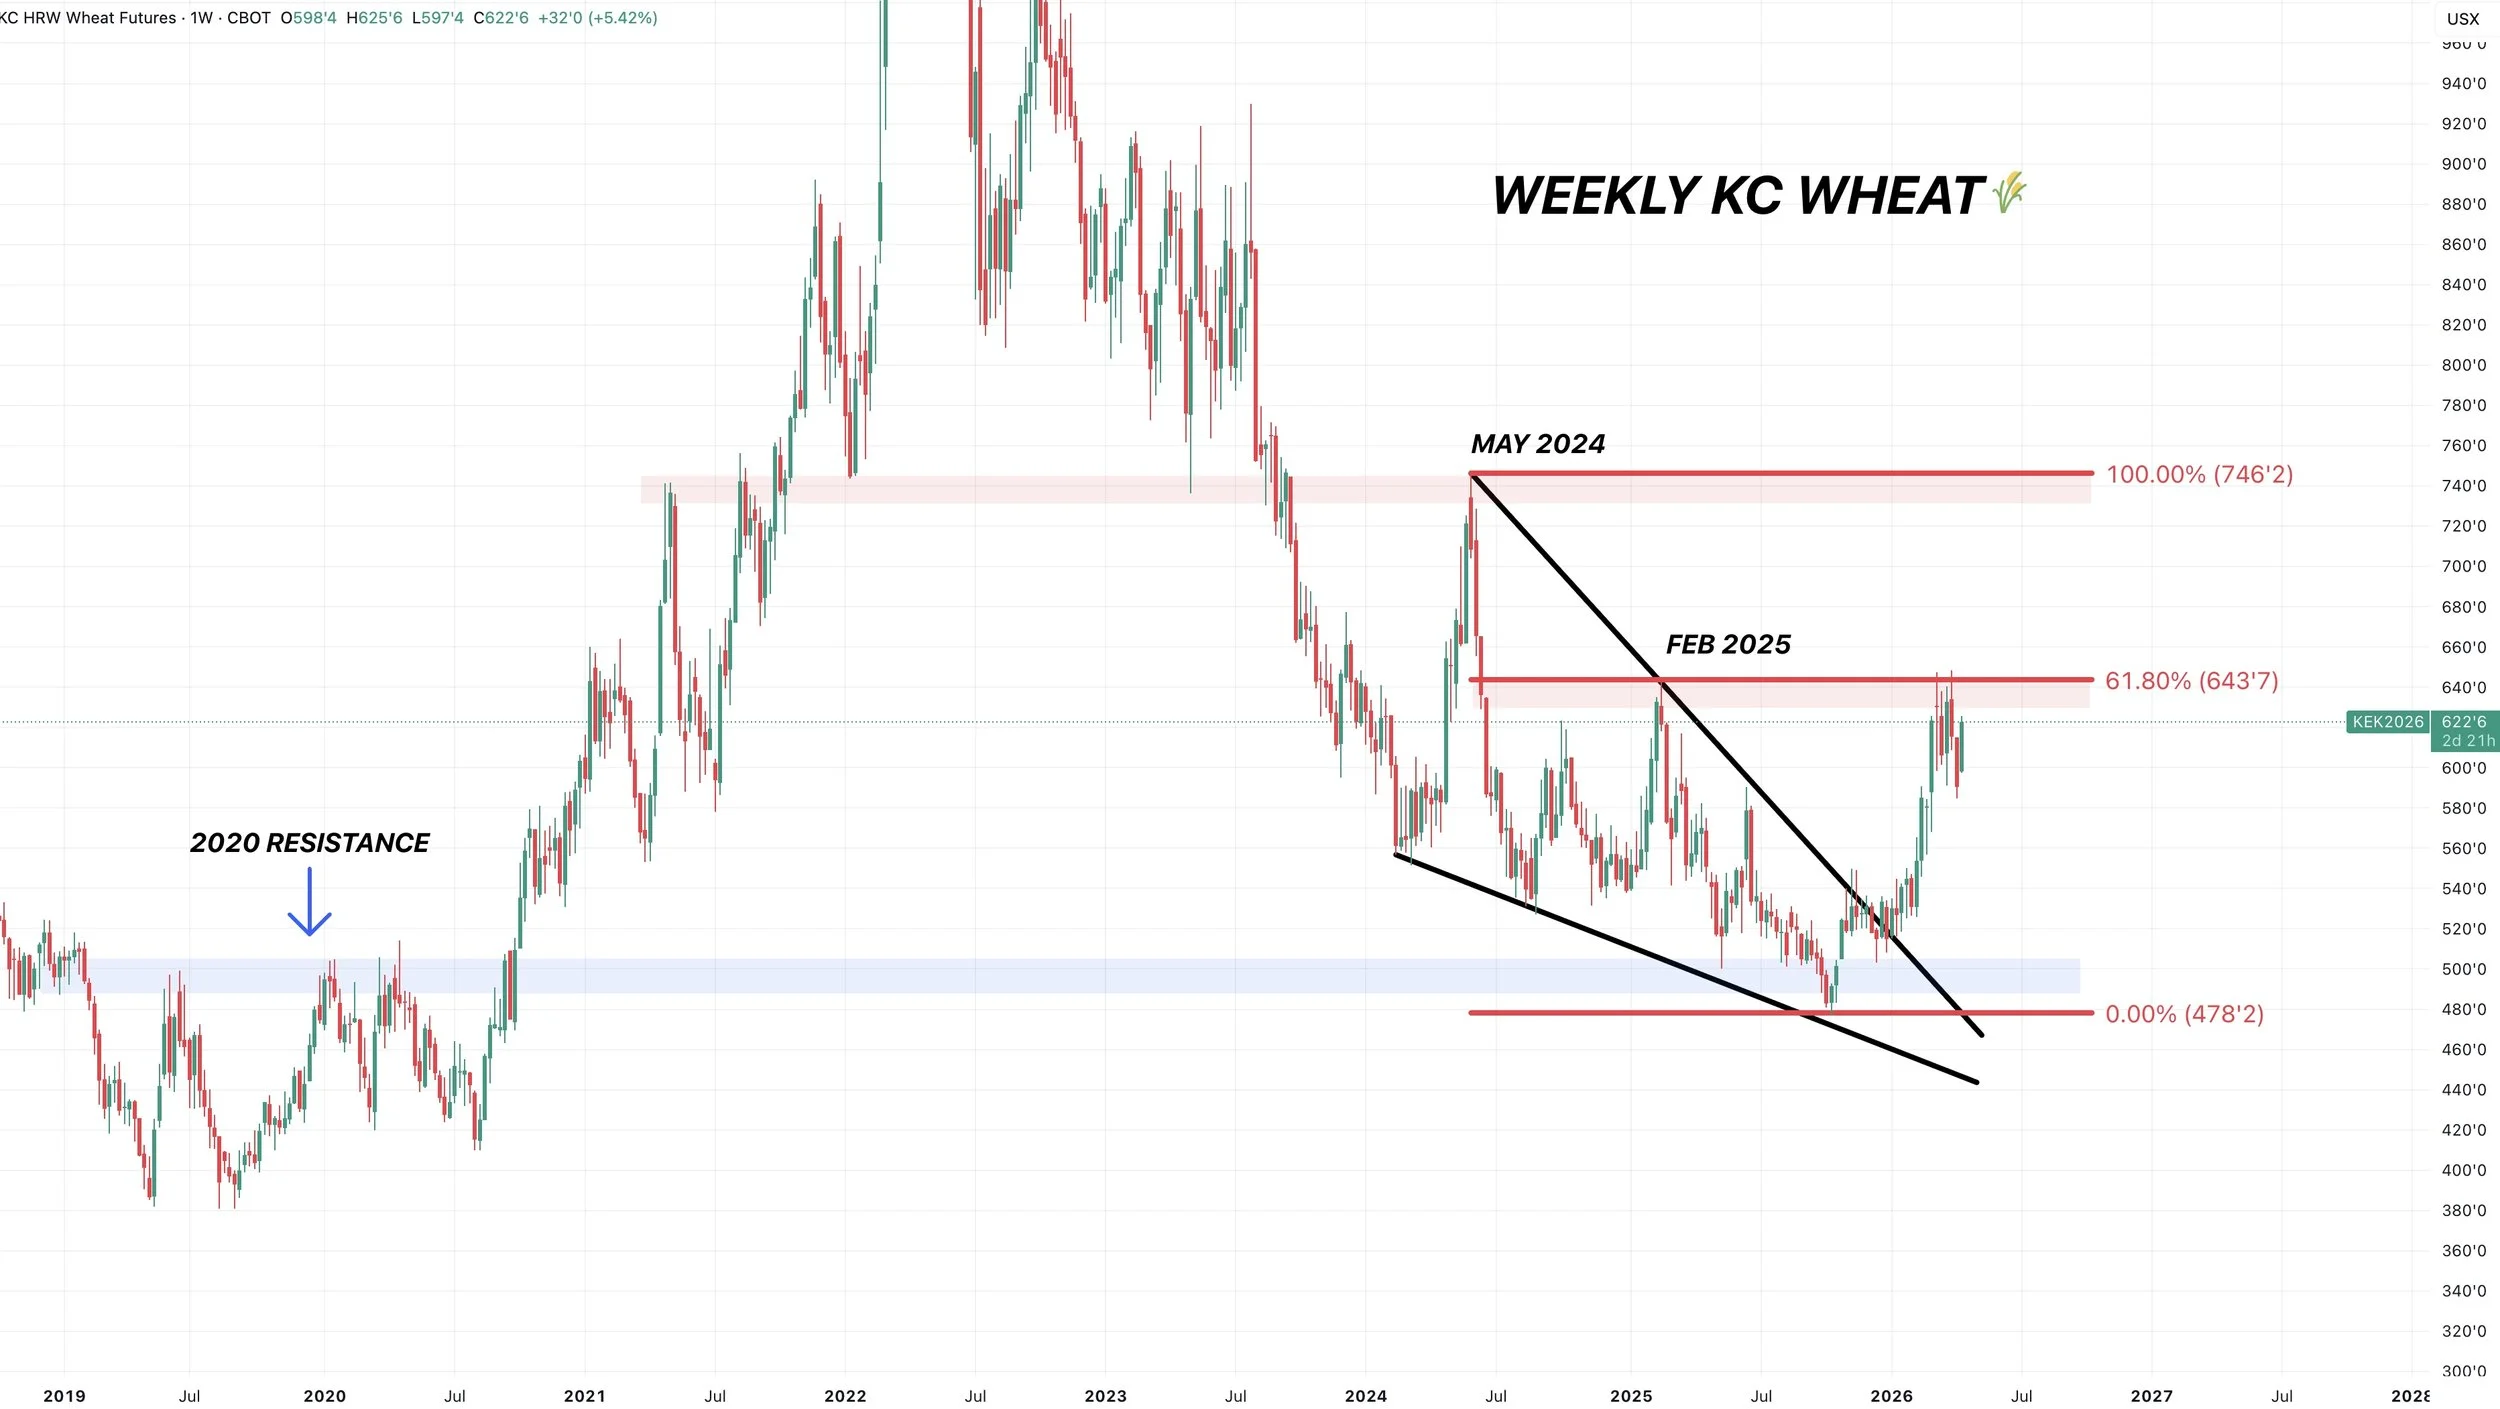
Big Picture Chart:
Those recent highs were also the highs from back in Feb 2025.
That same level clawed back 61.8% of the highs from May 2024.
It's clear resistance, hence why we've struggled there.
If you take out this level, there is plenty of room for this chart to run.
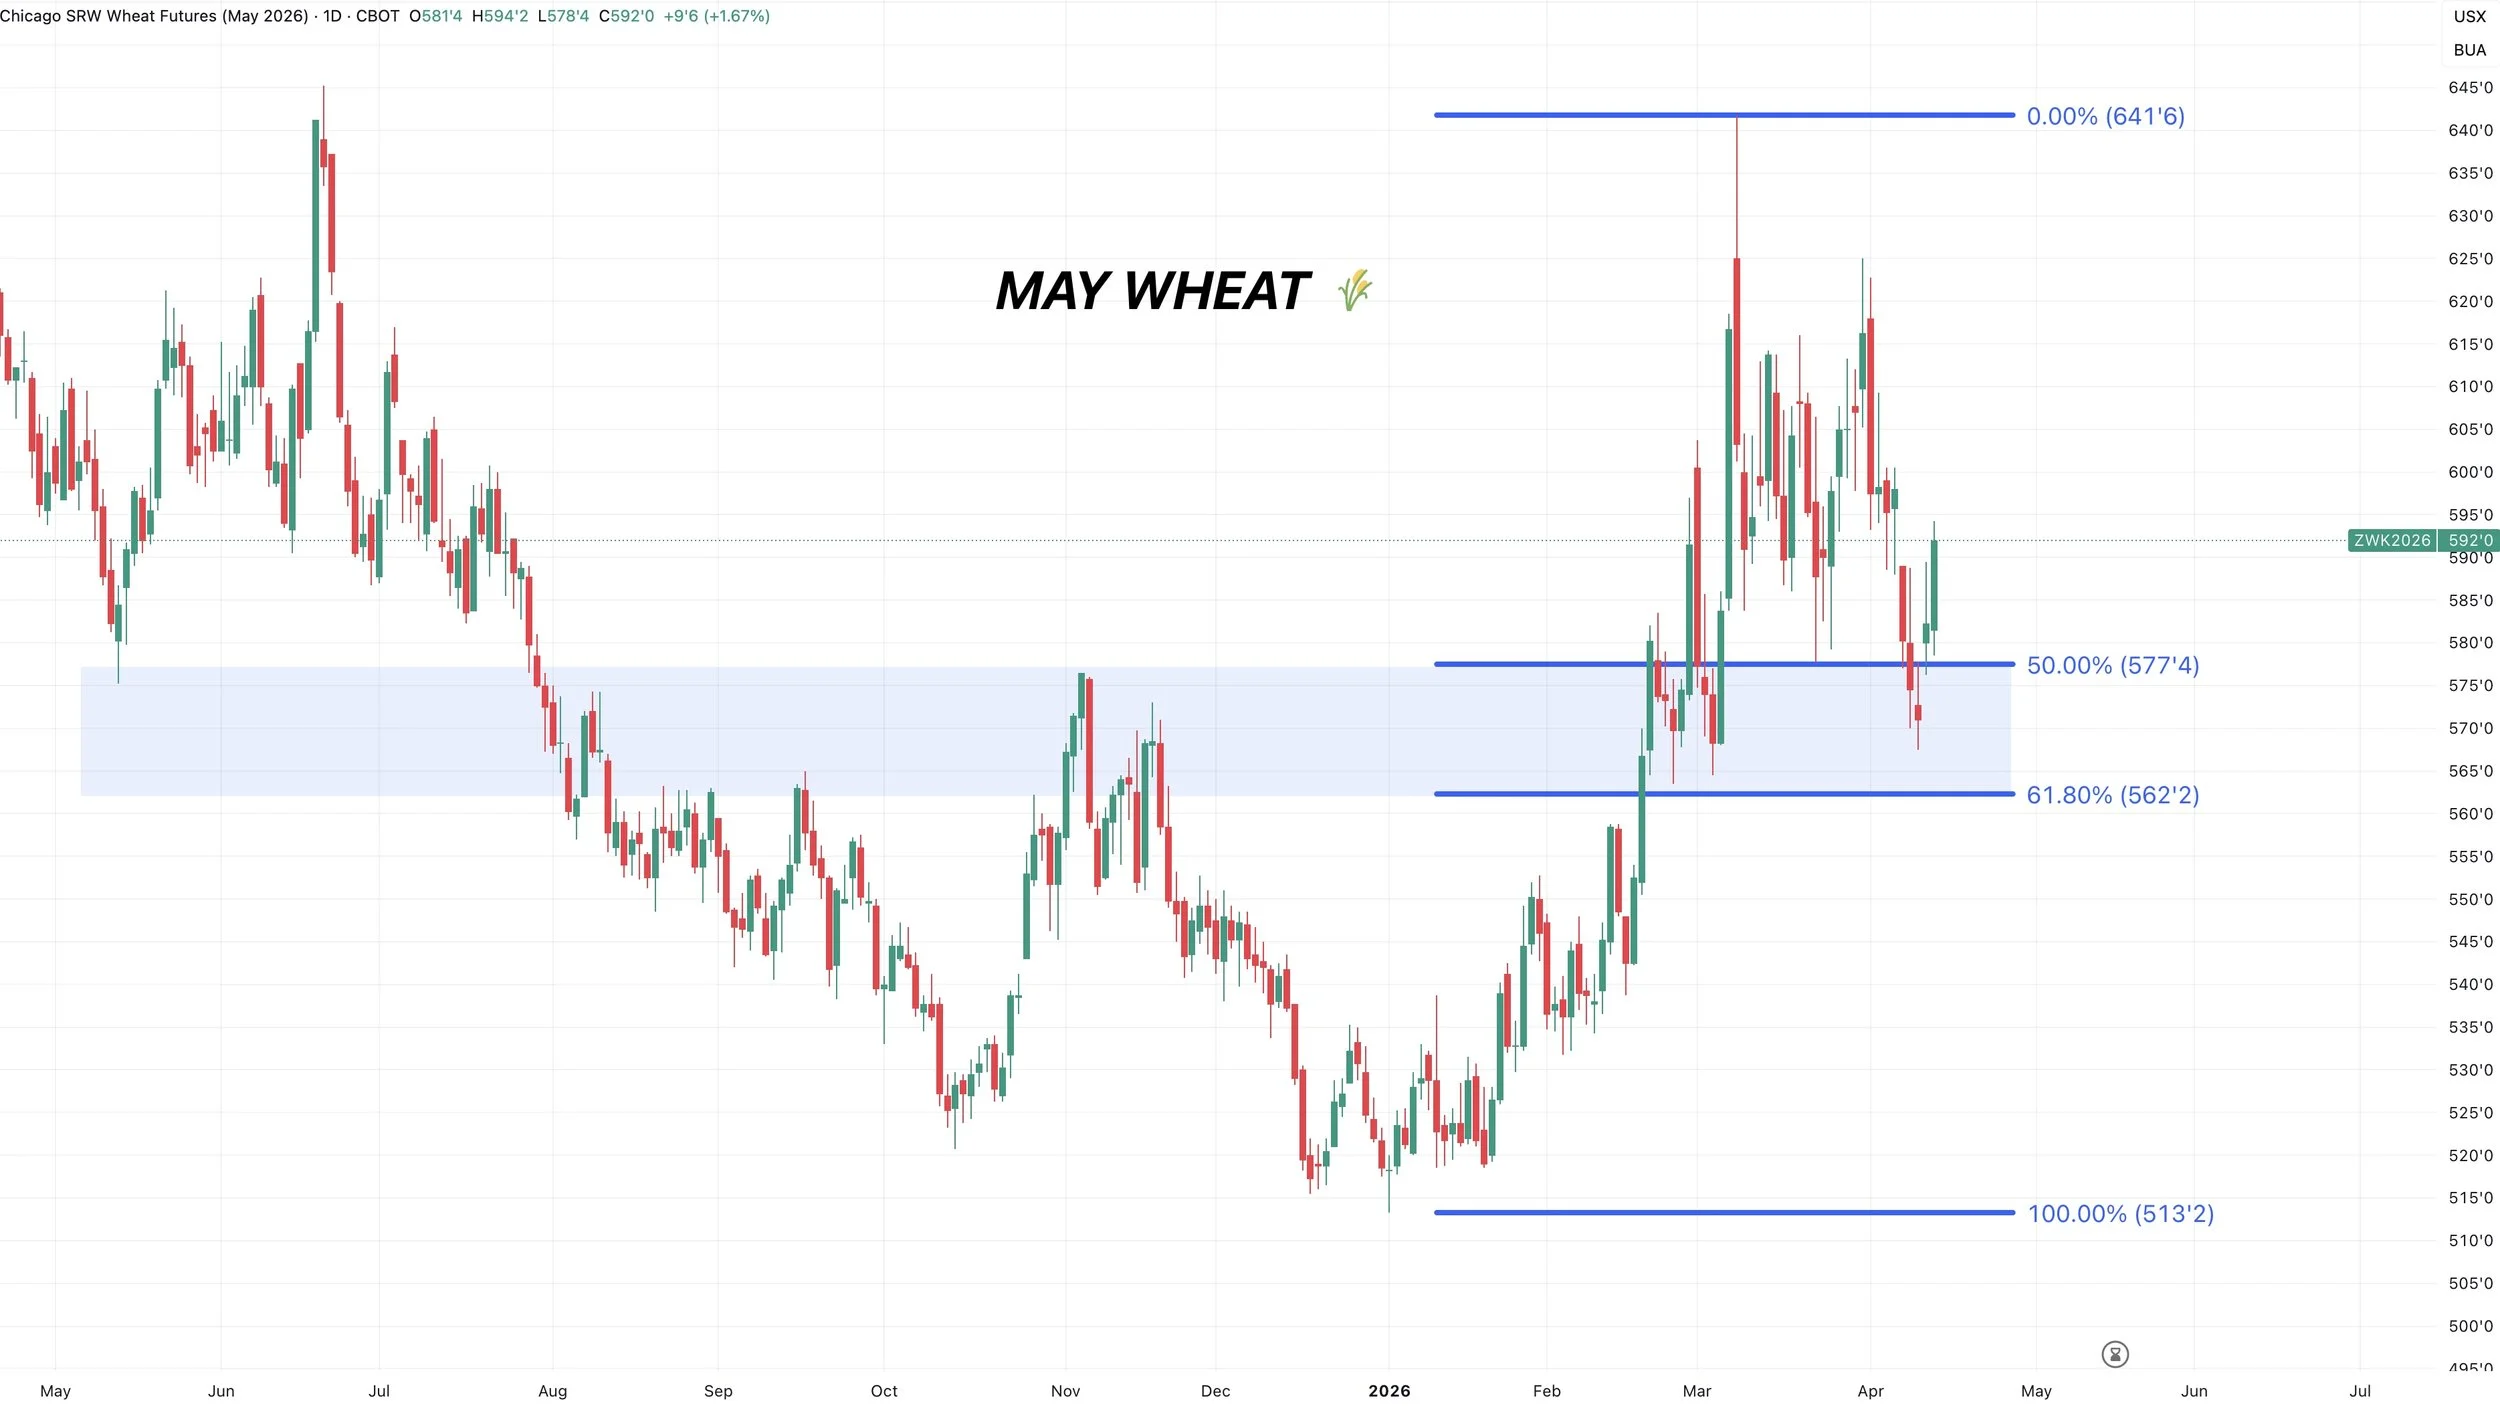
May Chicago Chart:
Held right where we needed to in the golden zone.
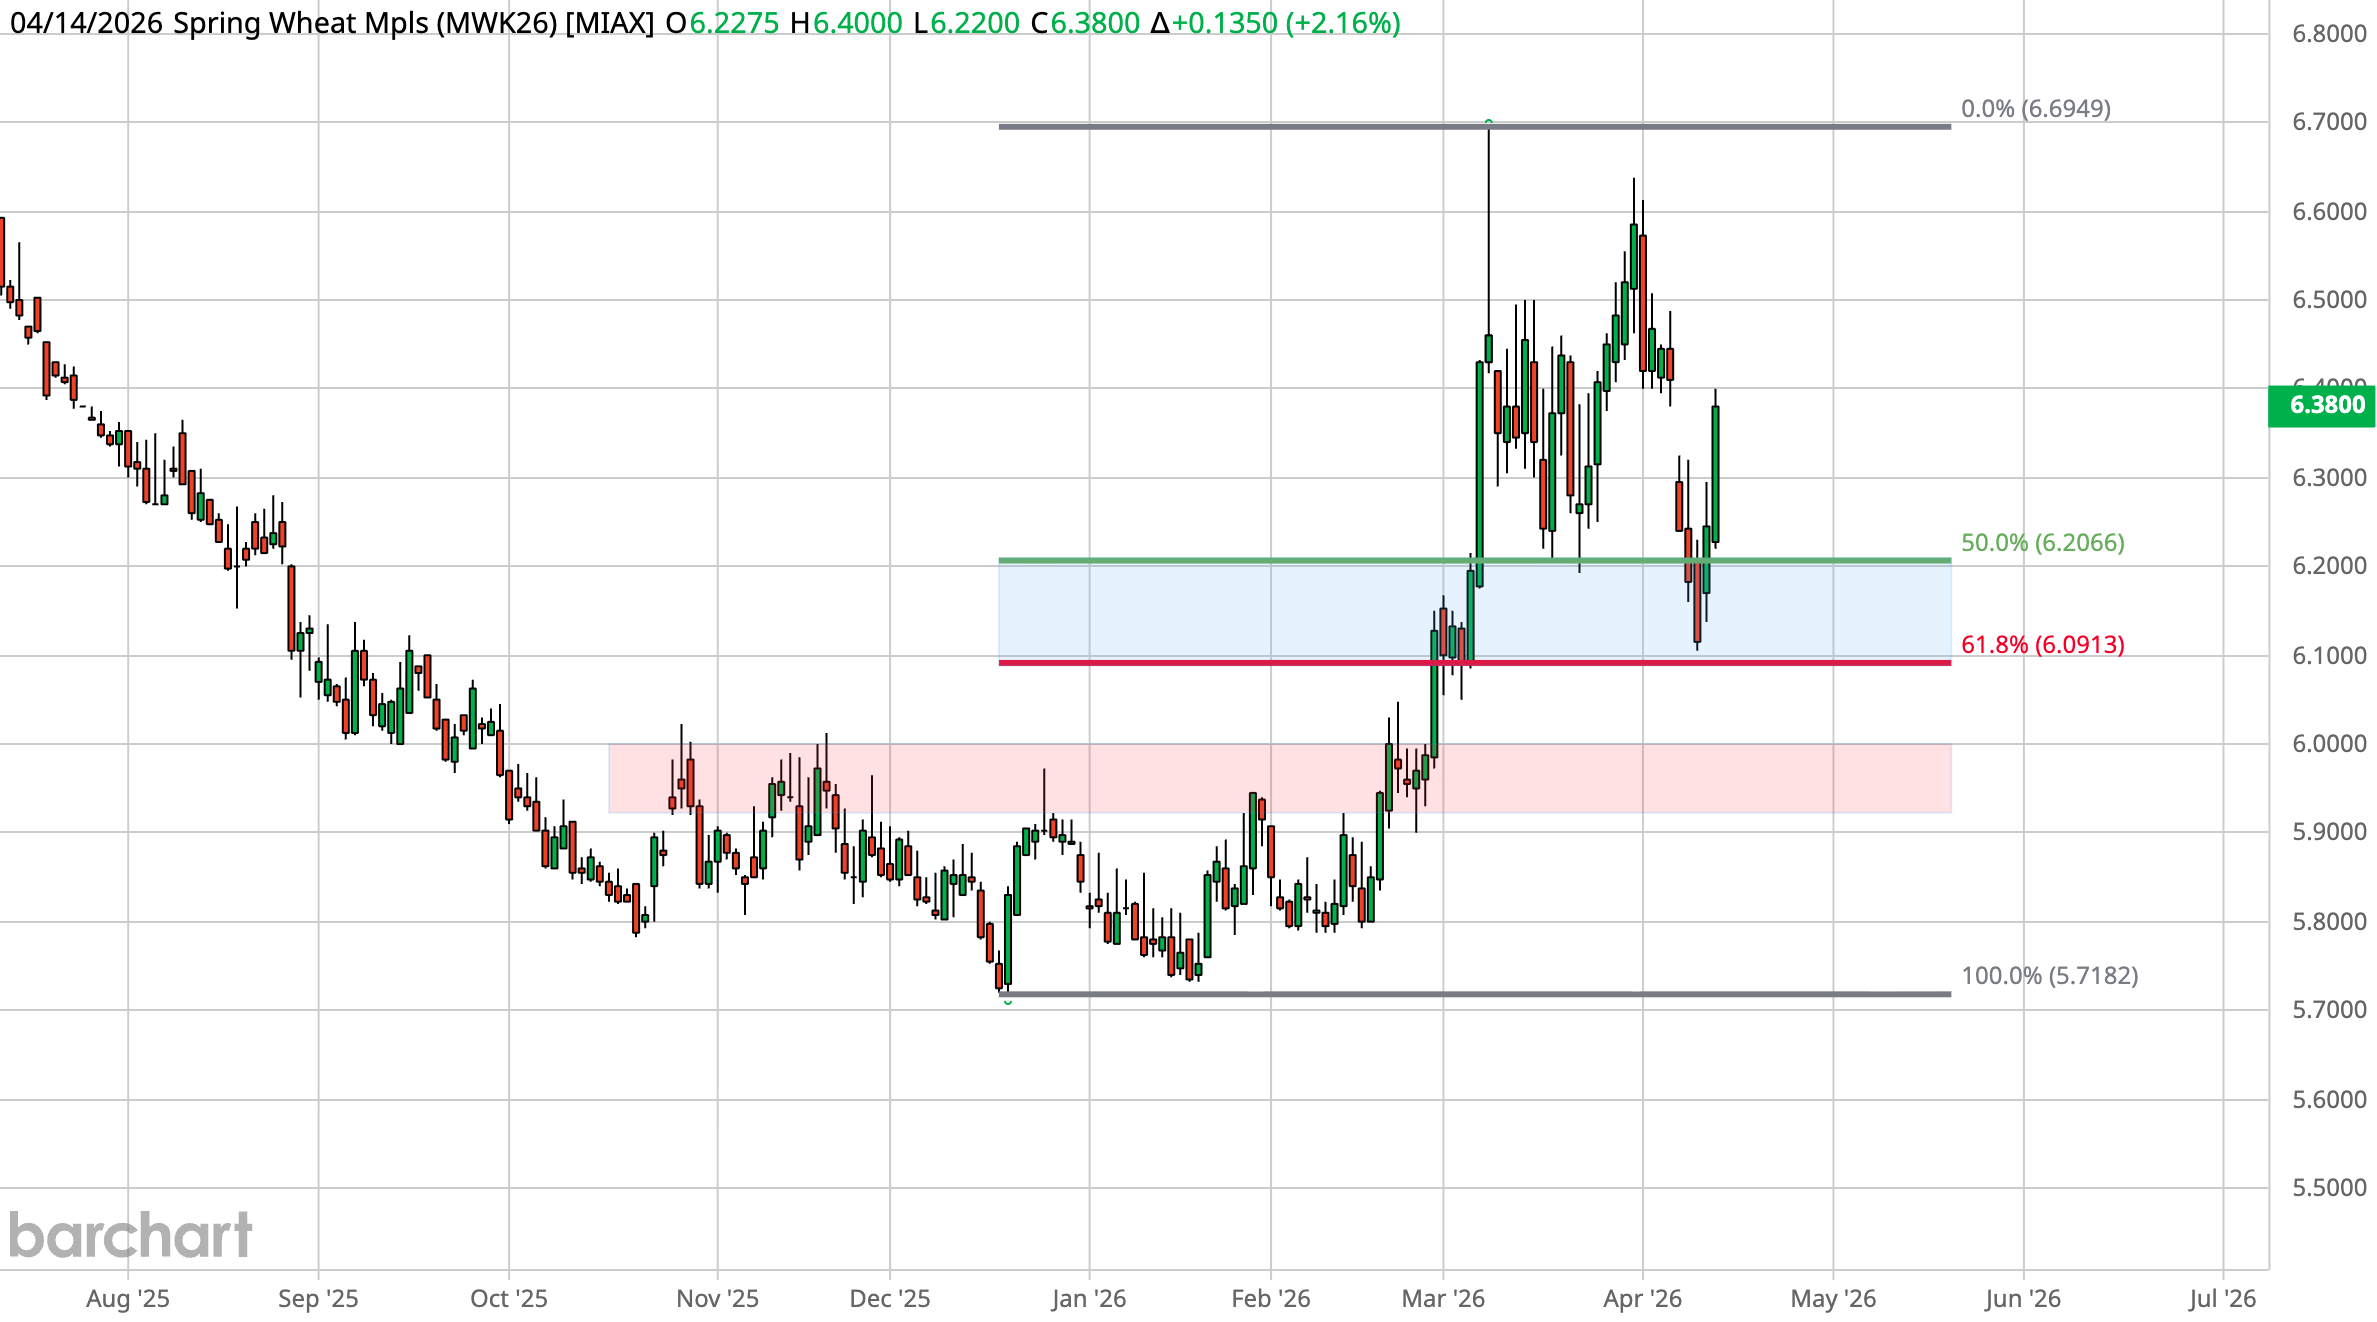
May MPLS:
Also held right where we needed to right at that 61.8% level.
Cattle
It appears like this rally has been mostly technically driven, and we've continued to be fueled by strong equities.
Live cattle posted a new all-time high today.
Even though it feels like this market wants to push higher, it still probably makes the sense to keep a floor under this thing if you don’t have one yet.
Cash trade was light last week as the packer is resistant to want to pay up at all-time highs.
We have a cattle on feed report on Friday.
Trade Expectations:
On Feed: 99%
Placements: 93.5%
Marketings: 93.7%
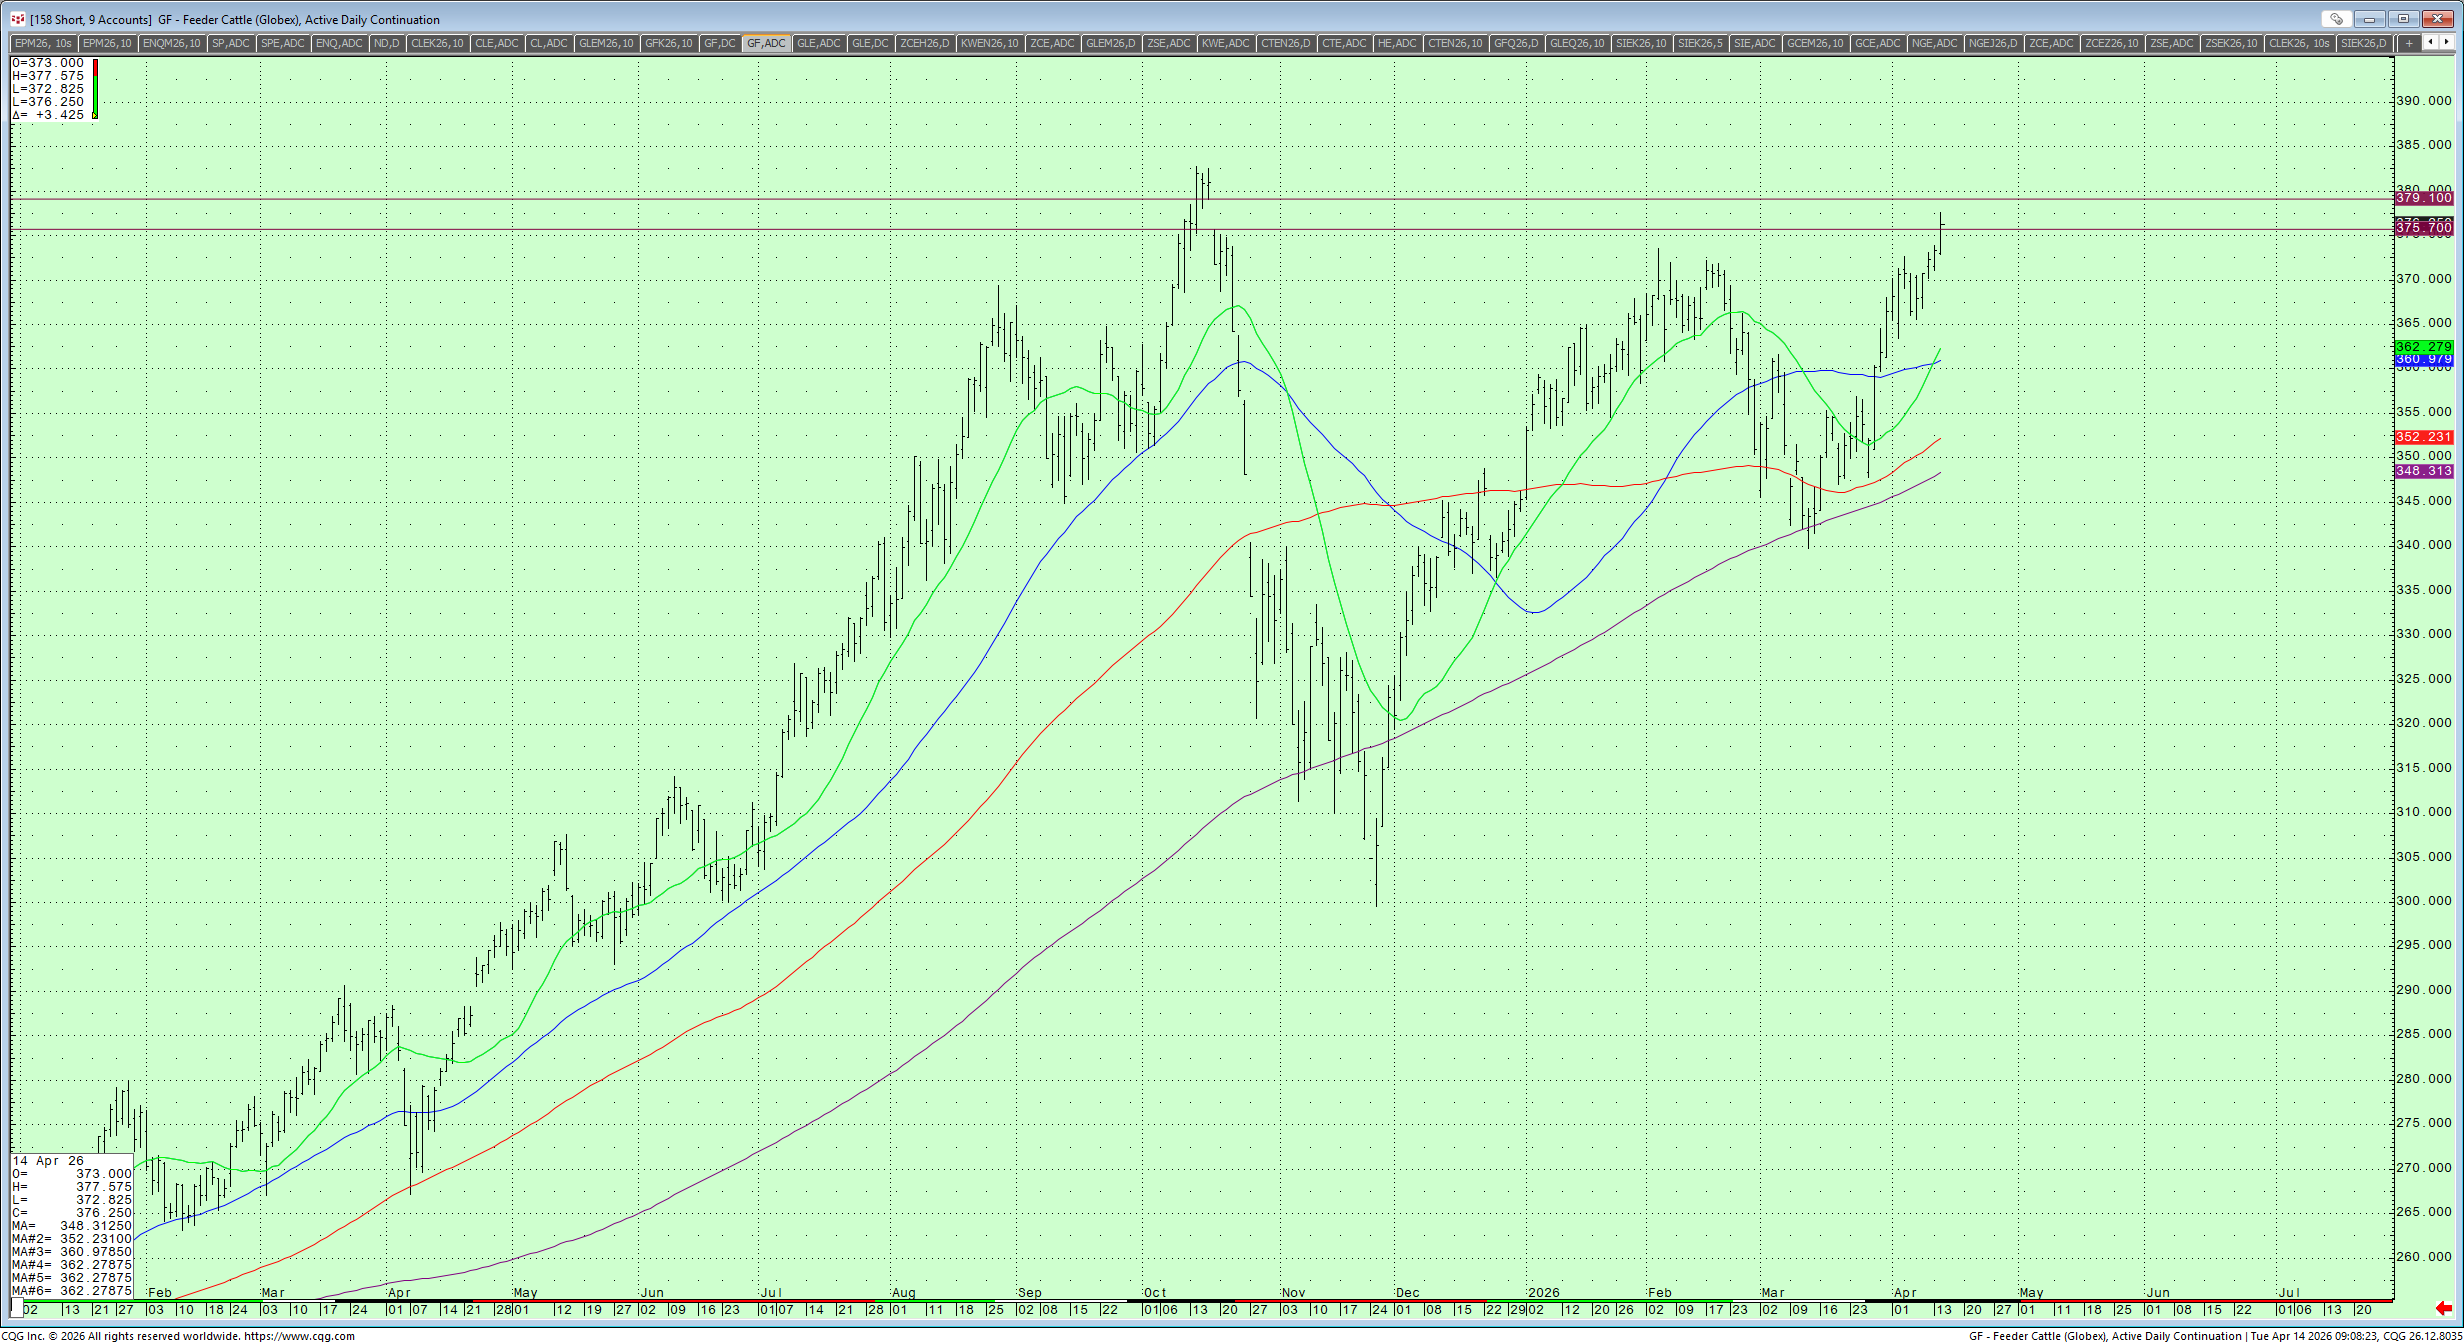
Feeders Active Daily Continuation Chart:
On this chart, we are nearing an unfilled gap at 379.10
Anytime you fill a gap like that, it's never the worst idea to protect your downside.
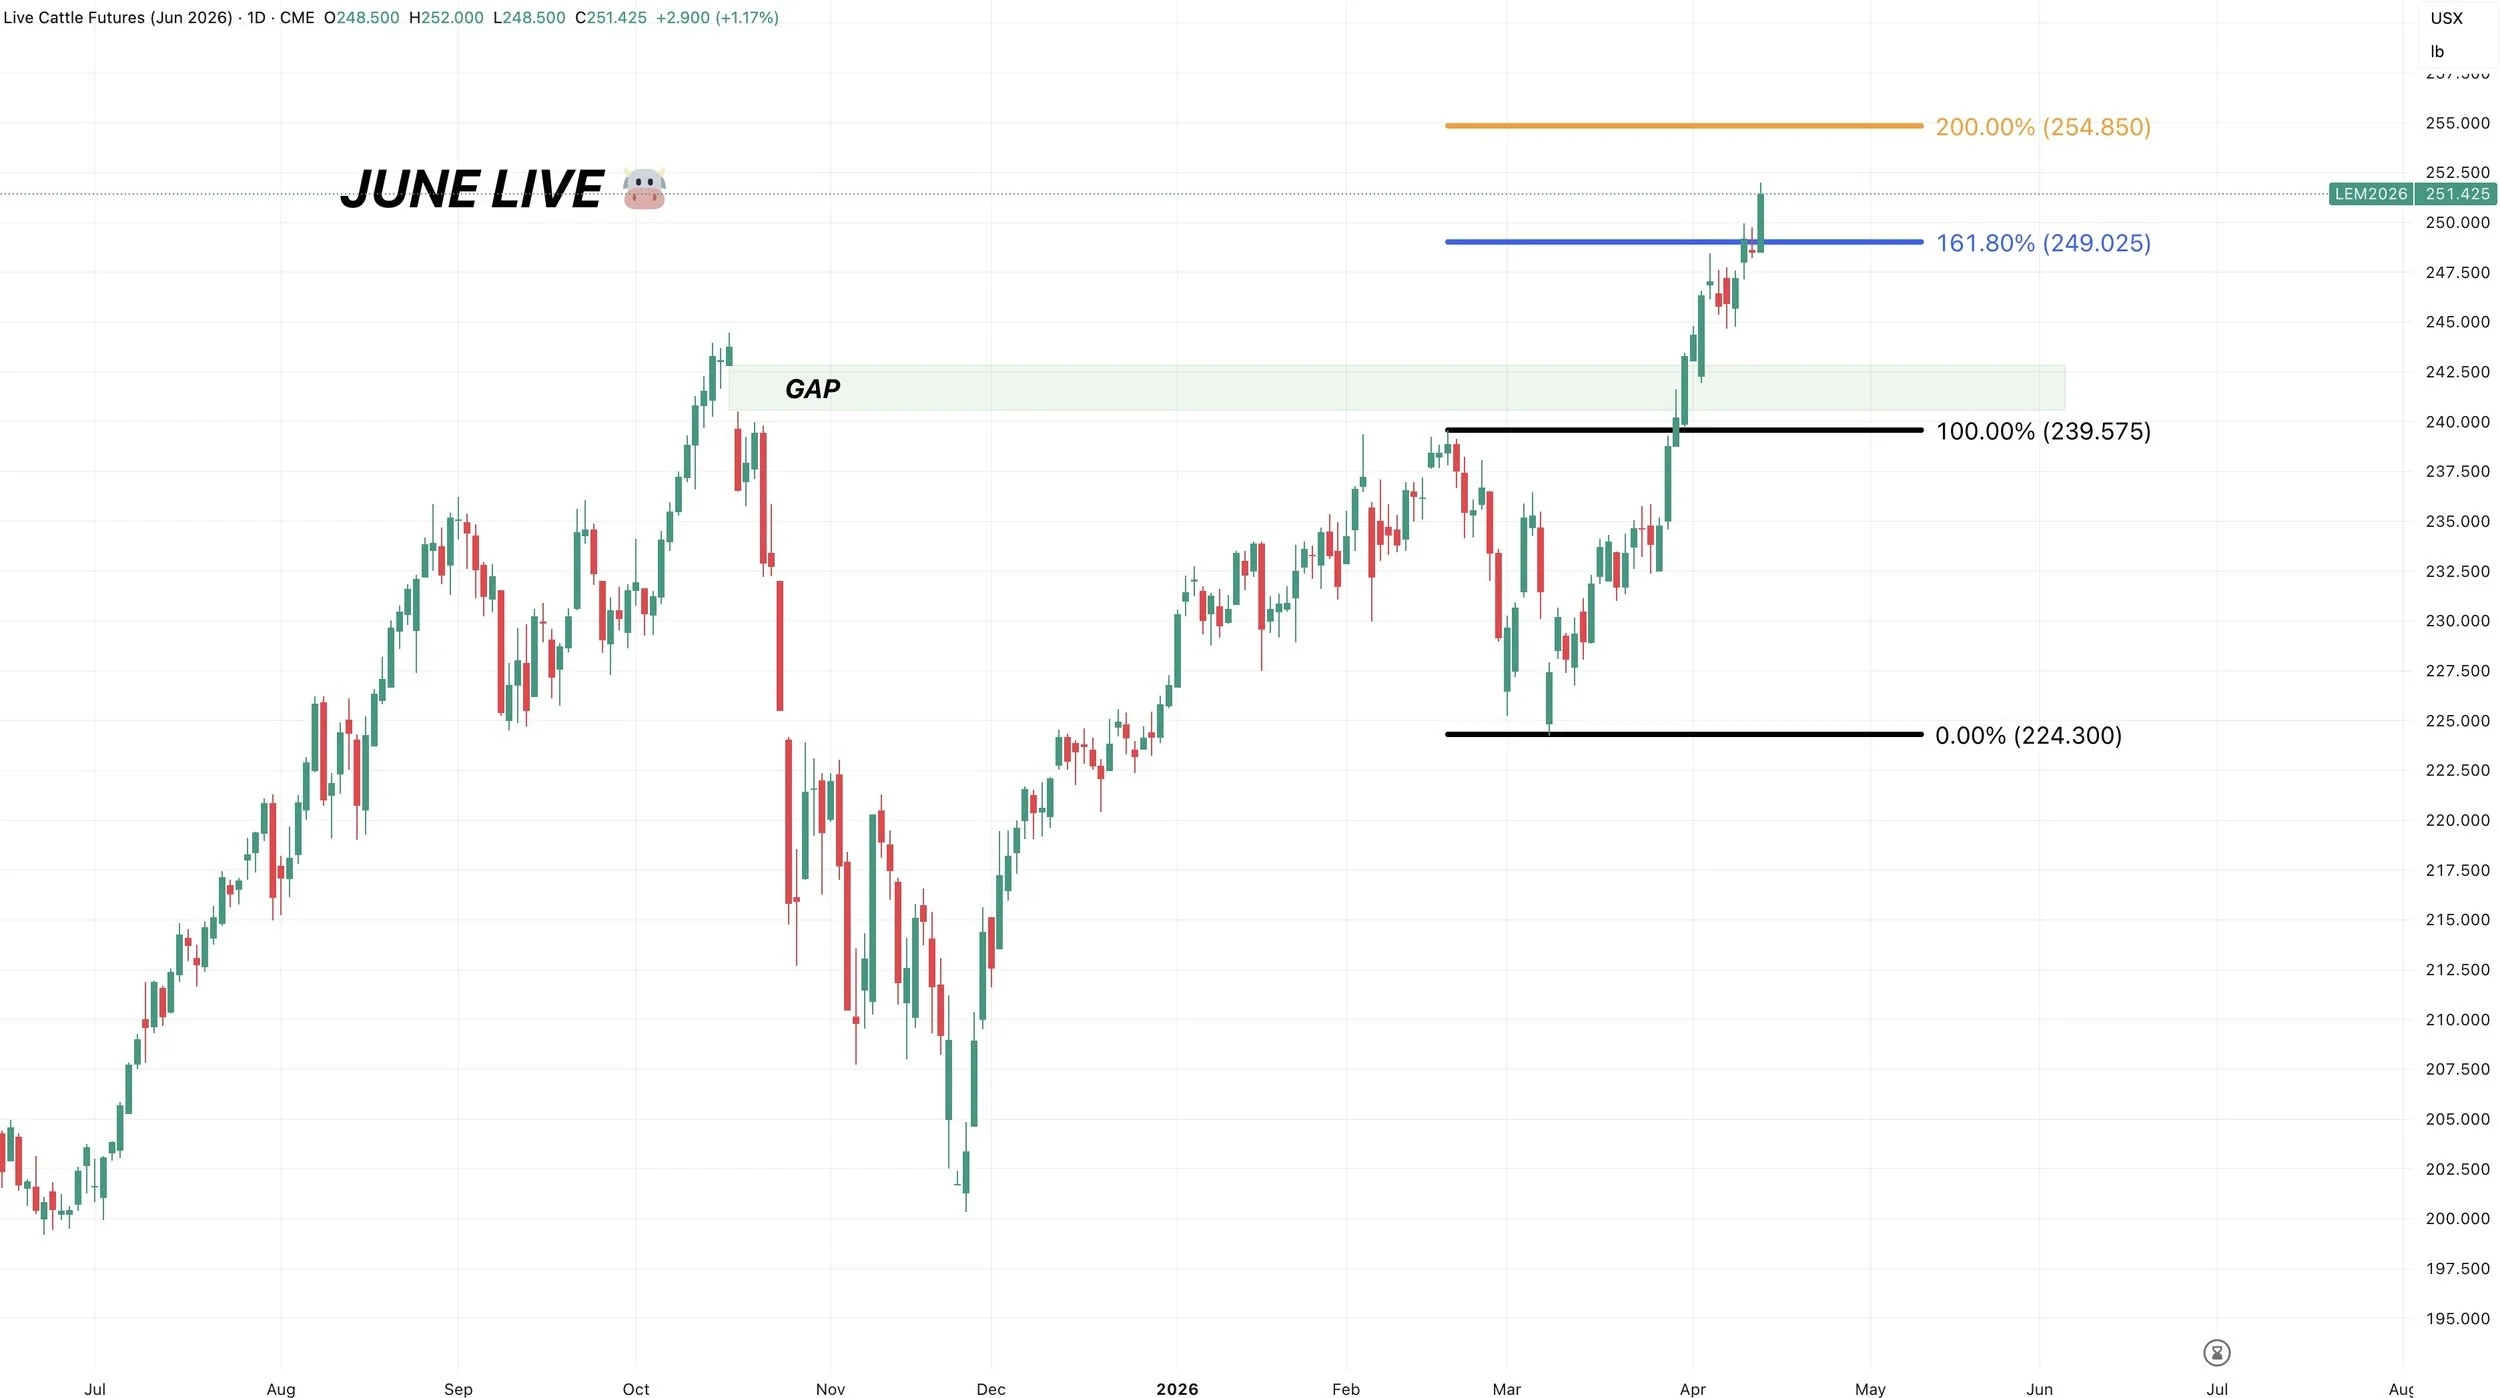
June Live Chart:
Sitting in between the 161.8% and 200% levels the February sell off.
This general area is a good spot to lock in some protection in my opinion, as it's often where rallies can stall.
Want to Talk?
Our phones are open 24/7 for you guys if you ever need anything or want to discuss your operation.
Jeremey & Office: (806)484-1214
Sebastian: (605)280-1186
Email: sfrost@dailymarketminute.com
Hedge Account
Interested in a hedge account? Use the link below to set up an account or give us a call.
Recent Signals
March 19th, 2026: 🌱
New crop soybeans signal & hedge alert.
CLICK HERE TO VIEW
March 9th, 2026: 🌱
Soybeans signal & hedge alert. Sent via text.
March 6th, 2026: 🌽 🌾
Corn & wheat sell signal & hedge alert.
March 3rd, 2026: 🌽
Old crop & new crop corn sell signal & hedge alert.
Feb 26th, 2026: 🌱
Old crop & new crop beans sell signal & hedge alert.
Feb 19th, 2026: 🌾
KC wheat sell signal & hedge alert.
Feb 6th, 2026: 🌽 🌱
Old crop corn & soybean sell signal & hedge alert.
Feb 4th, 2026: 🌱
Soybean sell signal & hedge alert.
Nov 17th, 2025: 🌱
Soybean sell signal & hedge alert.