
LAST YEARS CROP OVERSTATED?
AUDIO COMMENTARY
War back on and crude rallying
War isn’t good for China relation
Grains gapped open higher overnight
Filled gaps in beans & wheat
Today’s corn sell alert. For you?
Why the morning corn alert? Chart below*
Do you have to move stuff or not?
Fridays wheat sell alert
Closed well off the early highs
Funds bought a lot of grain
If yield slightly falls it changes things fat
Seasonals aren’t friendly yet
Last years crop might’ve been overstated
Why there is plenty of potential
Haven’t hit trend outside last year in a long time
Is supply falls and demand doesn’t the situation could get pretty tight
Want to hold last weeks lows
Crop conditions improved
Bearish divergence on charts. Charts below*
Full chart breakdowns below*
Listen to today’s audio below
Want to talk?
Office: (806)484-1214
CHARTS
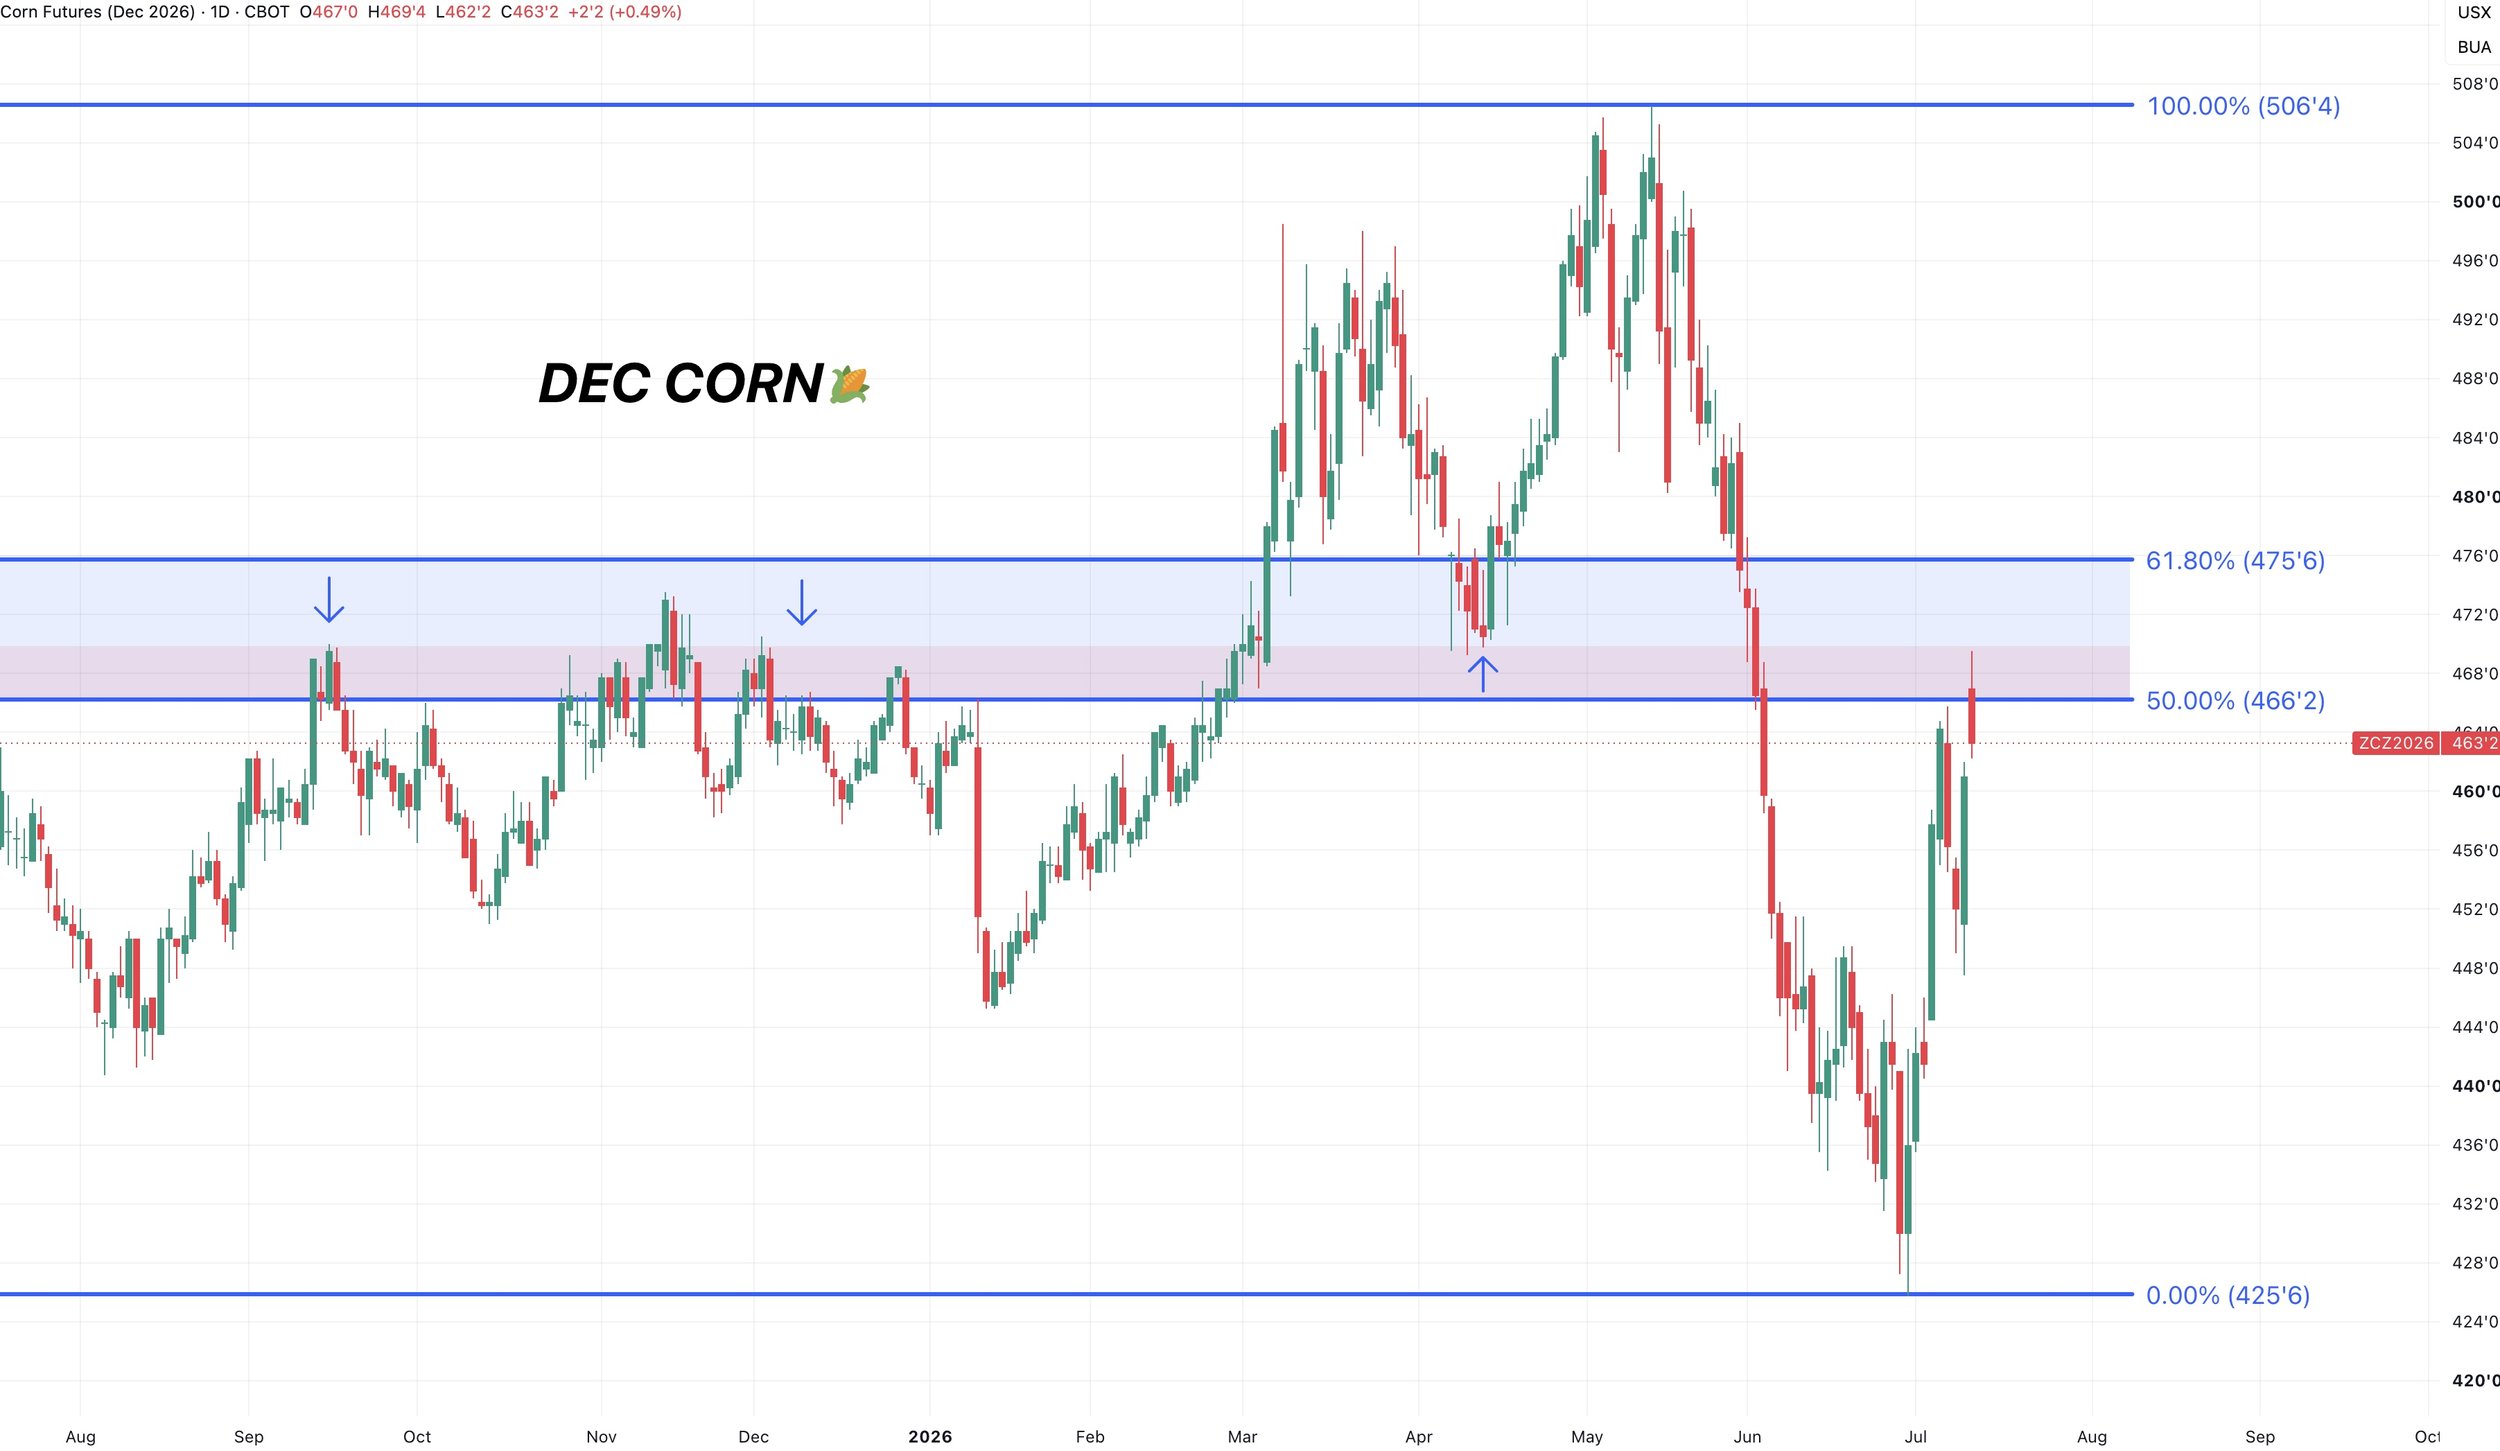
Dec Corn 🌽
We gapped open higher but closed well off the highs. We did not quiet fill that gap, so it’s still unfilled.
The reason for the sell signal this morning was that we were approaching a key level.
$4.66 clawed back half the entire sell off. Between here and the 61.8% level is the most common place for bounces to fail.
$4.70 is where the market failed multiple times back in the fall. $4.70 is also where the market bounced at in April. So it’s been key support and resistance on several occasions.
That of course doesn’t mean we “have” to fail here. But it’s a level we want to defend.
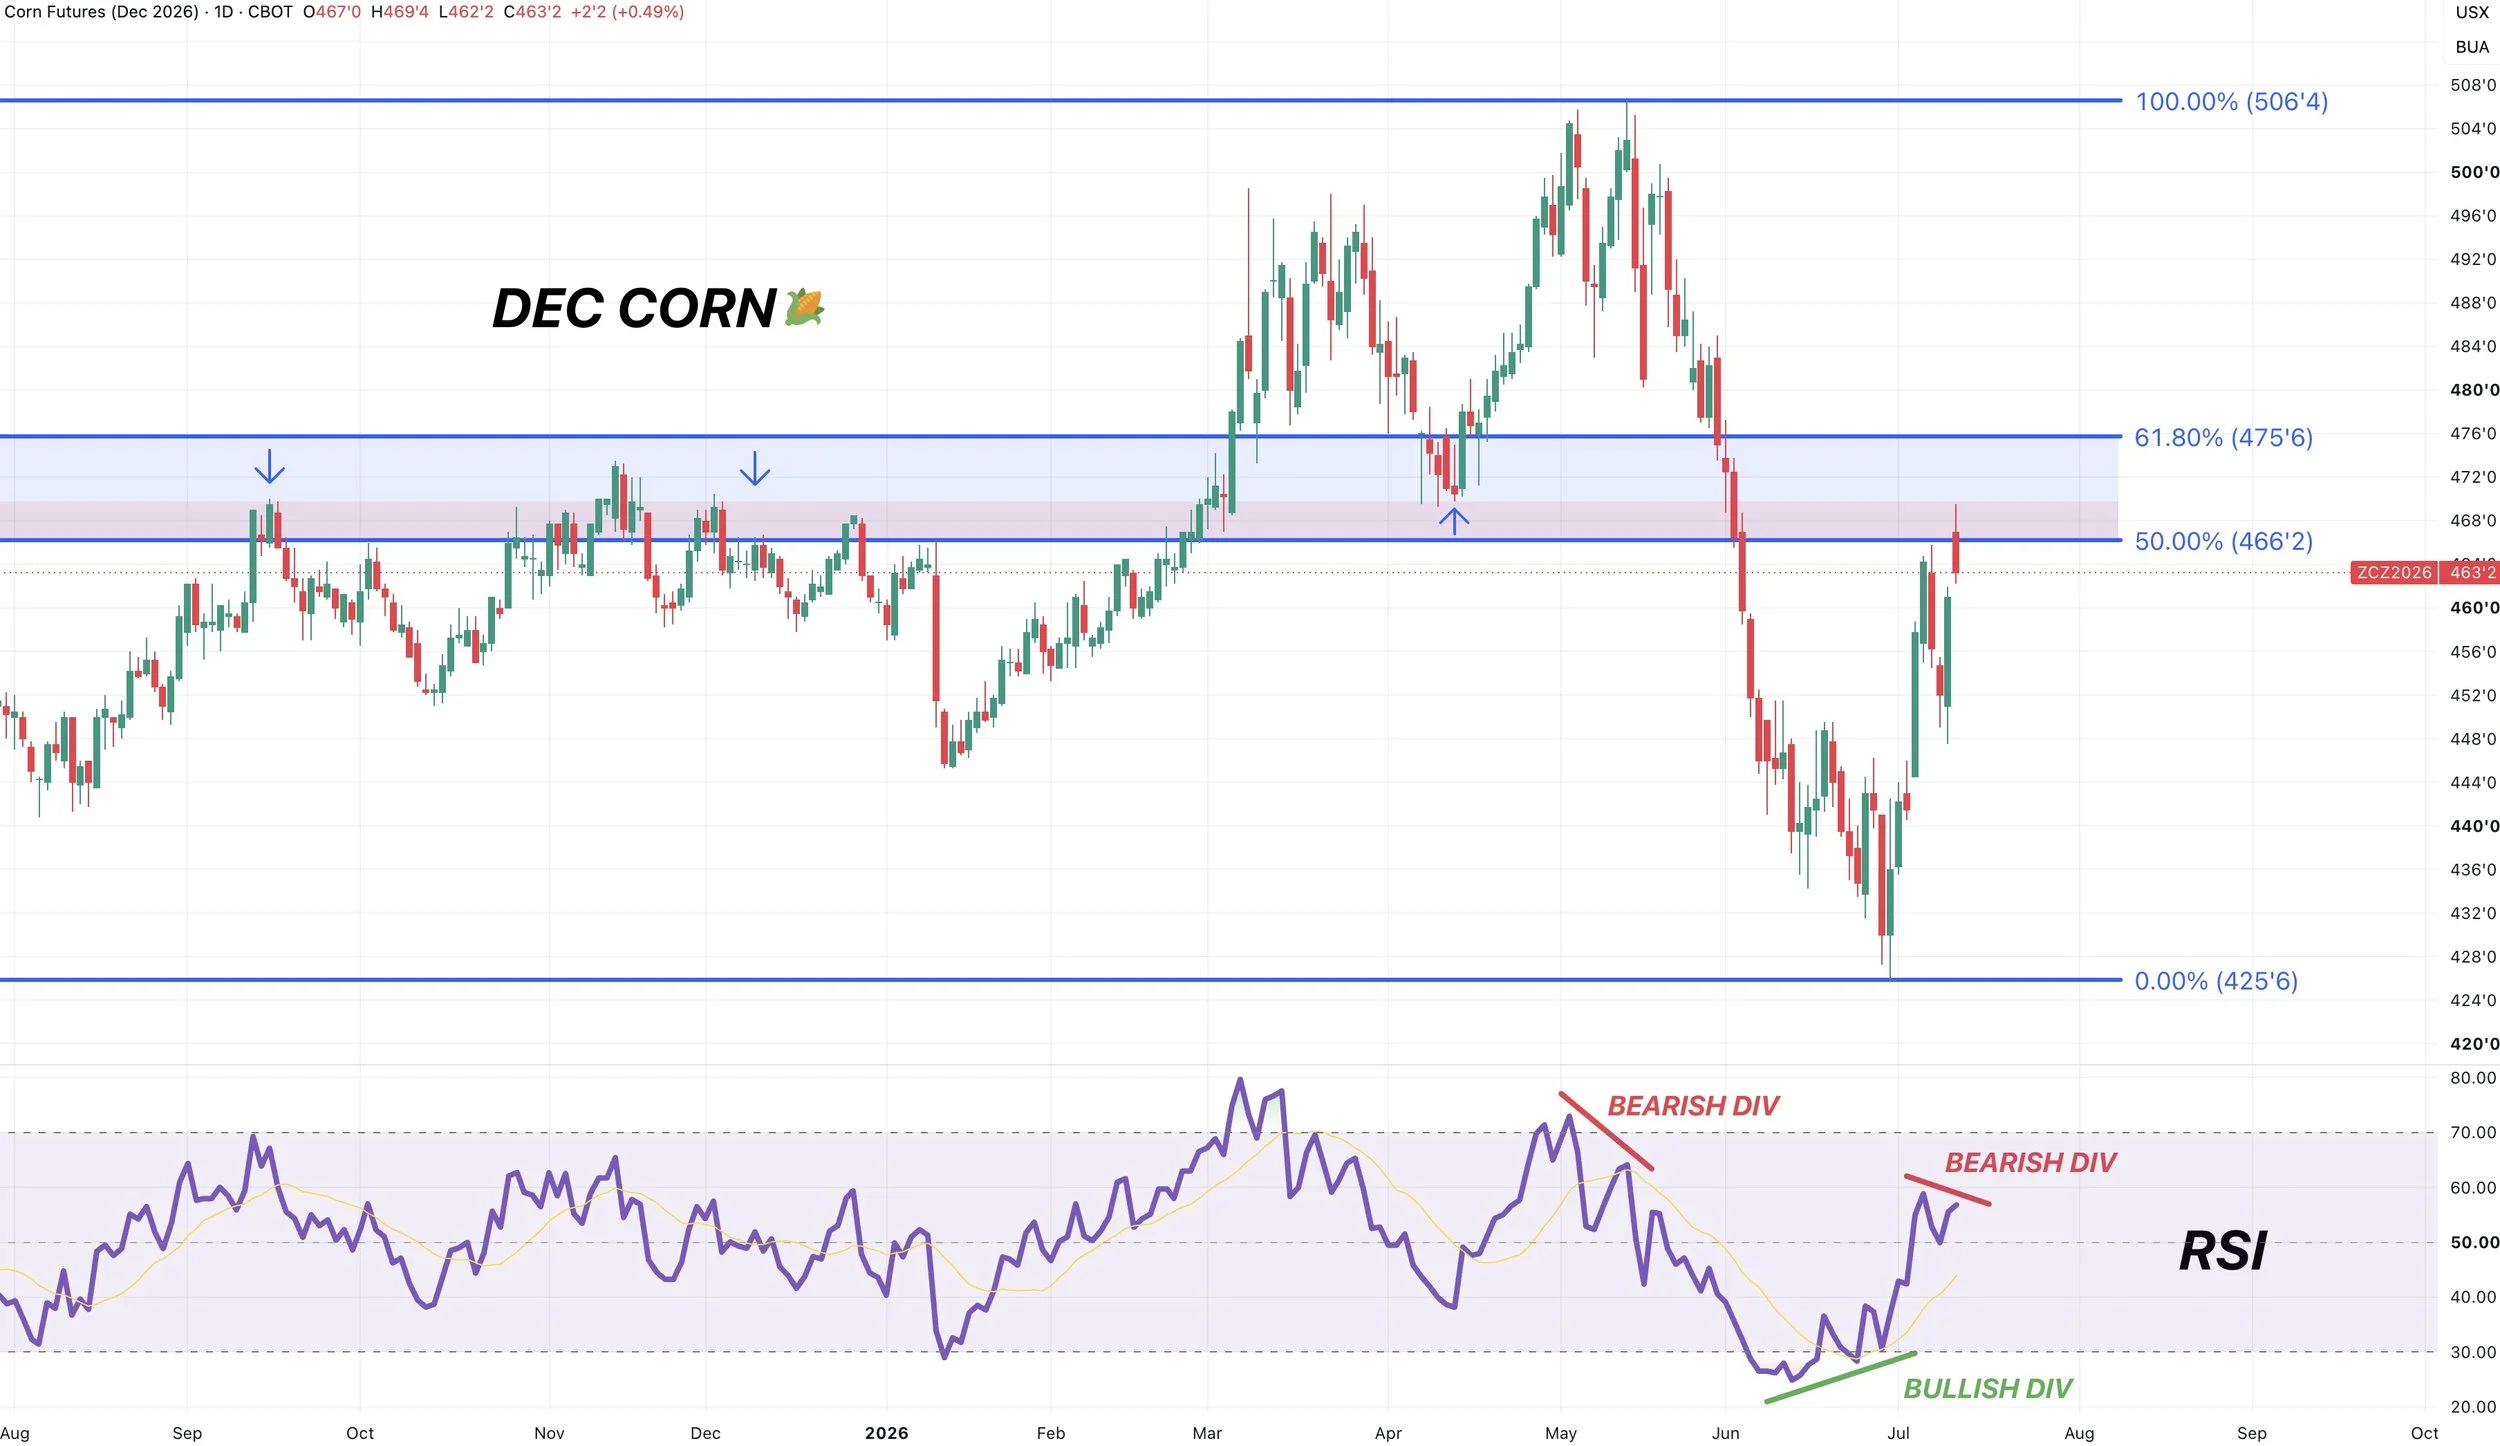
Dec Corn Bearish Divergence 🌽
Here is another reason for caution.
We are showing some potential bearish divergence on the RSI.
Prices made new highs. Prices did not. This can often be a sign that upside is losing momentum.
What marked the highs in May? Bearish divergence.
Similiarly to how bullish divergence just marked the recent lows.
Divergence is not an end all be all indicator. It can become invalidated. But it is a reason for caution.
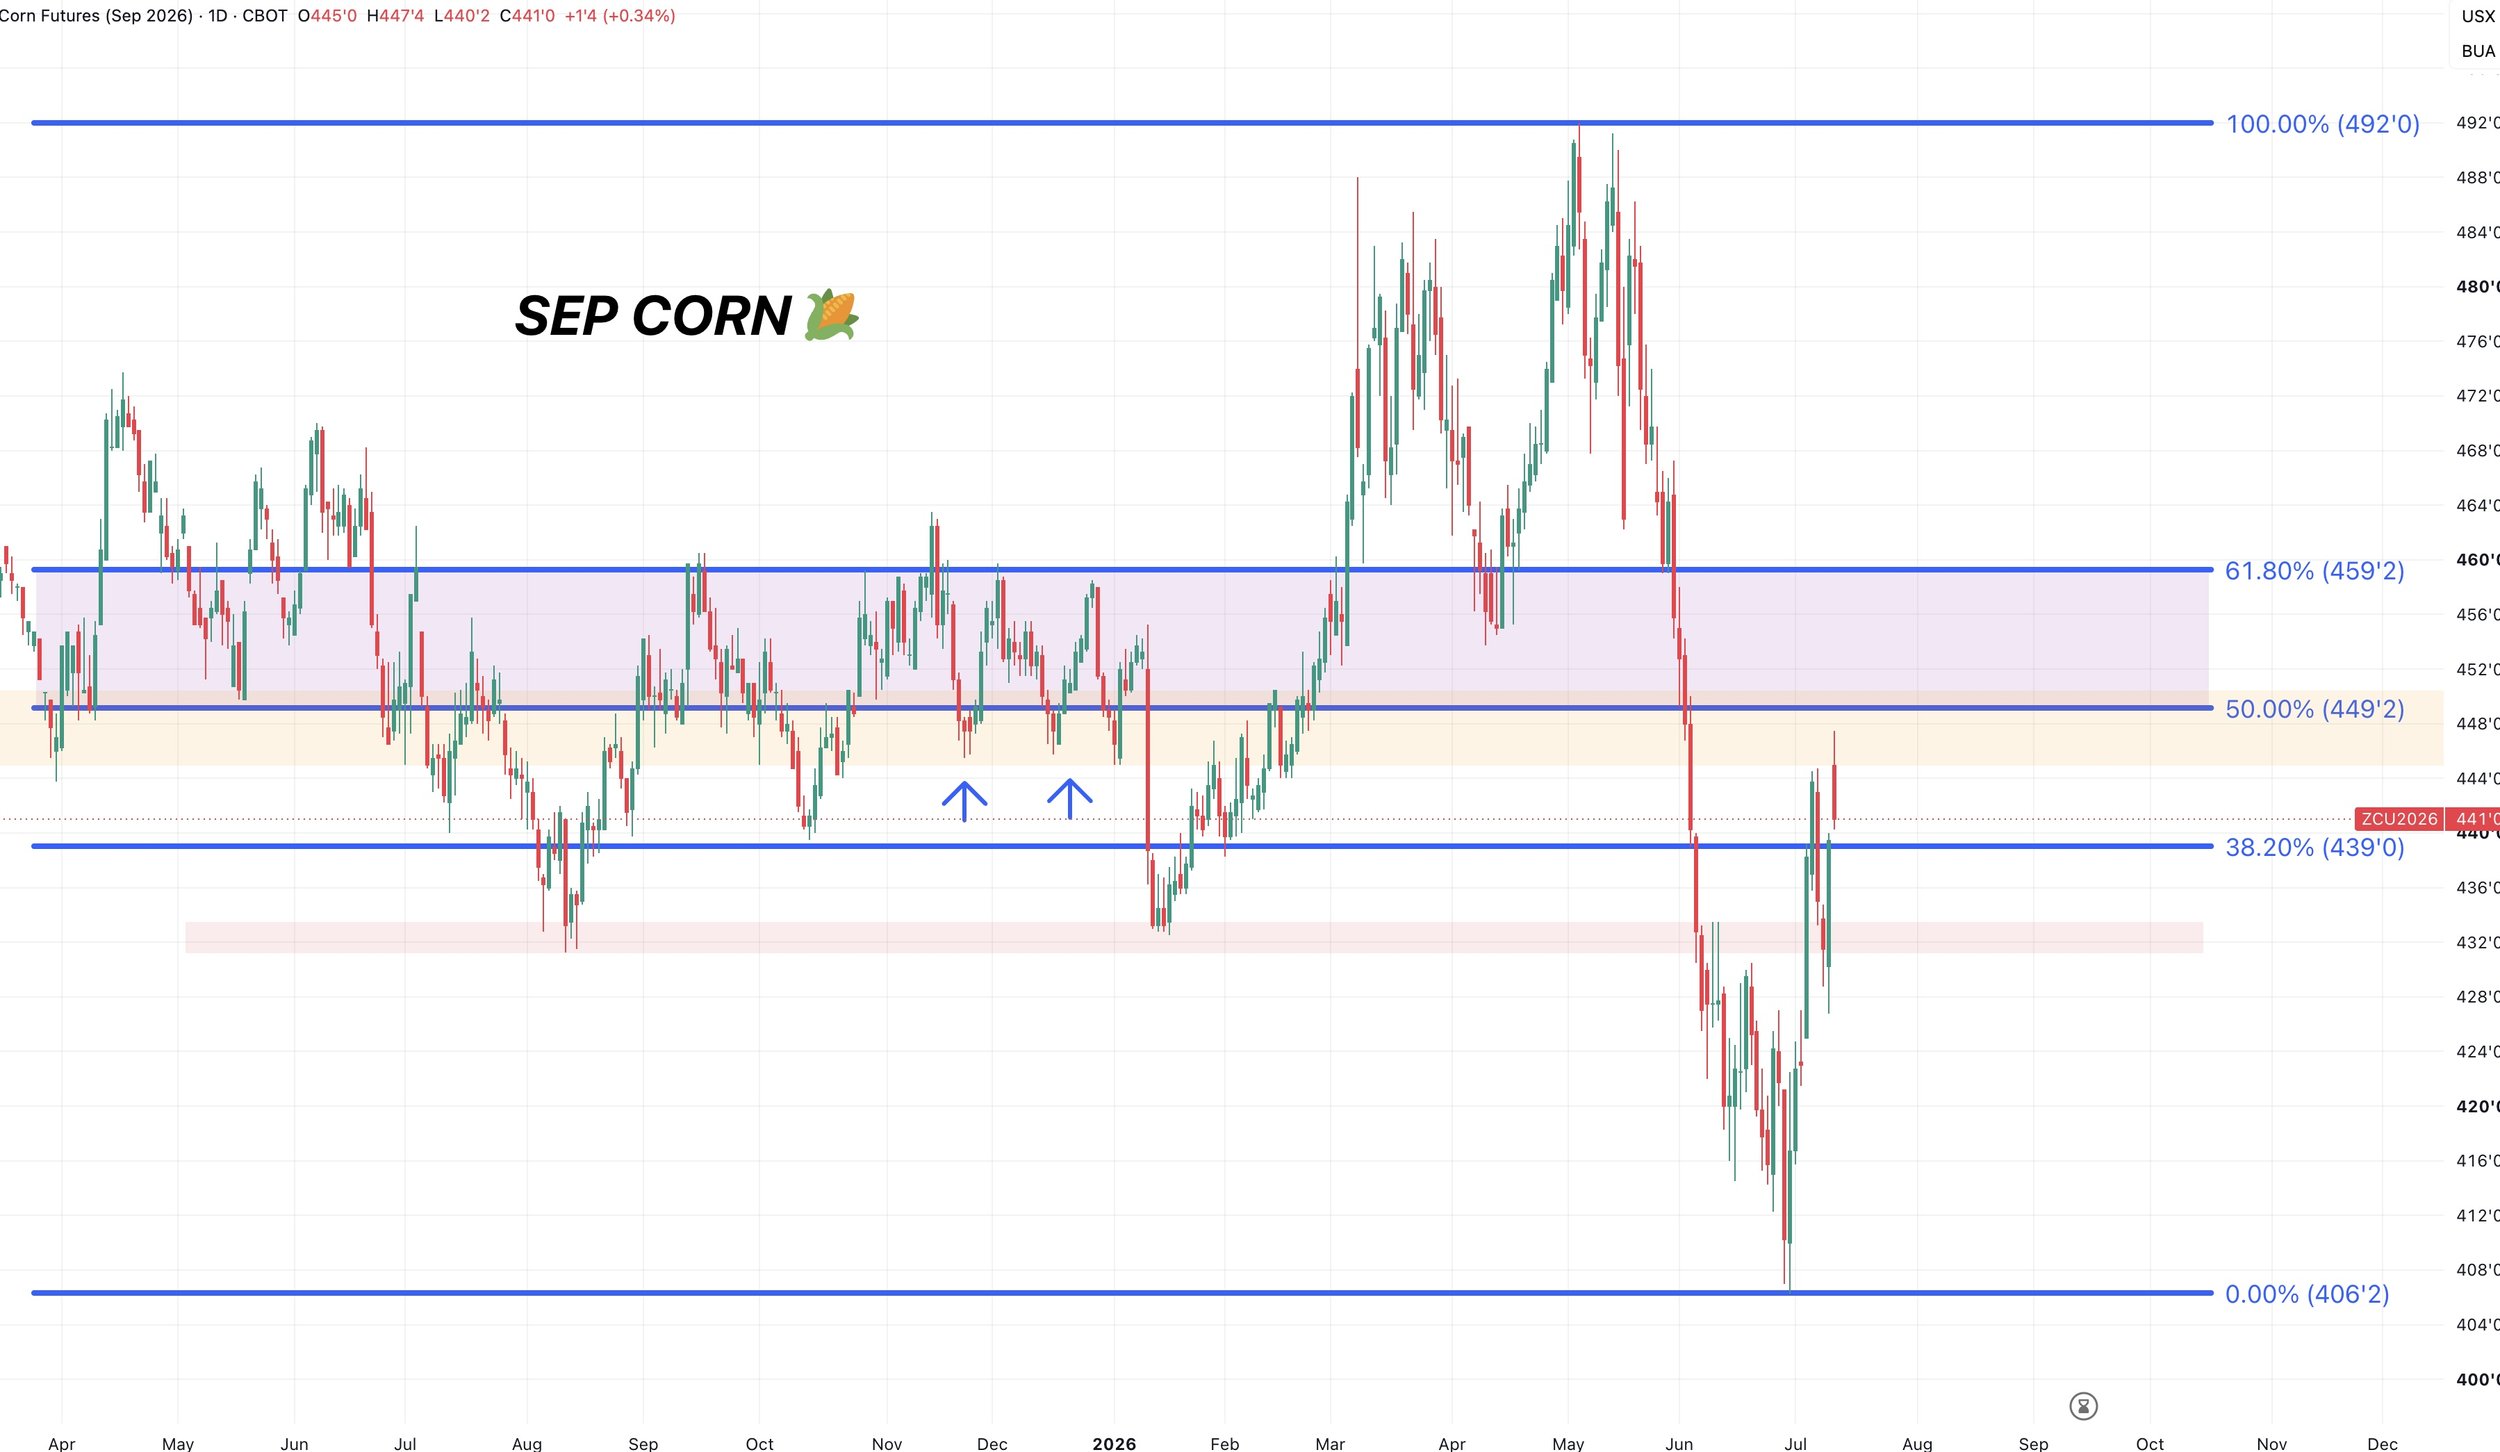
Sep Corn 🌽
We nearly hit the 50% retracement at $4.49. We’ve lagged Dec.
However, we did run up against those lows from last fall. Right where we boucned multiple times.
Old support can offer resistance.
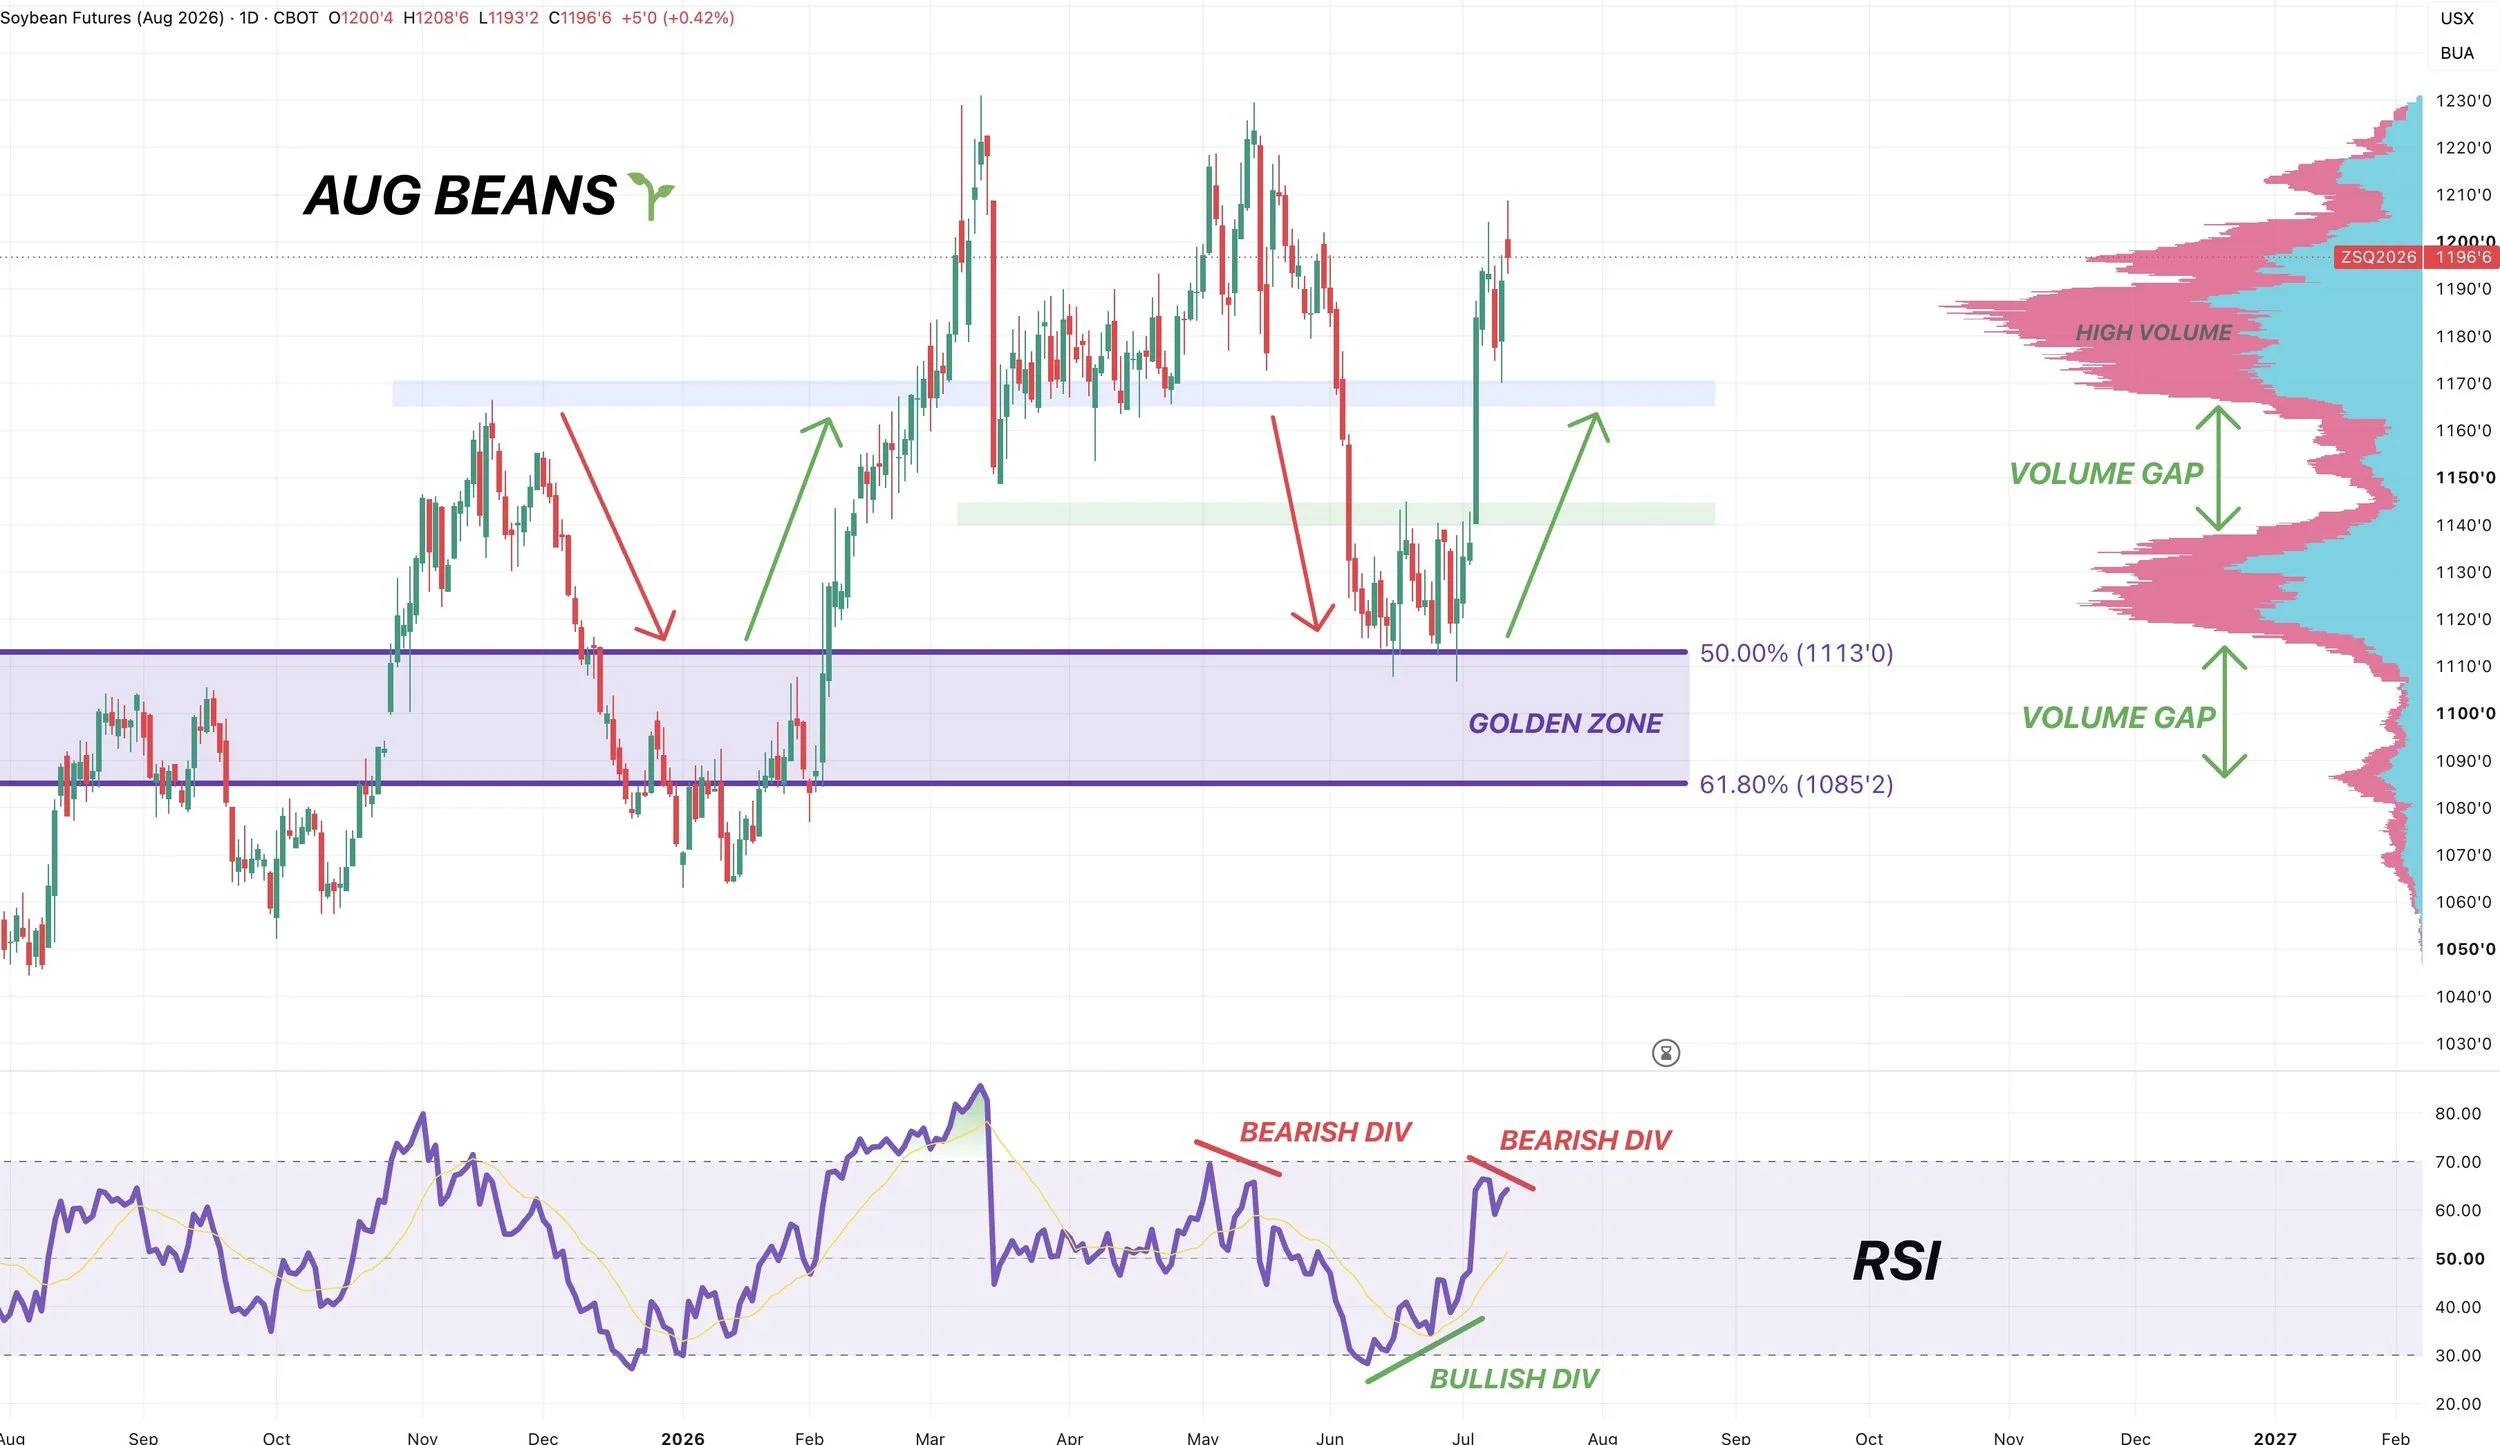
Aug Beans 🌱
We are still hovering at this area of high volume. We did post a new high close despite the poor close today.
I stil like defending this level if you have not.
One reason for caution is that we are showing bearish divergence on the RSI like we are in corn.
Prices made new highs. The RSI did not.
Which is what we saw in May as well.
Again.. doesn’t mean the rally has to be over. It’s just a reason to be cautious.
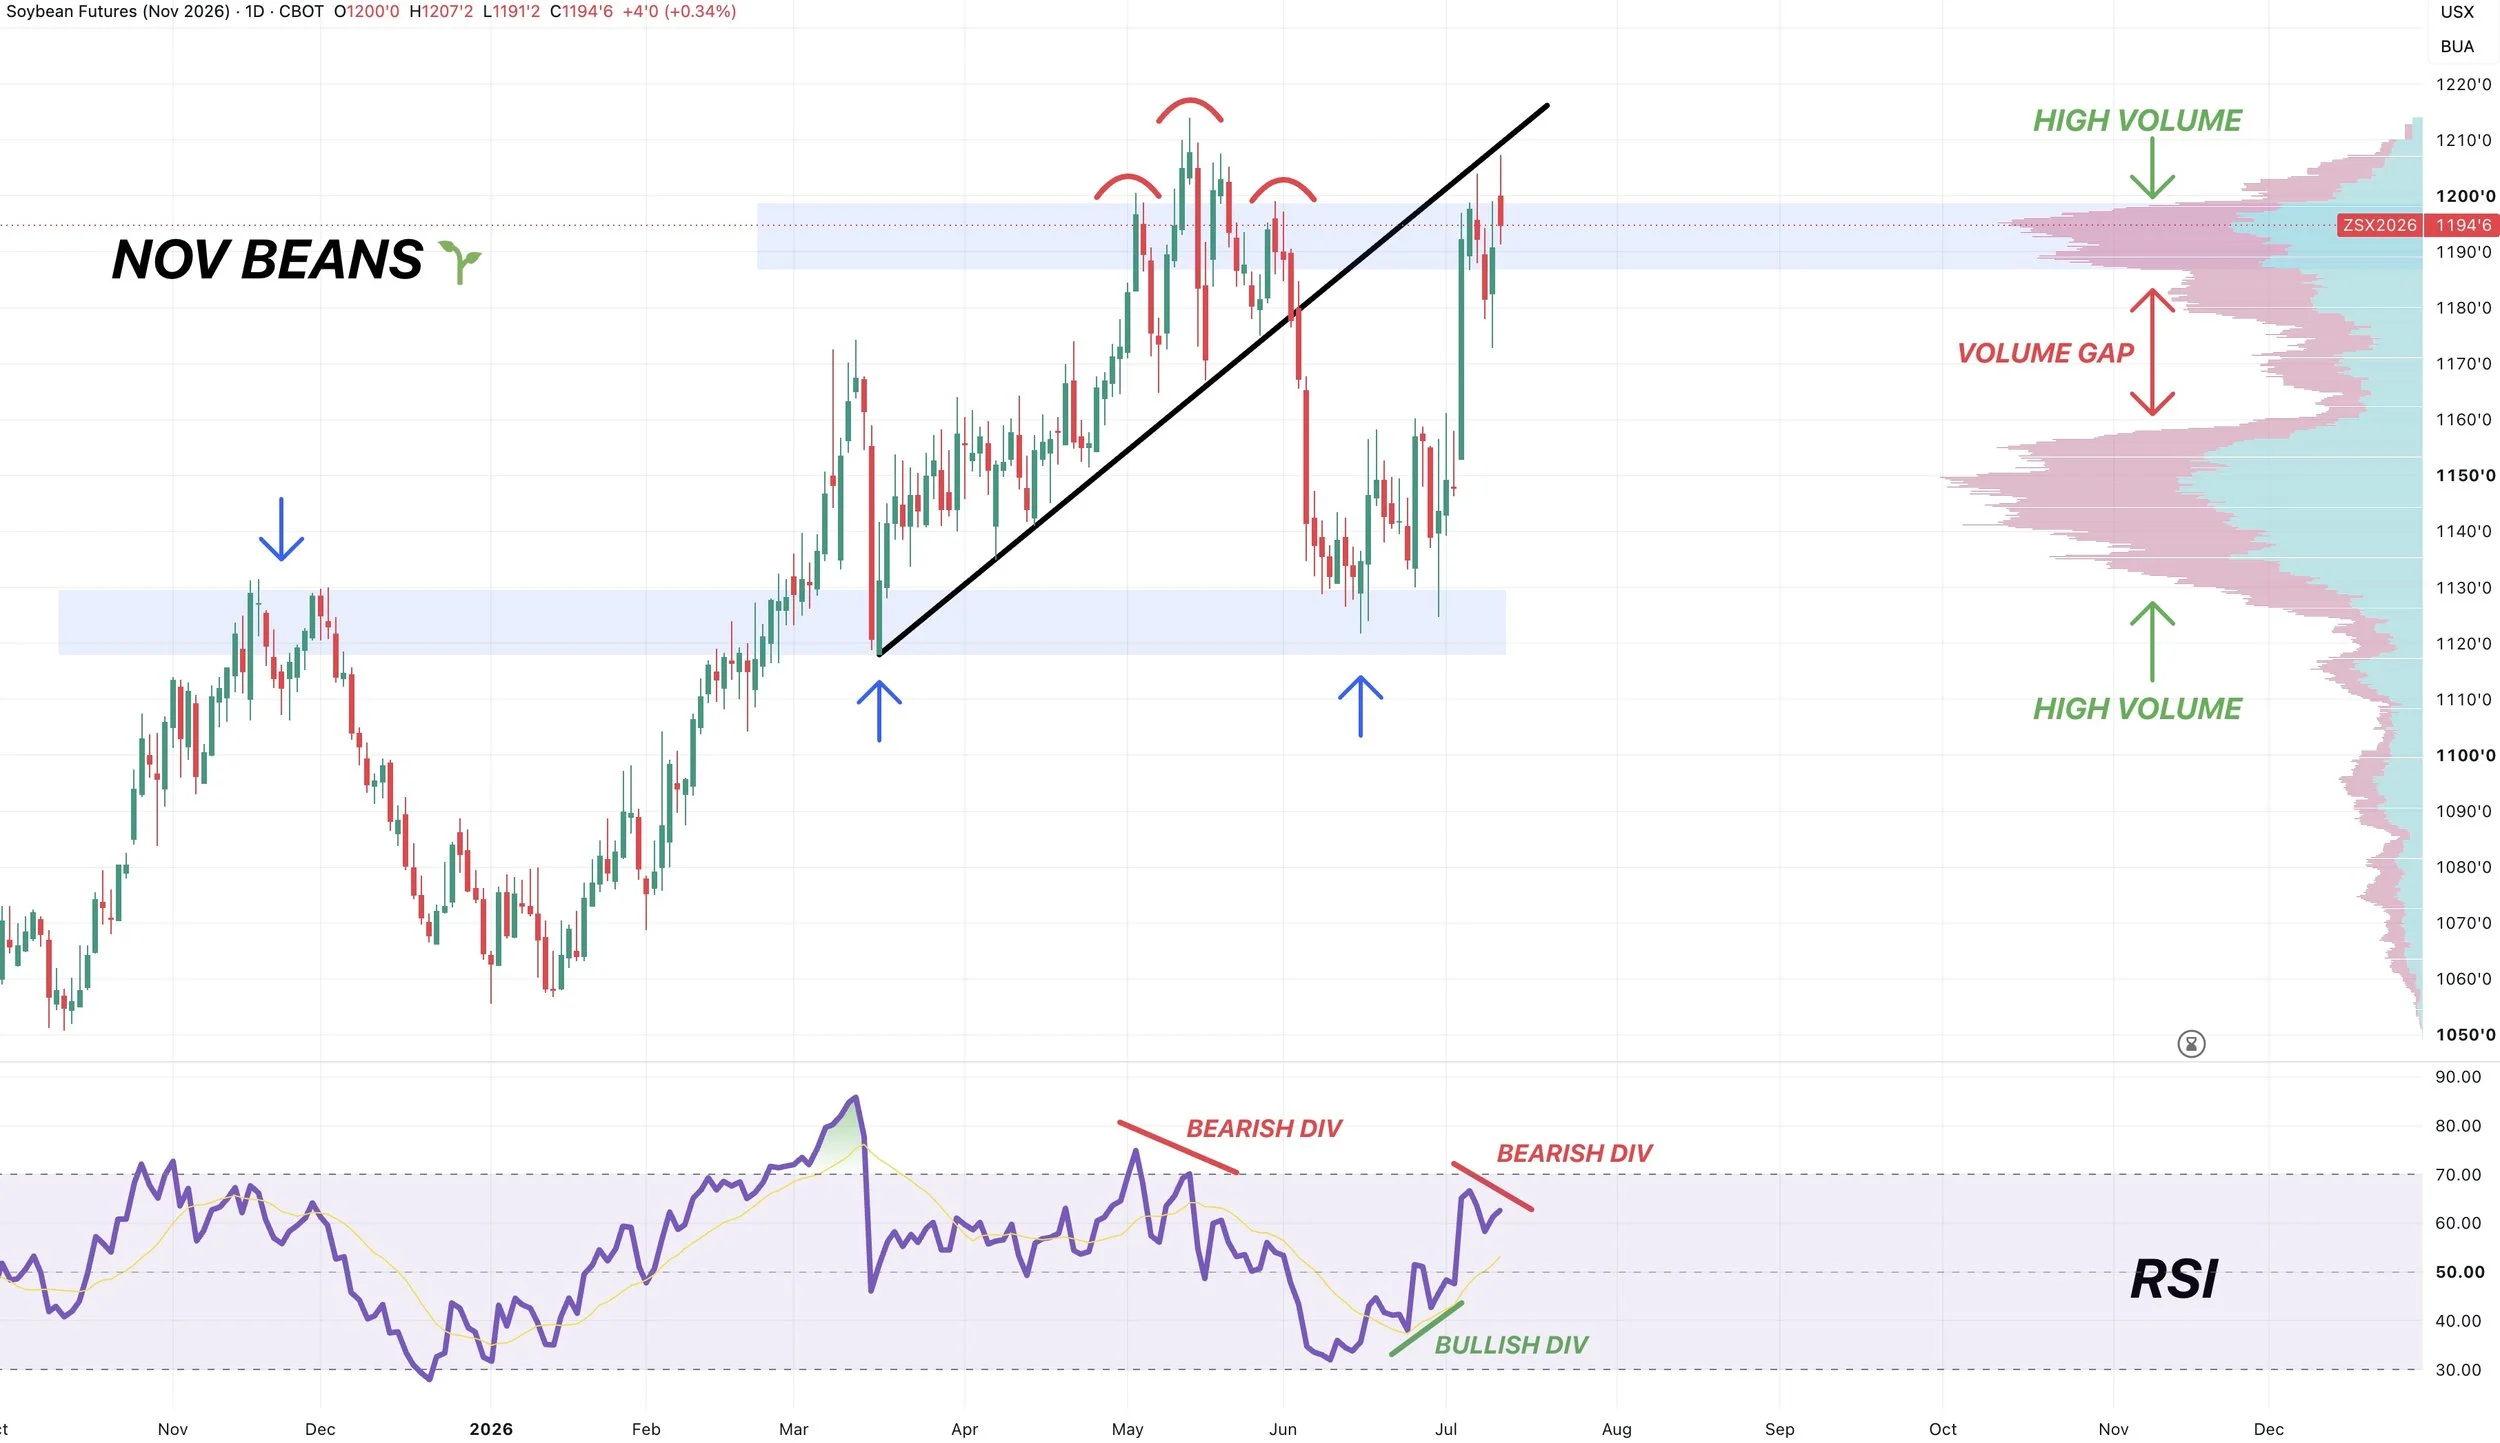
Nov Beans 🌱
Also struggling right at this area of major volume. Sitting at this volume shelf.
We are also potentially finding resistance along that old trend line support.
Like in August beans, we are too showing bearish divergence. So I am being cautious here.
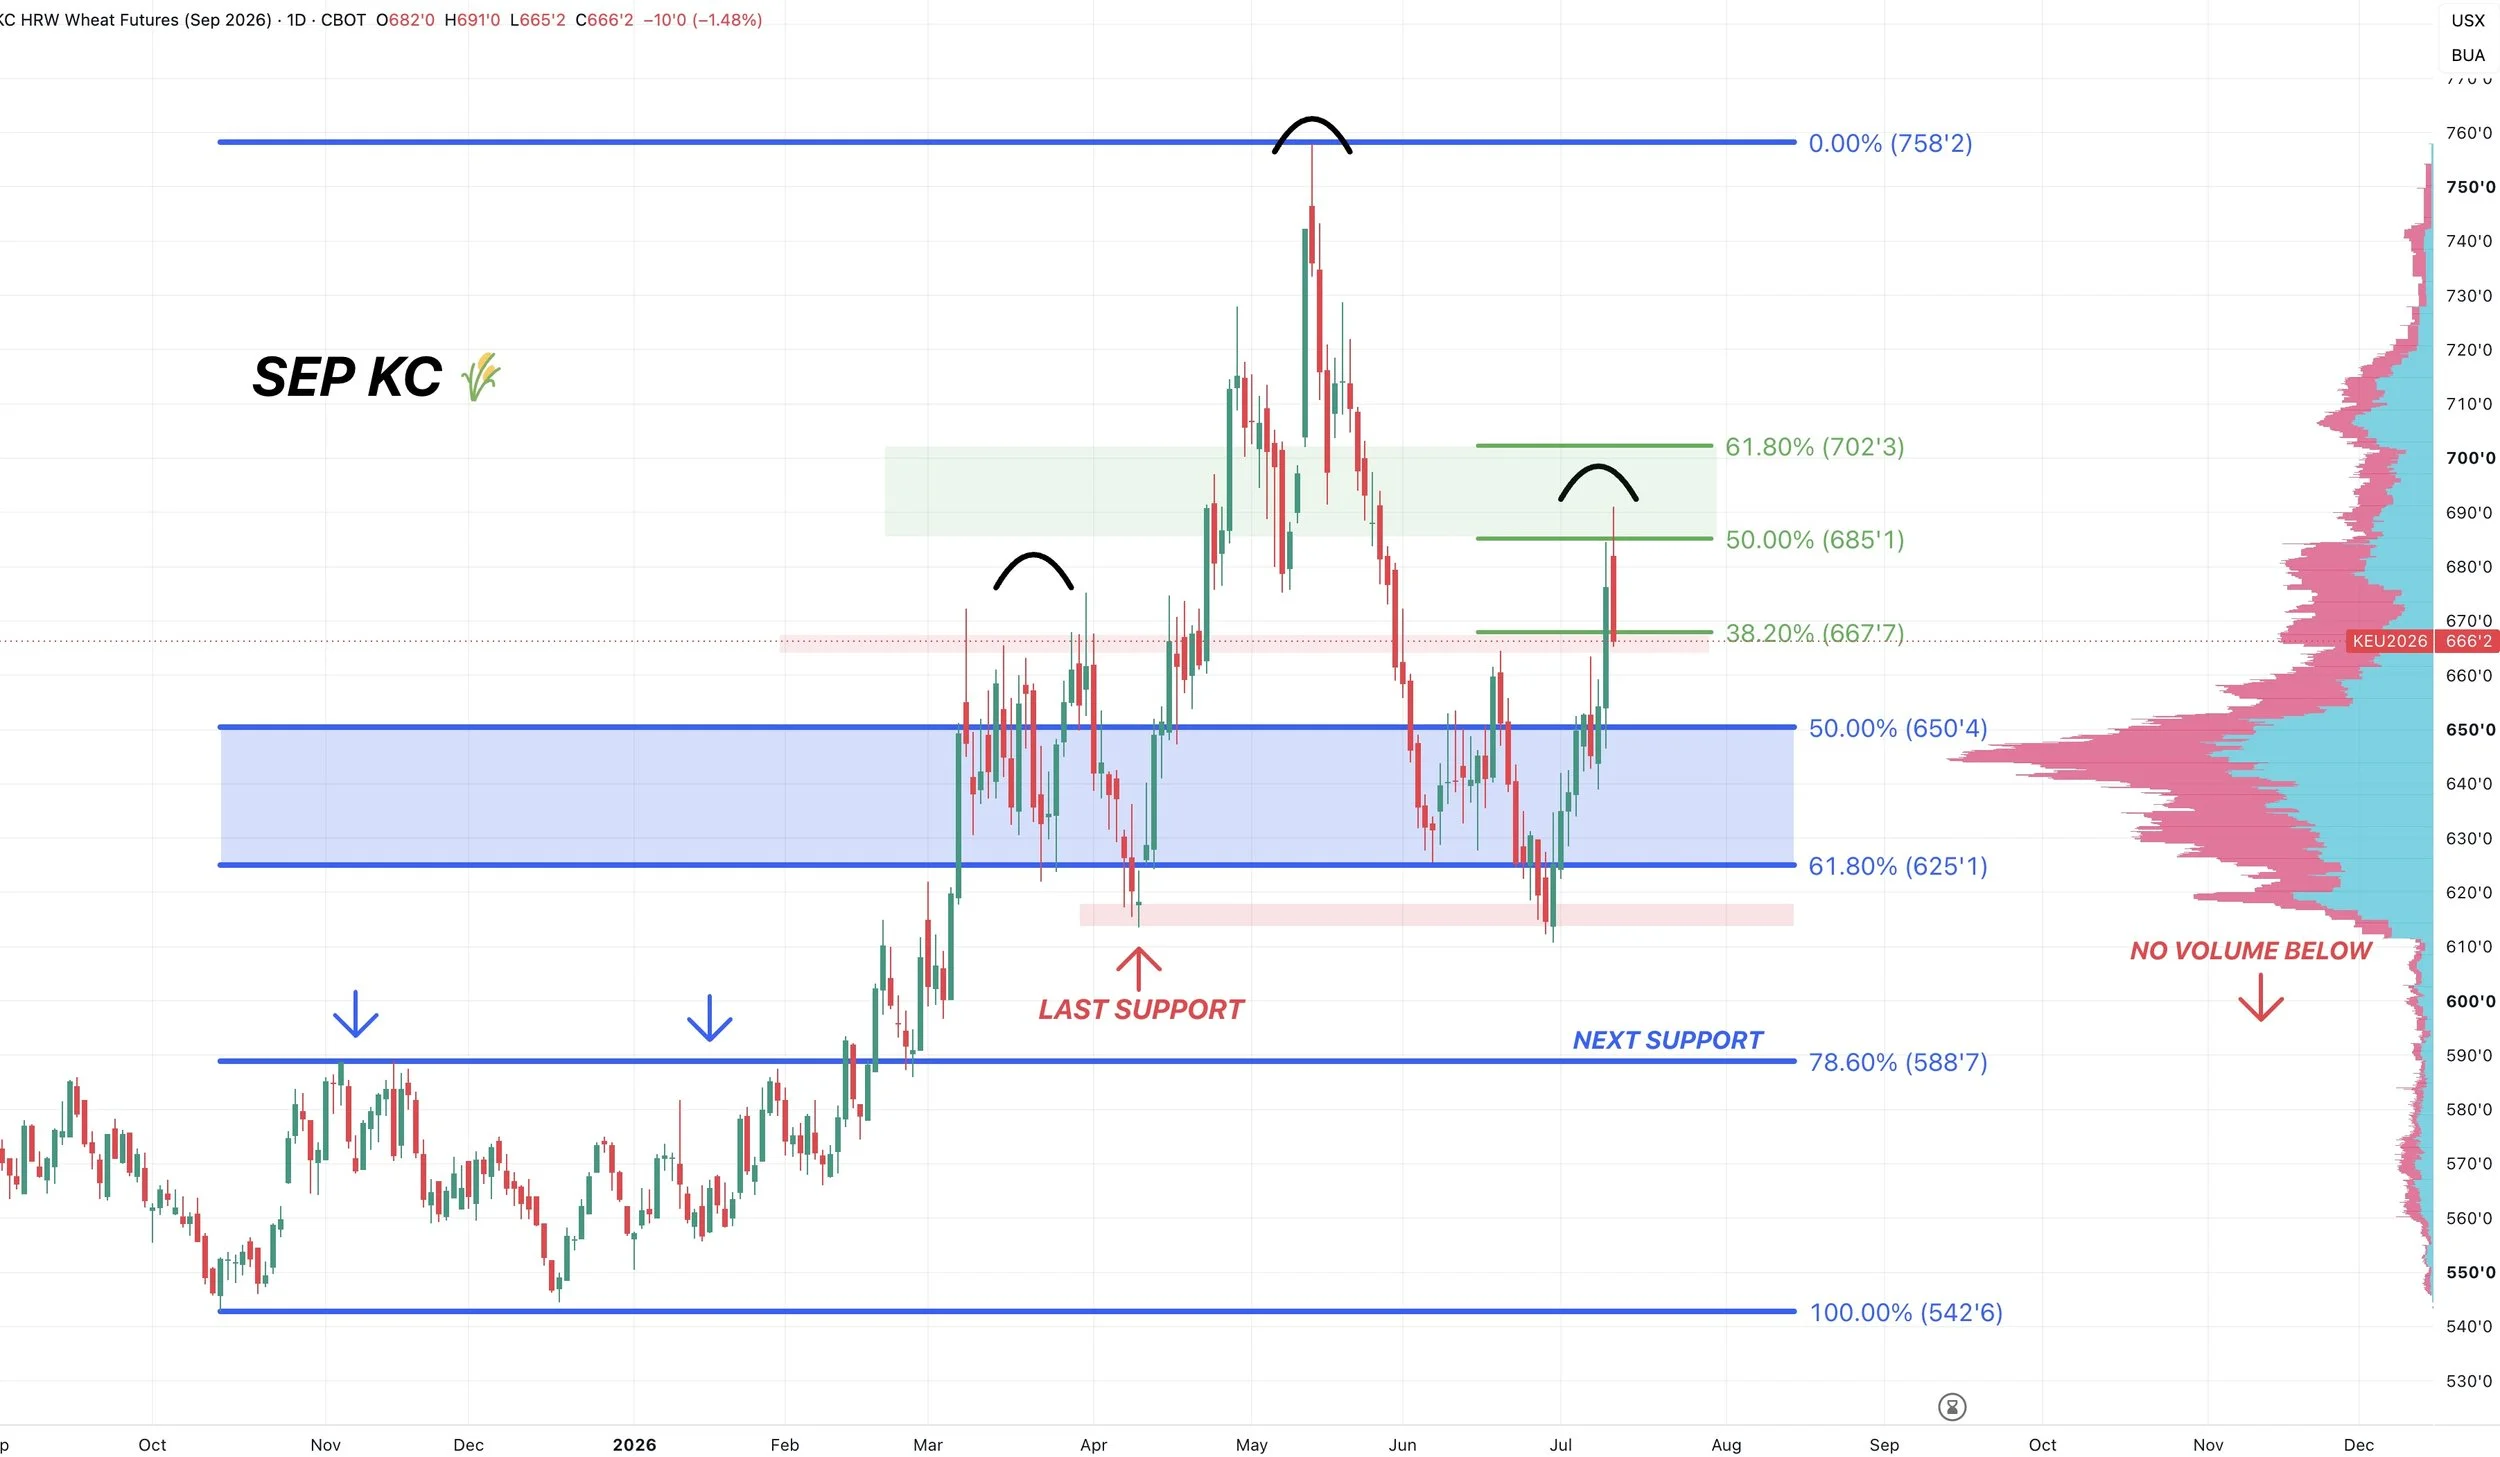
Sep KC 🌾
We had that sell signal on Friday.
Like the rest of the grains, we gapped open higher but closed well off the highs. Ending the day in the red for wheat.
We reclaimed 50% of the entire sell off. Between here and the 61.8% level is a common spot for a rally to stall. Hence the signal.
We also have somewhat of a potential sloppy head and shoulders pattern. Which adds more caution.
If you scroll, the next chart is another reason for the signal.
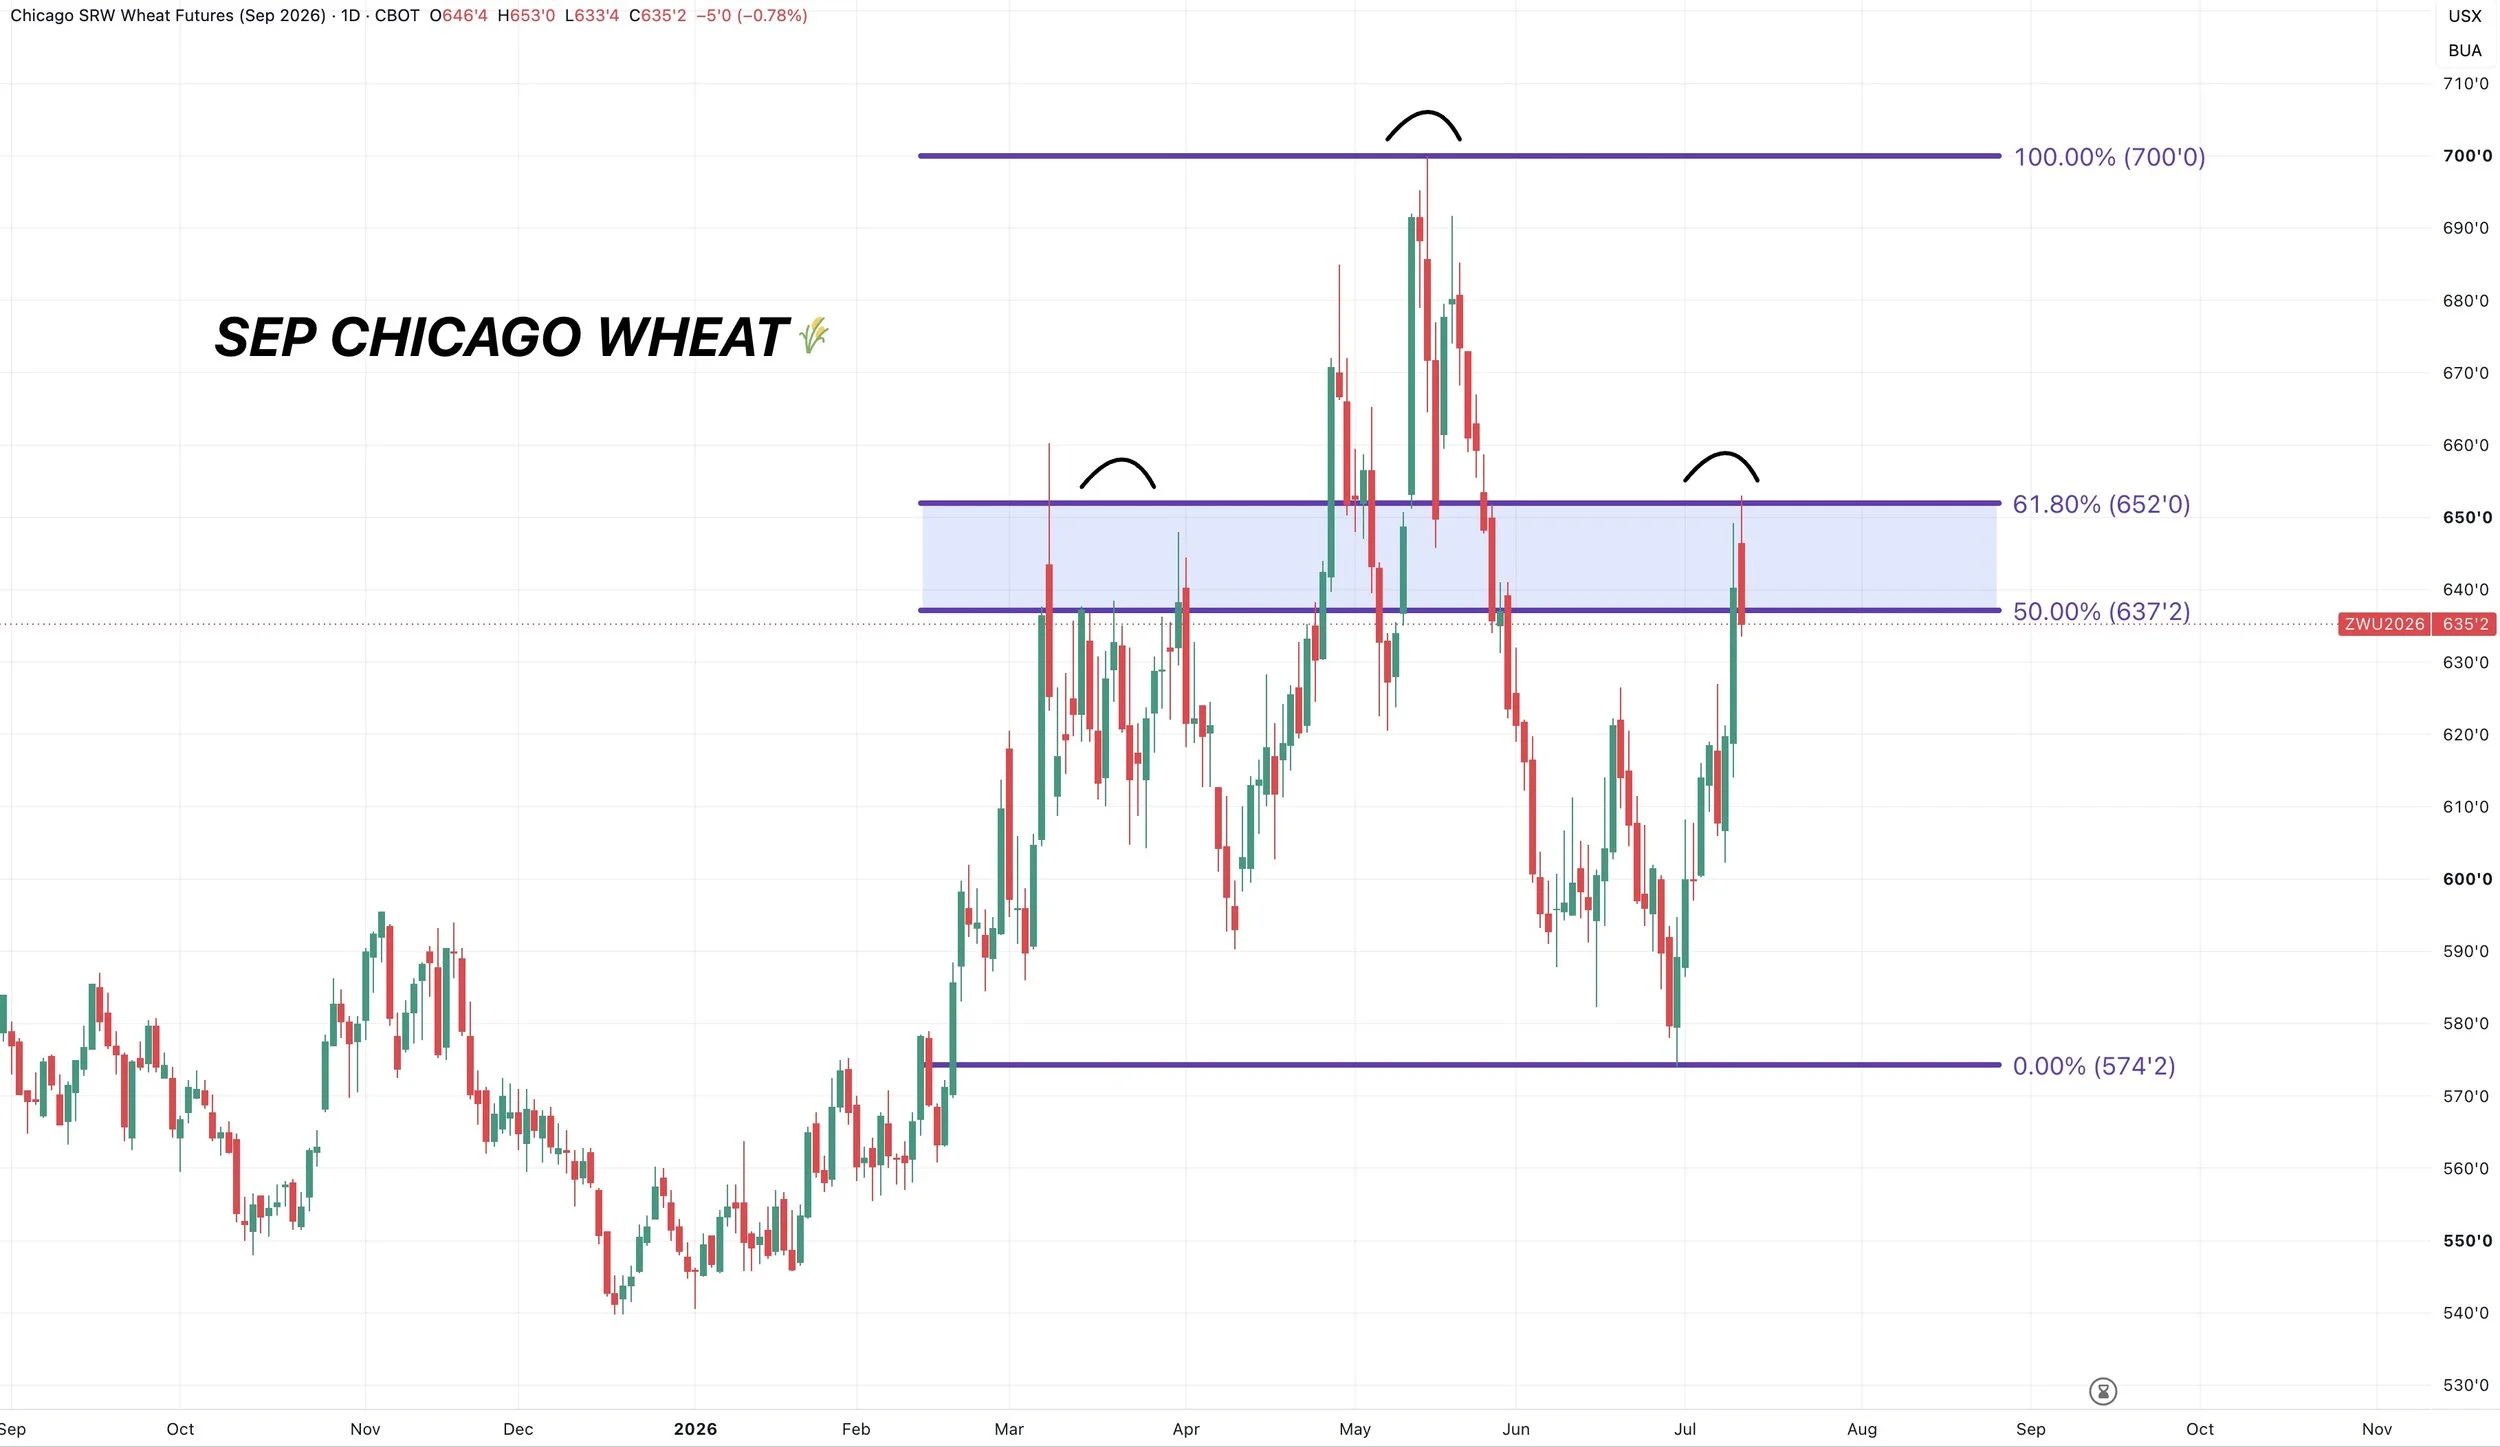
Sep Chicago 🌾
We perfectly clawed back 61.8% of the entire sell off before rejecting there.
As always, this is going to be the most common level for a rally to stall out at.
Not only that, but we have a far more possible textbook head and shoulders pattern.
Recent Updates
July 10th:
Friendly USDA. What’s it Mean?
July 9th:
Sunday Weather & USDA Tomorrow
July 10th:
Grains Take a Breather
Want to Talk?
Our phones are open 24/7 for you guys if you ever need anything or want to discuss your operation.
Jeremey & Office: (806)484-1214
Sebastian: (605)280-1186
Email: sfrost@dailymarketminute.com
Hedge Account
Interested in a hedge account? Use the link below to set up an account or give us a call.