
HAVE GRAINS FOUND A BOTTOM?
MARKET UPDATE
You can scroll to read the usual update as well. As the written version is the exact same as the video.
Timestamps for video:
Overview: 0:00min
Corn: 2:15min
Corn Charts: 10:20min
Beans: 13:20min
Bean Charts: 15:20min
Wheat: 16:40min
Cattle: 19:05min
Want to talk?
Office: (806)484-1214
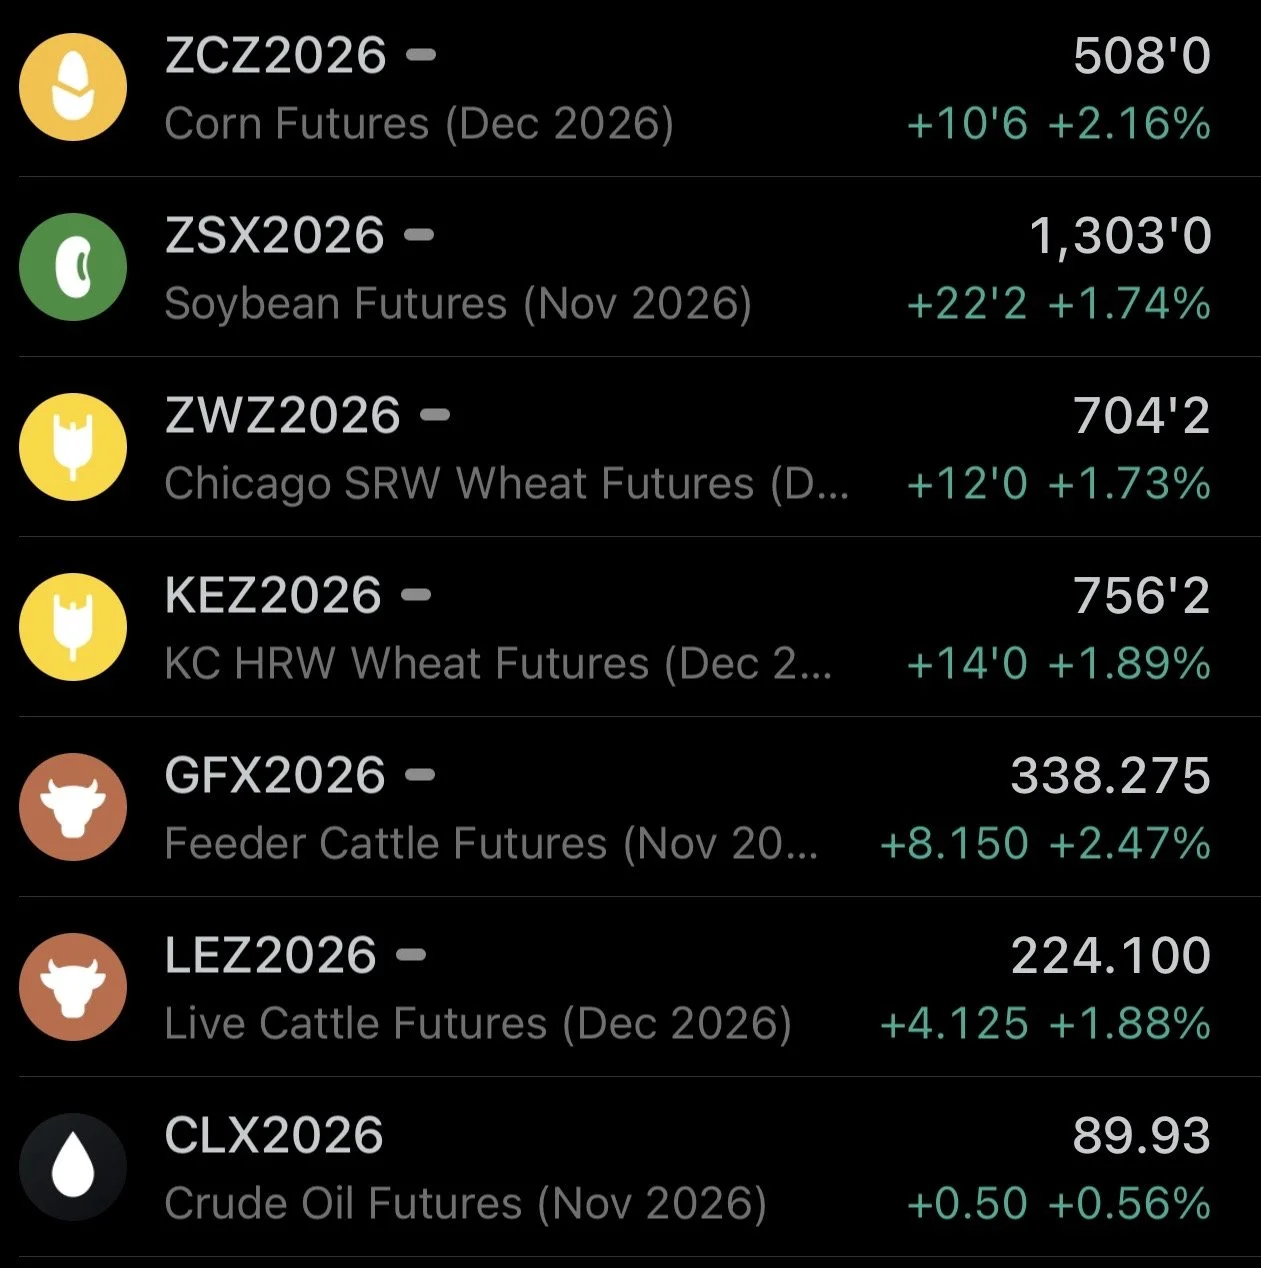
Futures Prices Close
Overview
Amazing day for the grains and cattle today. As we were higher across the board. With all grains up double digits.
Yesterday we faded well off the early highs, but today grains clawed back and closed above yesterday’s highs.
The grains continue to find support right where we need them to and the levels of support we've talking about.
This week is really all about the USDA report.
Friday we will see what the USDA decides to do with the corn balance sheet following the bearish Sep stocks report.
So let's jump right in.
Harvest Delays
Before we get into the good stuff we have to look at some harvest progress quick. As this is adding a little bit of support to the market.
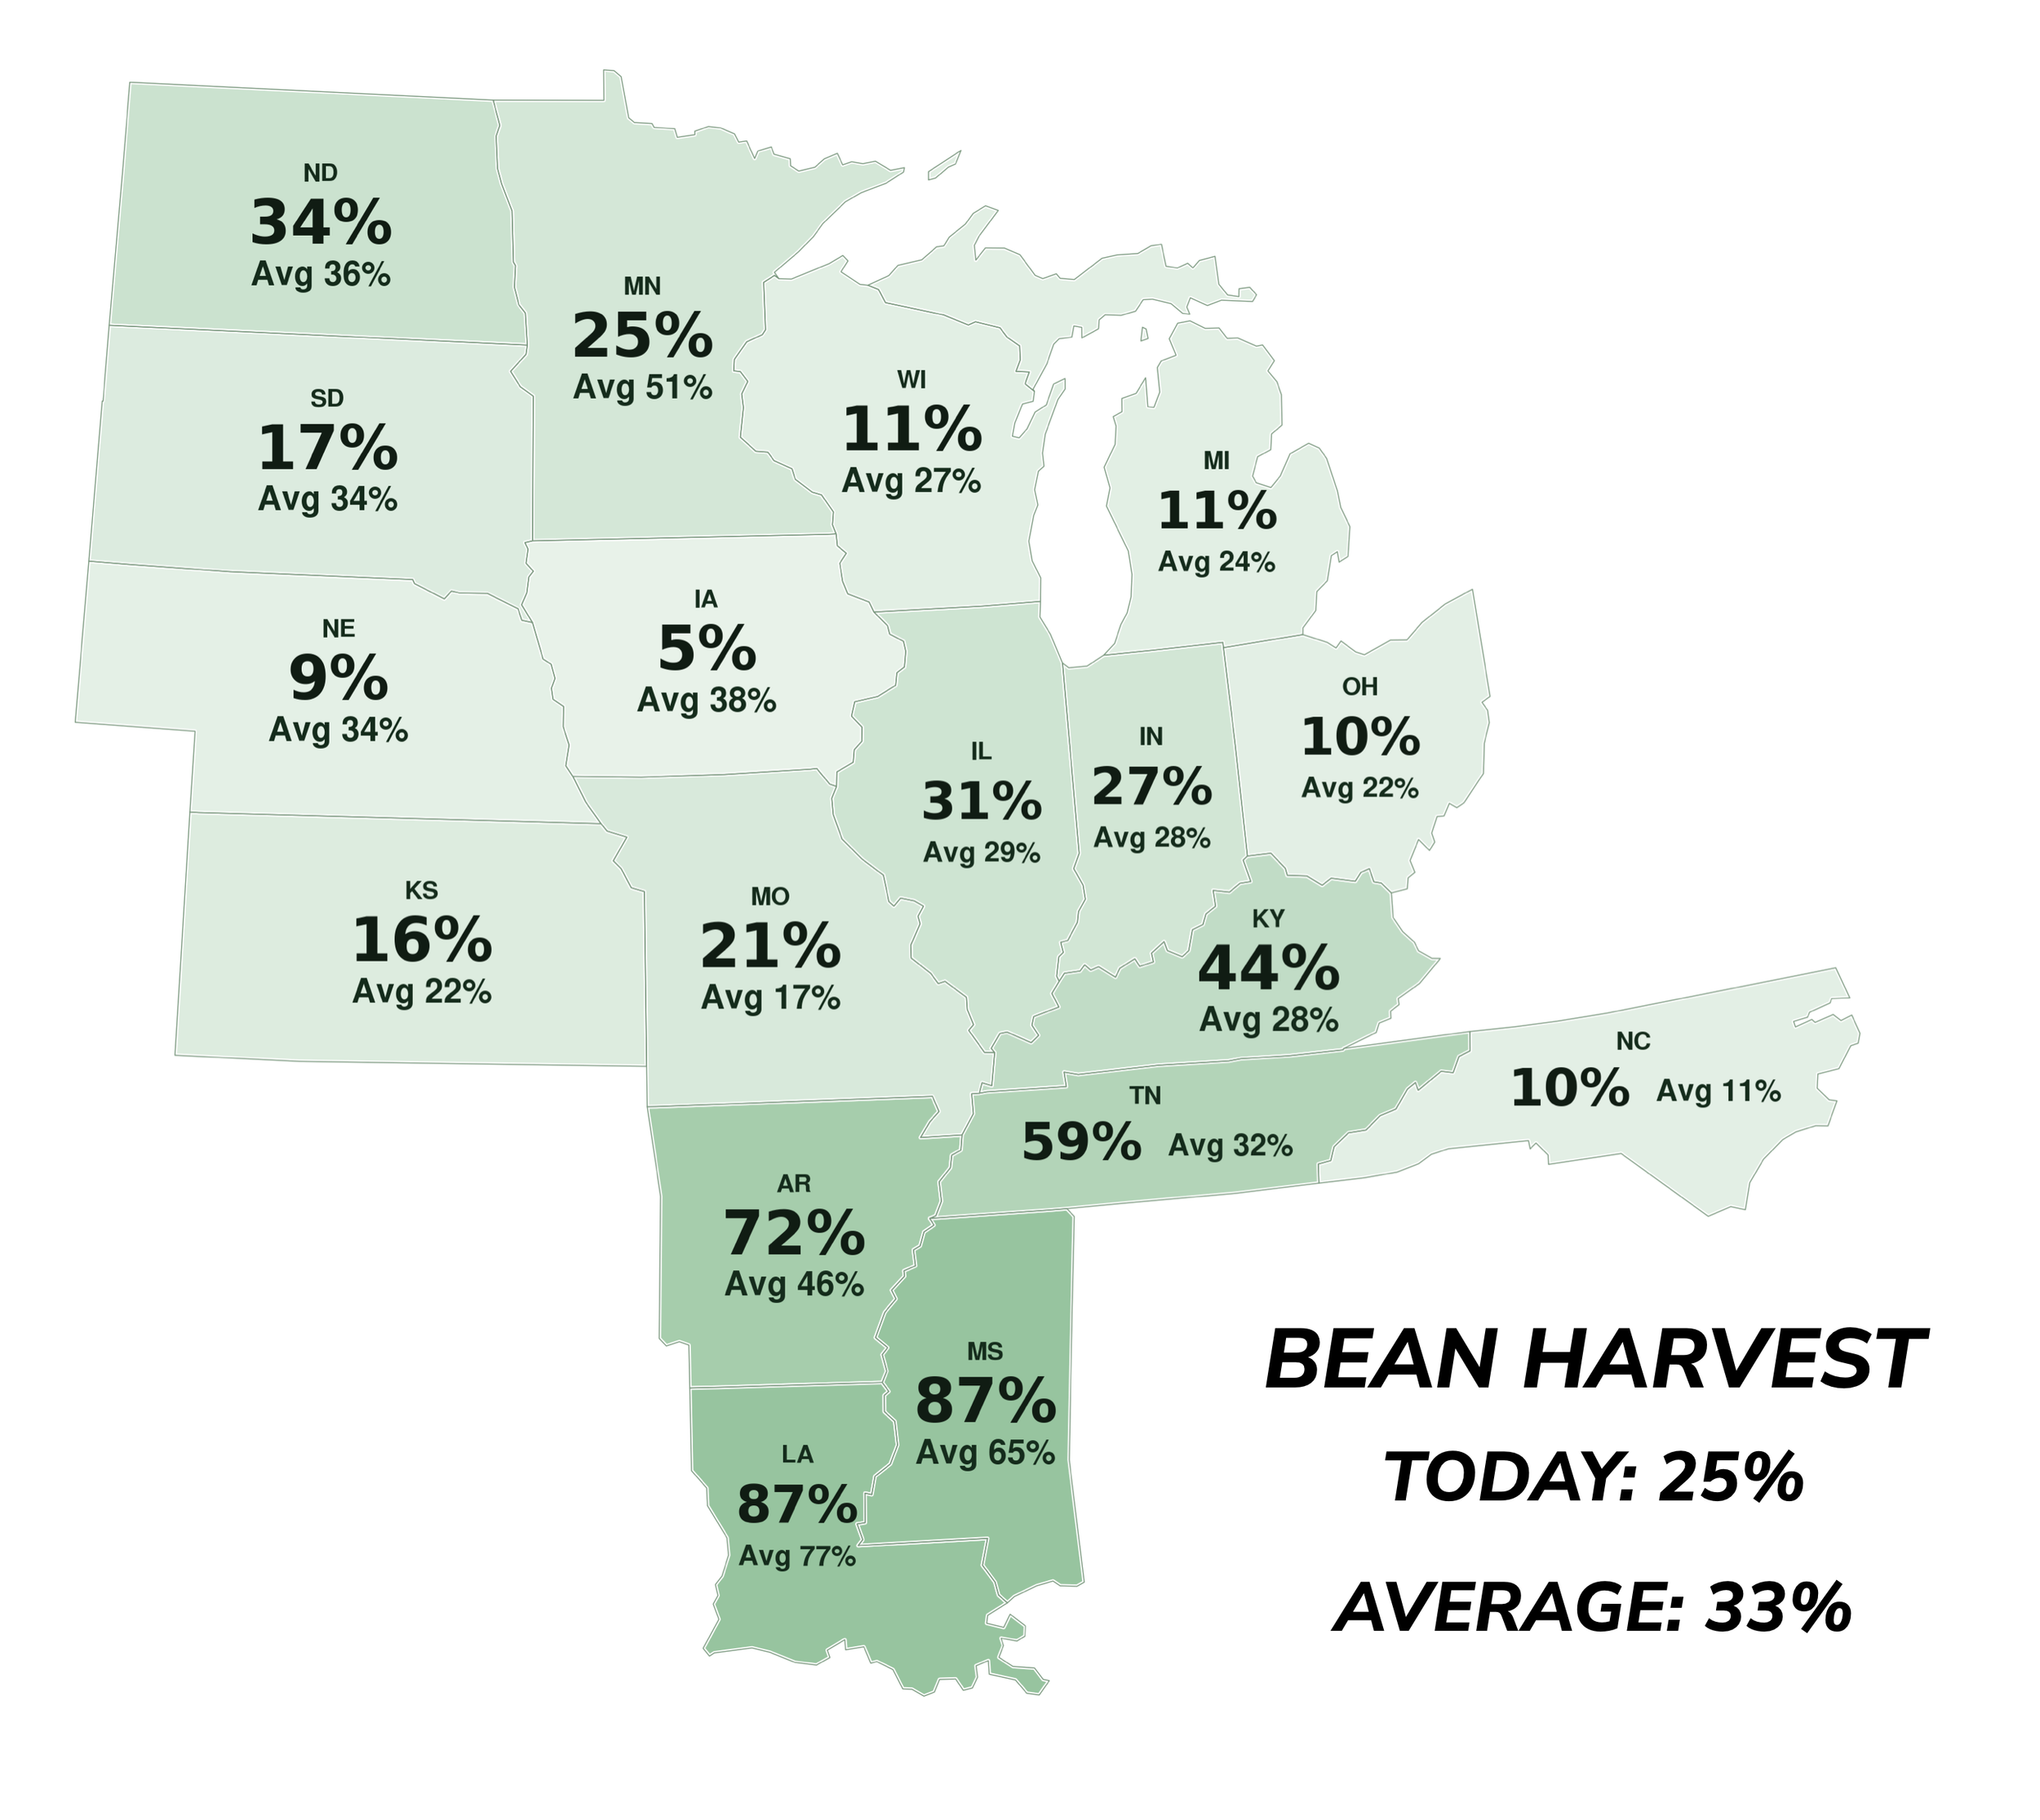
Corn harvest is at 23% vs the 27% average.
So slightly behind, however you have areas such as Iowa way behind pace. Iowa is only 7% complete vs 20% on average.
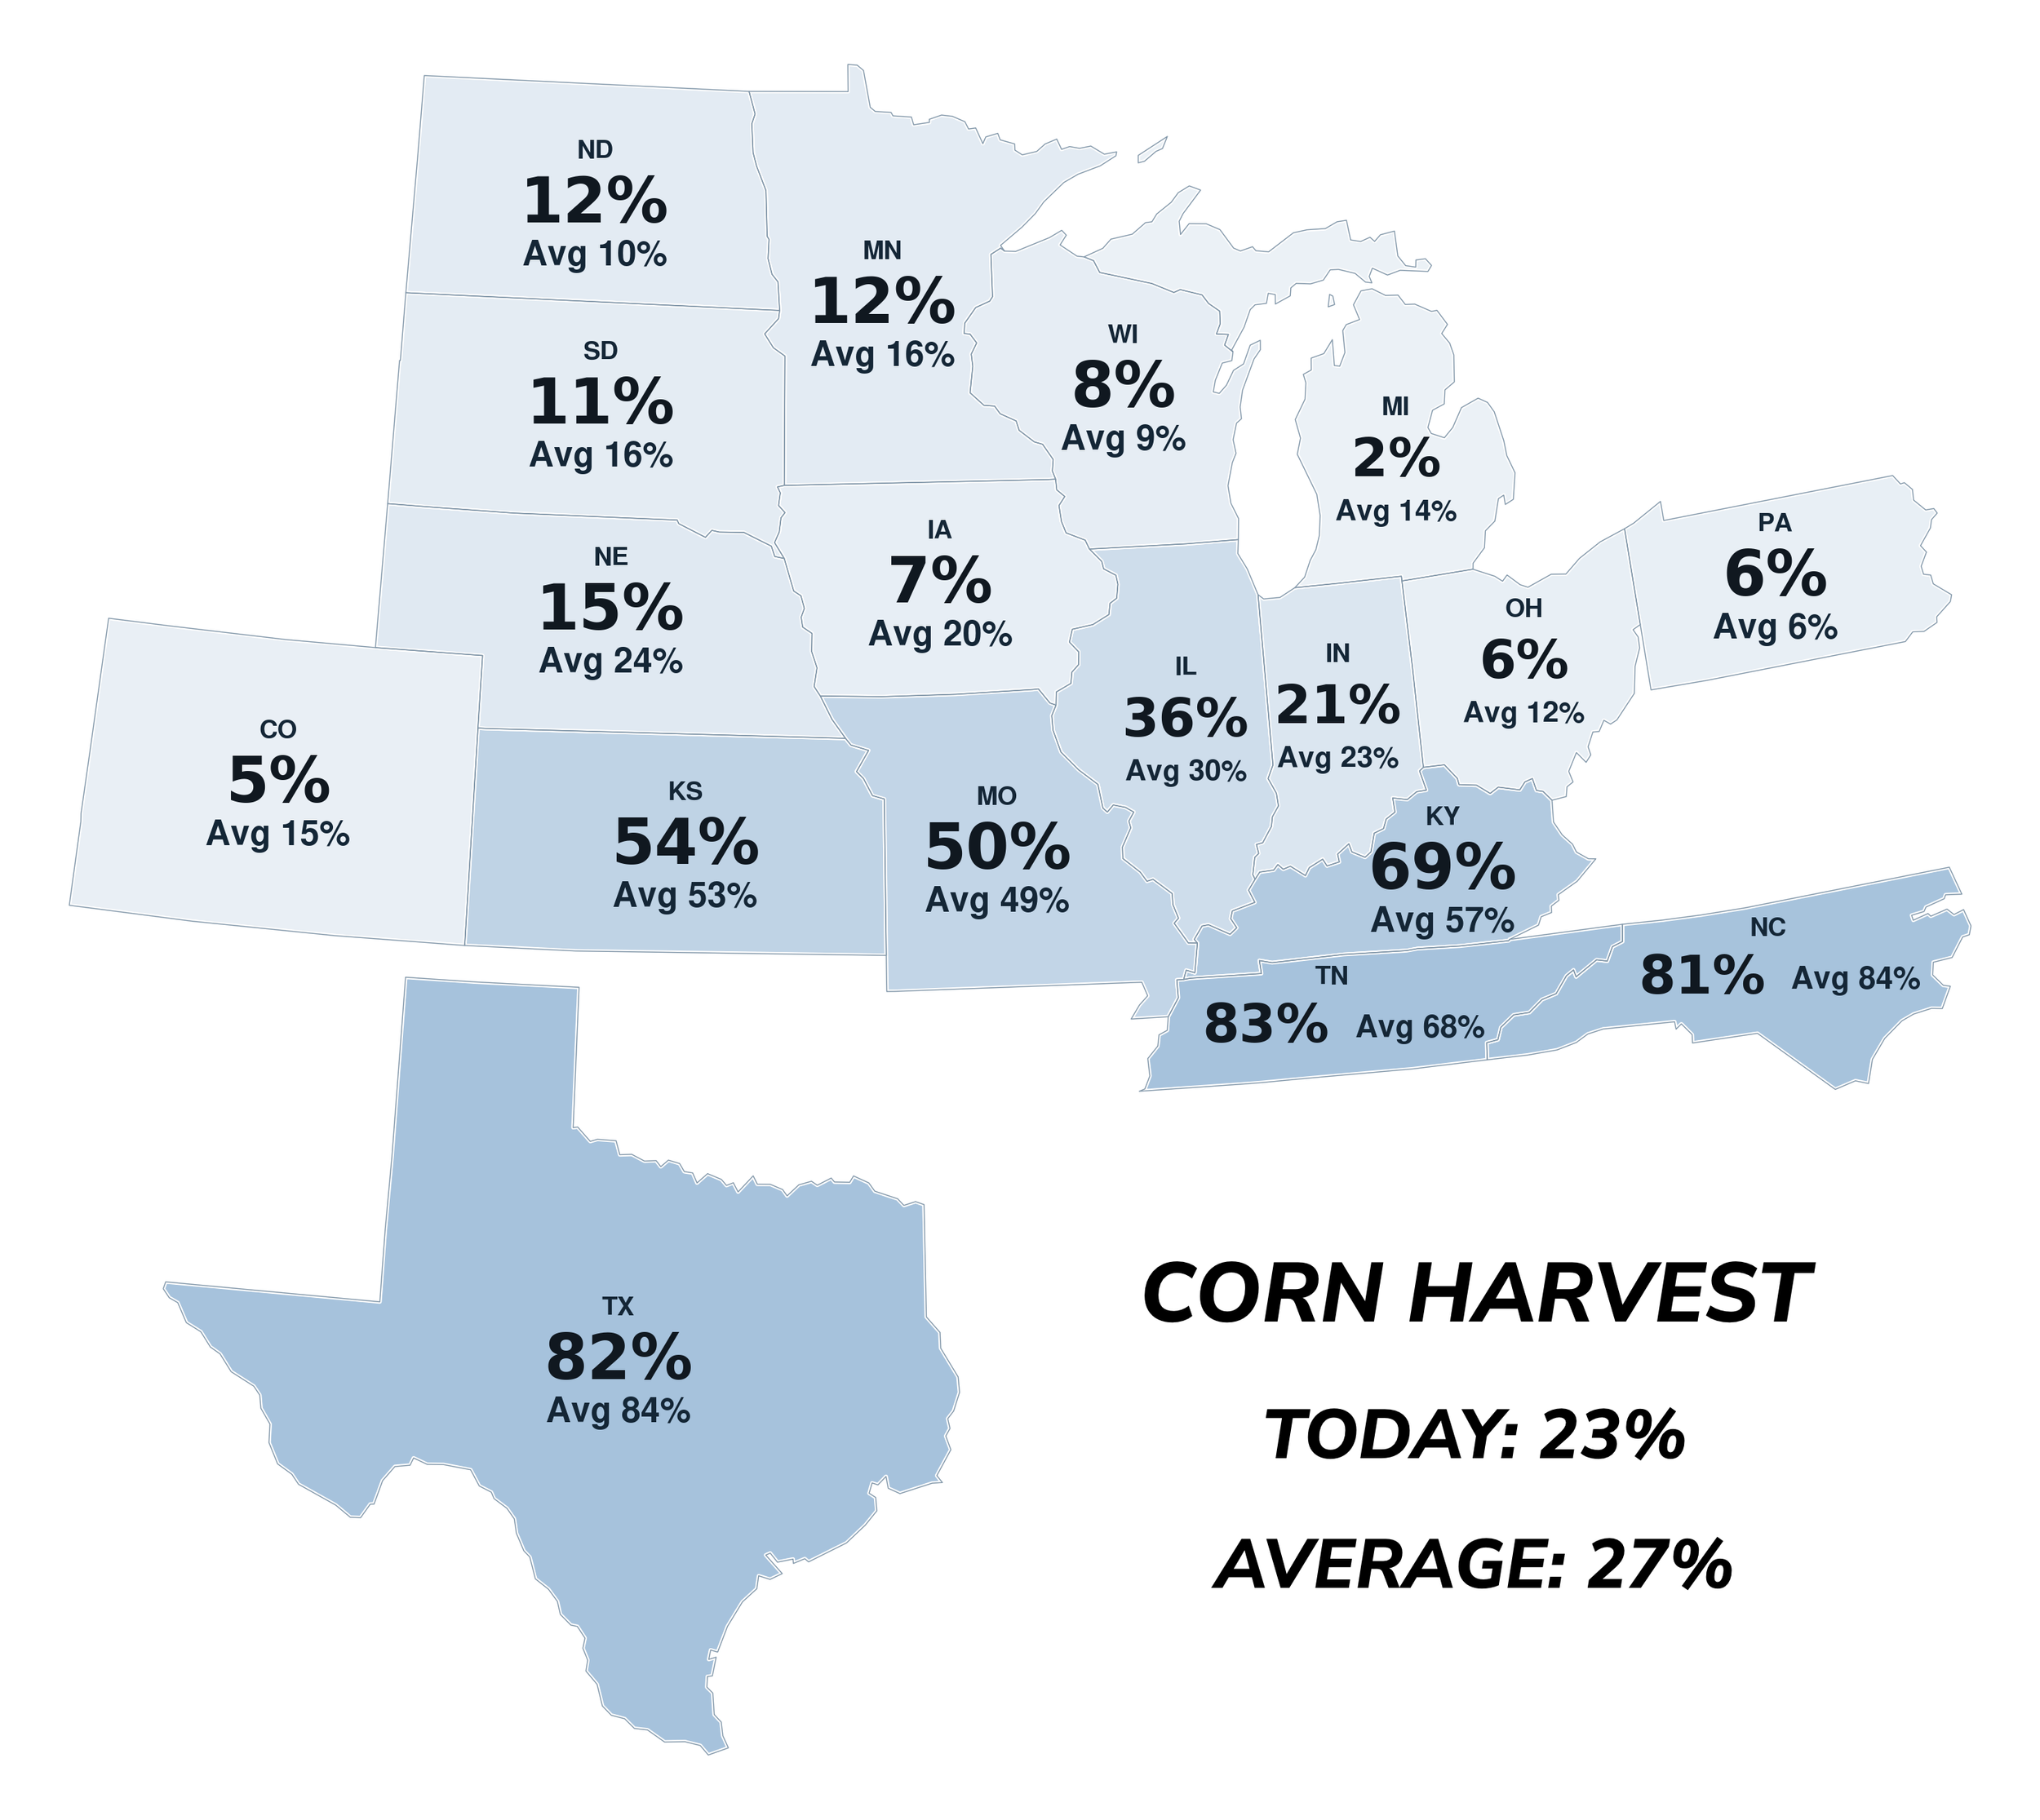
Soybeans are even further behind.
Sitting at 25% complete vs the average of 33%.
Similar story here, Iowa is way behind pace.
They sit at 5% complete vs their average of 38%.
So this is definitely adding some support. And I'm sure the recent heavy rains haven’t been helping the crop.
Corn Ratings
One partial reason for the strength in corn today was crop ratings.
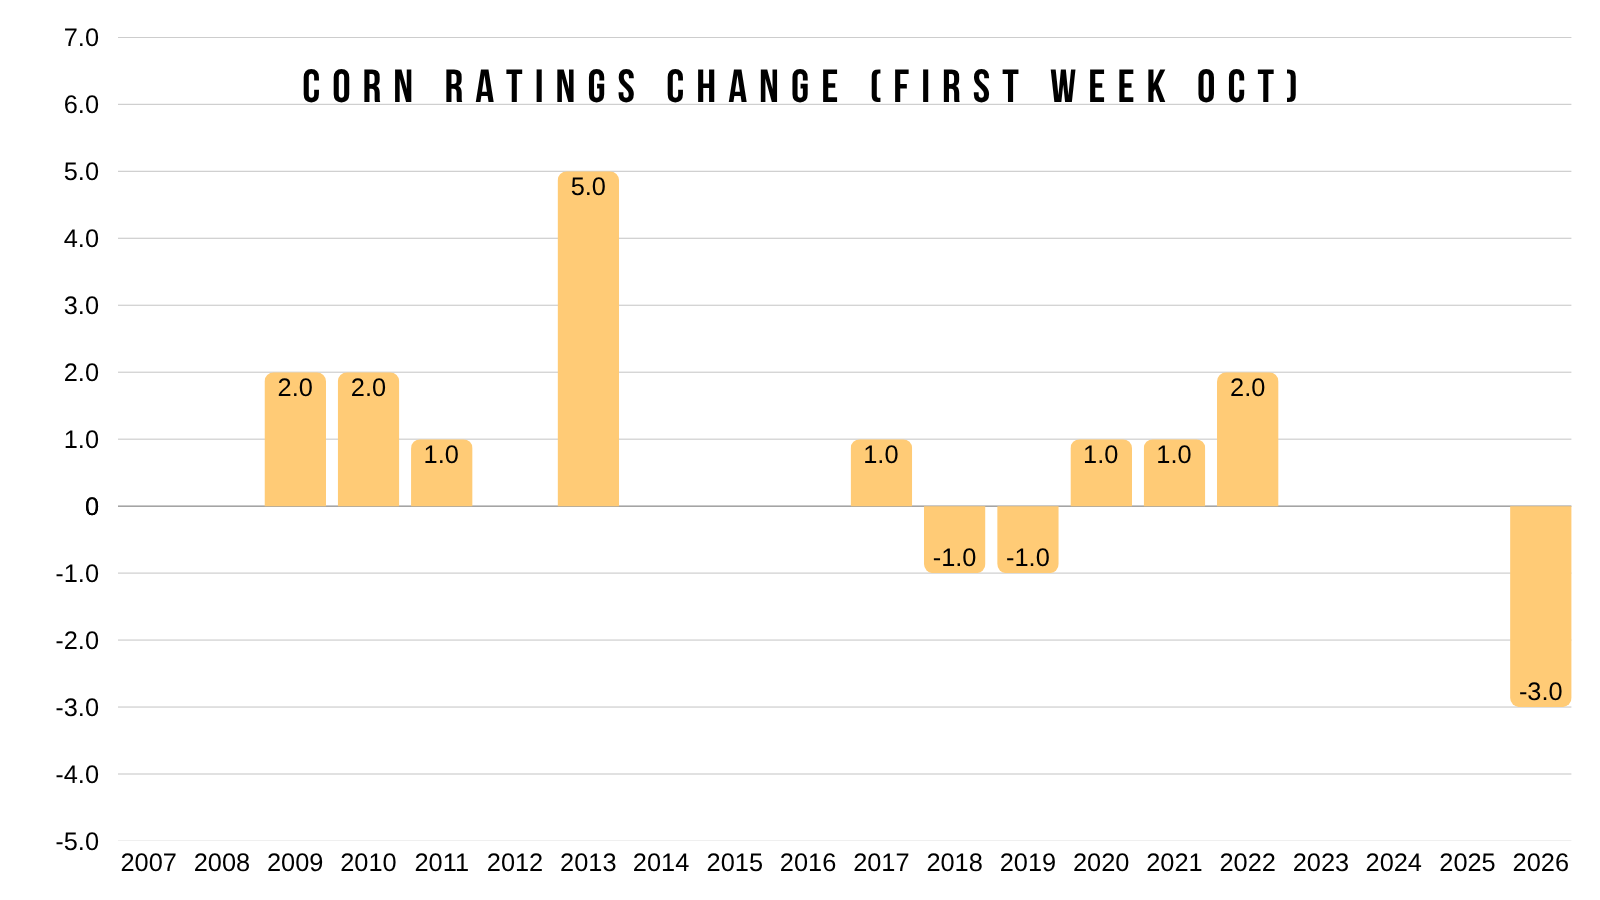
They dropped -3% down to 54% rated good to excellent.
A drop in ratings for this time of the year is pretty uncommon.
This would be the biggest drop for the first week of October ever.
Let's look at how these ratings stack up.
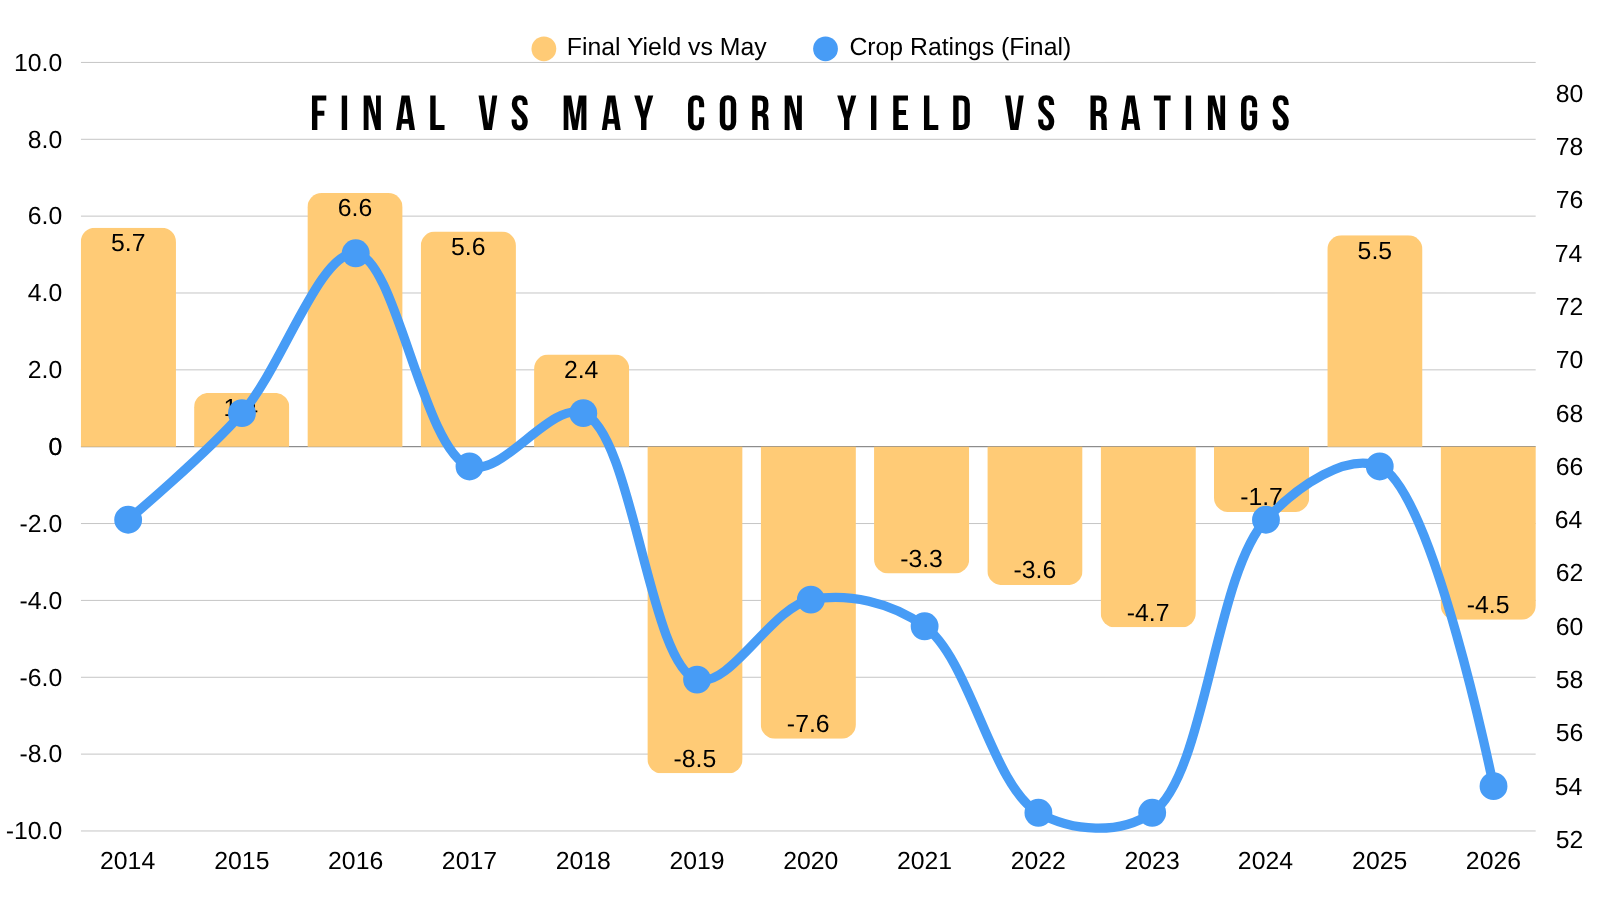
Here is a chart that shows final crop ratings vs how yield deviated from trend. This chart was one of the ways we figured yield was not above trend several months ago.
We're pretty much right on par with one of the worst ratings in at least the last decade.
2022 and 2023 had similar ratings to this year and saw yield deviate 3.6 to 4.7 bpa below trend.
Currently we are 4.5 below trend.
However, in 2019 and 2020, we had better ratings than this year and the crop deviated 7.6 to 8.5 bpa below trend.
Today's Main Takeaways
Corn
Sep Stocks:
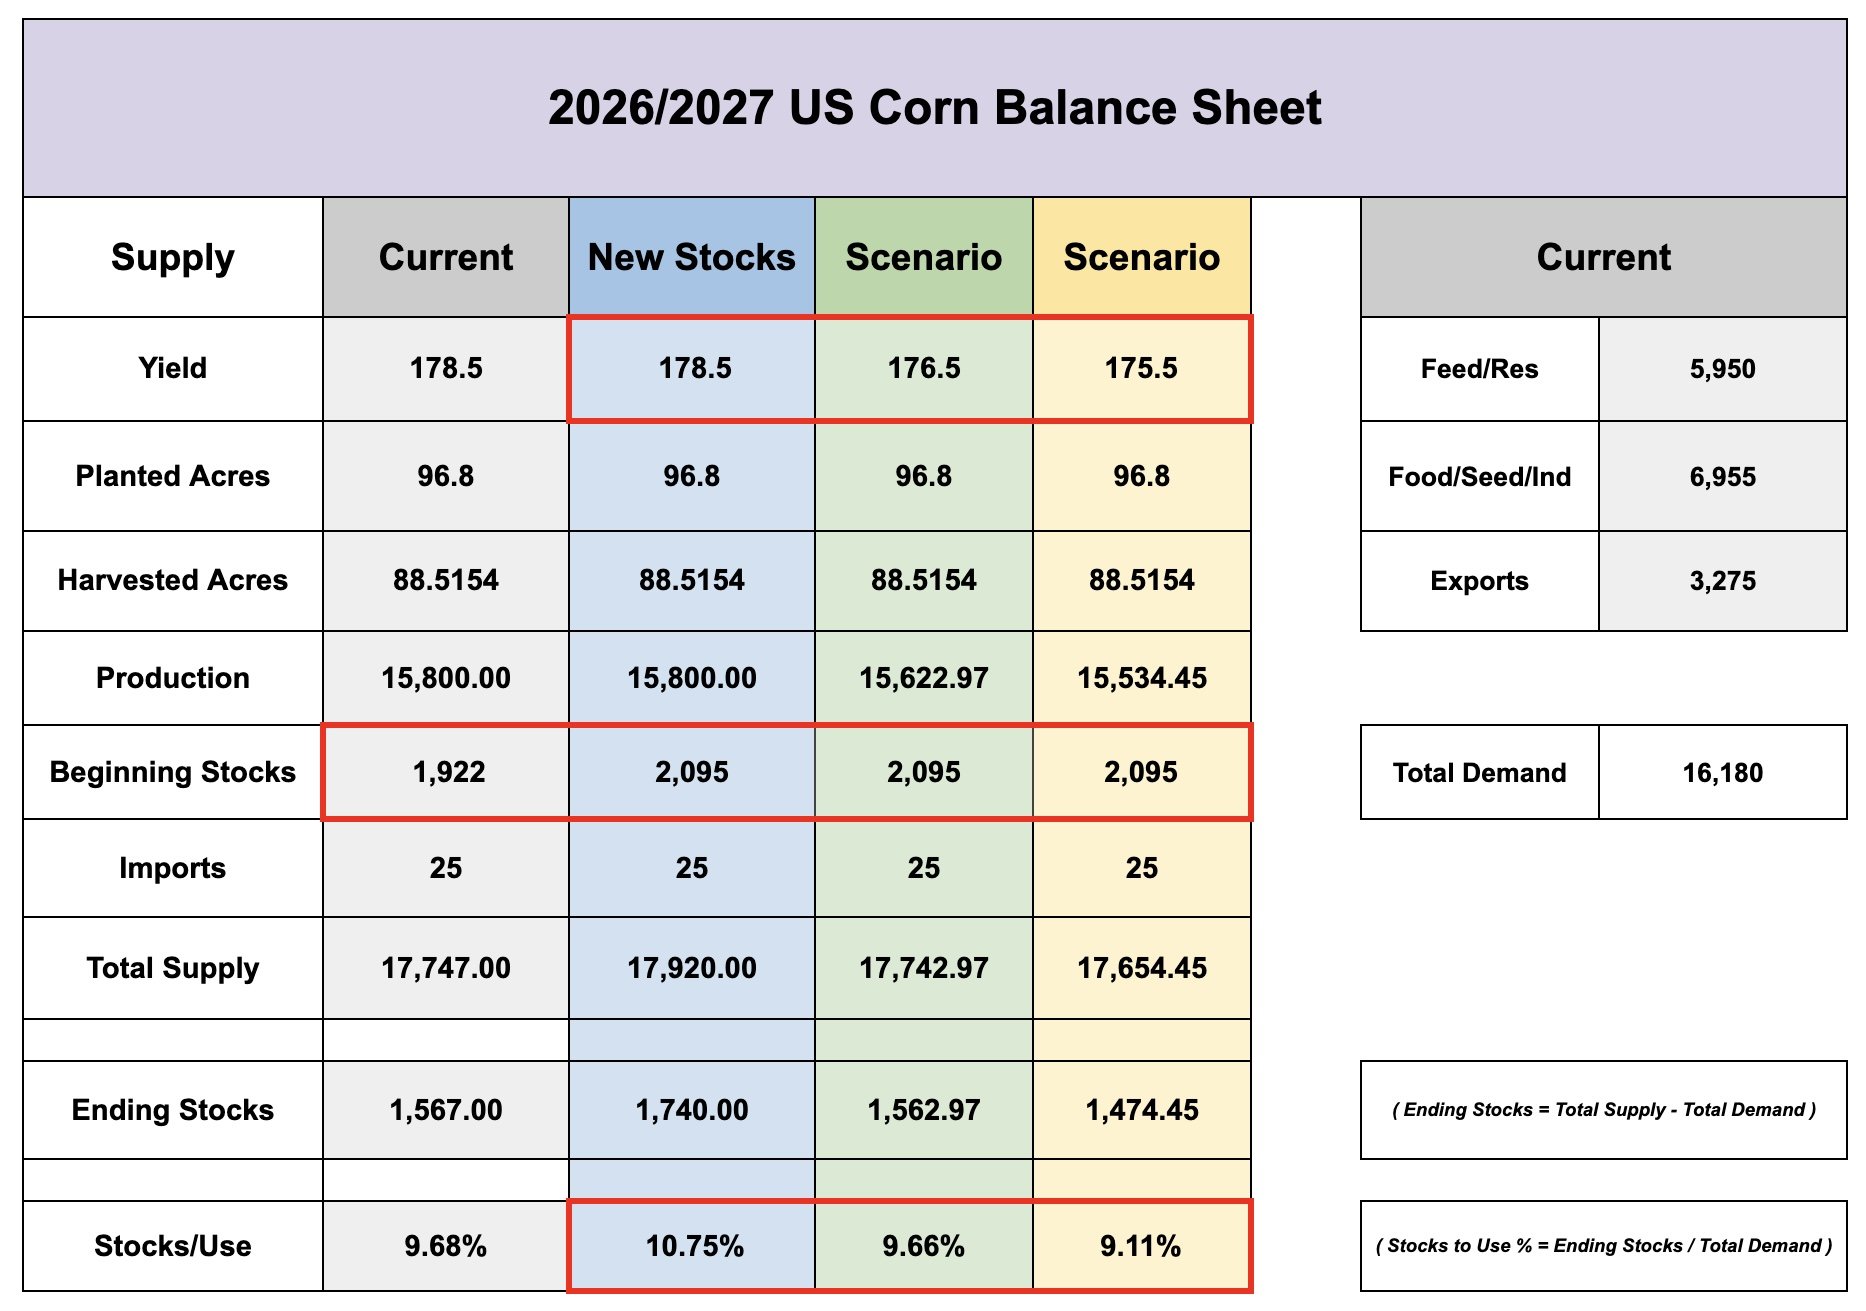
Last week the USDA found an extra +170 million bu of old crop corn stocks. As they likely trimmed the old crop feed and residual.
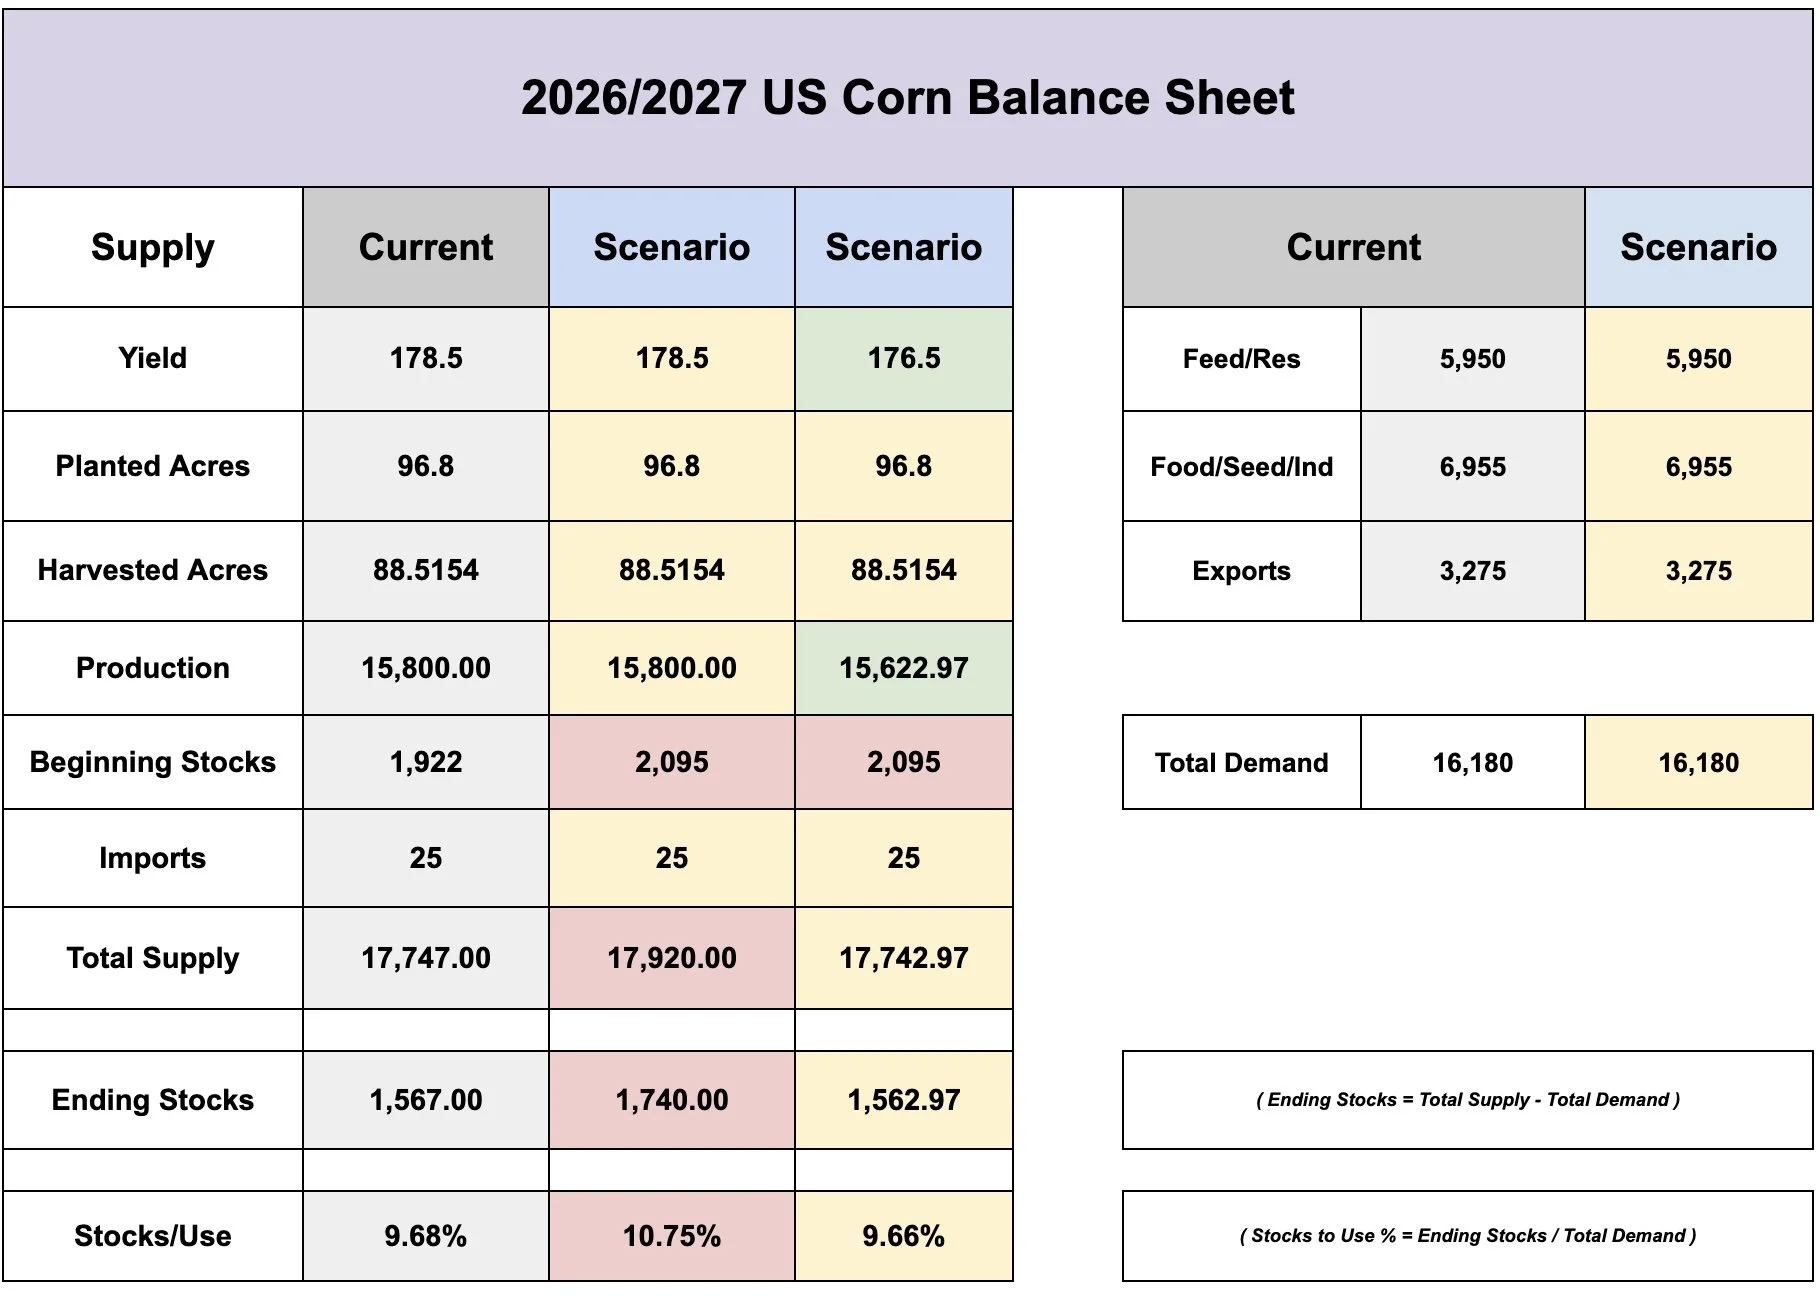
So before adjusting yield or touching the new crop demand numbers at all.. simply adding these extra old crop stocks bumps the new crop stocks to use back up to 10.7% (was previously at 9.7%).
As this now gives us a 2 bpa buffer on yield.
So without touching demand, for the balance sheet to remain the same as it was last month, we'd need to see yield drop -2 bpa in Friday's report.
Column 1 is previous balance sheet
Column 2 is new balance sheet with extra old crop stocks.
Column 3 is balance sheet with extra old crop stocks and a -2 bpa cut to yield.
Oct WASDE Estimates:
Here are the estimates for the report Friday.
Bloomberg's analysts have corn yield coming down -0.7 bpa. From 178.5 down to 177.8.
For carryout they have it coming in at 1.694 billion bu.
Which would be +127 million bu more than last month.
So the trade is expecting yield to come down, but not by enough to completely offset the extra old crop stocks.

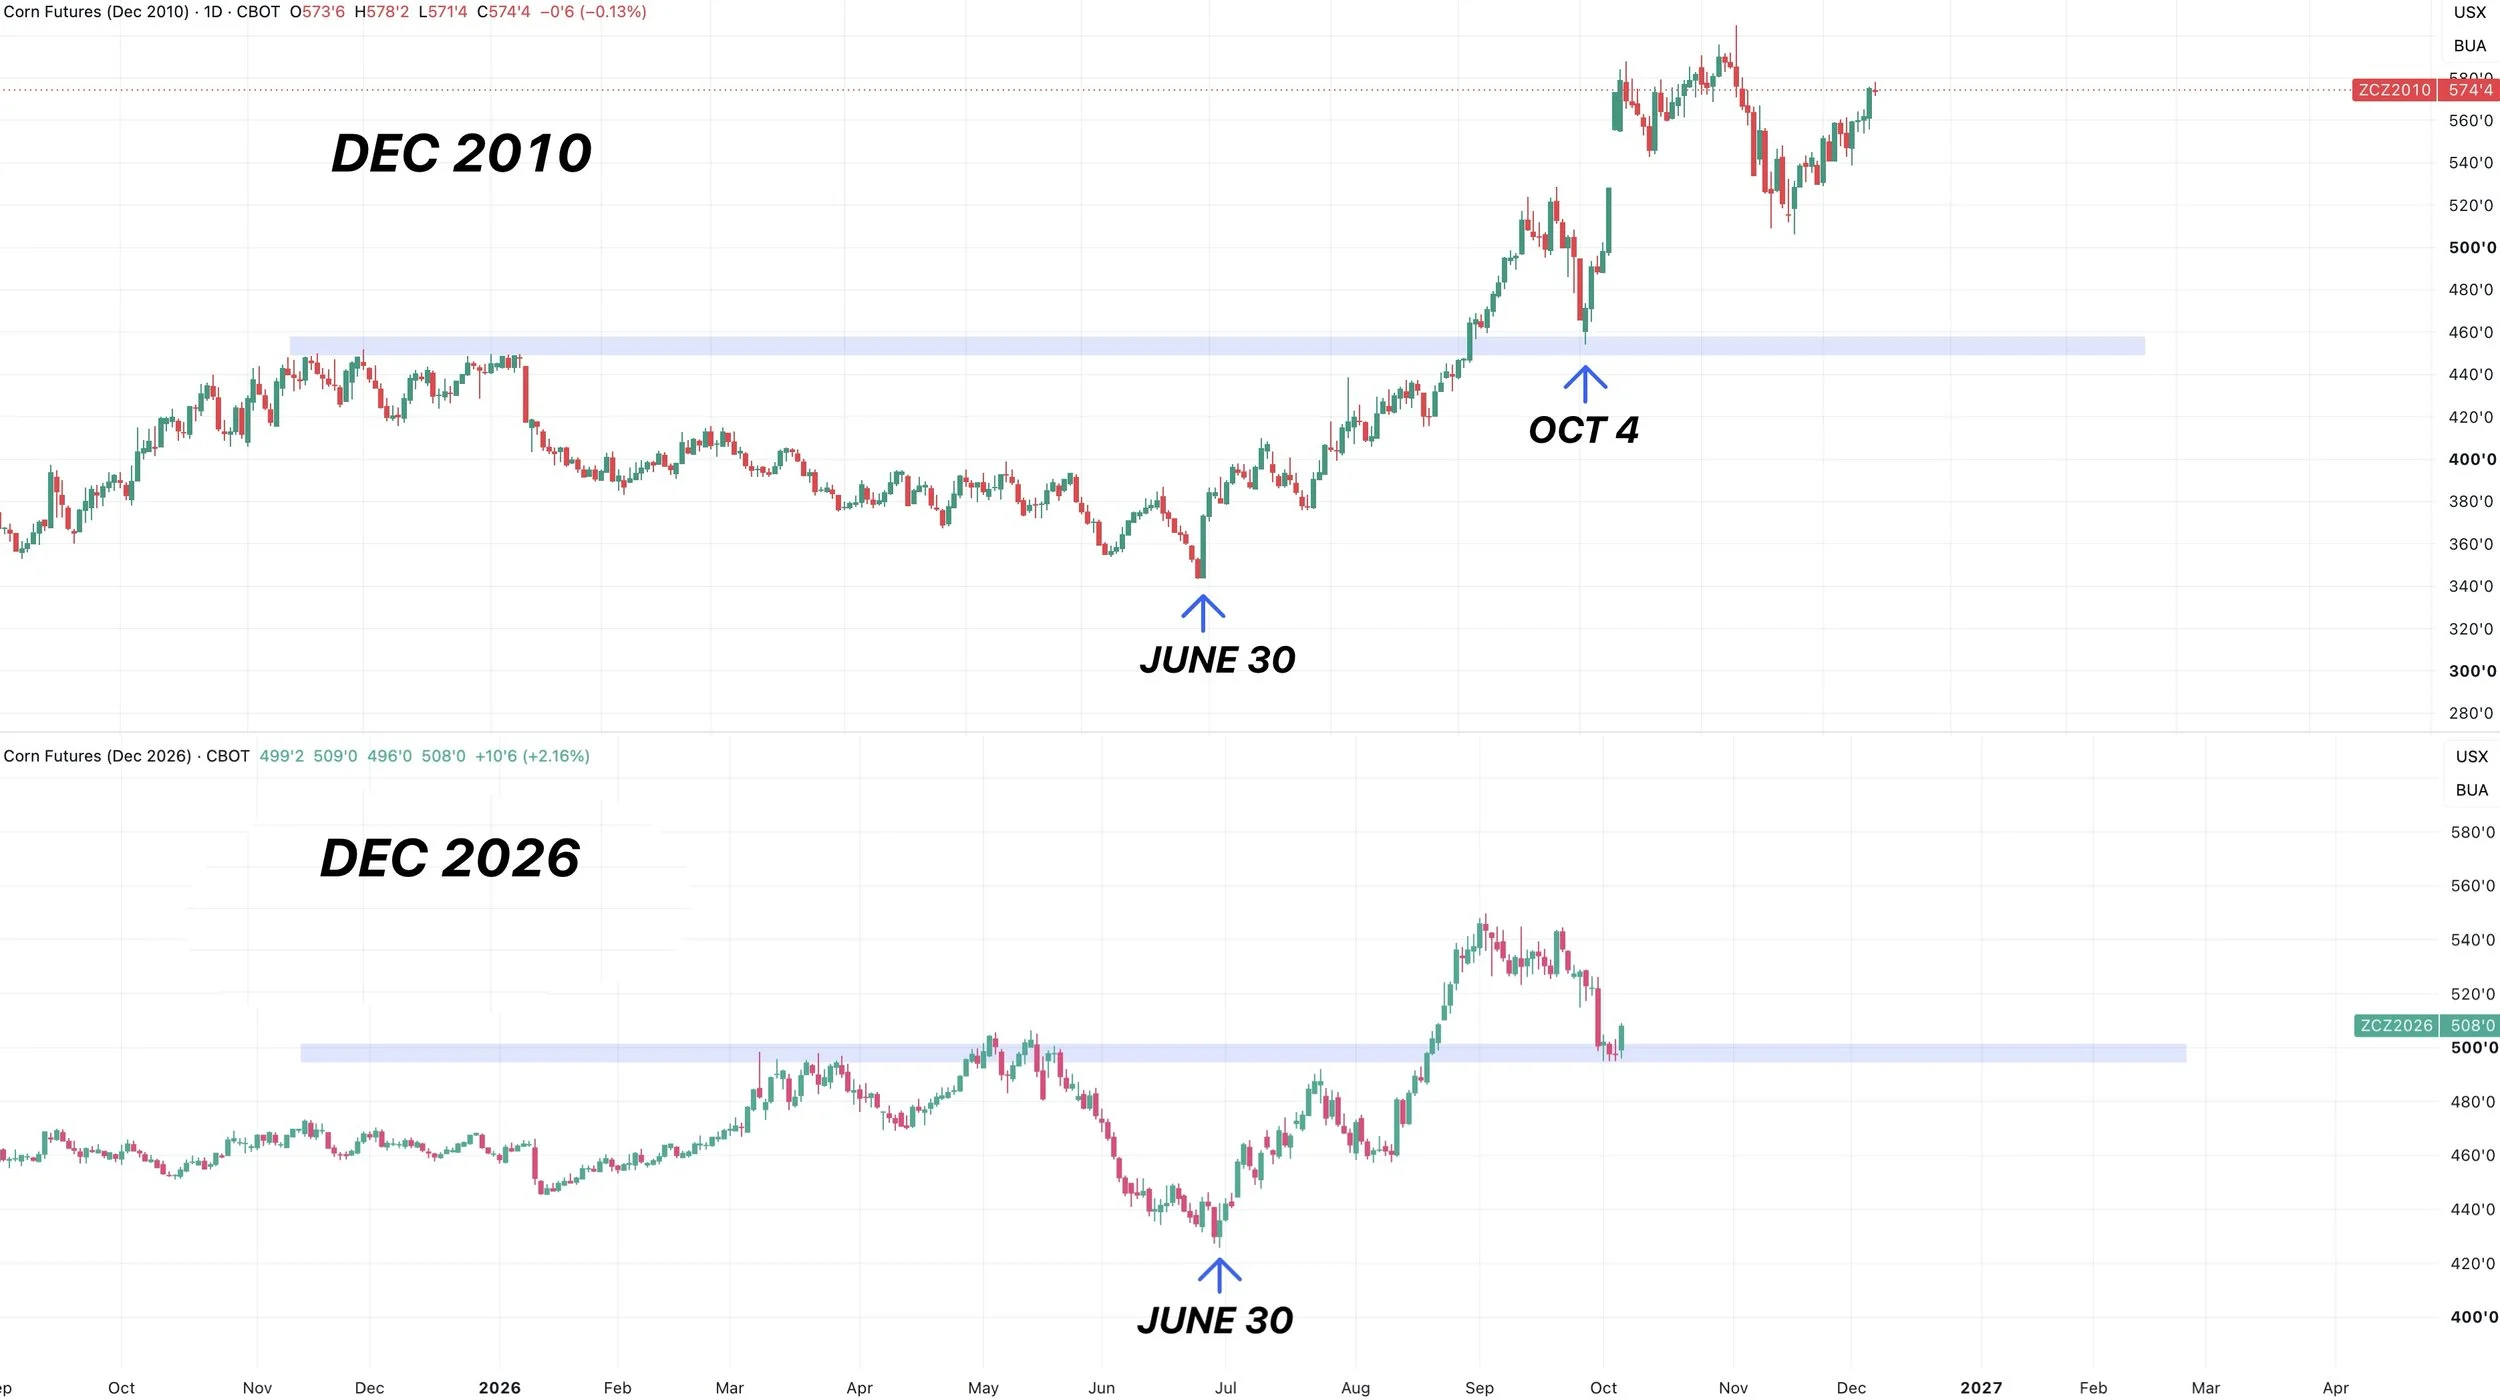
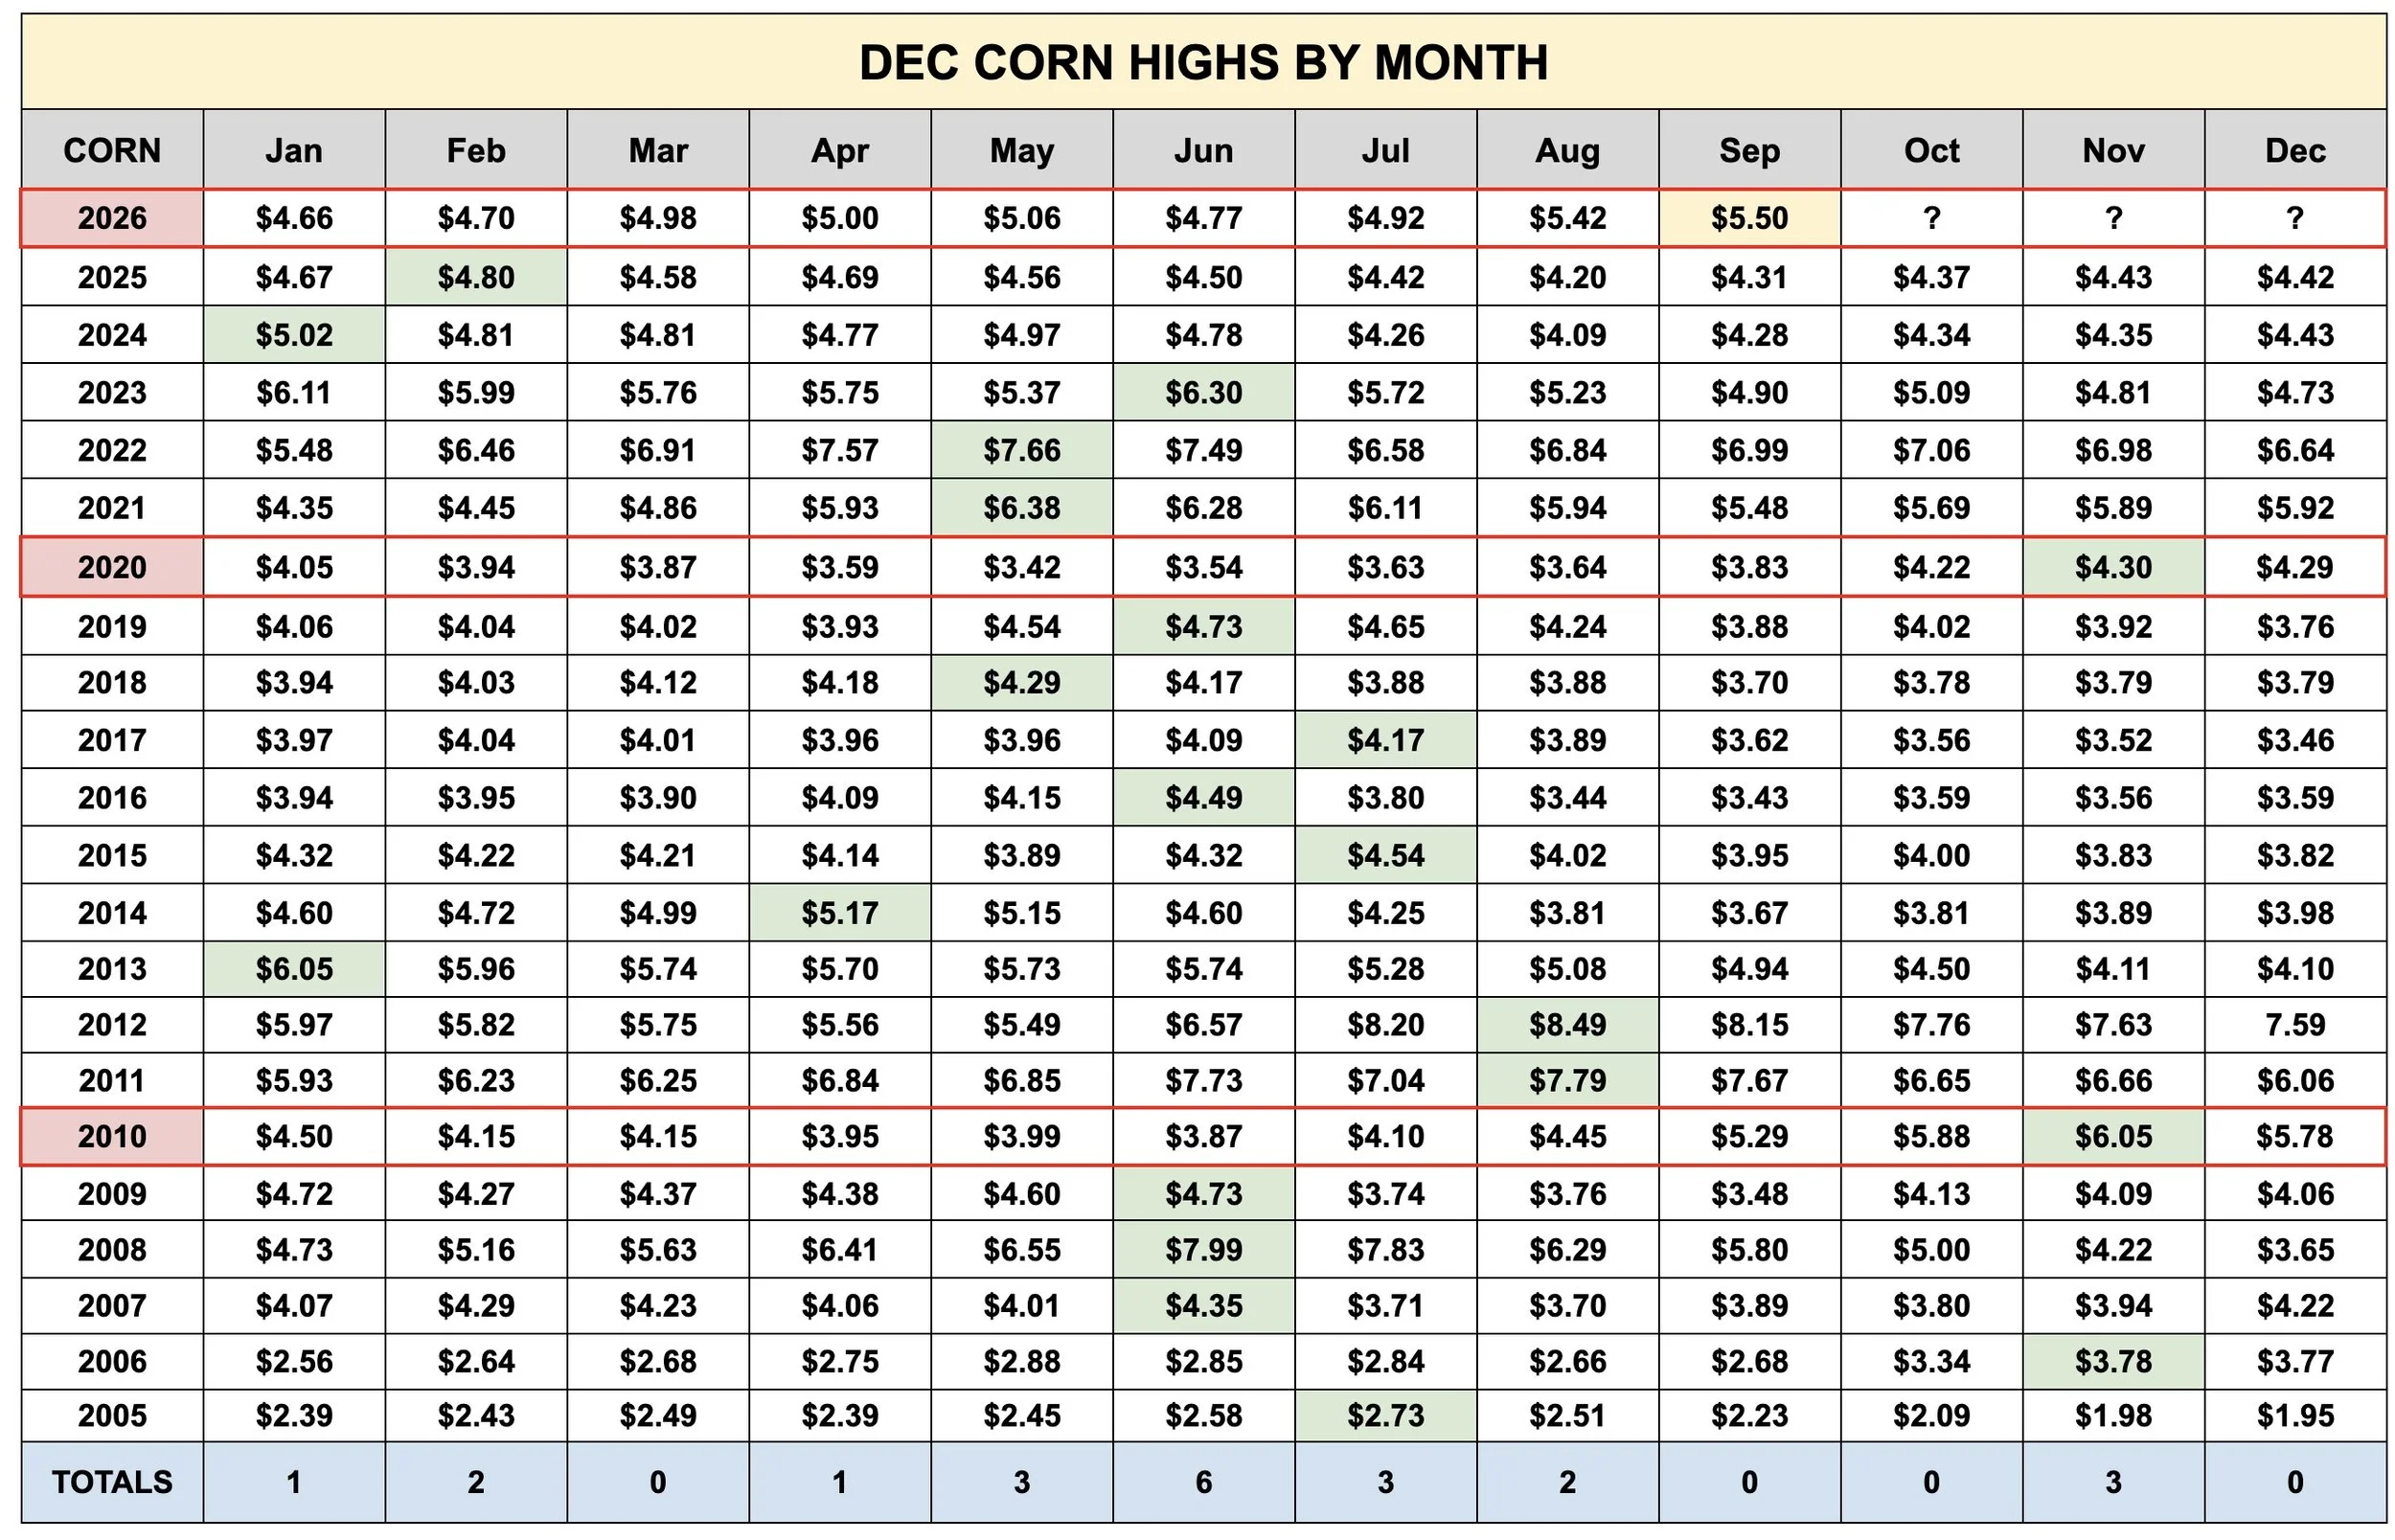
It's Giving 2010 Vibes:
I personally still think this setup is giving an eerily similar vibe to 2010.
We don’t have to rally to the extent we did in 2010, or get quiet as bullish of a report as we did in 2010.
But I think the way the USDA is going about things could very well be somewhat similar.
I covered this last week, so here is the short & sweet version:
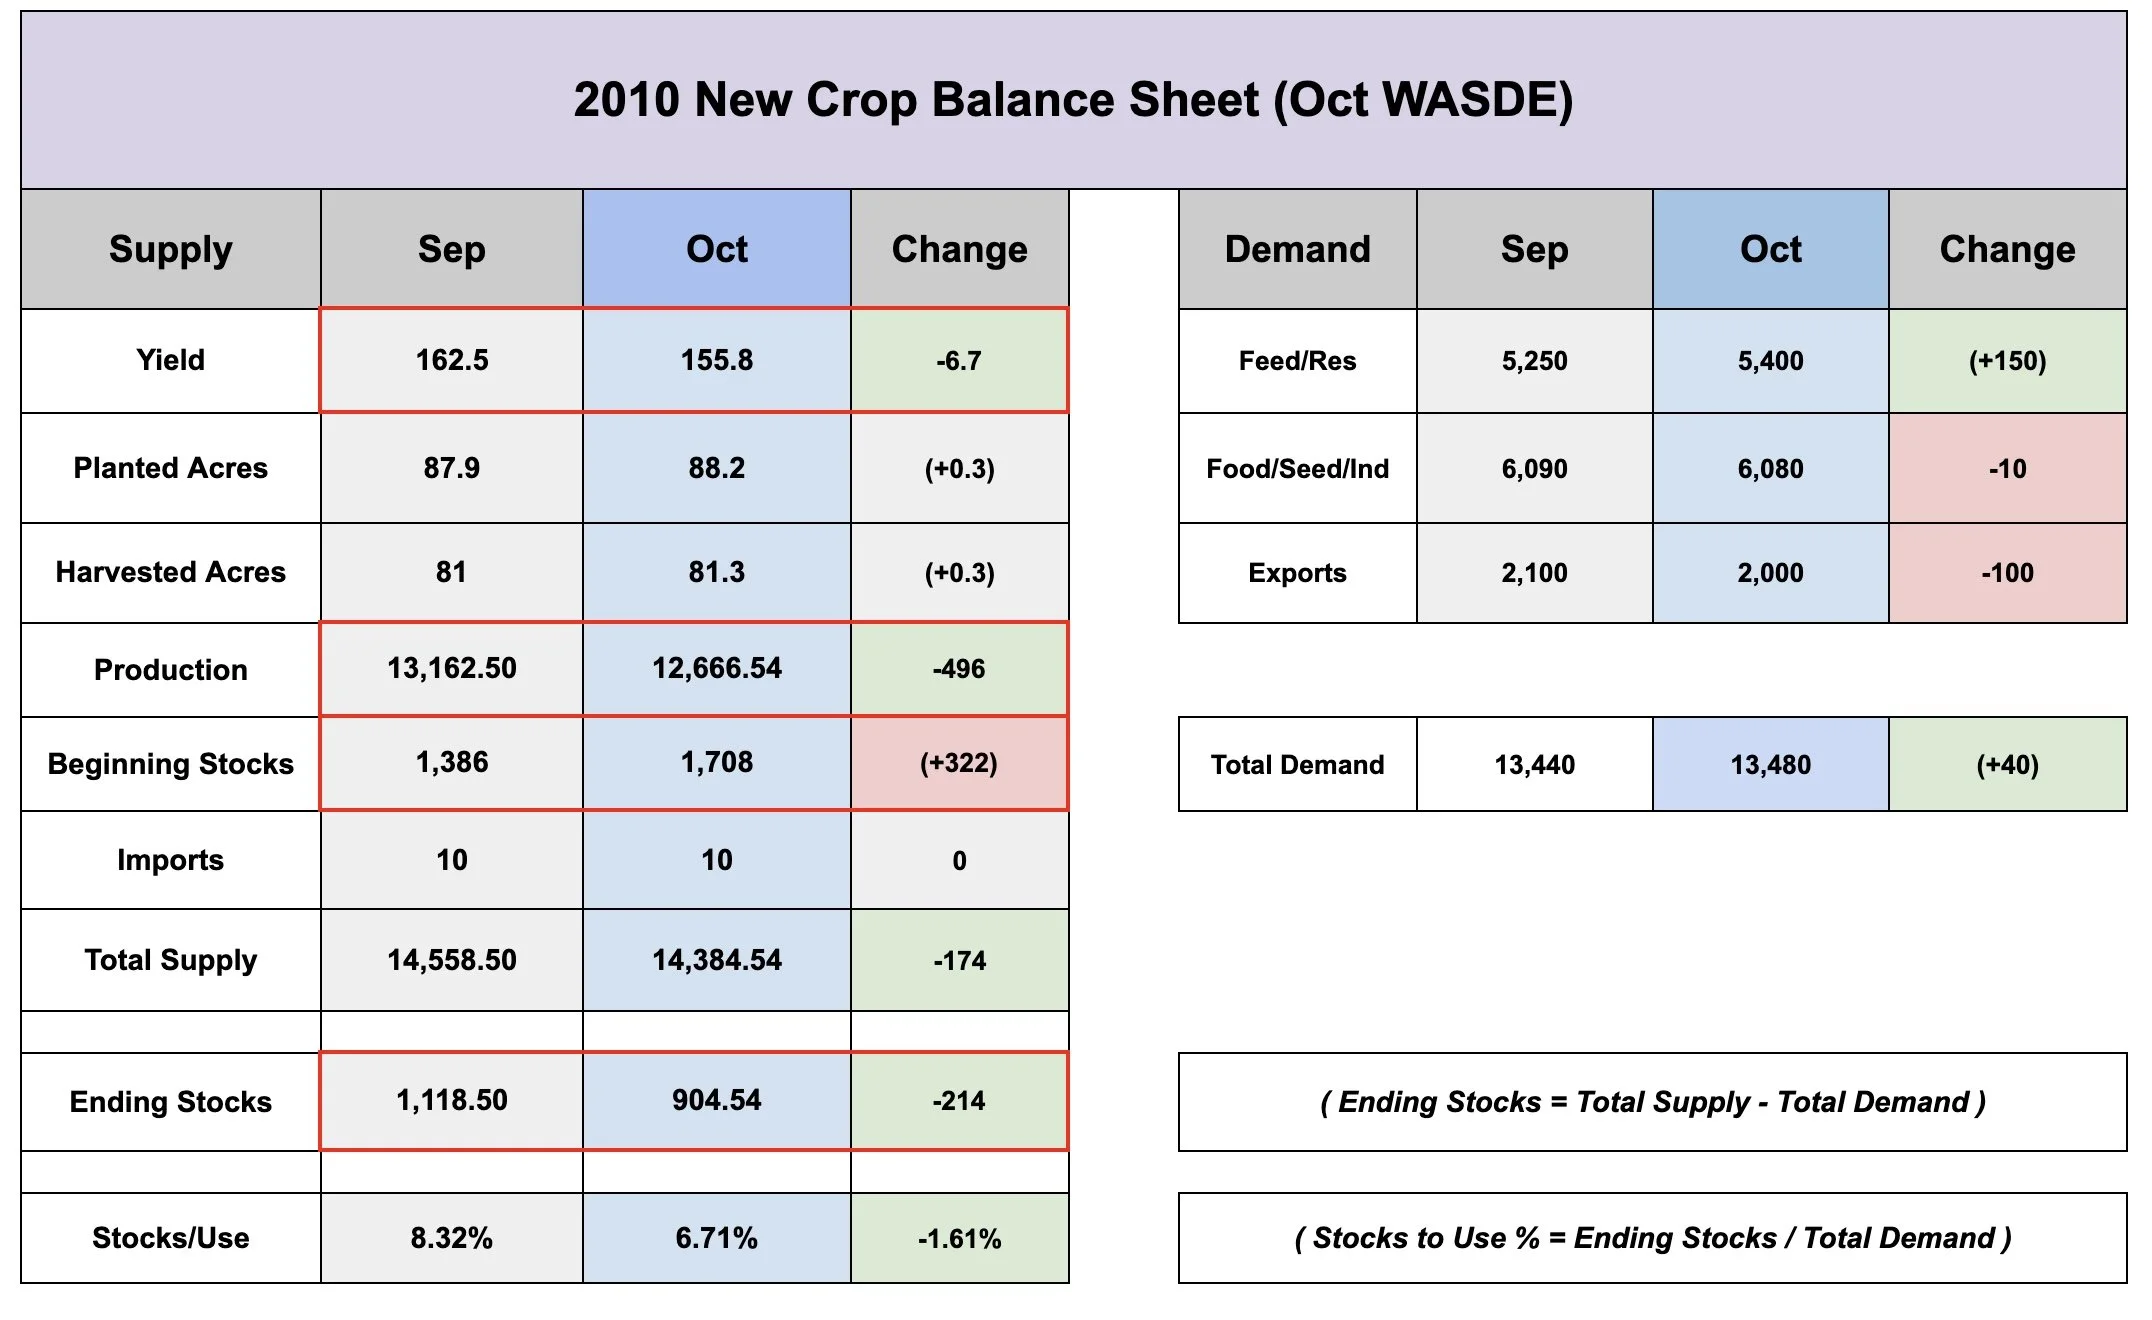
In 2010 the USDA cut old crop feed and residual demand by 322 million bu.
Fast forward a week later, in the Oct WASDE the USDA cut yield by -6.7 bpa.
Which dropped production nearly -500 million. Resulting in the new crop carryout dropping -200 million despite the extra +322 million of beginning stocks from the stocks report.
So the cut to yield more than offset the extra old crop stocks.
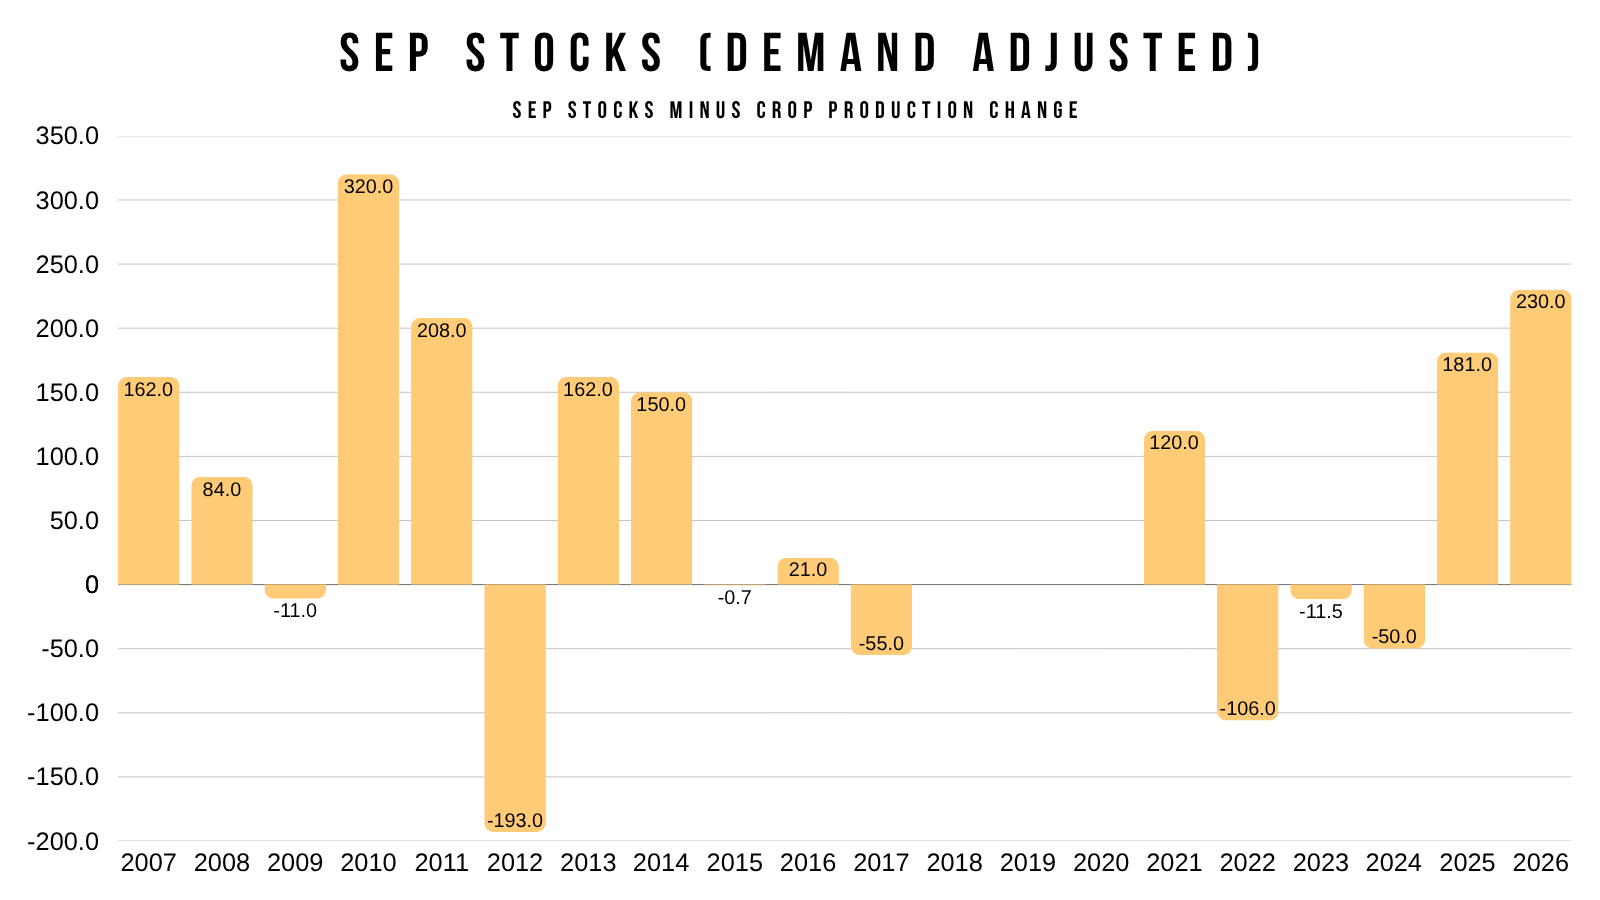
Now last week, the USDA dropped our old crop feed and residual demand by -230 million.
This is not as large as the -322 million cut in 2010. But this would be the largest demand miss since 2010.
Maybe the USDA did this because they know that yield will be coming down.
Just like what happend in 2010.
The report isn’t the only reason to think that this year rhymes with 2010.
I've been talking about the similarities between the two years for a while now.
Just look at the price action.
Both years posted their yearly lows on the June 30th report.
Both sold off on the Sep 30th stocks report.
Both came down to re-check the prior highs for the year.
Obviously we don’t have to follow 2010 exactly.
But can’t ignore the similarities and the potential.
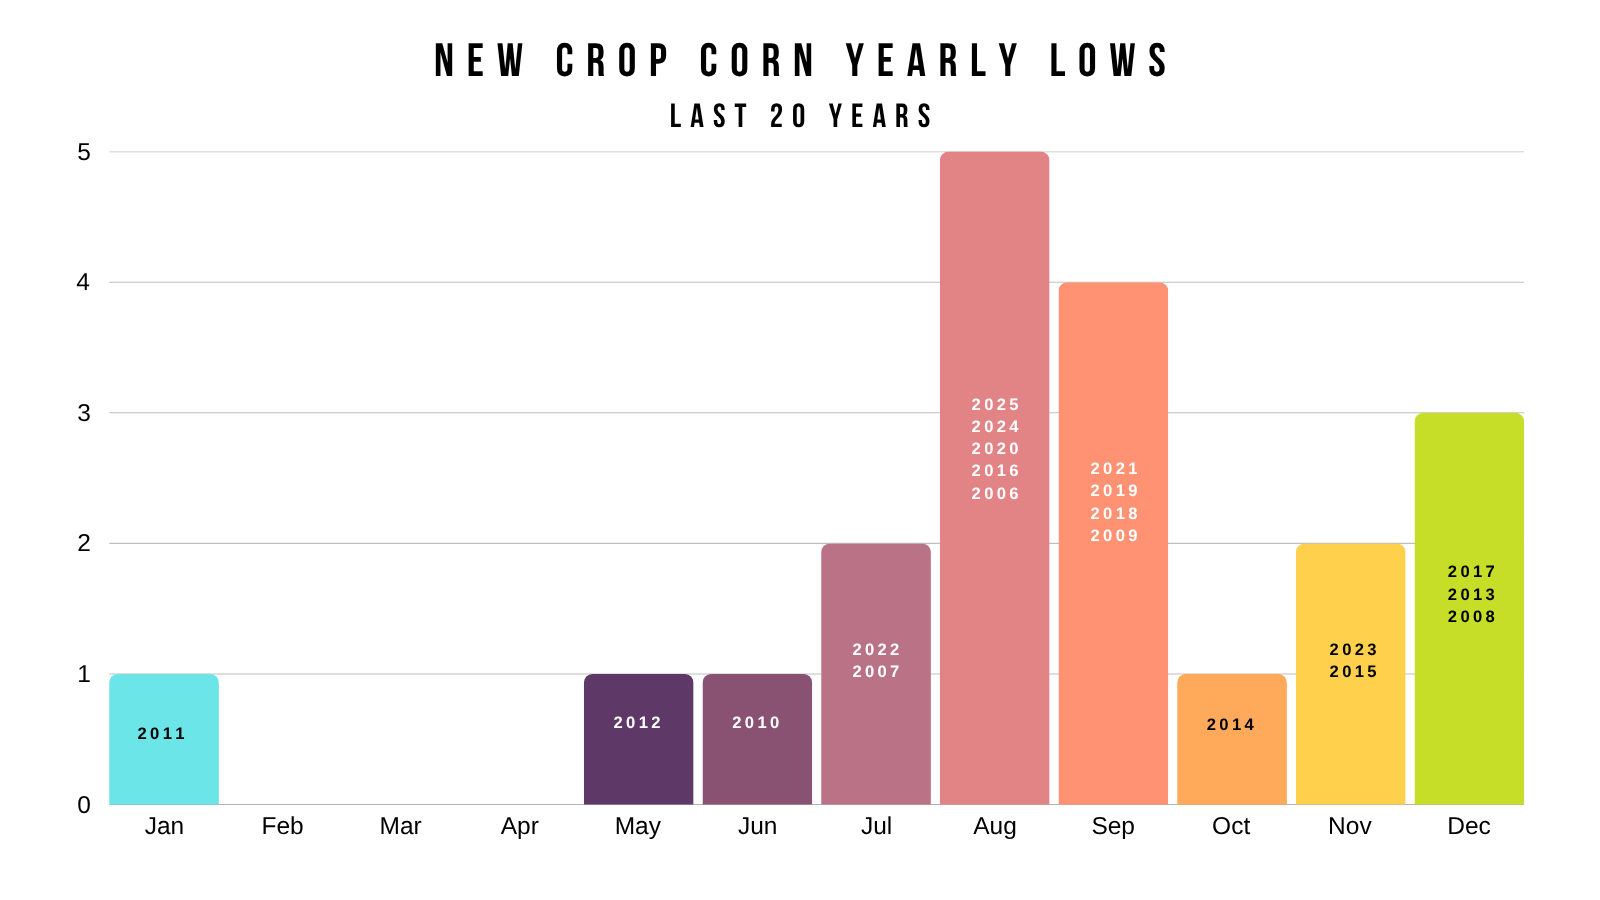
2010 is the only year that we have posted our lowest price of the year in June.
Just like we did this year.
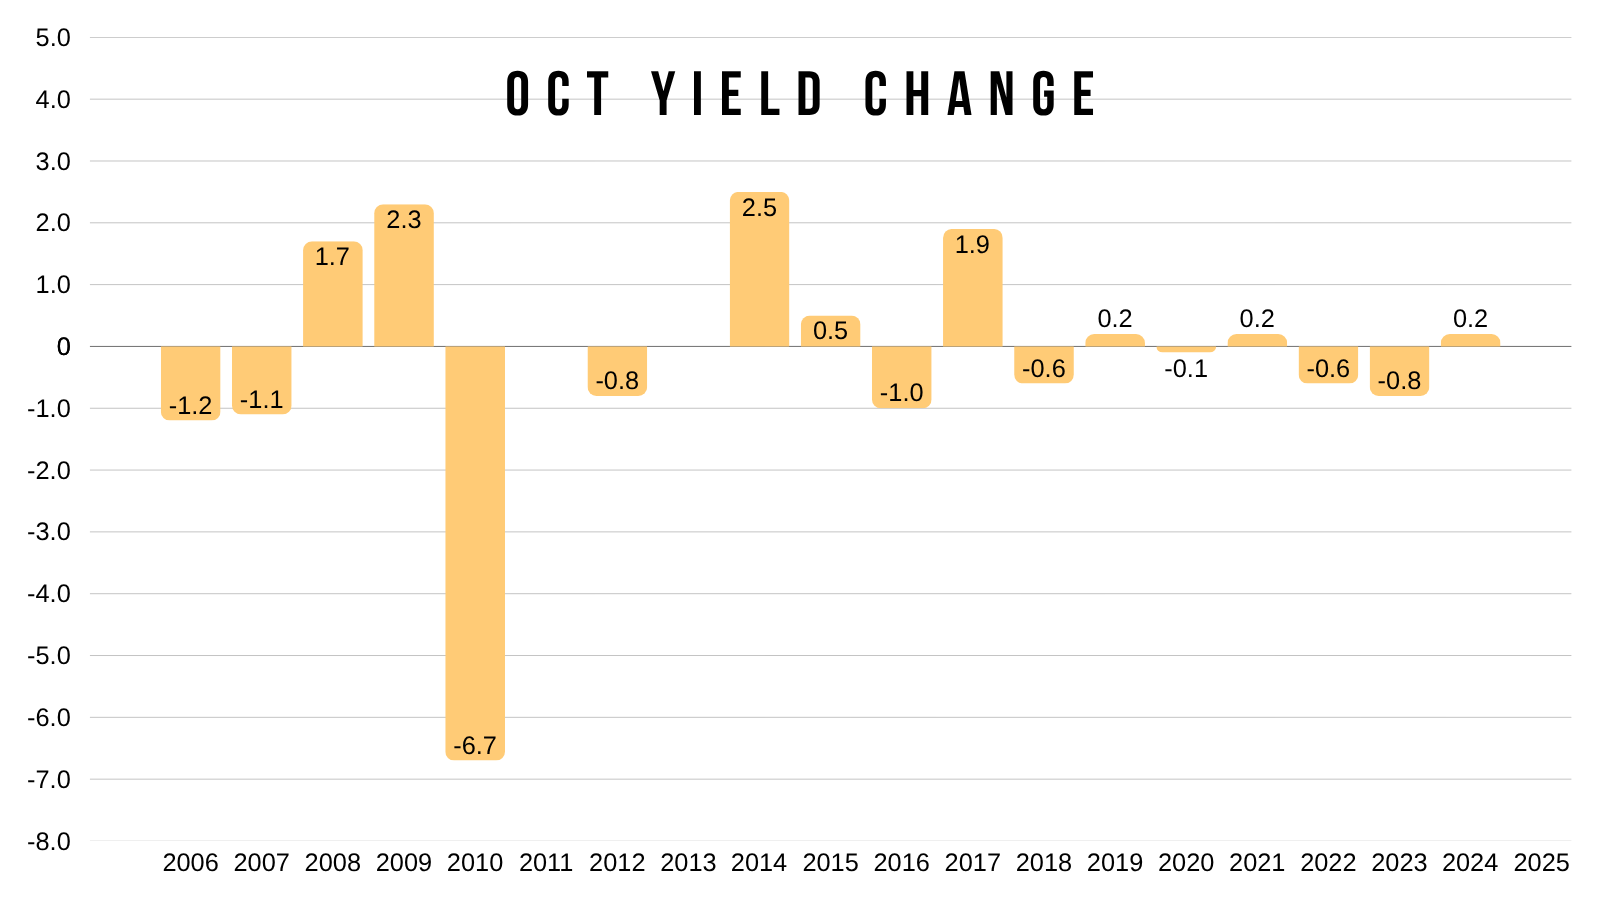
Does the USDA usually cut yield in Oct?
The answer would actually be no.
If they cut yield in October, it's usually just a minor change.
In the last 20 years, we have only seen them cut yield by more than -1.5 bpa one time.
Which was 2010. Where they cut it by -6.7 bpa.
No. I do not see a world where they cut yield by that much. But would a cut half that size be out of the realm of possible?
I'd say a -2 to -3 bpa cut is very possible.
If the USDA left yield unchanged, it would cause a blood bath. But I do not believe there is any chance the USDA doesn’t drop it at all.
Here are some balance sheet scenarios.
Since we have the old crop buffer, a -2 bpa cut once again would simply take the balance sheet back to where it was.
Back under a 10% stocks to use, yet we're now -50 cents off the highs.
Where as a -3 bpa cut would drop that stocks to use into the low 9% range. Before touching demand. Which would be a very bullish outlook if realized.
Bearish Sep Reports Lead to Reversals?
Here was some data I showed you guys after the report last week.
I was again wanted to include because the data still stands.
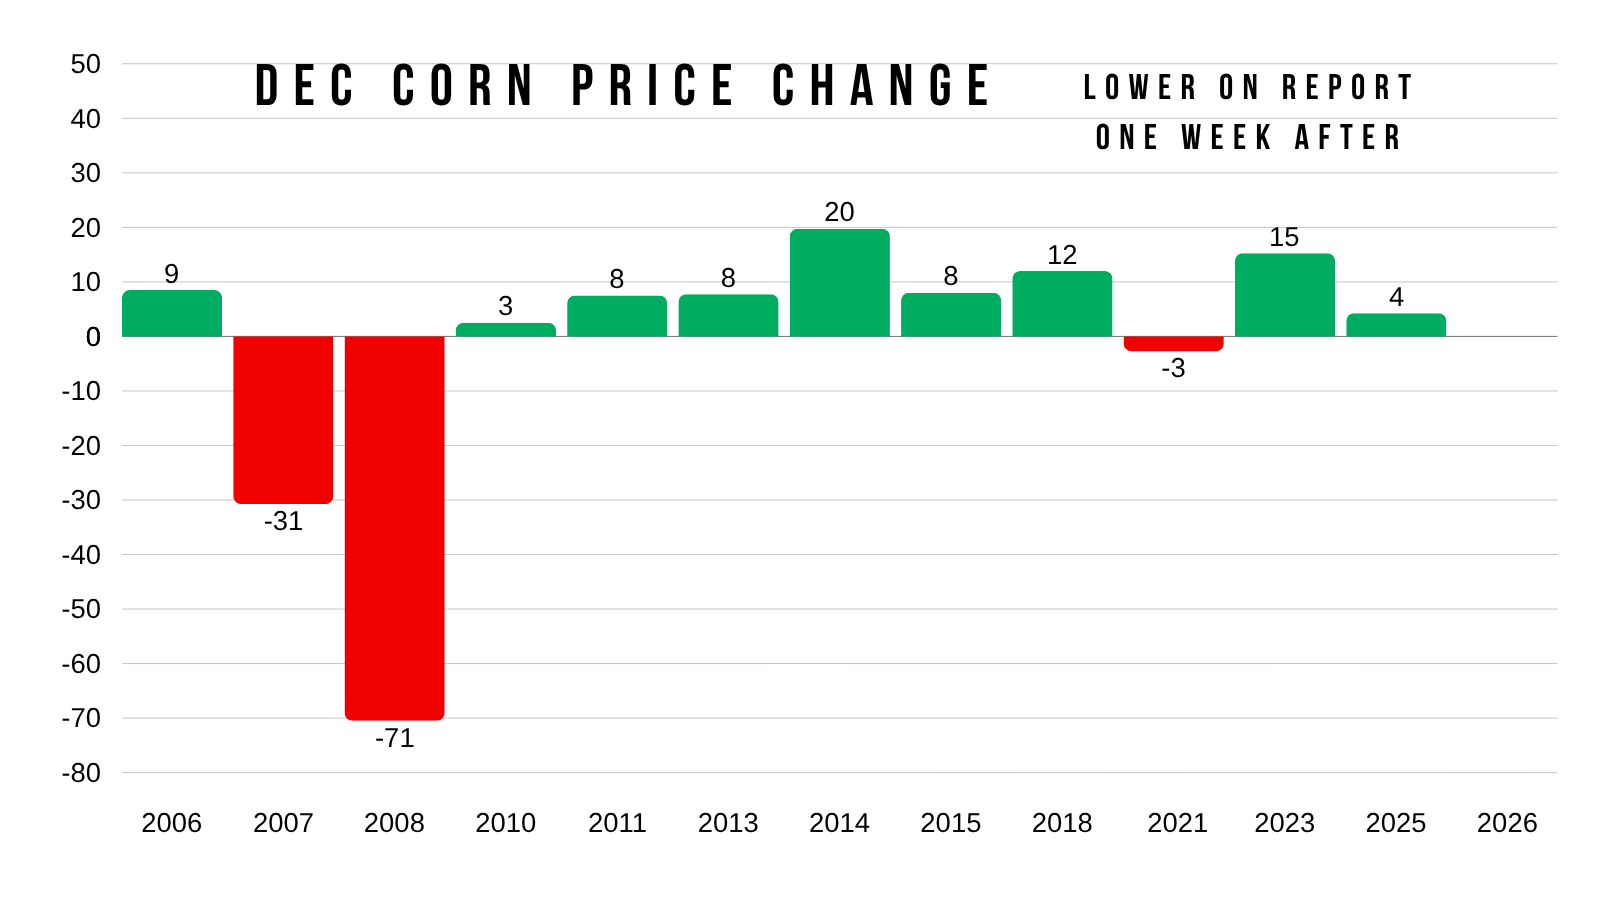
This data shows what happened 1 week after trading lower on the day of the Sep stocks report.
We were higher in the last 9 of 12 years.
Tomorrow marks 1 week since that report.
And right now, corn is higher than where it closed after the report.
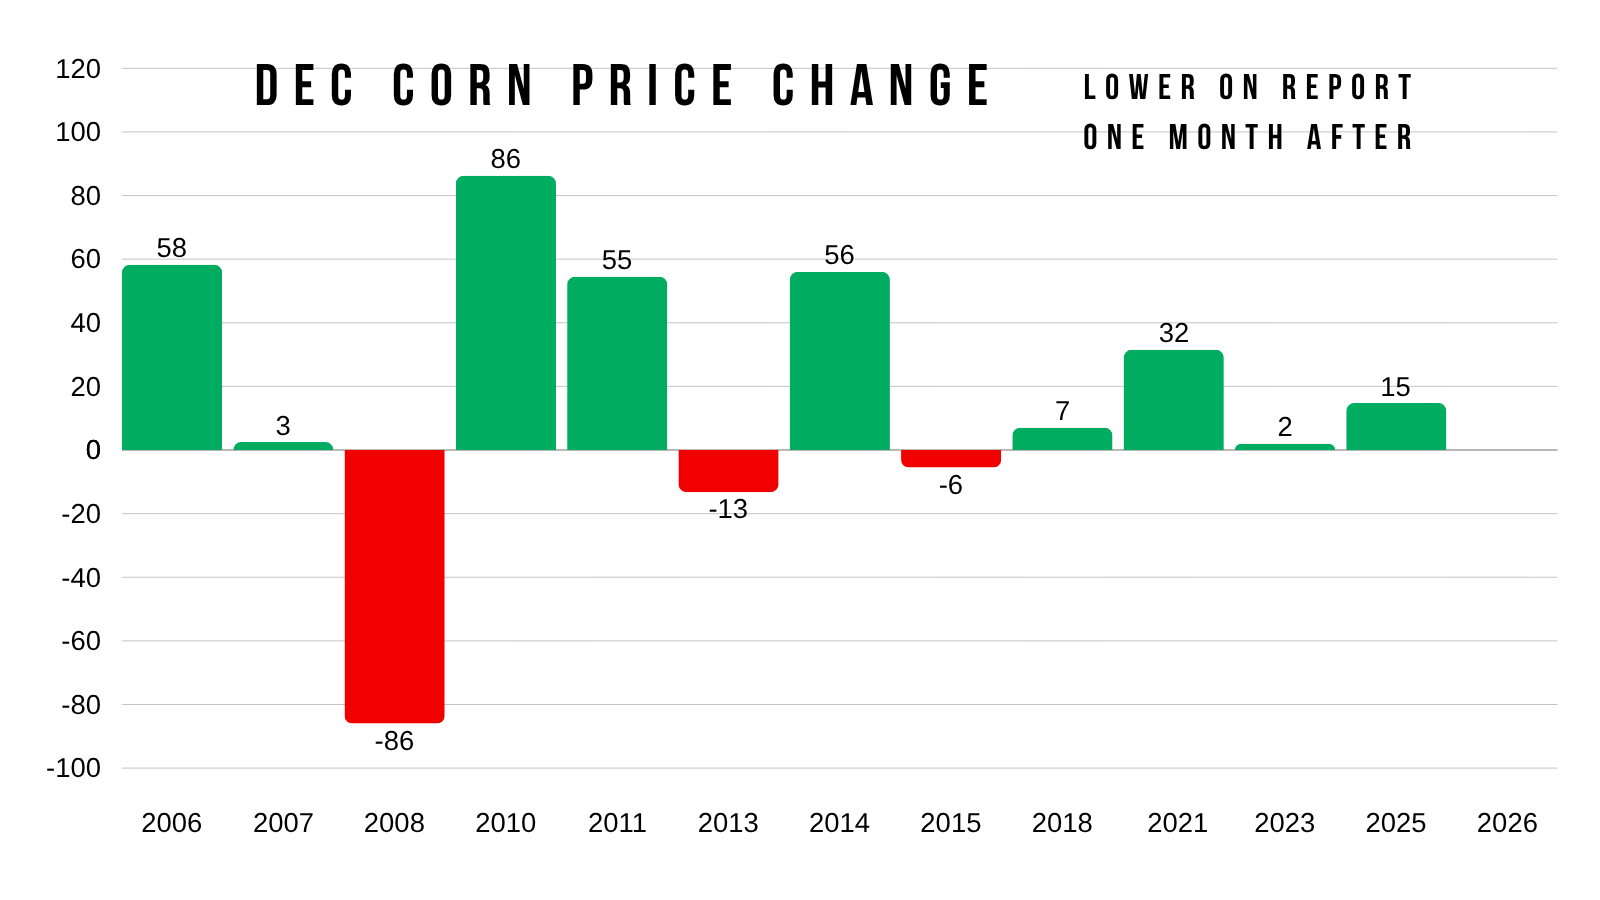
If you push the data back, exactly 1 month after trading lower on the Sep stocks report.
Corn has again traded higher in 9 of the last 12 years.
I would also throw 2008 out of the window, as the world was falling apart, so that's an anomaly.
So essentially you traded higher in 9 of 11 years.
We have a high tendency to reverse after a bearish stocks report.
Seasonal Data: Bullish & Bearish
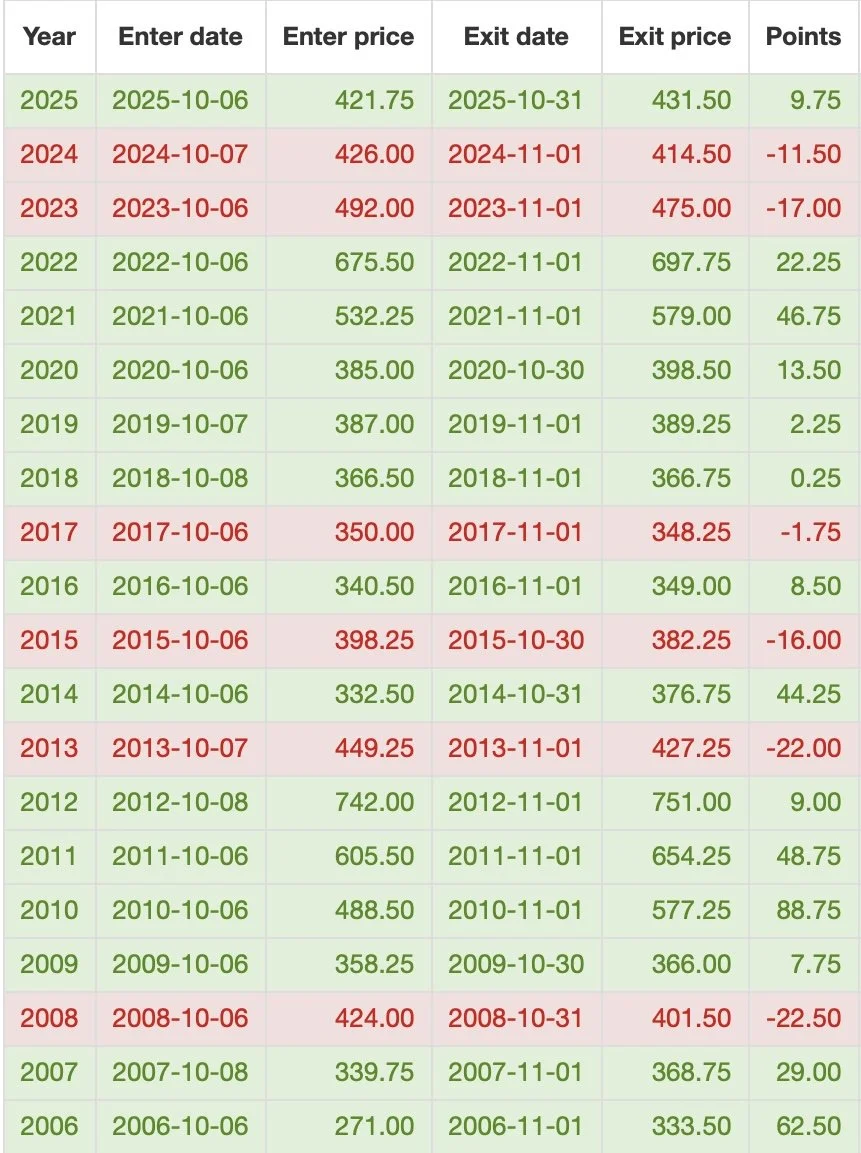
From today's date by November 1st we have been higher the last 7 of 10 years.
Also higher 70% of the time over the last 20 years.
October is seasonally friendly.
One last thing to note is mid-terms. I had some people ask about them and what happens to prices historically.
Who knows if it has any impact, but in all mid-term years we were higher from today's date by November 1st.
Which would be: 2026, 2022, 2018, 2014, 2010, 2006
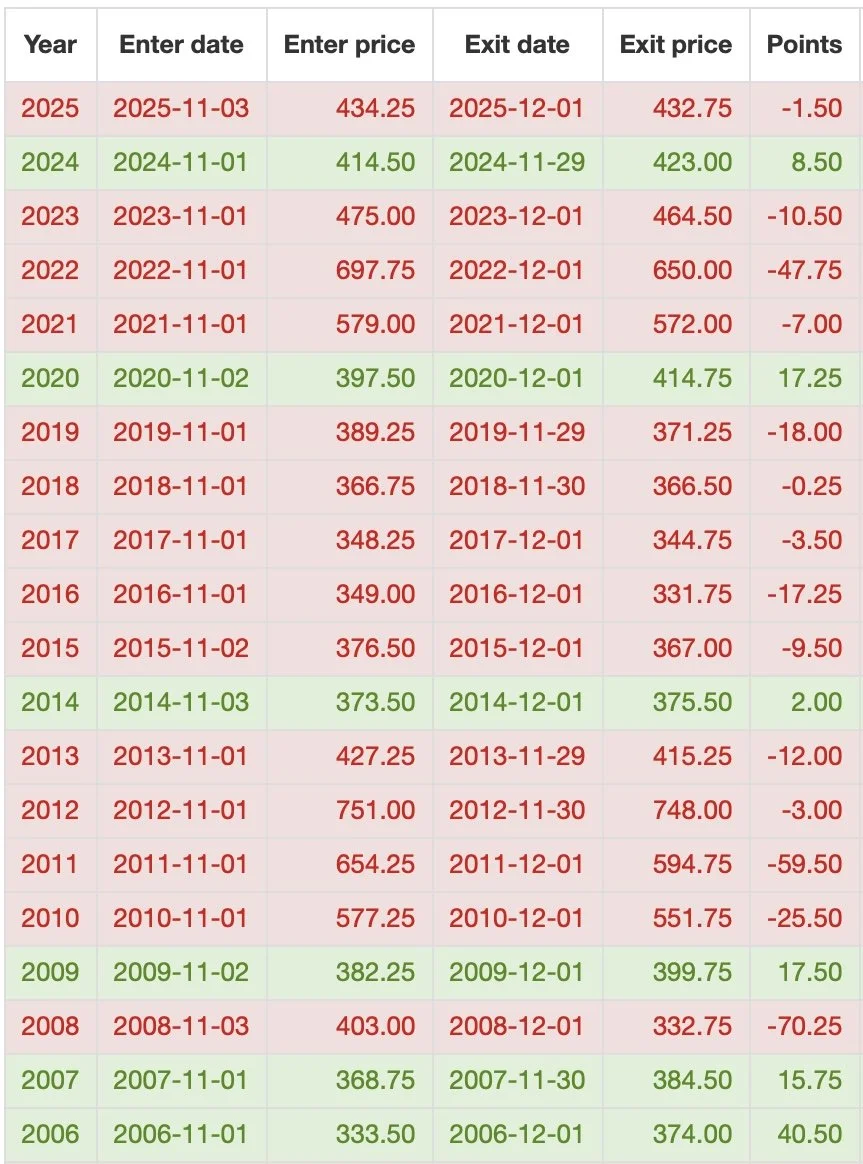
Now for some bearish seasonals.
After a friendly October, corn does tend to see weakness in November heading into December.
From November 1st to December 1st, corn has traded lower in 8 of the last 10 years.
Lower in 12 of the last 15 years.
Seasonal Highs:
I've talked about this set of data countless times this year.
Maybe this year winds up being a year of it's own like the last few years were when we topped out in January and February.
But corn has never posted it's highest price of the year in September or October.
The last two times we posted it later than August was 2020 and 2010. A bull market followed suite both times as prices continued higher into the next year.
Yet another reason to think this year has 2010 potential.
Are We in a Bull Market?
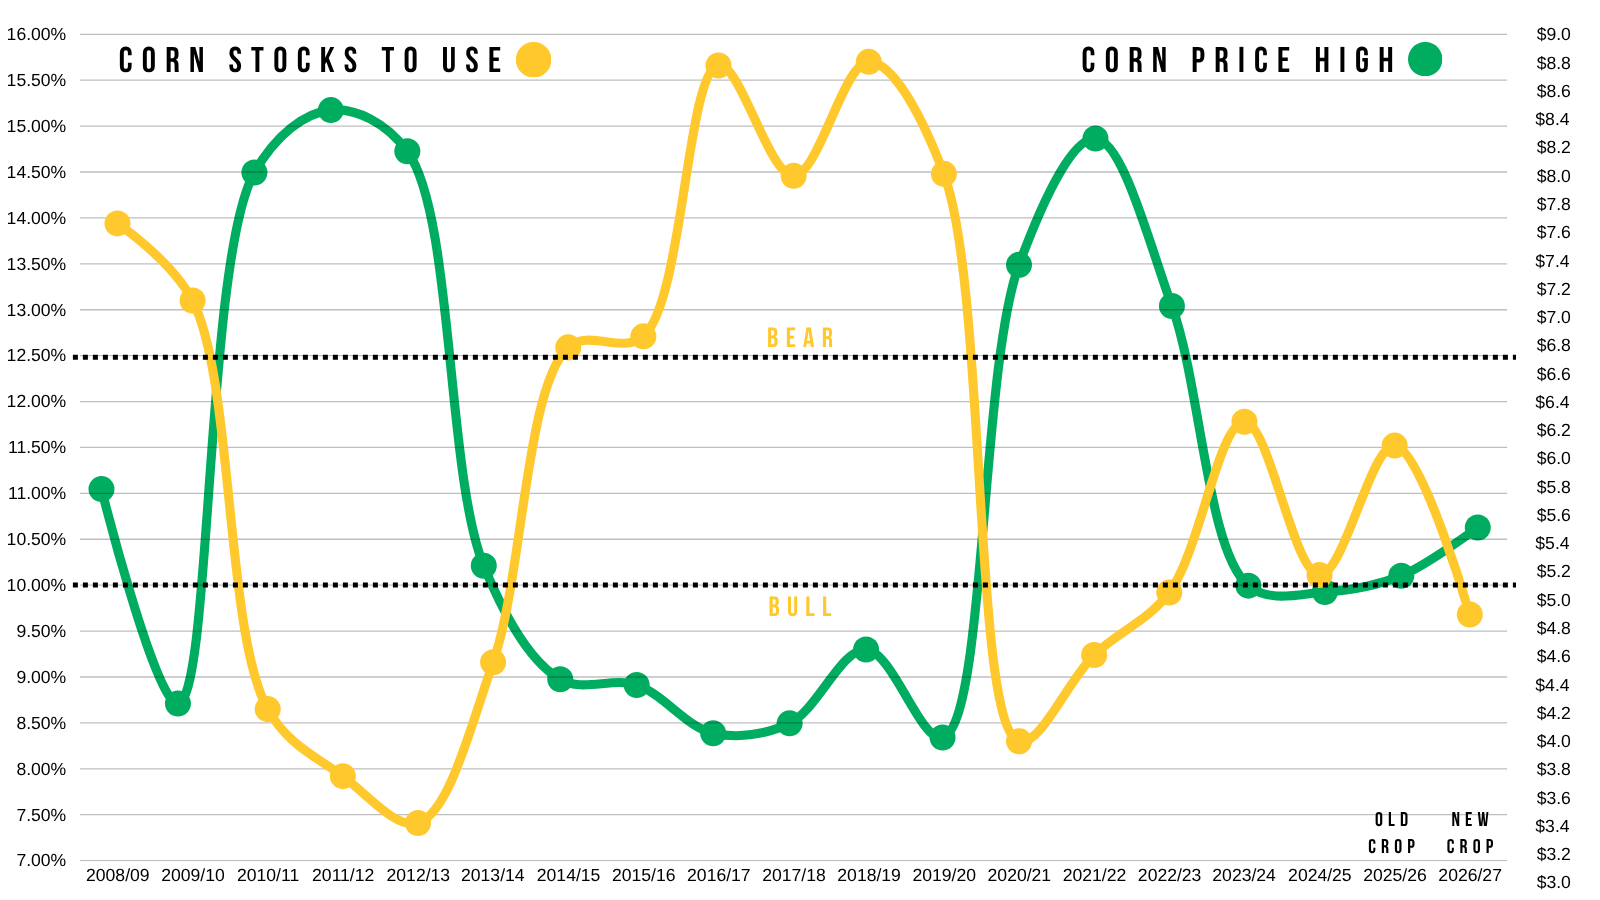
If the corn stocks to use stays below 10% like it was last month.
I see no reason to think that this isn’t potentially the start of a bull market.
If that number gets closer to 9%, it would all but reaffirm that thought process.
I've shown this many times, it compares our stocks to use vs corn prices. We have the tightest stocks to use since the 2021/22 marketing year right now. Hence we have multi-year highs in prices.
For us to get $6 or $7 corn, this needs to stay below 10% and probably get tighter from here.
As that's the magic threshold for corn to get much above $5.00. You can’t get a bull market unless it's below 10%, as history has proved.
So we'll see what the USDA does next week.
But the technical outlook on the charts alone are giving some hints. So let's get into them.
Corn Charts
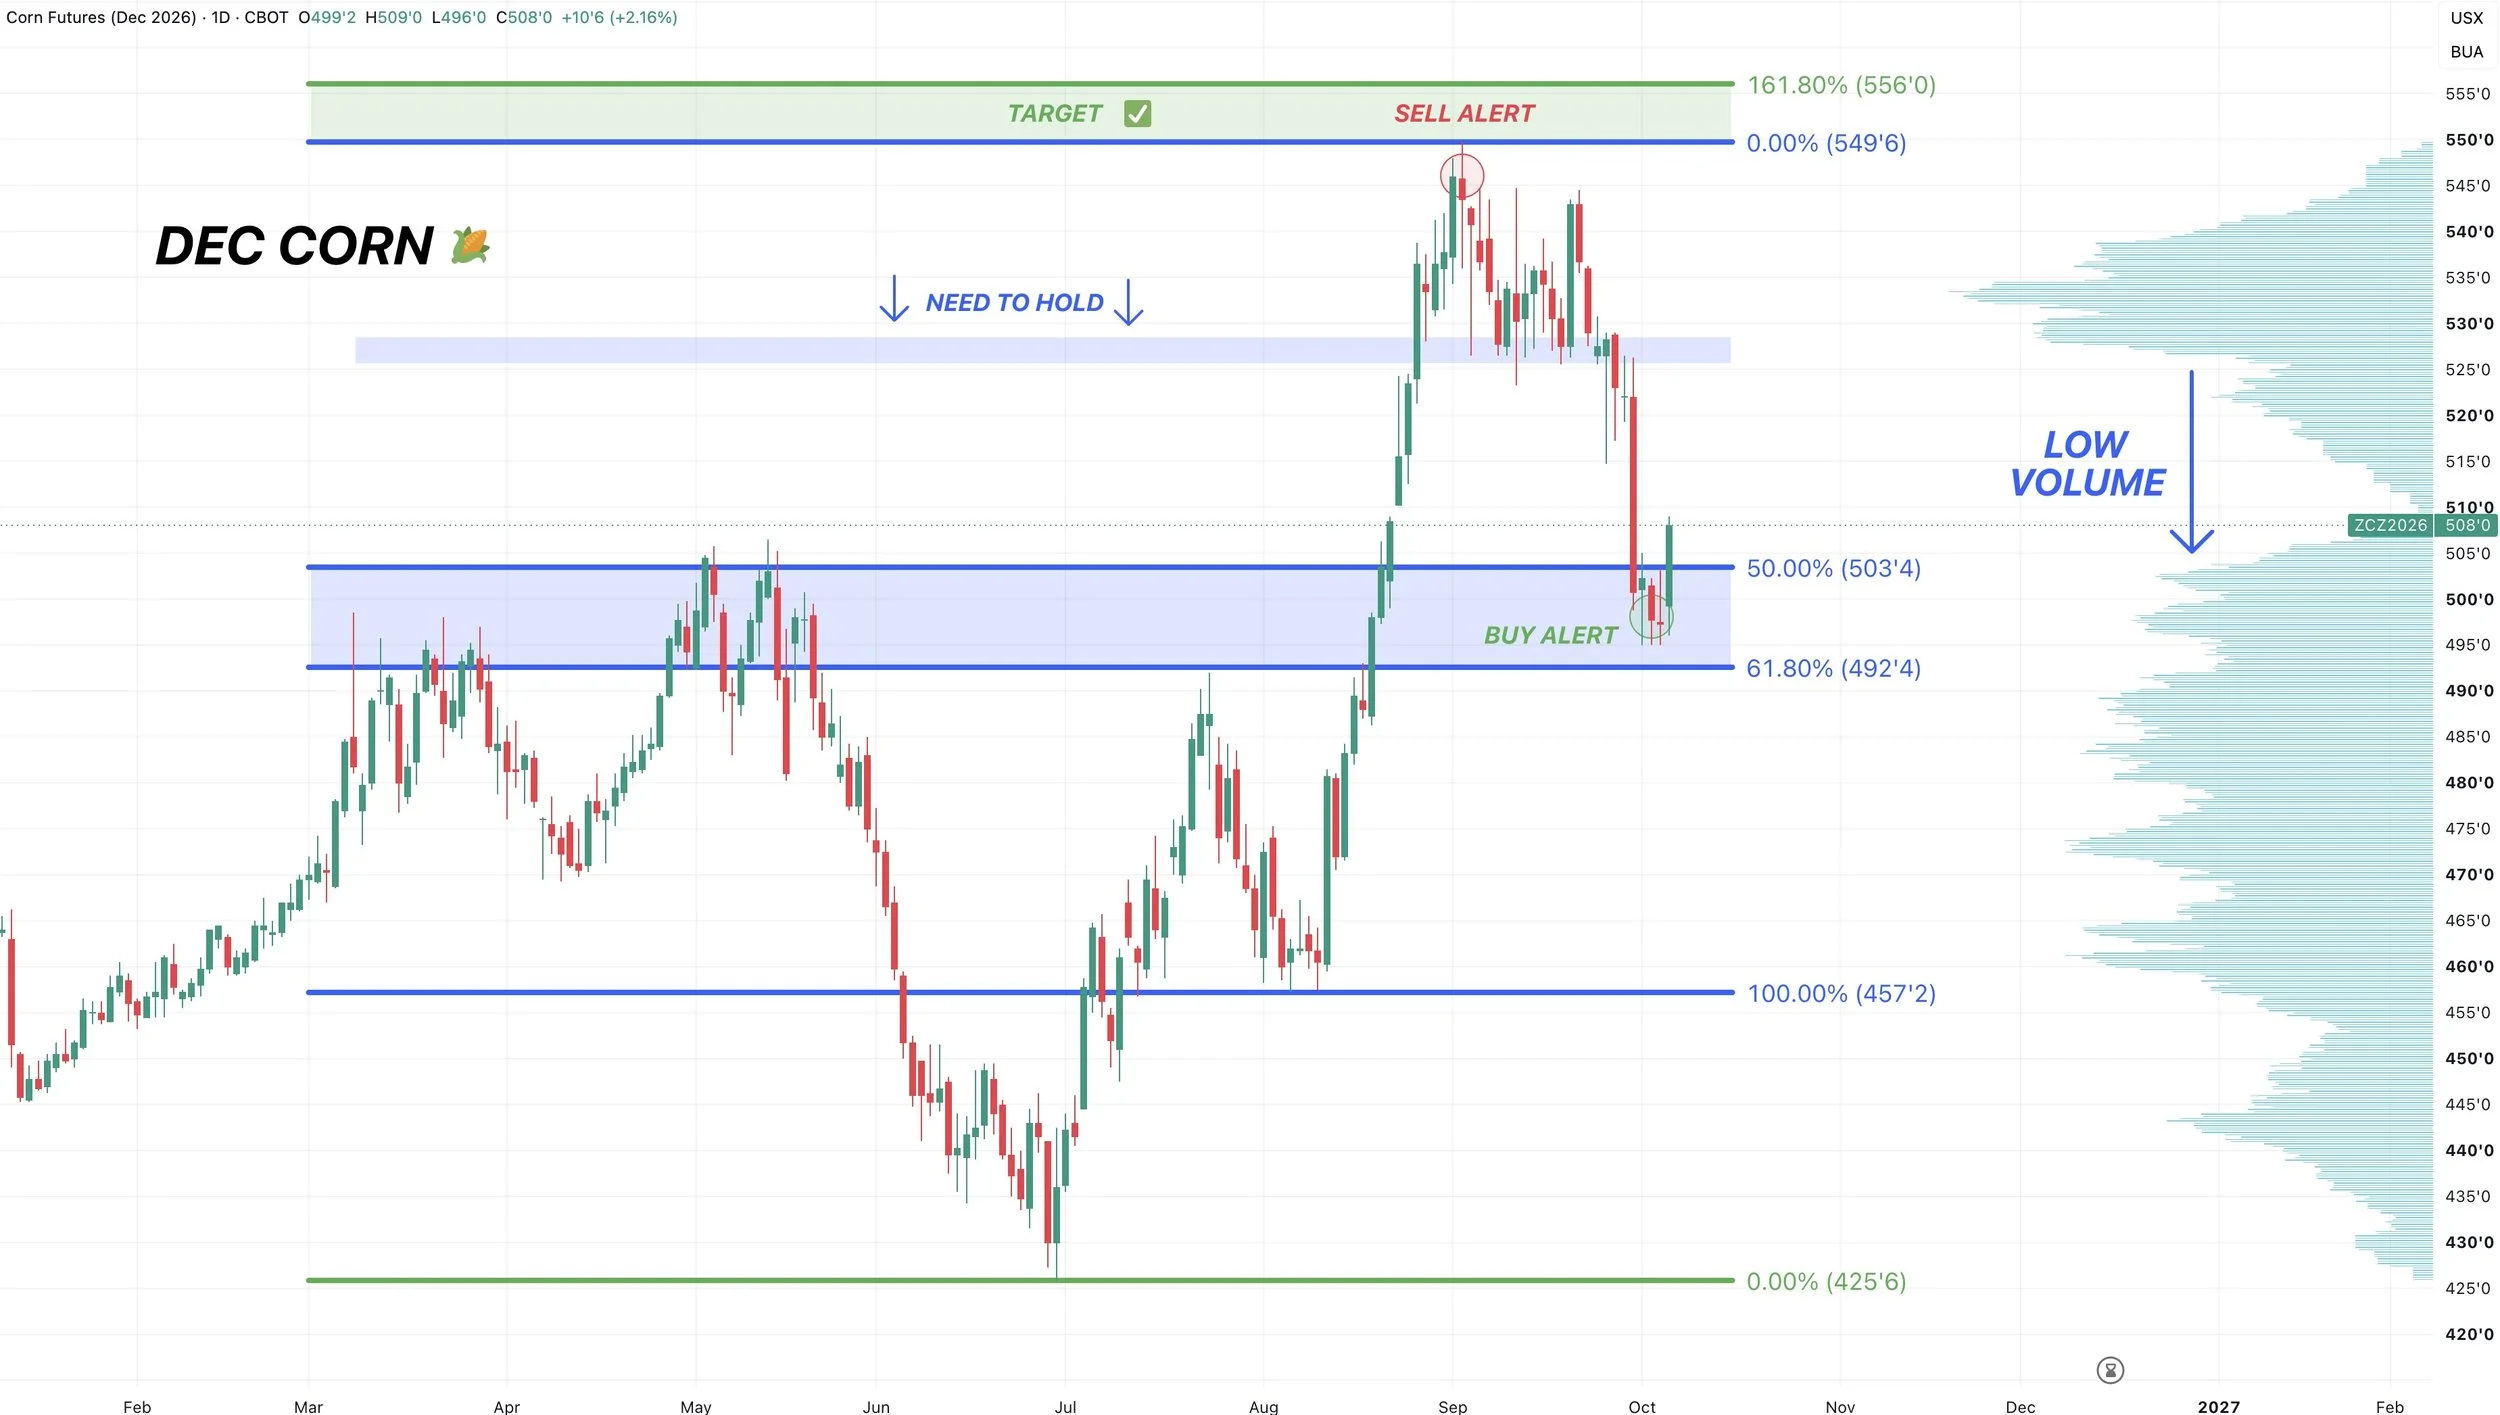
Dec Corn Daily Chart: Bottom has Arrived?
Like I said last week, markets often bottom on bad news and top on good news.
There is a reason corn bottomed on the bearish Jan report.
There is a reason wheat topped on the limit up day back on the May USDA.
The time to be bearish corn was at $5.50 and up near our sell alert. Not -50 cents lower at some big support.
Friday we sent out a rare buy signal for corn.
If you missed it here is a link: Click Here to View
But I think this is a great spot to consider re-owning corn.
Beautiful action today in corn.
Reacting right in the golden zone down to the August lows.
Which is the most common area for a correction to end.
We are re-testing the highs from May. Trying to turn old resistance into new support.
We had that massive volume gap to the downside that I had been warning about. We sliced right through it and are now back at high volume and support.
If we are going to bottom, this would be a spot where it would make a lot of sense to do so.
As long as the USDA doesn’t pull a bearish trick out of their hat, I think corn finds a bottom here.
I have not been short term bullish or called for a bottom this entire correction until now.
If you'd like to discuss what re-ownership strategy might suite you, feel free to reach out anytime.
Office: (806)484-1214
Indicators: Finally Cooled Off & Reset
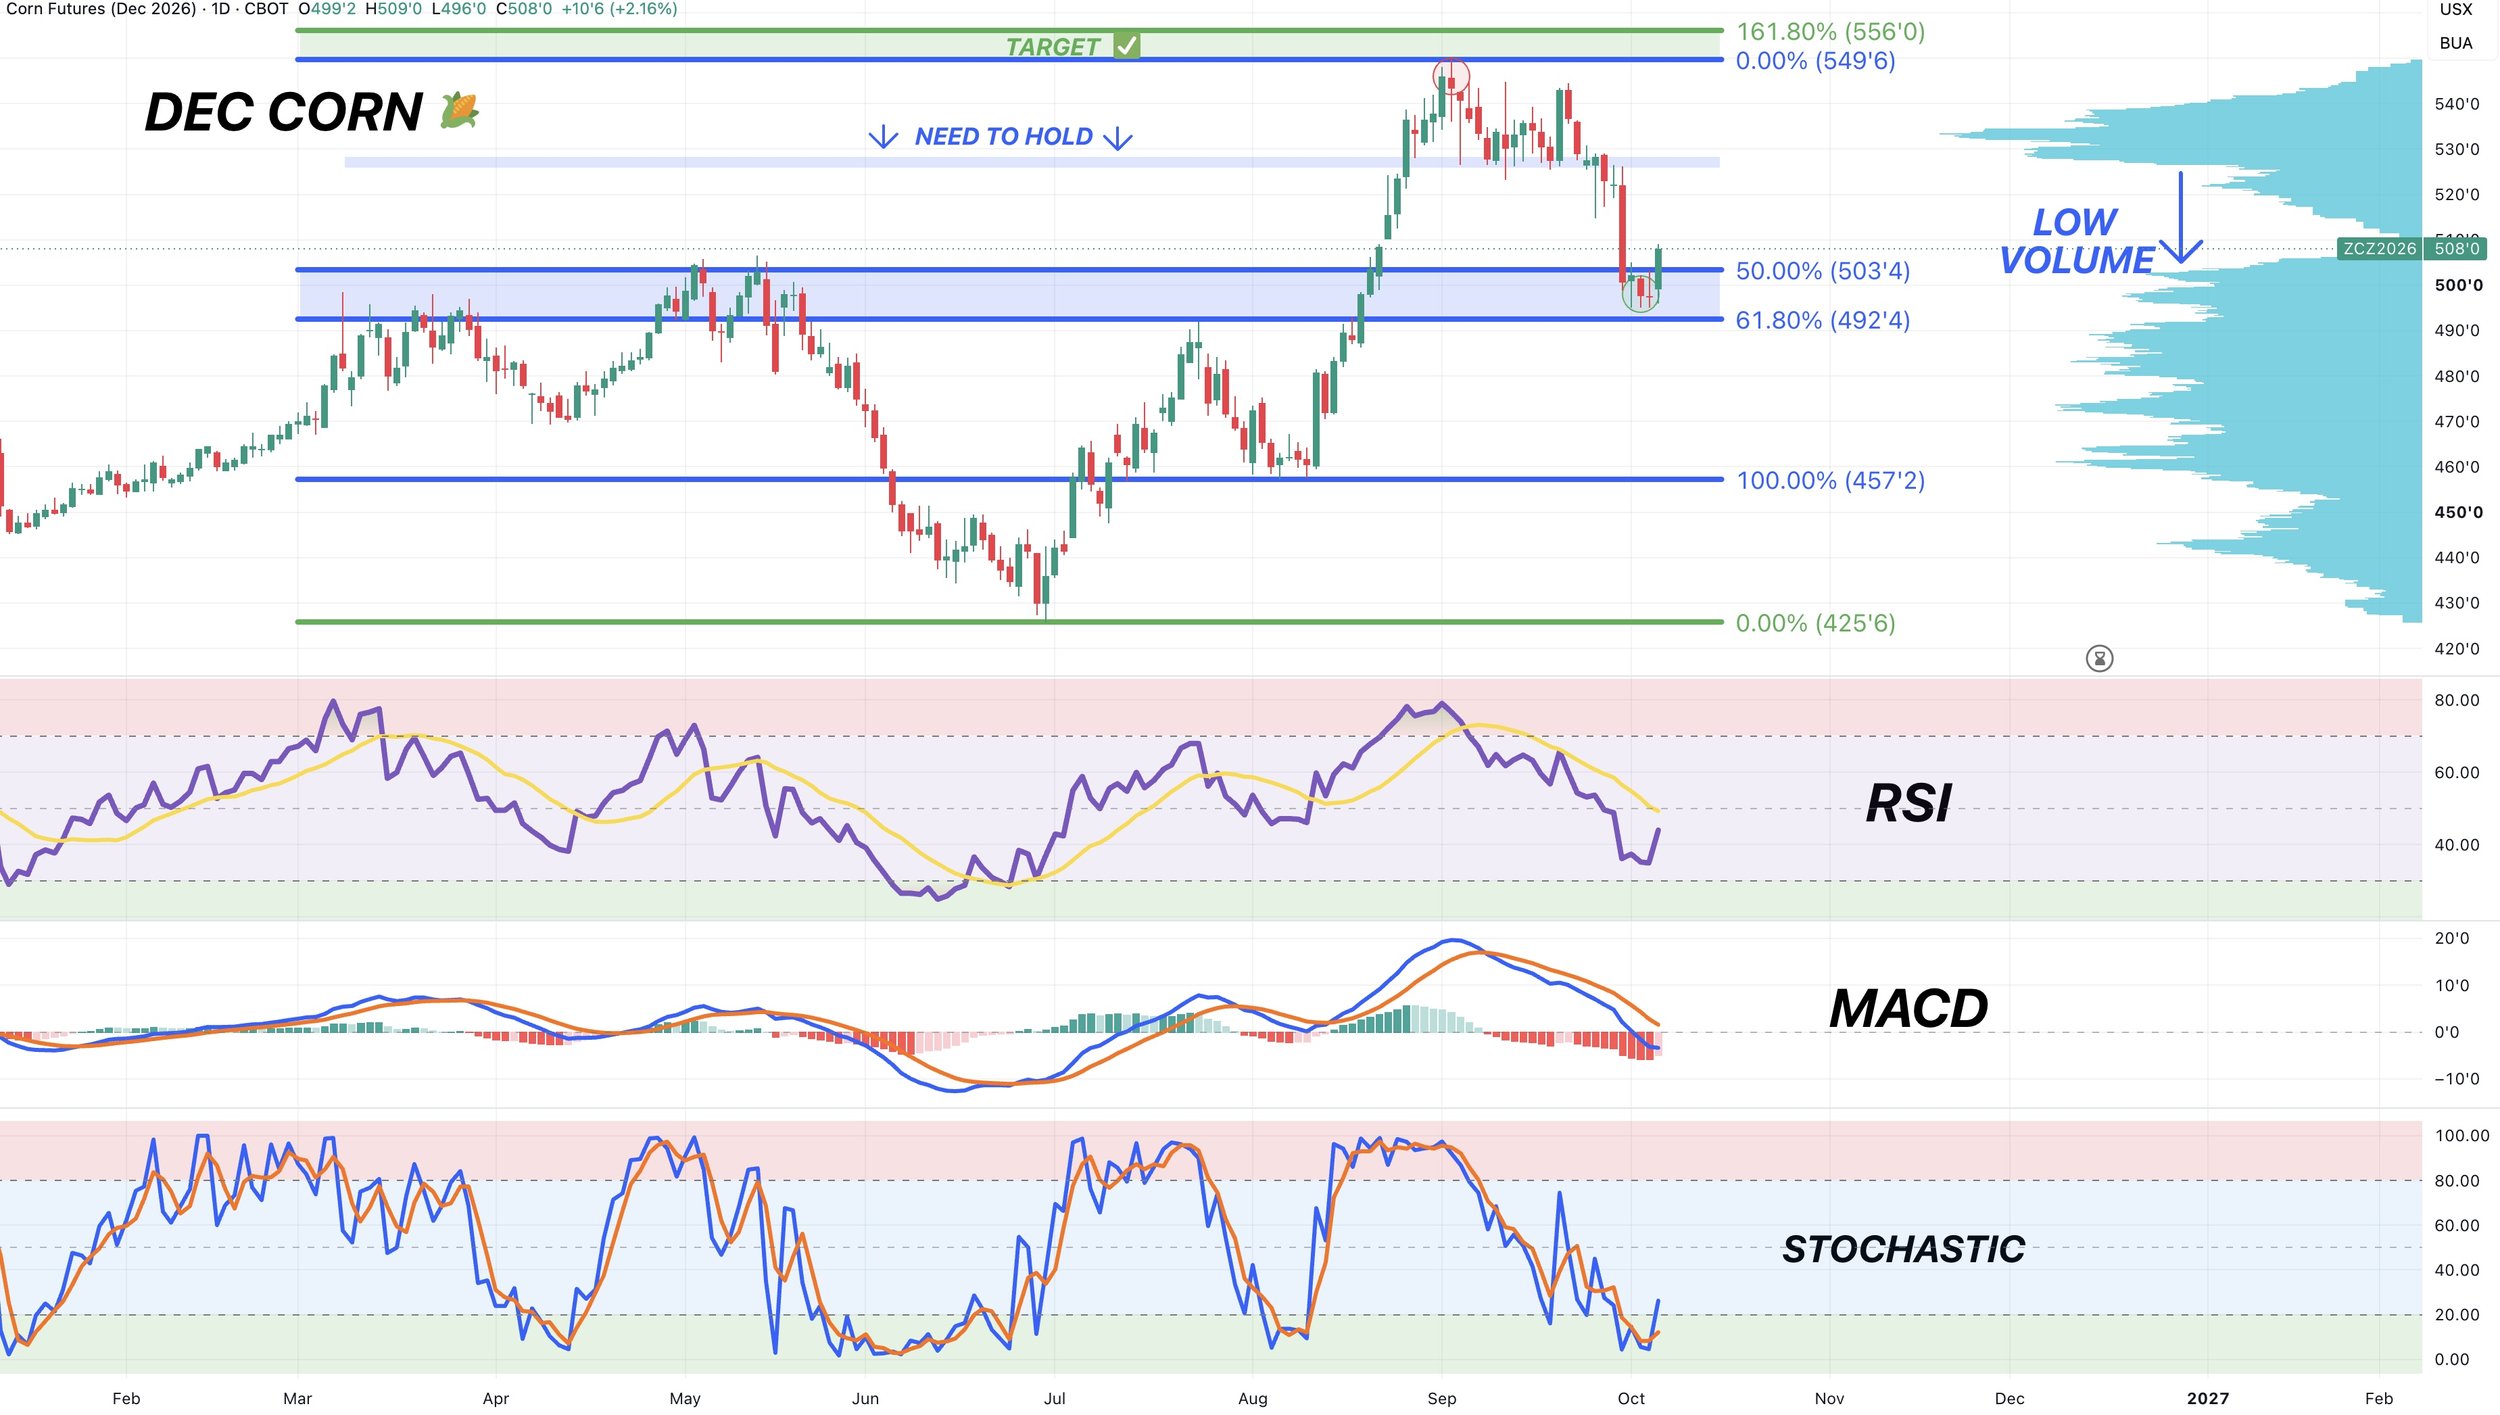
This correction finally led to corn being oversold for the first time in a long time.
The RSI was just the most oversold it had been since corn was trading at $4.25 at those June lows.
The stochastics have bottomed out.
We were cautious up near $5.50 as we were overbought. Now, this pullback was a healthy reset for this market.
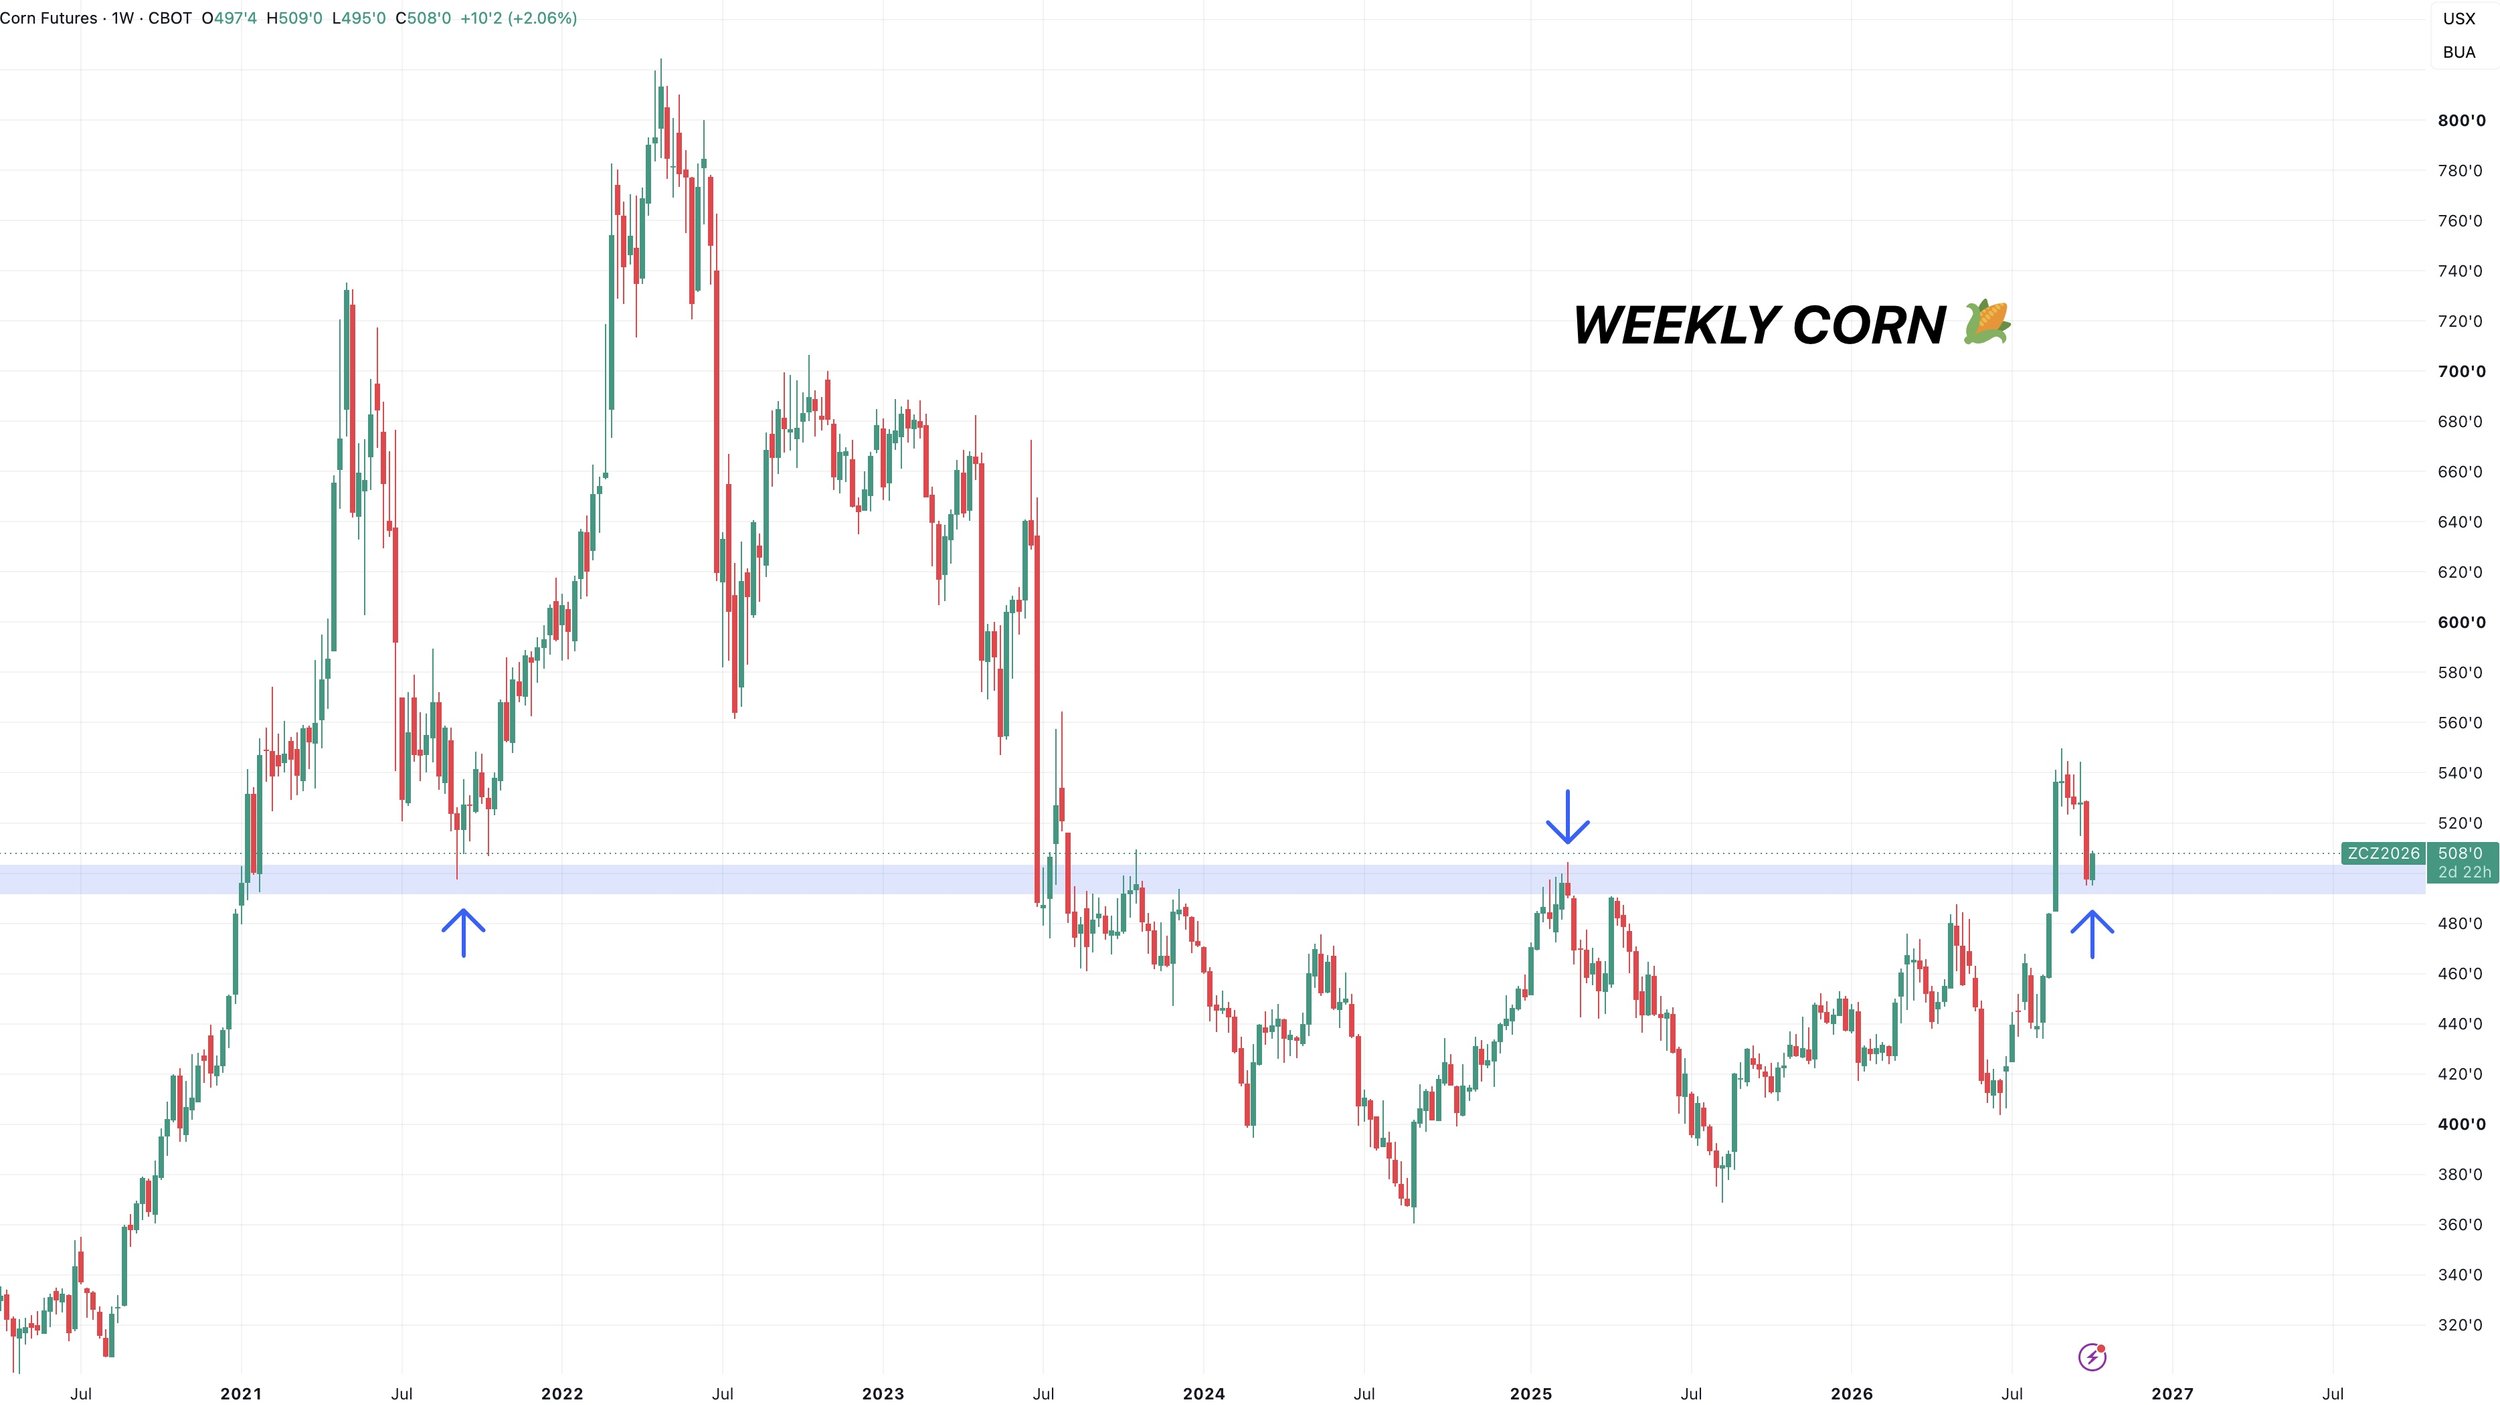
Weekly Chart: Simple S/R Flip
On the weekly chart, this looks like it could be a simple classic resistance and support flip.
We had that 3 year range we were trapped in. We broke out. Which isn’t bearish.
We've now came down and re-tested that point of breakout.
I've always said there would be nothing bearish about corn coming back down to re-test those old highs.
Everyone was so bullish at the recent highs, then we sold off and everyone got bearish again. You get bullish at support, not the other way around.
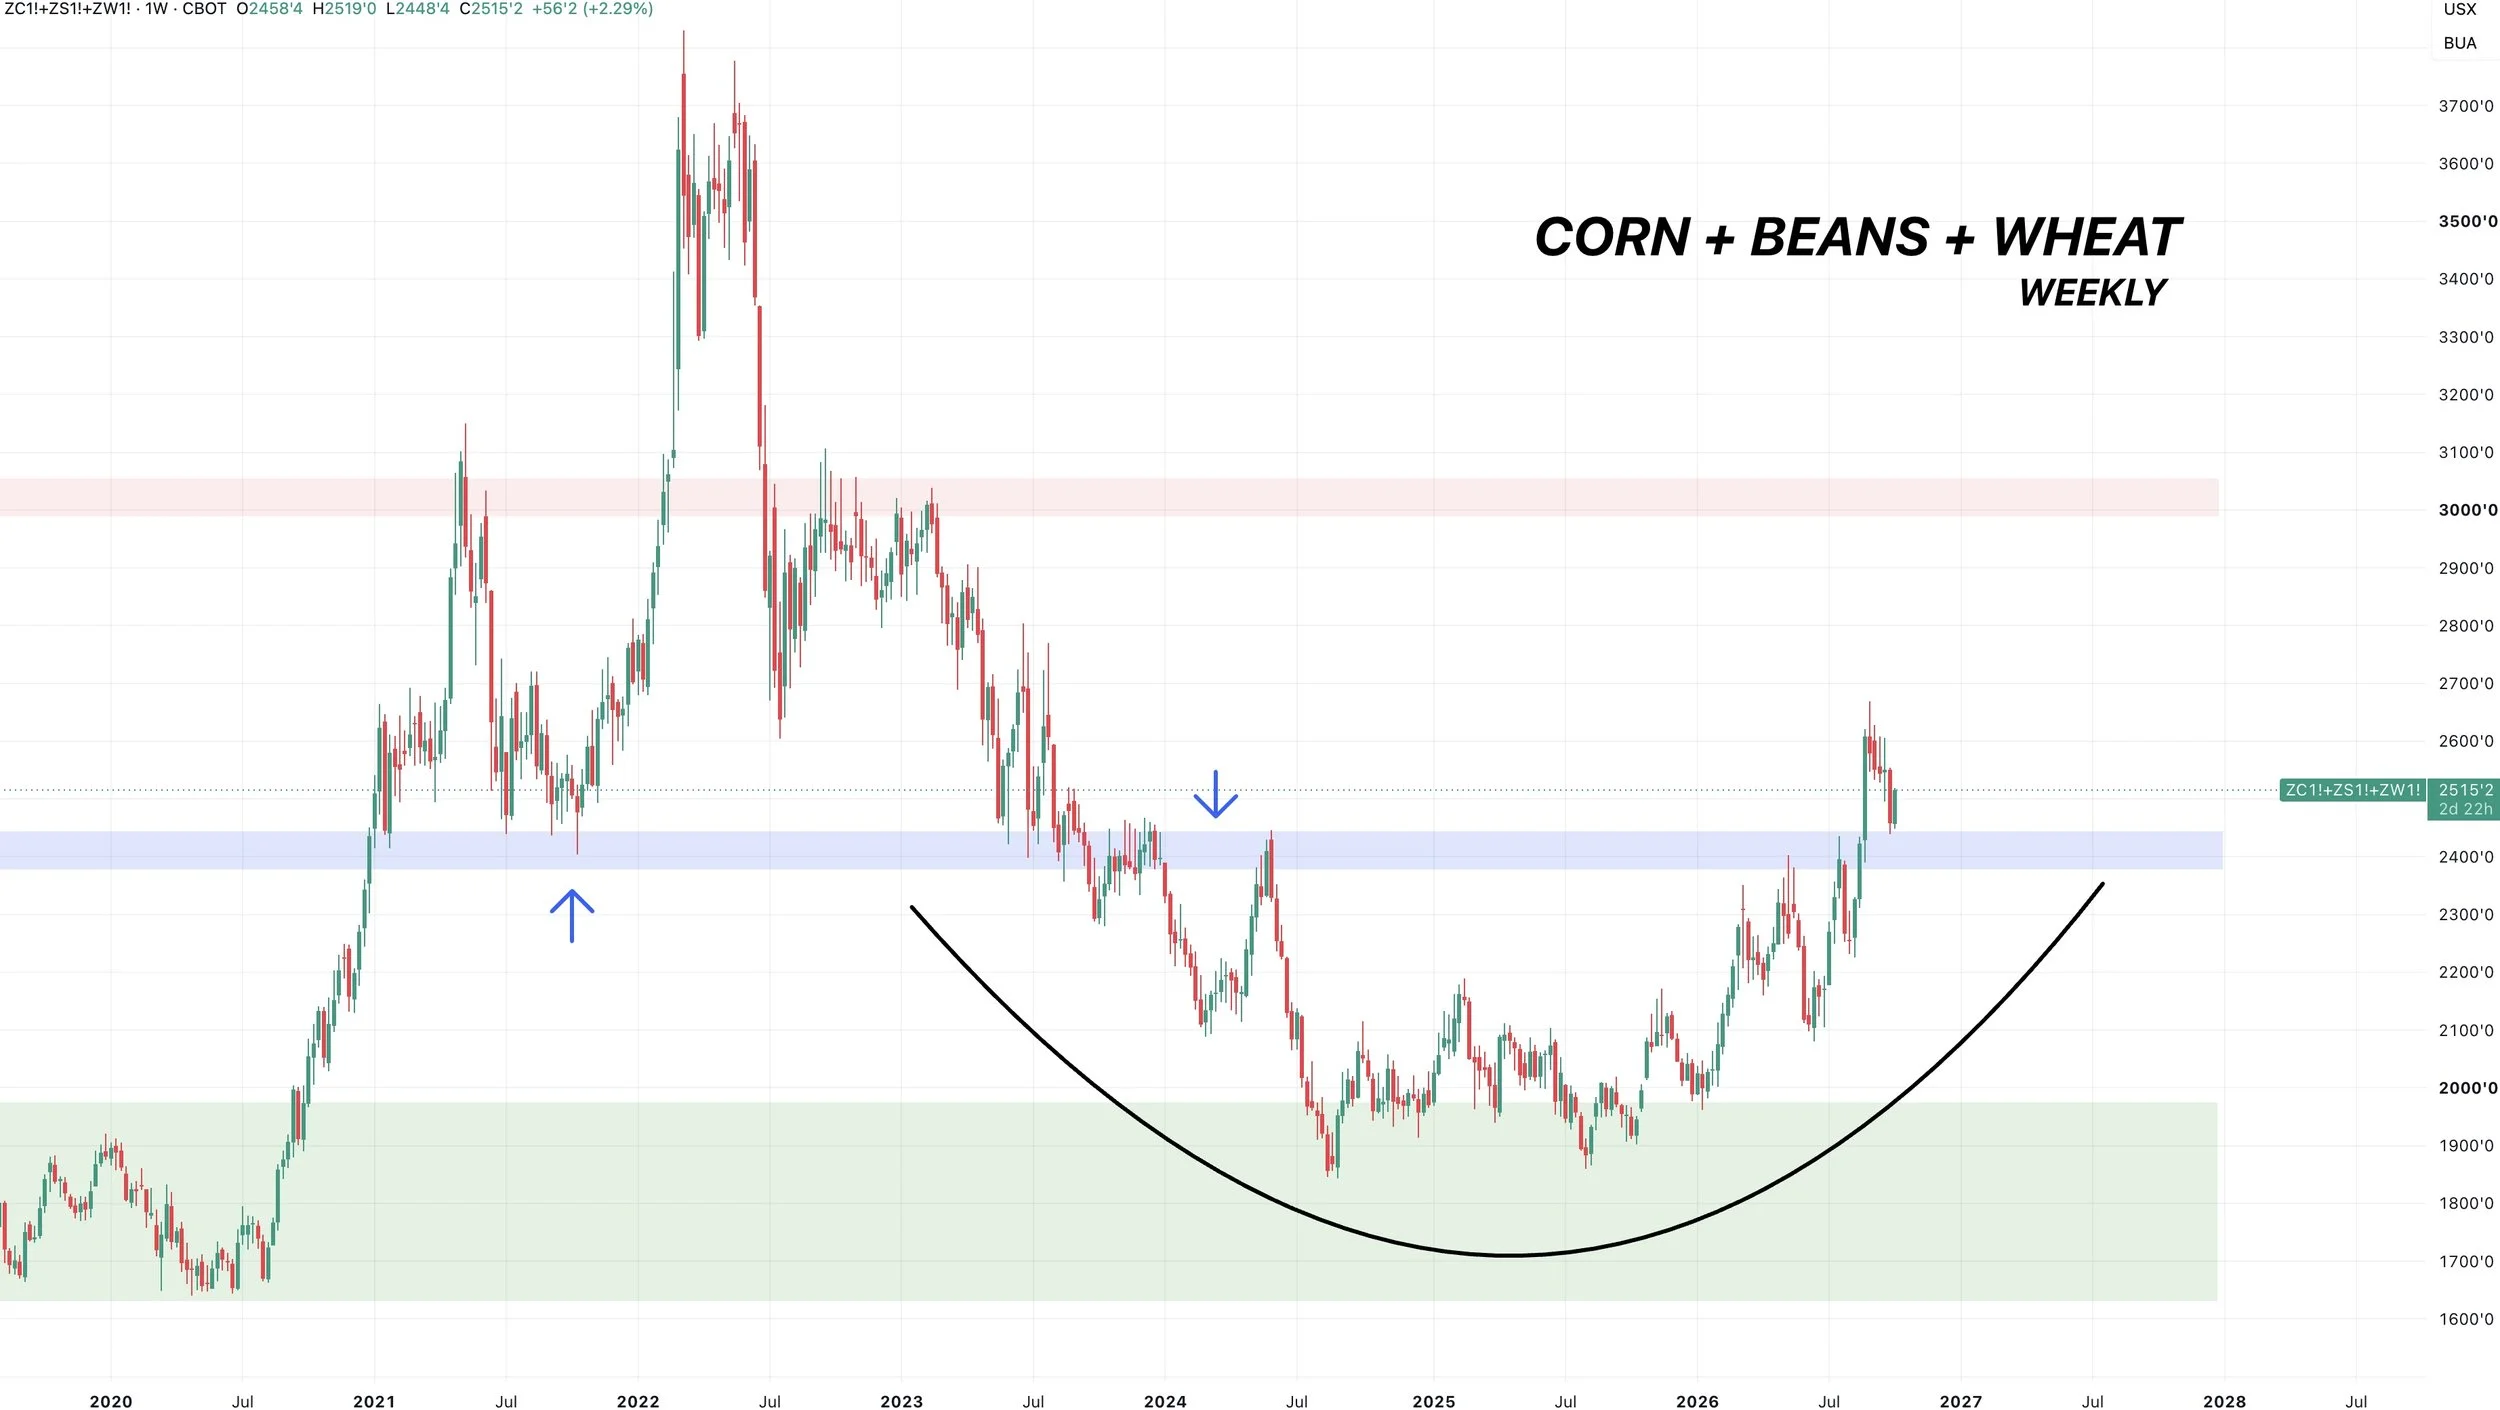
Corn + Beans + Wheat Weekly Chart: Same Look
Here is a chart that combines corn, soybean, and wheat prices.
Just like in corn, we broke through some massive resistance a month or so ago.
We've now came back down and re-tested that point of breakout.
Very clear support and resistance level for grains.
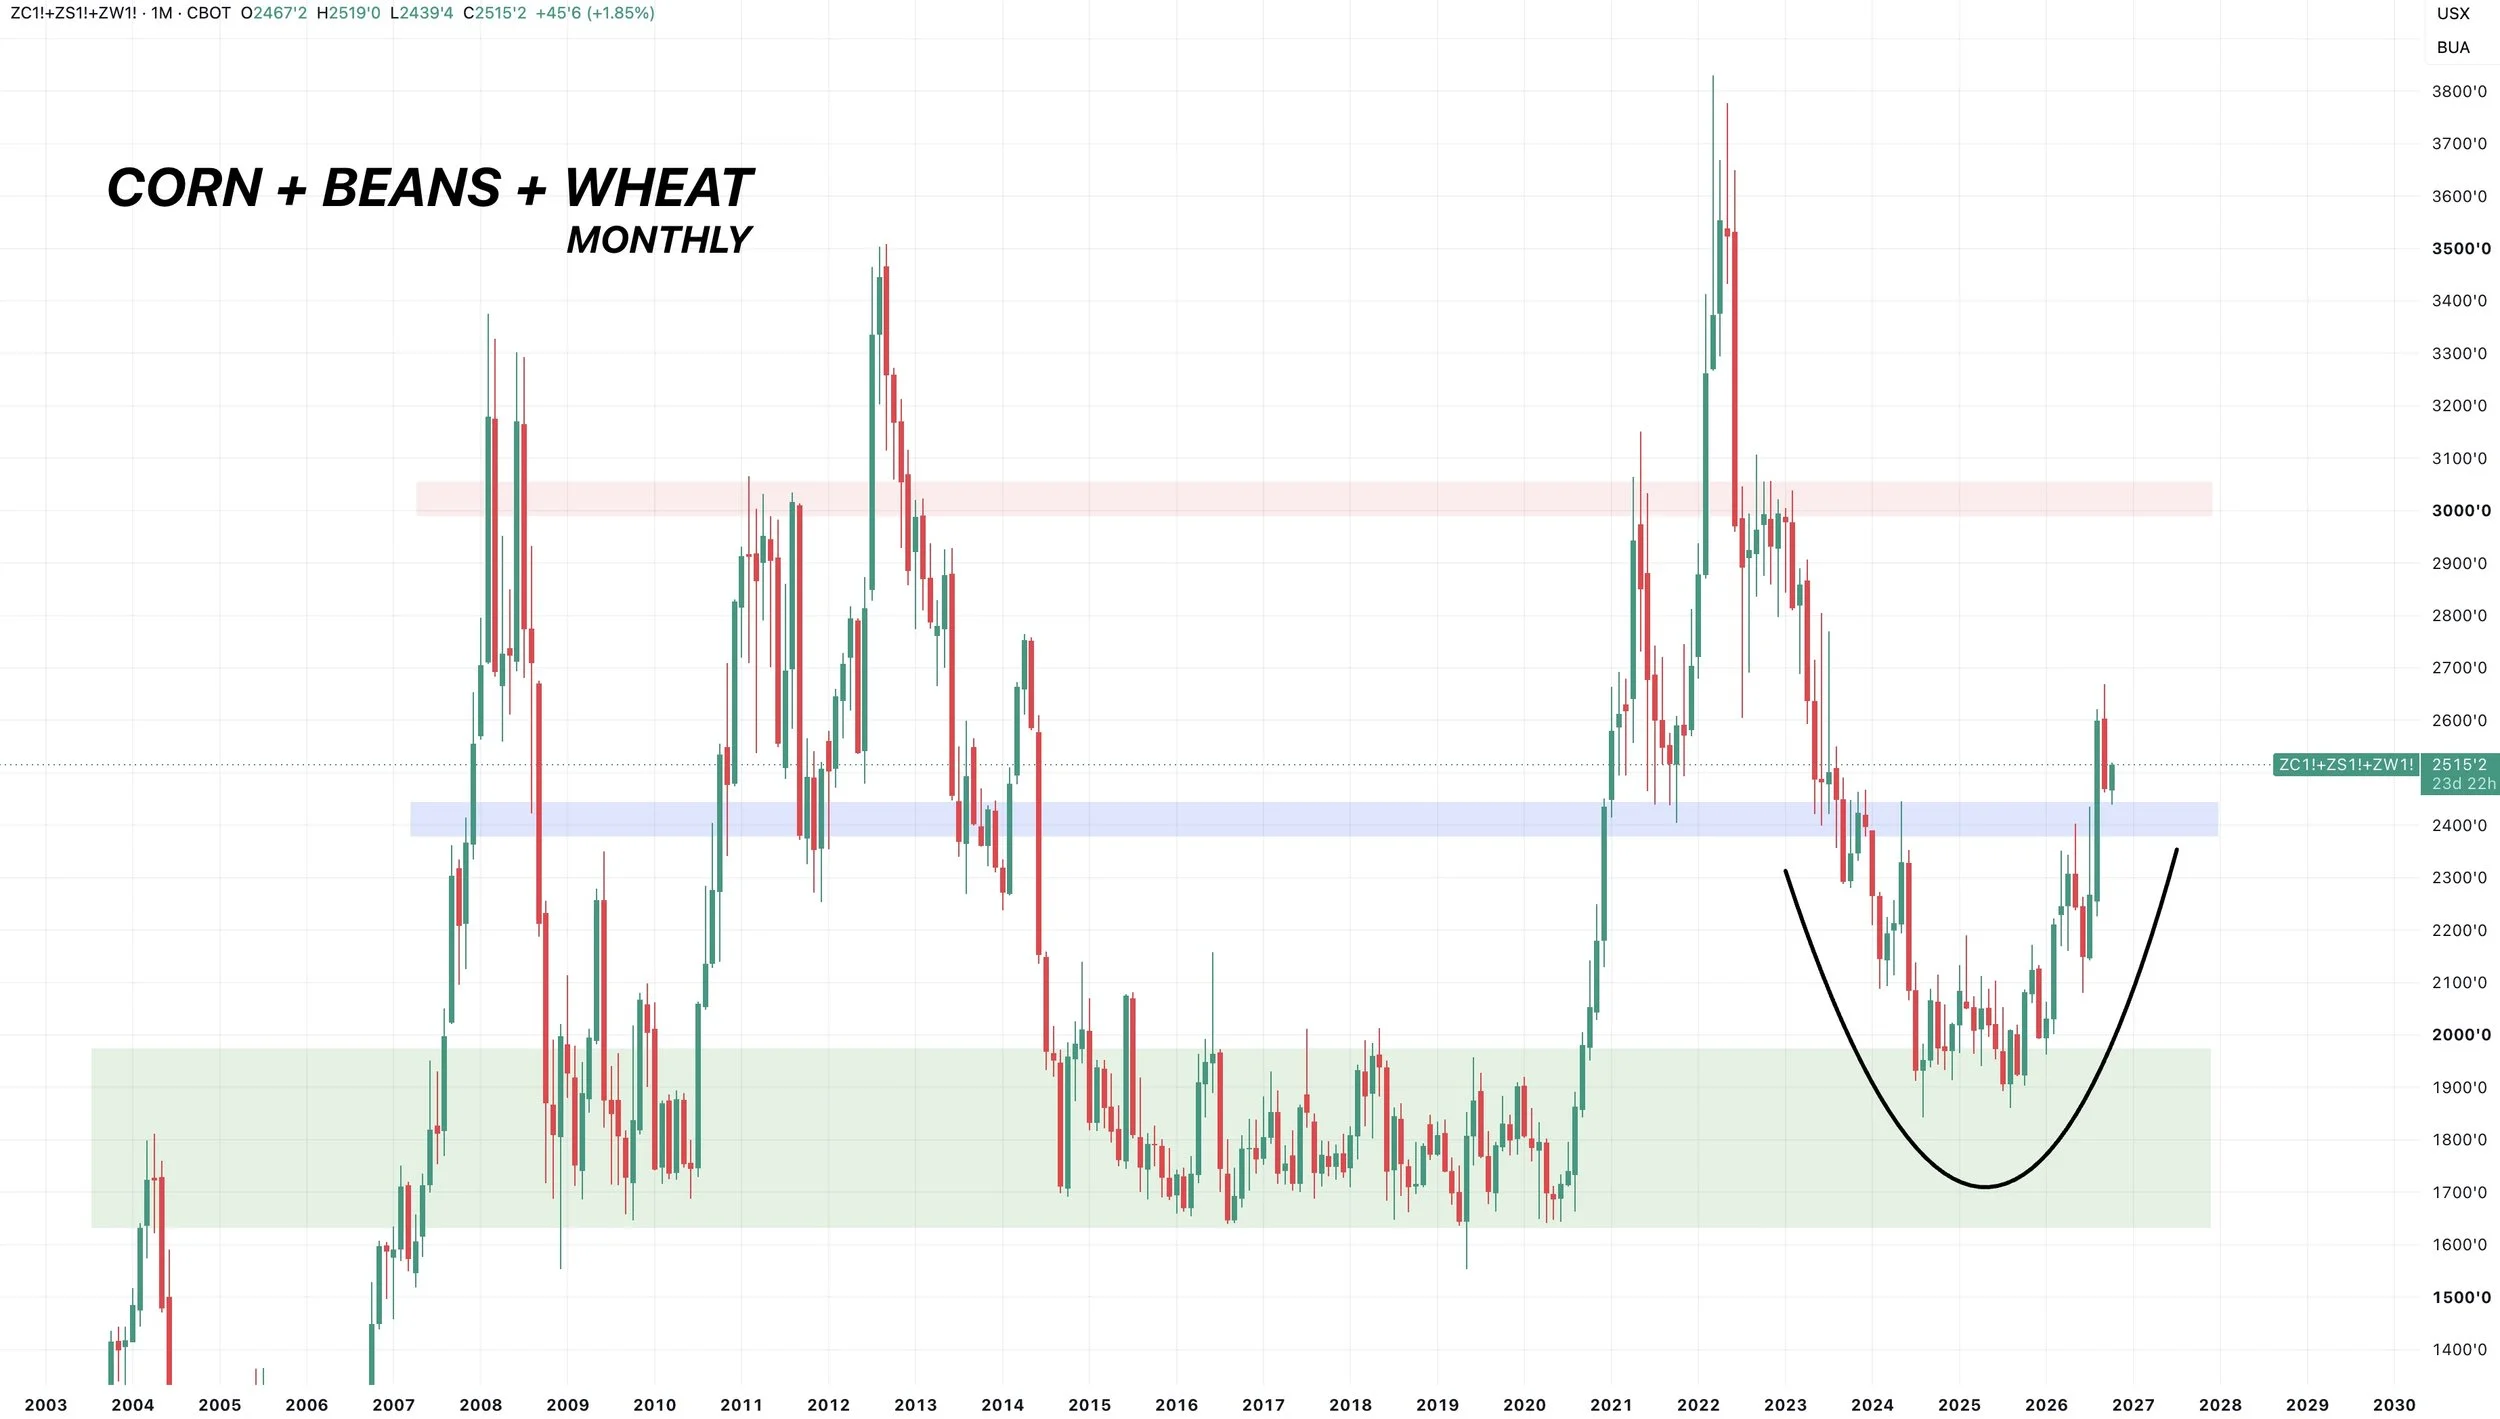
Corn + Beans + Wheat Monthly Chart: Immense Potential
Just look at the monthly chart.
This is not a bearish look.
There is a ton of upside potential for grains on this chart.
We broke a huge level. Every major run has run up to at least that red box. So I'd say there is plenty of room for grains to run.
To me, this looks like a bull market.
Soybeans
Fundamentals:
I do not have a ton to update on soybeans.
Here are the estimates for the report Friday.
The trade has soybean carryout being unchanged from last month.
They have soybean yield up fractionally from last month.

Outside of the report, we are entering Brazil's weather season which can spice things up.
As a Super El Niño has historically led to very dry conditions in northern South America with very wet conditions down south.
I don’t think this is going to be helping the world balance sheet get any bigger from here.
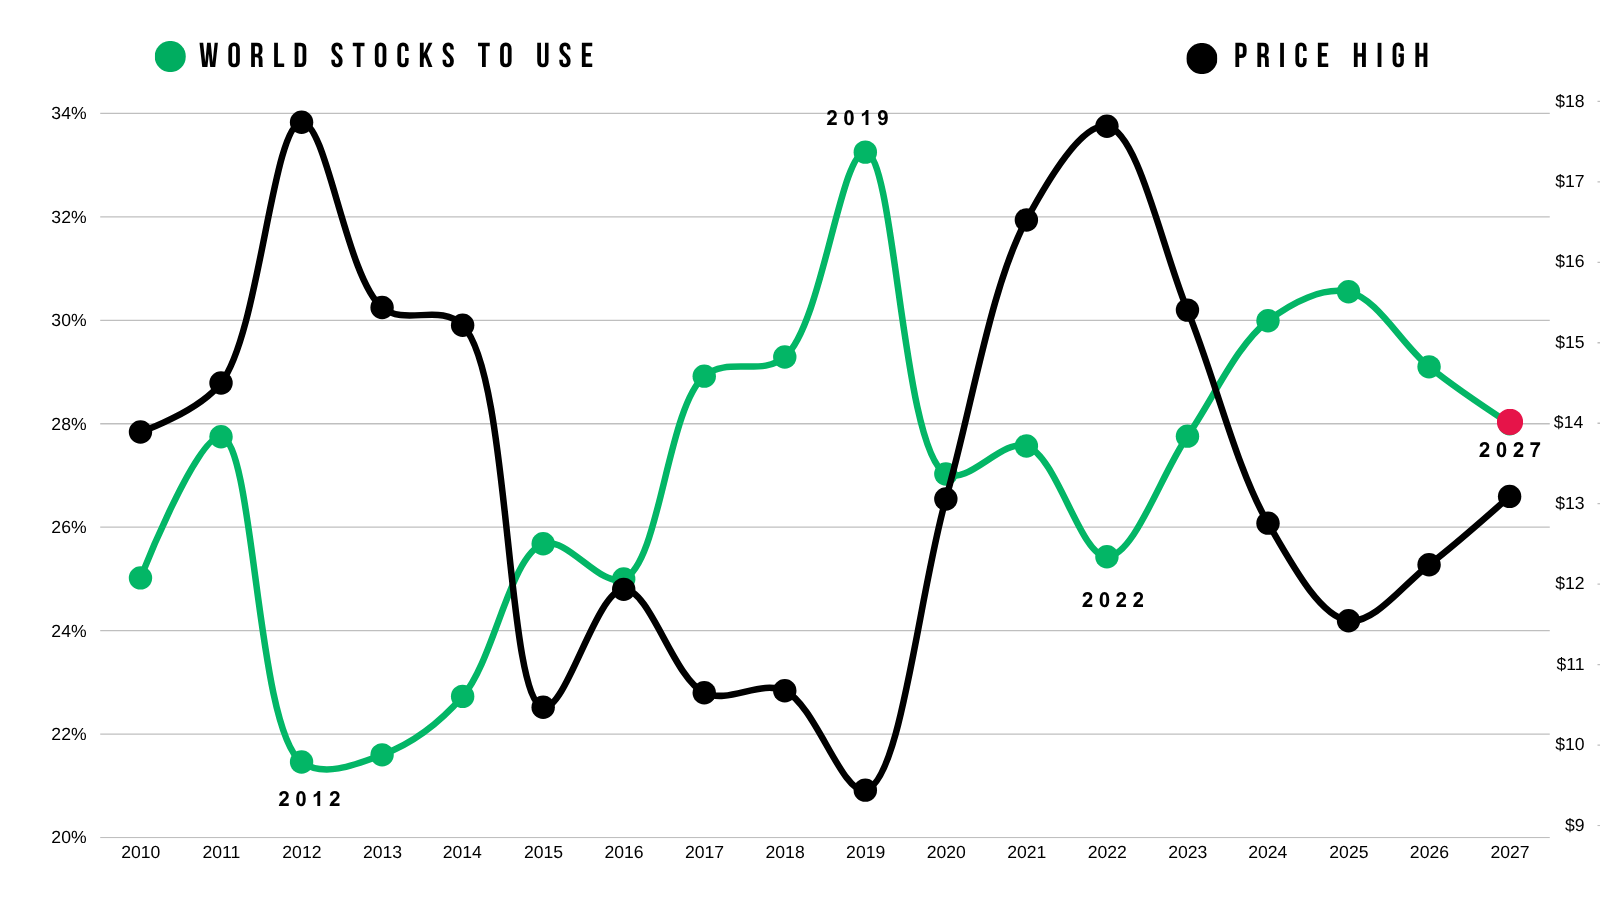
One of the most bullish things about soybeans is the world situation.
You are telling me that both Brazil and the US have record crops, yet the world situation has been shrinking for 3 years in a row?
The tightest since 2023.
So Brazil weather is going to be a hot topic the next few months.
US Dollar vs Brazil Real:
I thought I'd throw this in here today.
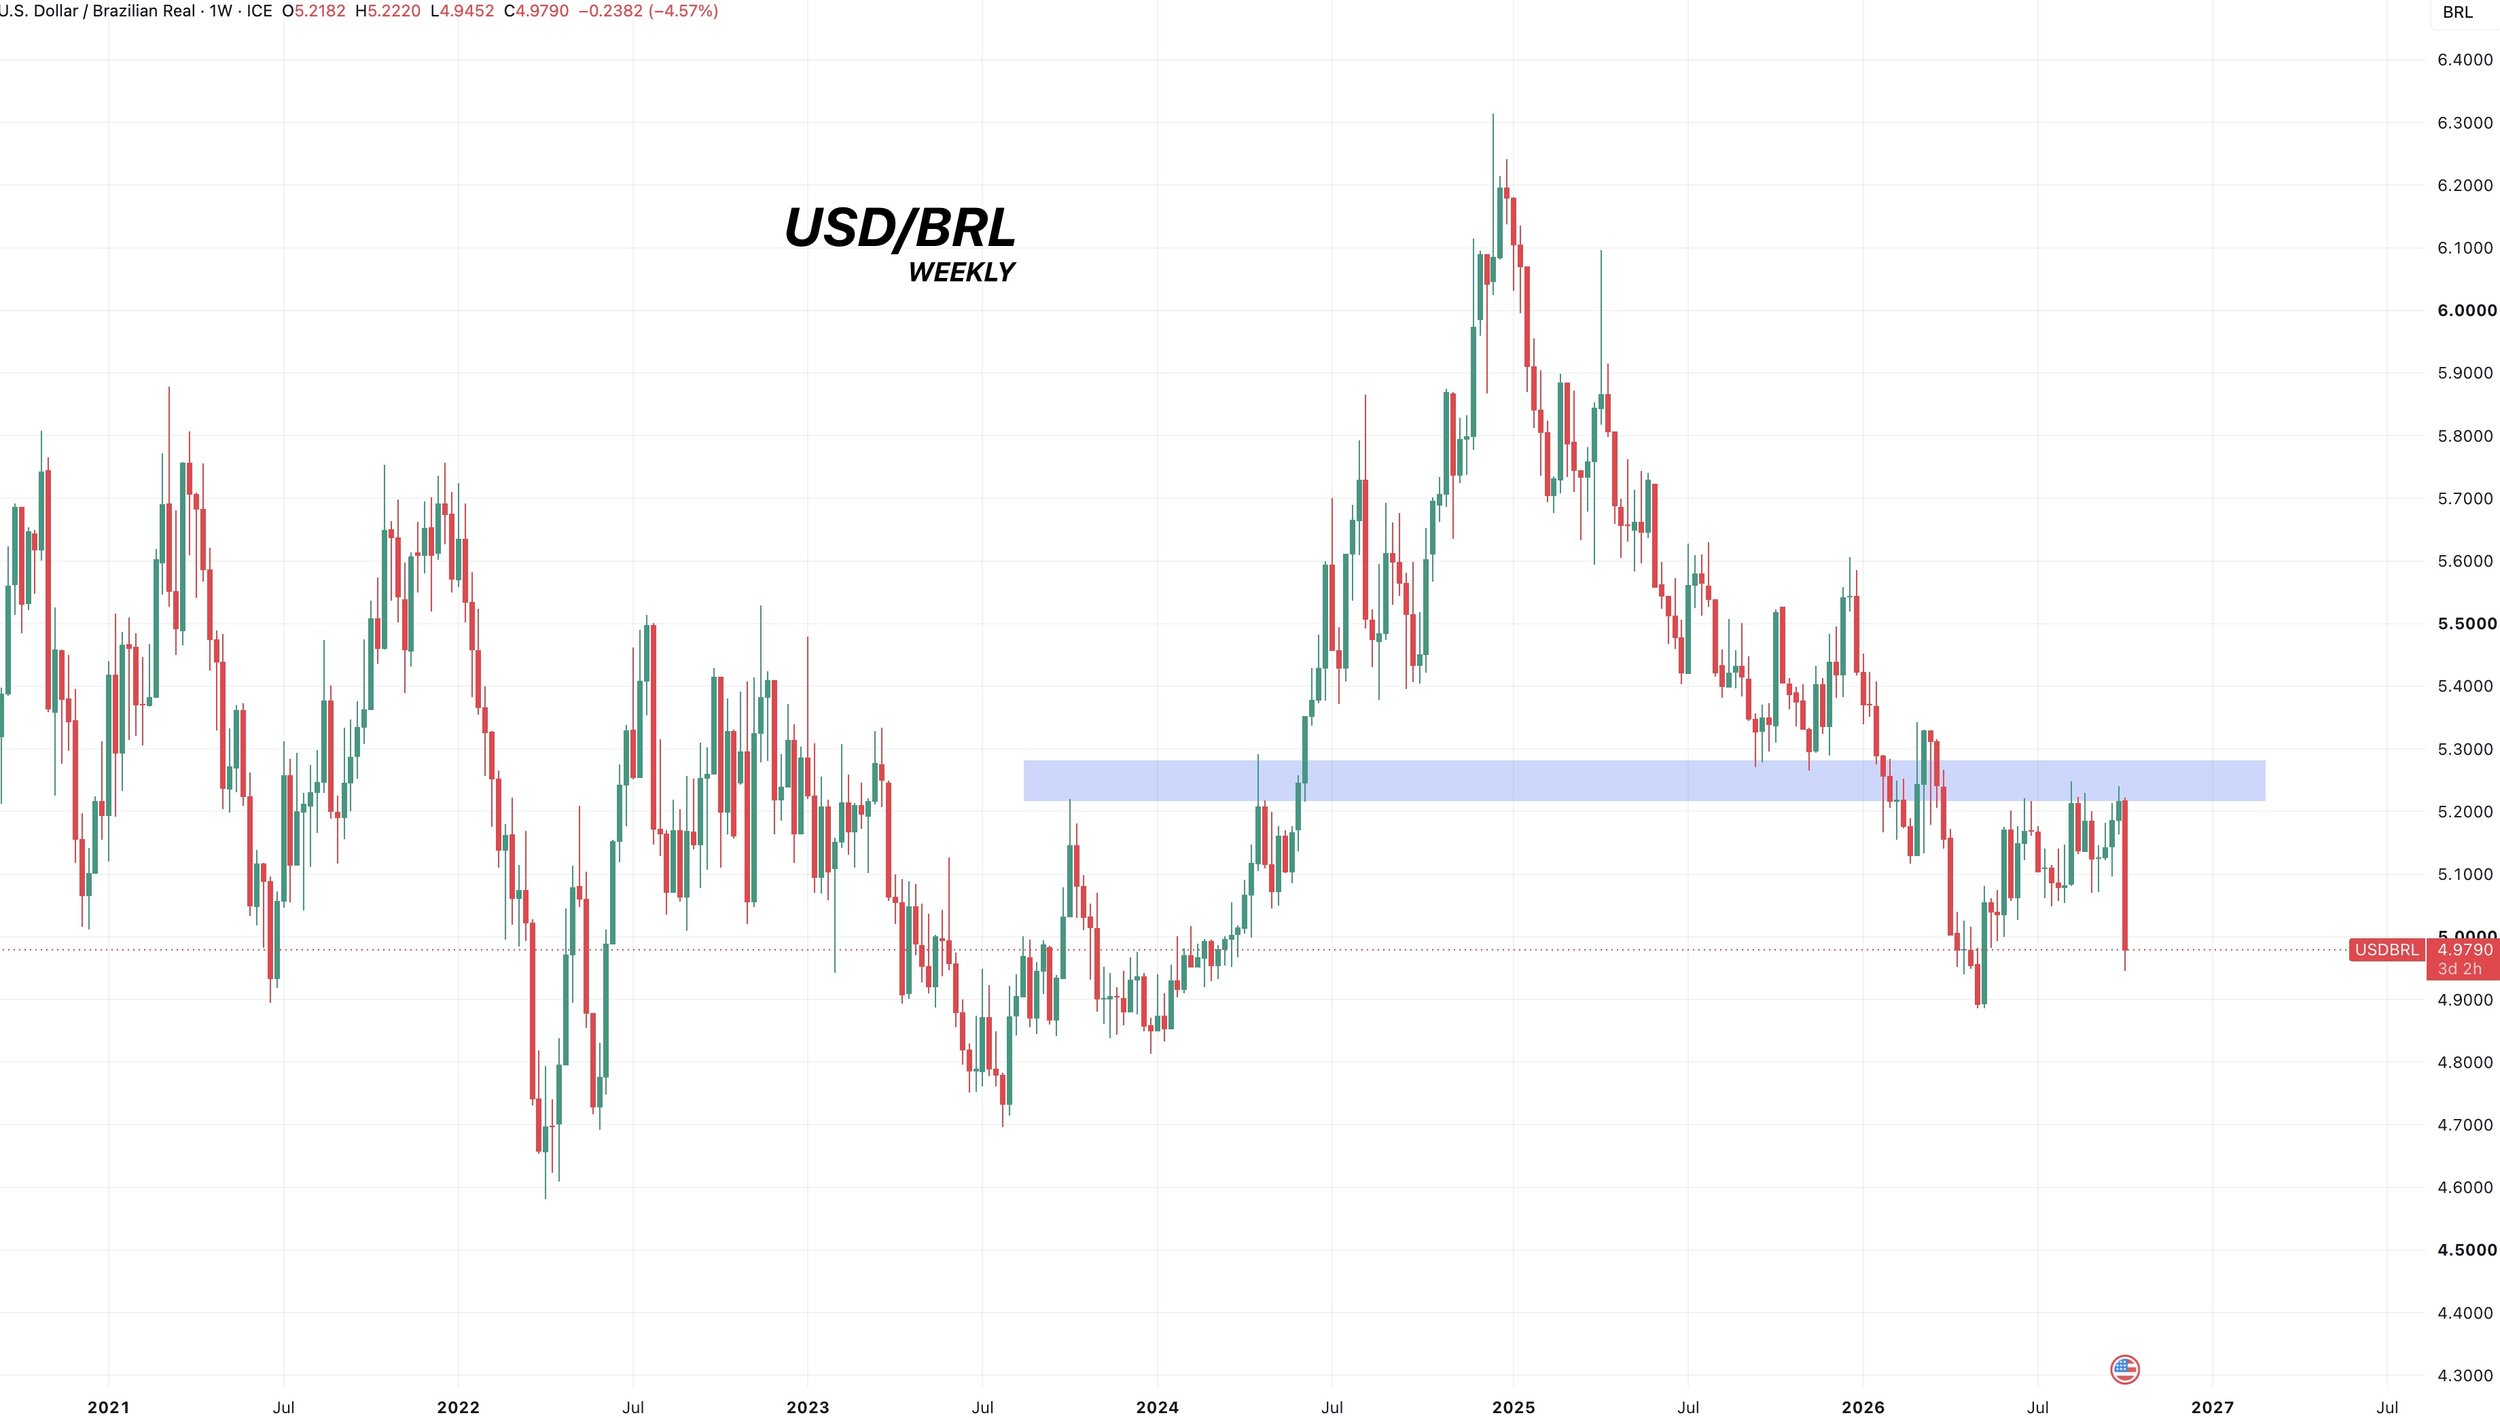
This is the US Dollar / Brazilian Real. This has been a bullish item for soybeans the last day or two.
Yesterday the Real saw one of it's largest daily gains against the dollar in history.
The last time we saw this big of a move was back in 2022.
When the real gains on the dollar like it's doing right now, it's not a bearish item for soybean futures.
As when this chart falls, the real gets stronger vs the dollar. Which means the Brazil farmer receives less reais for their beans at the same dollar price. Which can incentive less farmer selling in Brazil. So it helps make US beans more attractive.
Right now, this chart is taking a pretty nasty dive.
Seasonals Flipping Friendly?
The last several weeks I had been talking about the bearish seasonality for soybeans for the end of September and early October. As it's one of the most bearish time frames of the year.
Now, soybeans are entering into one of their most bullish time frames of the year.
As this is about the time of year where soybeans put in that seasonal low.
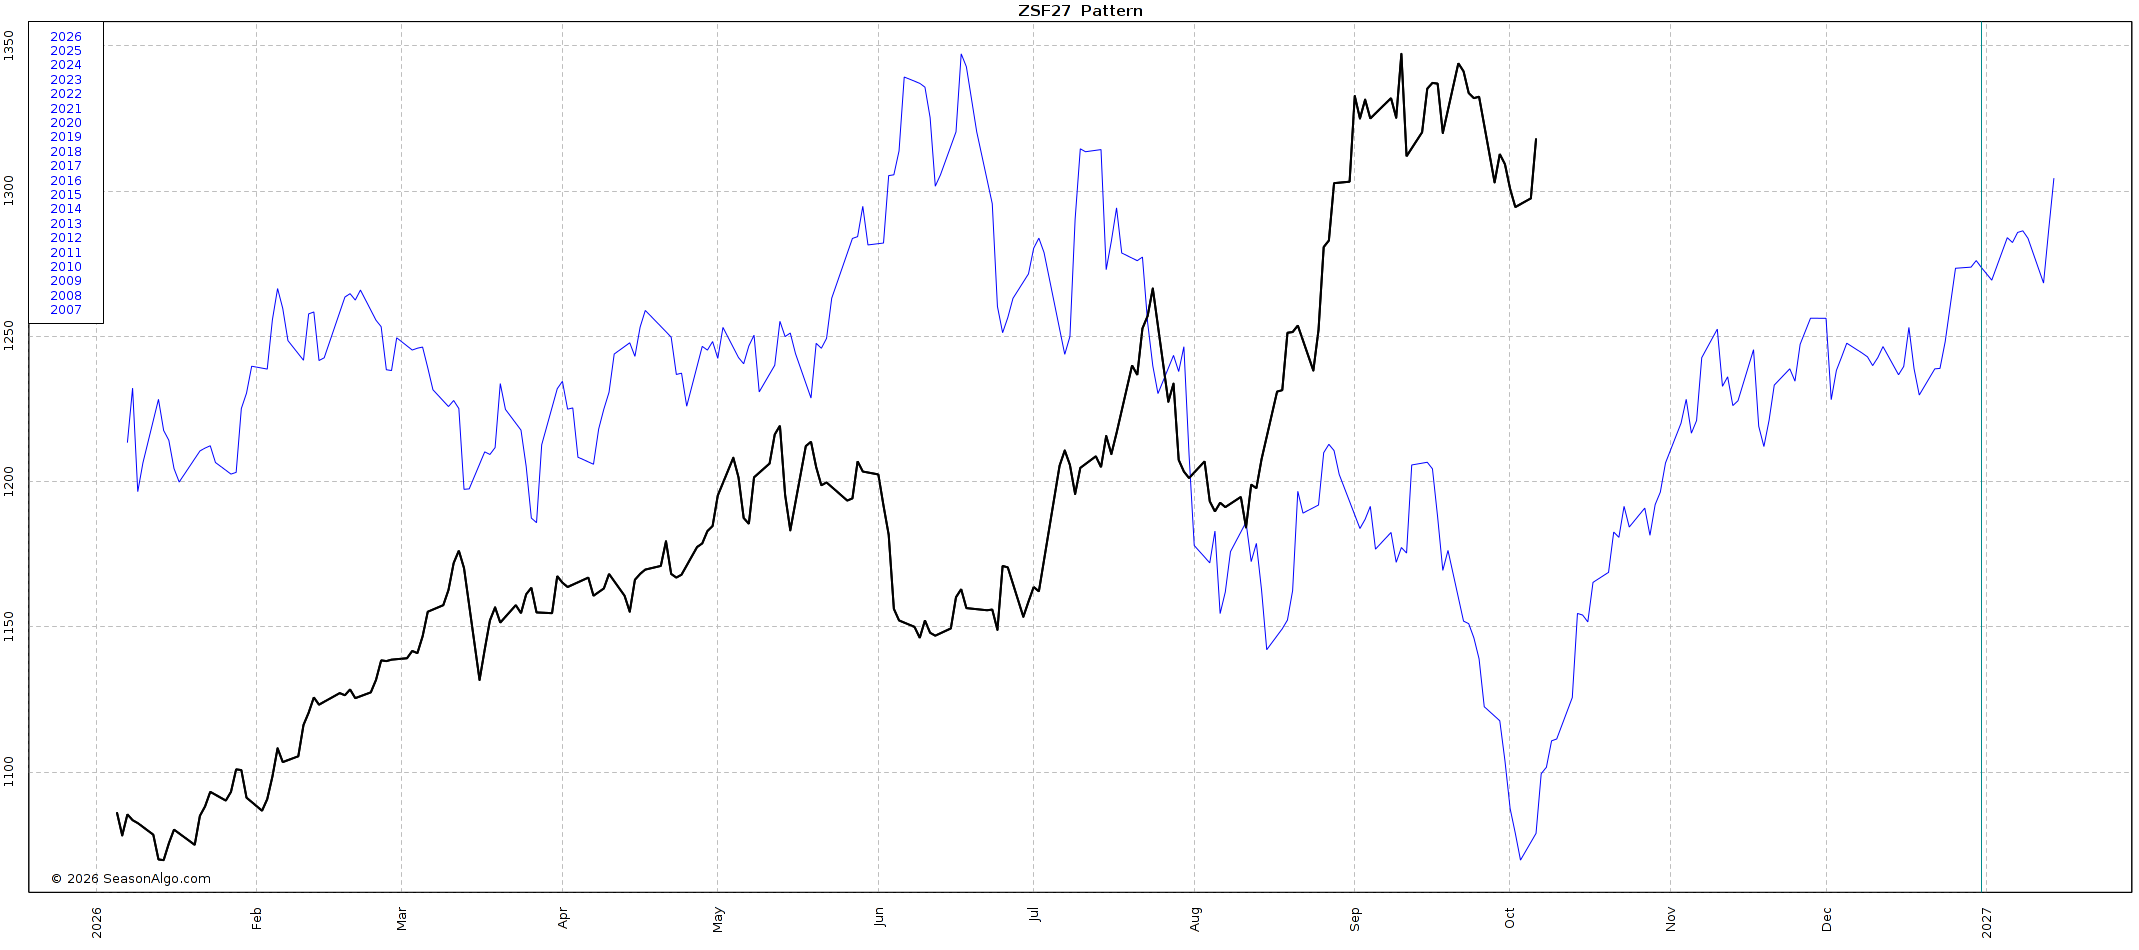
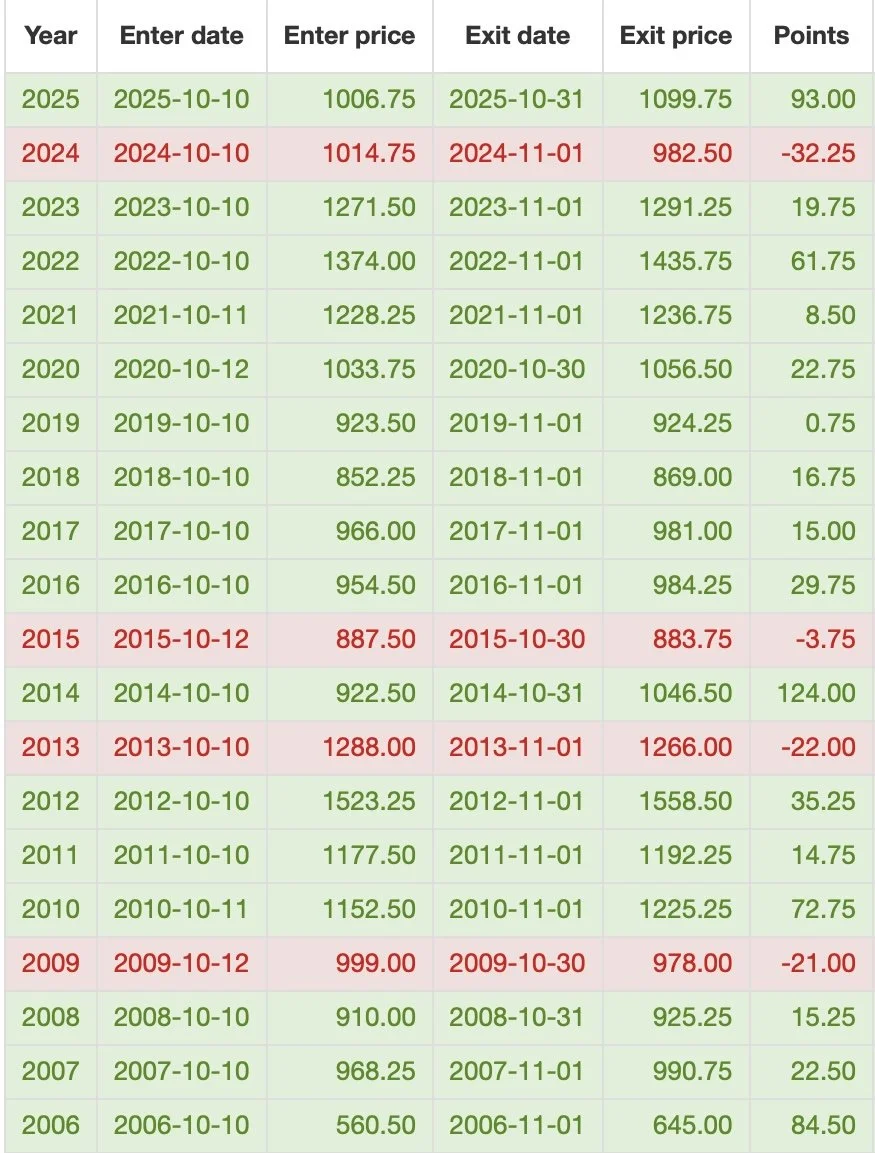
From October 10th to November 1st soybeans have traded higher the last 9 of 10 years.
Higher the last 16 of 20 years (80% of the time).
Soybean Charts
Nov Beans Chart:
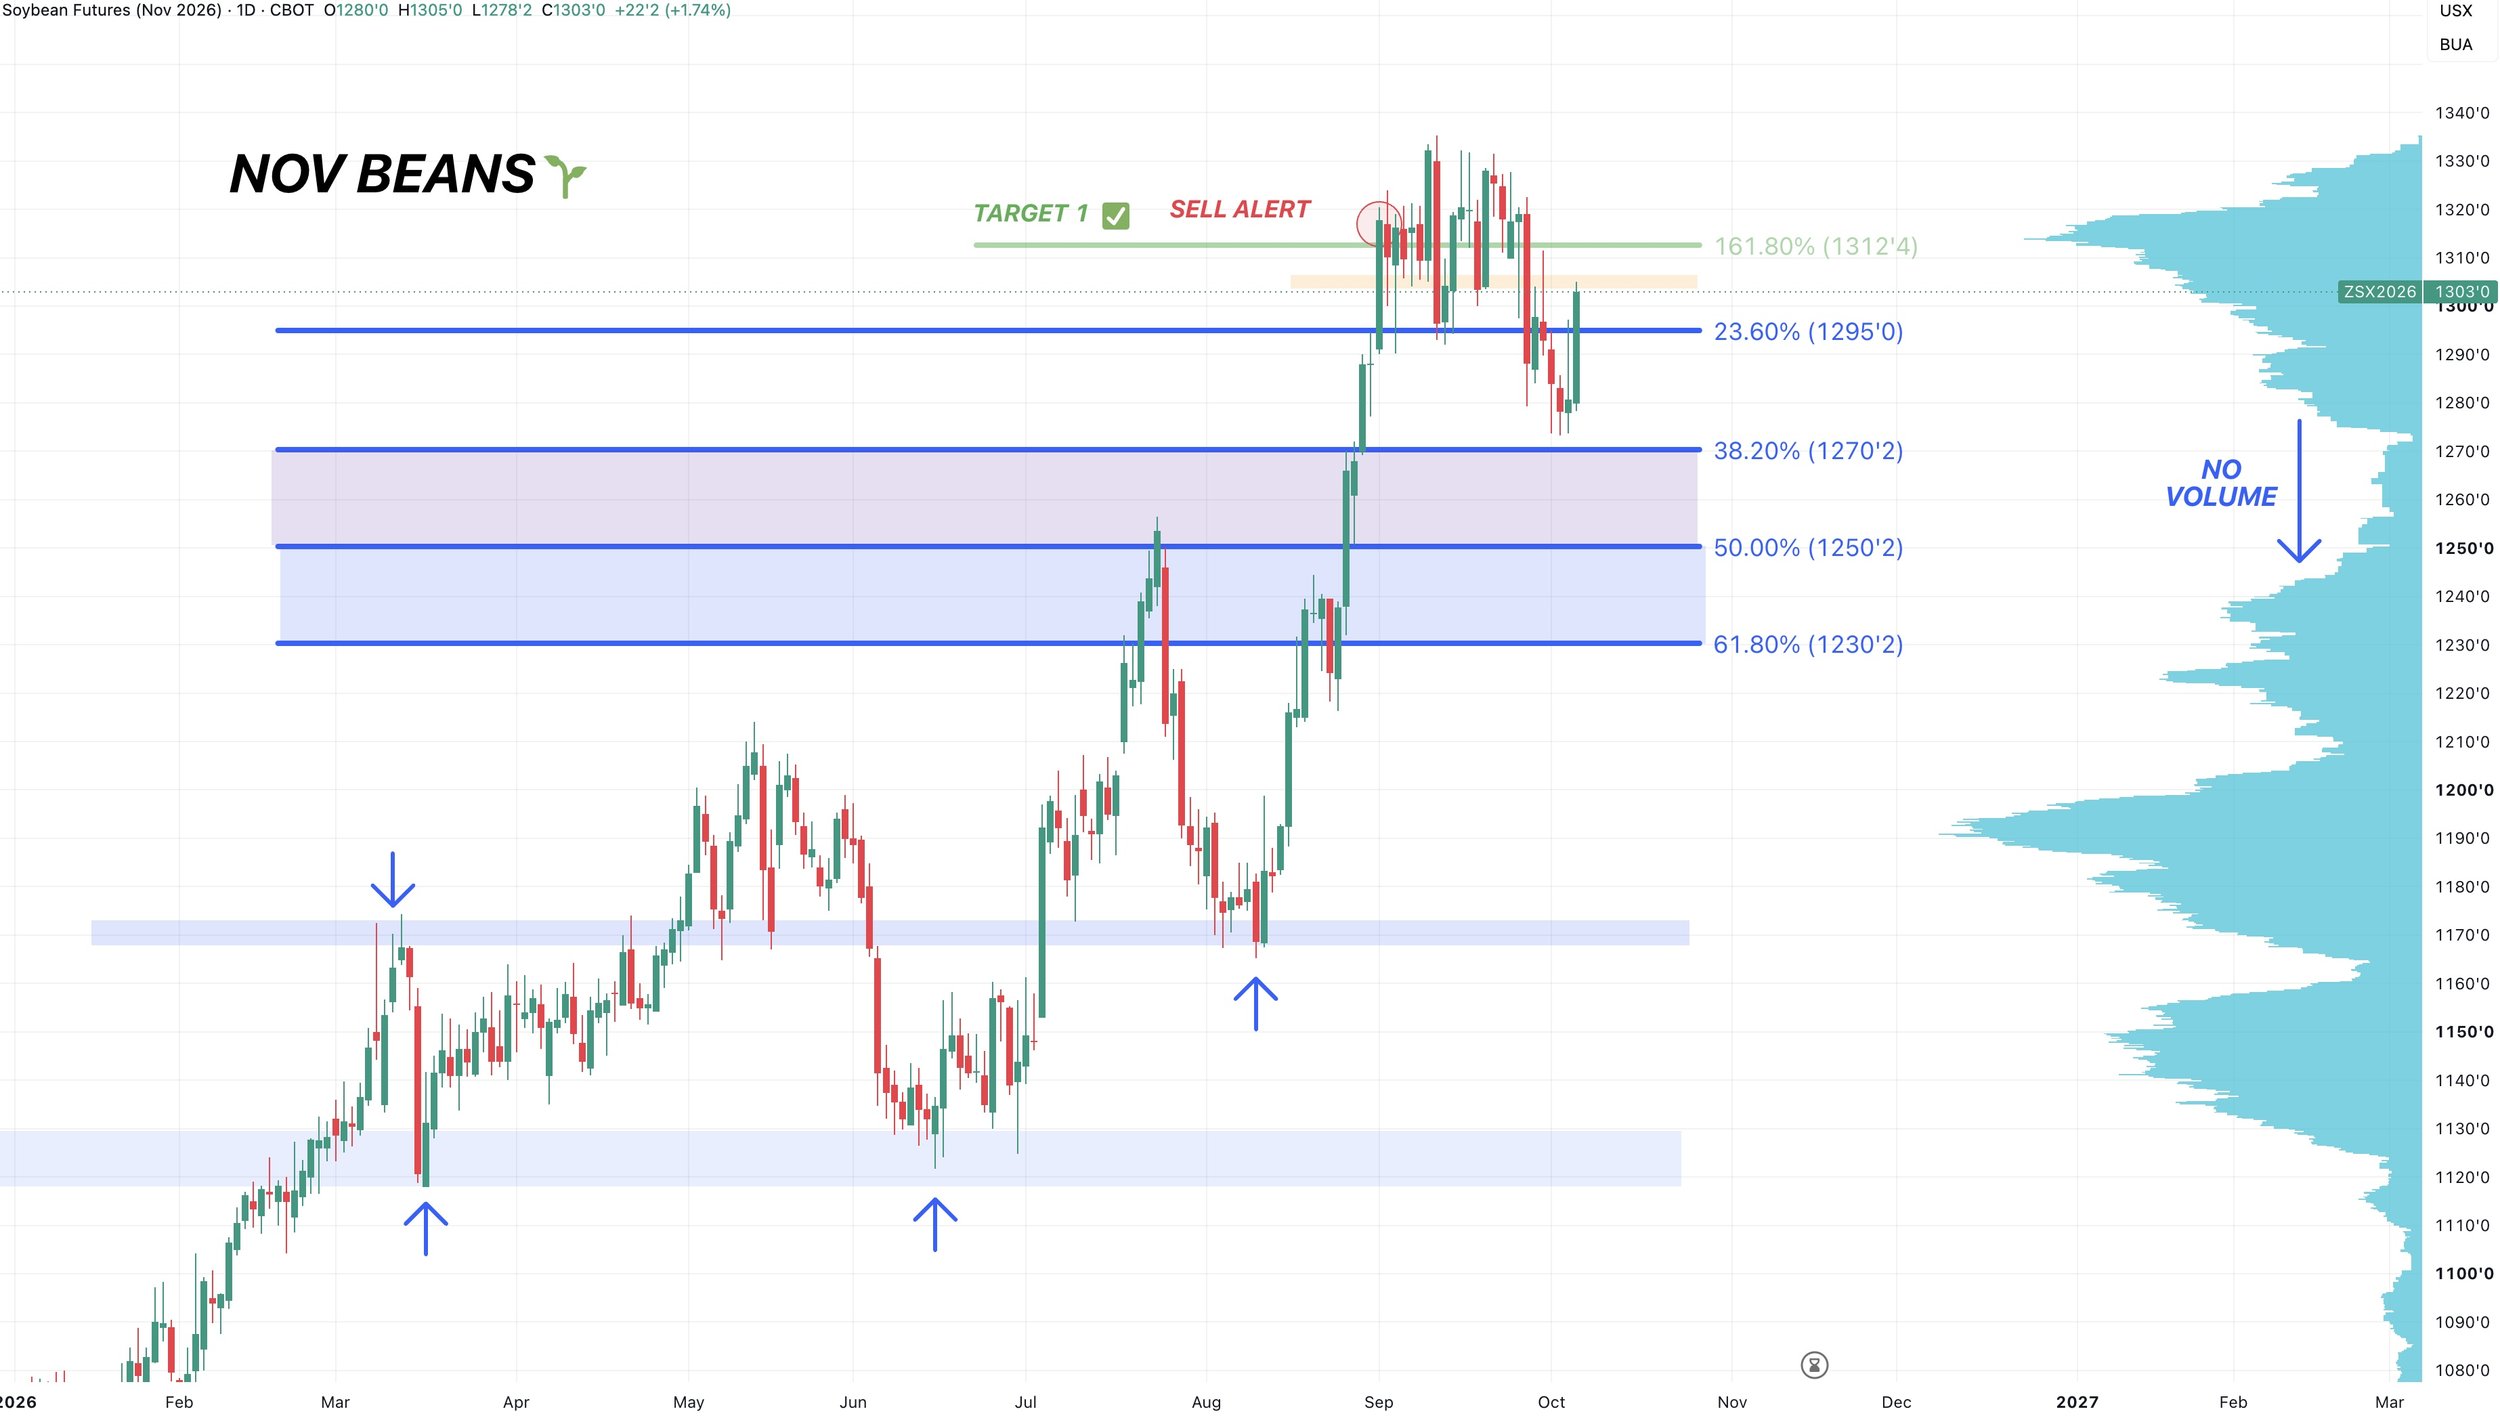
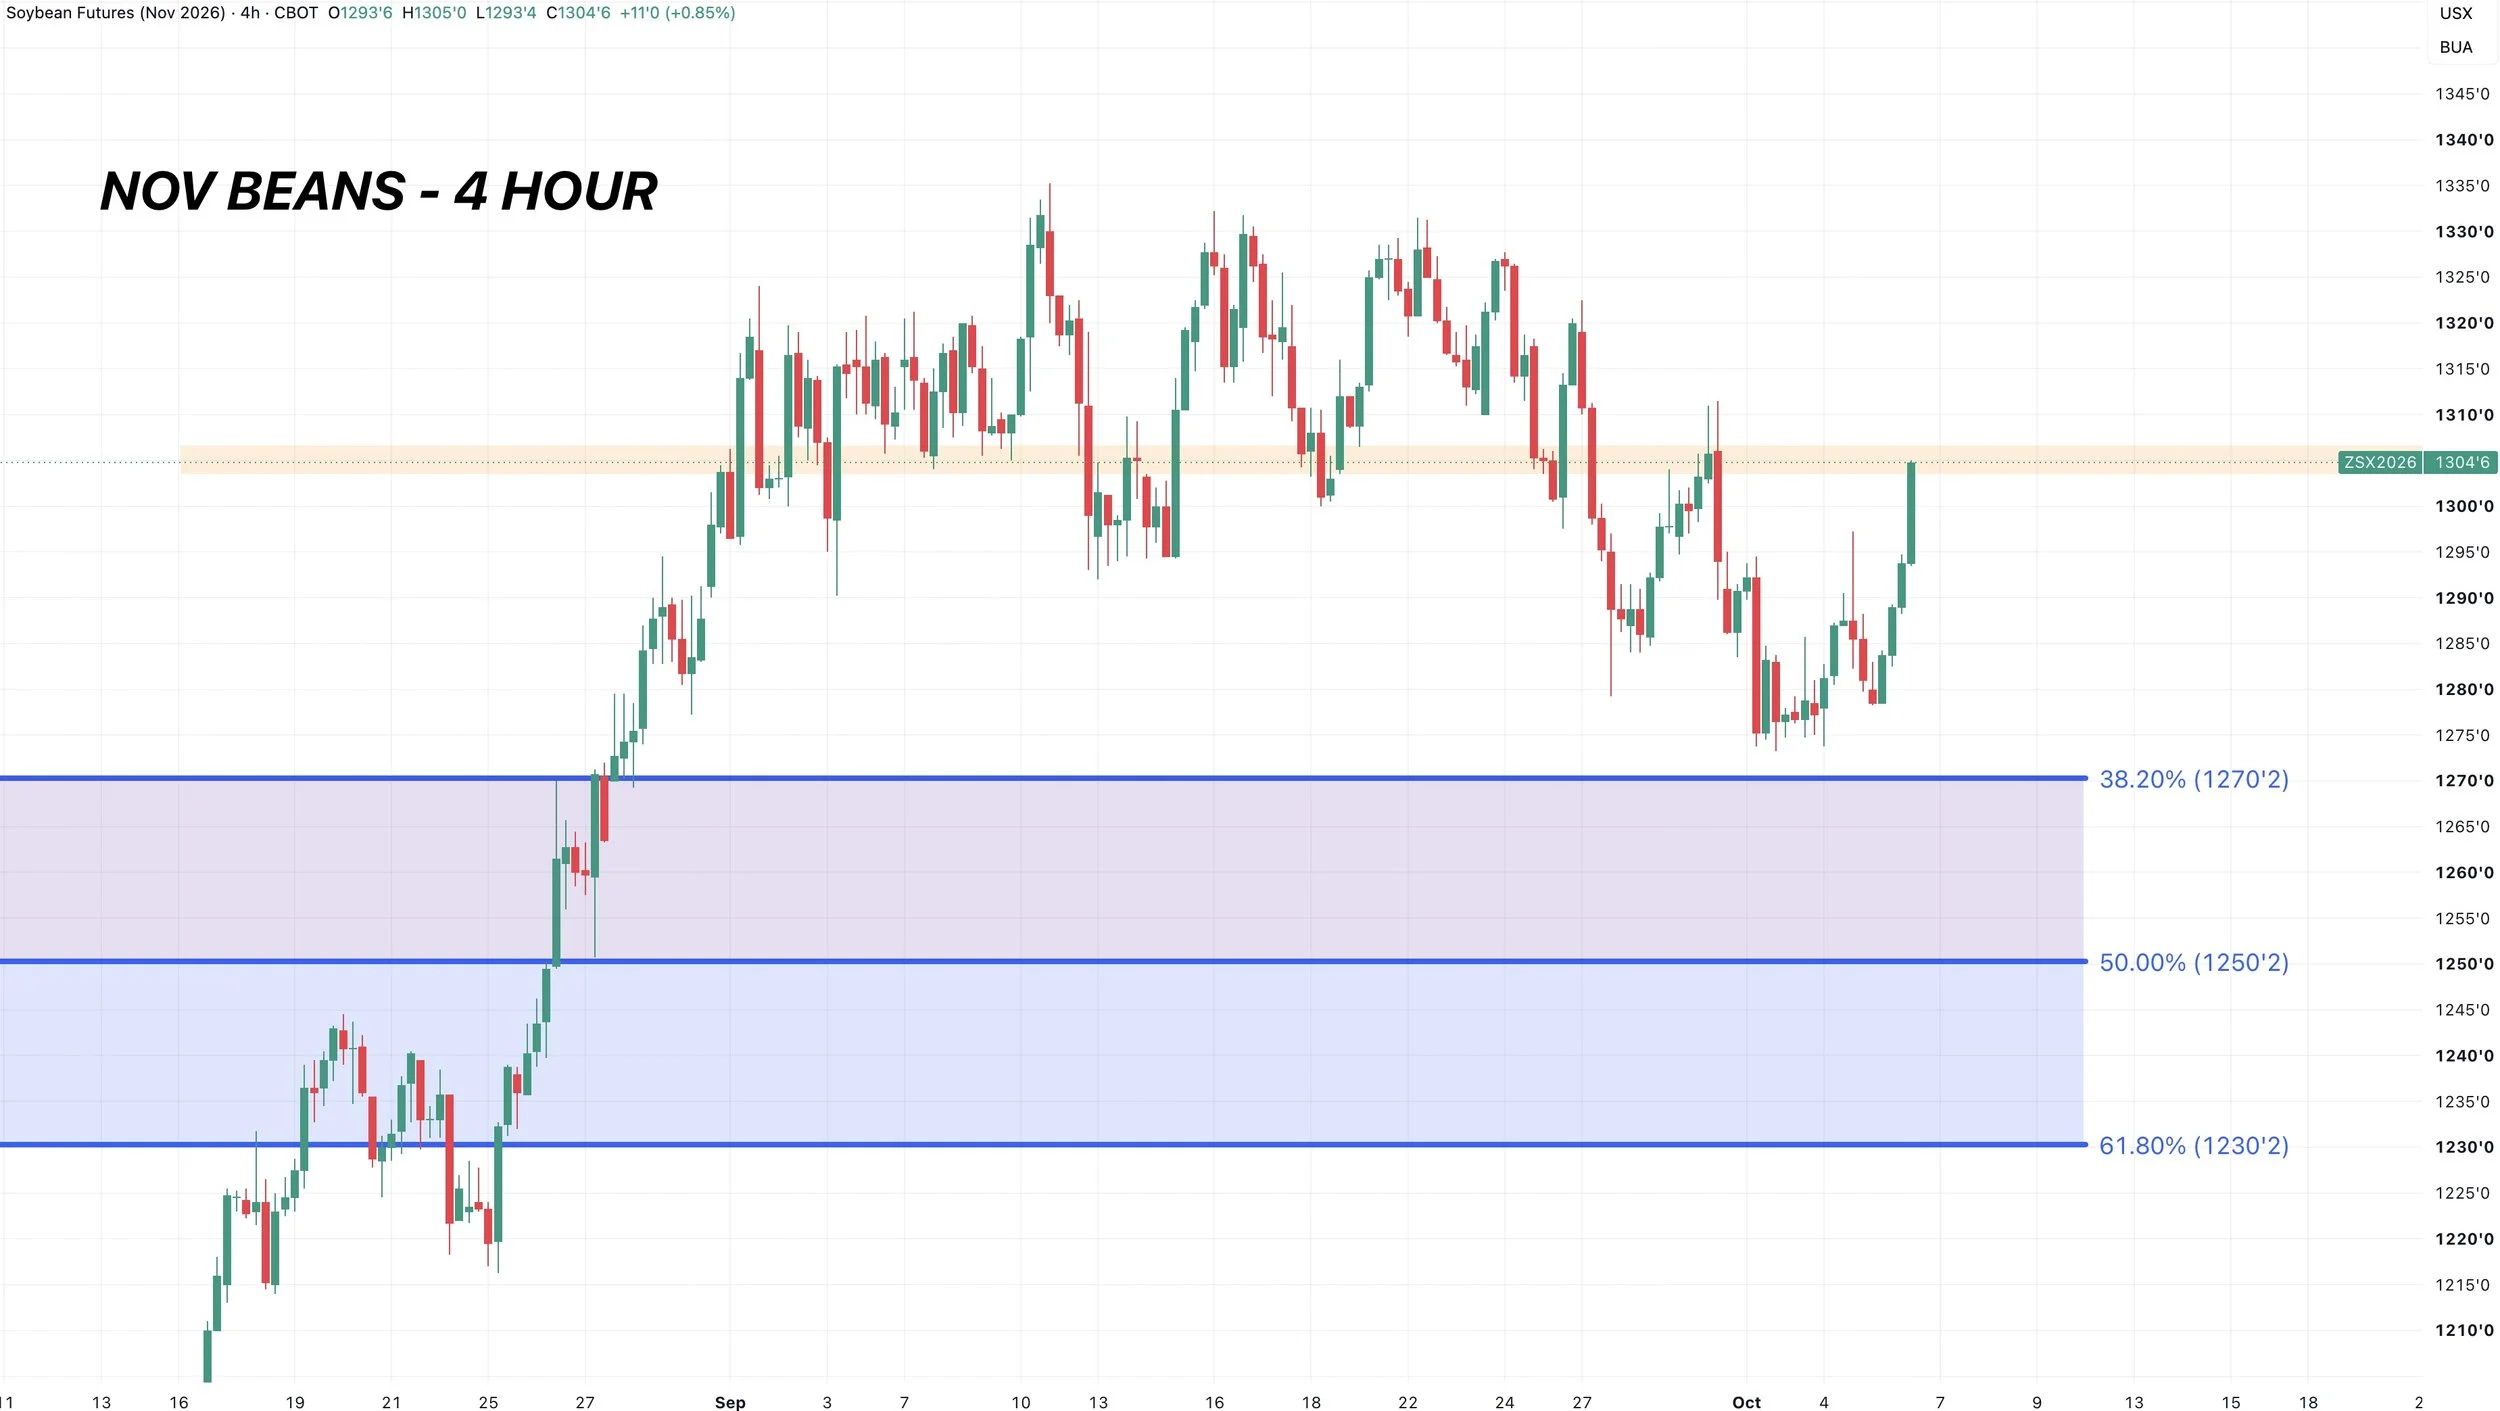
Very impressive day for soybeans.
We clawed back most of the recent sell off and are back above $13.00
We did not quiet come down to those retracement levels like we did in corn and wheat, but nearly tapped the 38.2% level. Which is a common level in a strong market.
Are the lows in for soybeans?
Here is the 4-hour chart.
We had that sideways we were trapped in for several weeks.
We broke below that range and support.
Then last week, we can came up and re-tested that old support before rejecting.
Now we are re-testing that prior support once again.
If you are able to crack above this old support and back into the prior range it would look like the lows are probably in for beans.
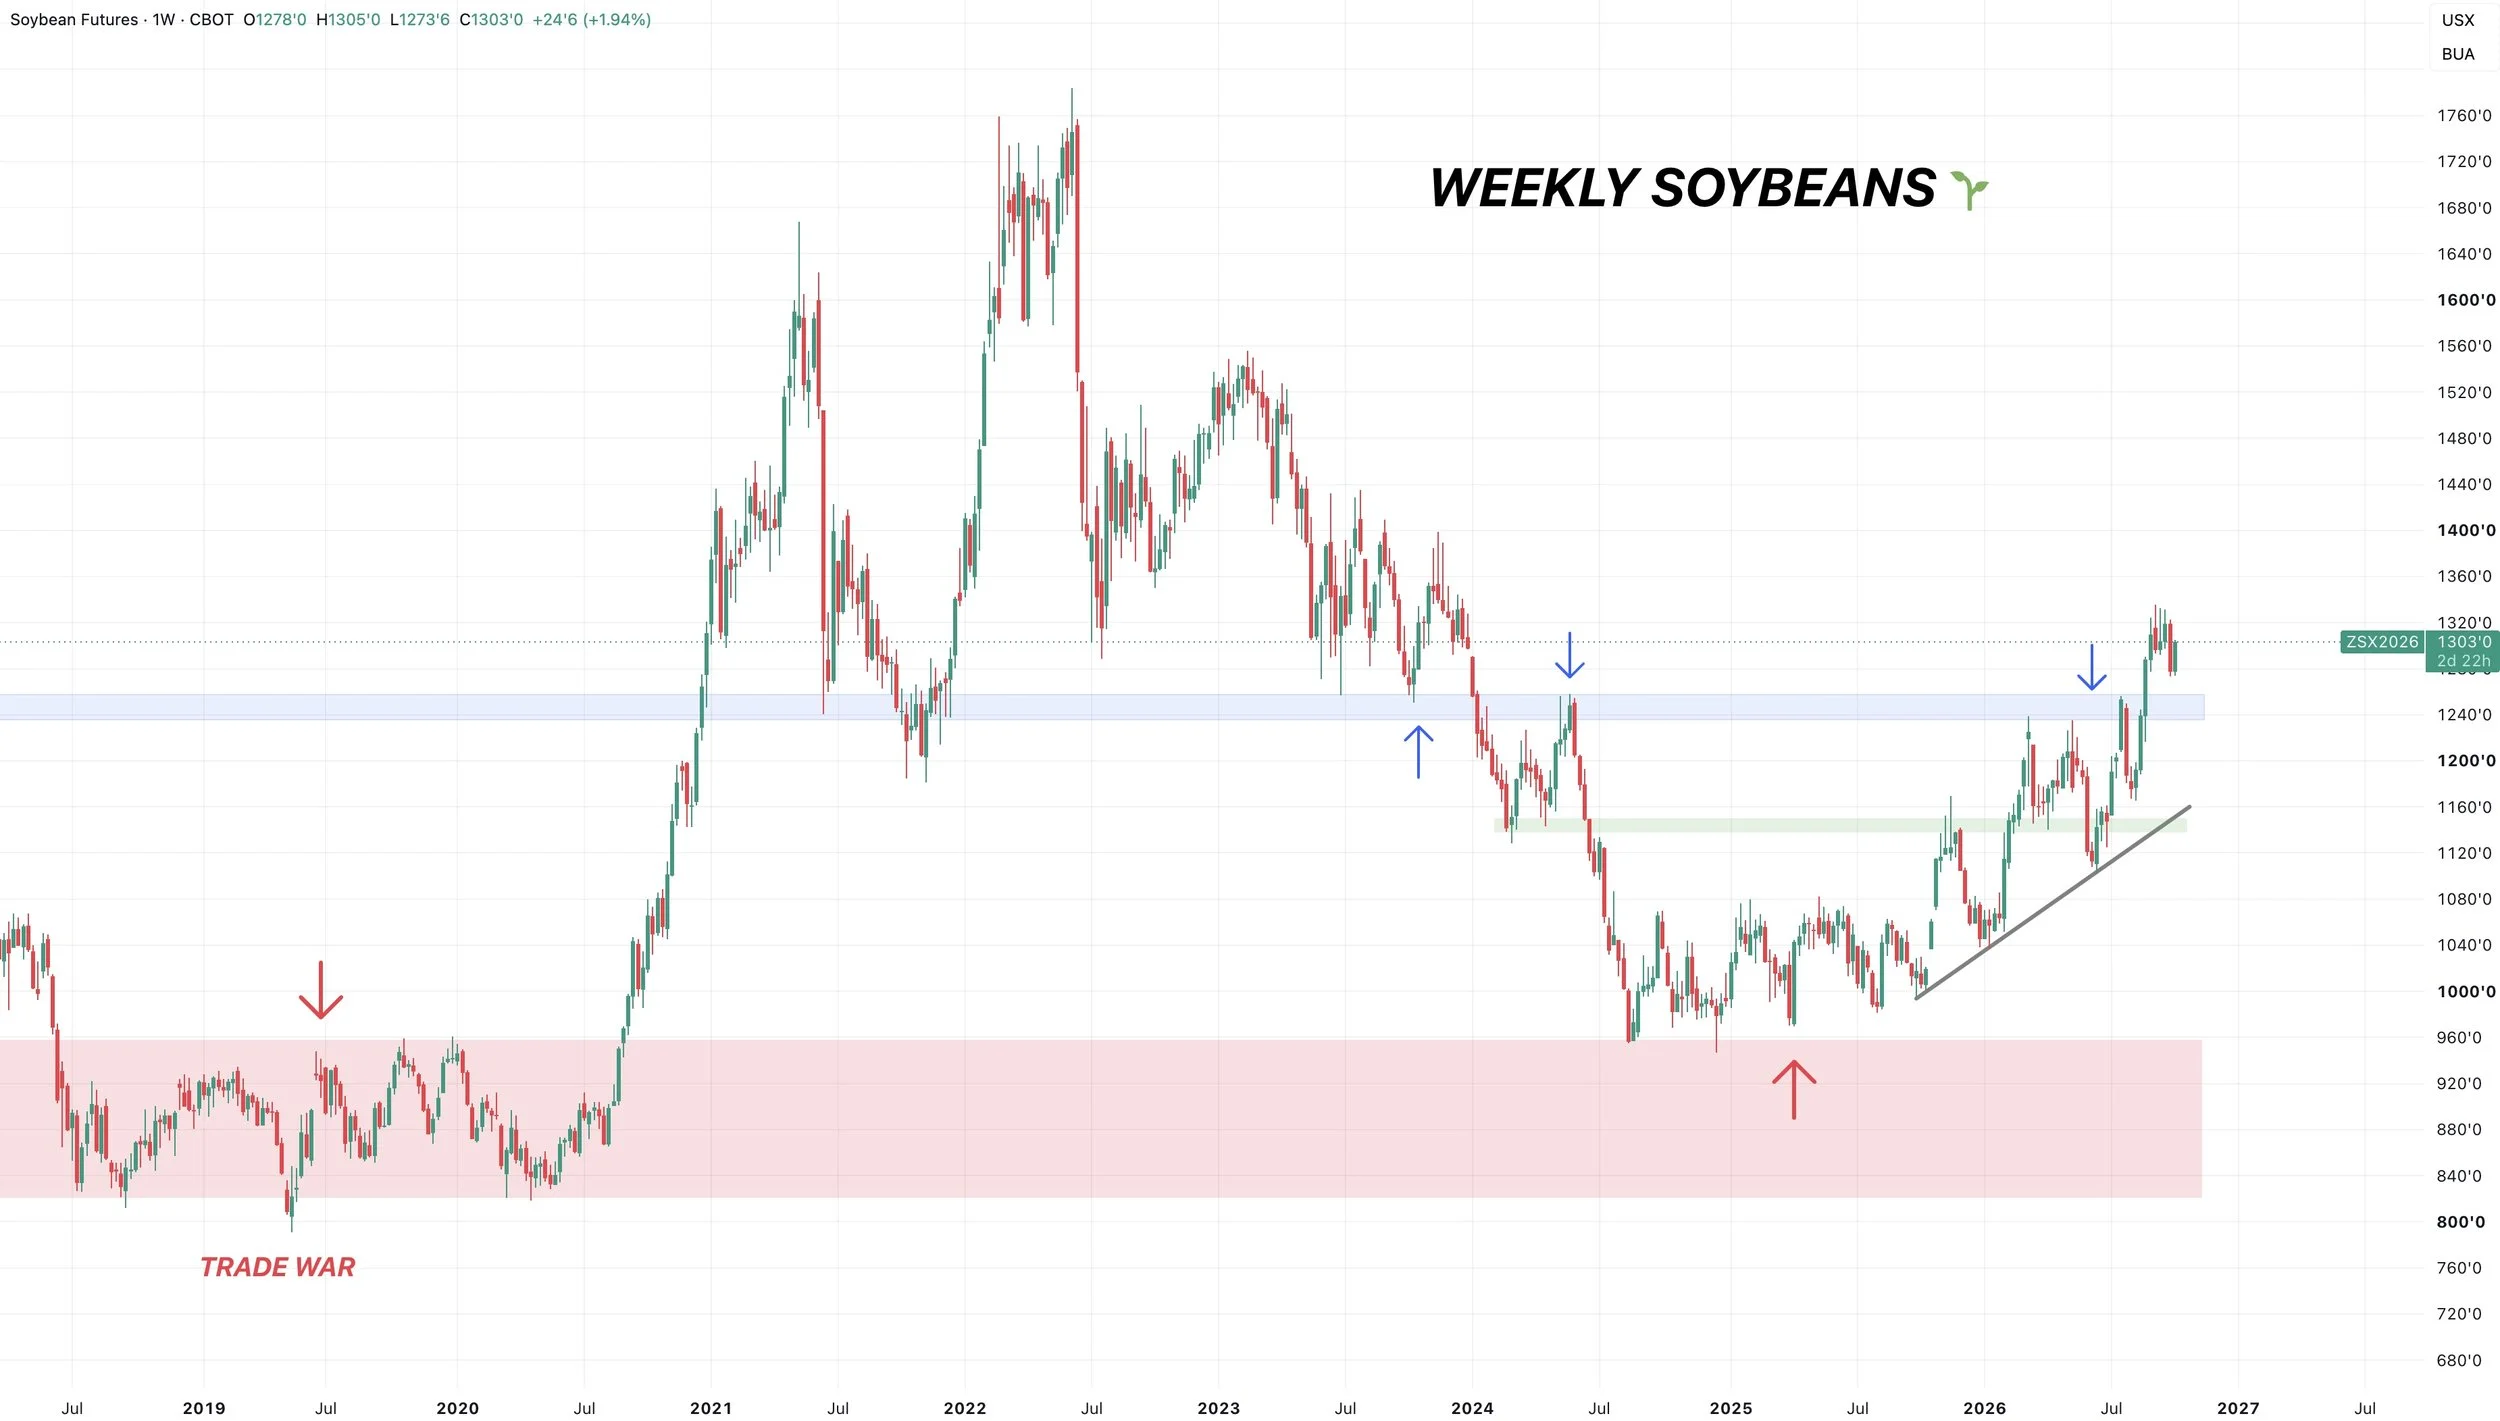
Weekly Chart: Anything but Bearish
Absolutely nothing bearish about this weekly chart.
We broke major resistance last month.
I'd say there is plenty of room to run long term.
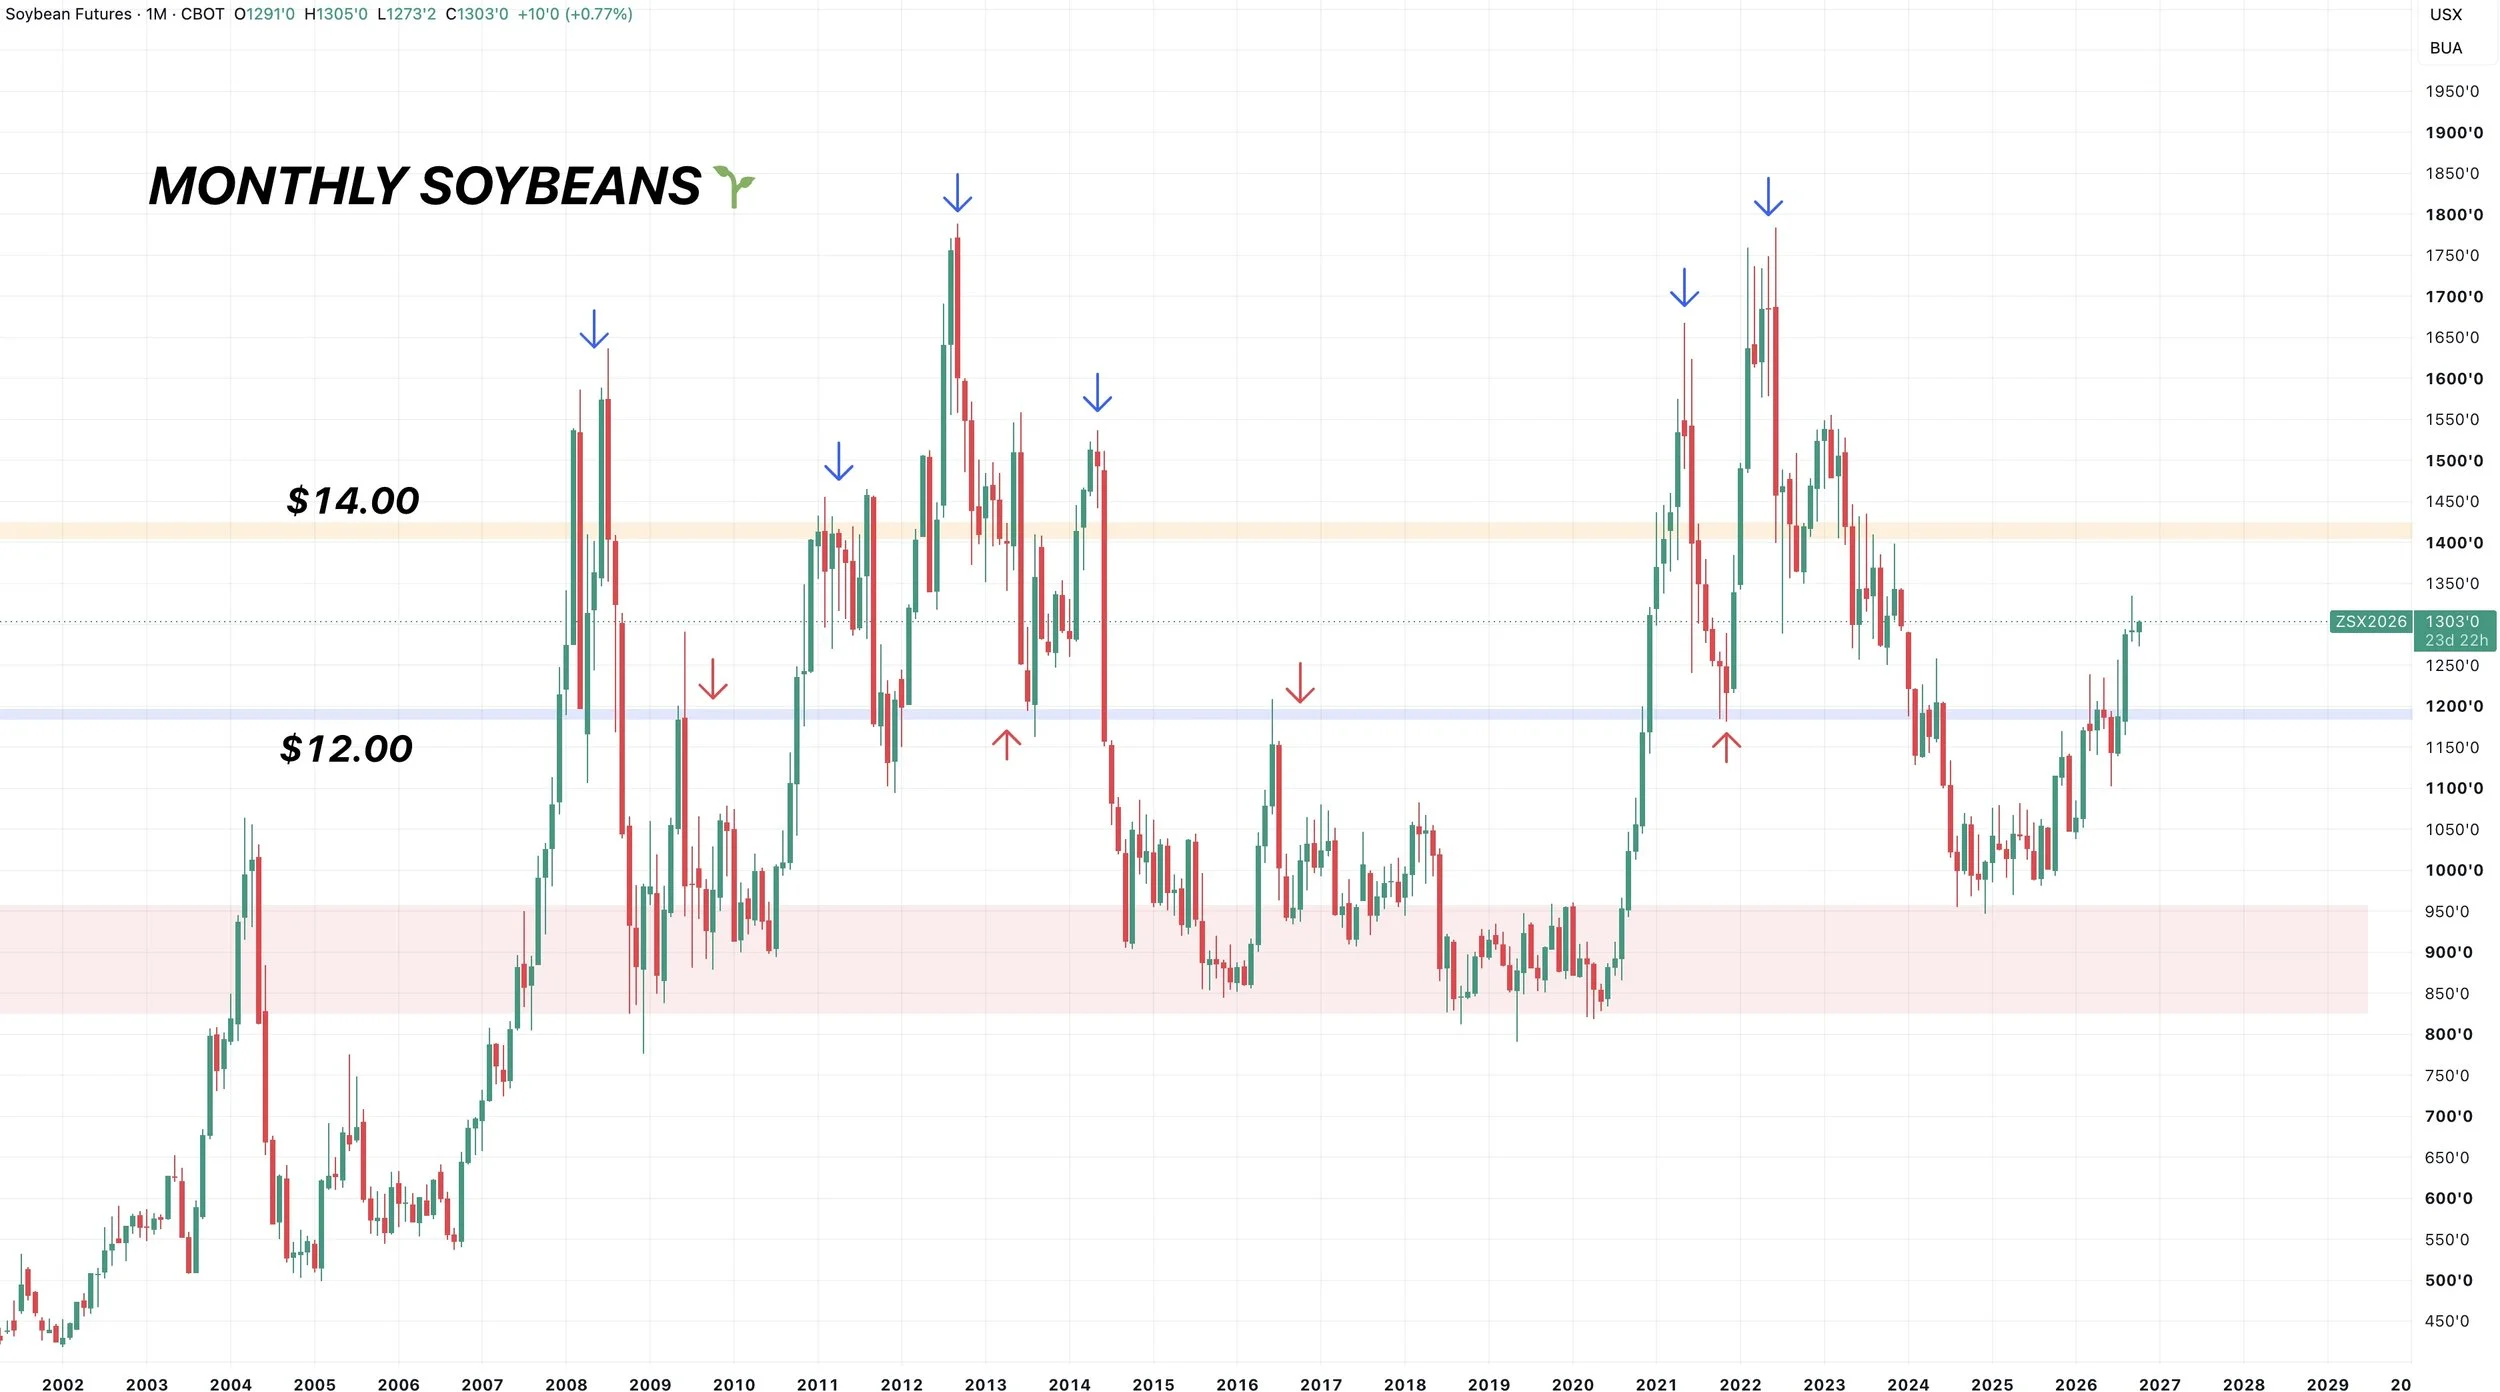
Monthly Chart: Plenty of Potential Room
I've shown this chart a hundred times at this point.
I still have my eyes set on +$14.00 soybeans at some point.
Given we've never seen a rally stop in the $12.00's or $13.00's.
Every major run has to led to $14.00 or higher when we got a monthly close above $12.00
Wheat
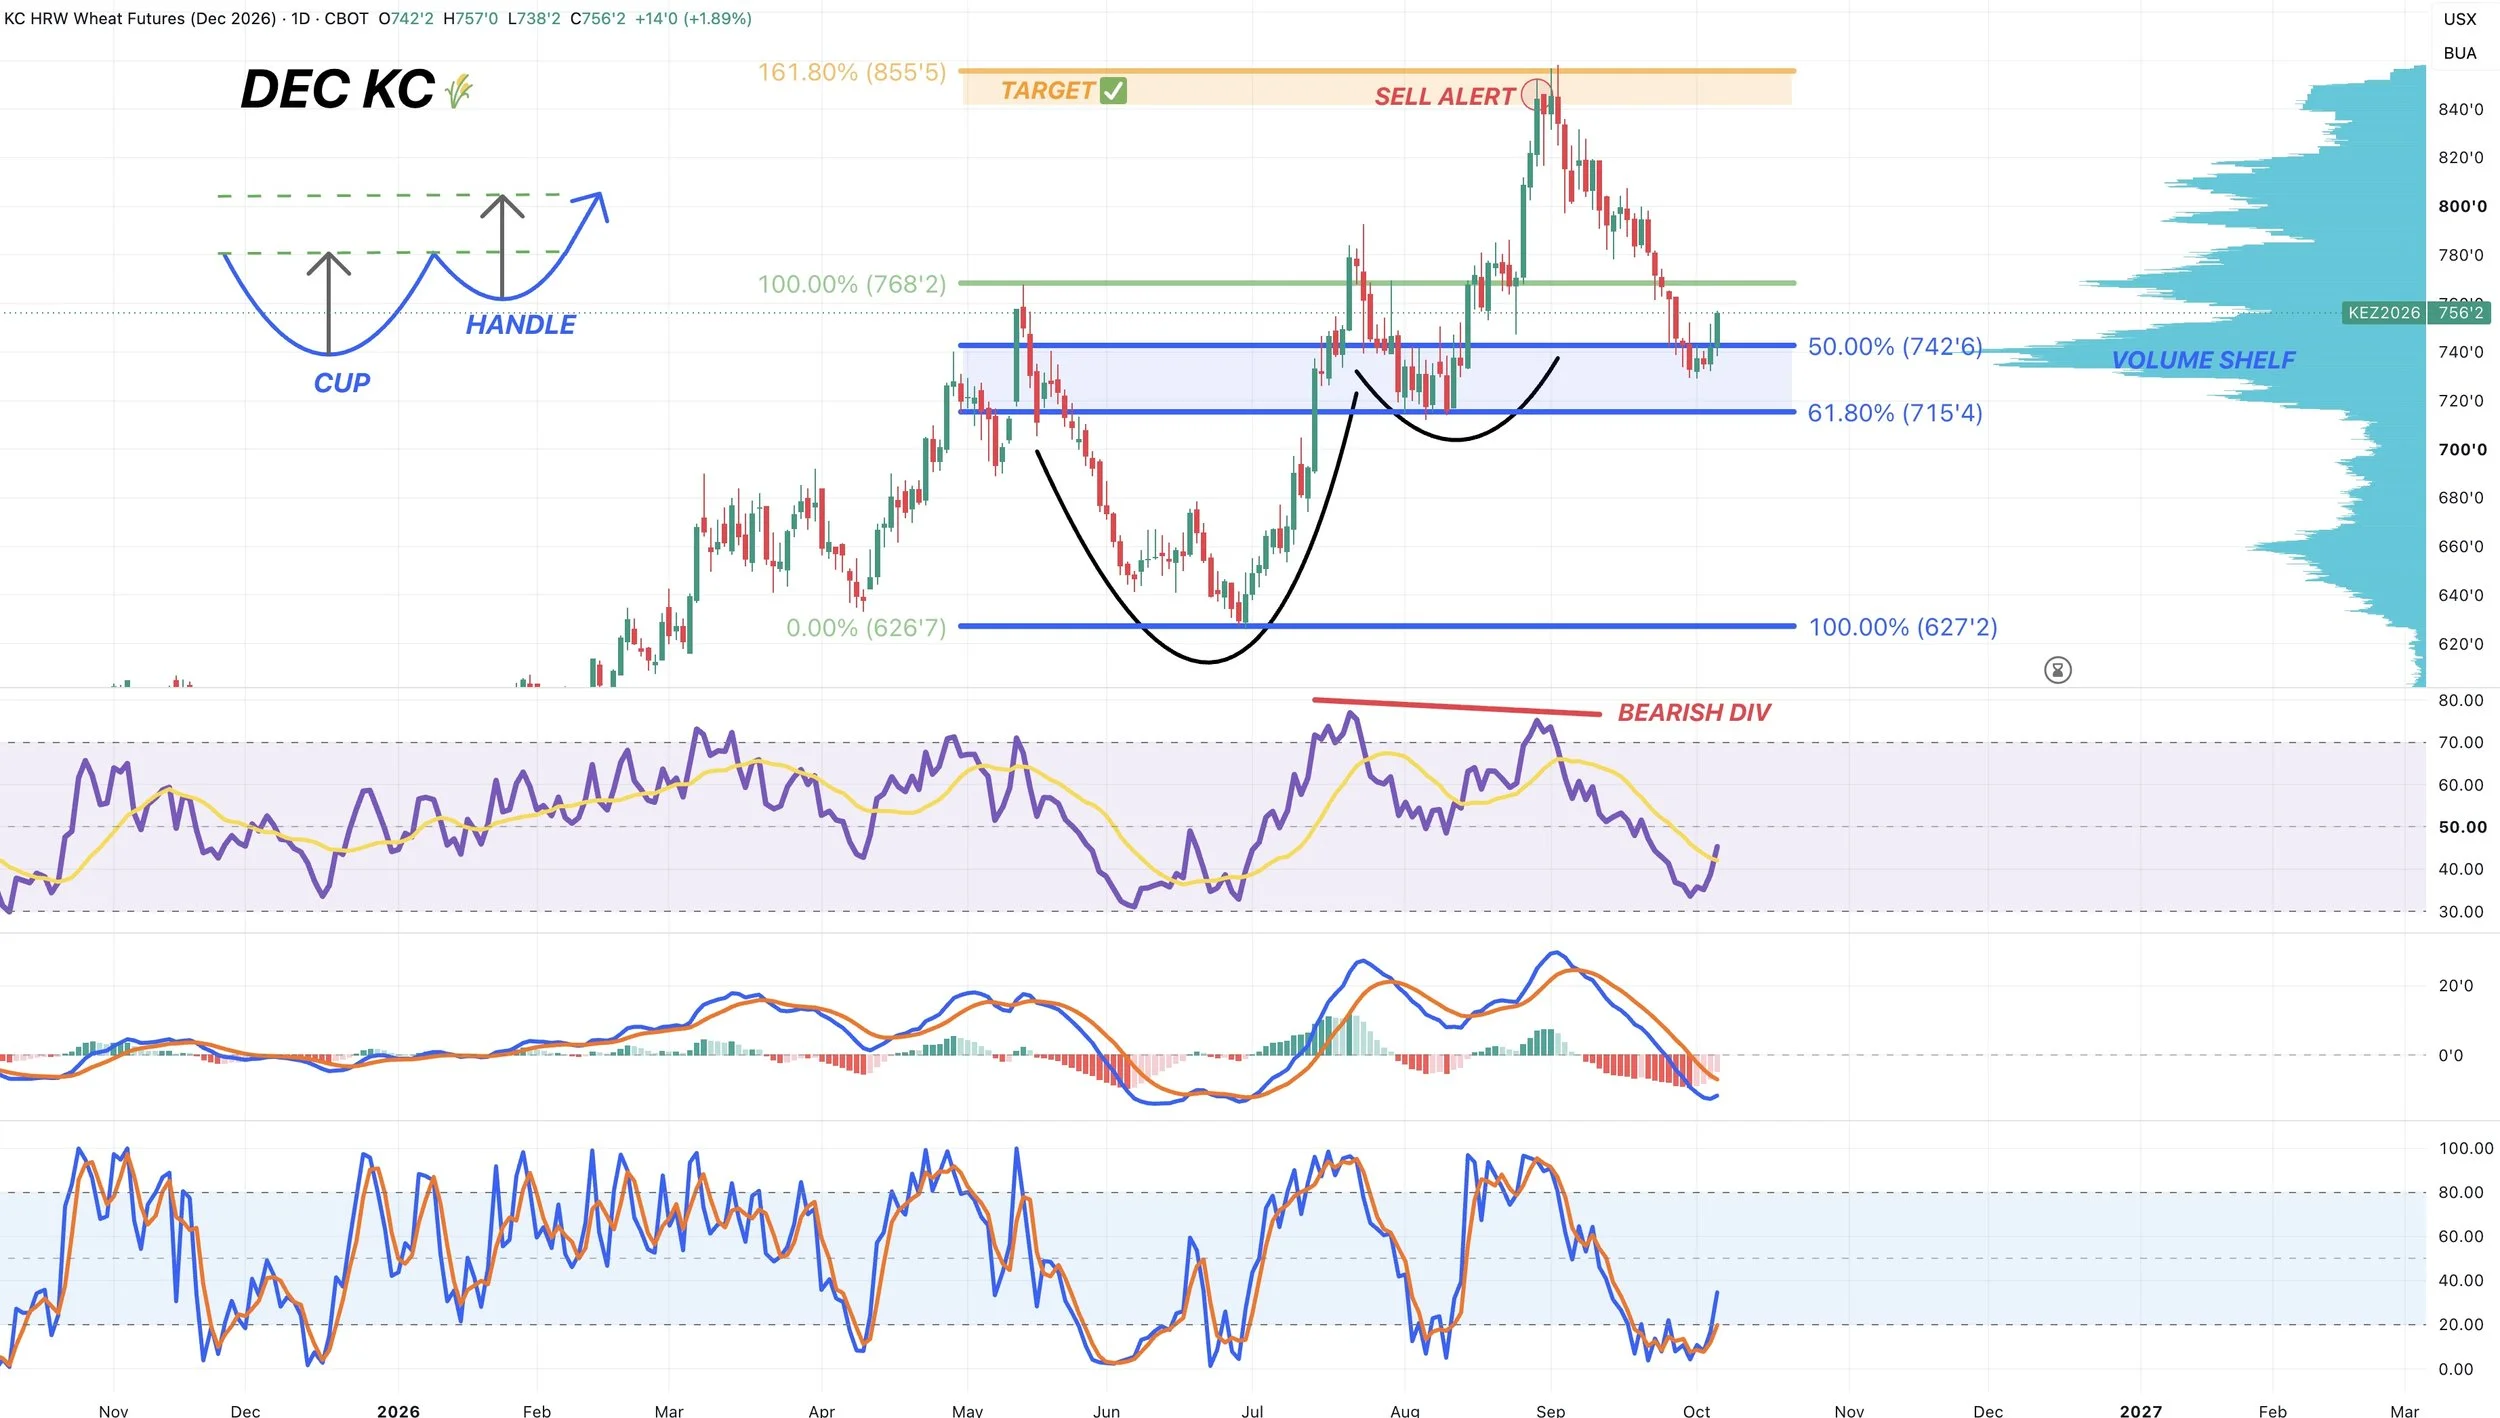
Dec KC Chart:
We are finding support right where we wanted to.
Right inside the golden zone down to the June lows.
Like I said last week, if we are going to put in some lows, this would be the spot we'd want to see it happen.
Not only is this the golden zone and most common area for a correction to end.
But we are re-testing the old highs from May and have a massive shelf of volume here adding support.
Prices slice through areas of low volume, but gravitate towards areas of high volume. So volume shelves often act as support and sometimes launch pads.
My bias leans higher unless we break below the 61.8% level at $7.15
The time to be bearish on wheat was at our $8.50 sell alert. Not at support.
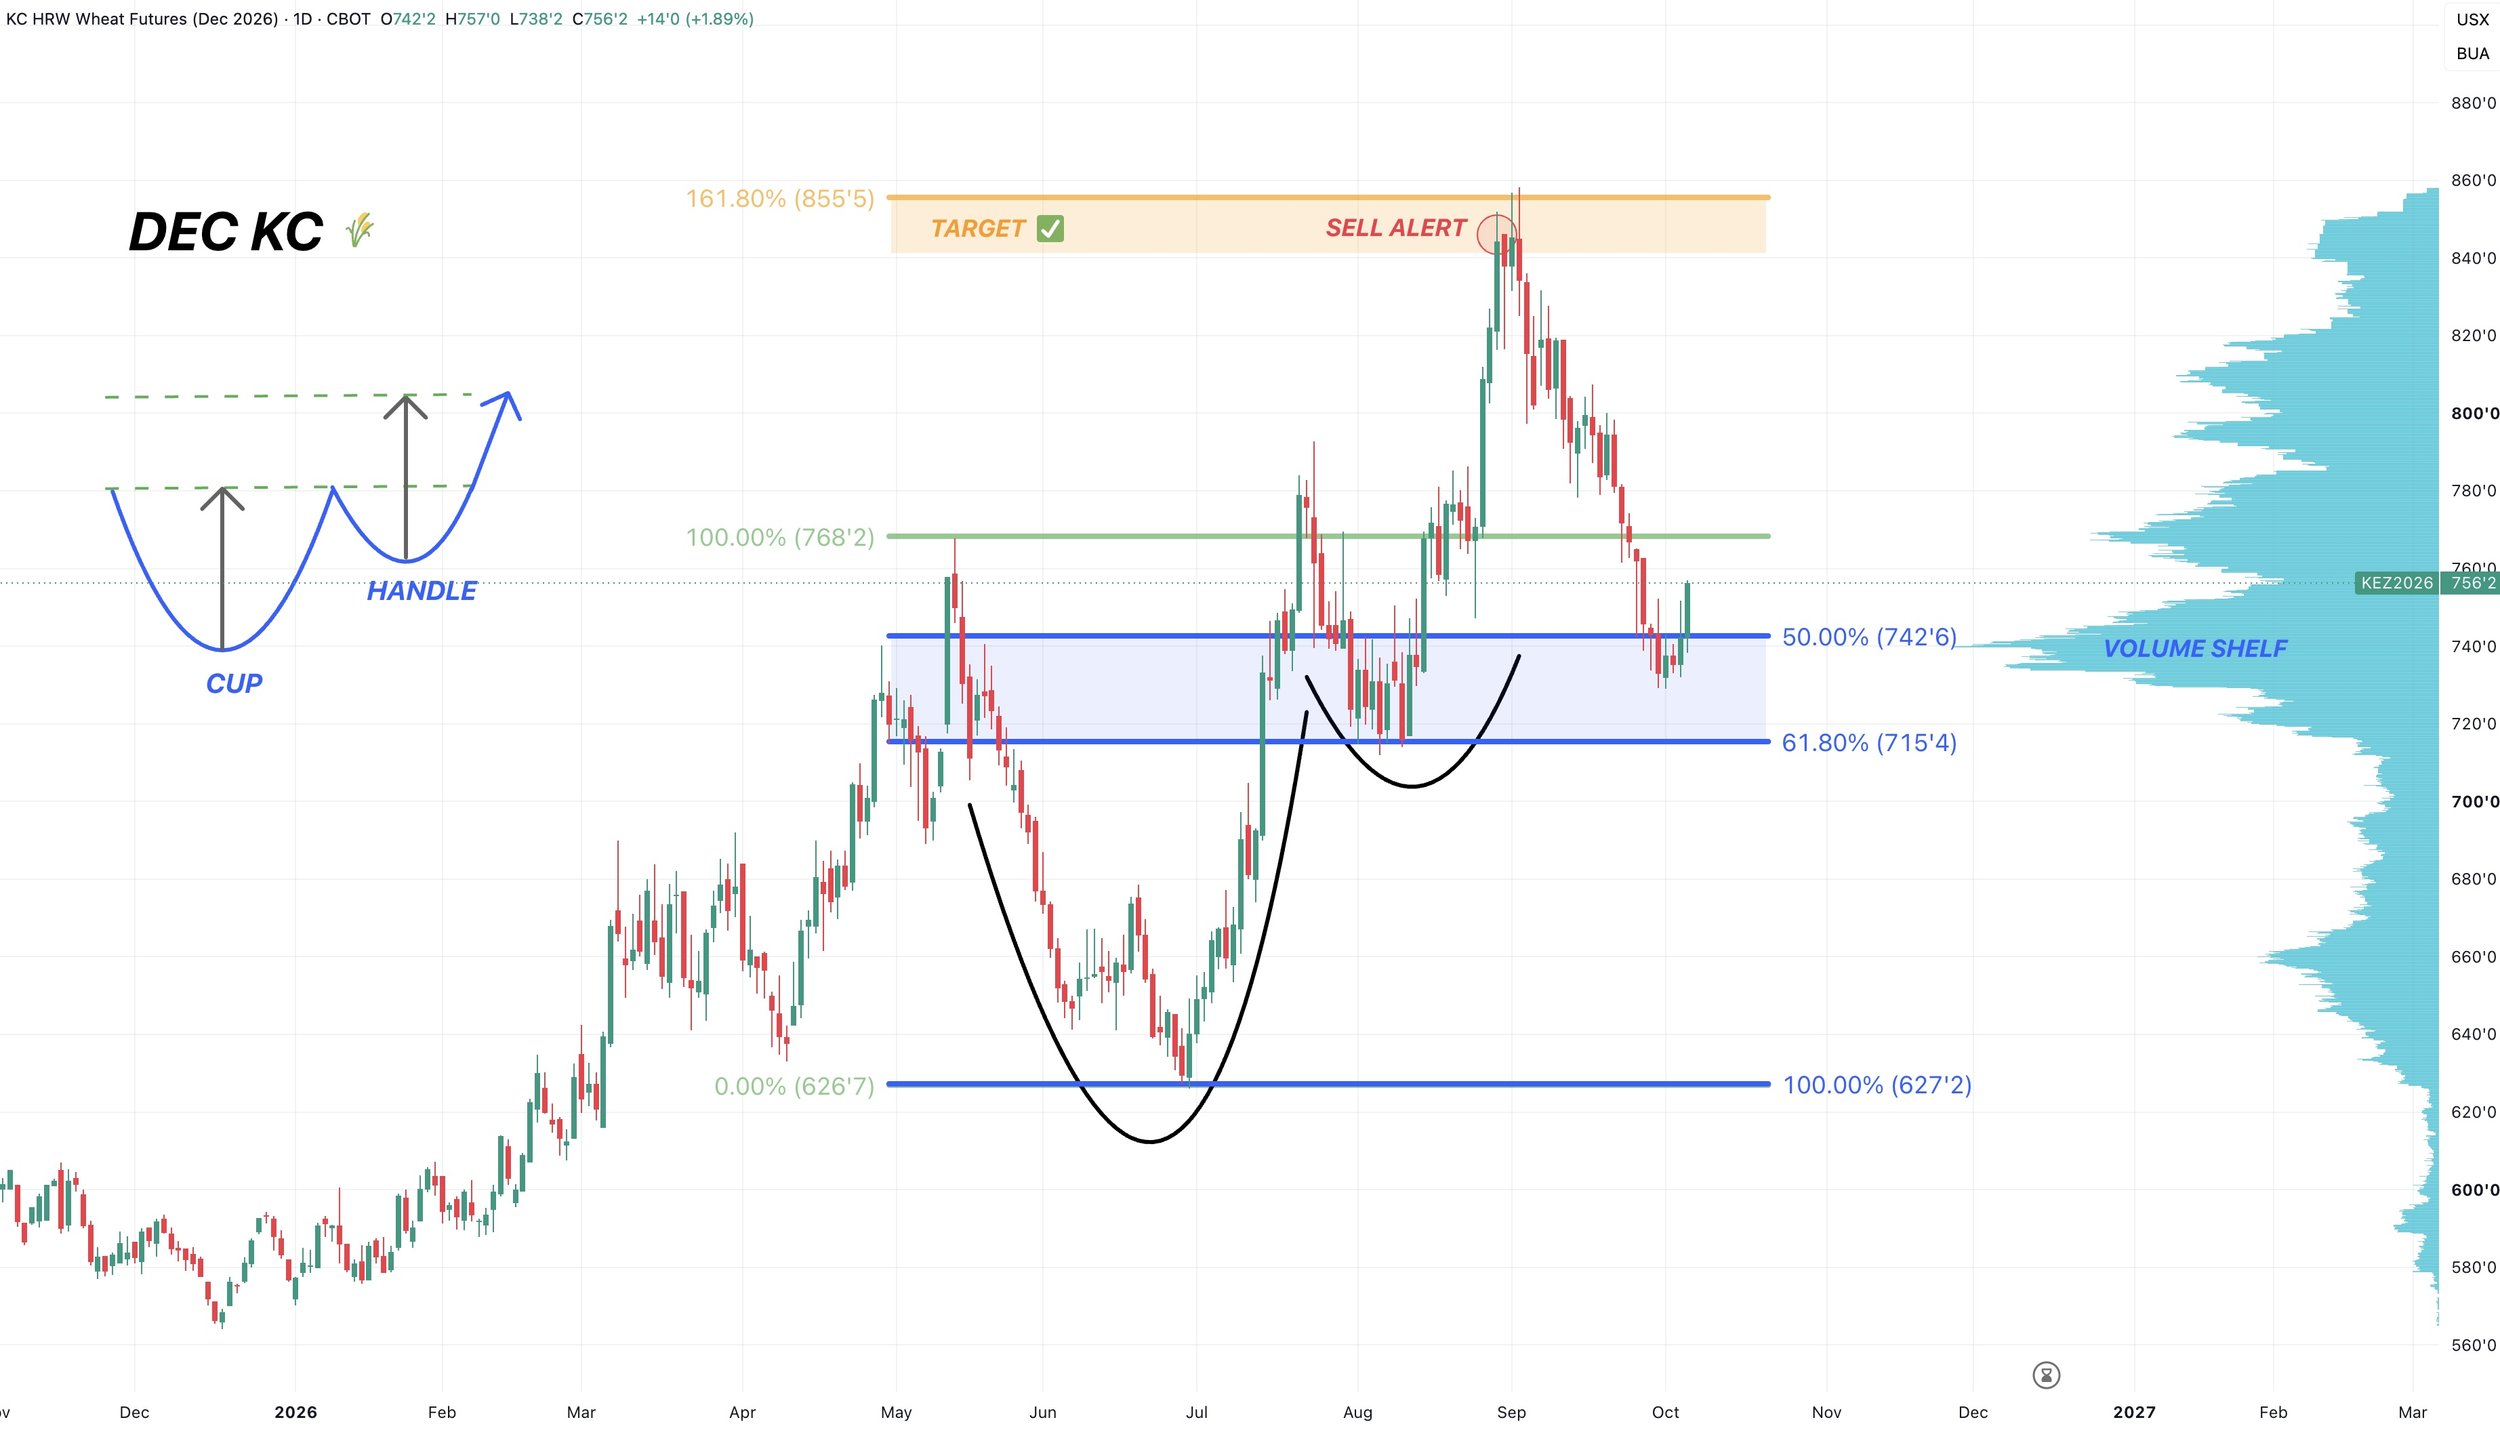
Wheat was just extremely oversold.
It was $1.00 cheaper than it is today the last time it was that oversold.
Now the indicators are picking back up and showing some signs of life.
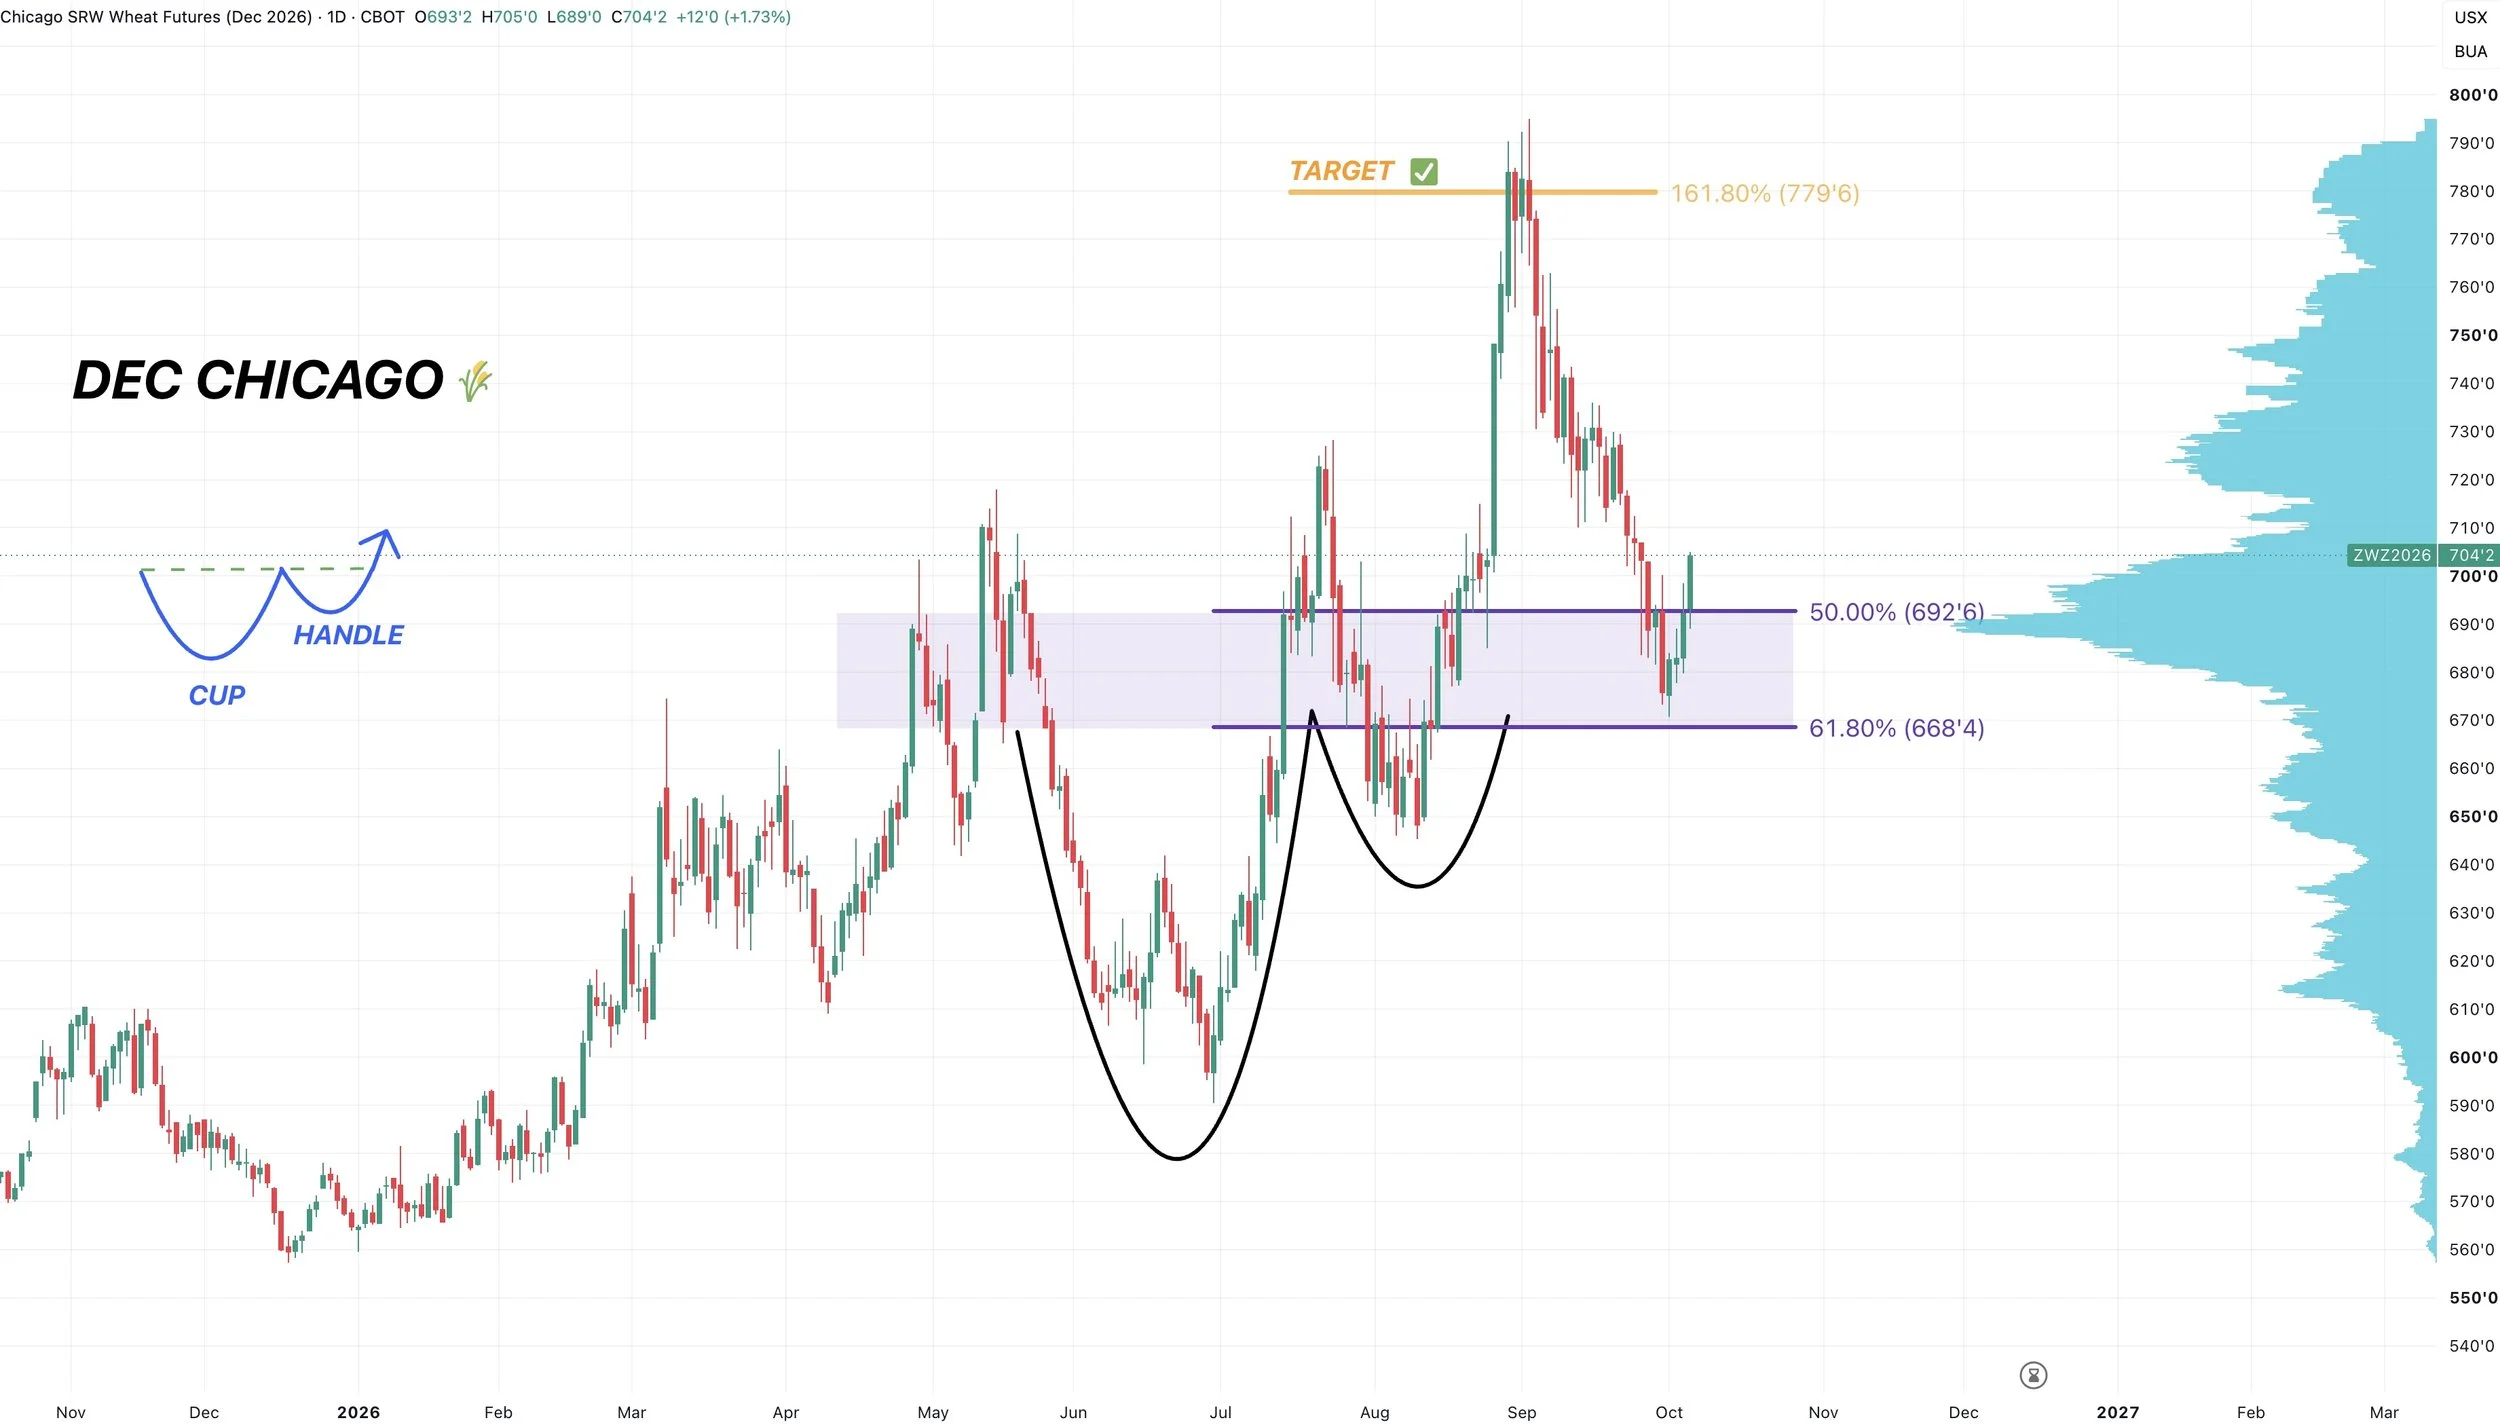
Dec Chicago Wheat Chart:
Chicago wheat is also bouncing right inside that golden zone right where we would expect us to carve out some lows.
This level also happens to be peak volume.
So this adds even more confidence for the wheat market to bottom in here.
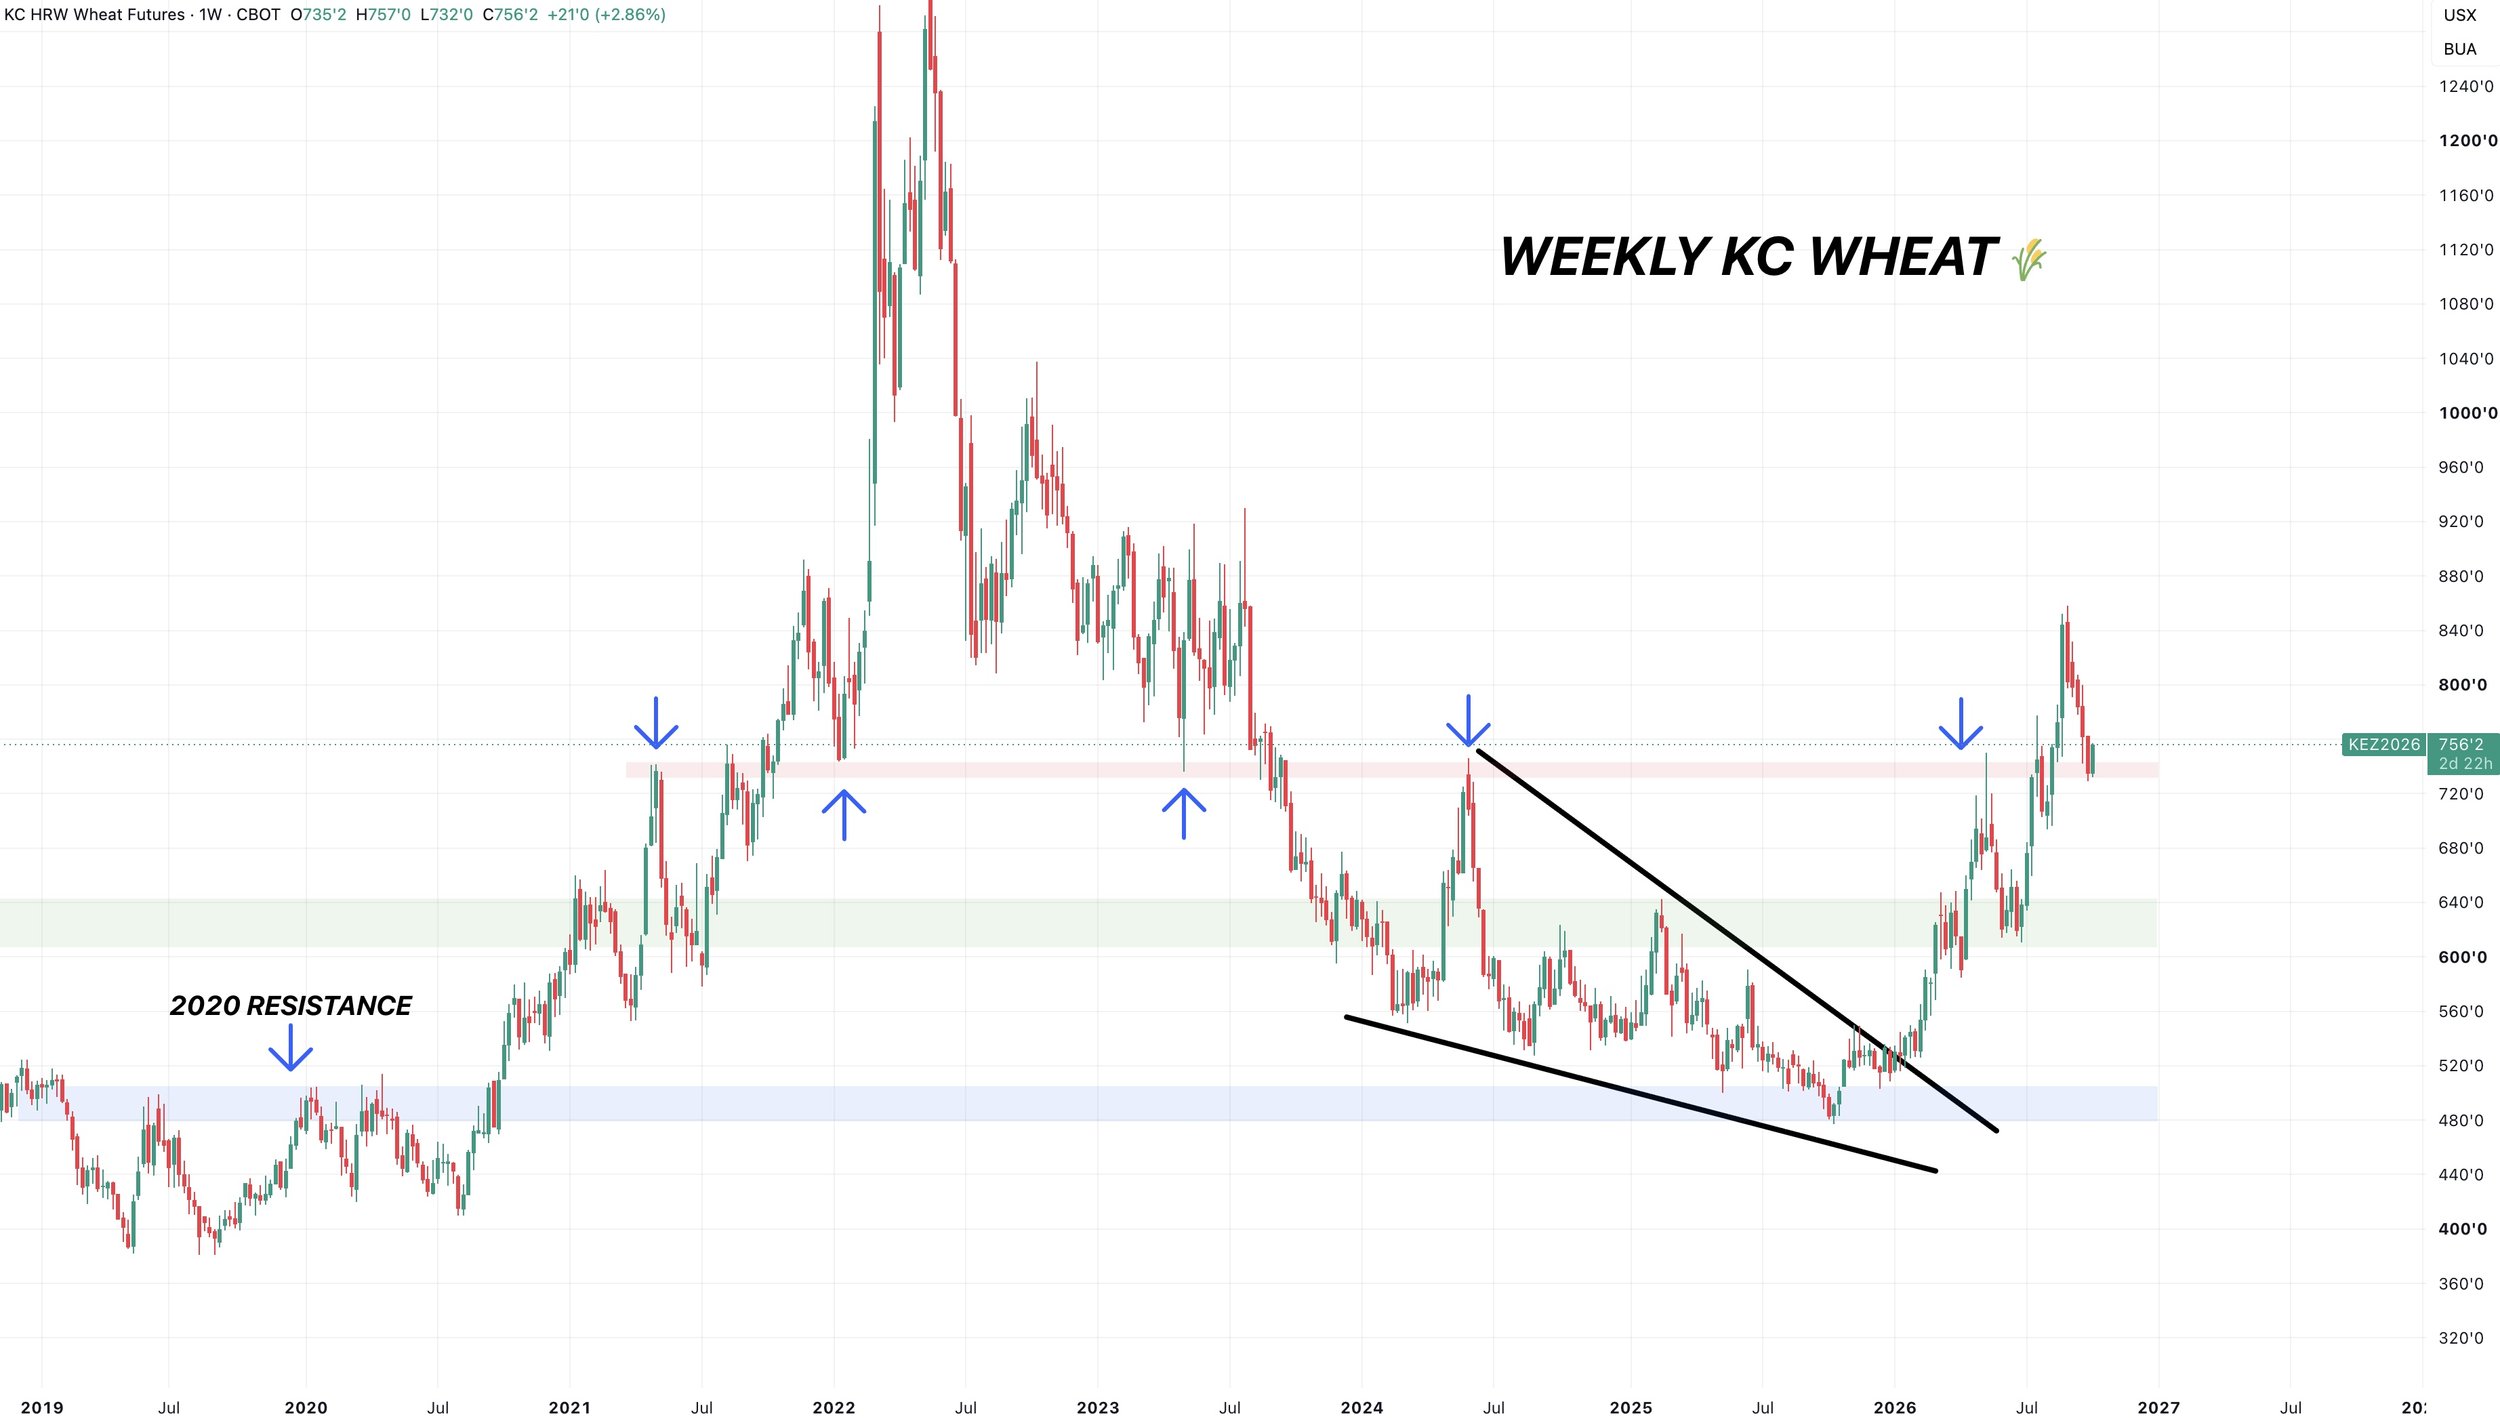
Weekly KC Chart: Simple Re-Test?
The weekly chart provides a very similar outlook to corn.
Wheat broke through some major resistance.
As I talked about last week, all this looks like is a high time frame re-test.
Old resistance becomes new support. Sometimes it's that simple.
The lows in 2025 came right at the highs from 2020.
Wheat endures brutal pull backs like this even in bull markets.
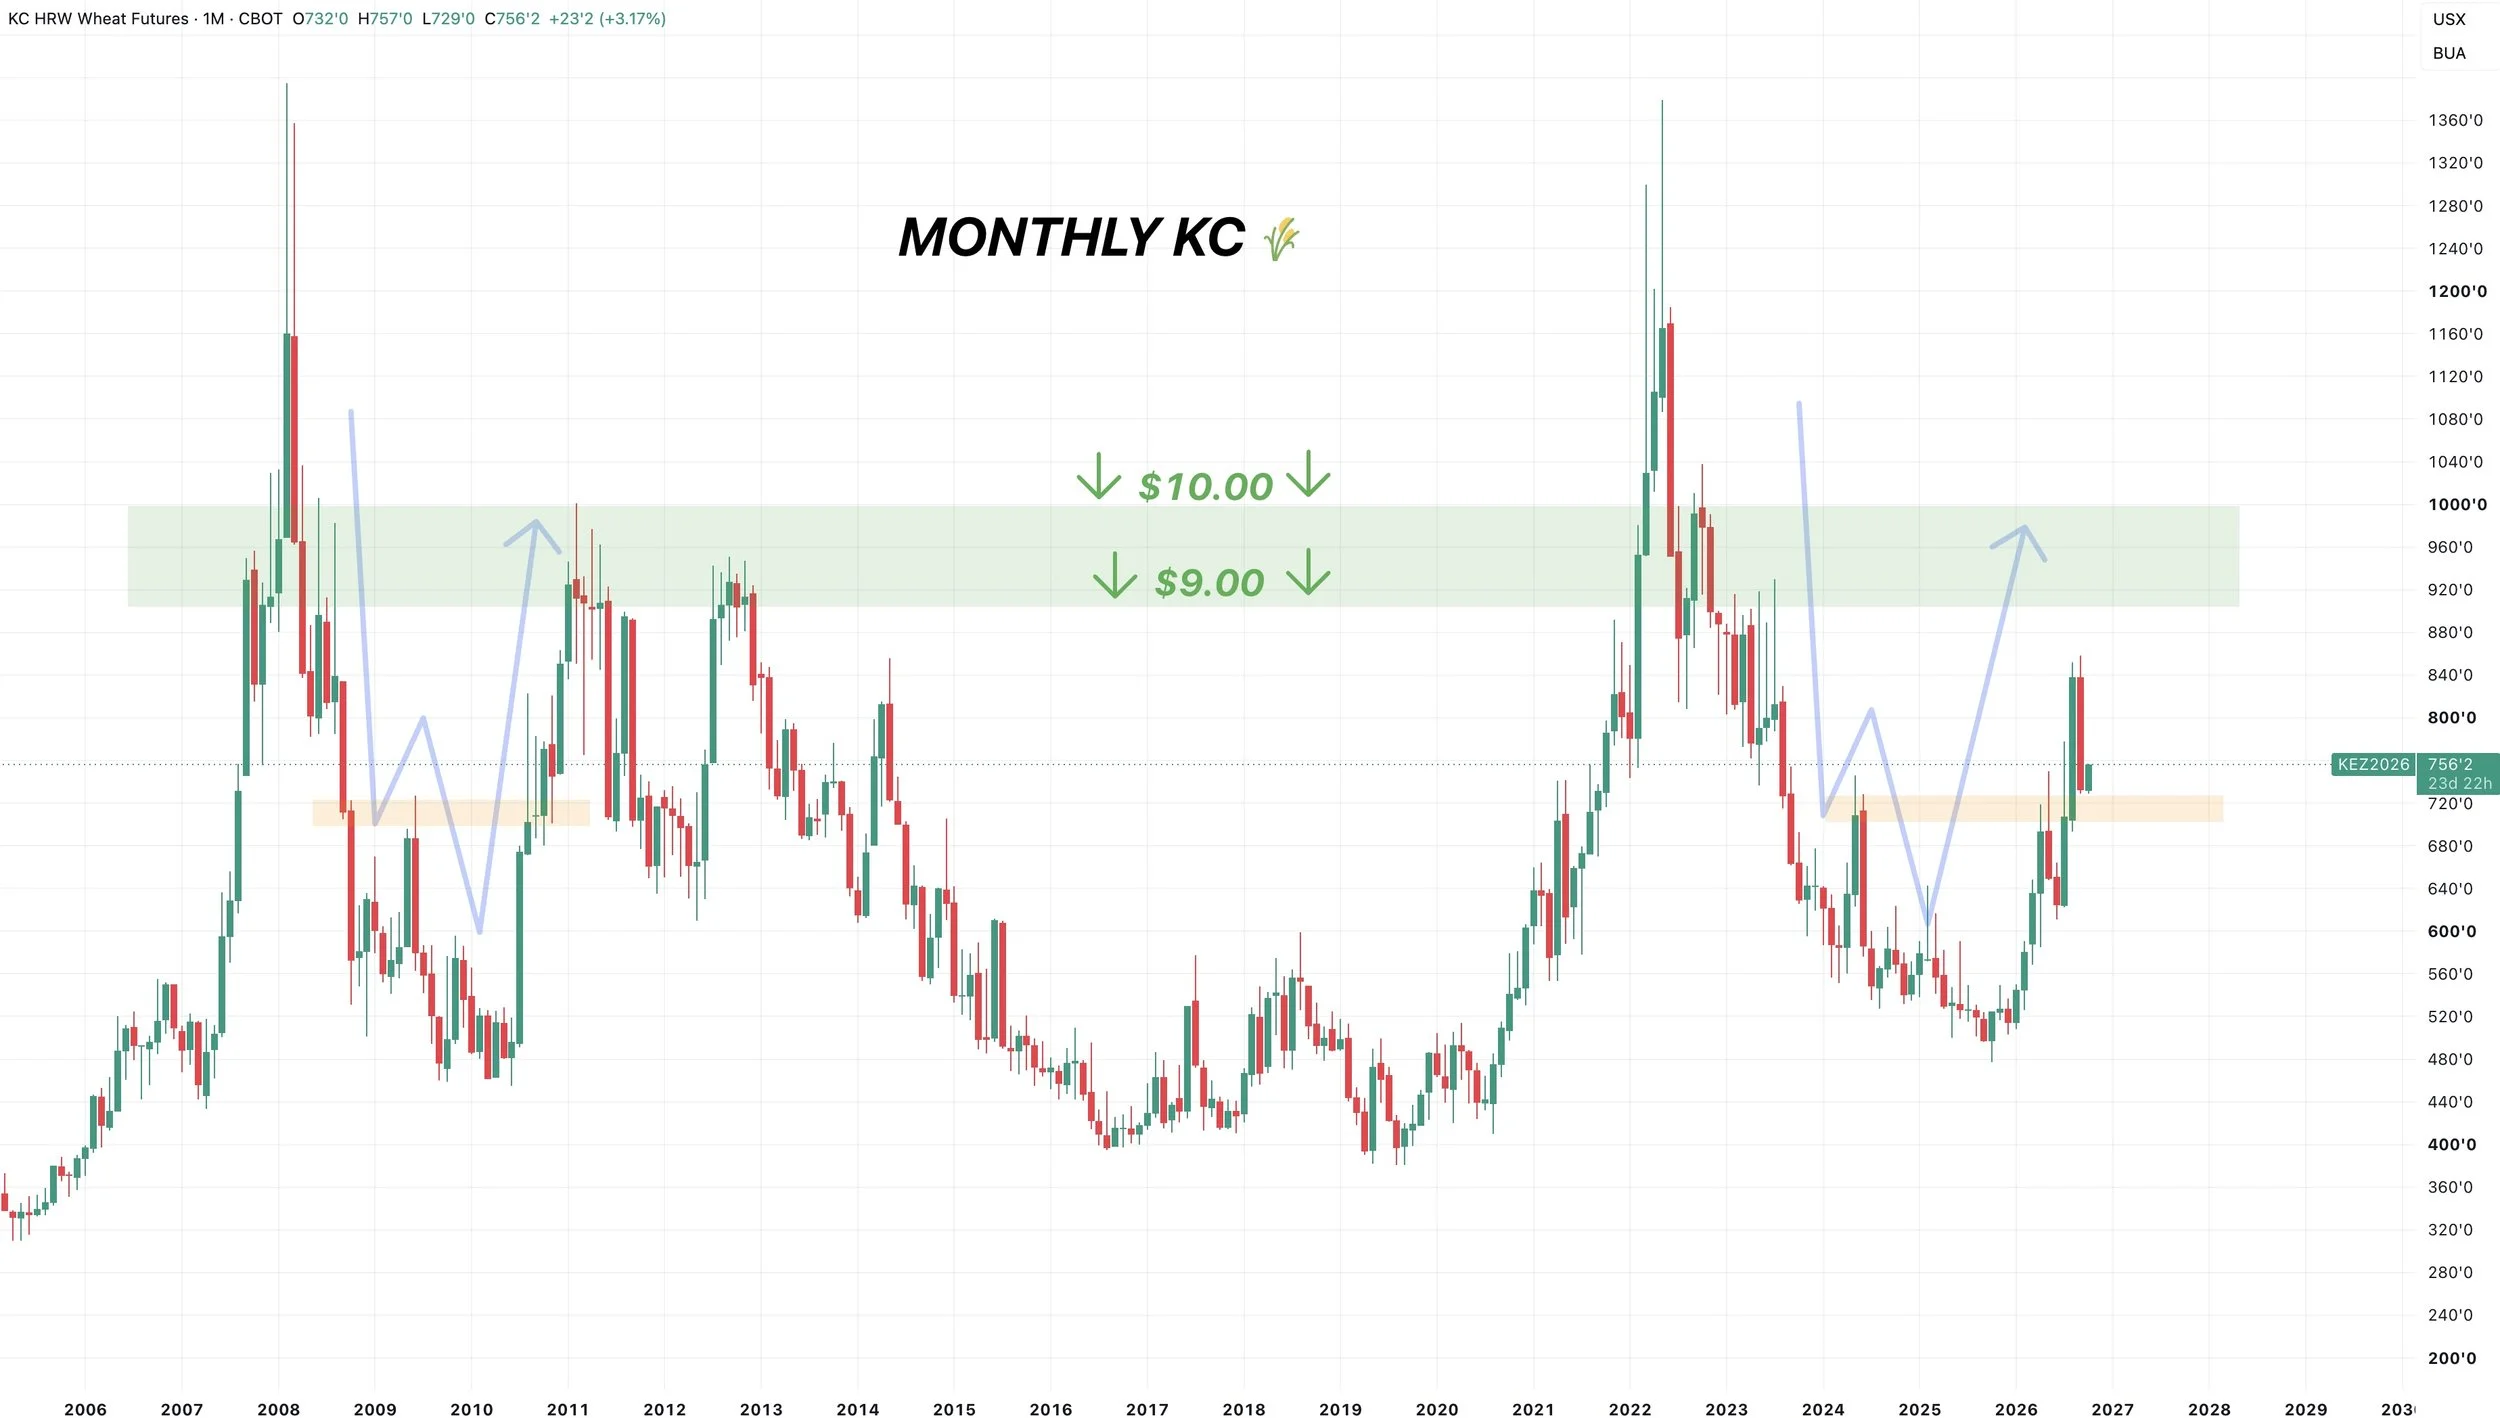
Monthly Chart:
As I've talked about plenty of times, every major run in the wheat market has led to at least $9.00 to $10.00
If this is truly a bull market, we would expect to see $9.00 at some point.
So far, this run looks eerily similar to what happened back in the 2011 rally.
Cattle
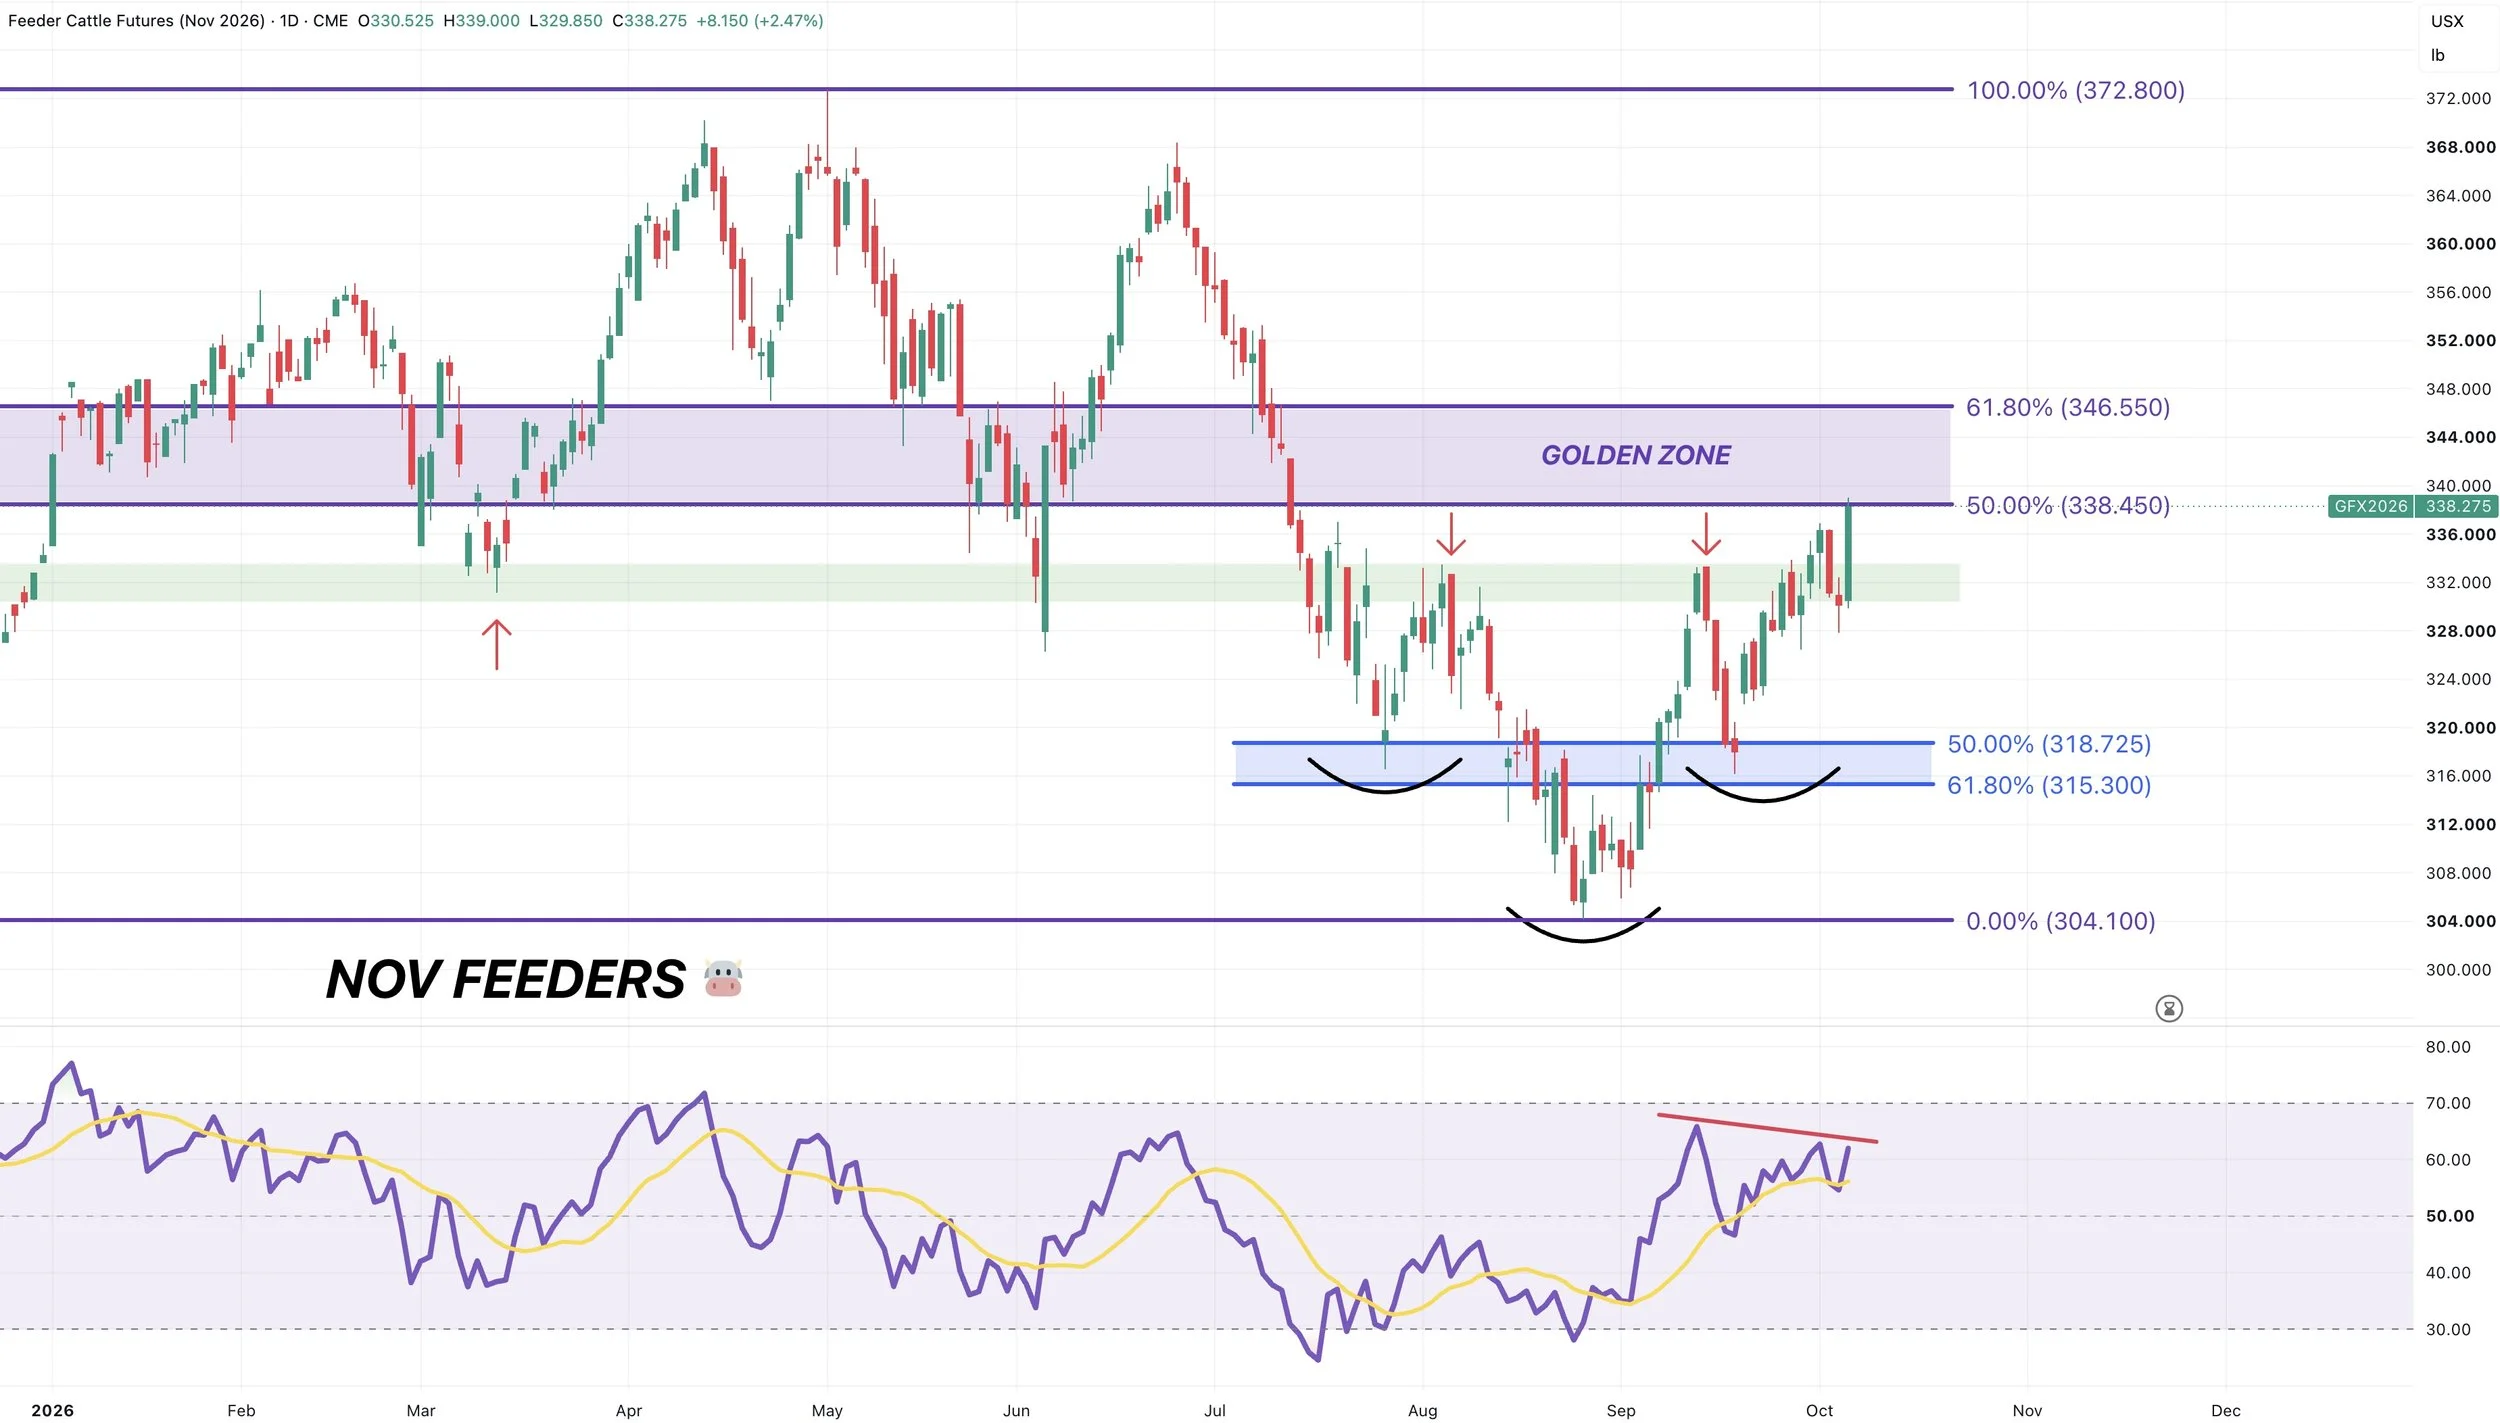
Nov Feeders Chart:
Huge day for the cattle market. The best day since June for this contract.
Feeders breaking about above resistance following this inverse head and shoulders pattern we've been talking about for the last few weeks.
Which is a common reversal pattern when hunting for a bottom.
Now we are entering the golden zone up to the May highs.
So I would be looking at doing hedging up here soon between here and the 61.8% level.
As if this is simply a relief bounce in a broader down trend, this would be a very common area for this market to stall out at.
I am currently in the camp that this market is overall in a downtrend unless we break above this zone. So this is where I'm looking to manage some risk soon.
We also have some bearish divergence on the RSI I am watching.
Dec Live Chart:
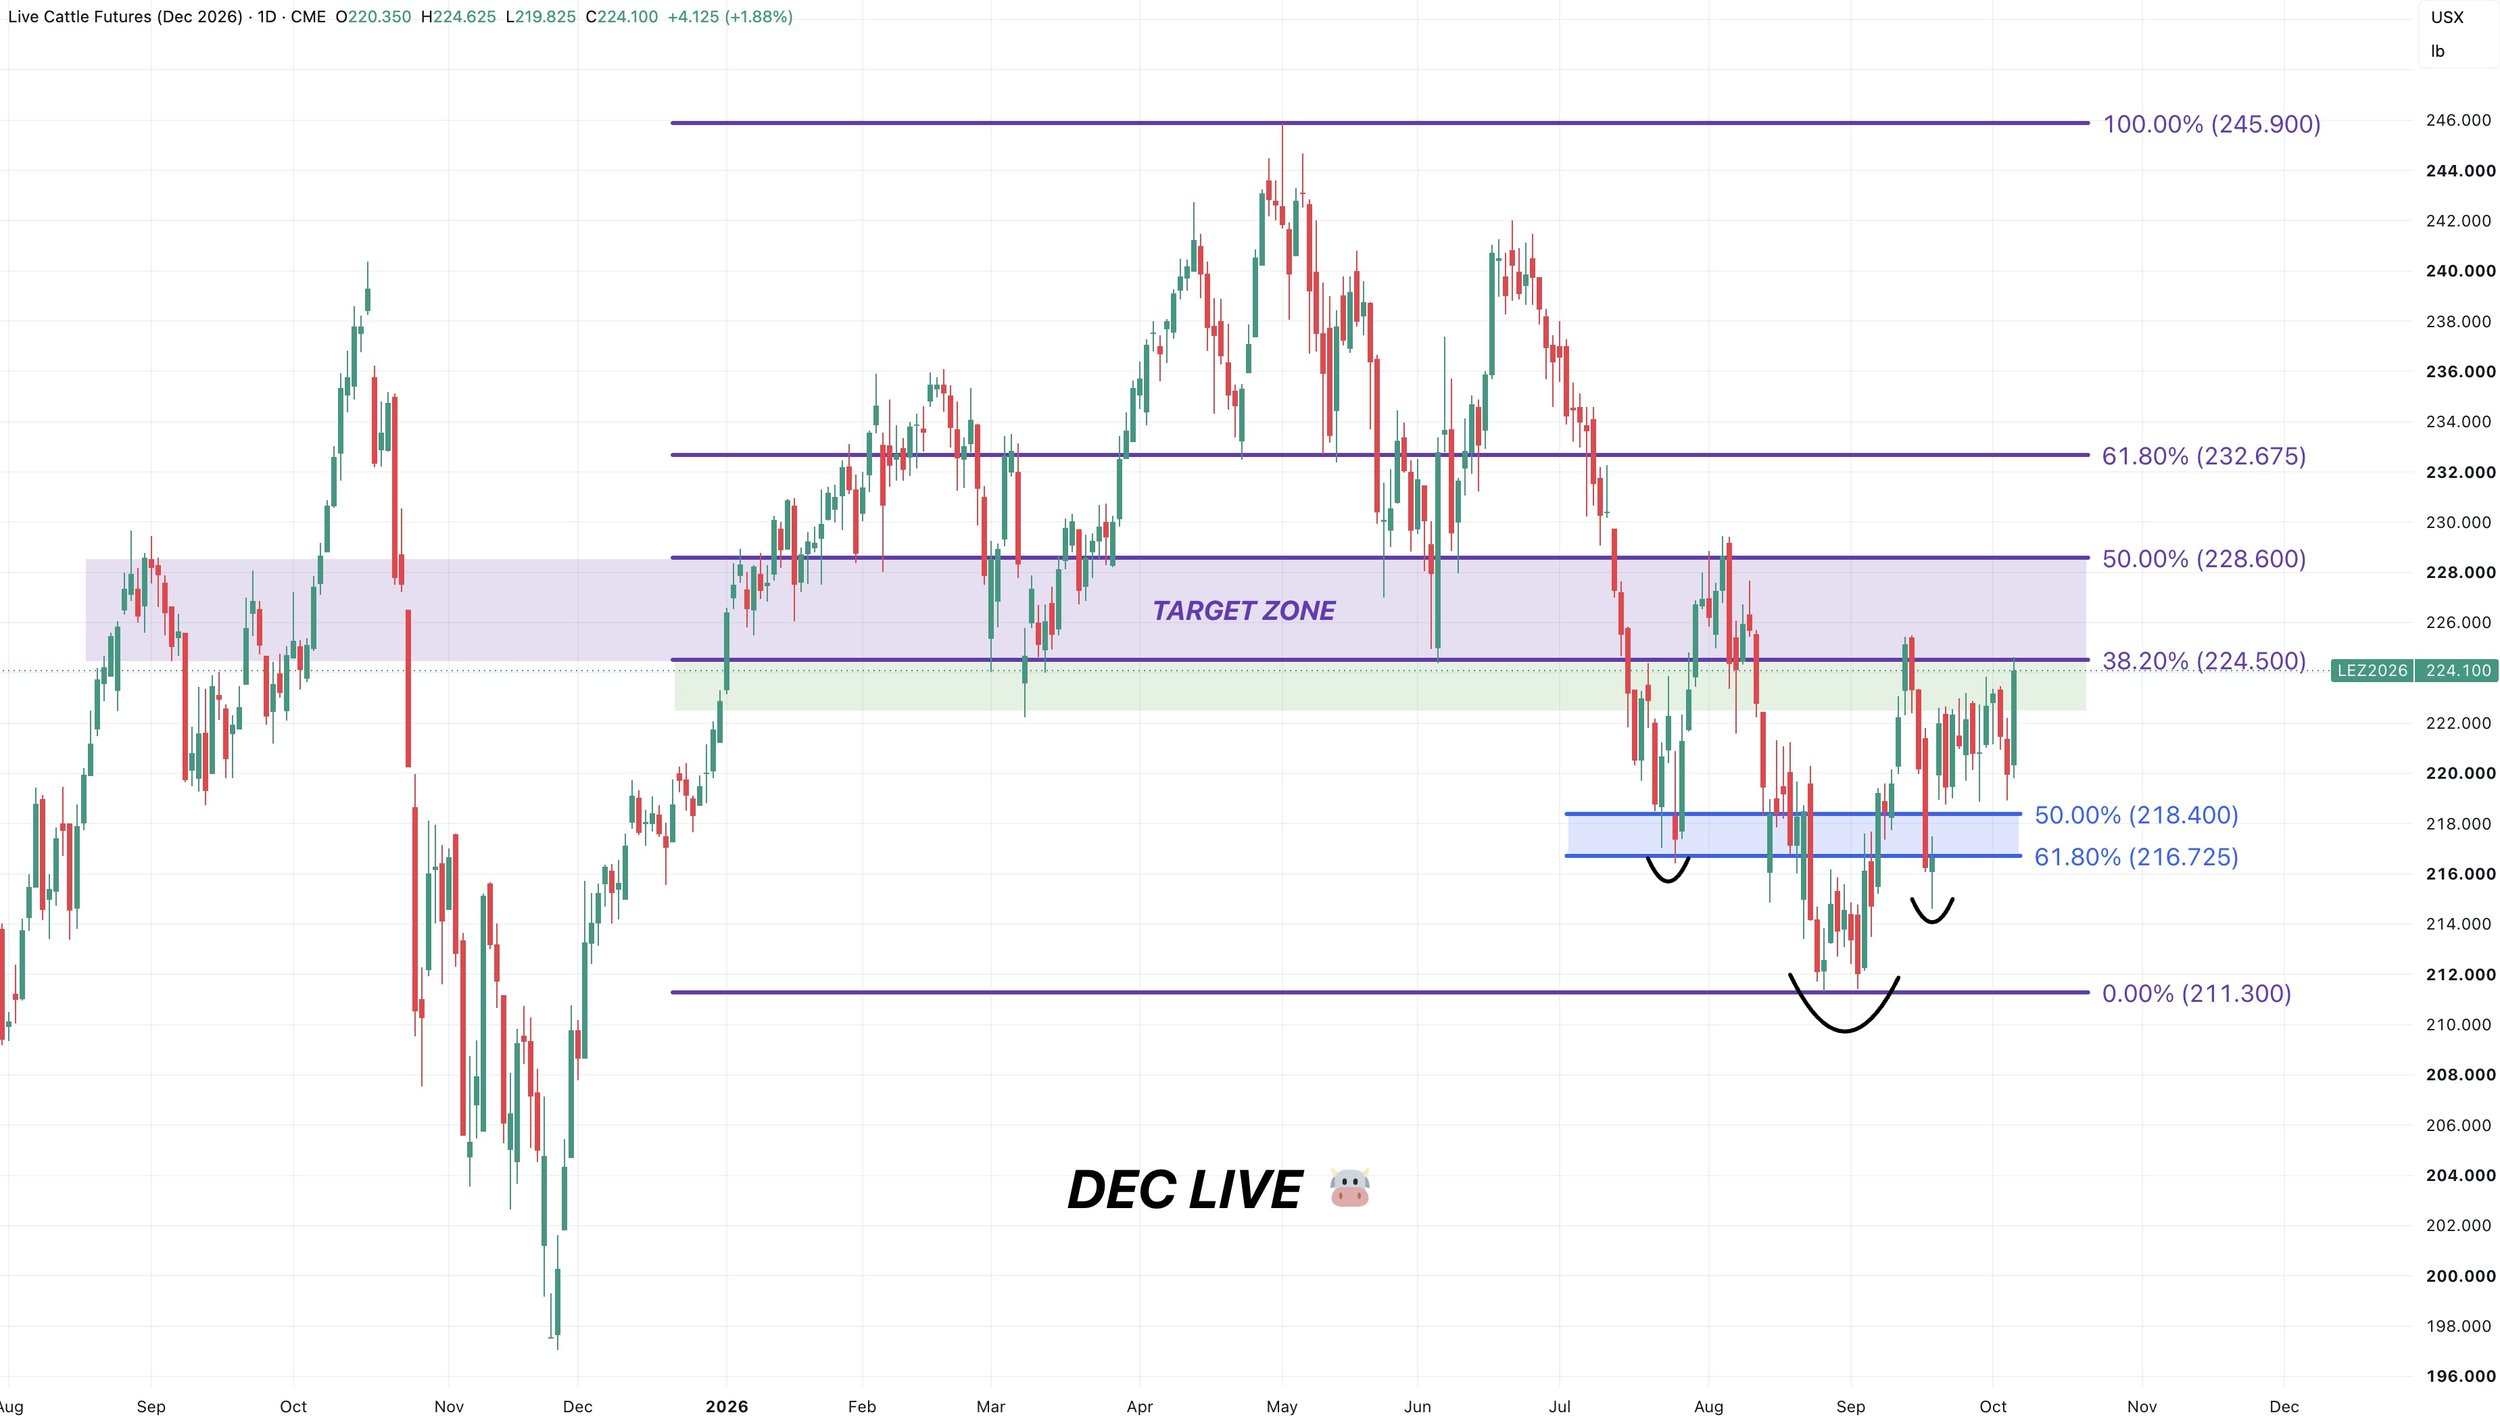
We haven’t broke out like we have in feeders.
Live cattle is still struggling to break resistance.
Right now we are battling the 38.2% retracement up to the May highs.
If we can break above, we can target the 50% level.
Between this 38.2% level and the 50% level is where I would look to be managing some risk.
Where as the levels in feeders is the 50% to 61.8% level given how much stronger they are in comparison.
Want to Talk?
Our phones are open 24/7 for you guys if you ever need anything or want to discuss your operation.
Jeremey & Office: (806)484-1214
Sebastian: (605)280-1186
Email: sfrost@dailymarketminute.com
Hedge Account
Interested in a hedge account? Use the link below to set up an account or give us a call.