
GRAINS CONTINUE RALLY
MARKET UPDATE
You can scroll to read the usual update as well. As the written version is the exact same as the video.
Timestamps for video:
China & Weather: 0:00min
Yield Impacts: 5:15min
Corn: 8:00min
Corn Targets: 10:10min
Beans: 12:55min
Wheat: 15:30min
Cattle: 16:40min
Want to talk?
Office: (806)484-1214
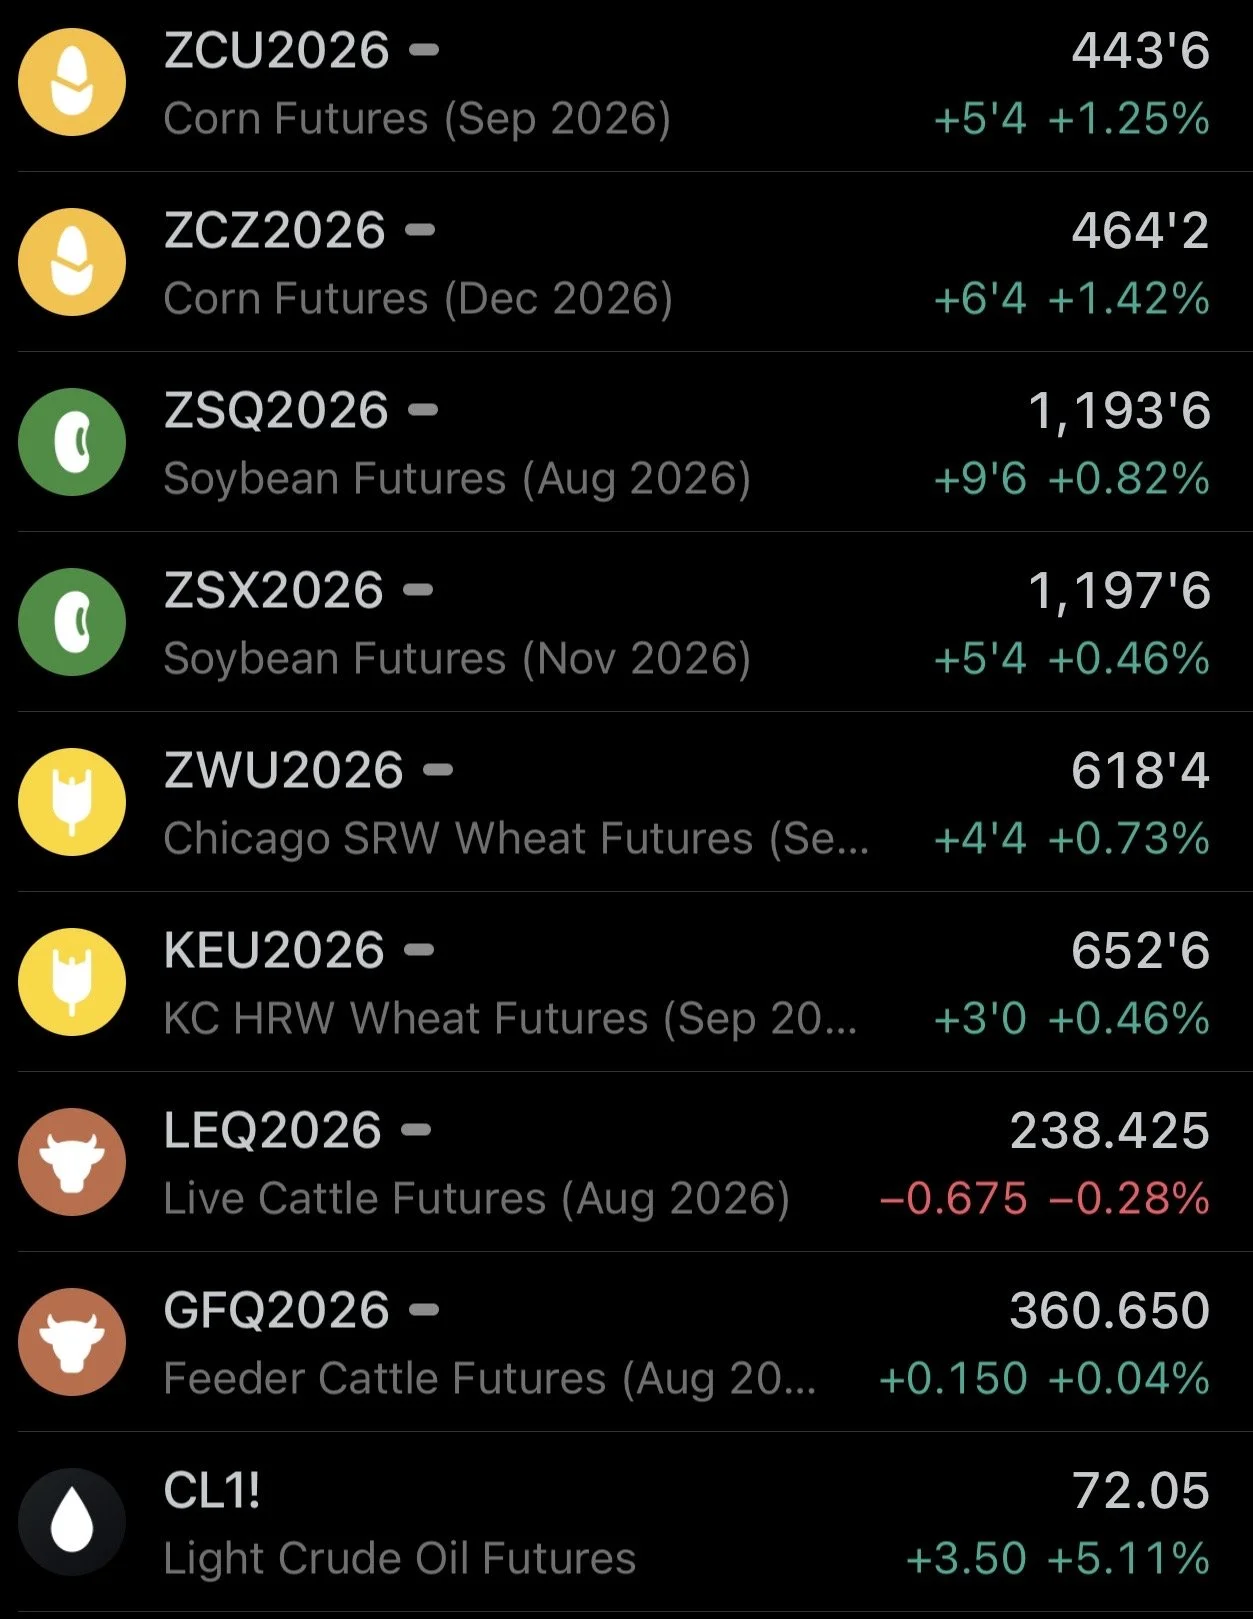
Futures Prices Close
Overview
Grains continue their recent run.
Soybeans are 80 to 90 cents off their lows from last week.
Corn is nearly 40 cents off it's lows from last week.
Meanwhile cattle has been lower 6 days in a row.
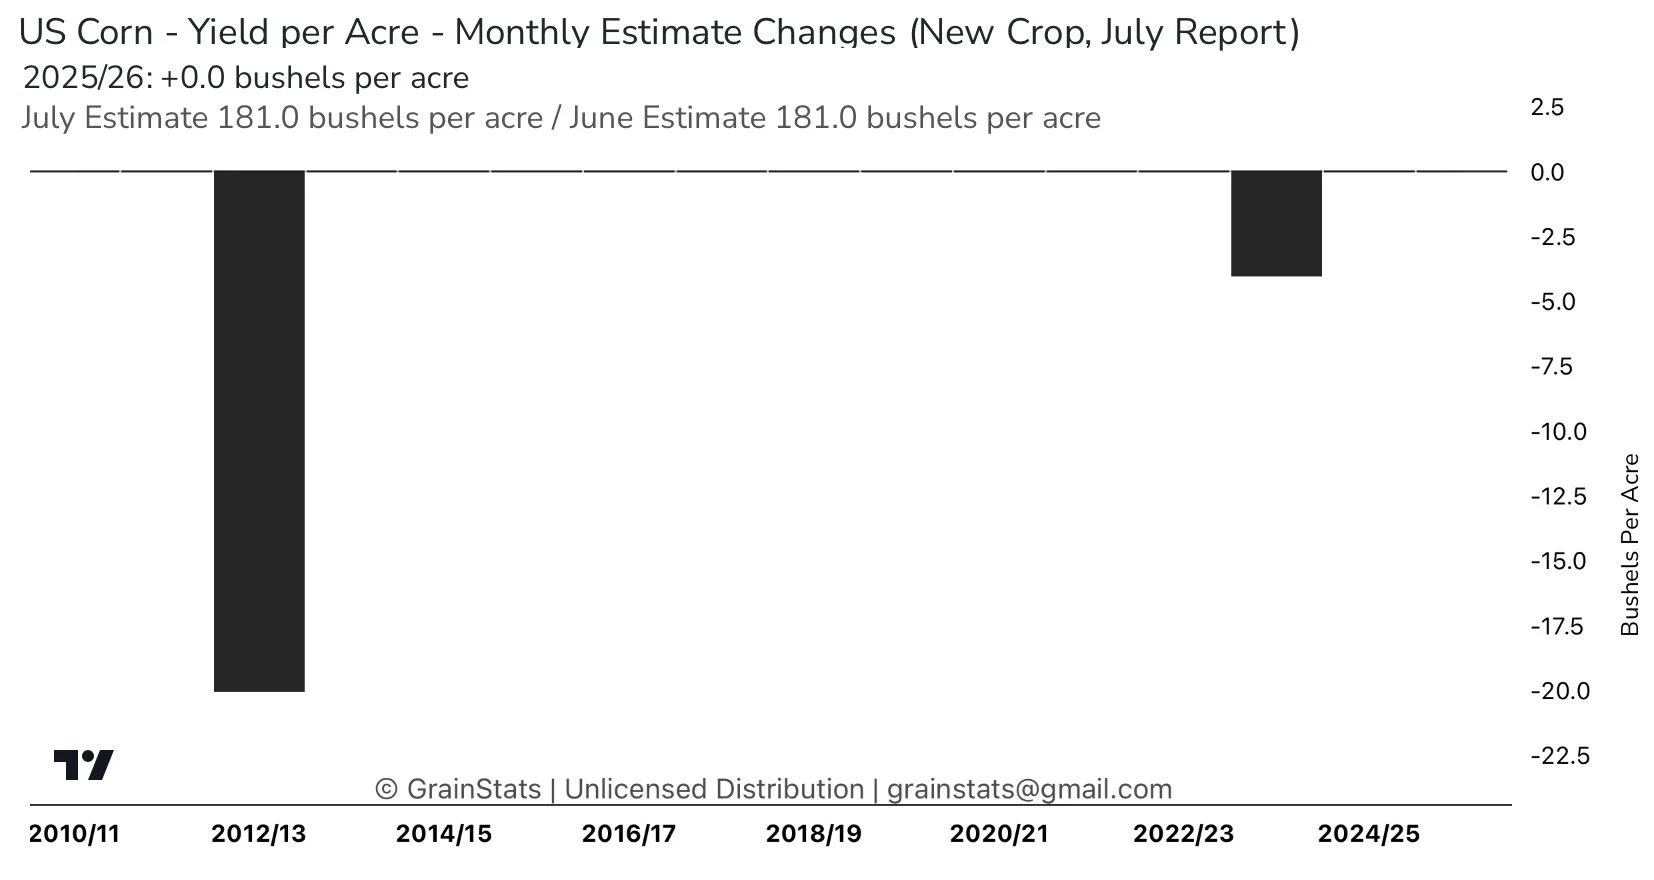
I wanted to mention that we do have the July WASDE out on Friday. But the USDA never lowers yield unless we run into some severe issues.
The last time we saw a yield change in July was 2023 and 2012.
So the market isn’t looking for massive changes, although we will get the updated balance sheets with the acre changes and the 100 million change from the stocks report in corn.
Past July Yield Changes (Chart Credit @GrainStats)
Why the rally in grains?
Part of the reason is of course the weather, which we'll get into.
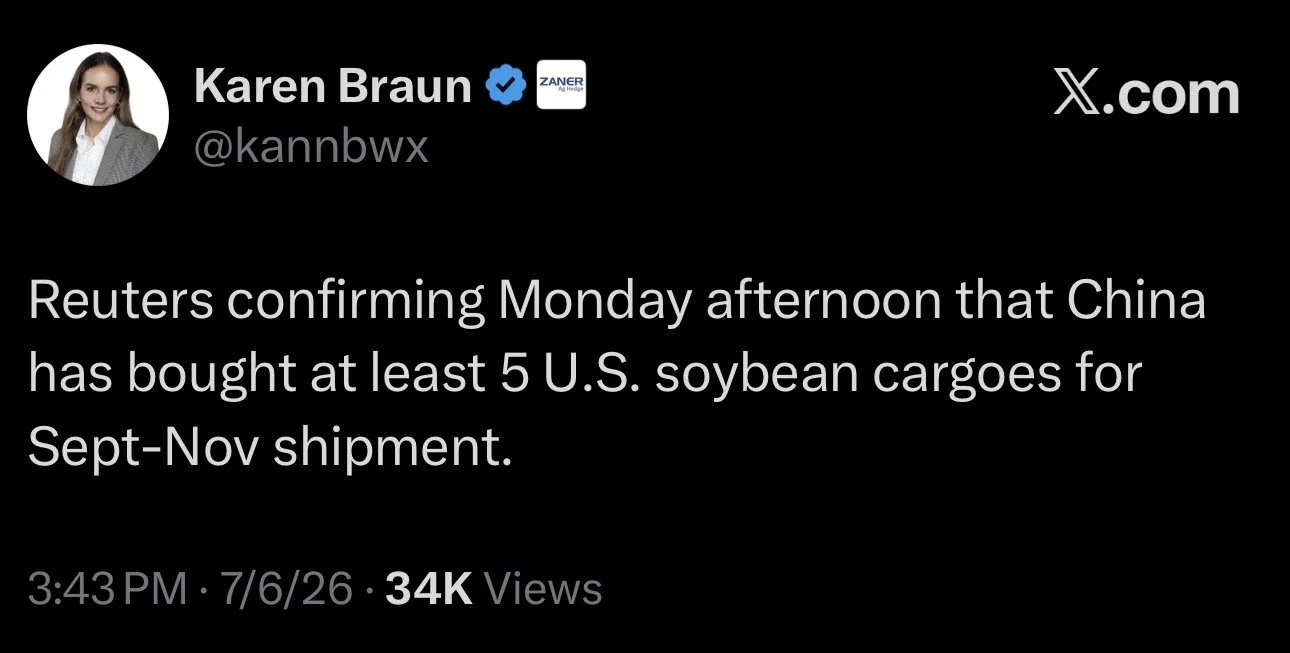
The other big reason is China. There were rumors that China was buying soybeans.
Then yesterday after the markets closed, we received confirmation that China had indeed bought soybeans. Buying 300k MT.
So the market knew before hand.
Weather alone wasn’t enough to rally soybeans like they did yesterday. The rally in soybeans was likely more due to the China news.
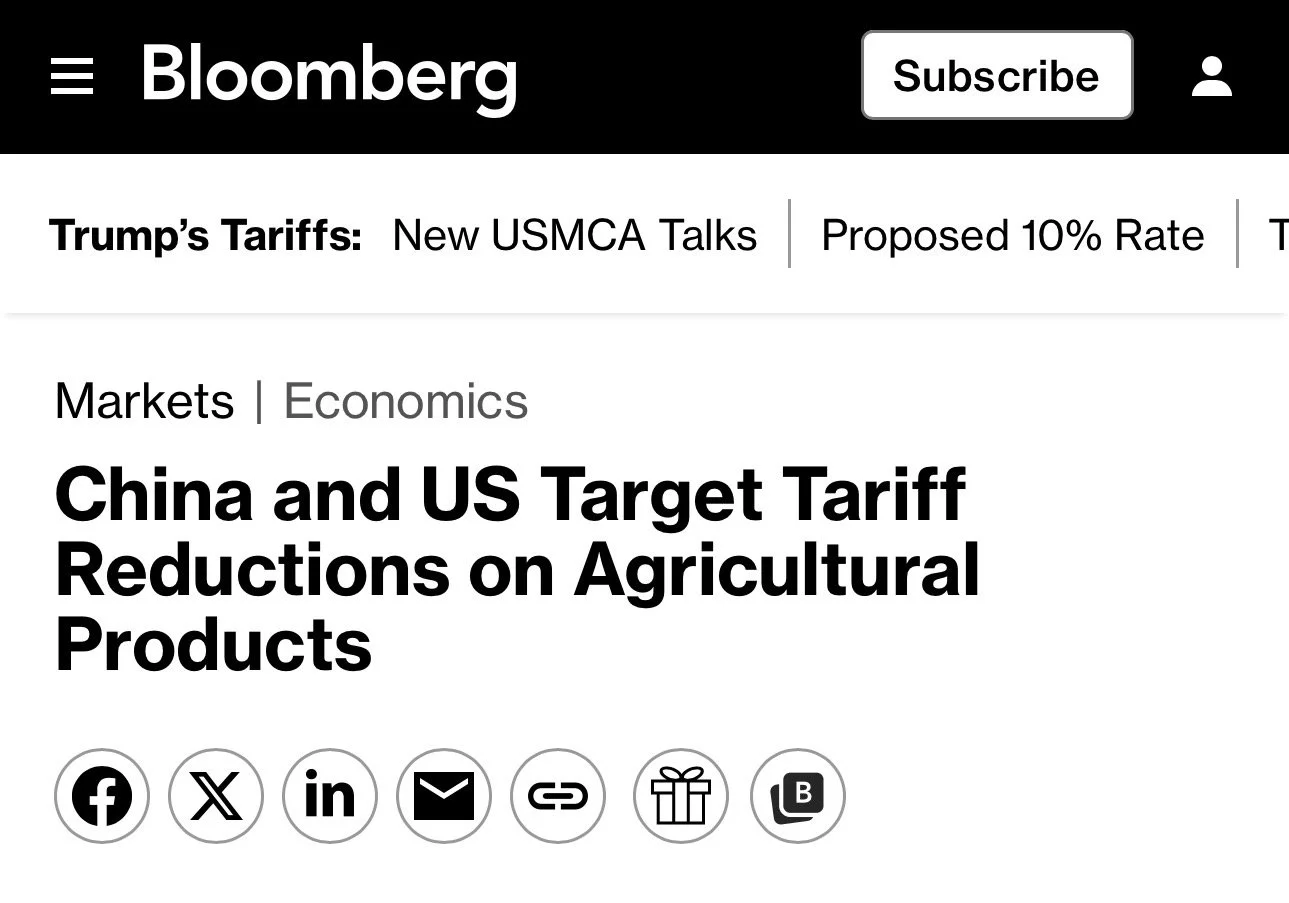
We also saw the US and China agree to some terms on agricultural trade.
Which included an agreement to drop the tariffs on ag products.
This is a positive because it helps make us more completive and overall strengthens the US and China relations.
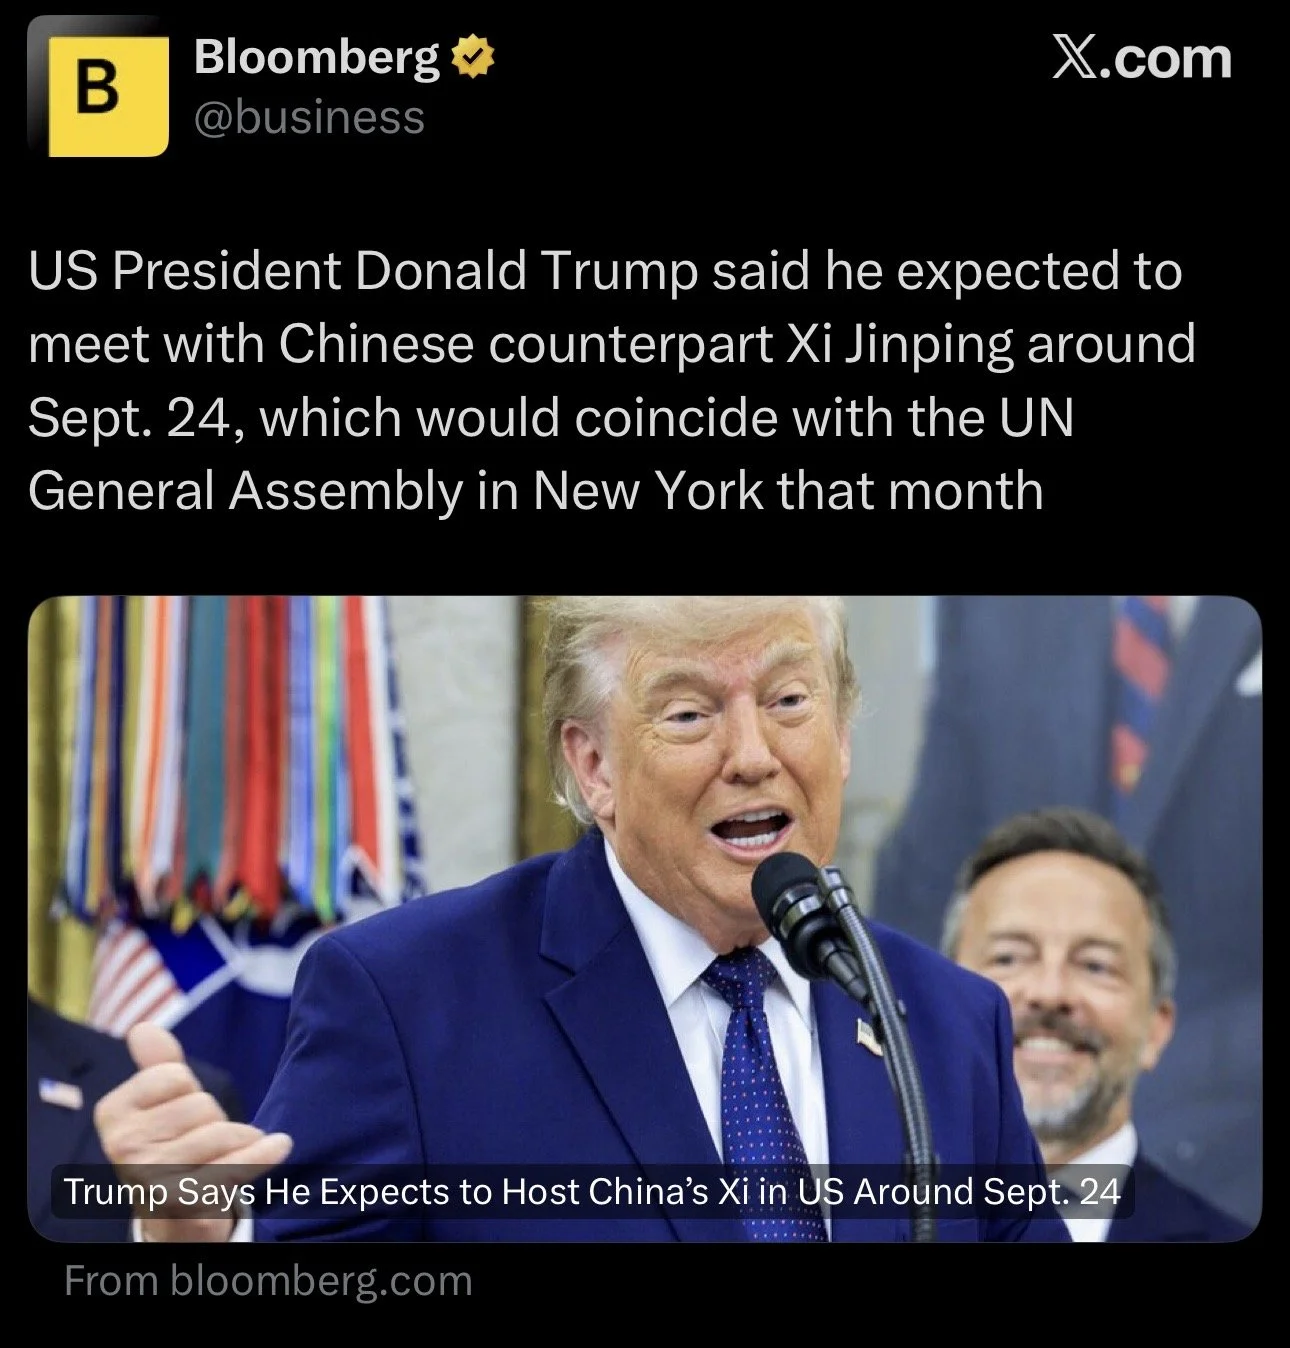
Trump and China are scheduled to meet again on September 24th.
Which aligns with when you'd expect China to start to step in heavier and buy grain. Right around harvest time. Which is when it would logically make the most sense for China to buy corn if they are going to.
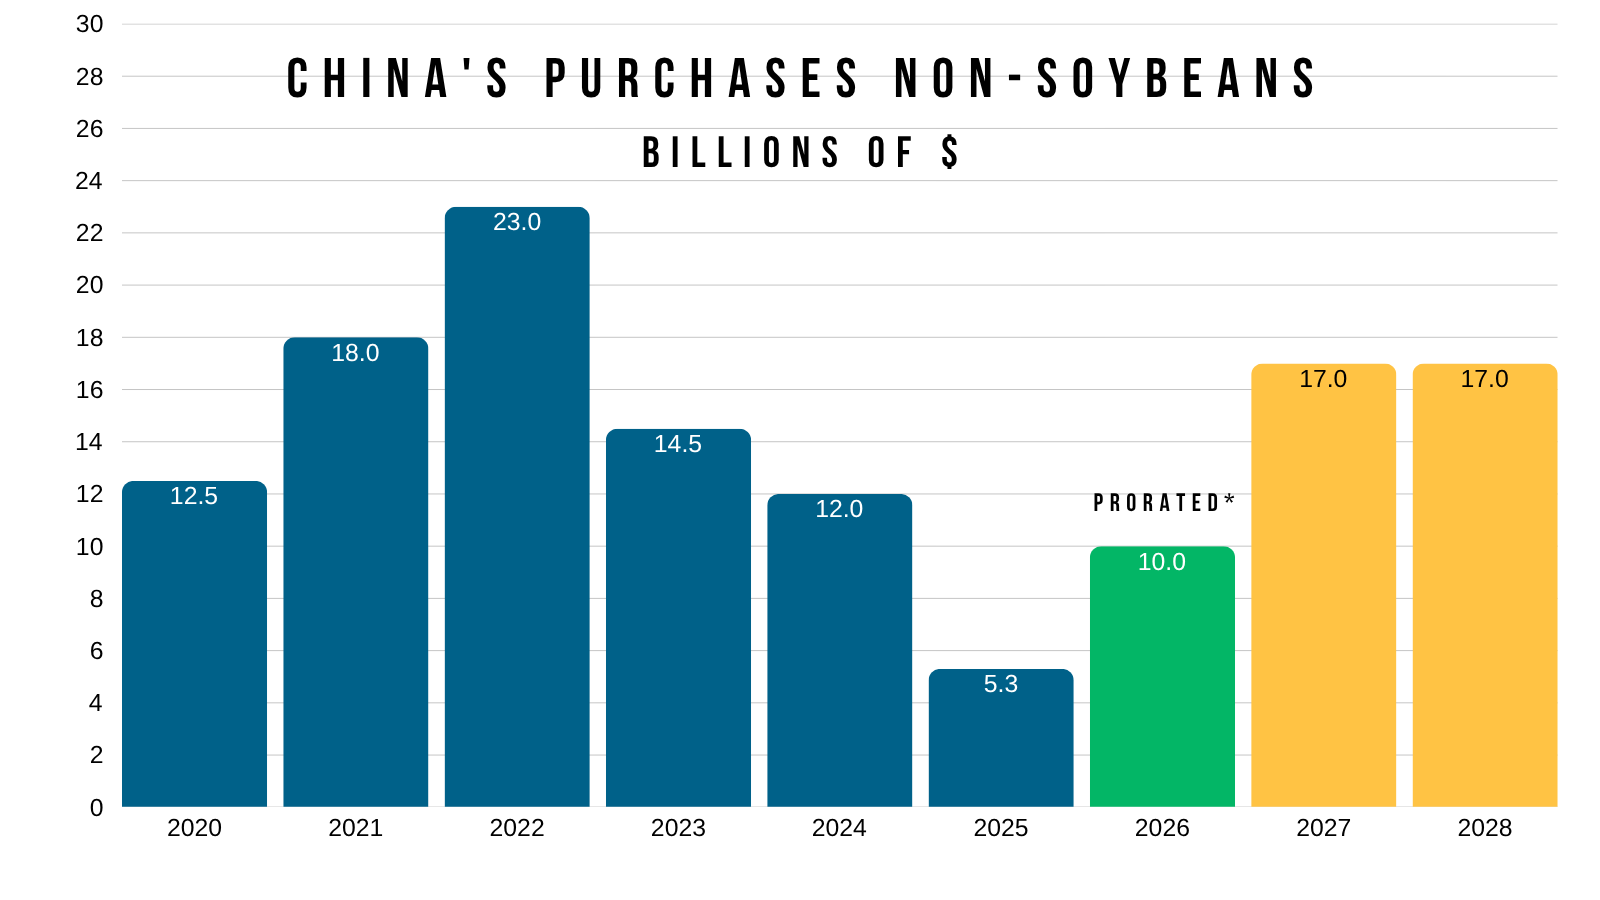
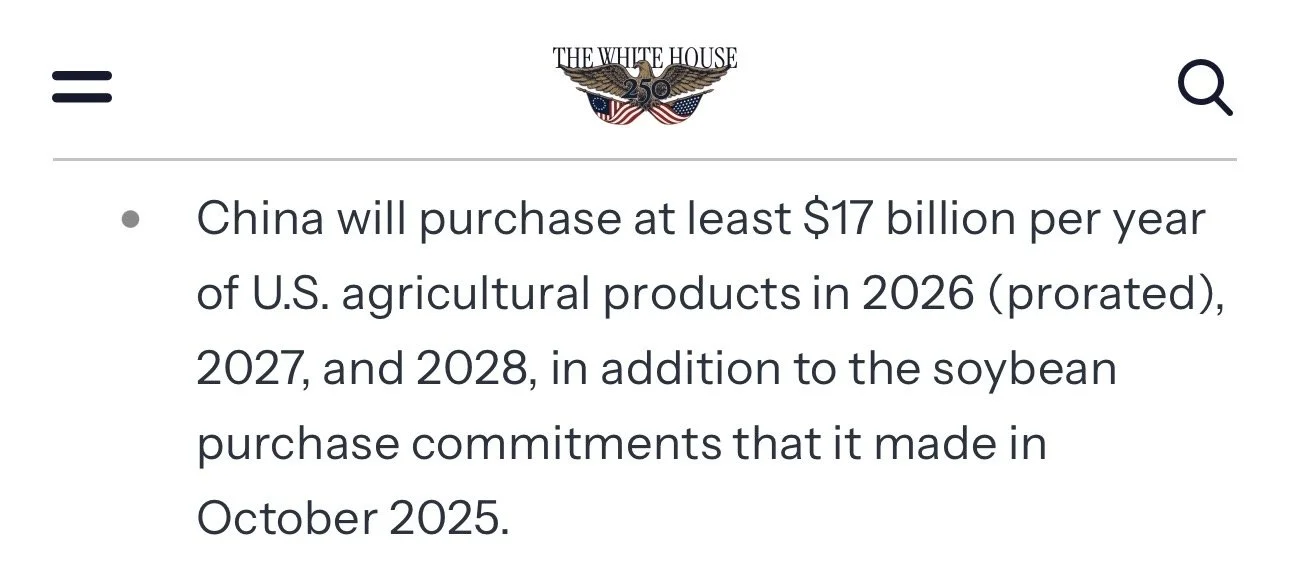
I'm still confident China ends up buying corn eventually. I don’t know how else they'd fulfull that entire $17 billion of non-soybean ag purchases without any corn at all.
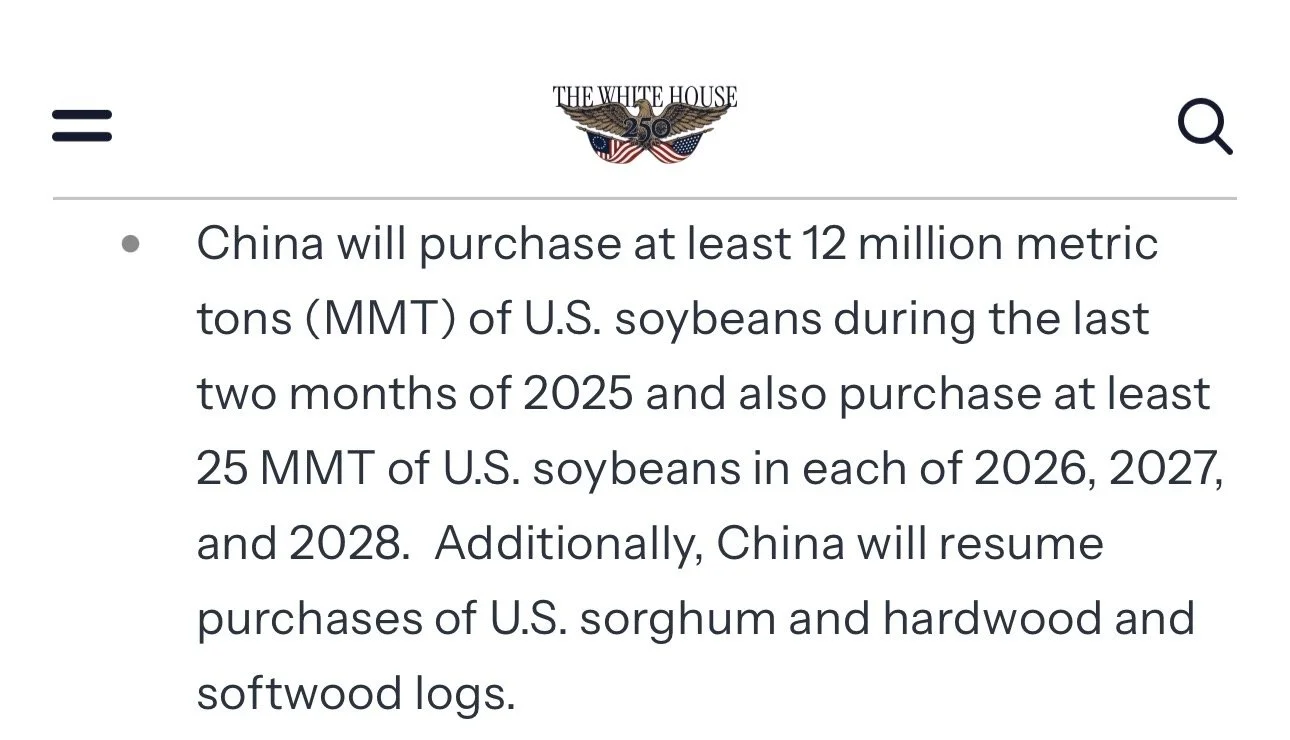
I also still think China stays true to their word when it comes to the 25 MMT of new crop soybean purchases.
They have fulfilled every statement that was made on the White House fact sheet.
The only thing they failed to do was buy that extra 8 MMT of old crop that Trump said they would earlier this year. But that was never included in the fact sheet. So it didn’t happen.
From May
From November
The other reason for the rally is weather.
Here is what the forecasts are saying.
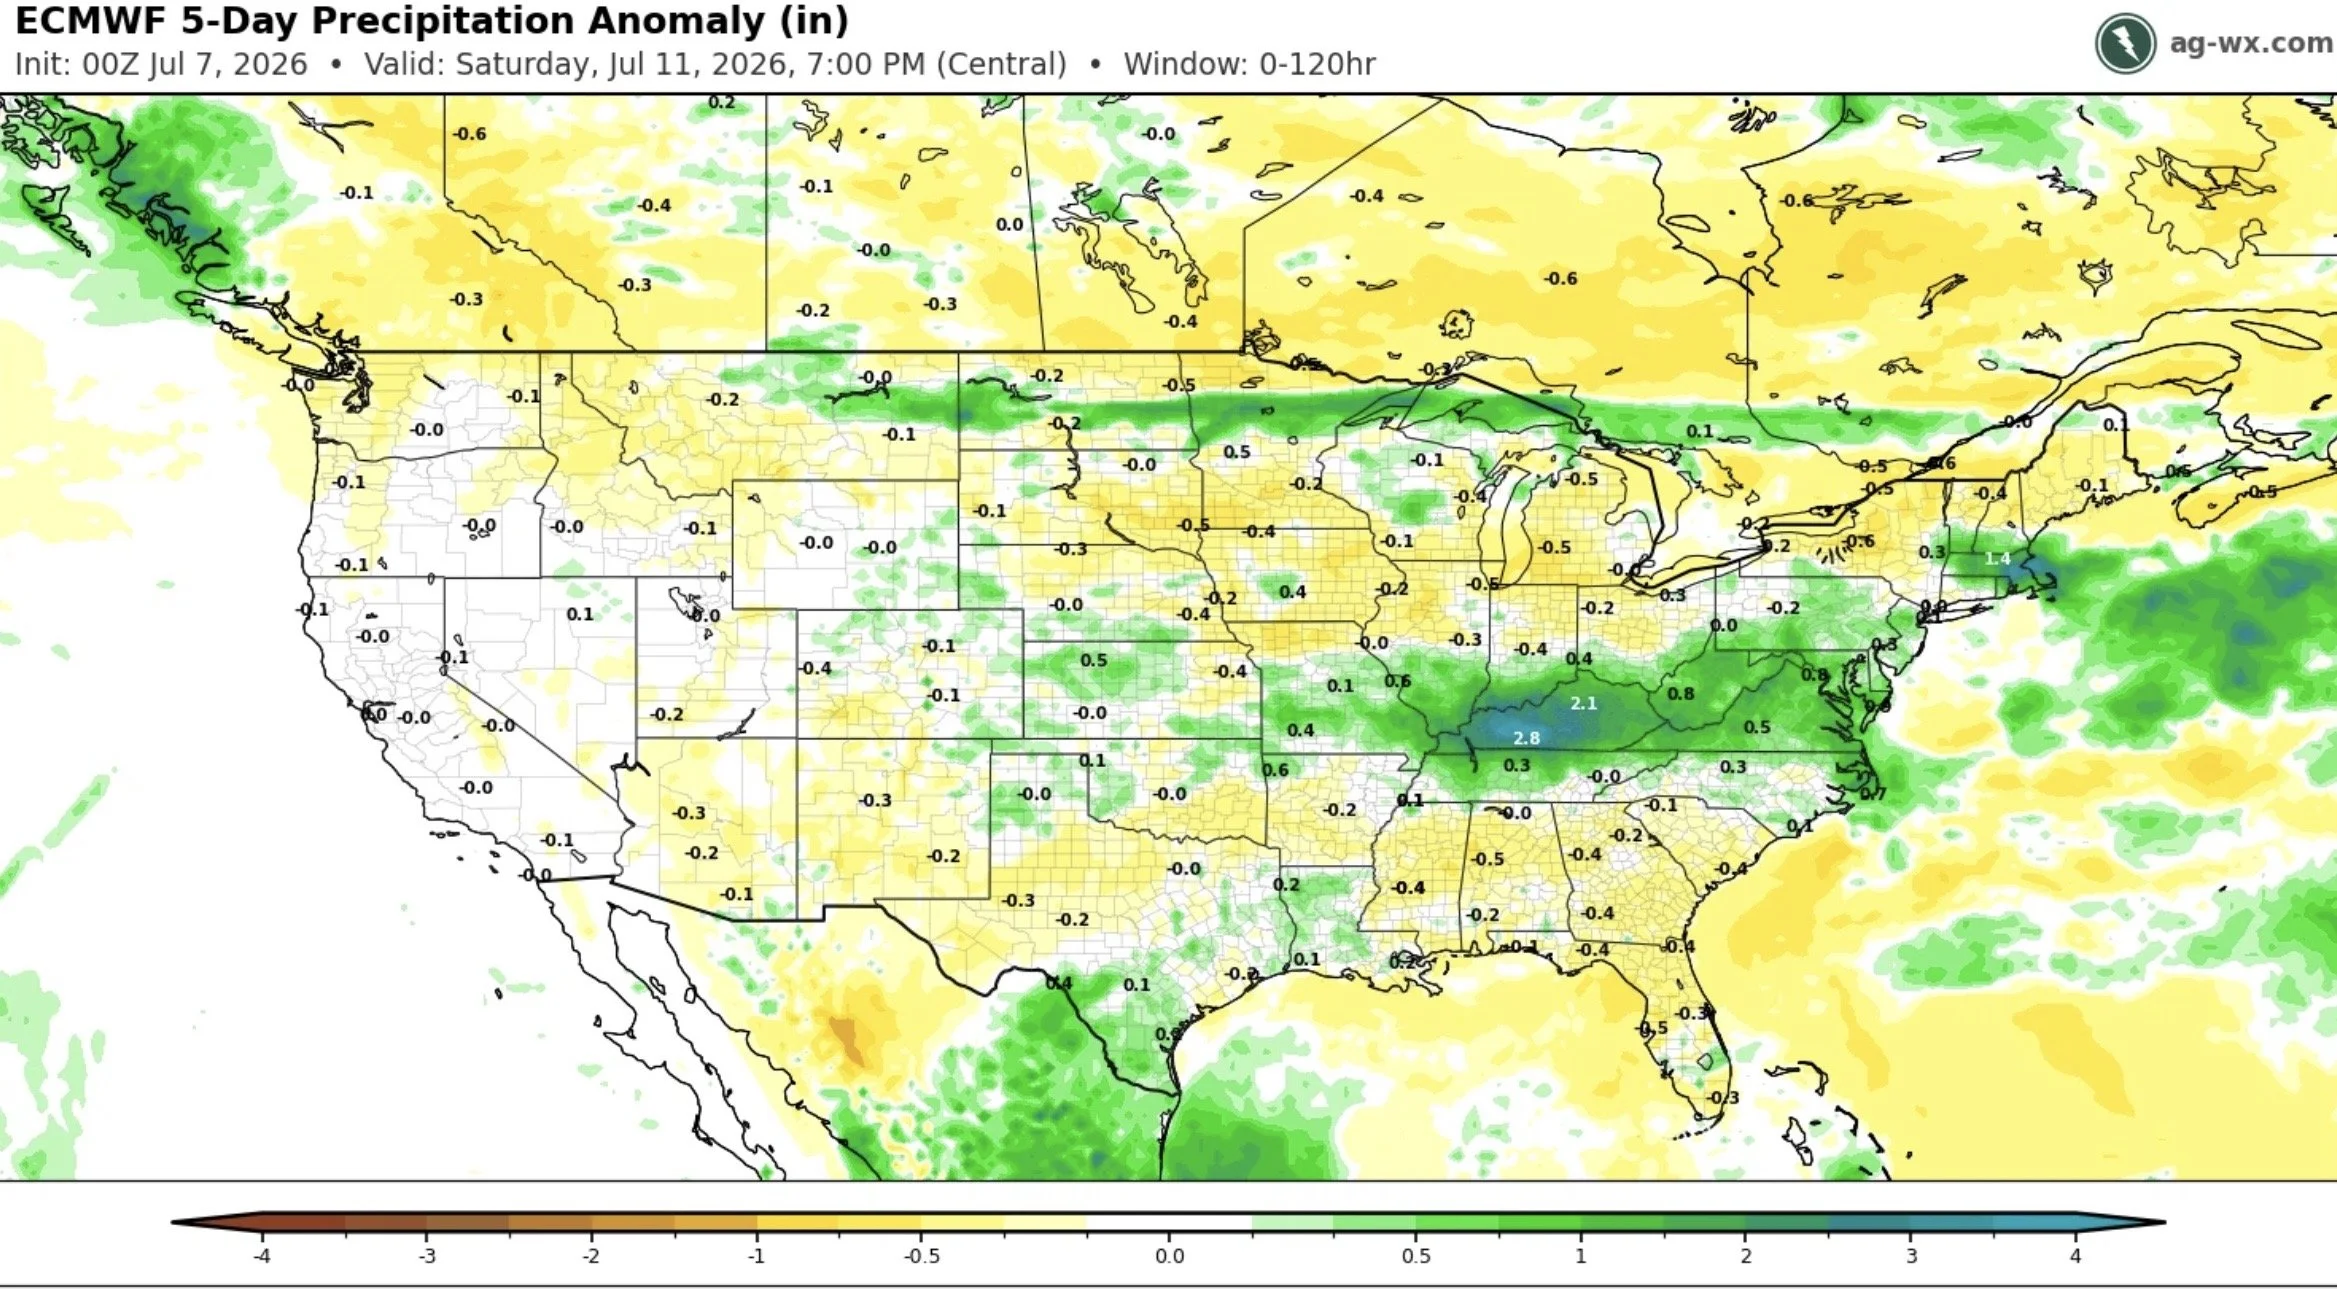
First let's look at precip.
The next 5 days are on the dry side for some of the central corn belt and I-states, with rain confined to the south.
This anomonly goes to July 11th.
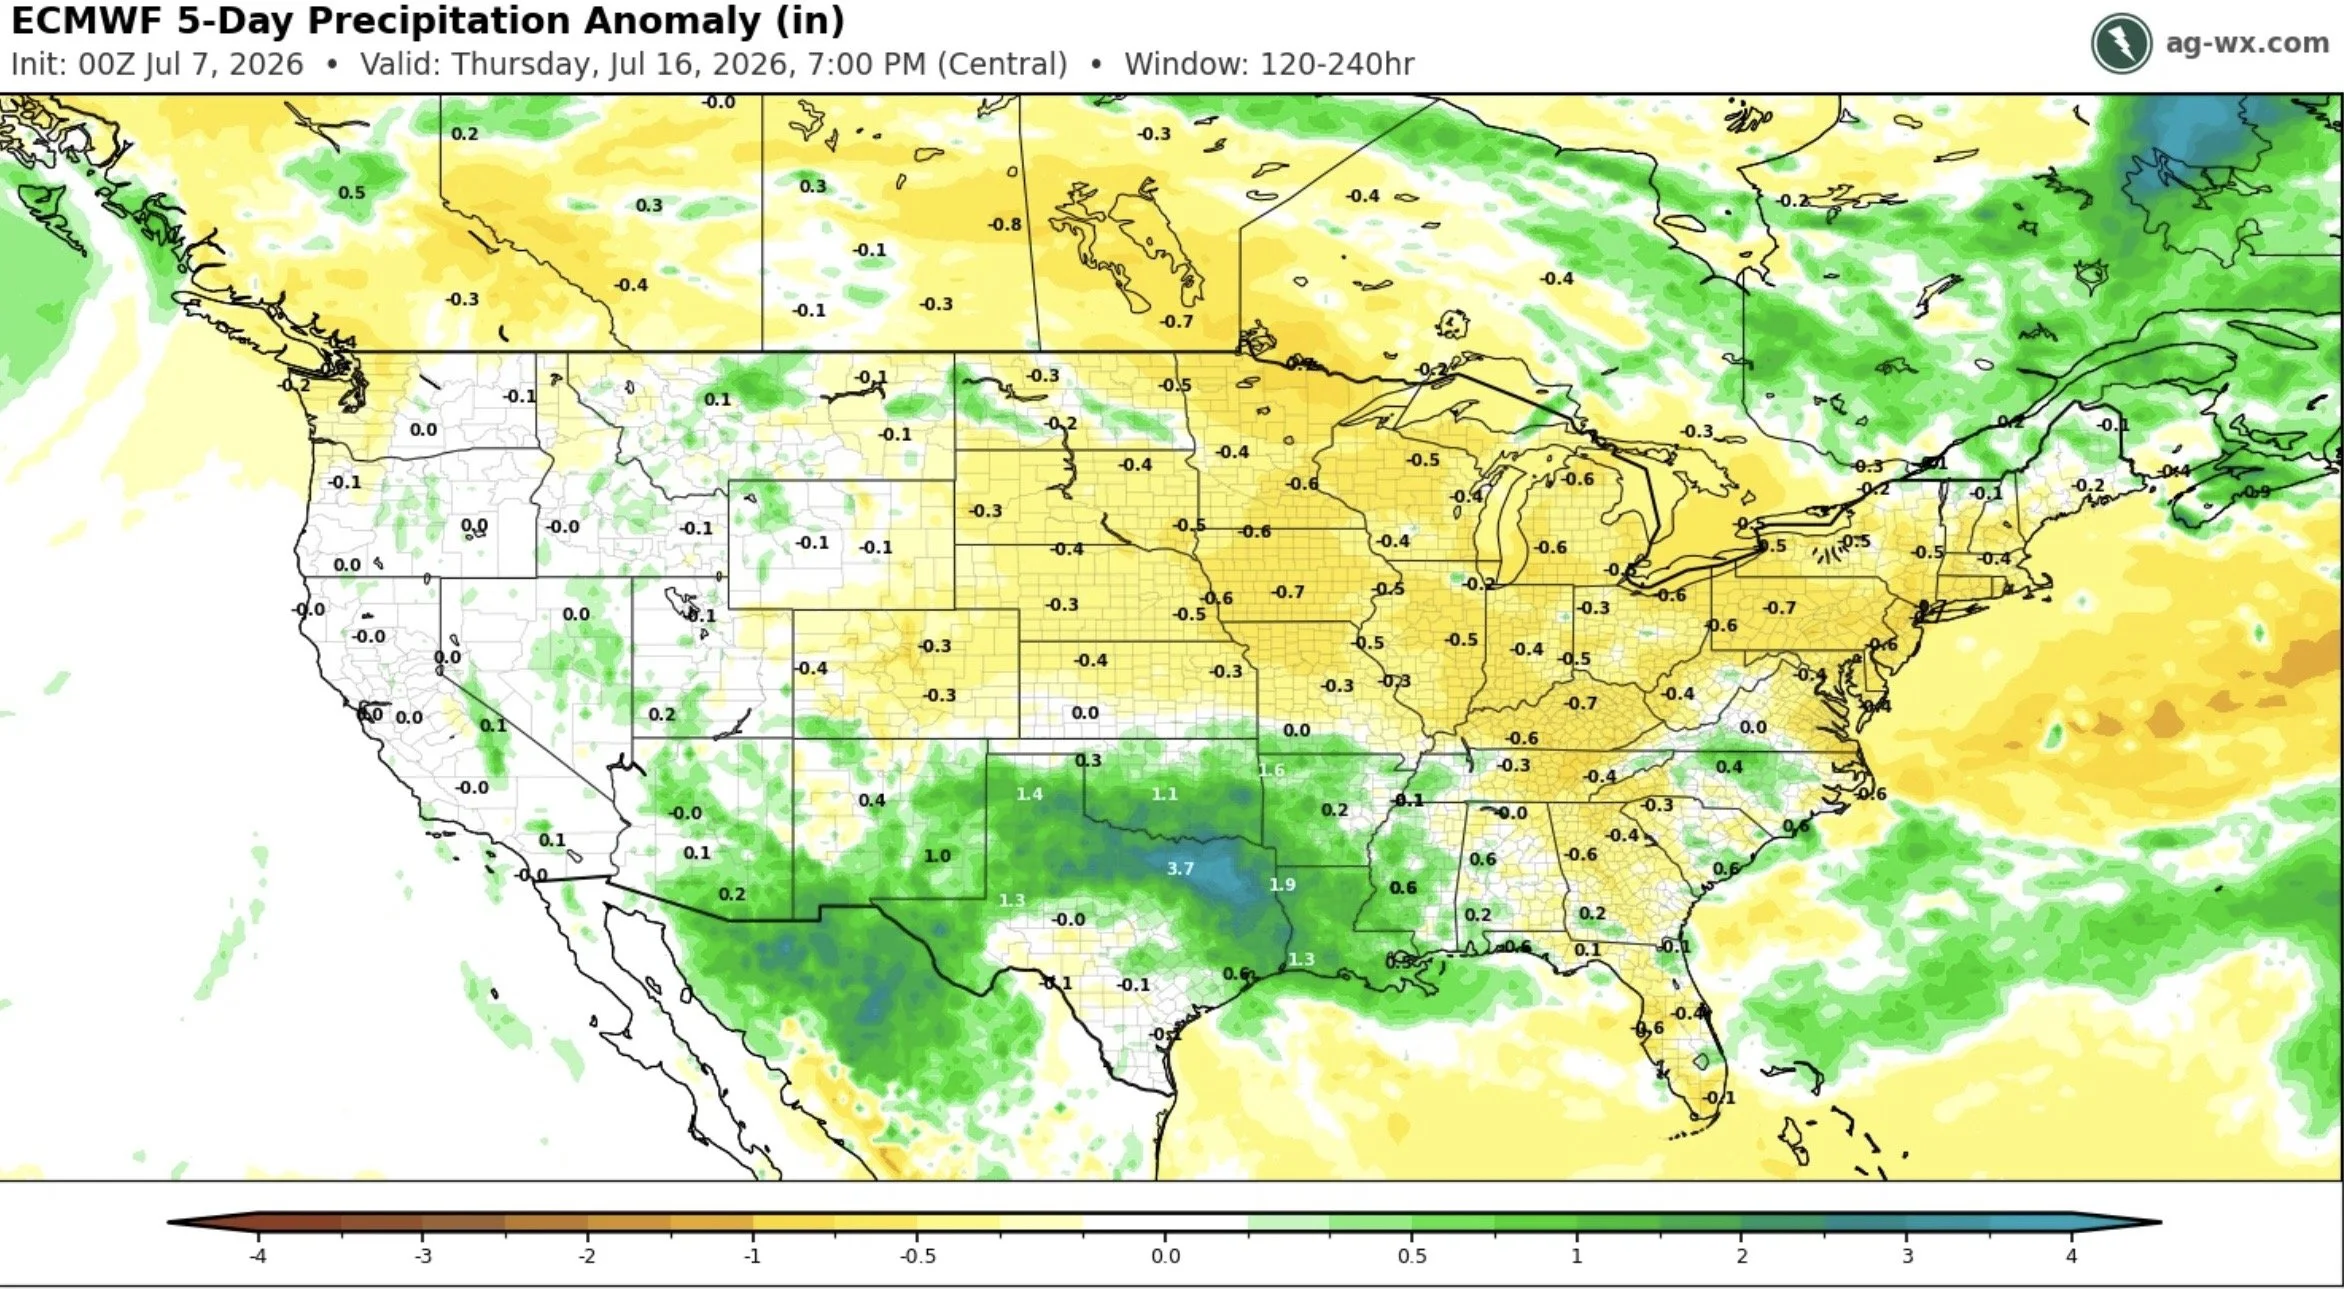
If we keep going, here is the outlook from July 11th to July 16th.
This outlook is 5 to 10 days out.
It's pretty dry across the entire corn belt.
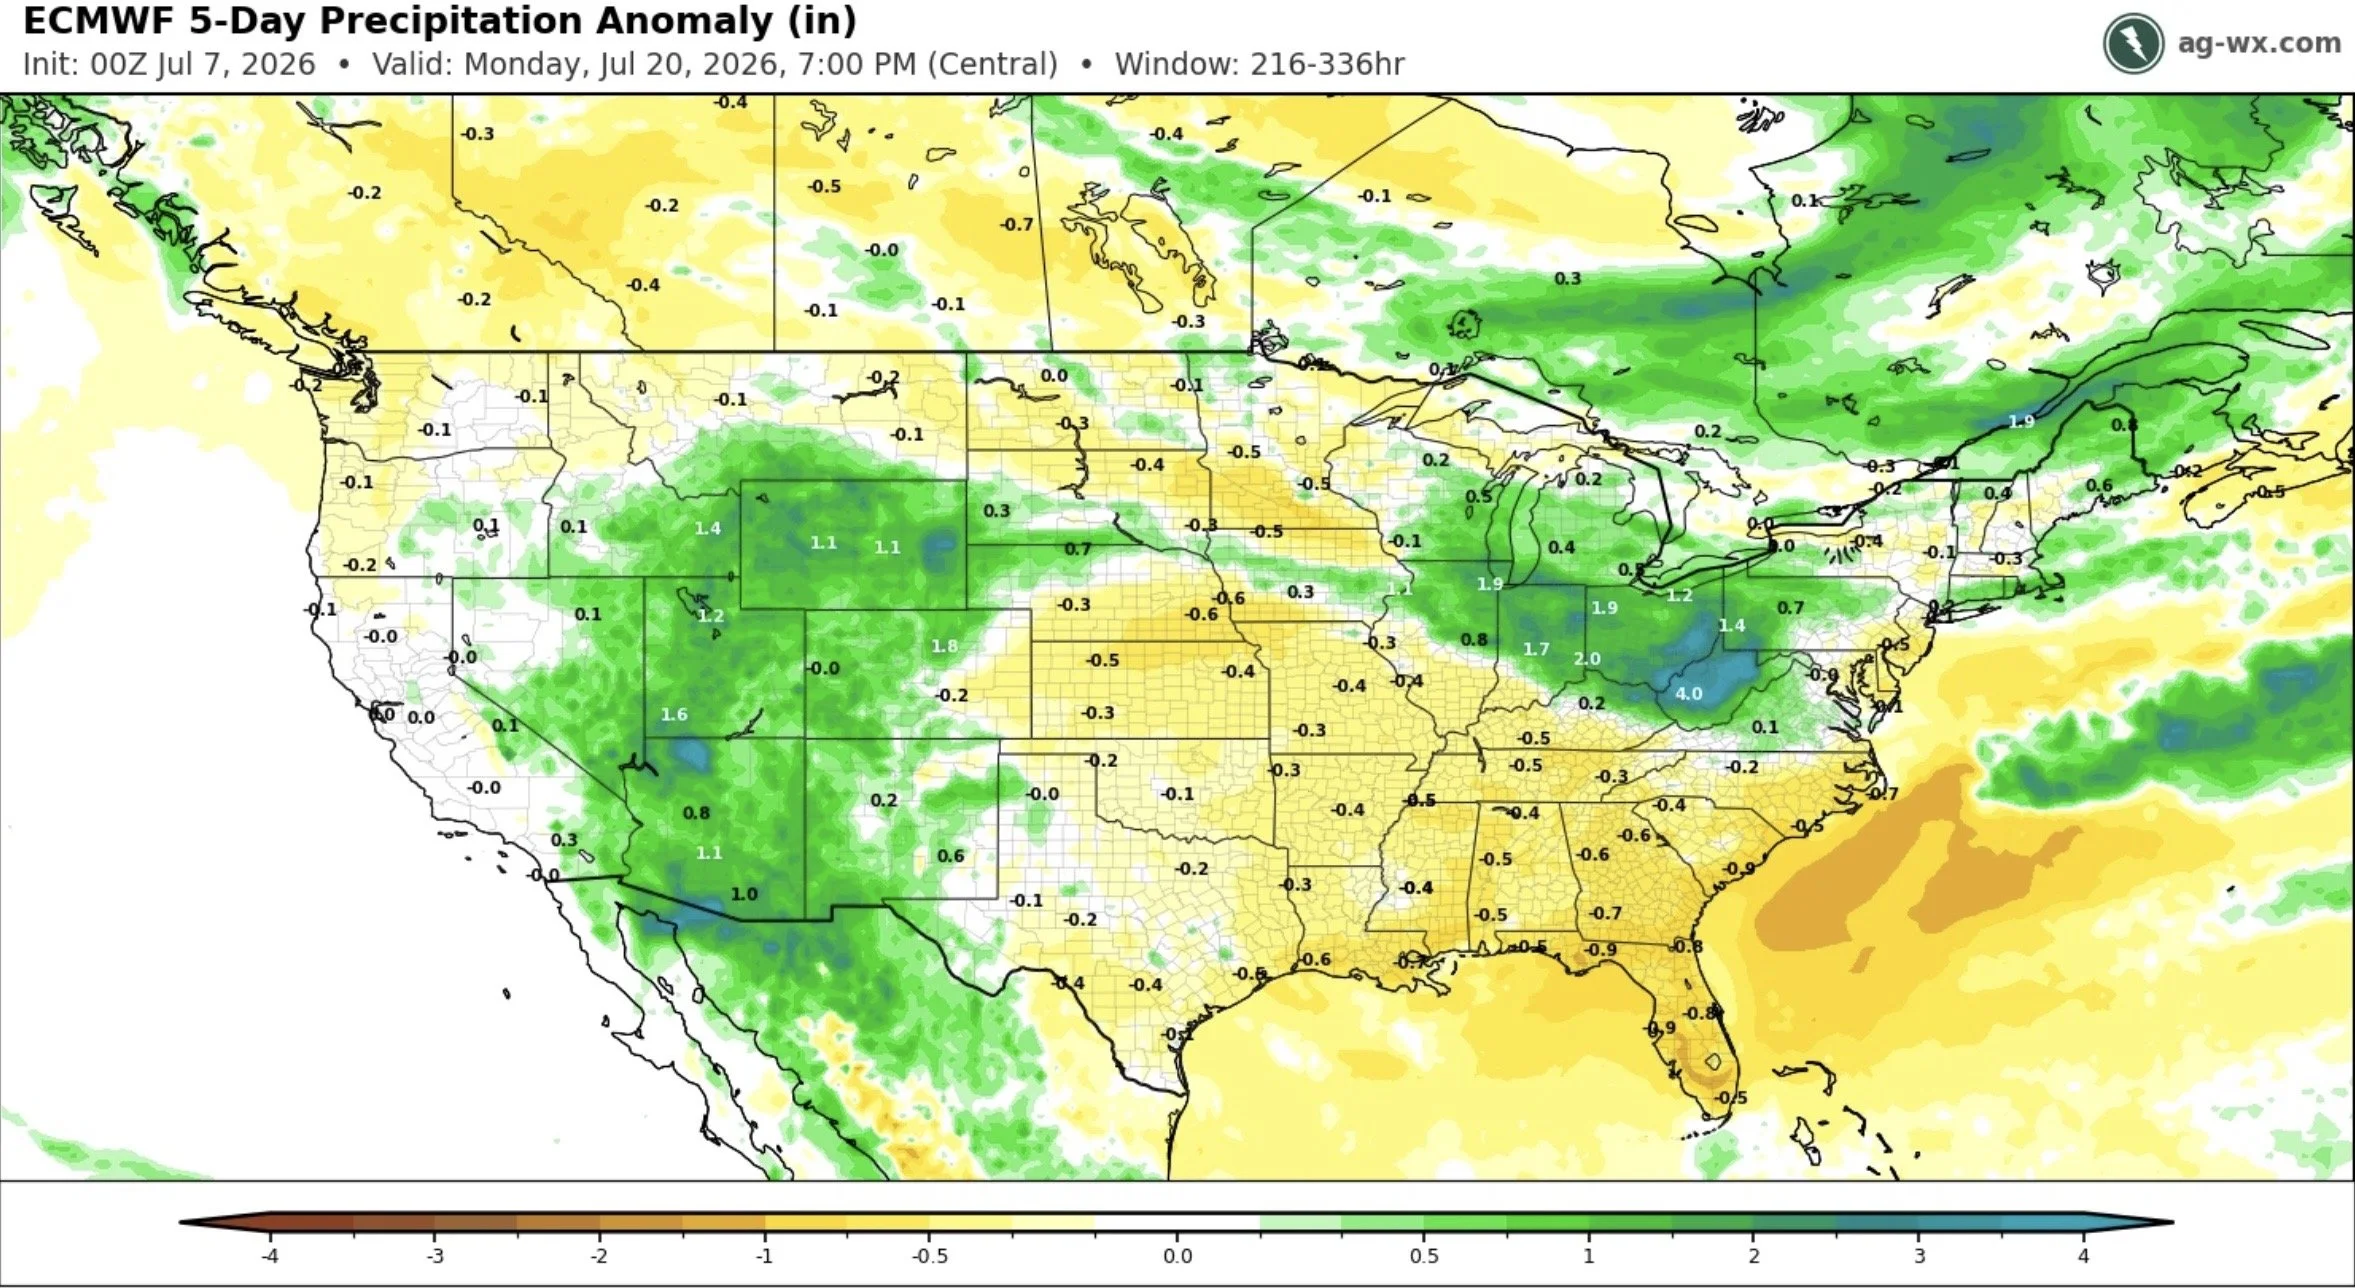
Here is the outlook from July 15th to July 20th.
This outlook is 9 to 14 days out.
We do eventually see some rain start to pop back up towards the middle to end of the month.
But it looks like it might dry out here for a week or two.
The bigger deal might not even be the lack of rain for a week or two, given a lot of growing regions have seen plenty of rain.
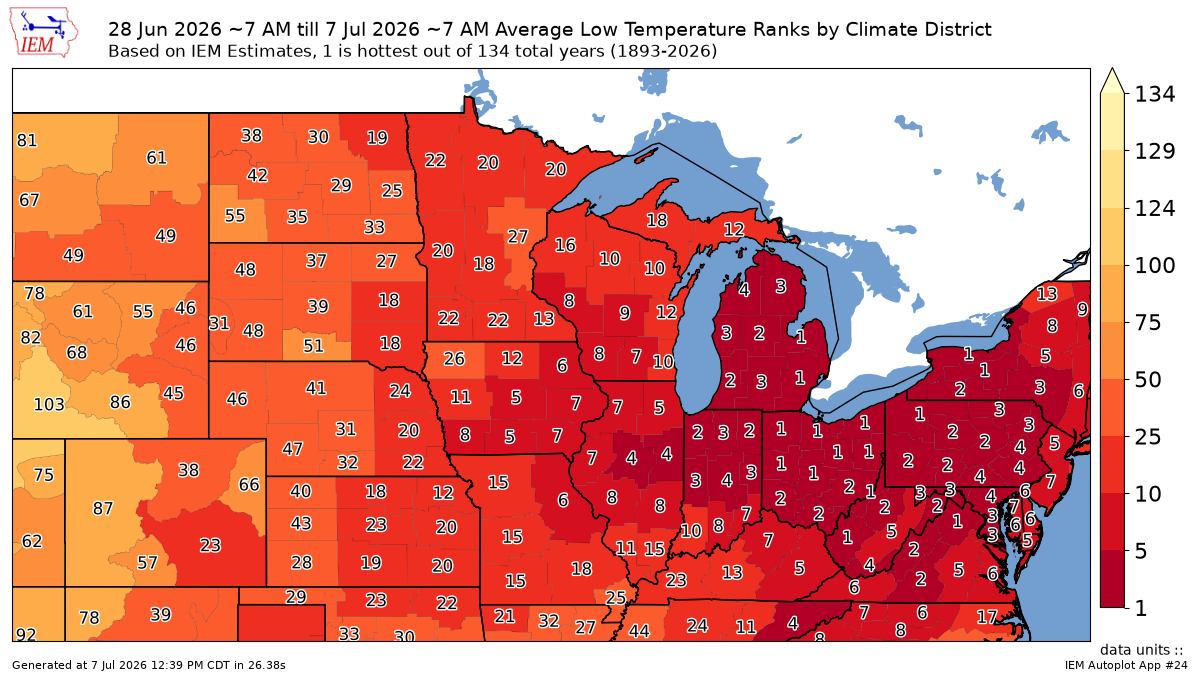
The issue is the heat. Especially the nighttime heat.
Below is the nighttime temp rankings for the last 10 days.
There are several areas that just saw their hottest nightime temps ever.
That can’t be ideal for yield.
Here are what the forecasts are saying when it comes to heat.
The next 5-days don’t look crazy hot.
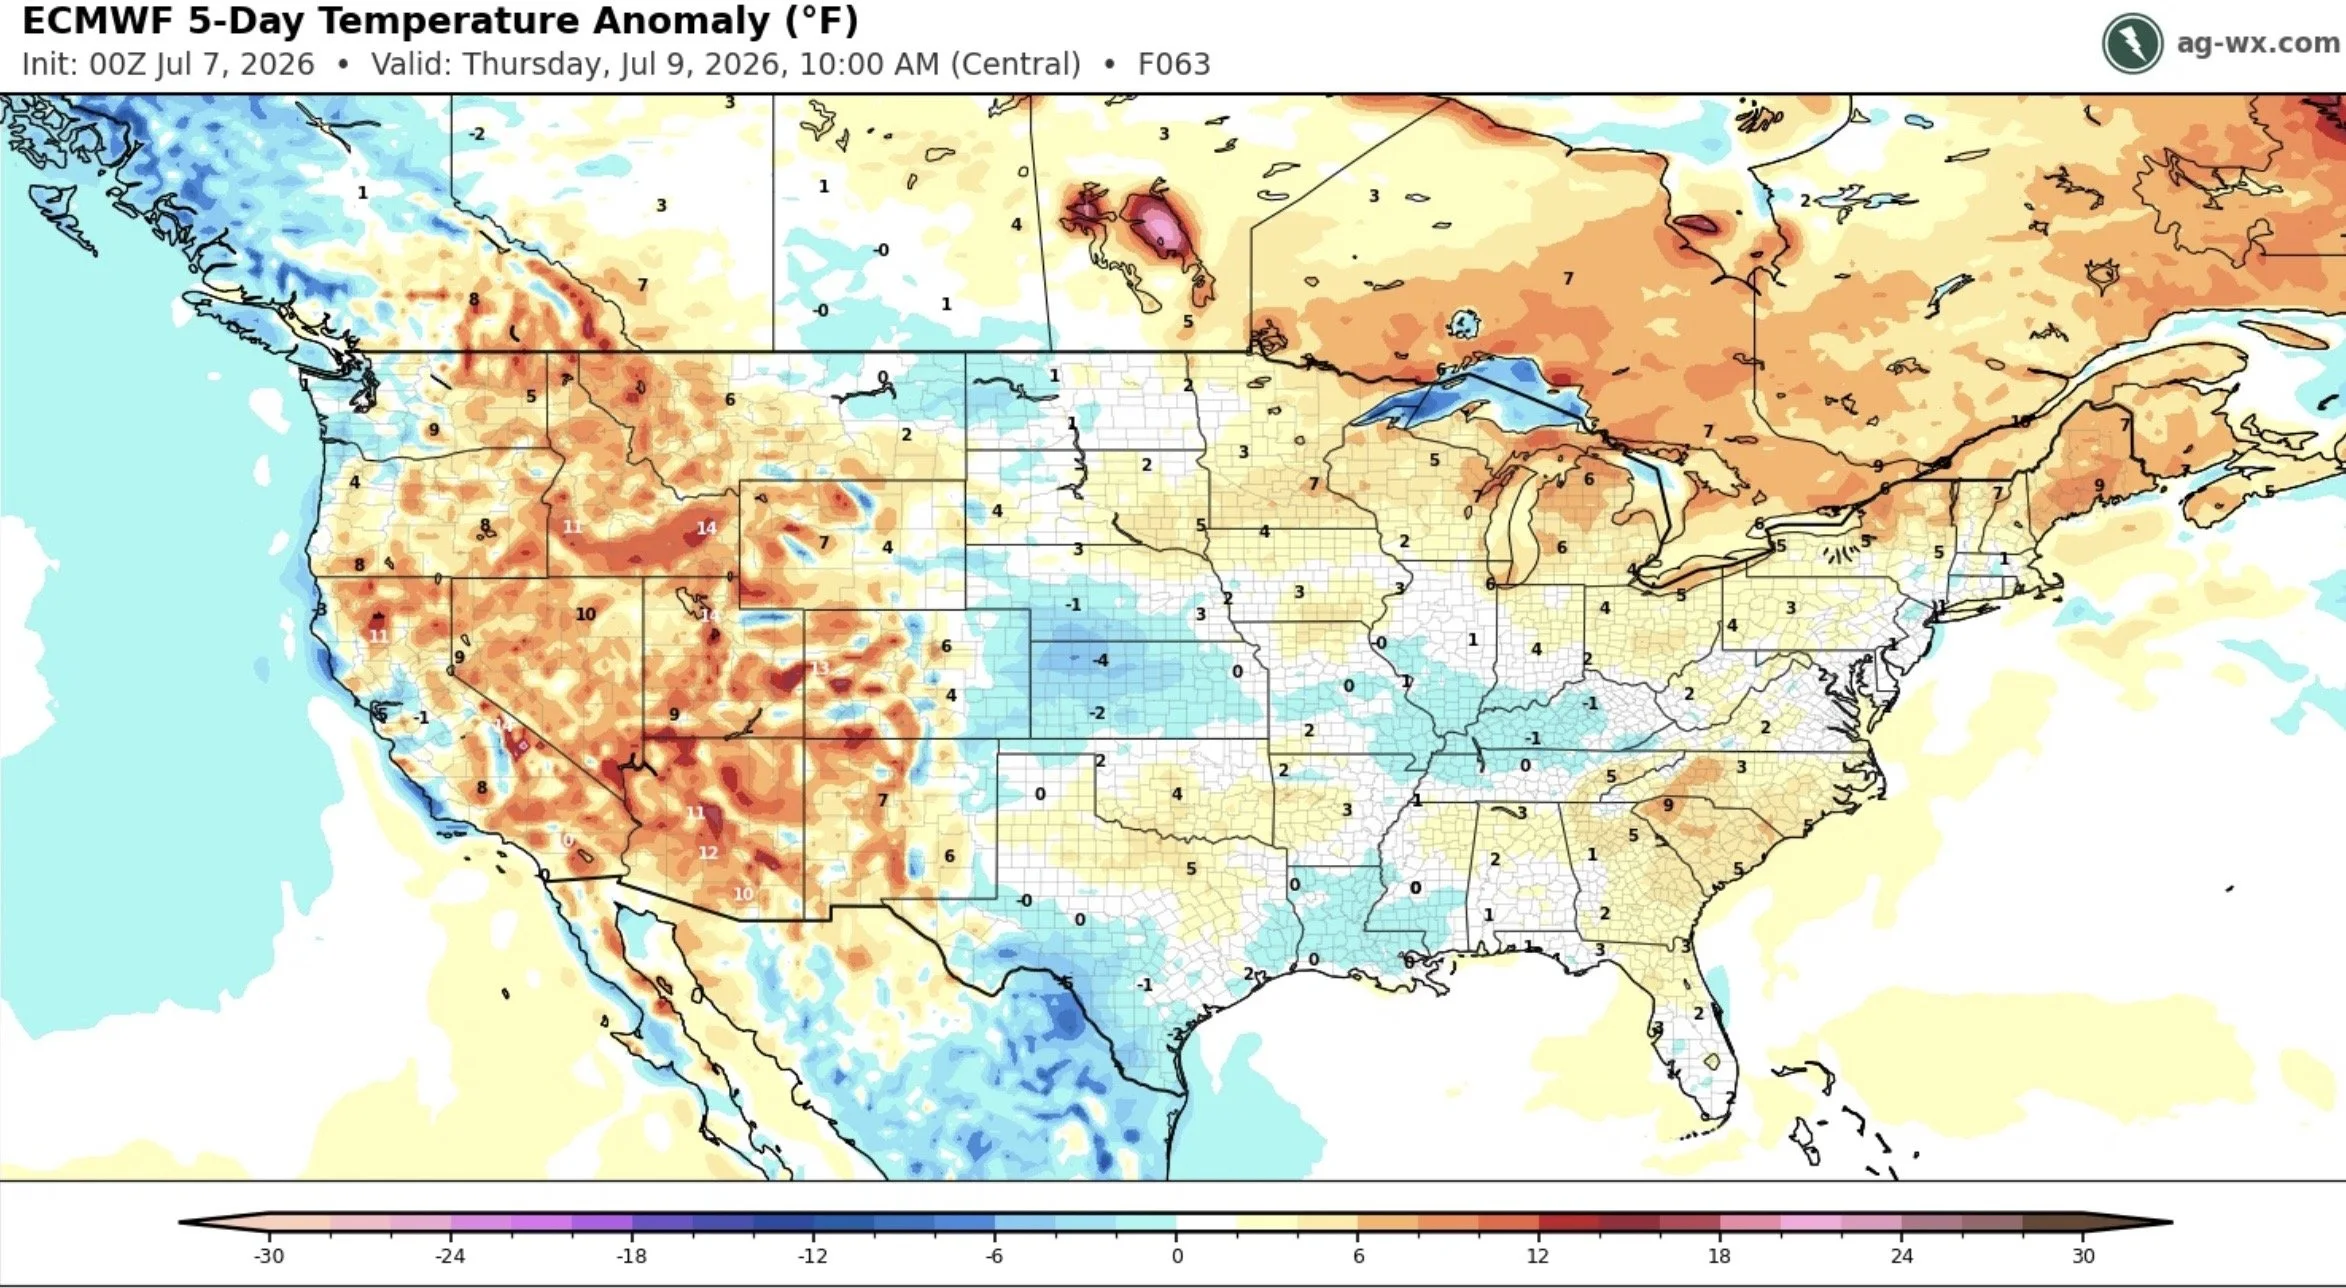
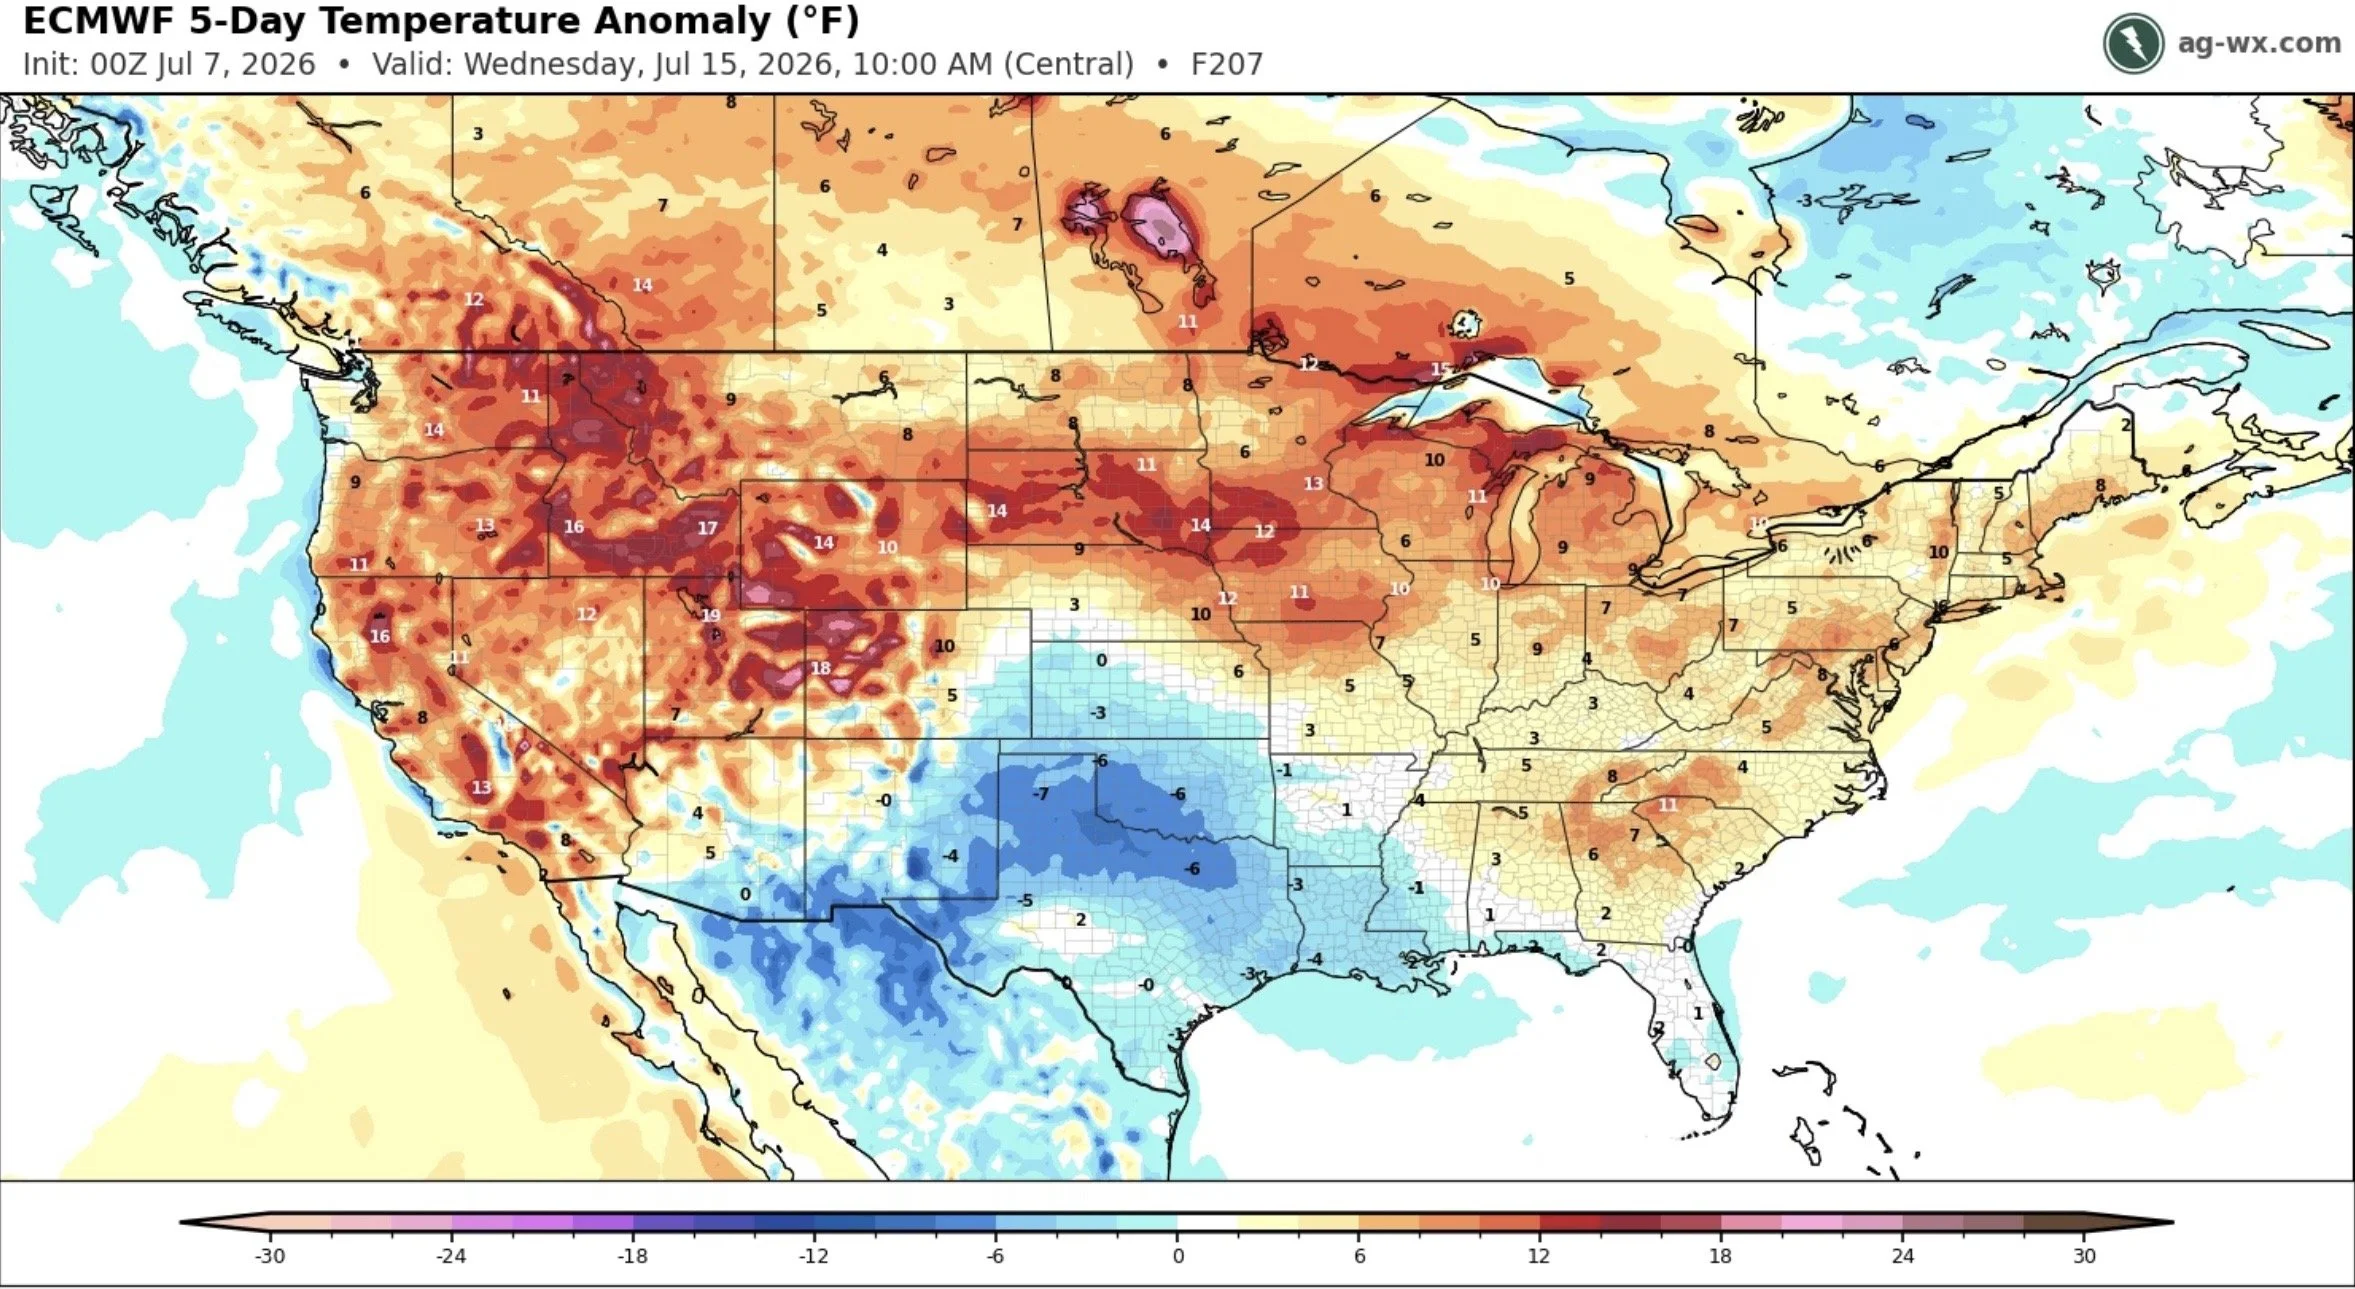
However, as you start to extend this forecast into the middle of the month things start to heat up.
Here is the 6-10 day outlook for July 13th to 17th.
Here is the daily temp anomaly for July 15th, next Wednesday.
You have several areas running 10 degrees hotter than normal.
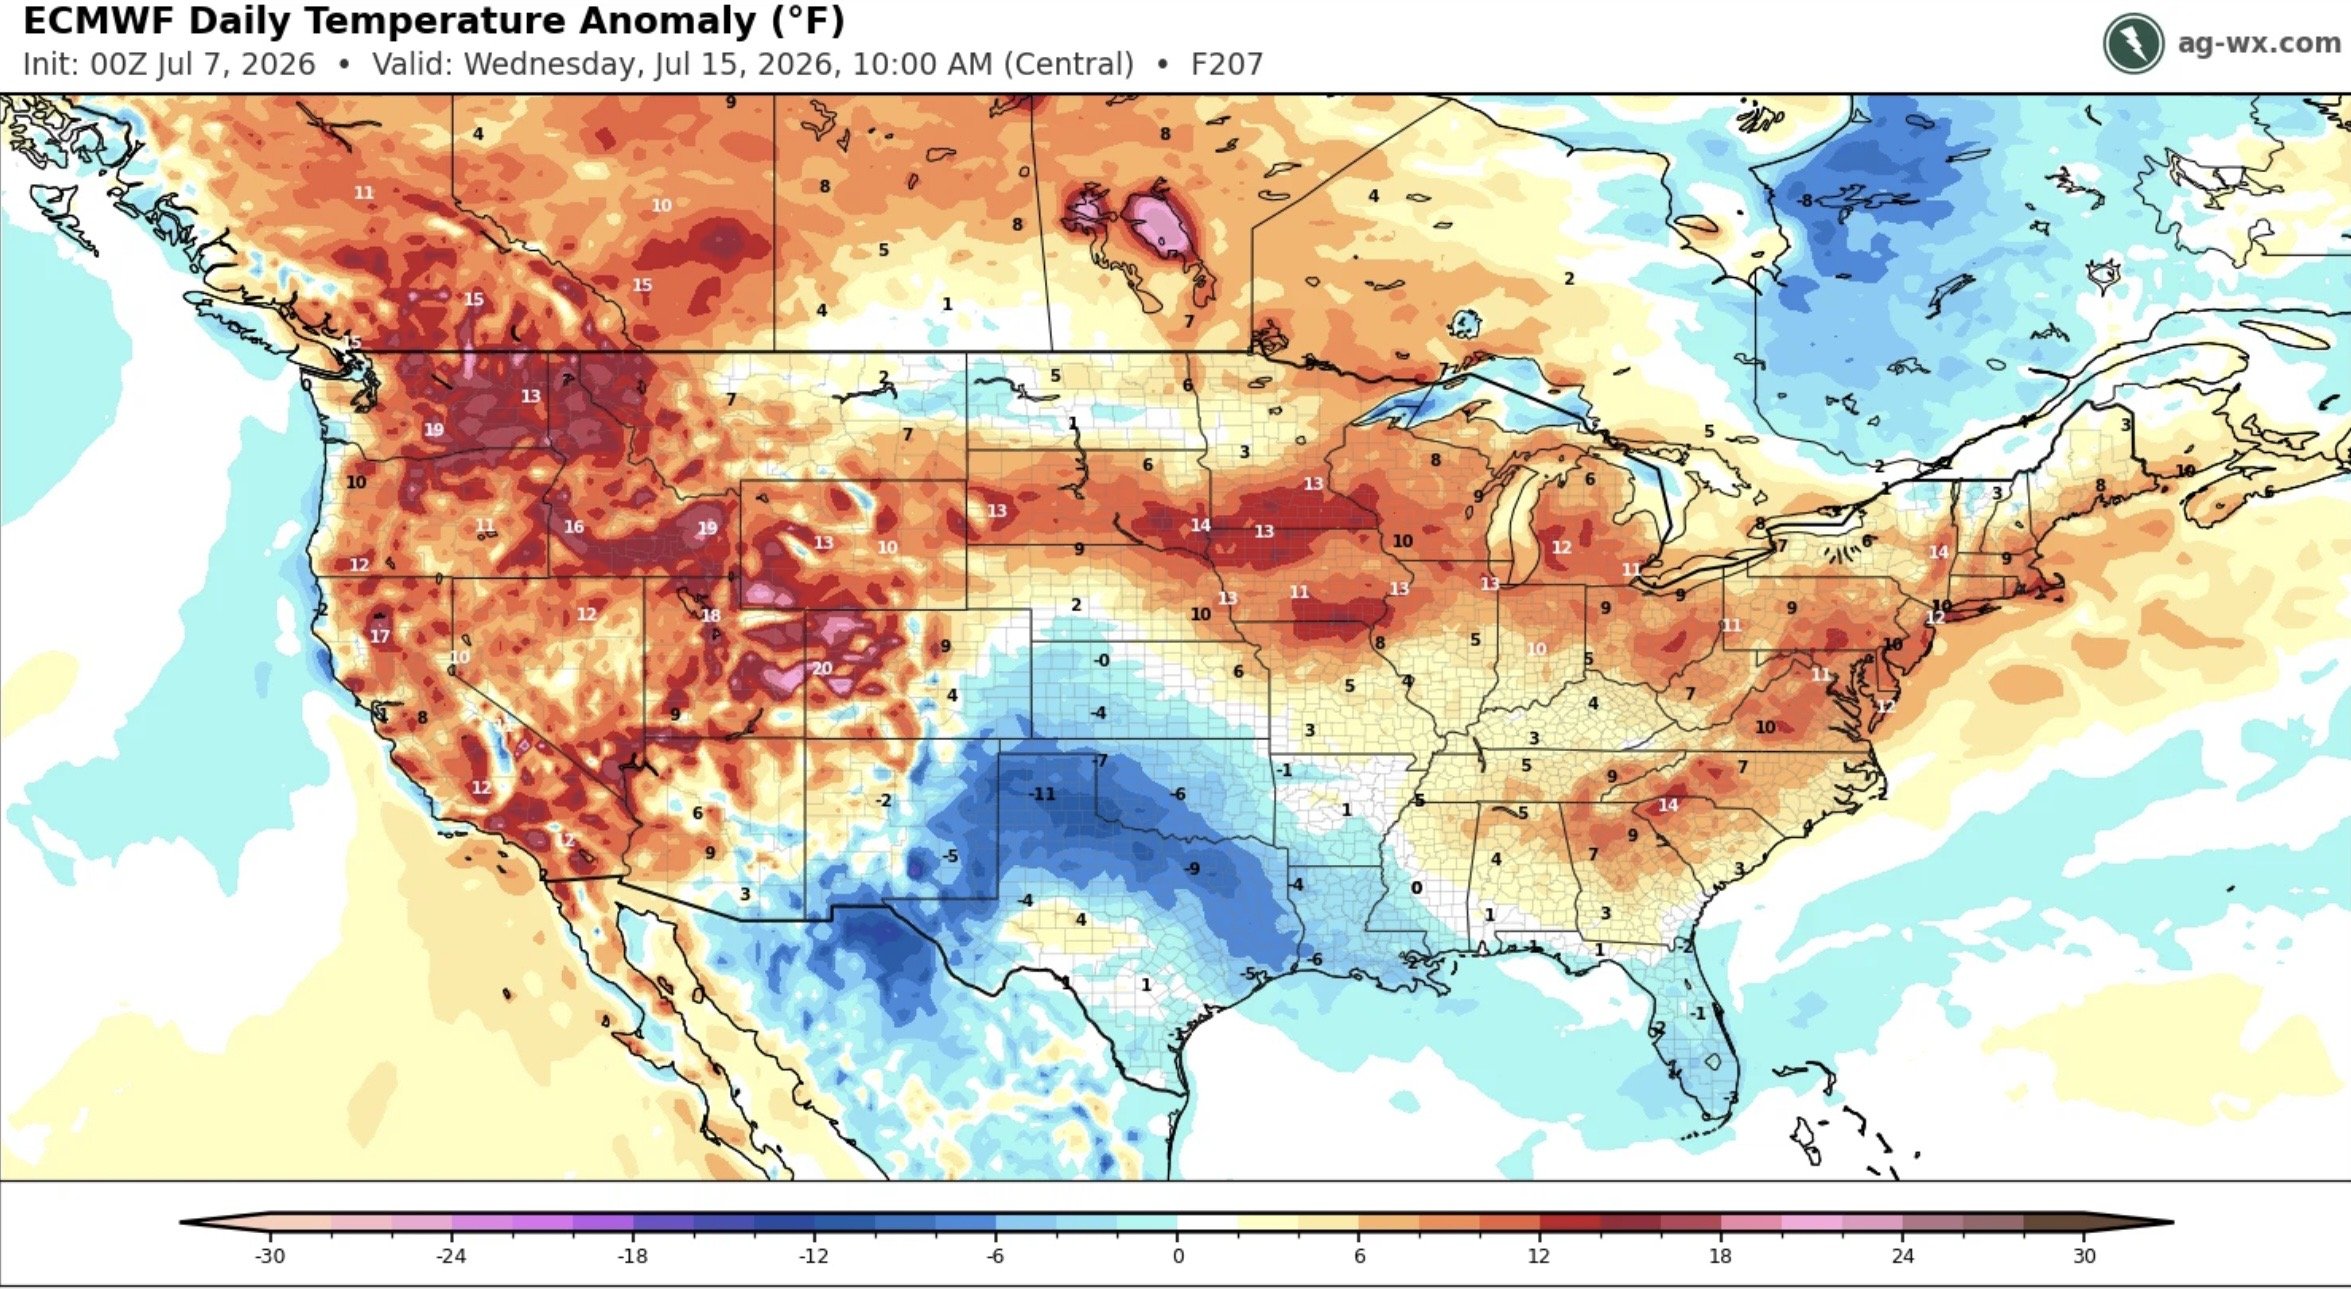
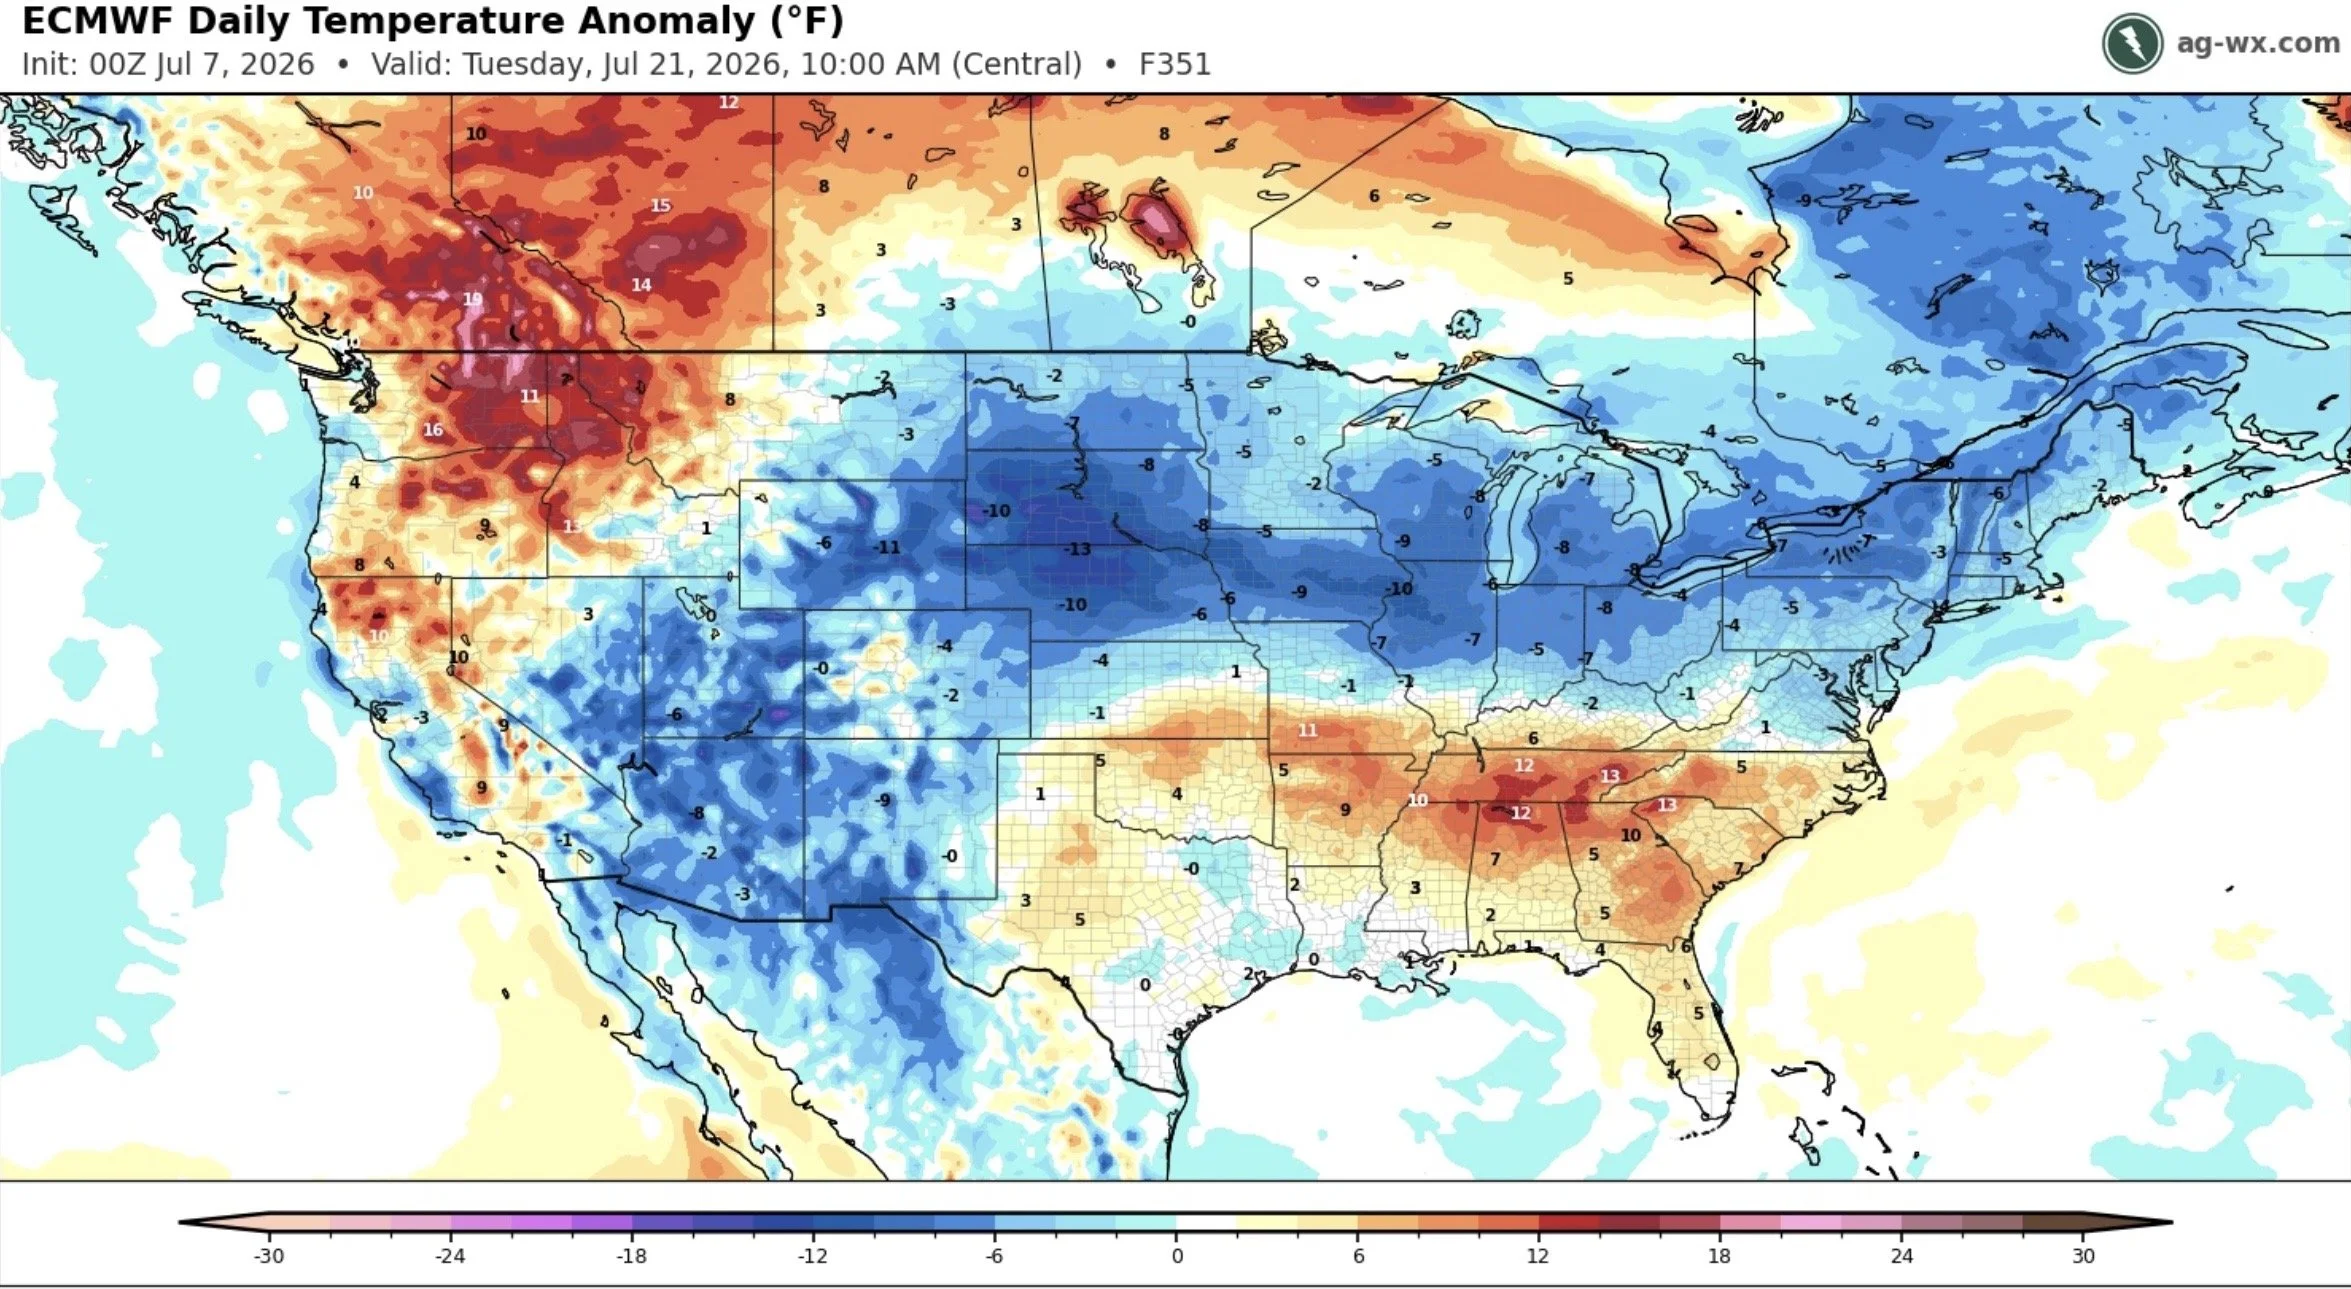
The forecasts don’t have the heat really starting to break until the middle to end of July.
Here is the daily outlook for July 21st.
This is when the heat snaps and temps start to turn colder than normal.
A lot of what the market does the next week or two is really going to come down to weather.
Weather forecasts can change on a dime.
Does it stay hot or not? What does the forecasts look like after this weekend?
If it actually stays hot and dry throughout the month of July, then the market will put more premium in.
If the heat breaks or we get more rain, then we can give the premium right back.
Crop Conditions
This growing season hasn’t been "perfect".
Some areas have gotten way too much rain, some not enough. Now we have the issue with the heat.
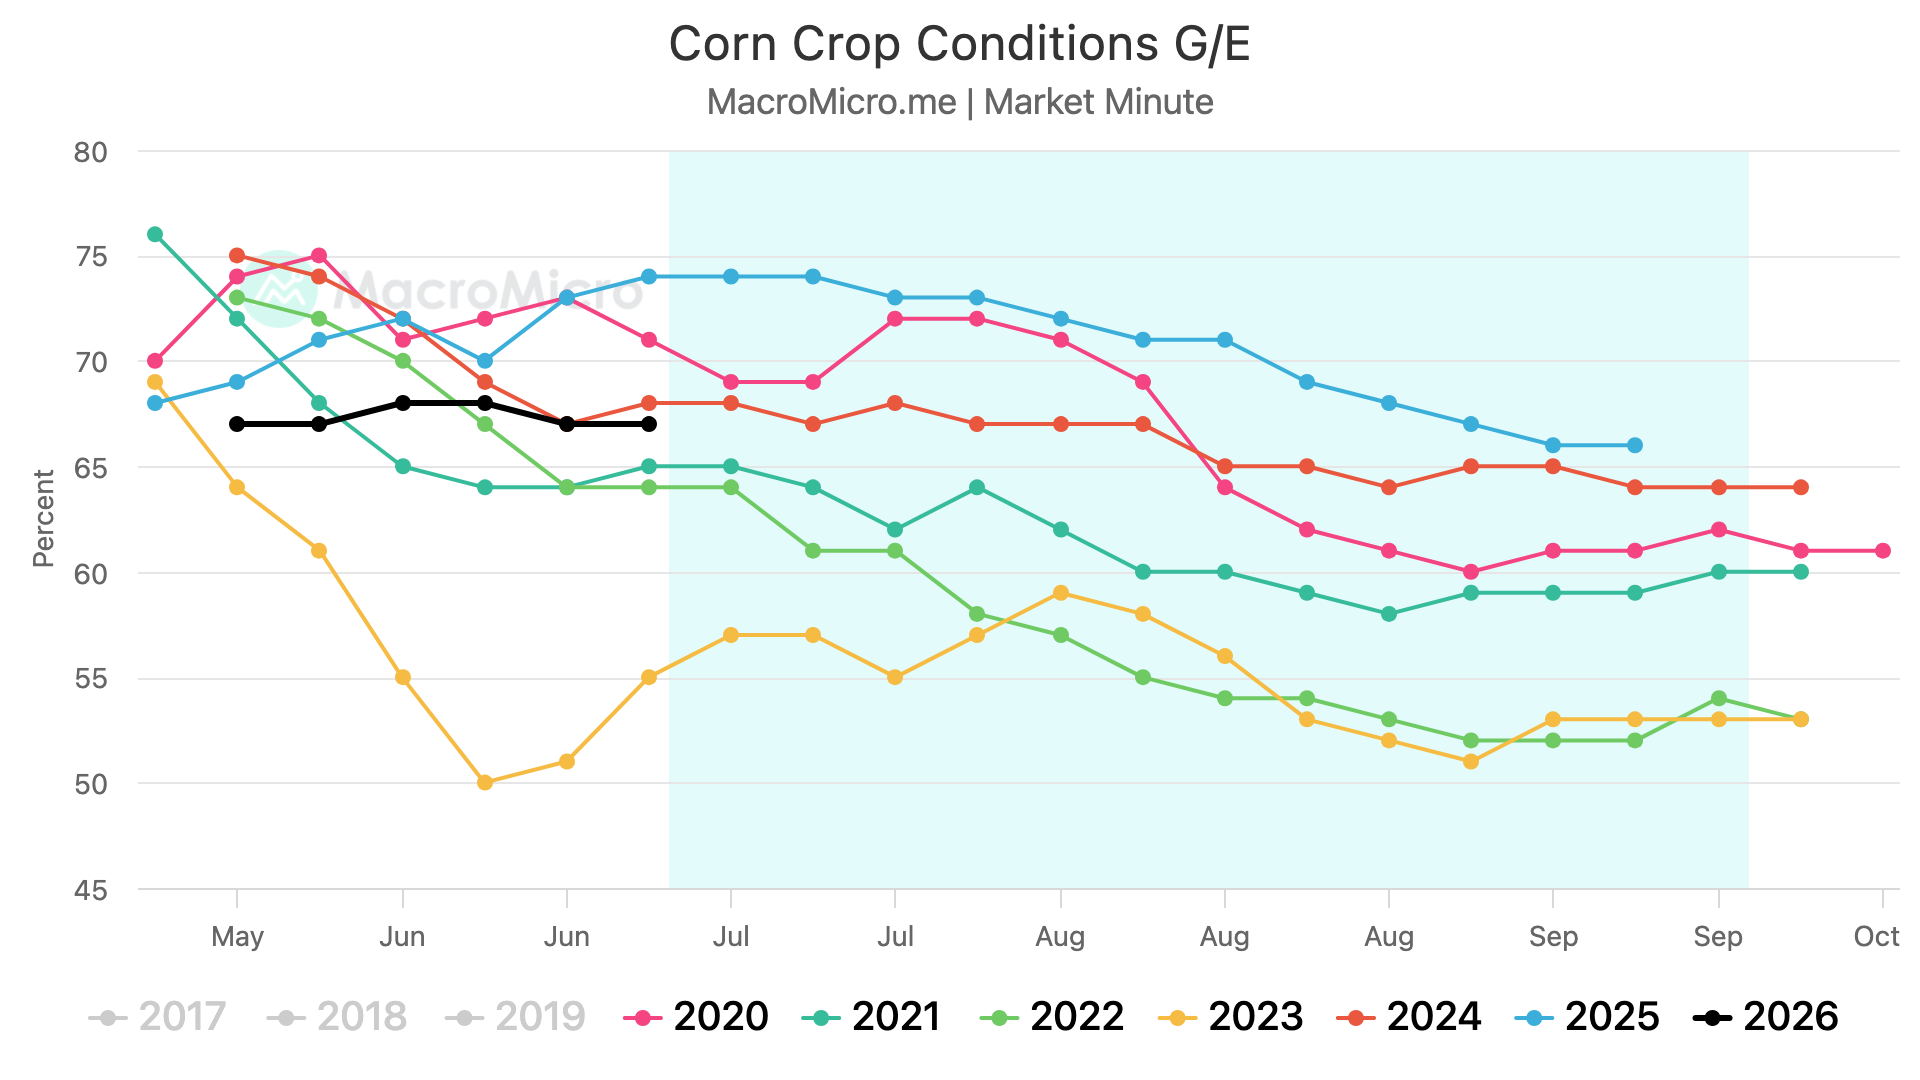
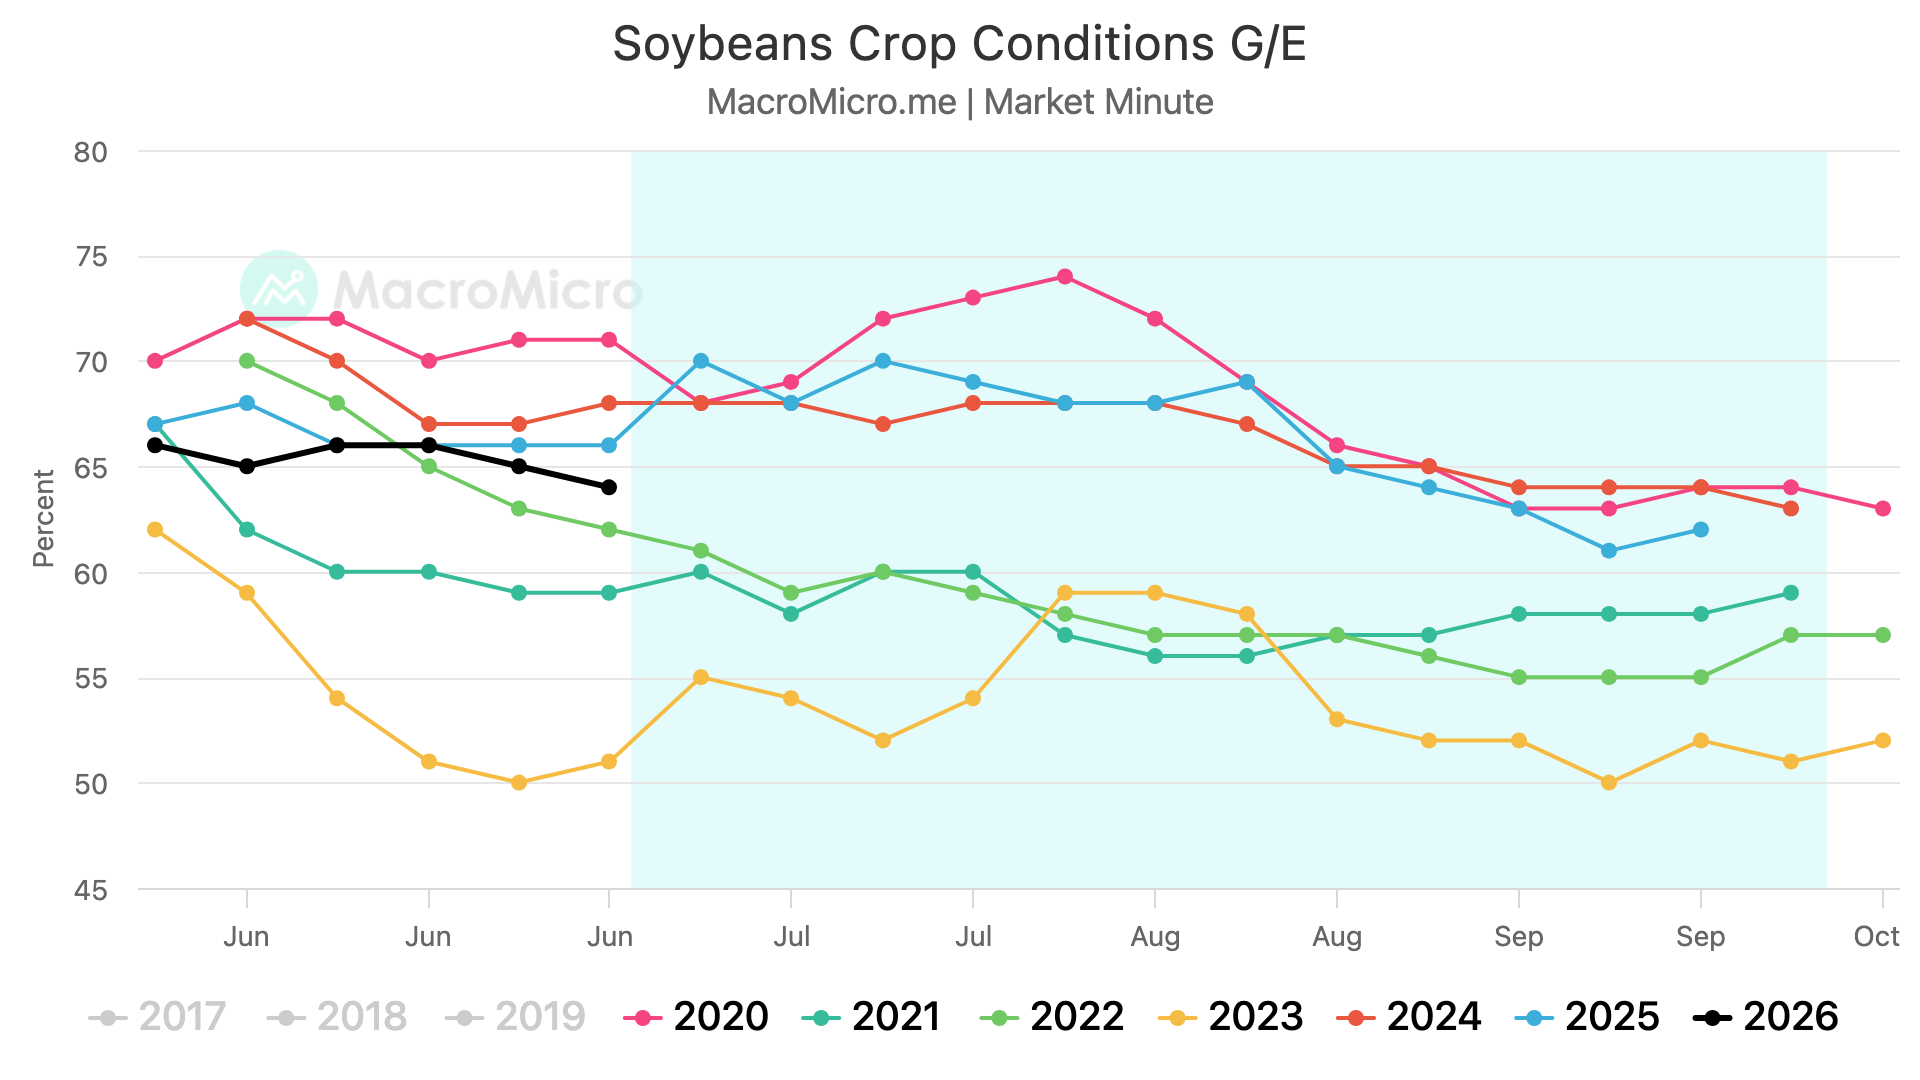
Here is how the current ratings stack up vs prior years.
Both corn and soybeans sit around average, but we're definitely sitting in a worse spot compared to last year based on these.
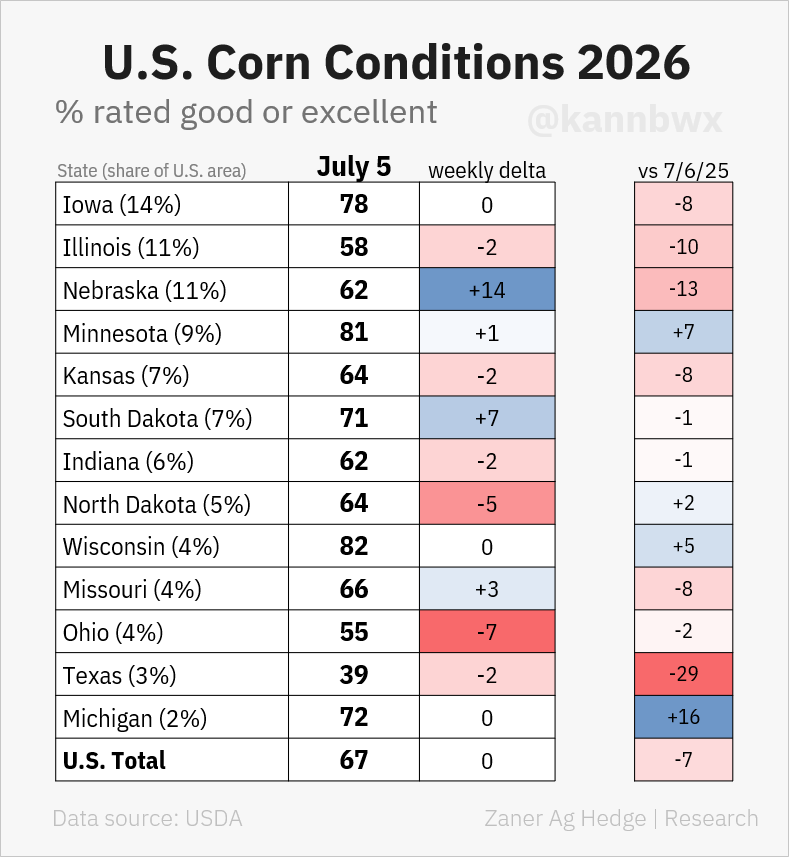
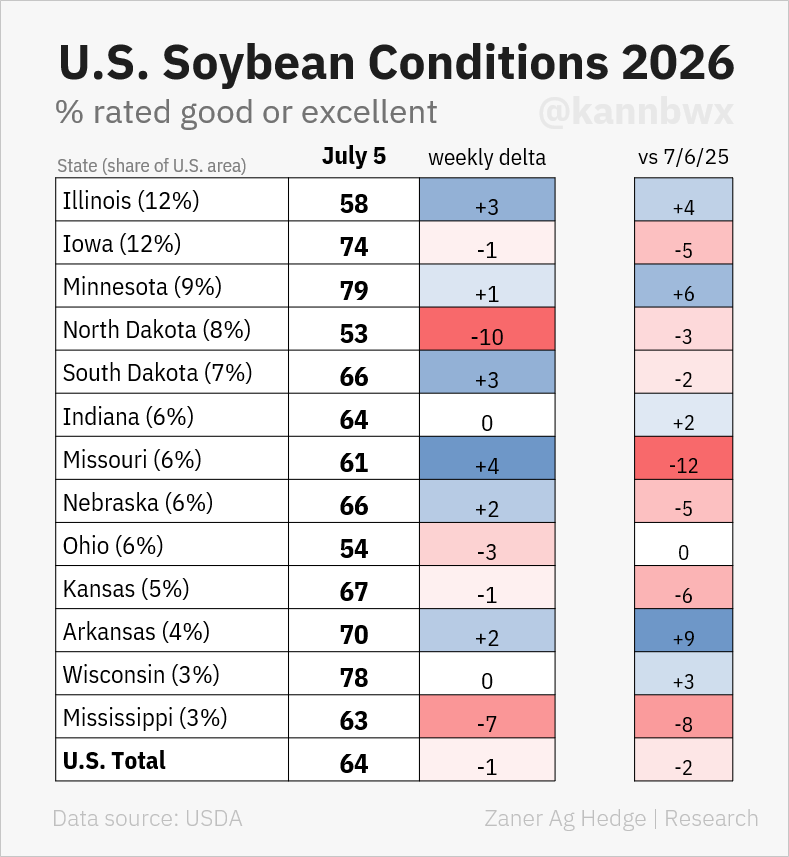
Here are some state by state breakdowns from Karen Braun (@kannbwx on X).
4 of the top 5 corn states are rated worse than they were last year.
Soybeans on the other hand a little more of a coin toss.
Some of the big players are worse than last year, some are better.
Possible Yield & Acre Impact
On the balance sheet, aside from demand you have two things that move the balance sheet dramatically.
Yield and acres.
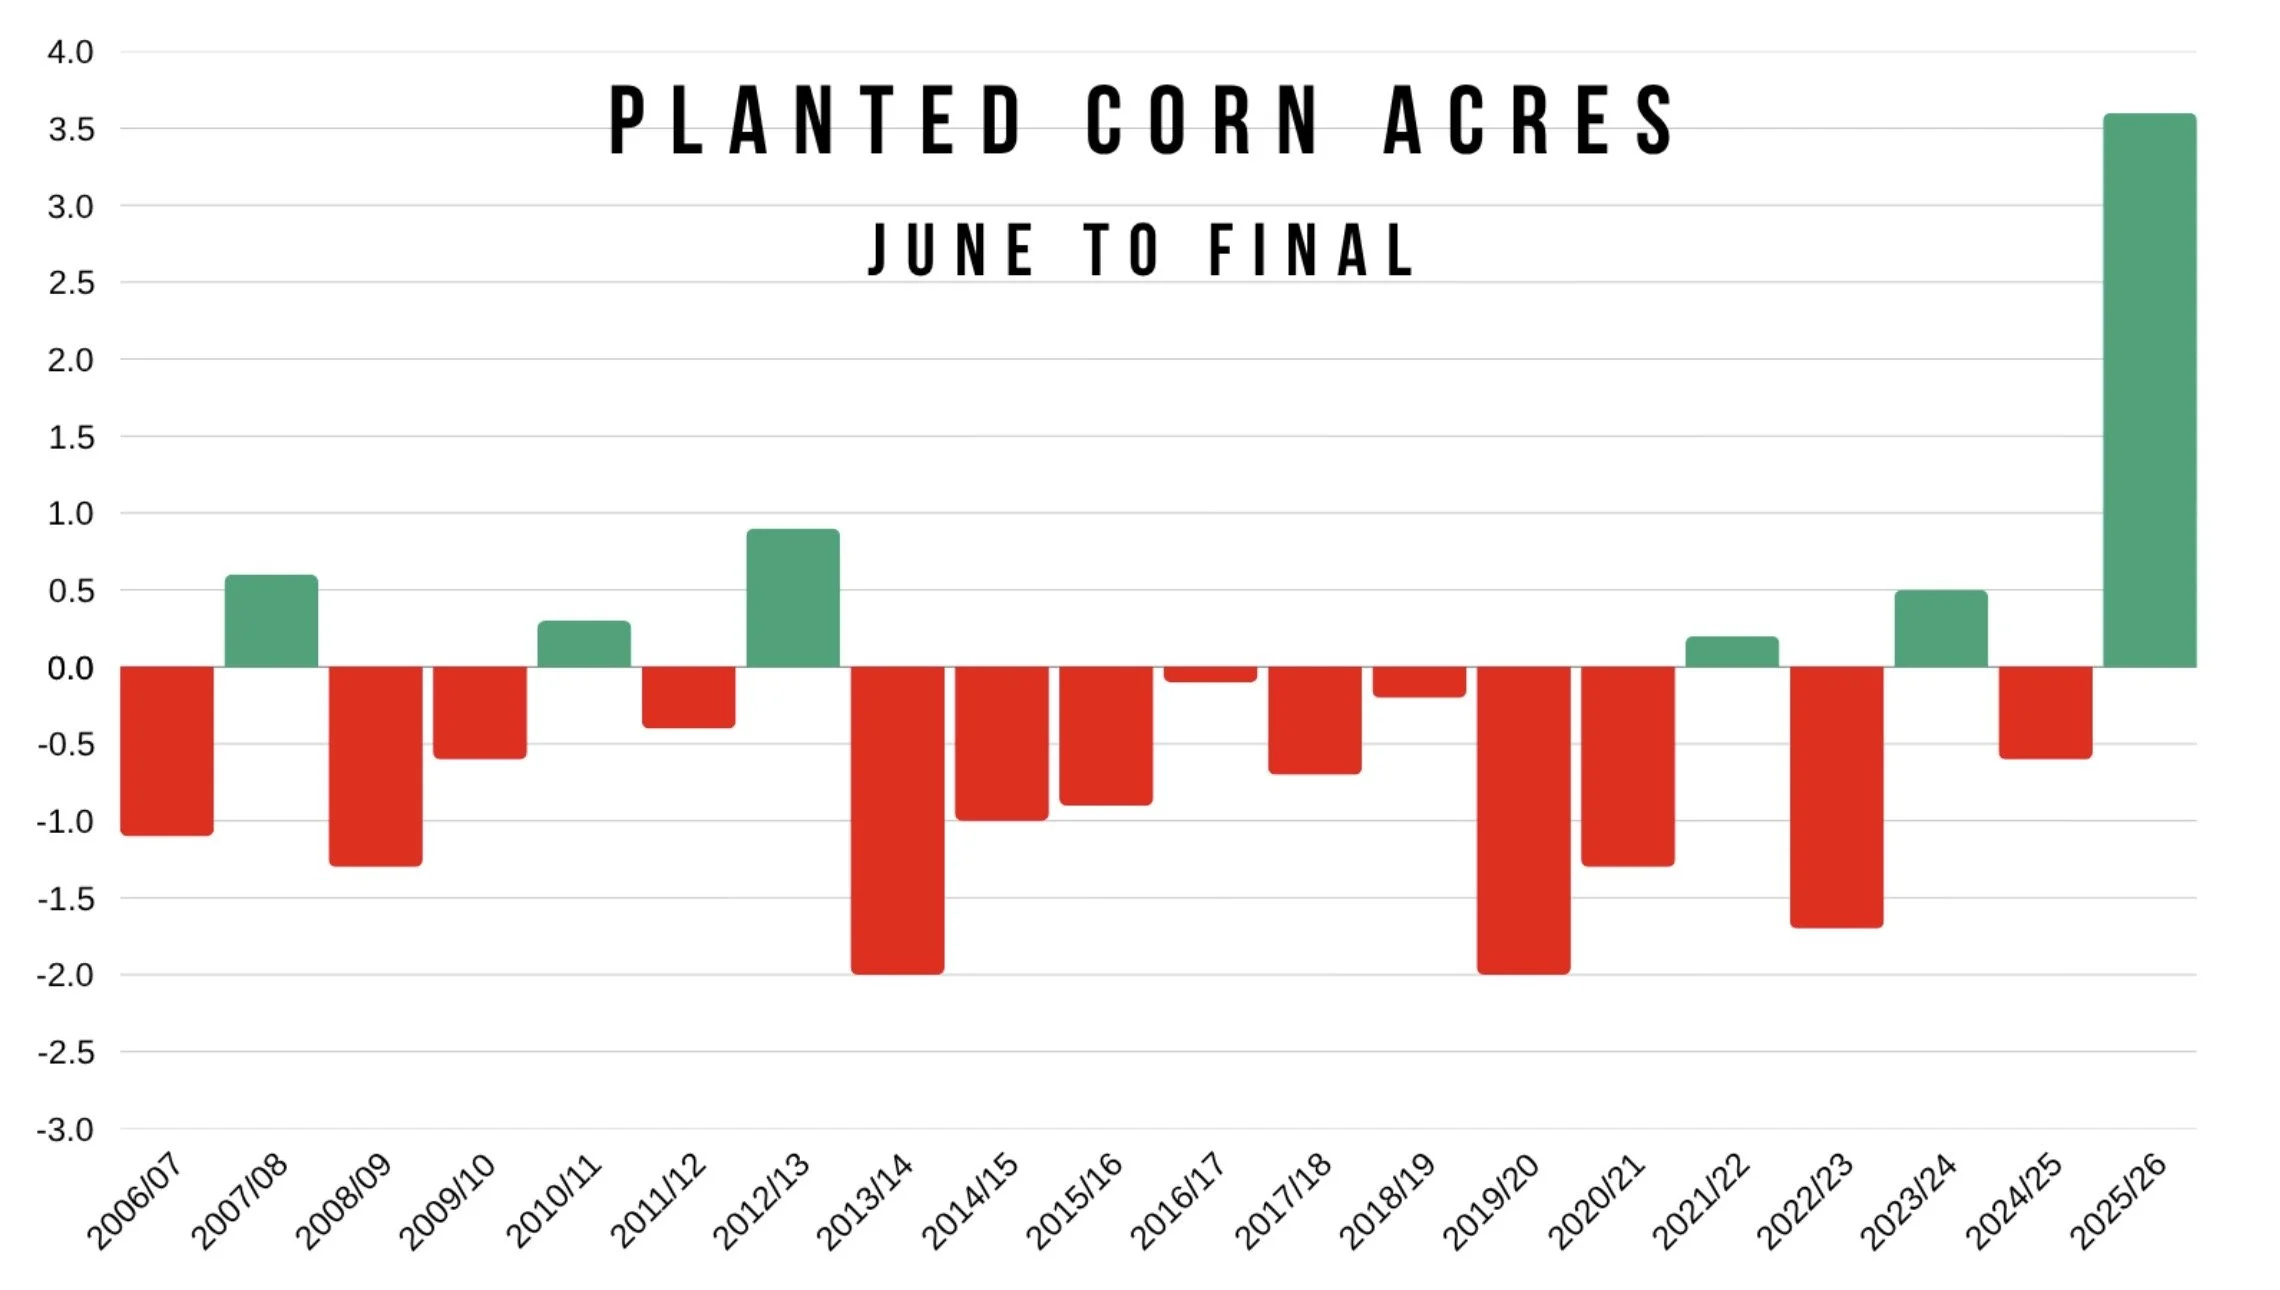
Here is past corn acres changes from June to final.
They've come down 10 of 13 years.
Last year of course being the anomaly of a year where they eventually raised them by 3 million.
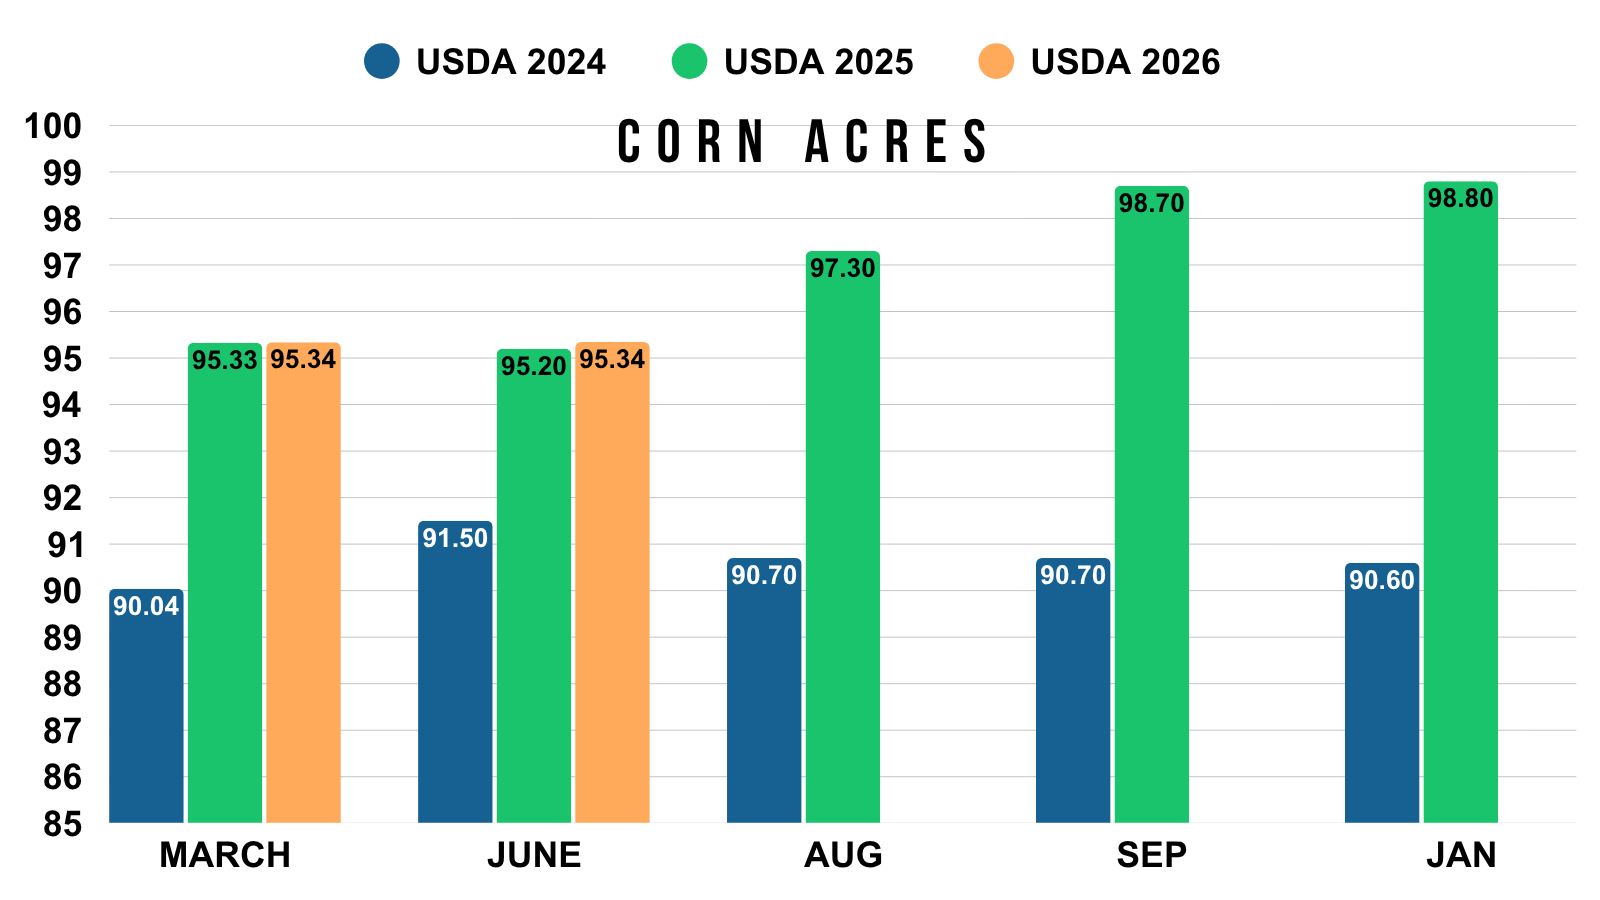
If we look at the last two years, the USDA did make some sizeable changes to acres in the August report.
2025: +2.10 million
2024: -0.80 million
So perhaps we see yet another change come August.
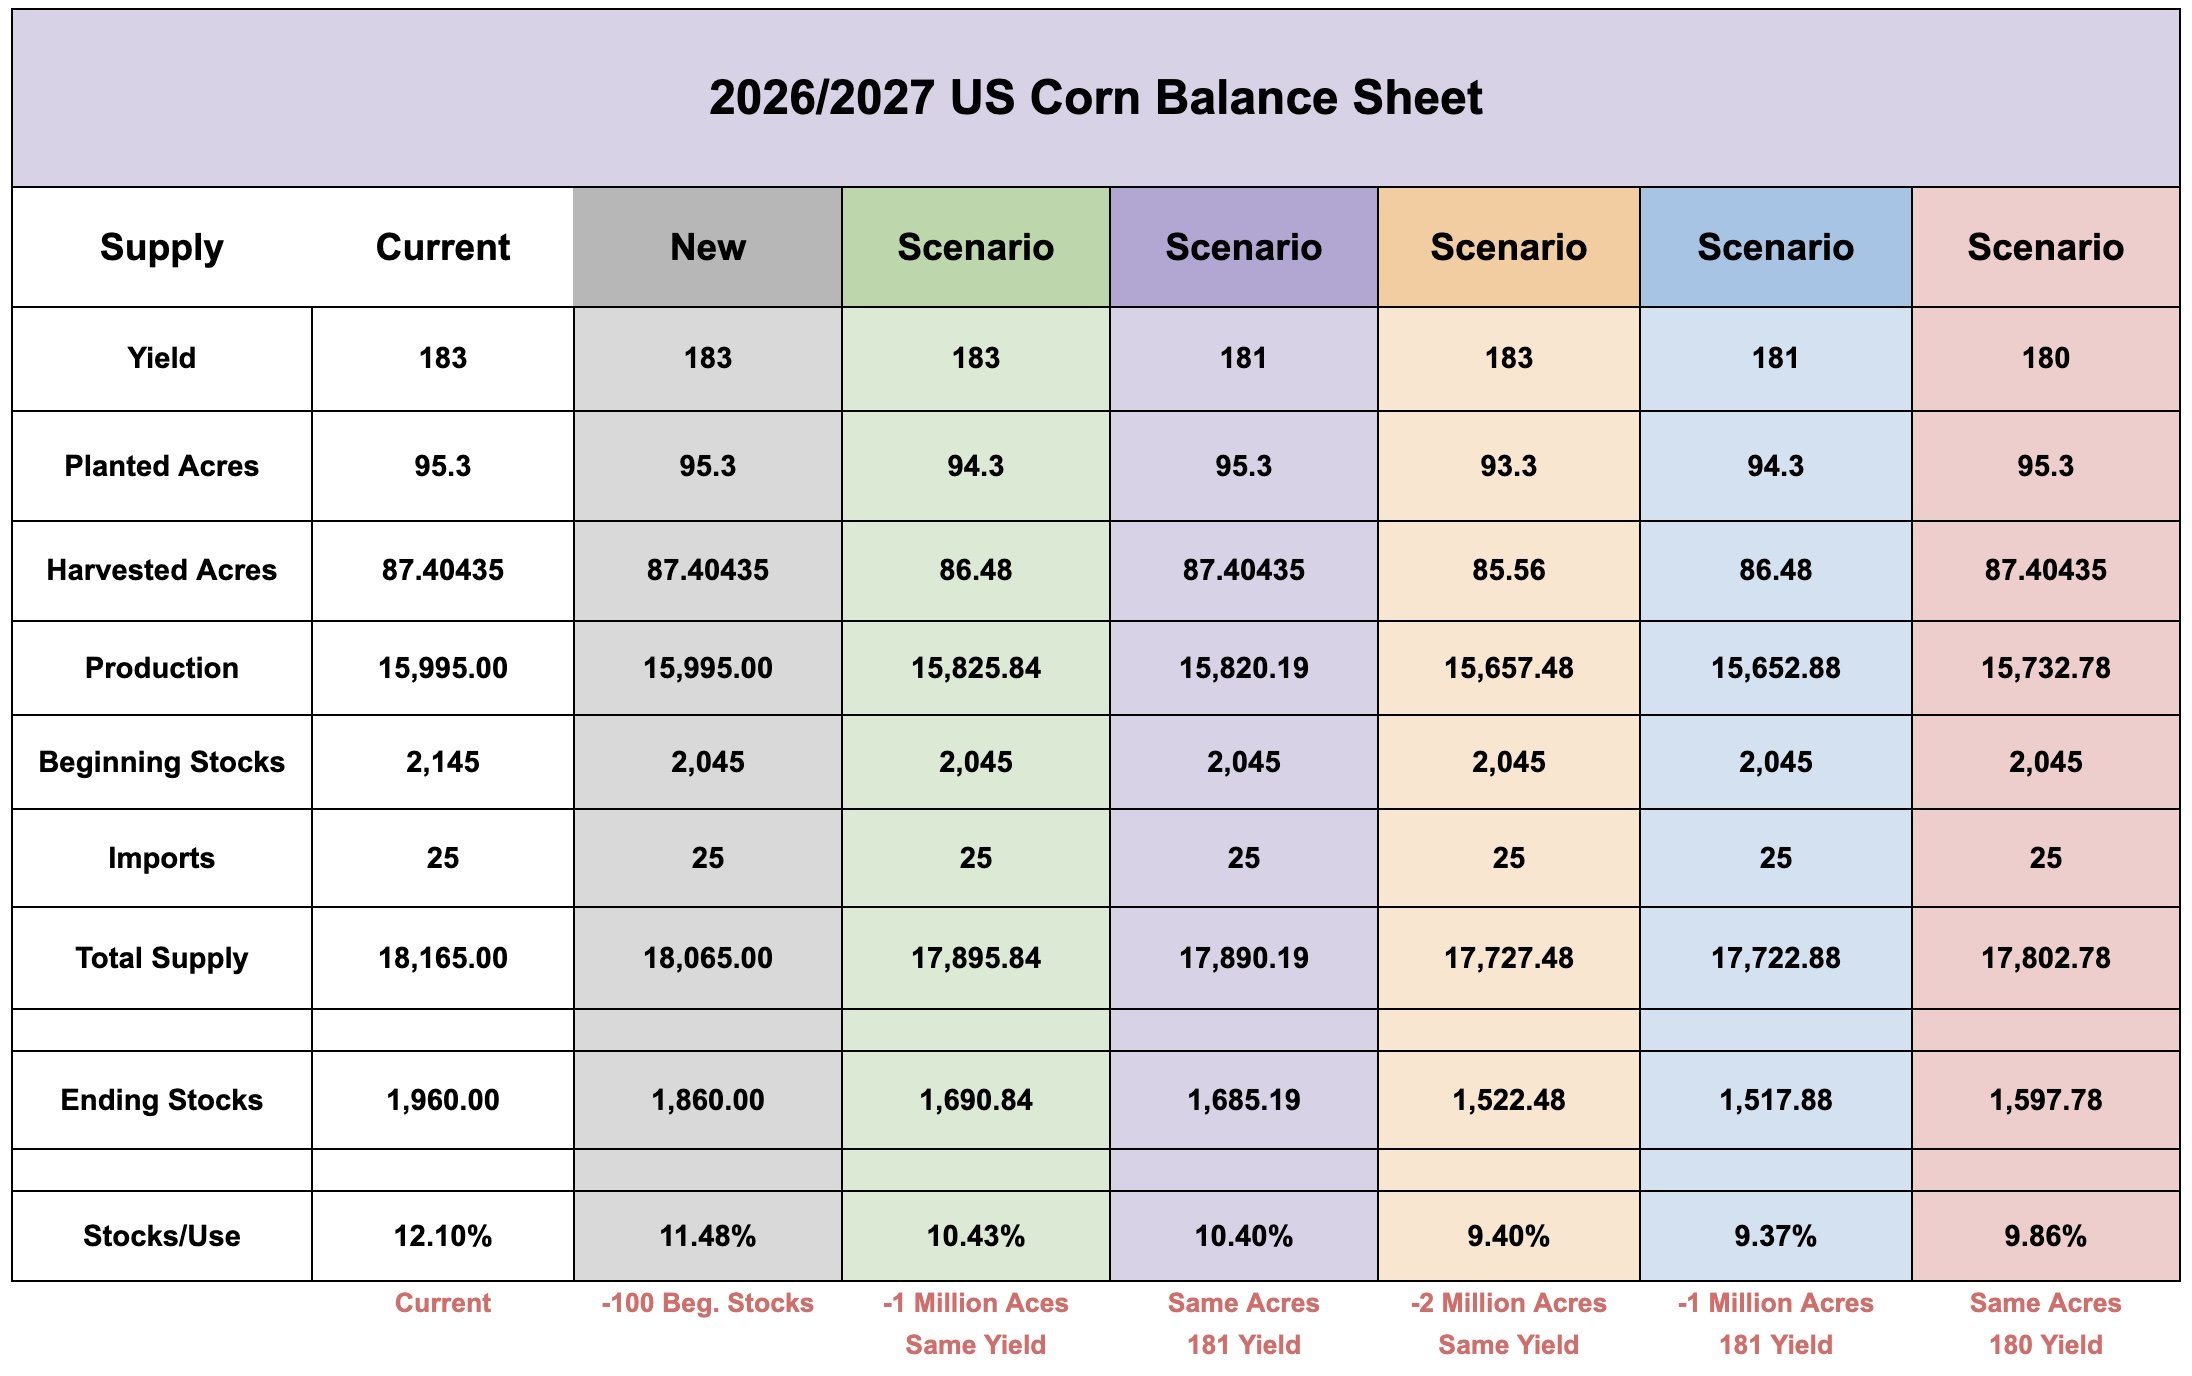
Now what if yield isn’t perfect?
We haven’t had a below trendline yield in a while. As we've posted record yields for 3 years straight now.
Here are a few scenarios. None of these account for any changes to demand. They simply show how both yield and acres can change things.
Some have yield staying at 183, with acres dropping.
Some have yield falling, while acres stay the same.
Some have both falling.
We don’t have the cushion we had last year when we had 98.8 million acres.
A 183 yield is absolutely possible but it is not a given, that would be the 2nd highest ever.
If yield isn’t perfect, or if acres do end up dropping, things could absolutely get interesting on the balance sheet.
As there are plenty of possible paths to a stocks to use ratio closer to that 10% range.
So there is clearly some "potential" in new crop corn. Not to mention what could happen if you throw some China demand on top.
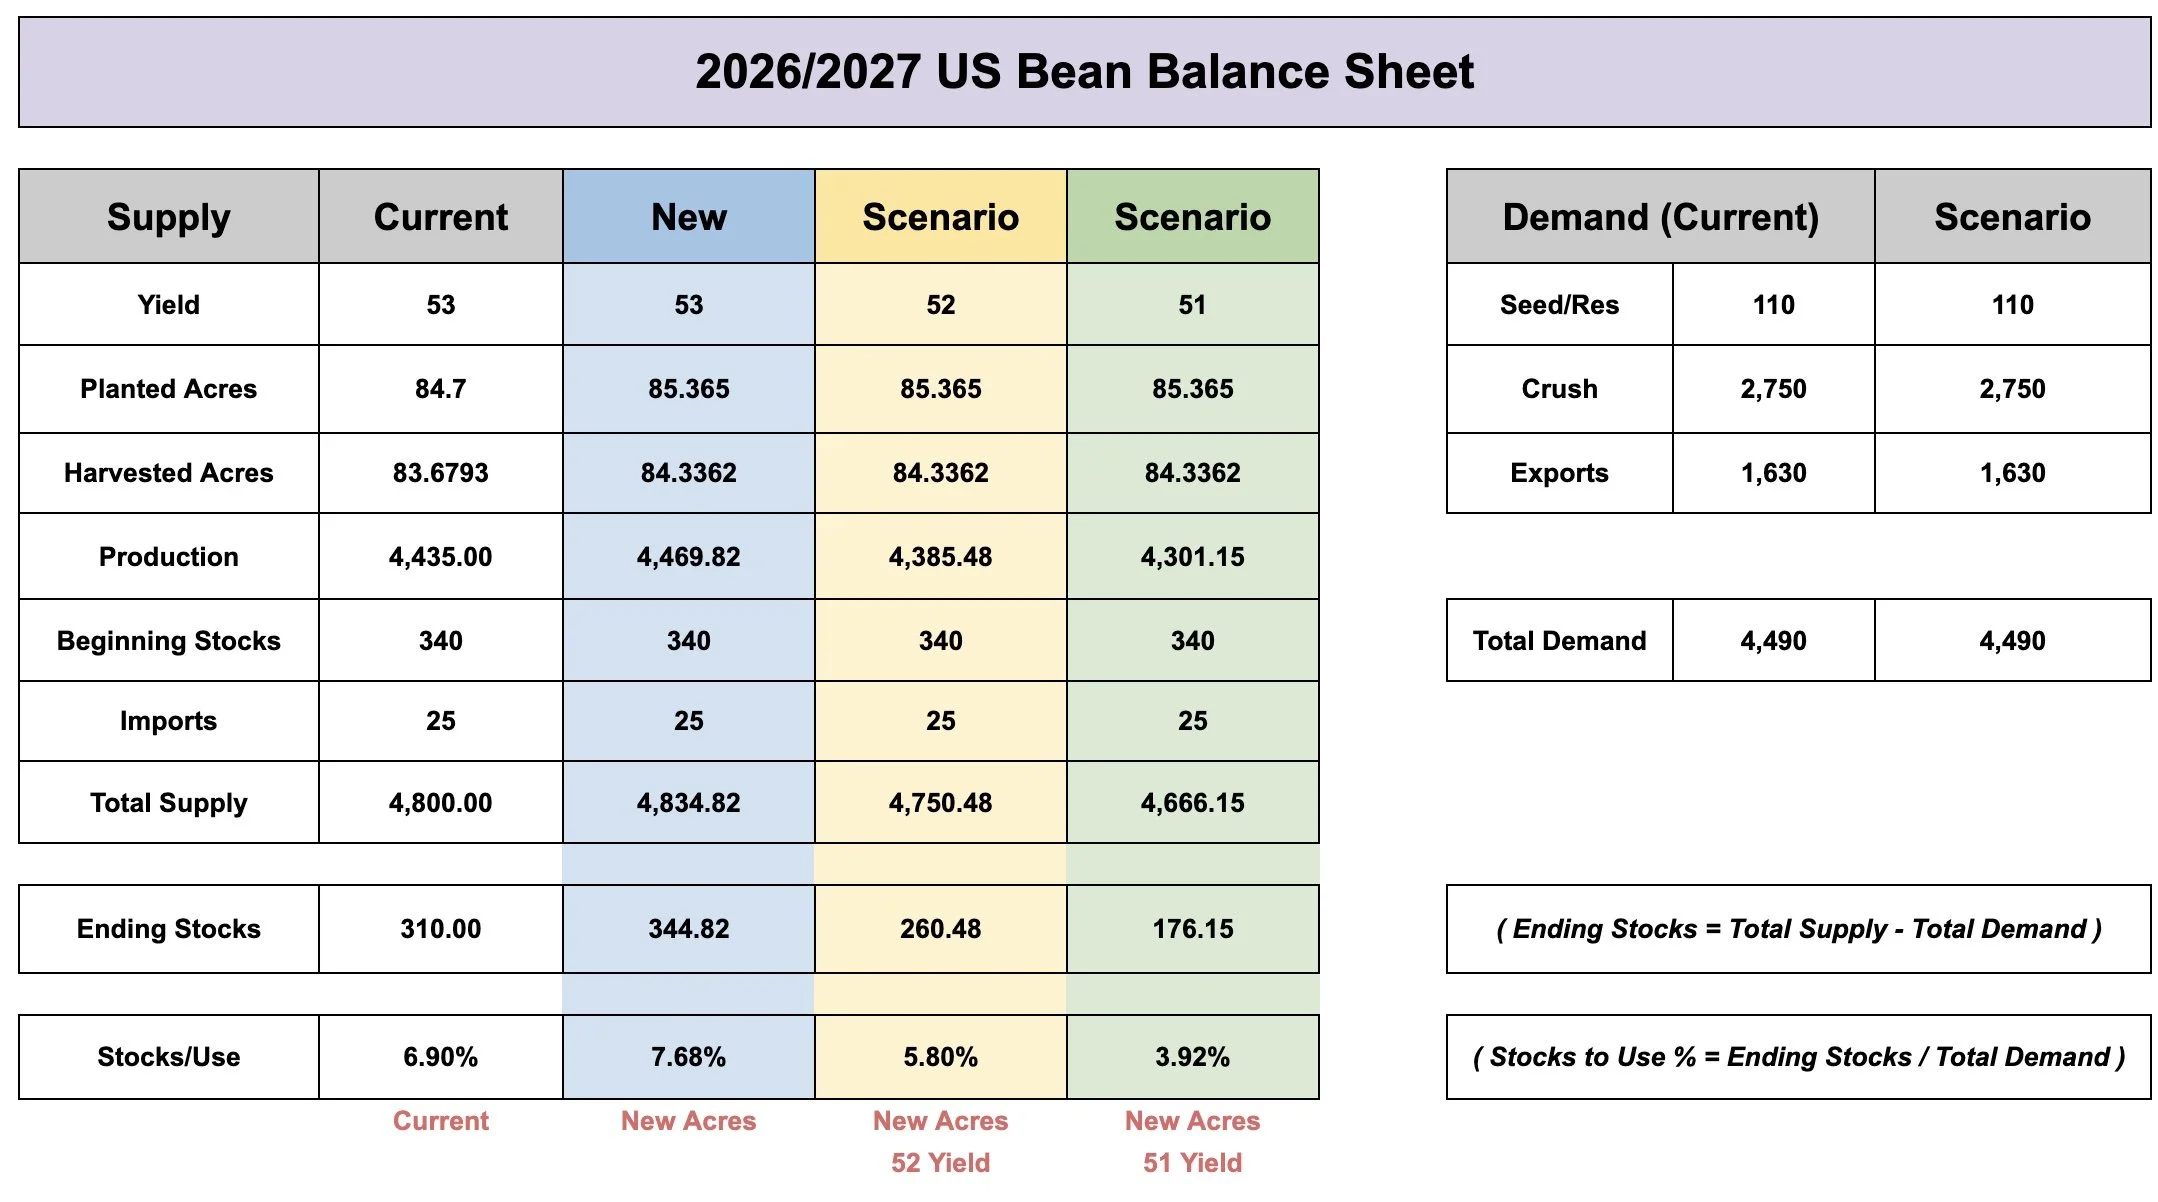
The same could be said for soybeans.
Even a slighy drop in yield could completely alter the soybean balance sheet.
Before changing demand, a 51 bpa yield would literally cut the carryout in half.
So the room for error is very small.
Today's Main Takeaways
Corn
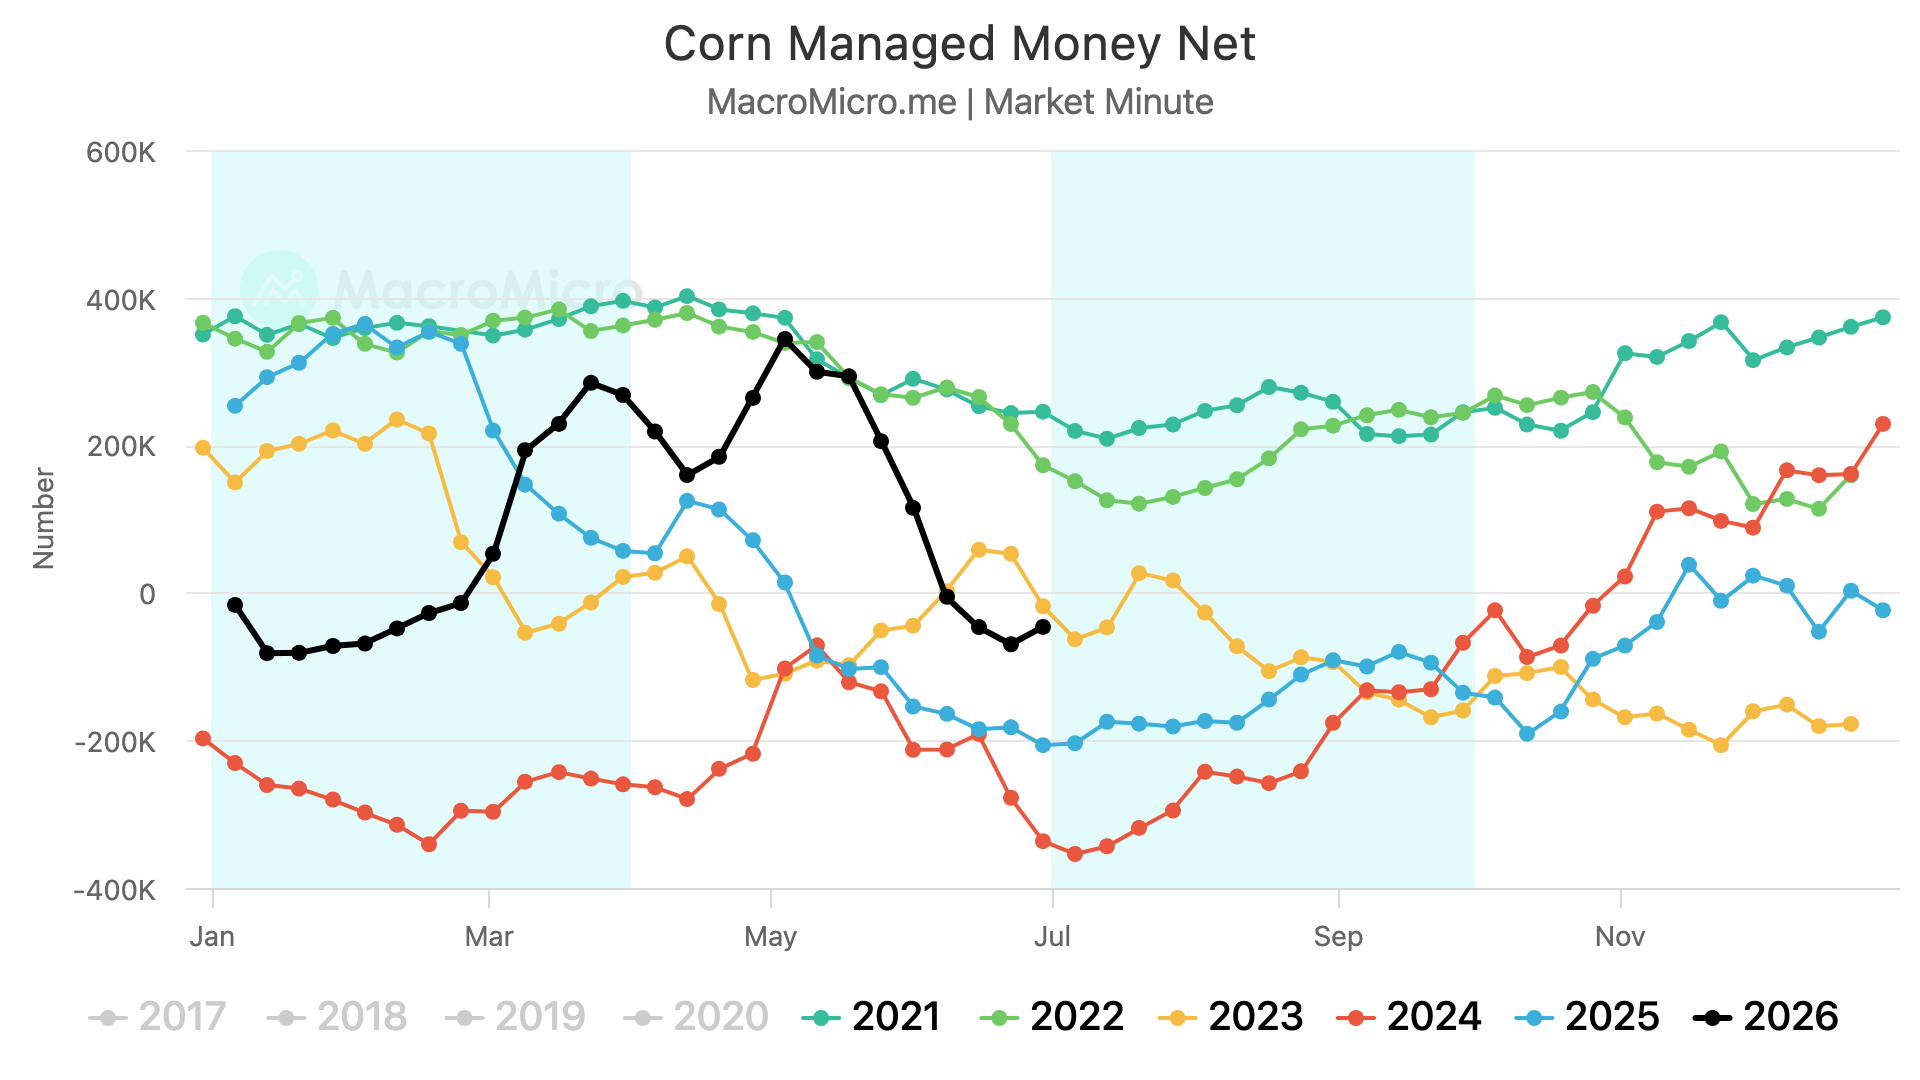
Funds:
The funds are short a small amount of corn, but aren’t full-blown short like they were either of the last two years.
This is the time of year where they tend to lighten up that short position and press the brakes.
Over the last several years, 2023 is the only year where they continued to sell after July.
Seasonals:
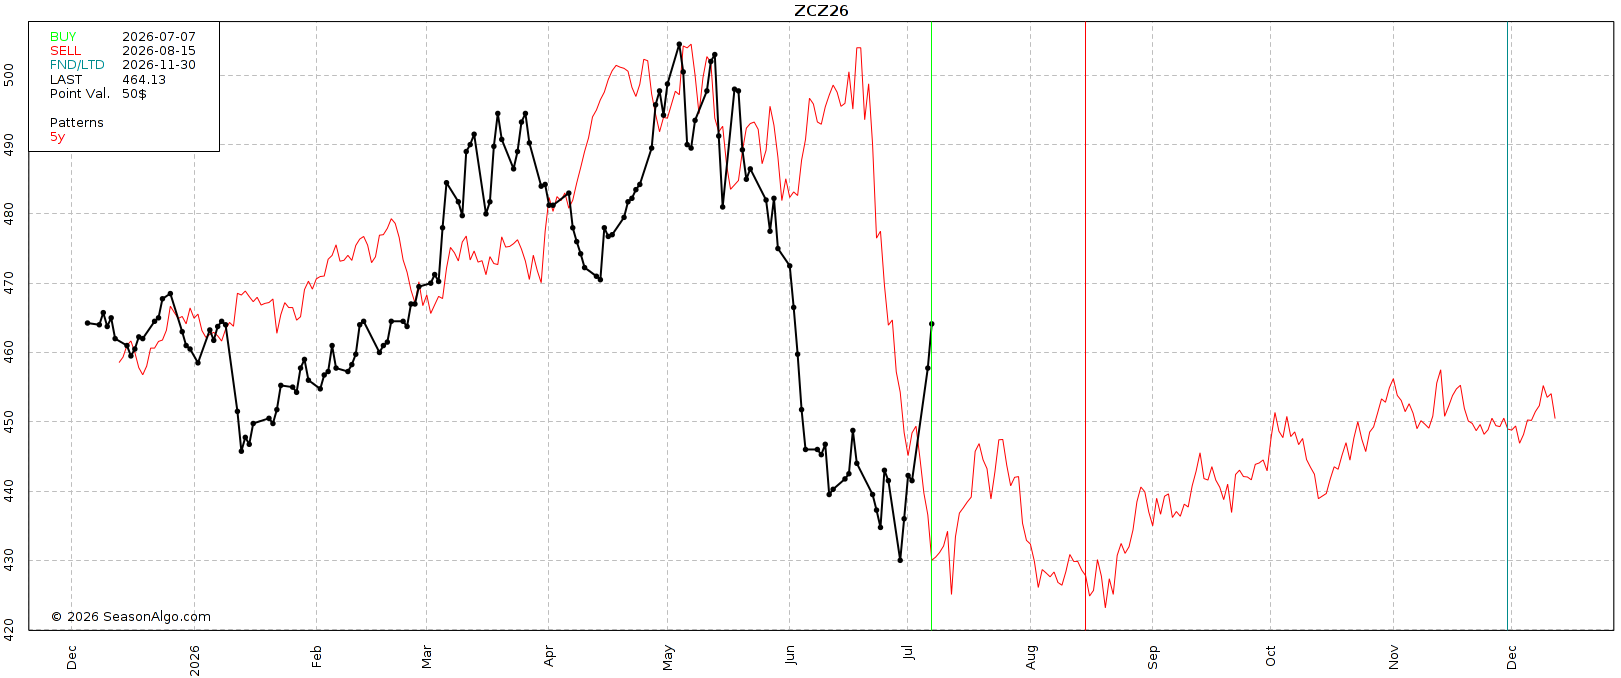
Let's look at the seasonal pattern.
Seasonallly, we do put in a local bottom and get a rally right about. Which we are seeing.
However, unless the weather scare develops into something really material, it often doesn’t last.
And we go on to post new lows, although the lows have tended not to be too far below the July lows.
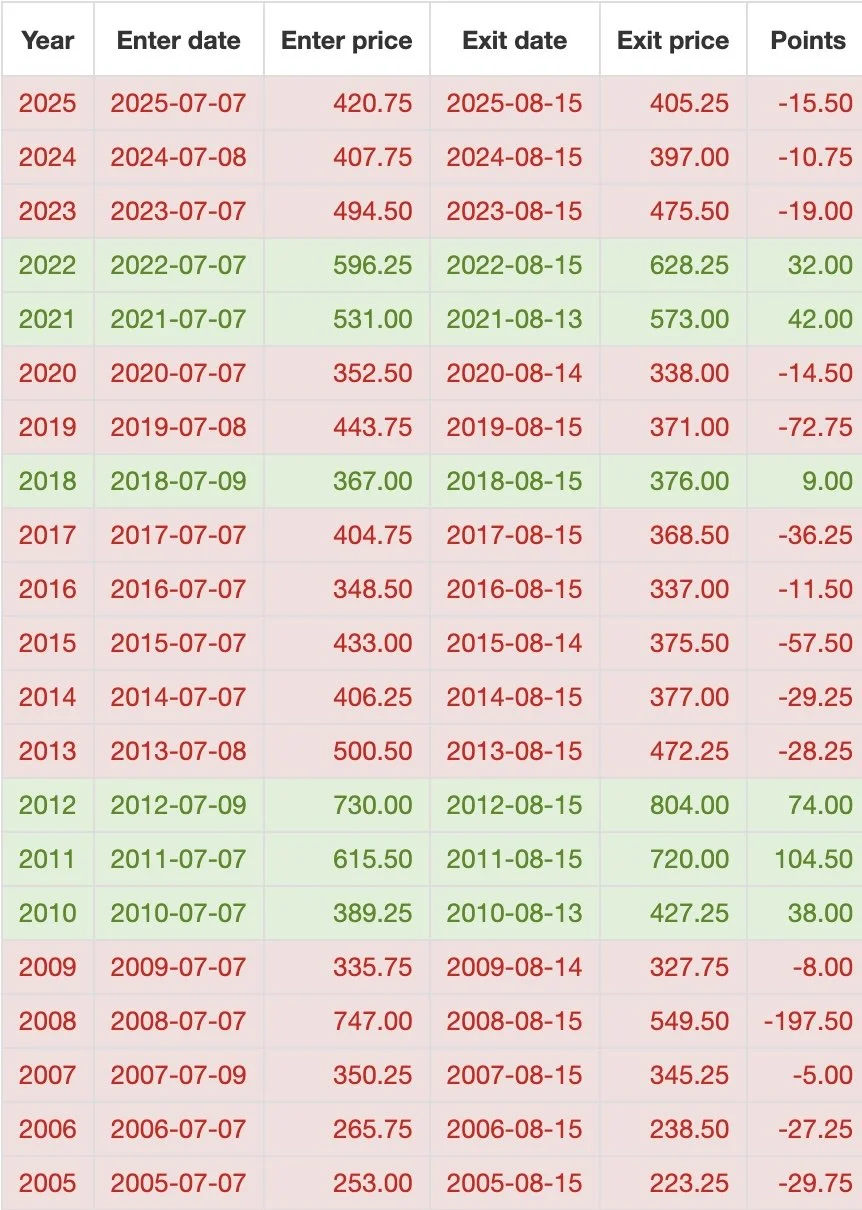
Now for some data.
Here is from today by August 15th.
We have been lower the last 10 of 13 years.
So it probably makes sense to defend this rally here soon.
It doesn’t mean we can’t go higher first, but often times we are lower come mid-August.
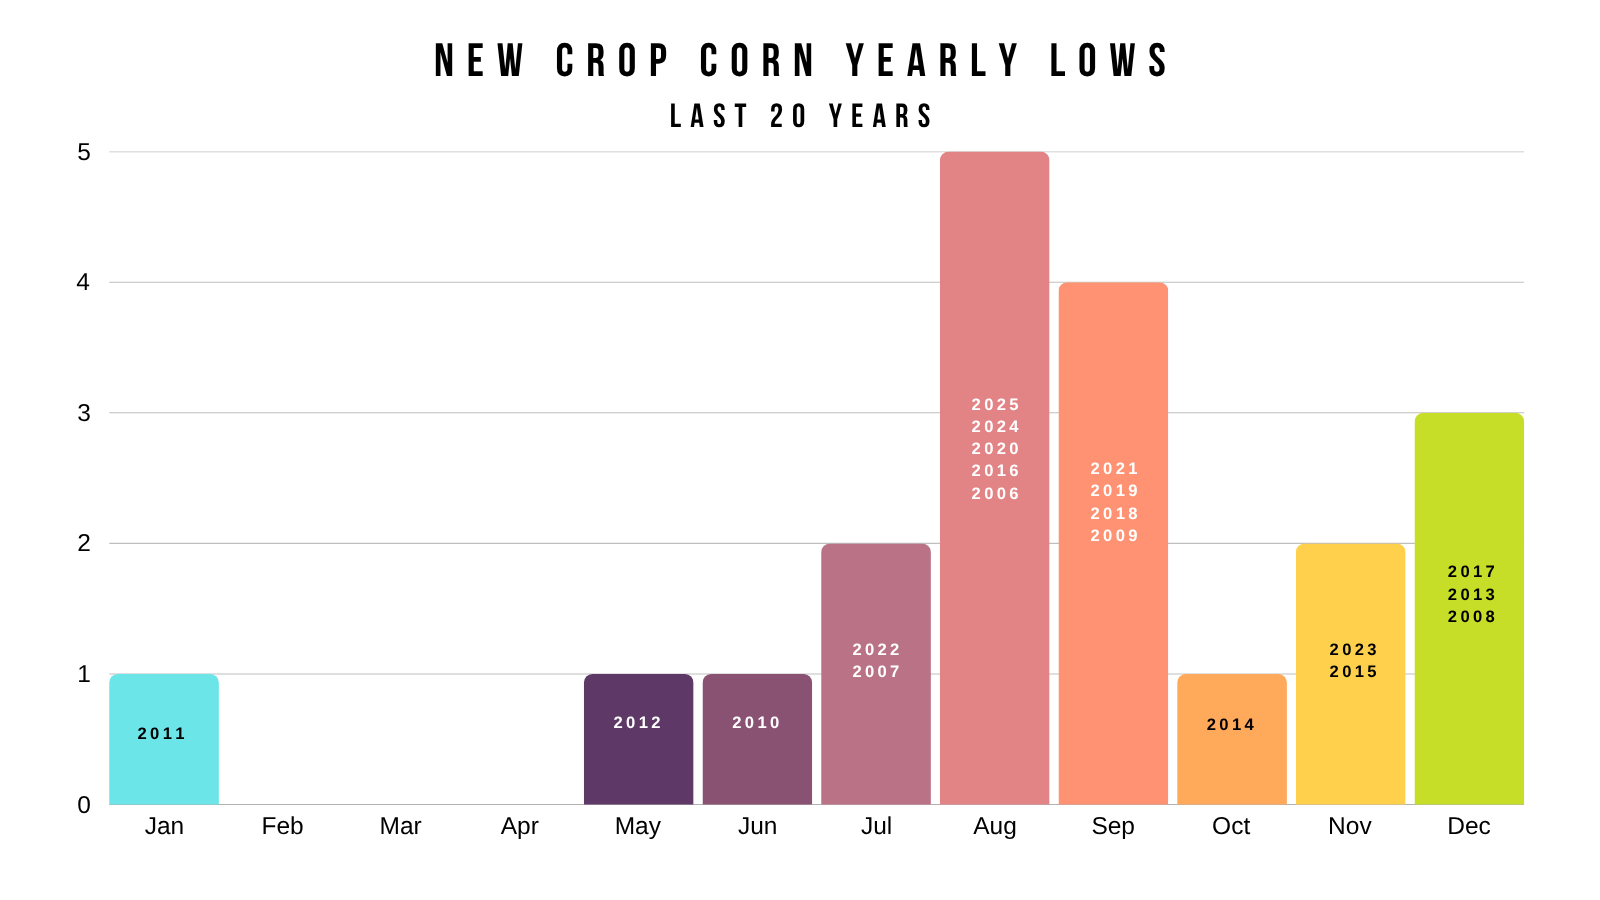
As I've talked about a lot, we rarely post our lowest price of the year in June.
So it makes sense to defend the rally soon or scale into something, especially for those who lack storage or know you are going to have to move stuff off the combine.
If you are someone who has plenty of storage, I don’t mind being patient or less aggressive at all. As I do think there will be opportunities down the road and into next year.
People with plenty of storage should have far different marketing plans than those that do not.
Could the lows be in for the rest of the year? Of course it is always possible.
But unless China steps in and flips this market on it's head, we have to realize that a supply scare rally is not the same as a demand driven rally.
A supply scare rally due to a weather scare, usually does not last.
A demand driven rally due to something such as China, usually lasts.
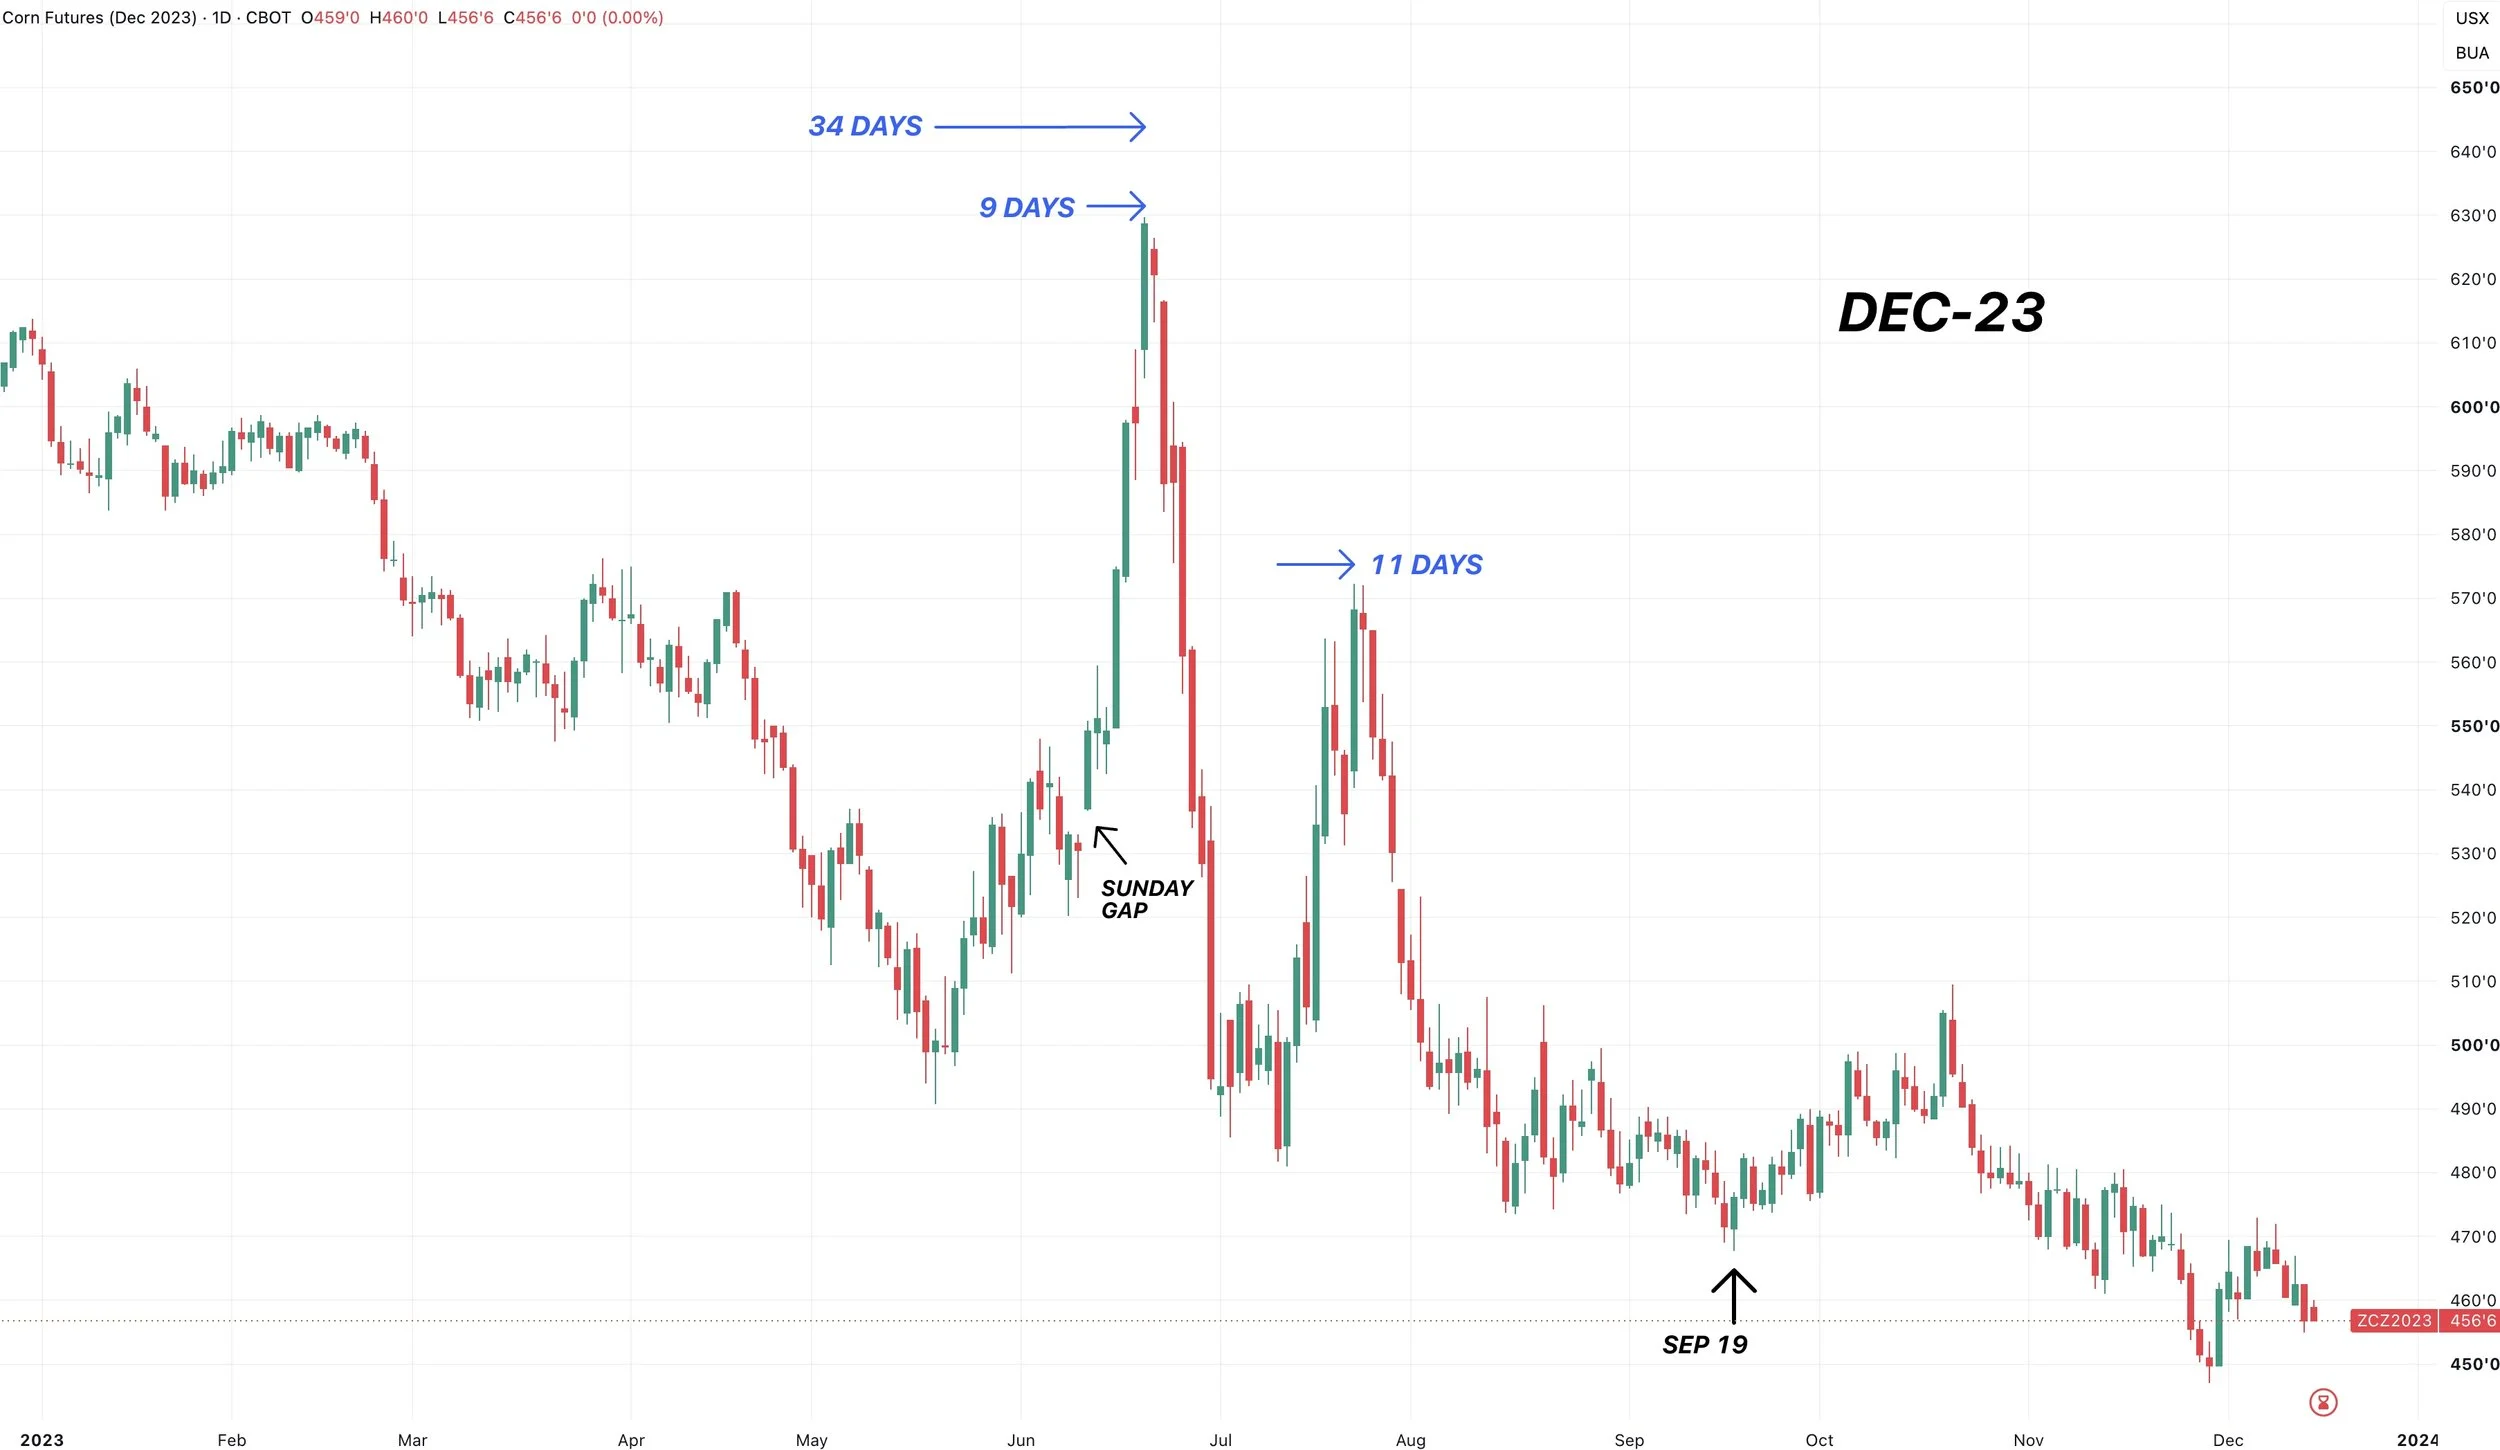
Here is the 2023 drought scare rally for reference.
It was a month long rally from the lows to the highs.
But from the Sunday night we gapped open higher to the highs lasted just 9 days.
So if this is purely nothing more than a weather scare rally, it might not last.
If this starts to turn into demand led rally via China, then it can go a lot farther.
Charts & Targets
Sep Corn Chart:
We are nearing our first target here in Sep.
$4.49 claws back 50% of the entire sell off.
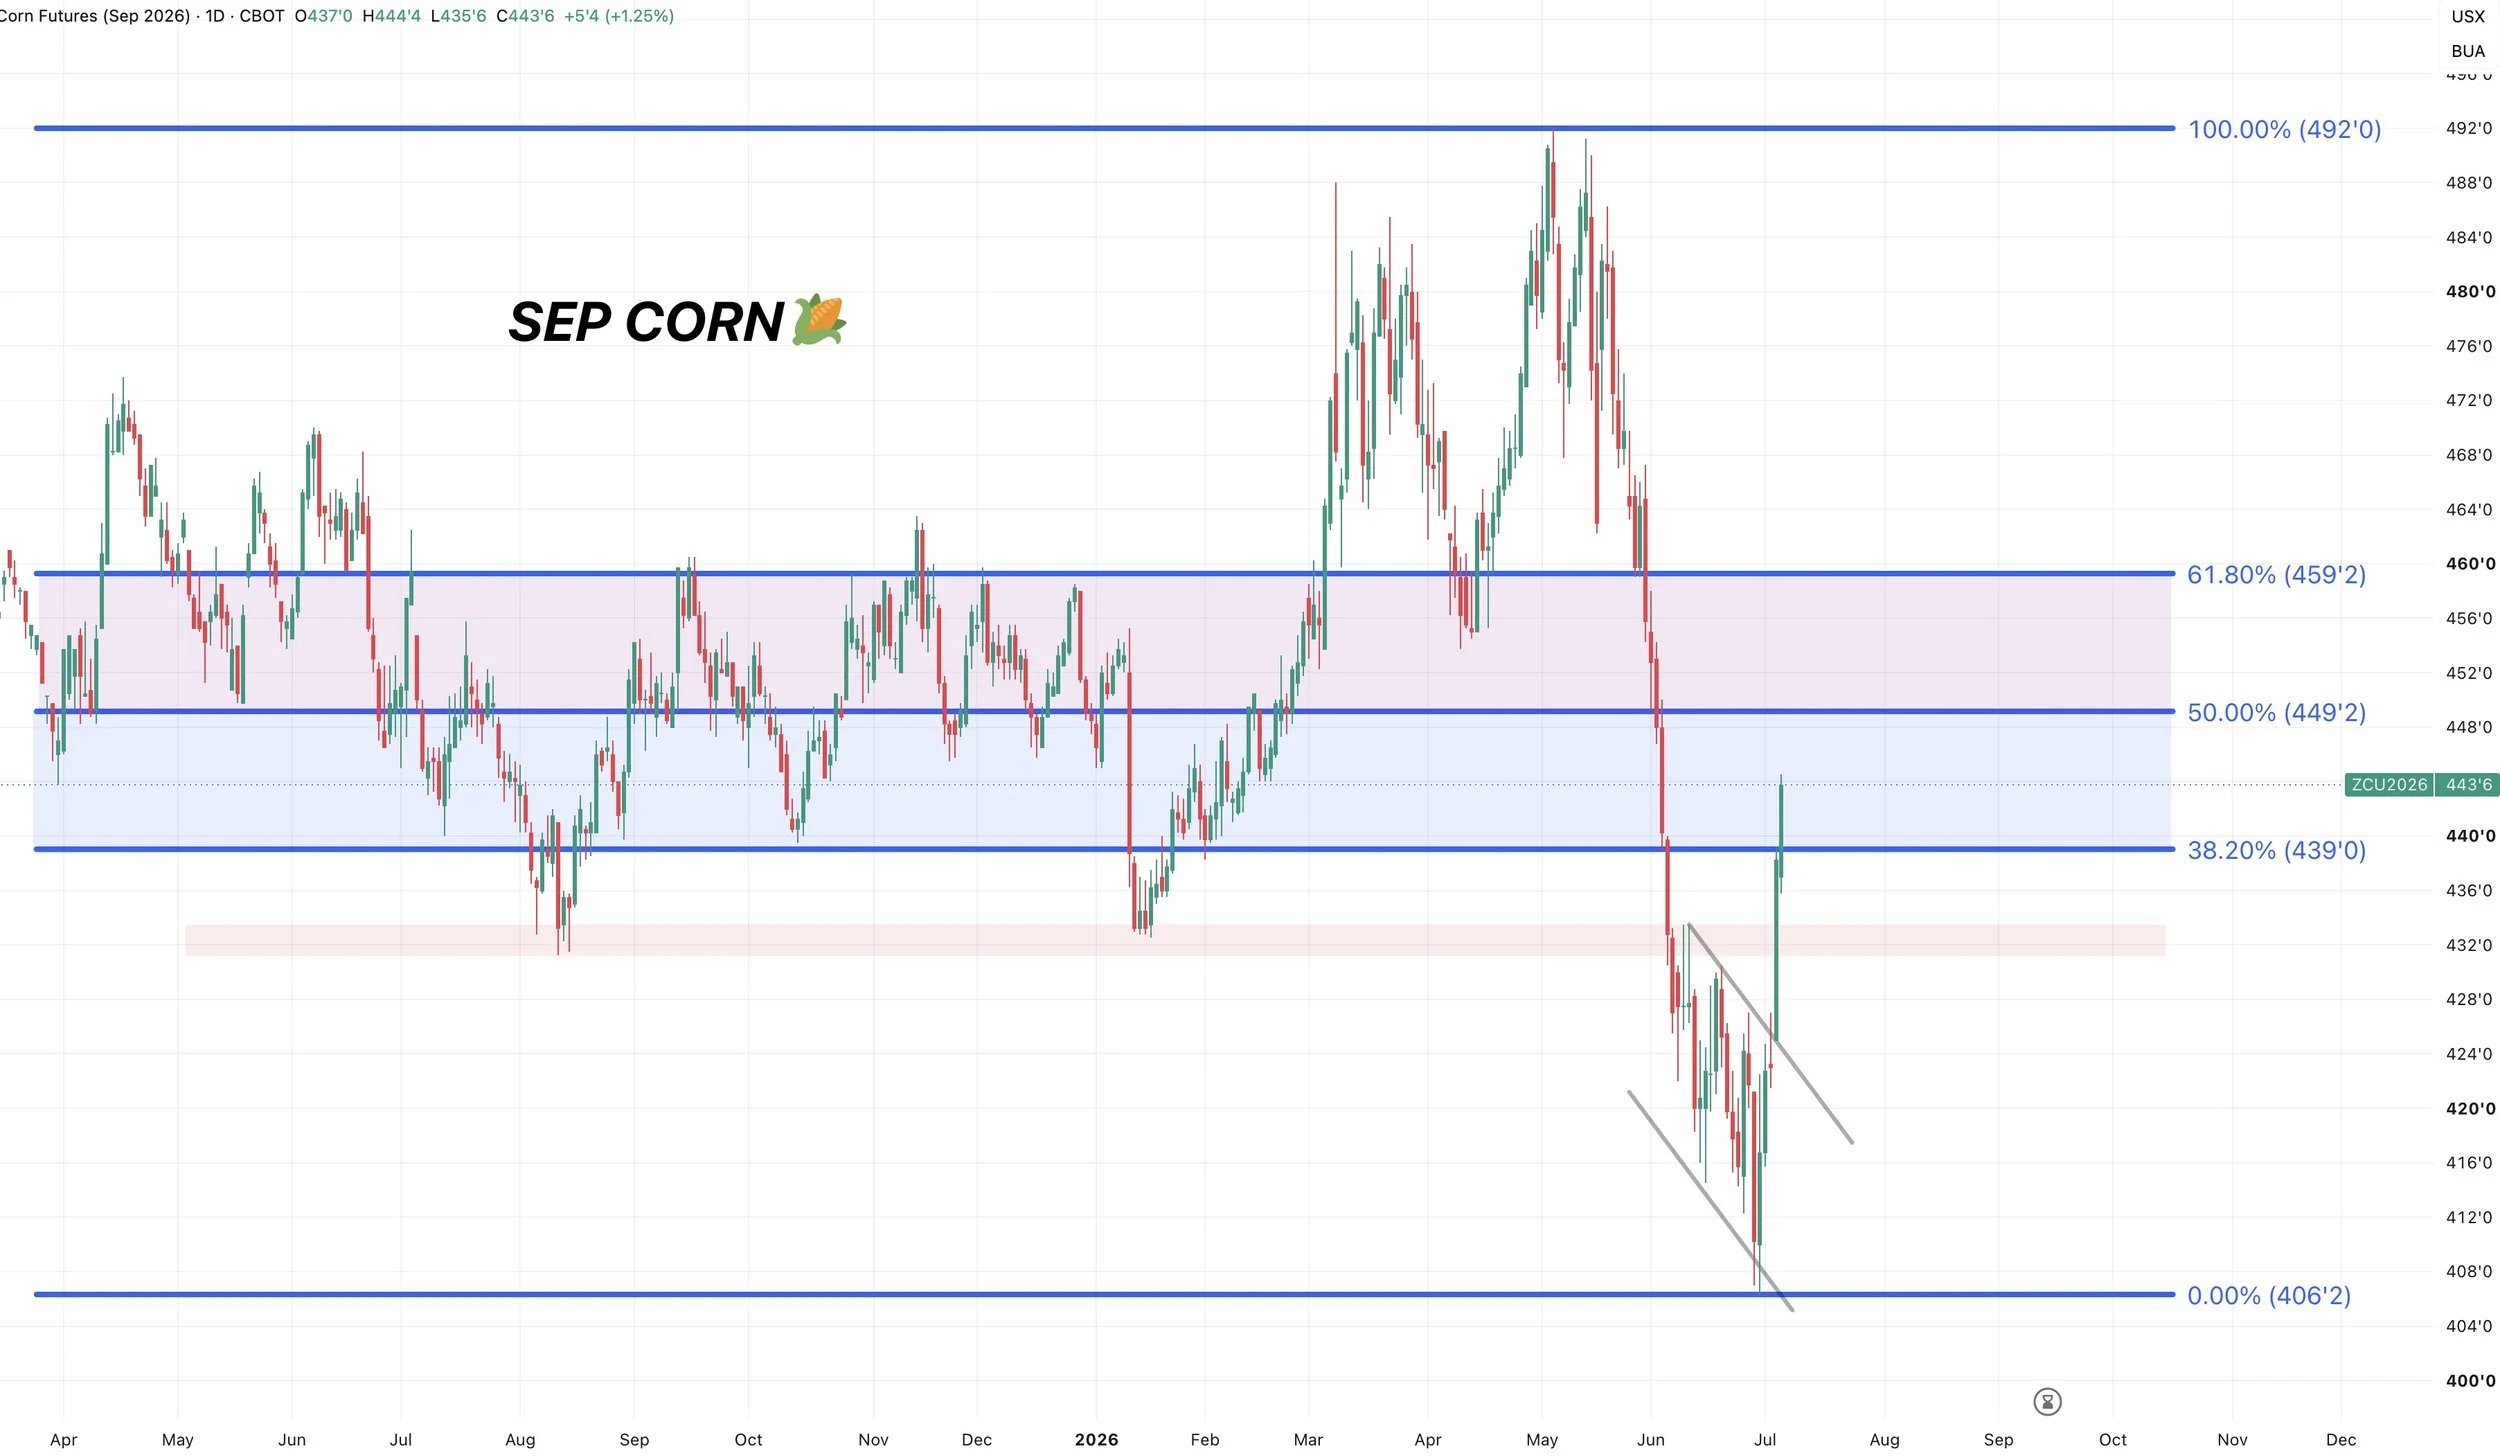
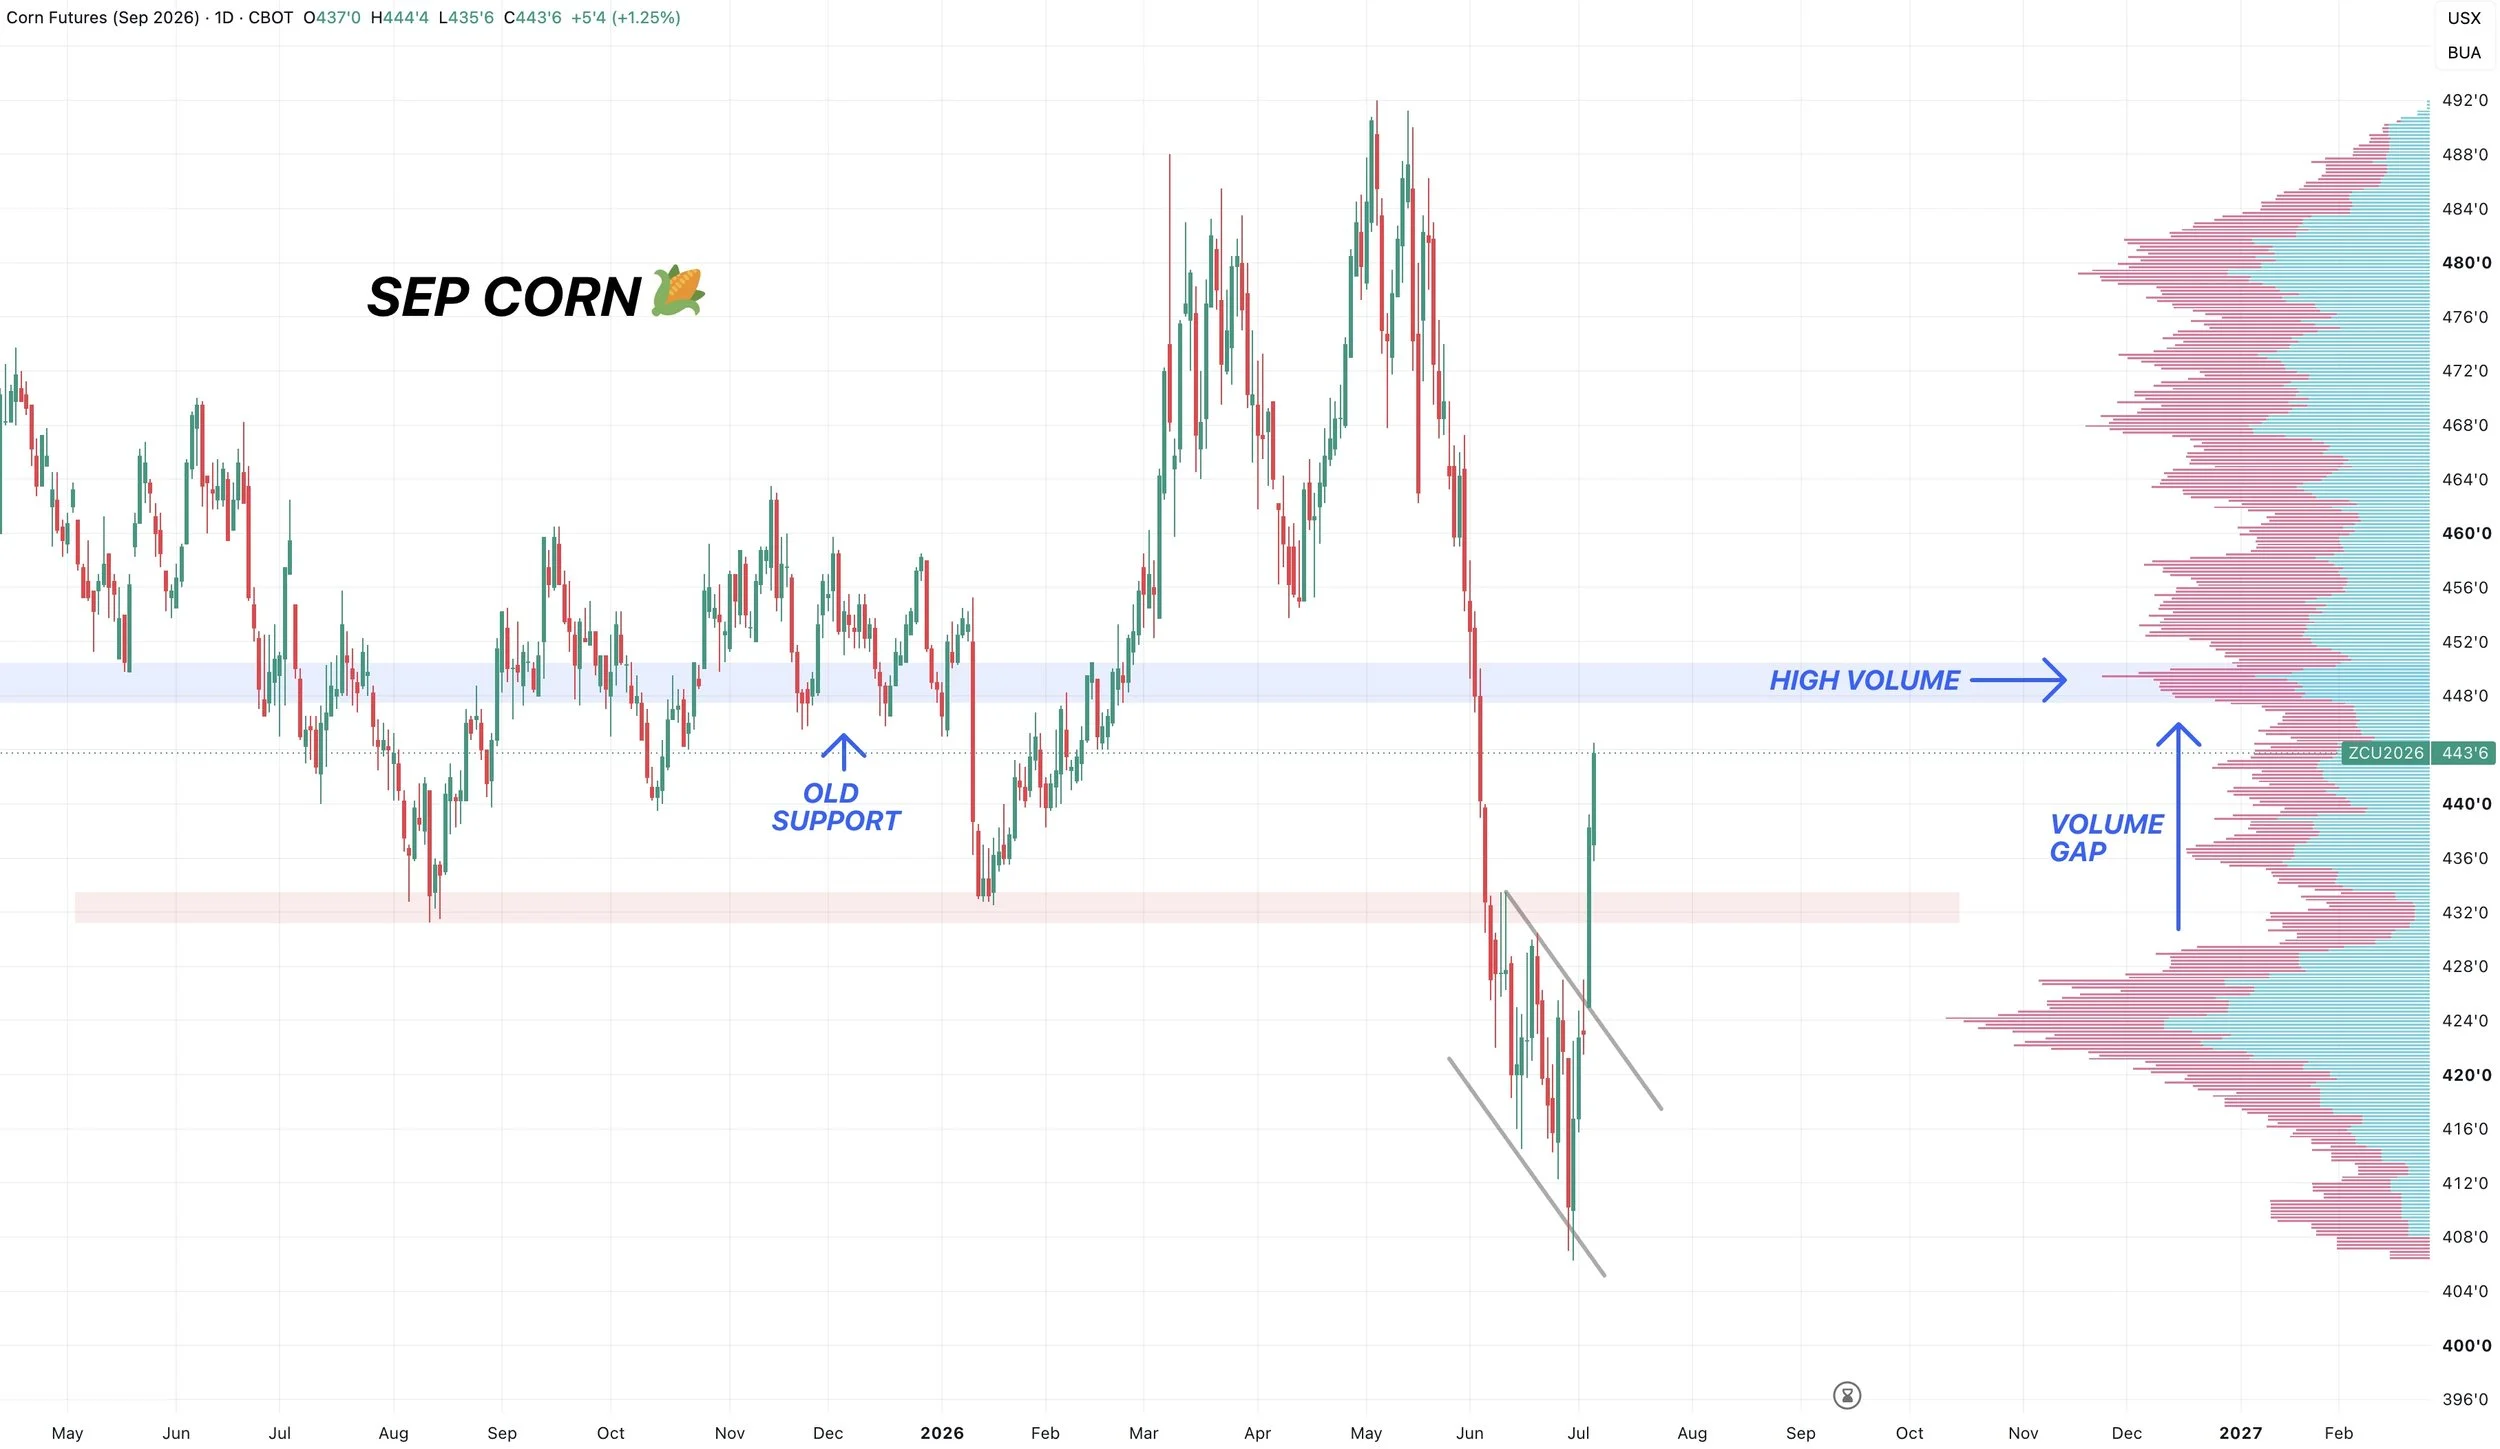
That same $4.49 level is support from the fall as well as the next area of high volume.
We had been talking about the volume gaps for a while. We broke above the area of high volume, so we are running through the volume gap.
As prices tend to slice through areas low volume because there is no resistance.
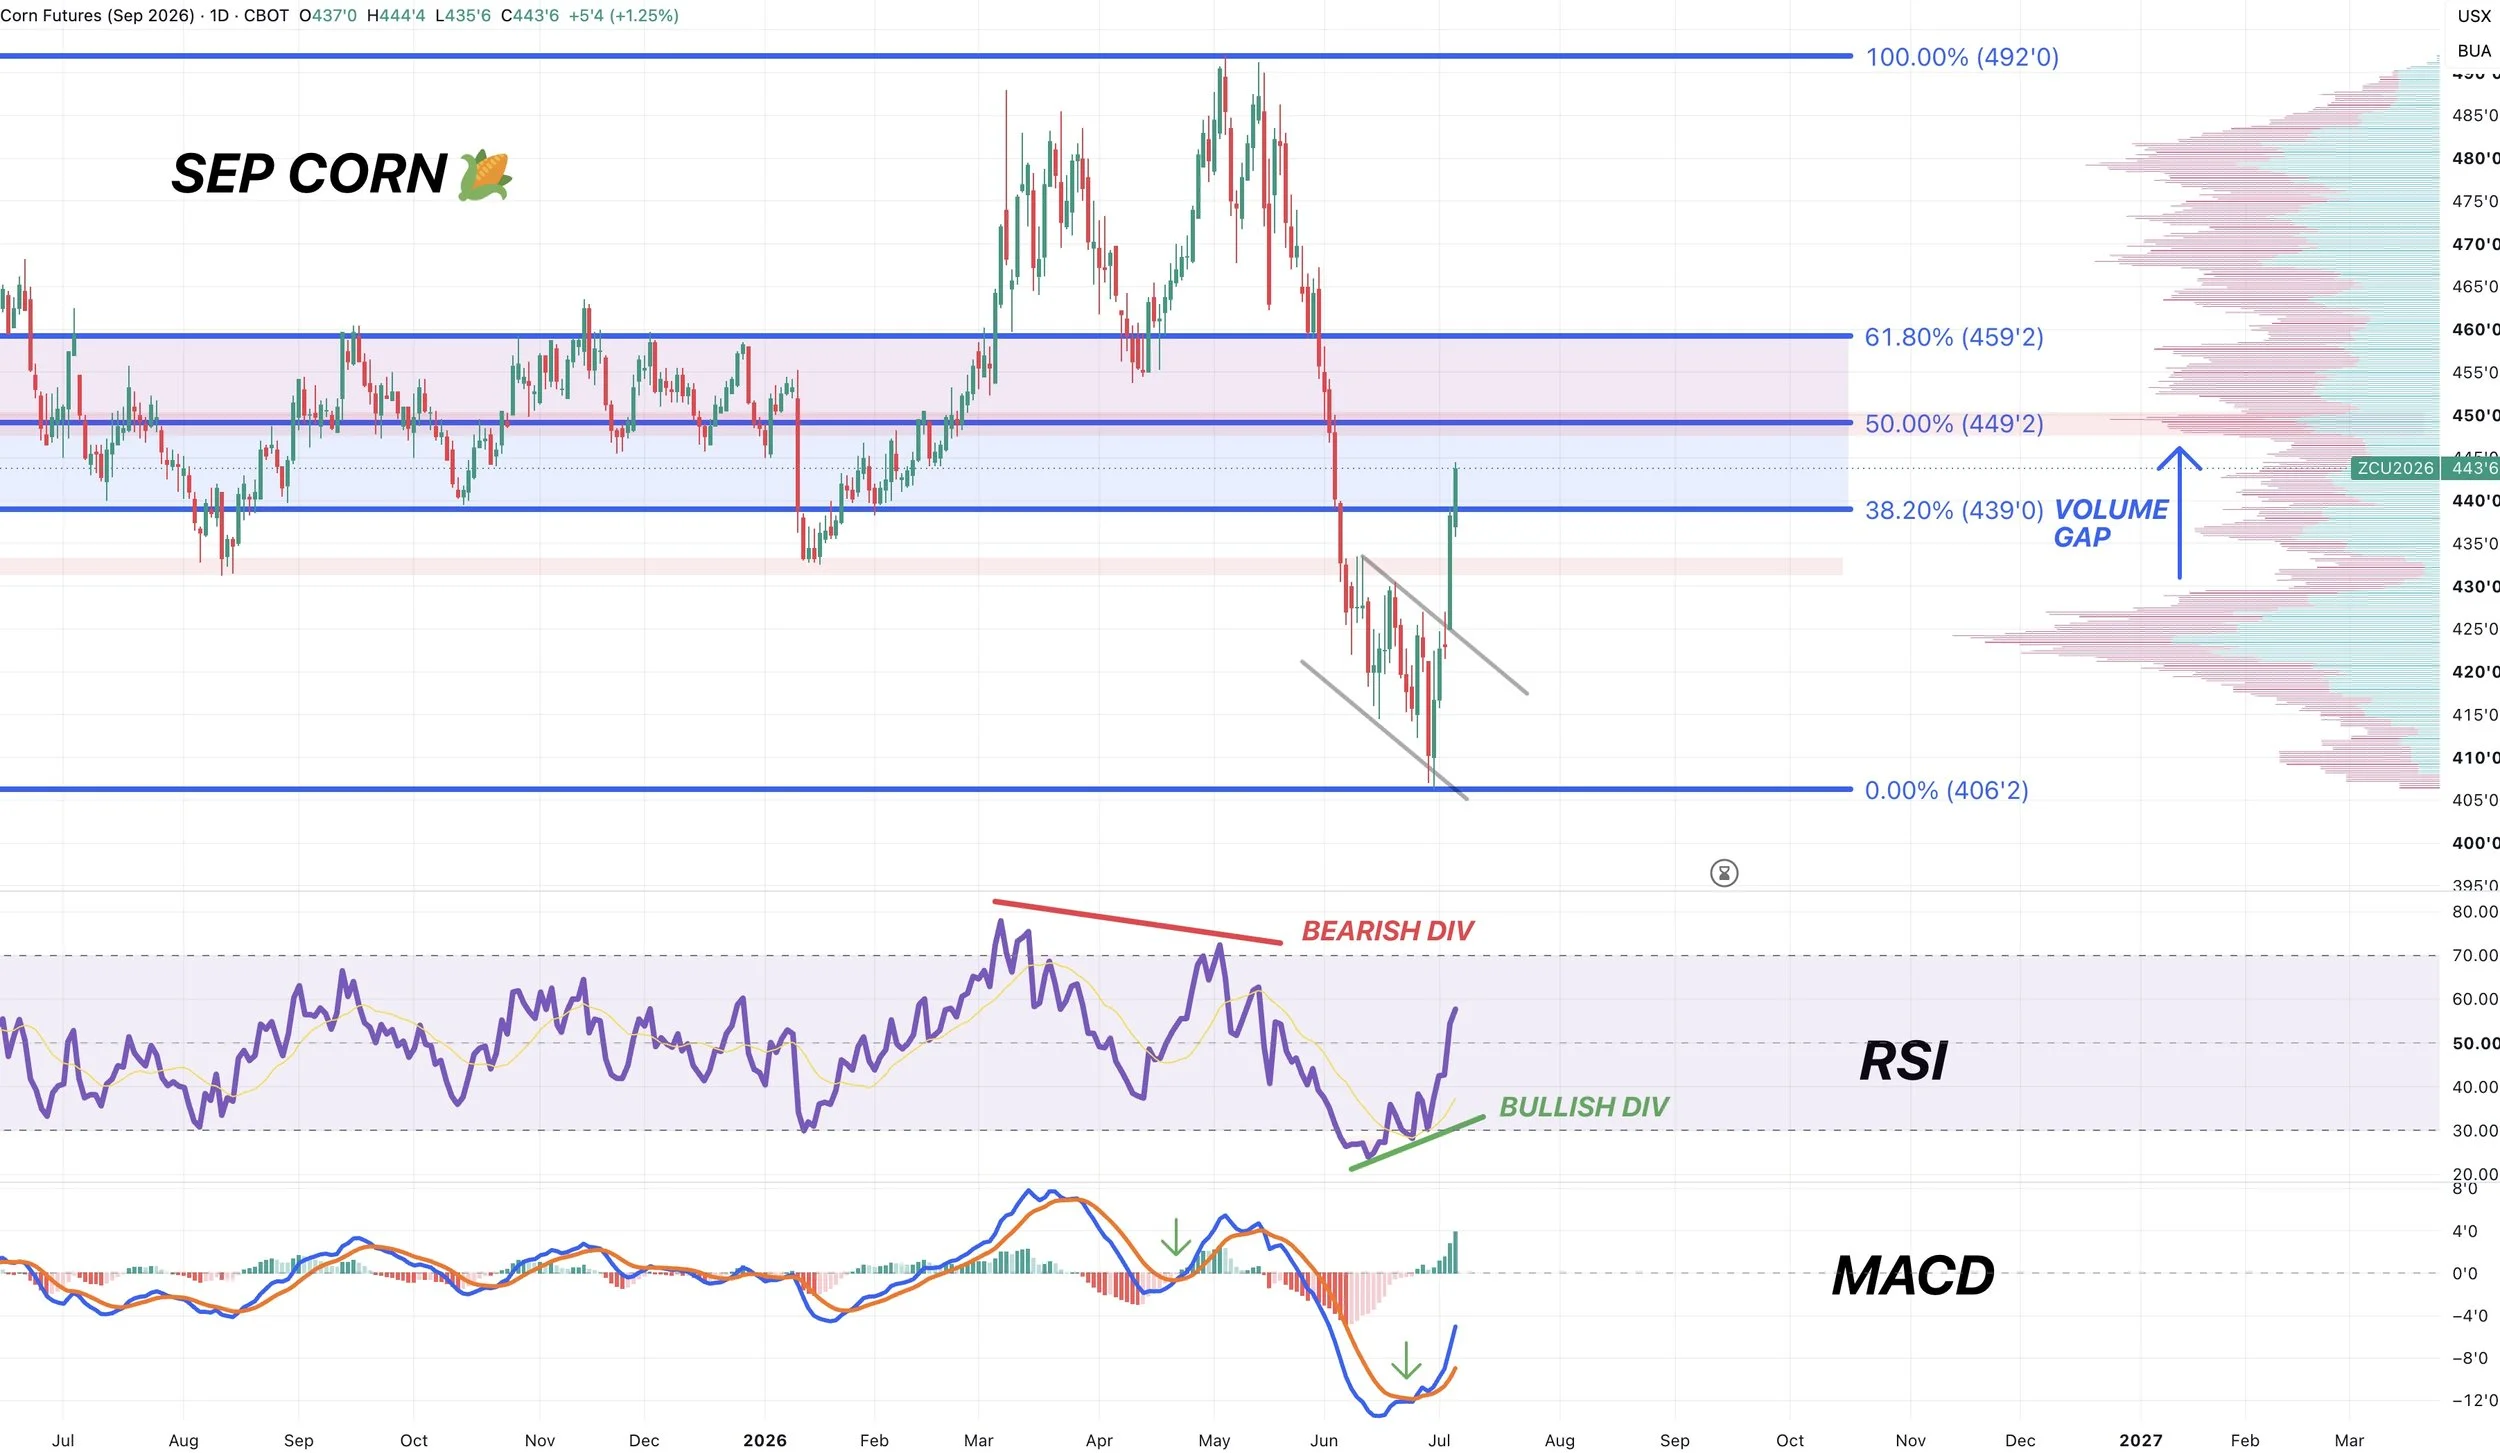
The last week or two we have been talking about how the indicators were showing some signs that we were potentially in the process of putting in a local bottom.
We have clear bullish divergence on the RSI. As prices were making new lows, the RSI was not.
At the same time, the MACD crossed bullish for the first time since the April rally.
Dec Corn Chart:
The first target in Dec is $4.65 to $4.70
$4.66 claws back 50% of the entire sell off.
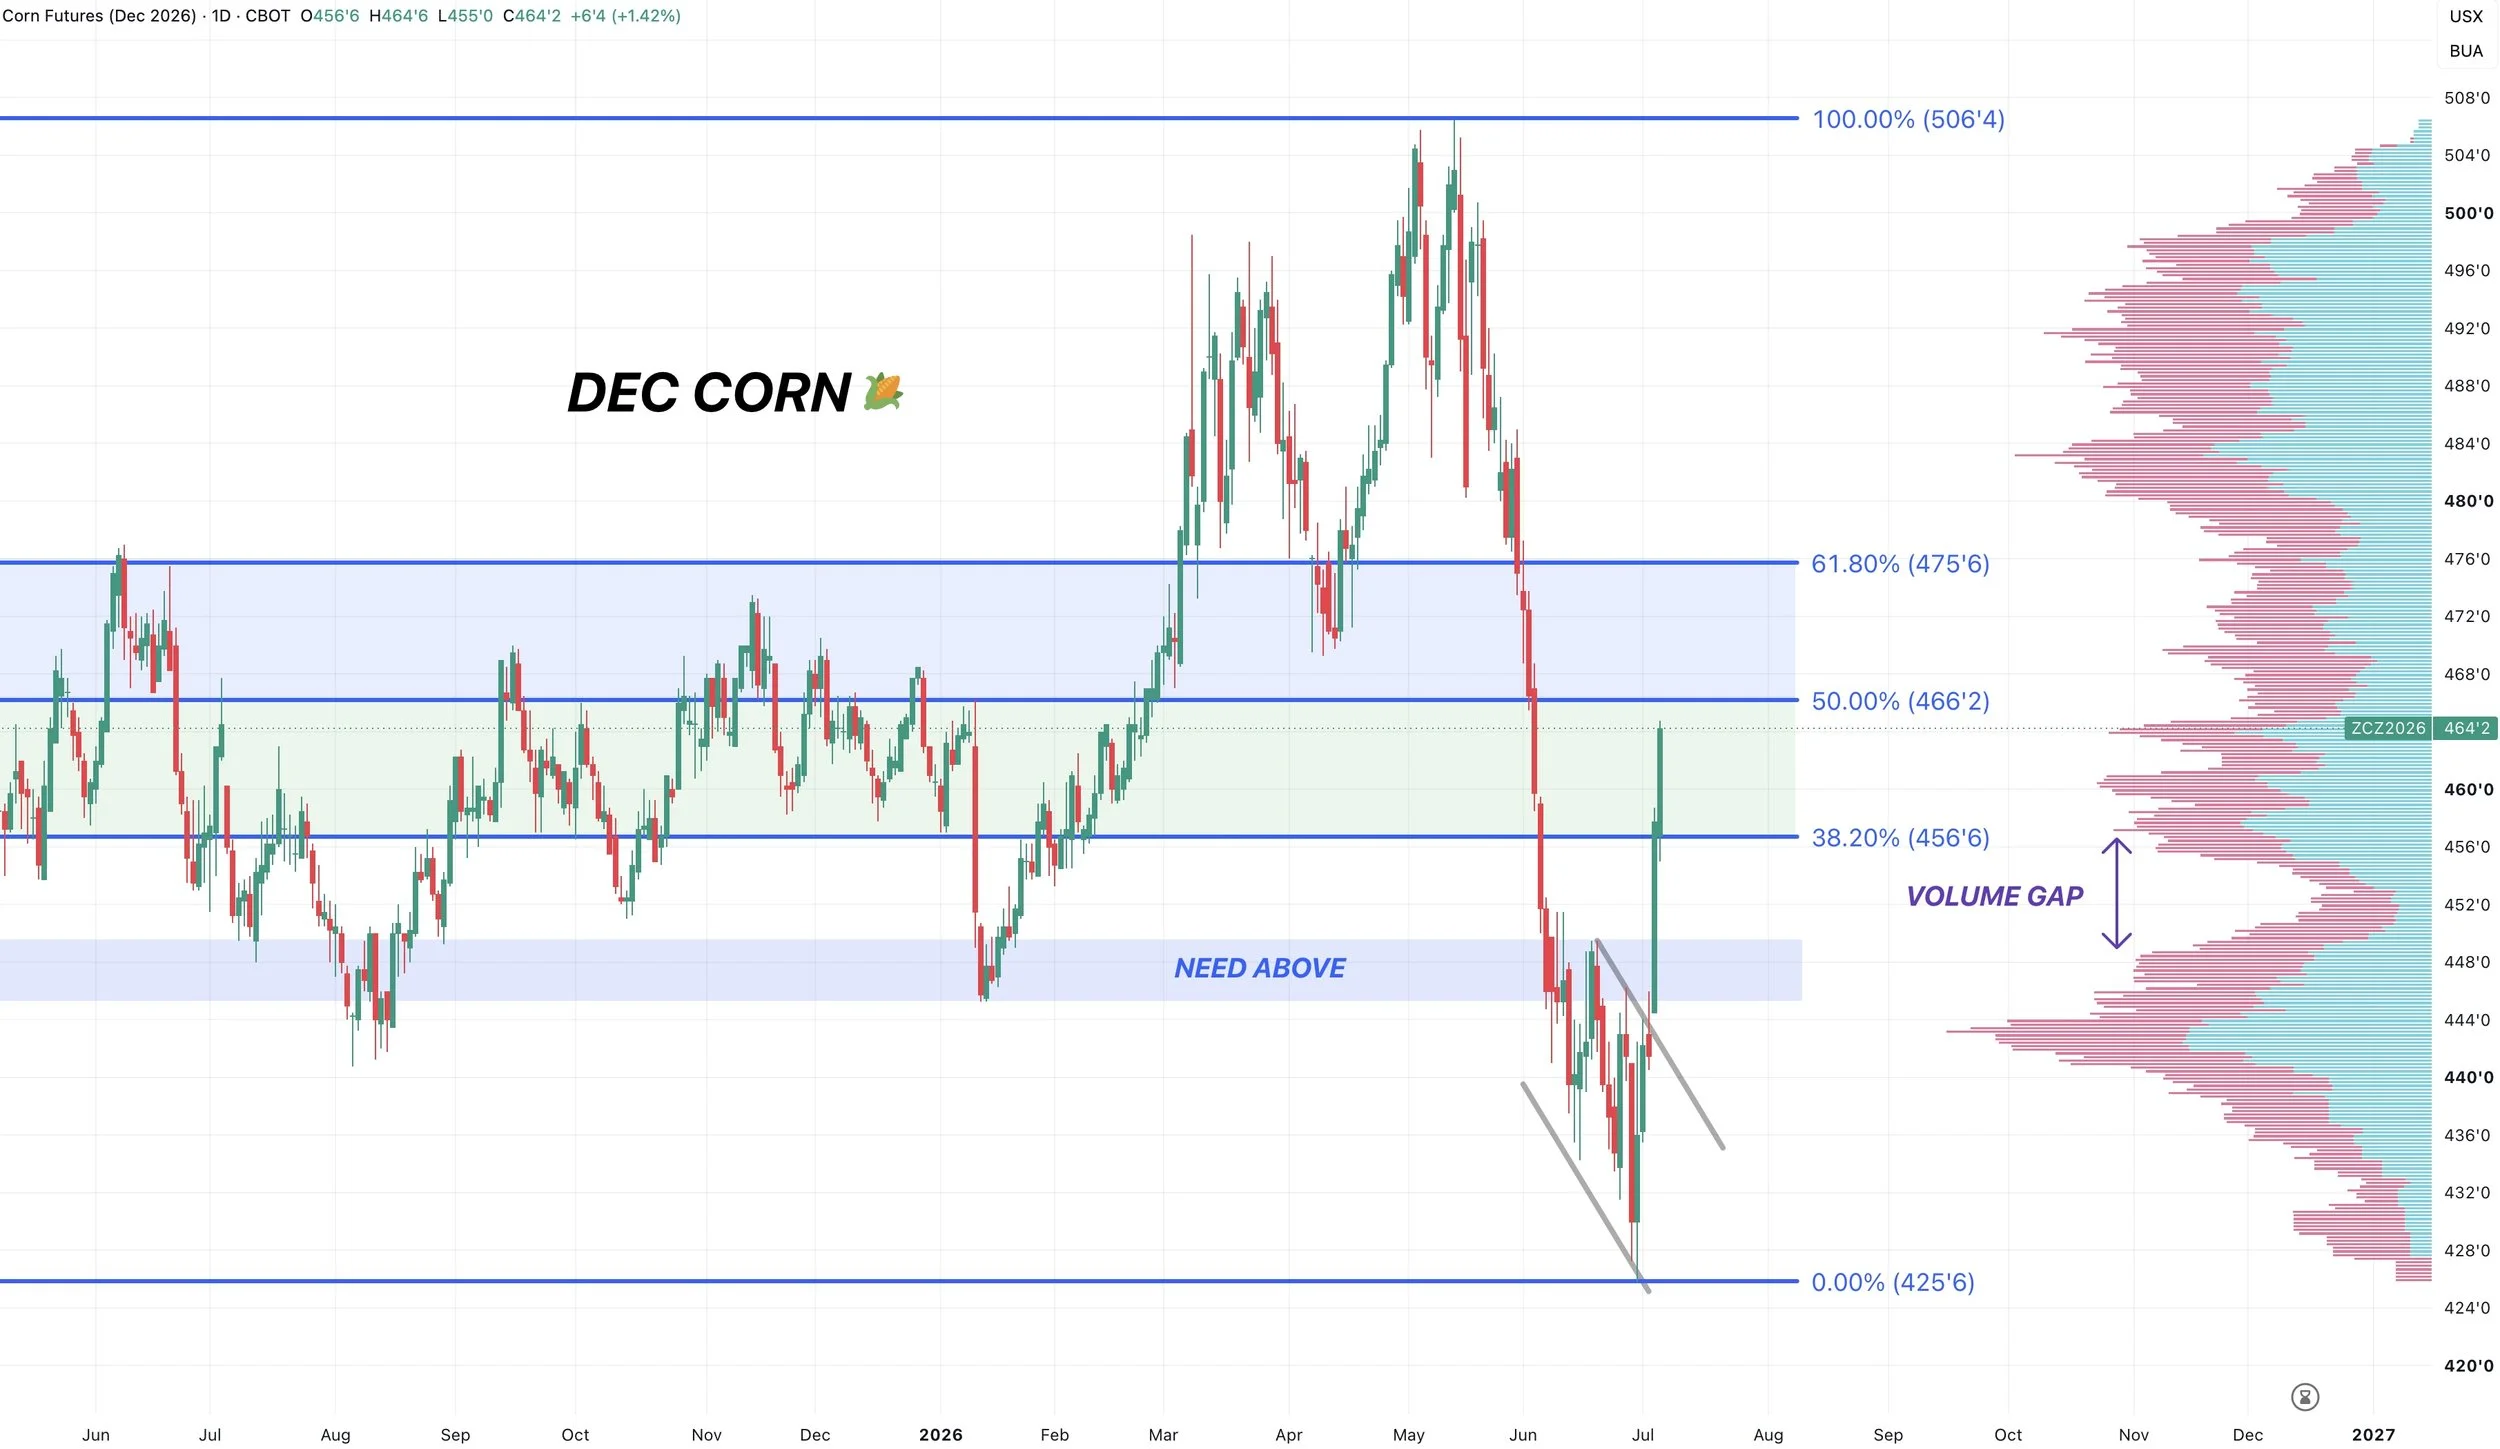
$4.70 is where this market failed at time and time again back in the fall.
It's also where the market bottomed out in April.
So it's been a clear point of support and resistance in the past.
We also have the 200-day MA that sits at $4.67
So I do think it makes sense to protect this 40 cent rally here soon.
Continuous Daily Chart:
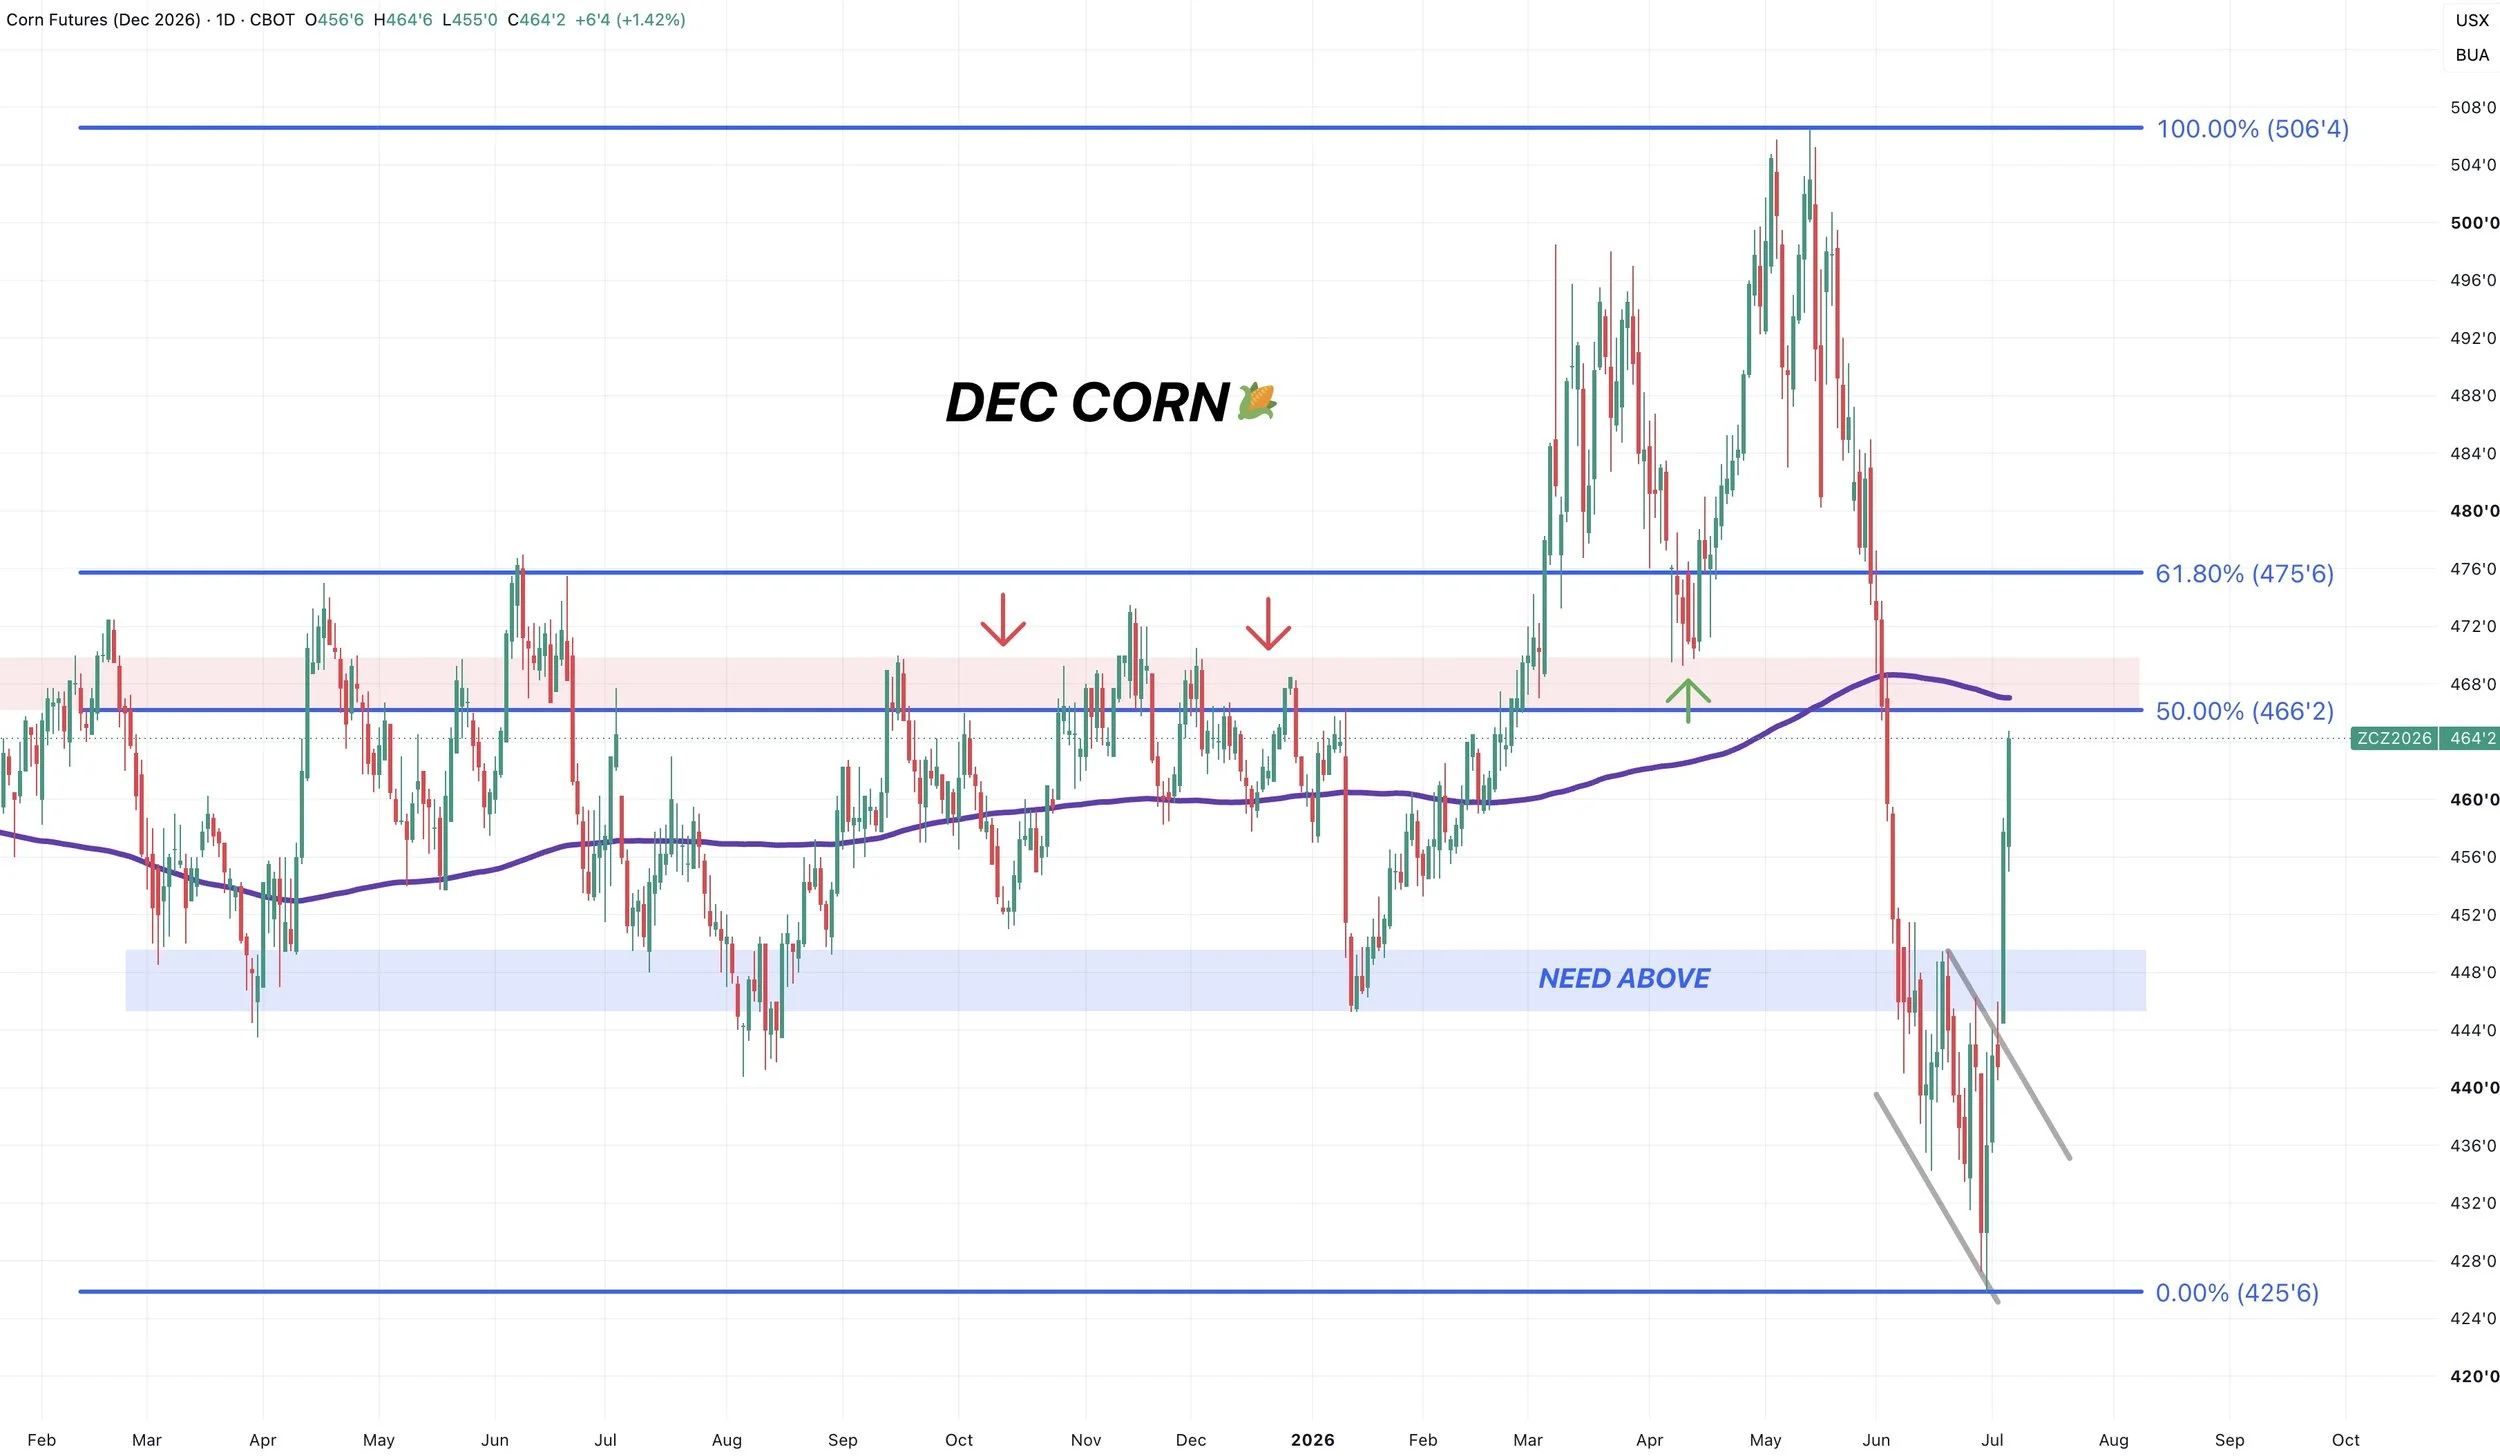
I've shown these next two chart the last few weeks.
We bounced right at our last level of support on this chart. A perfect bounce right where we wanted to see us do so.
Now approaching some possible resistance.
I haven’t moved that arrow since I showed this weeks ago, and that is still a possible scenario I think it possible. Altough it does not have to happen.
Continuous Weekly Chart:
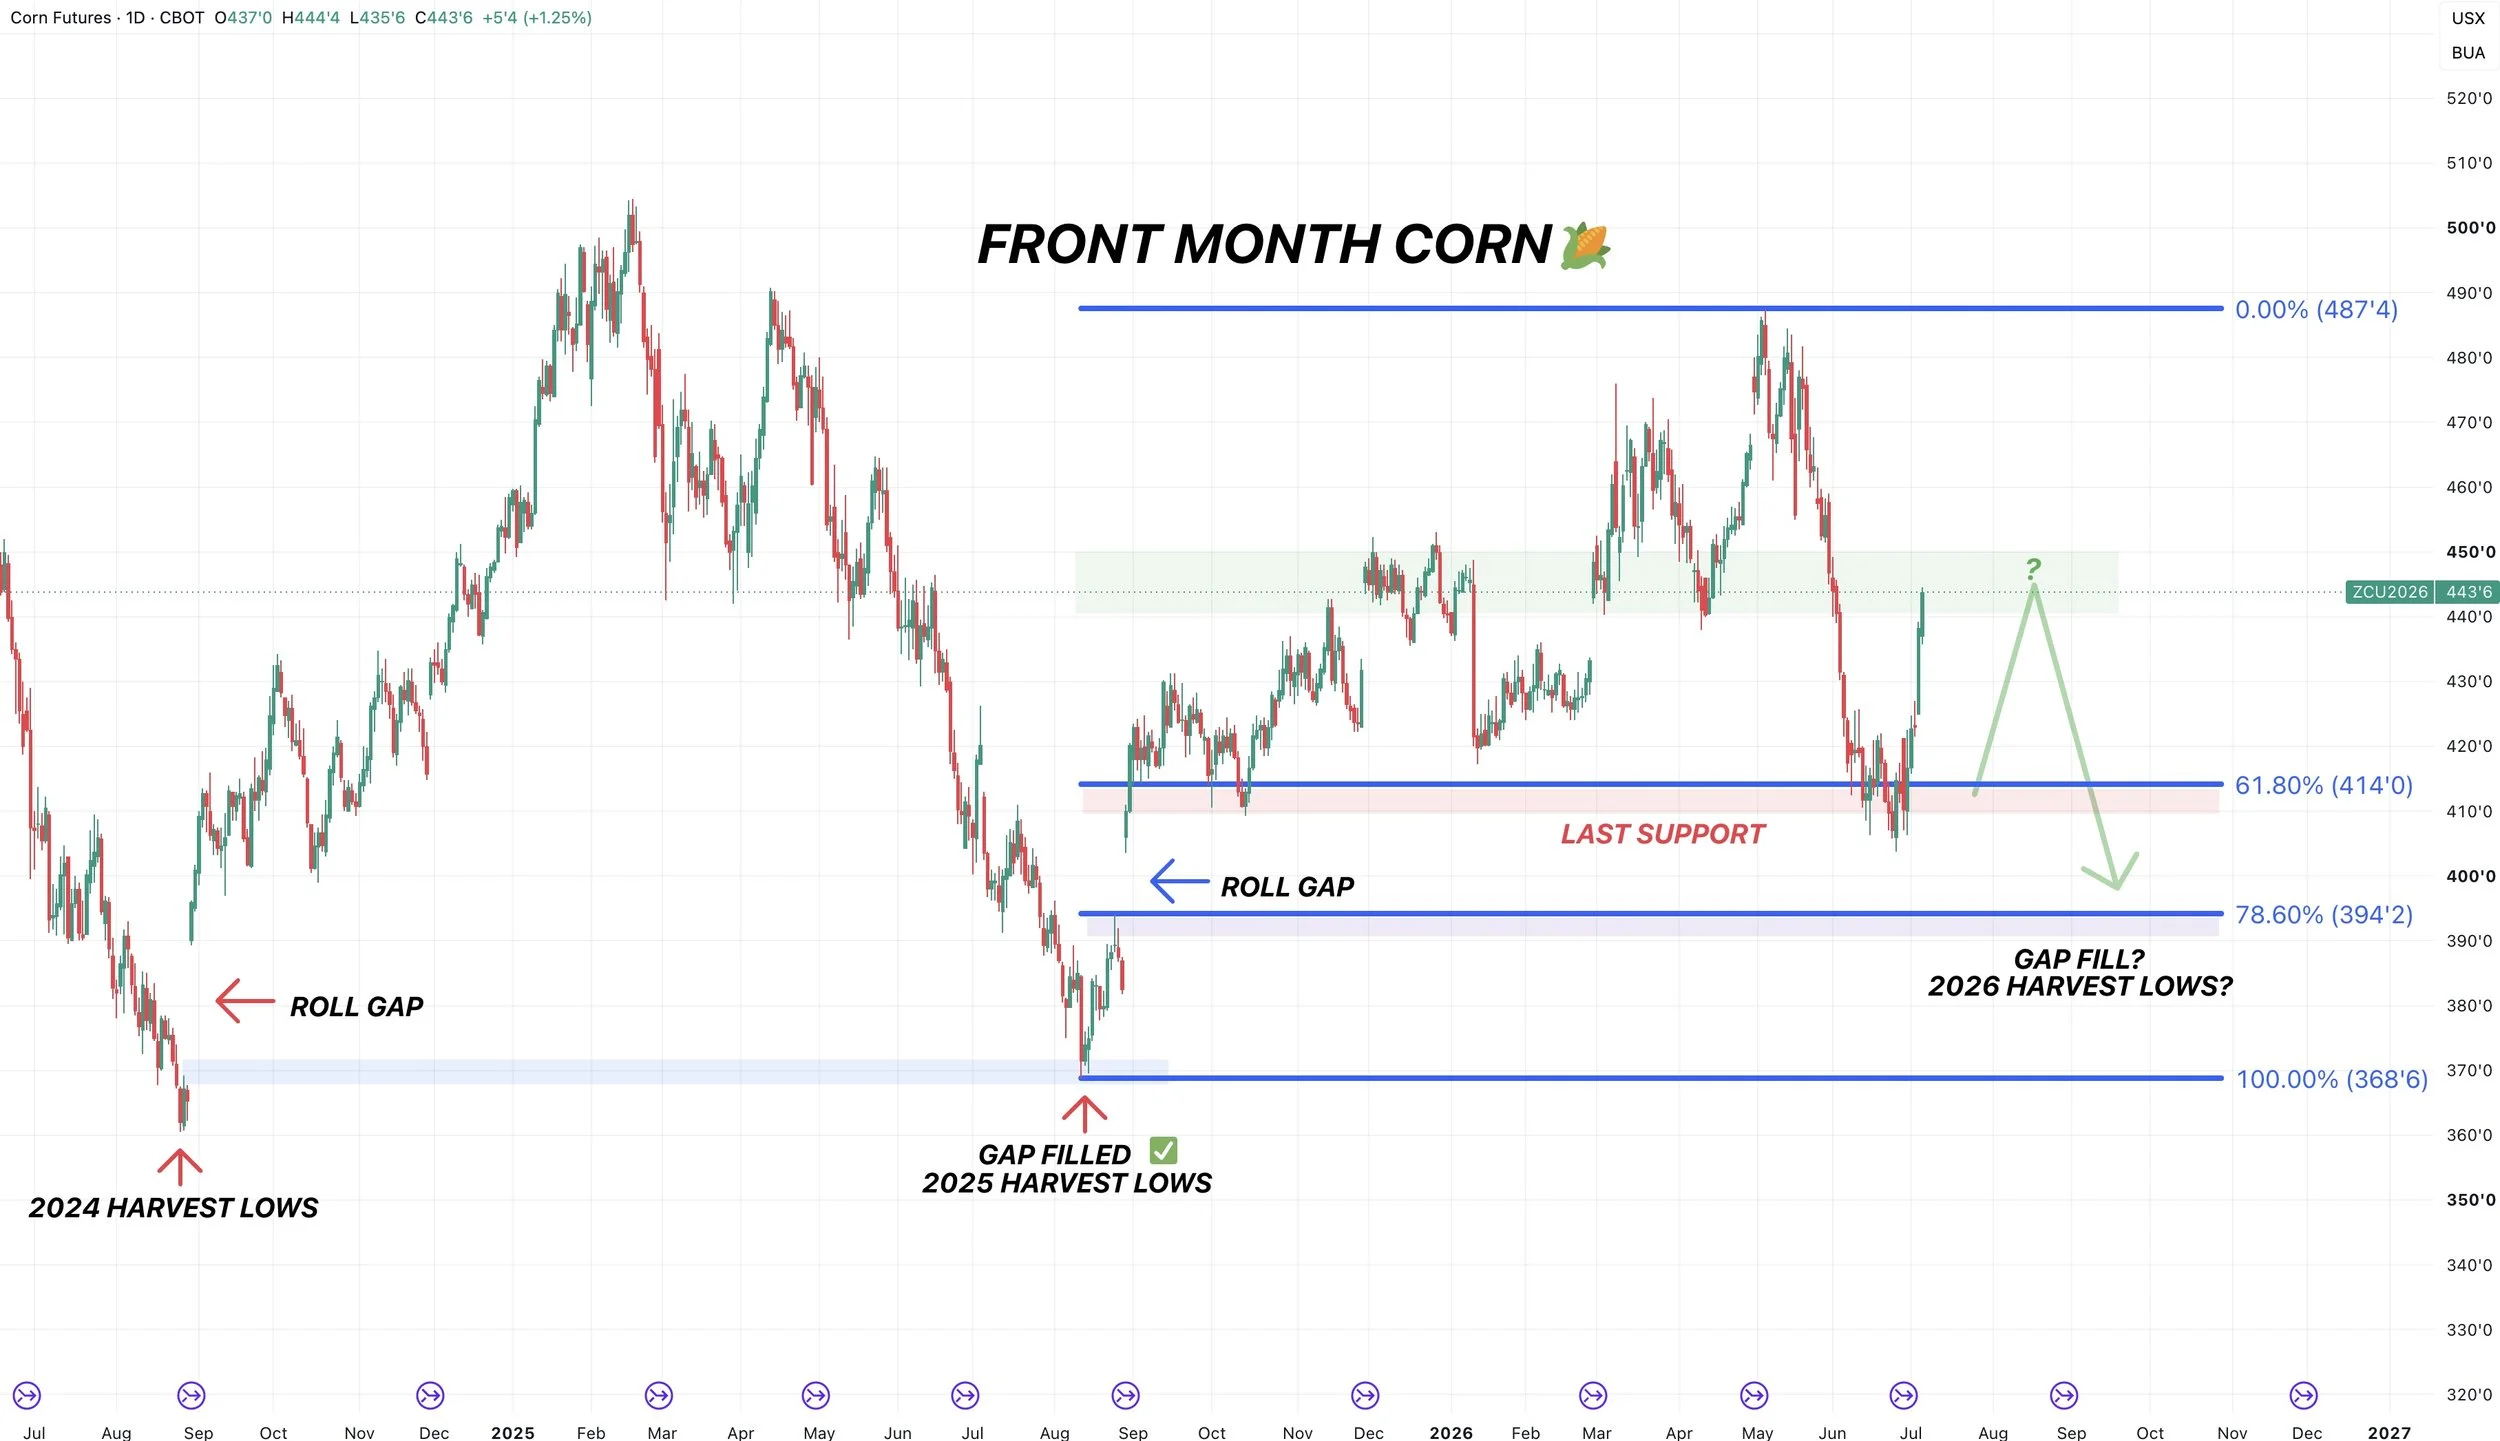
I still think there is a possibility we could get one final leg lower into harvest. Potentially along that trendline that has marked 3 previous harvest lows.
Along with the fact that our lows have came right around August for several years in a row.
This does not have to play out like this, but still something I want to be cautious of.
You never know how high a weather rallly can take us. Maybe we run into a real problem with the weather or China goes on a shopping spree and we continue higher and that was the absolute lows. But for now it does feel like an opportunity to do something here soon.
Puts would be one way to lock a floor in while keeping your upside open.
Soybeans
The funds are still long soybeans, despite puking out of a large chunk of the position.
They haven’t actually been short soybeans since before the China news last fall.
Since then, they've continued to be long.
They really haven’t made a a serious bearish bet on soybeans since 2024.
So the funds still see a story.
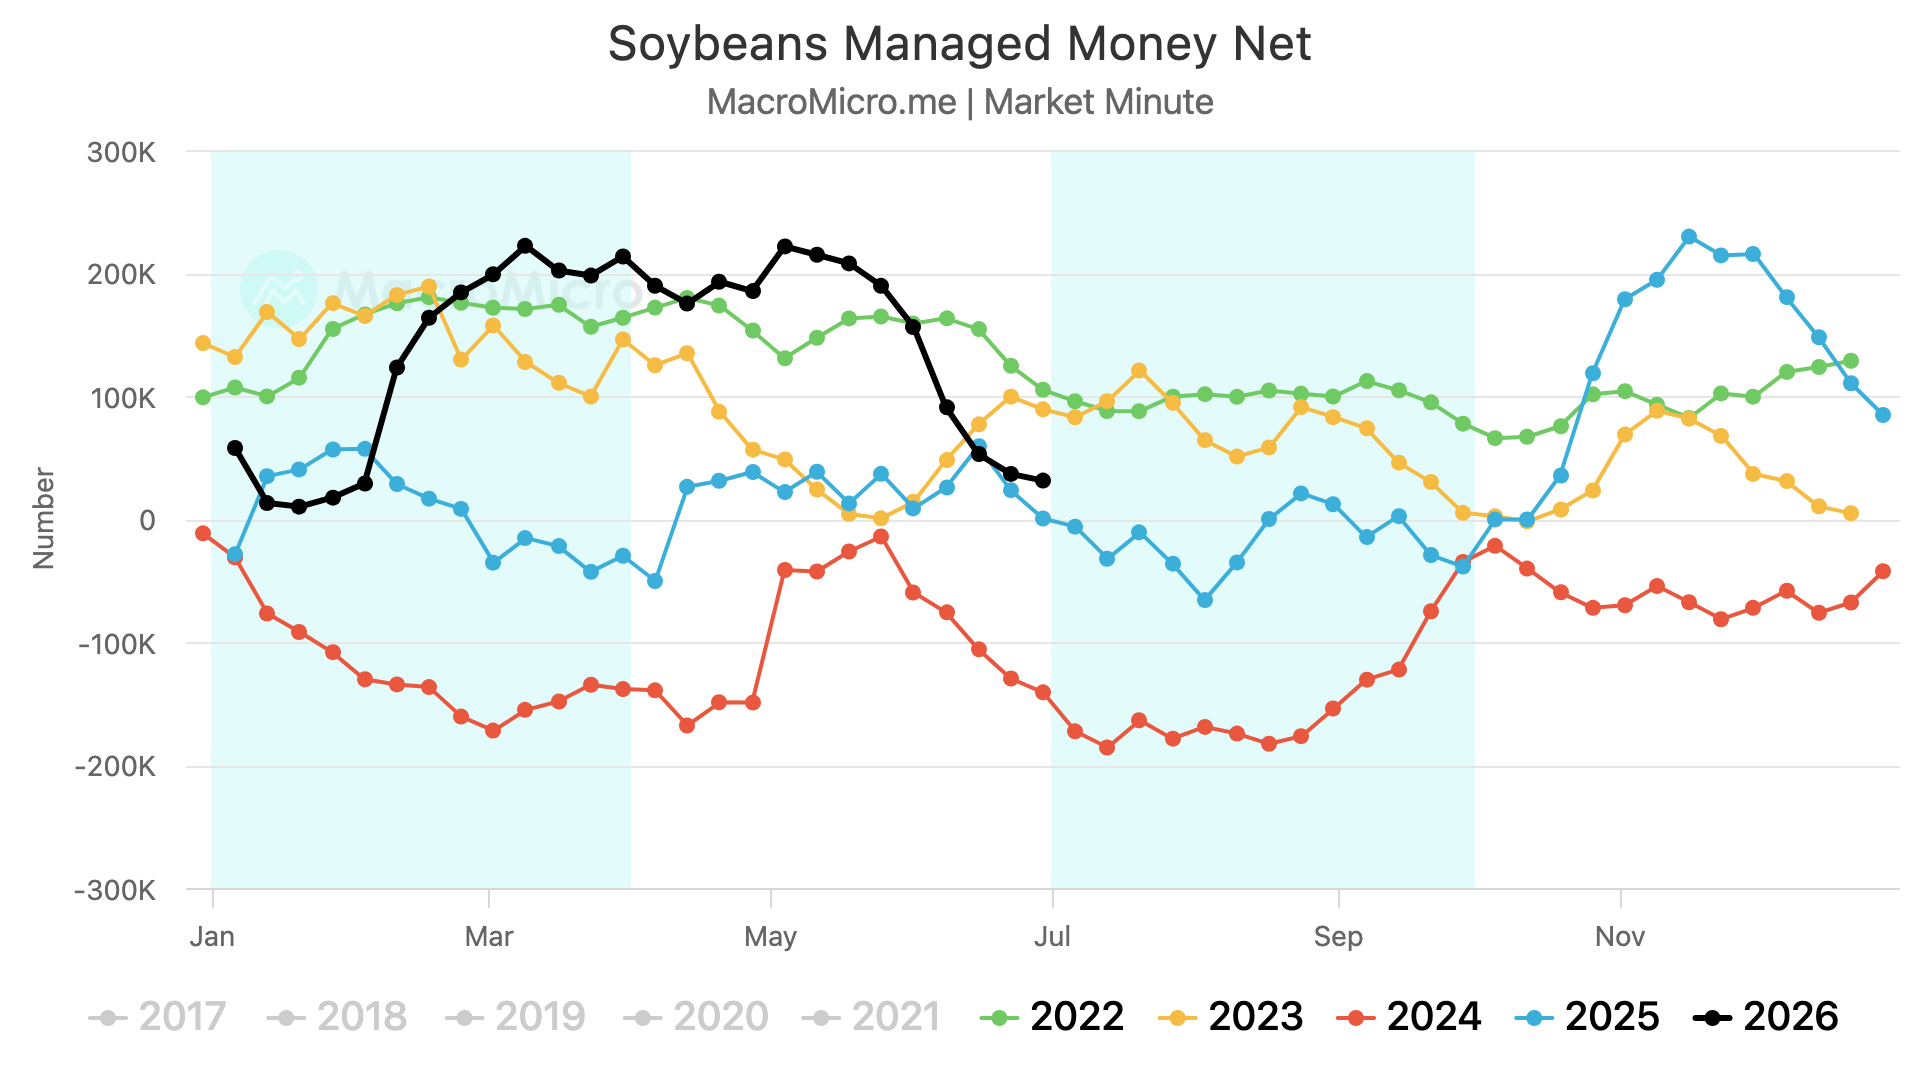
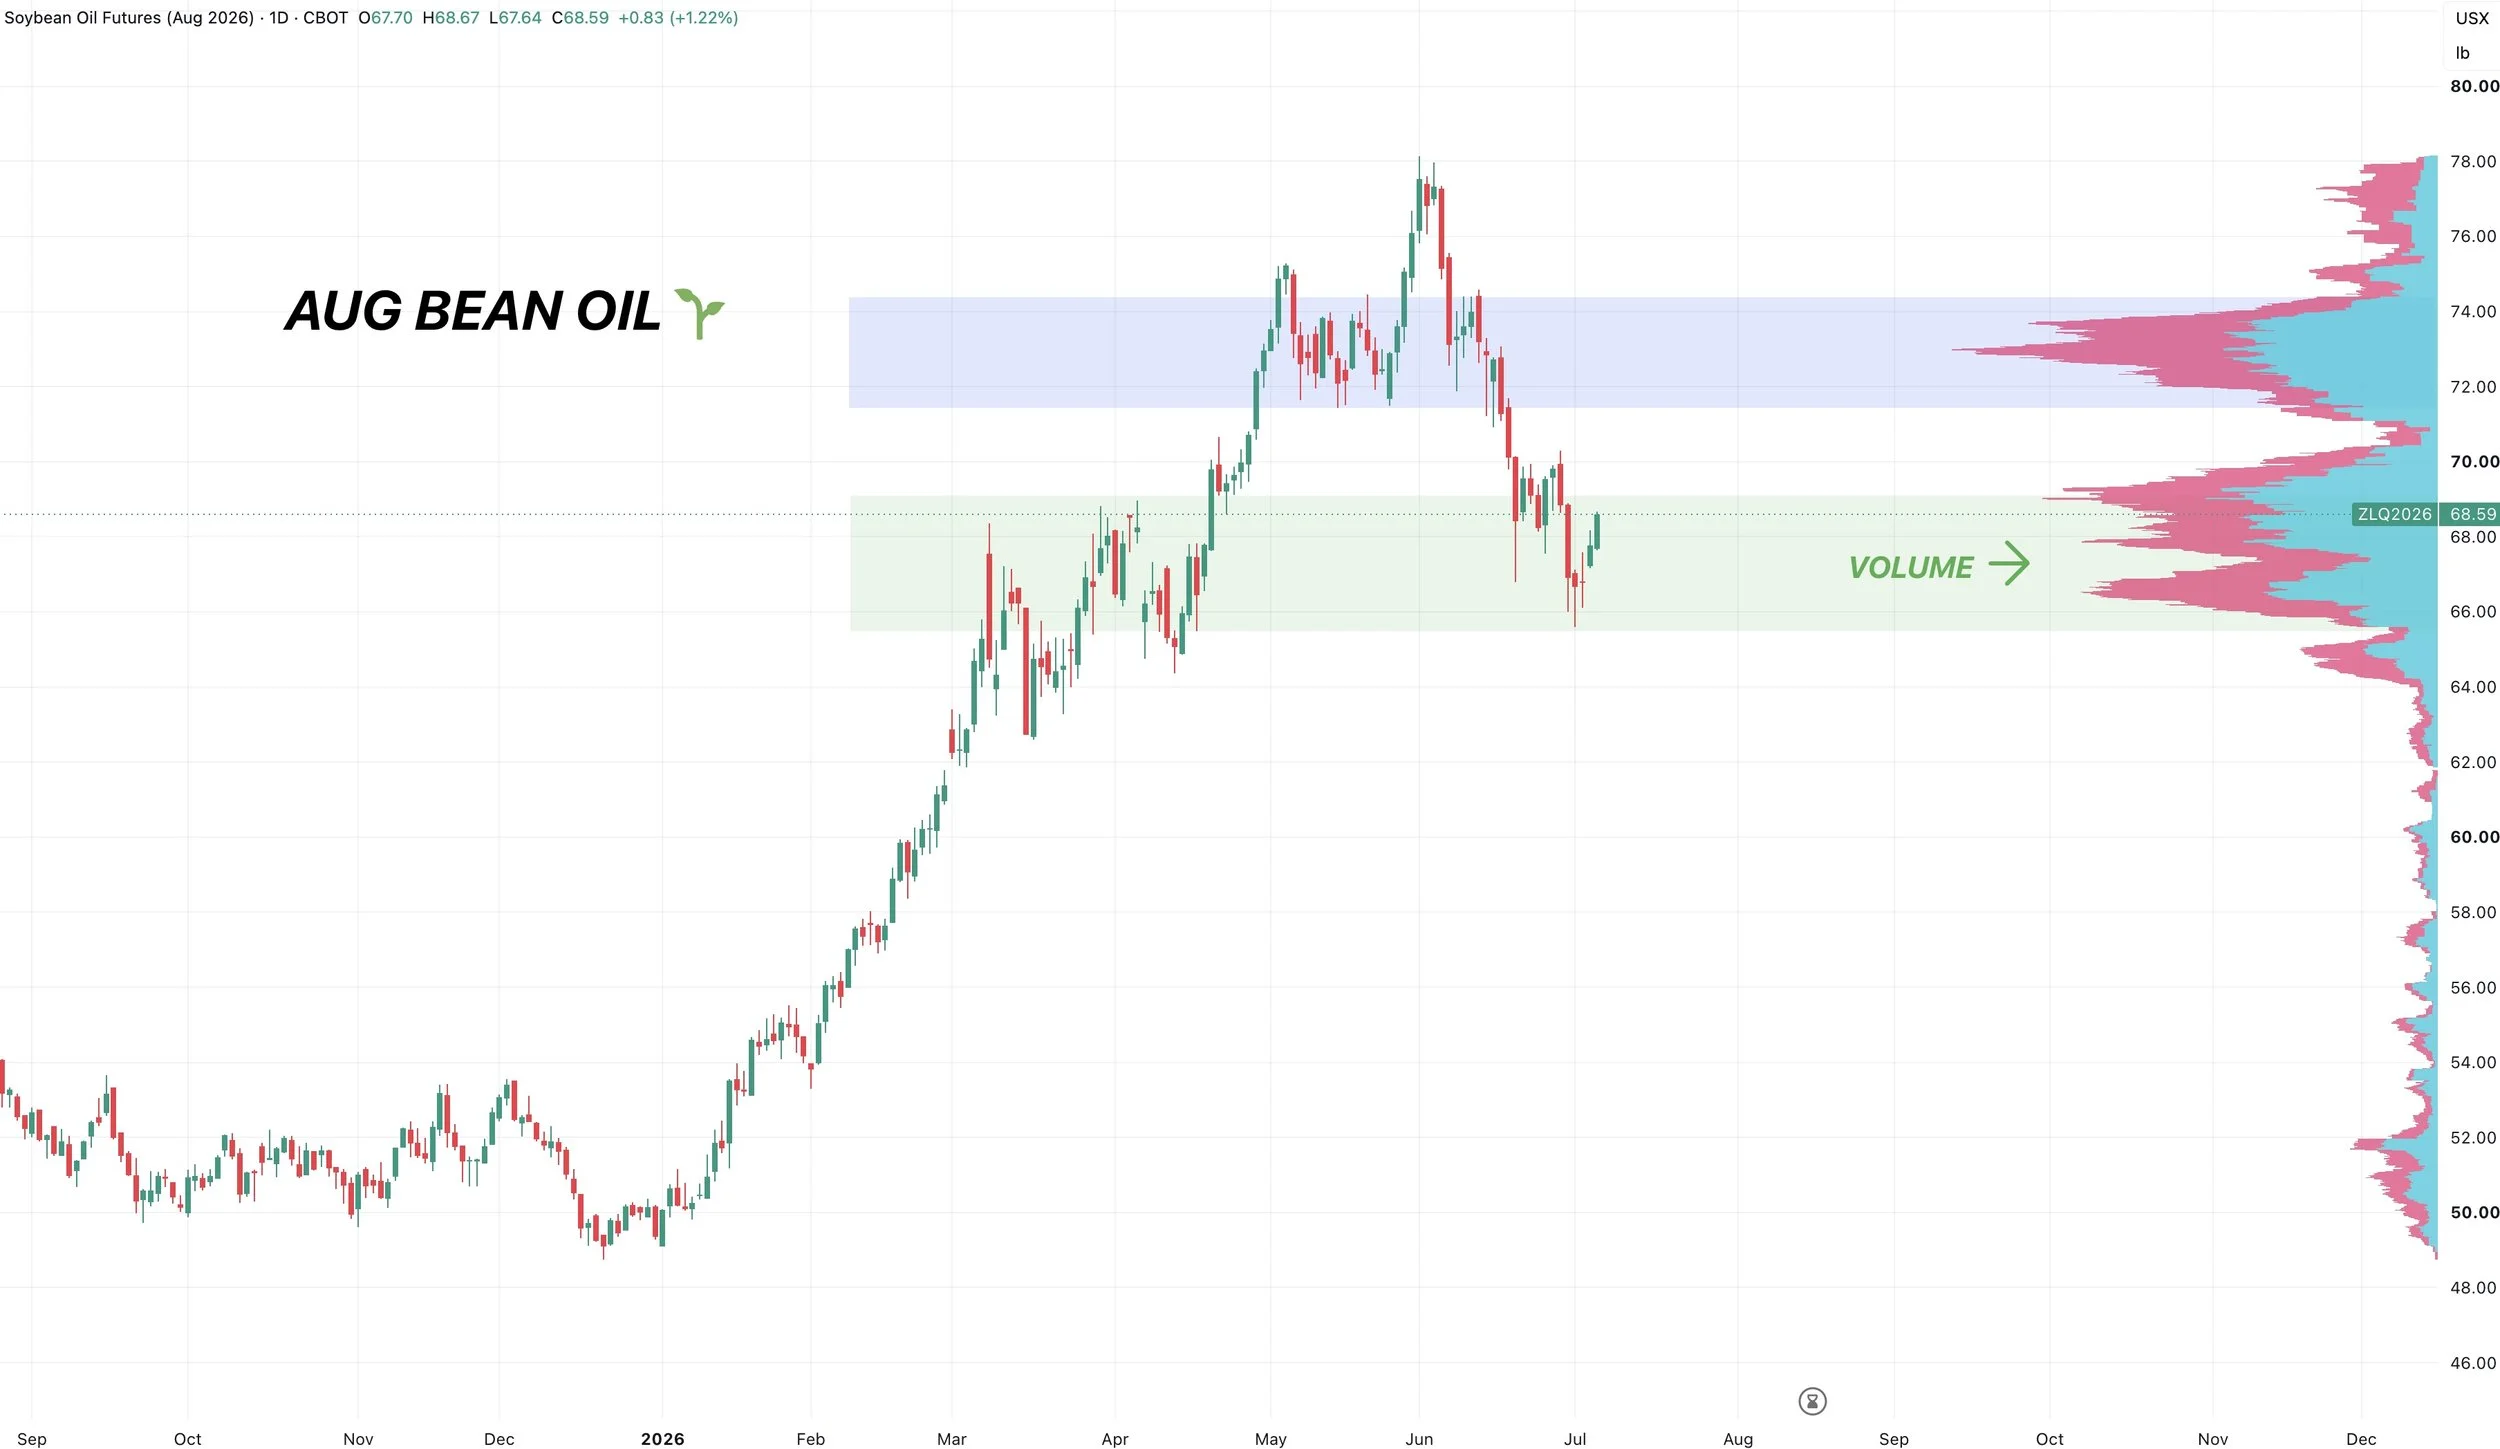
As we've talked about, a big reason for the funds keeping their bullish bet in the soybean complex is due to bean oil.
Unless bean oil starts to break down, I don’t see a major reason for them to simply full on short soybeans.
Aug Beans Chart:
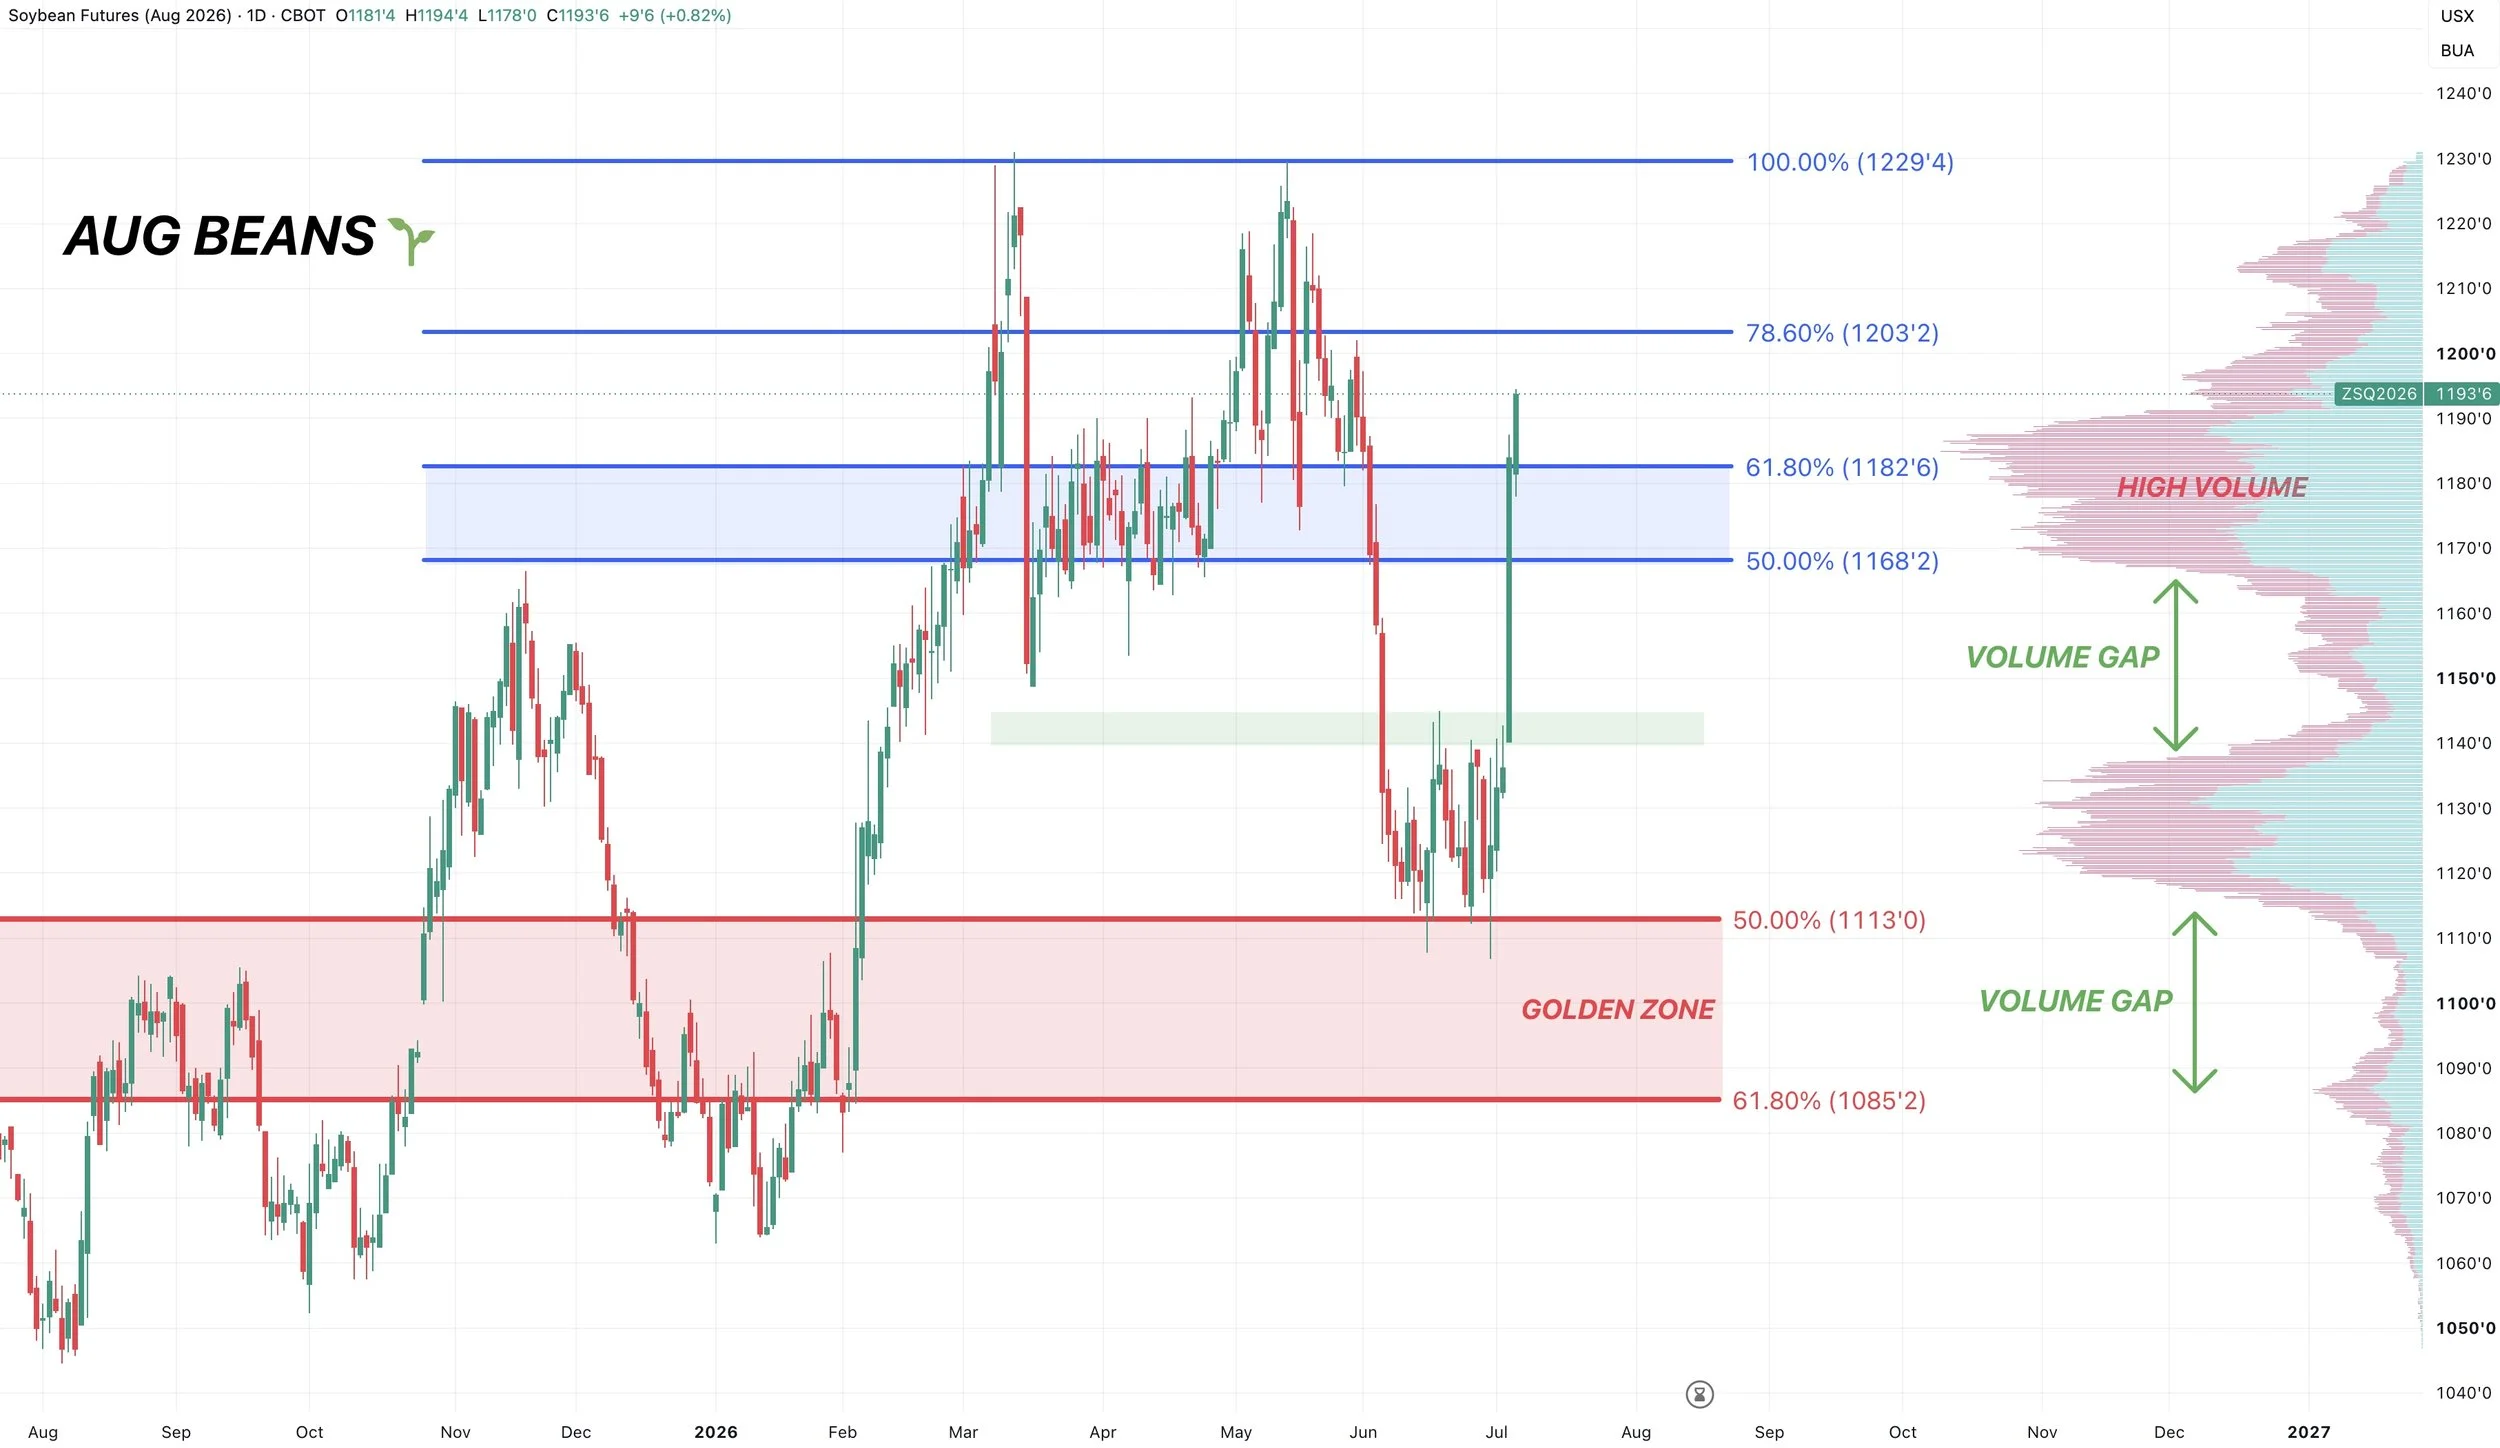
Yesterday we did send out a sell signal and hedge alert for soybeans.
The first one since May 12th.
After dropping -$1.30 the last month, we feel like it makes sense to simply do some catching up or at least secure some downside protection and lock in a worst case scenario.
Last week soybeans were coiling up in a tight range at an area of high volume, with a volume gap to the upside.
Once we broke above that range, it accelerated the upside as we sliced right through the volume gap.
We then shot up to the next area of high volume, which was a reason for the signal.
The other reason for the signal was that we clawed back 61.8% of the entire sell off. The most common retracement level. However, we are now above that level which is a good sign.
If we are able to break this area of high volume, the next resistance is going to be those highs.
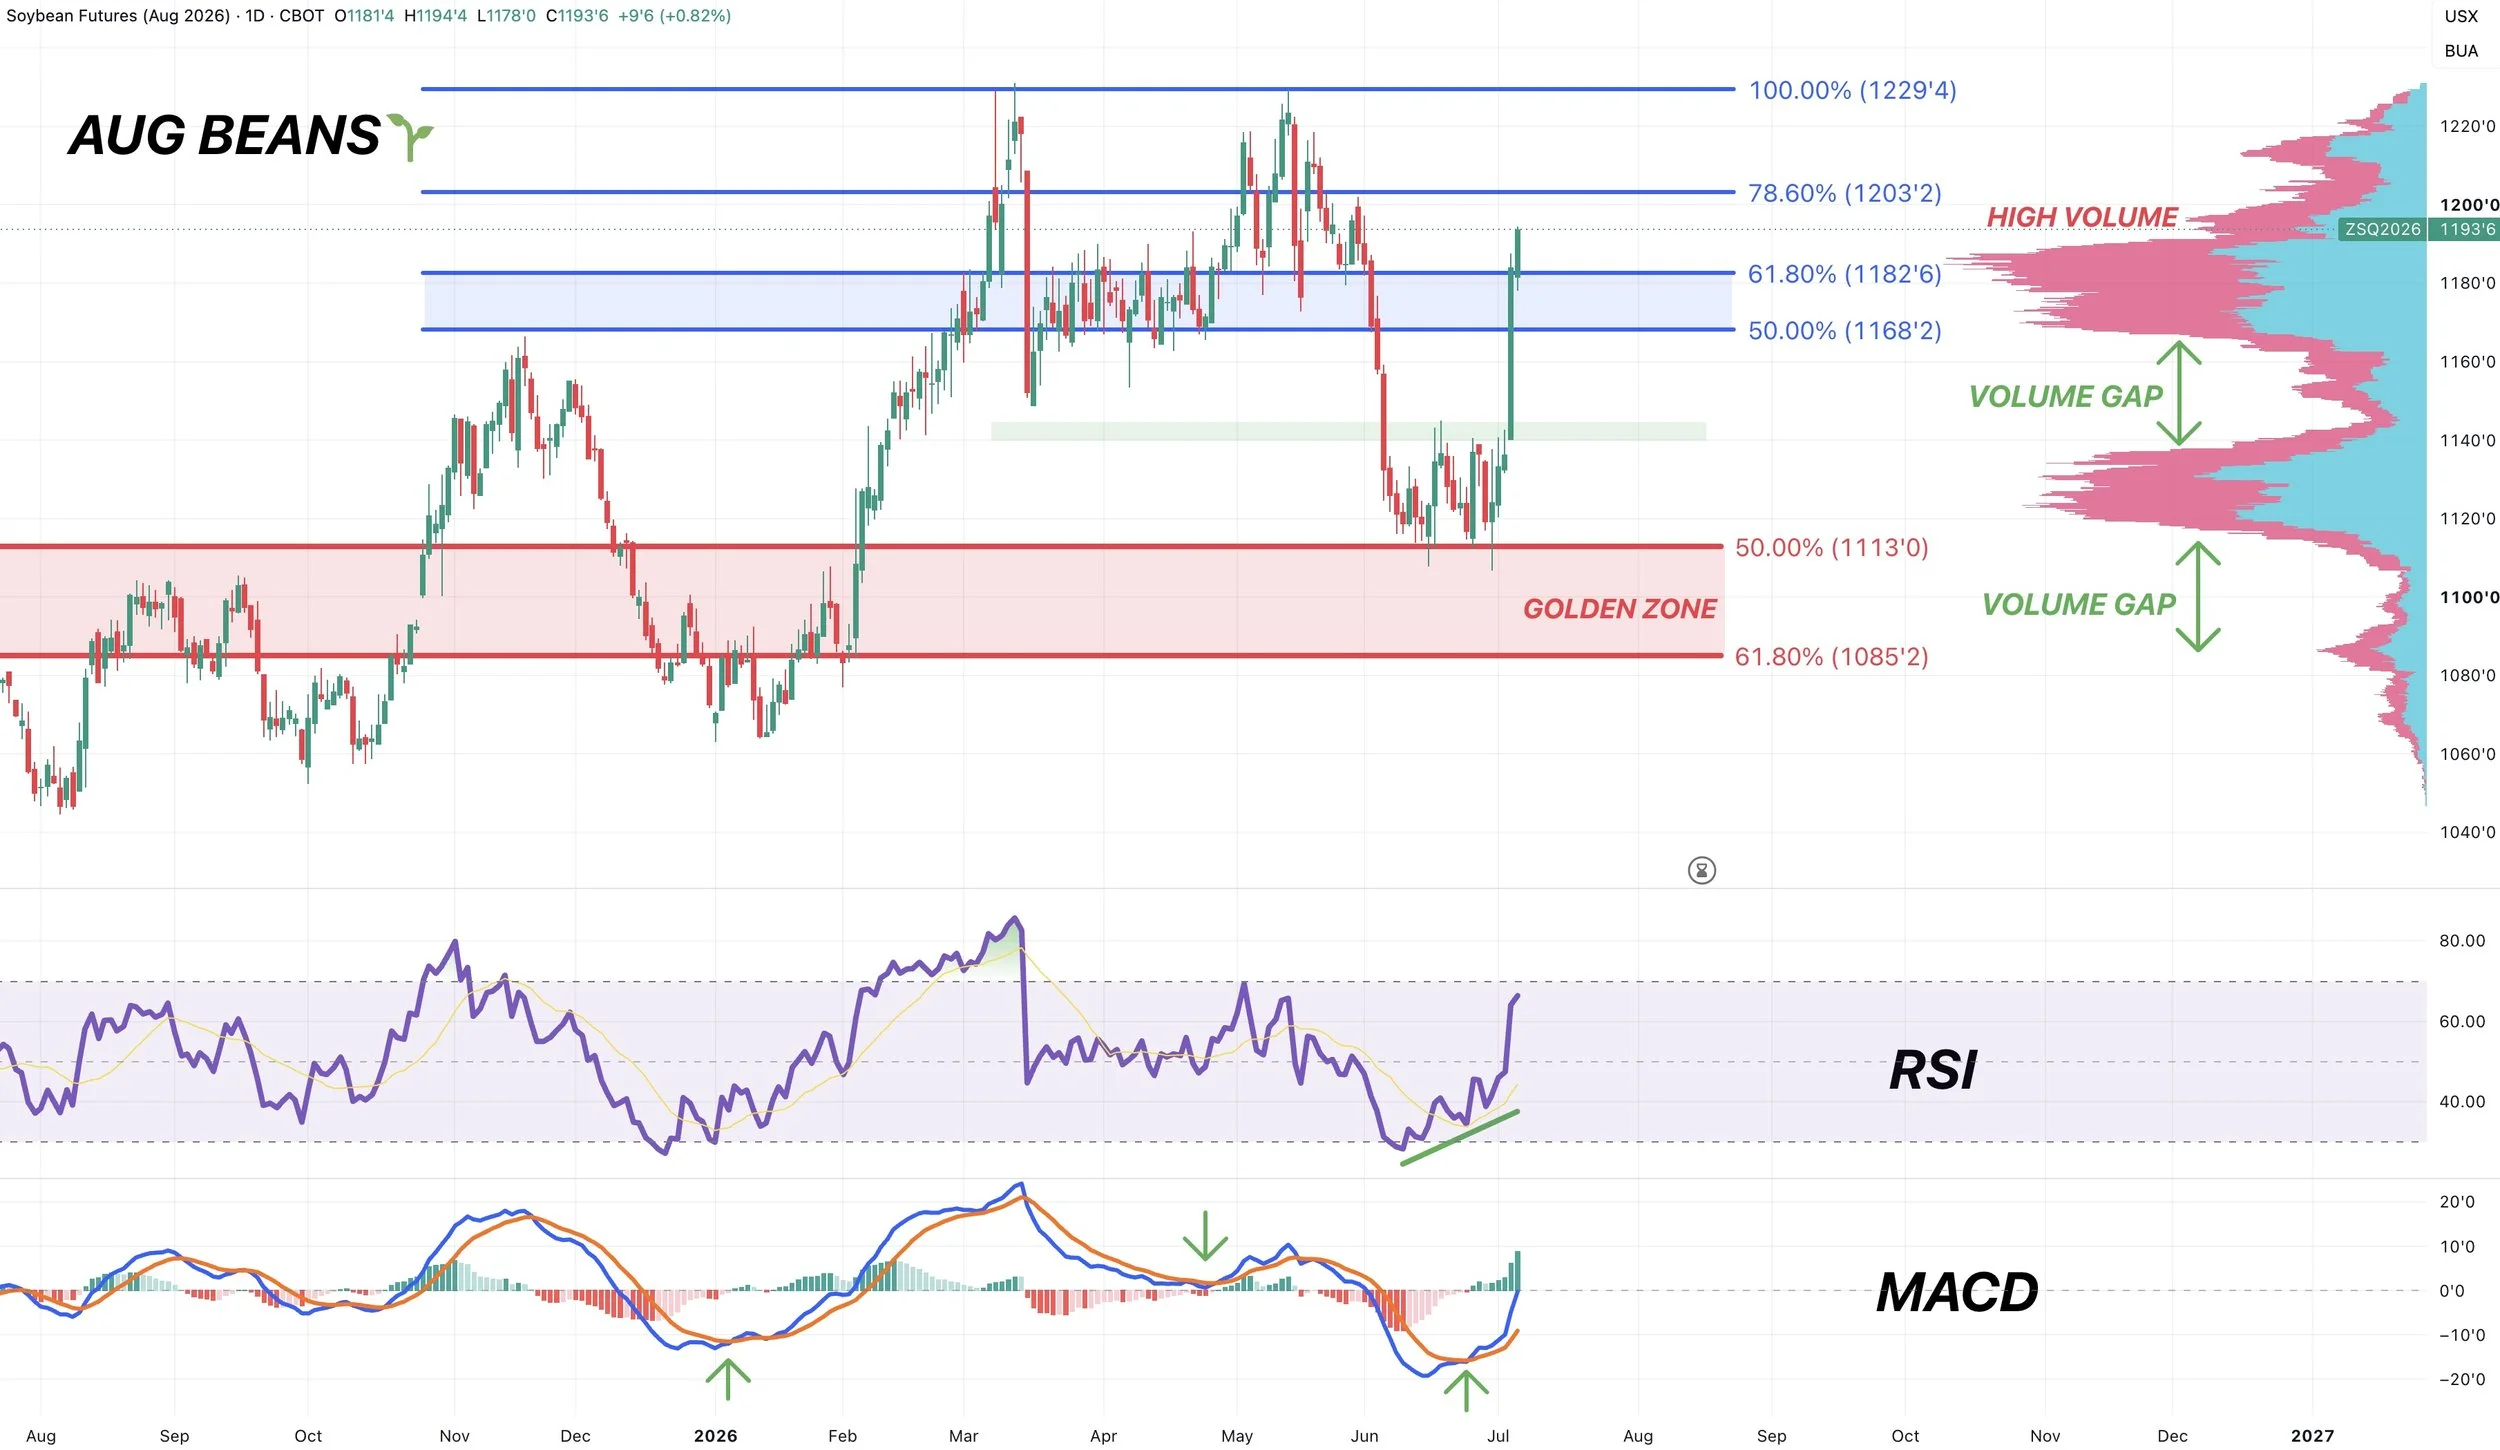
Similar to corn, the charts were telling us some positive things the last two weeks that we had talked about.
We had bullish divergence on the RSI.
The MACD crossed bullish.
The last two times the MACD crossed bullish, it led to a nice rally.
The first being in January and second in April.
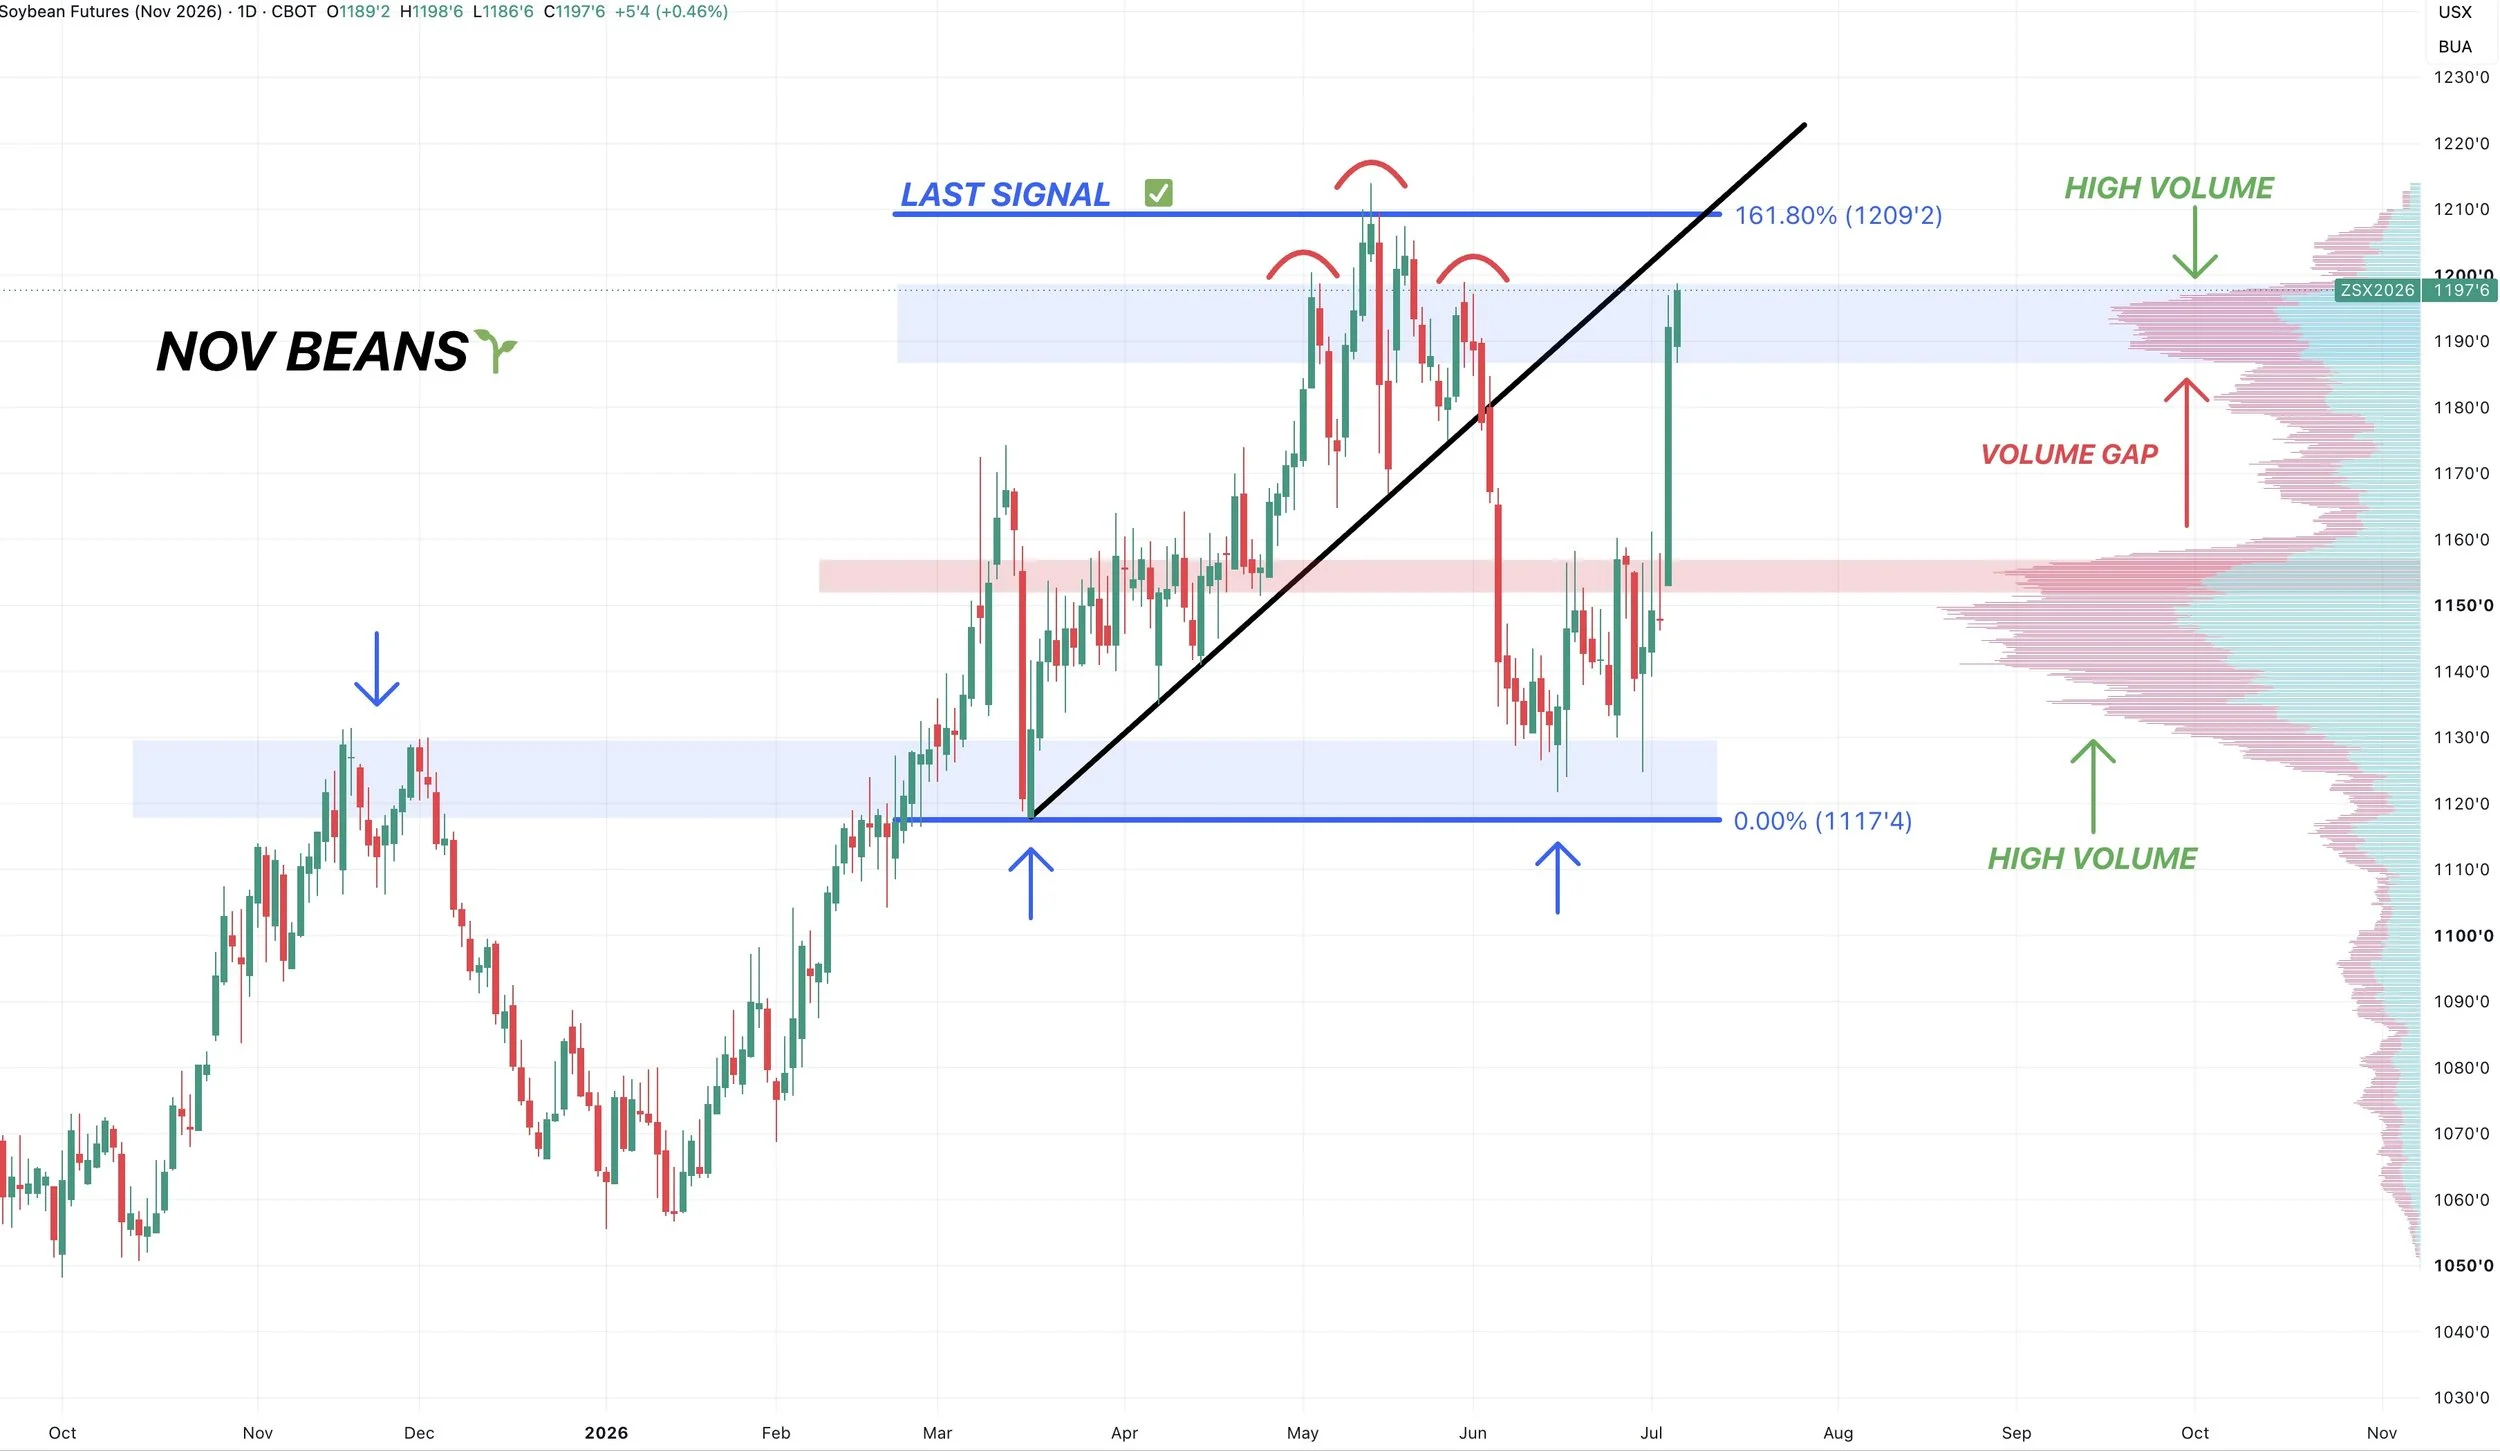
Nov Beans Chart:
Areas of high volume basically act as magnets. So once we broke that high volume area and range we were trapped it, we ran right up to the next area of high volume.
So we are now sitting at this big volume shelf. If we are able to take it out and post new highs, it opens the door higher. But for now, it could offer some resistance, hence the signal yesterday.
We are right back near the highs, so it makes sense to defend this level if you feel like you missed out or missed our signal on May 12th.
Wheat
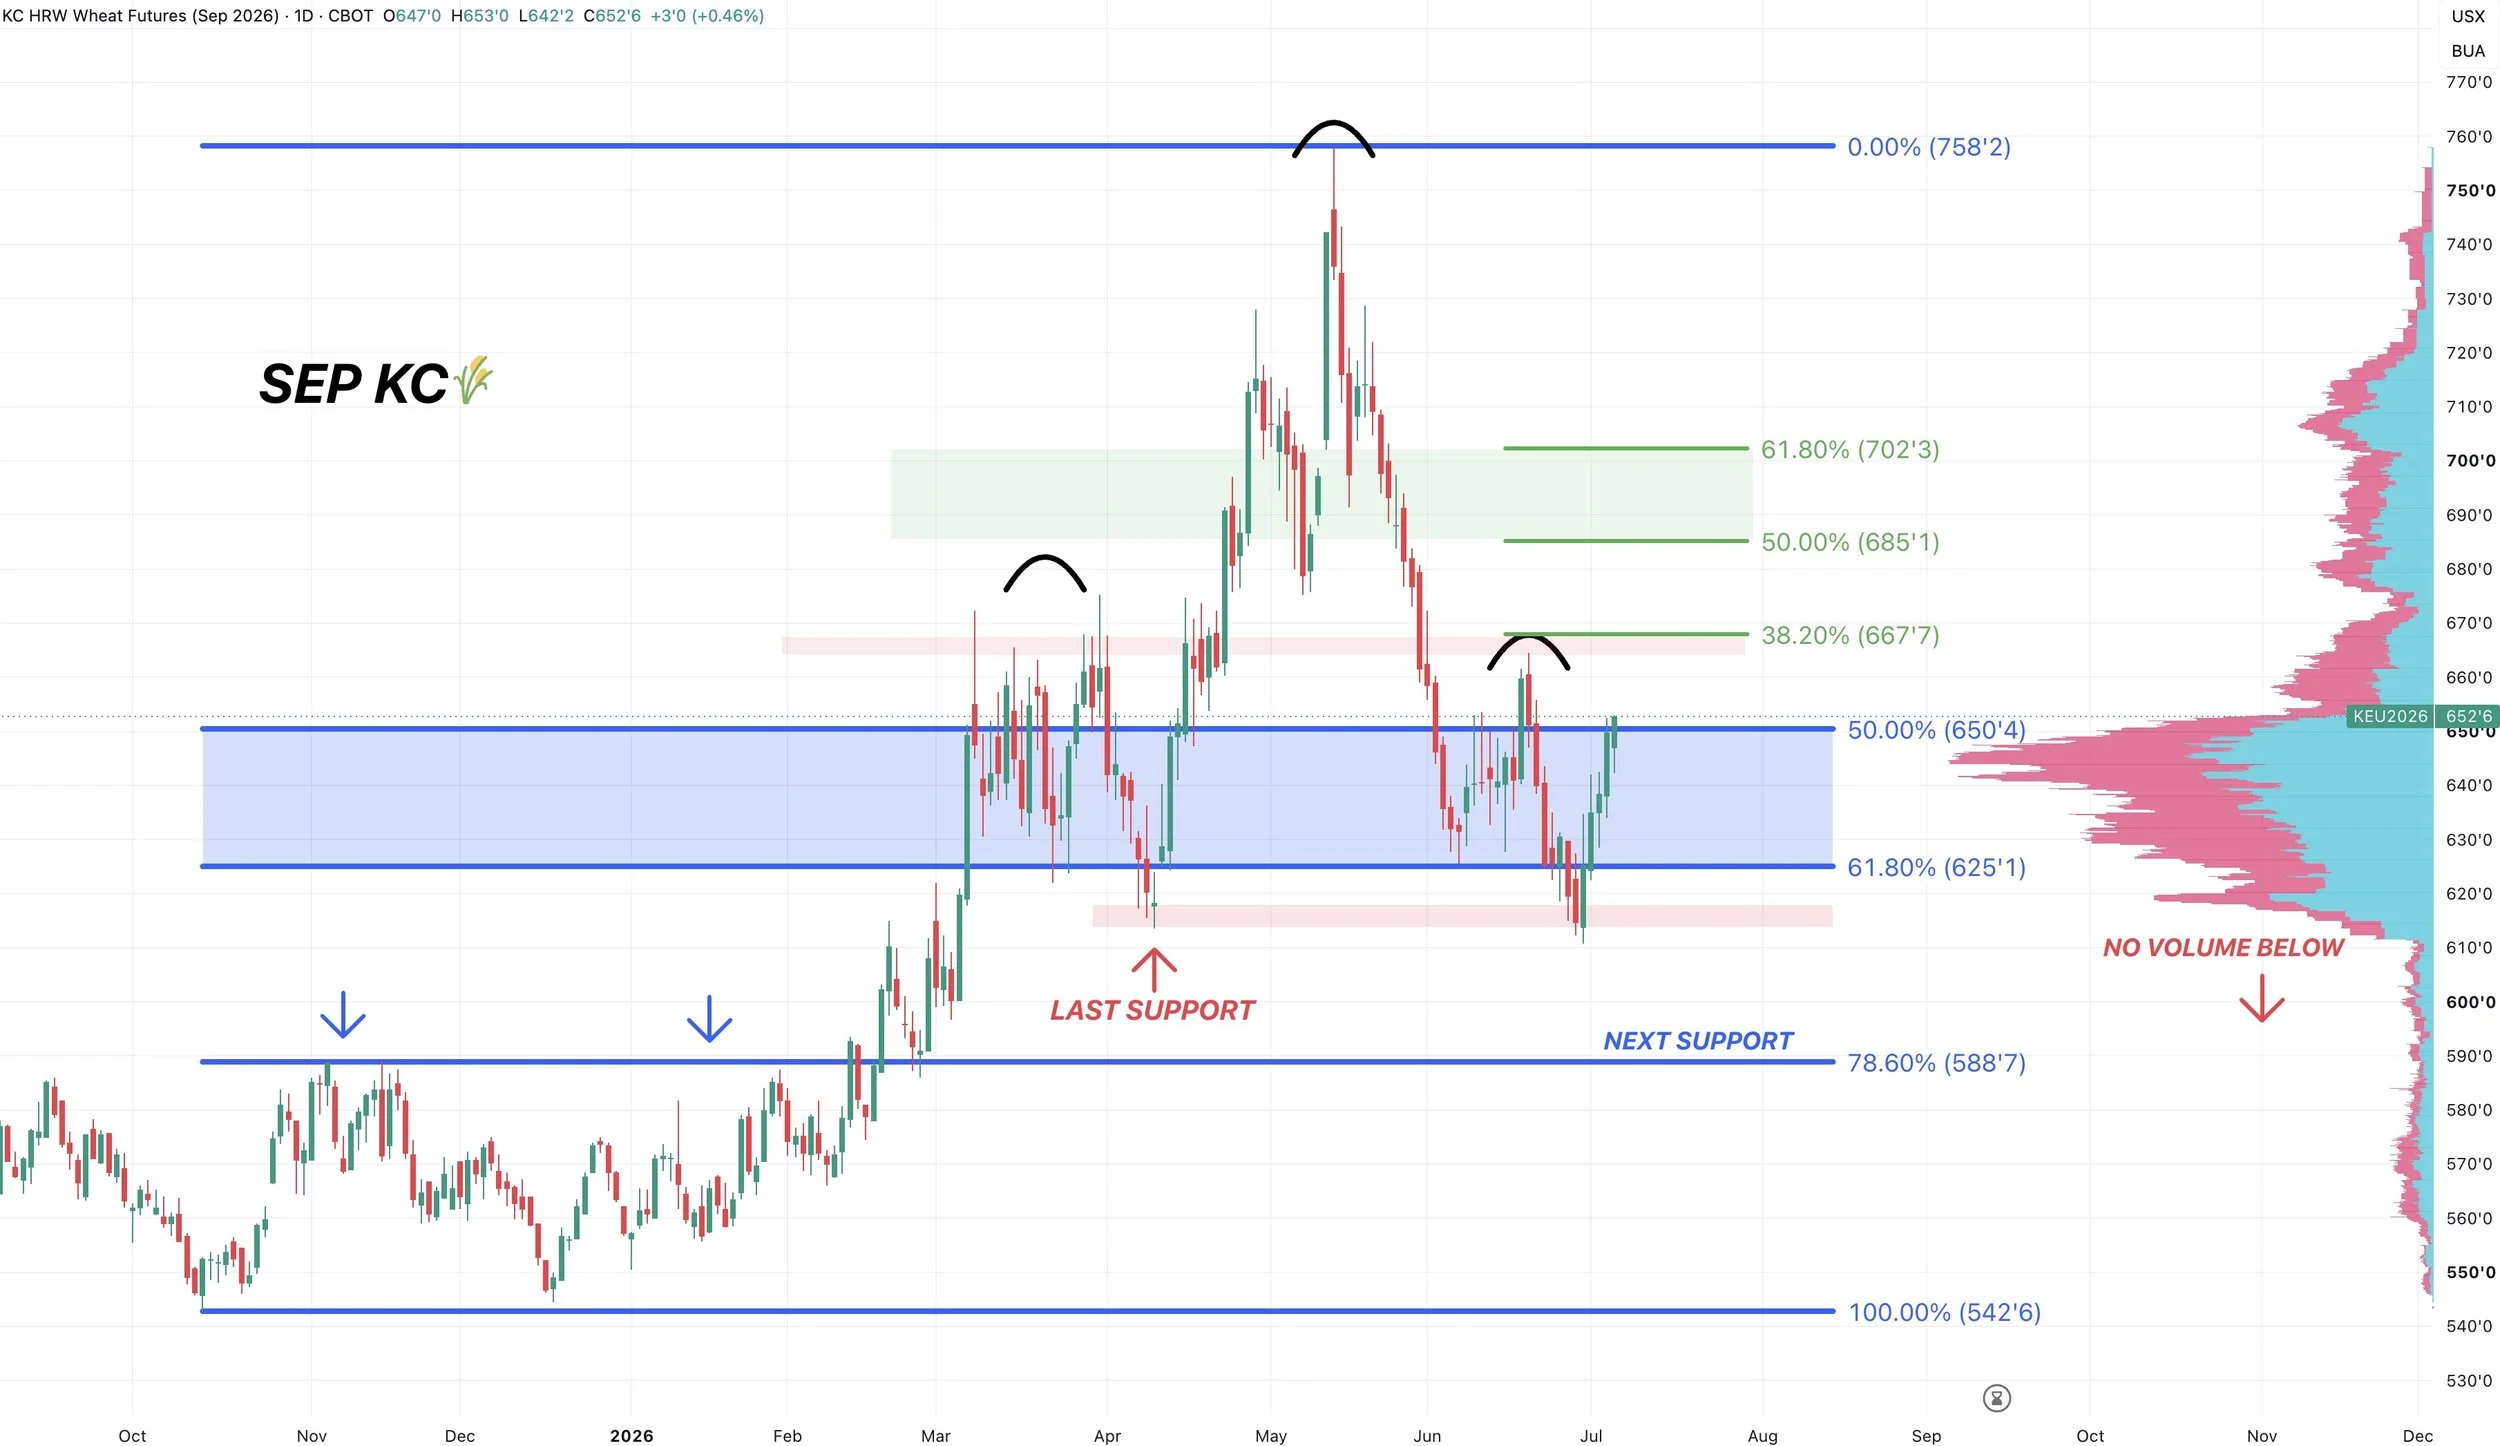
Sep KC Chart:
Wheat gets a participation trophy in this rally. It's essentially just following corn and soybeans along for the ride.
However the wheat chart doesn’t look bad.
We've traded higher for 5 days in a row now.
We held that very last line of support we needed to hold. As there is zero support beneath those recent lows.
If we can break above those recent June highs, it could spark another leg higher.
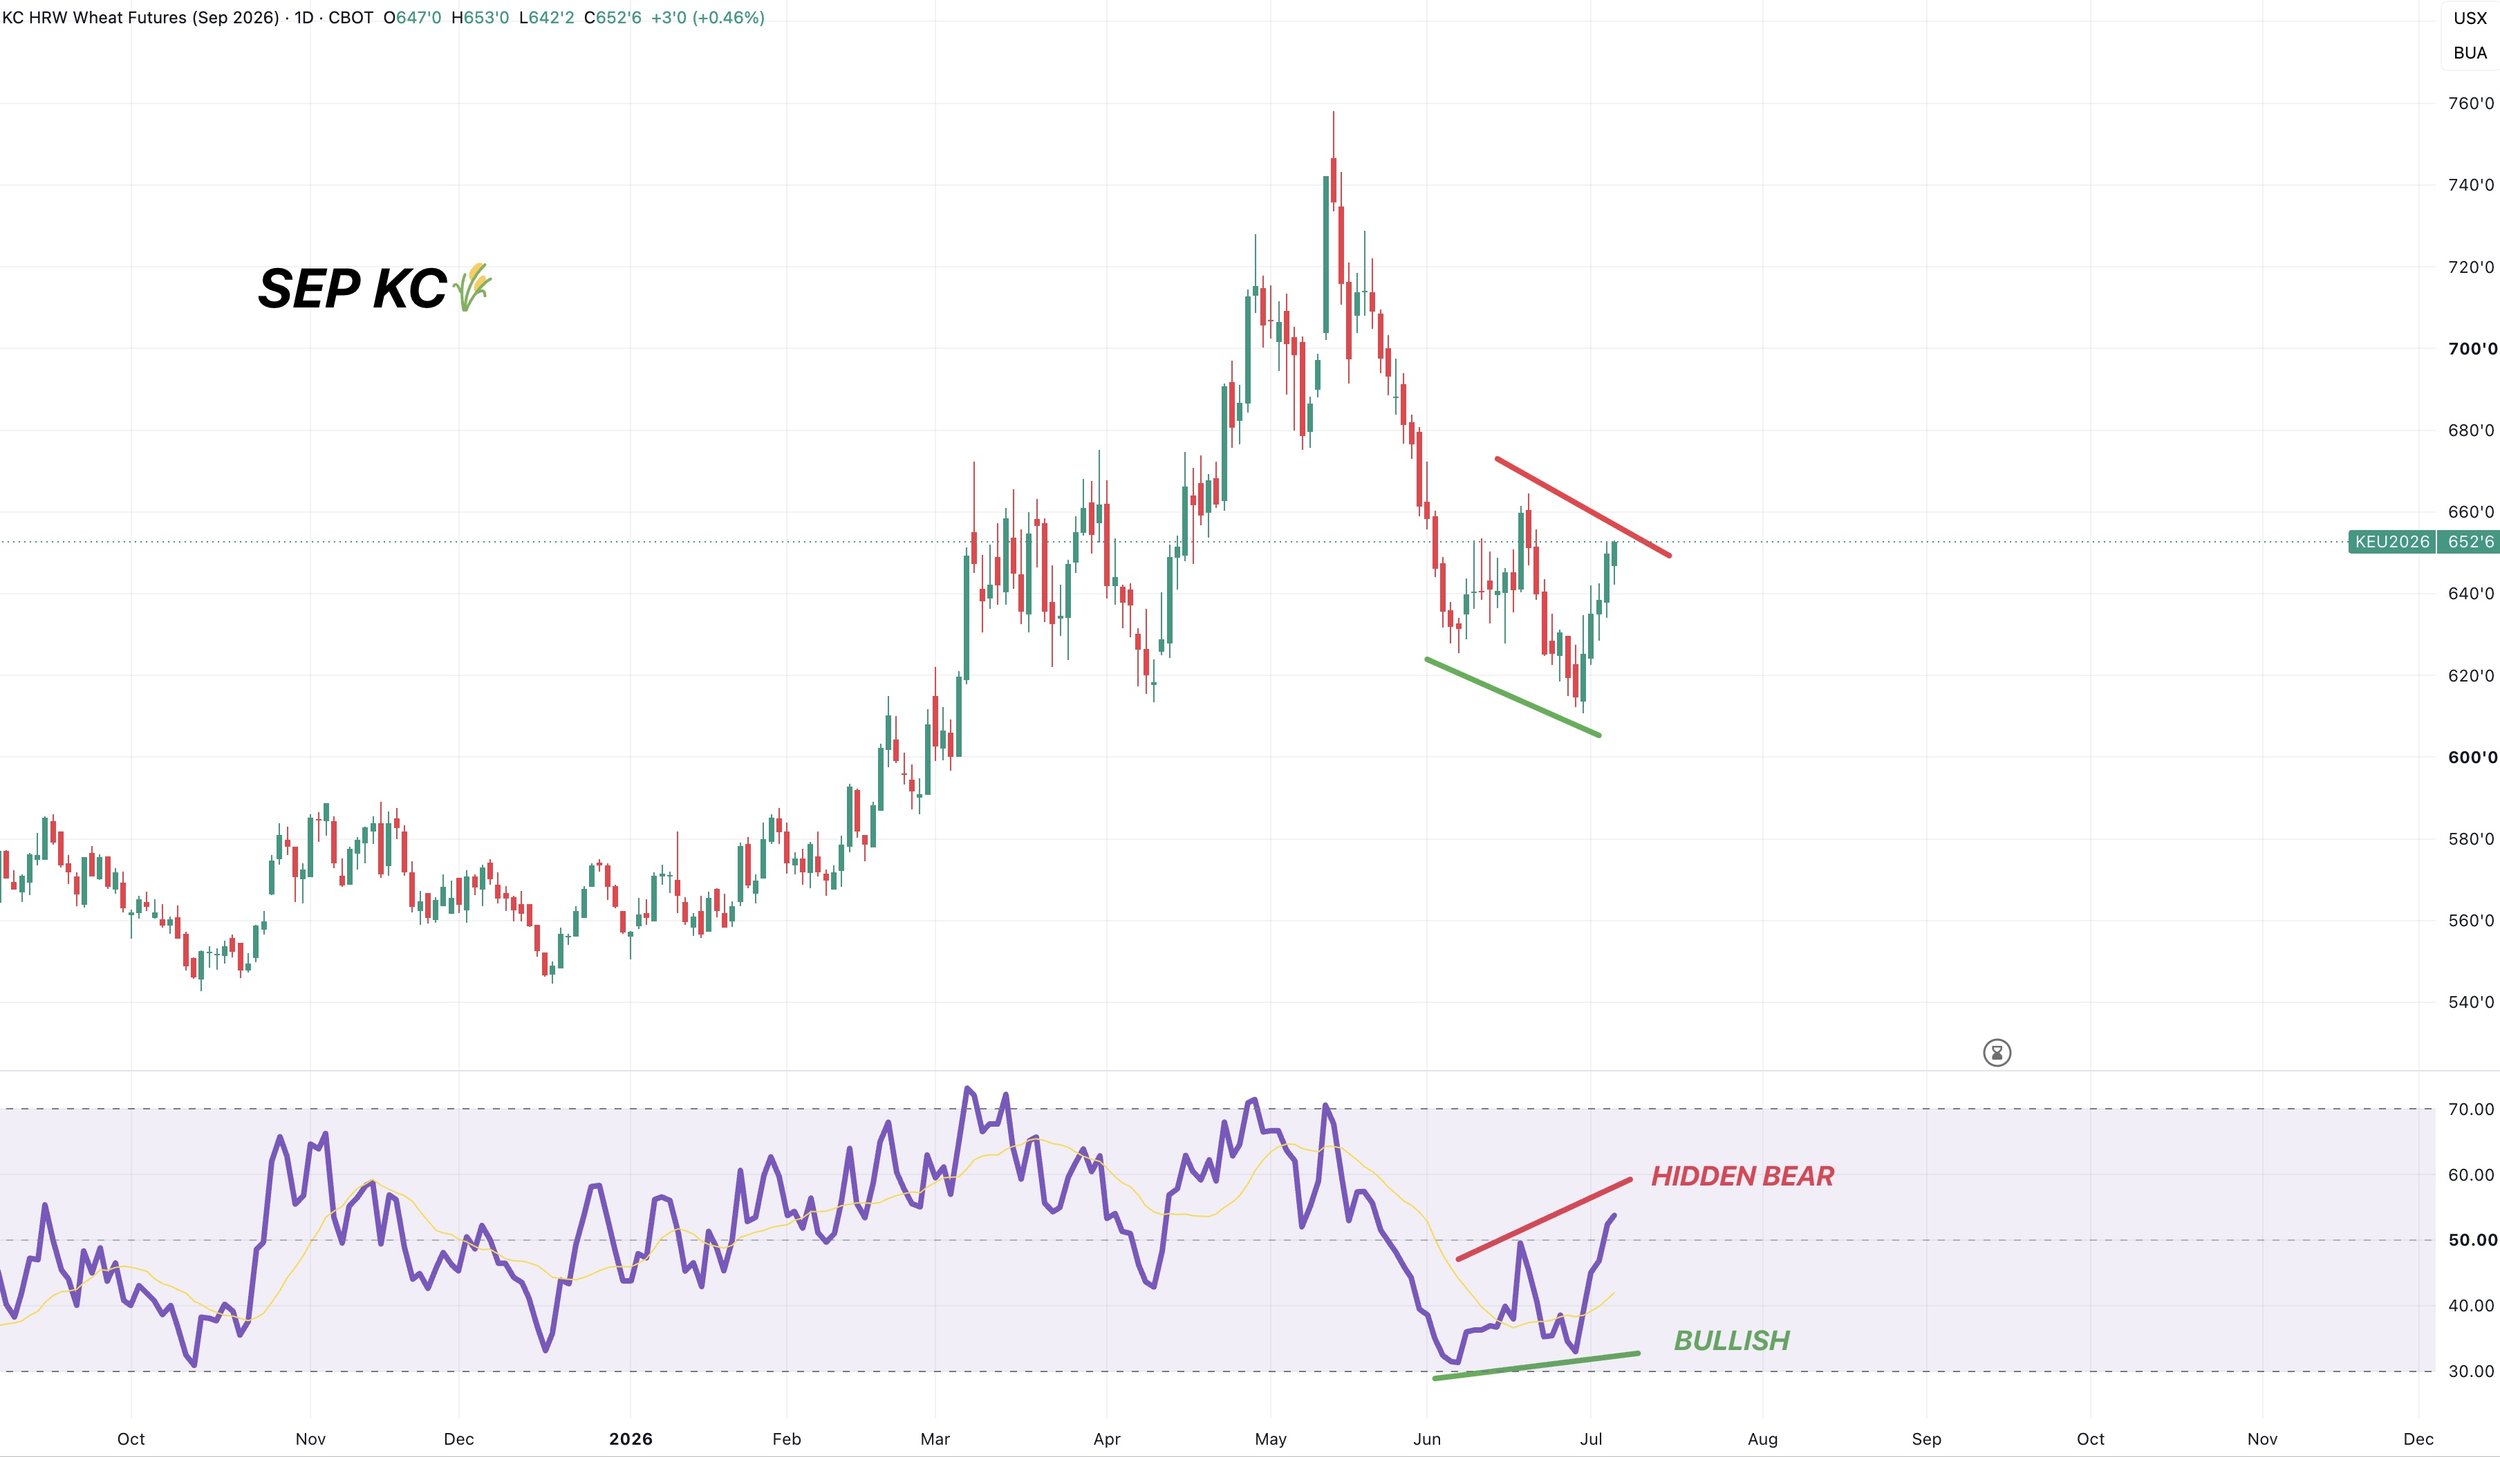
The last two weeks we were showing bullish divergence on the RSI.
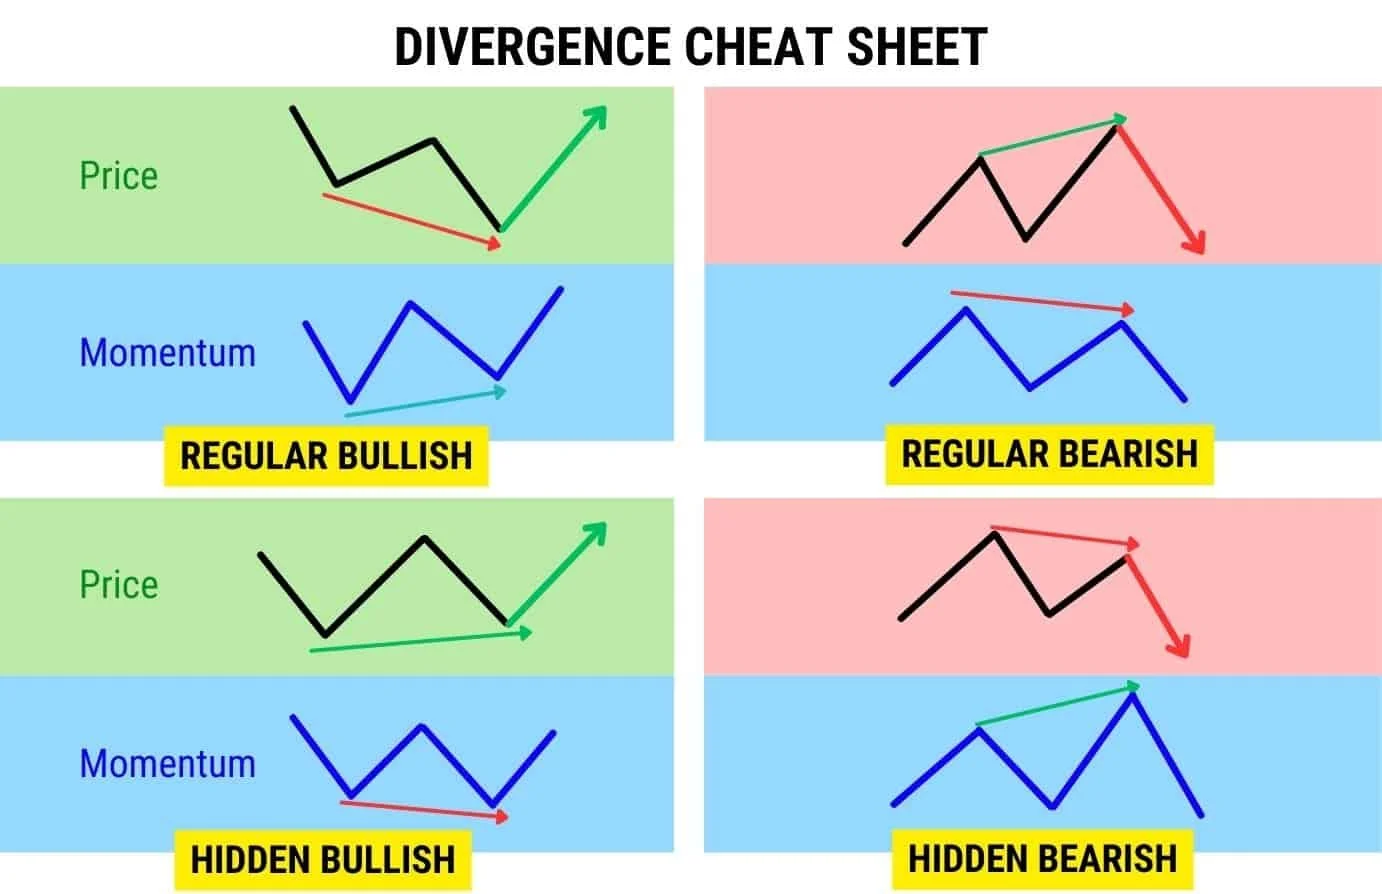
We are now showing some possible hidden bearish divergence, so that's something to be a little cautious of.
As the RSI is making new highs, but prices are not.
Cattle
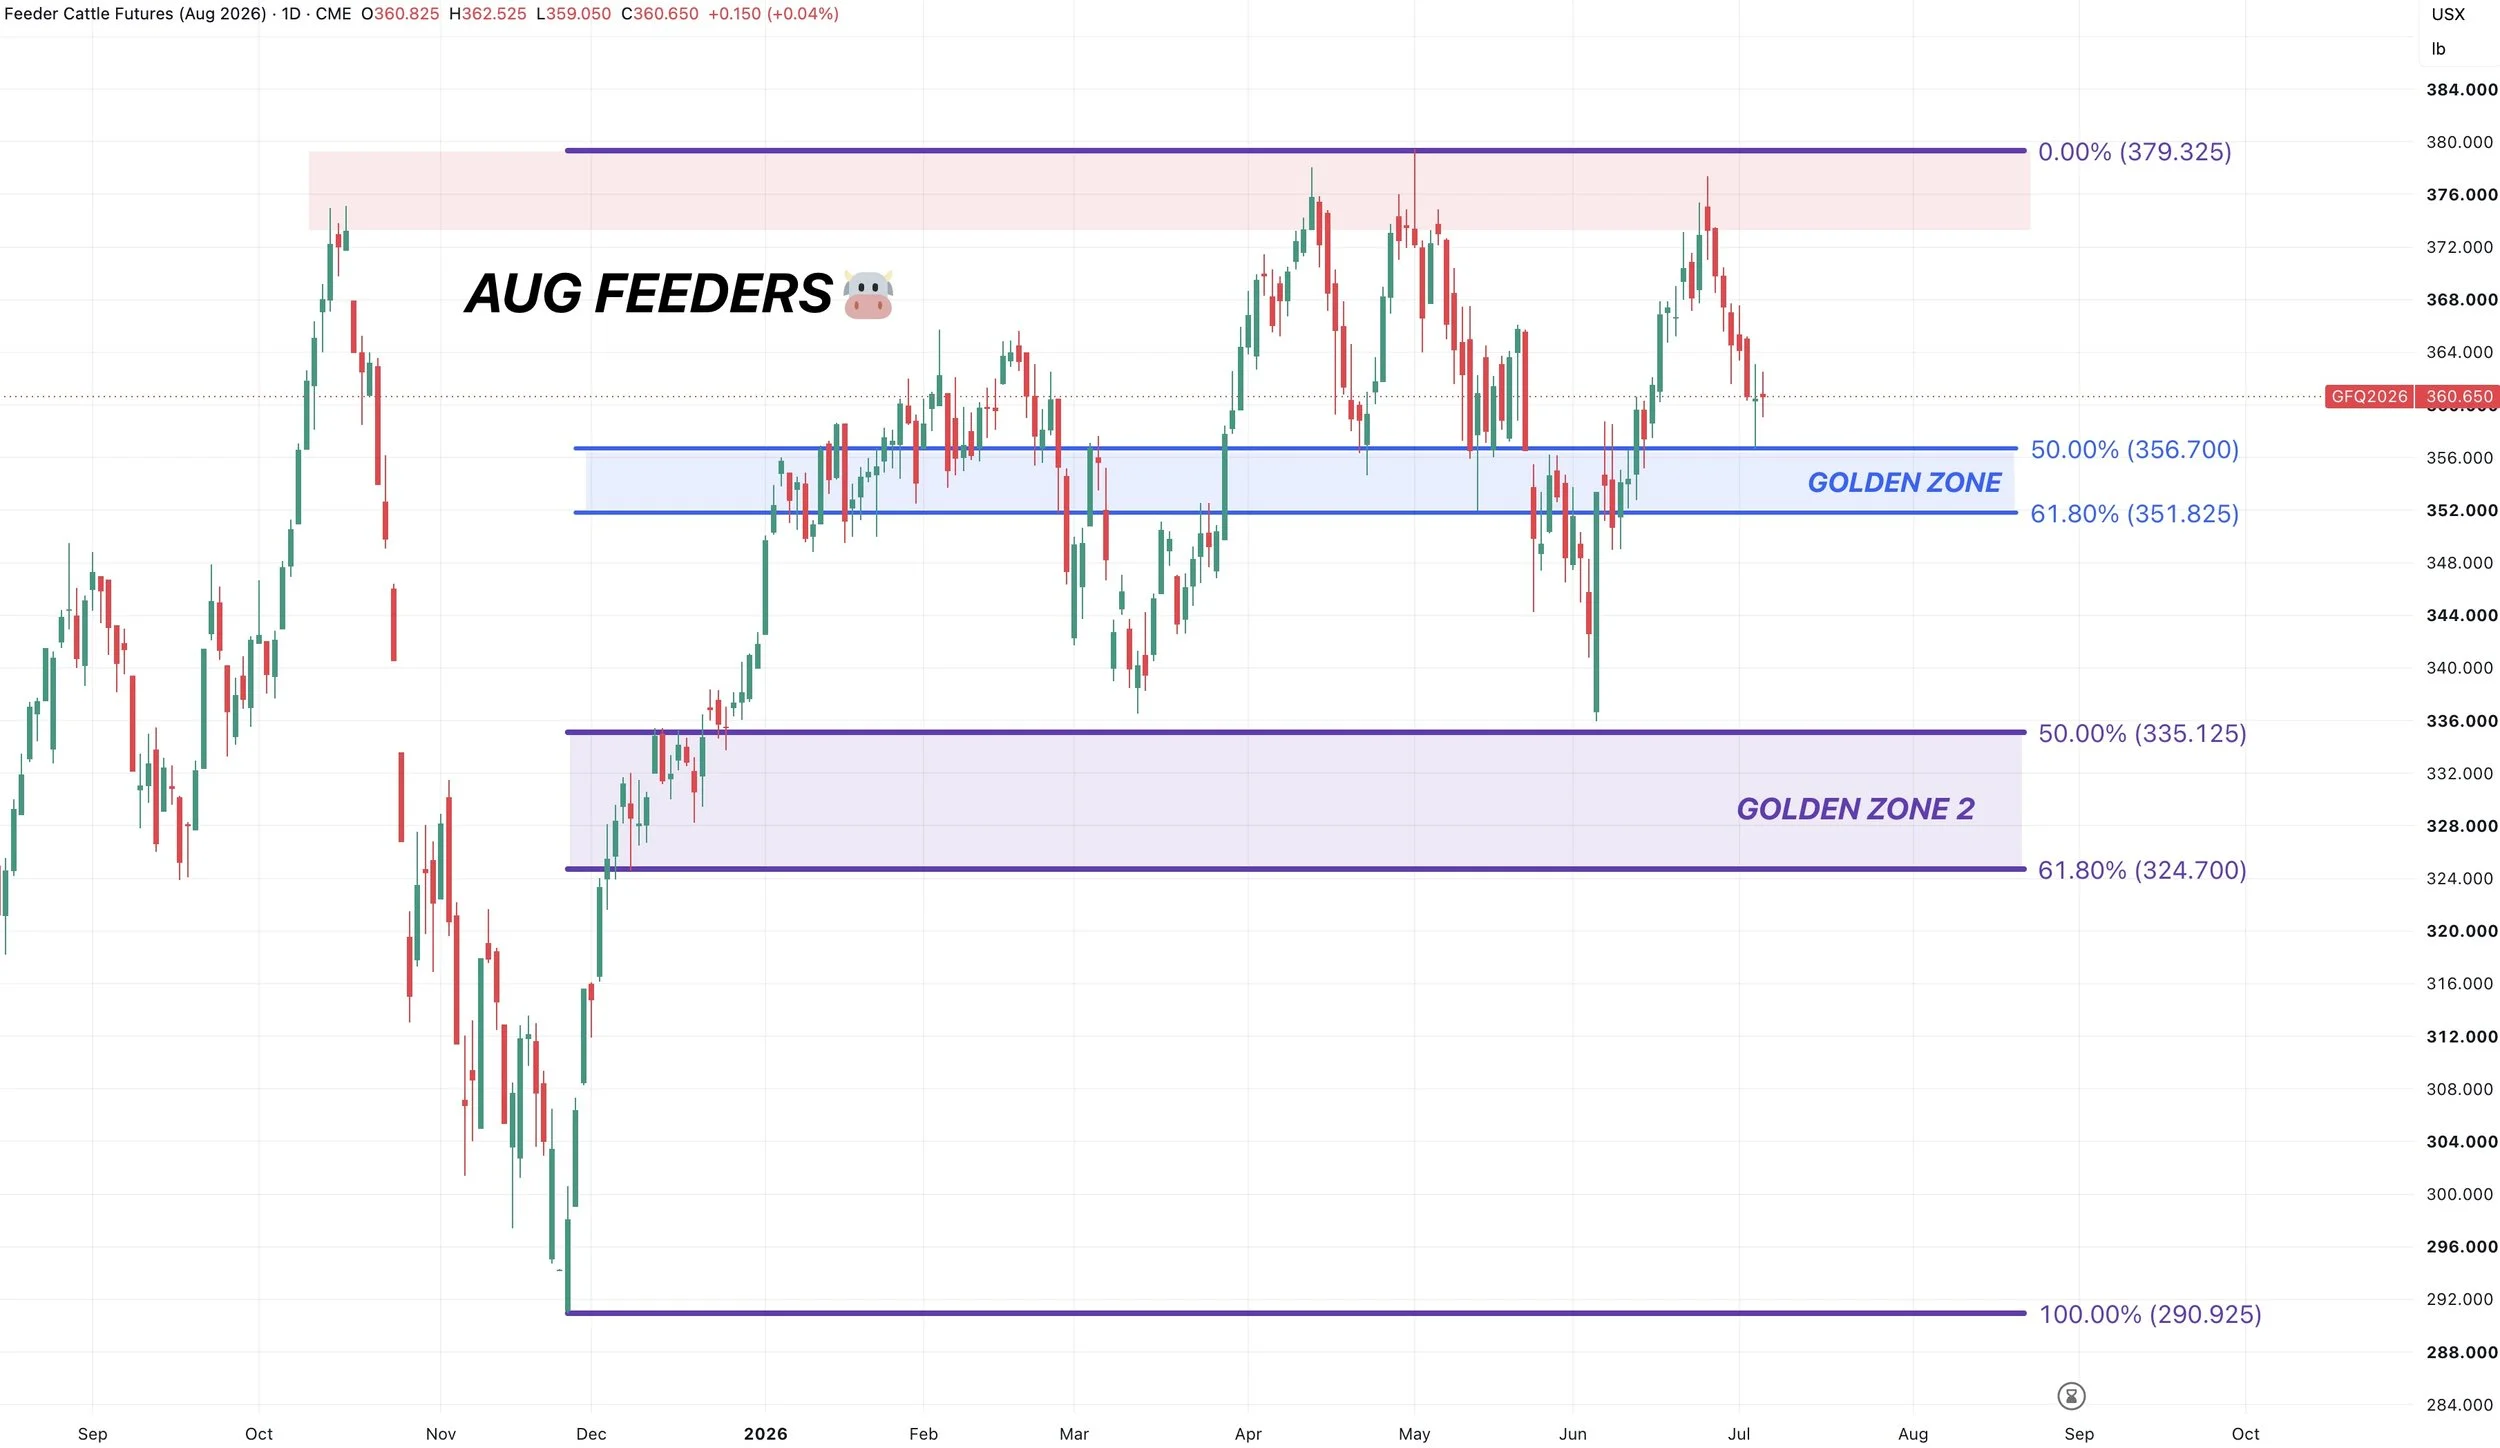
Aug Feeders Chart:
We rejected those highs once again, making it the 4th time we did so.
As we mentioned the last few weeks, we wanted to protect prices at all-time highs.
The biggest thing bulls want to do is hold this blue box and the 352 level.
If we start to break below the golden zone, that would be a warning sign.
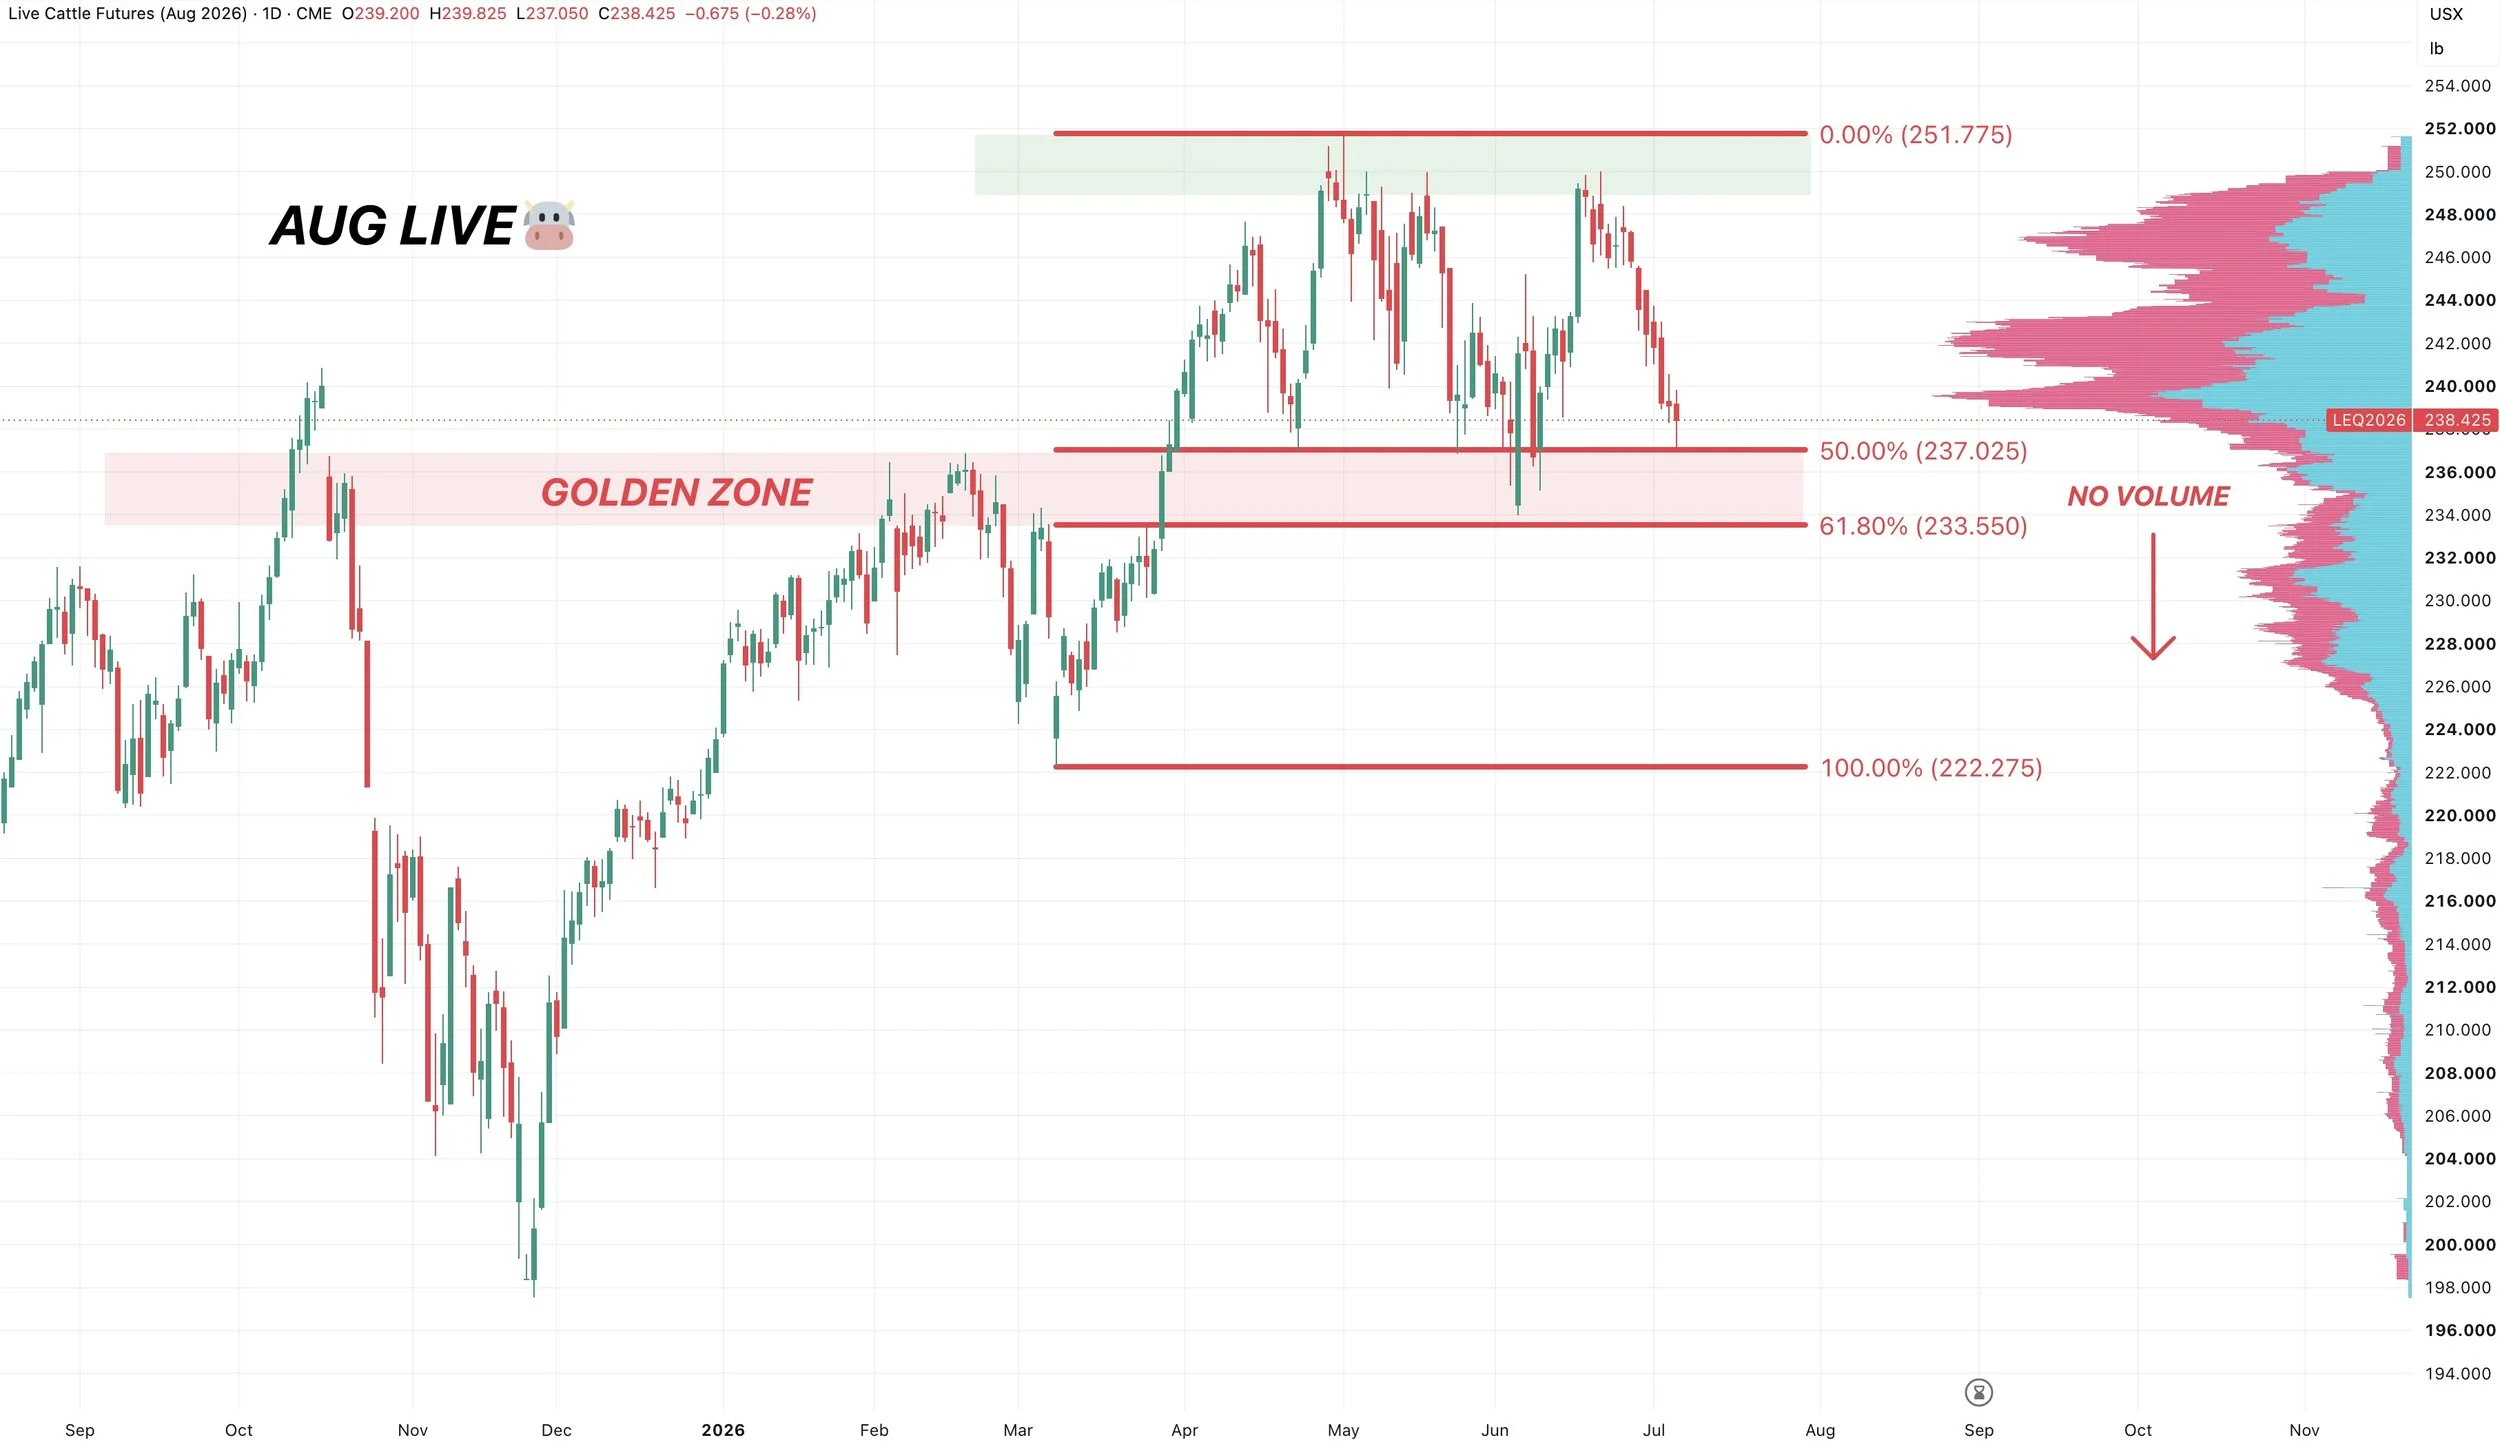
August Live Chart:
We rejected the previous highs, leaving a double top.
The chart doesn’t look too great. If we break below those June lows it does open the door potentially significantly lower.
So that's the level bulls want to hold.
Want to Talk?
Our phones are open 24/7 for you guys if you ever need anything or want to discuss your operation.
Jeremey & Office: (806)484-1214
Sebastian: (605)280-1186
Email: sfrost@dailymarketminute.com
Hedge Account
Interested in a hedge account? Use the link below to set up an account or give us a call.