
HOW BIG OR SMALL COULD CORN CARRYOUT GET?

Overview
Grains lower across the board, however we closed well off our lows. Most notably in wheat as Chicago closed +10 cents off of it's early lows. Closing down just -3 cents after trading down -13.
Corn and soybeans are seeing a little bit of pressure from rains in the midwest improving the soil moisture situation.
Rains right now will be perceived as a slight negative as we are not yet into planting season. So for now it just helps the moisture.
However two weeks from now and the further we get into planting, rain will be a negative as it could effect planting progress.
Another negative factor the markets saw today was a big headline that we got our first human case of bird flu from cattle. Anytime the market has gotten a headline like this in the past, the grains have been negatively impacted because the headline says less cattle means less grain being consumed by them. Even though the reality is we probably don’t lose any demand. Here is a link to the article.
The dollar rallied to 4-month highs which added some pressure. The dollar is particularly strong against Brazil's current which doesn’t help with competitiveness for US soybeans.
The effects that South America weather will have on their soybean crop is non-existent. However, there is still a very wide range of guesses as to how big that crop is.
The USDA has the crop at 155 vs most estimates closer to 150. One example would be StoneX recently lowered their number to 150.8.
Although Brazil weather won’t matter for the beans, we are still in a key time frame for that second crop corn in Brazil. Right now they are getting rain which is friendly for that crop.

Now that we got the planting intentions report out of the way, the market is going to very soon start paying close attention to US weather and our planting outlook.
The next week will be cool and wet. But it does start to warm up with above normal temps next week.
Precipitation for April is expected to be above average, which could cause some planting concerns. Temps are expected to be warmer than normal as well.
The outlook for this upcoming planting season has really shifted from dry to wet, while heat is expected to remain above average.
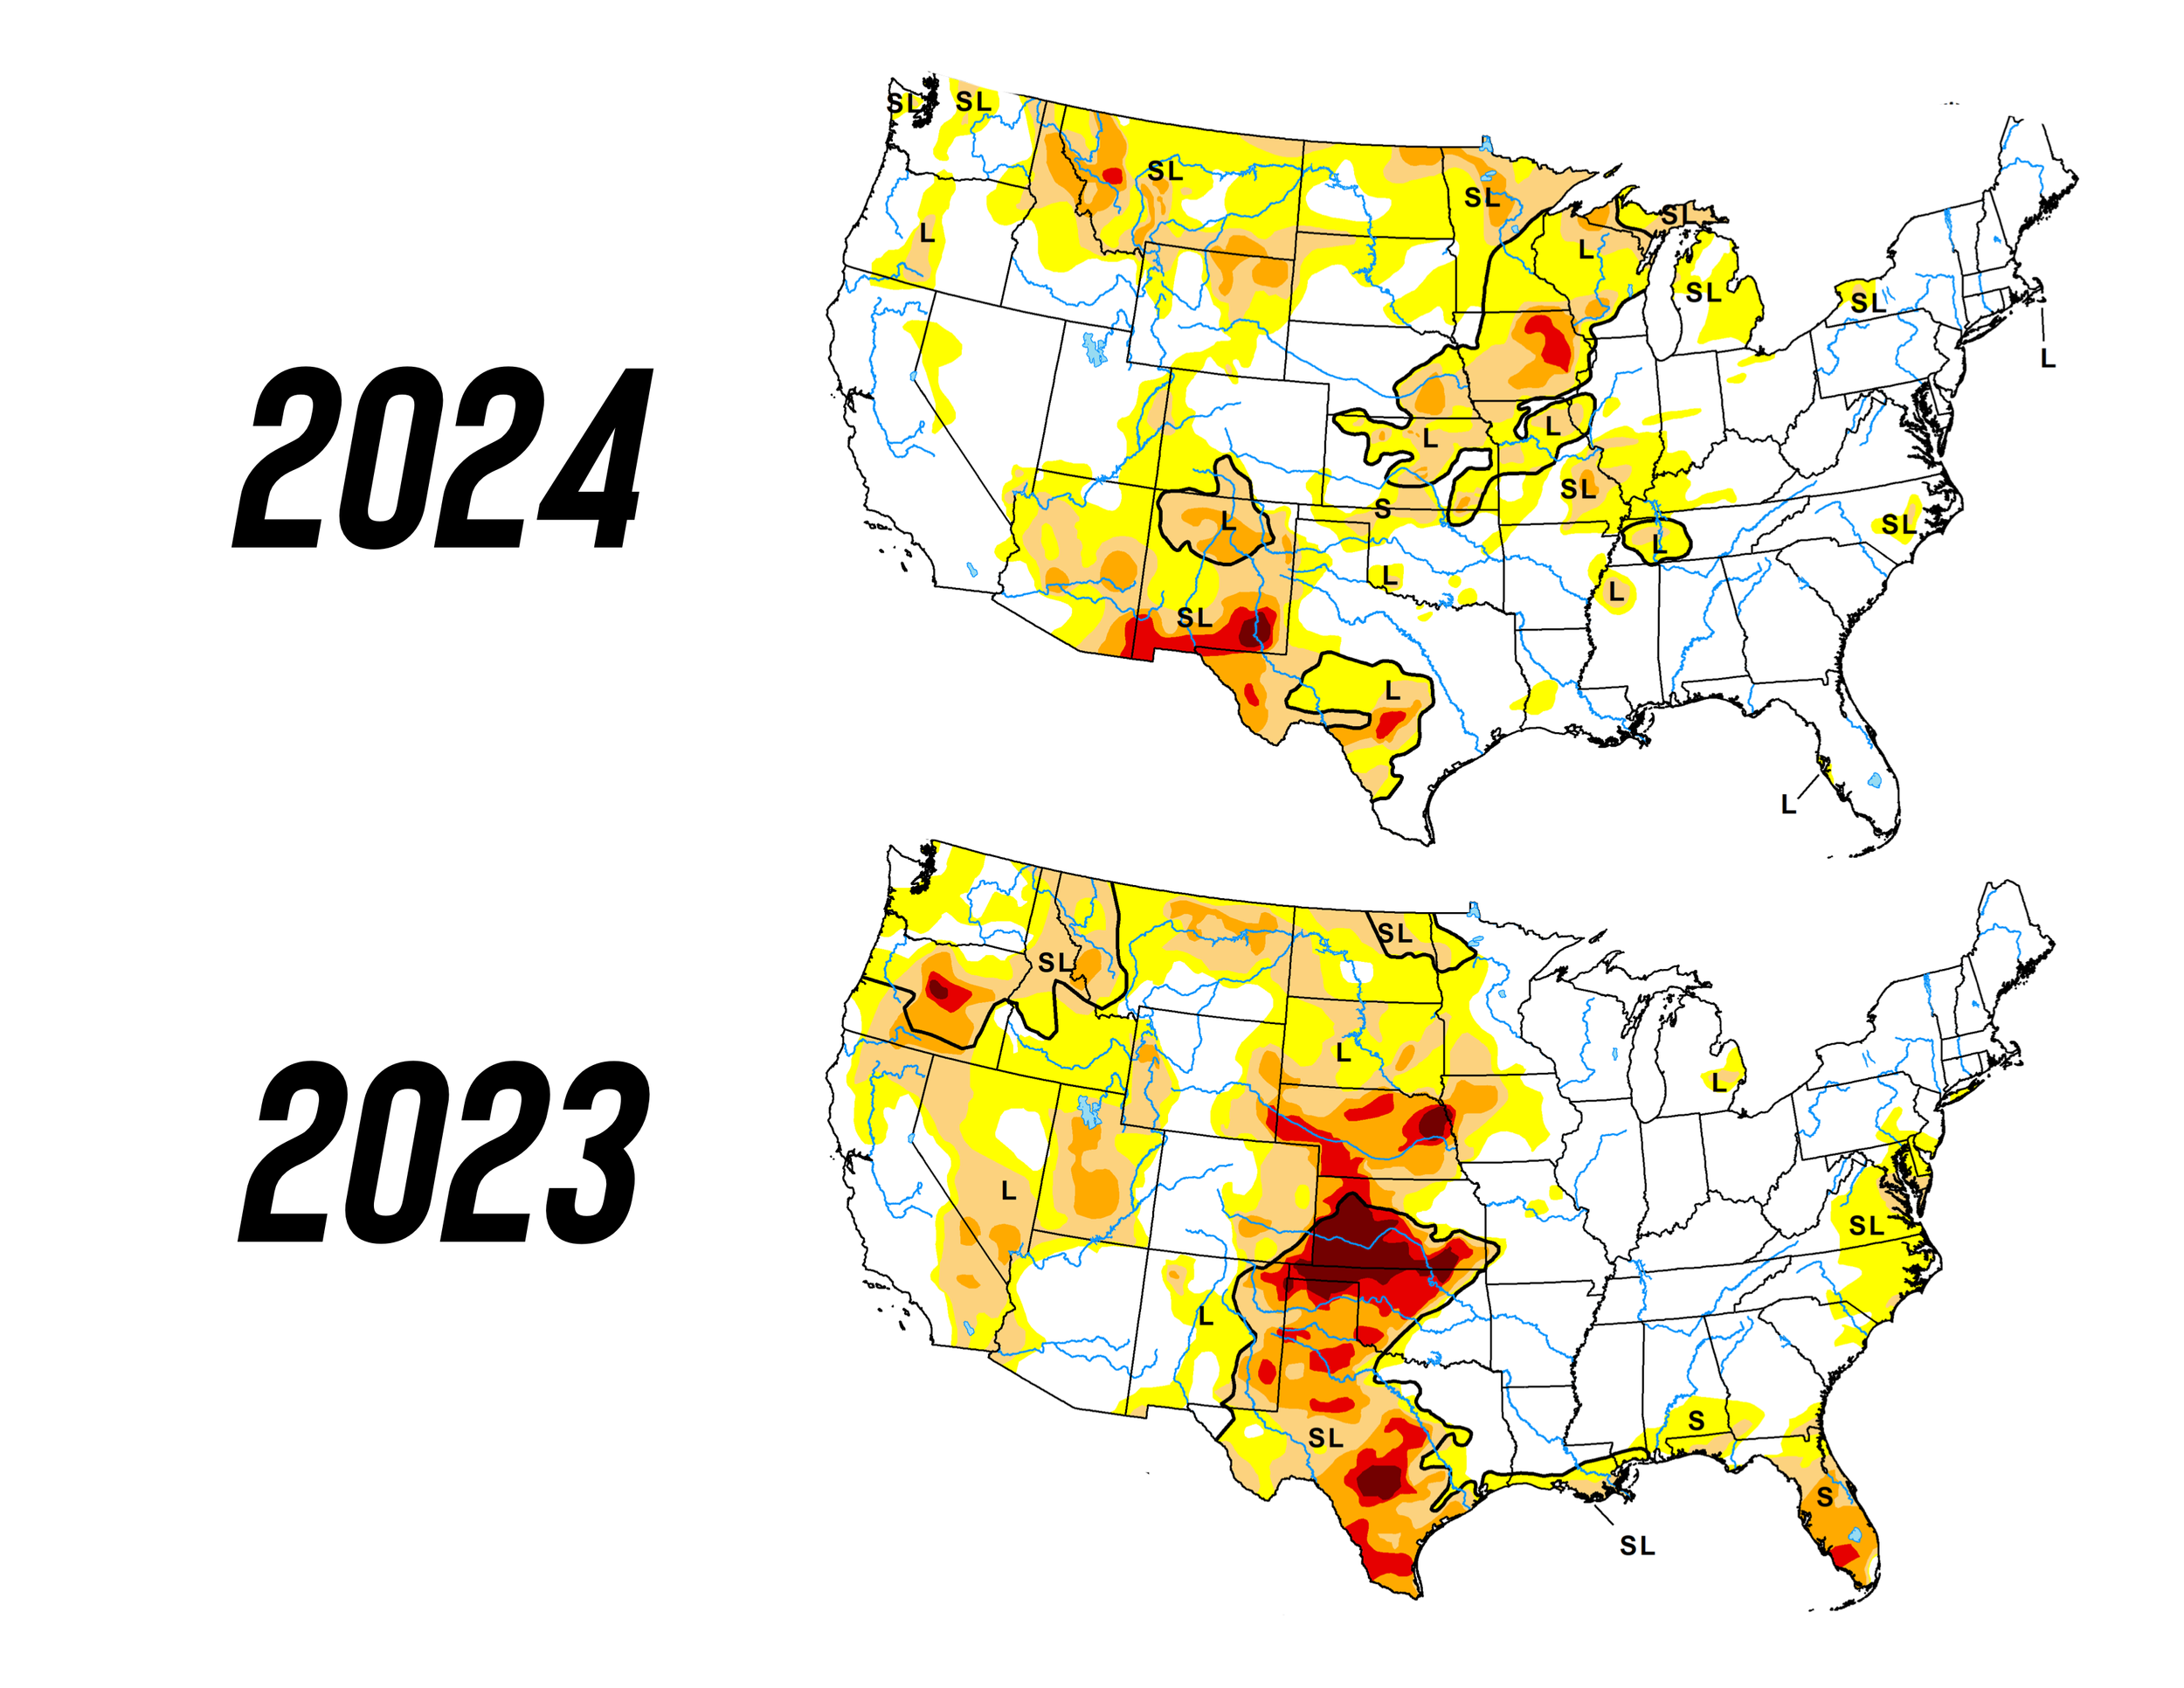
Below is two seasonal drought outlooks. The first was released 10 days ago. The second was released yesterday.
Originally they thought that drought would be persisting from now until July, however they now expect drought will be removed in a lot of areas such as Iowa due to this potentially wet spring and early summer.
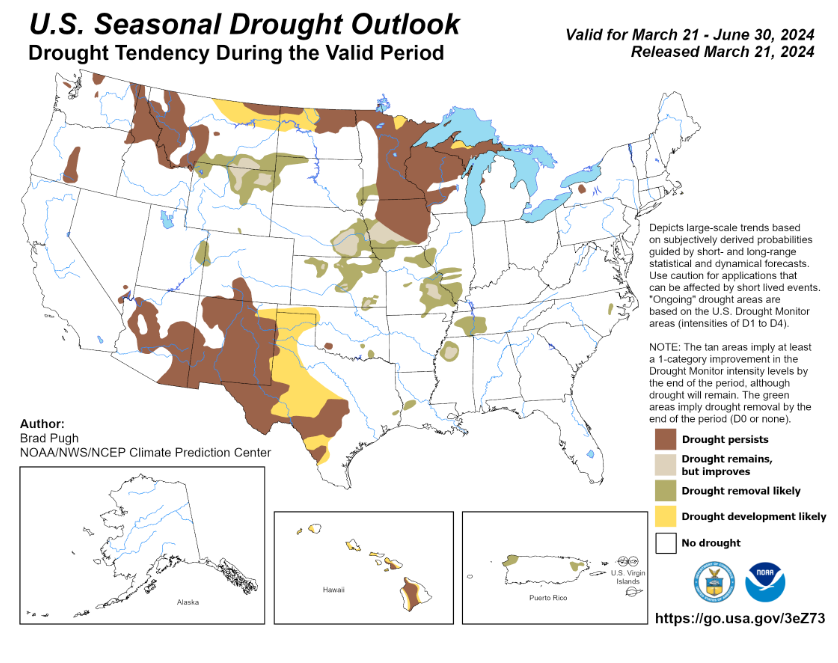
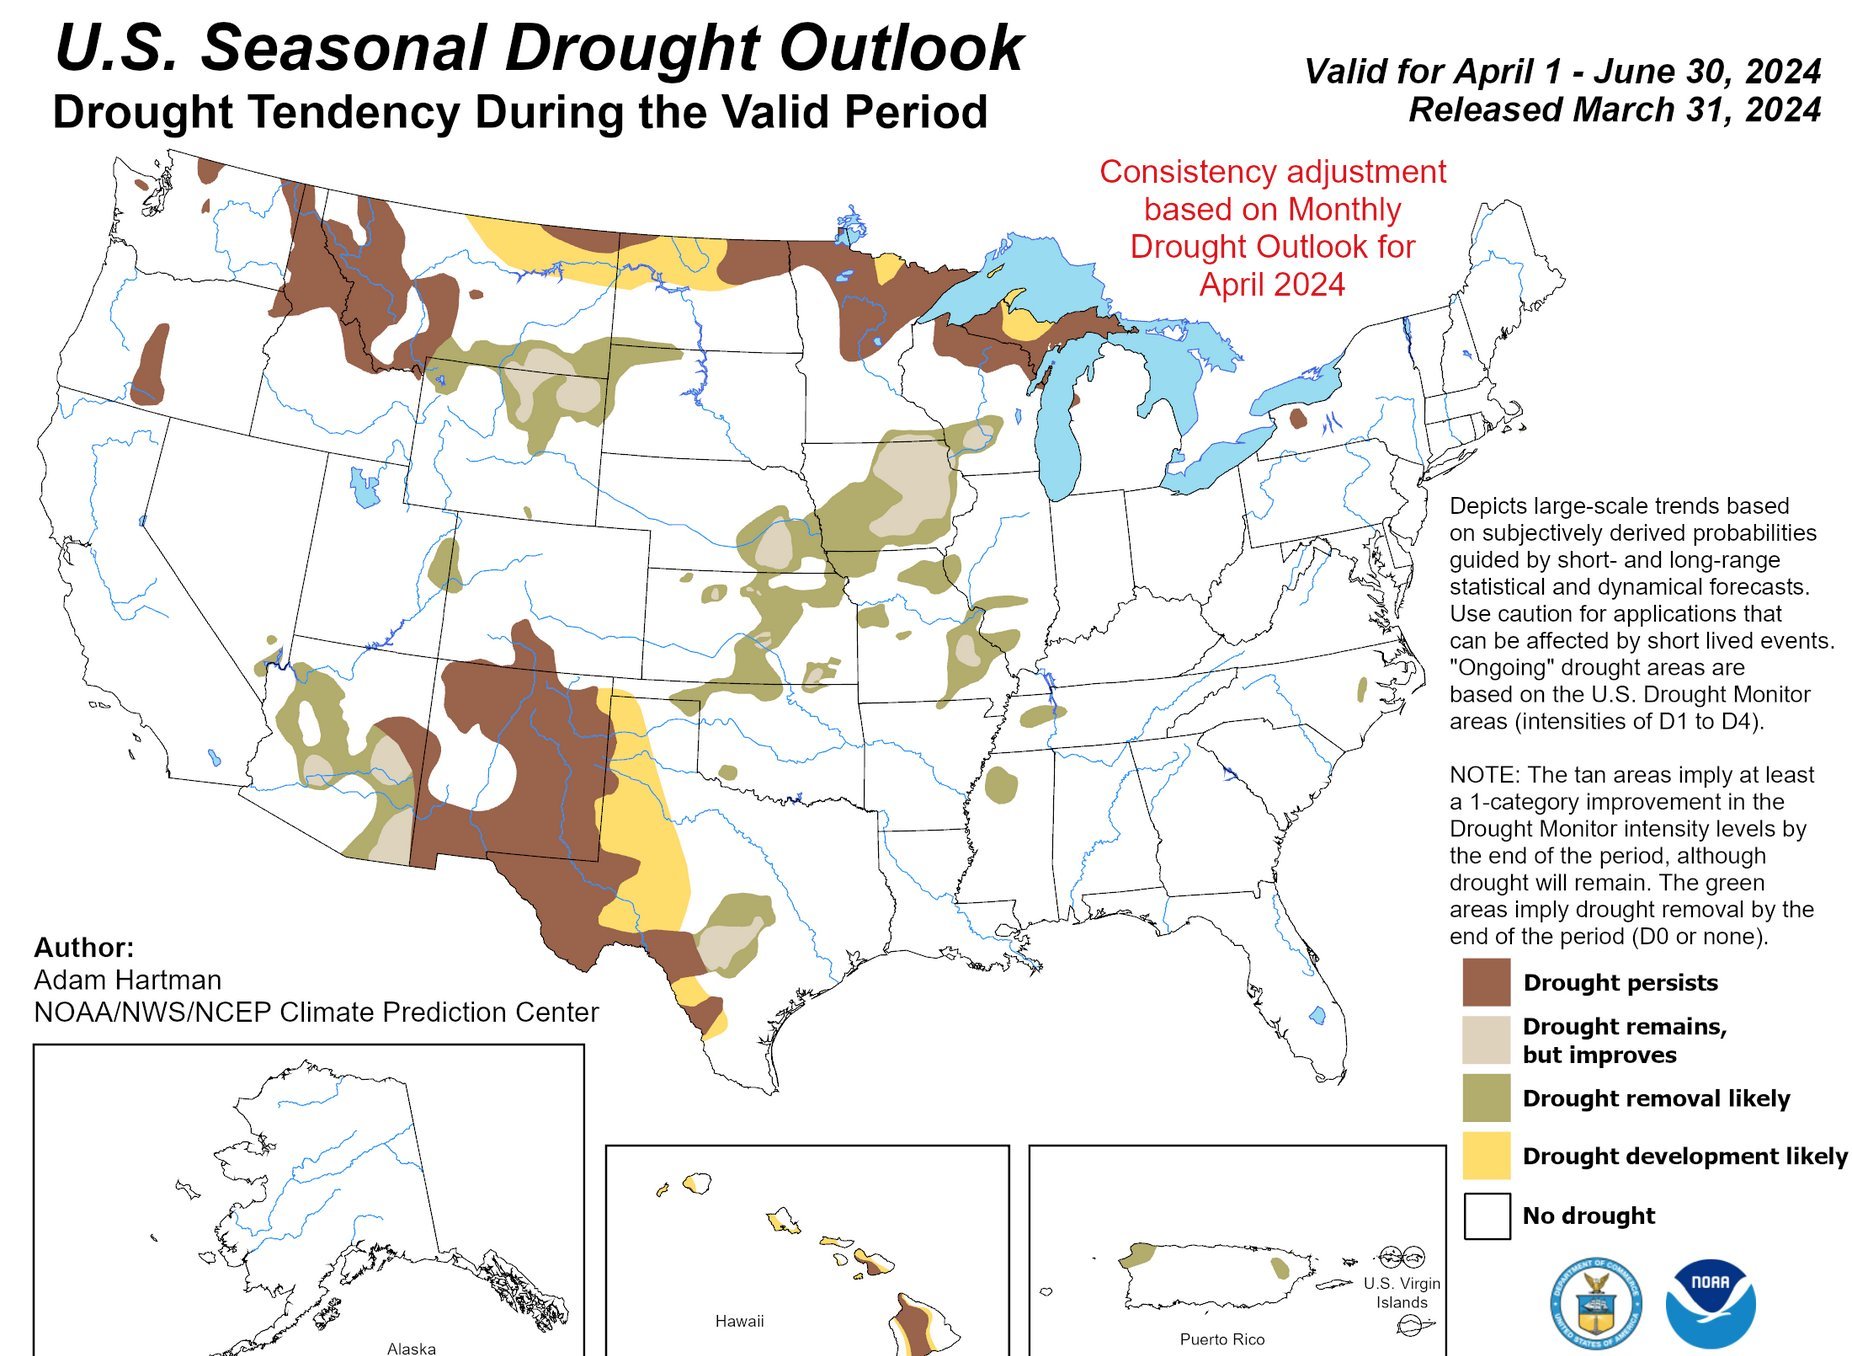
These rains could go a long way, but the corn crop is made in July. Soybeans are made in August.
The outlook for later summer is still hot and dry.
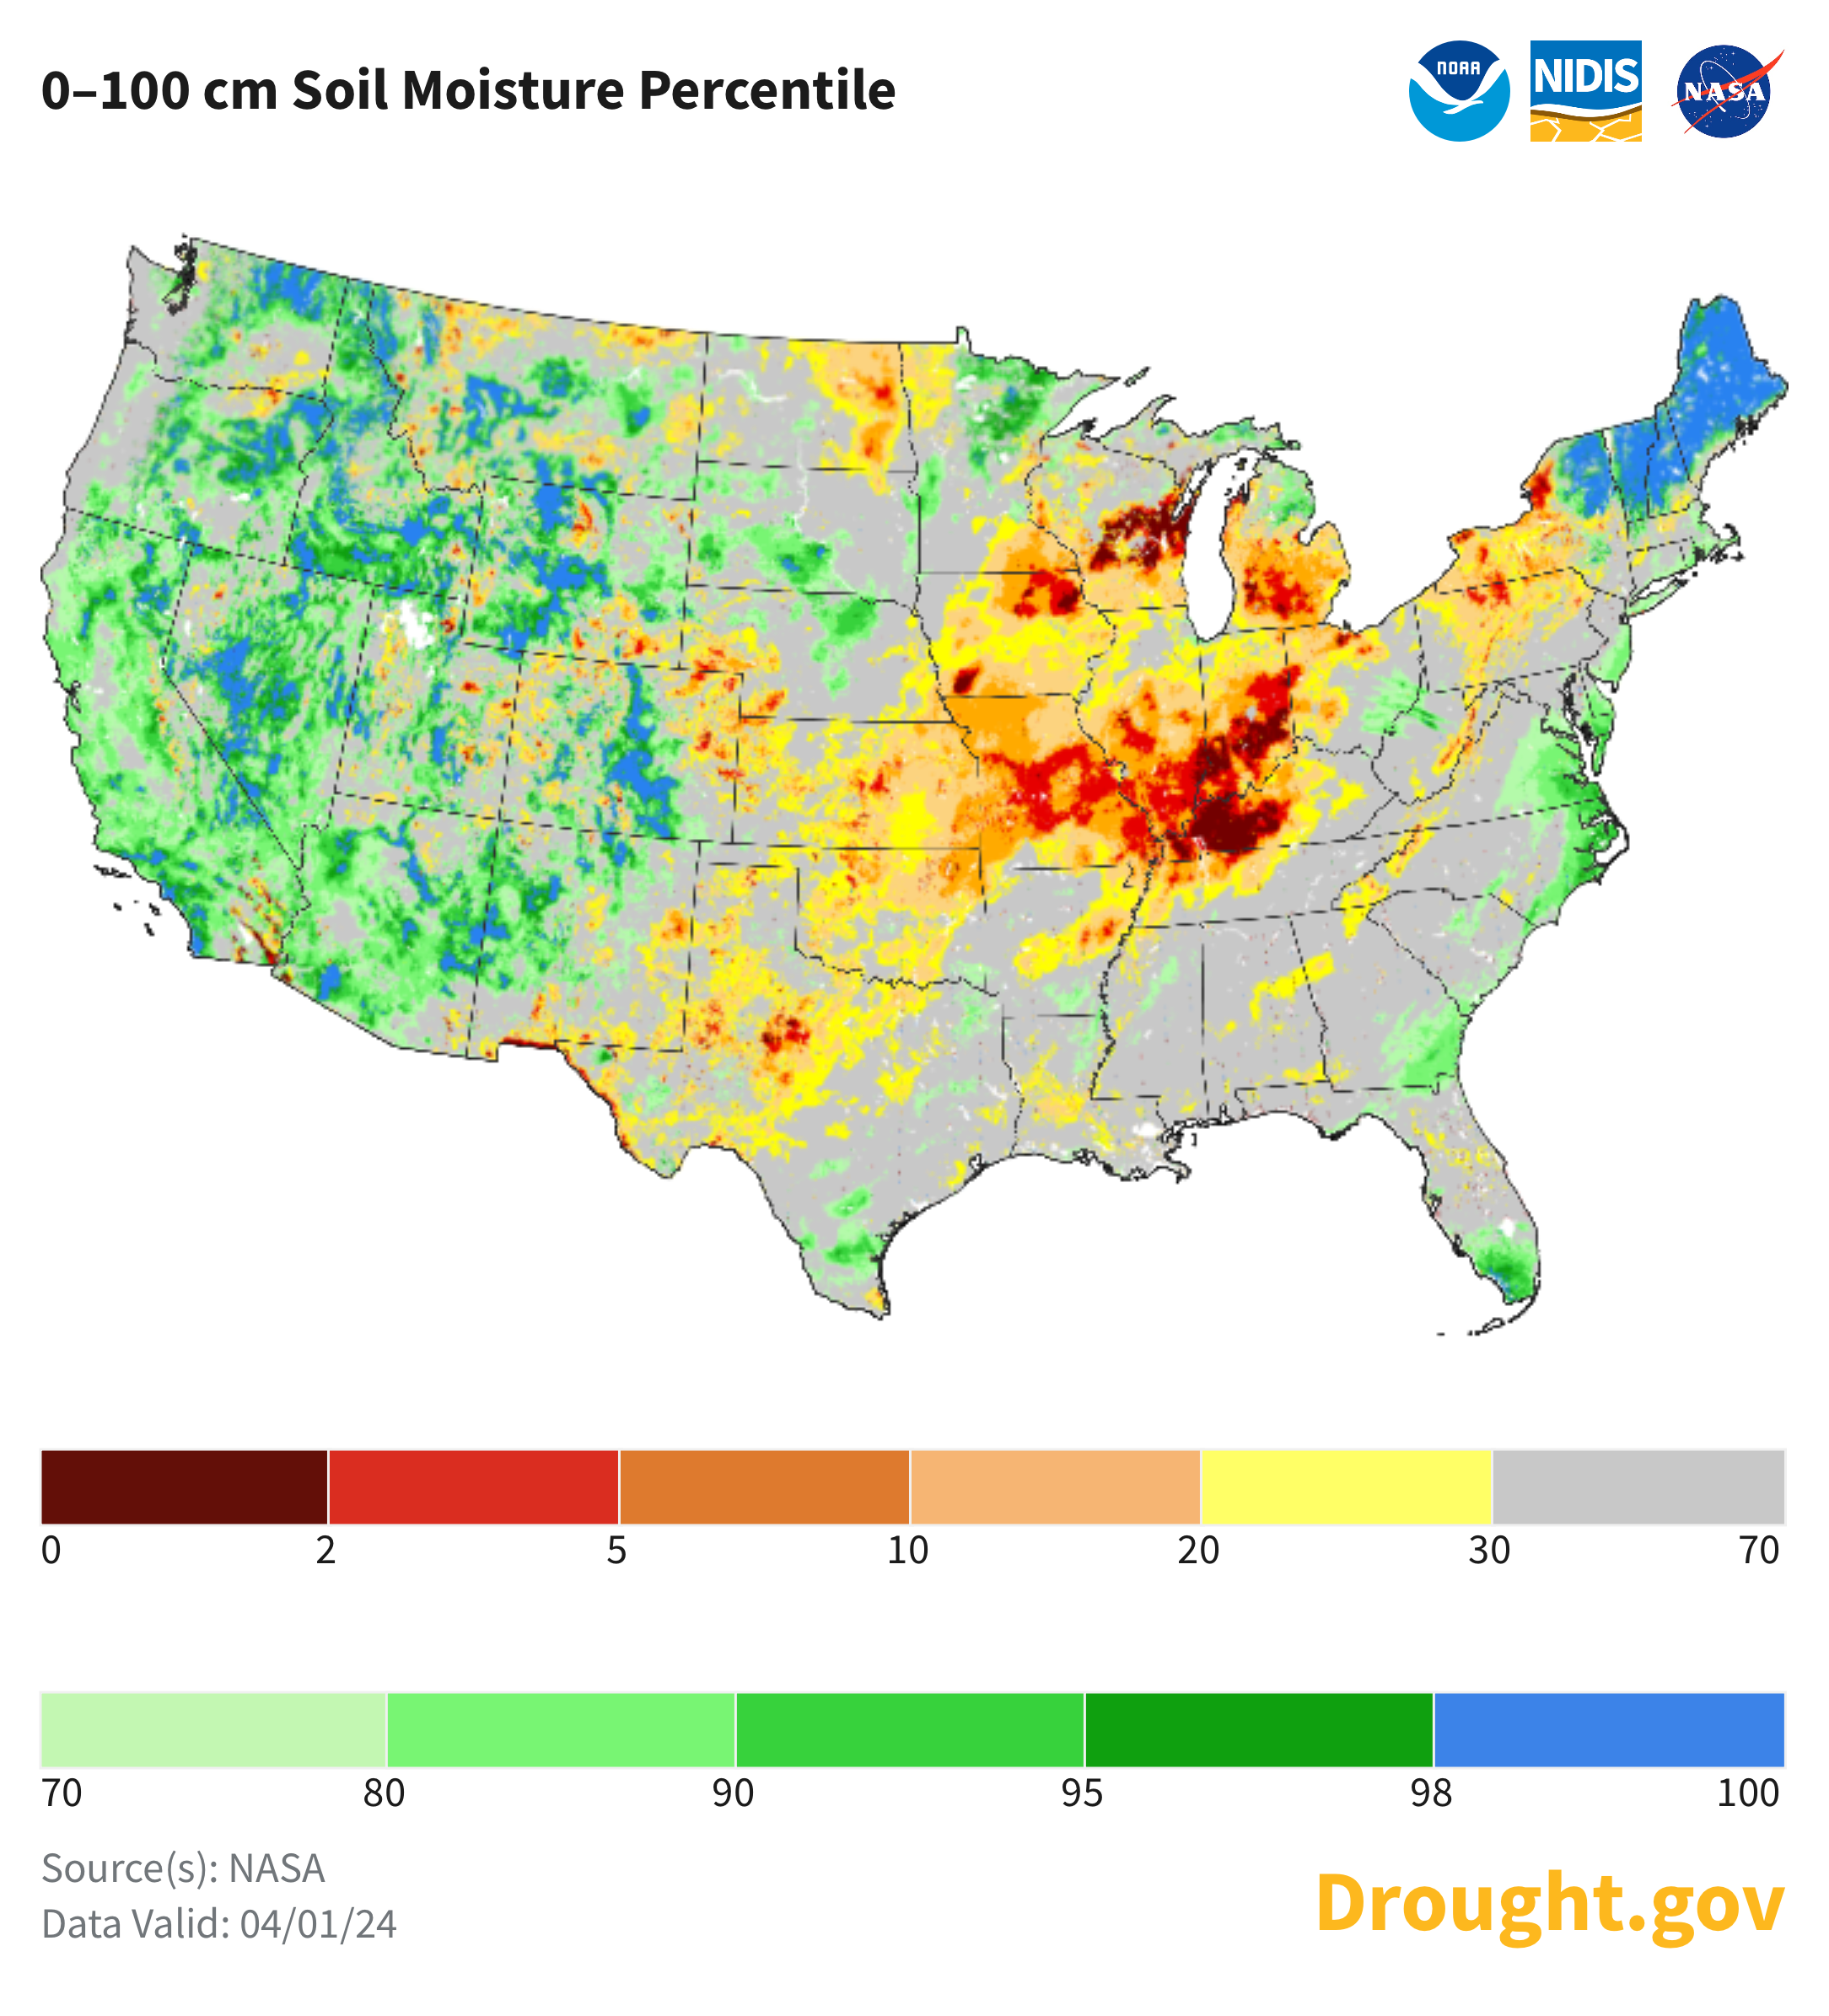
Subsoil Moisture in Top Growing States
Overall US subsoil moisture is 61% adequate vs last year's 67%
🌽 Top corn grower Iowa's subsoil is 24% adequate vs 69% a year ago
🌱 Top soybean grower Ilinois' is 58% vs 94% last year
🌾 Top wheat grower Kansas is 47% vs 20% last year
Today's Main Takeaways
Corn
Corn gives back part of Thursday's rally.
On Thursday we had the highest daily gain in corn since last July.
In Thursday's report we got the 2nd lowest average number in 6 years as we surprised lower. Coming in at 90 million acres vs the 92 million estimates and near 95 million last year.
Do these numbers have a lot of merit? Well considering it is based off a survey where only half of the people respond, maybe not. But considering the high input costs as well as the price difference between corn and beans. It is doubtful we will be raising extra corn.
Will this 90 million acre number be higher come June? It very well could be. Since 2005, corn acres have increased 14 times from March to June. The acres have declined only 5 times. The average difference is roughly 1.4 million acres.
It was a little strange that the total acres from this report dropped so much. Which has many believing we will see an increase in planting acres in the June report similar to some past years.
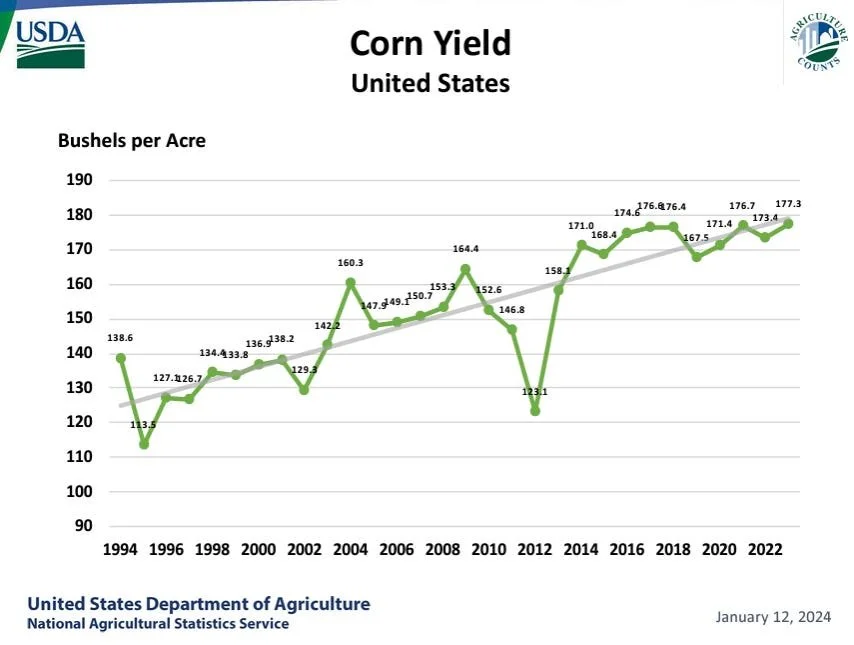
Currently the USDA has their initial yield pegged at 181 bpa.
I wanted to show this chart from Standard Grain.
In this chart they show what our US carryout for corn could be based on a calculator of things such as yield and harvested acres.
In the first chart they do the calculations using 90% of this 90 million planted acres. They got a 2.24 billion bushel carryout, which wouldn’t be bullish.
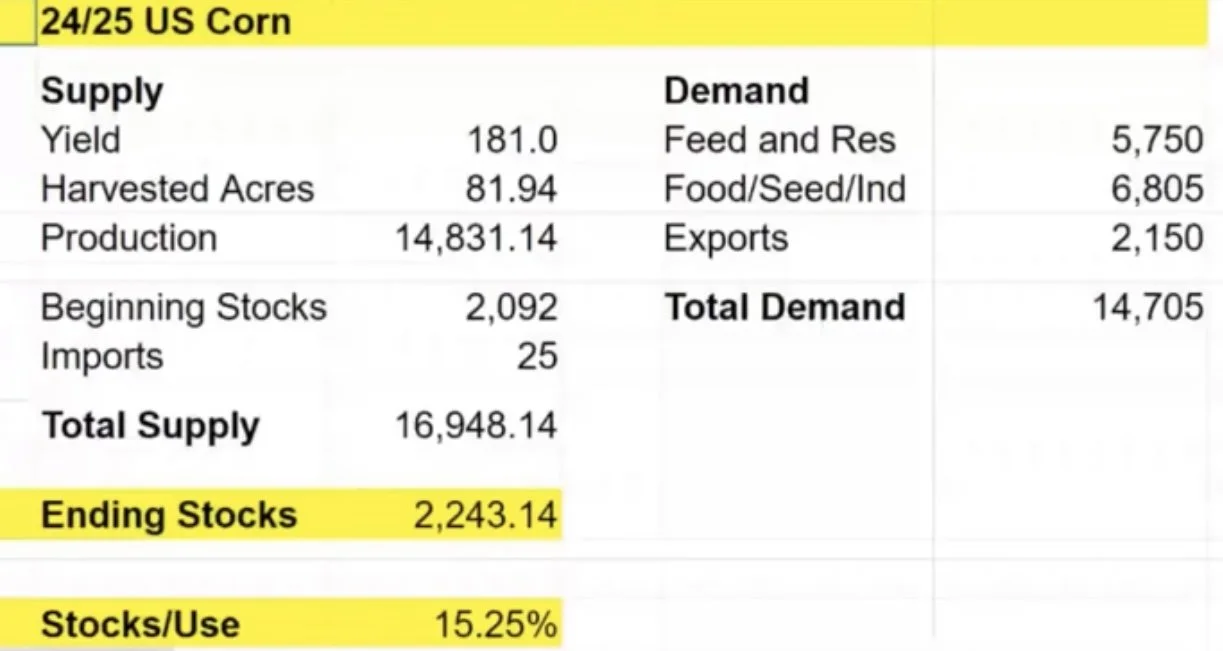
In the second chart they raised the planted acres to 92 million and used 90% as a base number for harvested acres. They got a huge 2.56 billion bushel carryout.
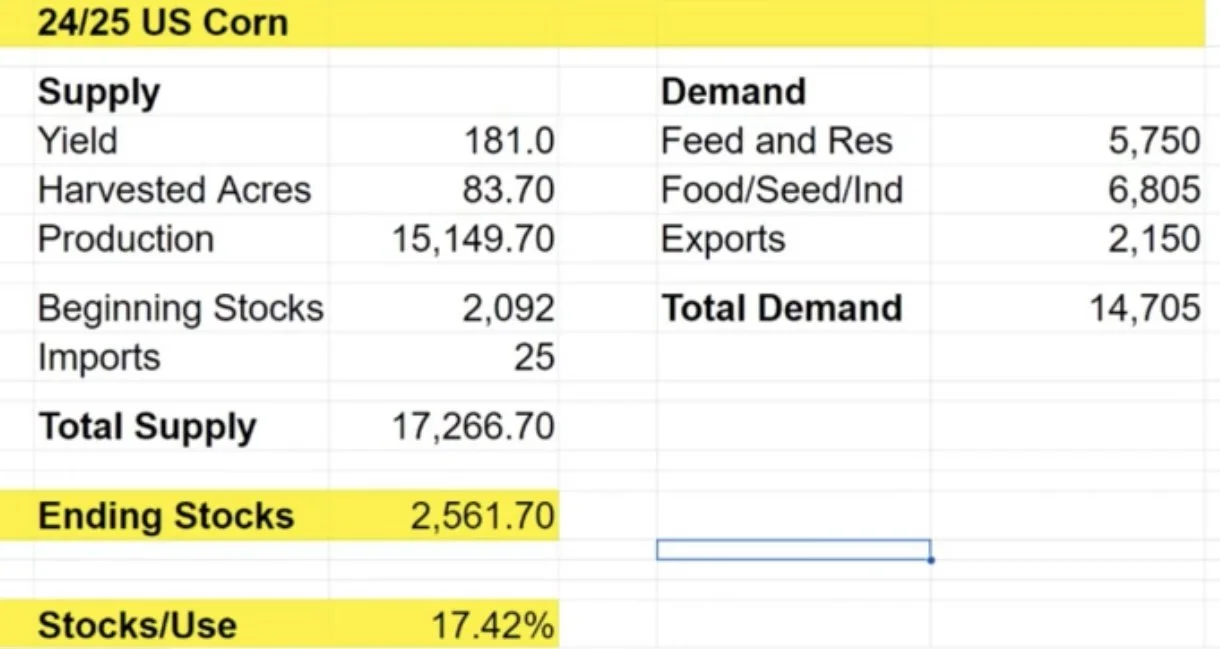
These numbers would both we very bearish, and would mute any chances of a rally in corn.
Does anyone actually believe we will see a corn yield of 181?
Keep in mind this carryout isn’t as bleak as it seems should the yield end up a lot lower than 181. If we were to have a yield of 171 with 90 million acres planted that would bring our carryout down by -900 million bushels. That may be a drastic number but you get the idea.
The USDA trendline yield has been stagnant for nearly a decade. With yields really topping out the past 6 years. We have struggled to get a number above 176.
Bottom line, we still do not like making sales here for most of you.
For a few weeks we had stated that with early planting, this market could take it on the chin.
However, this recent moisture has somewhat changed that opinion.
If this corn crop is 50% of more planted after the first week of May, the funds will likely stay short until the acreage report. So we could still get that early planting pressure we had been talking about, but currently the forecasts show rain which could slow things down. If this were to happen, the market would likely take it on the chin until late May before rallying on drought scares. Drought is short term bearish during planting season, long term bullish during growing season. Take 2012 and last year for example, we did not rally until June.
On the other hand, if we have less than 50% of this crop planted by then, the funds could very likely start to cover their short positions behind a "planting scare" driven rally. Rain is short term bullish, long term bearish because it delays planting but helps our moisture.
We will be wanting to make our sales in May, June, or July for corn depending on a few factors.
If we get a planting scare and rally, that is an opportunity.
If we get into June and the outlook for July looks like a full on drought, that is an opportunity. Remember, corn is made in July even if we get a decently wet spring.
Right now the forecasts for July suggest hot and dry.
Which opportunity presents itself will all come down to Mother Nature.
From 247 Ag:
"Comparable La Nina summers of 2010 and 2020 saw yields down -7% and -5%. For 2024, that would translate to yield of 168 bpa or 172 bpa."
When talking about weather experts, "Their story is that El Nino is now fading faster than originally thought, bringing forth the La Nina sooner. They now see a fairly strong La Nina by July, increasing the chances for a hotter and drier summer in the midwest."
We will let you know when that opportunity comes, but for now I am remaining patient on sales. Some of you still may want to utilize courage calls or lock in floors. Give us a call if you want to discuss marketing or anything else. (605)295-3100.
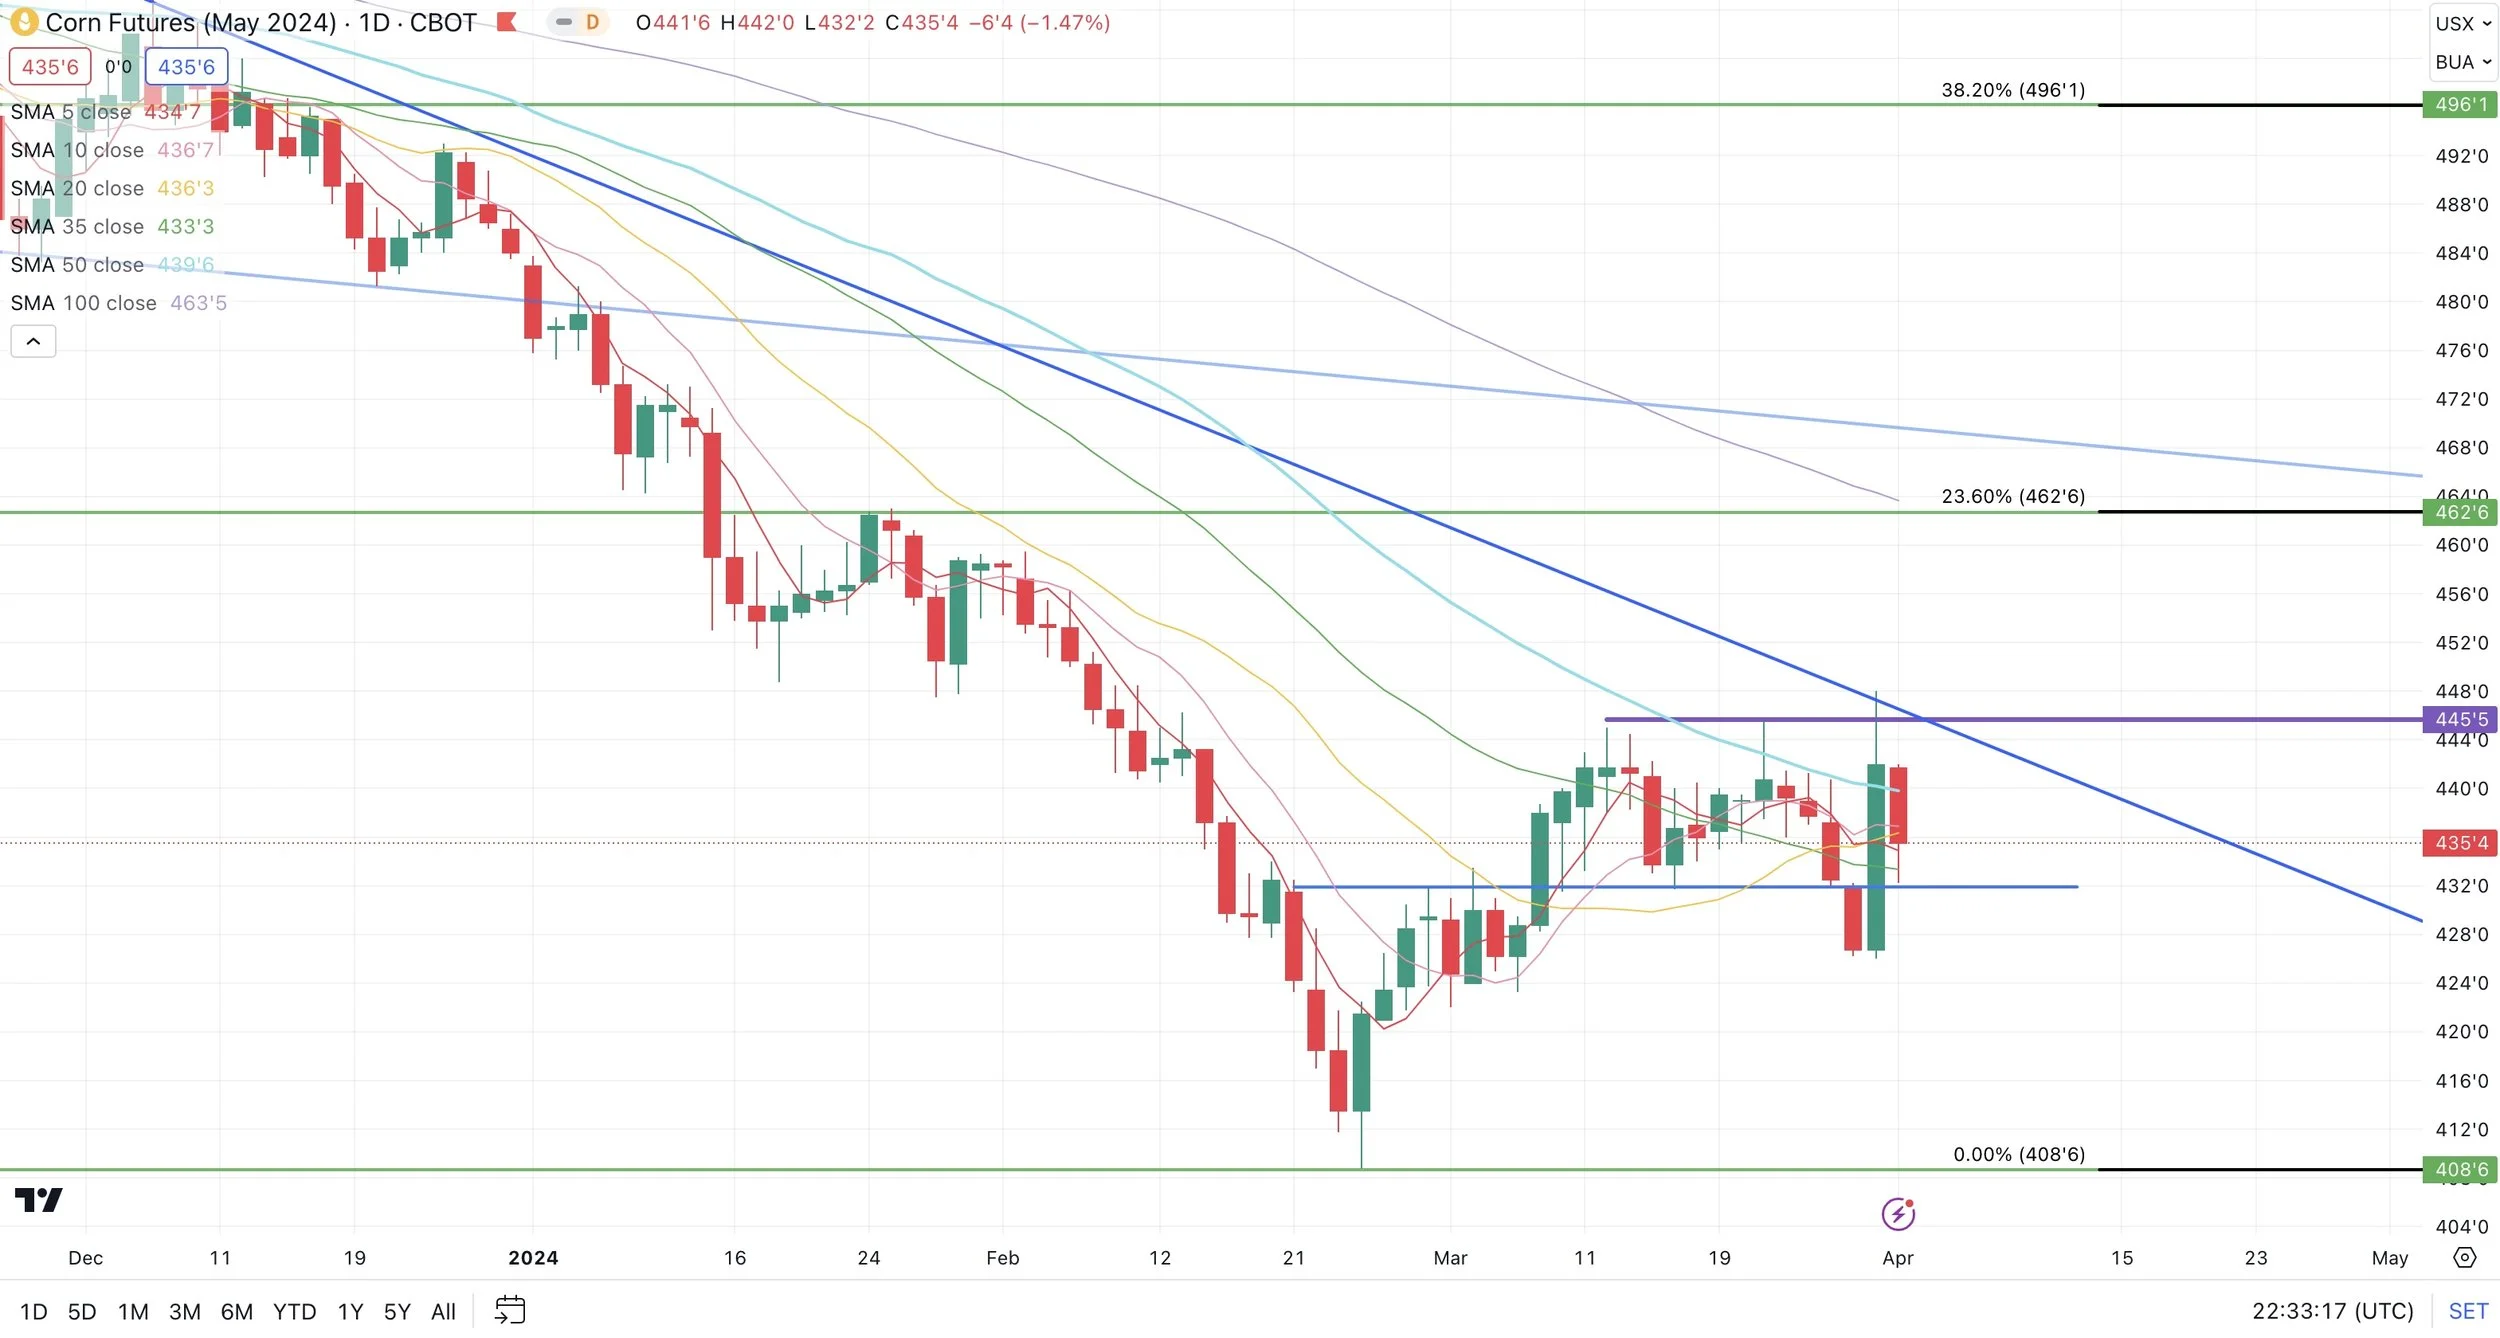
Corn May-24
Soybeans
Thursday's report was neutral for soybeans. It was not bullish by any means.
We saw acres up nearly +3 million from last year as the gap between corn and bean acres narrowed.
The more it rains the more soybean acres we will get. The less rain we get the more corn acres we will get.
In the report we did see an increase in the stock numbers.
The biggest thing here was that the increase came from on farm storage, not off farm storage. Meaning that the US farmer is holding that supply. However if this supply isn’t for sale and farmers are not forced to sell, the supply isn’t necessarily actually there as farmer selling around this time should be a non-existent factor.
Bulls and bears continue to argue at how big or small this Brazil crop is. This will be the ultimate wildcard until we get into the planting and growing season for soybeans.
The USDA currently has 155 for that crop while most are closer to 150.
The crush numbers for soybeans are still a friendly factor. We have a chance to see the USDA 50 million bushels or more light on their export demand numbers, which would make our carryout all that tighter. We continue to set record month after record month and I do not see crush demand for soybeans going away.
The funds are still very short soybeans which gives us all the more potential to see short covering, but we will need to see some demand.
As for as marketing goes, there are plenty of factors that could justify soybeans trading anywhere from $13 to $14 this year.
$14 might seem like a stretch, but remember last summer we went from $11.30 to +$14 very fast. When everyone was saying it wouldn’t happen, we did. The path way for that to happen this year again is there.
I don’t love making sales here. If you are undersold there is nothing wrong with rewarding a near $1 rally. But personally, we want to be making sales in soybeans closer to summer and when we seasonally make our highs in that July to August time frame typically. Soybeans typically make their highs after corn does.
$11.75 is the level bulls want to hold. $12.17 is the level bulls want to take out to bring on more upside.
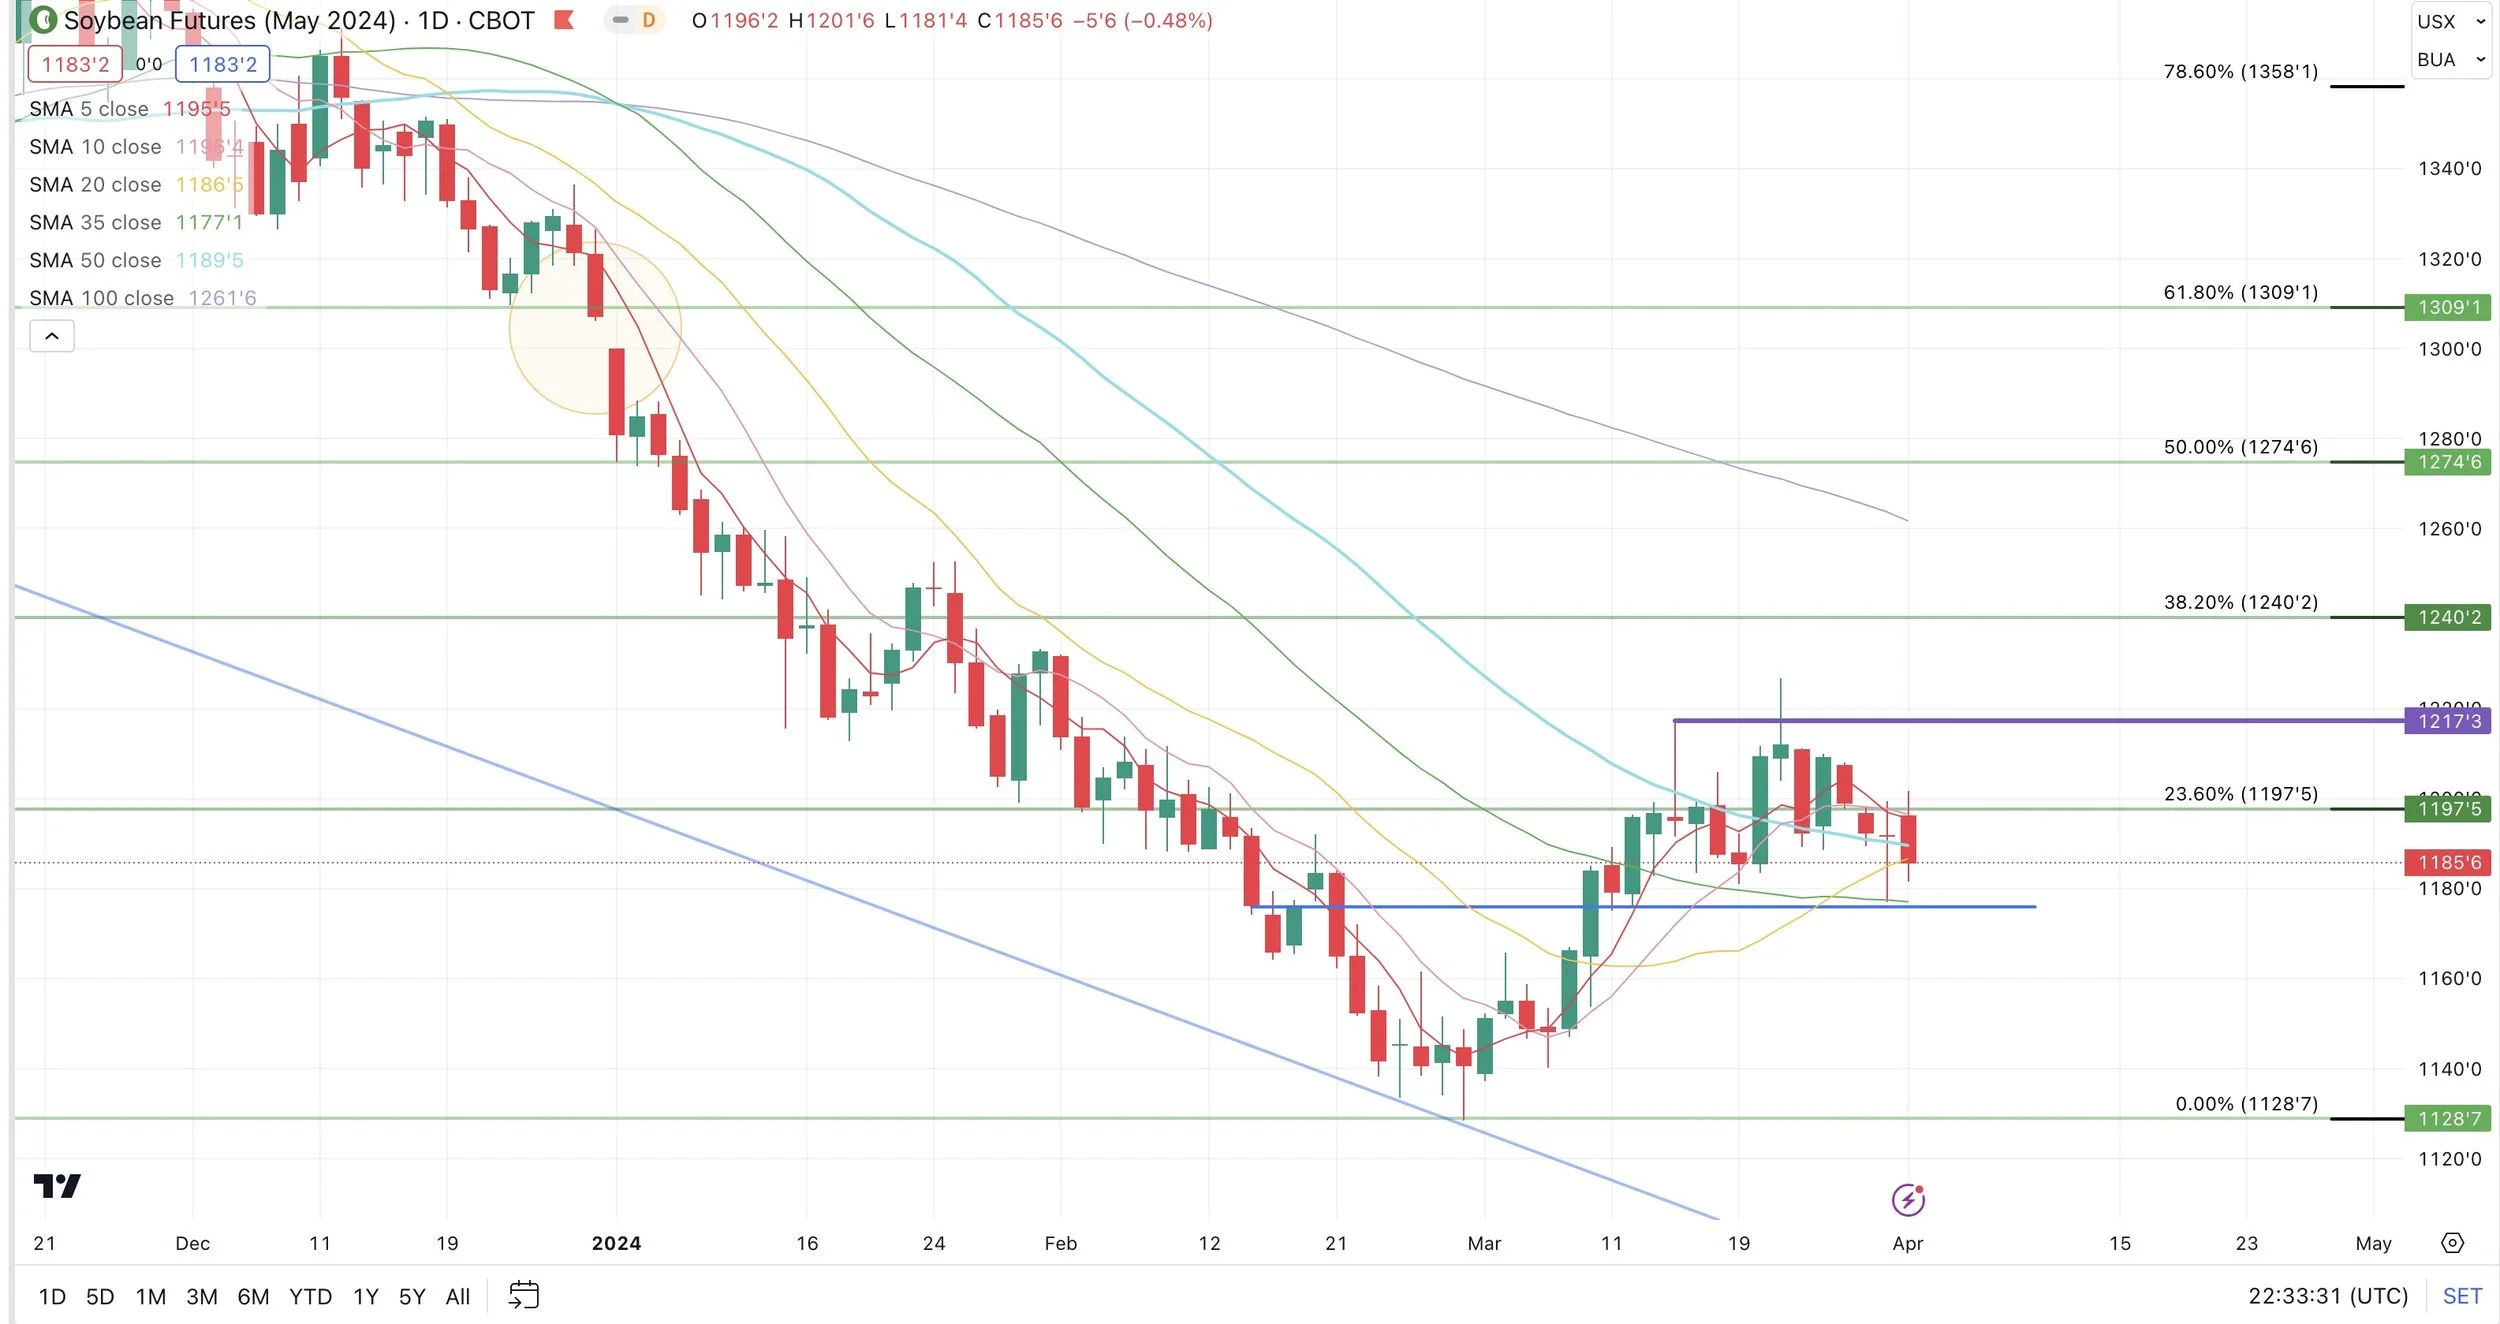
Soybeans May-24
Wheat
The wheat market was under pressure but Chicago wheat closed well off of it's lows.
Russia issued some certificates to the ships waiting to get out. So some of the pressure today came from more ships moving in Russia.
Ample Russian wheat supply remains the biggest hurdle wheat futures continue to face.
Spring wheat was under pressure due to more acres in the report on Thursday.
We are also getting moisture here in the US which is helping these crops.
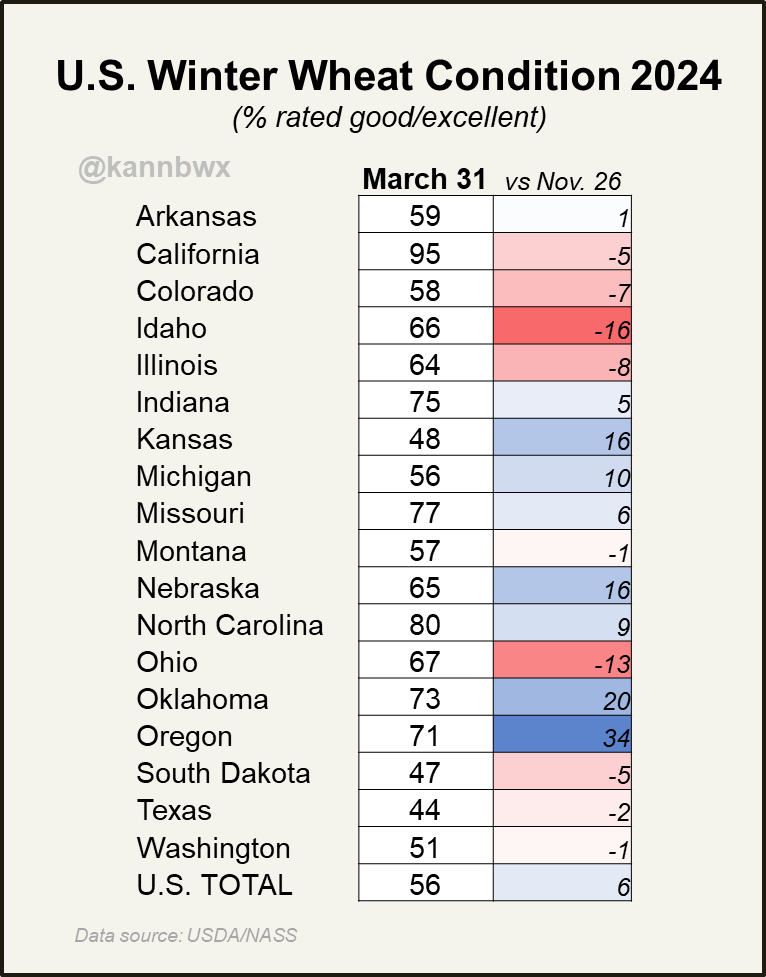
US winter wheat ratings came out today rated 56% good to excellent. This crop was rated 50% in late November and 28% a year ago. So the crop is clearly far better than it was last year.
Here is a state by state breakdown from Karen Braun.
Other than that, not a ton new for the wheat market.
Still being patient waiting for the right opportunity to present itself.
The wheat charts are starting to look better. There is no clear sign that we are going higher just yet, but last week was the first week in a very long time where we closed above the previous week's highs.
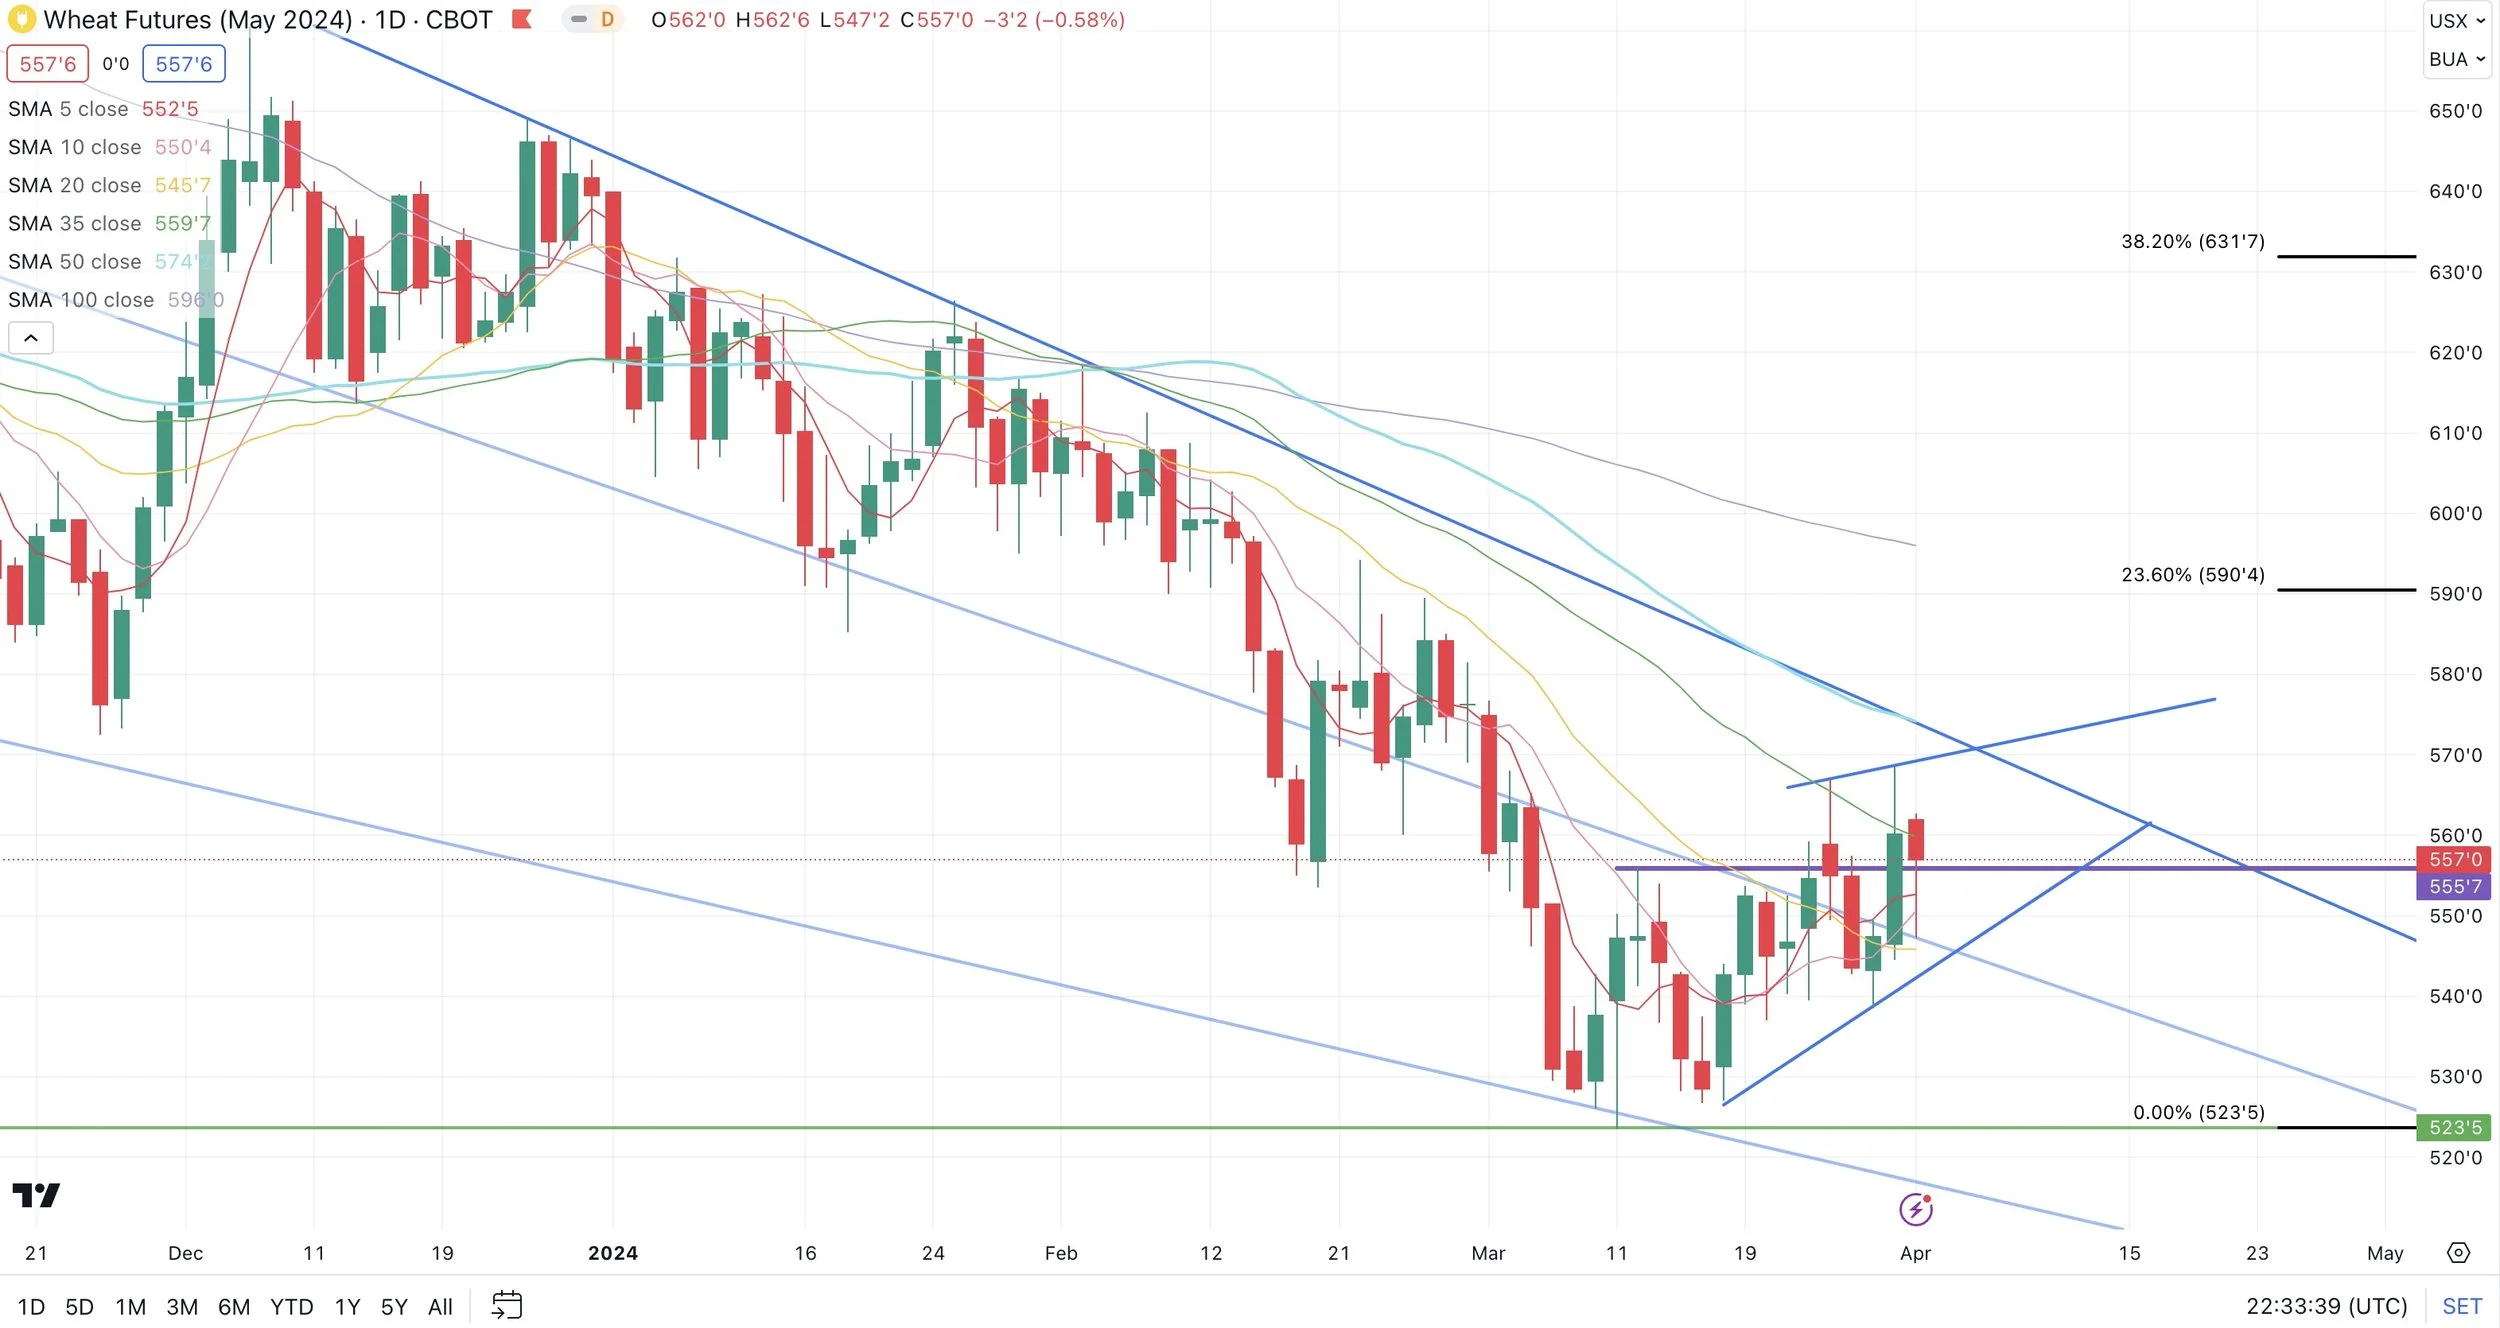
May-24 Chicago
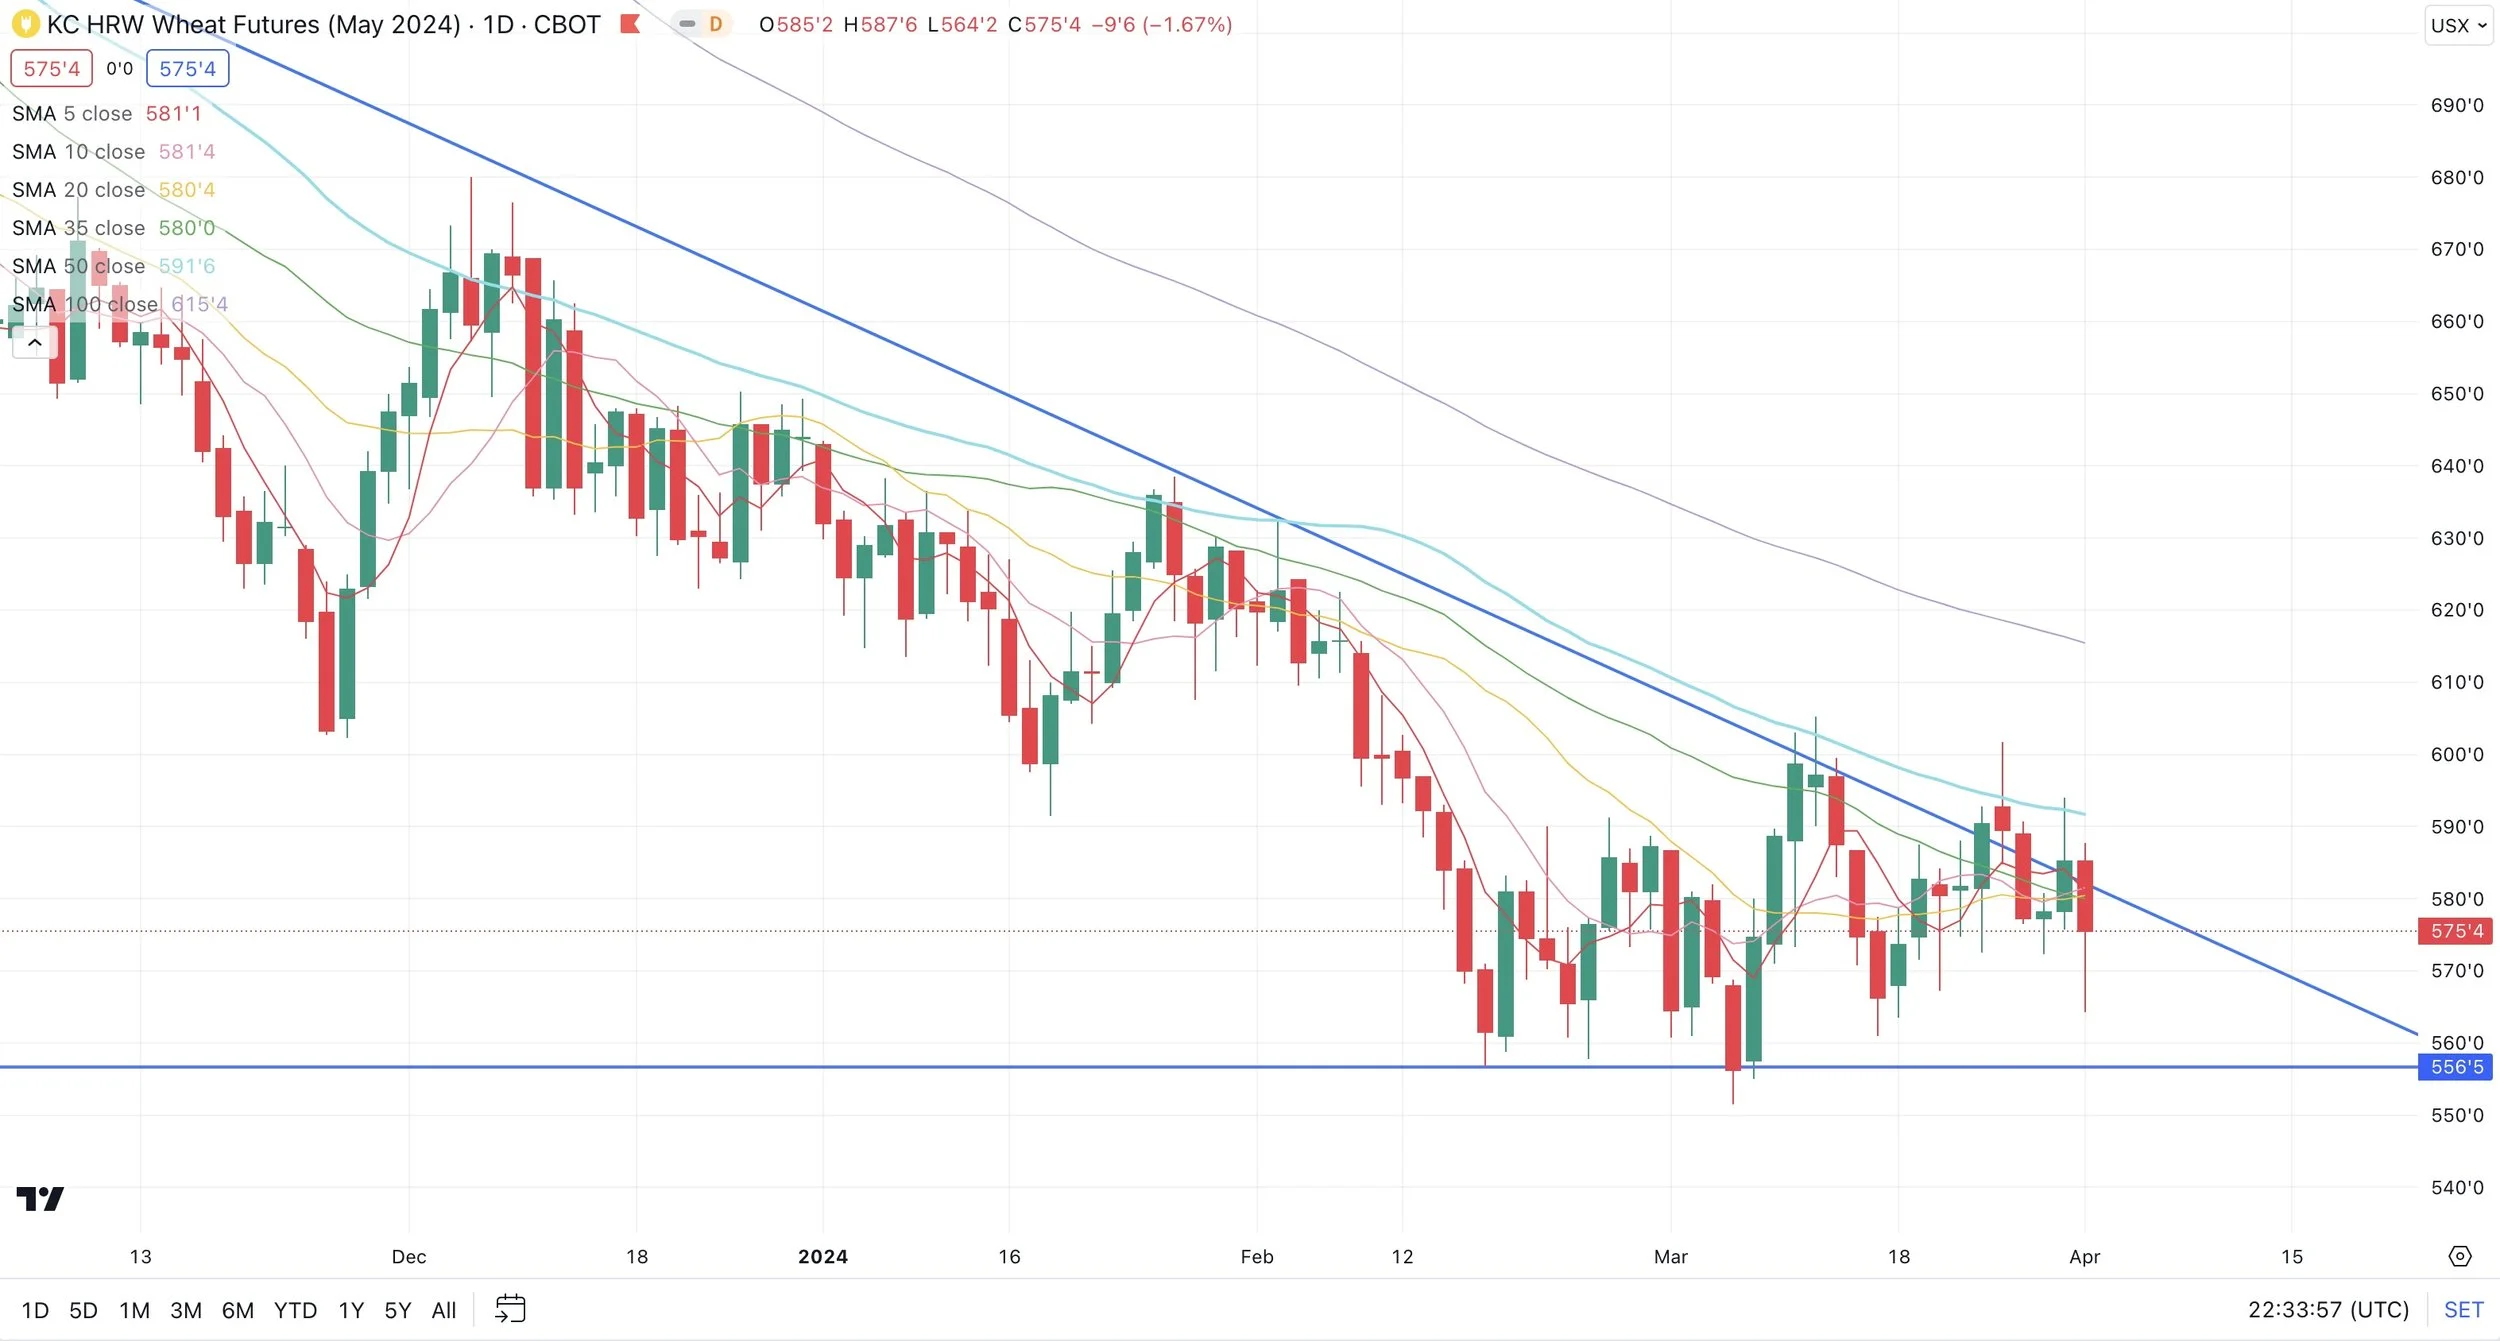
May-24 KC
Cattle
The cattle market got hammered today with the bird flu news.
Even without the news, I had been saying for weeks that this market looked toppy and could be nearing it's highs. I am still leaning towards bearish from here as the charts look pretty ugly right now.
We are not too far away from those recent highs for those of you that missed the top.
If you want to discuss different strategies to use please give us a call (605)295-3100.
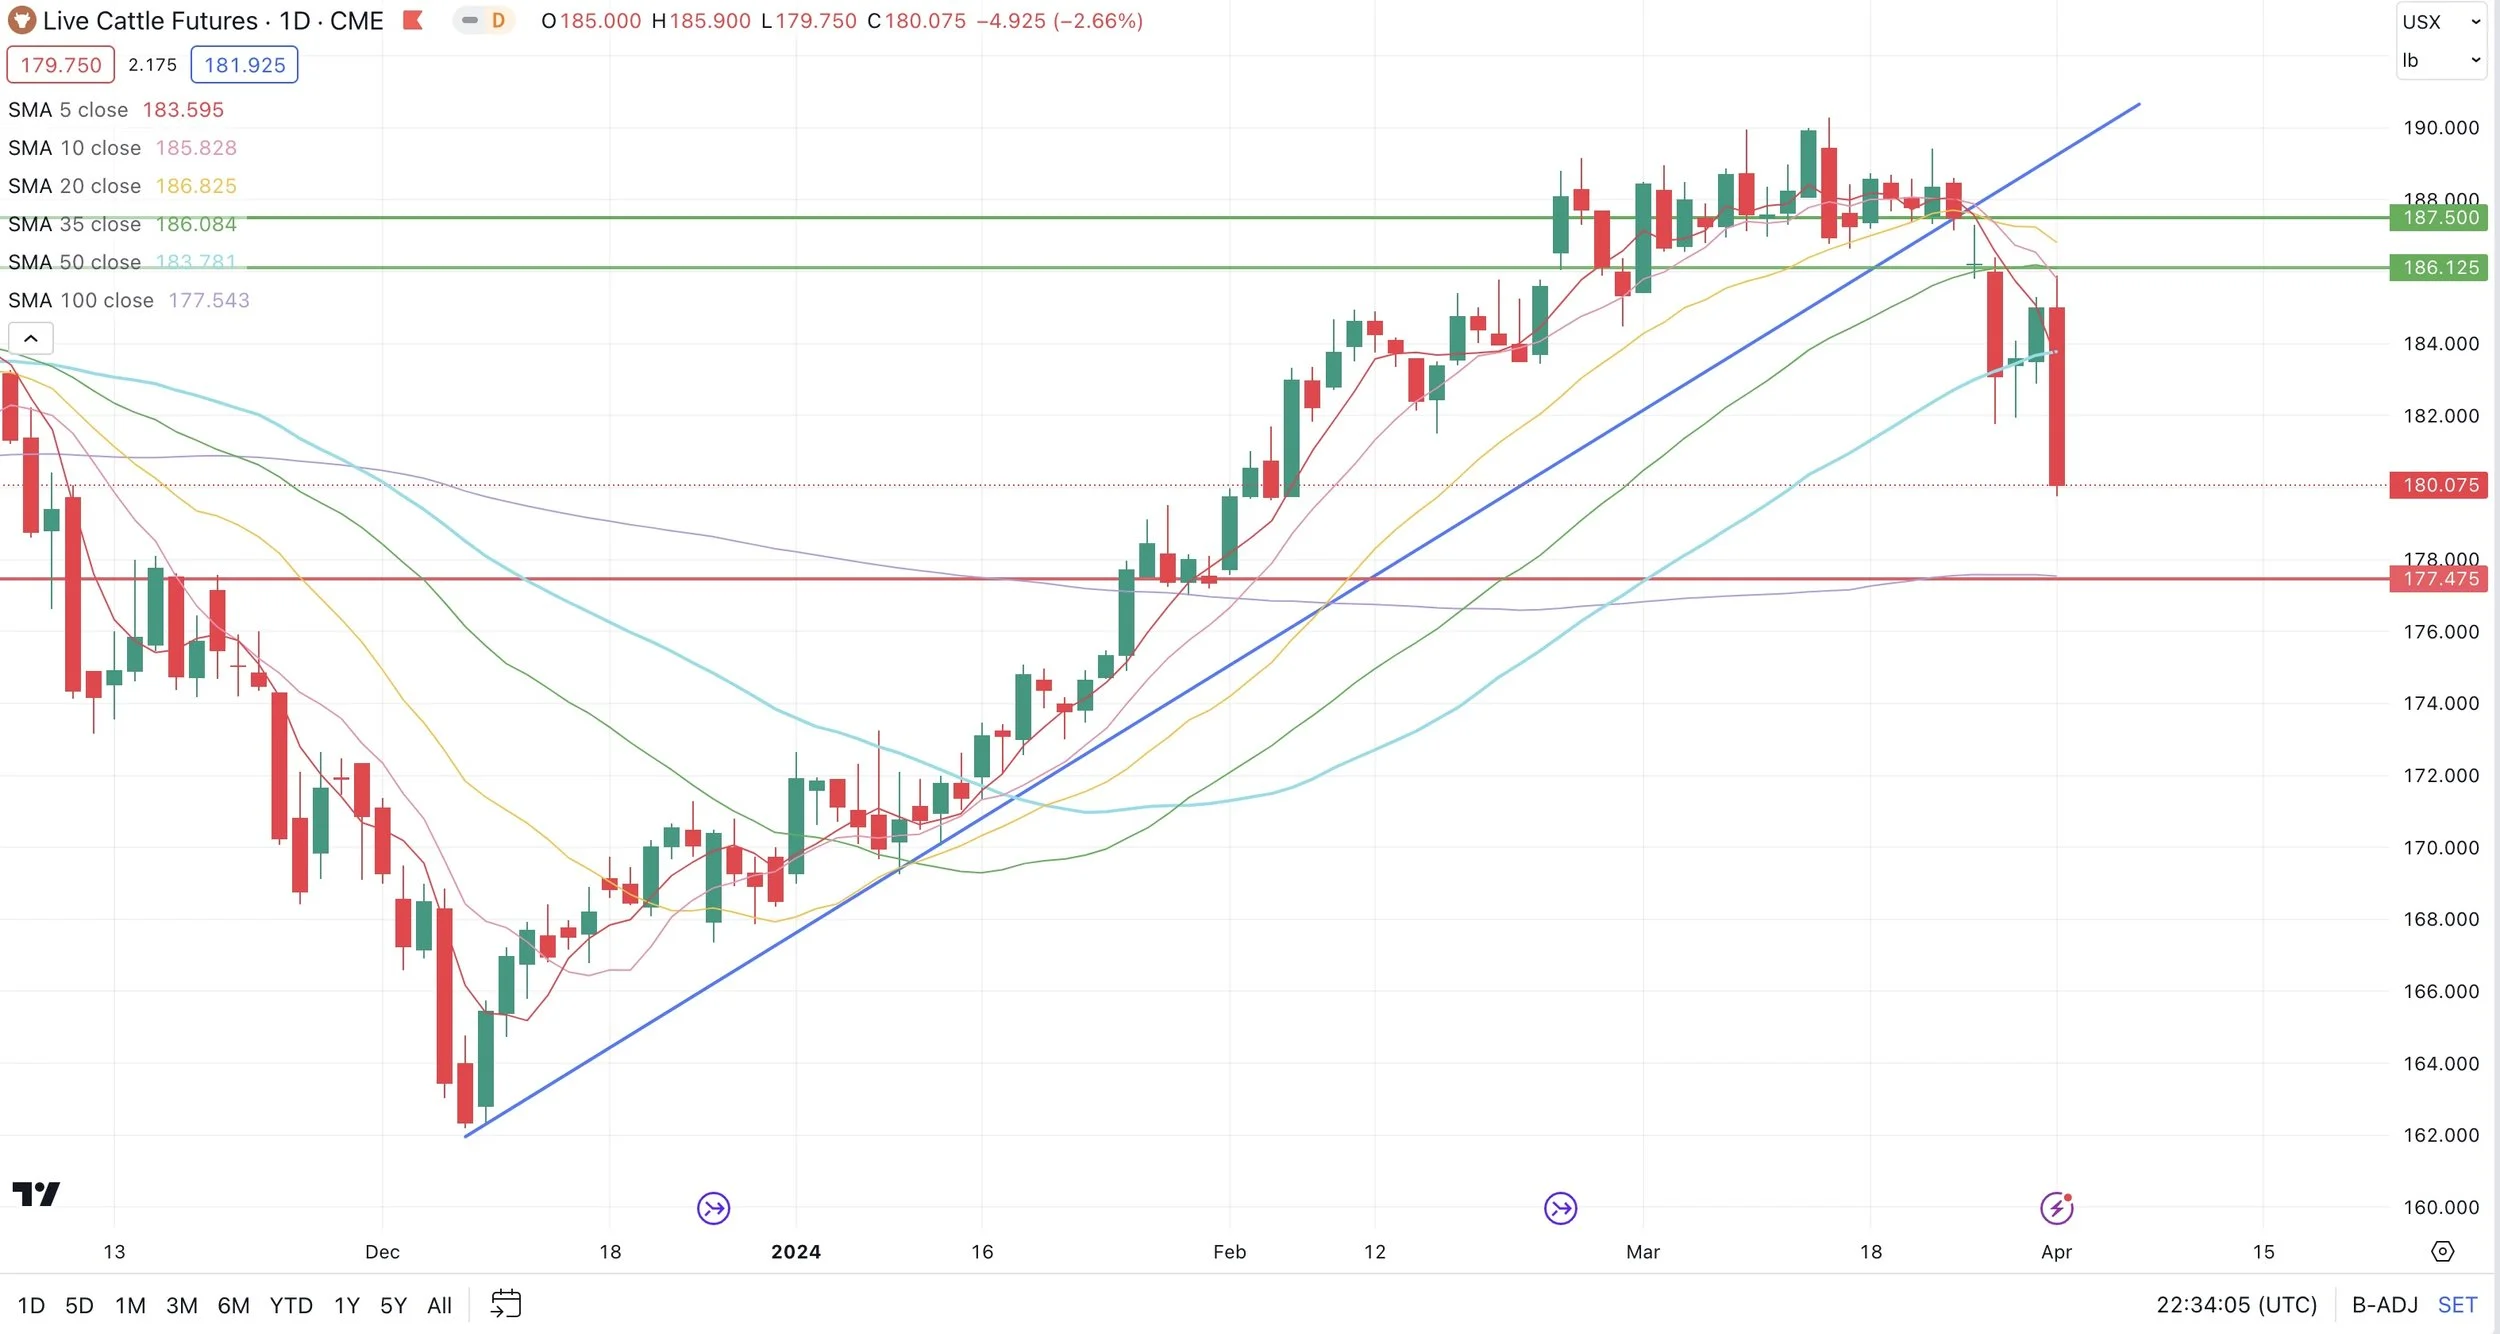
Live Cattle
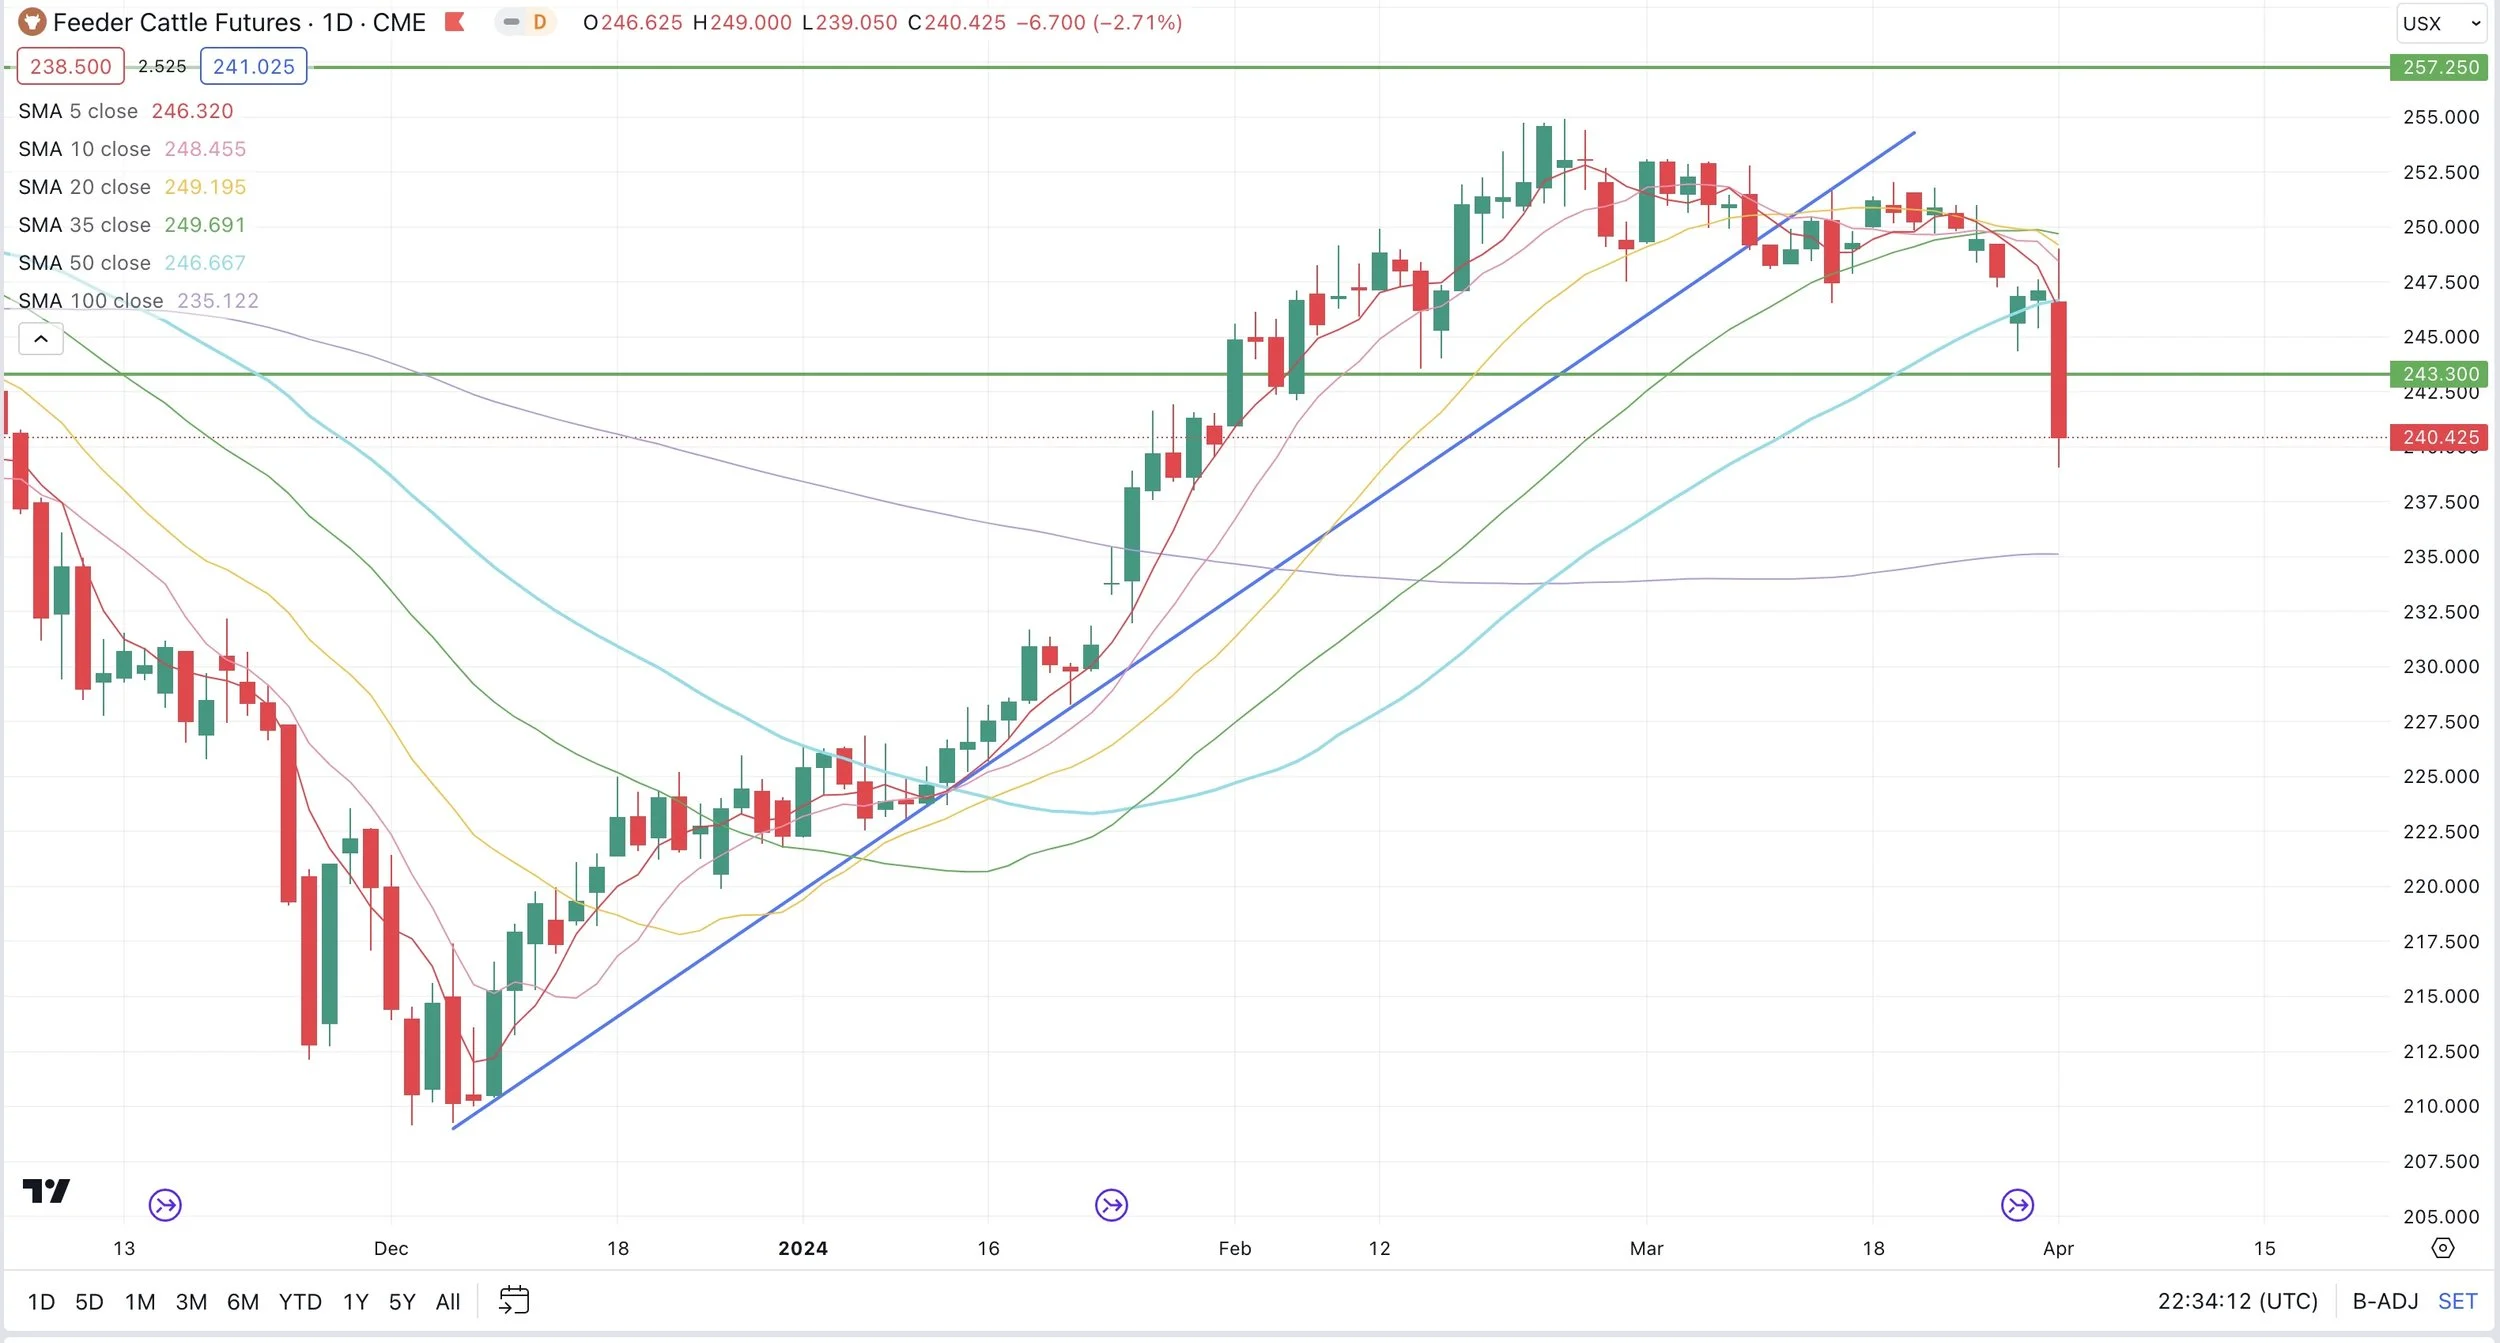
Feeder Cattle
Want to Talk?
Our phones are open 24/7 for you guys if you ever need anything or want to discuss your operation.
Hedge Account
Interested in a hedge account? Use the link below to set up an account or shoot Jeremey a call at (605)295-3100 or Wade at (605)870-0091
Check Out Past Updates
3/28/24
WHAT THIS USDA REPORT MEANS MOVING FORWARD
3/27/24
ARE YOU READY FOR USDA CRAP SHOW?
3/26/24
WHAT TO DO AHEAD OF THIS POSSIBLE TREND CHANGING USDA REPORT
3/25/24
USDA ACRES & STOCKS REPORT IN 3 DAYS
3/22/24
PRE-USDA REPORT POSITIONING
3/21/24
GRAINS FAIL TO HOLD OVERNIGHT RALLY
3/20/24
MORE SHORT COVERING LEADS TO MORE SHORT COVERING
3/19/24
WHEAT LEADS WITH RUSSIA TARIFF RUMORS
3/18/24
ARE YOU PREPARED FOR 160 OR 190 BU CORN?
3/15/24