
VIDEO CHART UPDATE
MARKET UPDATE
You can scroll to read the usual update as well. As the written version is the exact same as the video.
Timestamps for video:
Overview: 0:00min
Corn Charts: 1:25min
Bean Charts: 7:45min
Wheat Charts: 12:10min
Cattle Charts: 14:10min
Want to talk?
Office: (806)484-1214
Futures Prices Close
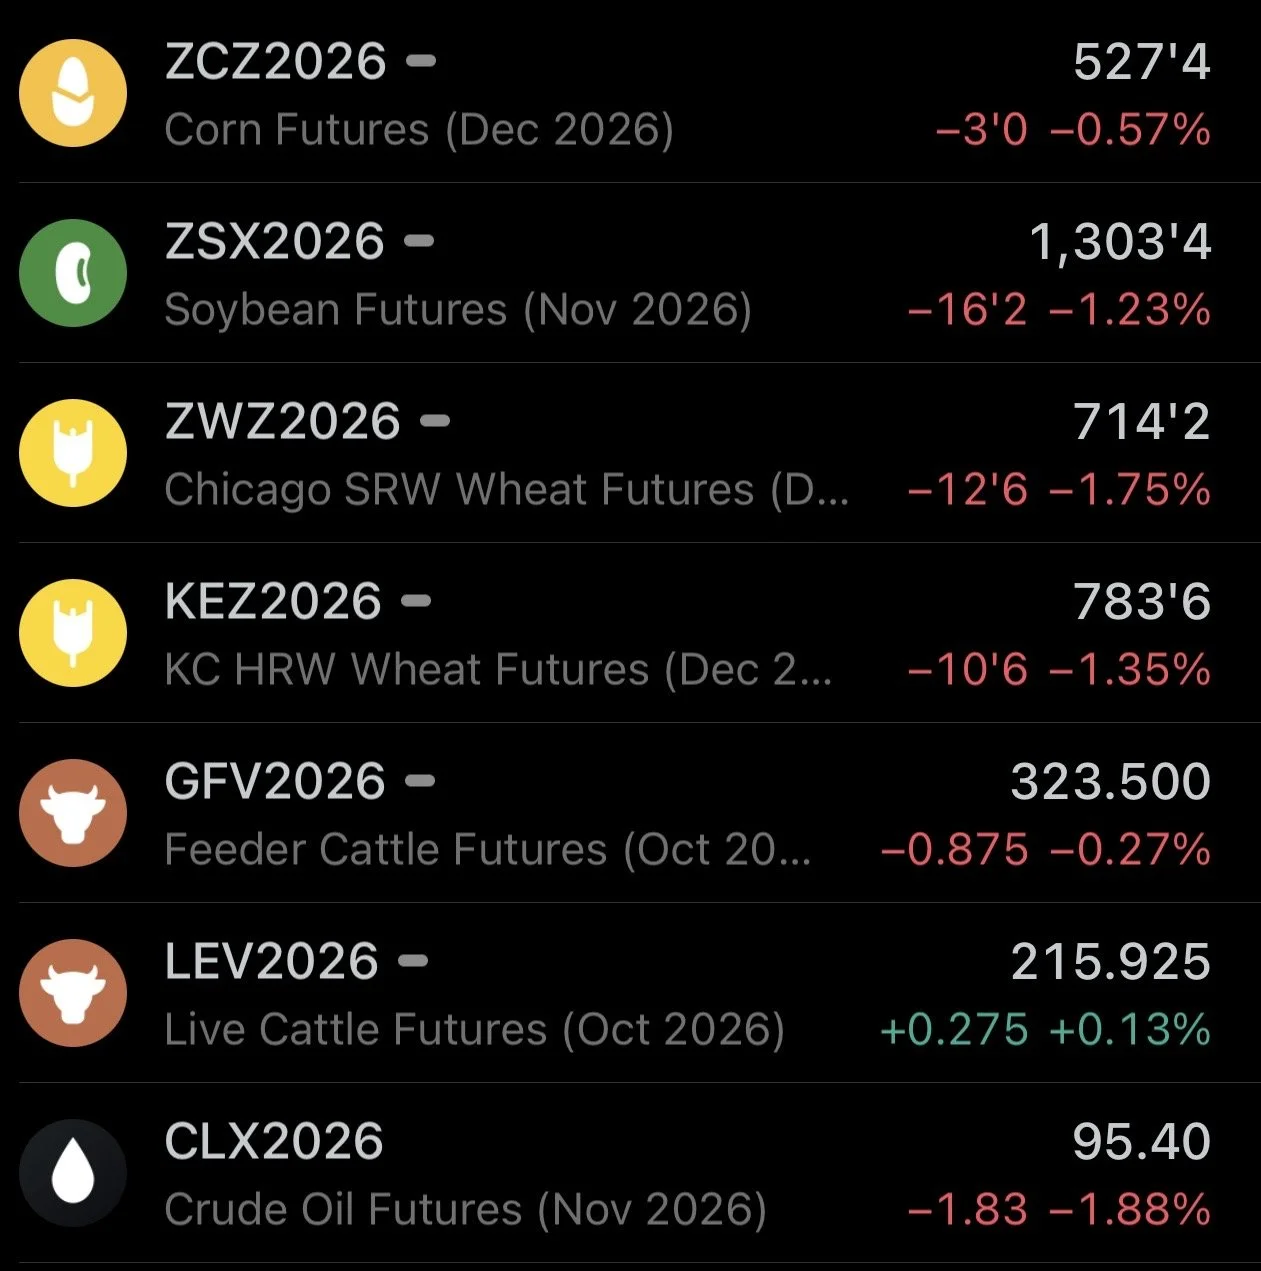
Overview
Grains were lower across the board with a lack of fresh bullish news and some outside pressure. Cattle was down early but saw a nice recovery.
Crude oil was lower again today which added some pressure. But the big mover today was soybean meal, it was down pretty big today following the recent run up. So that of course helped pull soybeans lower.
Today we are just going to be doing an update on the all of the charts and things I am watching.
As fundamentally, nothing has changed since our last few videos.
If you've watched my previous updates, you should know that long term I still hold a very bullish outlook on the grains as a whole.
And I think there is a chance we could be setting up for plenty of long term upside, perhaps similar to that of 2010 and 2020. As I do believe this could very well be the beginning of a bull market heading into the next year or two.
We won't be going over those fundamental reasons or comparisons today as we have done so plenty in the past. If you'd like to check out why I hold a bullish long term view on the grains take a look at some of my past videos.
Sep 16th Update: Click Here to View
Sep 11th Update: Click Here to View
Despite the long term potential, short term my bias is rather cautious as it has been for the last several weeks. Hence the sell signals near the recent highs at the beginning of the month.
The big news factors to watch over the next few weeks are going to be that China meeting that is scheduled for next Thursday, September 24th.
Then we will get that USDA quarterly stocks report on September 30th that is going to be pretty impactful as well.
But let's jump right into the charts..
Today's Main Takeaways
Corn
Long Term Bullish vs Short Term Risk:
Short term, I see risk.
Long term, I see potential.
Which means that those who have to move stuff off the combine, or simply lack storage or time should be more proactive than those with plenty of time.
Which is why we had that sell alert on September 2nd, which was more geared towards those in that situation. I have been pretty vocal about the short term caution the last few weeks.
If you've got time, we like seeing if the potential will play out. Because the potential is absolutely there for the first time in a long time.
But short term, we are getting close to breaking some support.
We could very well get some harvest pressure that keeps a lid on things short term.
It just makes sense to be proactive if you know you should be, and can’t withstand some short term weakness.
There is a reason the corn market rarely makes it's top around harvest, and why we usually make our lows this time of year.
Once the farmer is forced to sell off the combine, I think this market likely makes another run.
Corn Charts
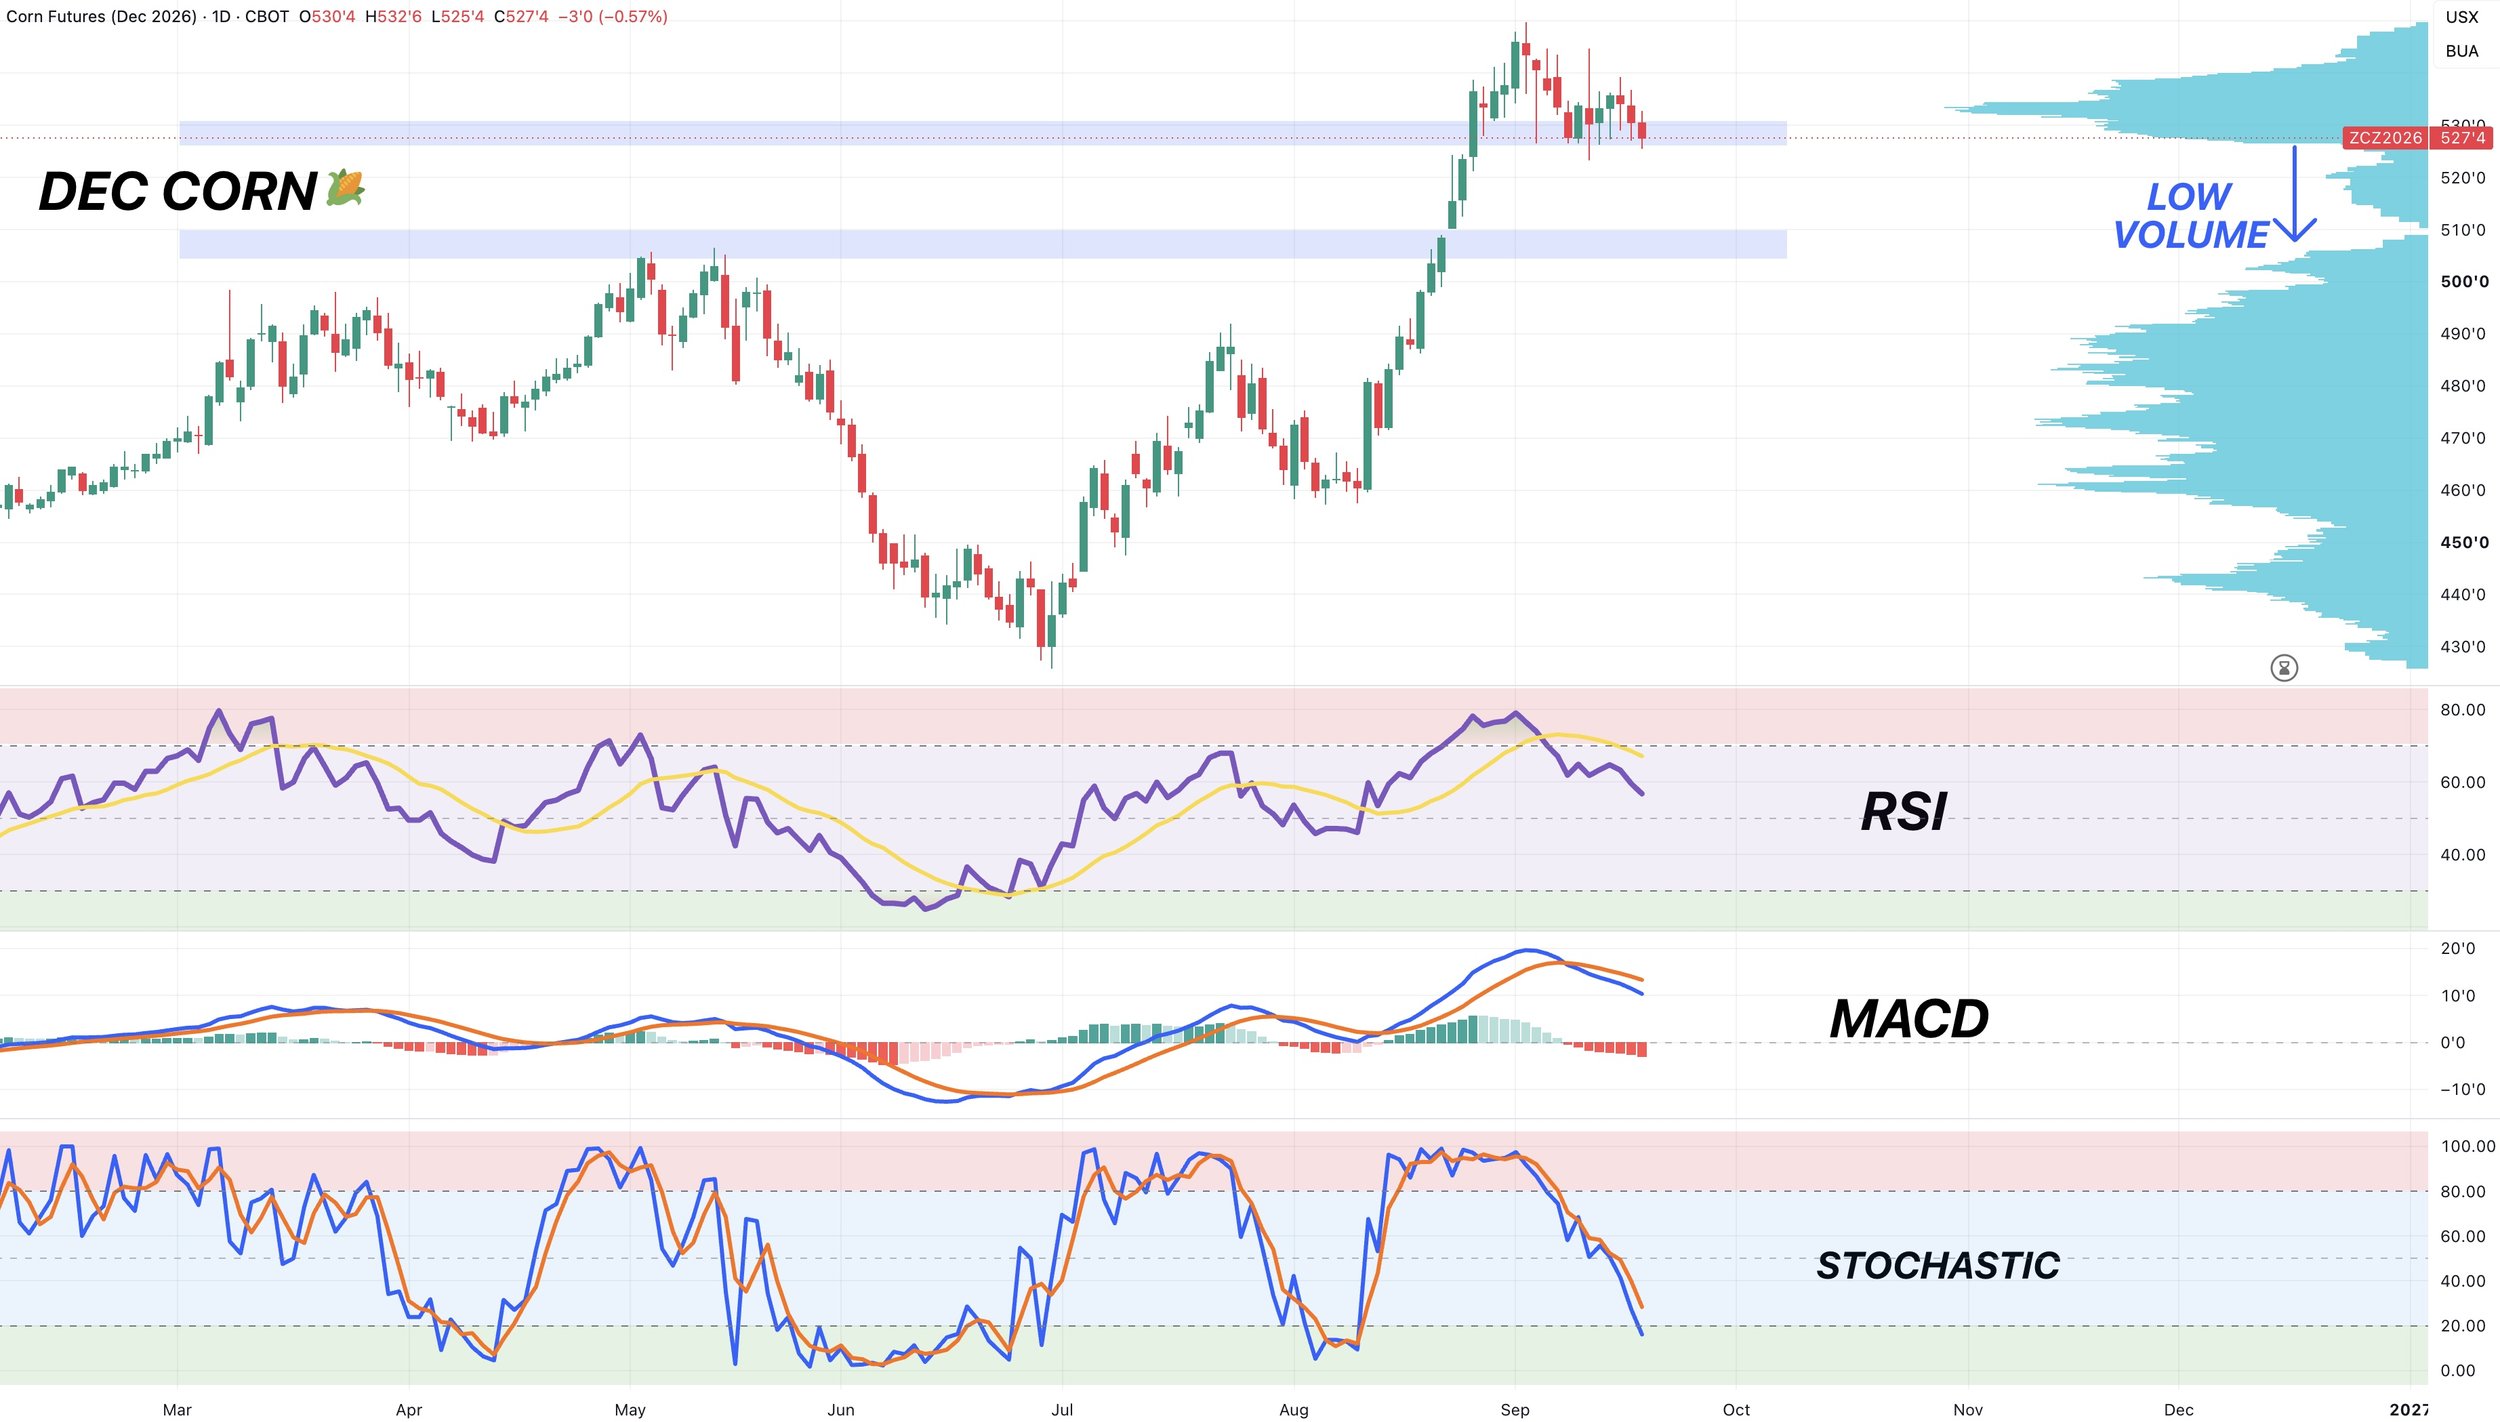
Dec Corn Daily Chart:
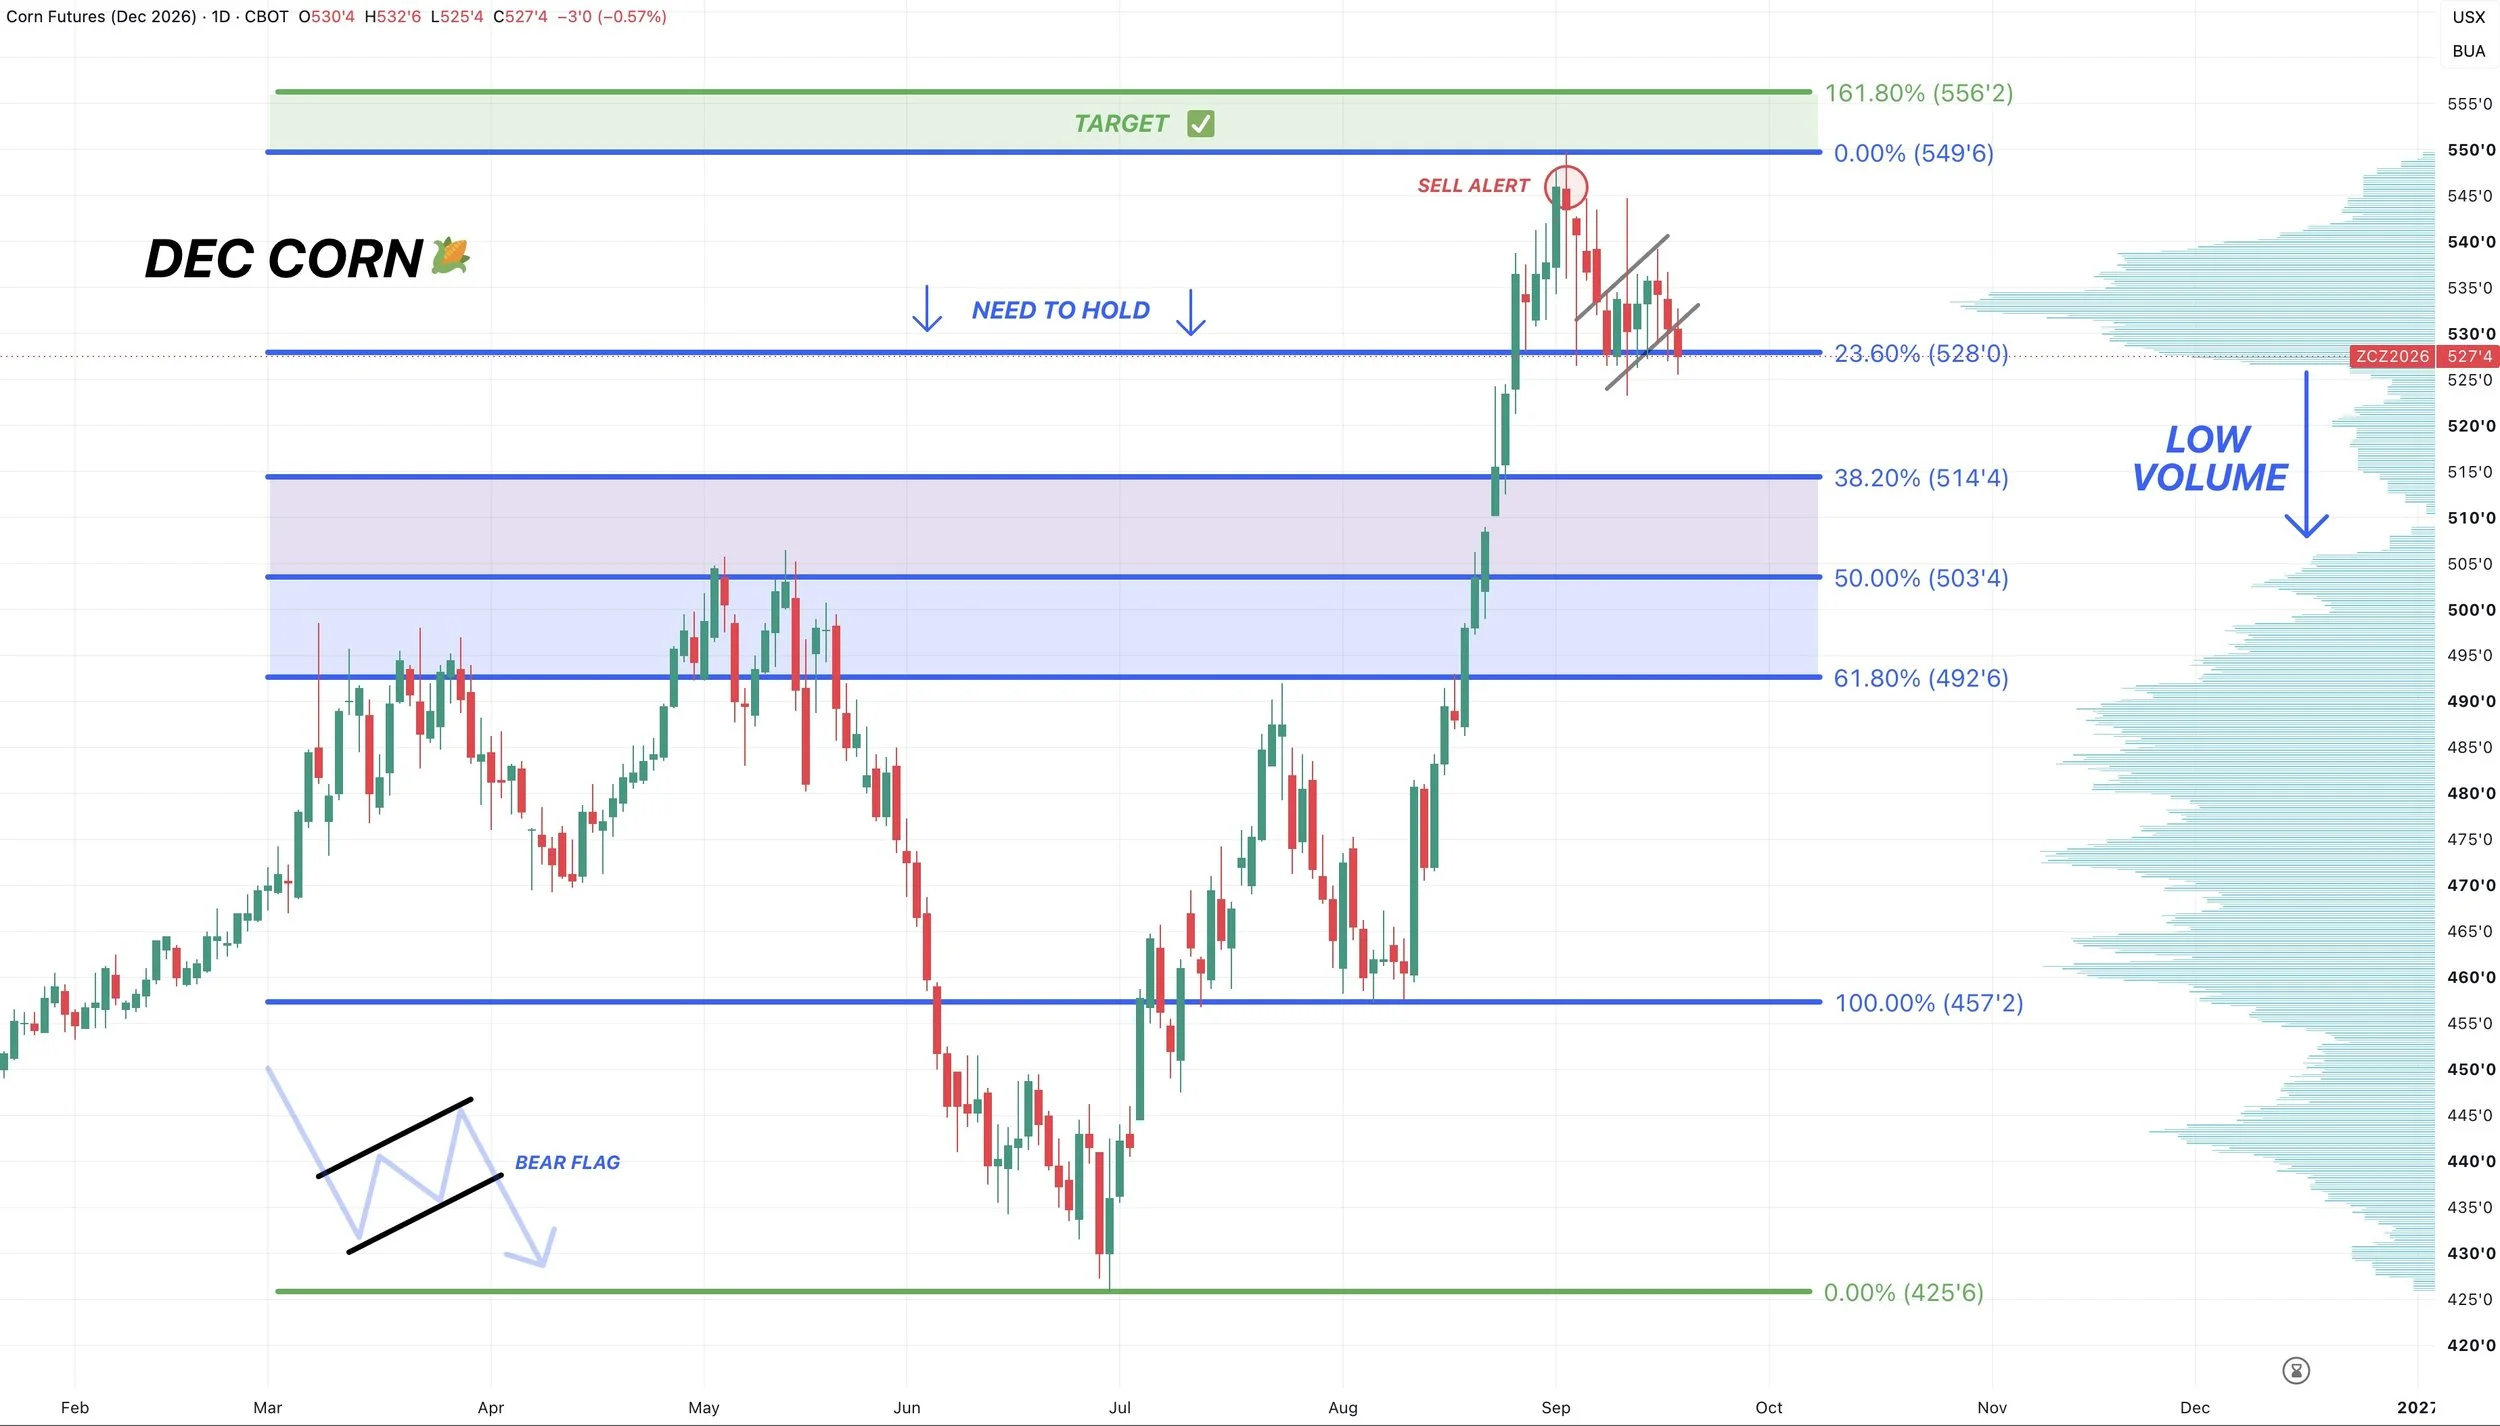
We're down around 20 cents off those highs and that sell signal.
Now corn is sitting at an important spot here short term.
We're battling trying to hold this key support.
If you notice, corn has bounced off this level 7 times now. So bulls need to hold to prevent a leg lower.
This level is also the first retracement down to the August lows. The 23.6% level.
Why I am cautious here:
We have a potential bear flag pattern.
If you look at the volume profile on the right hand side of the chart, there is very very low volume beneath this support level.
So if we break below, it could easily spark a good leg lower. As prices tend to move through areas of low volume fast because we simply built no support between those levels, given we ran straight up.
The implied rough move for this bear flag takes you down into that $5.04 to $5.14 range. Which is the 38.2% to 50% retracements down to the August lows.
That range would be where I would expect us to find a bottom if we break below this support.
That's where volume picks back up. We have the unfilled gap sitting there. And that 50% level would re-test the highs from May.
If we get down to that level, I would view that as a great spot to look at re-ownership strategies. As I like the idea of owing corn later into the year and into next. As I do not think we have seen the ultimate highs.
Corn has not yet broken the key support, but is getting pretty close. Another down day and it would look like a break of structure short term. So it is still too early to say we are definitively headed lower. Bulls want to see us bounce right about now.
We are still inside that range from the USDA report day a week later. Whatever high or low we take out likely decides the next leg.
Something else to note is that we're nearing the end of the quarter. The funds are record long.
So if we break support, seeing them clean up their books and take a little profit would make sense. Although, I expect them to remain relatively long as we've talked about before.
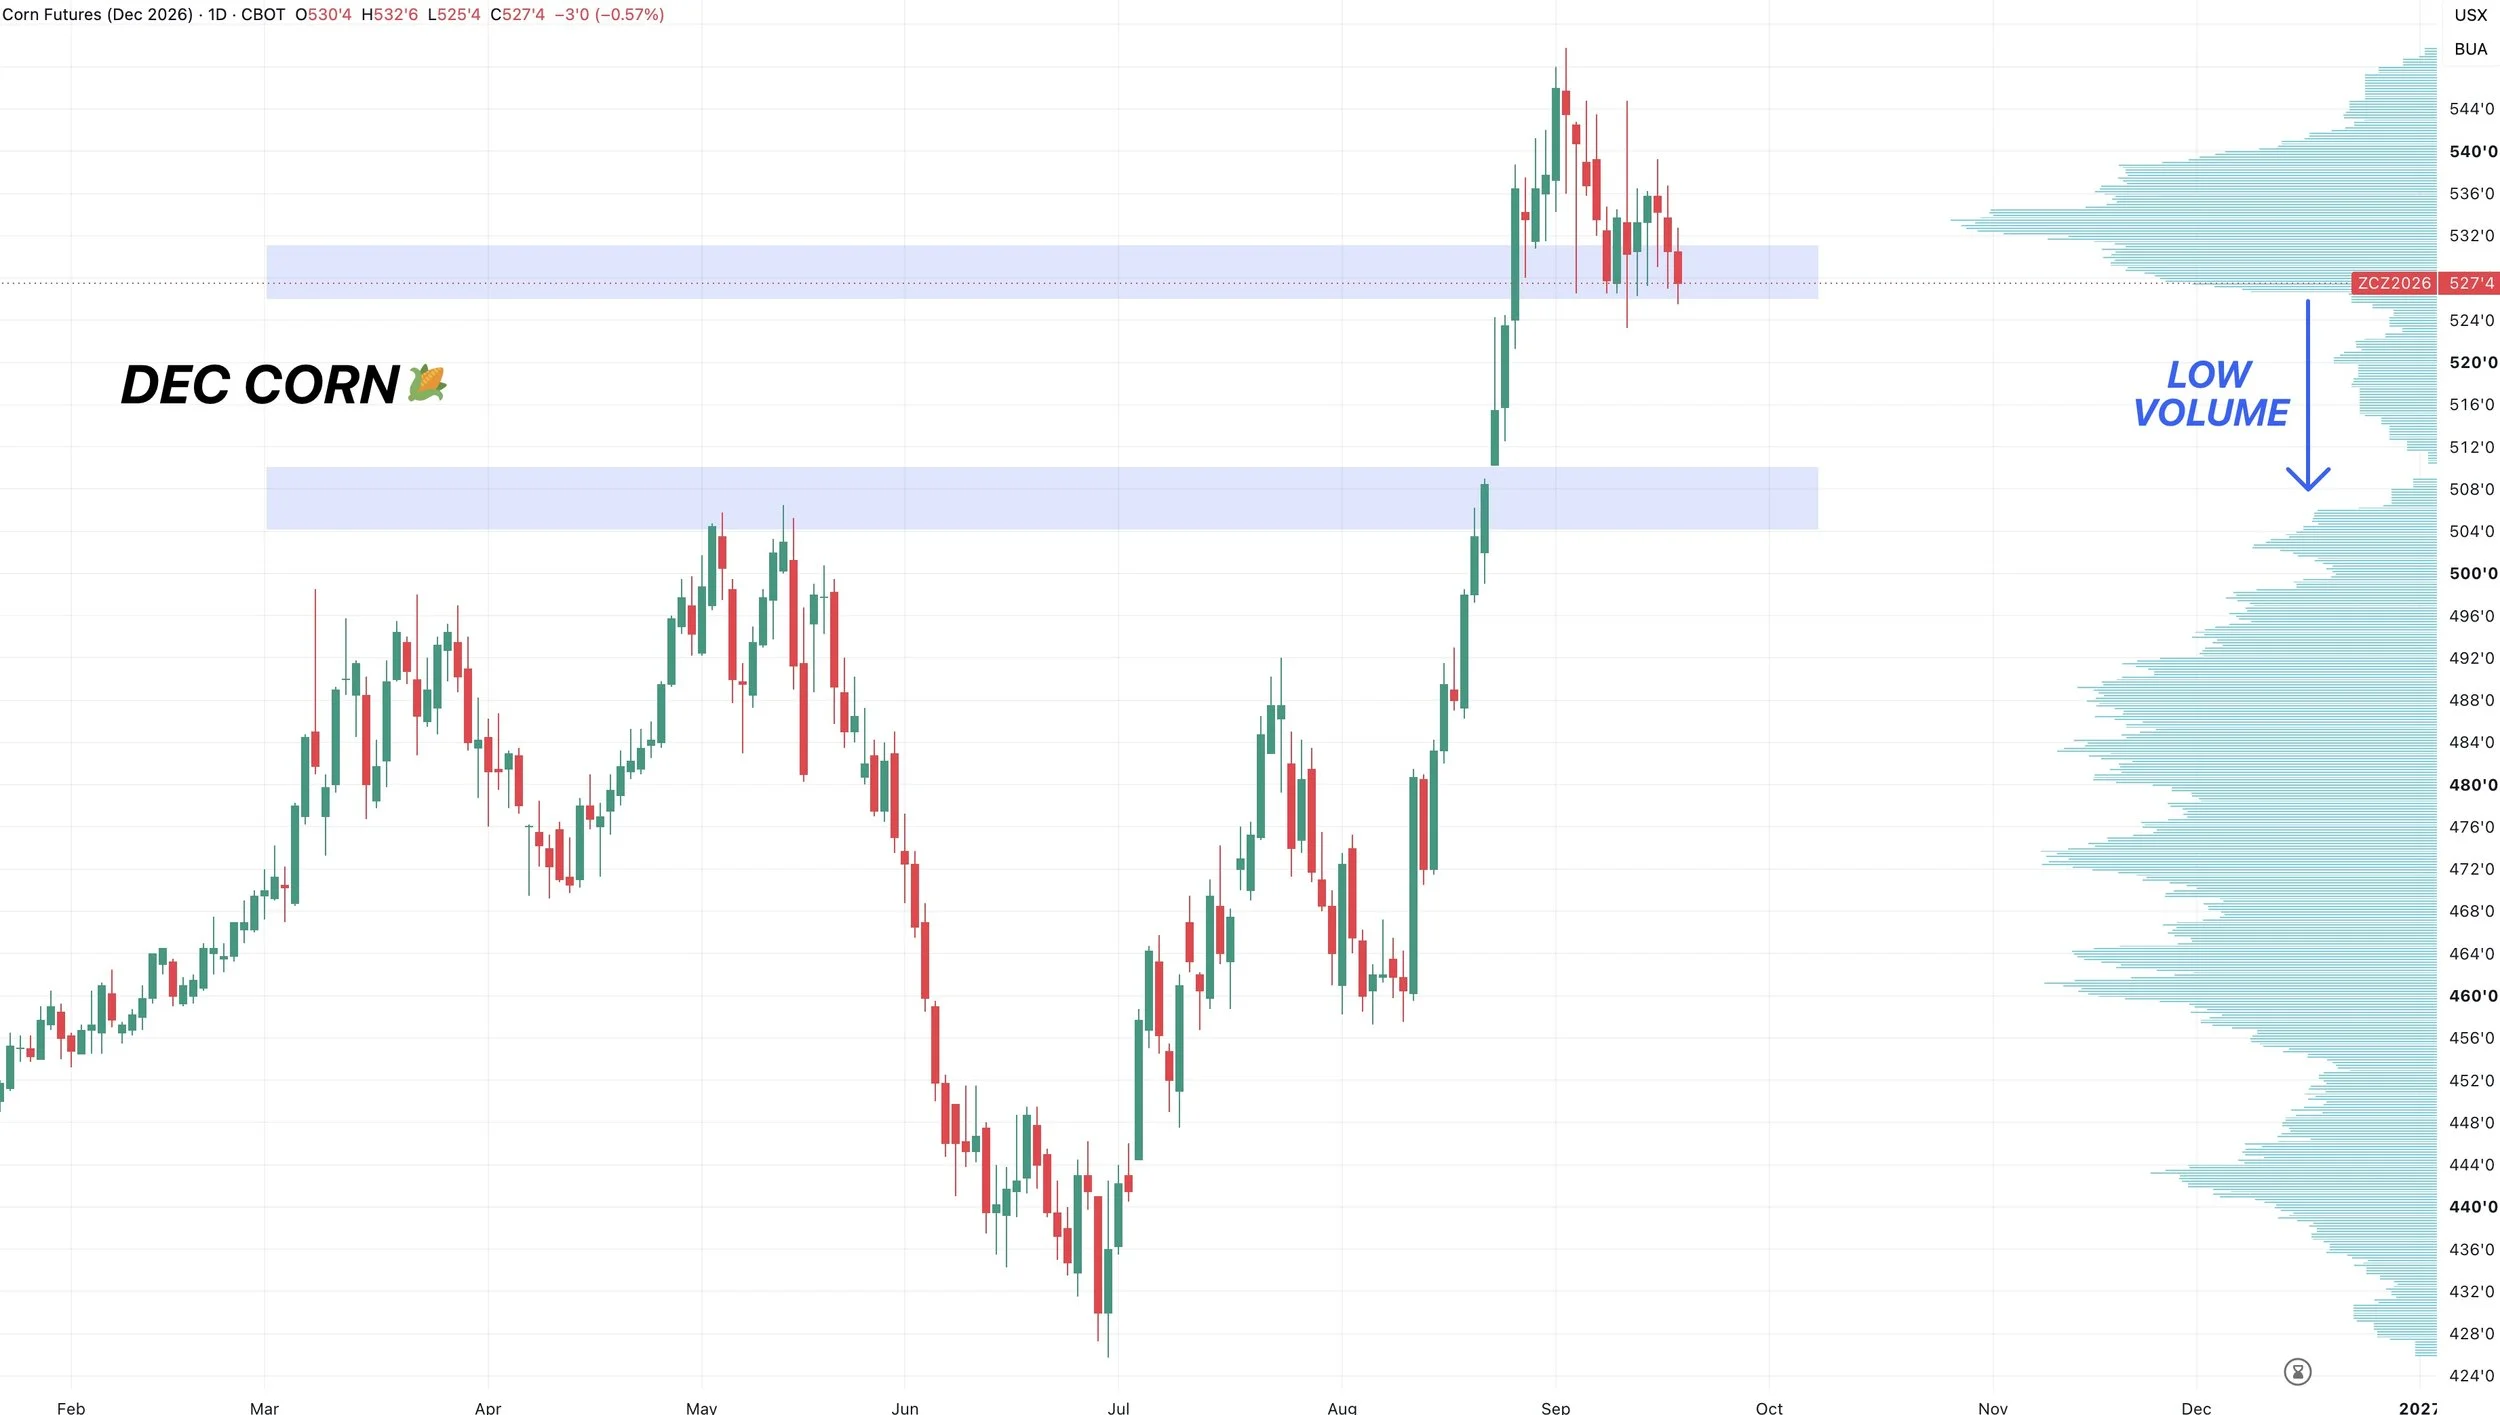
Simple Support & Volume Shelf:
Here is a pretty simple way to look at the chart.
I just have support and volume on here.
This is clear support we need to hold.
If not, there is room to the downside.
No we do not "have" to pull back further. But if you are short on time, here is your risk.
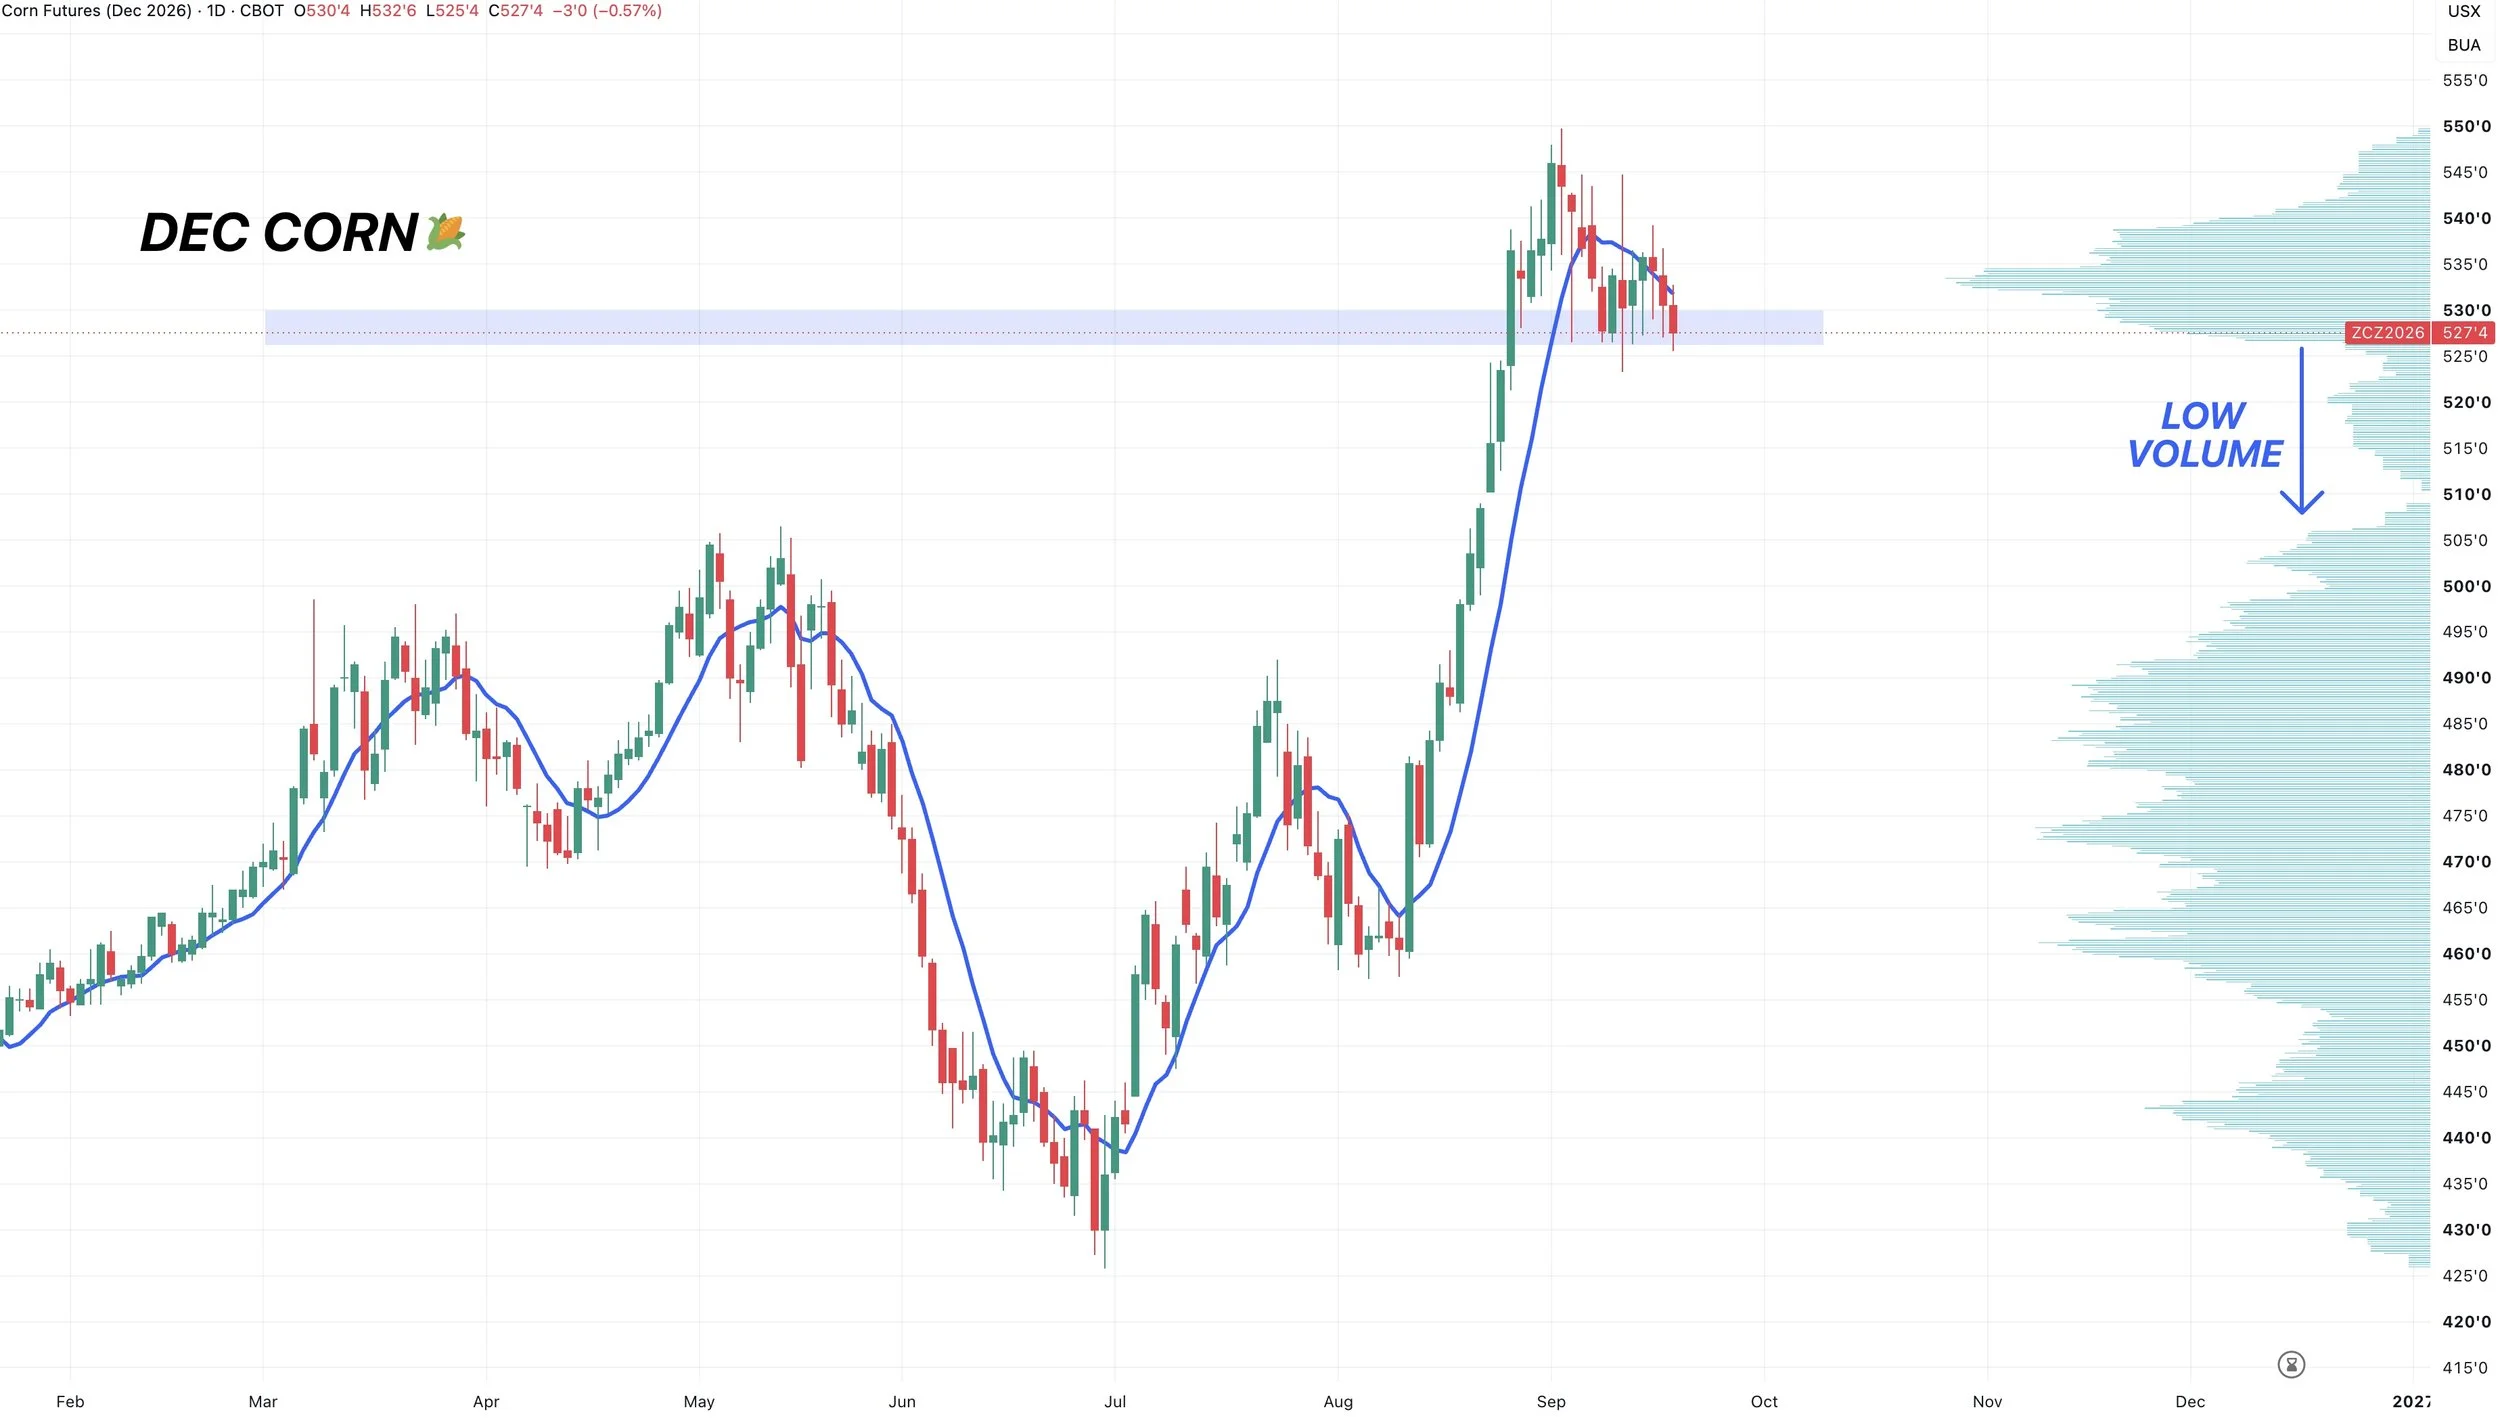
9-Day Moving Average:
This shows the 9-day MA.
During uptrends, corn tends to stay above it.
During downtrends, corn tends to stay below it.
Right now we are below it.
So currently the short term trend is lower for now, but can change if we break back above it.
Indicators:
Here is an update on the indicators.
MACD still curling lower. Suggesting momentum is still lower for now.
Stochastics getting lower but still not yet bottomed out.
So no signs of a bottom yet here either.
Corn vs Wheat Chart:
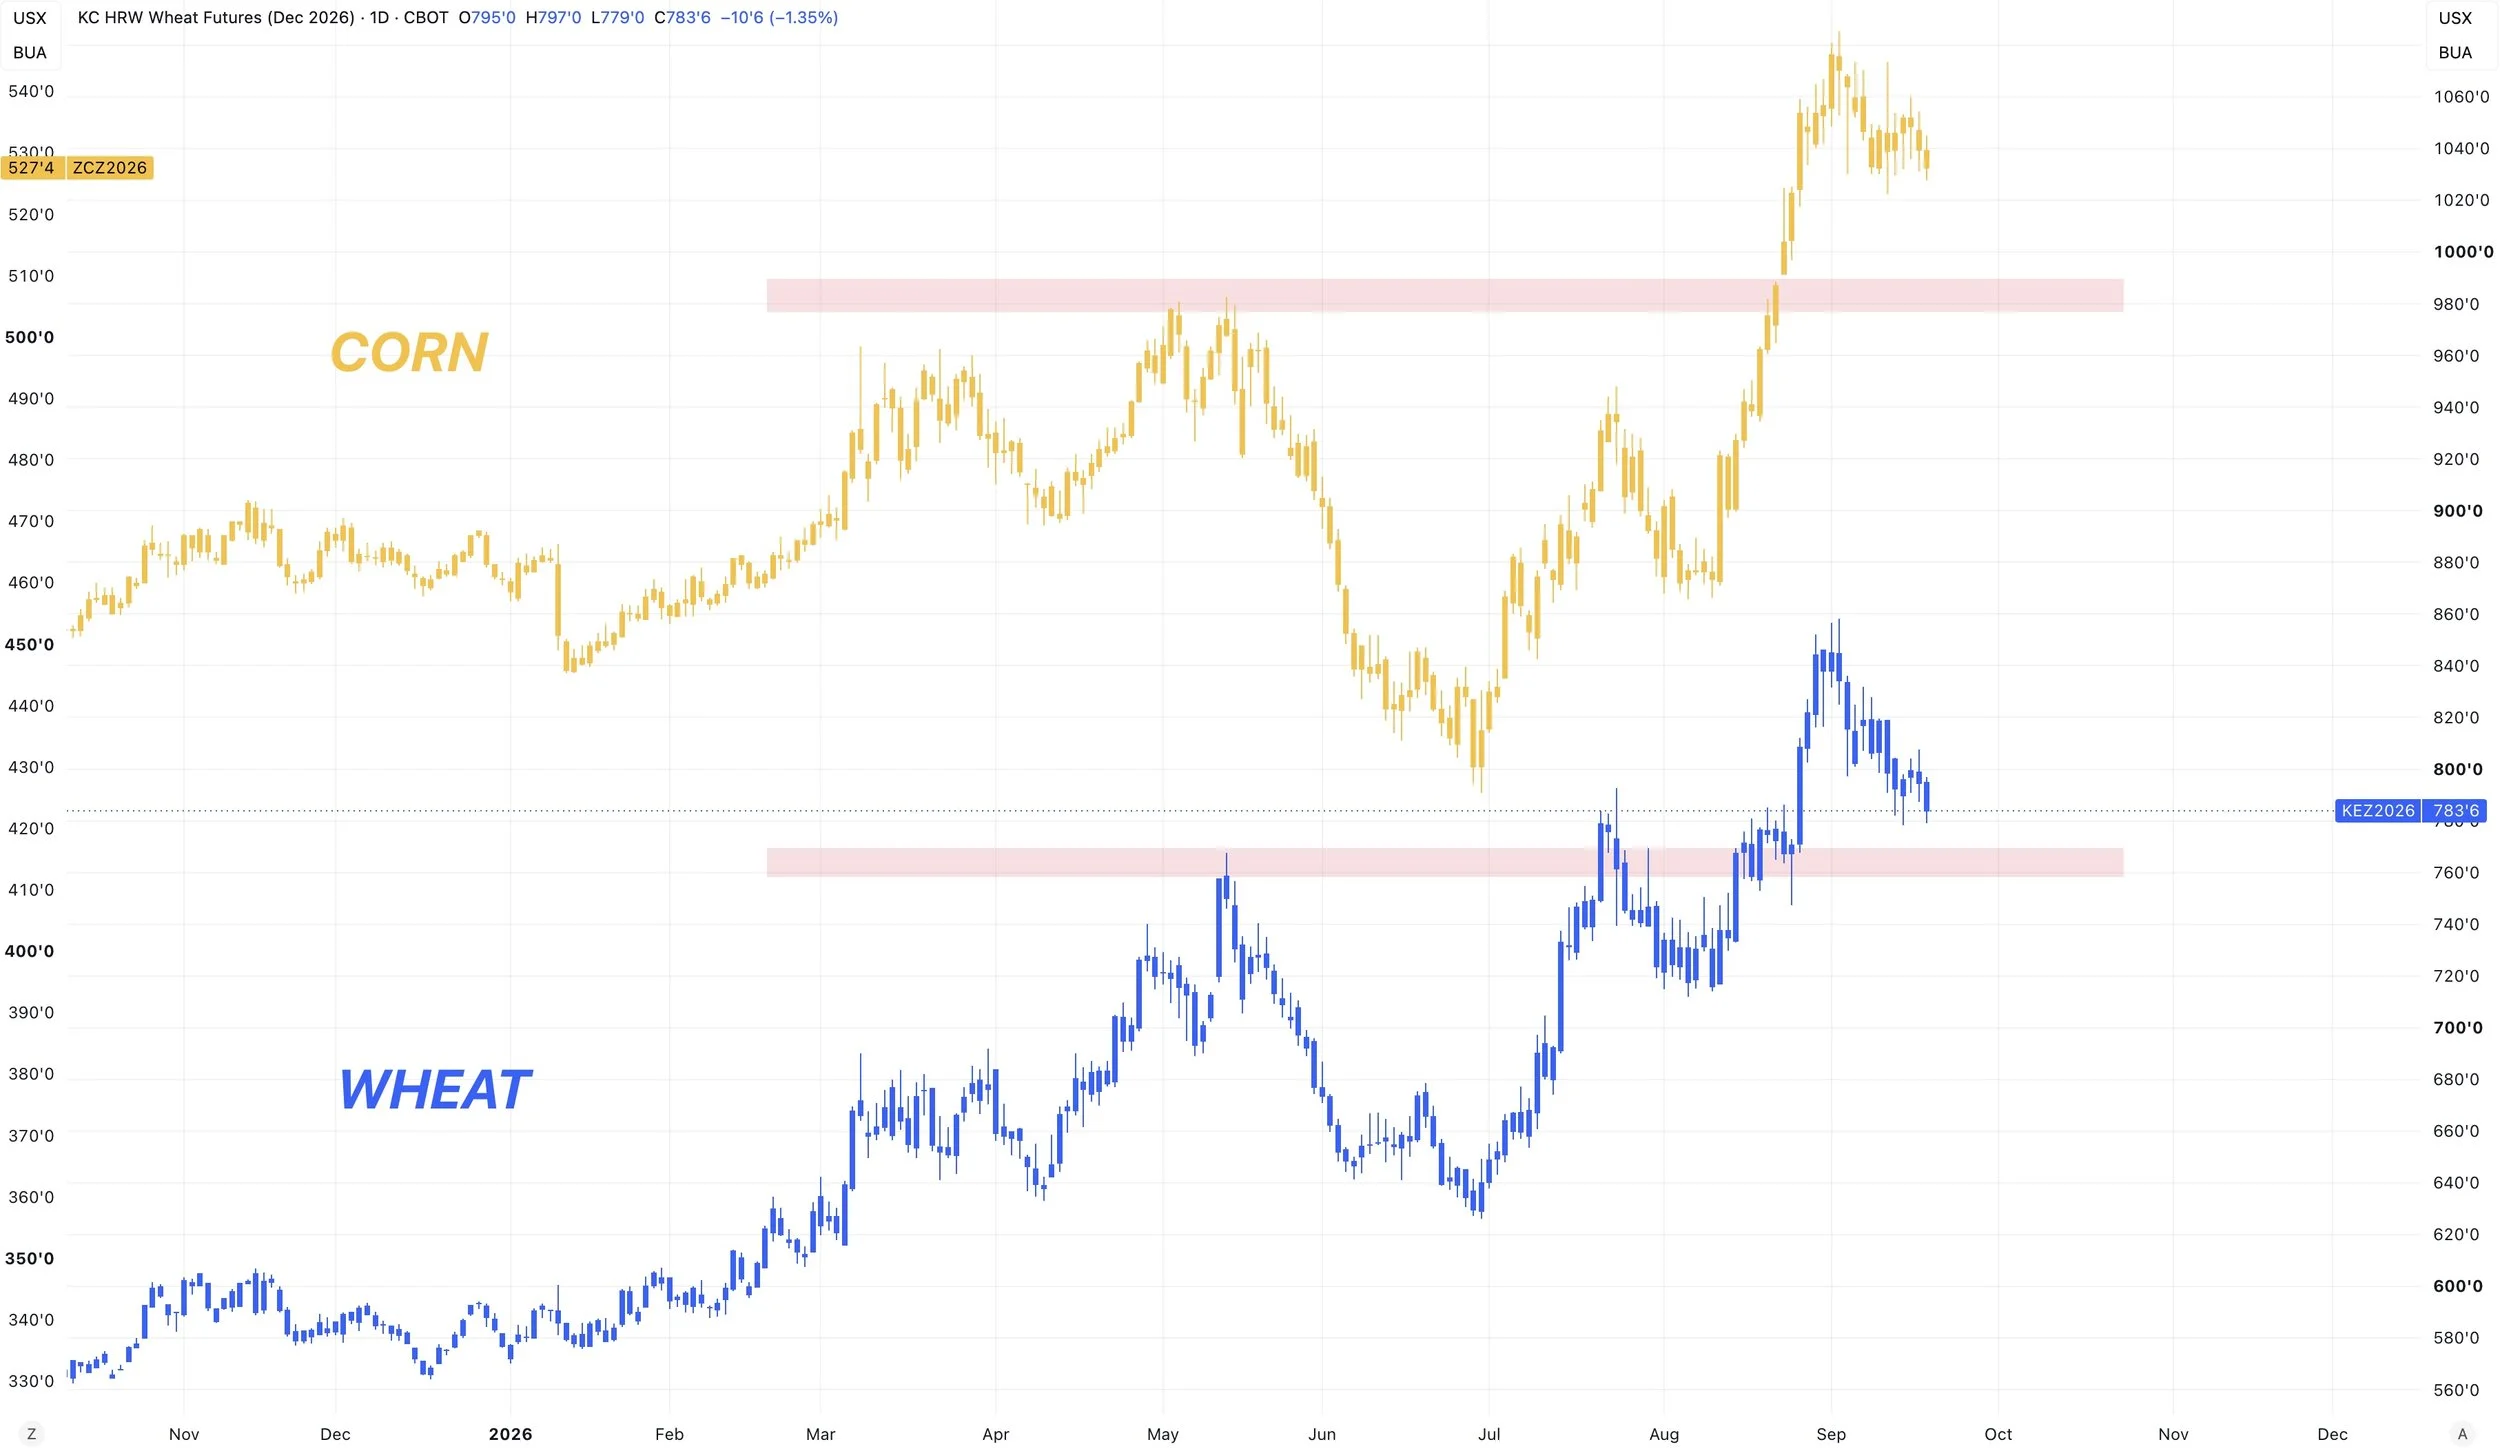
I just wanted to throw this out there.
Corn and wheat have nearly moved identical this year.
Wheat looks like it's coming down to re-test those prior highs.
So it might make sense for corn to do the same. I guess we will find out.
Corn is only -20 cents off the highs (-3.80%).
Where as wheat is -72 cents off the highs (-8.40%).
Weekly Chart: Still Bullish
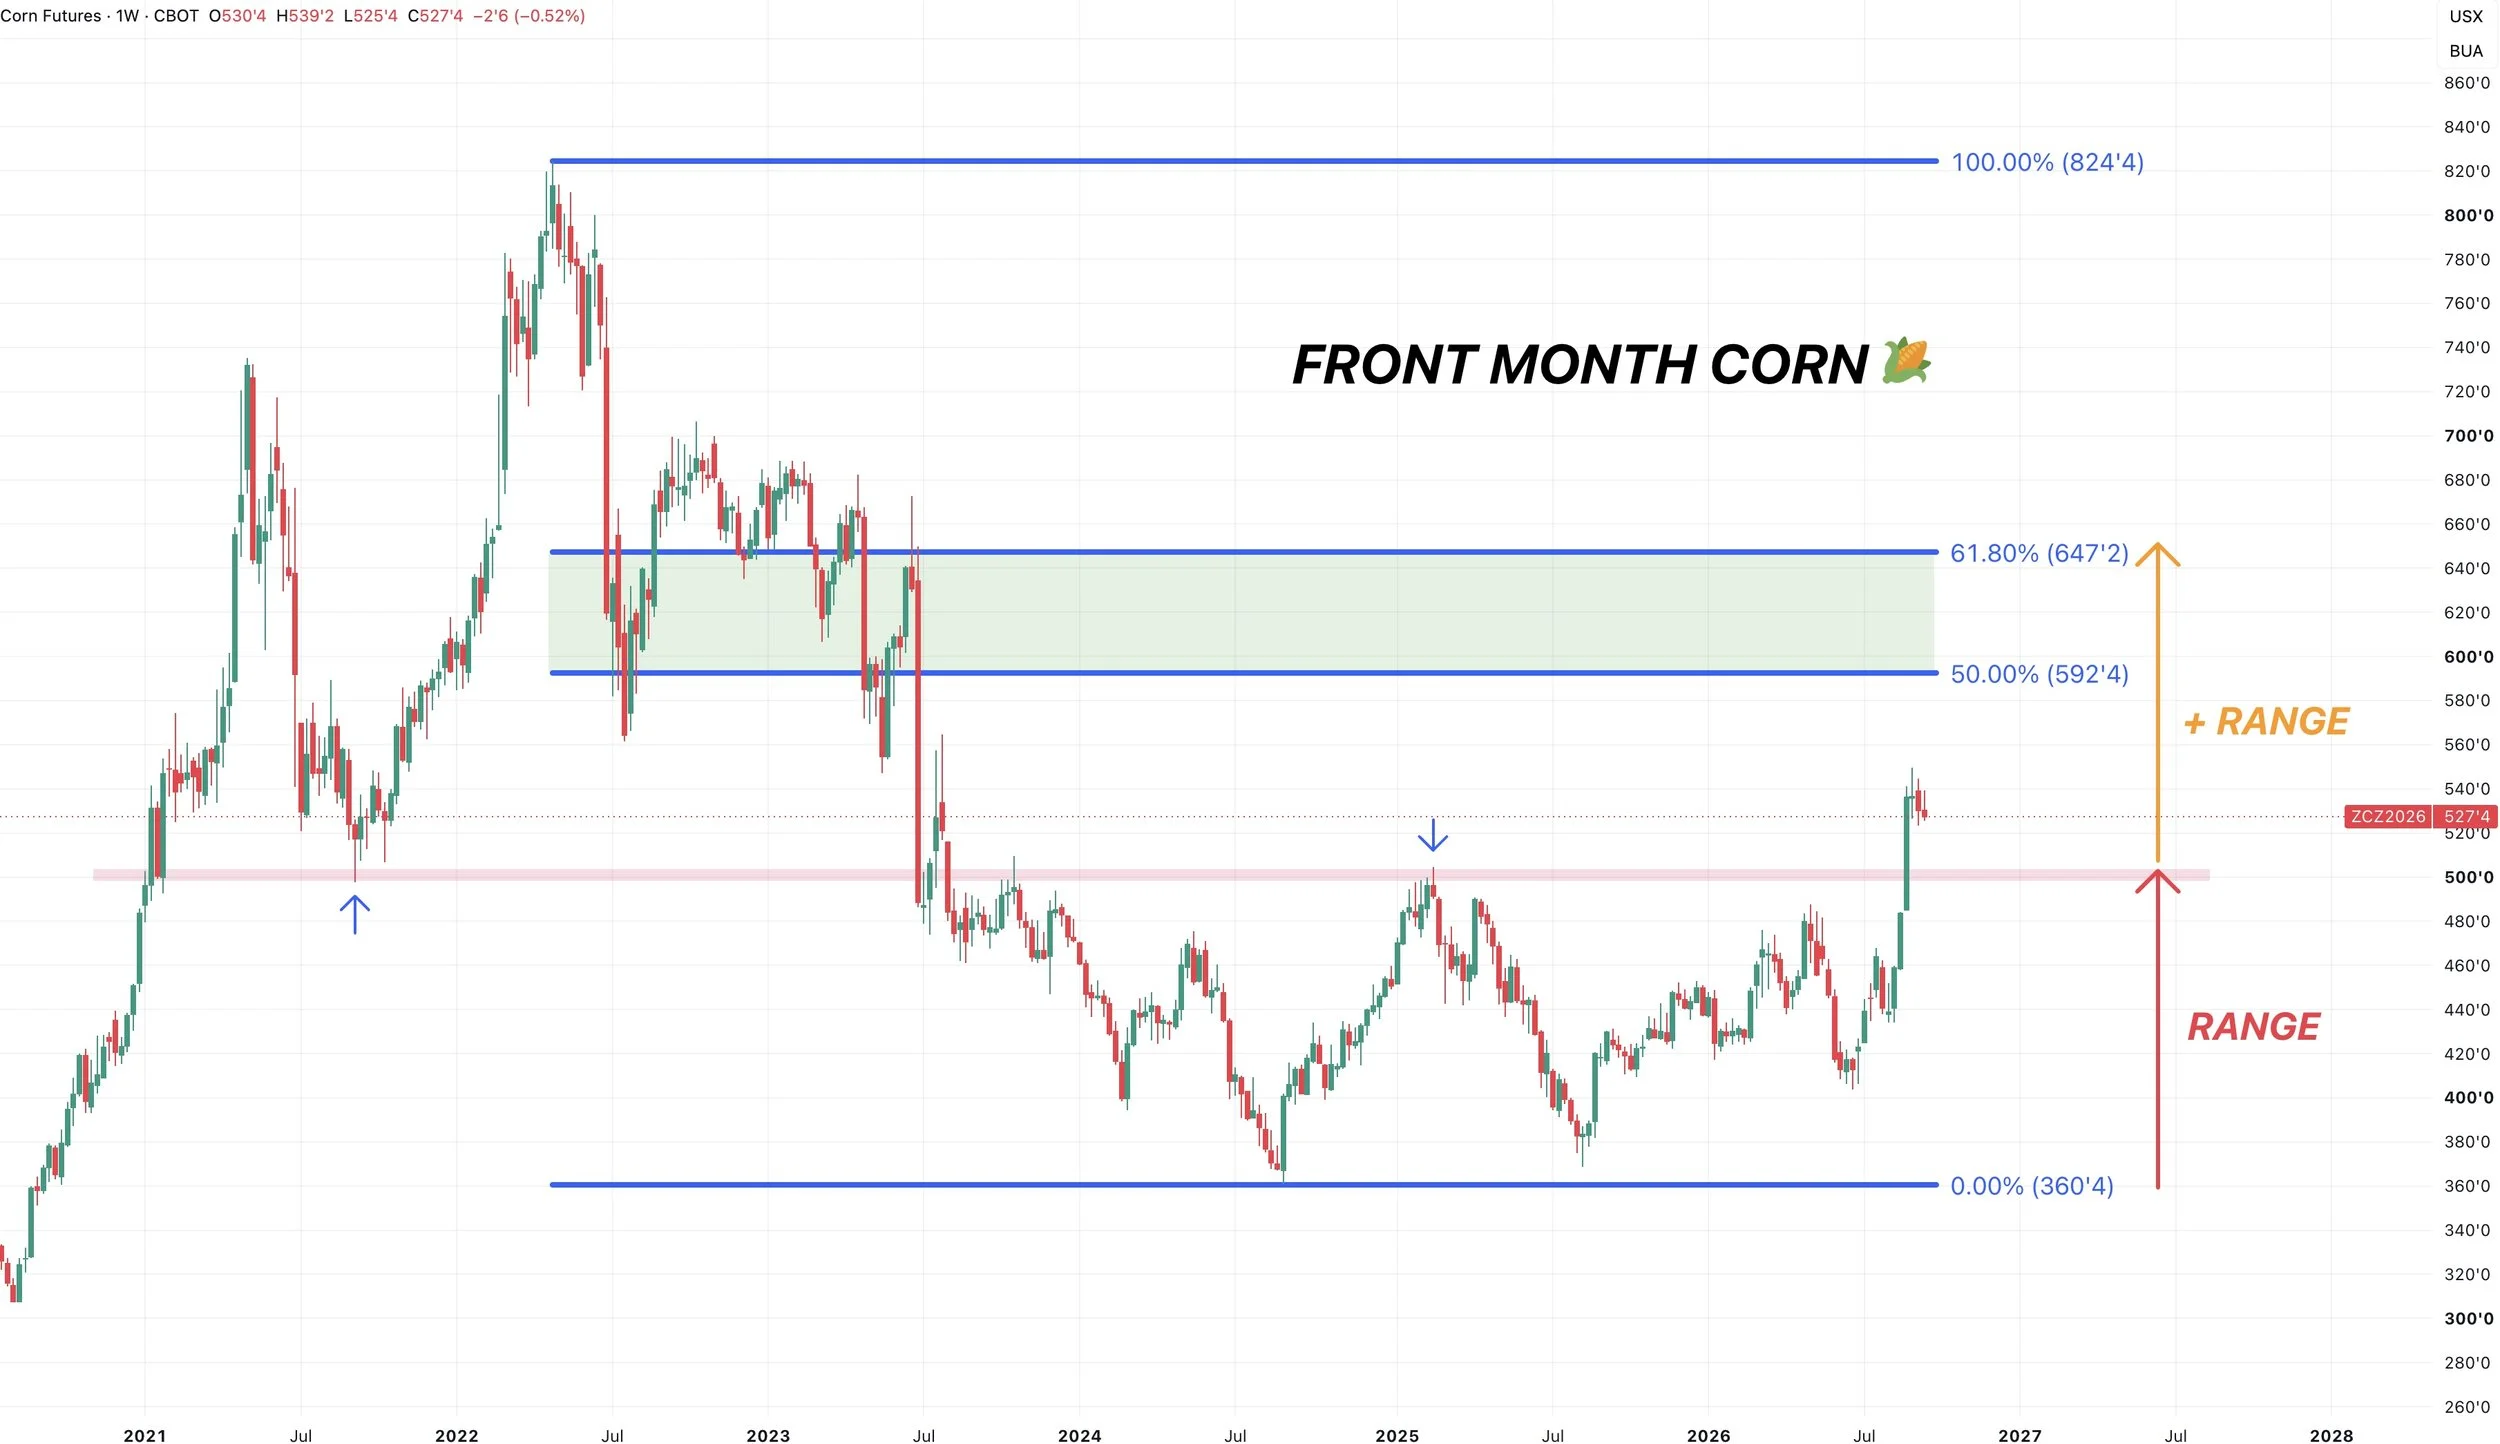
If you zoom out the big picture structure is still absolutely bullish.
Seeing a pullback following a +$1.00 run the last month should come as no surprise.
The long term trend has officially shifted higher for corn in my opinion.
As we posted our first series of higher highs and higher lows of the entire bear market.
A long term potential target is still $6.50
That is 61.8% of the 2022 highs.
We were trapped in a 3 year sideways range. We broke out. If you add that range on top of the range we were trapped in, you also get $6.50
Monthly Chart: Also Still Bullish
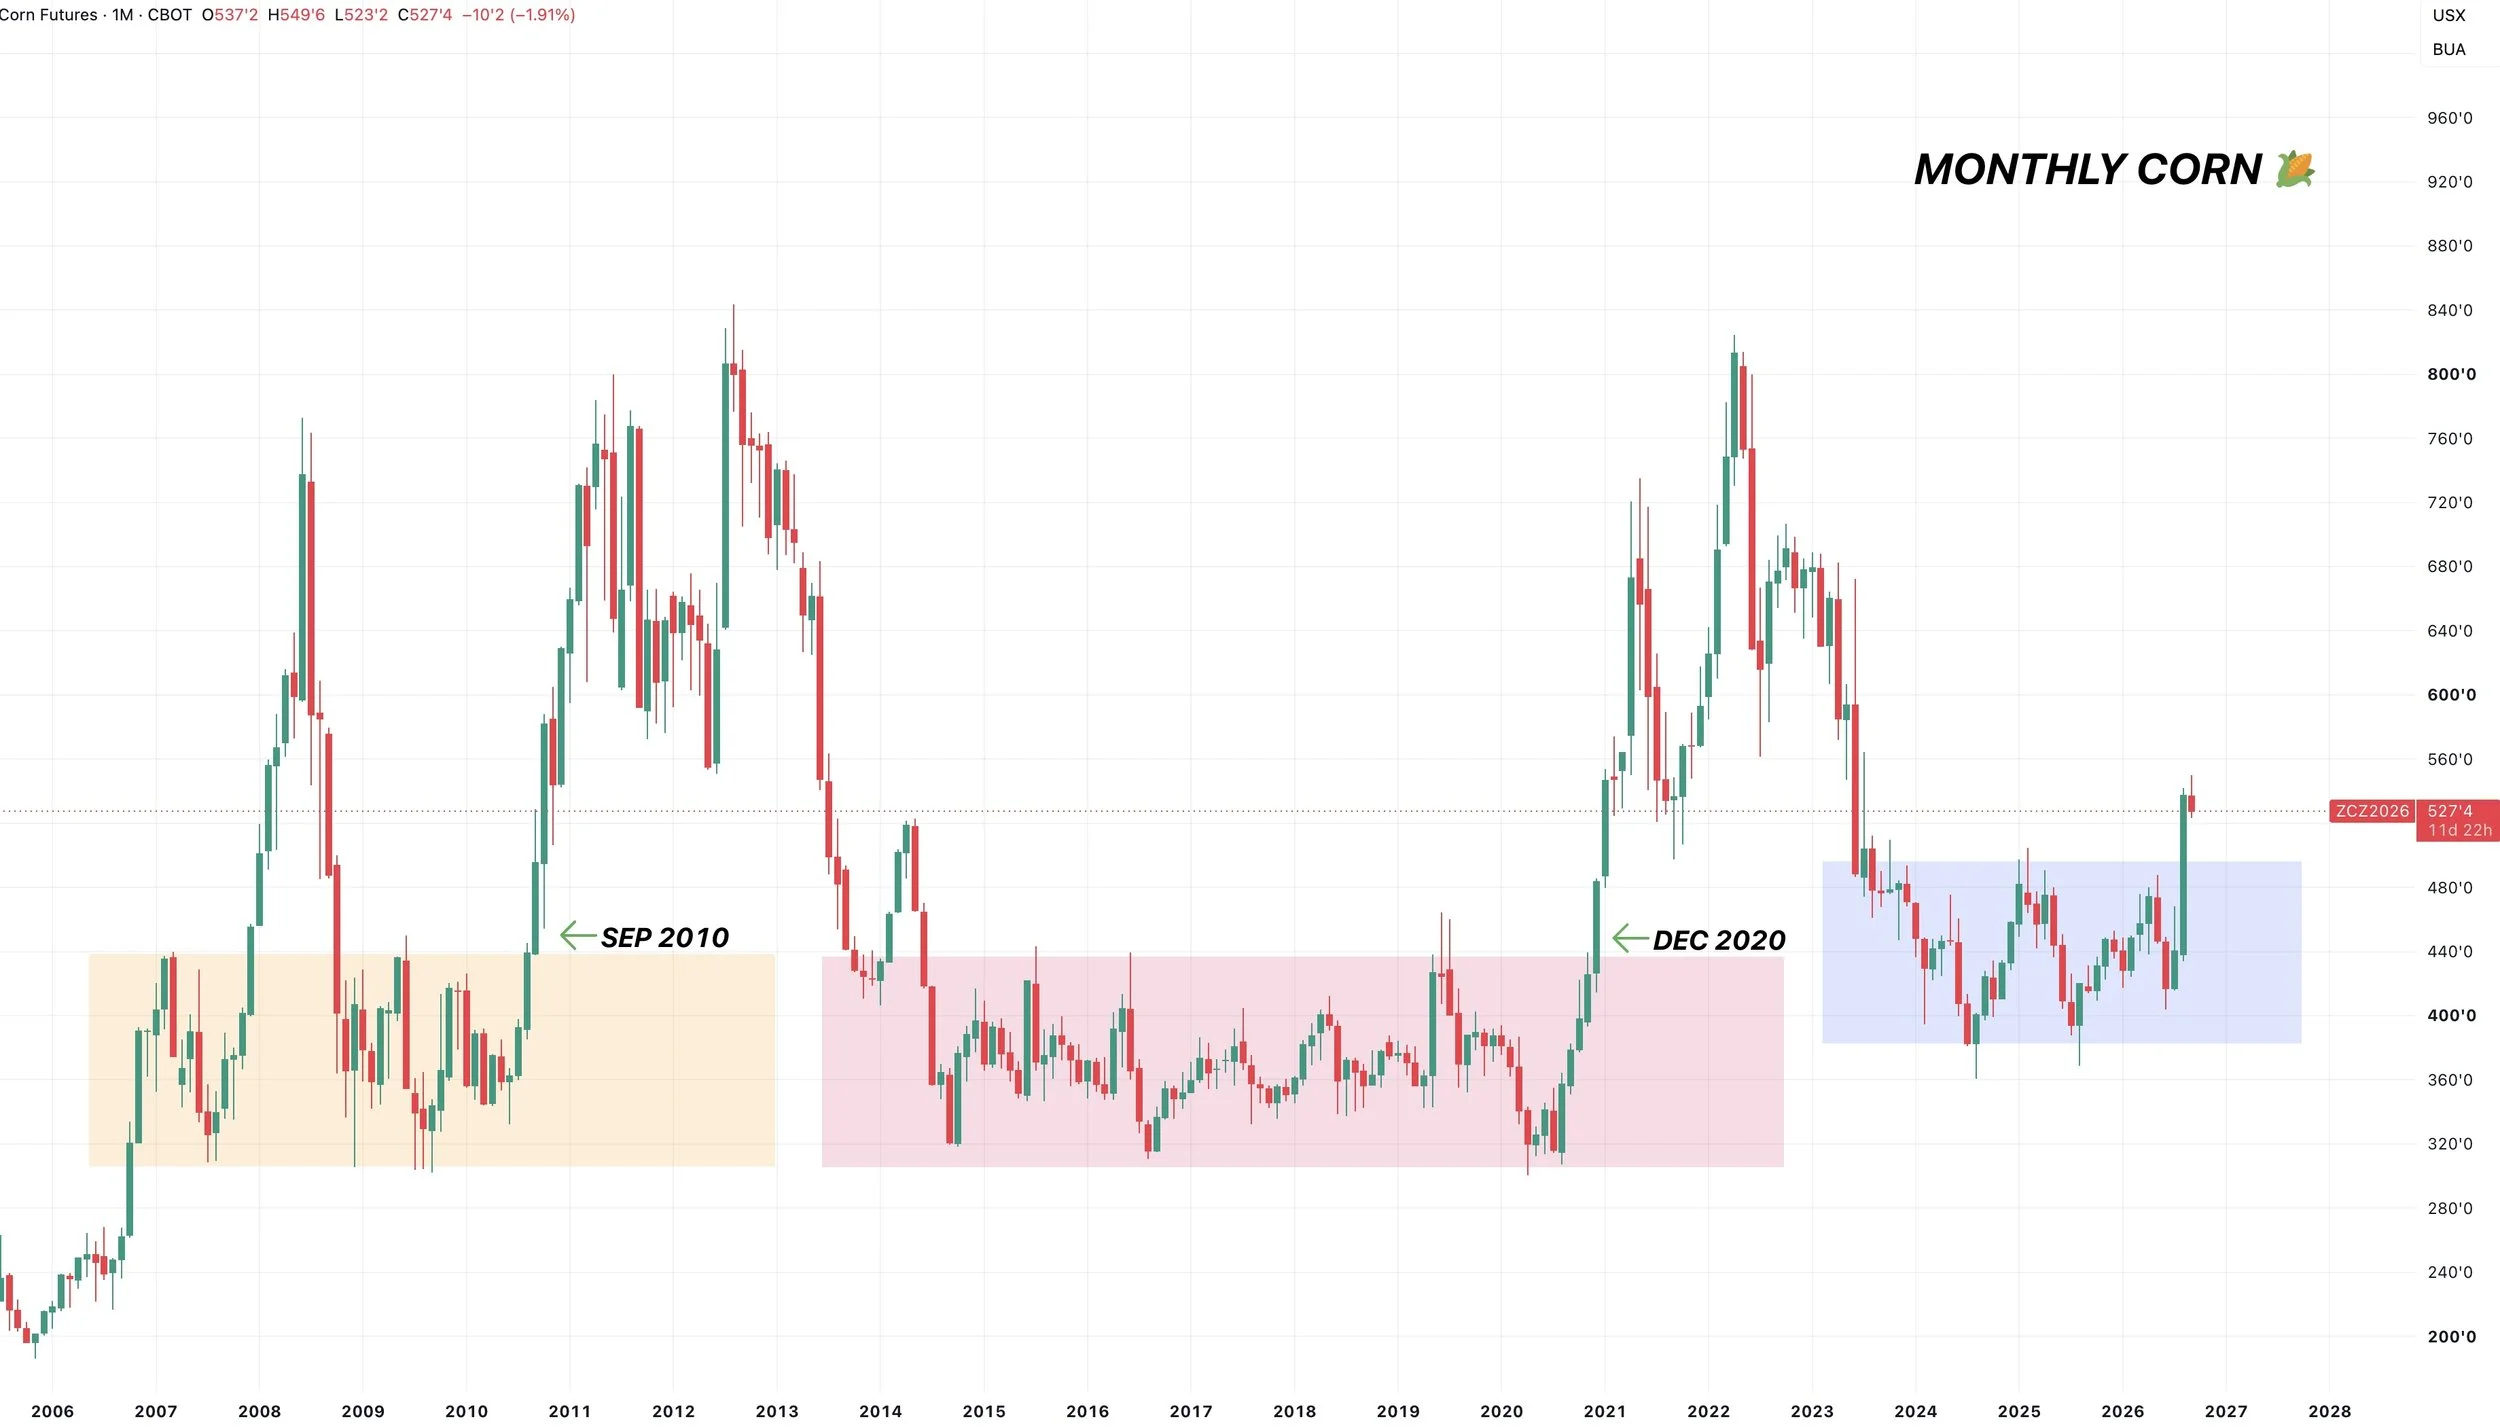
Let's not forget we just saw our first monthly breakout since 2020.
Which again happened after consolidating sideways for 3 years.
That is not bearish.
And should open the door to higher prices down the road in my opinion.
I'll have my next actual upside target once I feel like we've found a bottom. Given we hit that previous $5.50 target.
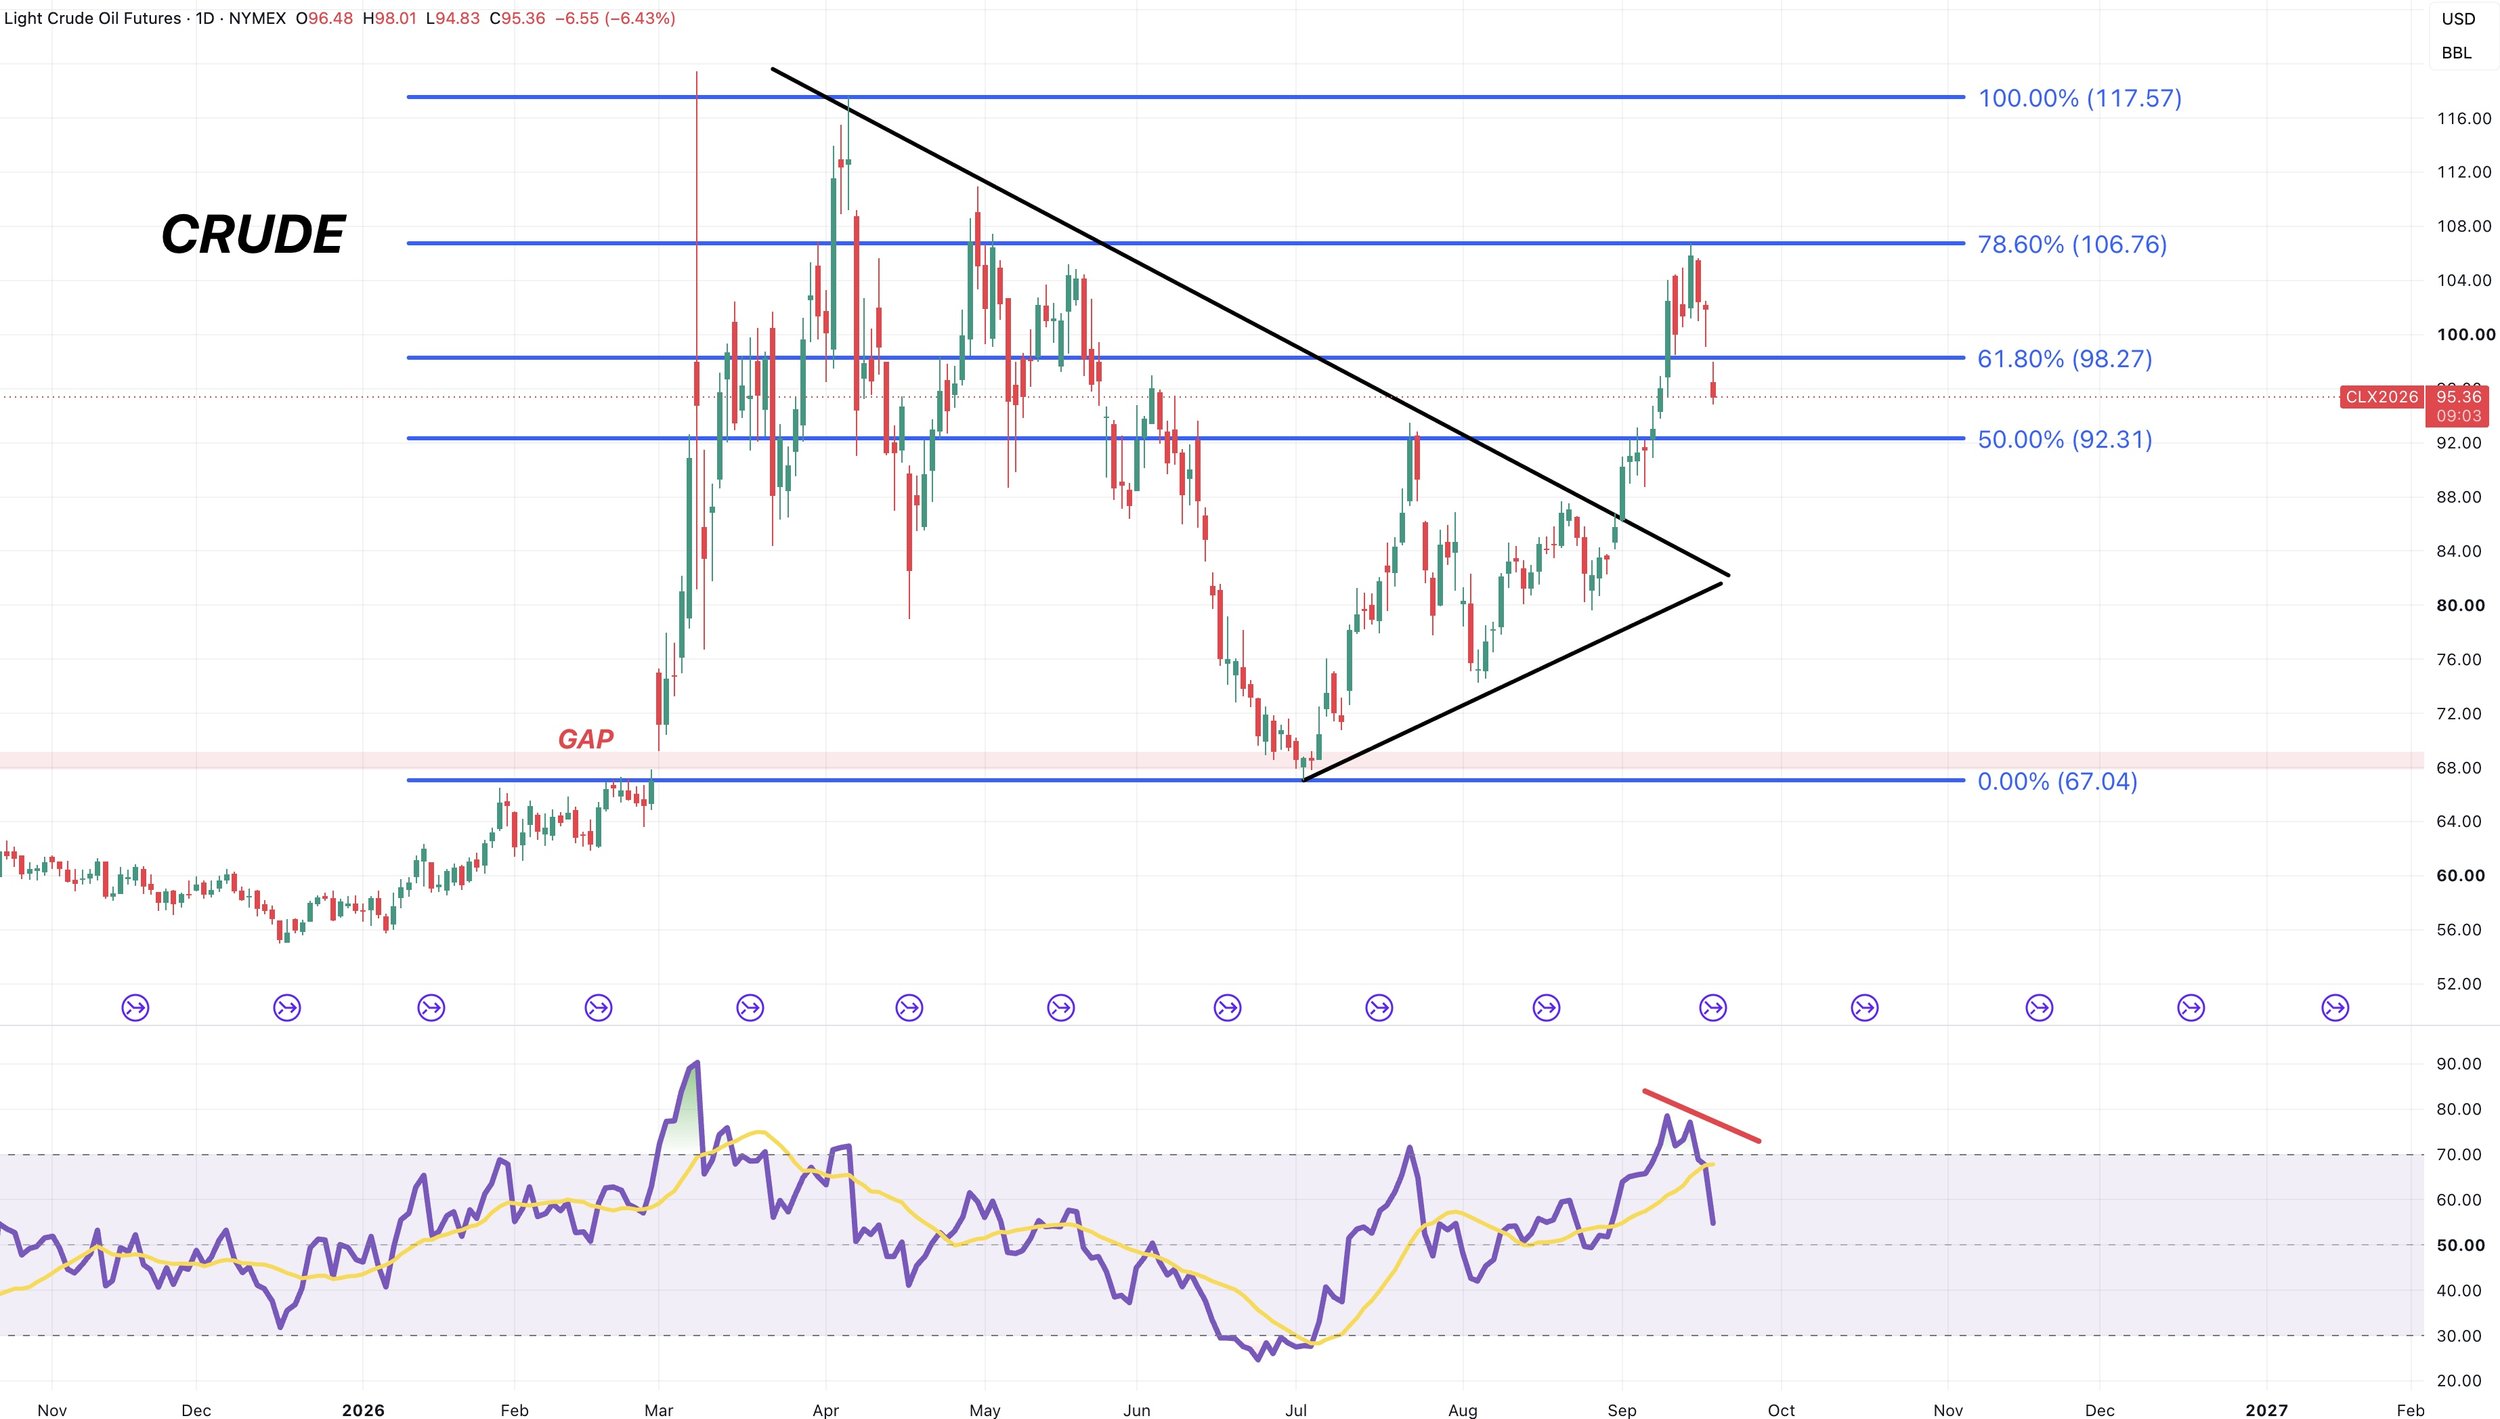
Crude Chart: Continuous
This is the continuous chart, so it shows contract switches and switched today.
But crude rejected right off the 78.6% retracement up to those April highs.
We were also showing bearish divergence.
So getting some weakness as expected.
Crude Chart: Nov Crude
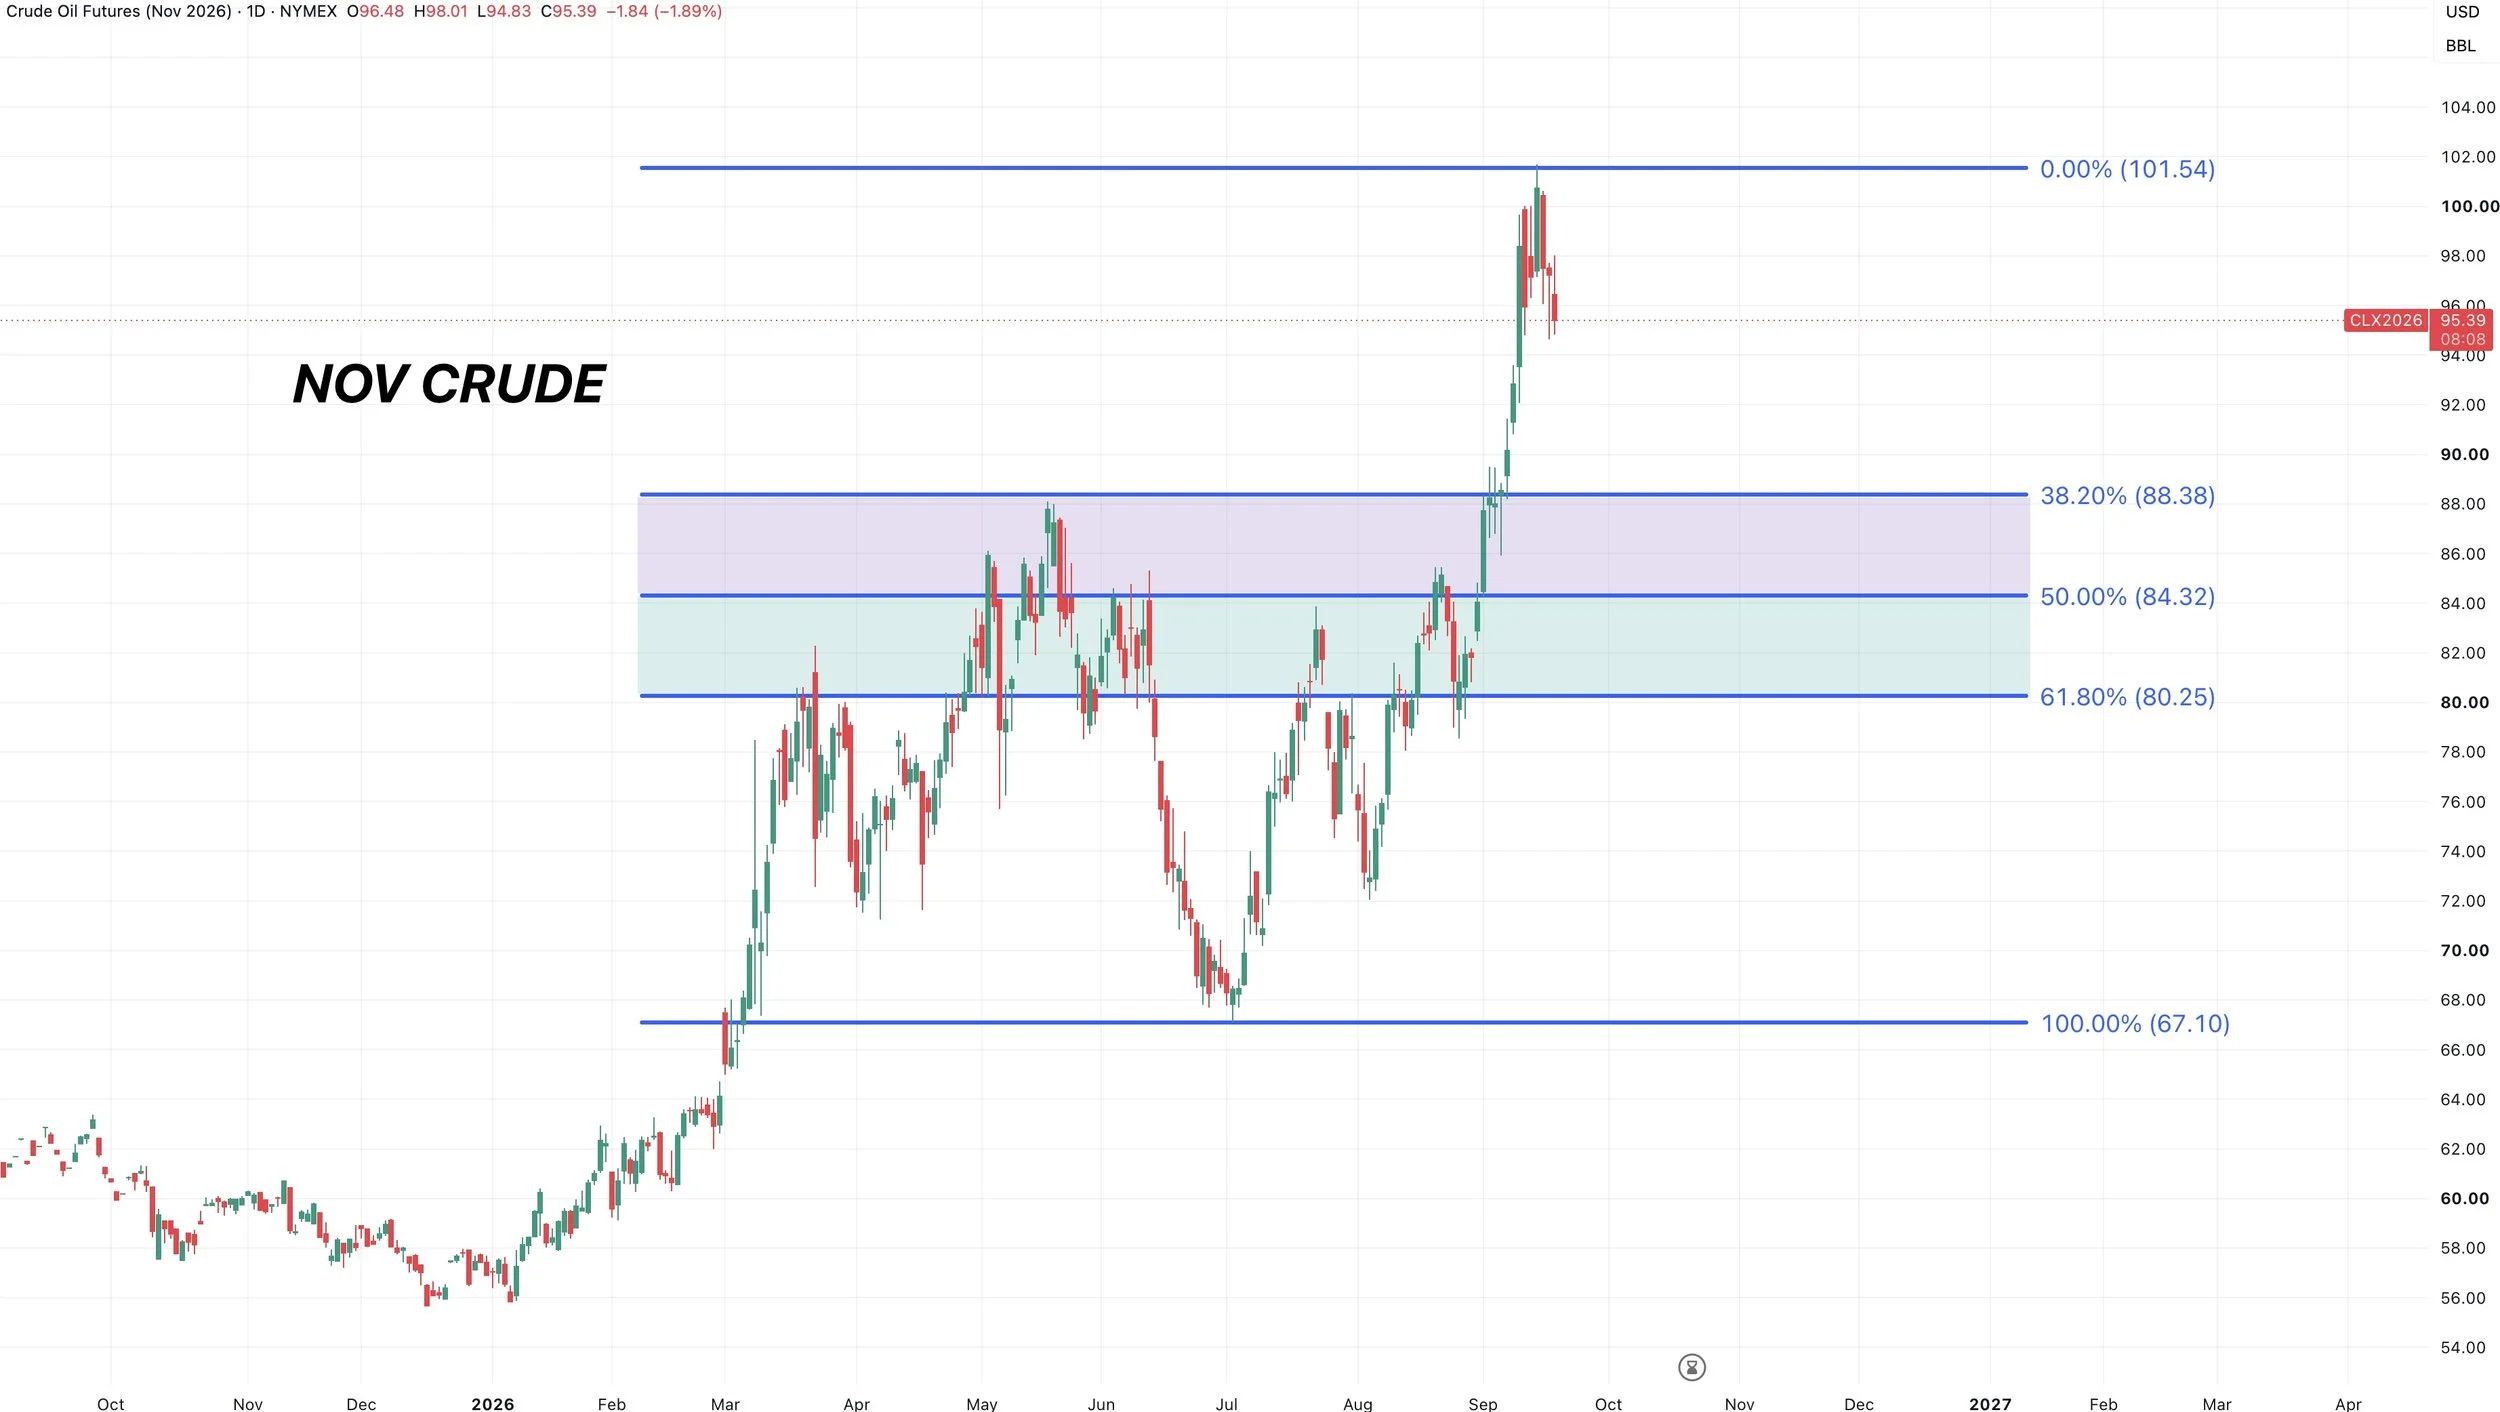
This is the lead contract now.
Crude could easily pullback into the high to mid 80's if this is the start of a pullback.
Testing some of those retracements and prior highs from May.
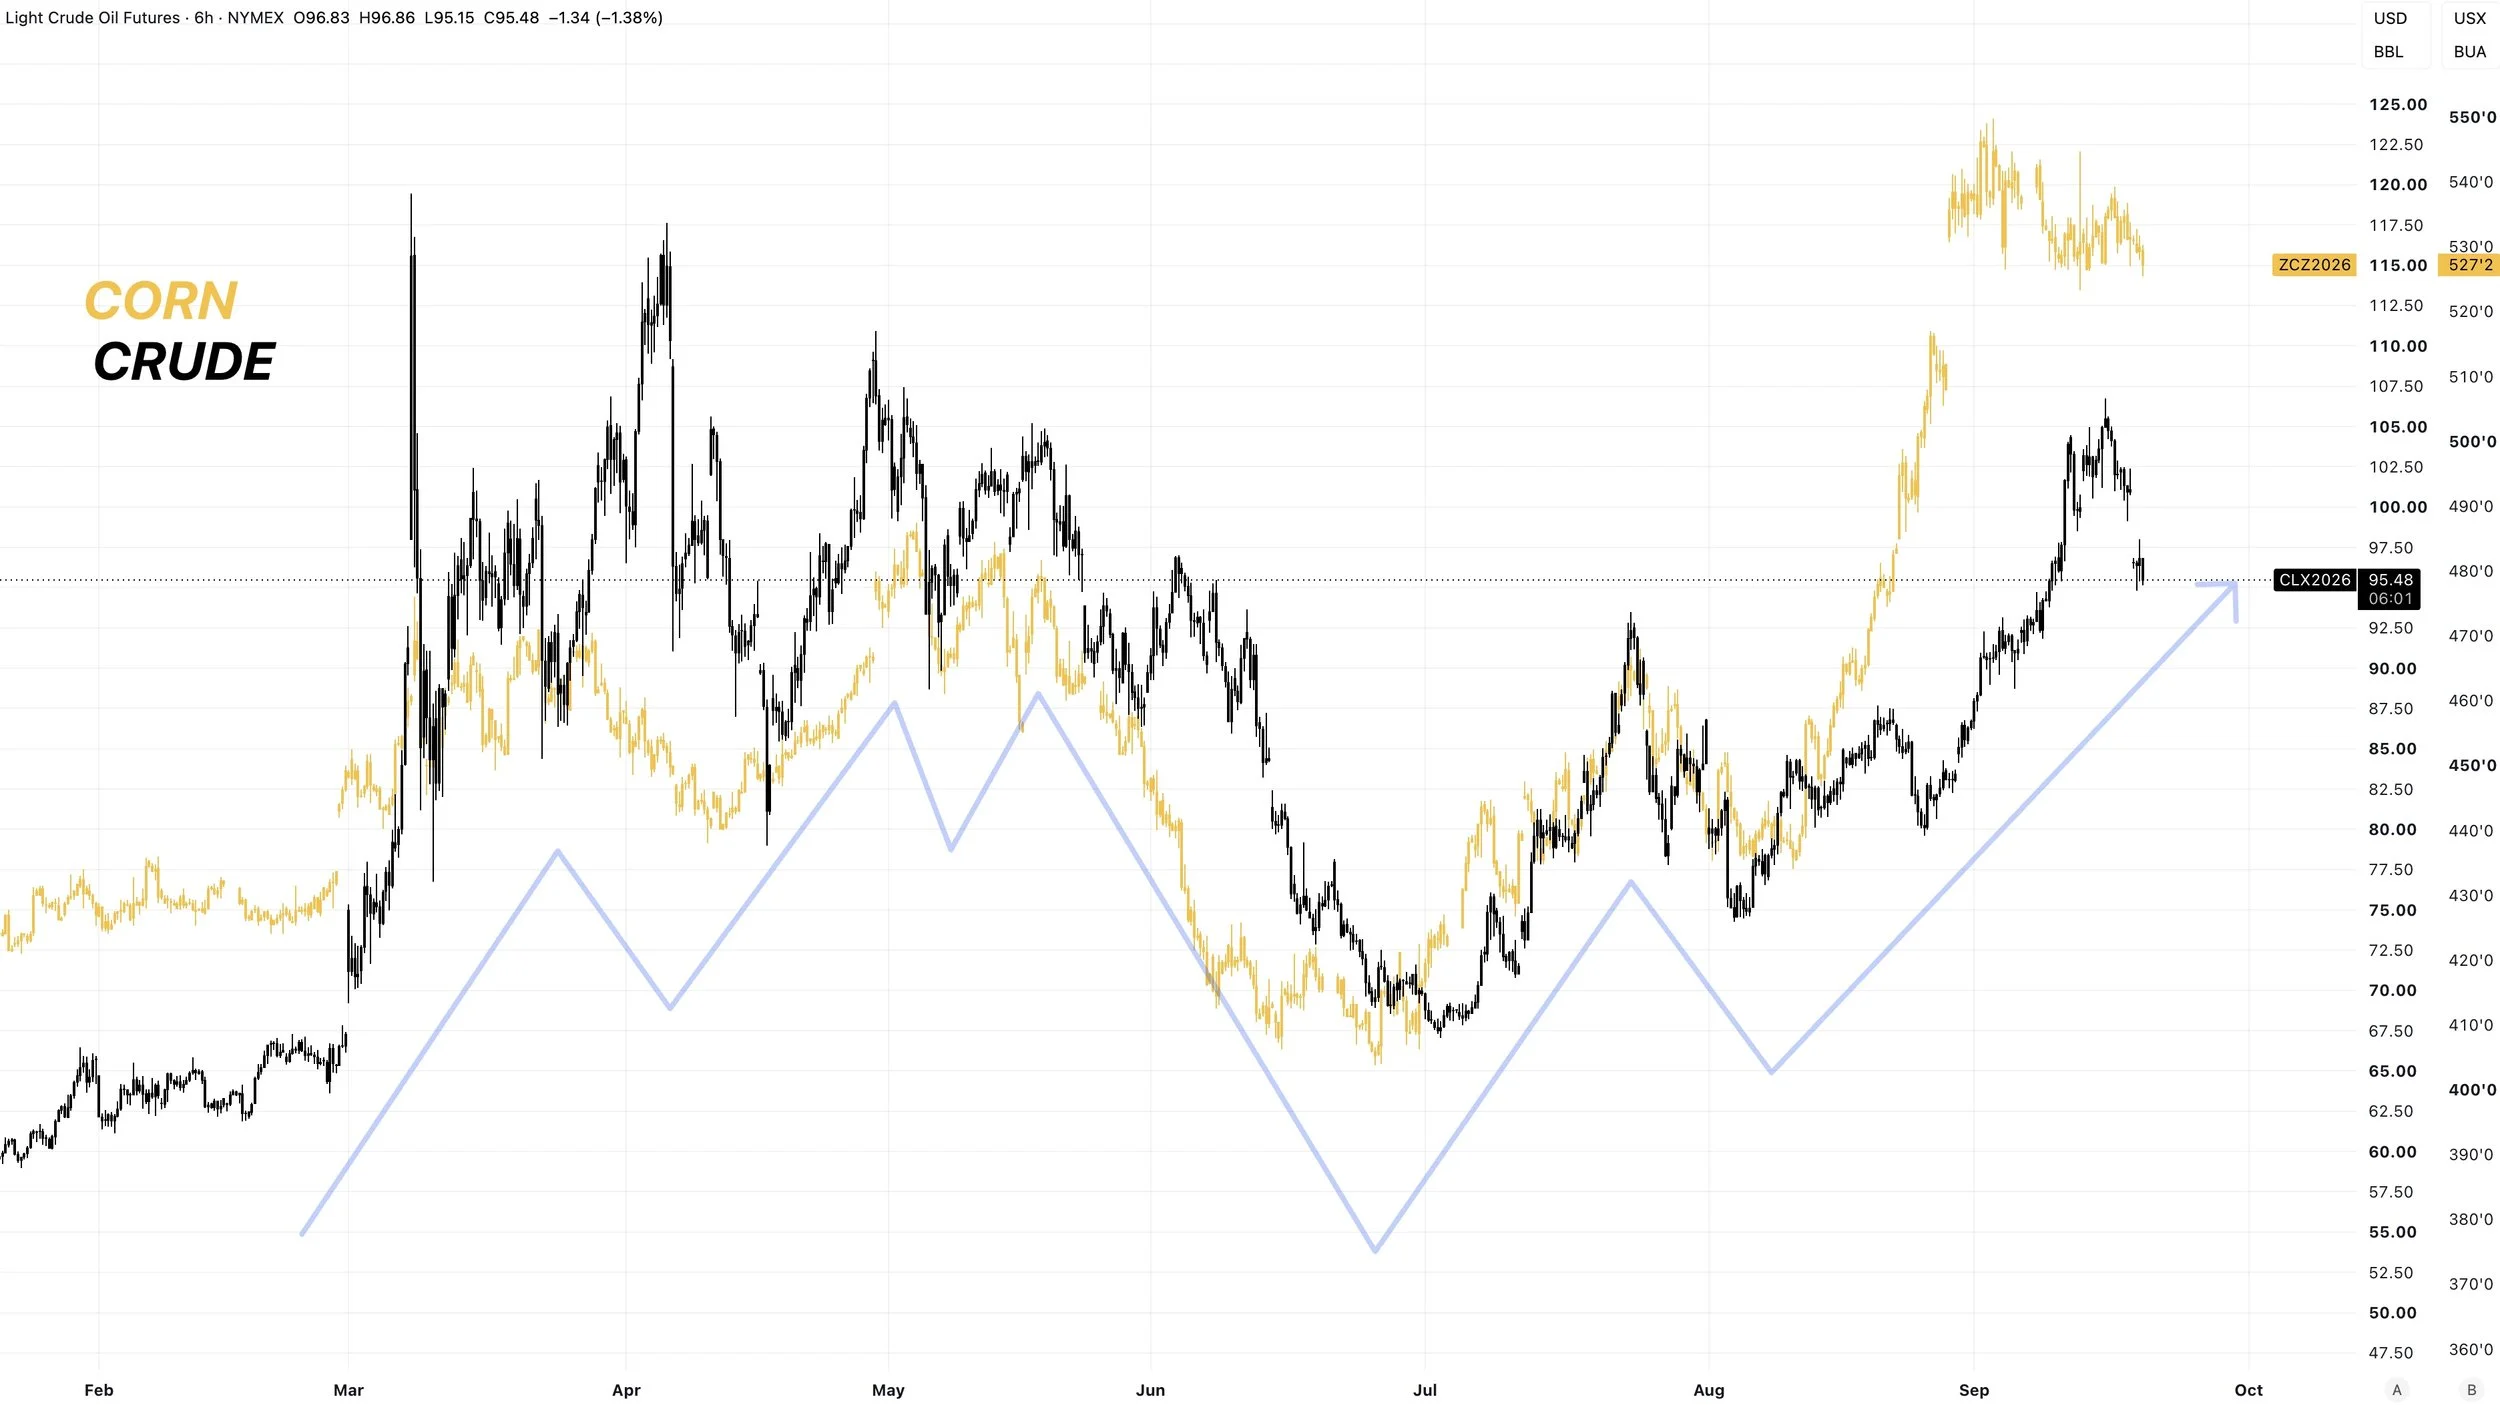
Crude vs Corn:
If crude does decide to pullback, it doesn’t mean corn automatically has to go lower. But it wouldn’t help pull us higher either.
Despite there not being a perfect day to day relationship between the two, overall the two have actually ran pretty in tandem all year long.
Soybeans
Soybean Charts
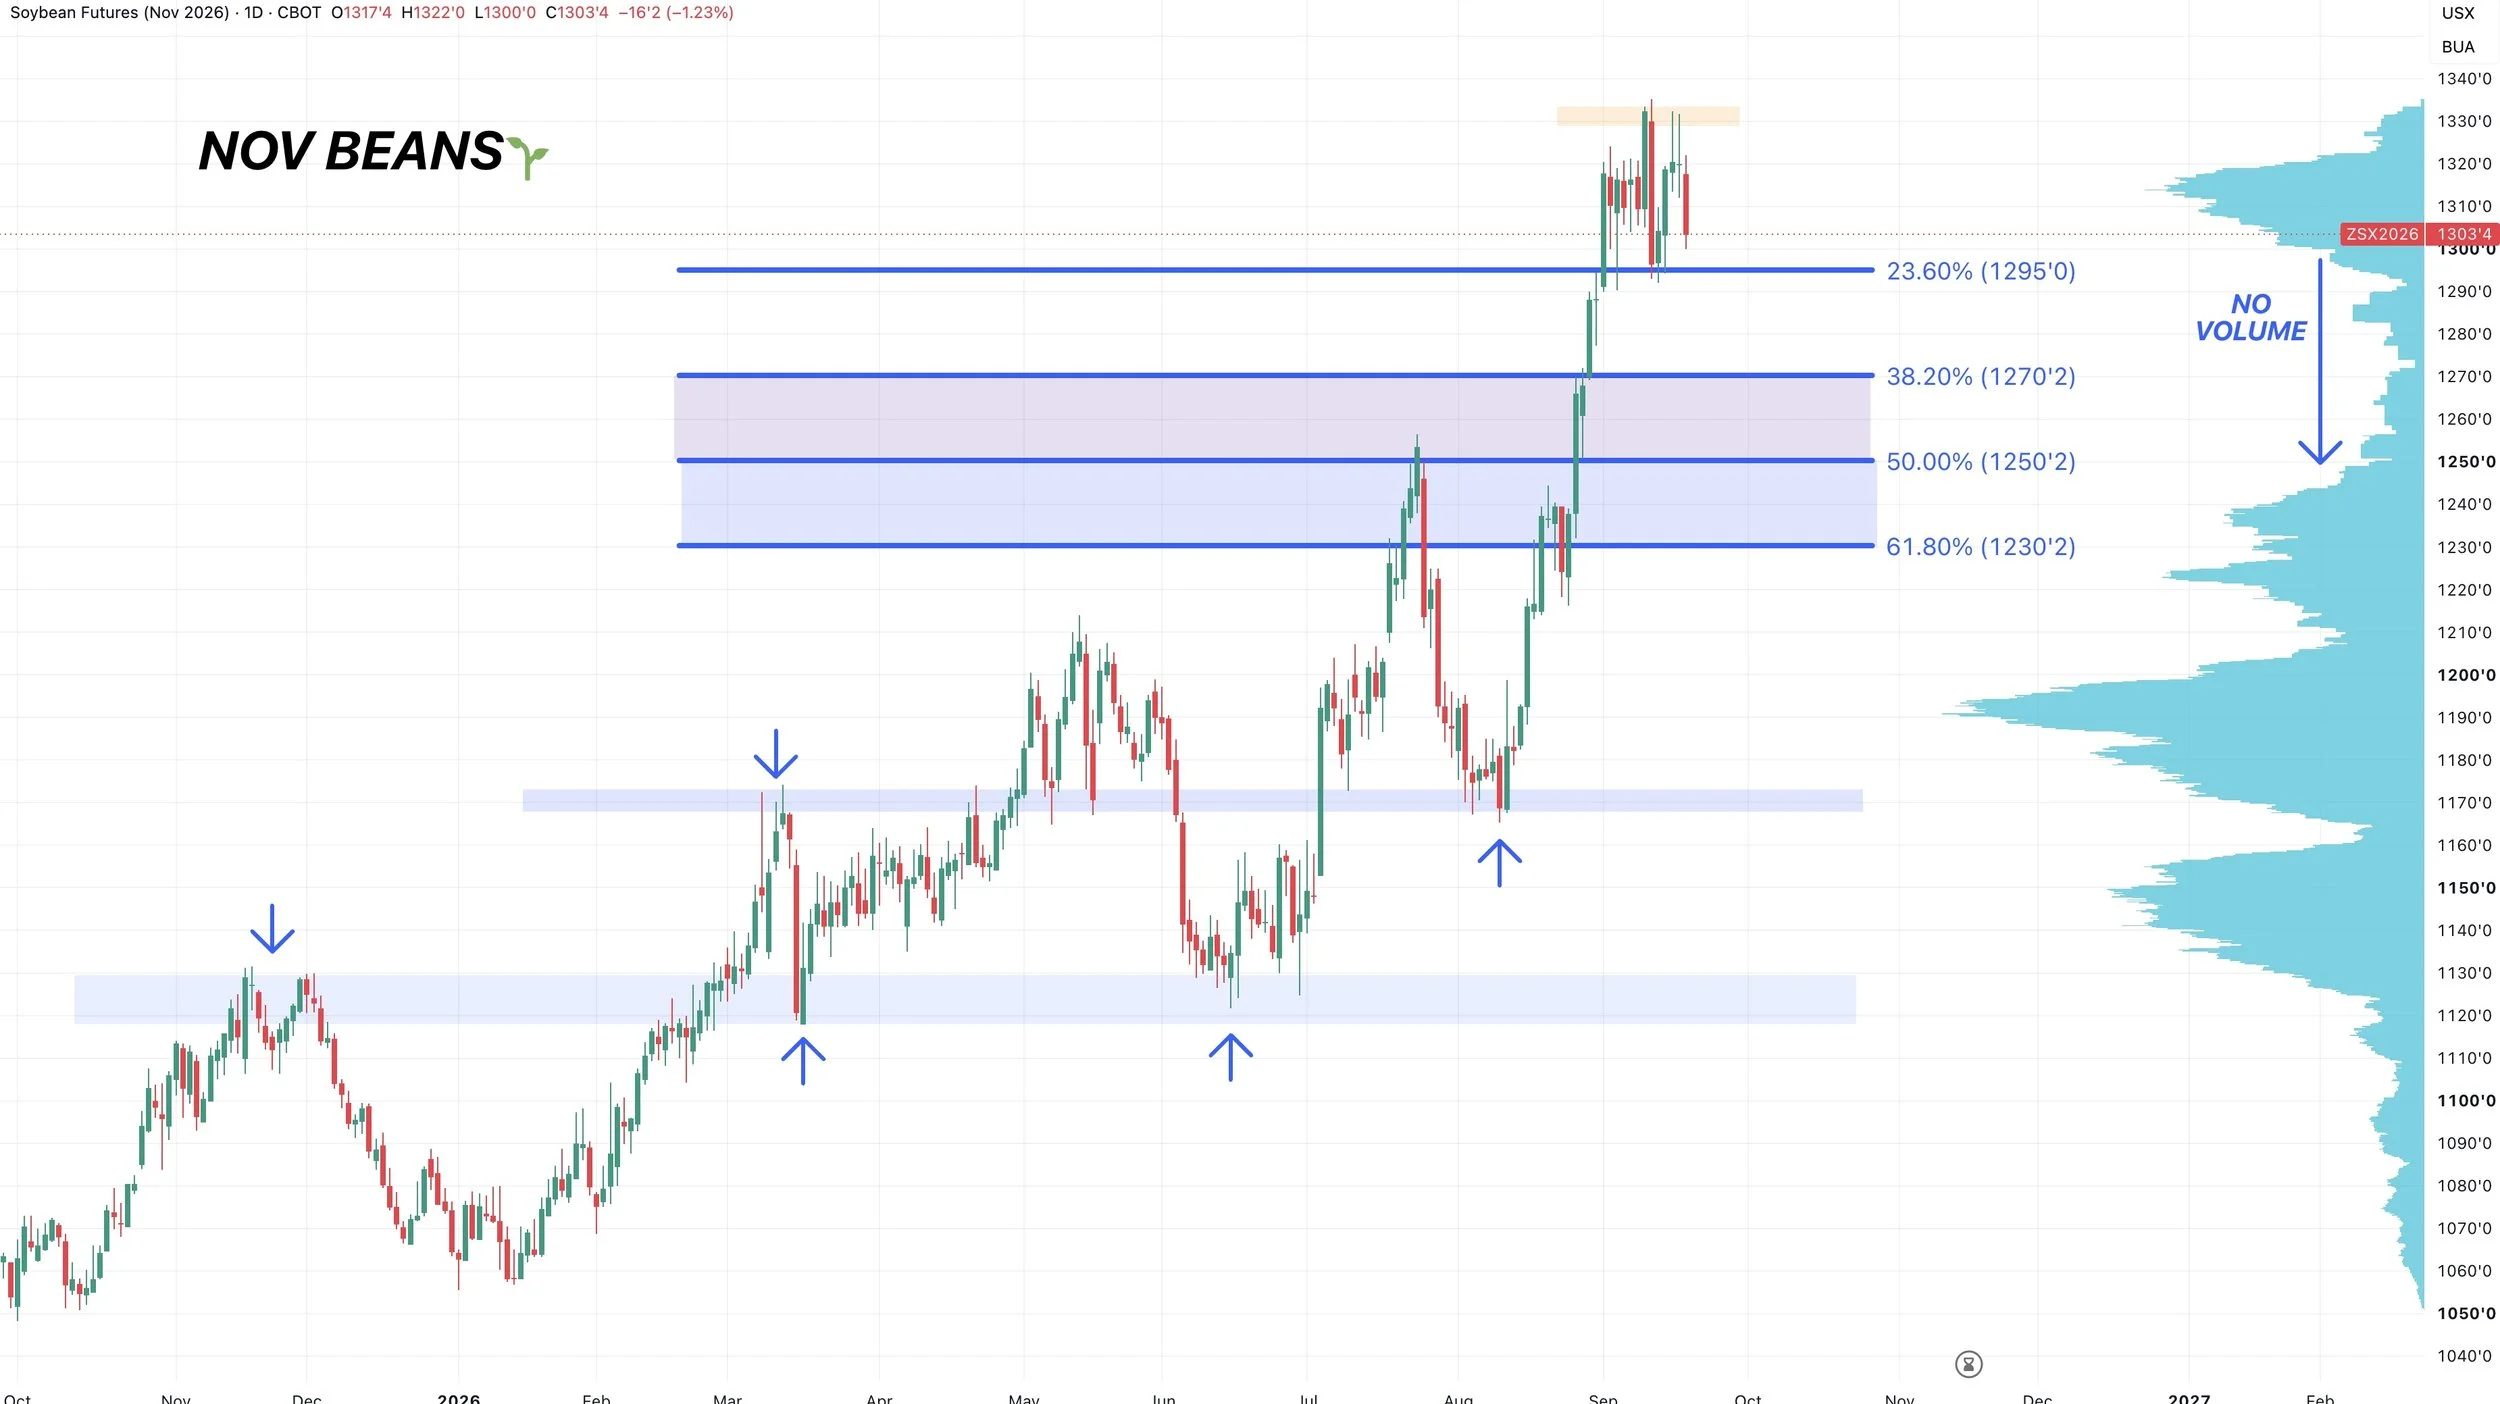
Nov Beans Chart:
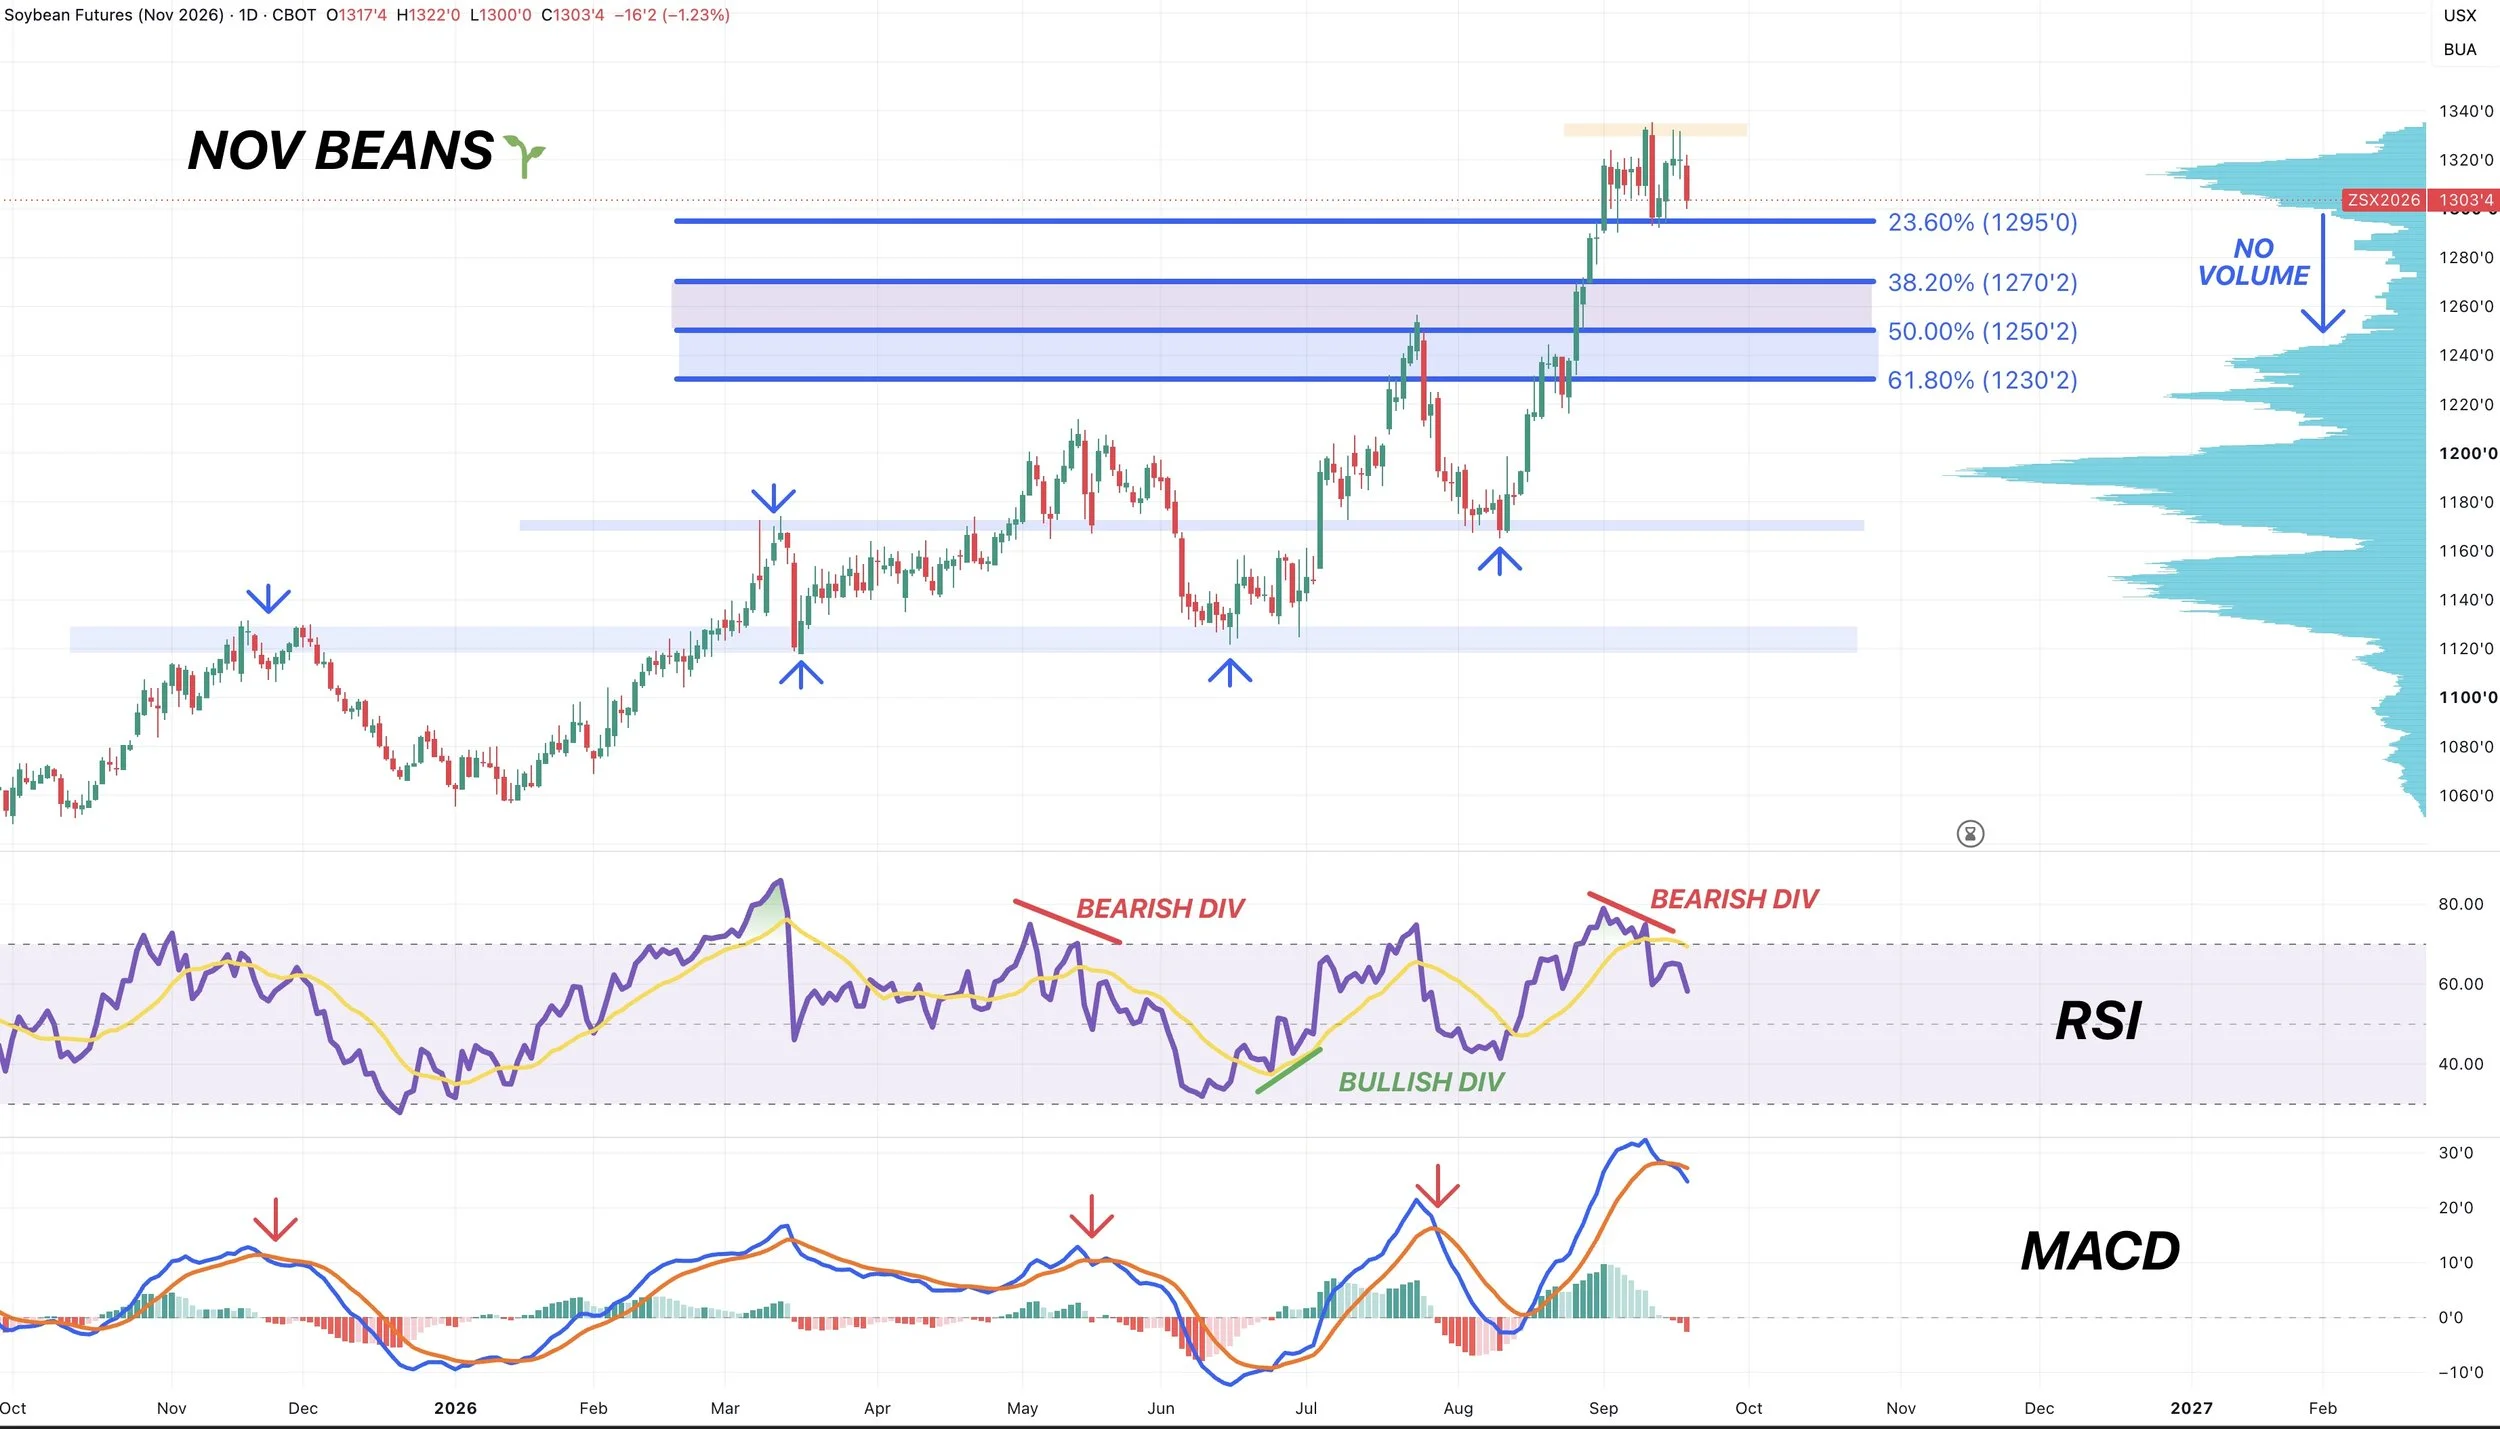
Soybeans continue to chop sideways in a 30-cent range.
We rejected those contract highs back to back days yesterday and Wednesday. So it looks like those highs are going to be some stiff resistance.
But basically we are still trapped in no man's land.
We spent the entire week this week trapped inside the range from the USDA report.
The obvious level to watch is the lows from the USDA report.
If we break below it could easily spark a good leg lower.
If you look at the volume profile, like in corn, we simply have zero support or volume below this support. So it could trigger further selling. As there is just a pocket of air below here.
So bulls want to hold the bottom of the range and break the top of the range.
If we get a pullback, it could be towards the 38.2% to 50% retracements down to the August lows. Which comes in at $12.50 to $12.70
The 50% level would re-test those highs from July.
Soybeans do tend to turn old highs into new lows quiet often. We saw the November highs become the March and June lows. We saw the March highs become the August lows.
Indicators:
One reason for caution is that we had that bearish divergence on the RSI.
We also just saw the MACD cross bearish for the first time since July. Suggesting momentum might be starting to cool off.
So that is definitely to note. As the last few crosses led to a pullback.
Seasonals:
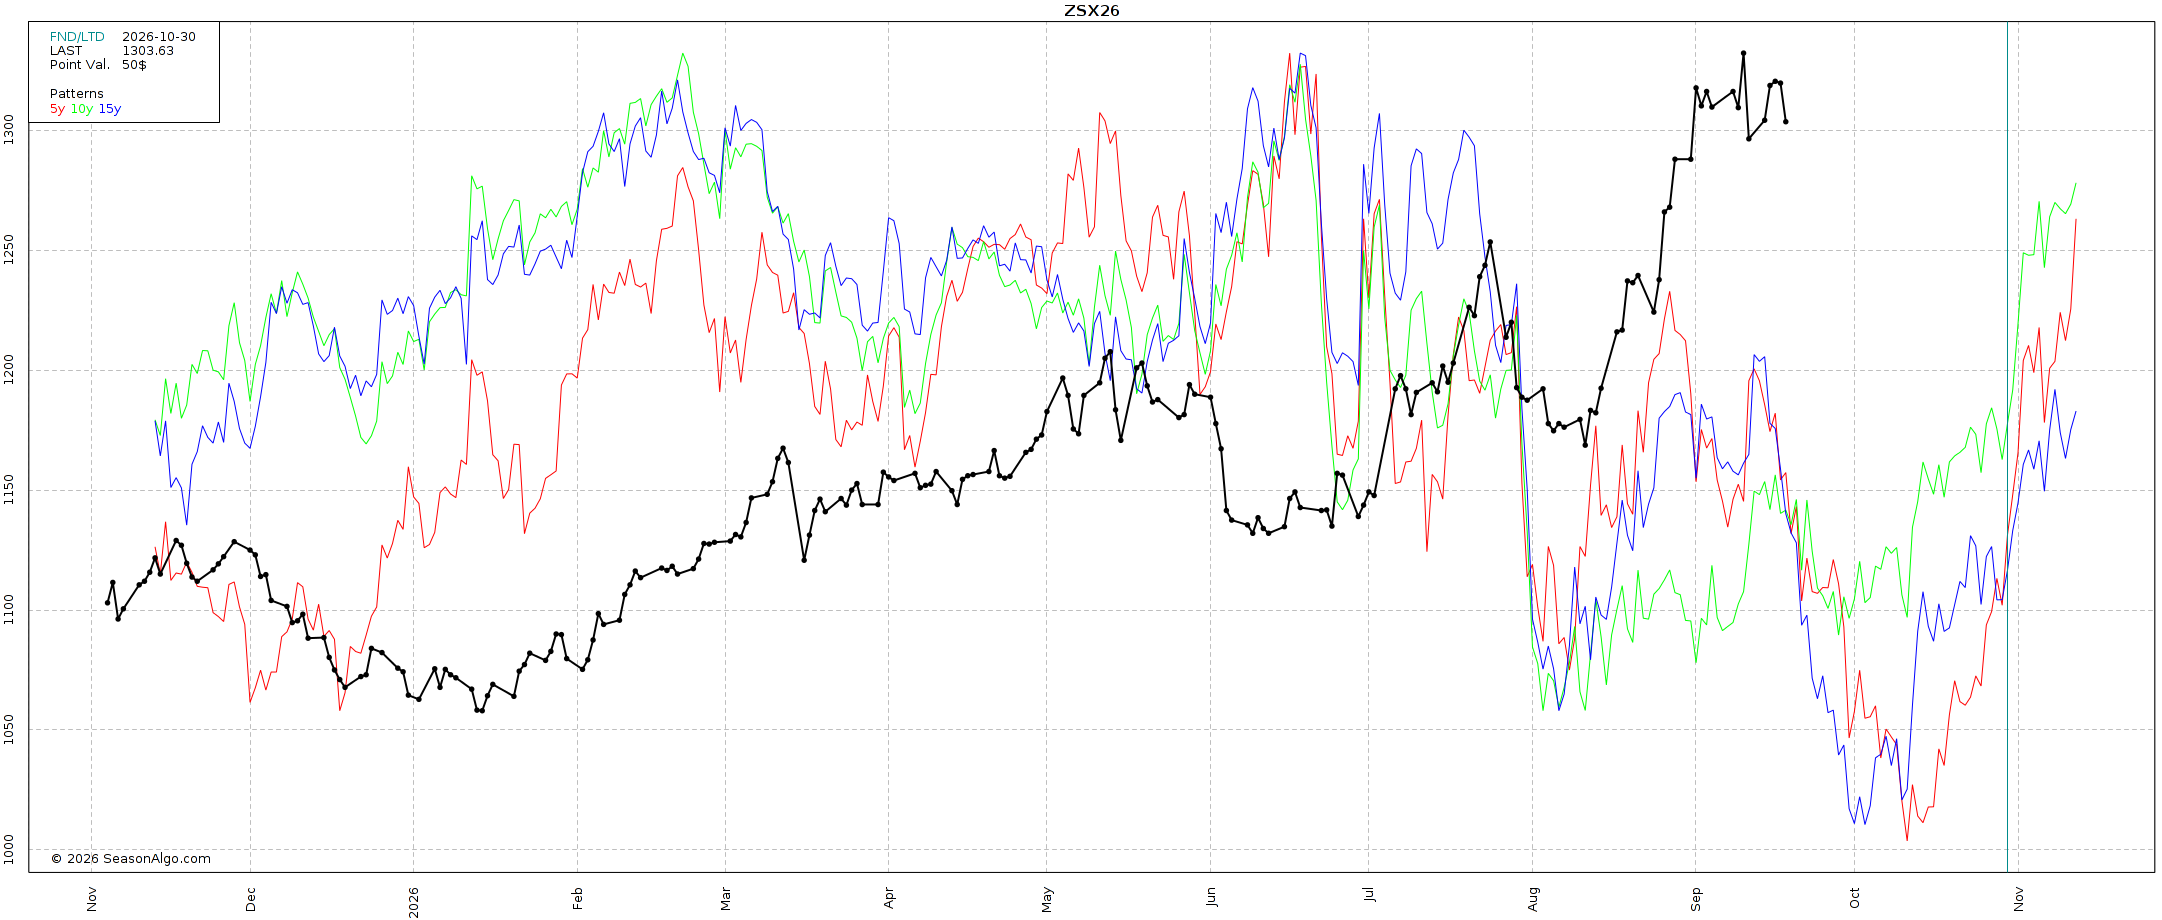
Like in corn, I think soybeans have a ton of upside potential and long term I am bullish on soybeans.
But short term, we do want to keep in mind that this is seasonally one of the most bearish time frames of the year for soybeans.
So if you have to move stuff off the combine, it probably makes sense to be managing some risk.
Which is why we had that sell signal and hedge alert back on September 1st. Specifically for those short on time or behind.
Obviously, seasonals don’t always work. But another reason to have some short term caution up near contract highs and multi-year highs for that matter.
Weekly Chart:
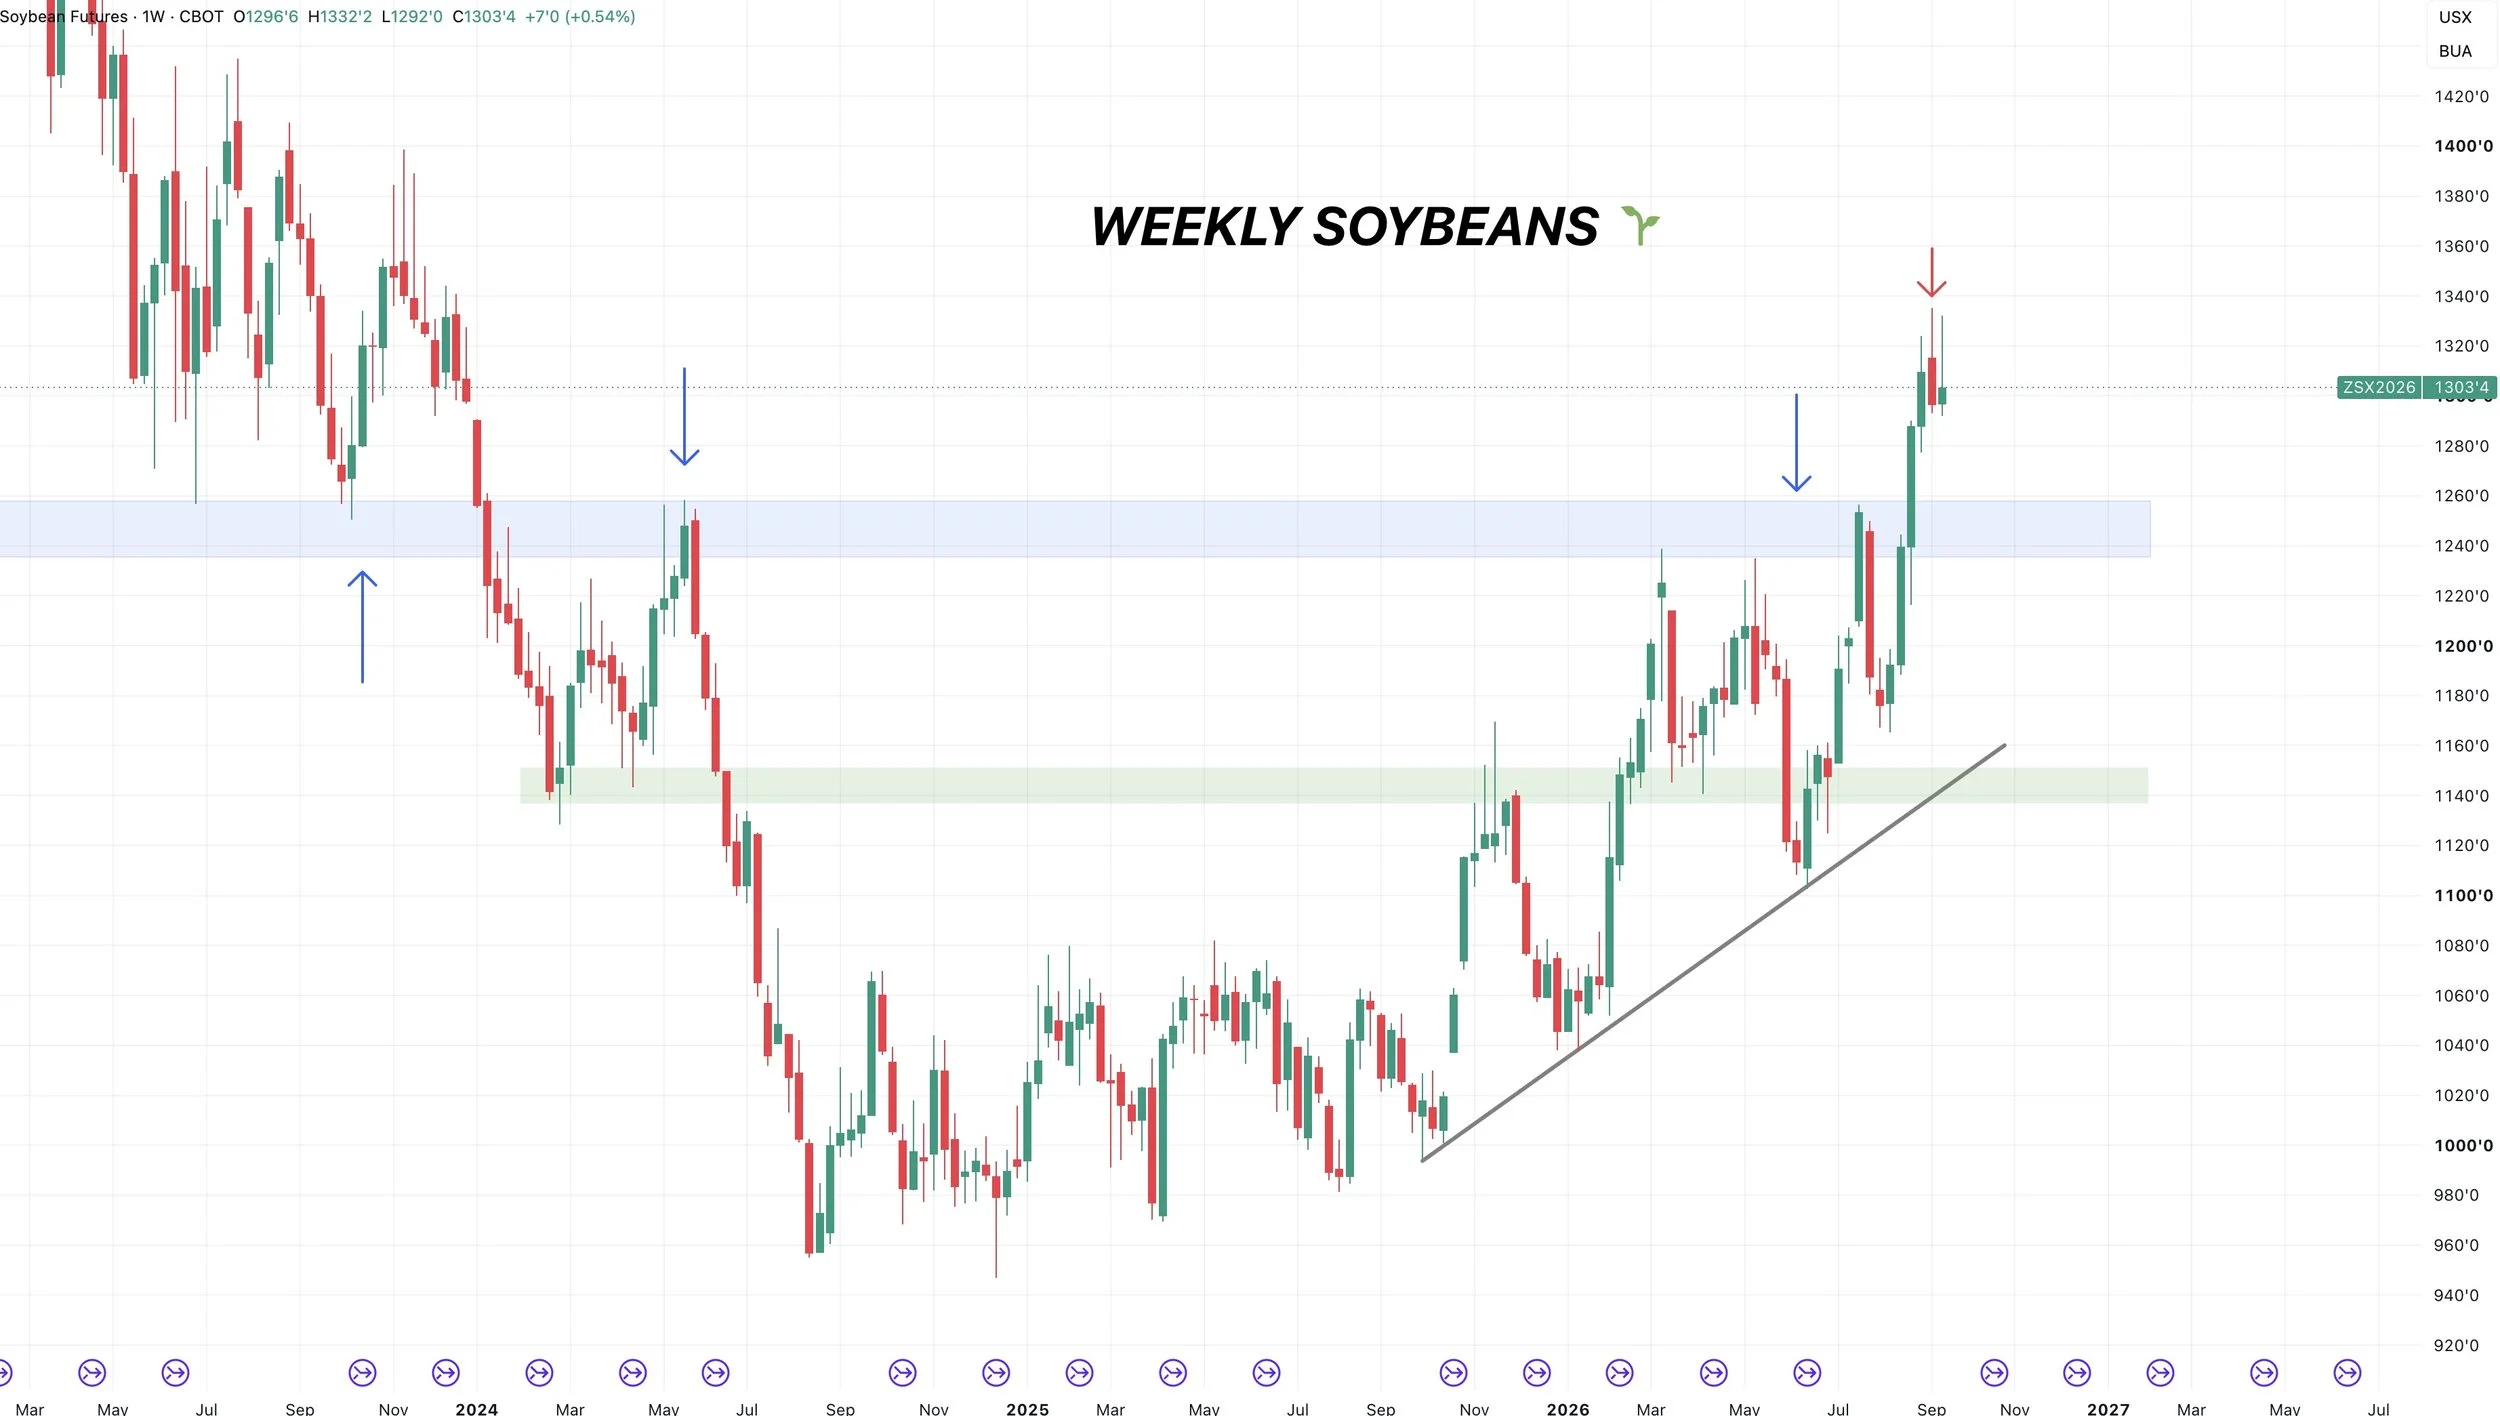
If you notice, we have closed off the highs for 3 weeks in a row now.
Leaving some long tails. So these recent highs look like clear resistance for now.
Would it really be that surprising to see beans come back and test that previous resistance before heading higher?
Of course does not have to happen, I am just saying I would not be shocked to see it.
Monthly Chart:
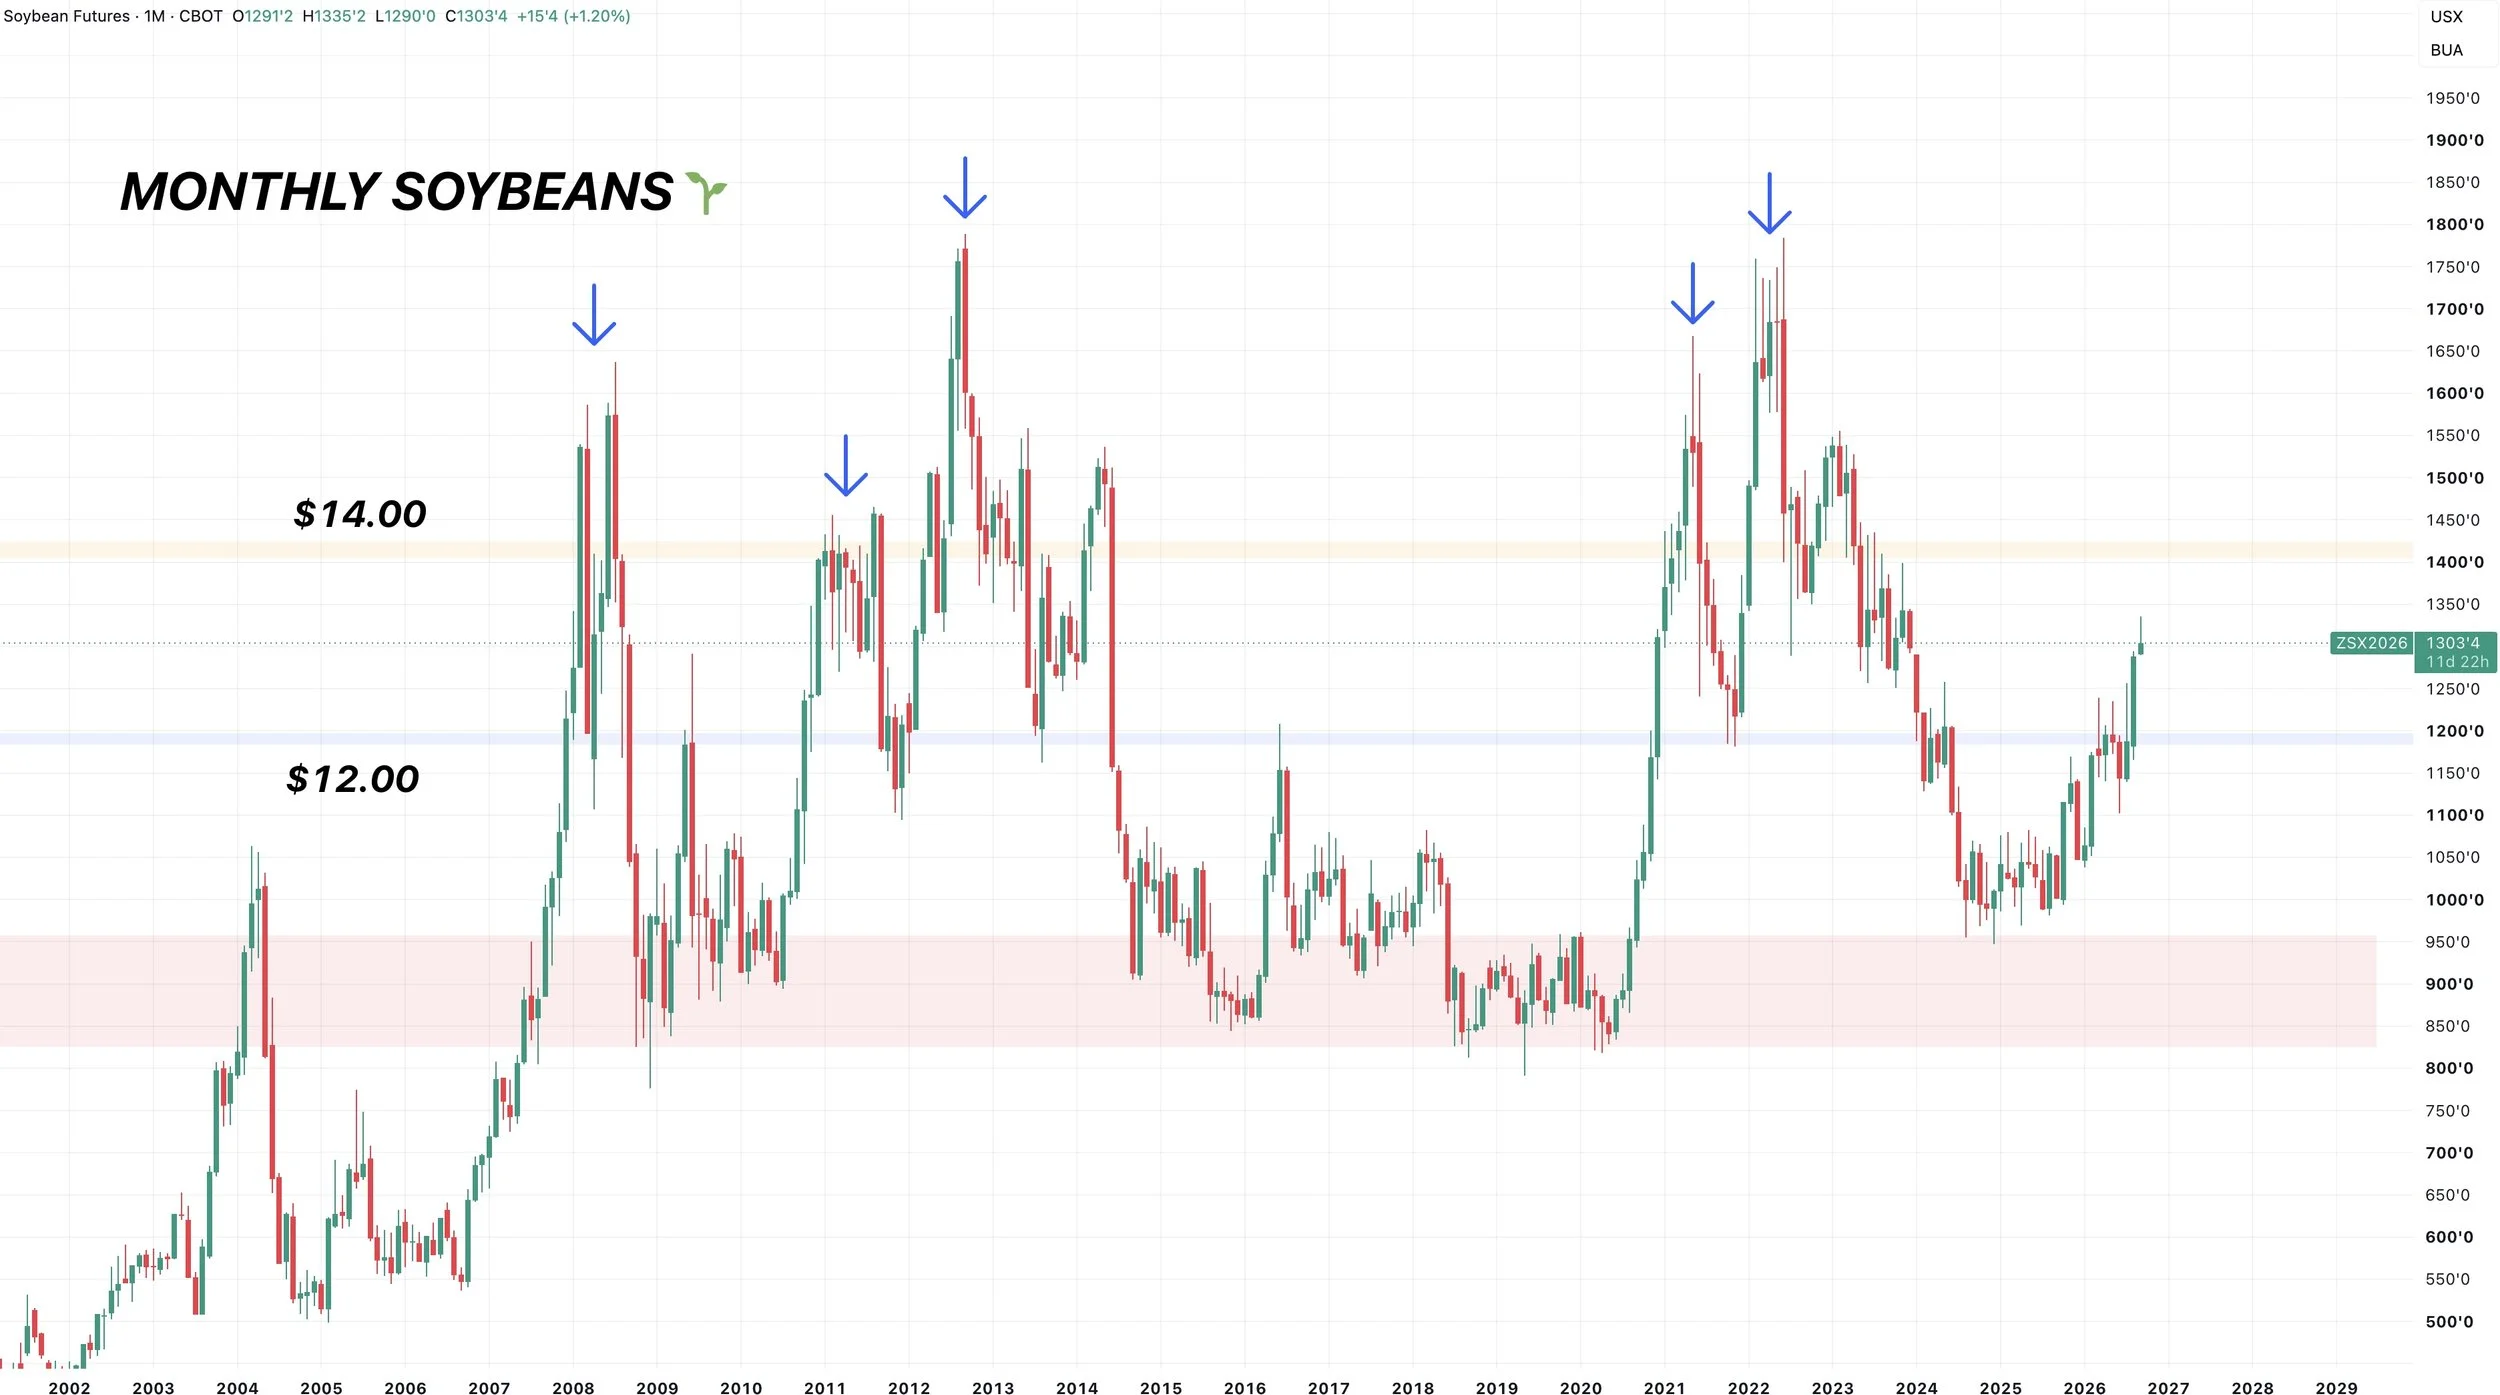
Long term, as I have stated many times by now, I still expect $14 beans at some point.
Every major run in soybeans where we got a monthly close above $12 led to $14 or higher.
We just saw that happen.
You can’t look at this monthly chart and tell me it's not a good looking chart with plenty of further upside.
That $12.00 level was big resistance. And we broke above.
It's been a key pivot in this market countless times the last few decades. So I think it offers further upside.
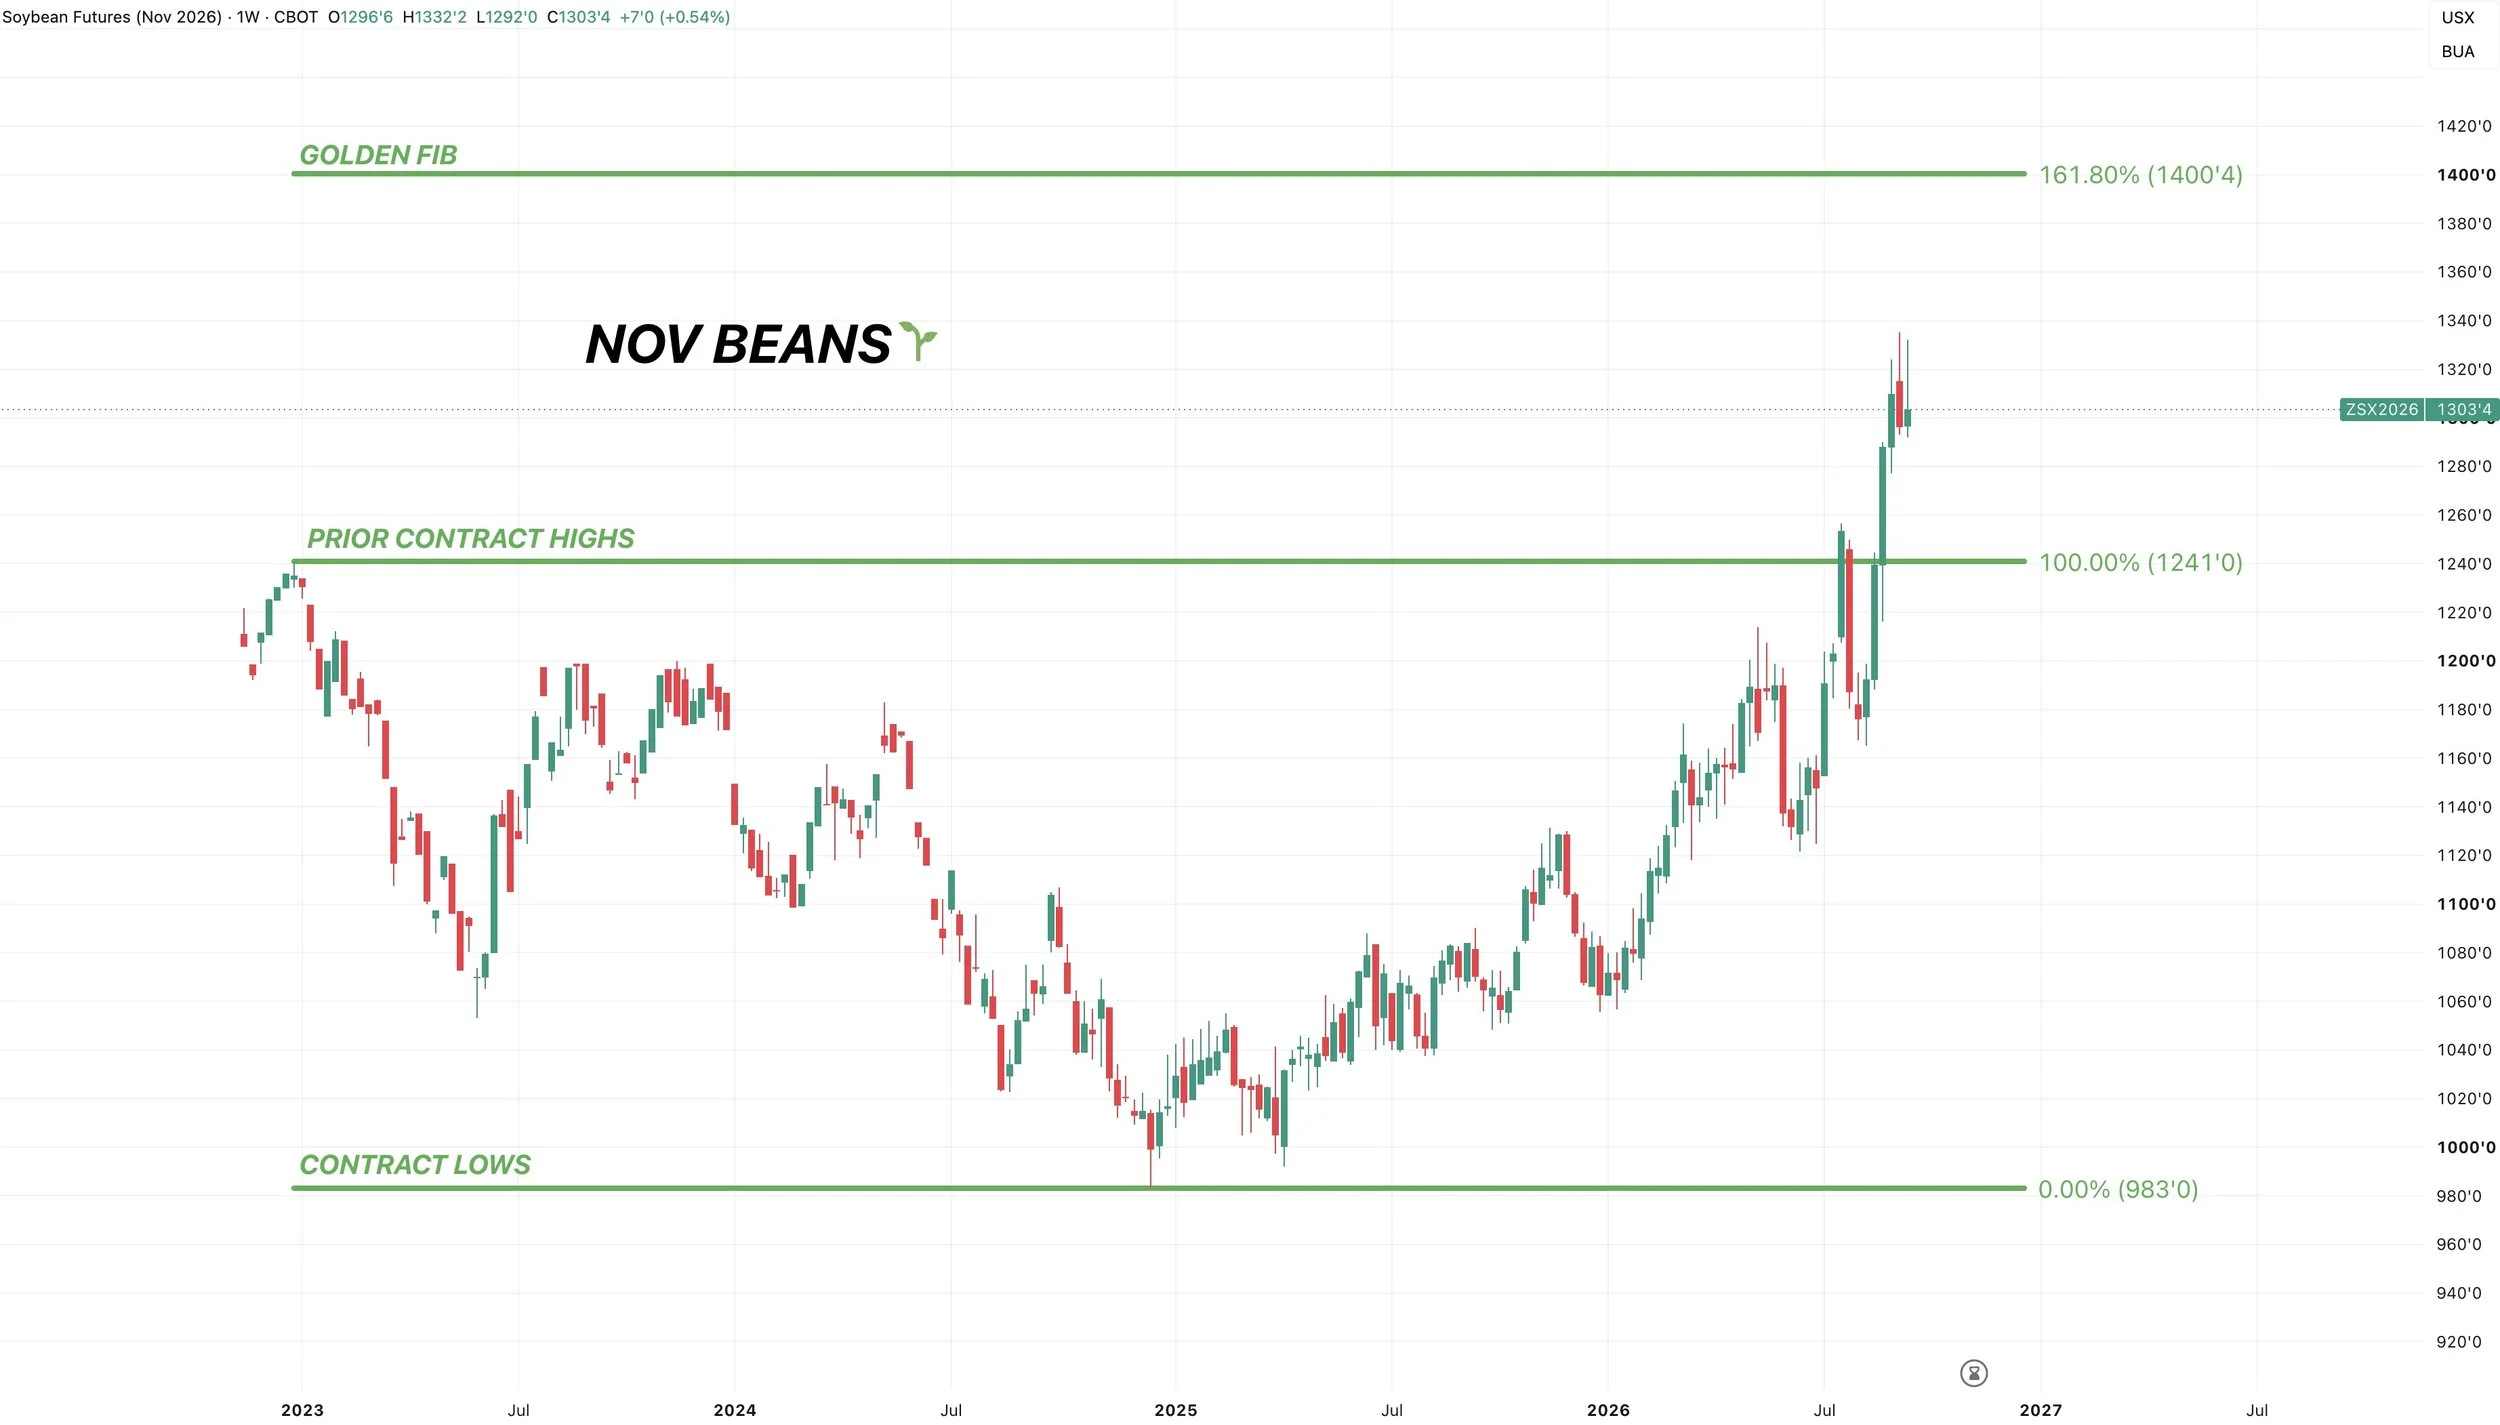
Nov Beans: Golden Fib
If you take the contract lows up to the previous contract highs from 2023.
The 161.8% retracement also comes in exactly at $14.00
Who knows if it happens on the Nov contract, but another reason to have that as a target.
Weekly Meal:
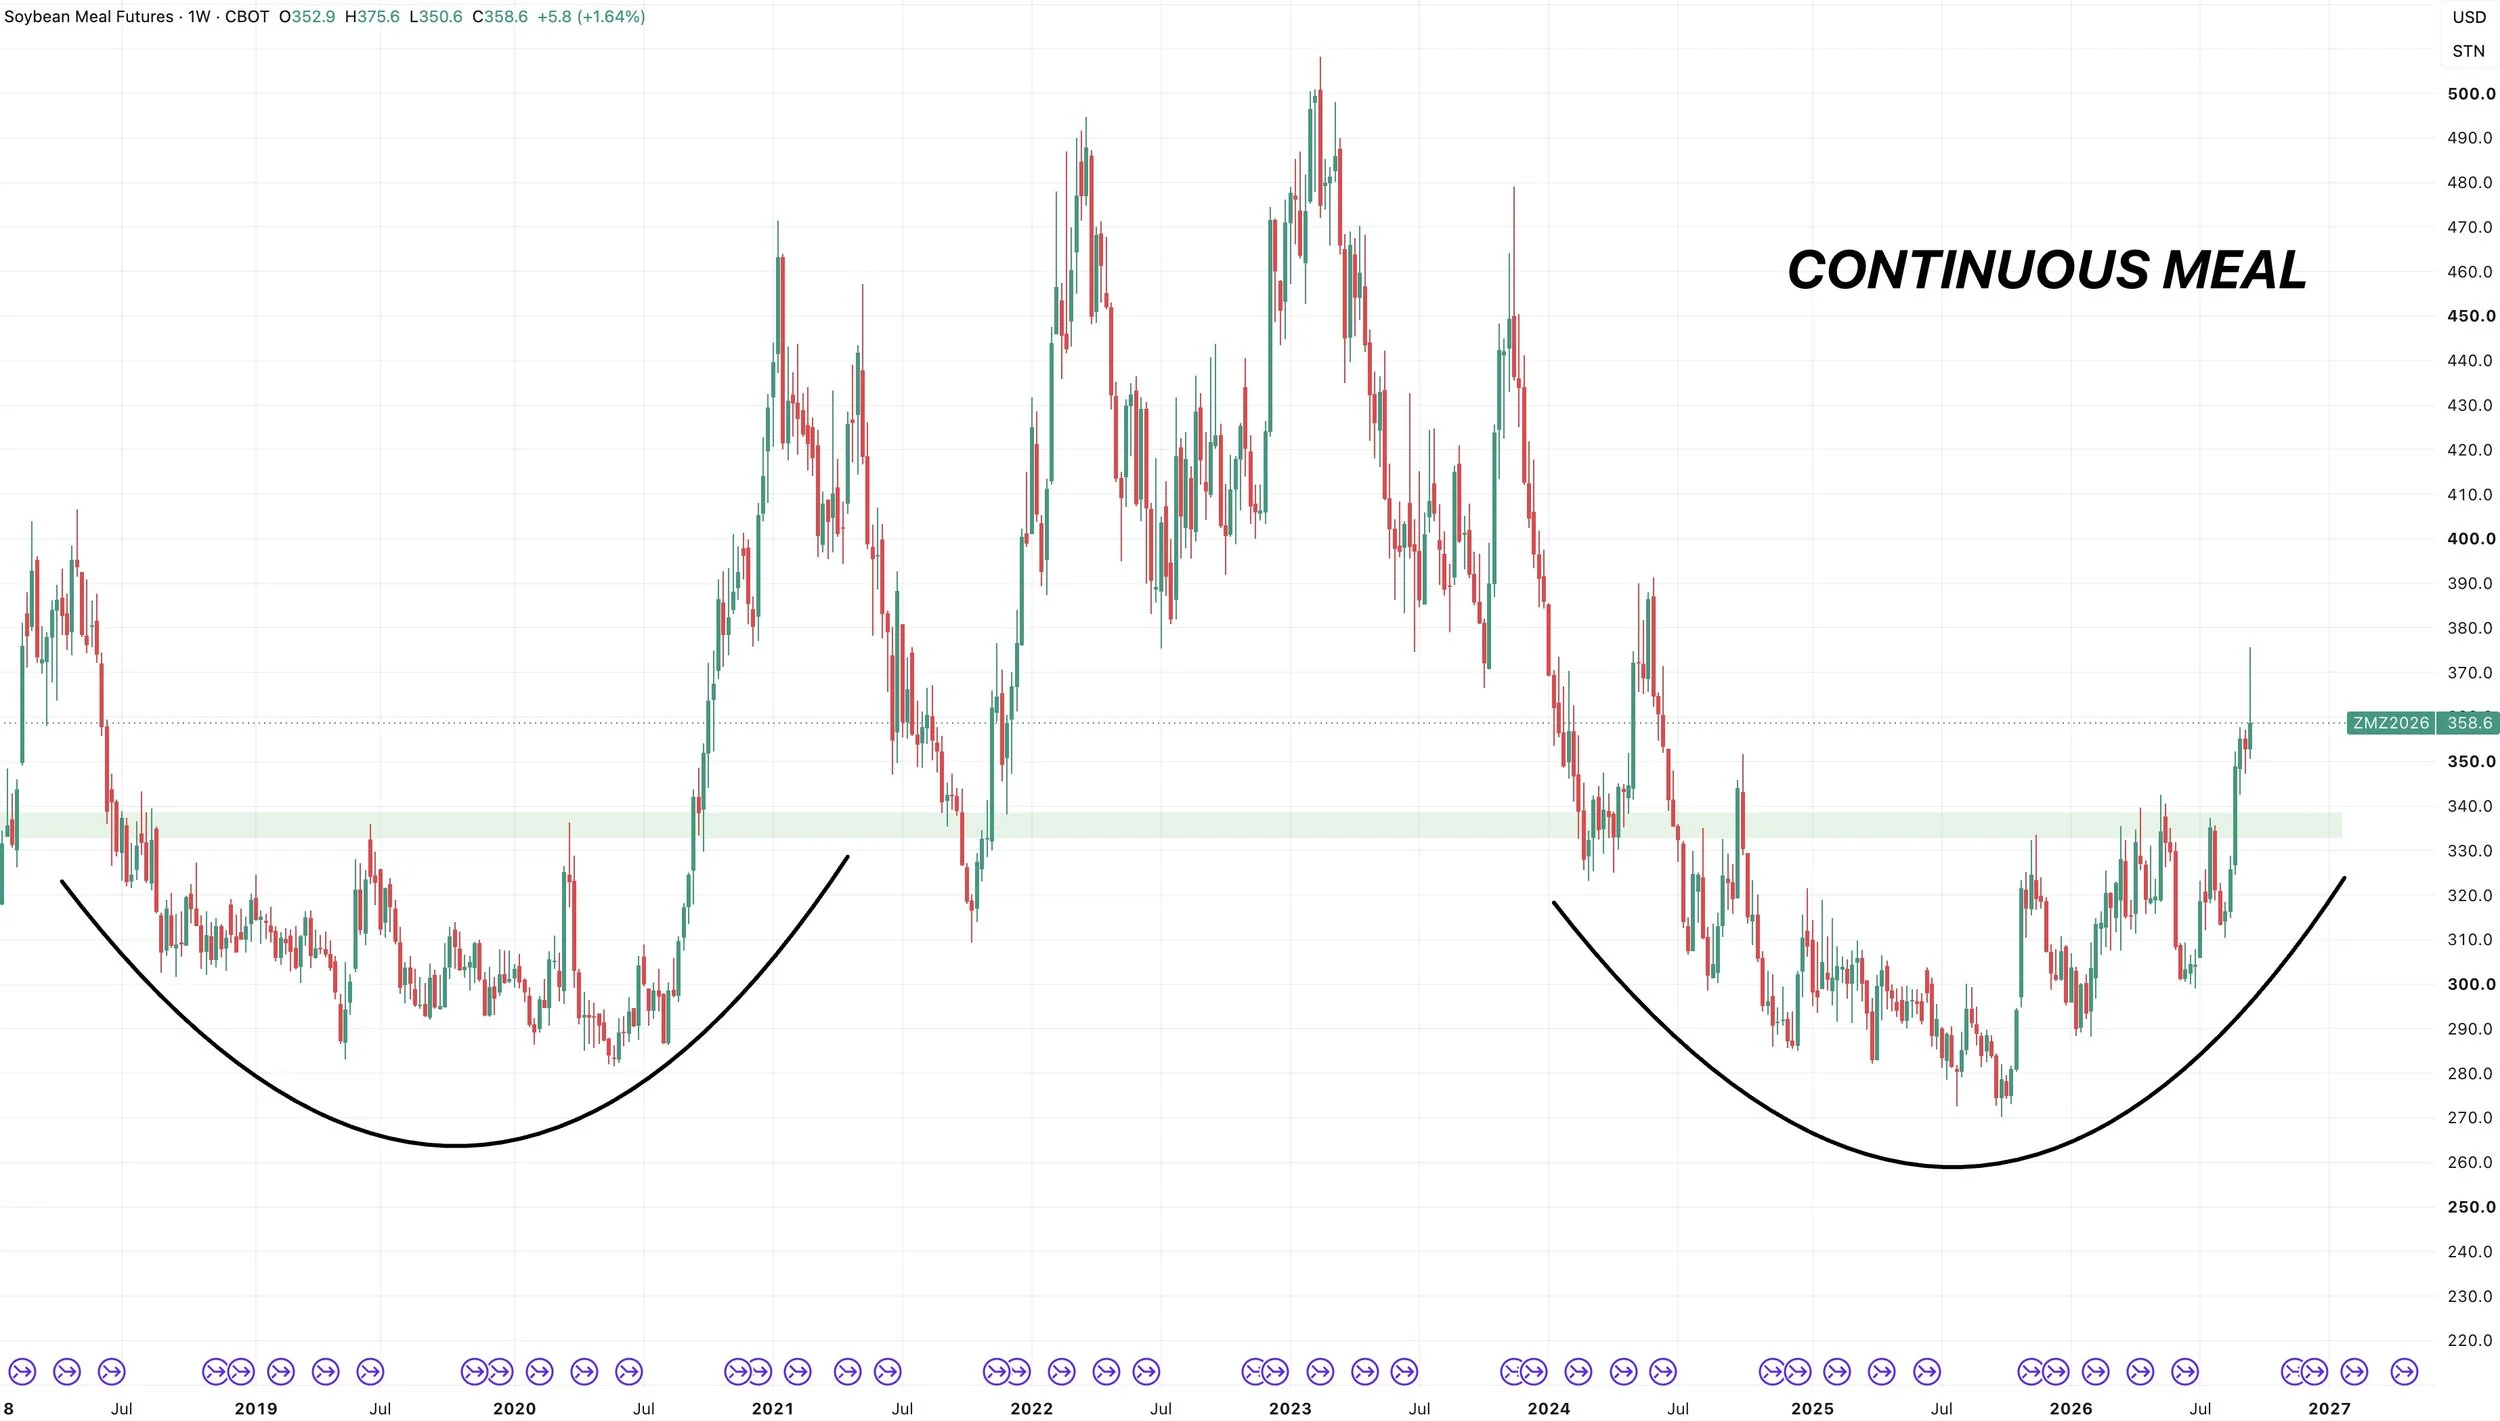
Nasty weekly candle in meal with the blood bath today.
Which could cause some further downside.
But overall, the long term structure of meal looks great.
We broke some major resistance that had a kept a lid on this market for over a year.
So ultimately I think this could could continue to be friendly for beans long term.
Dec Daily Meal:
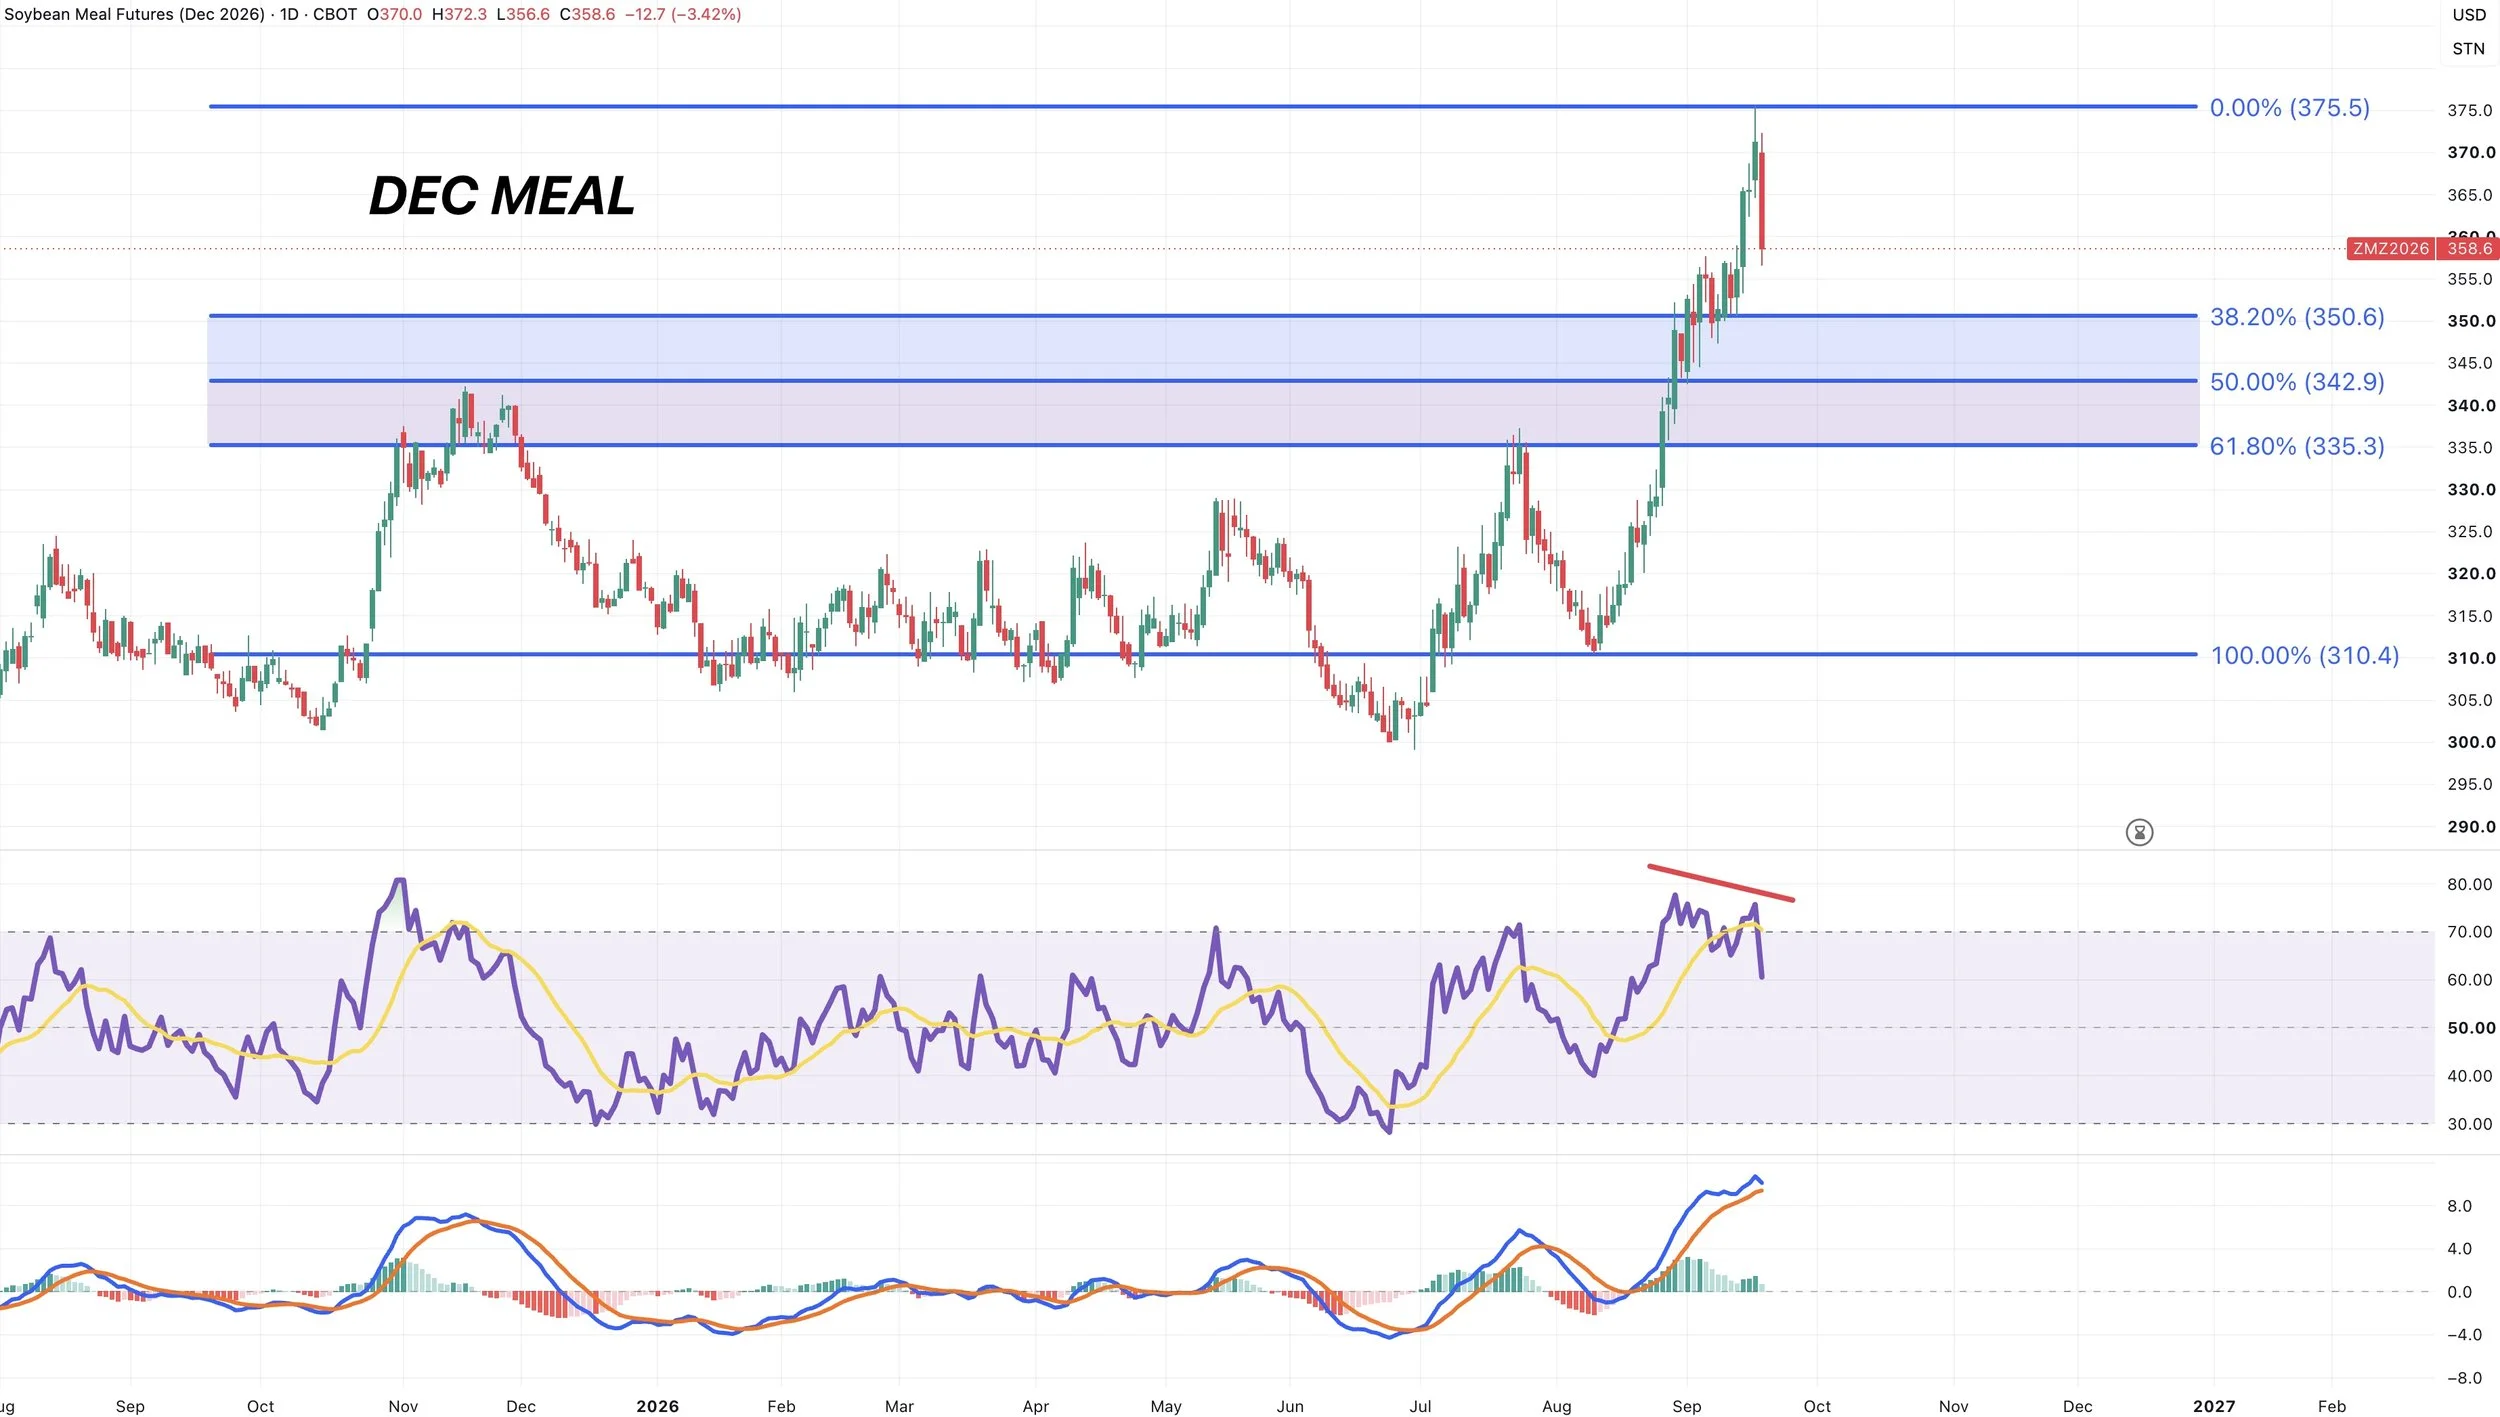
We had bearish divergence leading up to this sell off.
The MACD also is starting to potentially curl lower.
Ugly day today.
But meal could drop a good amount and still structurally be fine.
If we gave back 50% of the rally from August, it would re-test the highs from last November.
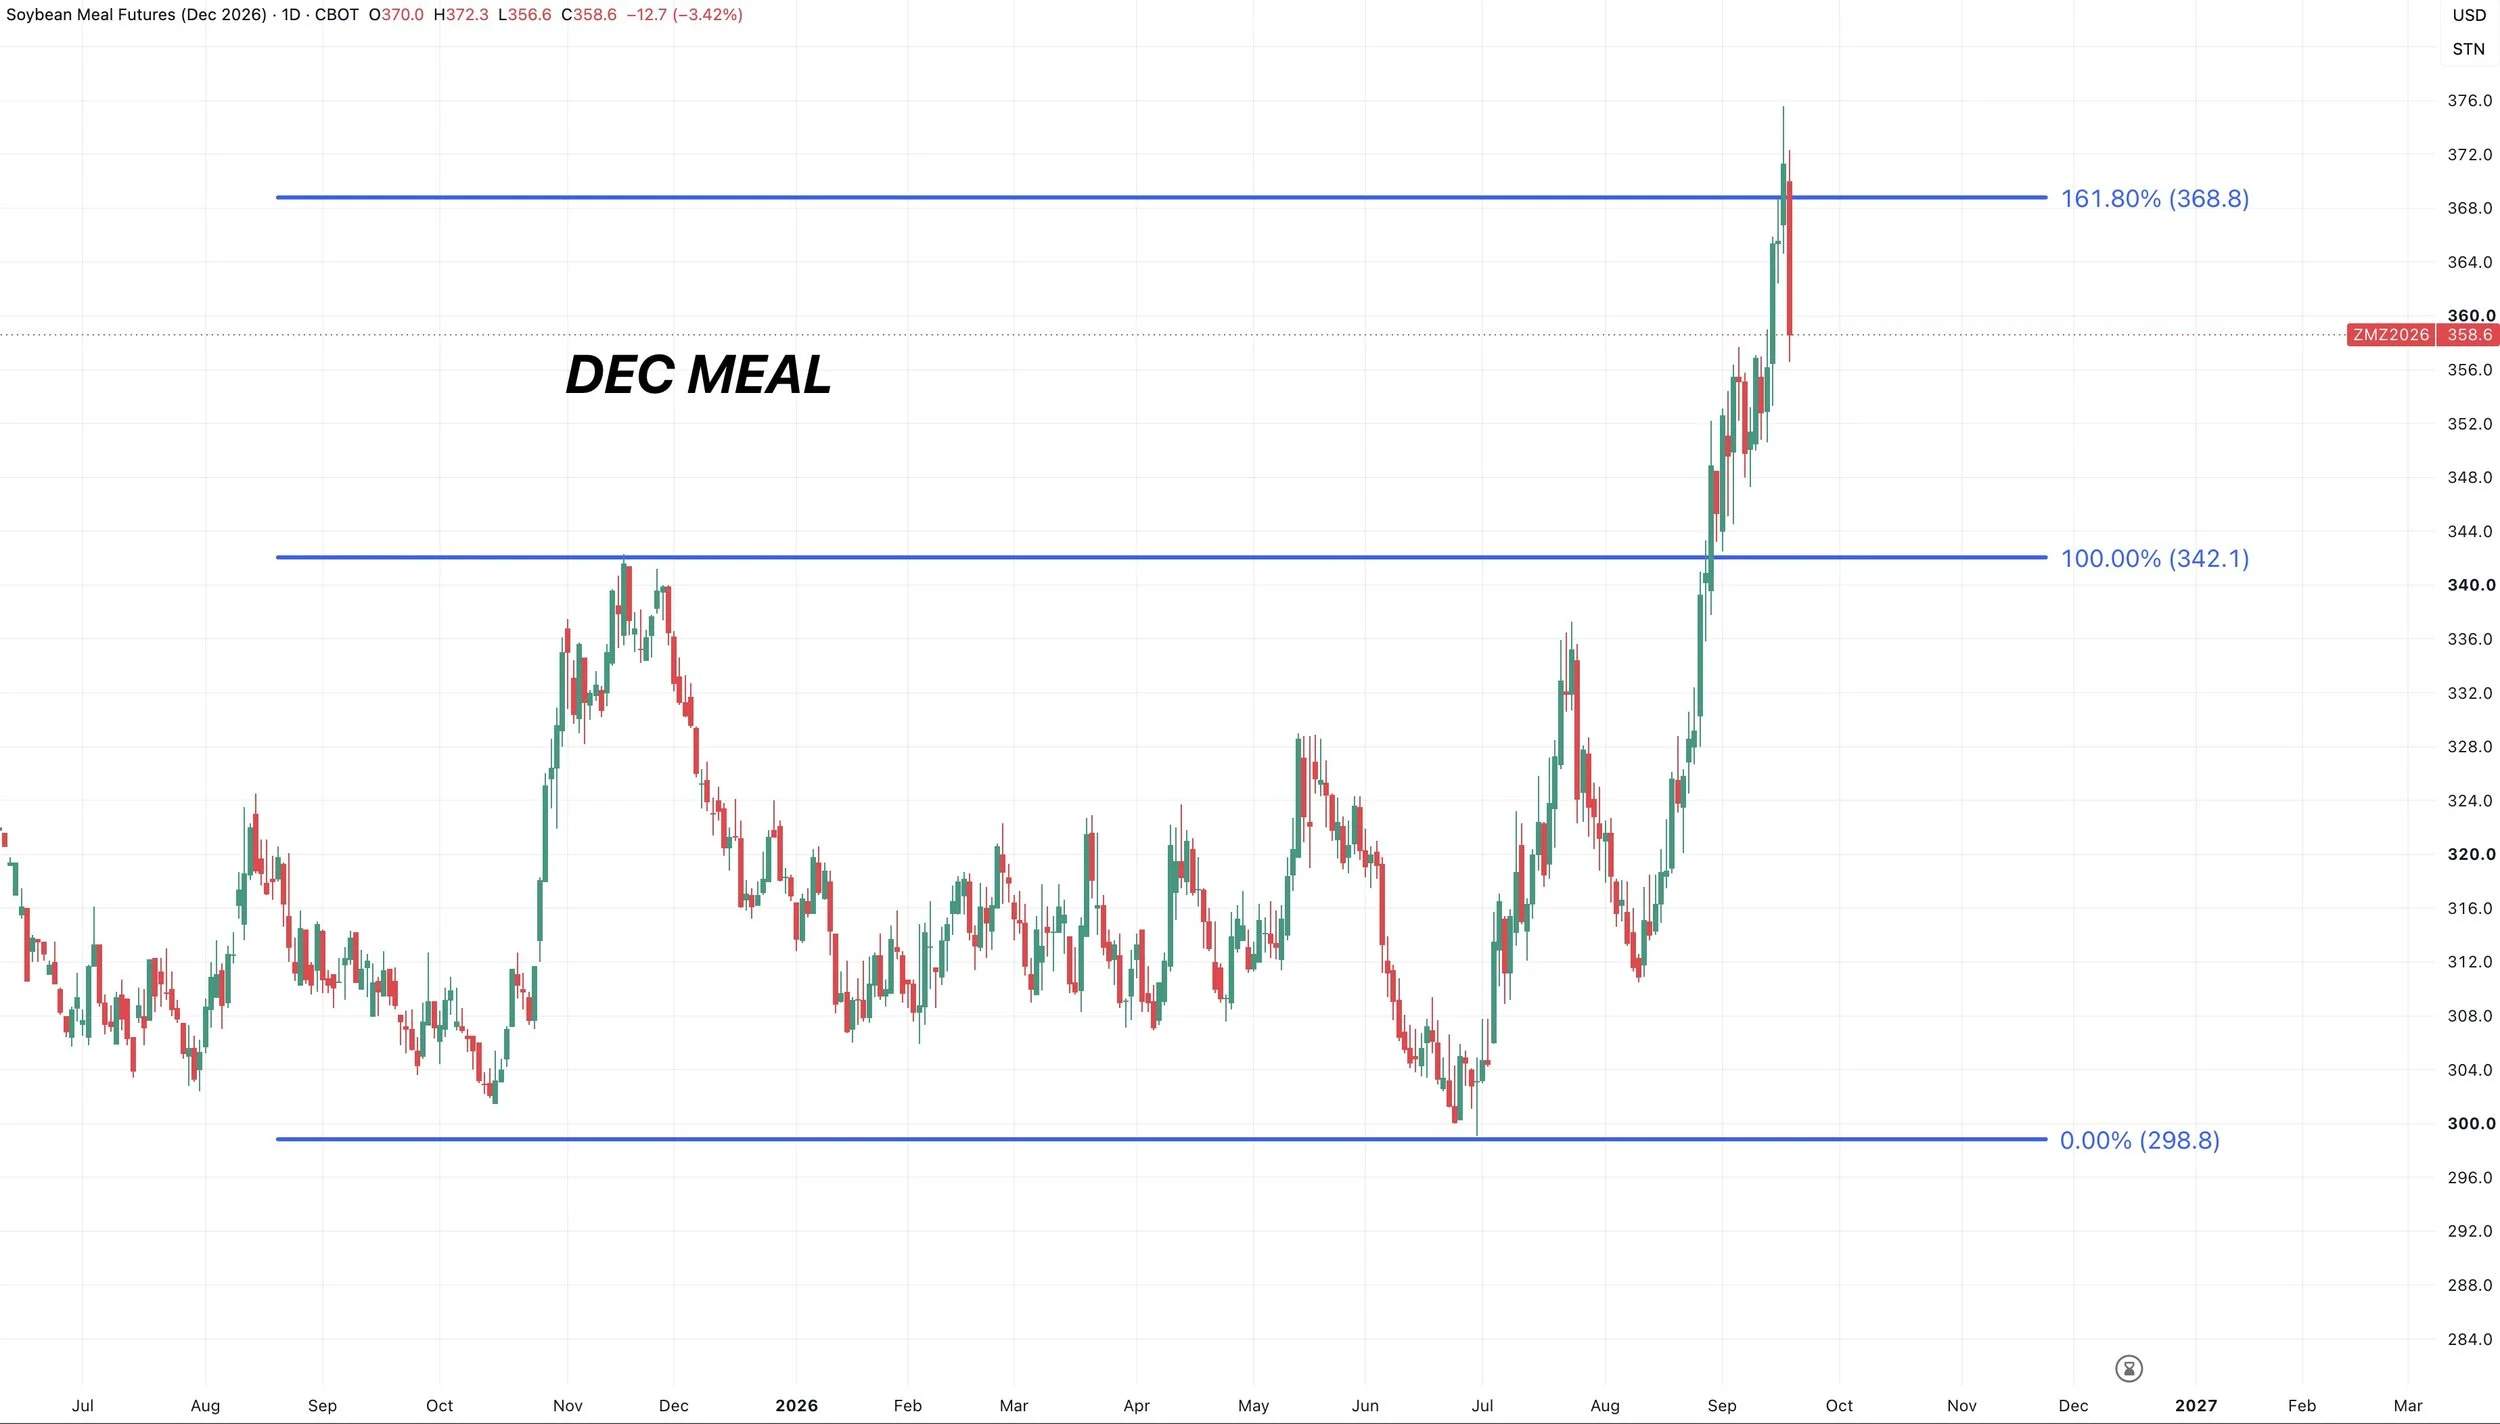
Meal also perfectly hit the golden fib (161.8% retracement) from the June lows up to the highs from last November.
A very common level for a rally to stall.
Wheat
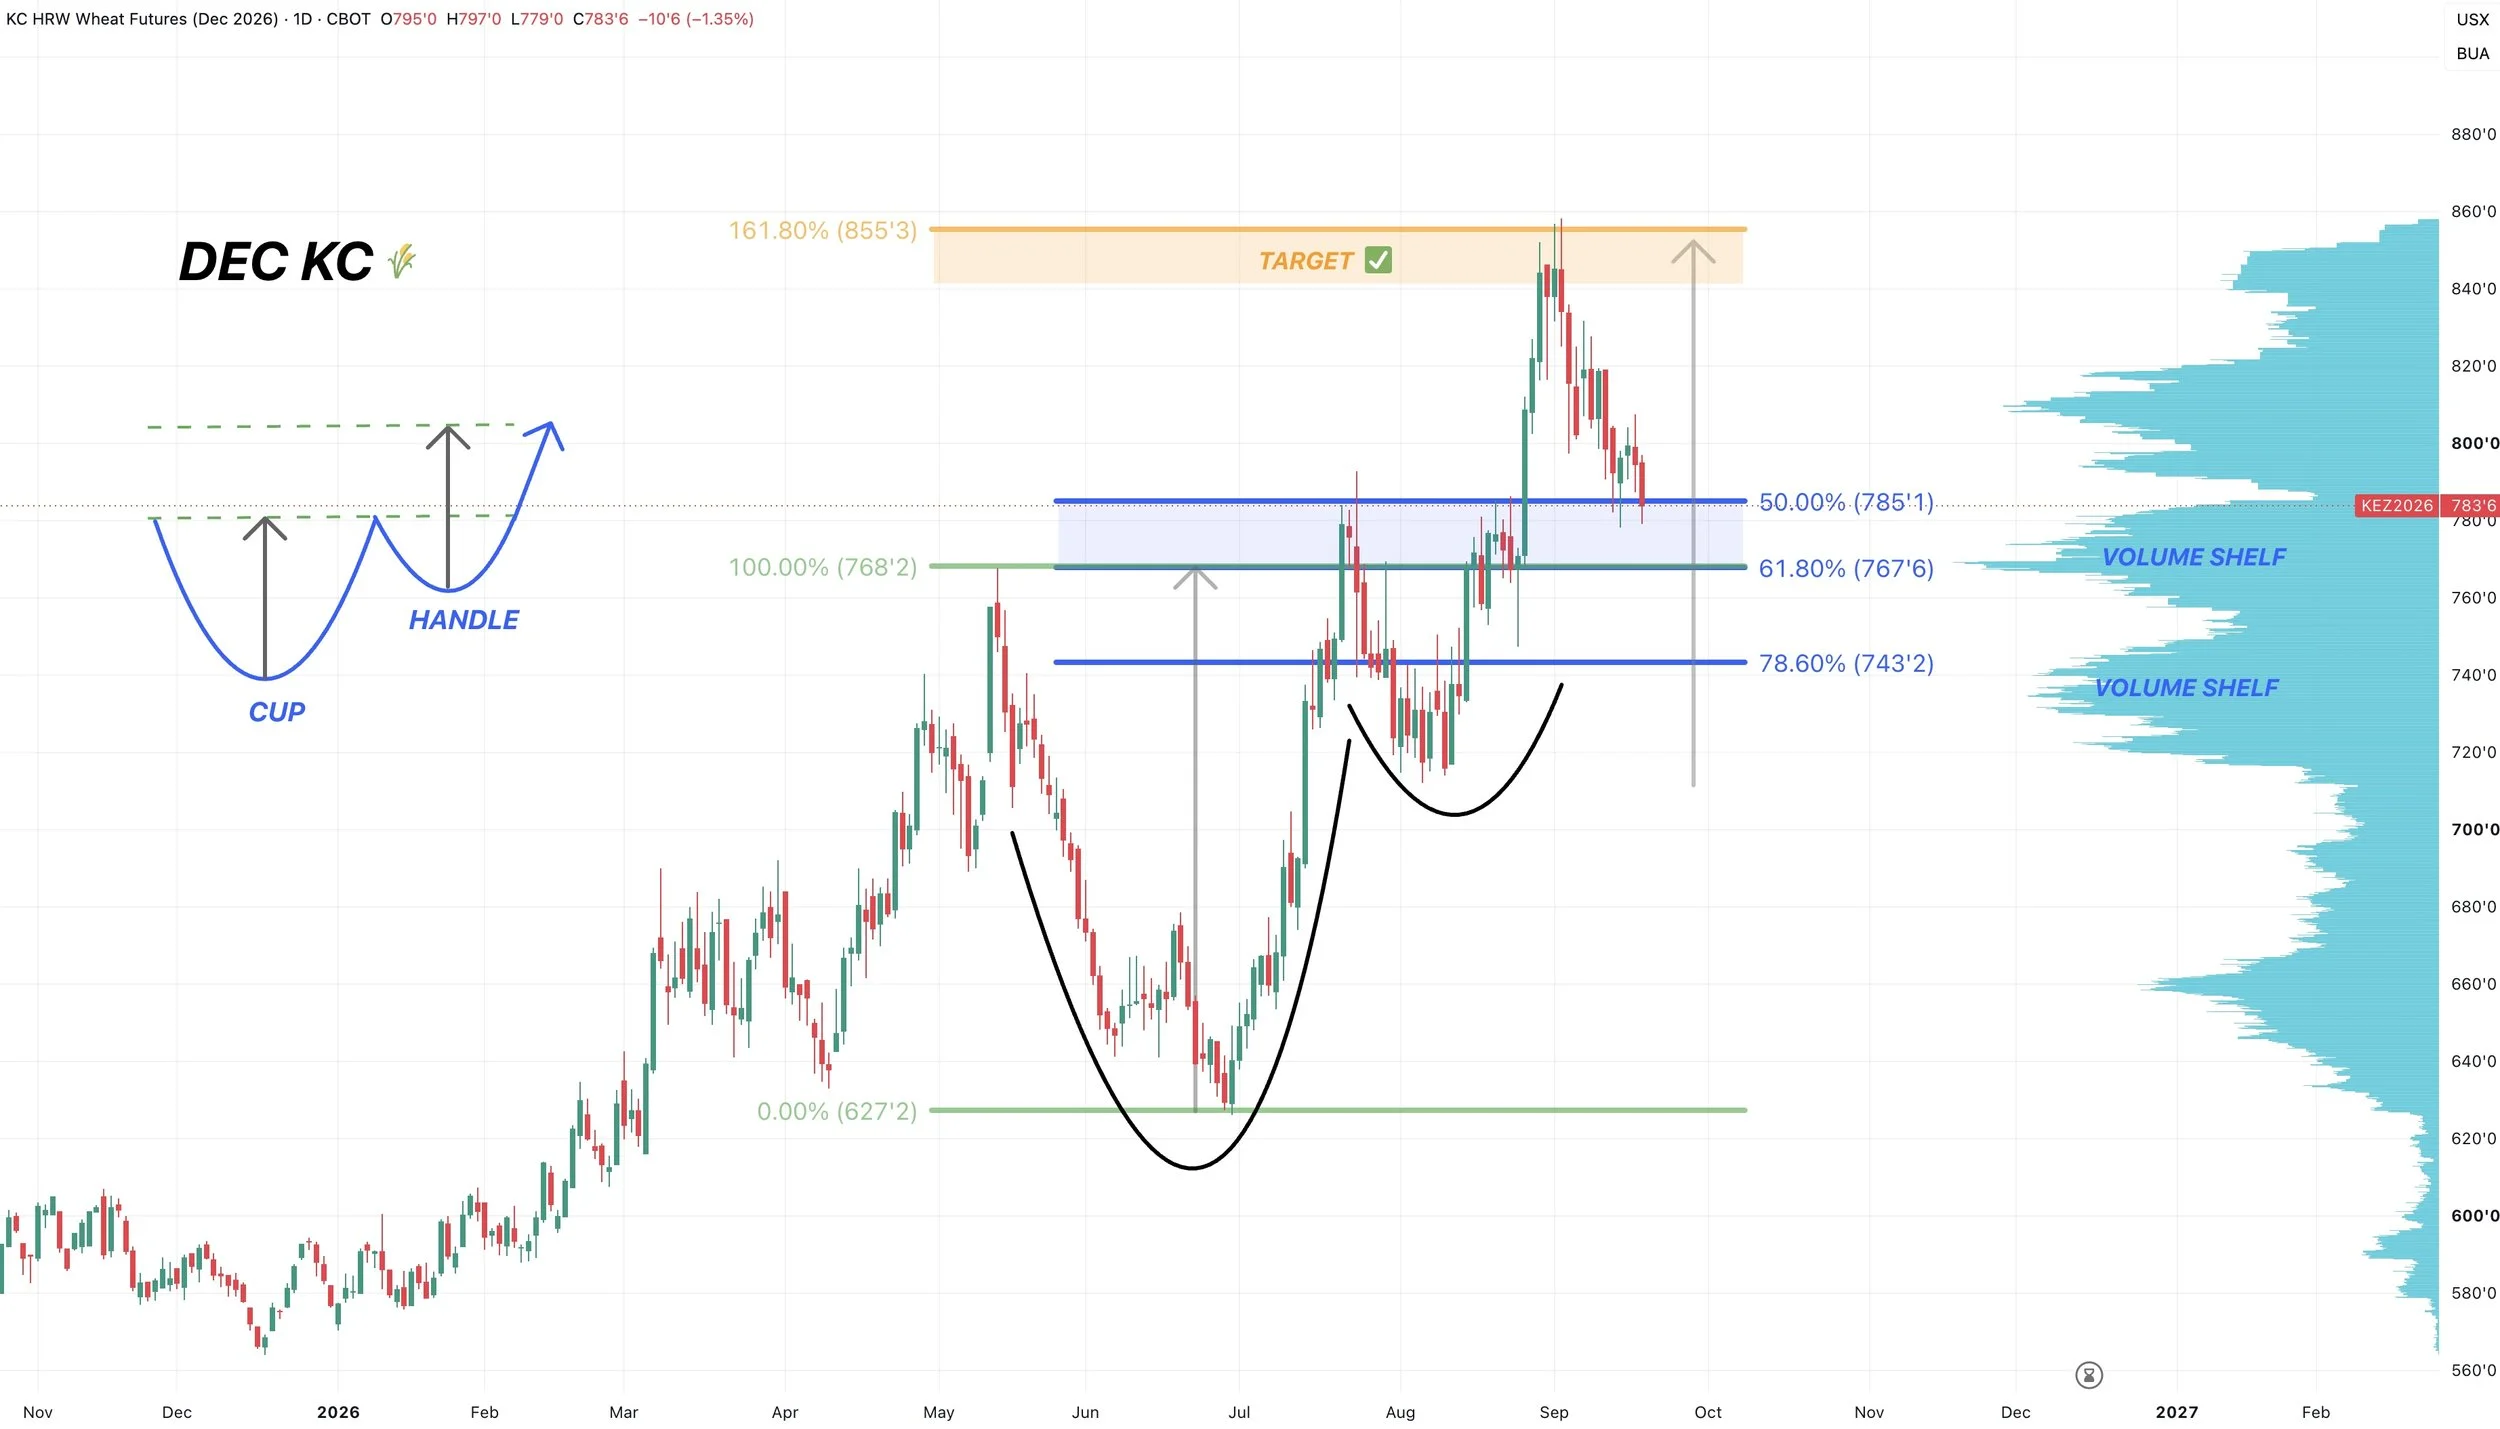
Dec KC Chart:
Still not much to update in the wheat market.
We're still grinding lower as expected following the rejection of that target and sell signal at the highs.
However we are now nearing an area where it would make sense for us to find a bottom.
Between the 50% to 61.8% retracements of the August rally.
That's going to be the most common area for a correction to end.
Not only that, but it would be a simple re-test of the old highs.
We also have a pretty massive volume shelf sitting here. Which can act as support and a magnet for prices.
I think wheat is still set up for another run and leg higher once we find some lows.
Ideally I'd like to see us hold this box. And this is where a bottom would make sense. If we break this box it does offer more downside towards the next volume shelf.
But it's a little tricky, as corn is close to breaking support, where as wheat is getting close to approaching support. And the two trade in similar fashion.
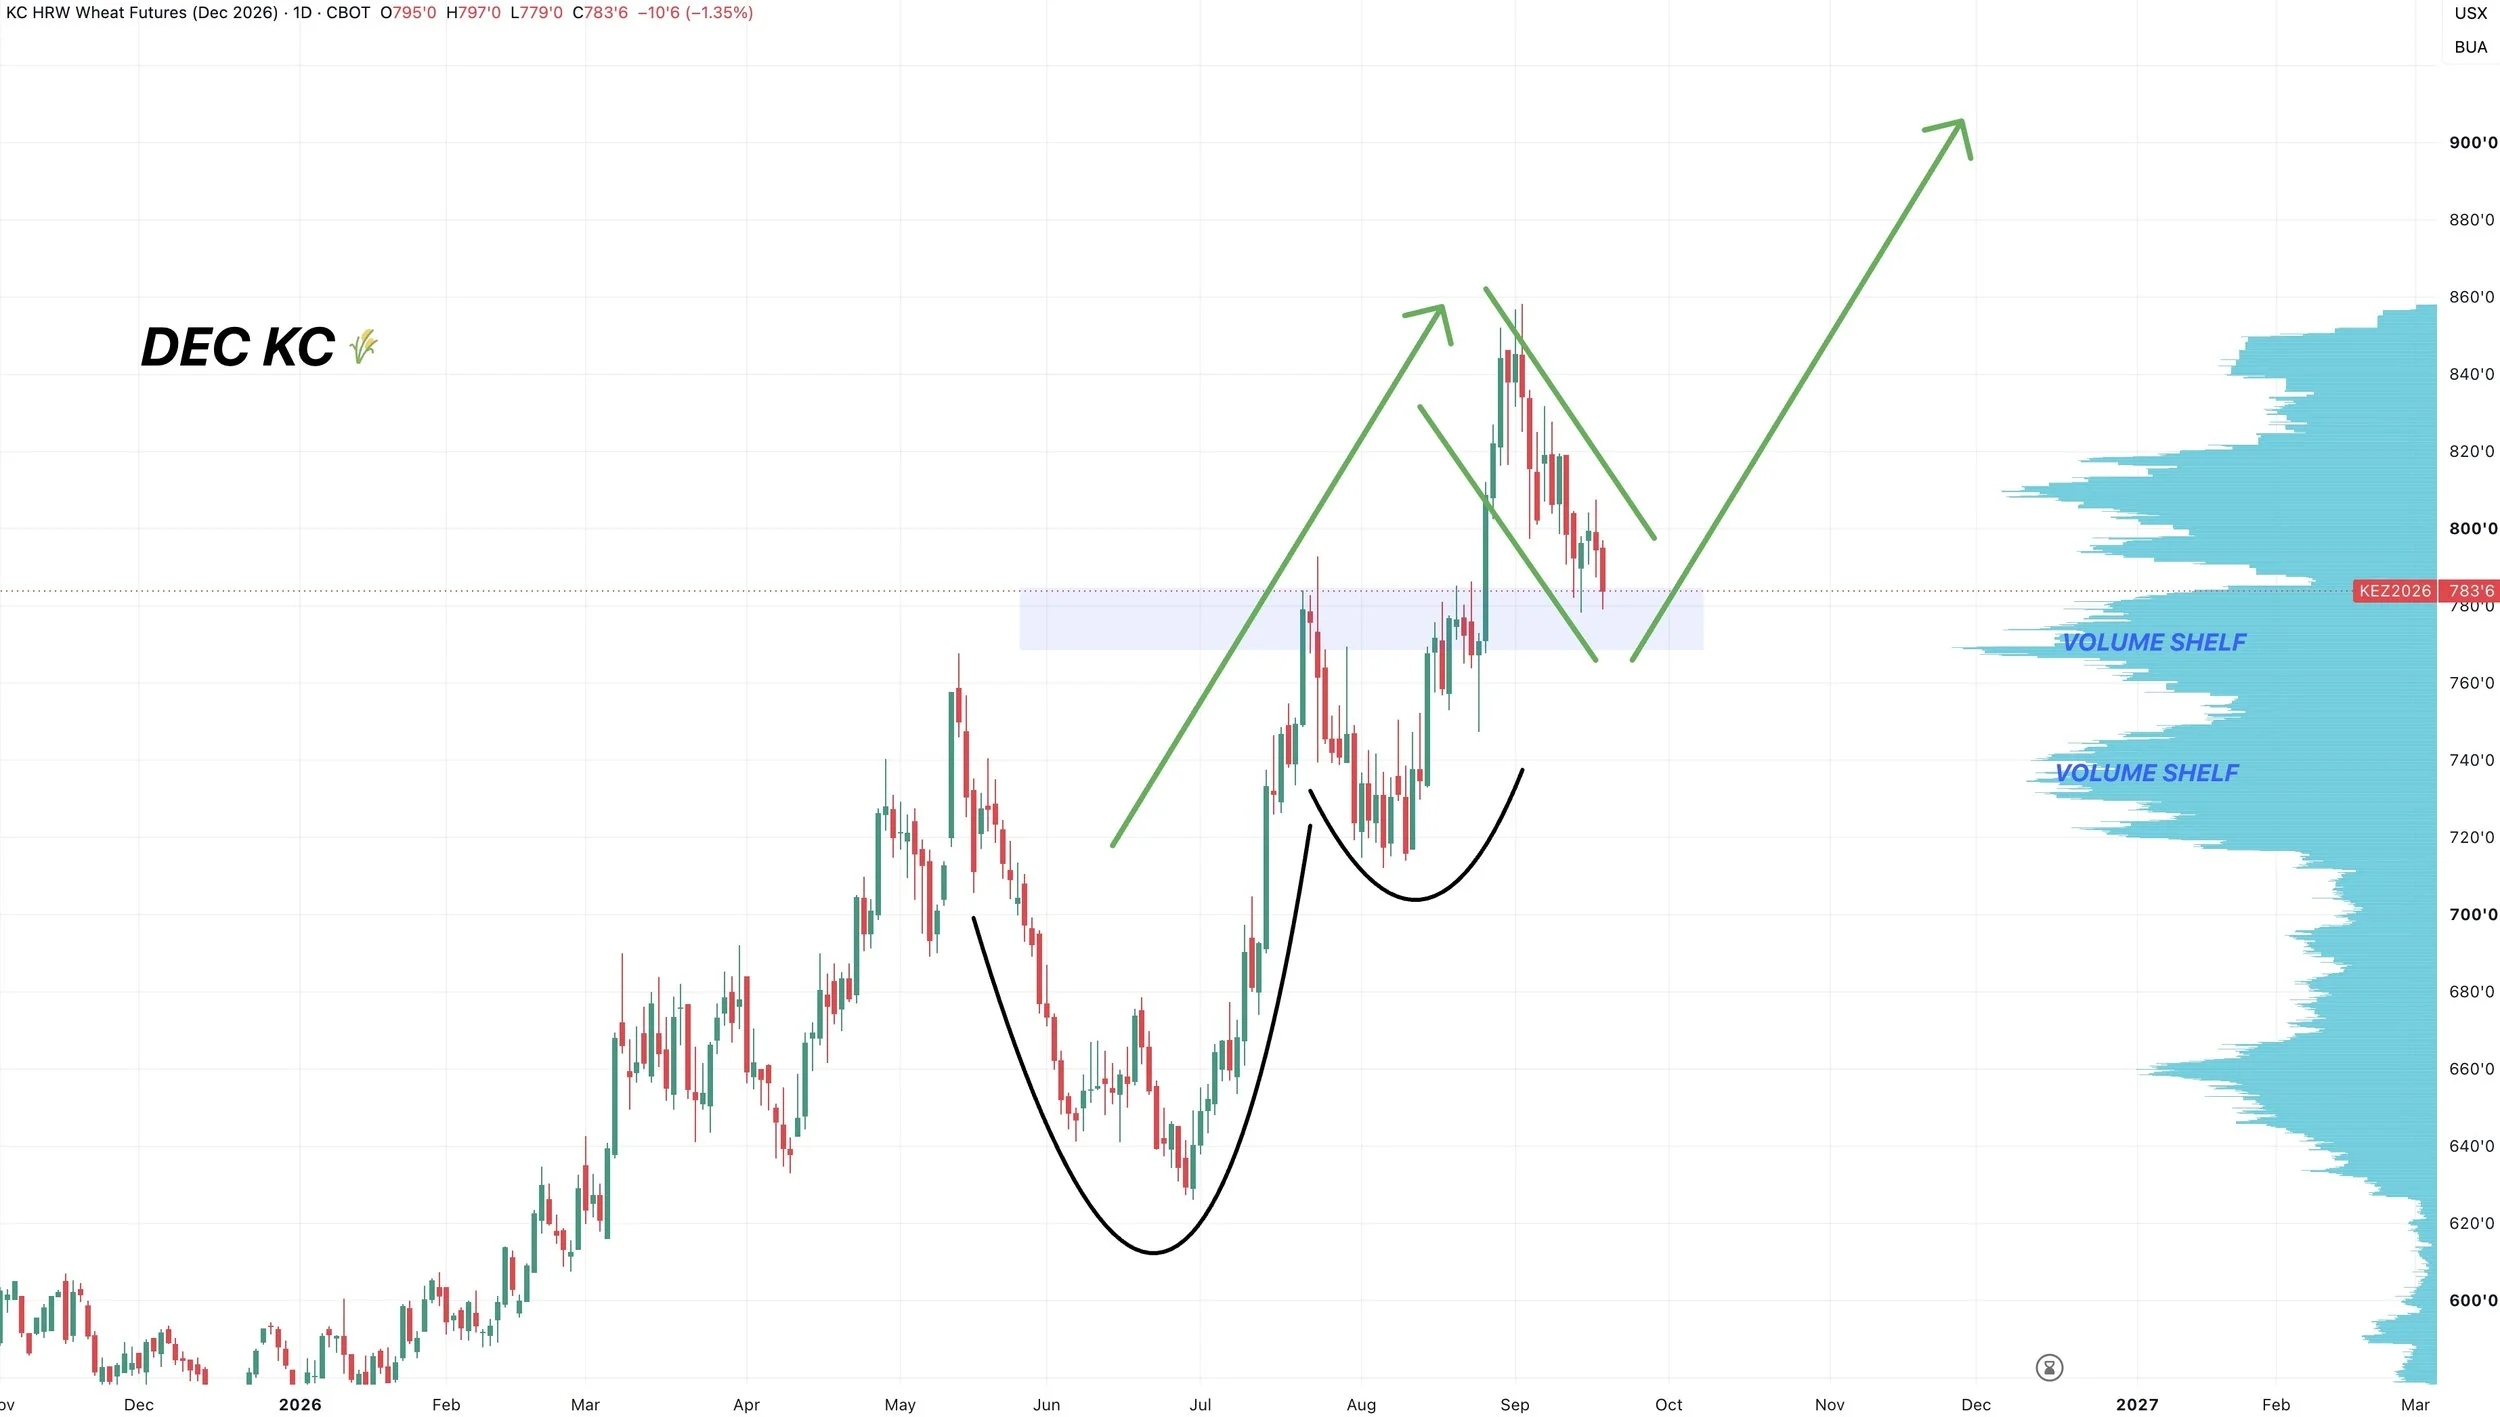
Just a Big Bull Flag?:
As long as we hold this golden zone, we do have somewhat of a longer term bull flag going on here.
The implied move would take you into that $9.00 or so range.
I'll have an exact updated target once I think the bottom is in.
Monthly Chart:
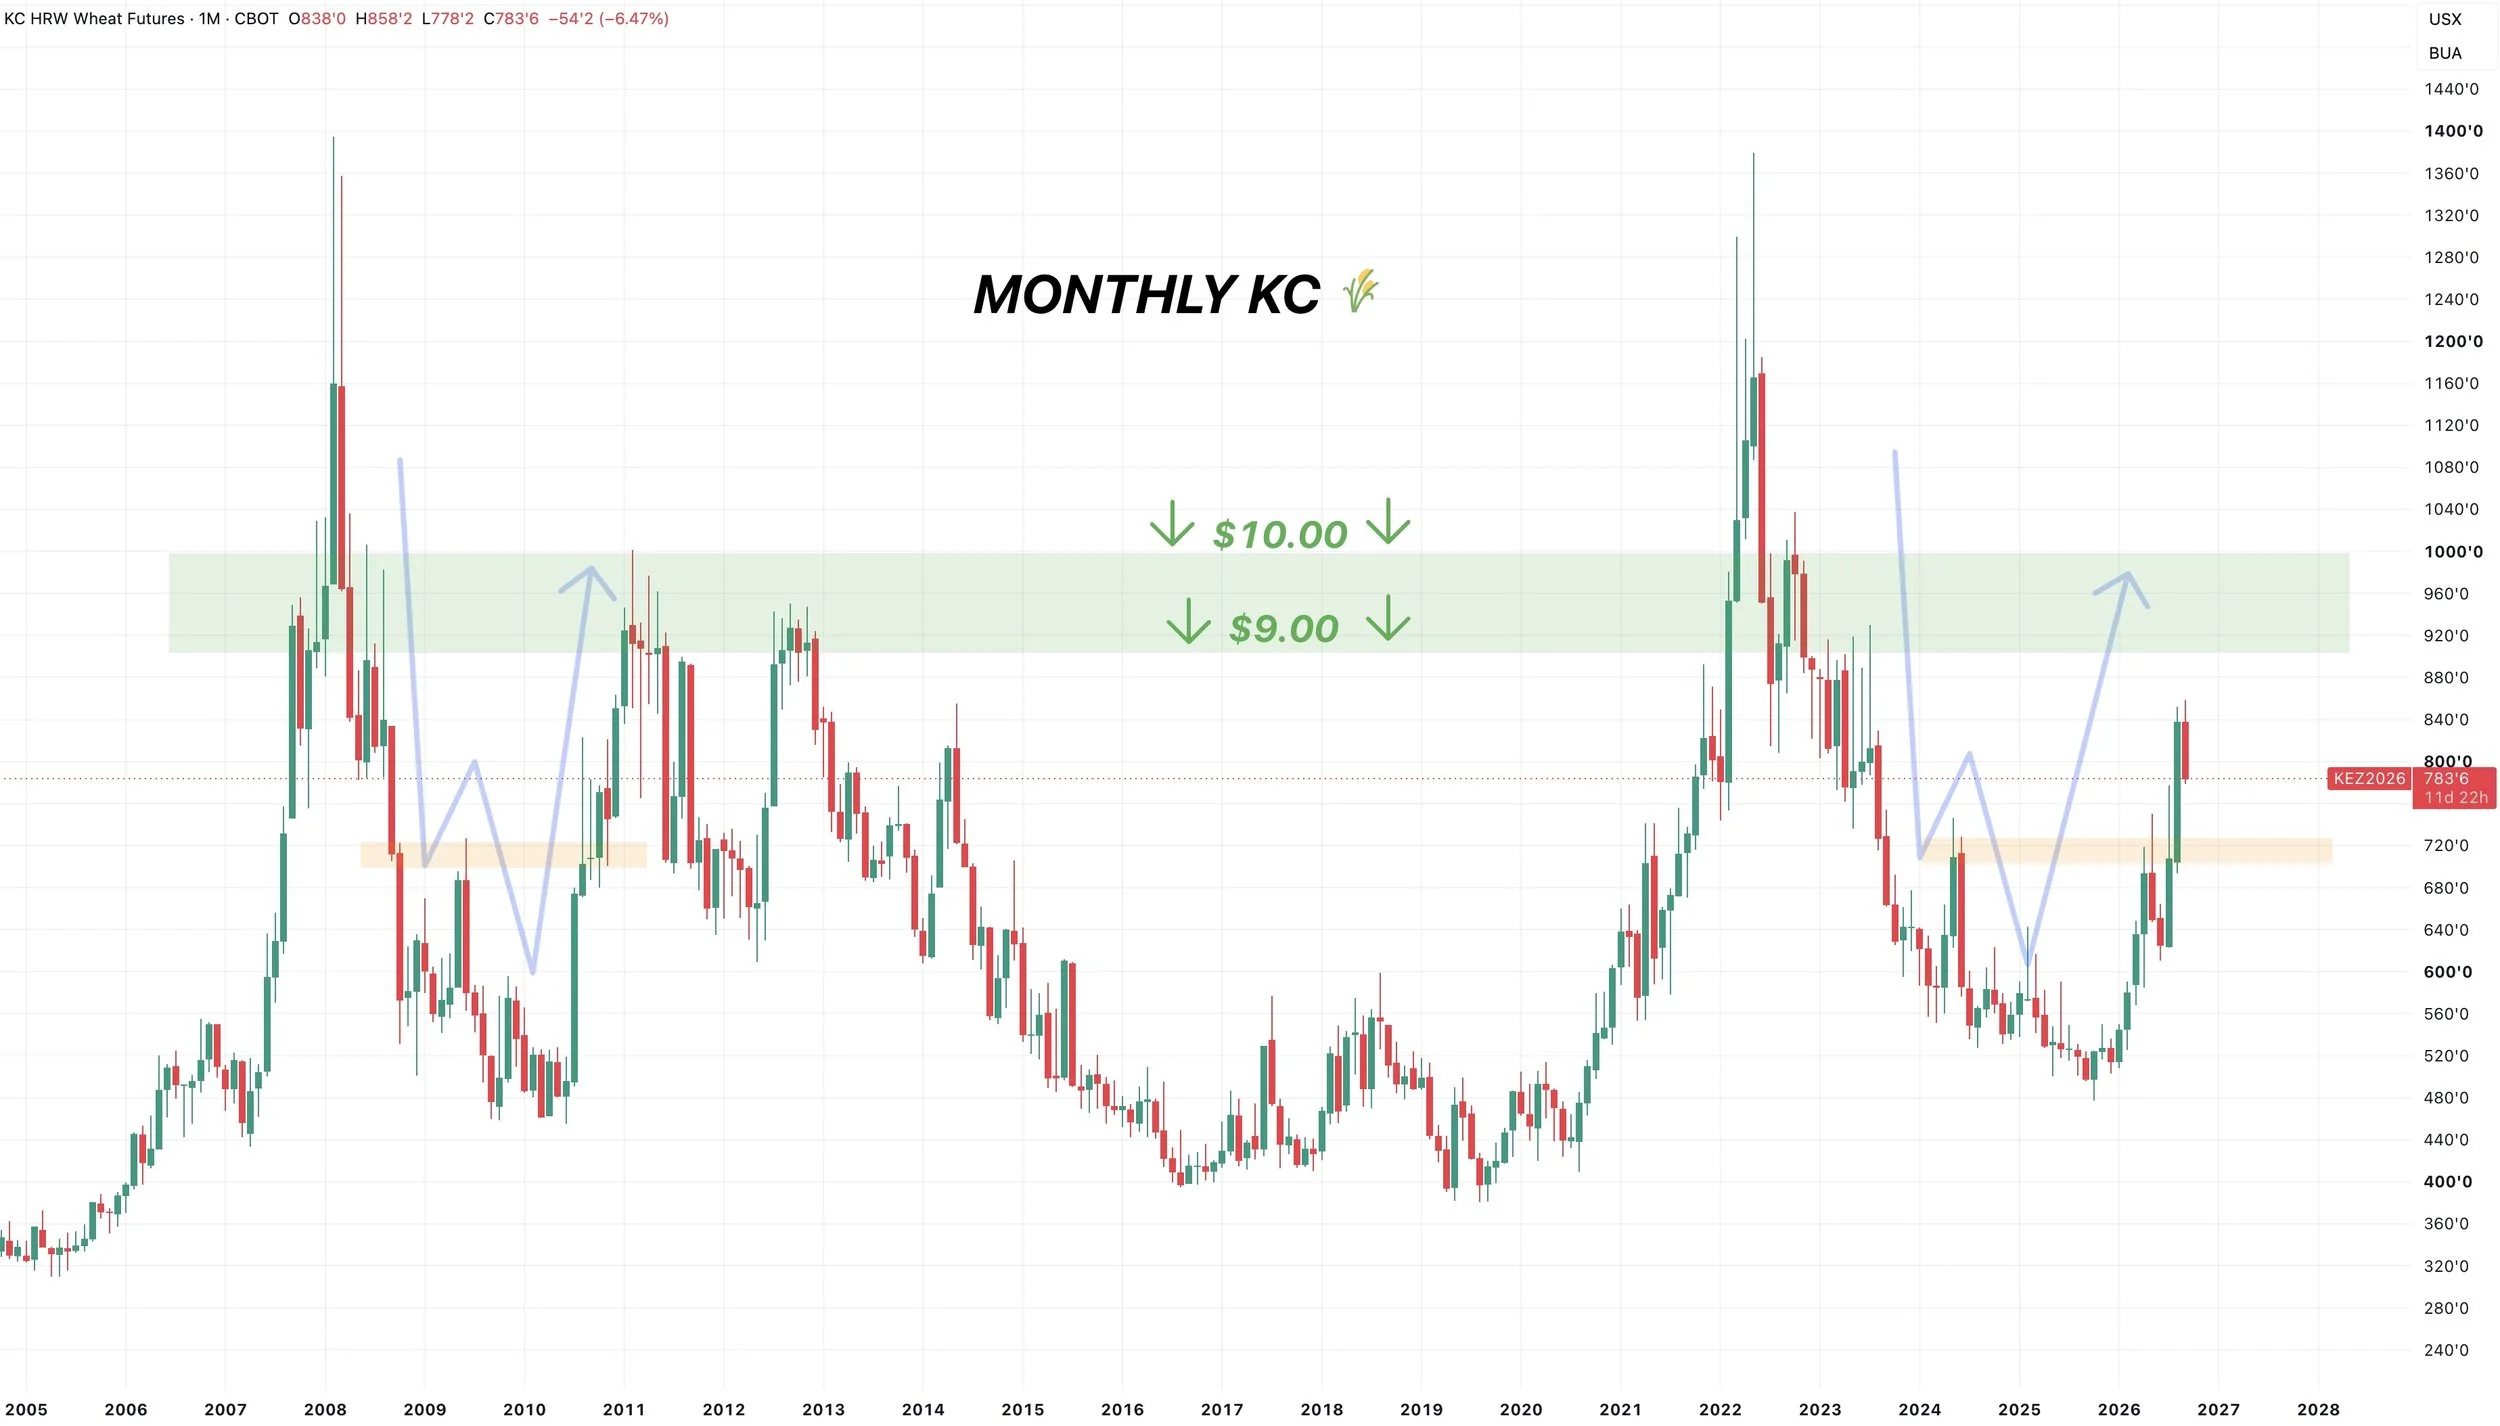
I've said this a hundred times at this point, but every bull market in wheat has to led to at least $9.00
$9.00 to $10.00 is the big picture resistance.
As we've only been above $10.00 a handful of months ever.
This rally still looks awfully similar to that of 2011.
Corn + Beans + Wheat
Monthly Chart:
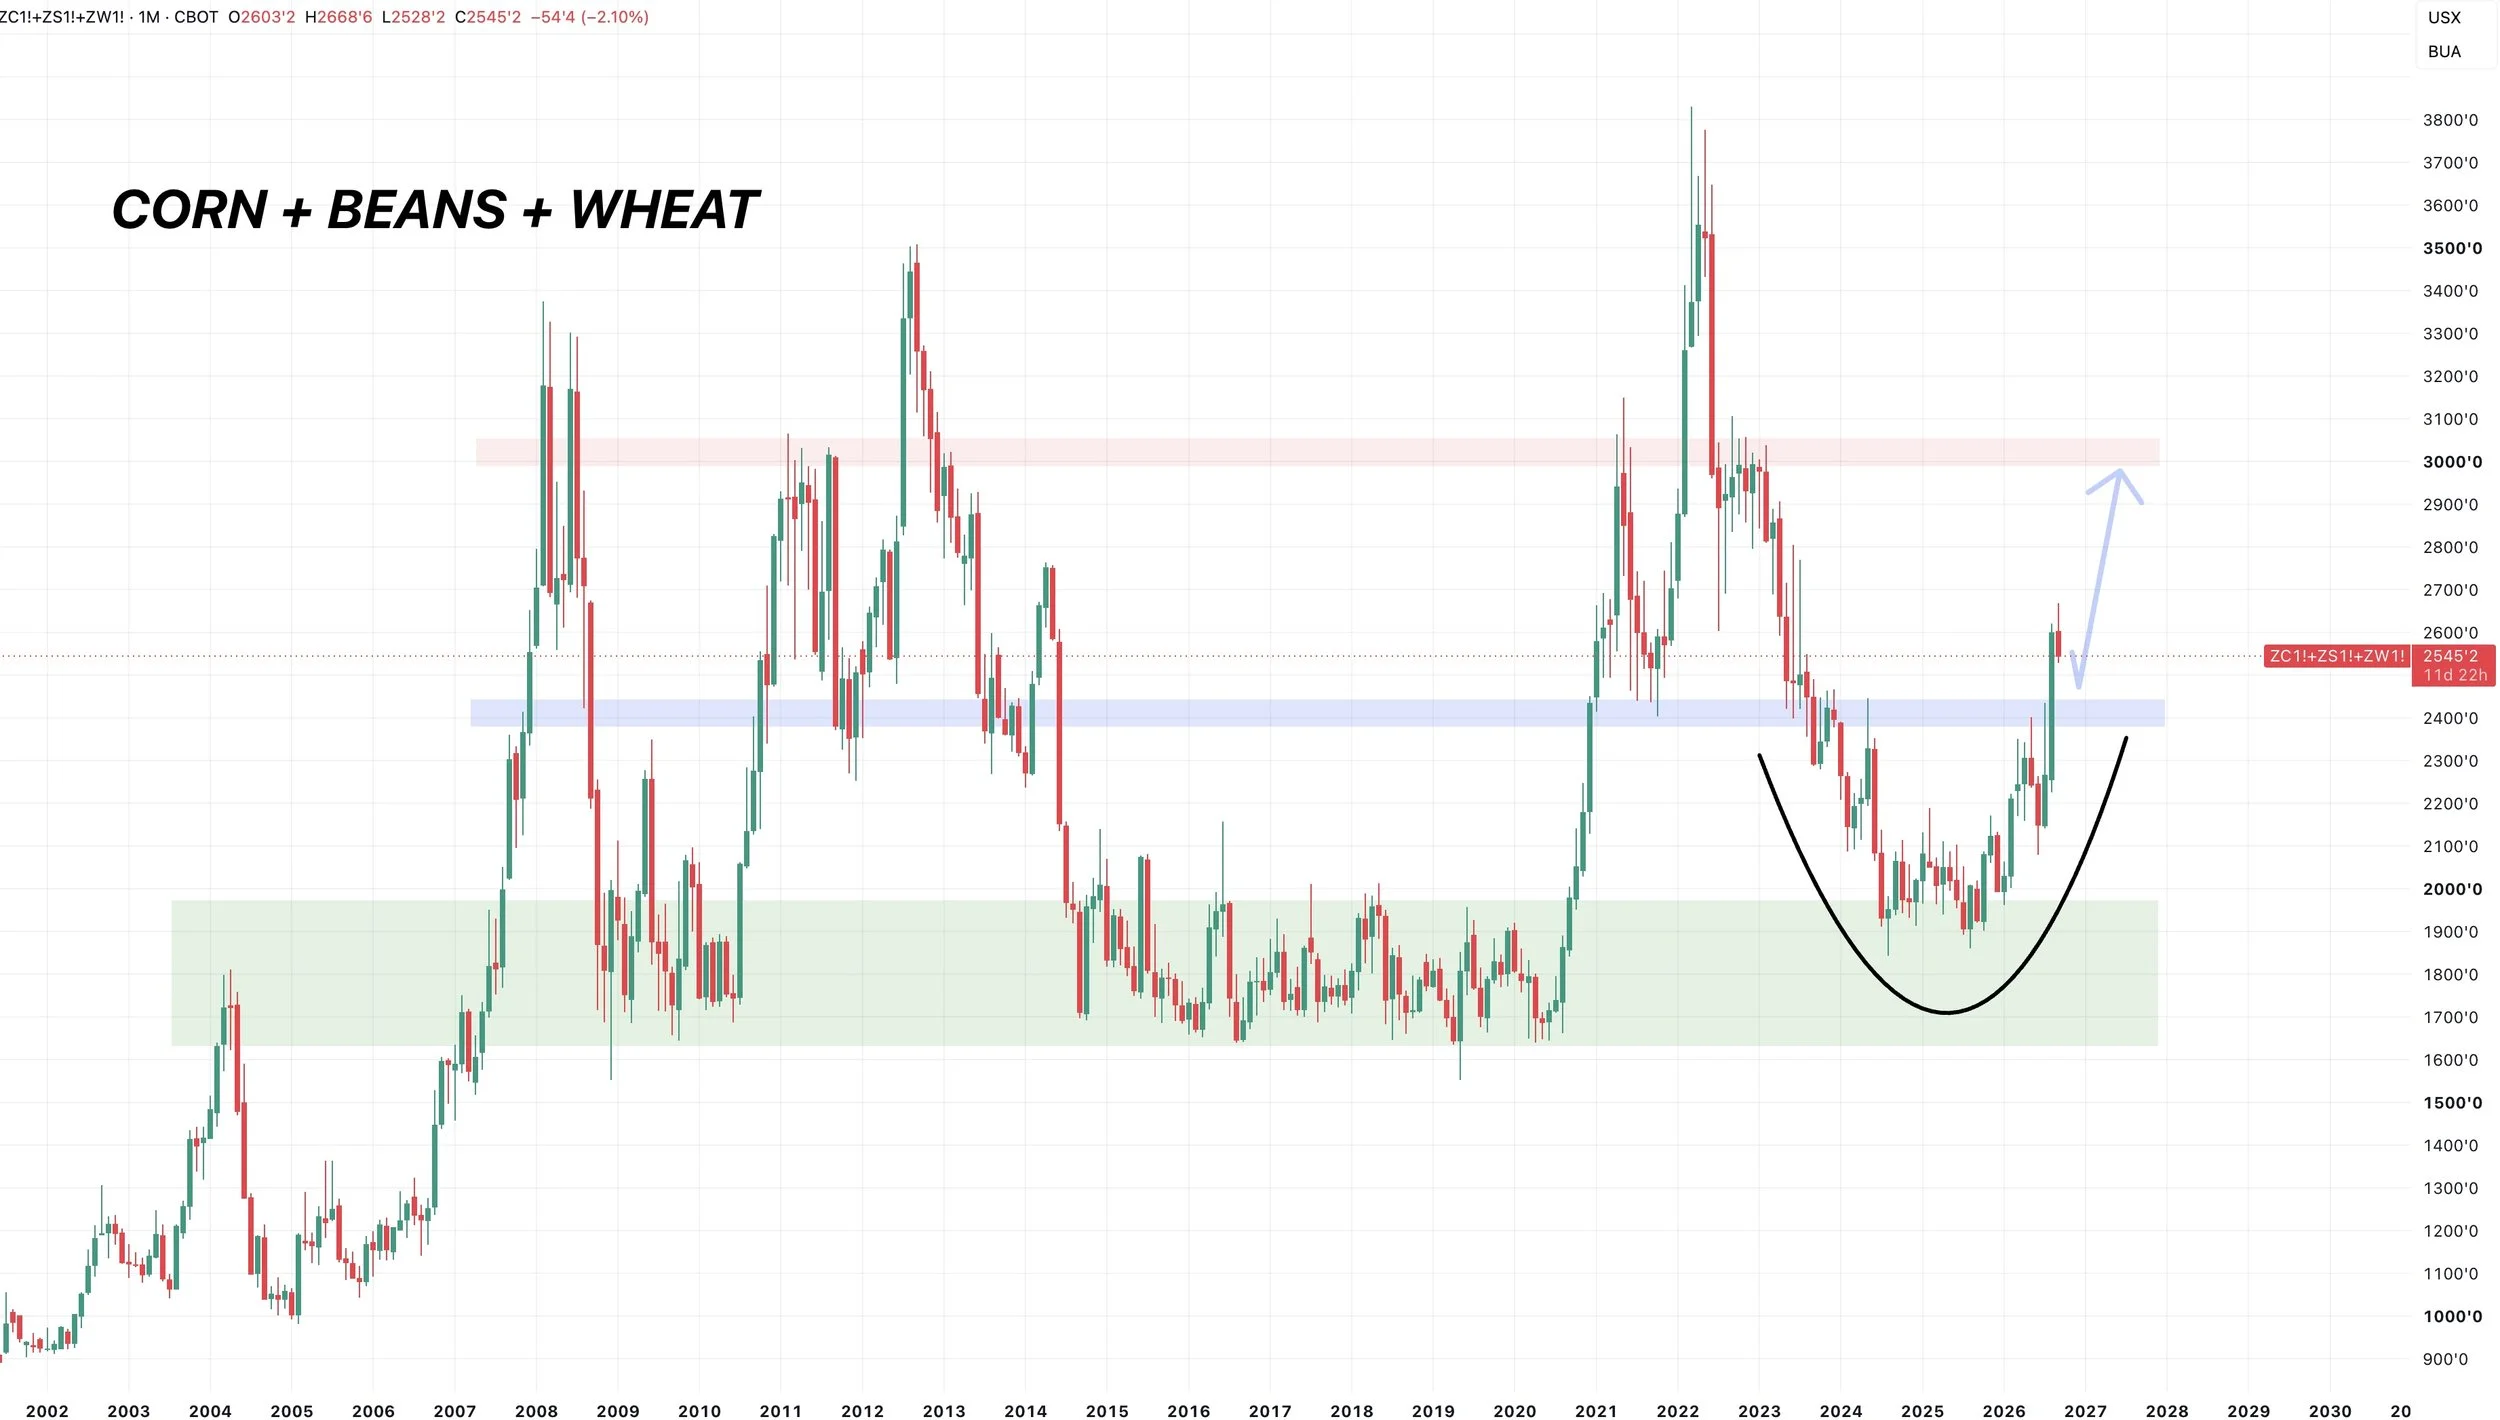
I've shown this before, but it is a big reason why I think grains have a ton of upside down the road.
Here is corn, soybeans, and wheat combined.
This chart does not look bearish at all.
We got a massive breakout.
I think this leads to more upside long term. As this chart has plenty of room to run.
Cattle
COF Report:
The report came out after close.
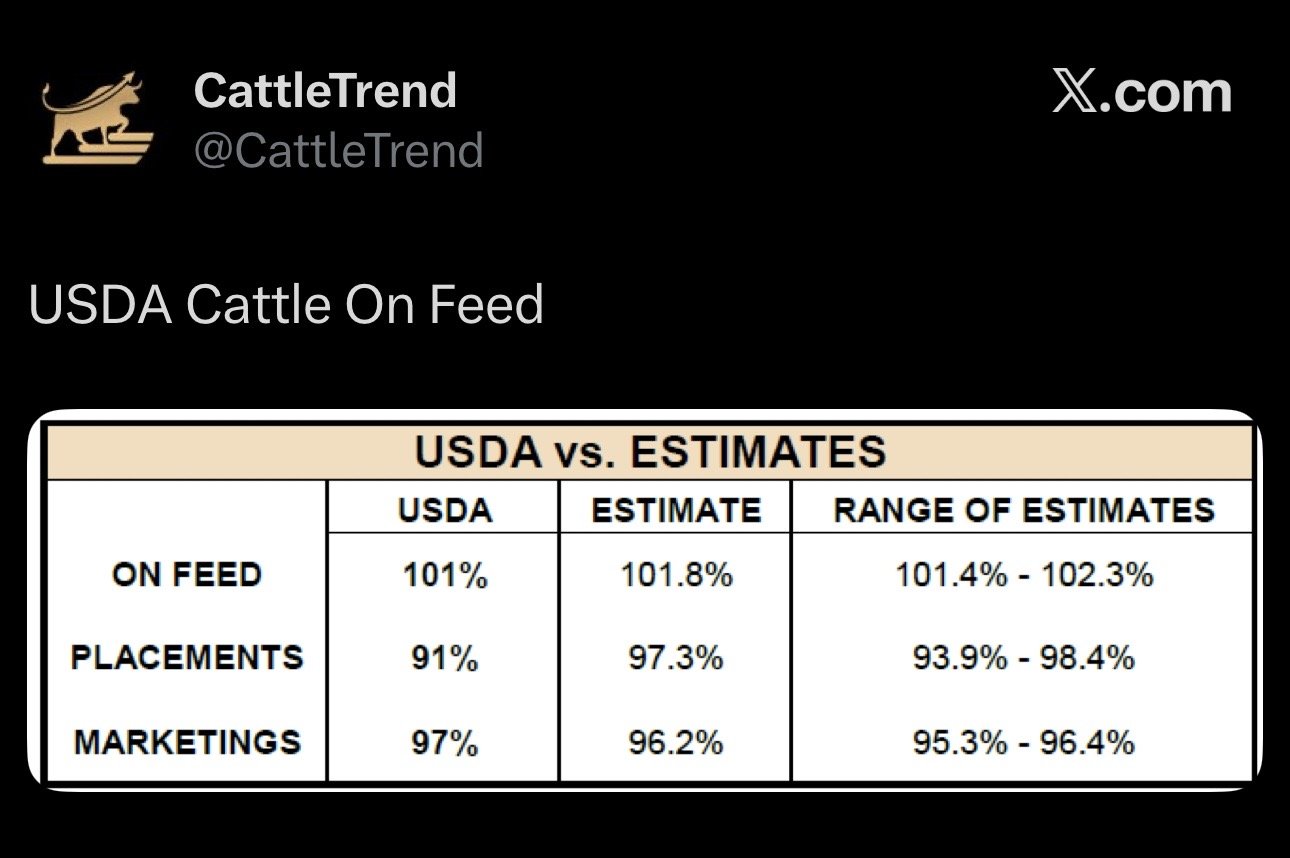
On Feed was 101 (Guess was 101.8)
Placements were 91 (Guess was 97.3)
Marketing was 97 (Guess was 96.2)
So the report was pretty friendly, with placements well below the guess.
That placement number would be the lowest of all-time since they began this data back in 1996.
Oct Live Chart:
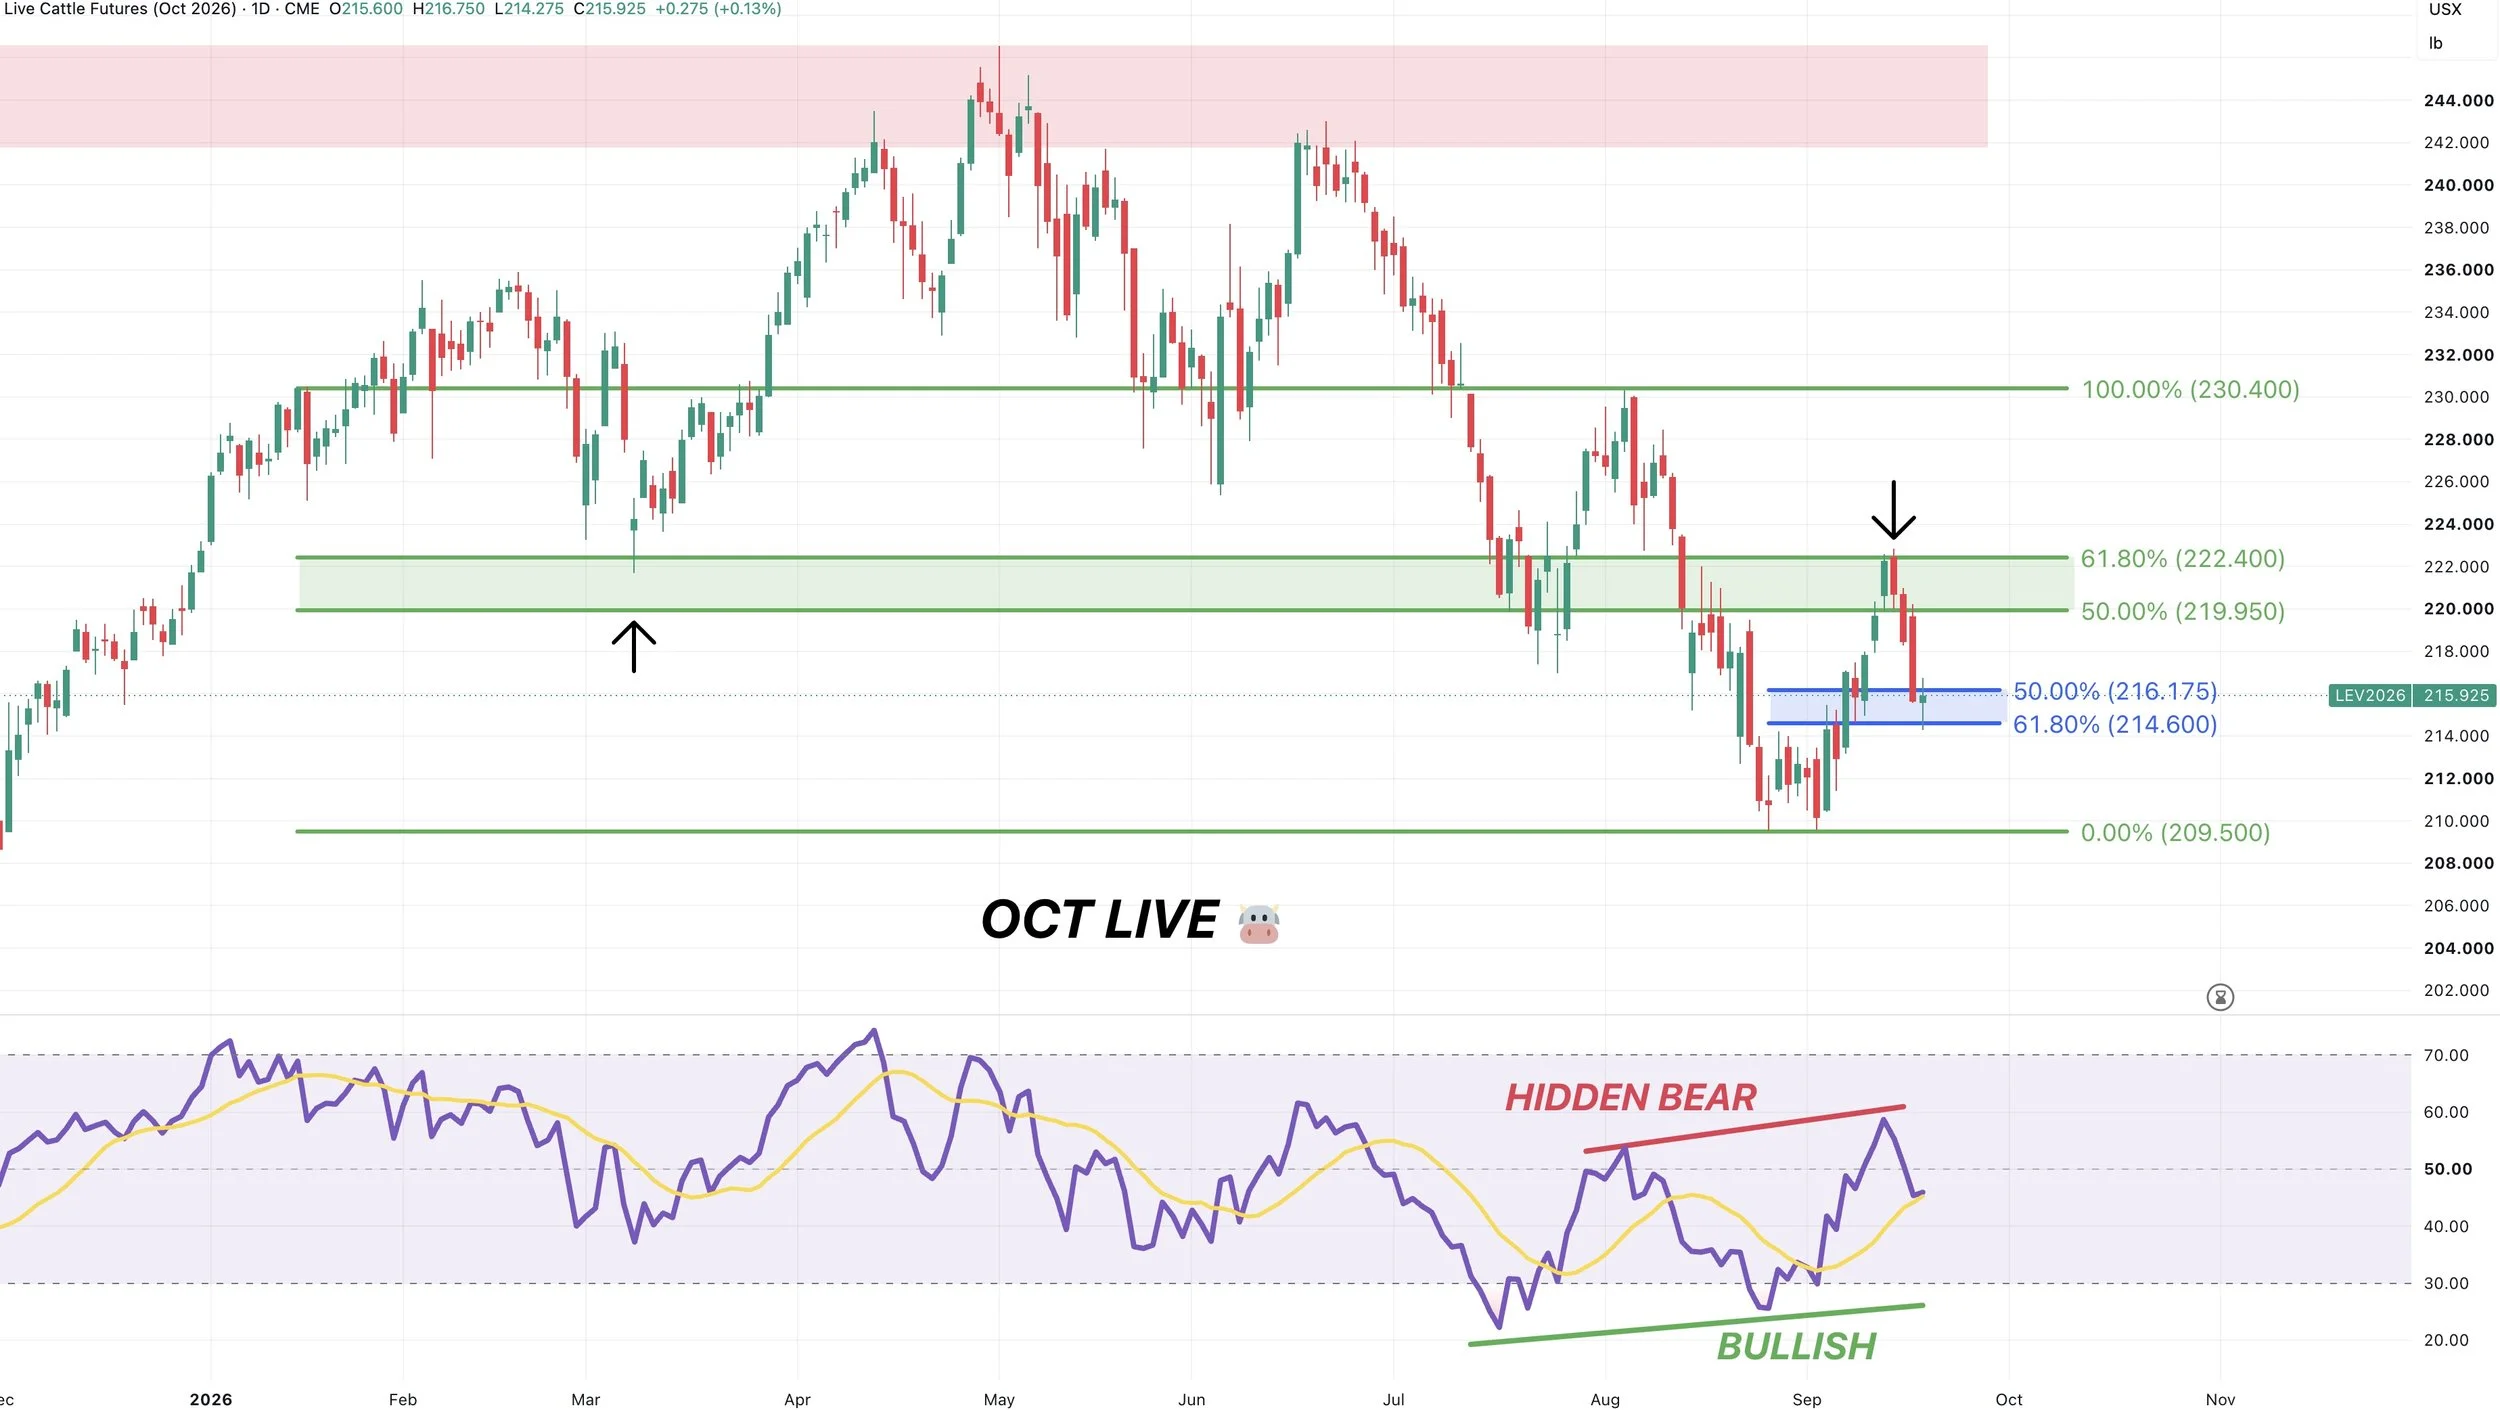
We rejected off that golden zone we talked about last week, along with the hidden bearish divergence.
We now came down right into that support box, where bulls would like to see us bounce.
As we've now given back 61.8% of the rally and so far found life there.
That's going to be the line in the sand to tell us if this is a simple pullback before higher or not.
If we are going to bounce, it needs to be here or we likely test the lows.
If we can break above those recent highs it opens up further upside.
Oct Feeders Chart:
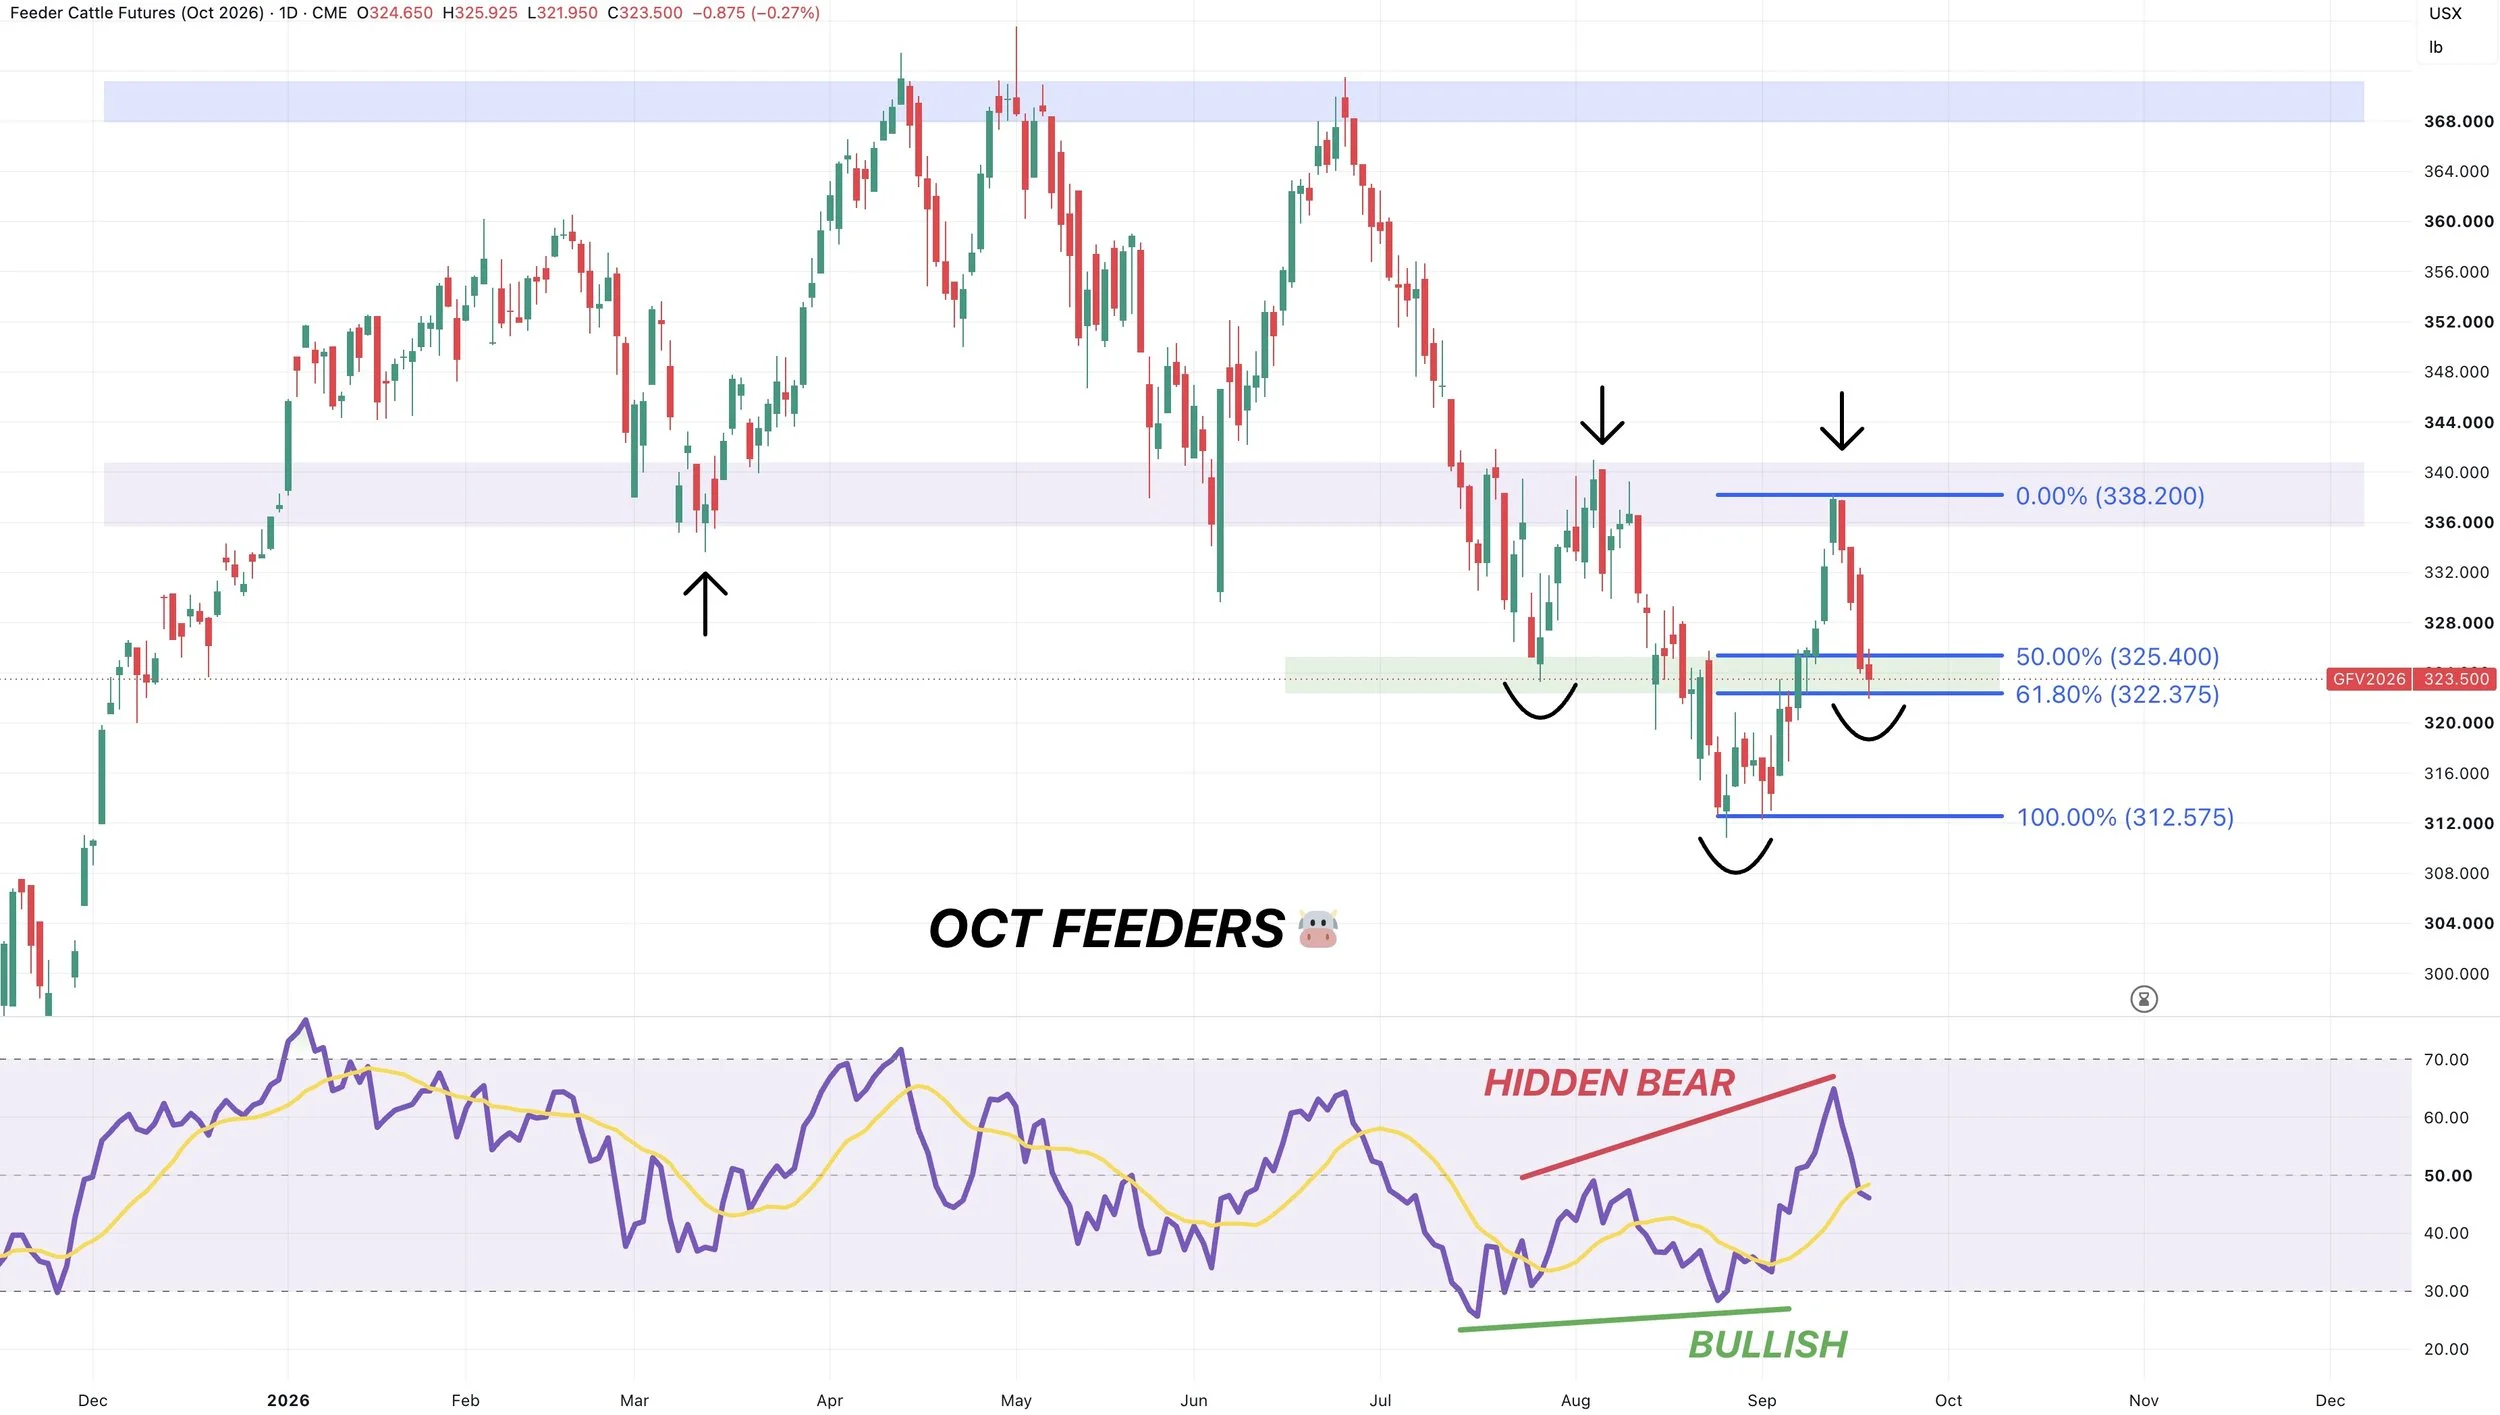
Same exact thing here.
We rejected that resistance we had been talking about.
Now we pulled back right into that golden zone box we want to see us hold.
If you are able to break above the recent highs, it's going to offer more upside.
If we are able to hold here and break above the recent highs, this would also look like a potential head and shoulders bottom. So that's something I am watching as well.
Want to Talk?
Our phones are open 24/7 for you guys if you ever need anything or want to discuss your operation.
Jeremey & Office: (806)484-1214
Sebastian: (605)280-1186
Email: sfrost@dailymarketminute.com
Hedge Account
Interested in a hedge account? Use the link below to set up an account or give us a call.