
HOW BIG IS JUNE 30TH REPORT?
MARKET UPDATE
You can scroll to read the usual update as well. As the written version is the exact same as the video.
Timestamps for video:
Overview: 0:00min
Corn: 3:00min
Beans: 10:55min
Wheat: 14:45min
Cattle: 15:50min
Want to talk?
Office: (806)484-1214
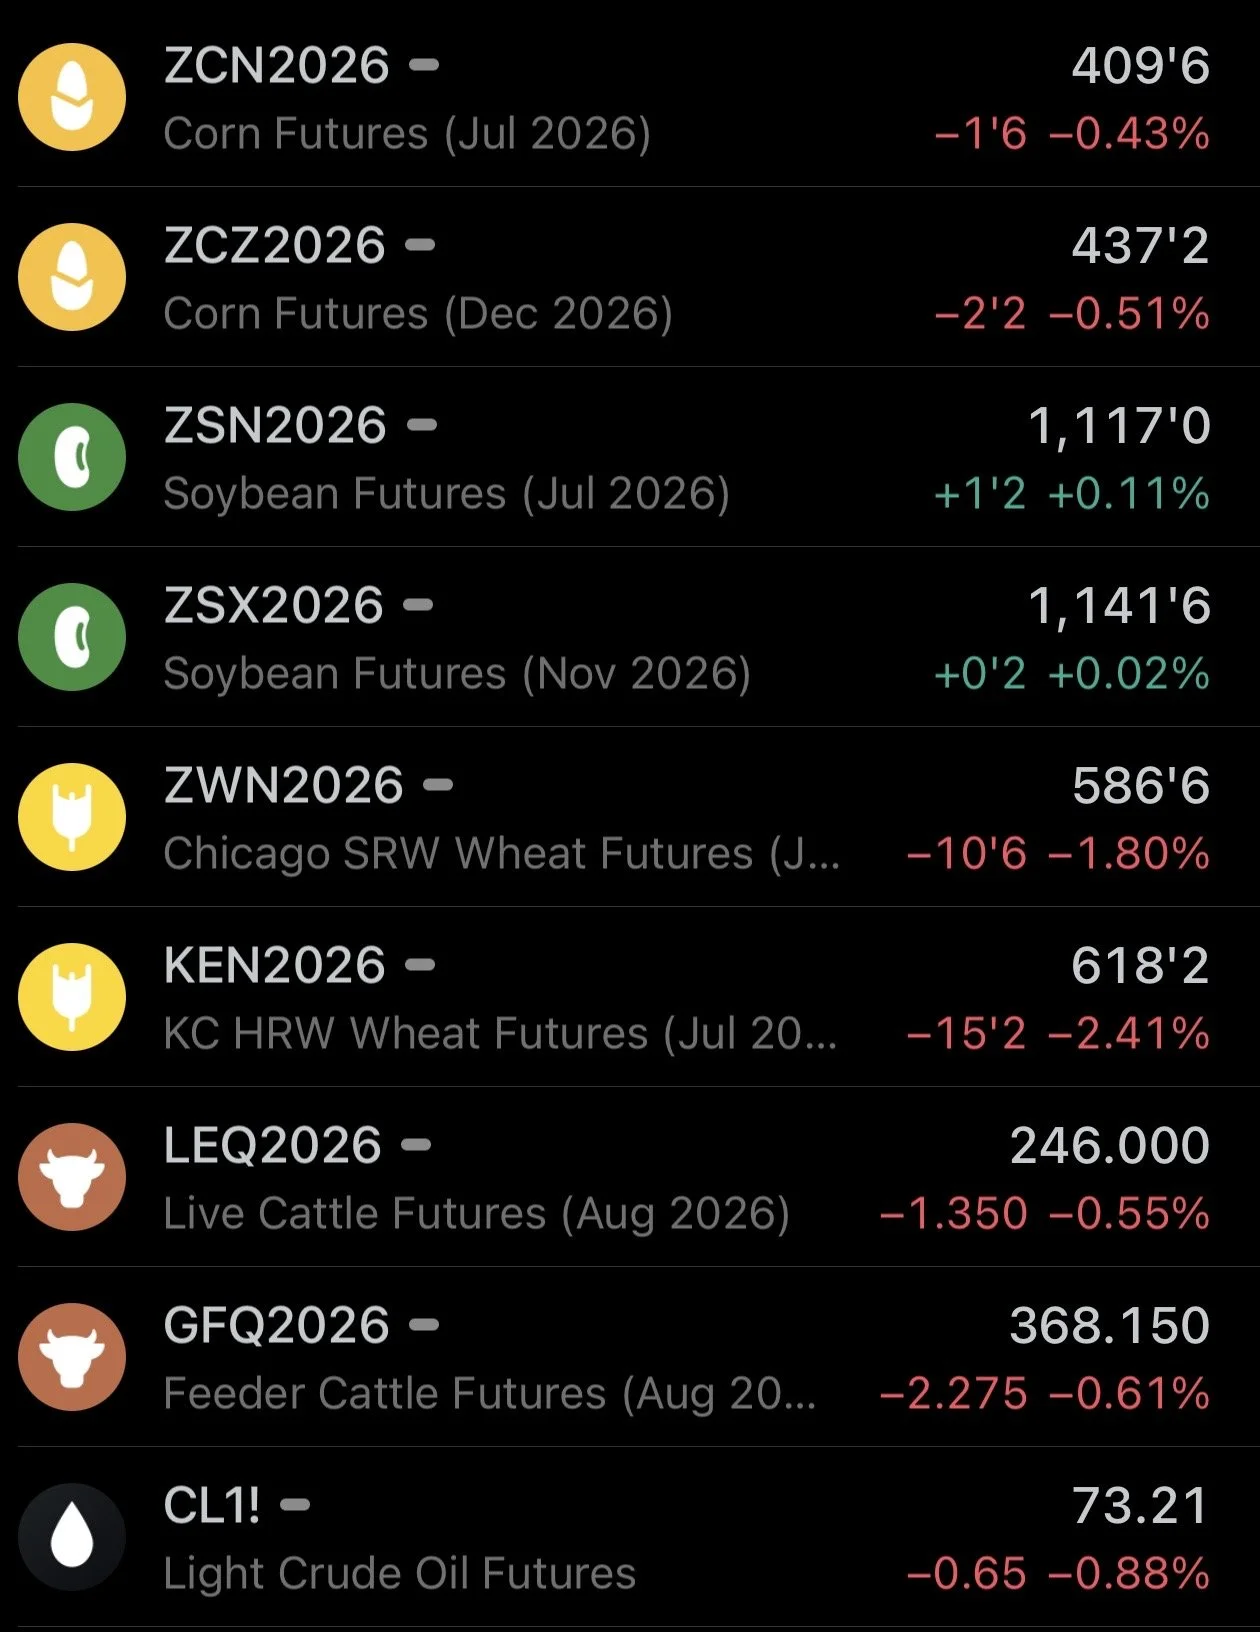
Futures Prices Close
Overview
Grains and cattle mostly lower across the board as grains struggle to find a catalyst. Wheat led the way lower today as both corn and wheat re-challenge the recent lows.
Crude oil continues to drift lower.
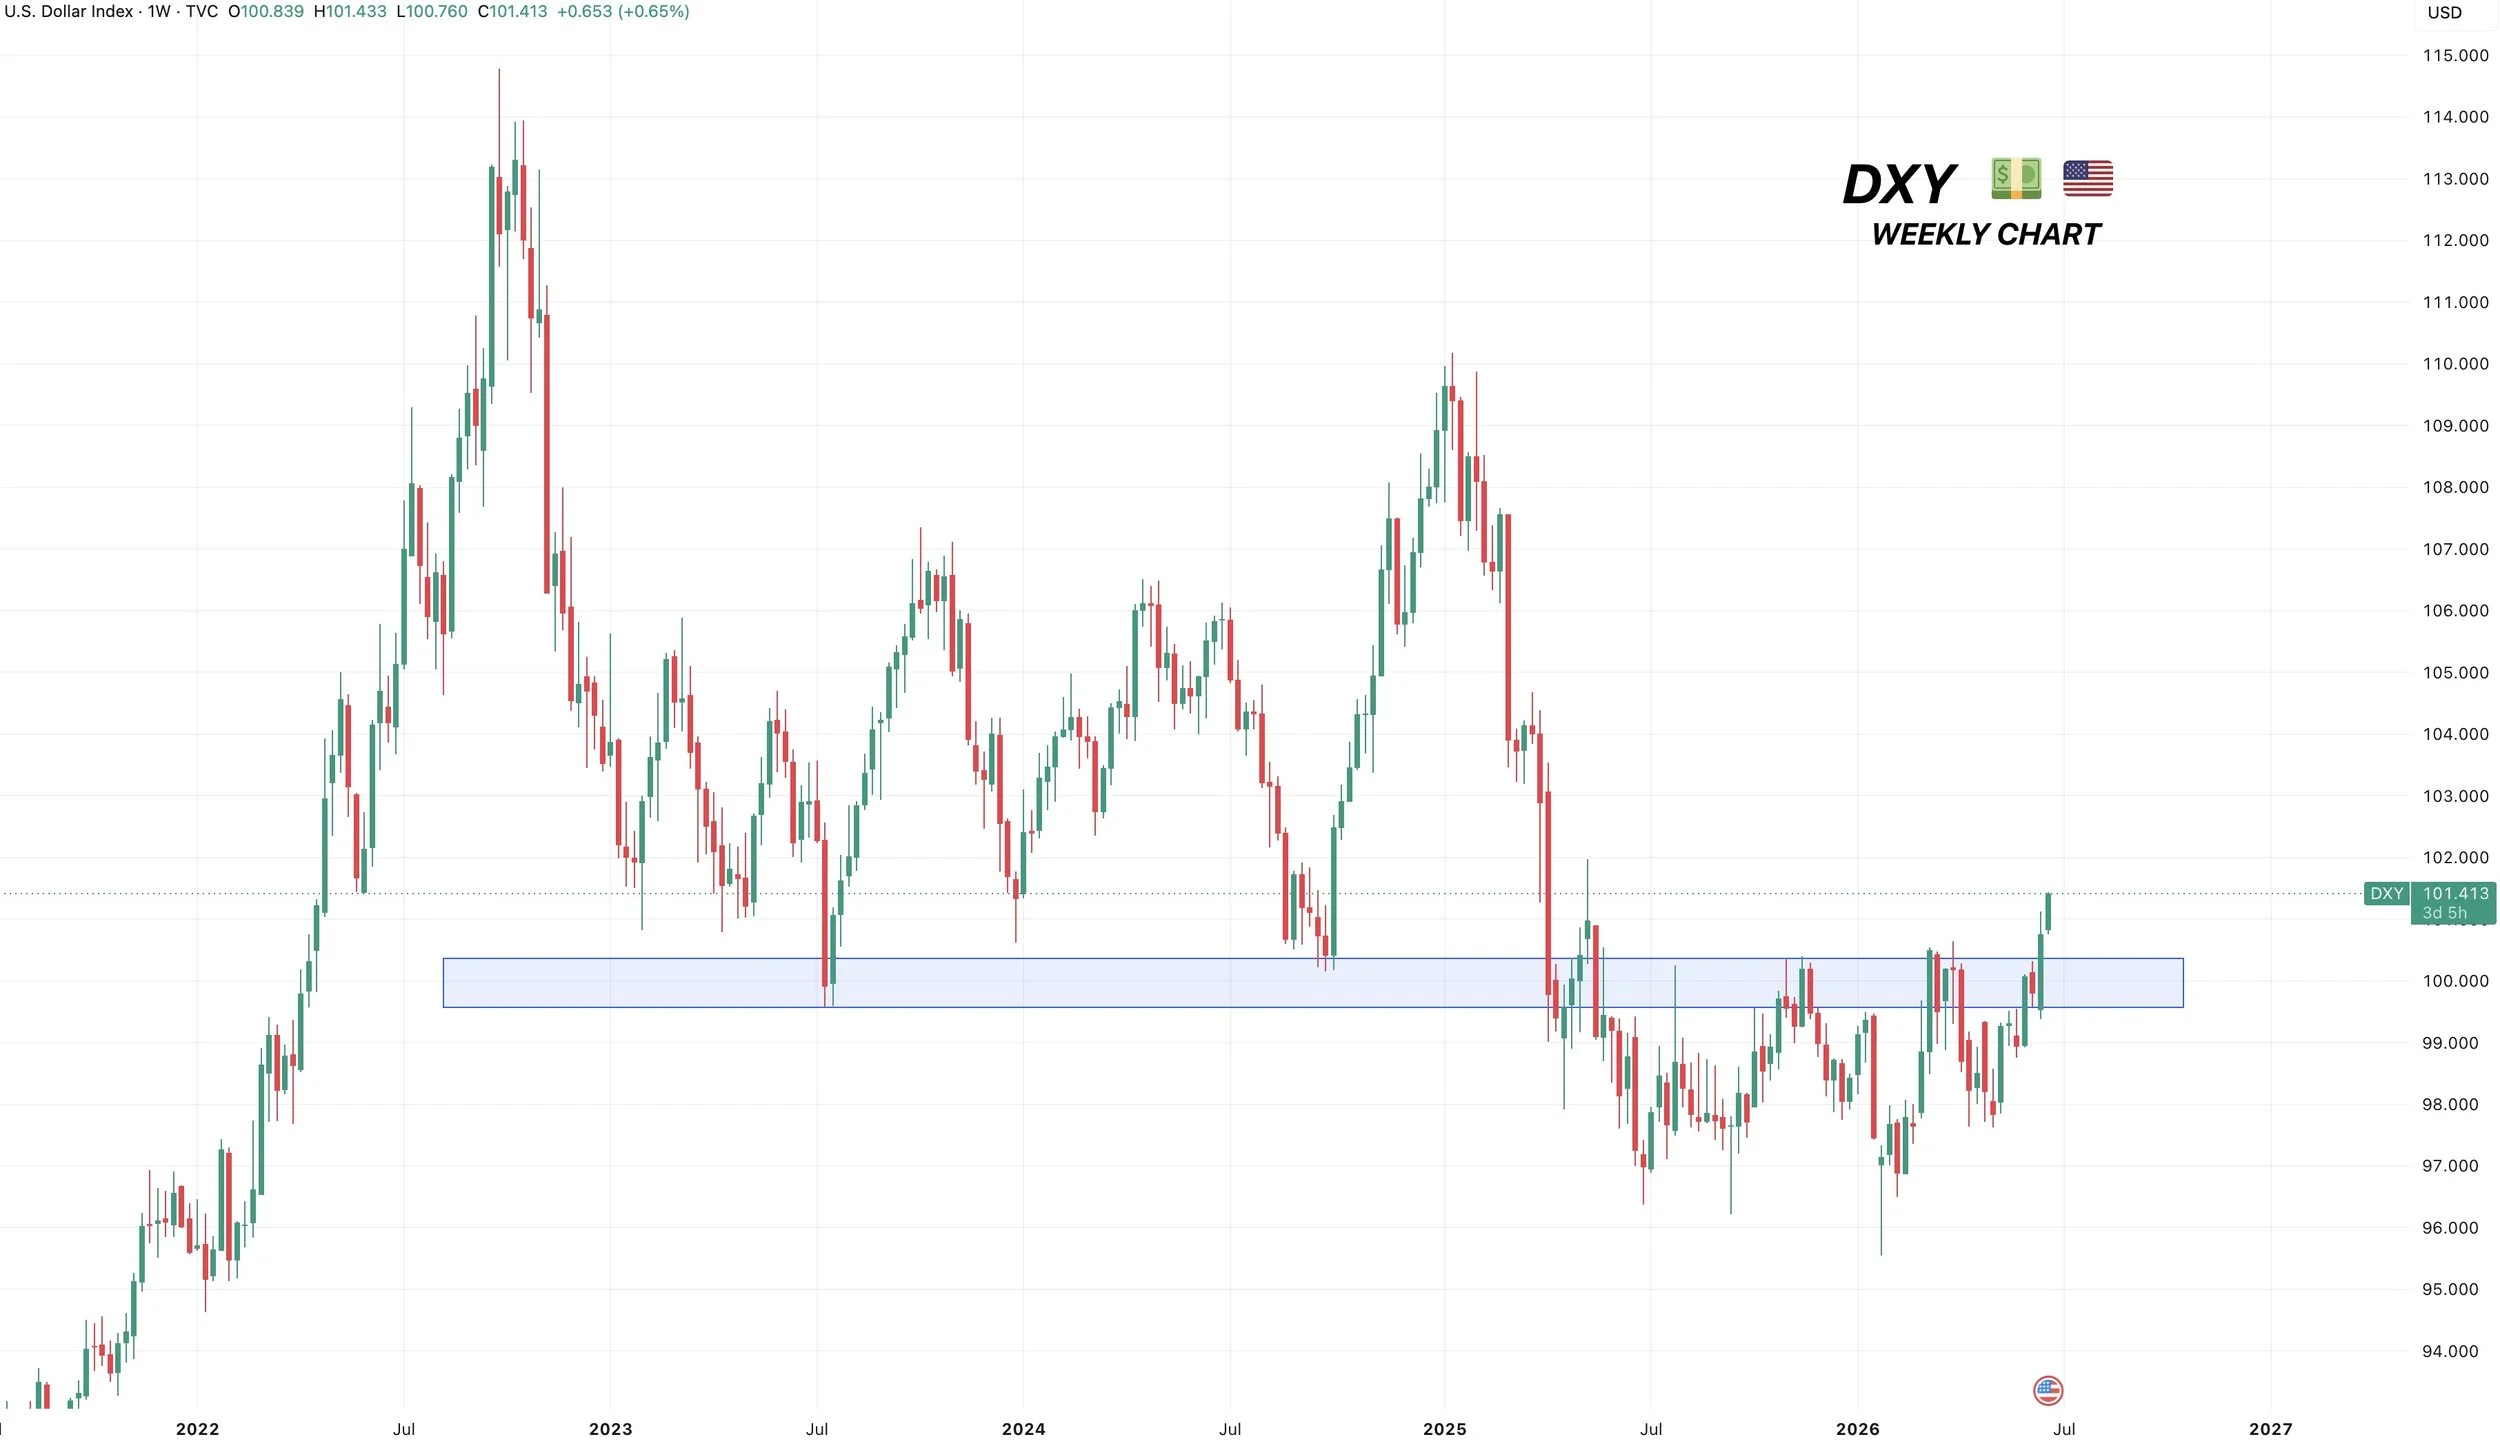
The US dollar is rallying, as it posted fresh 1-year highs today.
Below is the weekly chart. We've clearly broken out of resistance and prior support. So it looks like it's headed higher.
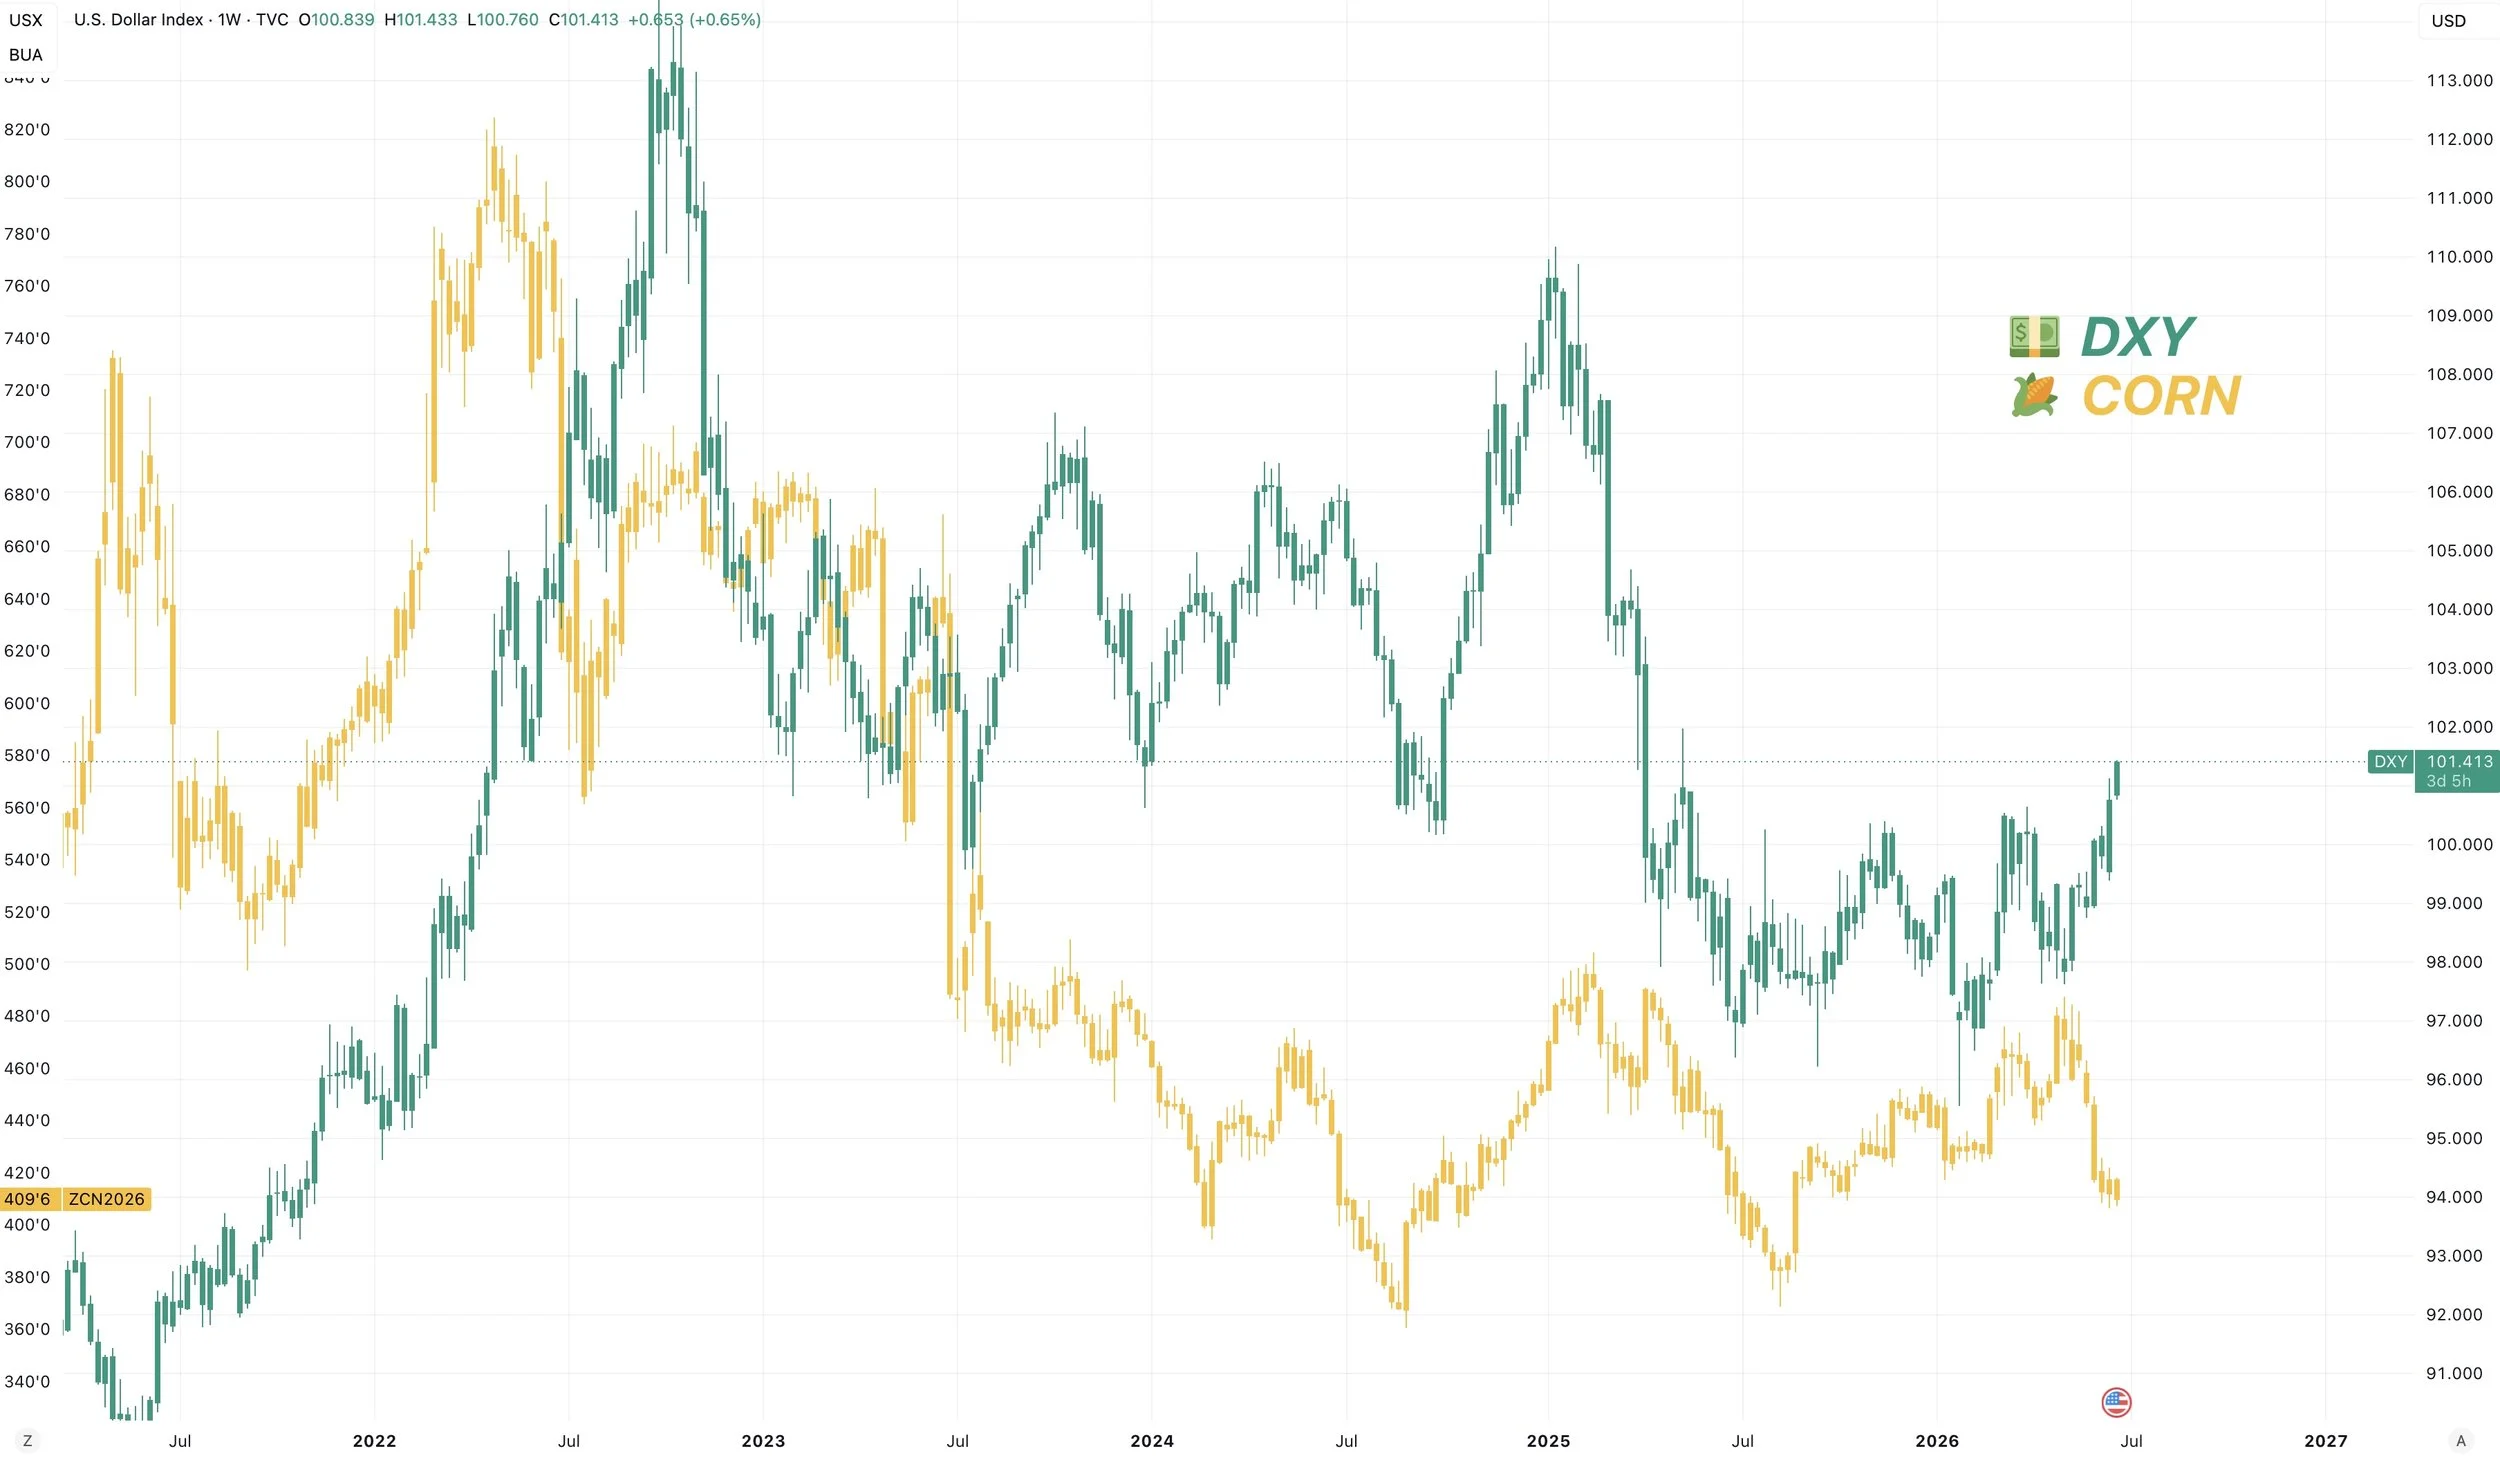
There is no direct inverse correlation between the dollar and the price action in grains.
Some may say "grains were lower because the dollar is higher".
Below is a chart that compares the US dollar to corn prices.
I don’t see an inverse correlation.
Take last year's rally that topped out in February for example. Both the dollar and corn rallied.
However, a higher dollar is of course a negative factor. As it makes it harder to be competitive on exports.
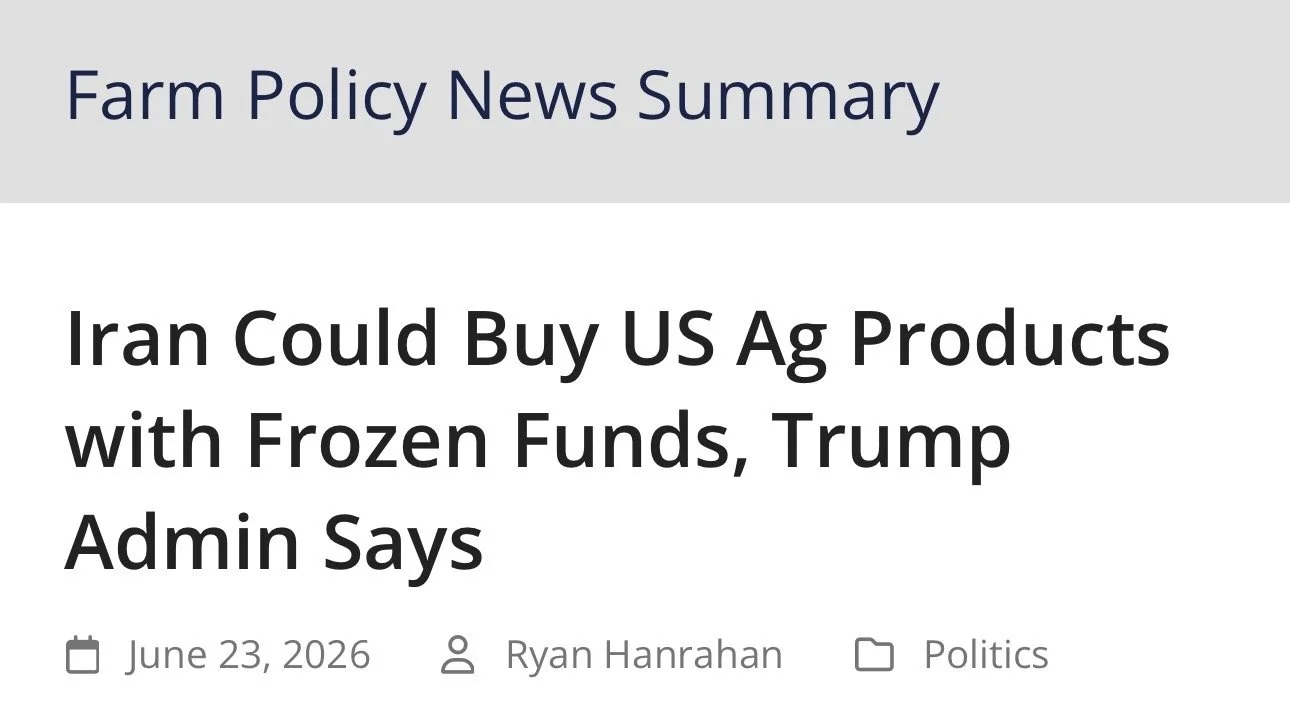
Iran Buying US Grain?
Trump said the Iran frozen funds will be used to buy US ag.
Iran has not confirmed if this would true or not.
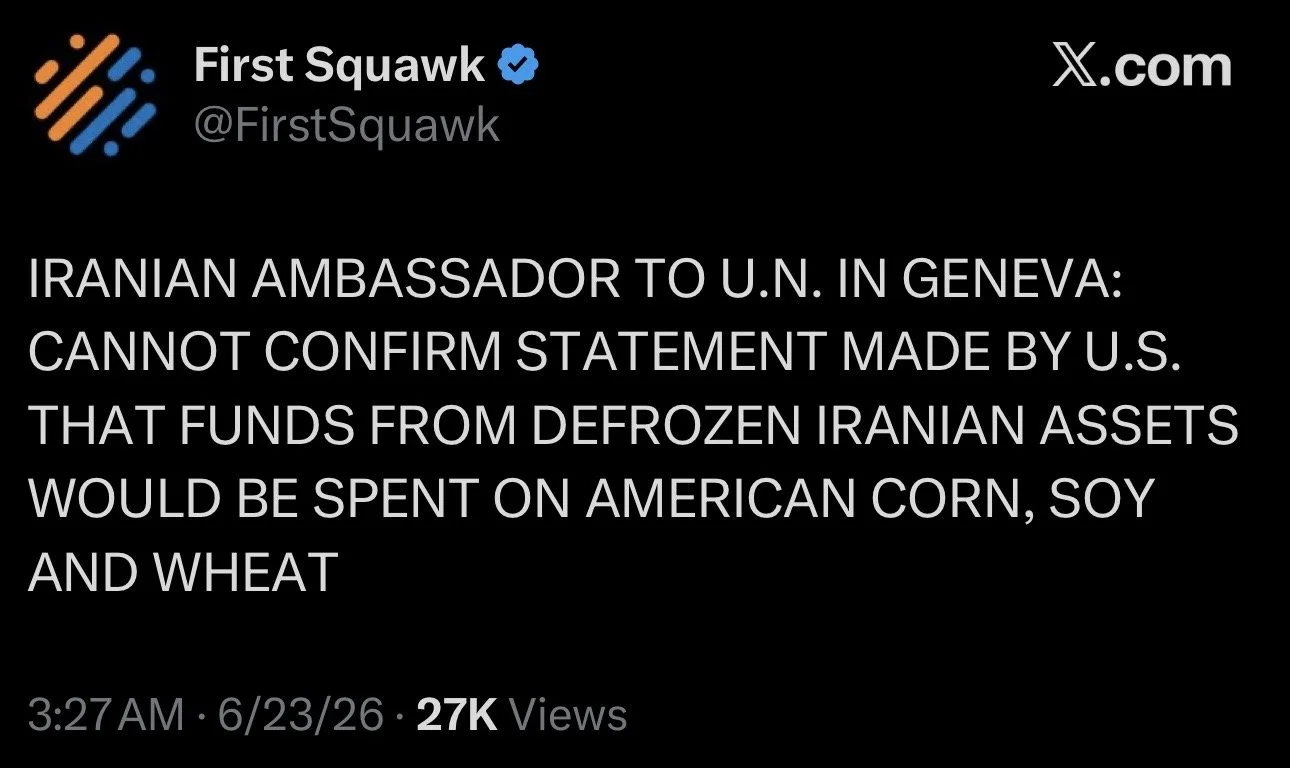
Let's just say it is true.
Does it really matter?
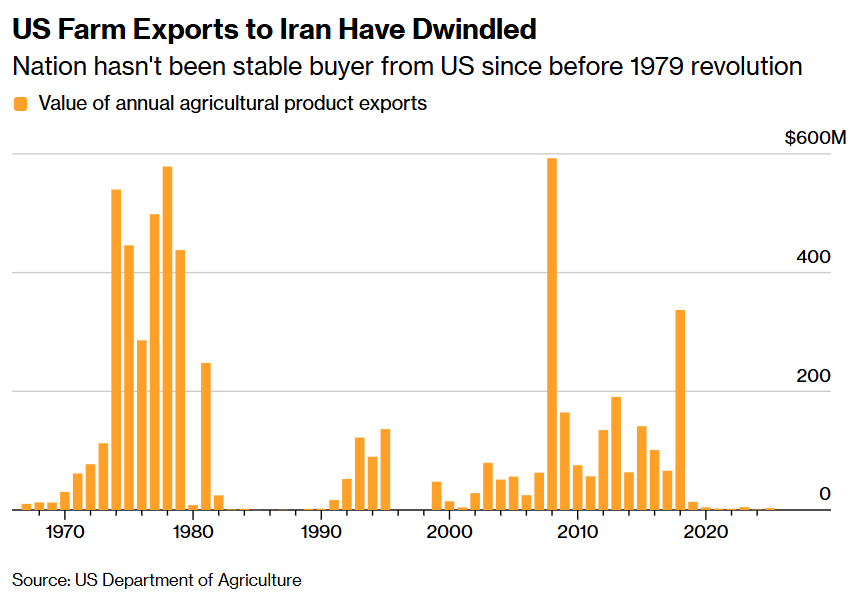
Below is the US's past exports to Iran.
Iran hasn’t been a big buyer since the 2019 trade war. Where they bought around $300 million worth of ag.
It just doesn’t seem like Iran would be buying enough for this to be some game changer.
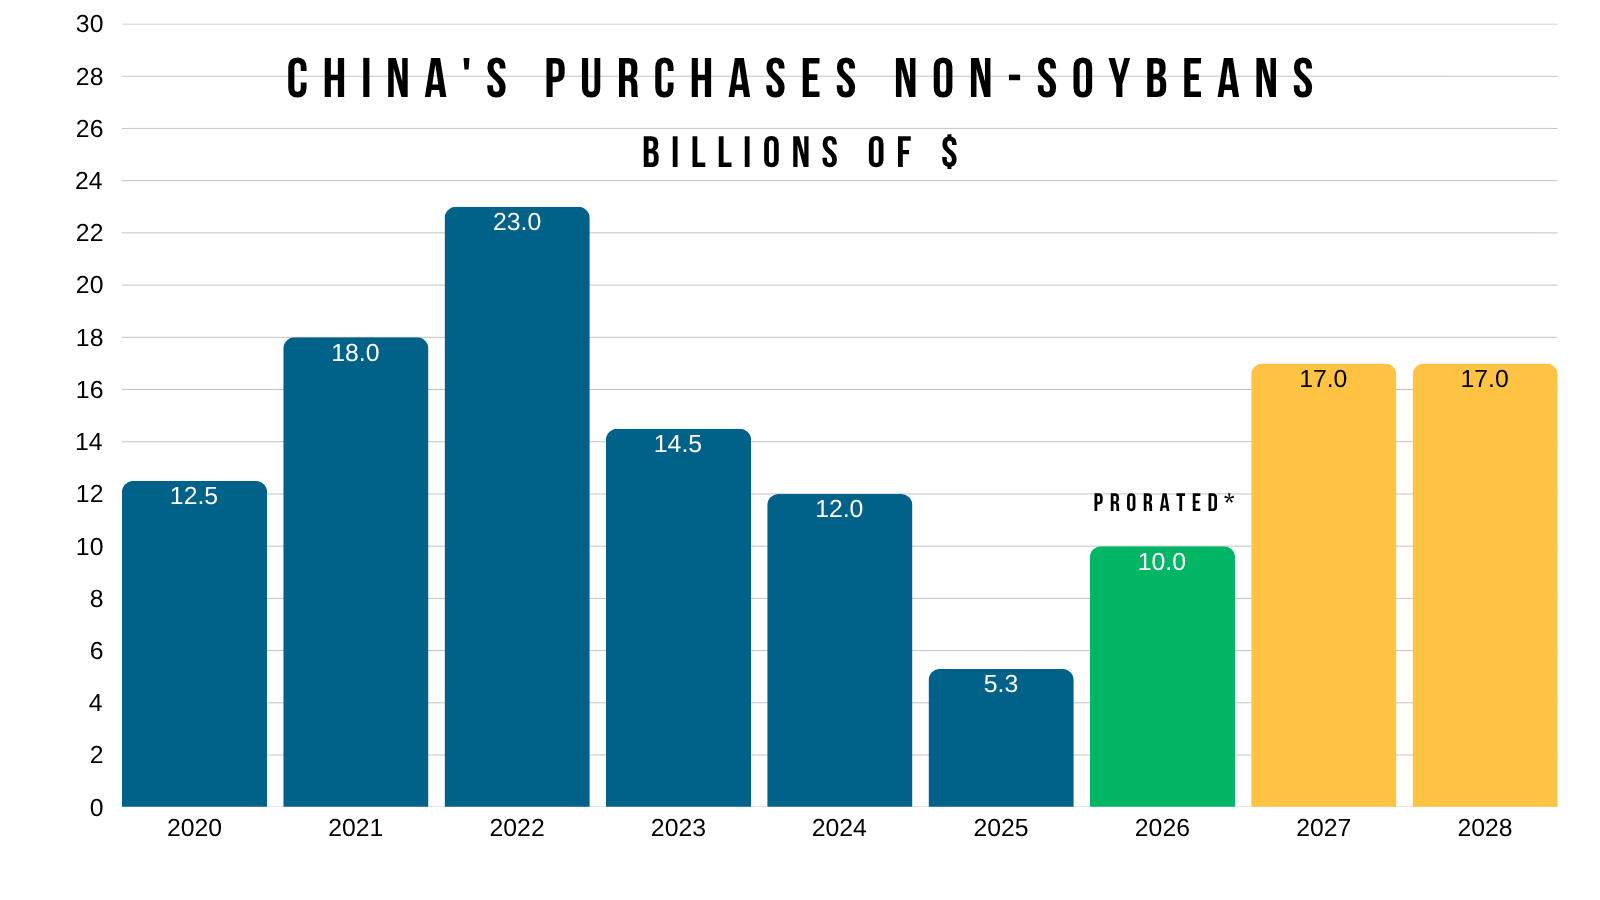
You know what could be a game changer?
China.
$17 billion is a lot more than we've ever exported to Iran.
Week Away from Massive USDA
The June 30th stocks and acres report is now a week away.
This report is often viewed as one of the largest of the entire year.
But just how big of a market mover is this report actually?
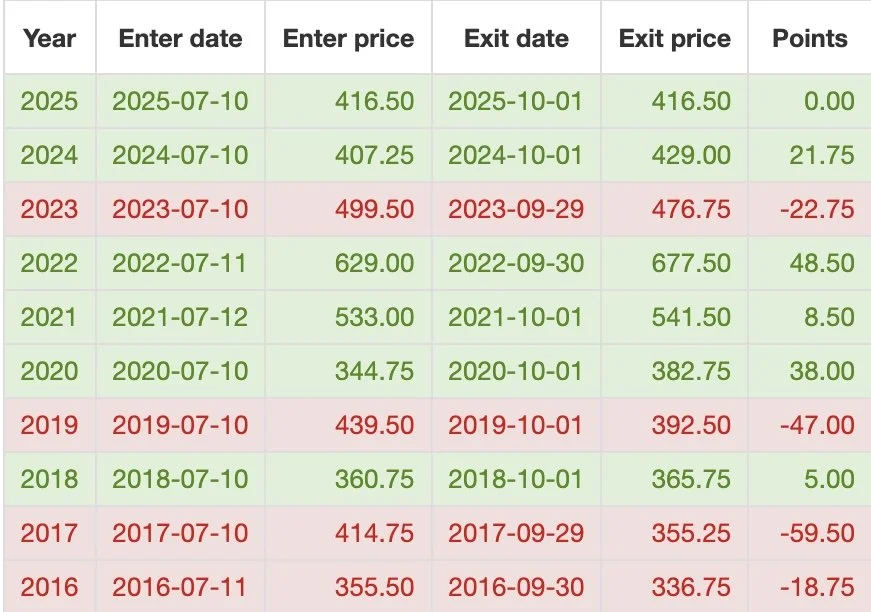
To put things into perspective, here are the price changes from the day of this report over the last 20 years.
Corn:
Corn has only moved less than 10 cents twice in the last decade.
It's resulted in several limit type moves over the years.

Soybeans:
The last two years have been a quiet report for soybeans.
However, there is only 4 times in the last 20 years we've moved by less than 10 cents.
There are plenty of instances of beans seeing massive moves on the day of this report.
2014 we dropped -70 cents.
2015 we rallied +57 cents.
2021 we rallied +87 cents.
2023 we rallied +78 cents.

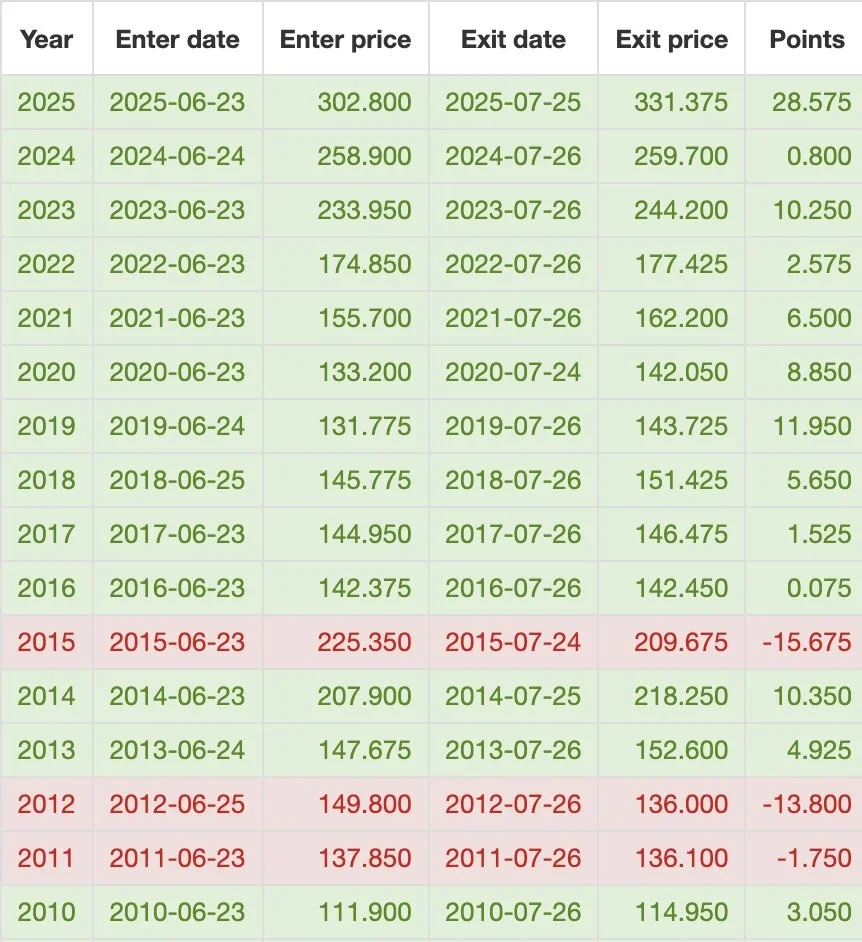
Wheat:
Like soybeans, the last few June 30th reports have been relatively quiet for the wheat market.
But it is still historically a market mover.

Today's Main Takeaways
Corn
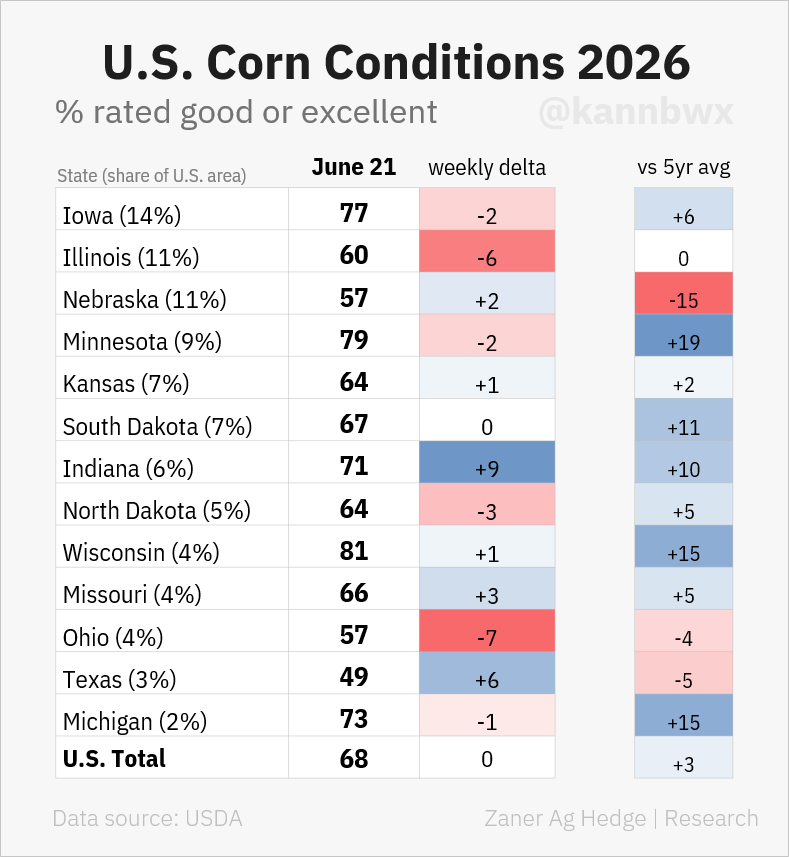
Crop conditions came in unchanged this week at 68% G/E.
Here is what that looks like compared to other years.
They sit right about average. Not great, but not bad either.

Despite national ratings staying unchanged, we did see both Iowa and Illinois take a step back.
Iowa dropped another -2% while Illinois dropped -6%.
Chart Credit: Karen Braun (@kannbwx on X)
Iowa, Illinois, Nebraska, and Minnesota are the top 4 corn producing states.
They account for over 50% of the total production in the US.
So how do their ratings stack up vs the last decade?
If you take the average rating of the 4 states, you get 68%.
Which isn’t quiet as good as the last two years, but again isn’t bad.
Still sitting in a better spot than 2019, 2021, and 2023.

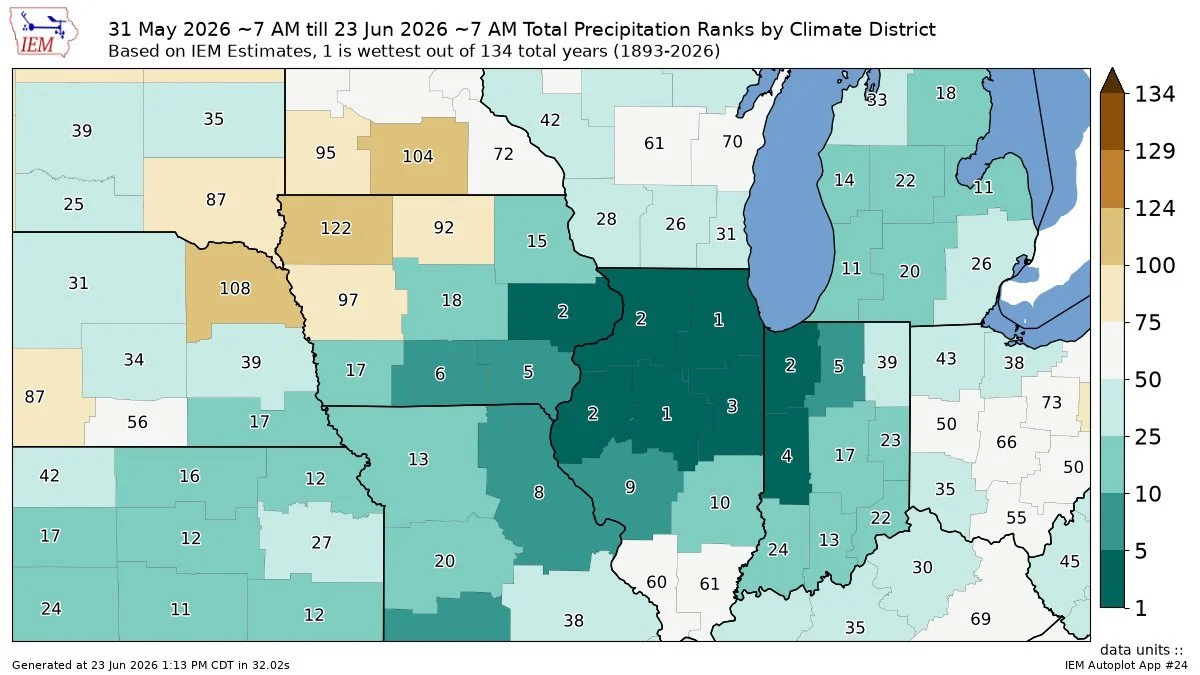
We just had one of our wettest Junes on record.
Northern Illinois and Eastern Iowa specifically had their wettest ever.
Those are the top 2 corn states.
The market views this as rain makes grain. So it's not bullish right now at all. It's not going to create a weather rally.
This is the time of year where rain in the forecasts is going to be bearish even if it's too much rain.
However, too much rain can be an issue that shows up later come harvest time. And we may be starting to see some of those impacts in the ratings.
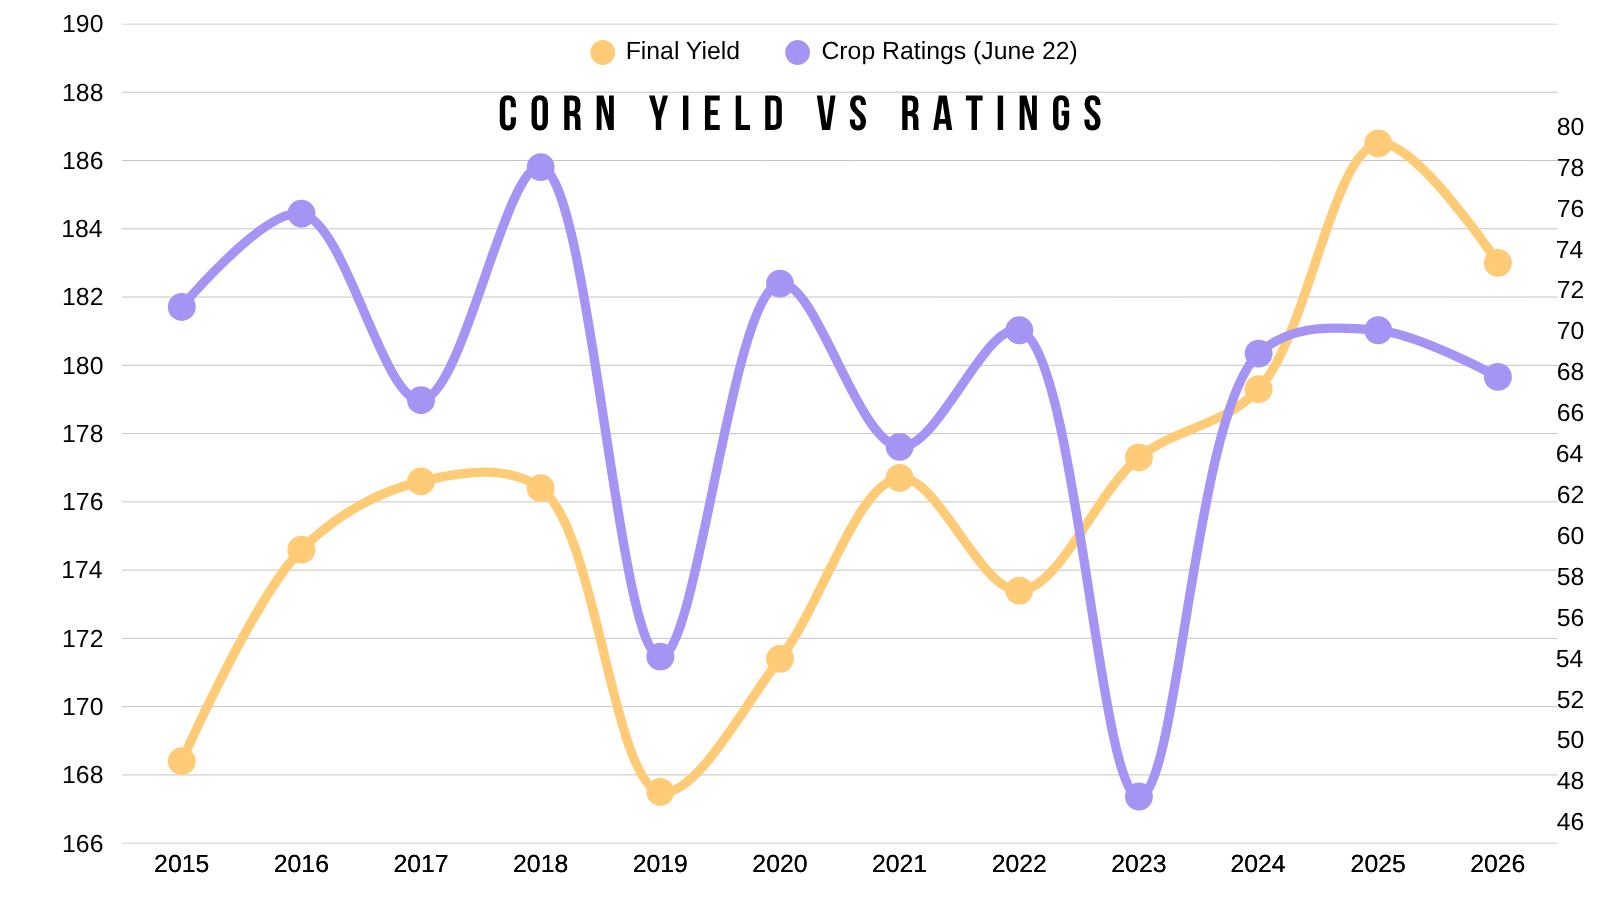
Although, ratings today have very little correlation to final yield. Here is a chart that demonstrates that.
This shows final yield vs today's crop ratings.
For starters, yes we are still plenty early into the growing season.
But there are several discrepancies.
Take 2023 for example. Poor ratings, yet a record yield.
2021, poor ratings, great yield.
2022, good ratings, yield was lower.
So ratings aren’t a tell all be all, but they do give us a good idea on how the crop is fairing.
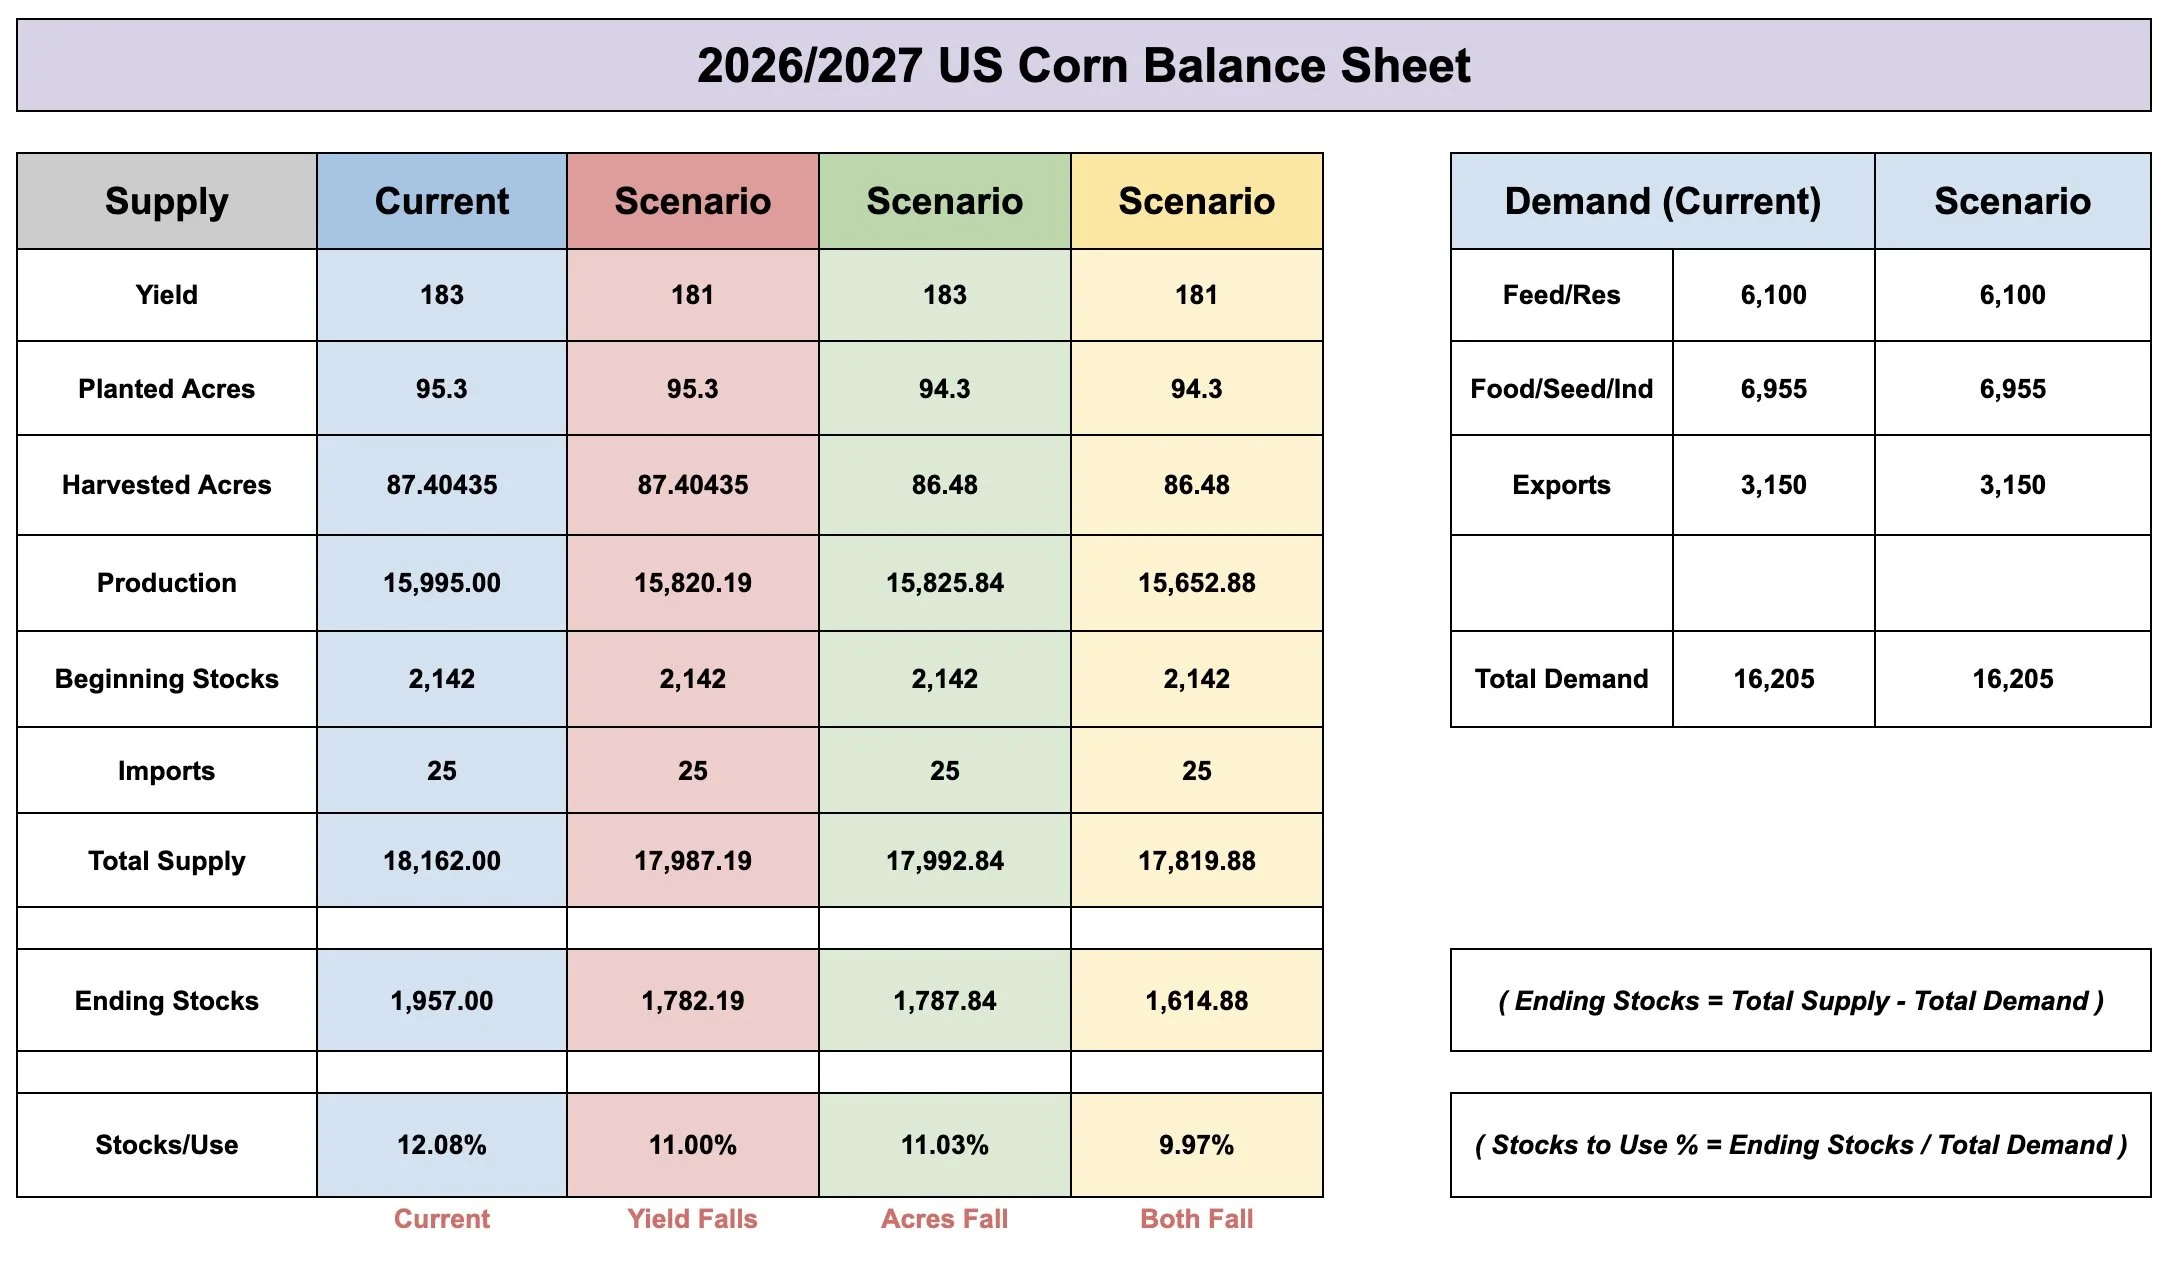
What if yield isn’t perfect?
We've gone over plenty of balance sheet scenarios, usually to show the impact acres are going to have.
Below shows how both yield and acres impact the balance sheet.
One scenario shows what happens if acres stay the same, but yield falls to 181.
95.3 acres
181 yield
1.78 carryout
11% stocks to use
Another shows what happens if acres fall a million, but yield stays at 183.
94.3 acres
183 yield
1.79 carryout
11% stocks to use
The last shows what happens if acres fall a million and yield falls to 181.
94.3 acres
181 yield
1.61 carryout
10% stocks to use
If acres fall, we are going to need a big yield to prevent the balance sheet from getting tight.
As always, these scenarios account for no changes to demand. Usually if the USDA cuts supply, they cut demand. Which is what they did this year. The USDA is expecting exports to be worse than last year because they cut production vs last year. Altough, I could argue demand isn’t slowing down.
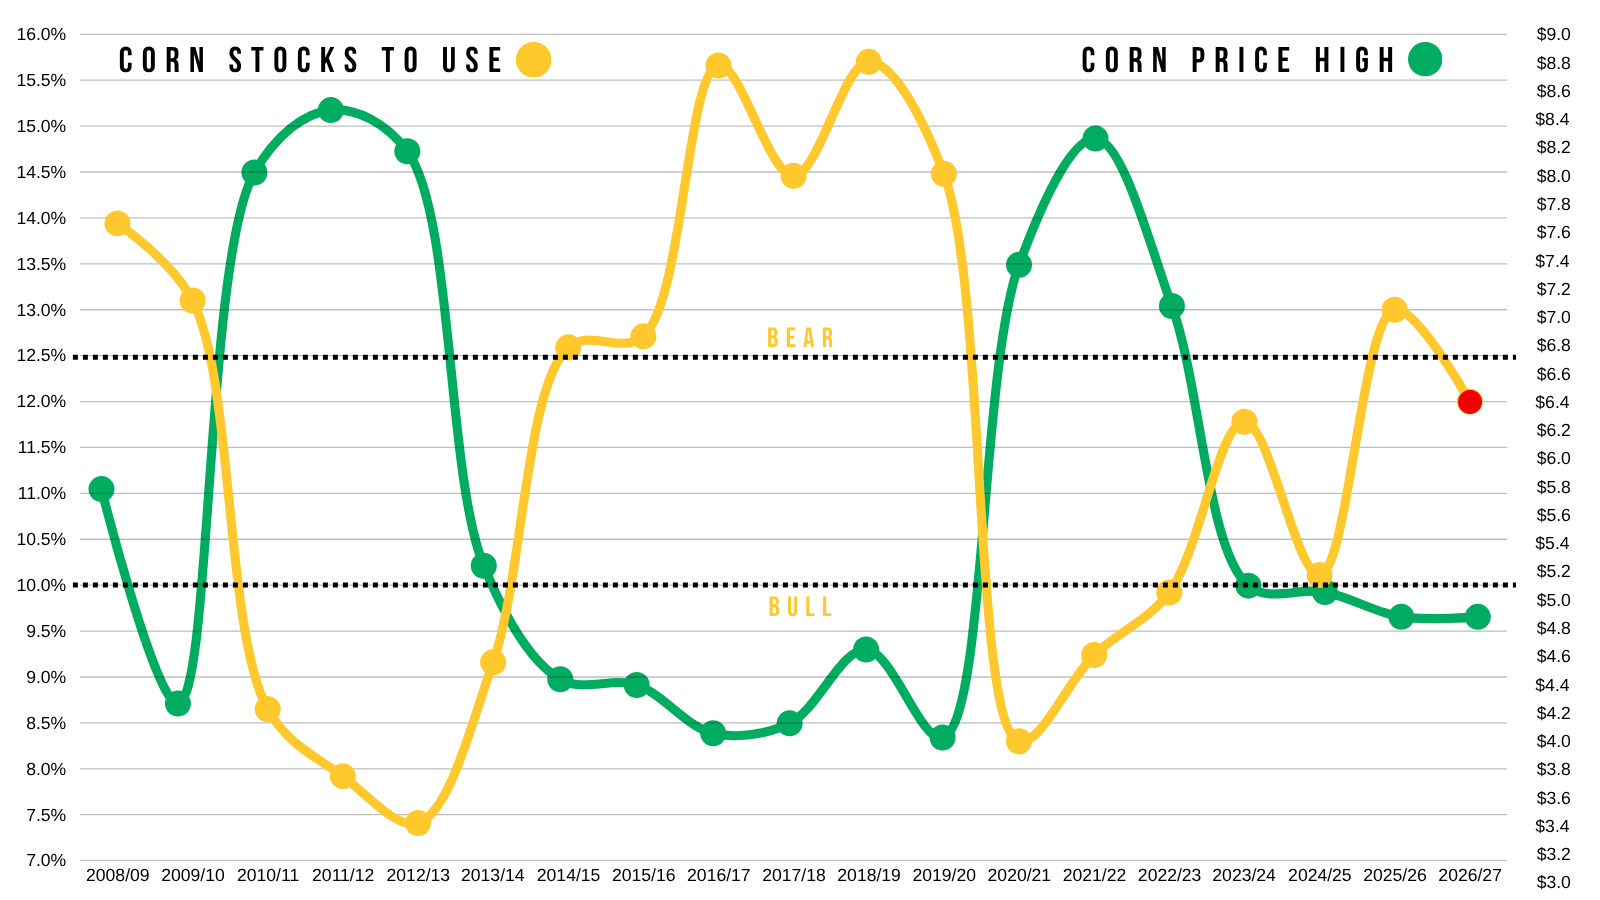
I showed this chart all year long.
This is front month corn's highest price of the year vs the stocks to use ratio.
Most of the time, to achieve +$5.00 front month corn you need to see the stocks to use ratio fall to 10% or lower.
In those scenarios above, there is a "possible" pathway for that to happen.
That doesn’t mean it "will" happen. But the possibilities are there if acres come down and yield isn’t perfect.
The problem is, none of this is going to matter for a while.
What happens if China buys corn?
Demand is already the best it's ever been.
What happens if China buys corn while acres come down or the crop isn’t perfect?
So there are still plenty of reasons to believe corn has a story heading into next year.
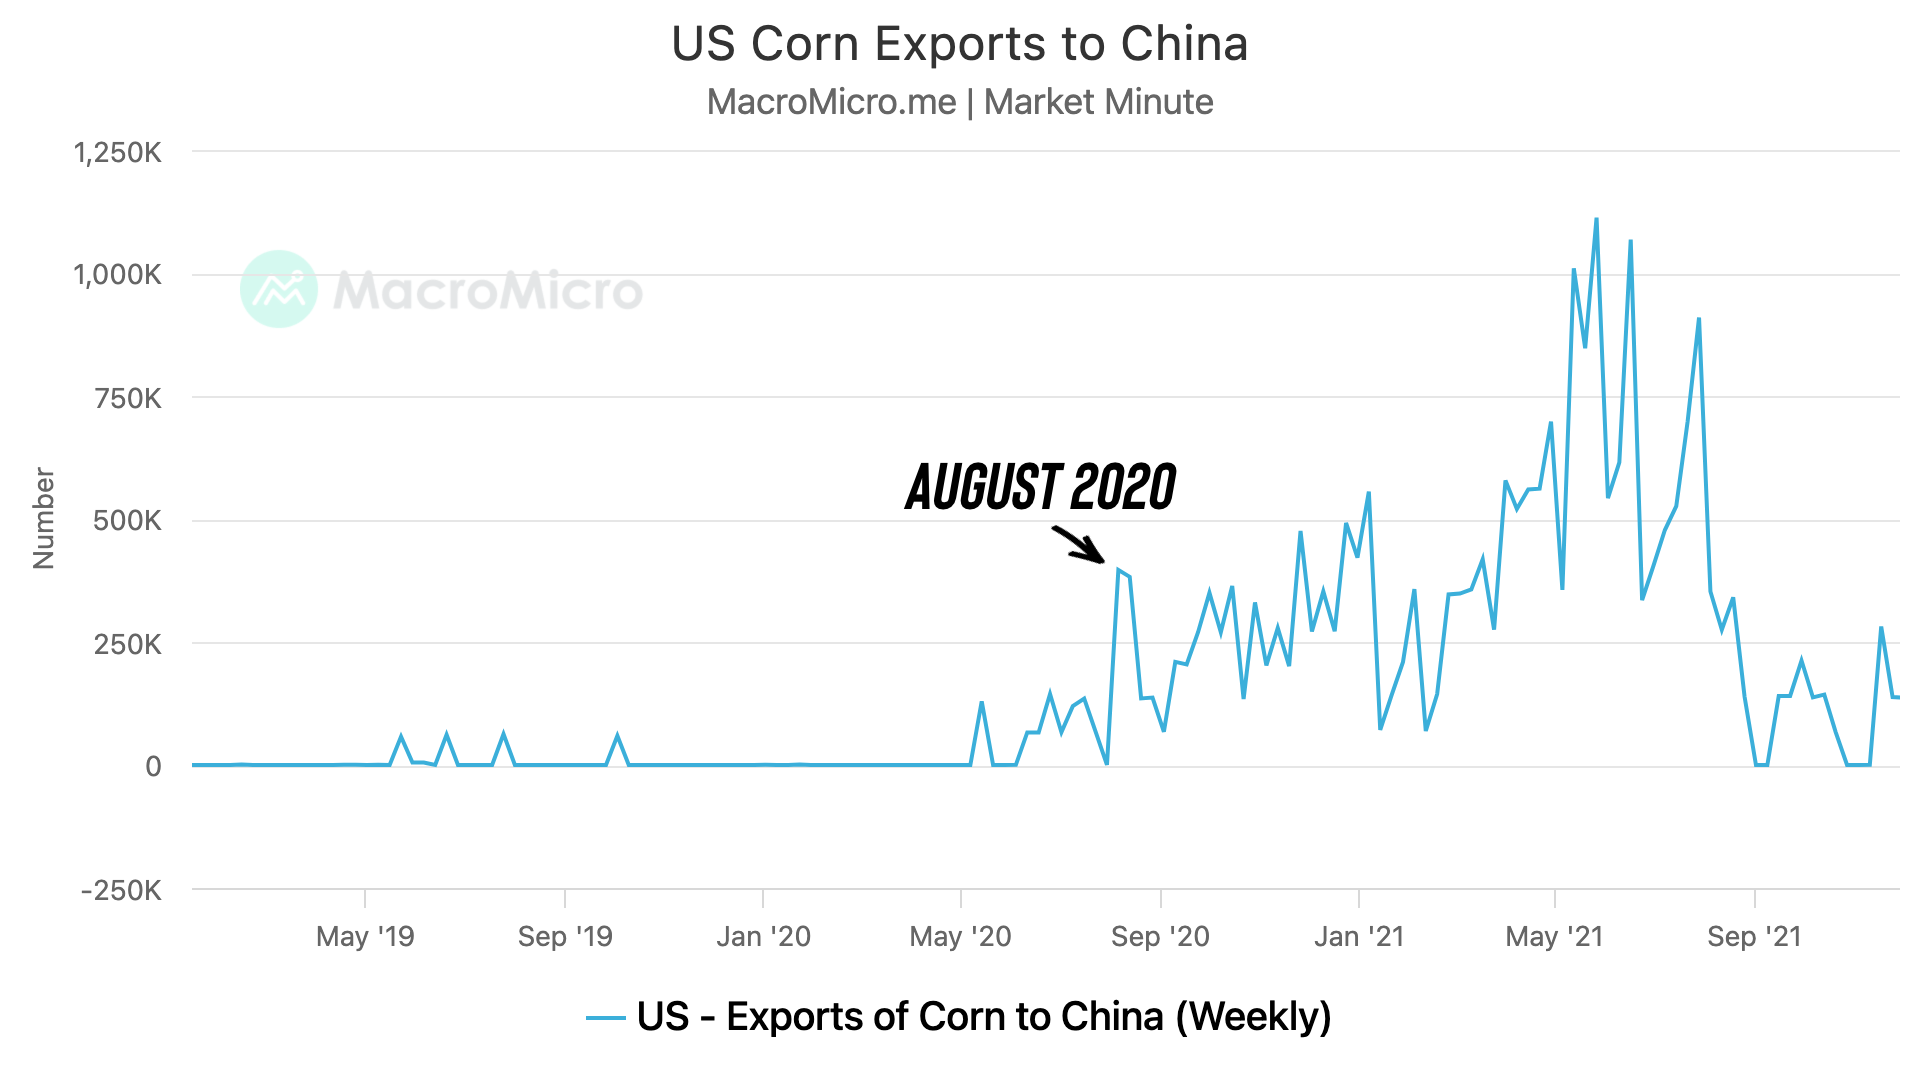
Again, the issue is that logically China probably doesn’t buy corn until harvest.
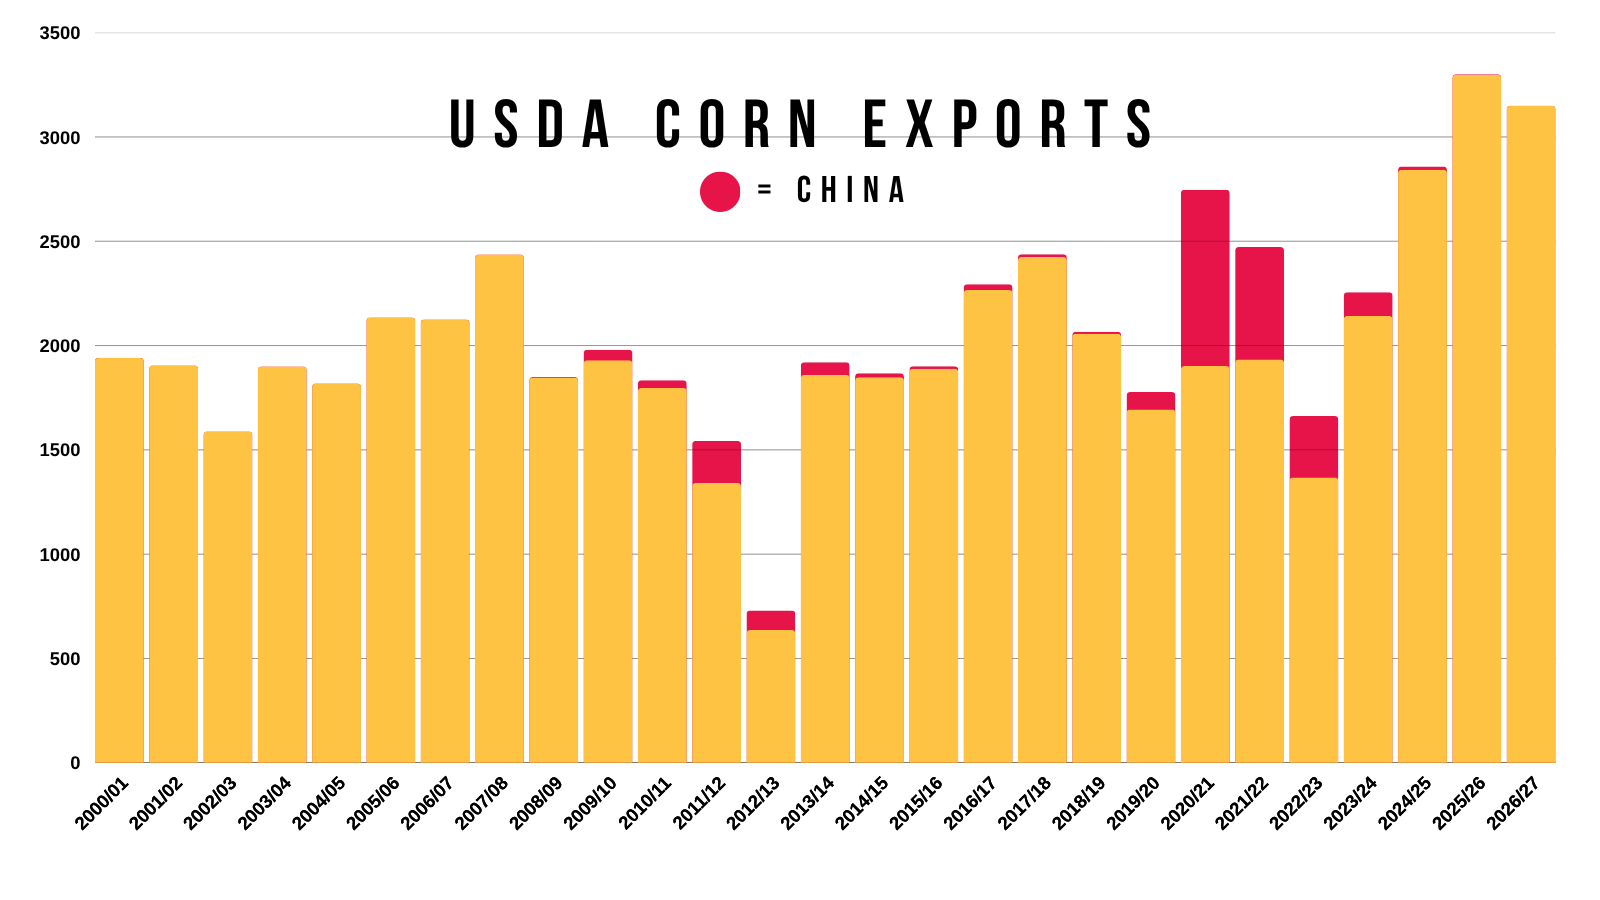
When did China start to buy in 2020?
They didn’t start buying consistently until August.
If you are China and want the best deal possible, when would you buy?
Probably around harvest.
When prices are their lowest, and when supply is it's highest.
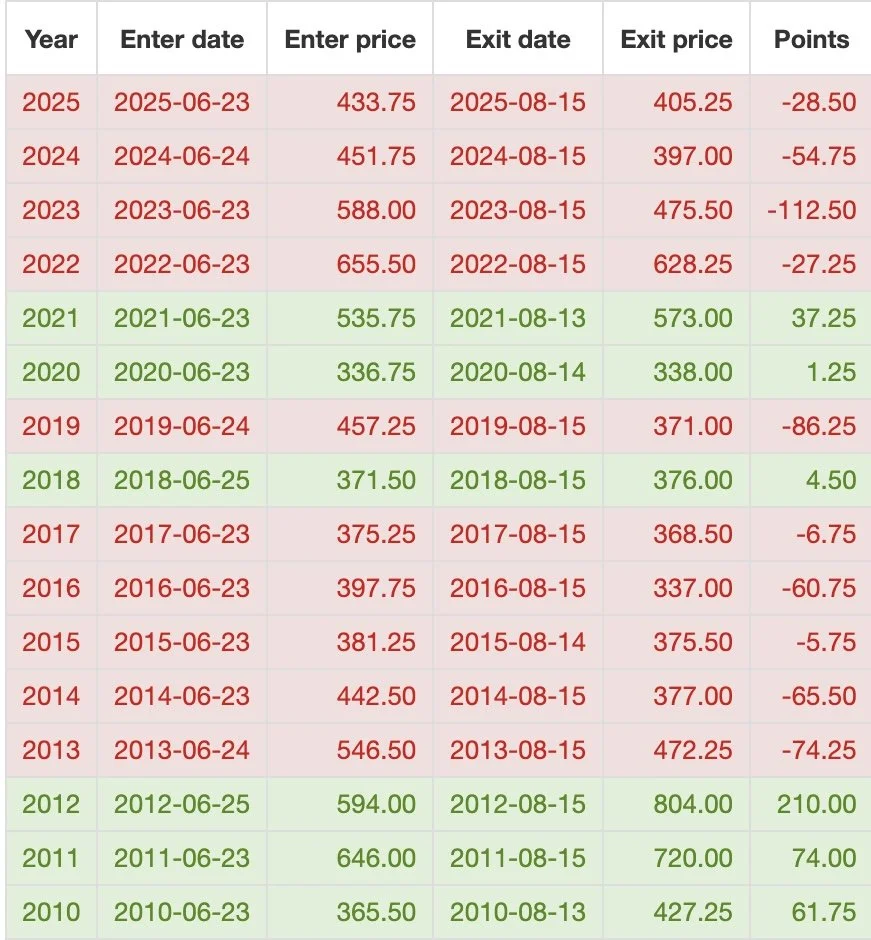
What seasonals suggest:
Can we get a bounce? Absolutely.
Do we have to get a bounce? No, we do not.
Seasonally, this is still the time of year where we simply head lower. Bounce first or not.
From today's date by August 15th, we've been lower the last 10 of 13 years.
So unless the landscape and story somehow completely changes before then, we likely want to defend a bounce if we get one.
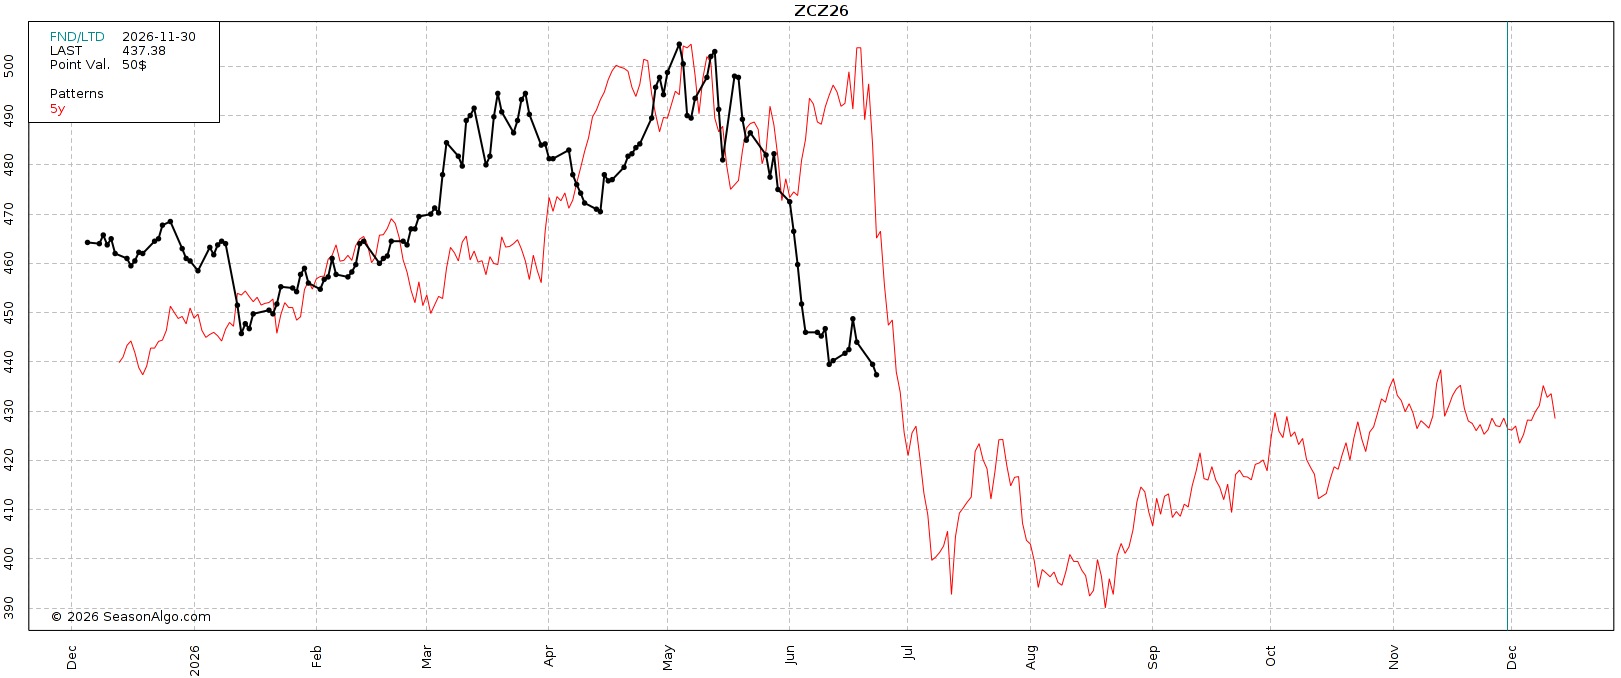
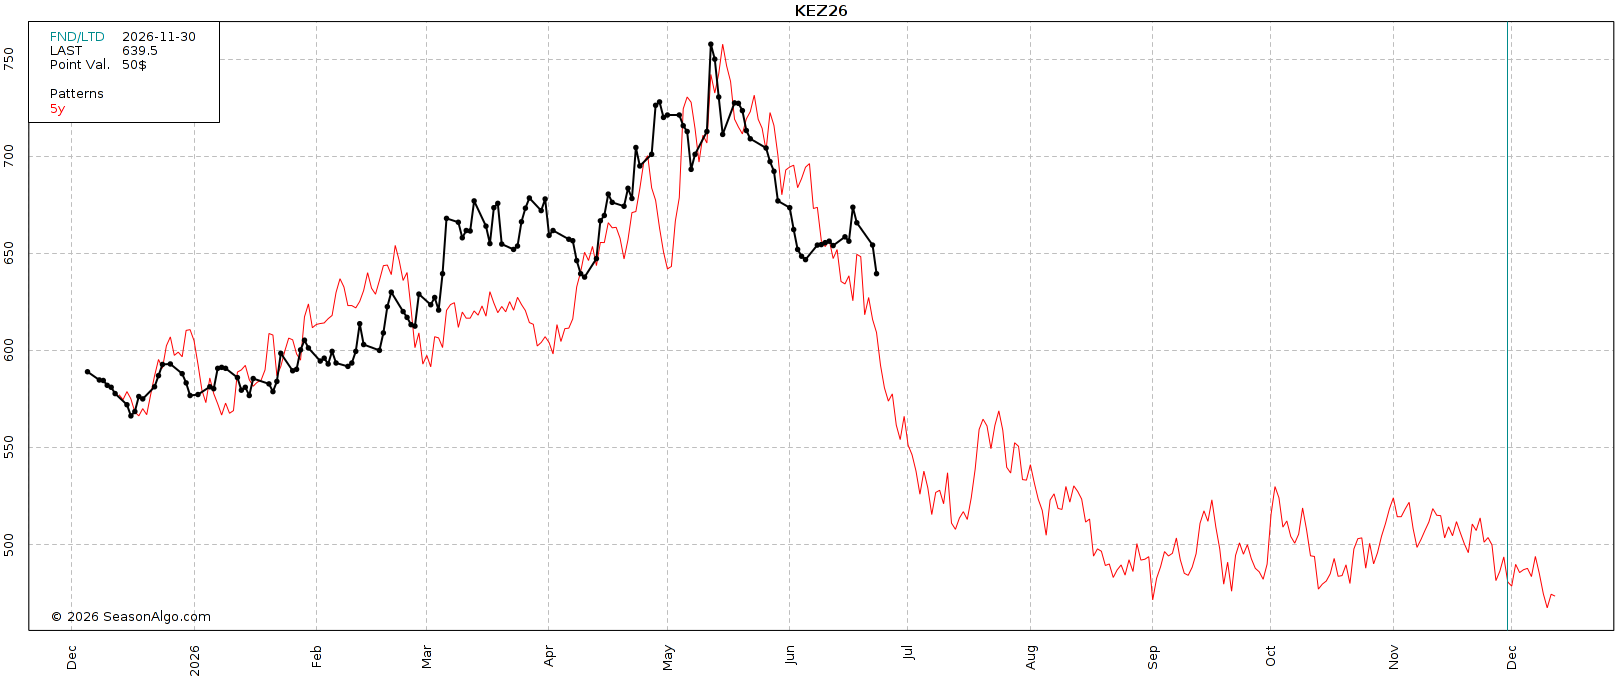
Take a look at the 5-year seasonal pattern.
We usually carve out some lows in early to mid-July before getting a bounce.
We then continue to head lower before putting in a secondary true harvest bottom in August.
However, something to note is that the August lows have tended not to venture too far below the July lows.
Here is another set of seasonal data.
From July 10th (the date of that first seasonal low) by October 1st, we have been higher the last 5 of 6 years.
From August 15th (actual seasonal low) to October 1st, we've been higher the last 6 of 7 years.
So the point is, seasonally yes, we head lower from here.
But by October, we are often higher.

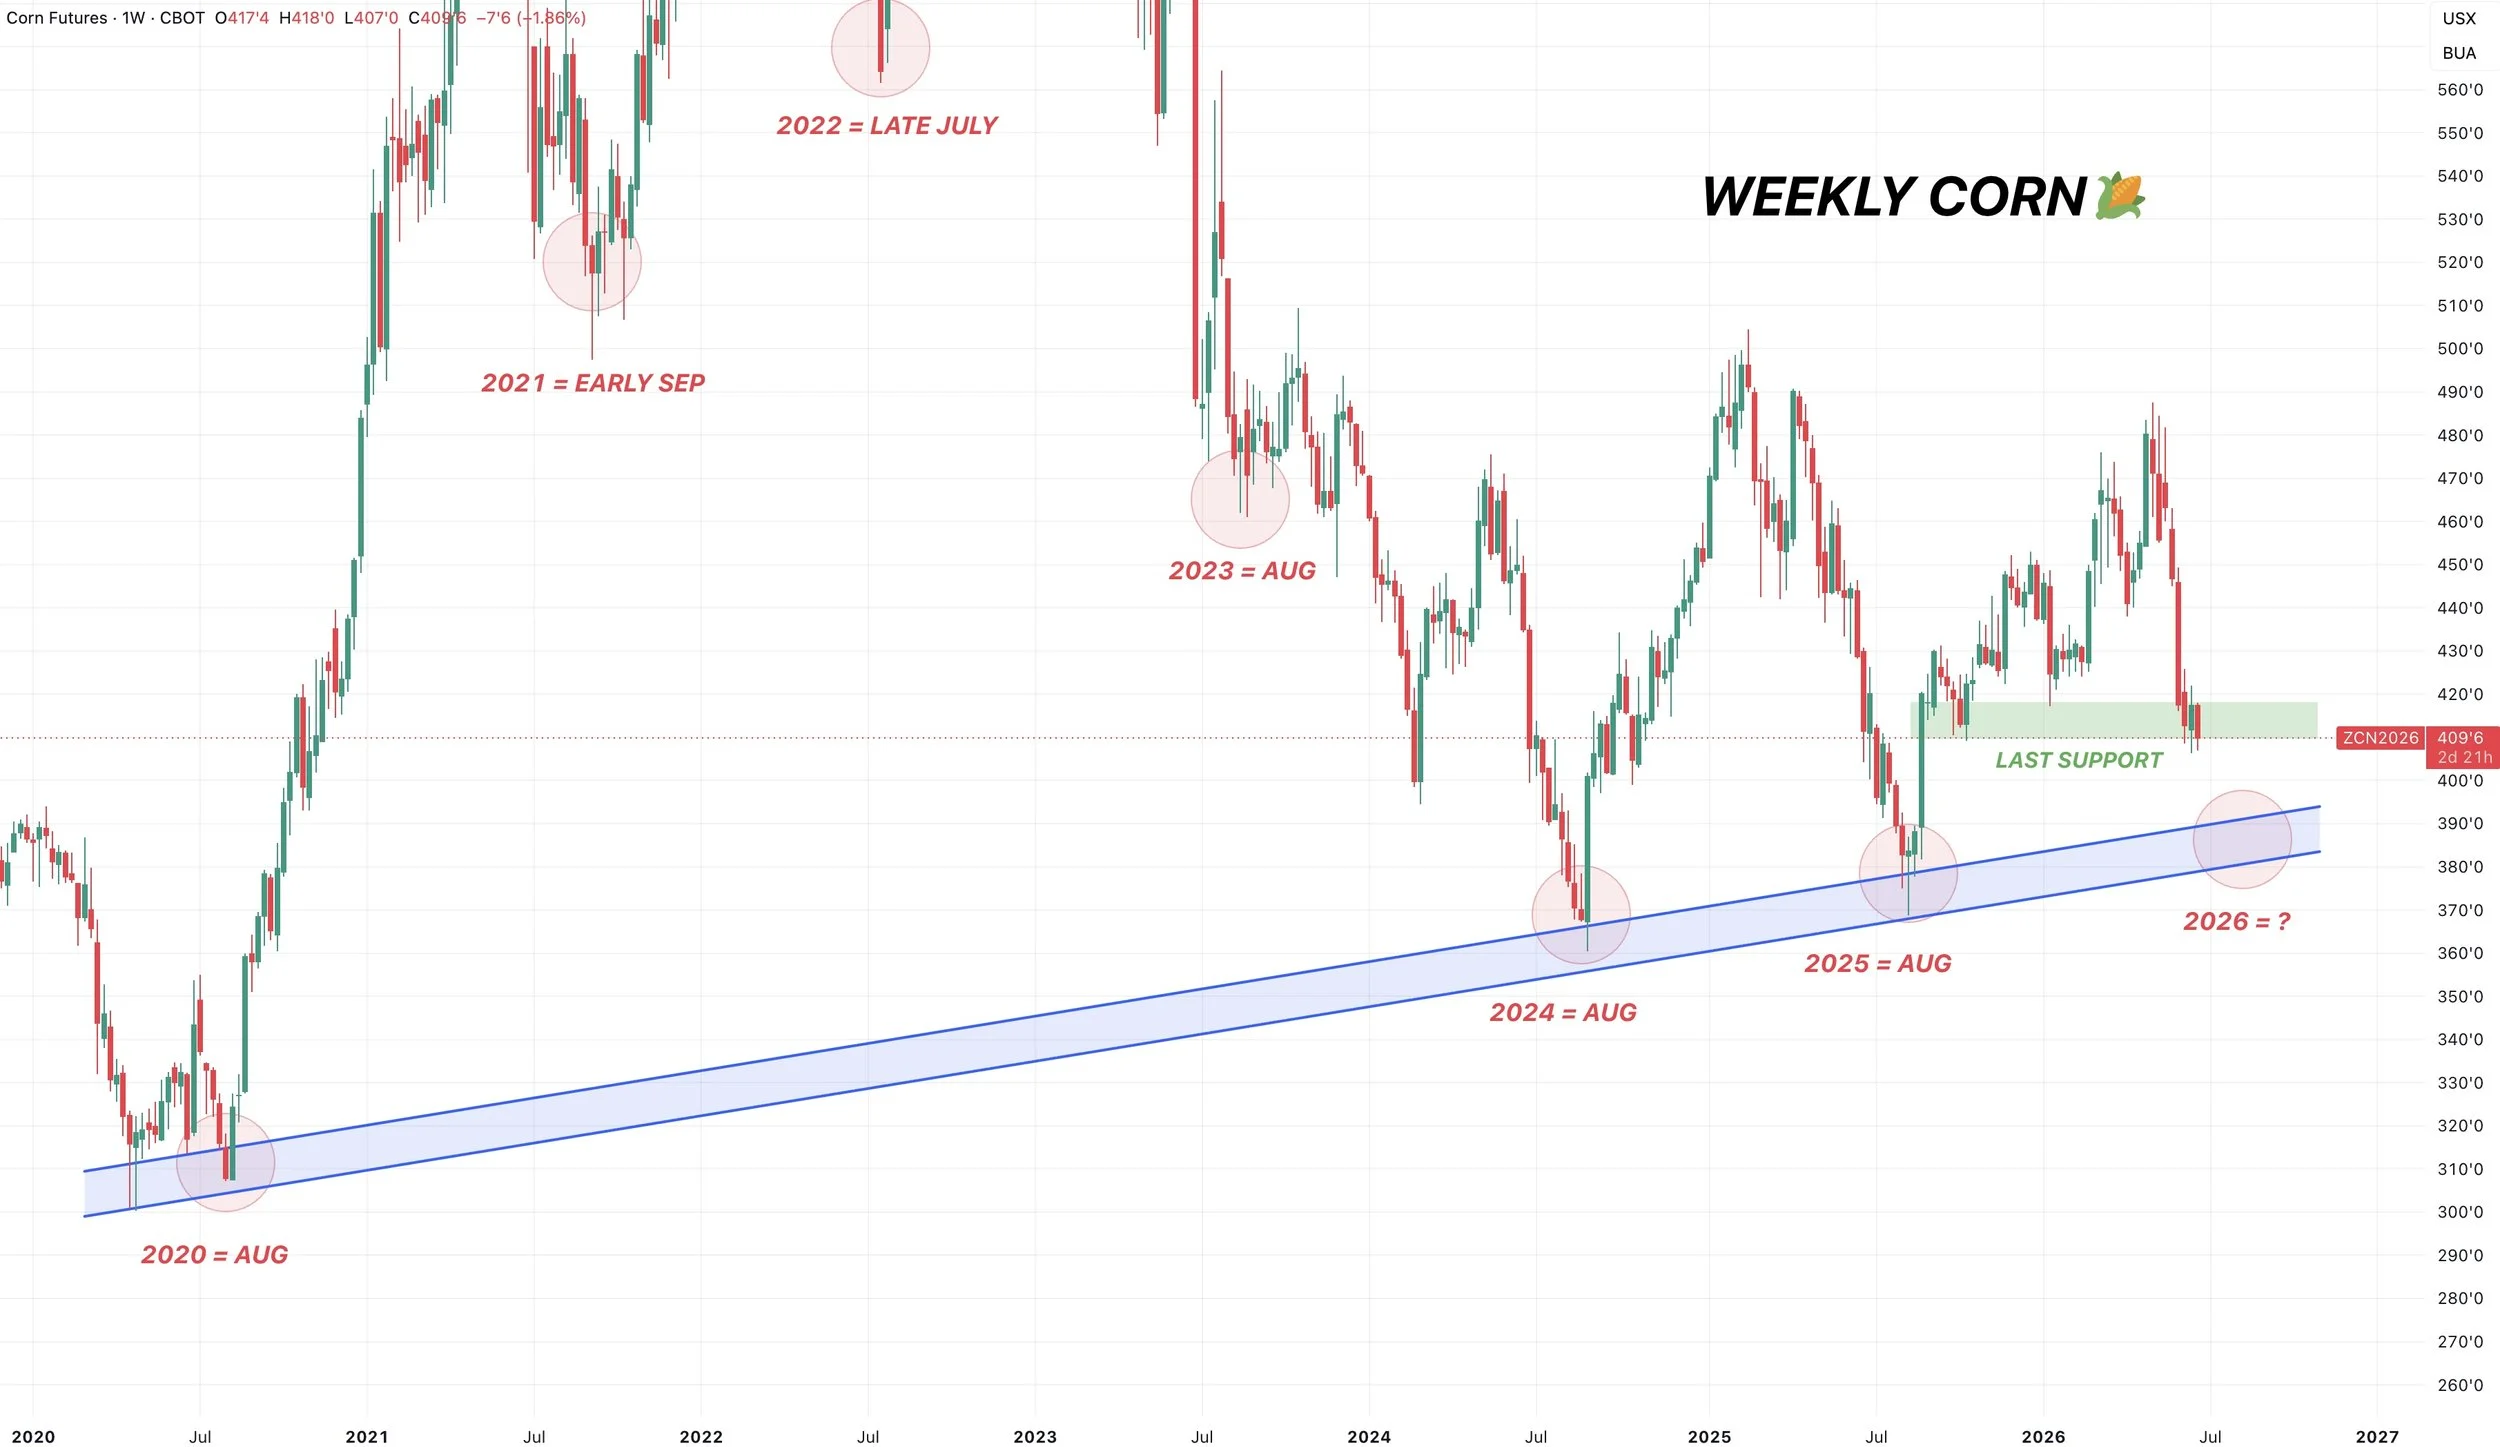
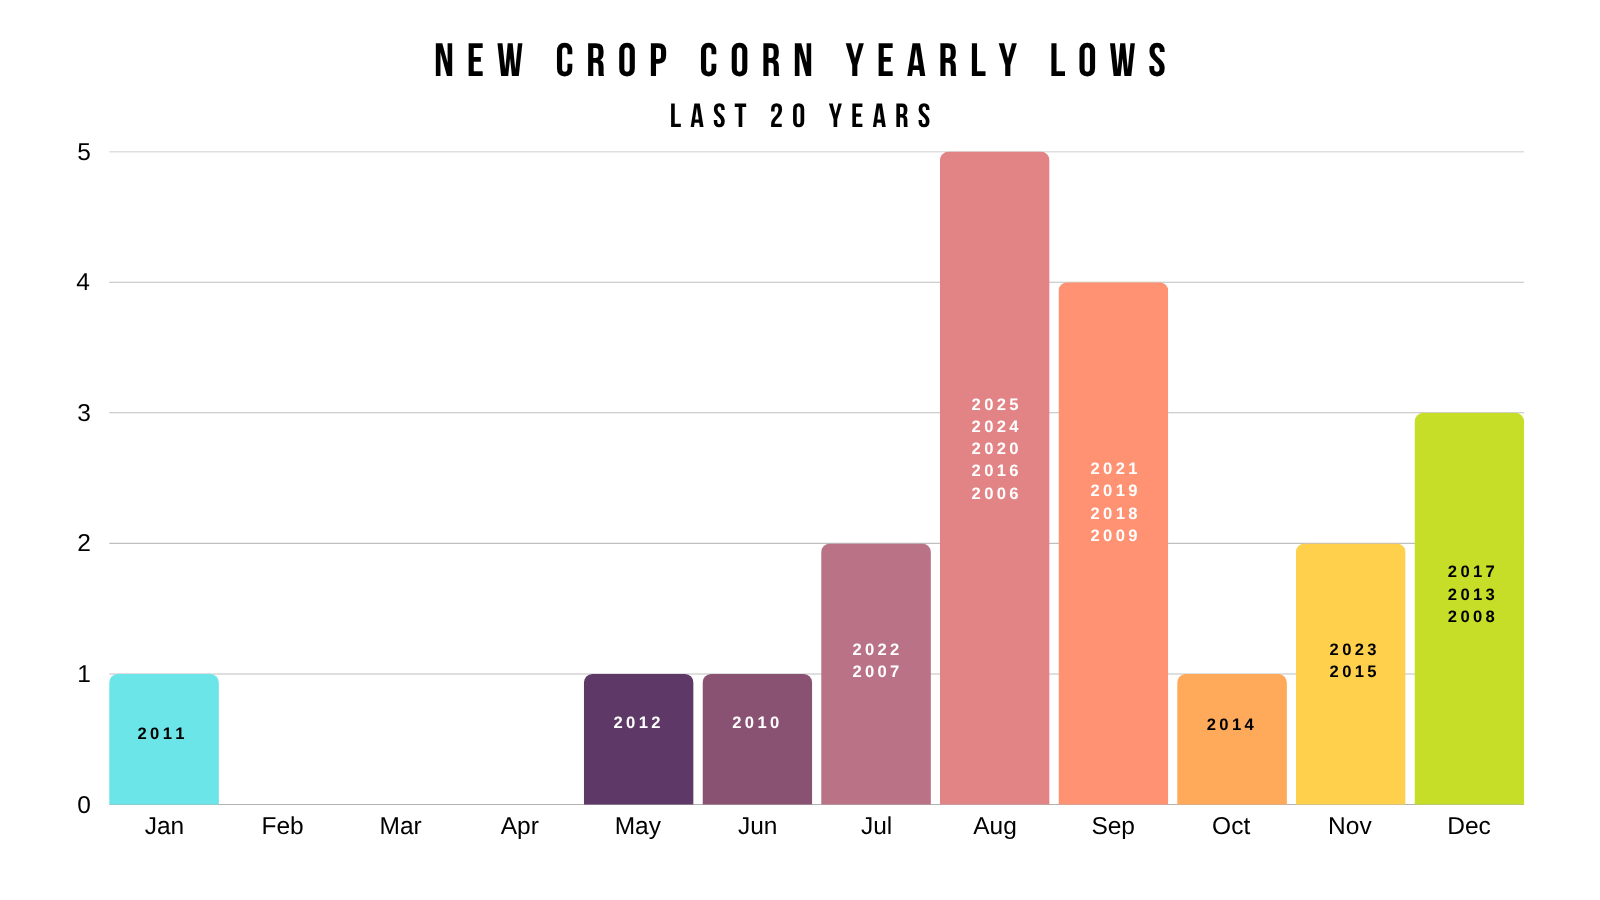
I showed this last week, but once again wanted to point out the last several harvest lows in corn.
2025: August
2024: August
2023: August
2022: Late July
2021: Early Sep
2020: August
2019: August
There are few things more seasonal than the corn market, and August is where the market usually carves out a real bottom.

It would still make sense for those harvest lows to come around that $3.80 to $3.90 range.
That's trend support that's marked the harvest lows in 2020, 2024, and 2025.
Bottom Line:
The war appears over. Crude is falling apart. Seasonally we head lower. Weather hasn’t been an issue.
So we want to be looking to respect a rally if we get one. As we rarely print lows in June.
Once we post those harvest lows, this market still has a ton of potential looking towards next year.
The story in new crop is the most "potential" we've had in a while.
China should be buying corn eventually.
I'd like to think acres come down.
We don’t know final yield yet.
What impact will the fertilizer situation have long term?
None of these unknowns are priced into the market.
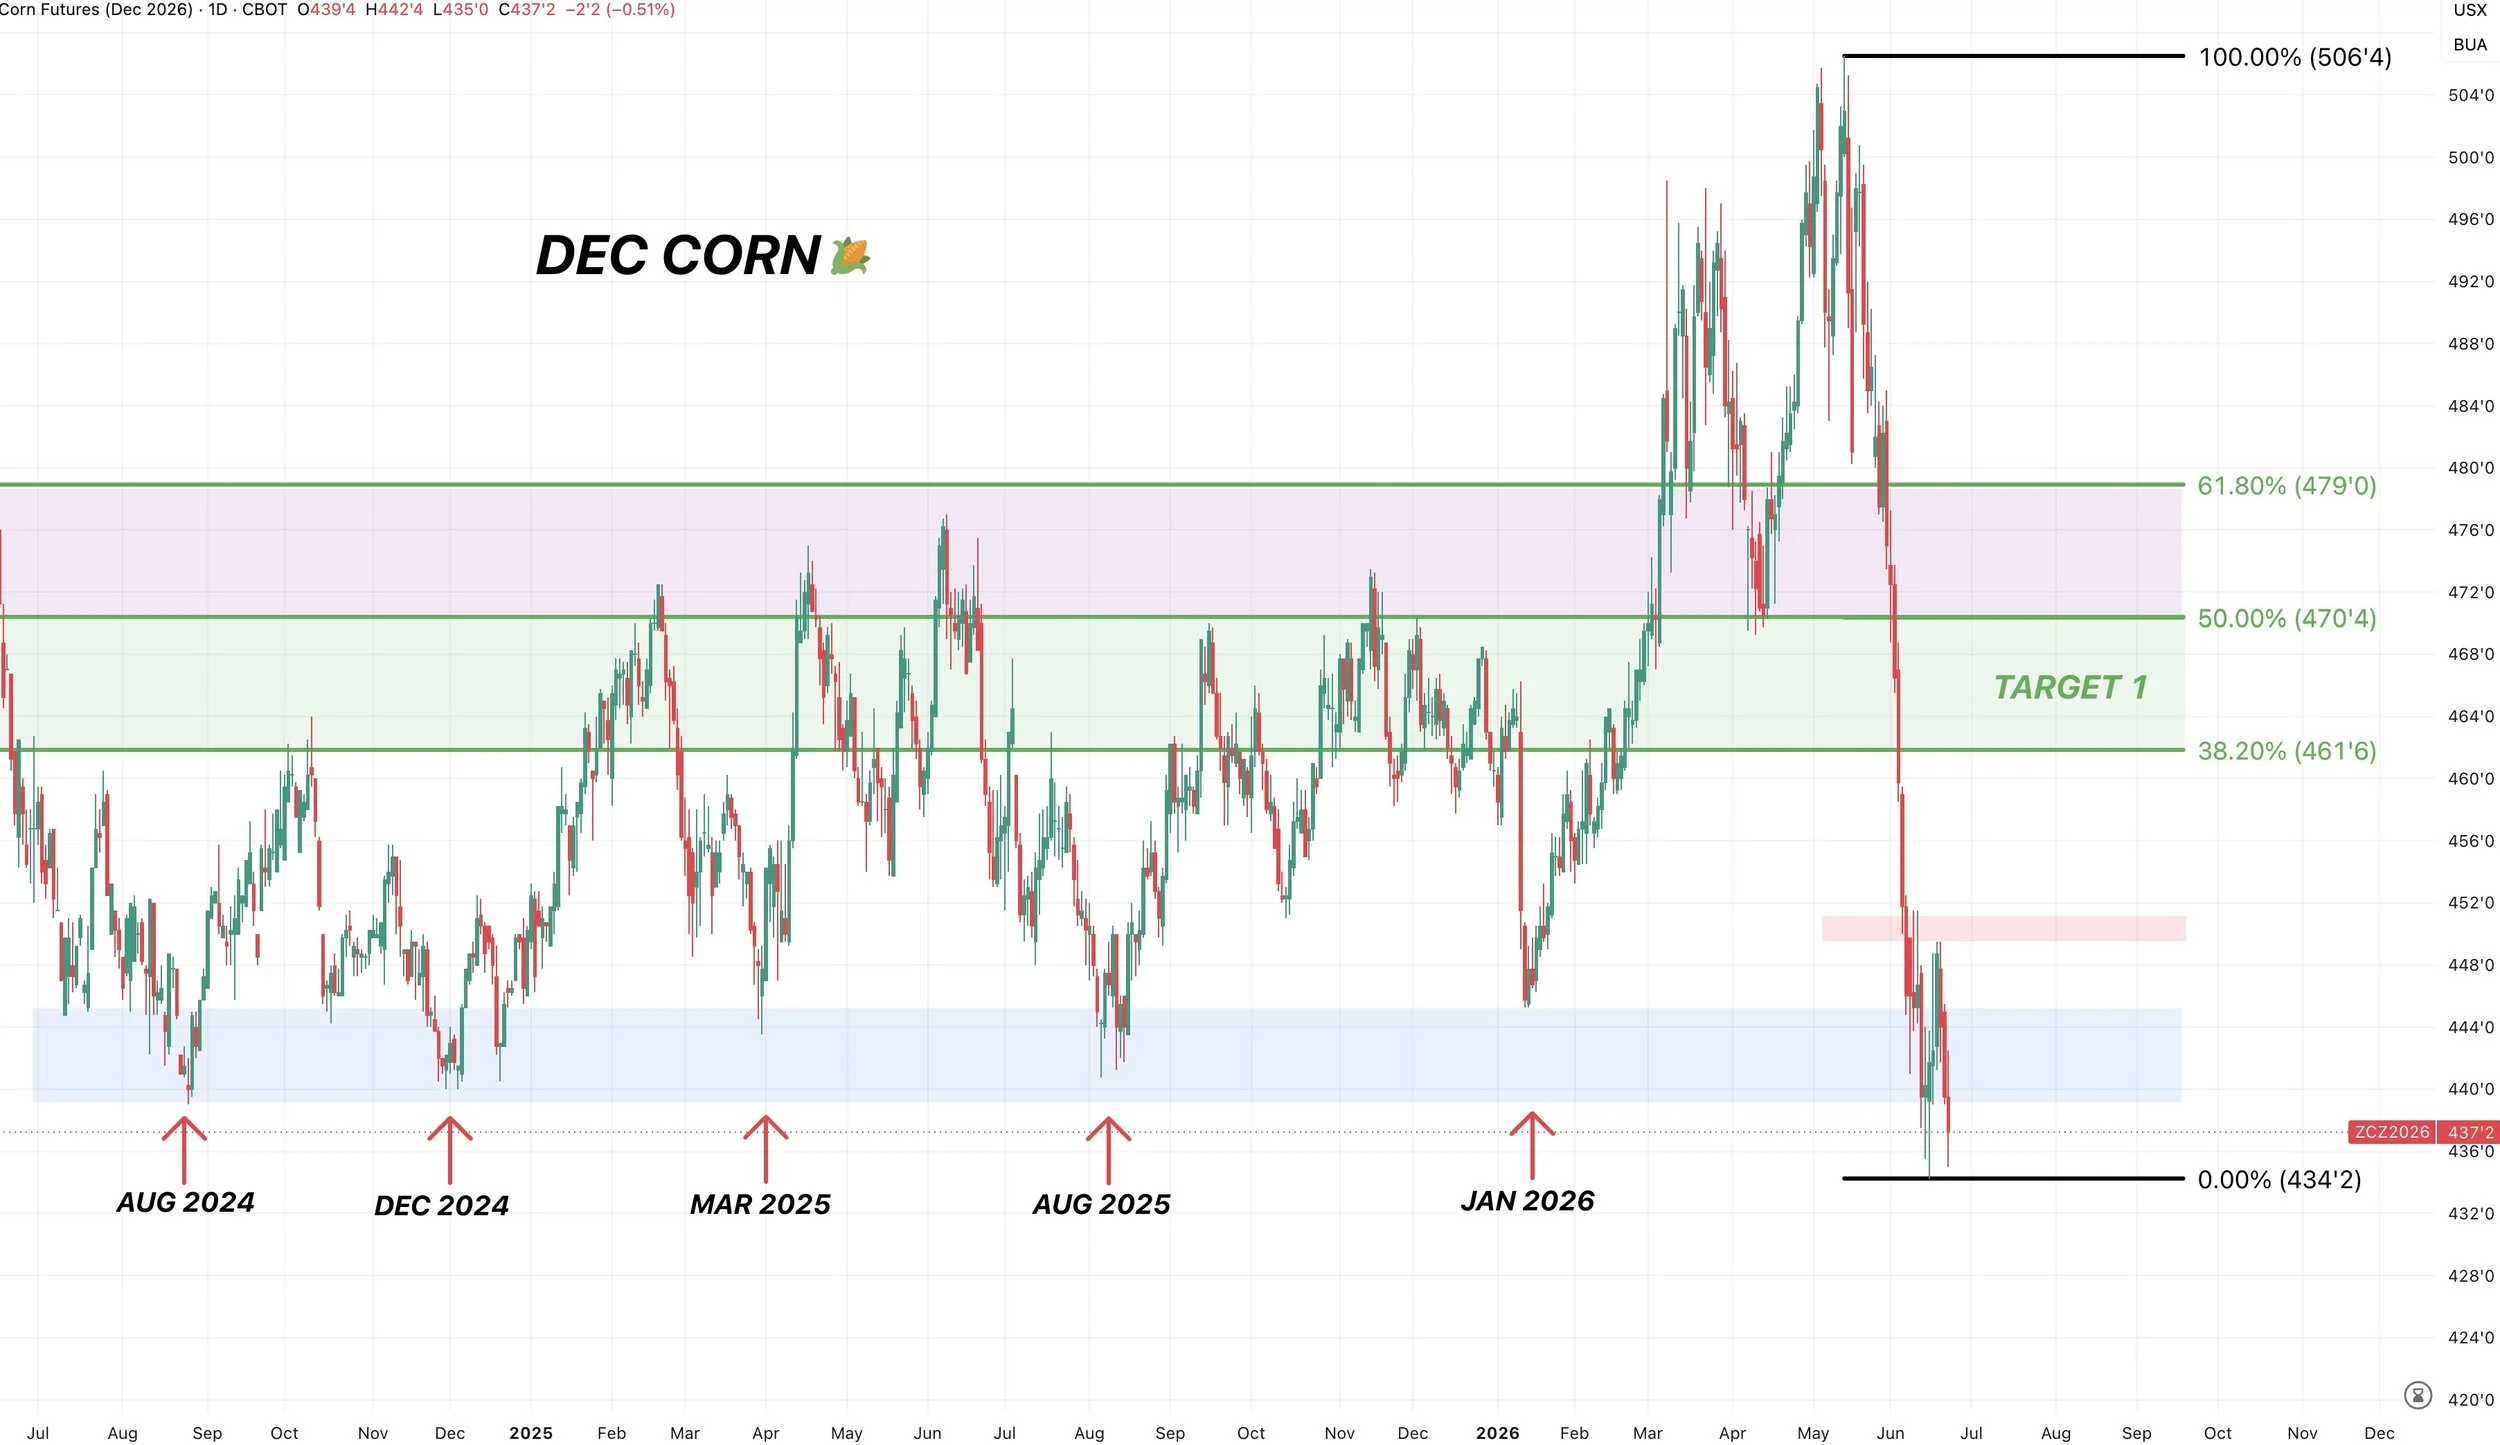
Dec Corn Chart:
Right back at major support.
We've held this support for 2-years now.
This is still the area we want to hold to prevent us from getting a leg lower, as there is zero support below.
If we are able to bounce here, we could be looking at a potential double bottom. But have to bounce right now otherwise we're catching a falling knife.
If we get a rally towards $4.60 to $4.70 we want to respect it.
Need to break above the recent highs and the $4.50 level to get confirmation of a local bottom.
Sep Corn Chart:
Need to hold here or we simply open the door lower once again.
Breaking above $4.33 would be the first sign we've put in a local bottom, as that is resistance.
If we get a move towards $4.44 to $4.53 that's the level to defend.

Soybeans
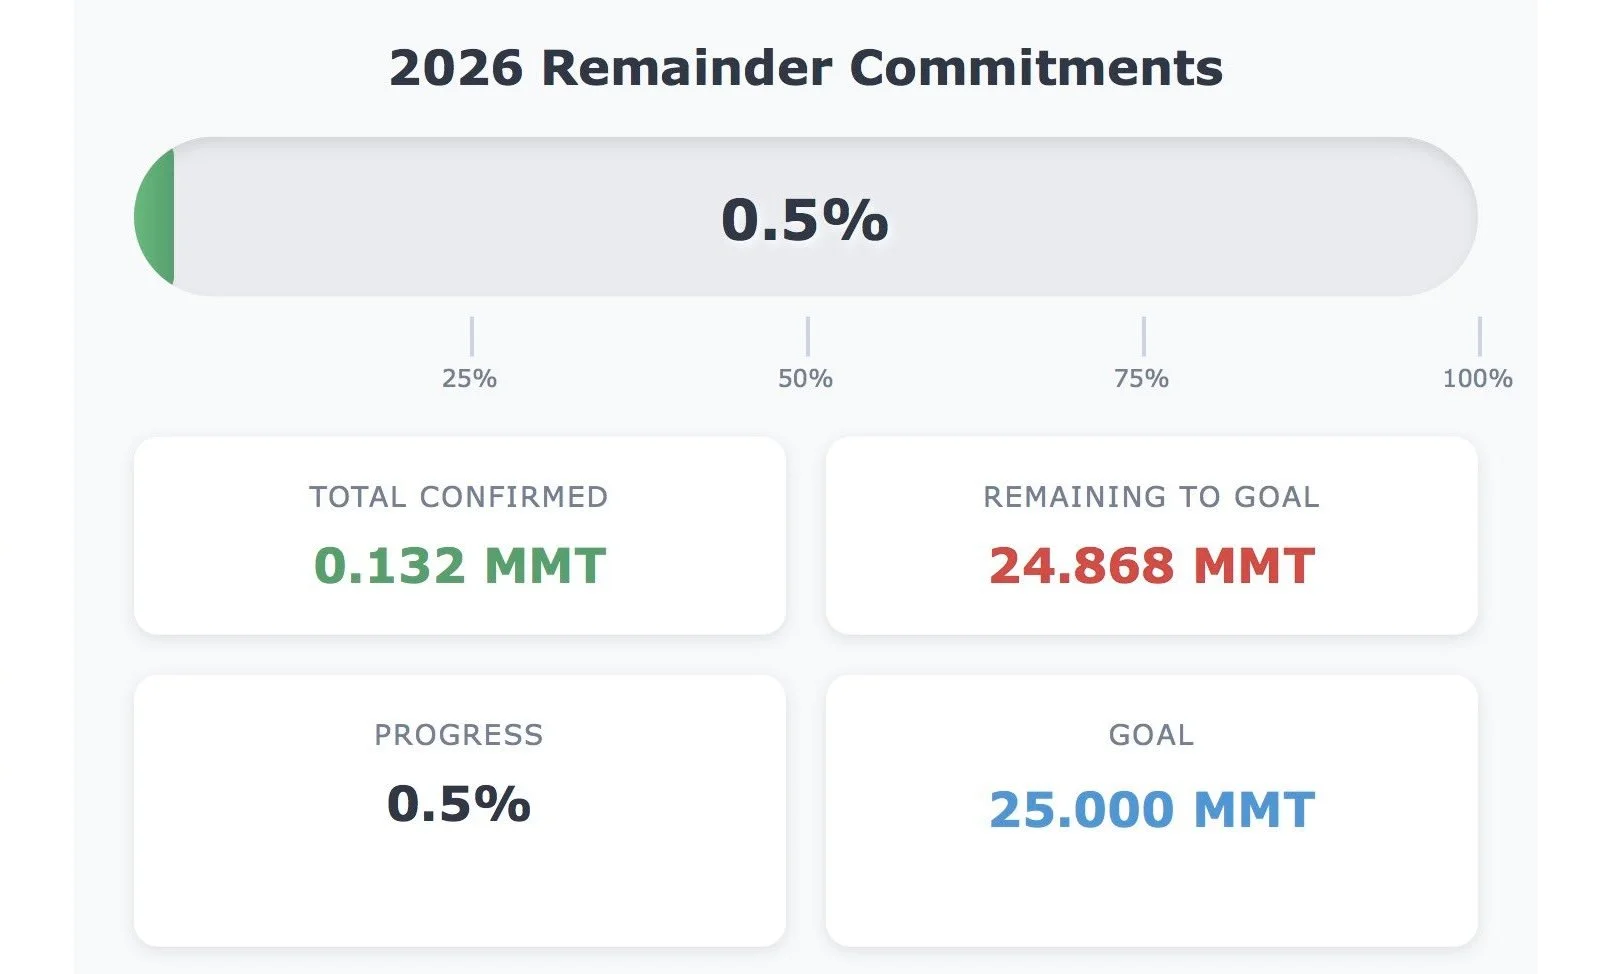
Like we talked about last week, China finally bought some new crop soybeans.
But the market seems a little disappointed it was such a small amount, given it was only 0.5% of the total number they commented to.
Tracker from GrainStats (@GrainStats on X)
The funds have dumped alot, but are still long the soy complex. Largely due to soybean oil.
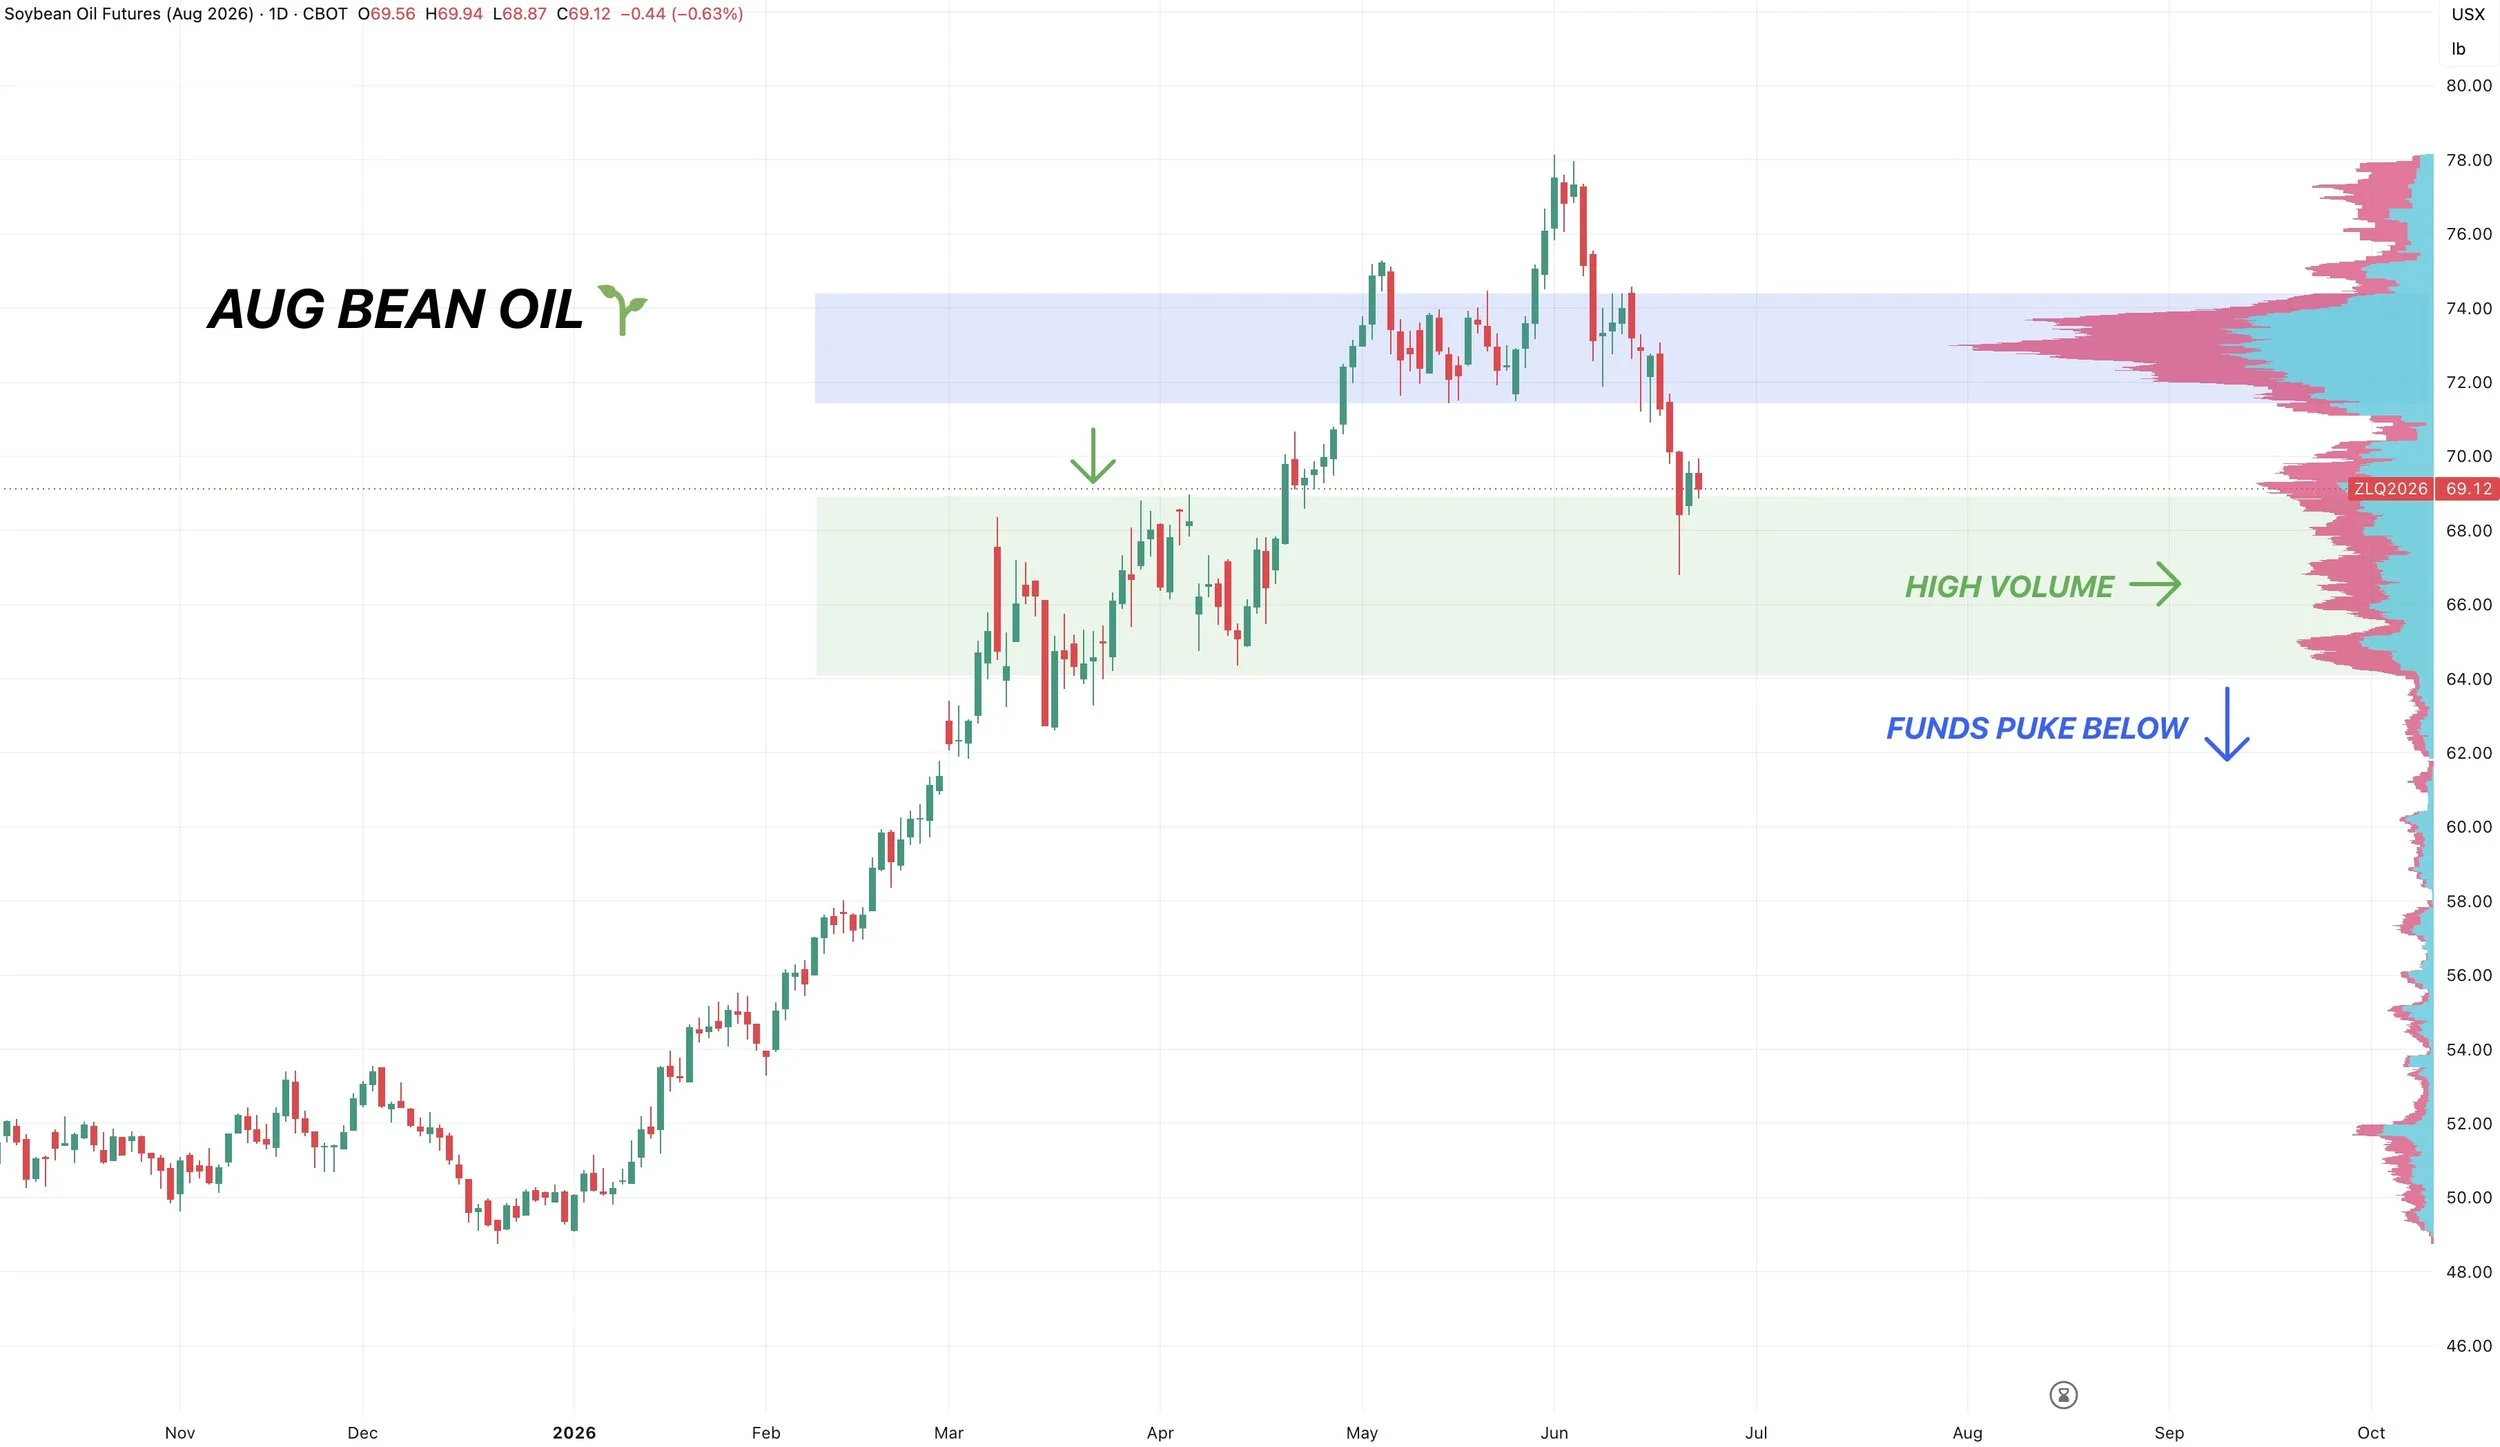
Bean oil is still going to be one of the bigger things to watch here.
If they start to puke out of that bean oil position, they probably start to puke out more of that soybean position.
Right now, soybean oil is sitting at support. Bouncing at prior highs.
If we start to break below this range, they could look to sell. As there is plenty of air below.
If we continue to hold support, I don’t see why they'd look to exit.
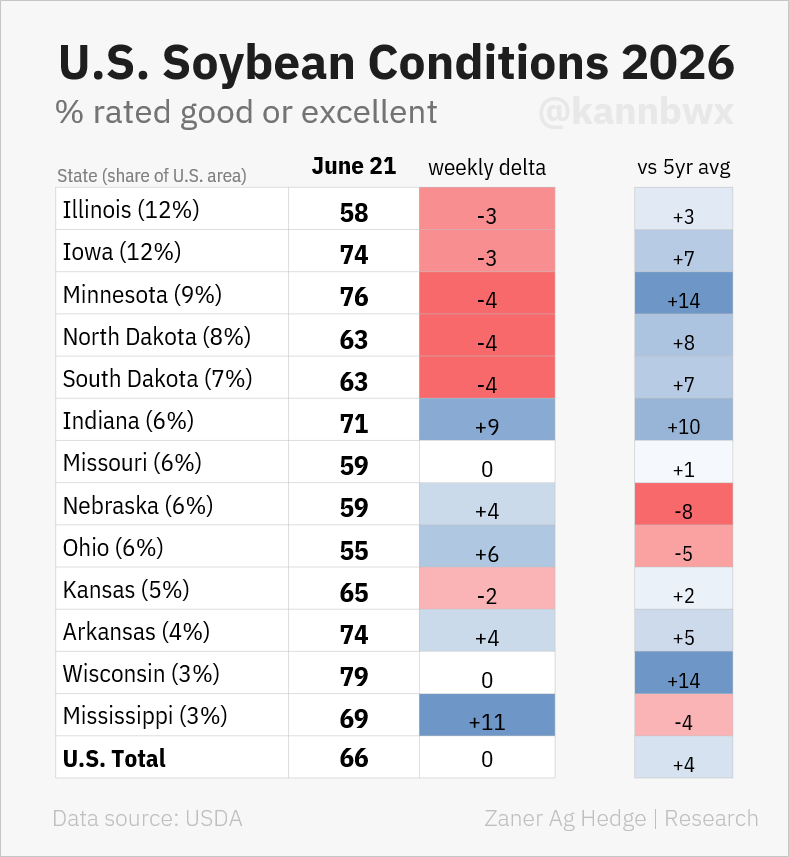
Like in corn, national crop ratings came in unchanged for the week.
However, the top 5 states all saw declines vs last week.
So once again, the massive amount of rain might not exactly be helping.
Chart Credit Karen Braun (@kannbwx on X)
There is still plenty of weather season left for soybeans.
The crop is obviously far from being made.
I've seen some extended forecasts saying July is going to be wet.
I've seen some calling for a dry July.
For example, here is a model run for July.
If this becomes verified, there is zero weather premium built into this market after falling over $1.00
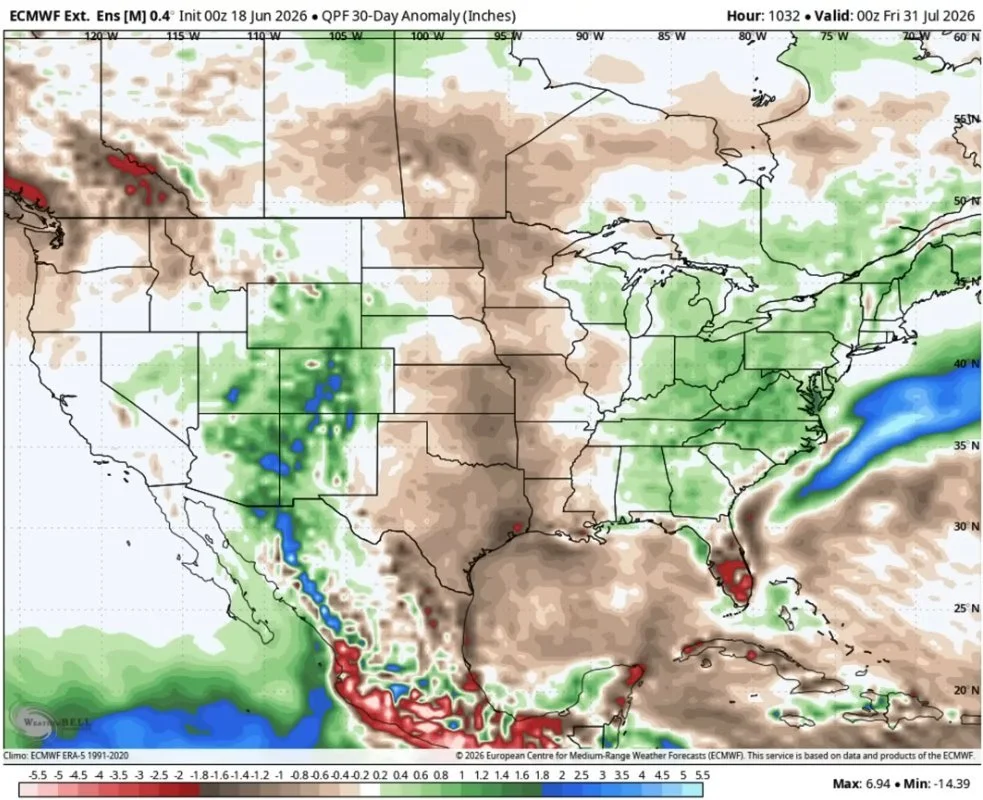
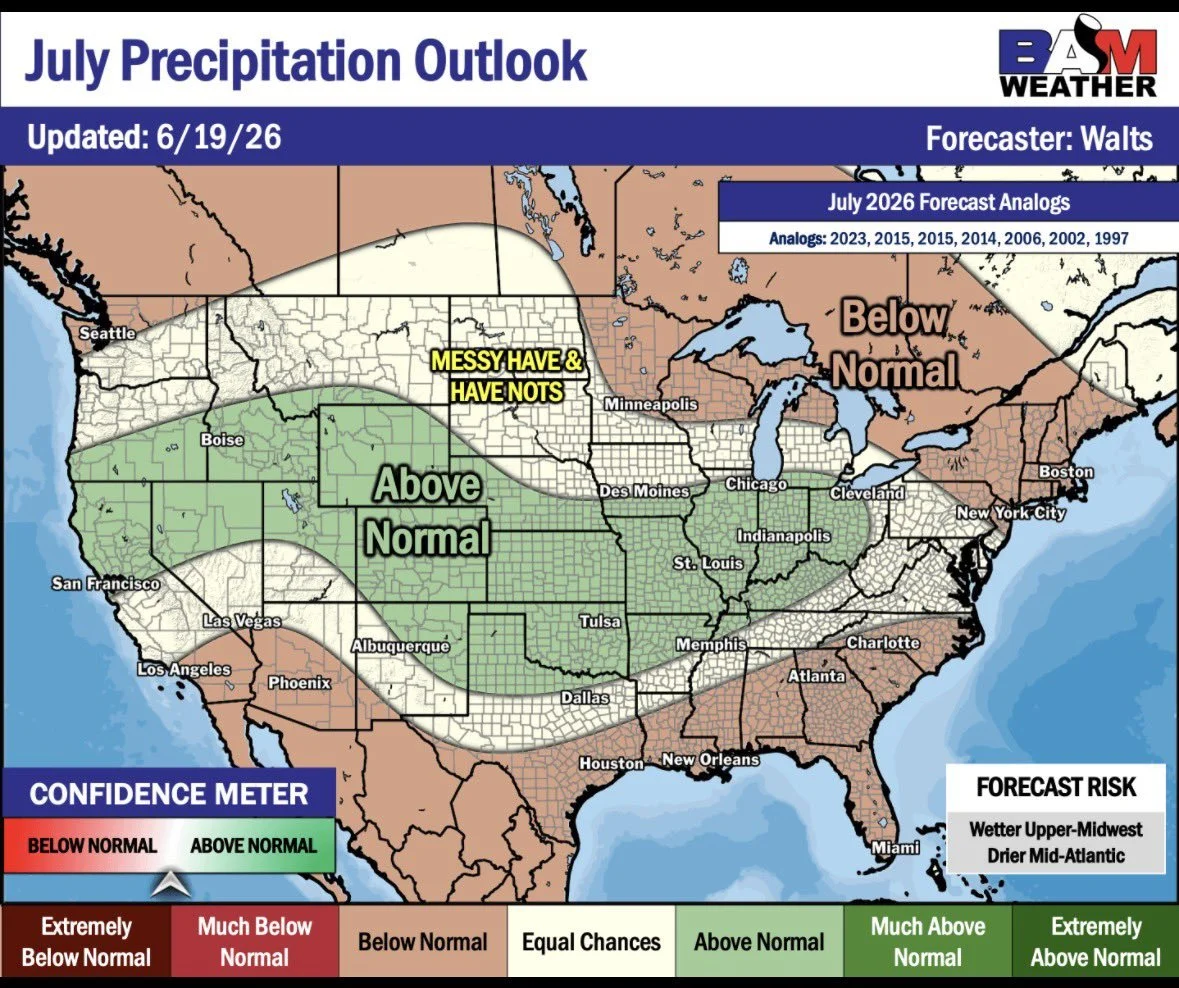
Then here is BAM Weather's outlook for July. They are callling for plenty of rain.
So it seems safe to say no one really knows what it's going to look like further than 10 days out.
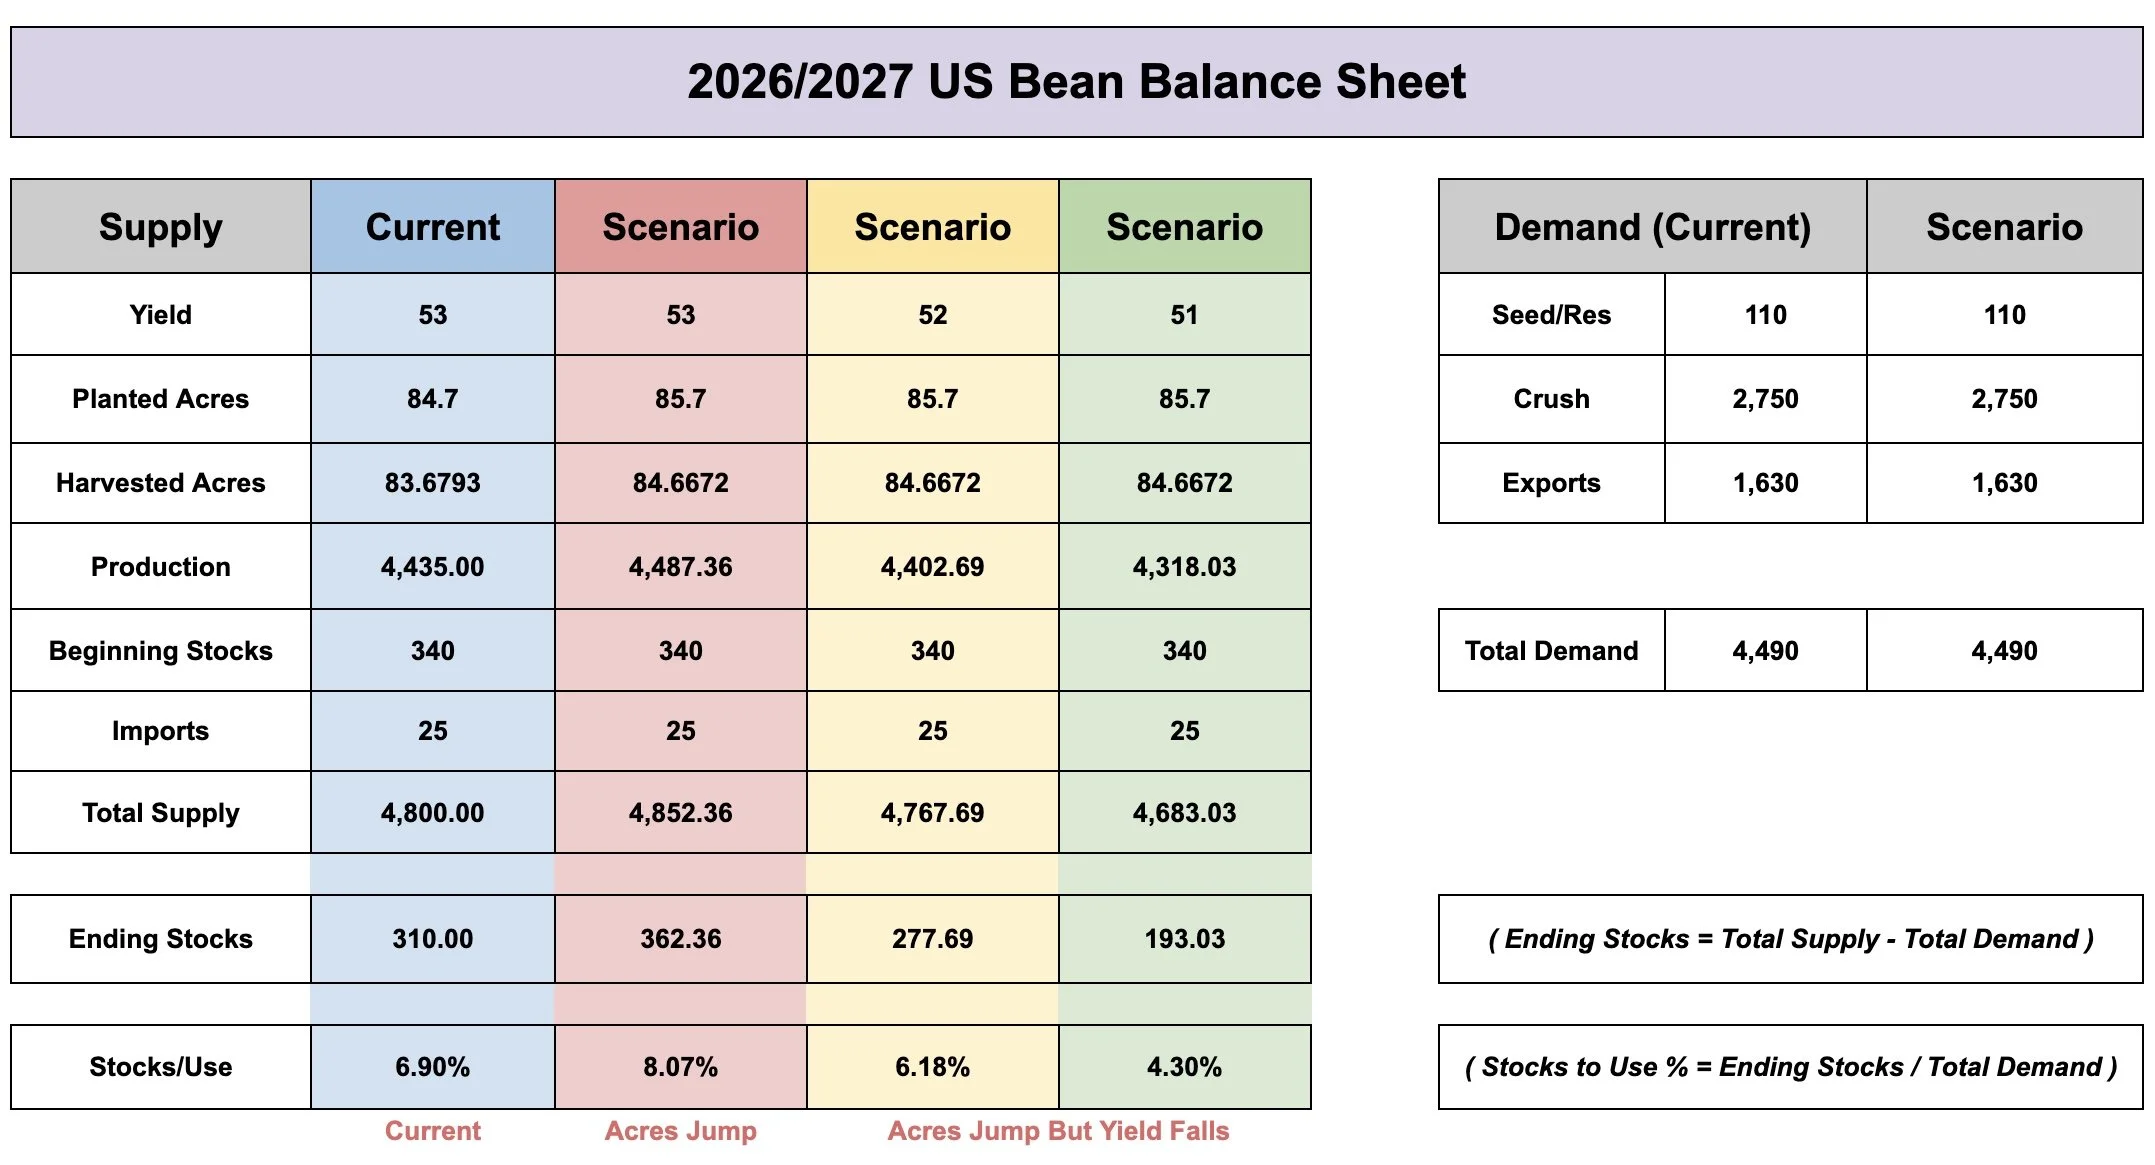
The new crop balance sheet for soybeans doesn’t have this massive amount of room for error either.
Here are a few scenarios where we tweak yield and acres.
Even if acres end up coming in higher, you still need a big yield to keep the carryout from getting tight.
For an example, if acres jump by 1 million but yield falls even slightly, your carryout still decreases.
So like corn, there is still "potential" if we don’t raise yet another record yield.
Aug Beans Chart:
So far we found life after giving back 50% of the entire rally from contract lows.
We need to hold that $11.13 level or we could drop to $10.85. Which gives back 61.8% of the rally from contract lows.
If you notice, we have a volume gap down to that level as well. So we need to hold the recent lows.
To the upside, we want to look to reward a rally to $11.68 to $11.83 if it comes. That claws back 50% to 61.8% of the sell off. It's also an area of high volume.

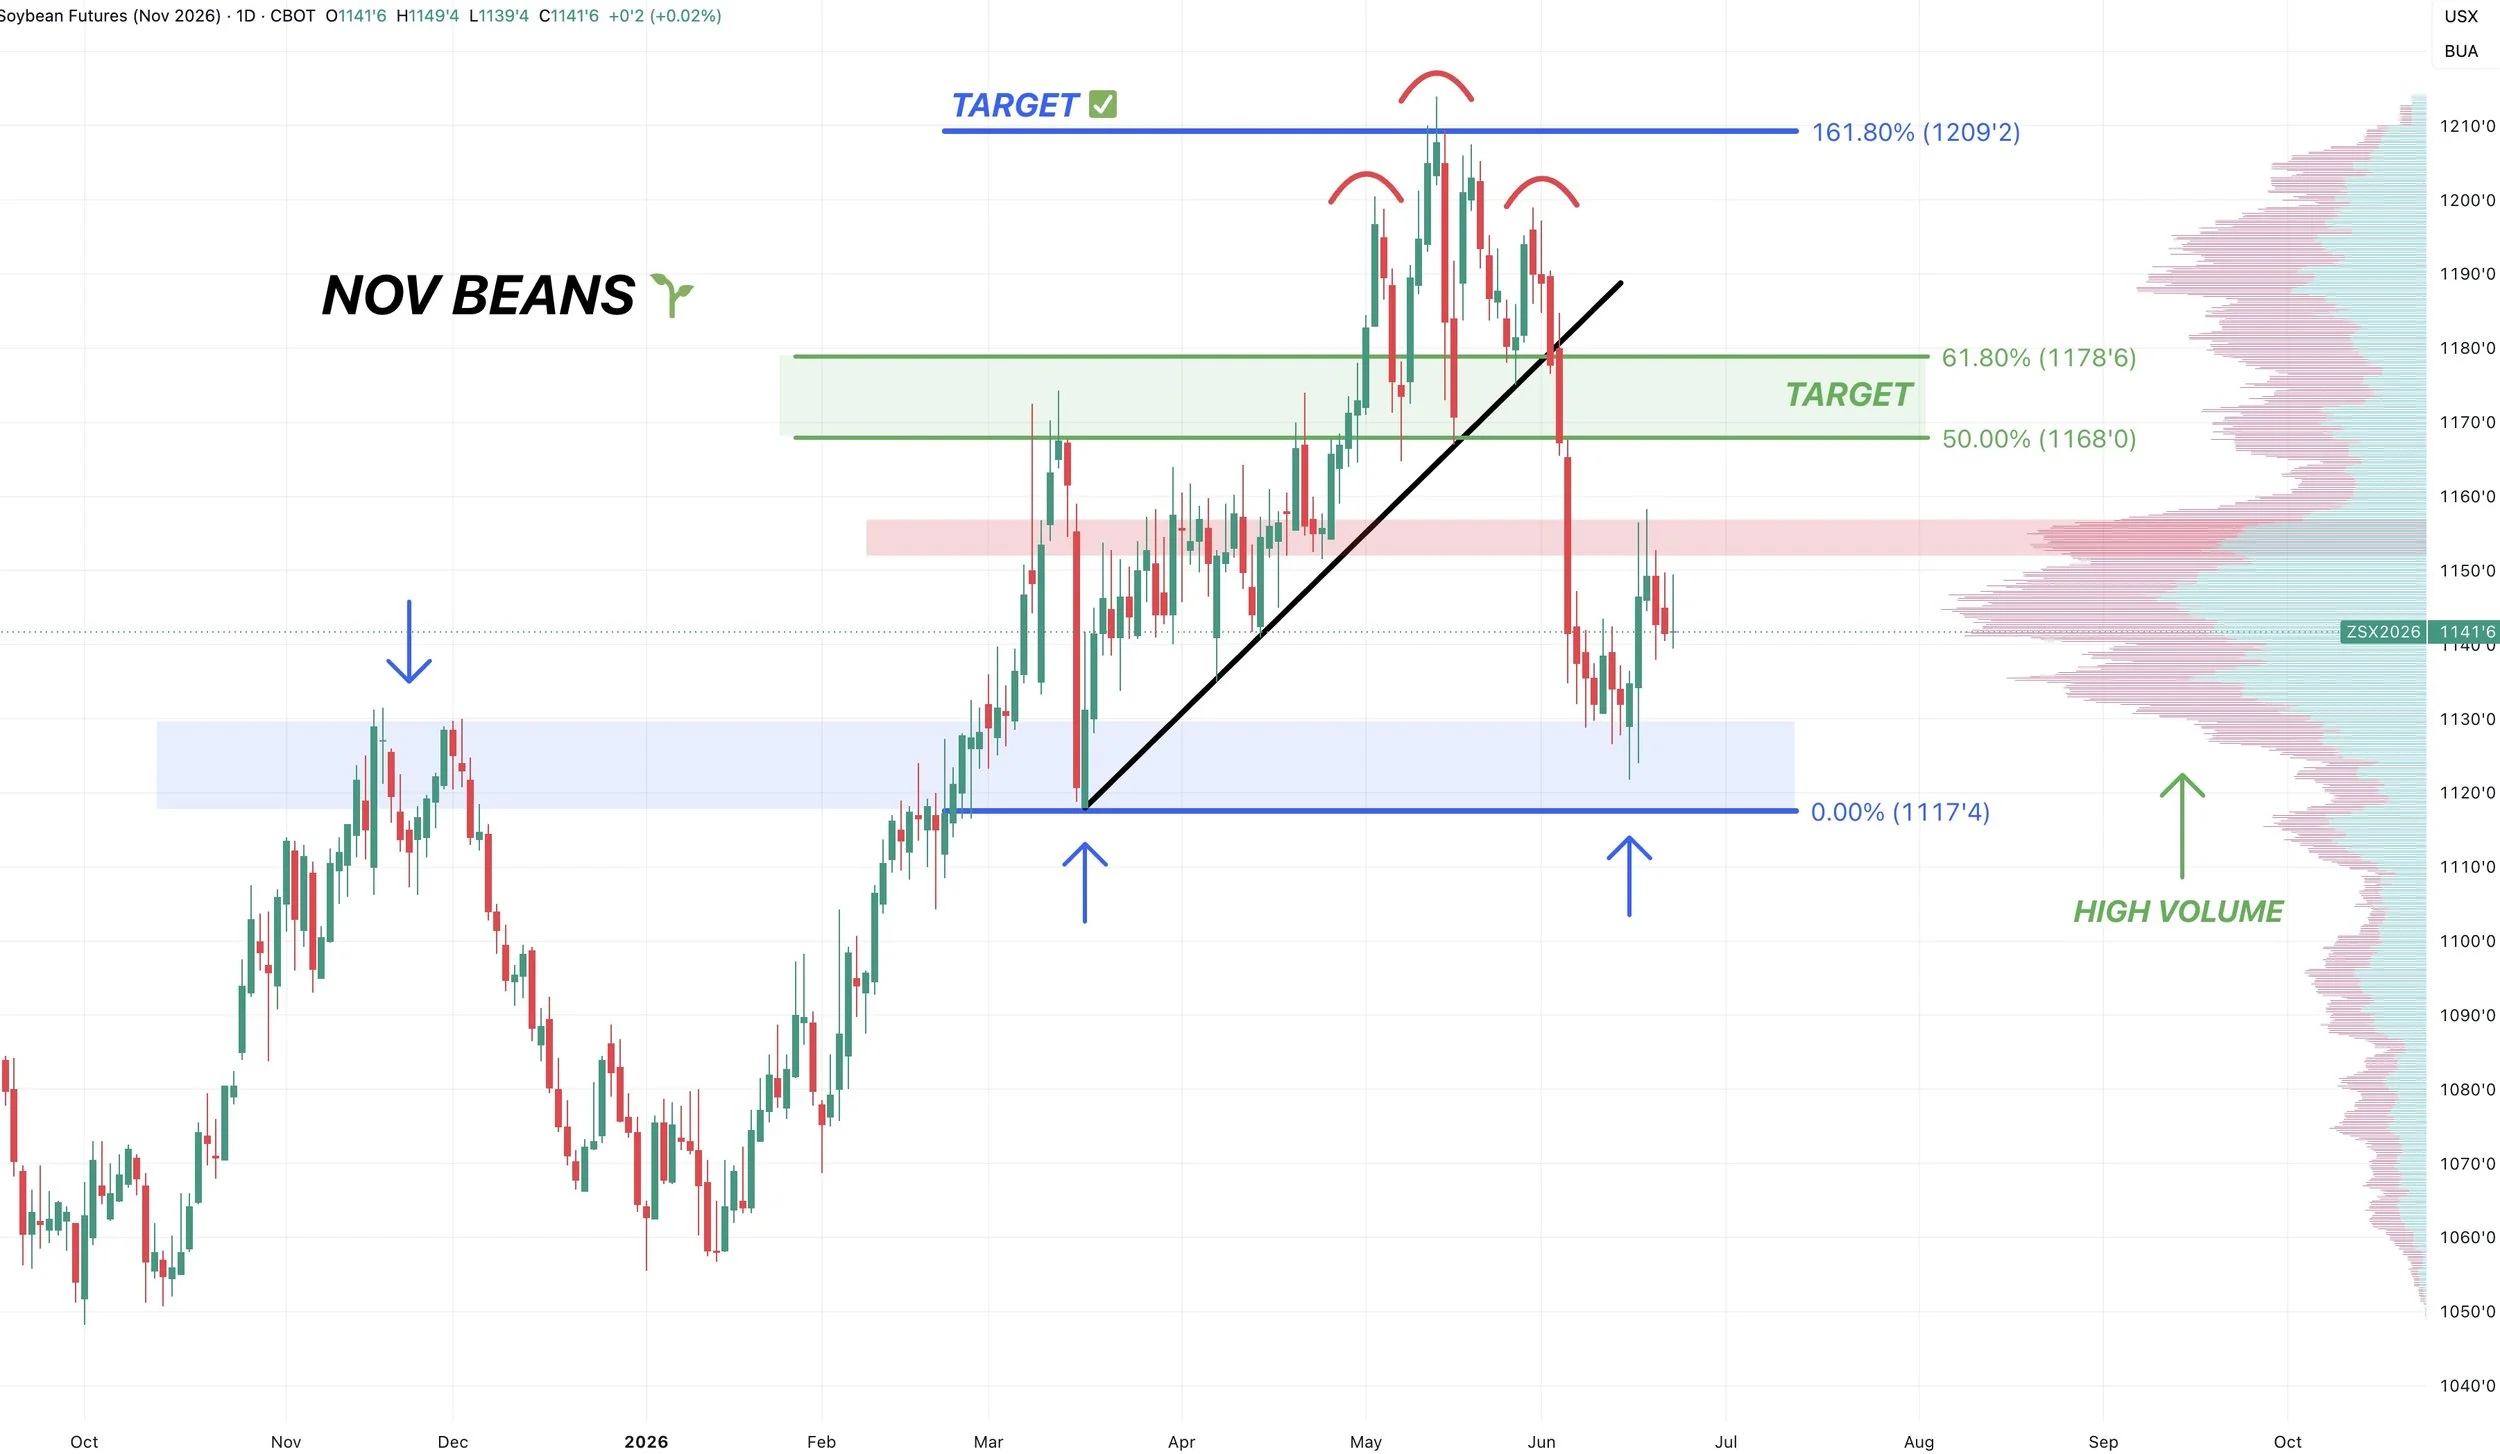
Nov Beans Chart:
We bounced right where we needed to.
Now sitting in an area of high volume and chop.
The recent lows are still the spot to hold as we have very little support below.
We bounced right at the highs from November and lows from March.
If we can break above the recent highs, we could get a run up towards $11.68 to $11.79
That would be an area to look to defend. It reclaims 50% to 61.8% of the sell off. The most common level for a relief bounce.
That same area is prior support and an area of high volume.
Wheat
Seasonals aren’t on wheat's side here.
However, the EU is burning up a little bit. As they are going though a heat wave with the models turning hotter.
So that's a friendly factor but isn’t a game changer or anything.
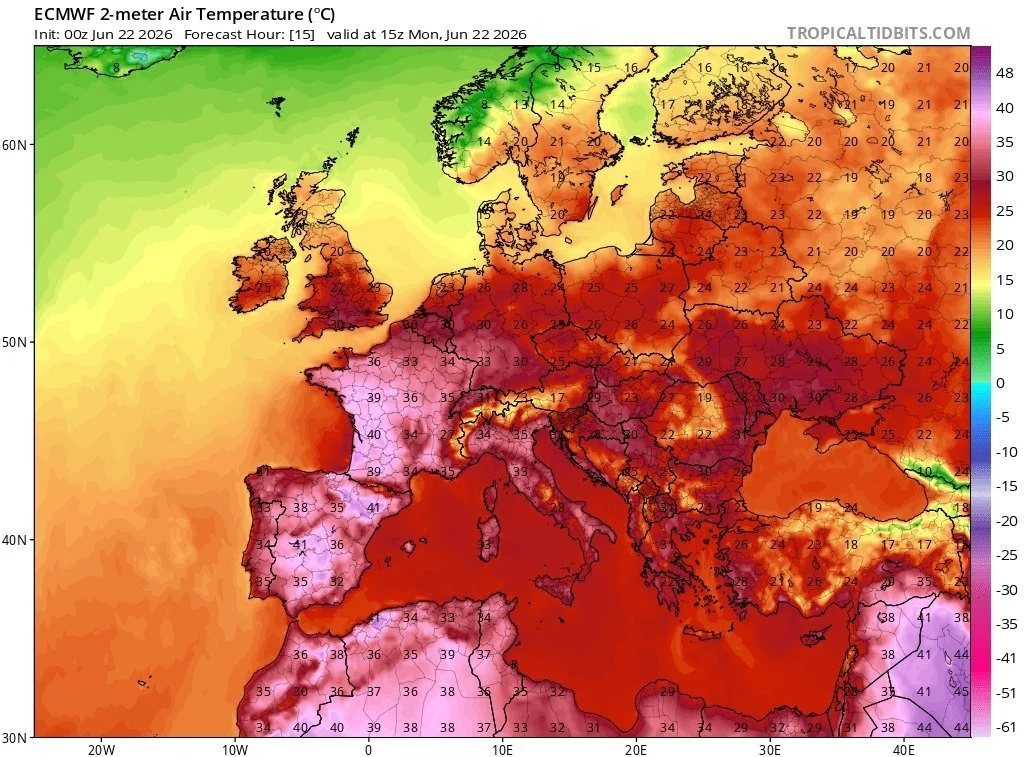
Obviously it's already known, but the US crop is one of if not the worst of all-time.

Bottom Line:
Seasonally we are still in a weak time frame where we are suppose to struggle.
We've priced in the war. We've priced in the awful crop.
We simply lack a short term catalyst.
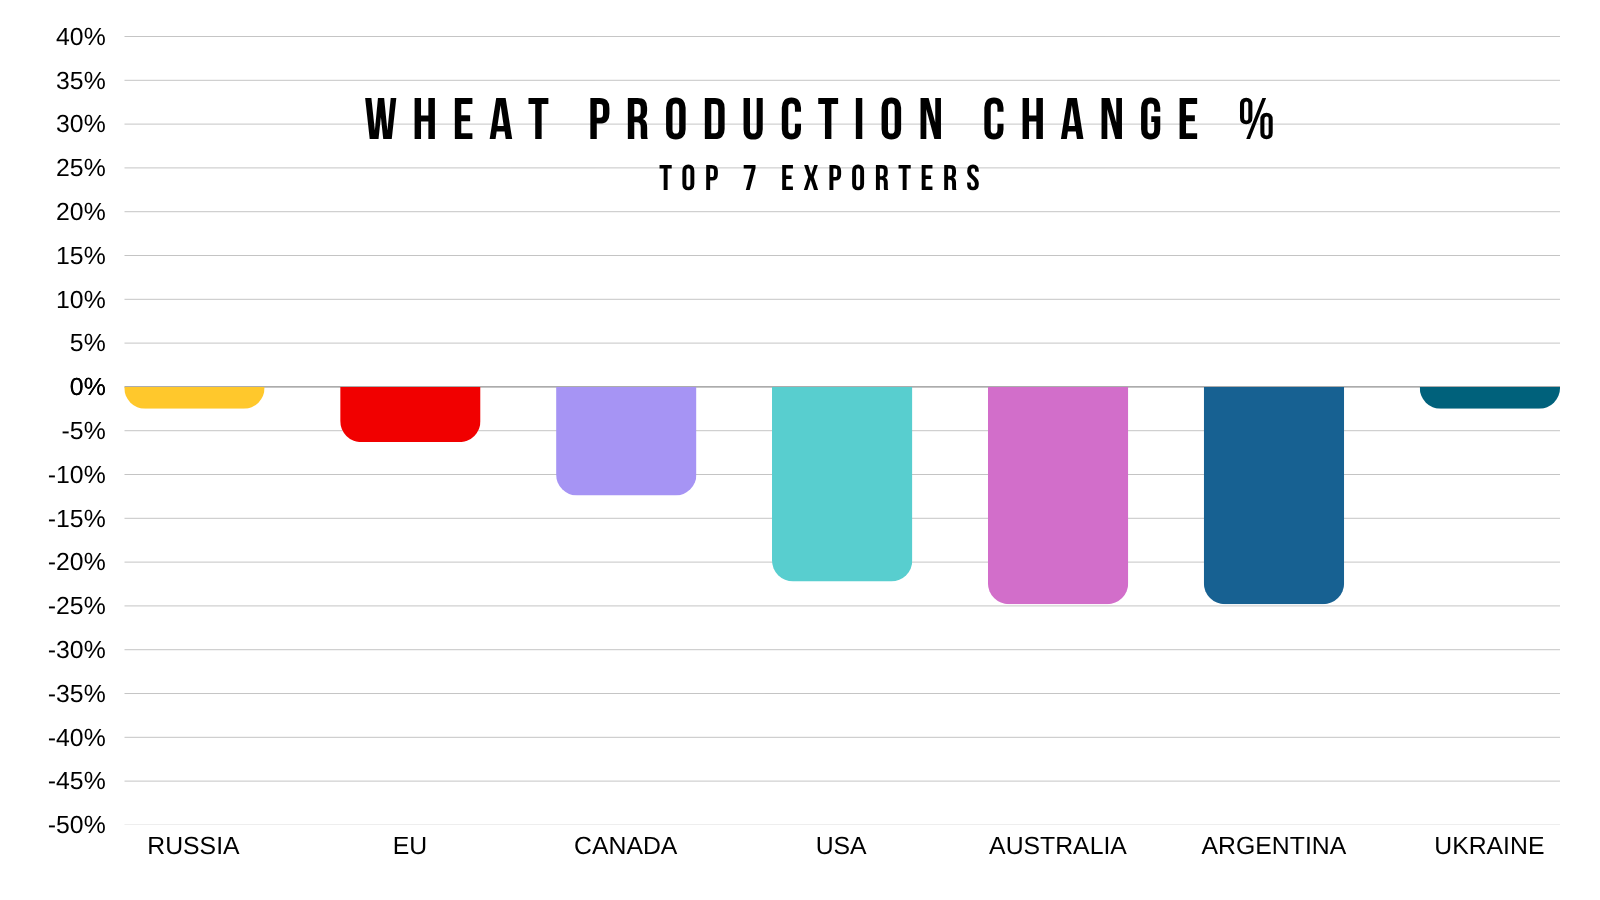
Long term the wheat market still has potential given that every major exporter of wheat is expected to produce less wheat this year.
Below is the YOY % change in production for the top 7 exporters of wheat.
In order biggest exporter to smallest:
Russia: -2.55%
EU: -6.28%
Canada: -12.40%
USA: -22.22%
Australia: -22.19%
Argentina: -24.78%
Ukraine: -2.49%
You have 3 of the top 7 exporters all already expected to produce a quarter less than they did last year.
What happens if the fertilizer situation leaves a lasting impact?
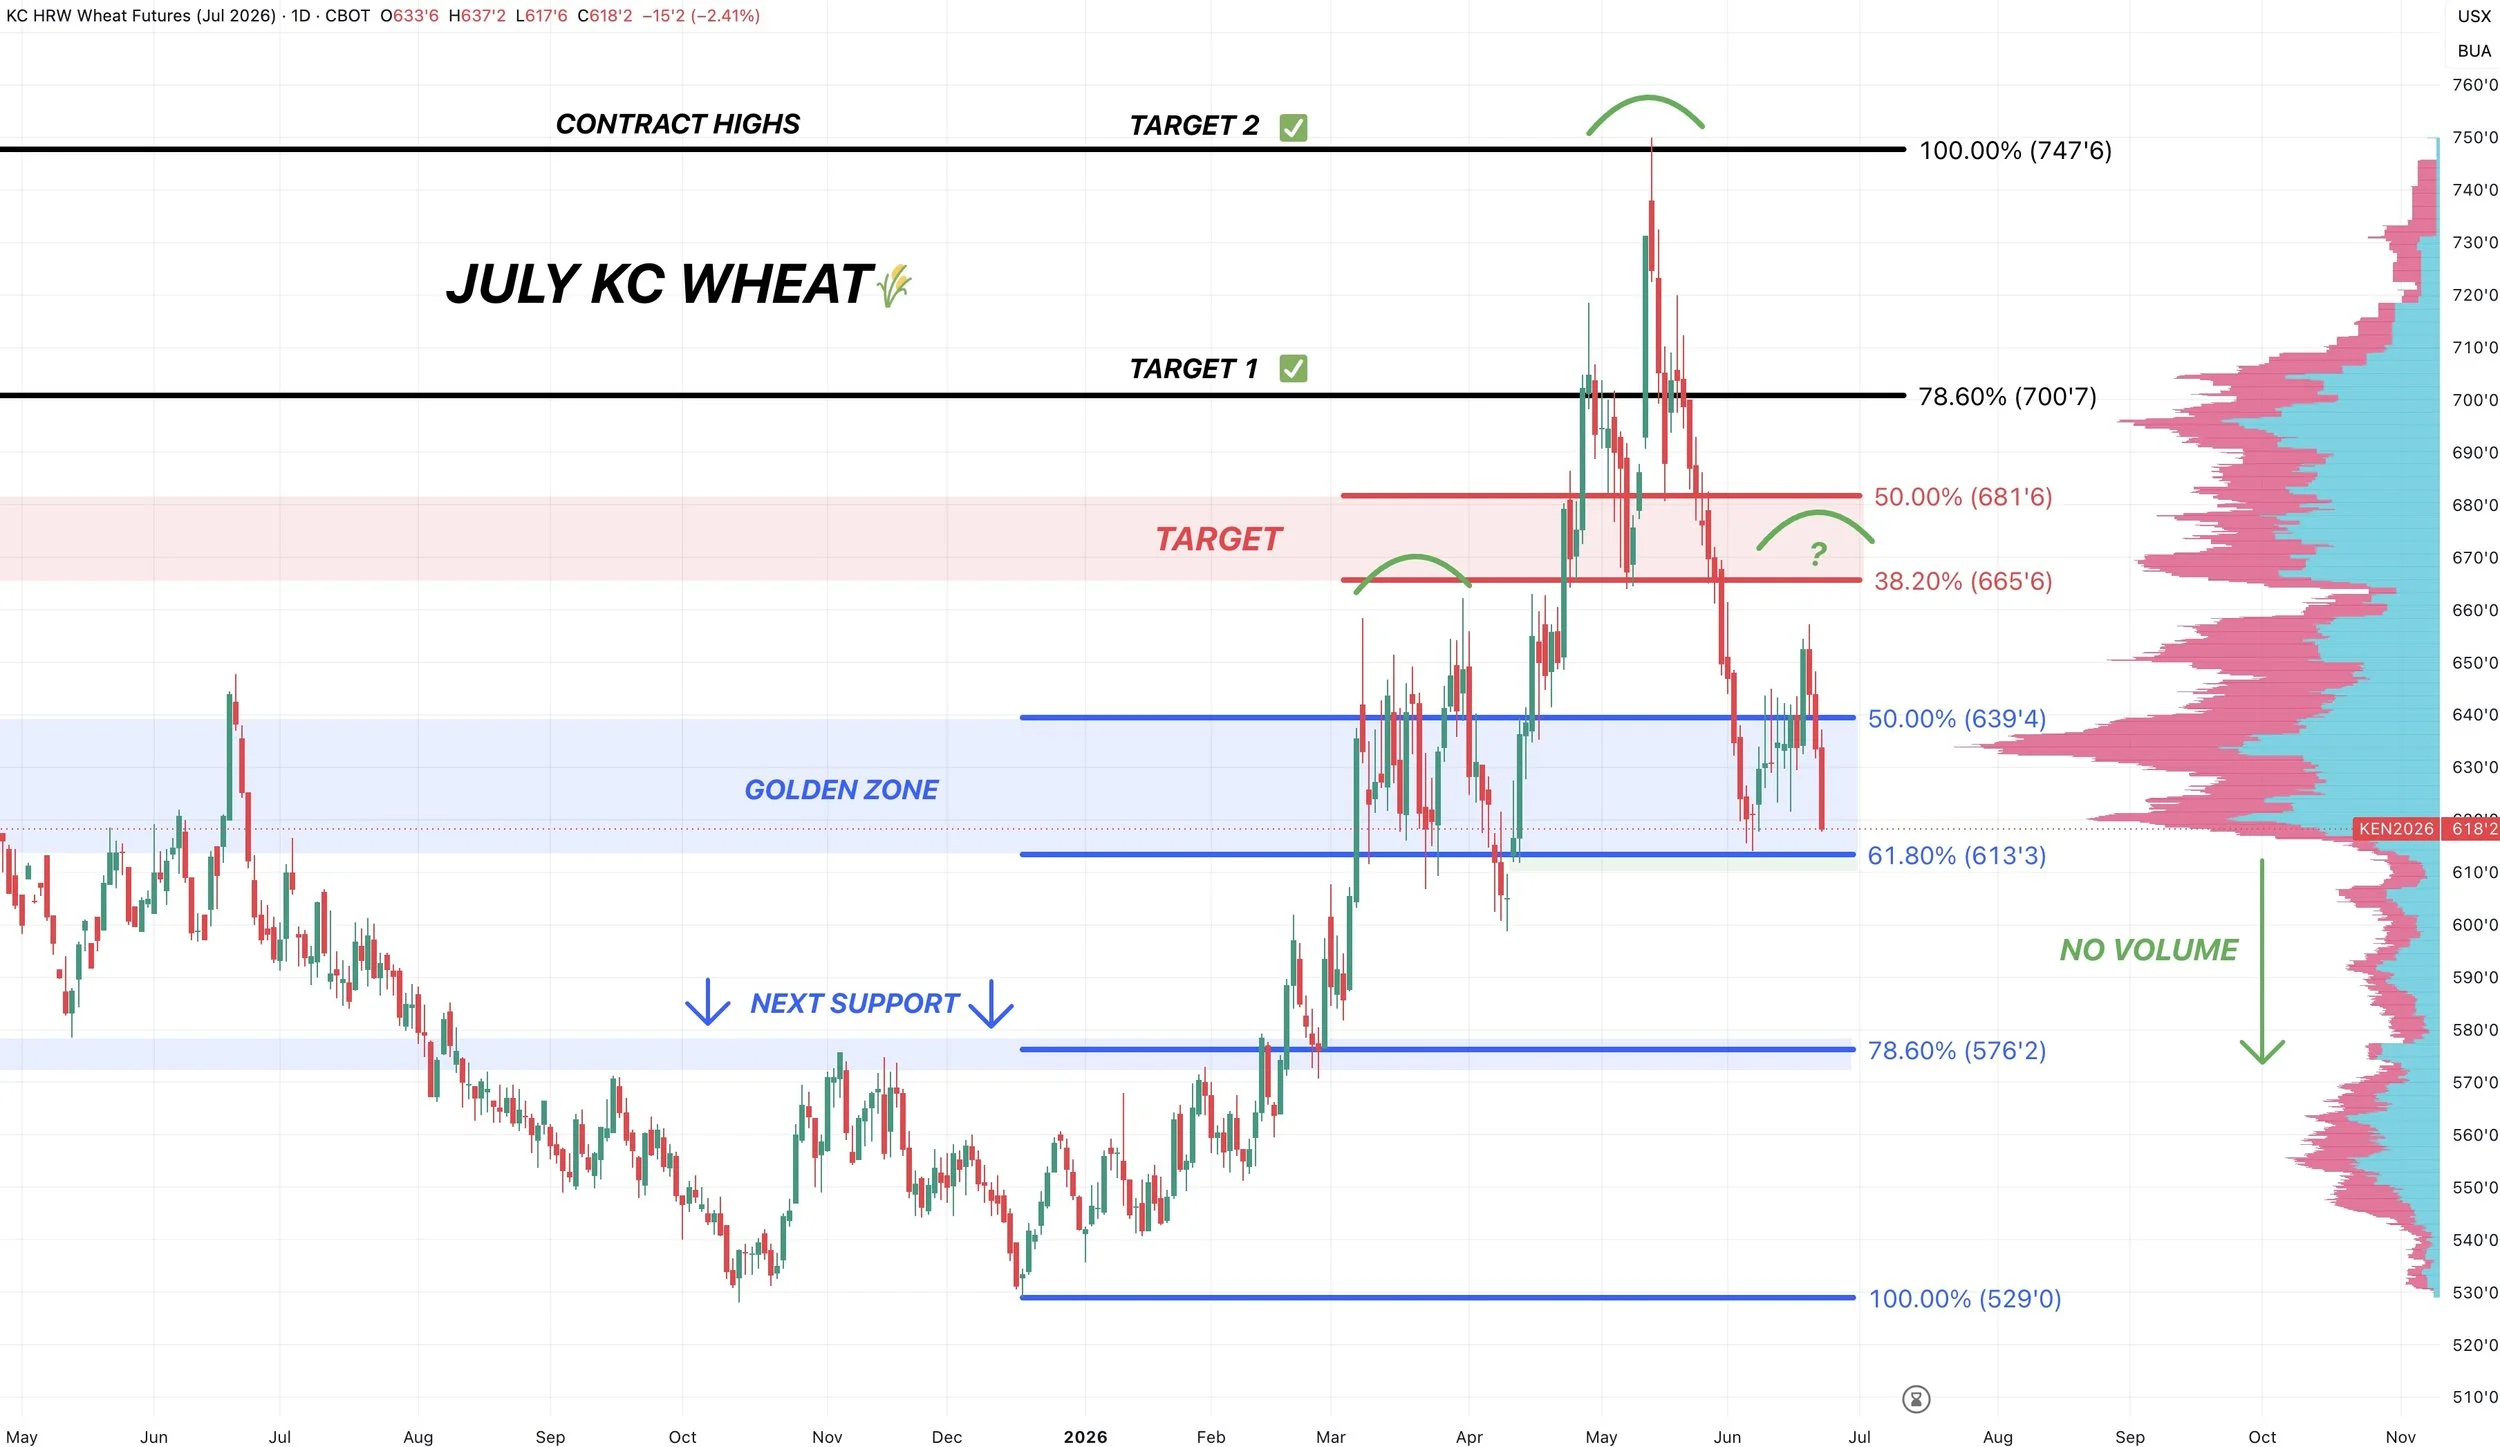
July KC Chart:
The chart went from looking pretty solid just a few days ago, to now pretty discouraging.
We gave up the entire mini bounce. Now right back at some must hold levels.
We bounced after giving back 61.8% of the entire rally from contract lows to contract highs. The most common retracement level.
If we fail to hold this level, we likely drop down to the $5.75 area.
That's the next retracement, the 78.6% level.
It's also the next area of high volume. As there is zero volume beneath this level.
The bounce didn’t get as high as I would’ve liked, but we still have the possible head and shoulders pattern in play that we’ve been cautious of. Which verifies if we break below this support.
So absolutely an important spot to hold.
Cattle
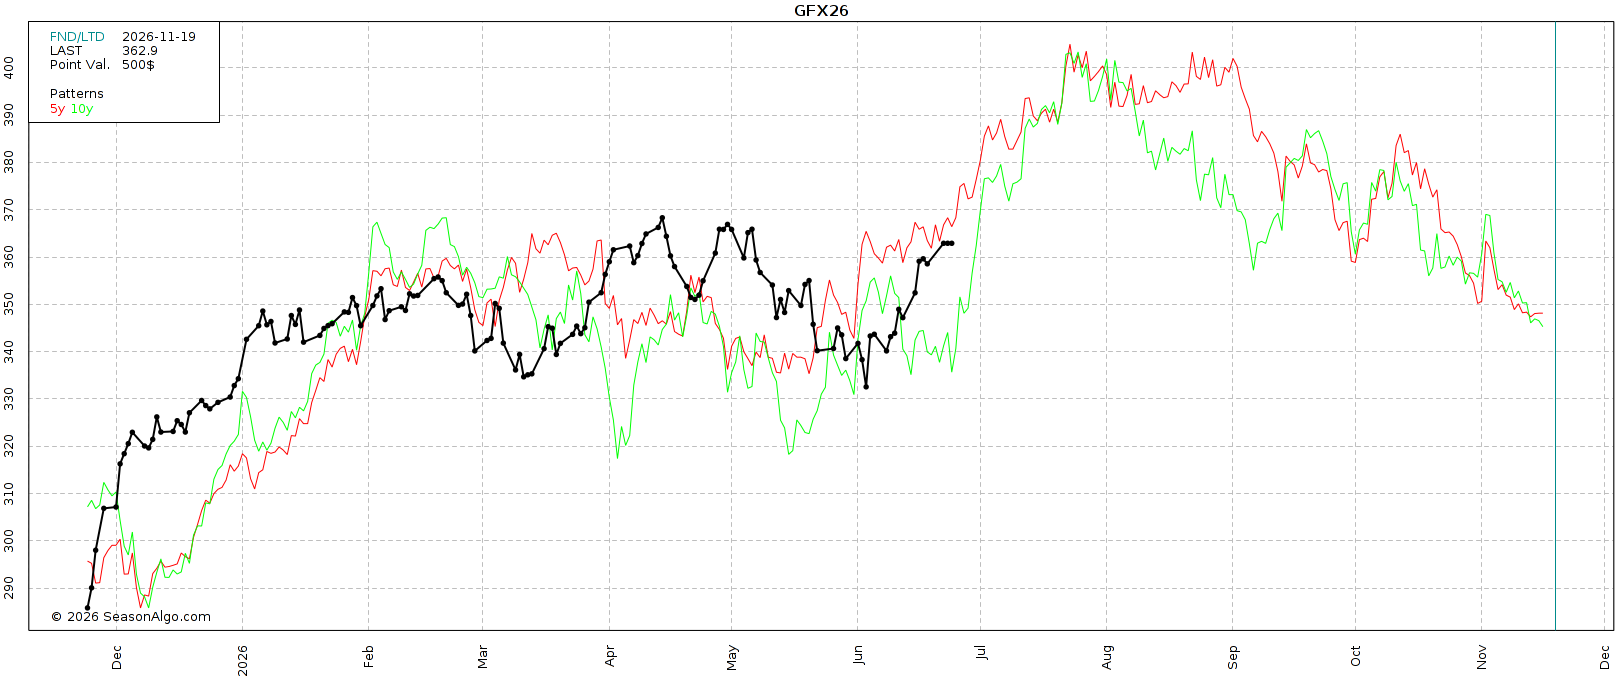
Seasonals Say Higher?
From today's date by July 26th, feeder cattle has traded higher 10 years in a row.
So the next month often tends to be friendly for the cattle market as we head into the strong seasonal beef demand.
The typical seasonal high for cattle comes around the end of July and early August.
Although the last 5 years haveon average seen a secondary high in September.
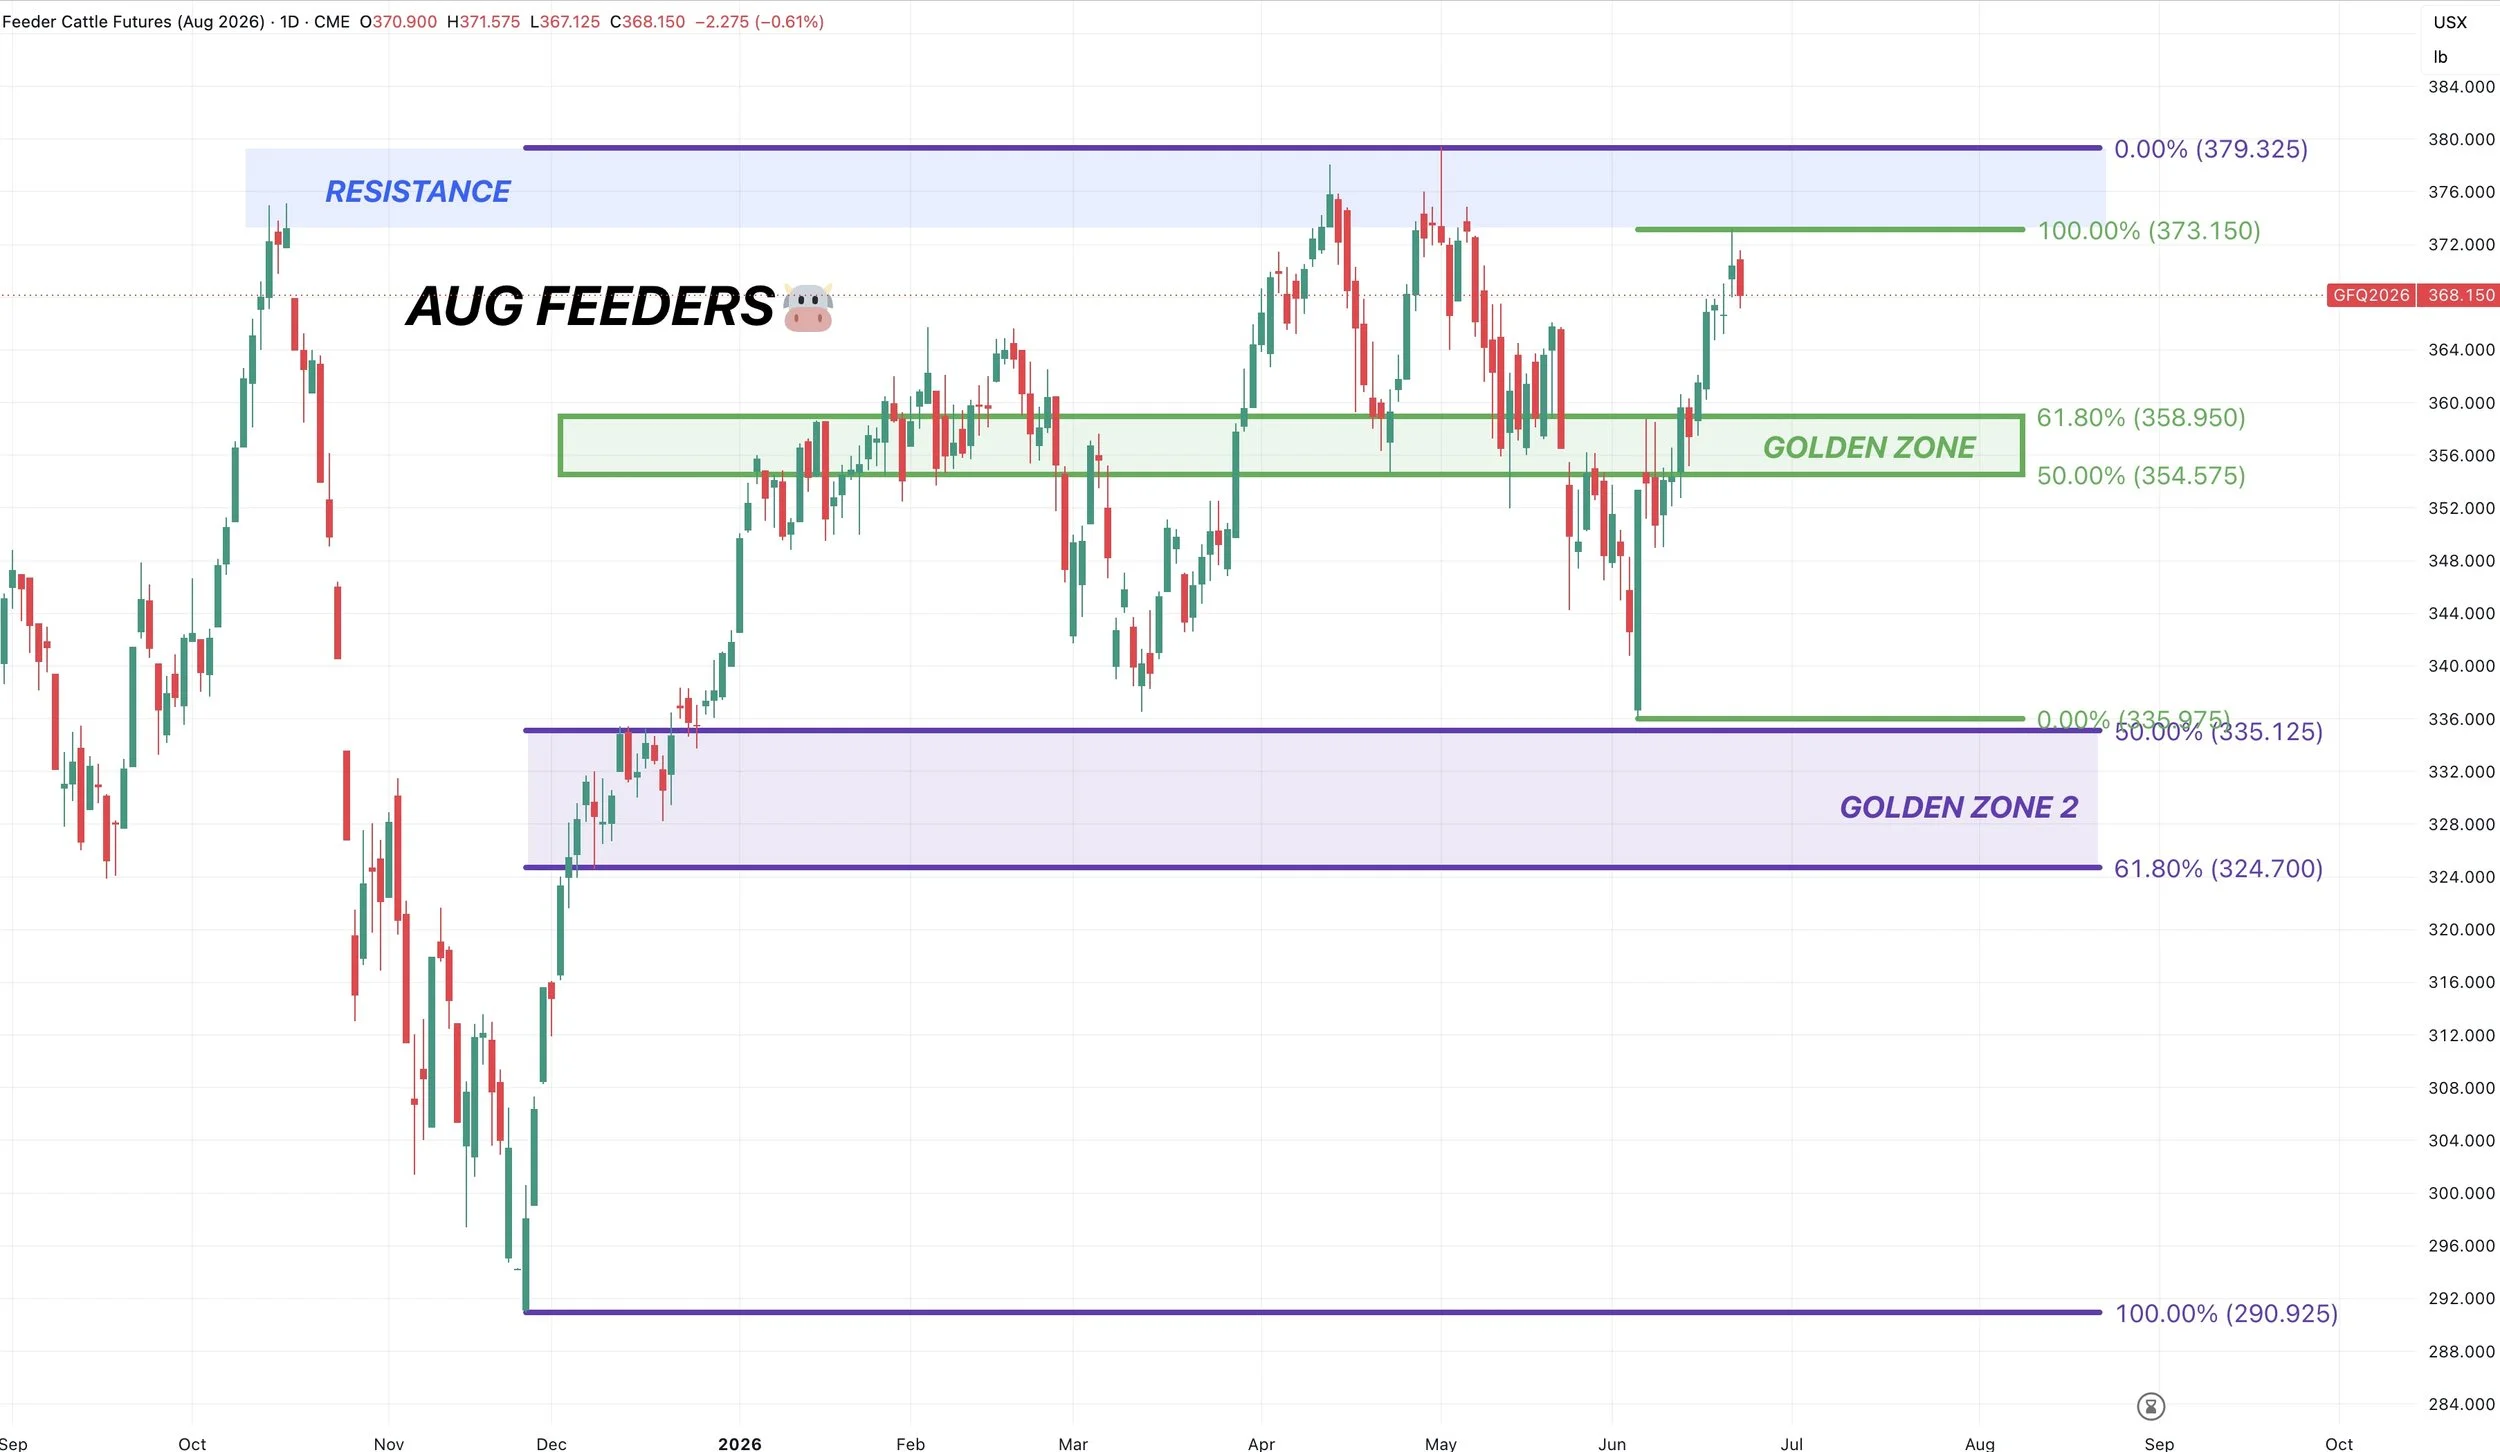
Aug Feeders Chart:
Despite the seasonals saying higher, we still feel like it makes sense to have some protection at all-time highs.
We are right back at the highs.
It just makes sense to have coverage as we all know how quick this market can turn.
We've failed at these highs twice previously.
The trend remains higher in feeders unless we break below the green box and 354 level. That's the golden zone retracement. That would be the warning sign.
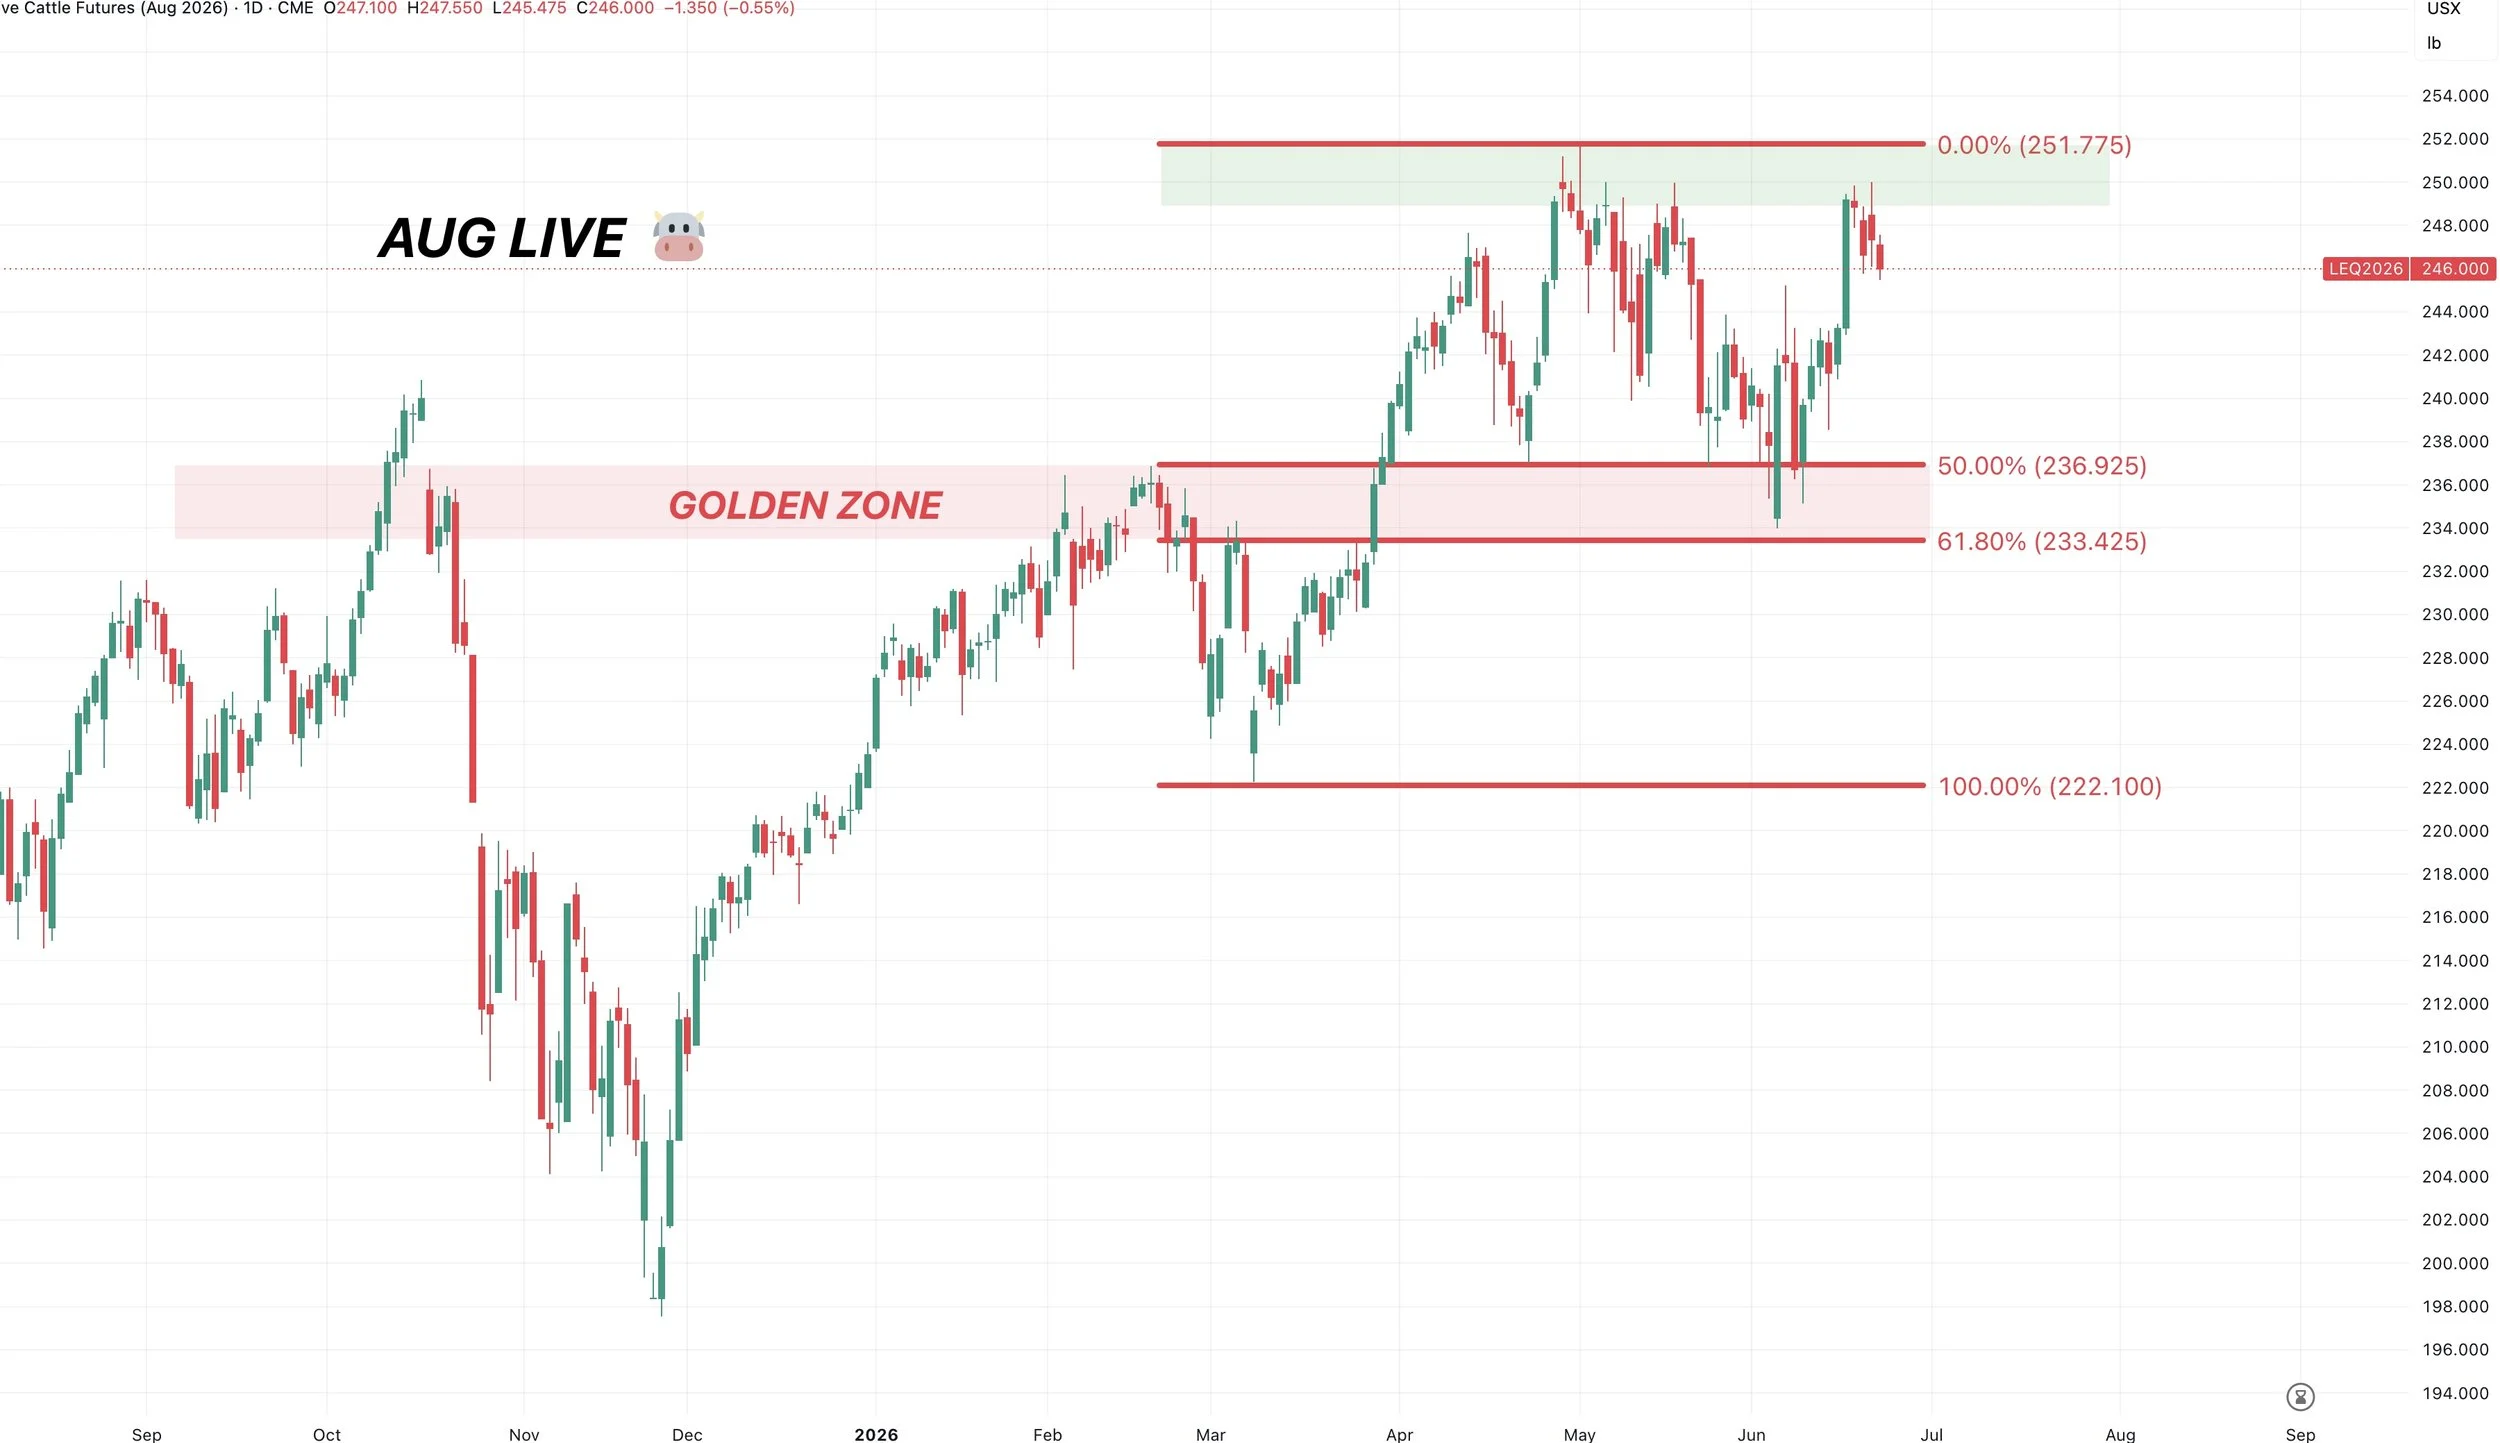
August Live Chart:
Nothing new here.
We're sitting right back at all-time highs, so makes sense to defend these levels.
Currently waiting to see if we get the breakout or if we are going to reject once again.
So far we're seeing some resistance here.
Want to Talk?
Our phones are open 24/7 for you guys if you ever need anything or want to discuss your operation.
Jeremey & Office: (806)484-1214
Sebastian: (605)280-1186
Email: sfrost@dailymarketminute.com
Hedge Account
Interested in a hedge account? Use the link below to set up an account or give us a call.