
WHO IS RIGHT ON YIELD?
MARKET UPDATE
You can scroll to read the usual update as well. As the written version is the exact same as the video.
Timestamps for video:
Overview: 0:00min
Corn: 1:10min
Beans: 12:30min
Wheat: 15:40min
Cattle: 16:25min
Want to talk?
Office: (806)484-1214
Futures Prices Close
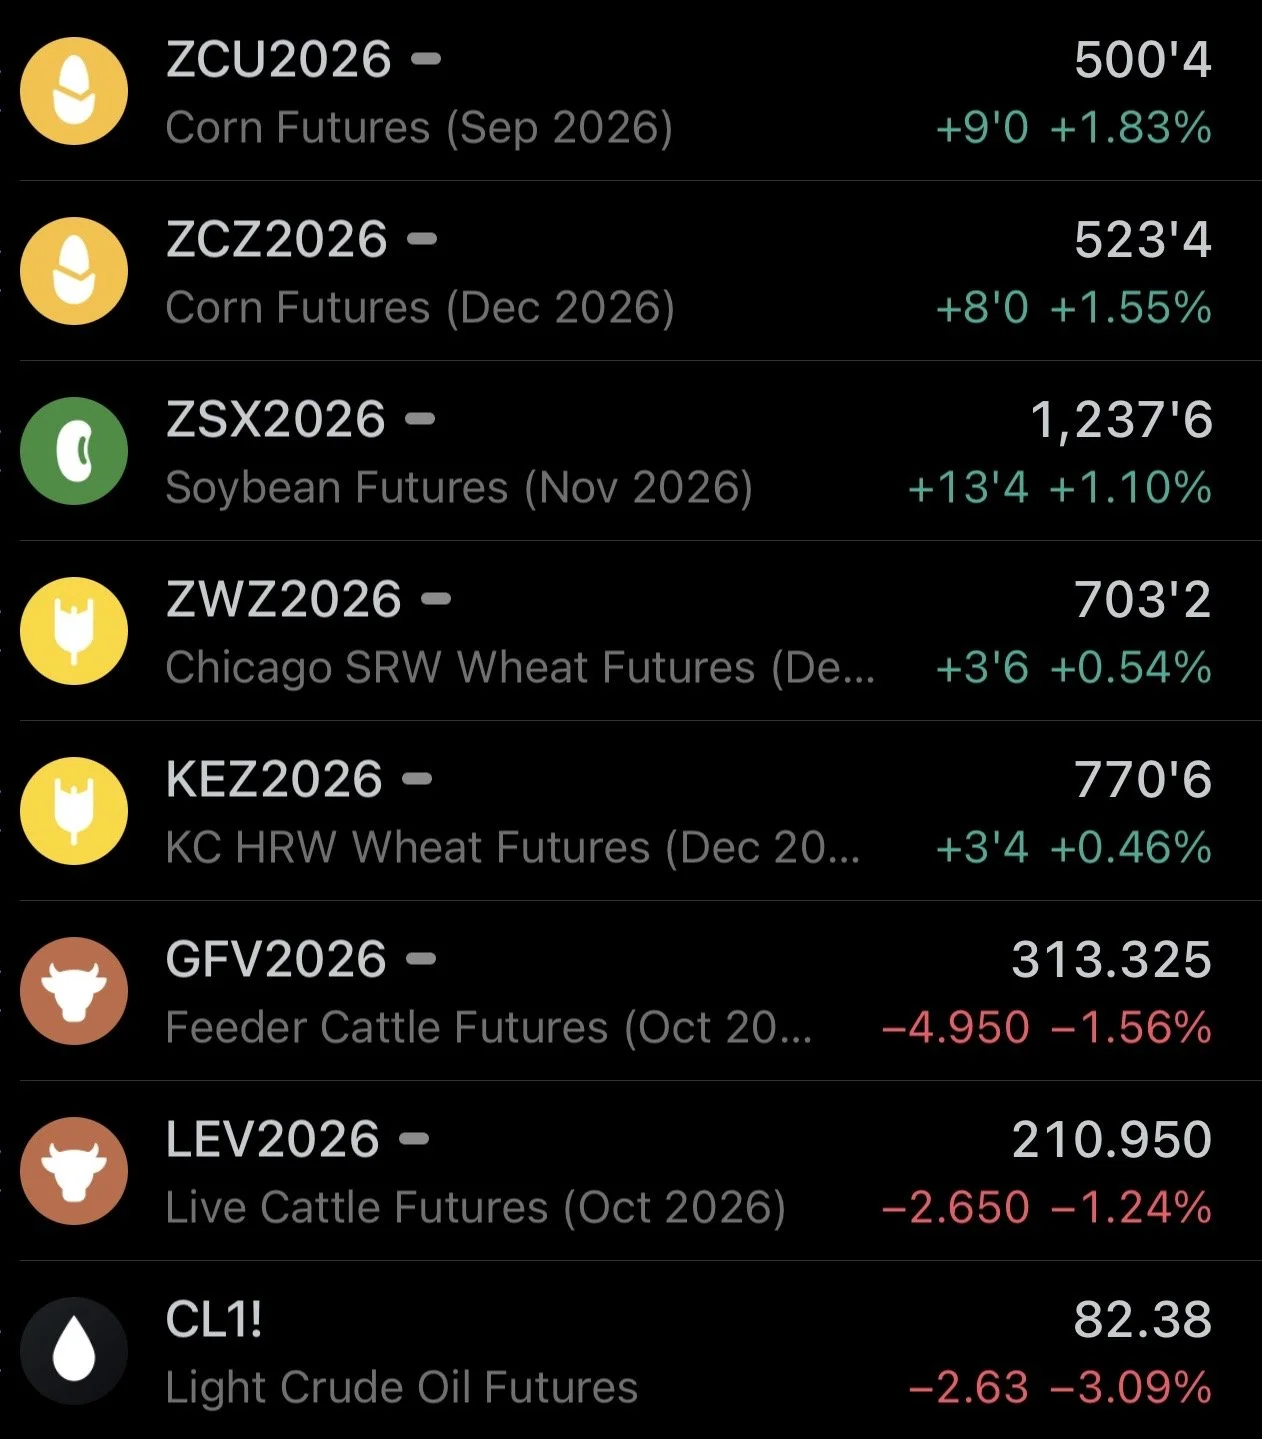
Overview
Corn and the rest of the grains continue to run.
As the market continues to price in the potential for a corn crop that's more poor than originally thought following the crop tours and continuation of deteriorating crop conditions.
Corn is now up nearly +70 cents in exactly two weeks. As we've gone straight up since the USDA report, trading higher the last 8 of 10 sessions.
We're also now a full +$1.00 off the contract lows.
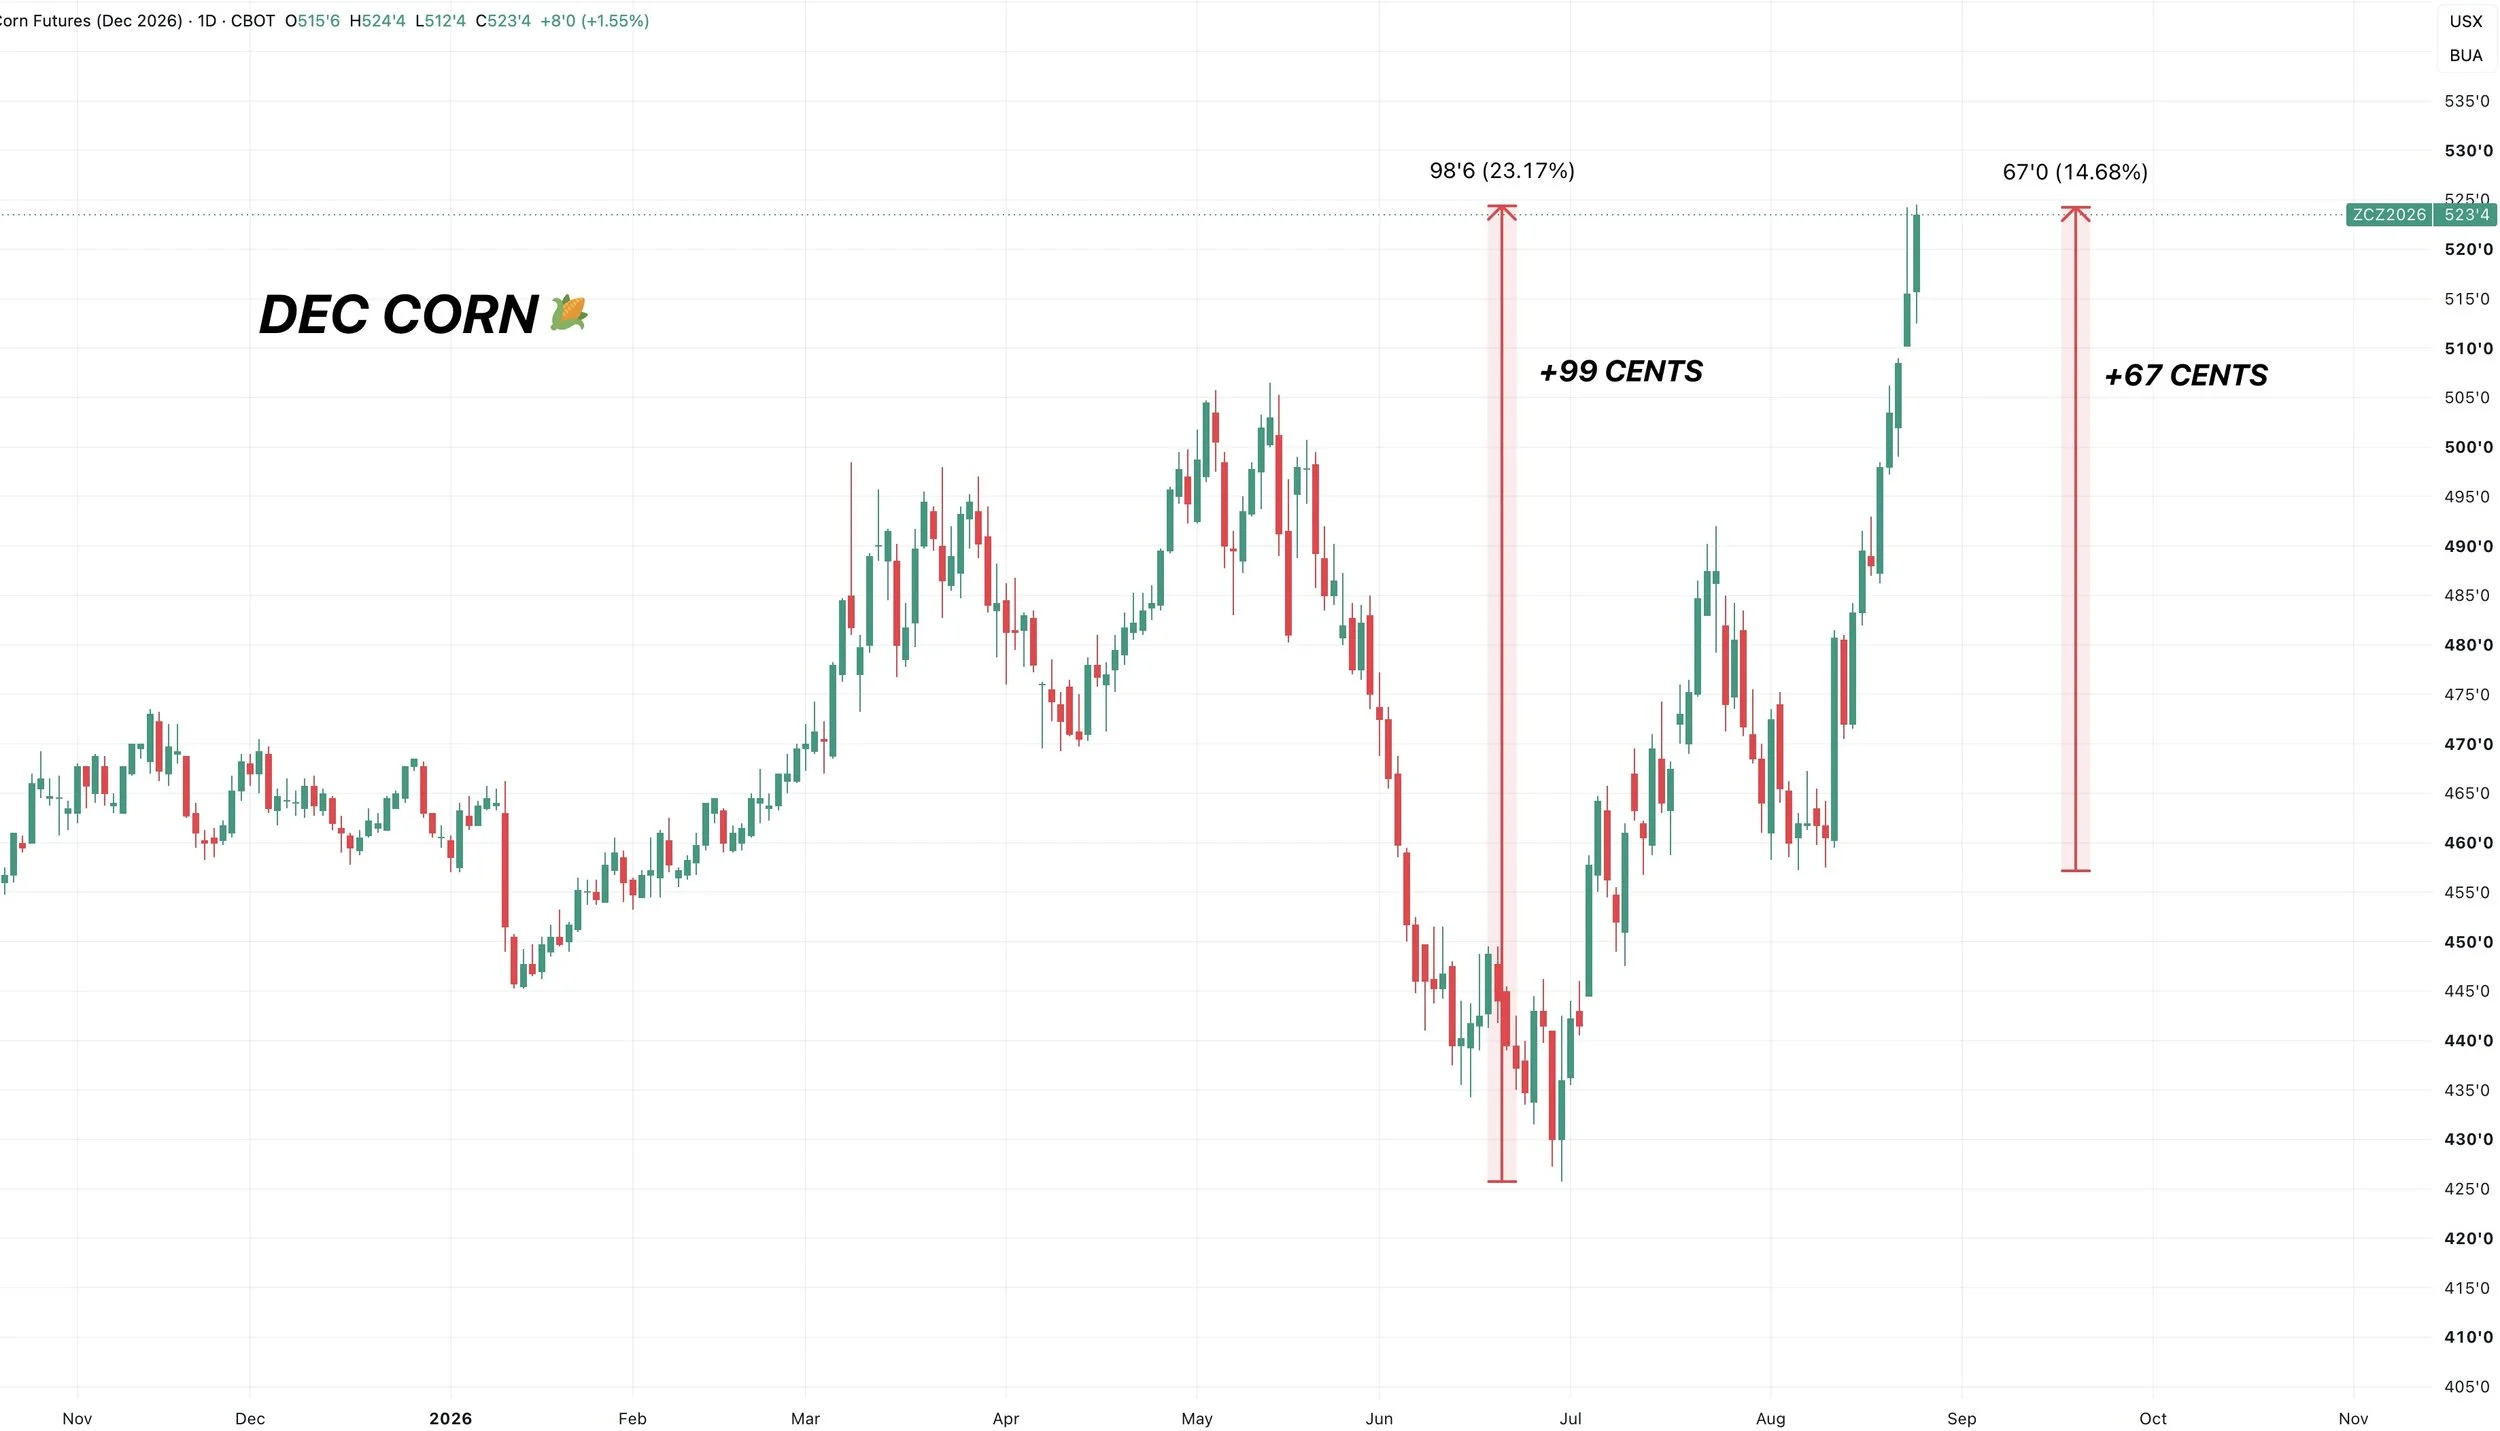
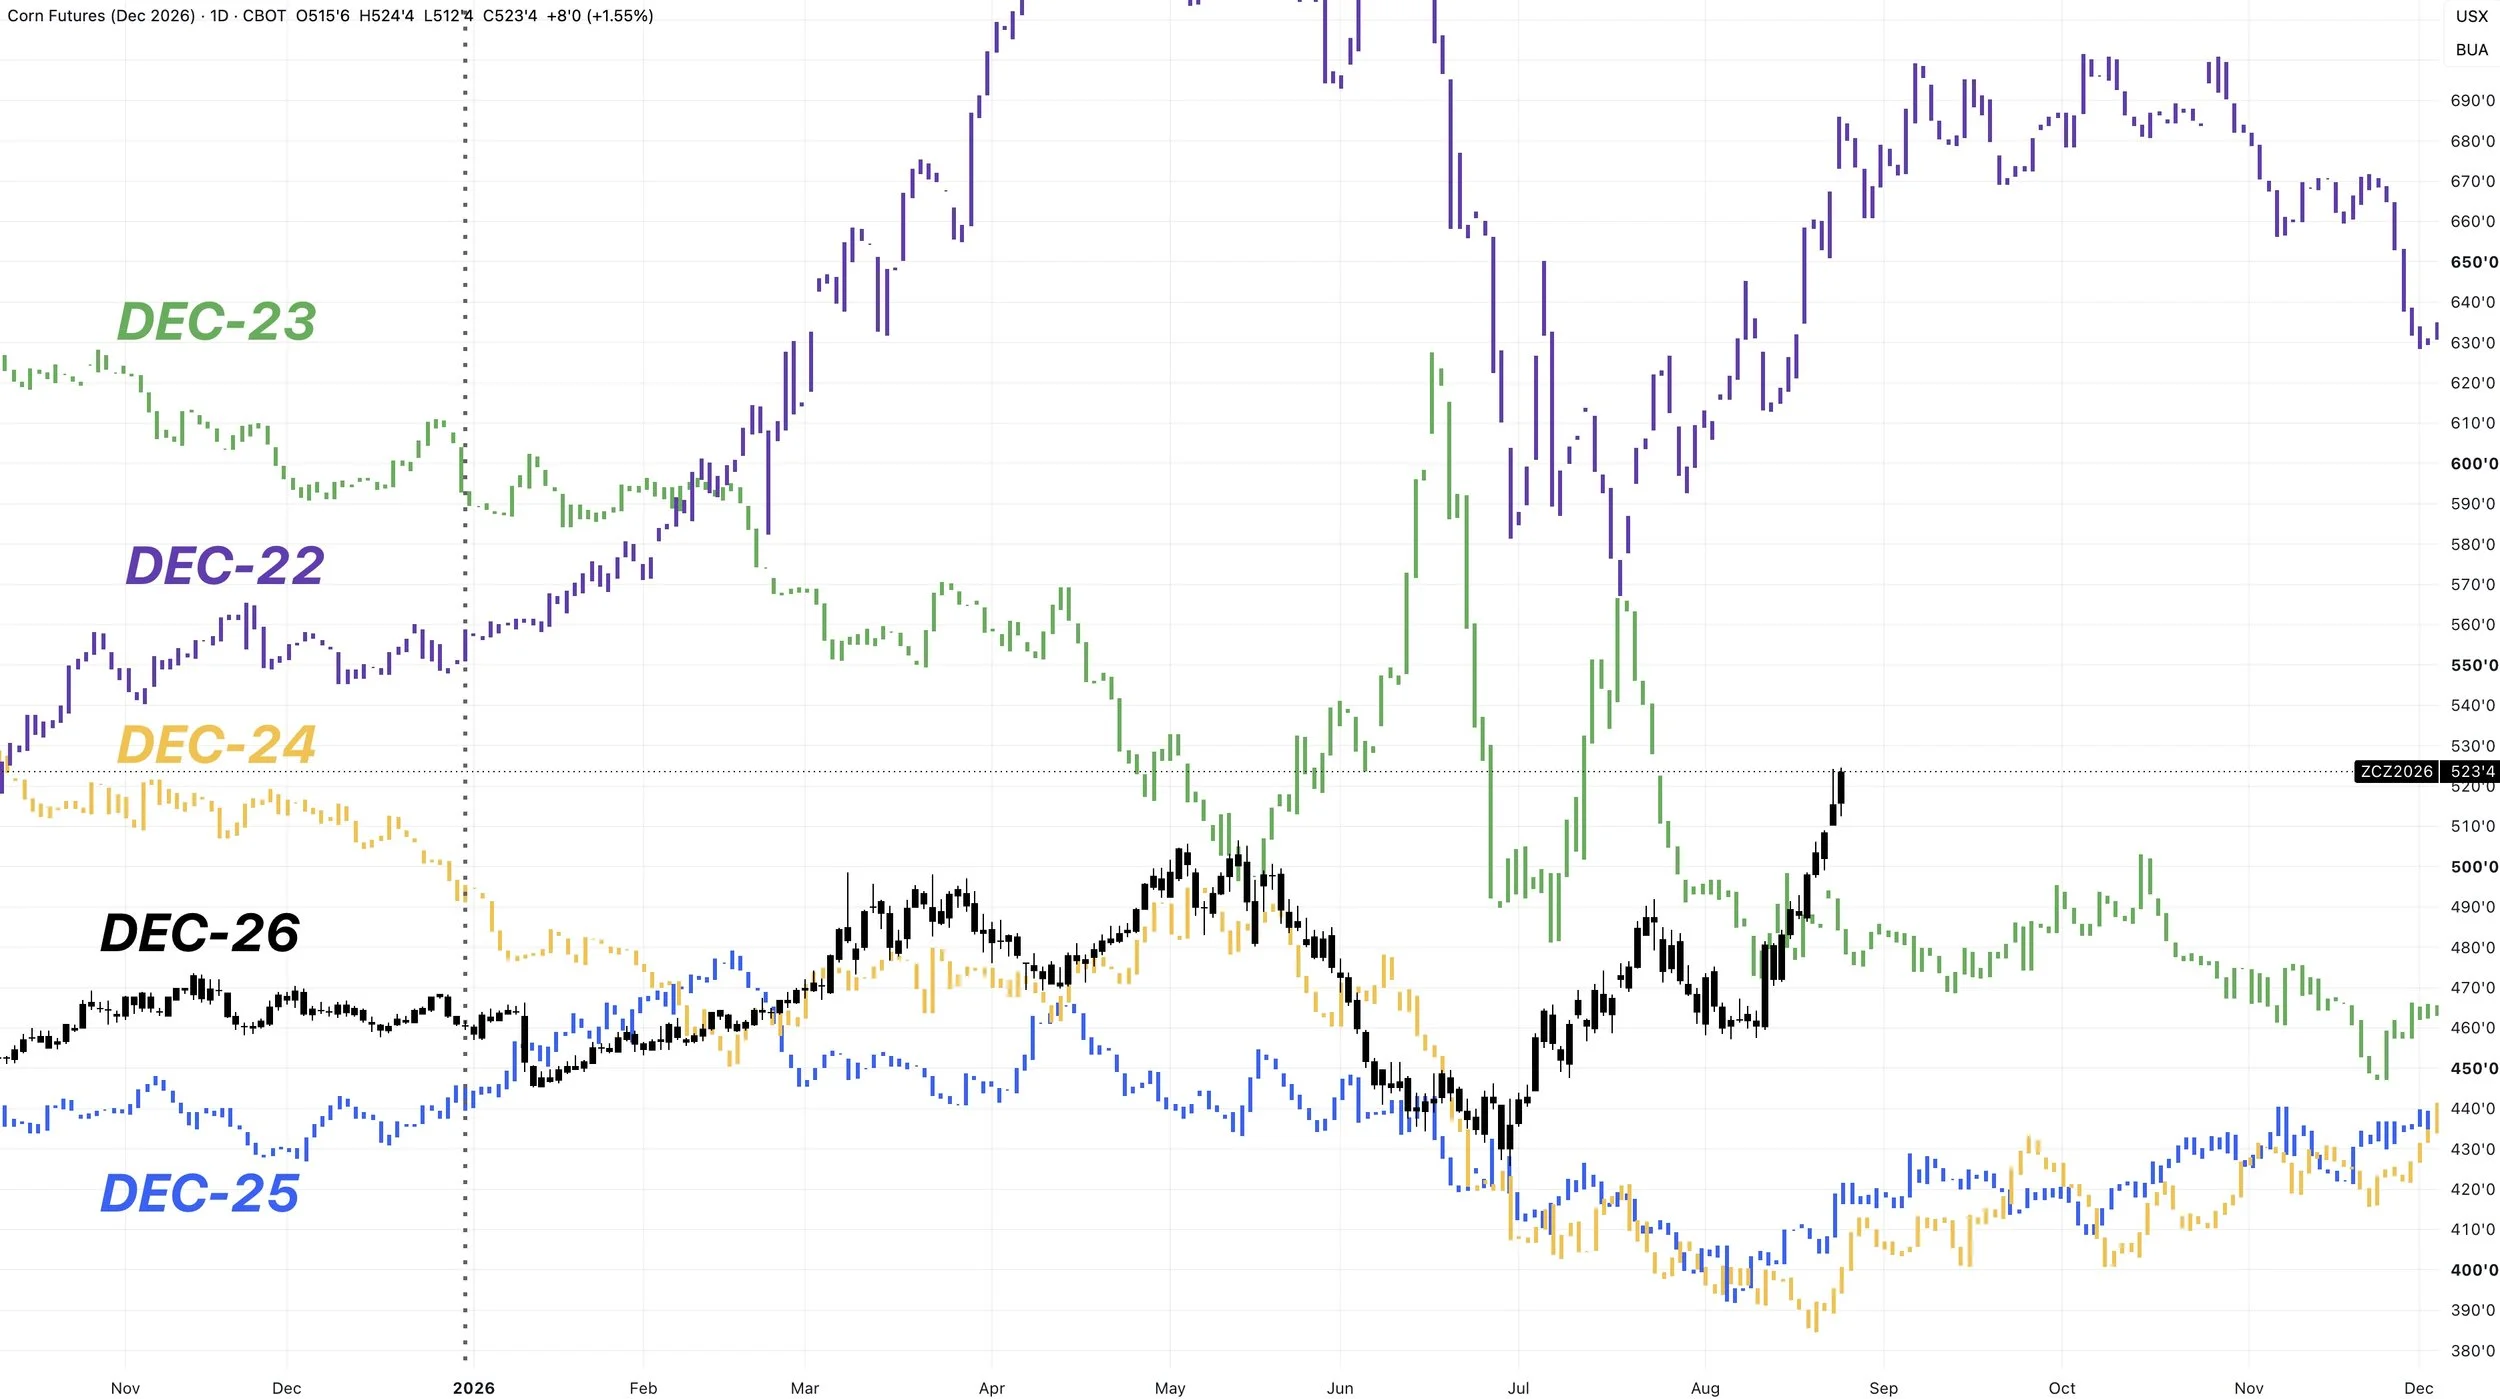
For the time of year, Dec corn is at it's highest levels since 2022.
About 40 cents higher than 2023 and over $1.00 higher than both 2024 and 2025.
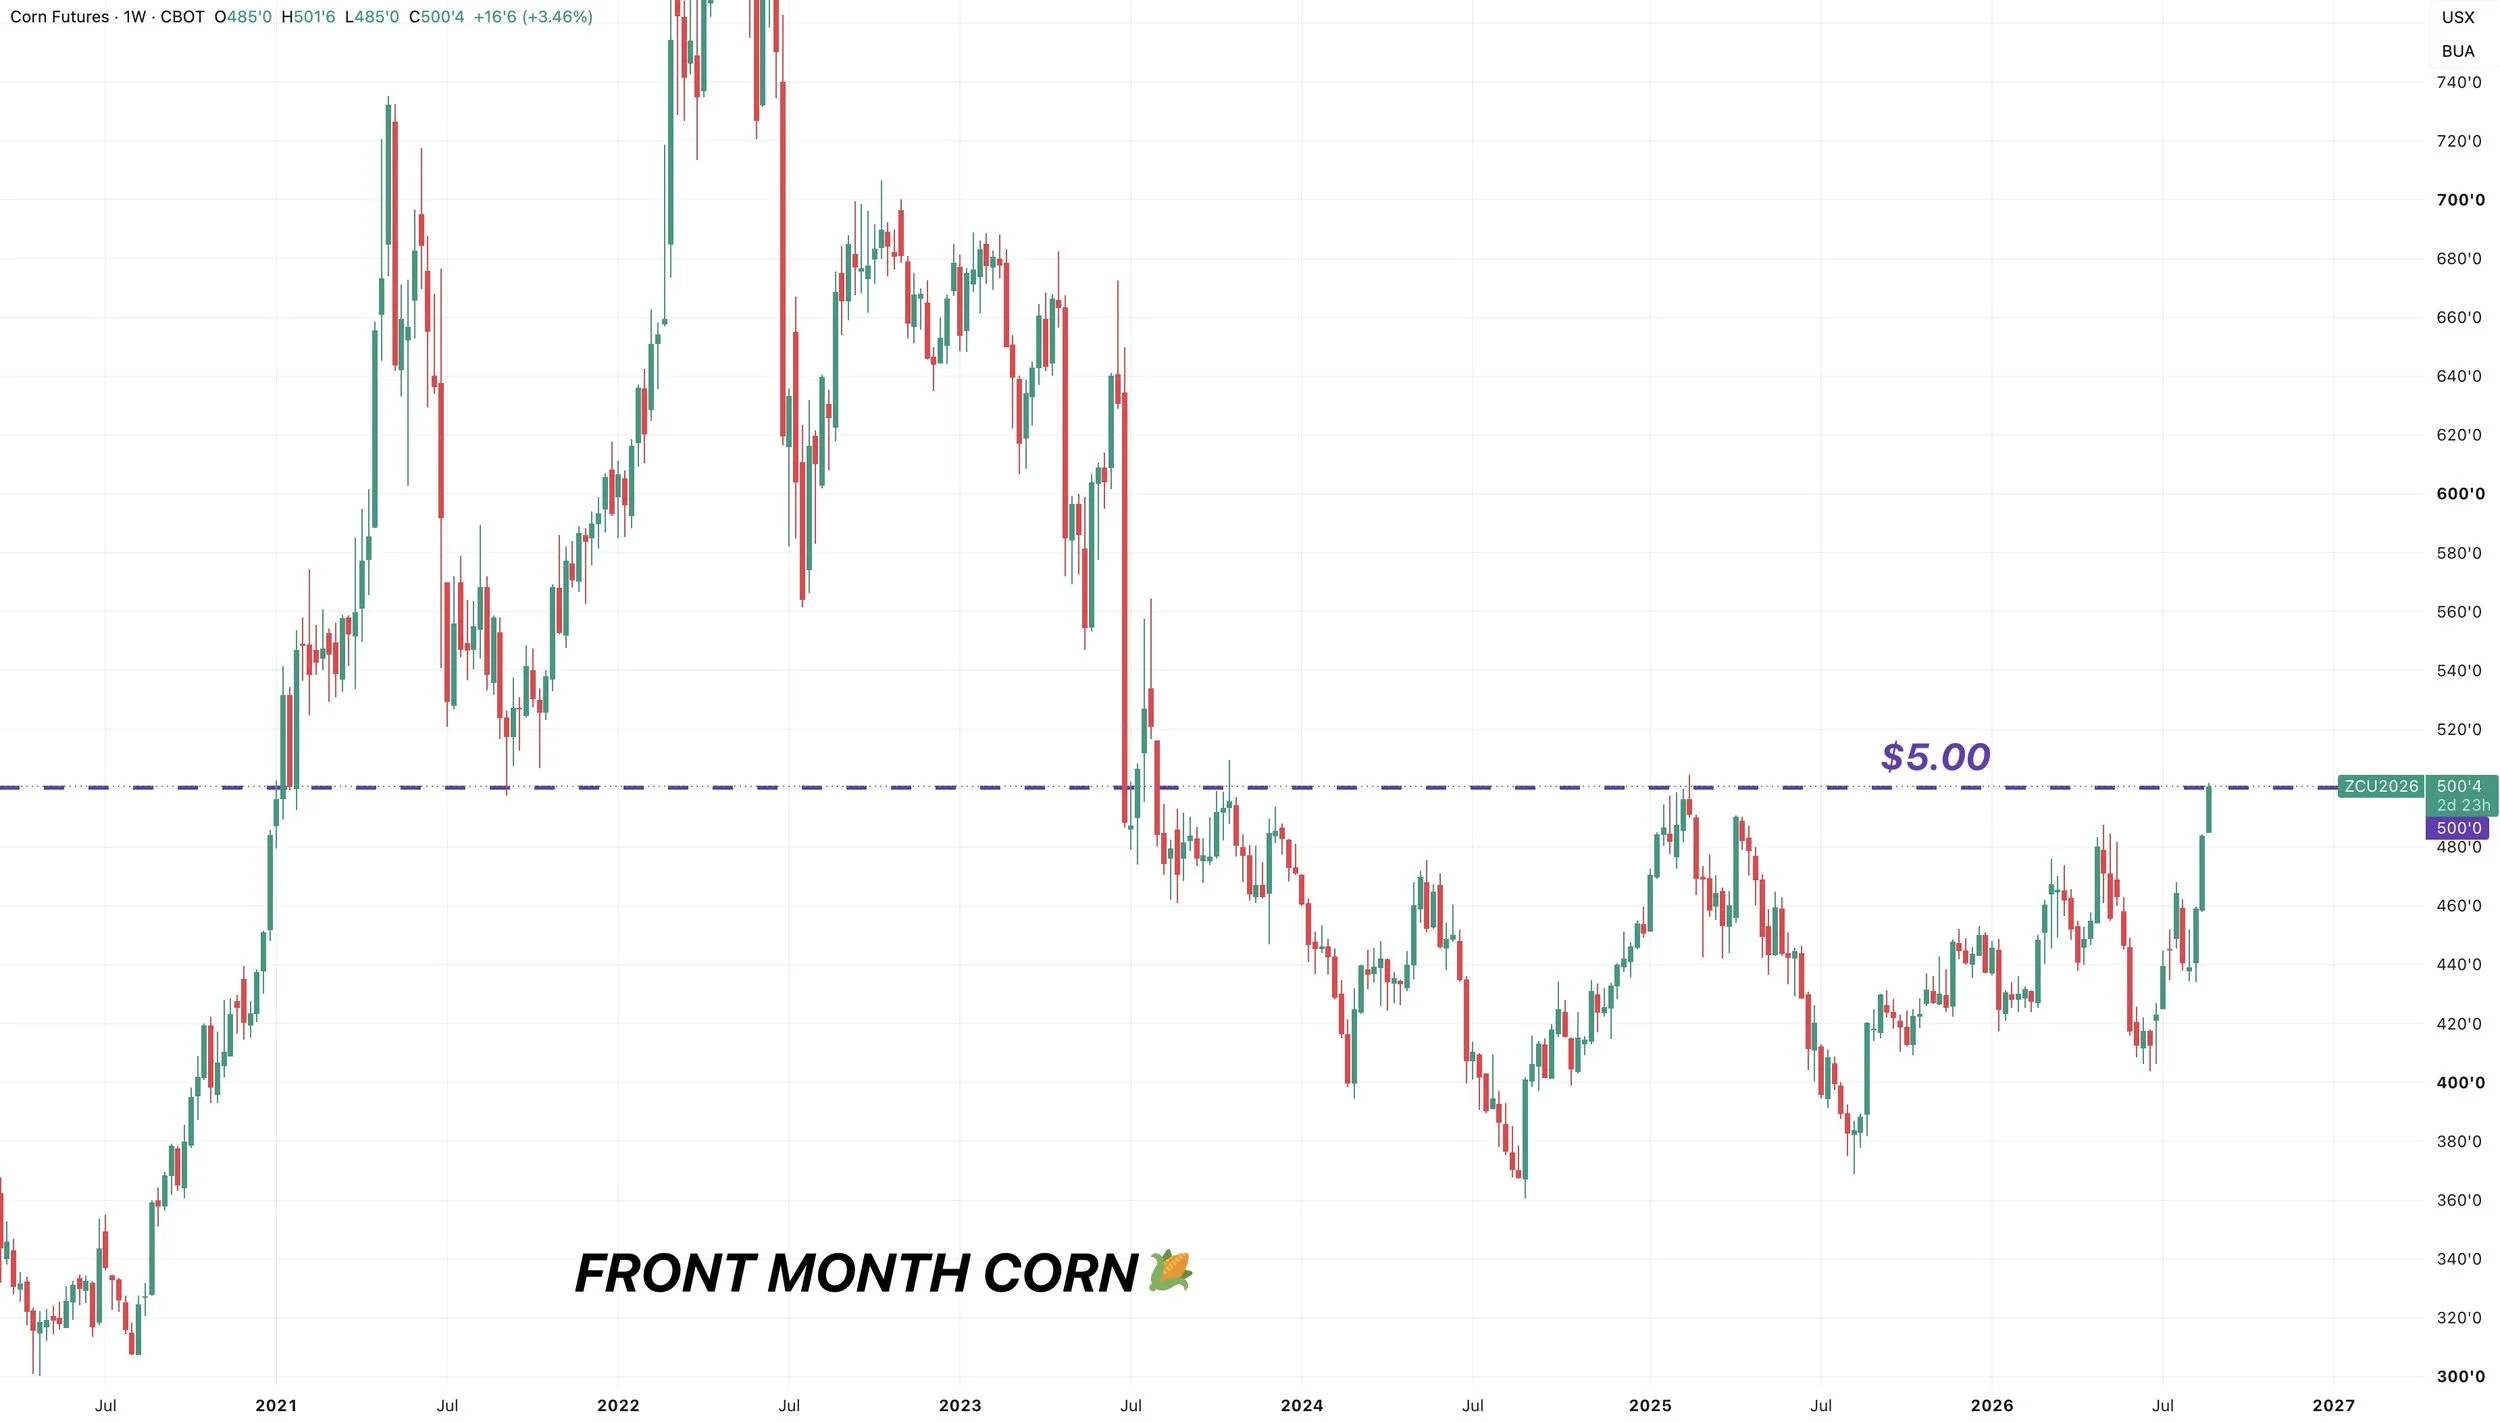
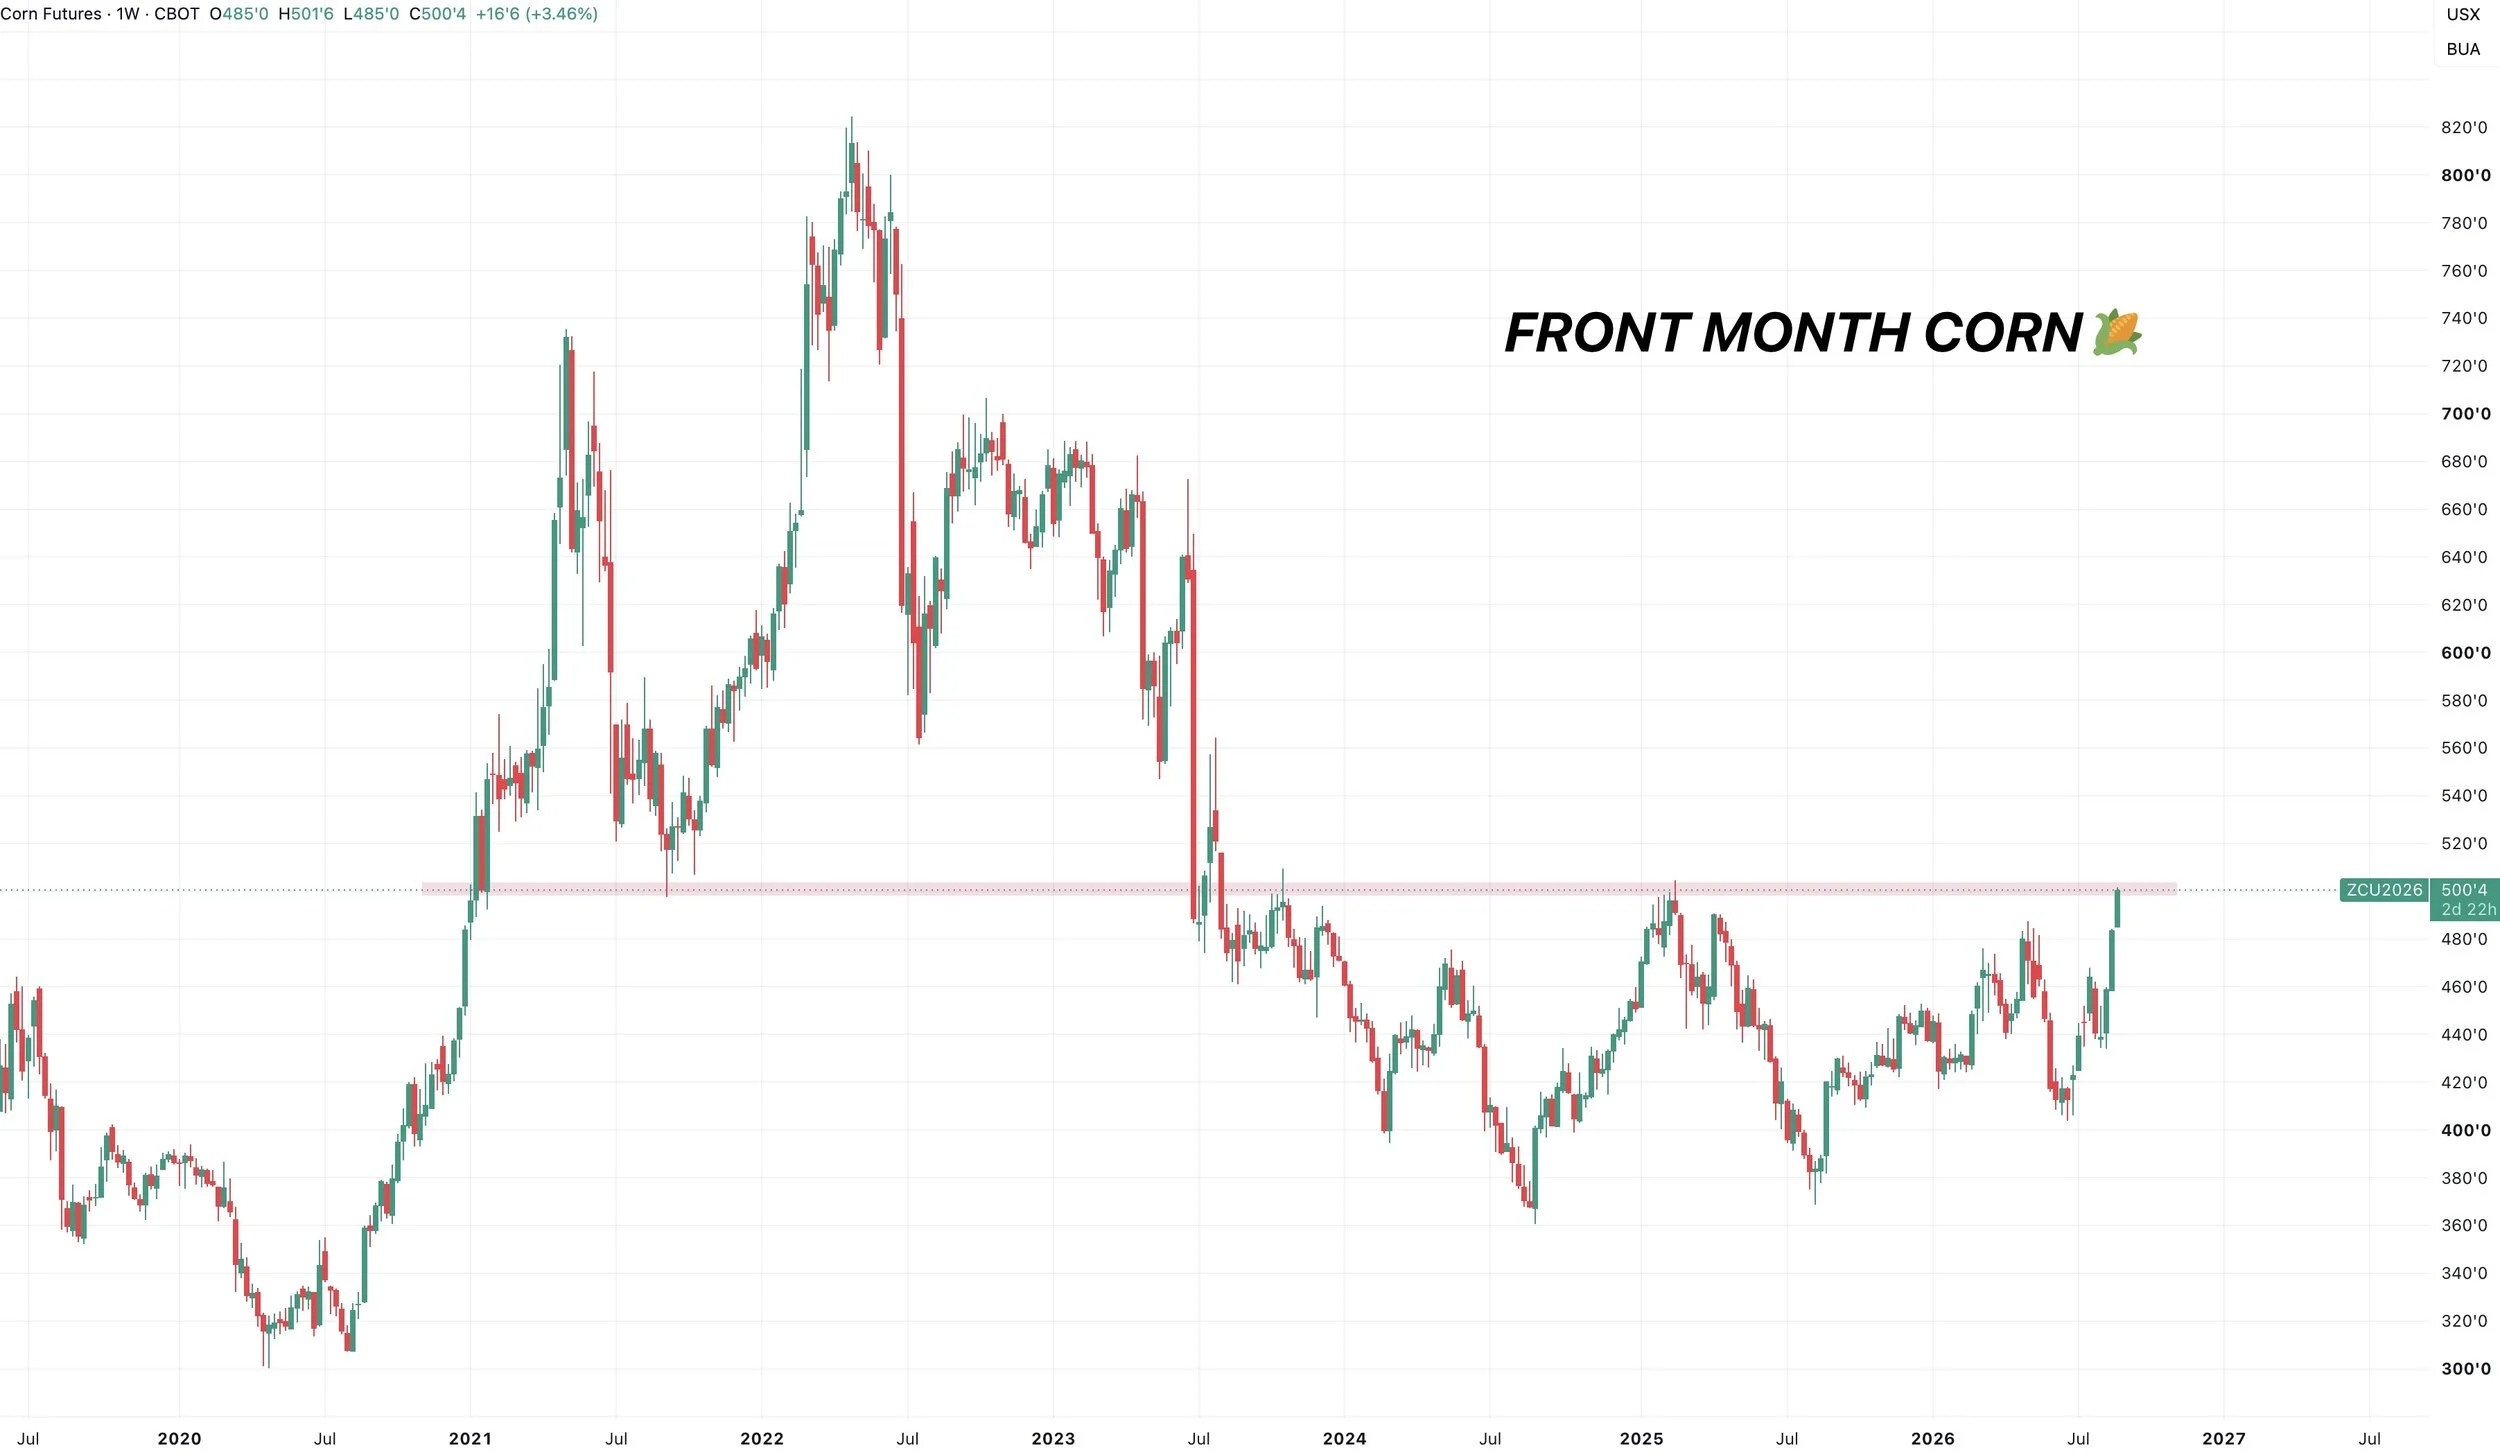
Today front month corn hit $5.00 for the first time since February 2025.
At those February 2025 highs, we only closed above $5.00 for one single day.
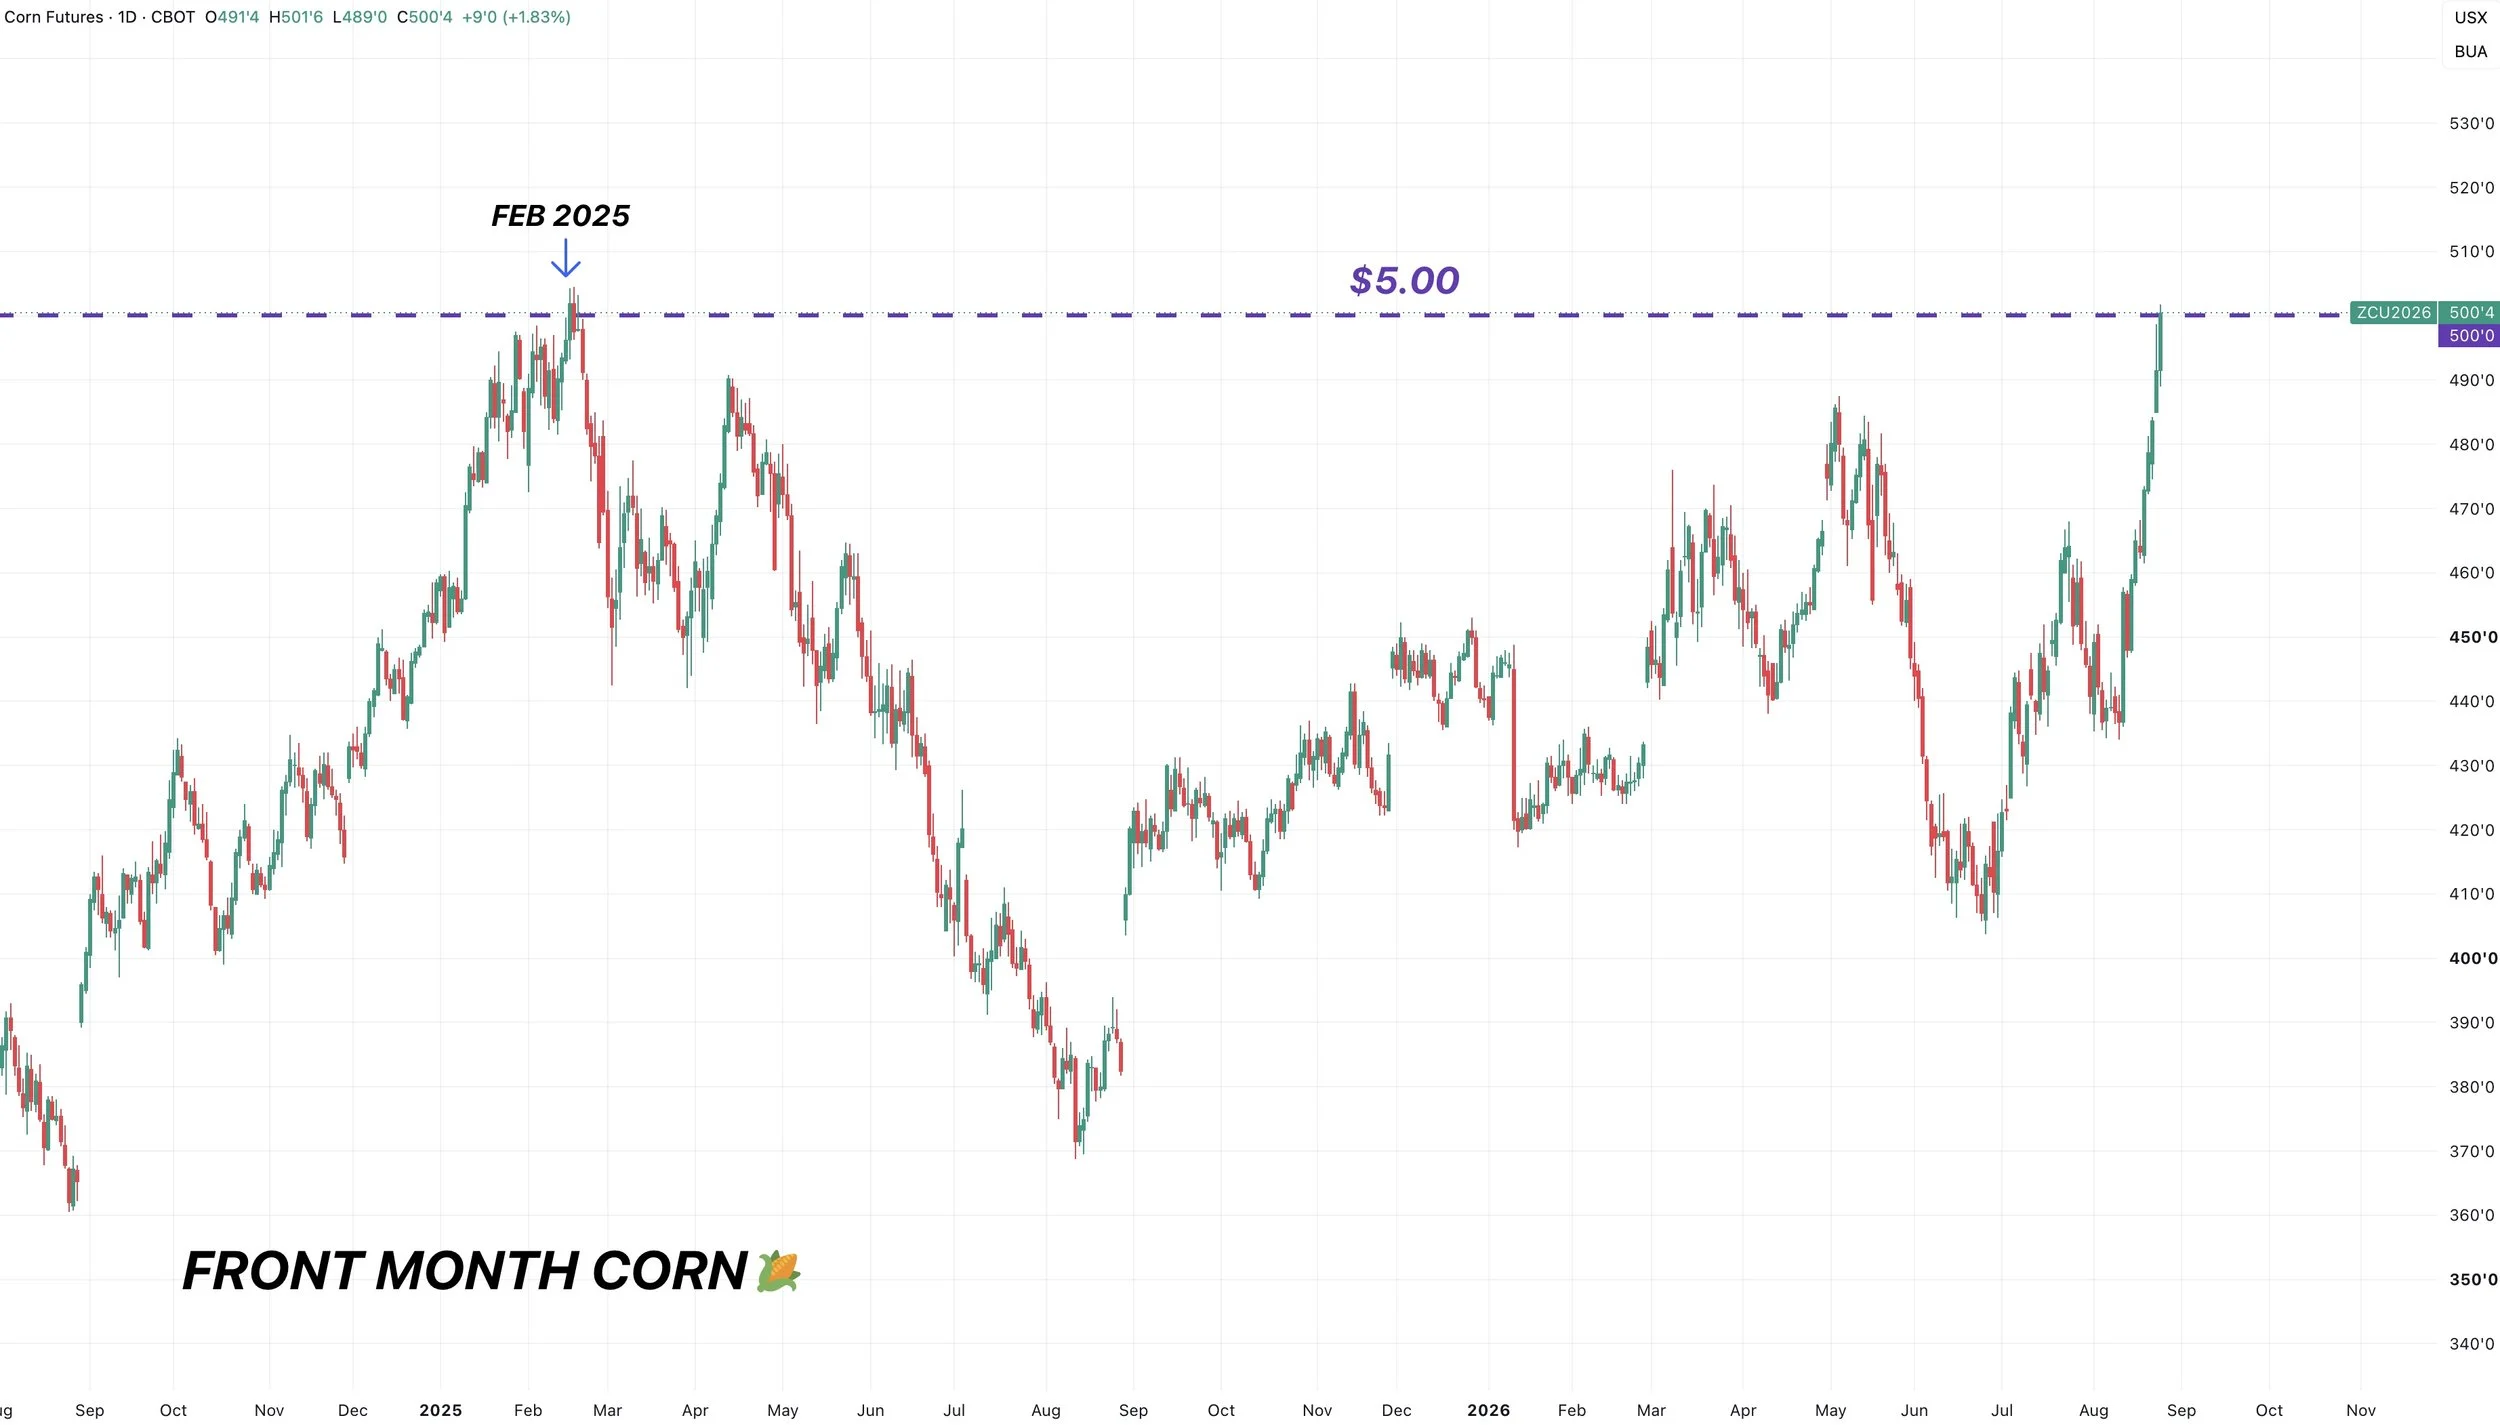
Before that singular day, you'd have to go back to 2023 to see the last time front month corn closed above $5.00
As we have not had a weekly close above $5.00 since July 2023.
Today's Main Takeaways
Corn
Crop Ratings:
Corn ratings dropped -3% down to 57% G/E.
Dropping for the 3rd week in a row.
The trade was only expecting a -1% drop which was the reason behind the strength today.
Last year ratings were at 71%. So we are far below last year.
In recent memory, only 2022 and 2023 had a worse rated crop for today's date.
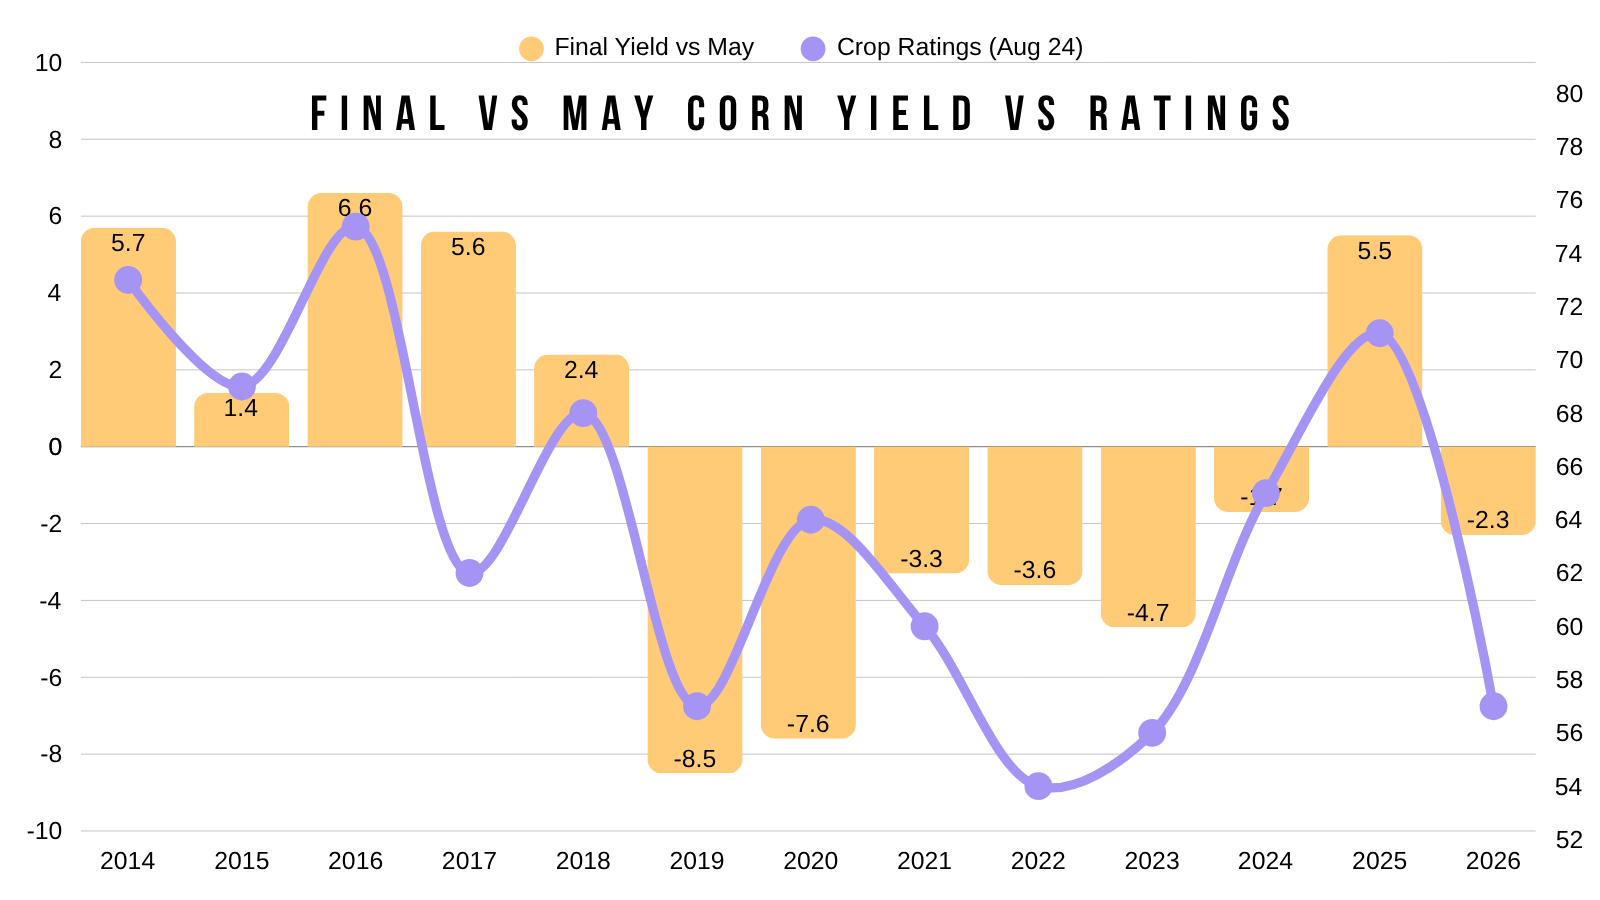
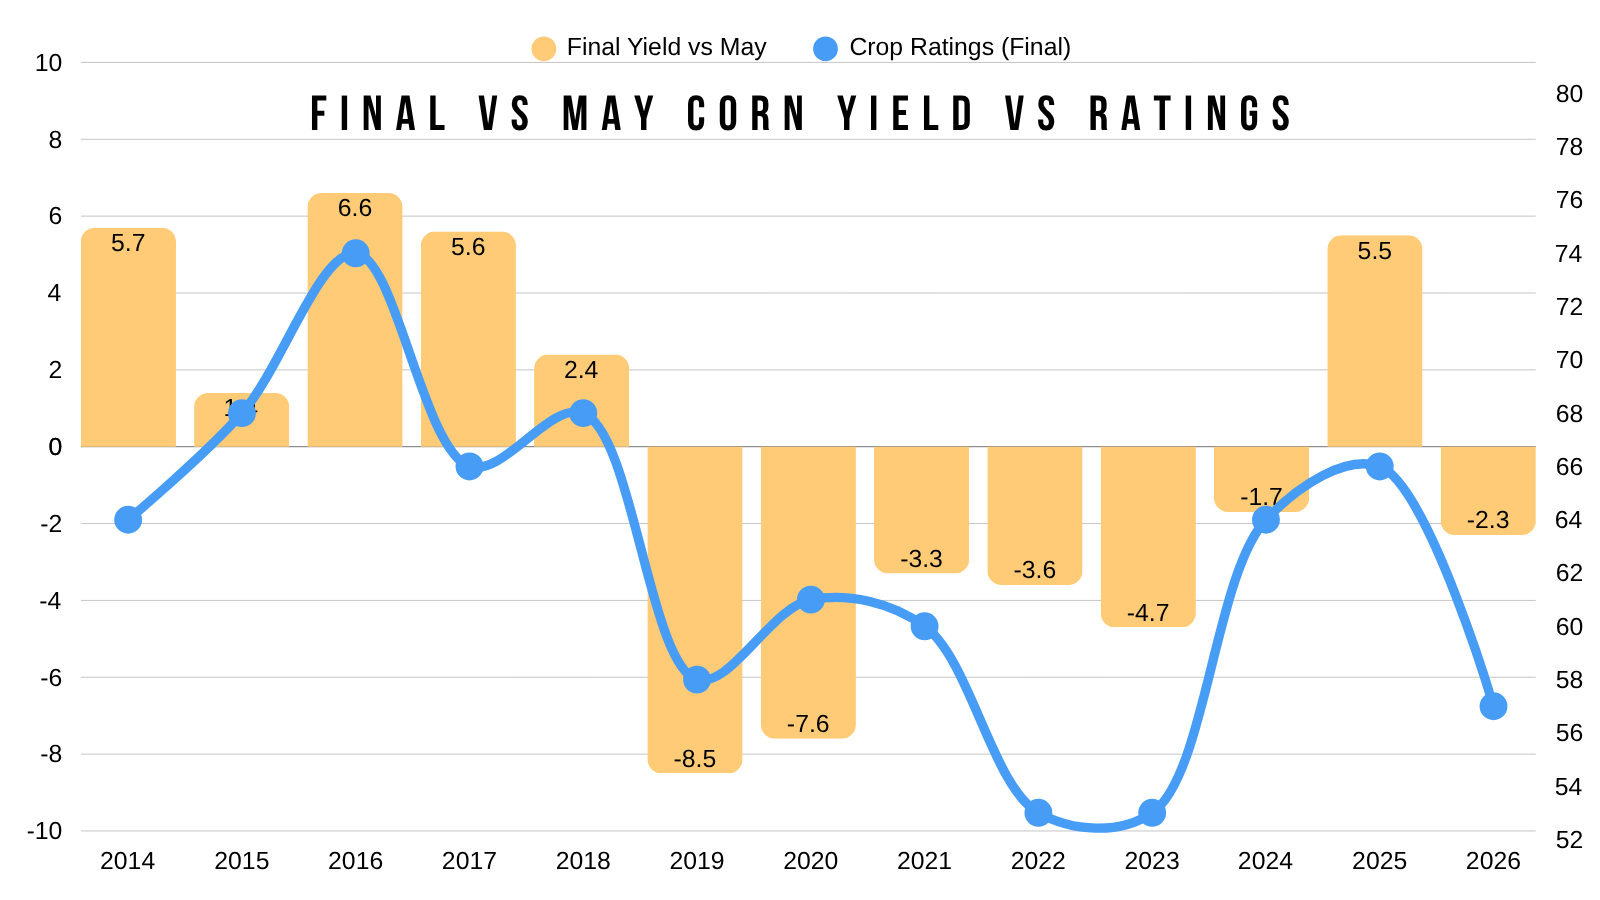
Here is the final crop ratings vs yield's deviation from trend.
Like we've talked about for a long time, these poor of ratings has a very strong tendency for below trend yields. Which the USDA finally acknowledged two weeks ago.
Despite the 3rd worst ratings, the USDA only has a -2.30 bpa deviation from trendline yield..
This would actually be one of the smallest we've seen.
The only year we saw a smaller deviation below trend was 2024.
This poor of ratings has historically led to a larger cut from trend than the USDA currently has.
Yield Talk:
We had the crop tours last week.
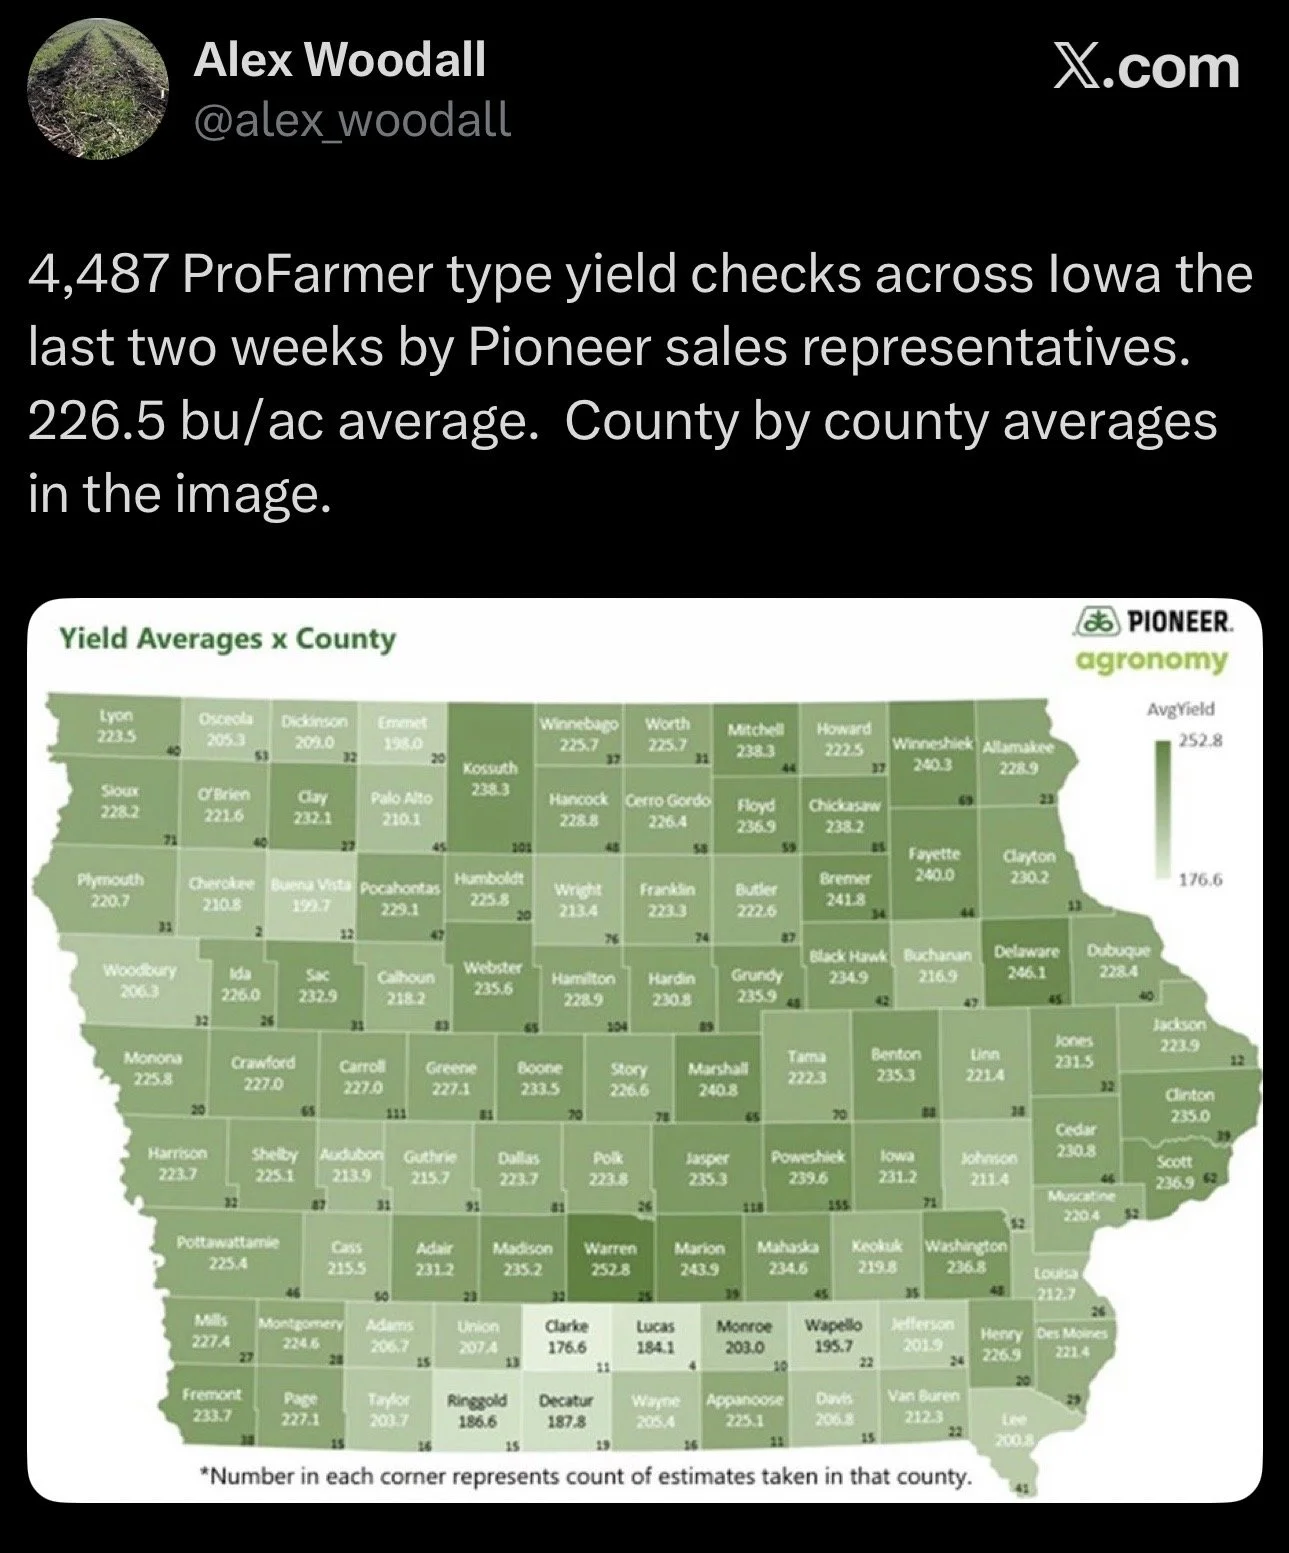
Then yesterday we saw Pioneer release their Iowa corn yield numbers.
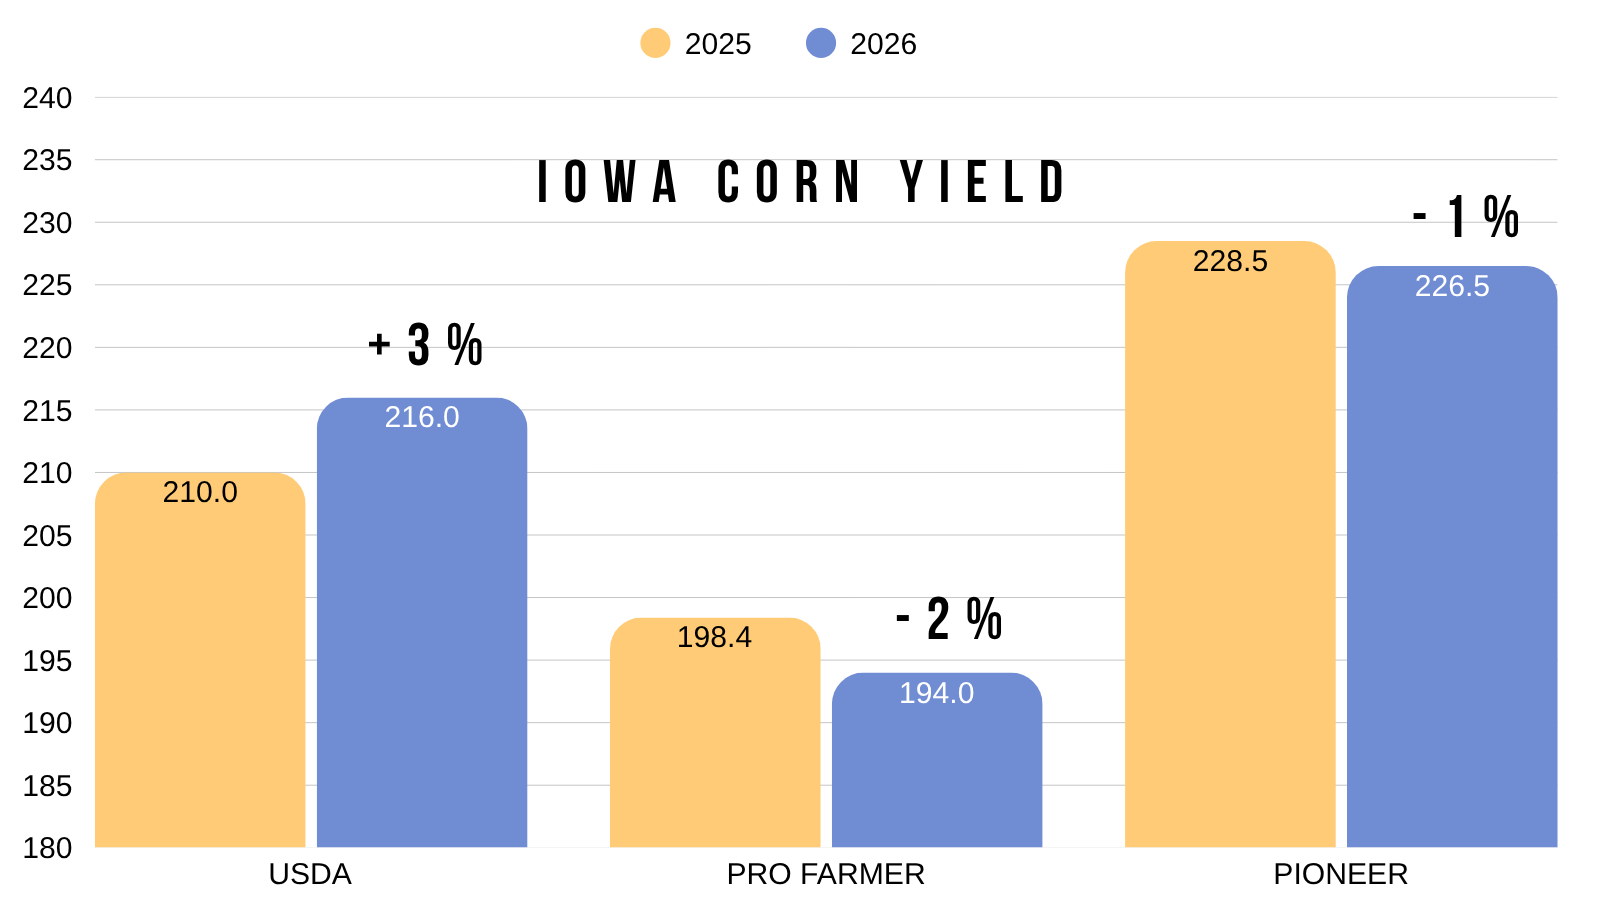
They came in with a 226.5 bpa yield for Iowa. Which would be viewed as a pretty big yield.
For reference:
Pro Farmer had 194 bpa.
The USDA has a 216 bpa.
So who is right?
Rather than taking the numbers at face value, let's simply look at how each of them expects yield to change vs last year.
Pioneer vs Last Year: -1%
Pro Farmer vs Last Year: -2%
USDA vs Last Year: +3%
So despite Pioneers big number, they actually expect the crop to be lower than their data from last year. Similarly to how the Pro Farmer tours data suggested a smaller crop than last year.
The USDA is the only one who has yield being better than last year for Iowa.
USDA vs Pro Farmer. Who is right?
Pro Farmer has a 173 yield.
The USDA has a 180.7 yield.
Who's right?
This is some data I included below last Friday's audio update as well as on social media, but I wanted to throw this in here today in case you missed it.
Here is Pro Farmer's corn yield vs the USDA's final yield.
Just from first glance, you can tell that the tour does have a tendency to be lower than the USDA's final yield.
The tour has been lower than the USDA's final in 8 of the last 12 years.
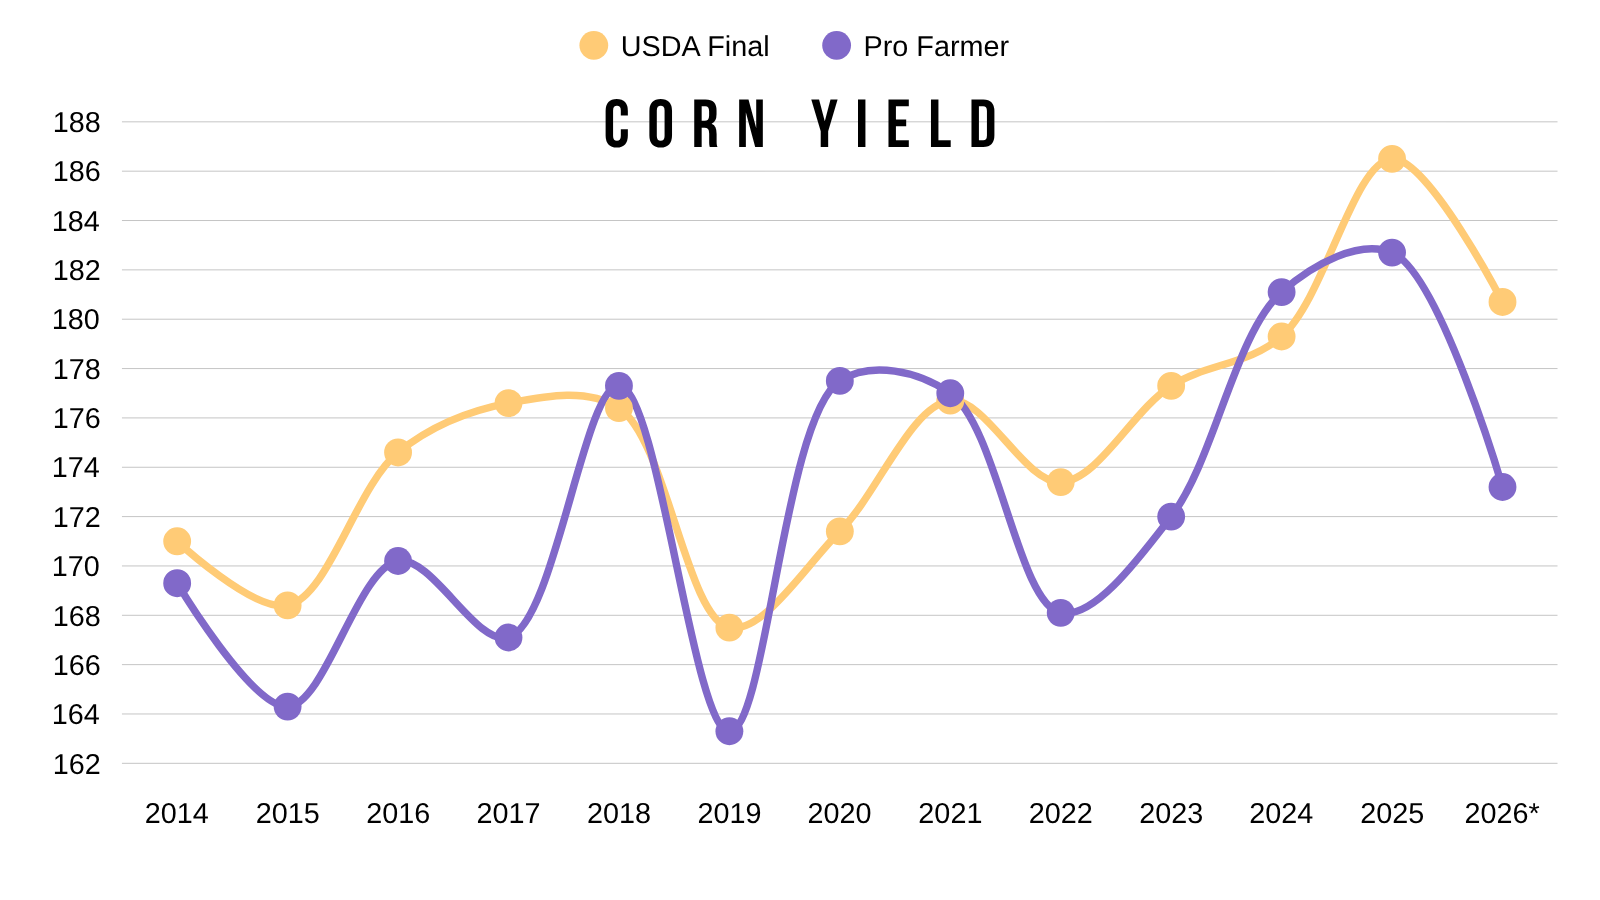
But does this simple chart really give us the full story?
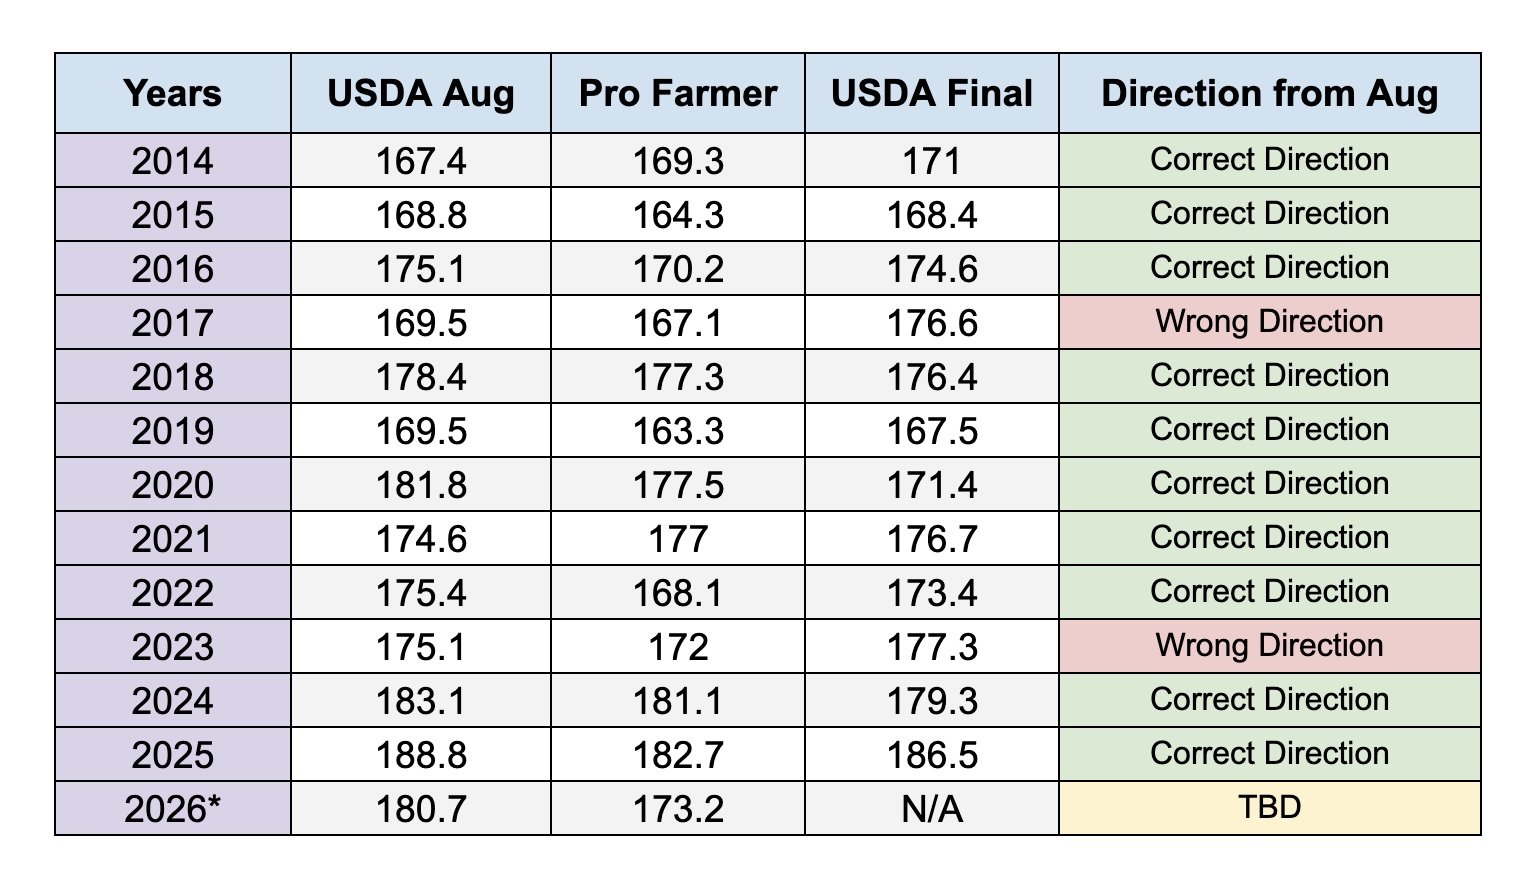
Here is a table that shows:
USDA Aug Yield
Pro Farmer Yield
USDA Final Yield
The last column shows how accurately Pro Farmer guessed the direction of yield from August to final.
If you notice, Pro Farmer has accurately predicted what direction yield was headed in all but two years since 2014.
The only two years they were wrong was 2017 and 2023.
So this data means that any time Pro Farmer's yield was higher than the USDA's August yield, the final yield was usually higher.
Anytime Pro Farmer's yield was lower than the USDA's August yield, the final yield was usually lower.
Let's dig a little deeper.
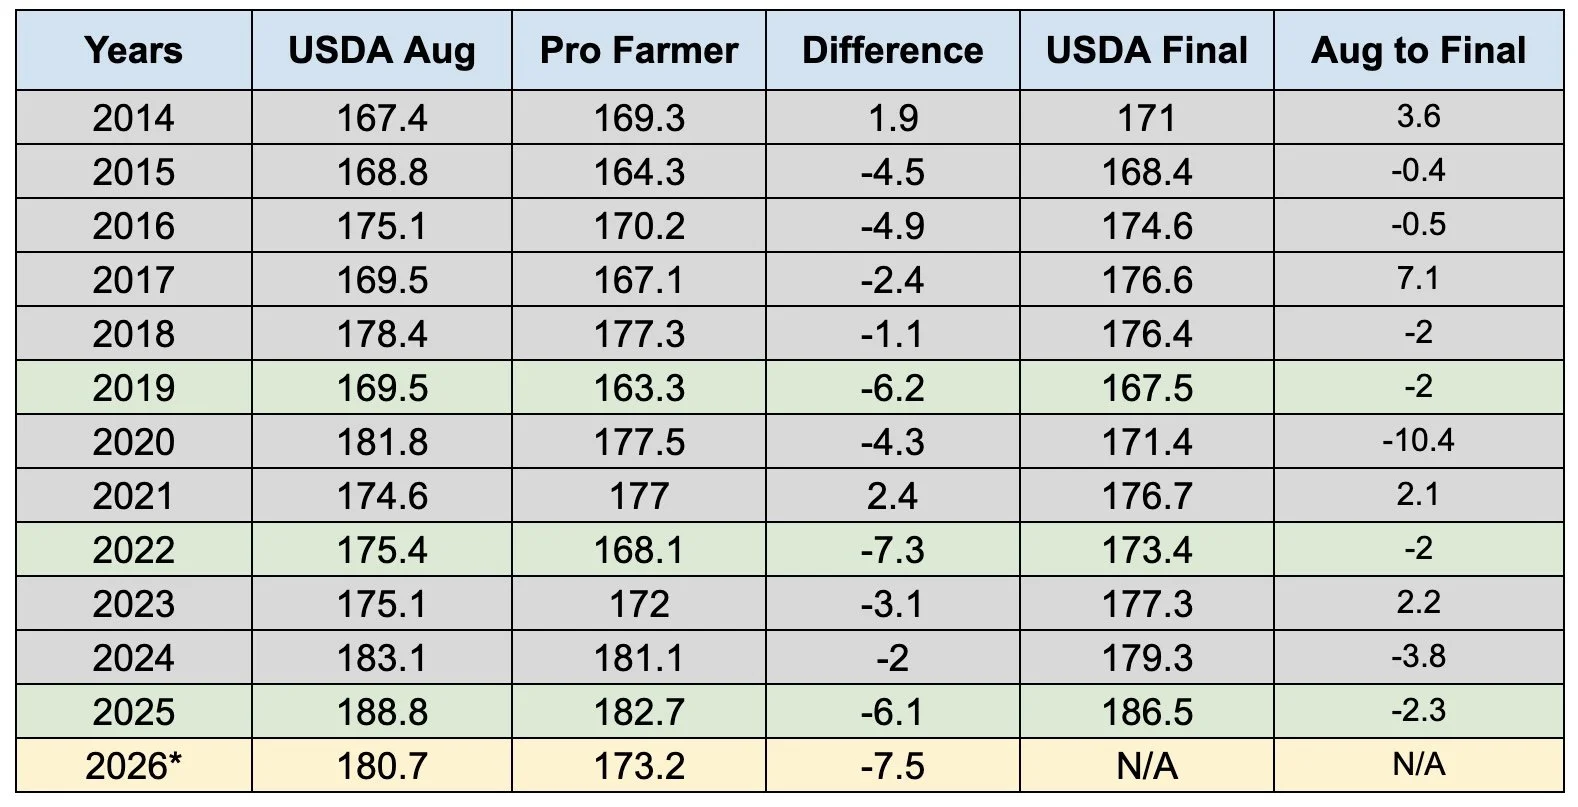
The difference between the USDA and Pro Farmers yield estimates are 7.5 bpa.
That would be the largest difference between the two in at least a decade.
(180.7 - 173.2 = 7.5 bpa)
So what happened in other years where we saw a similarly large difference between Pro Farmer and the USDA?
There are 3 other years where we saw Pro Farmer's yield come more than 5 bpa below the USDA's Aug estimate.
2019:
Tour was -6.2 bpa below Aug USDA
Final USDA was -2 bpa below Aug USDA
2022:
Tour was -7.3 bpa below Aug USDA
Final USDA was -2 bpa below Aug USDA
2025:
Tour was -6.1 bpa below Aug USDA
Final USDA was -2.3 bpa below Aug USDA
So what does this data tell us?
Every time the tour has been this far below the USDA's August number, the final yield has indeed came in lower than where it was in August.
However, the final yield never came all the way down to Pro Farmer's number.
Which tells me that it's likely the final yield is lower than the current 180.7 bpa.
But is not as small as Pro Farmer's 173.2 bpa.
The truth likely falls somewhere in between the two.
In each of those years, the final USDA was around -2 bpa lower than the August estimate. Which would put us around 178 to 179 based on this.
Here is some more data.
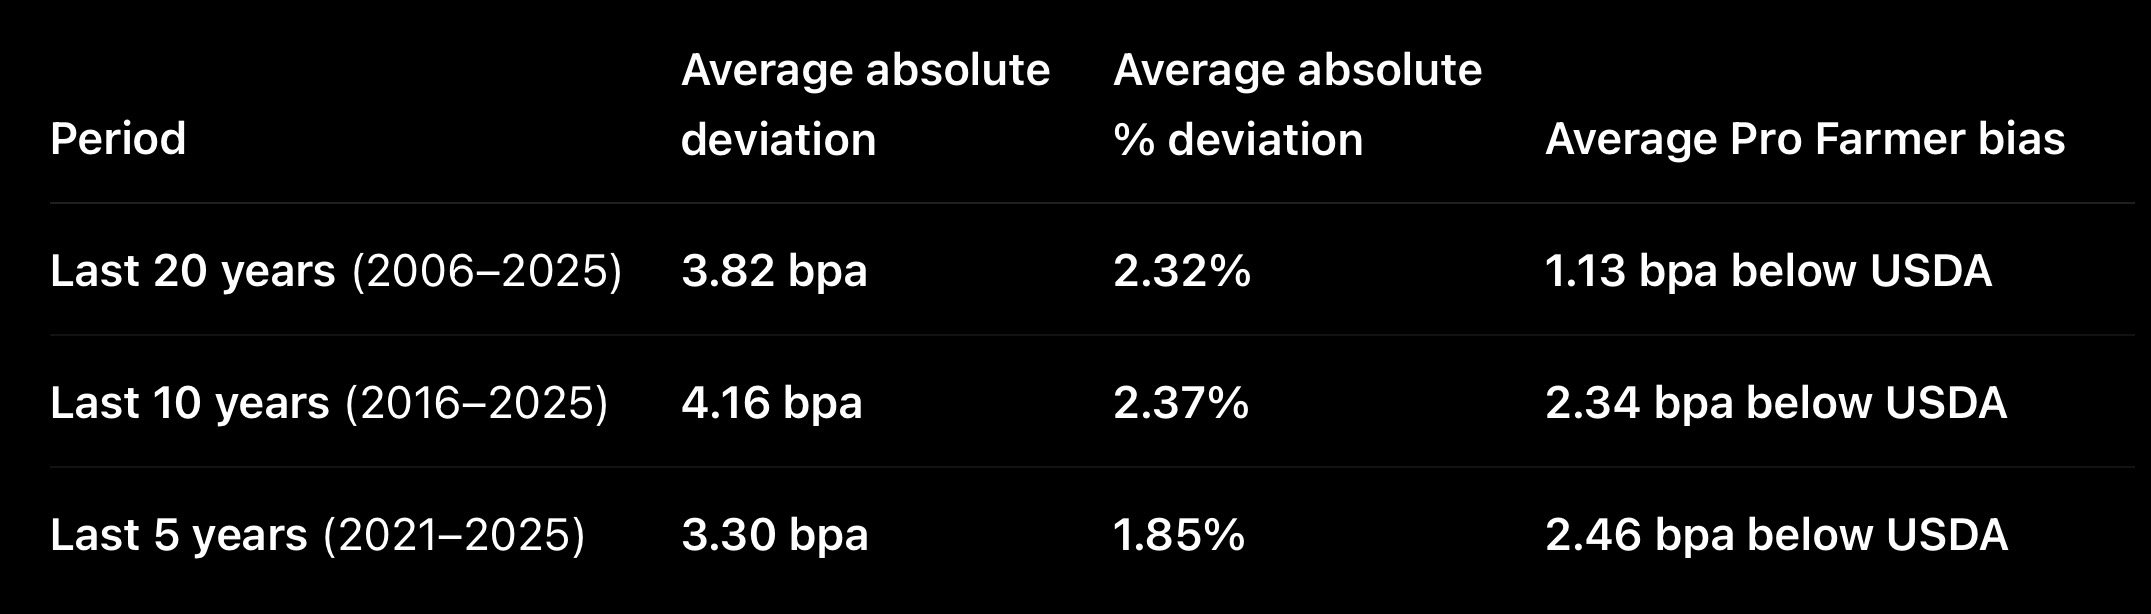
Over the last 10 years, the average deviation from Pro Farmer to the USDA's final has been around 4 bpa.
Which would still not even come close to the USDA's 180.7
(173.2 + 4 = 177.2 bpa)
The average Pro Farmer bias when you account for years where they are too high and too low comes out to 2.5 bpa below the USDA.
Meaning they do have a tendency to come in below the final USDA.
All in all, this data would suggest yield is lower than 180.7 but not as small as 173.2
What if yield is lower?
This brings us to our next point of discussion.
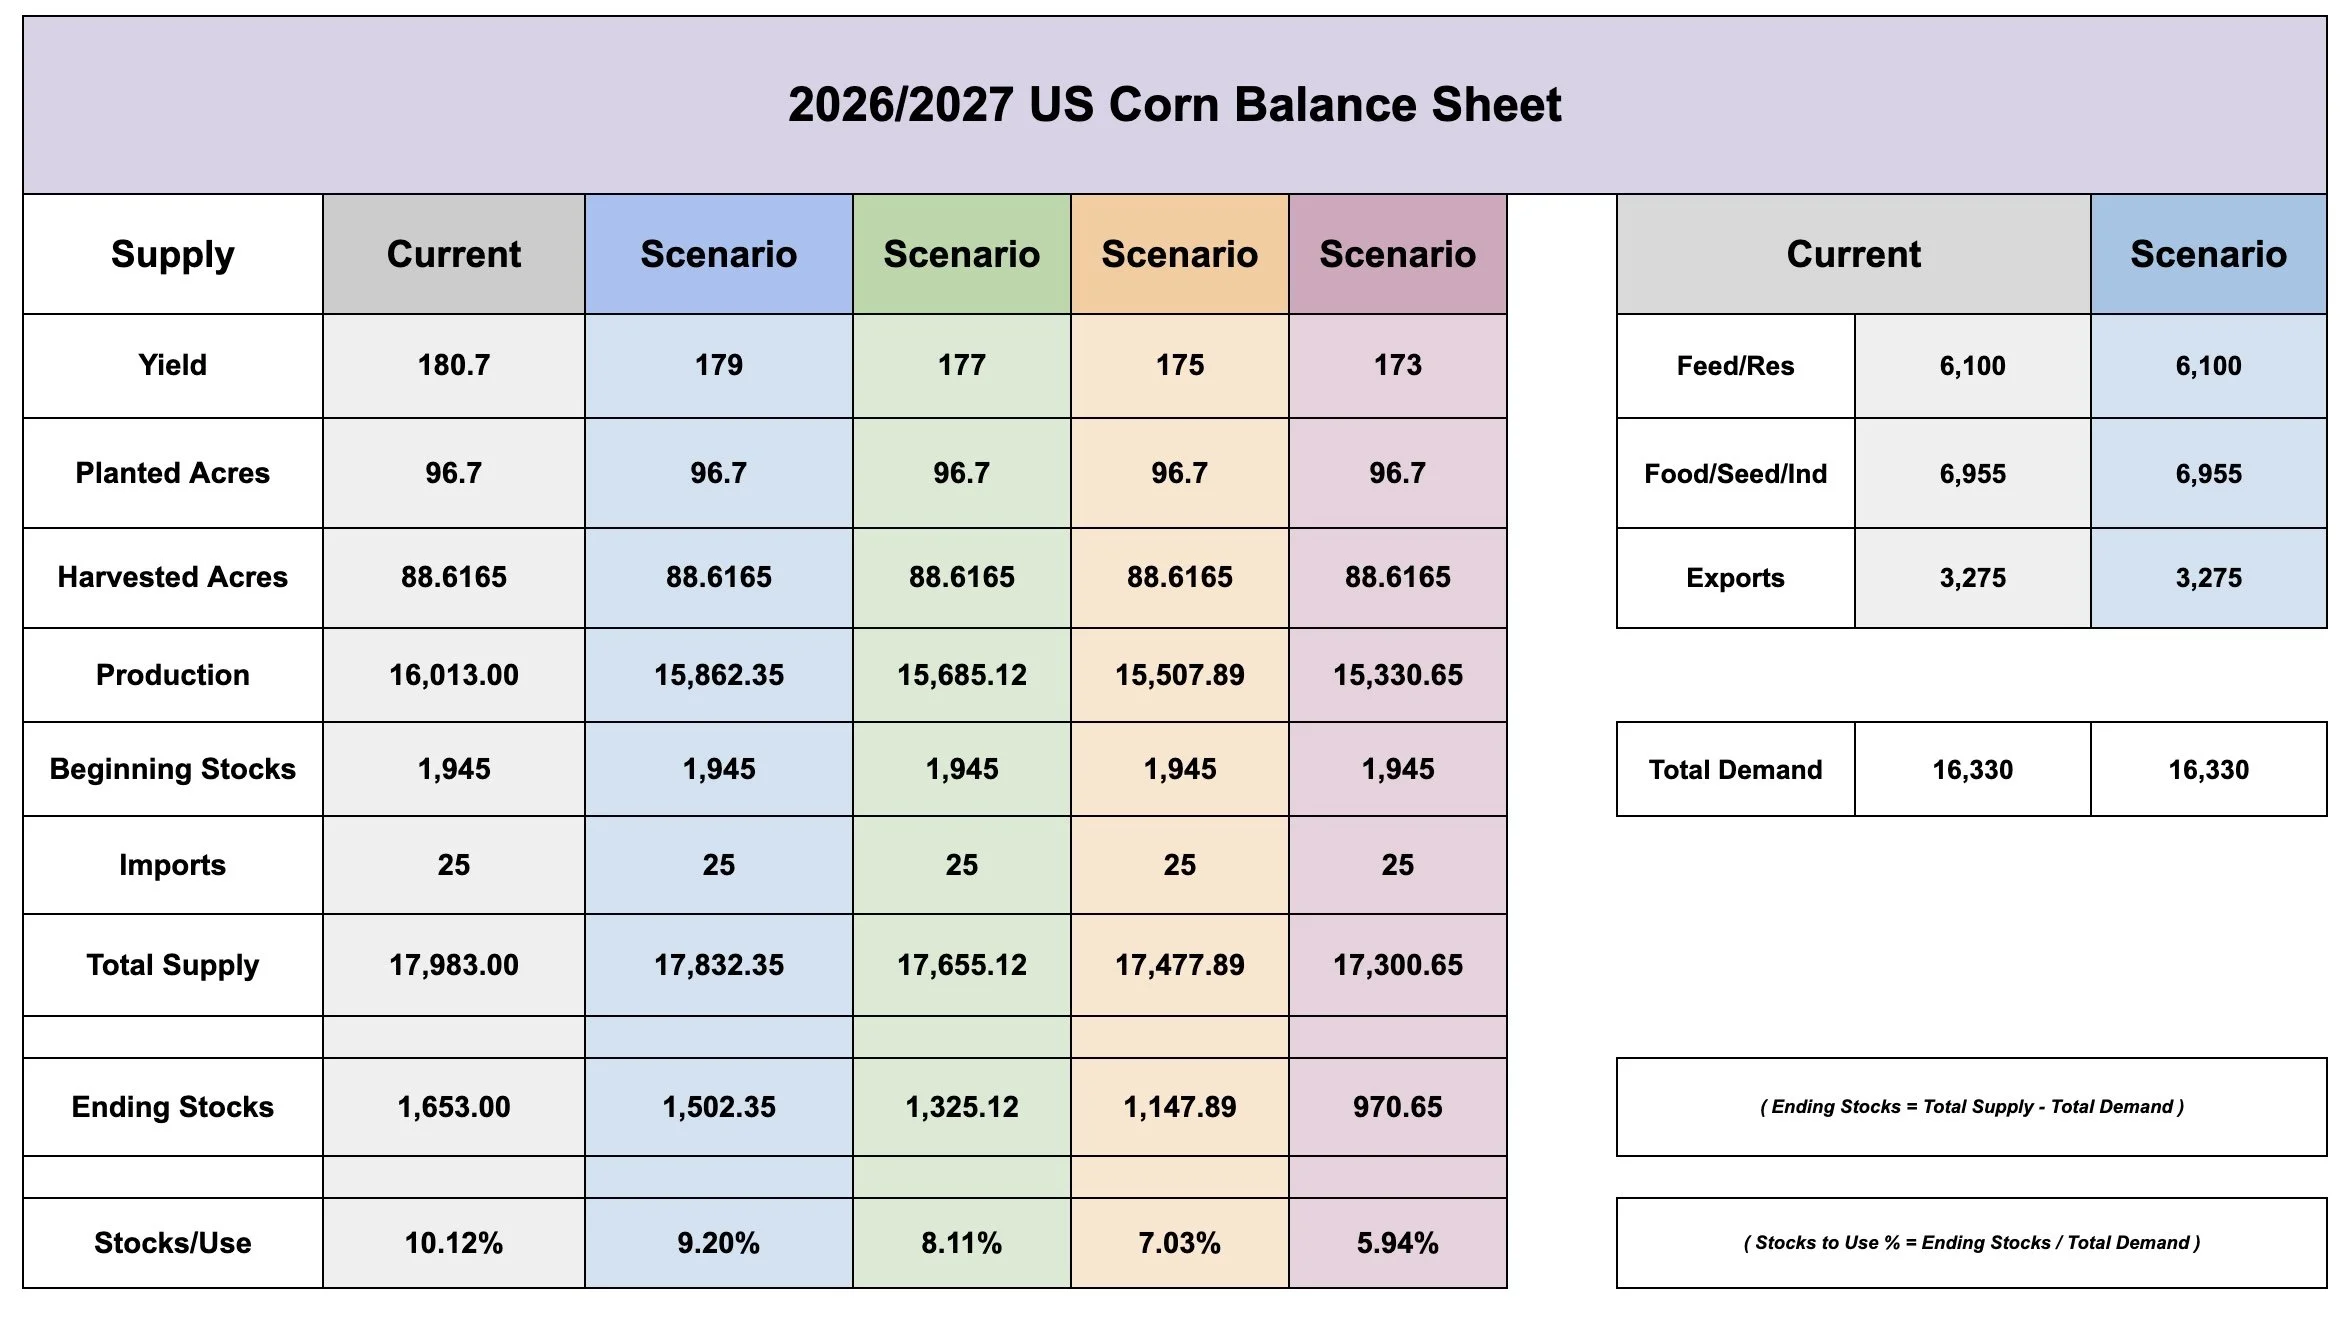
What if yield is actually below 180?
Let's run through some scenarios to see how it changes things.
None of these scenarios include changes to demand.
But you can see that any further cut to yield would result in a very tight situation for corn.
Anything below 180 gets that stocks to use ratio below 10%.
There is simply not much wiggle room.
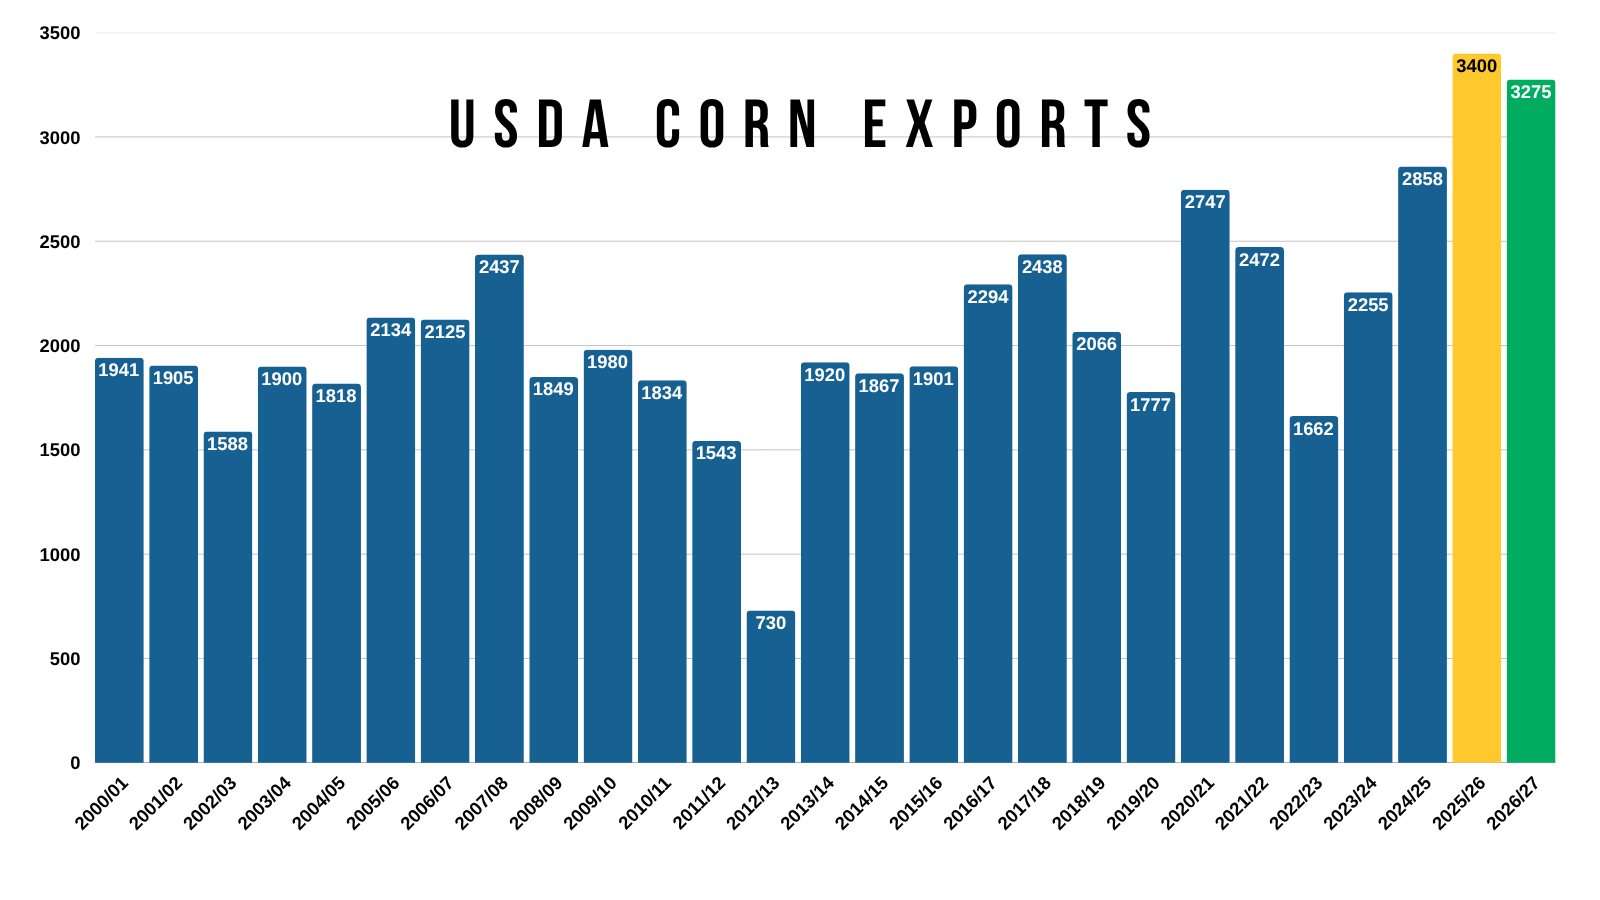
If supply is not there, how are we suppose to meet that record demand?
We'd have to ration demand lower via prices being higher.
We simply cannot afford a yield below 180 or the balance sheet tightens up extremely fast.
I'd also argue that our old crop exports are going to need to be raised more to begin with. Which would further cut into this new crop carryout.
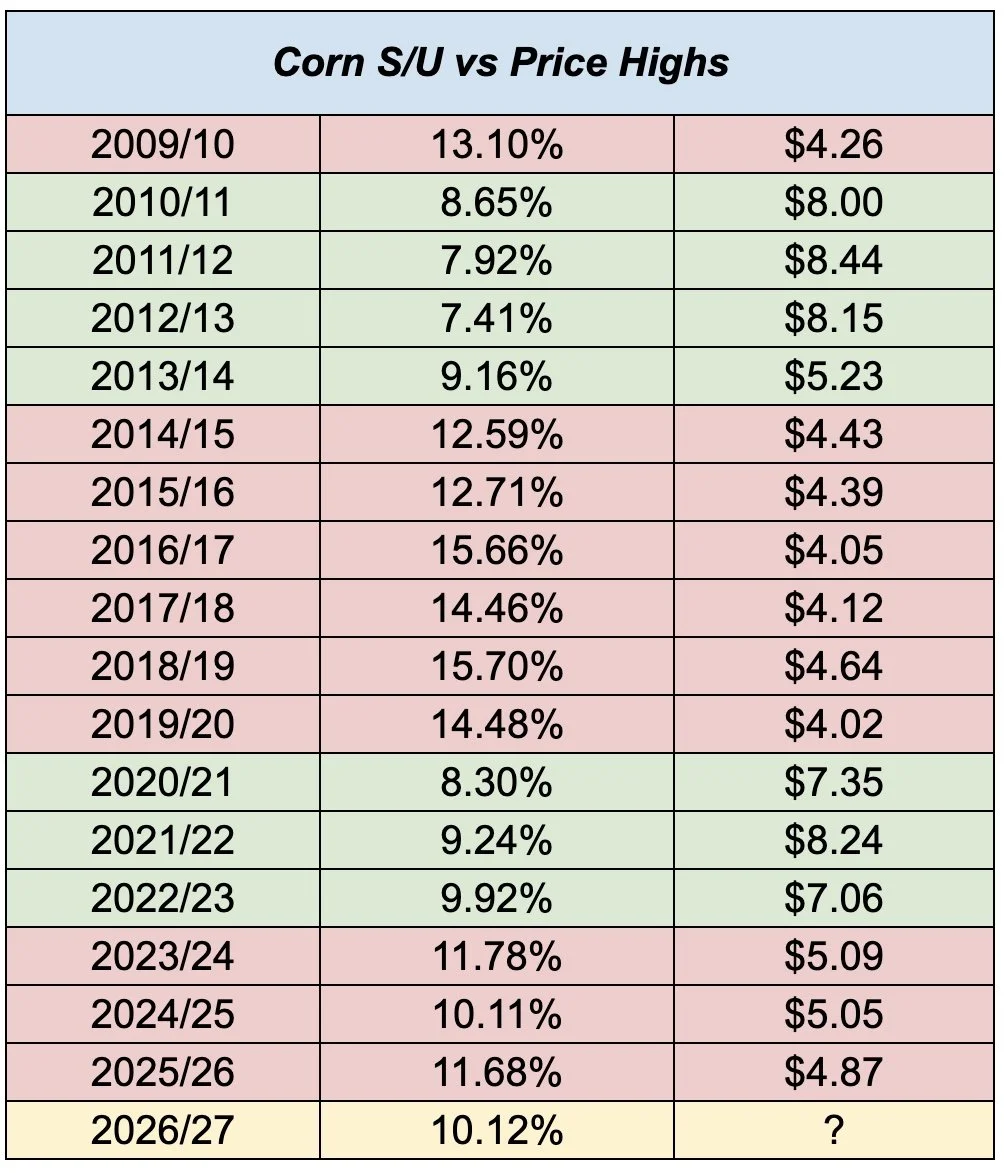
If the stocks to use ends up at the current 10% it's at right now, and the balance sheet does not get tighter from here, then maybe corn is about fairly priced here.
But if that number starts to creep towards 8-9% then we're probably undervalued here.
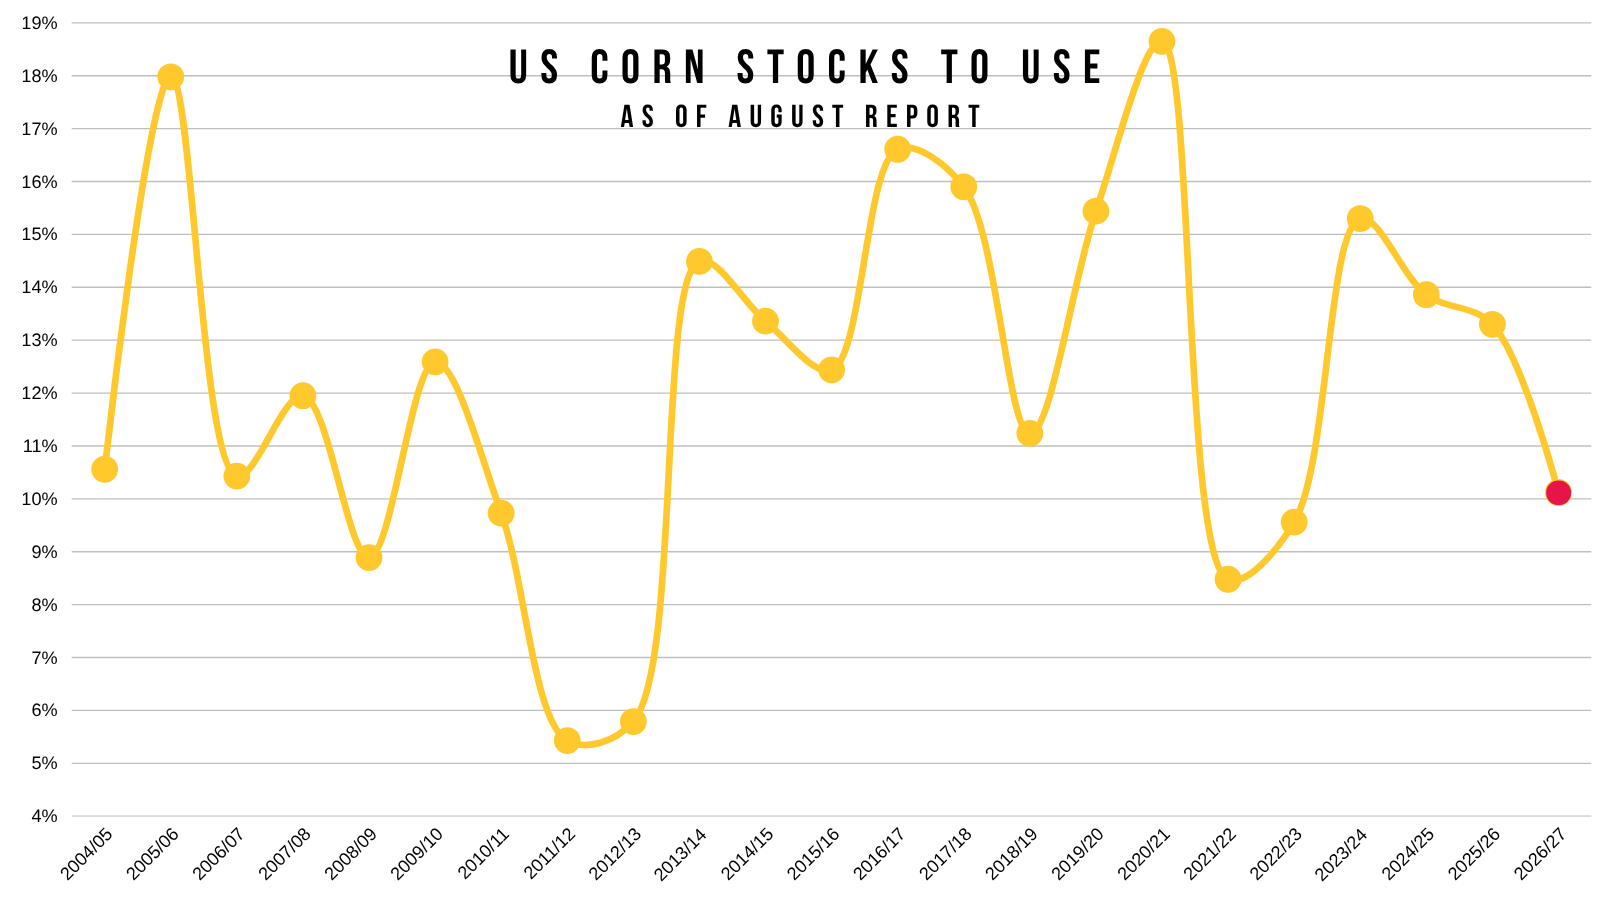
As we've talked about before, usually the situation tightens up as the year goes on.
Right now we are starting at an incredibly tight spot.
The tightest we've been in August since 2022.
With the potential to get tighter.
Highs by Month:
I showed this the other day.
This shows new crop corn's highest price for every single month since 2005.
We just posted new highs for the year.
We have not posted our highs in August since 2011 and 2012.
We have never posted our highs in September or October.
The last two times we posted our highs at the end of the year a bull market followed. Which was both 2010 and 2020.
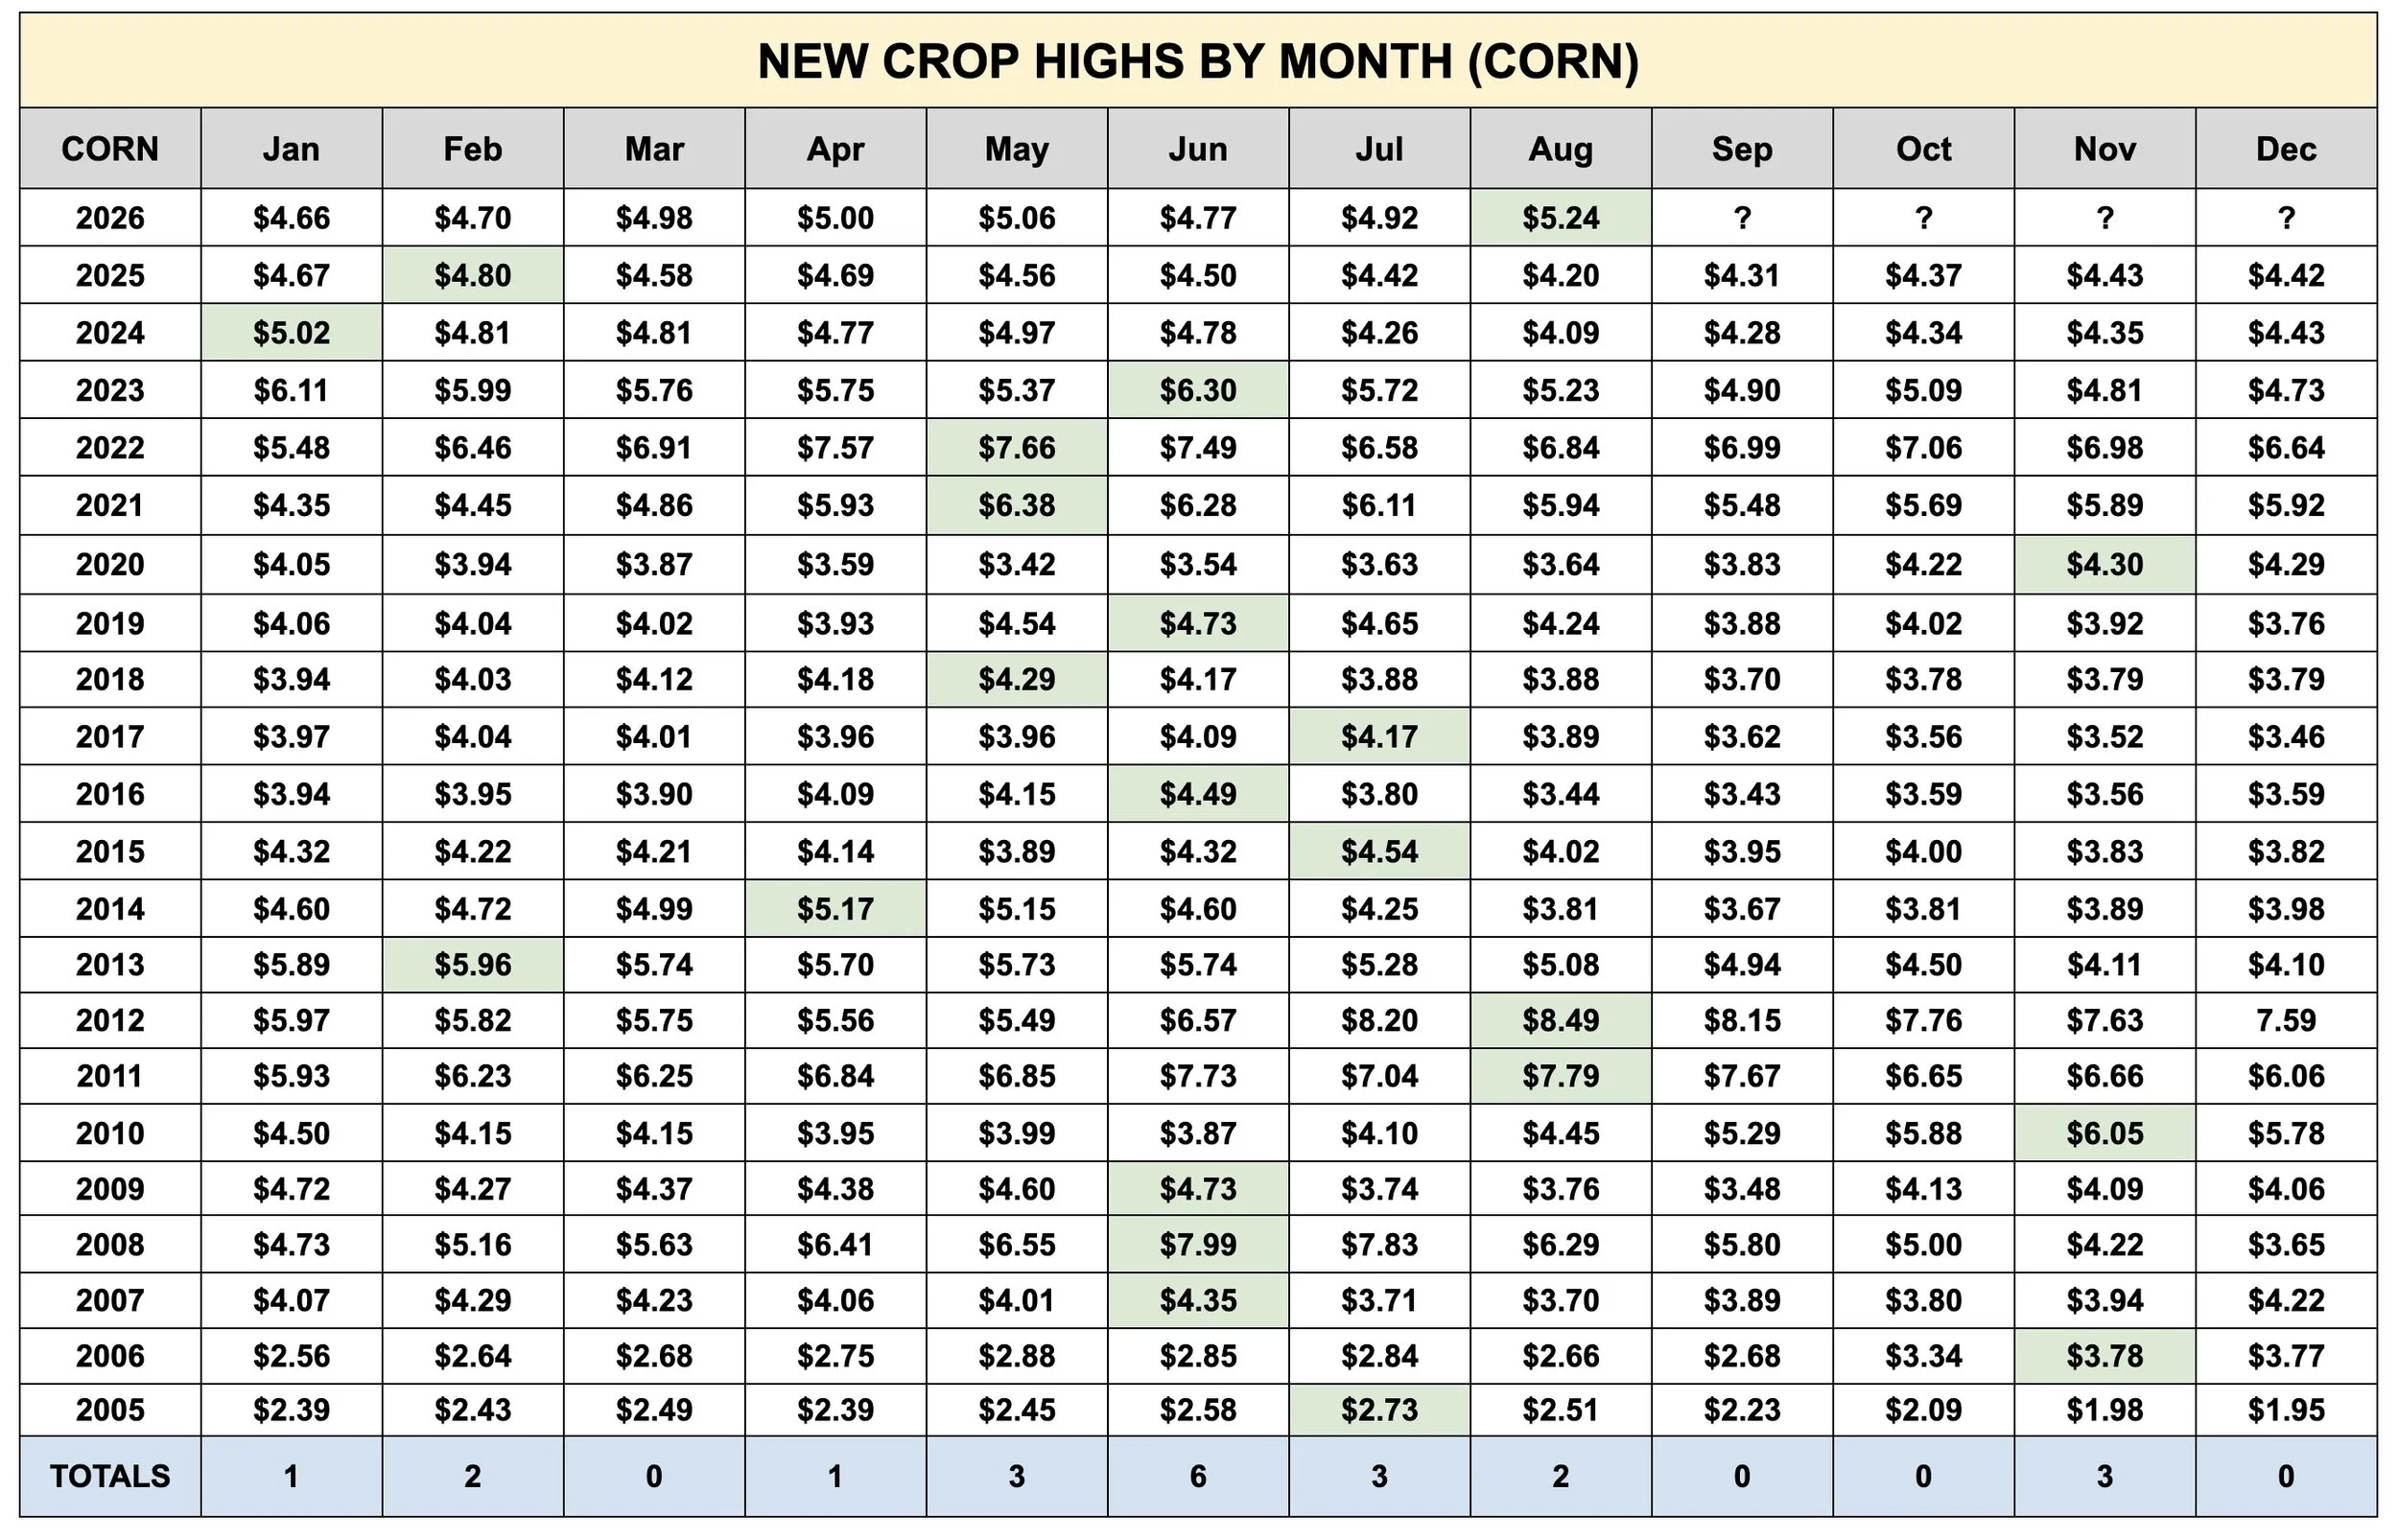
Again, the only two years we posted our highs in August was 2011 and 2012.
But this year is different than both of those.
In 2011, we were coming off the back of the start of the bull run that started in 2010.
Then we all know what happened in 2012.
So this year feels more similar to 2010 and 2020 rather than 2011 or 2012.
This hasn’t been a simple weather scare rally. Next week is already September.
Below is a chart that compares 2026, 2020, 2012, 2011, and 2010. As these are the years where our highs were posted in August or later.
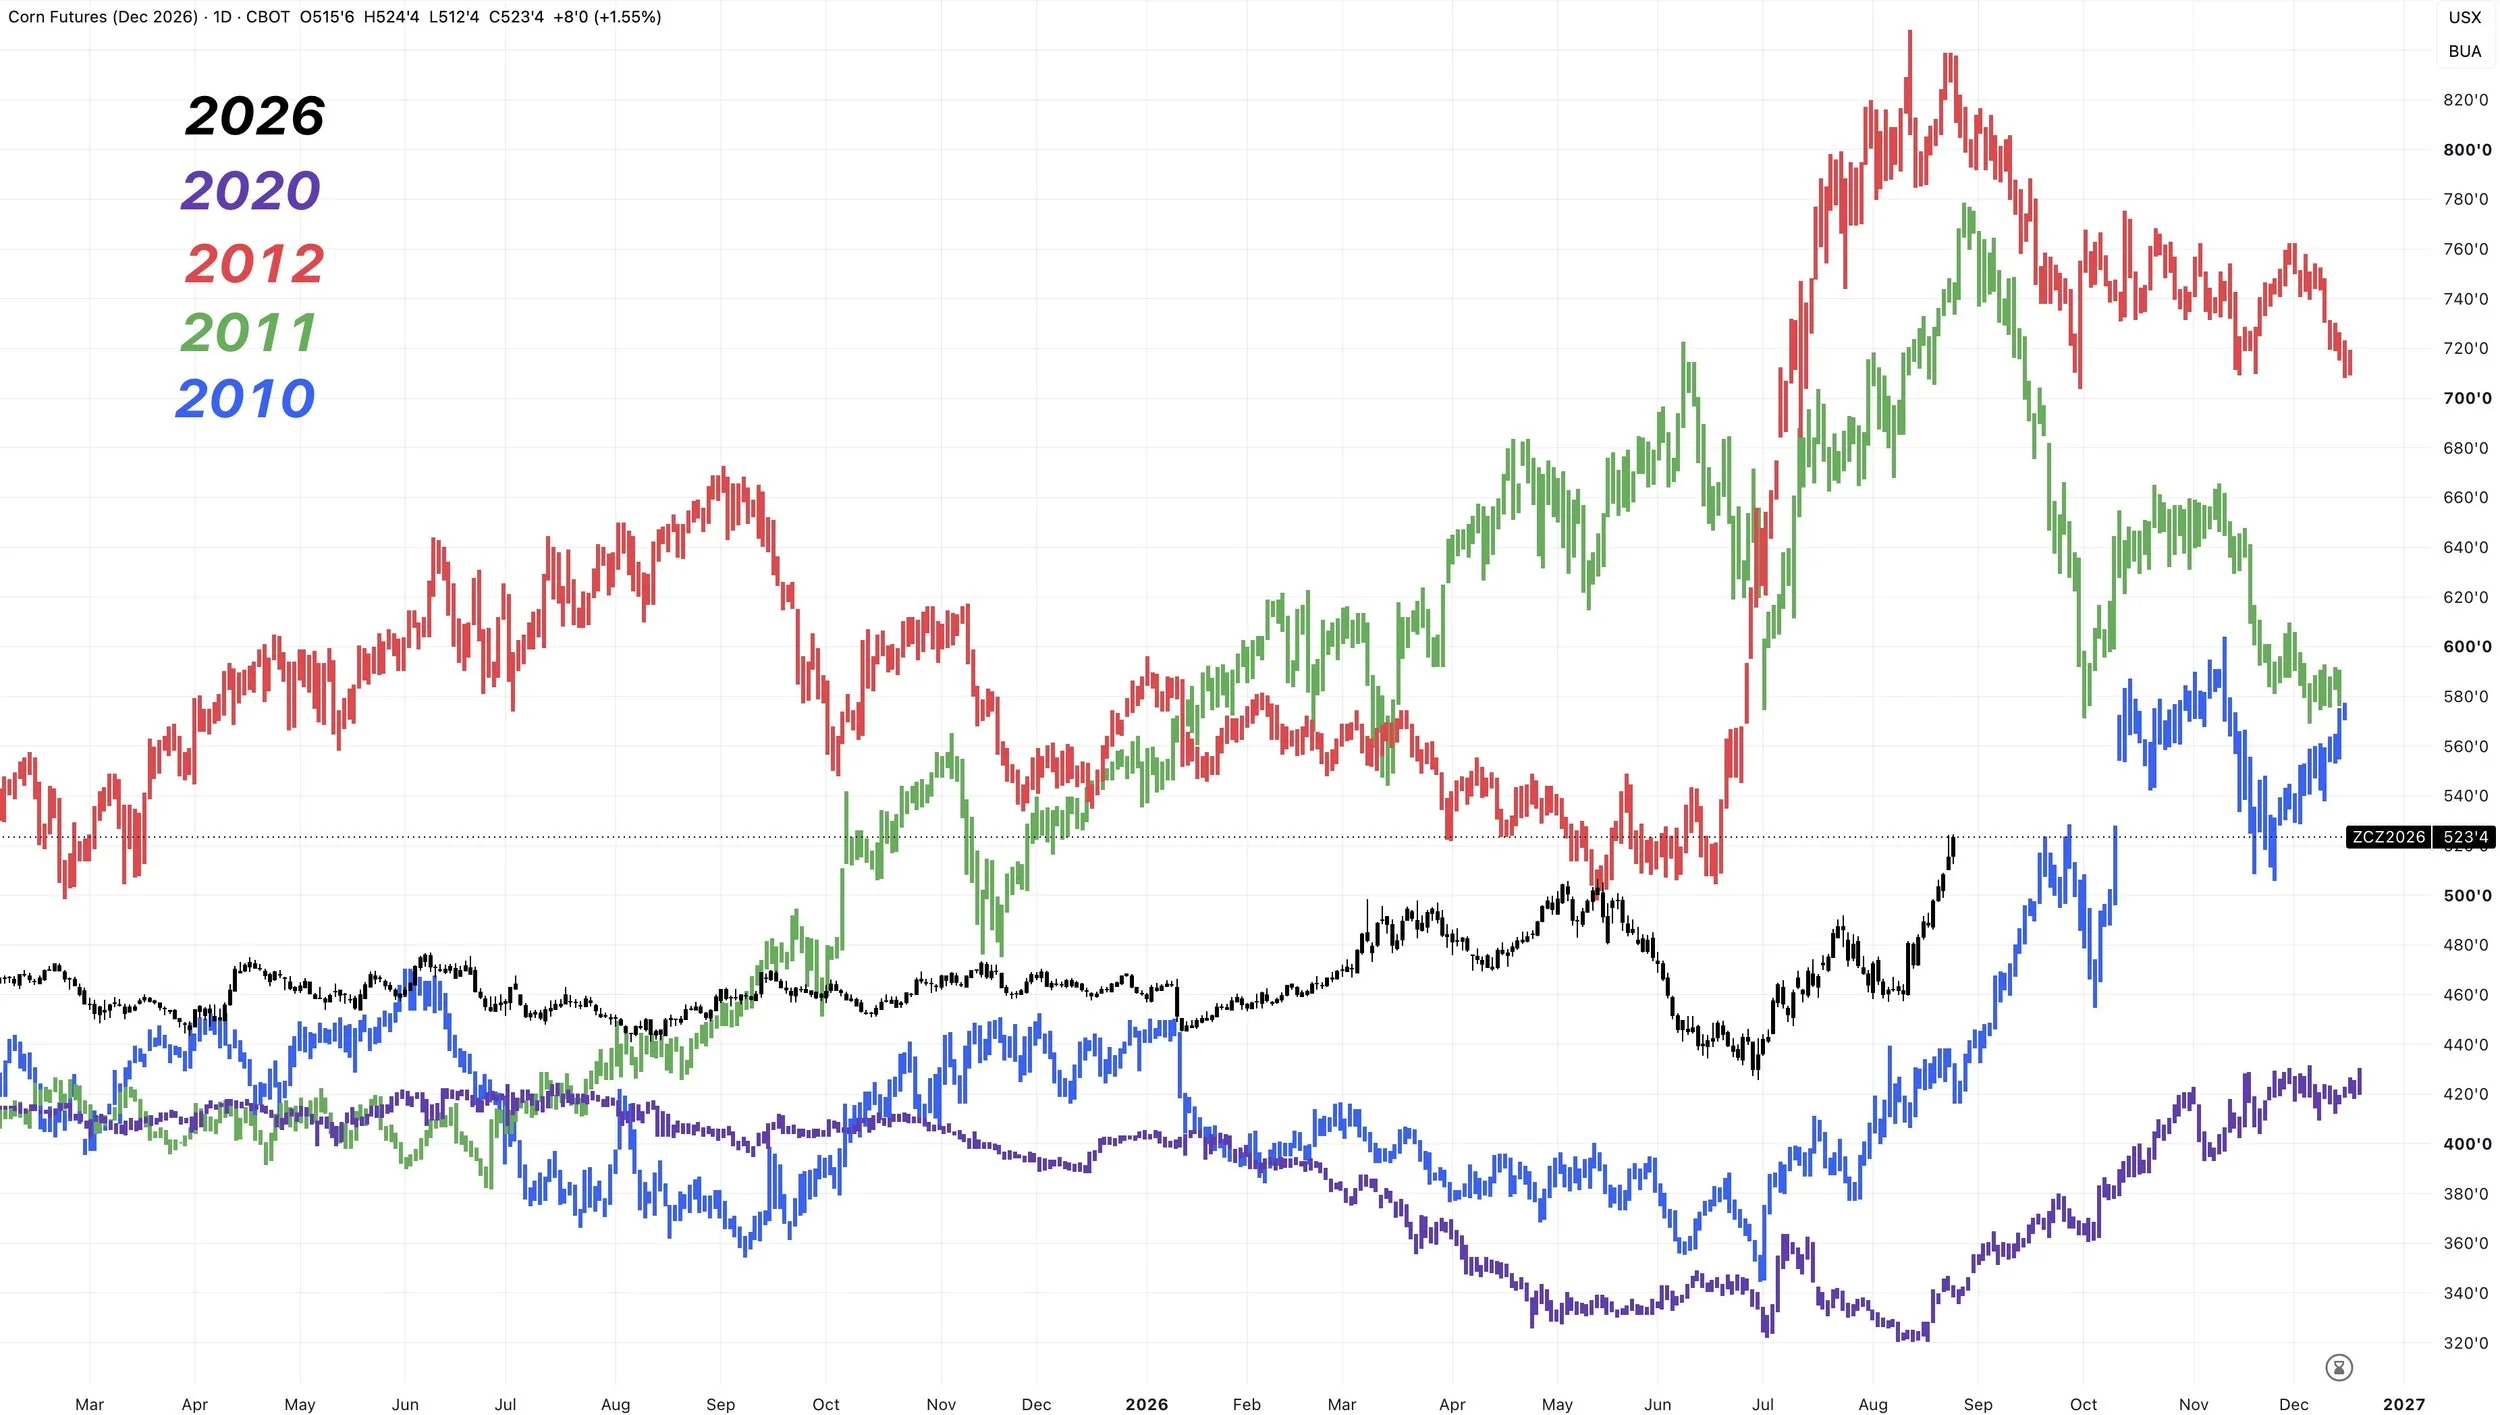
This is more of a demand led market that is realizing our supply might not be able to meet that demand.
The best thing about a demand led market?
It's one that can last.
Bottom Line:
We are posting new contract highs into a time frame where we are usually making our contract lows. That's usually a pretty friendly sign.
The market is realizing what happens if the crop isn’t as large as advertised.
We've been talking about this potential for a very long time.
If yield is actually below 180, then this market has plenty of potential.
If yield is not below 180, then no we do not have to go to $6 or higher corn.
But the potential for better prices is the best that it has been in a very long time.
Our marketing thoughts are still the same.
If you're behind in your marketing, lack storage, or have to move stuff off the combine, do not ignore a market that has gone straight up without stopping and posting new highs heading into harvest.
If that is you, then be proactive, whether that's a simple sale or giving yourself a floor via options.
If you've got plenty of time of your hands and are at a comfortable spot in your marketing. We like seeing if that potential is going to unfold.
The last thing we want to do is put ourselves in a position where we are oversold.
Corn does not have to go to +$6.00.. but if it does.. we don’t want to miss out.
We still don’t love doing anything with the 2027 crop.
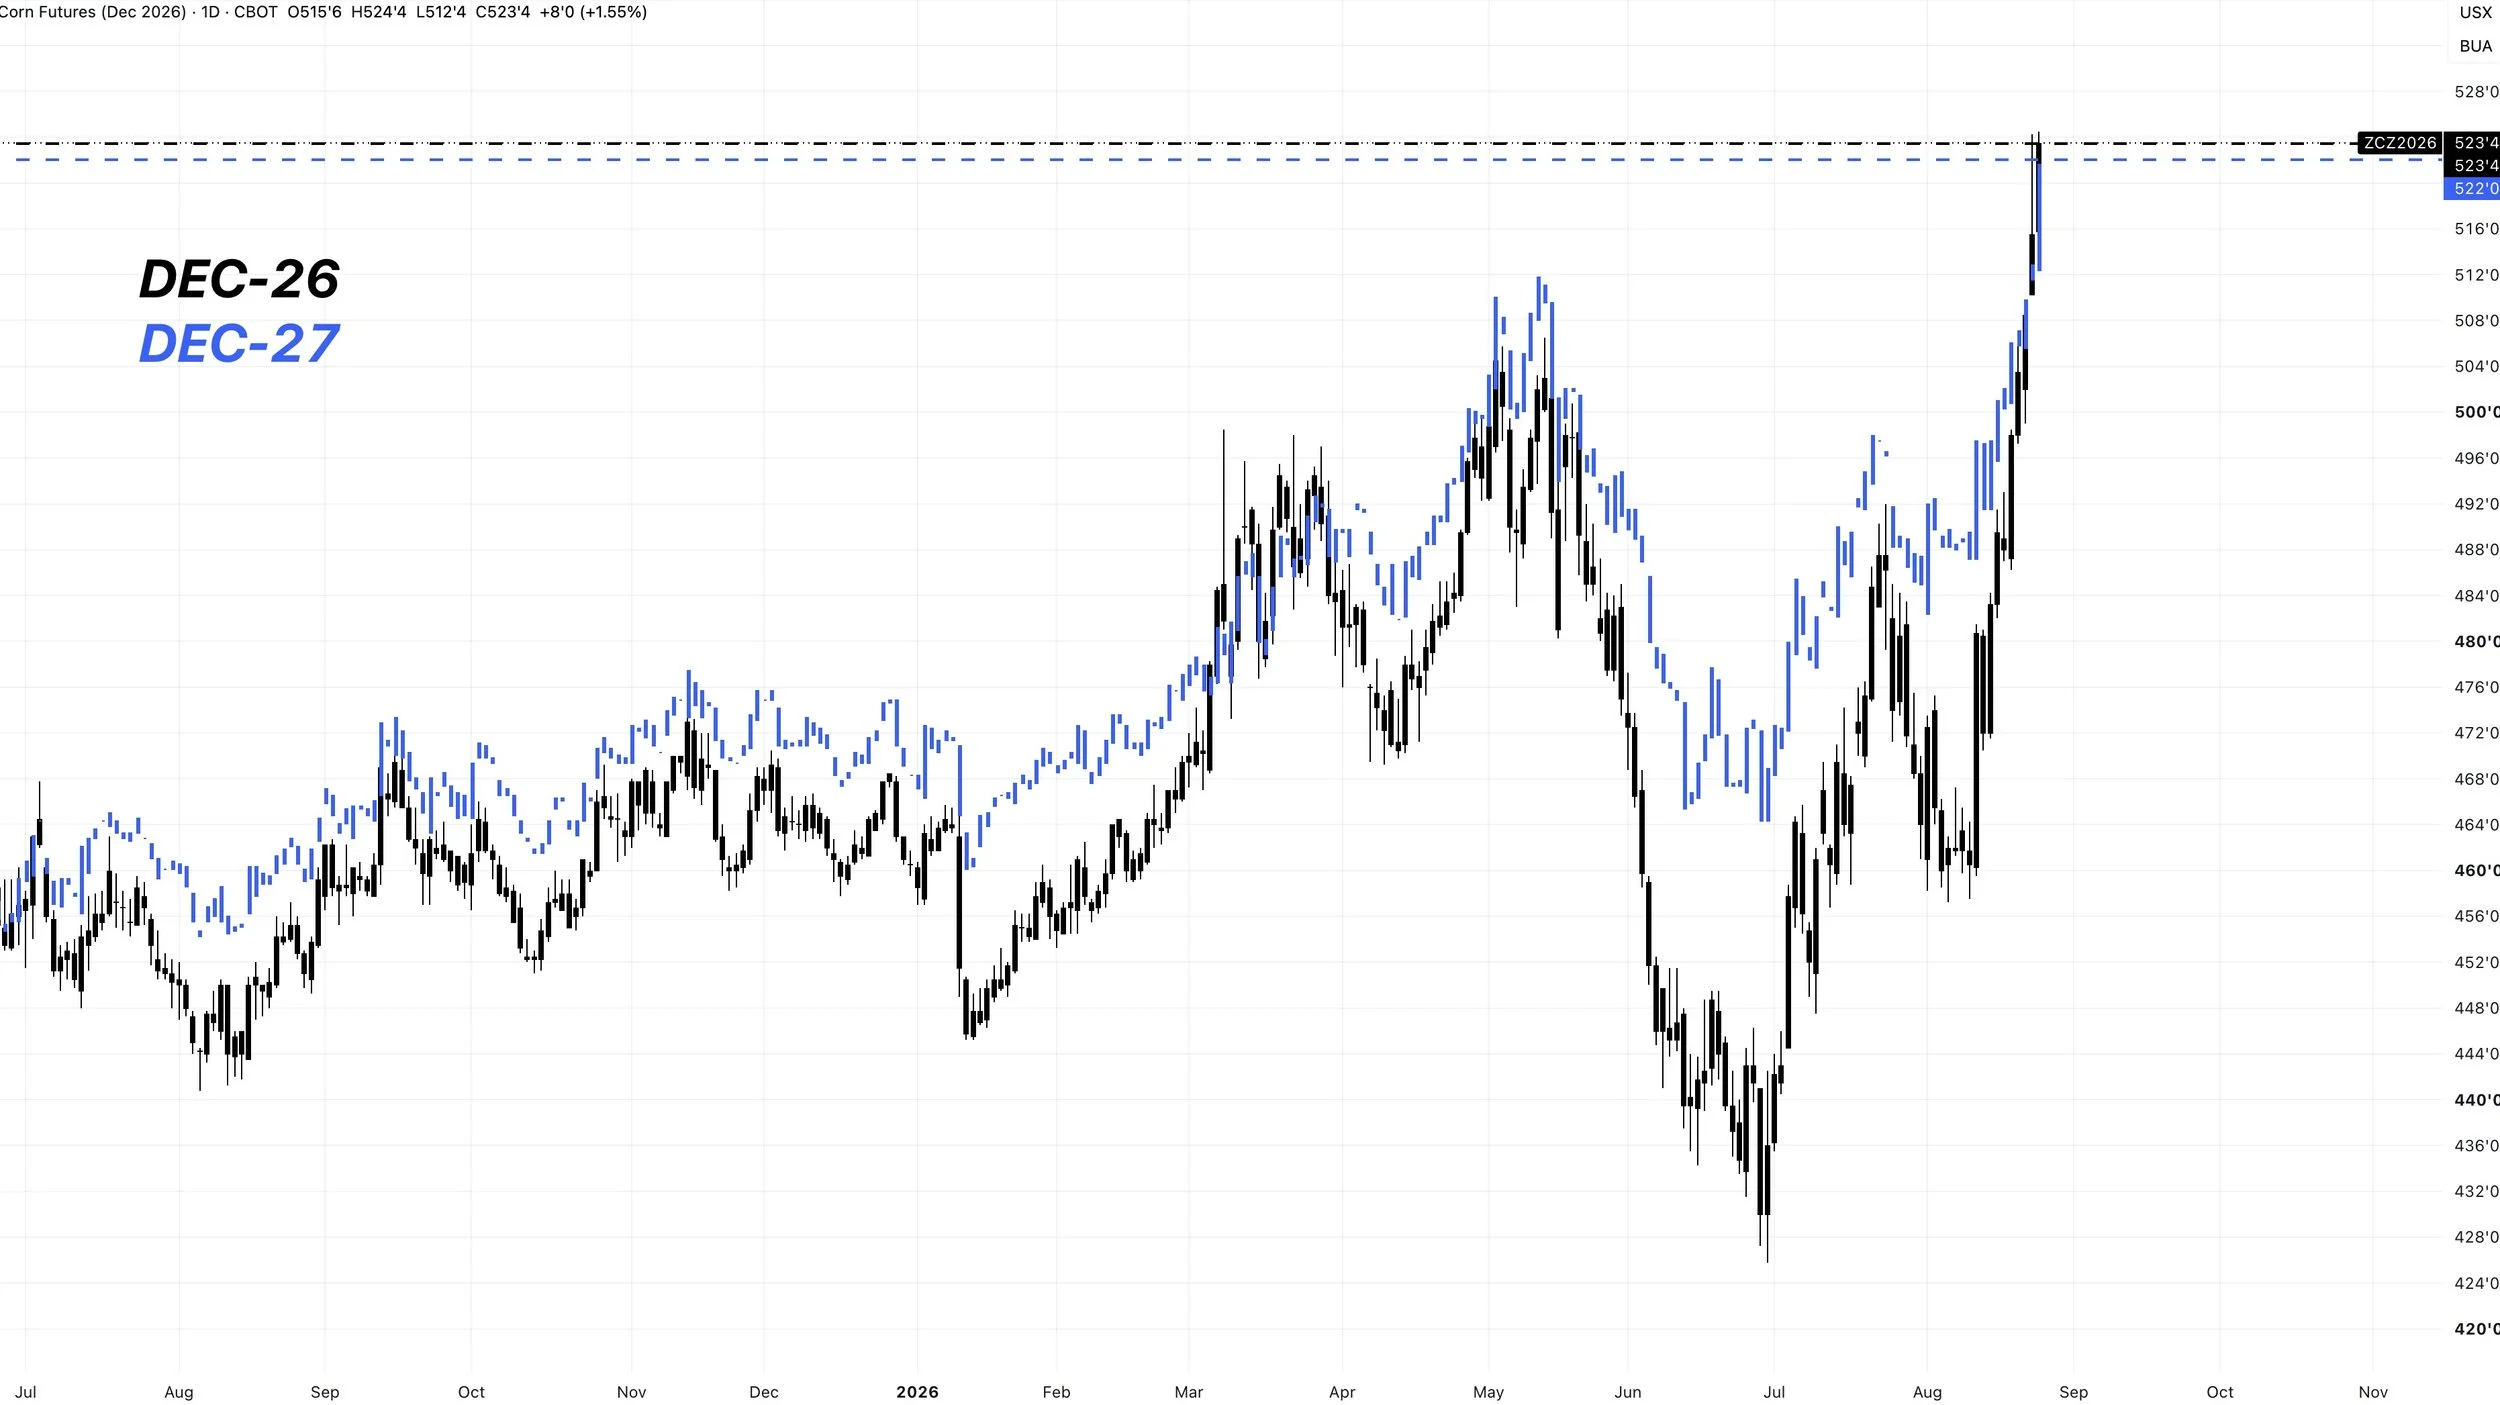
We actually have an inverse between Dec-26 to Dec-27 now.
Dec-26 is going to lead the market higher or lower.
Dec Corn Chart:
Yesterday we gapped higher over the weekend, posting new contract highs.
This move happened on massive volume, the most volume we've seen for this contract.
Which is a bullish sign.
Then today, we closed right back at yesterday’s highs after fading well off the highs yesterday.
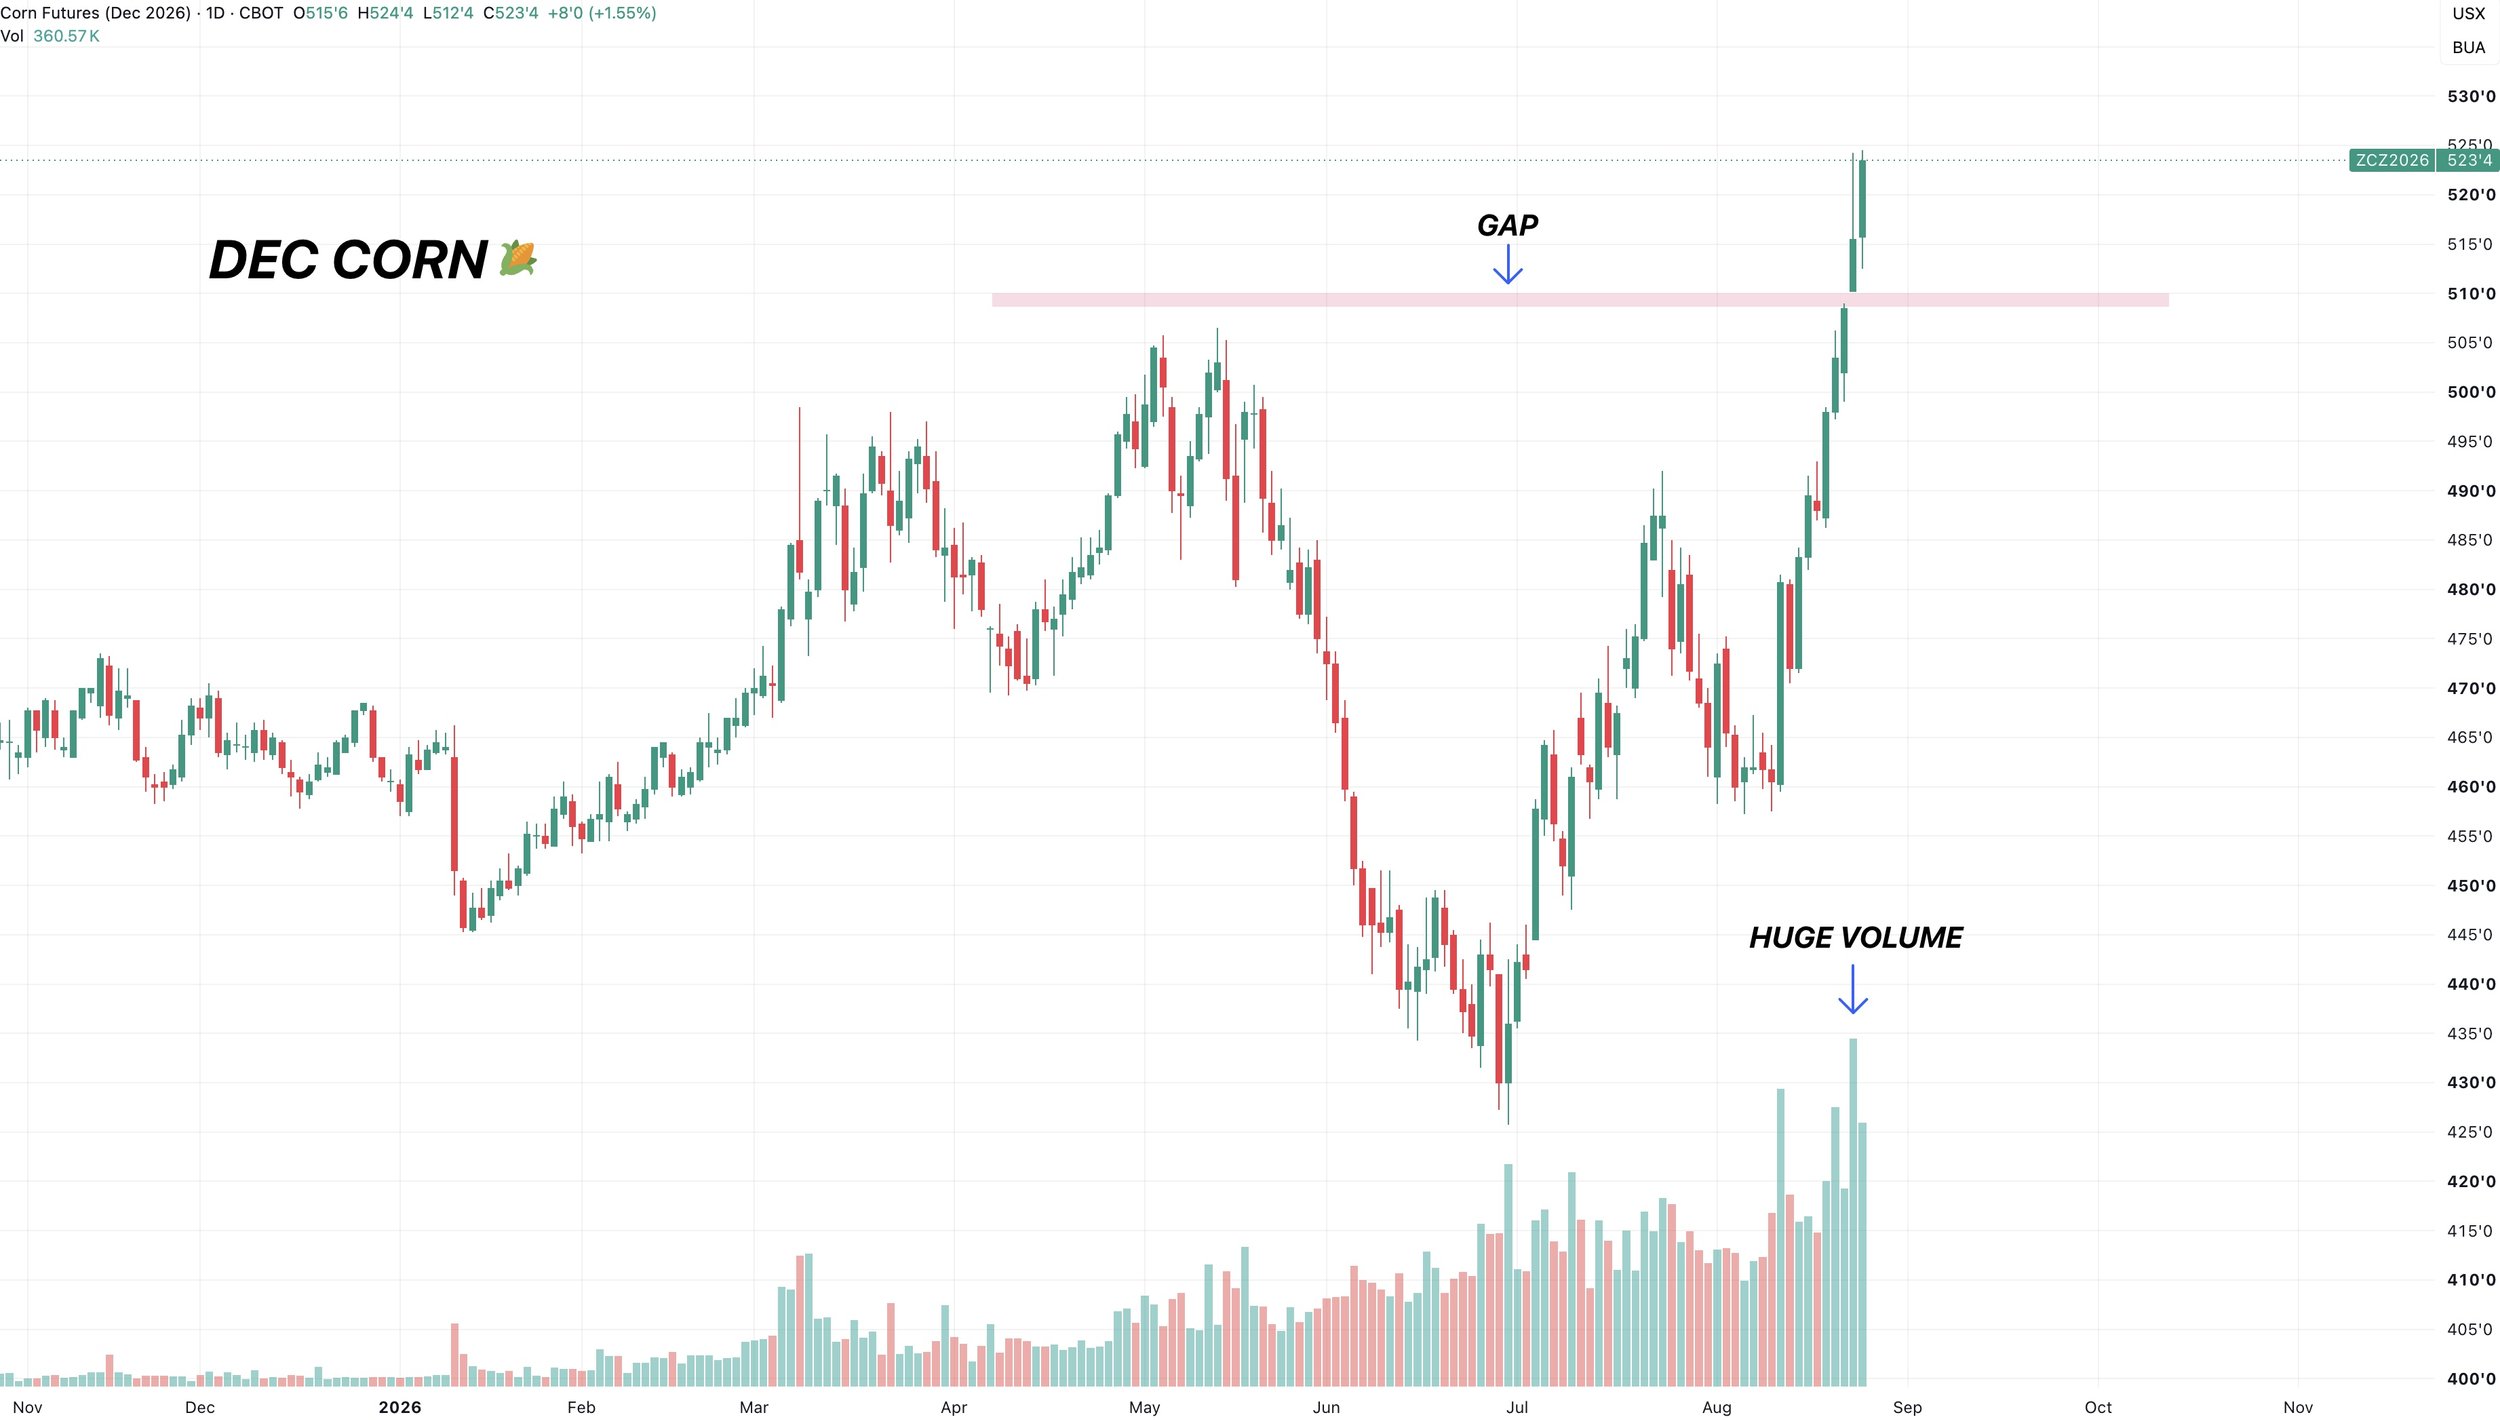
Can this market just continue to melt faces without stopping? Yes, it’s definitely possible.
However, short term this market is getting overextended.
We just ran nearly 70 cents without stopping.
We are also right at a key target area where it wouldn’t shock me to see us take a healthy breather.
We are sitting at the 161.8% to 200% retracement from the August lows up to the July highs. A common continuation target.
This same level is the implied move from the bull flag we broke out of in August.
Beyond this, the next target is going to be around that $5.50 range.
$5.56 is the golden fib (161.8% level) from the contract lows up to those May highs.
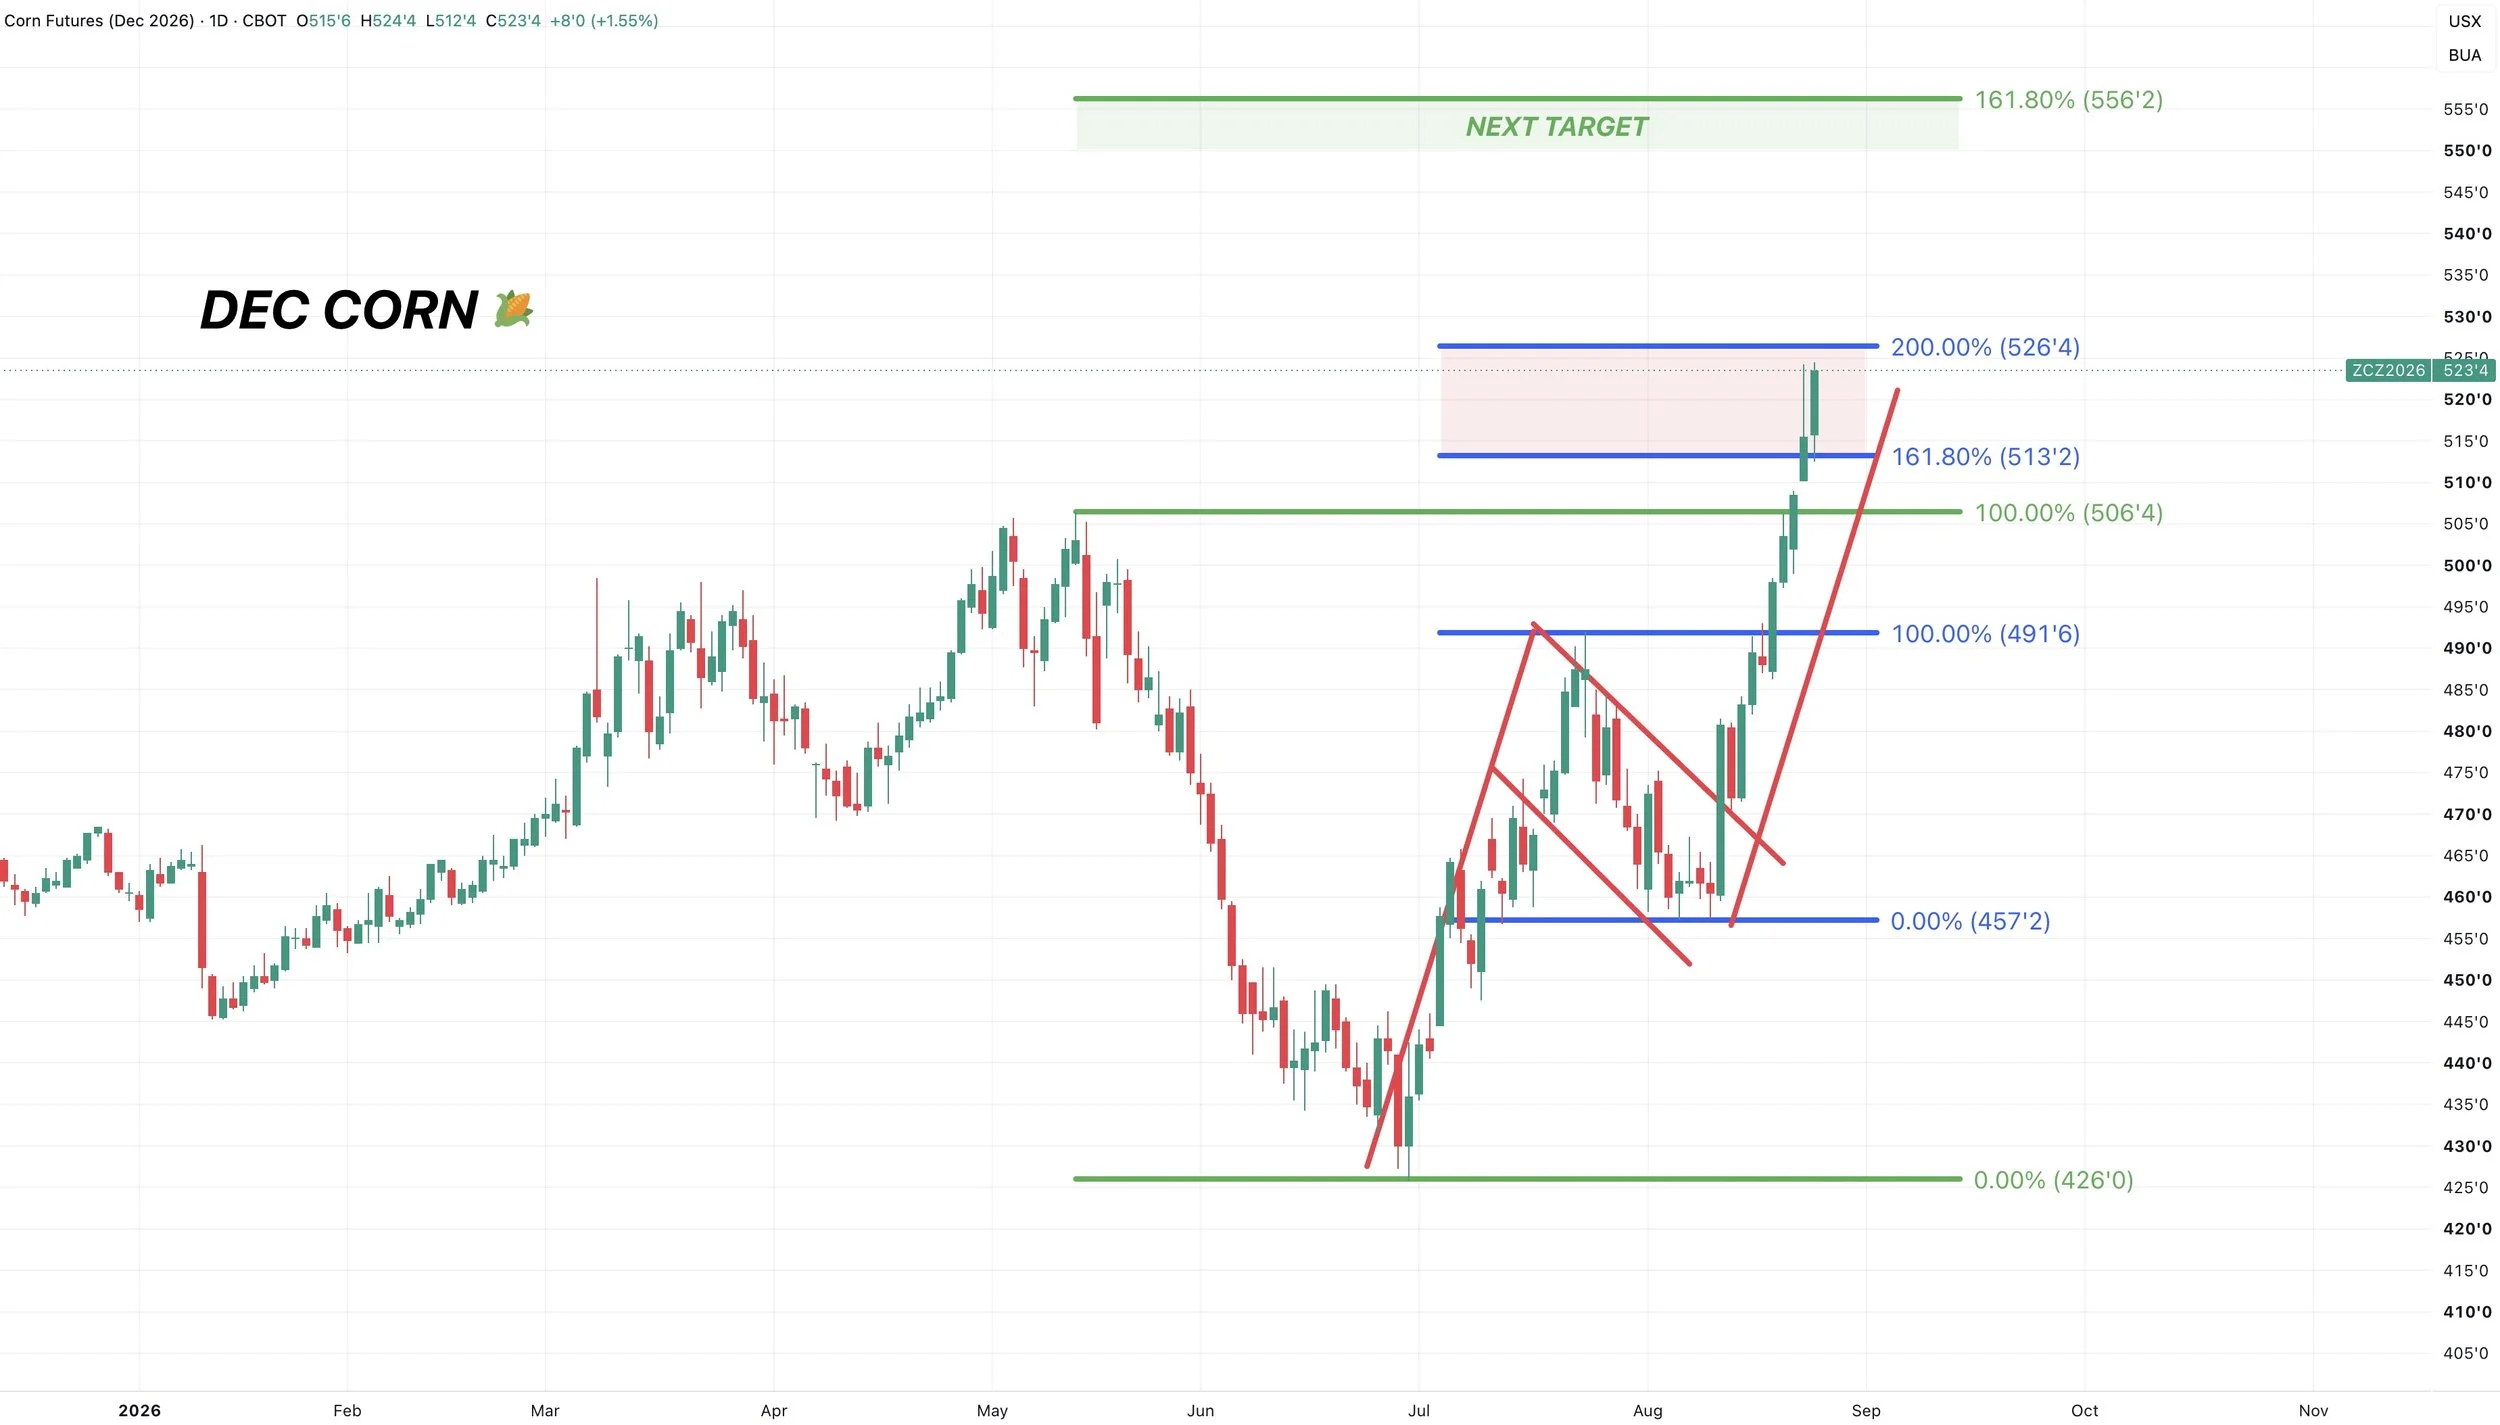
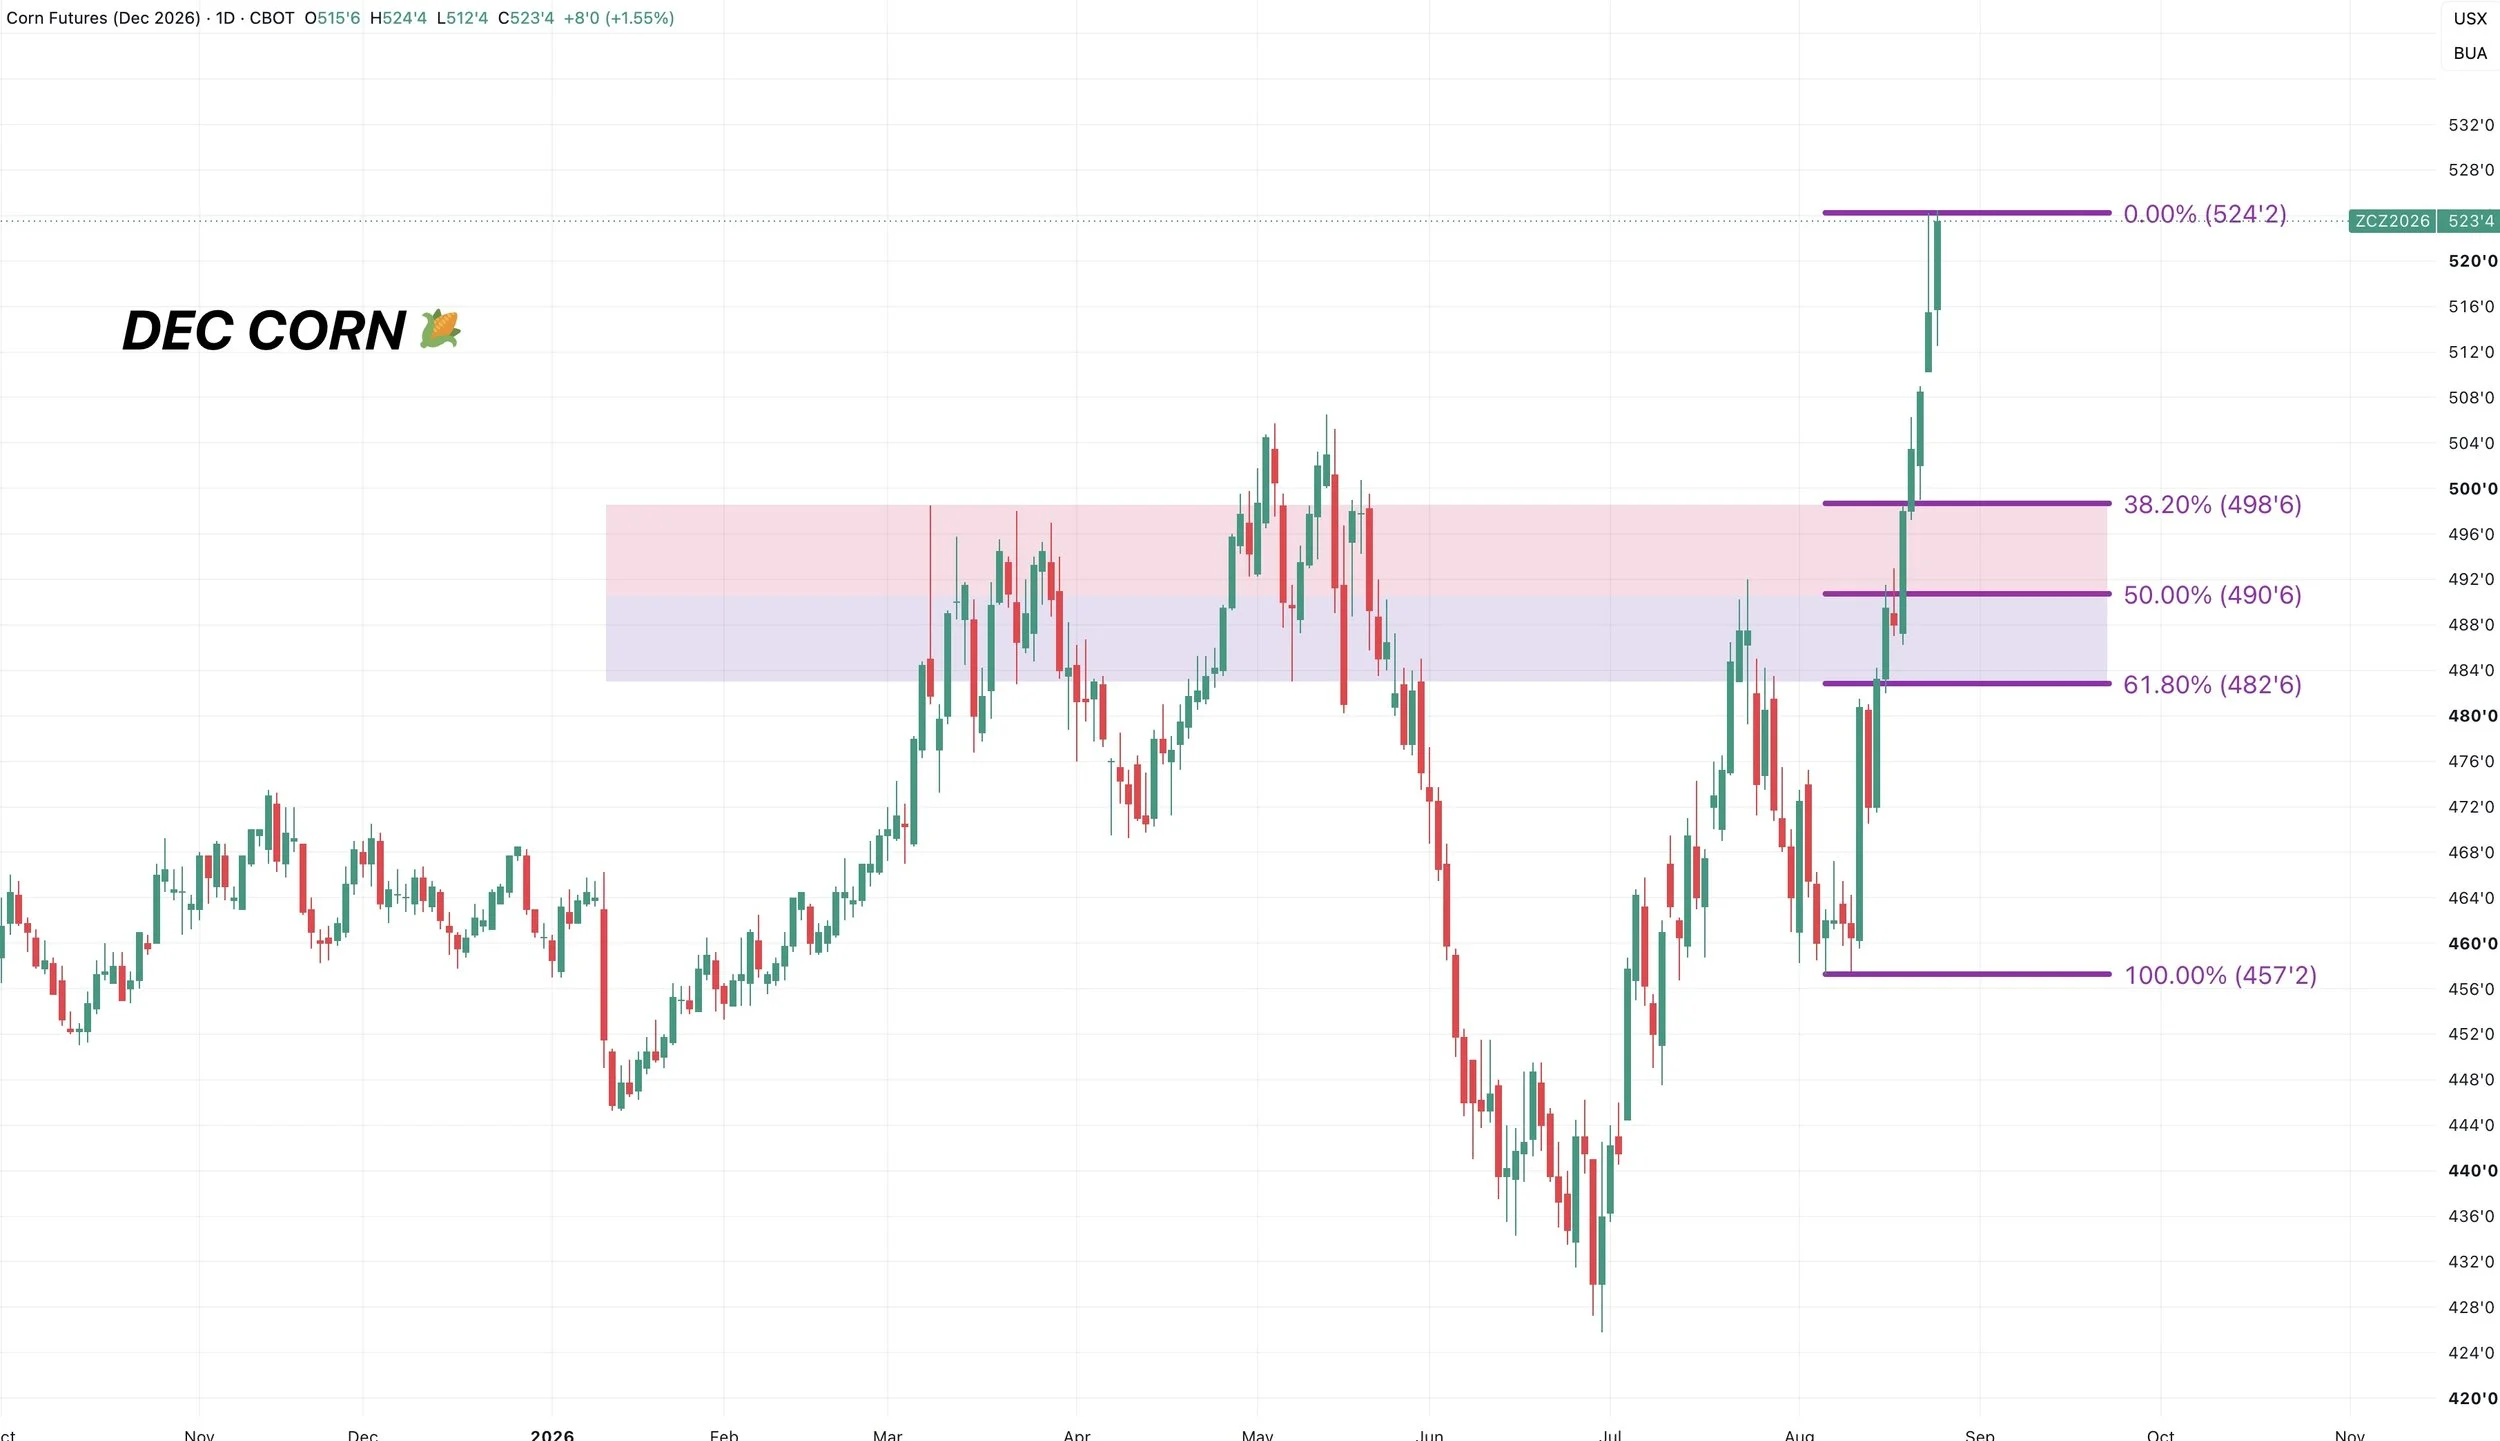
The market doesn’t have to give us a huge pullback, but if it does, I think it'll be viewed as an opportunity.
If we get a sizeable pullback, I am currently eyeing that $4.90 to $5.00 range.
Which would give back 38.2% to 50% of the recent rally.
It would also align with testing those old resistance levels from the spring.
Front Month Chart:
This chart is starting to look very interesting..
We broke trend resistance.
Now right up against those highs from 2025.
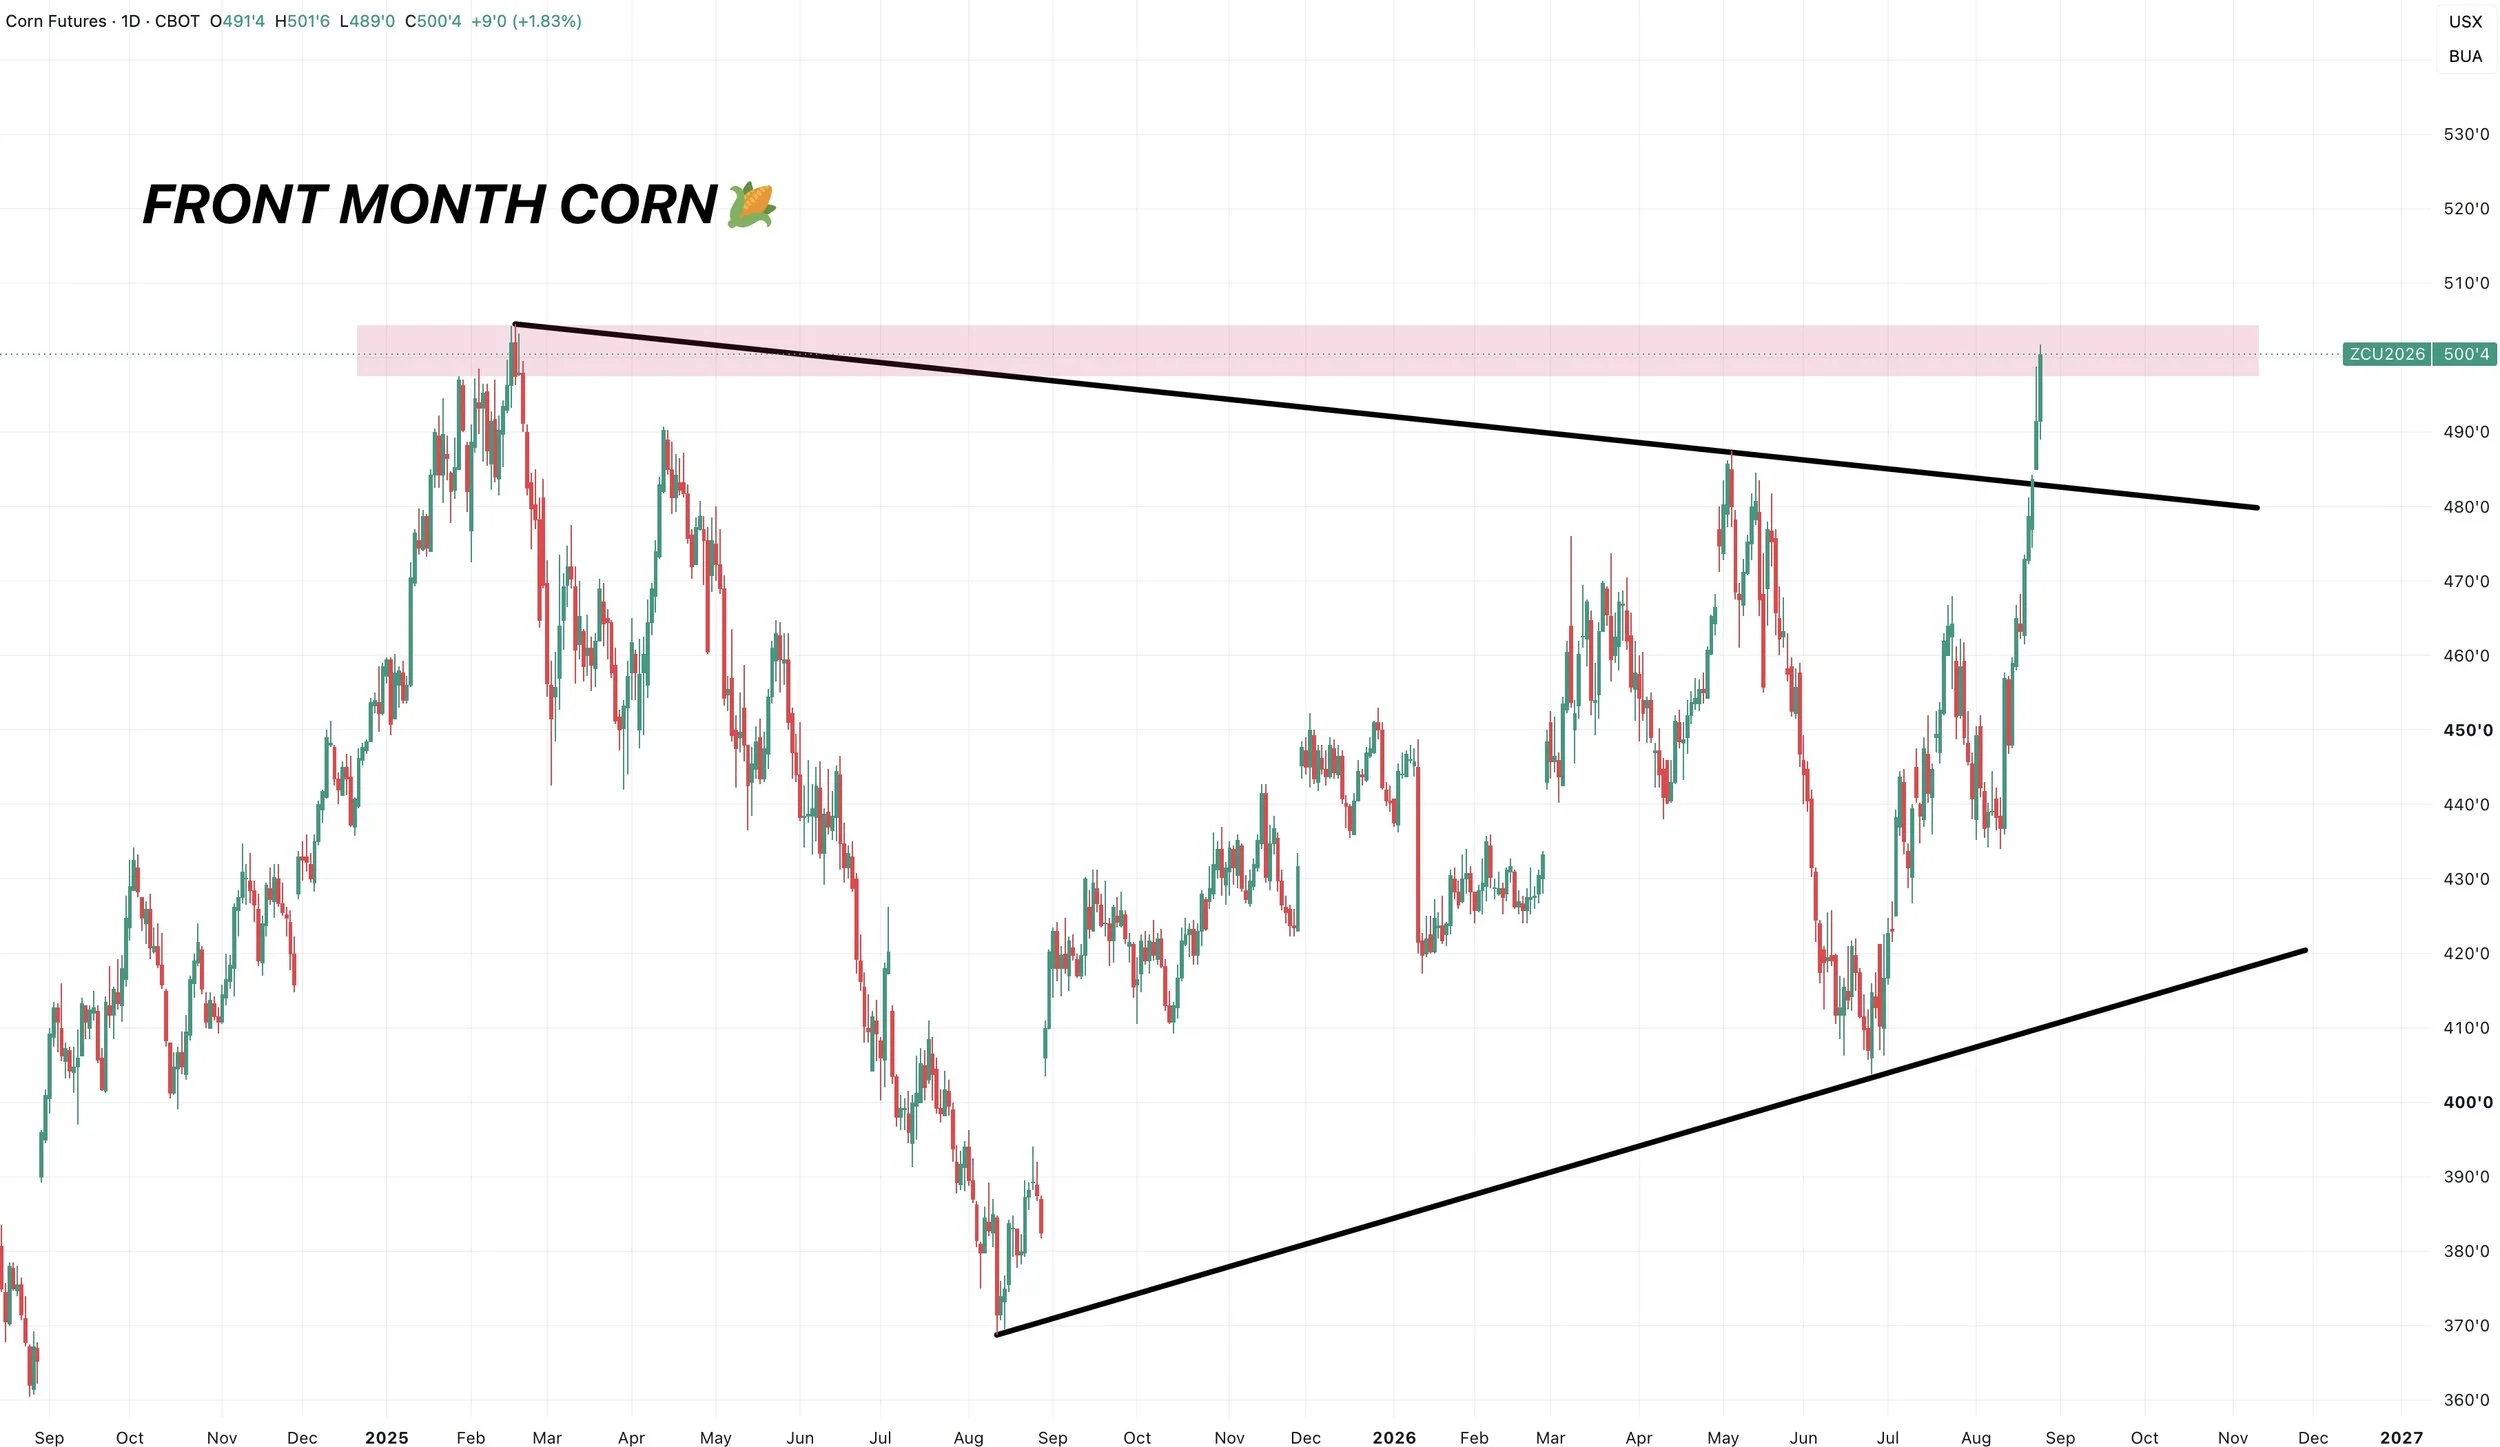
If you zoom out..
Breaking that $5.04 level and the highs from 2025 would be a big deal.
It would be our very first higher high of the entire bear market.
It would suggest that the trend in this market is now higher when taking a long term approach.
So break above, and things become interesting really quick.
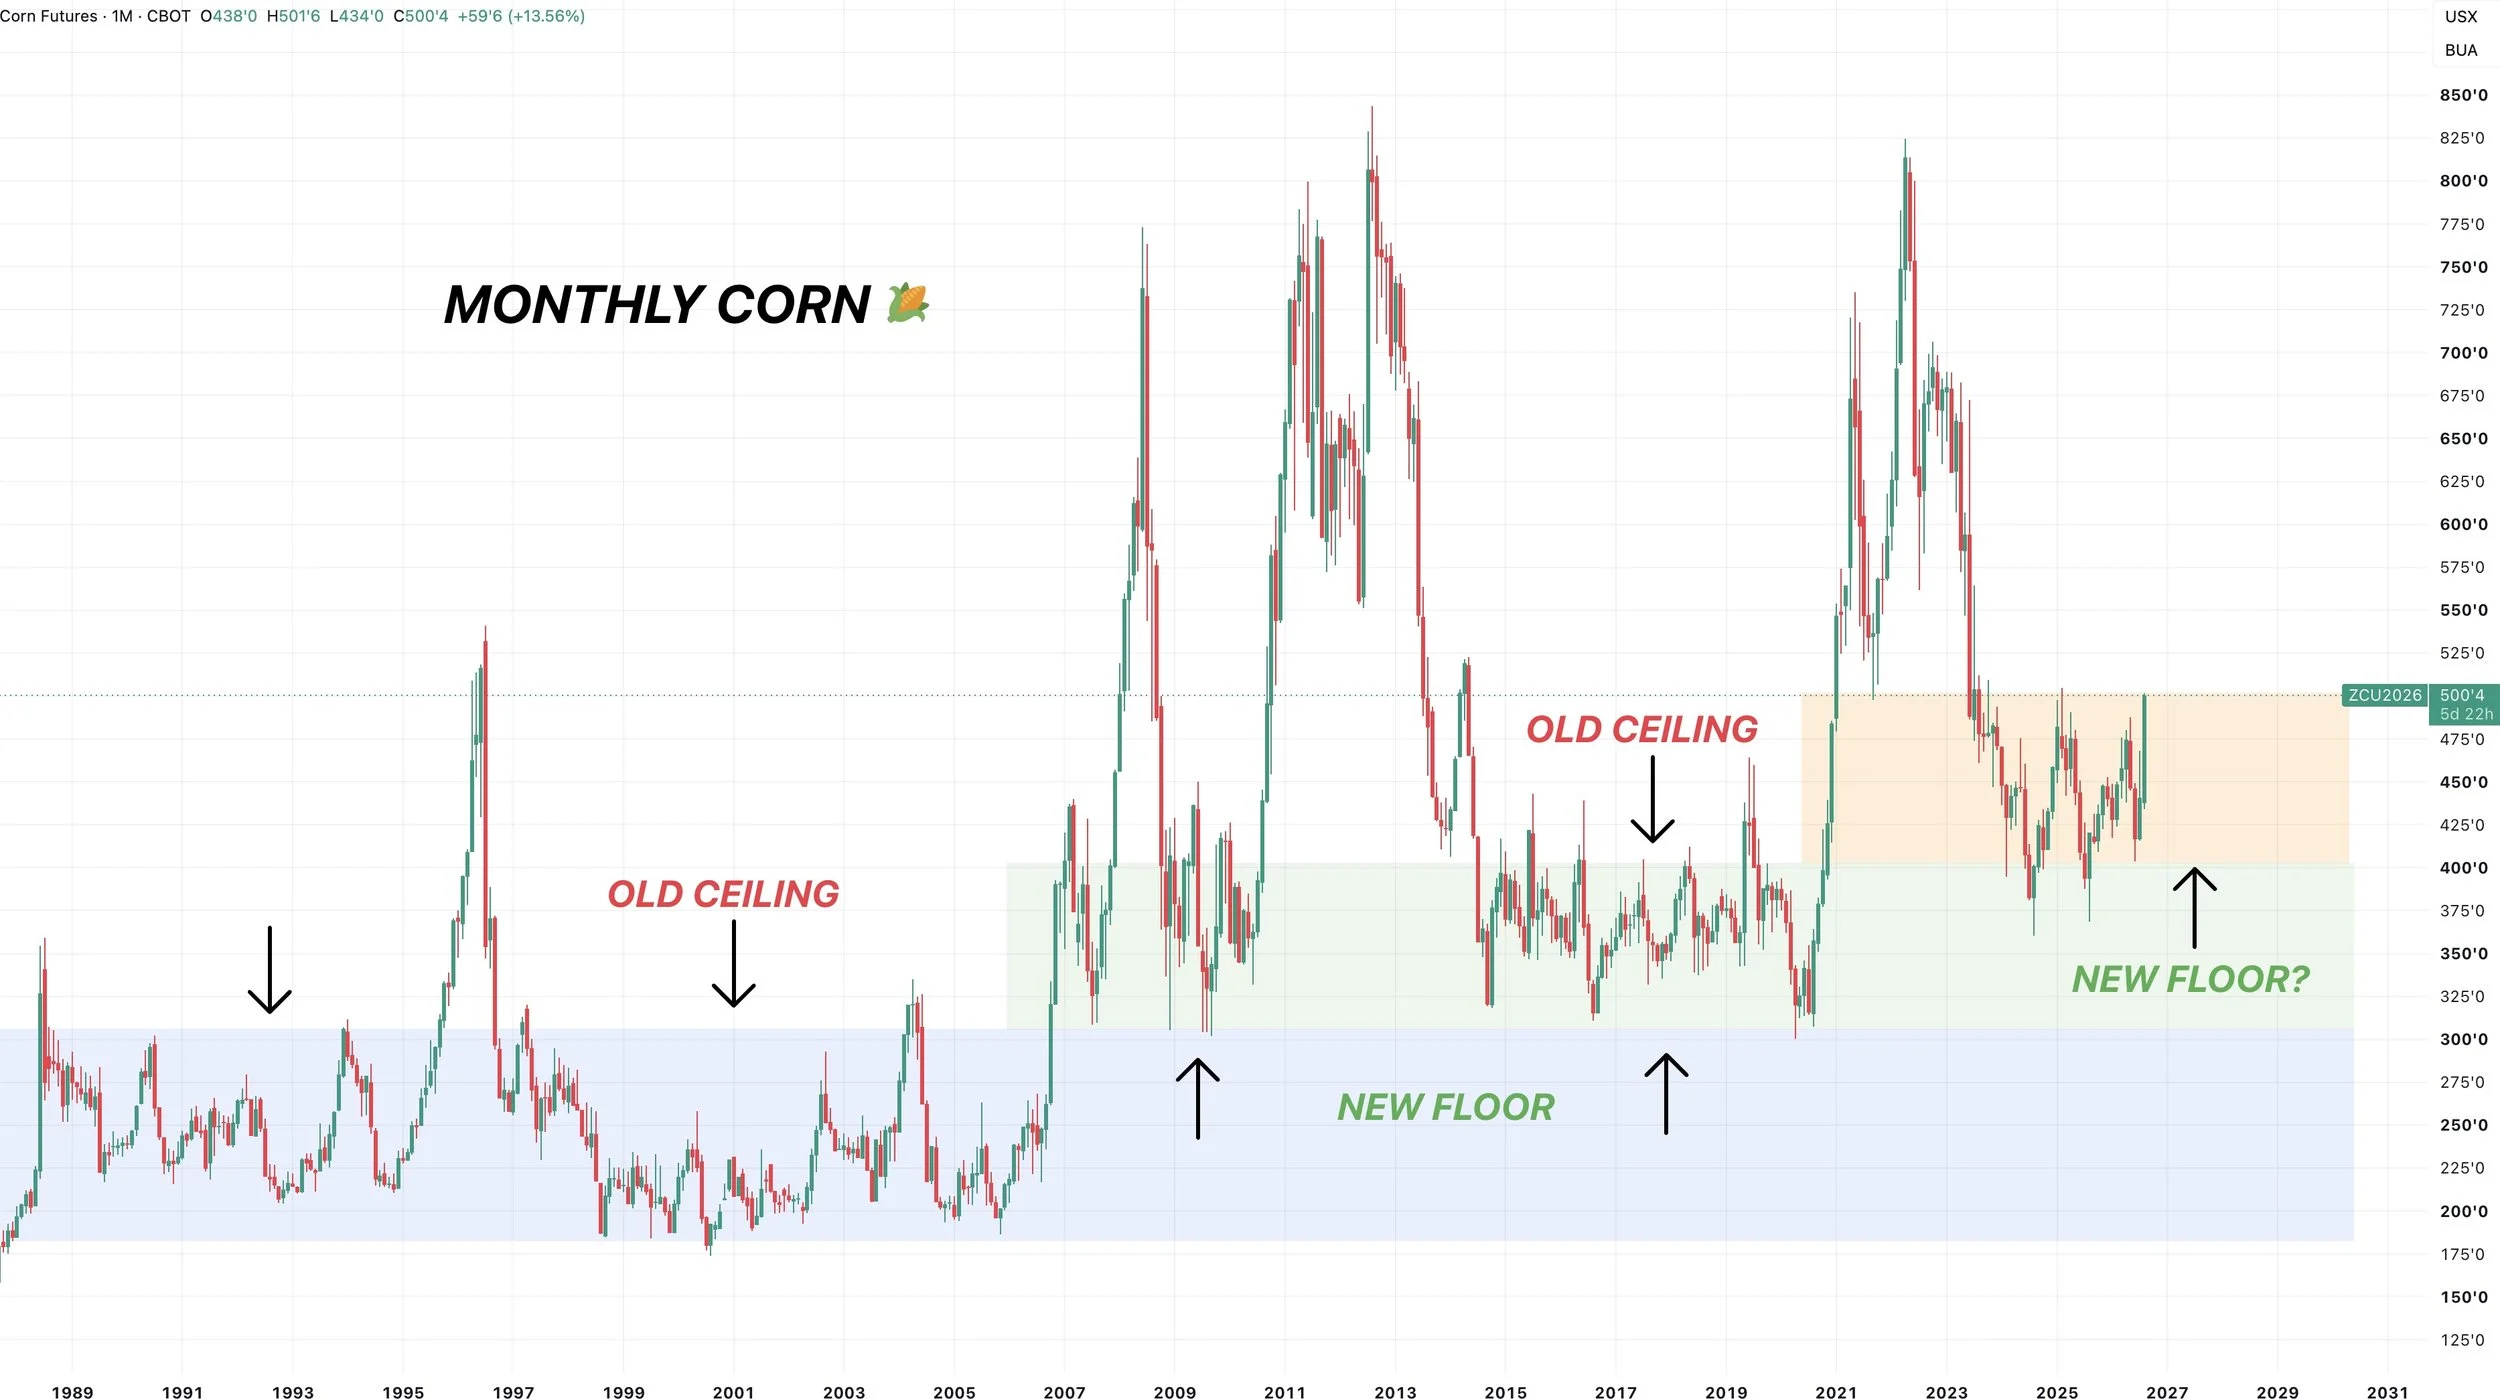
Here is the monthly chart to give you some perspective.
We've essentially just been trapped in a range from $4.00 to $5.00 the last few years.
If we break out of this range, the possibilities for higher prices are certainly there.
Soybeans
Brazil Factor:
Here was an interesting post I saw from Karen Braun today.
Agroconsult is expecting Brazil's soybean planted area to be flat YOY.
This would be the first time in 19 years they have not seen an increase.
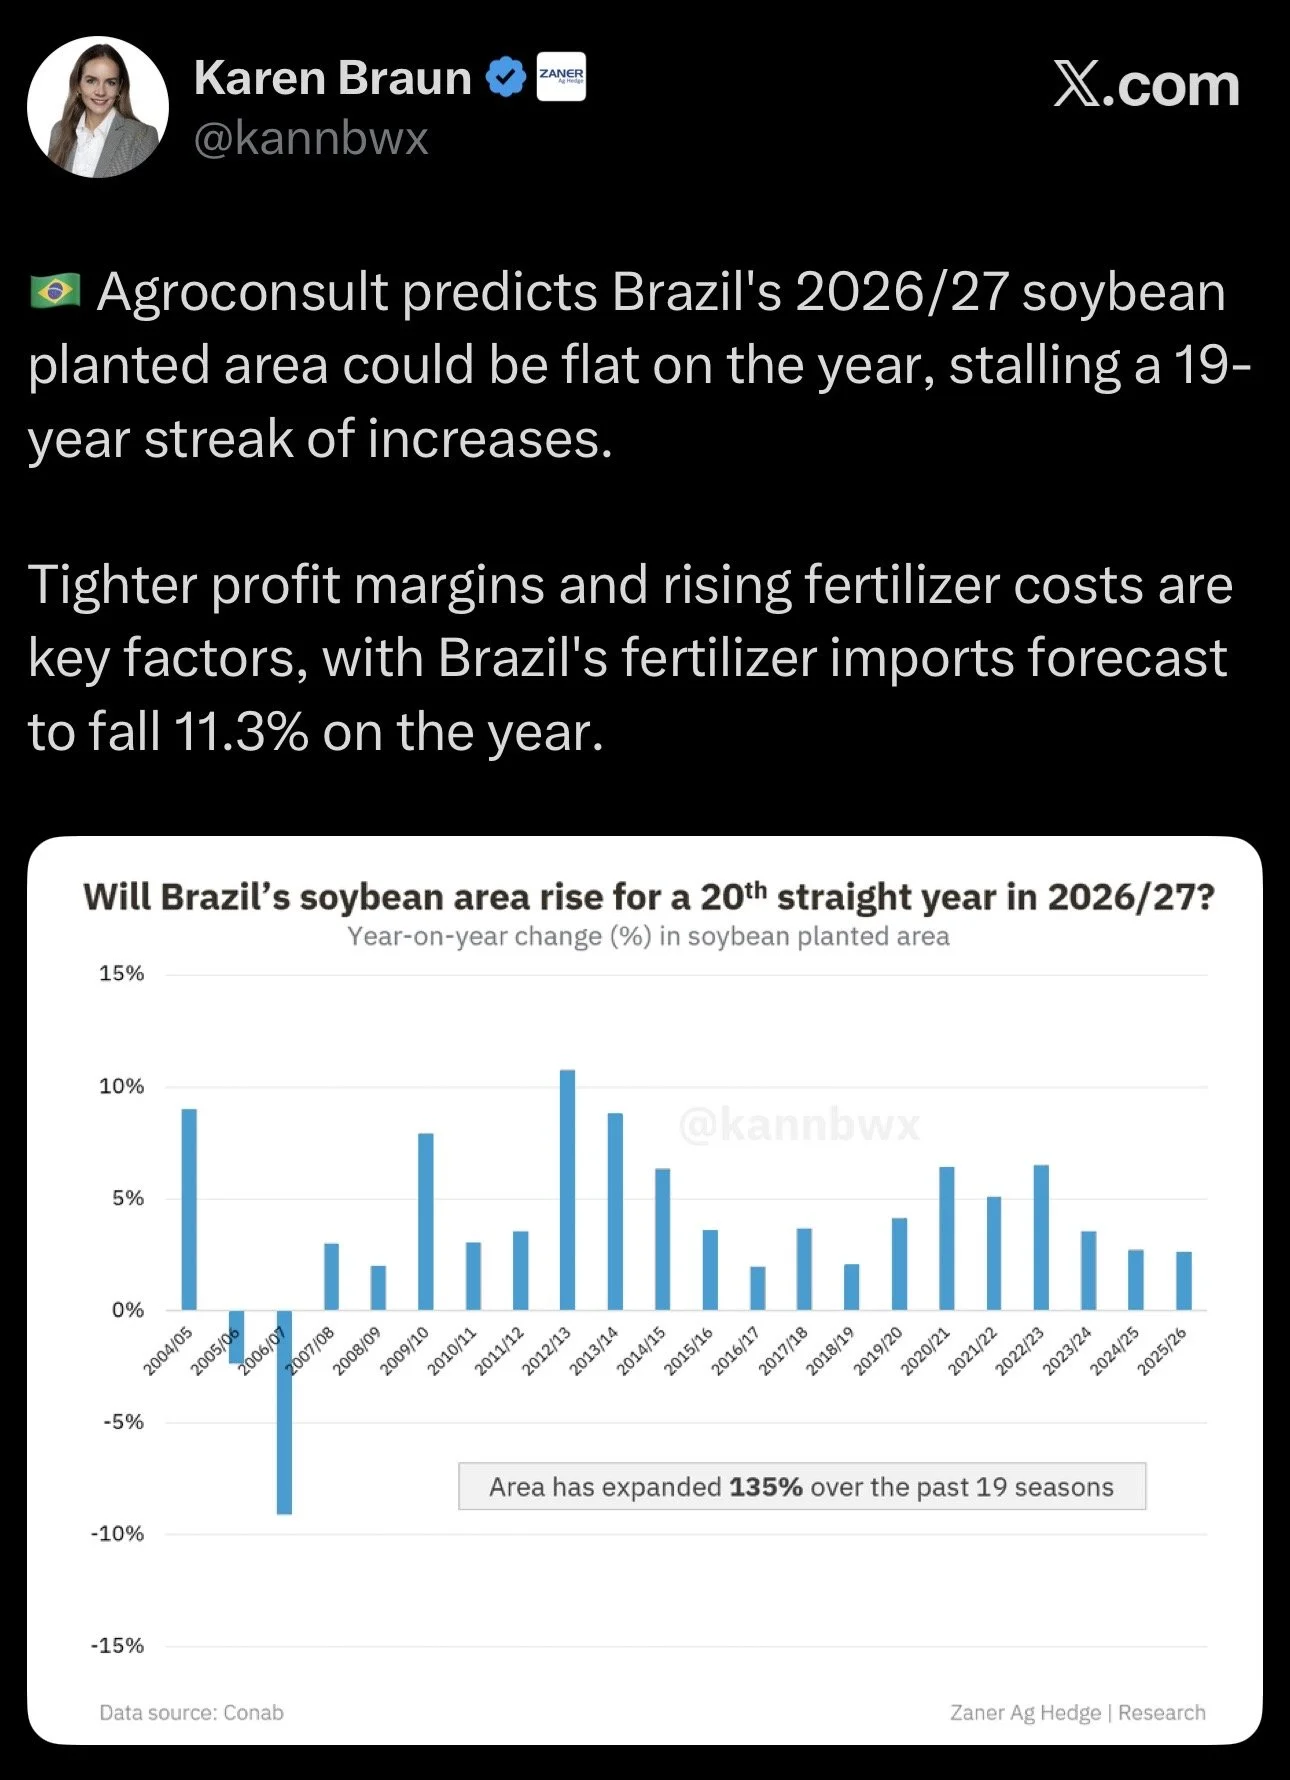
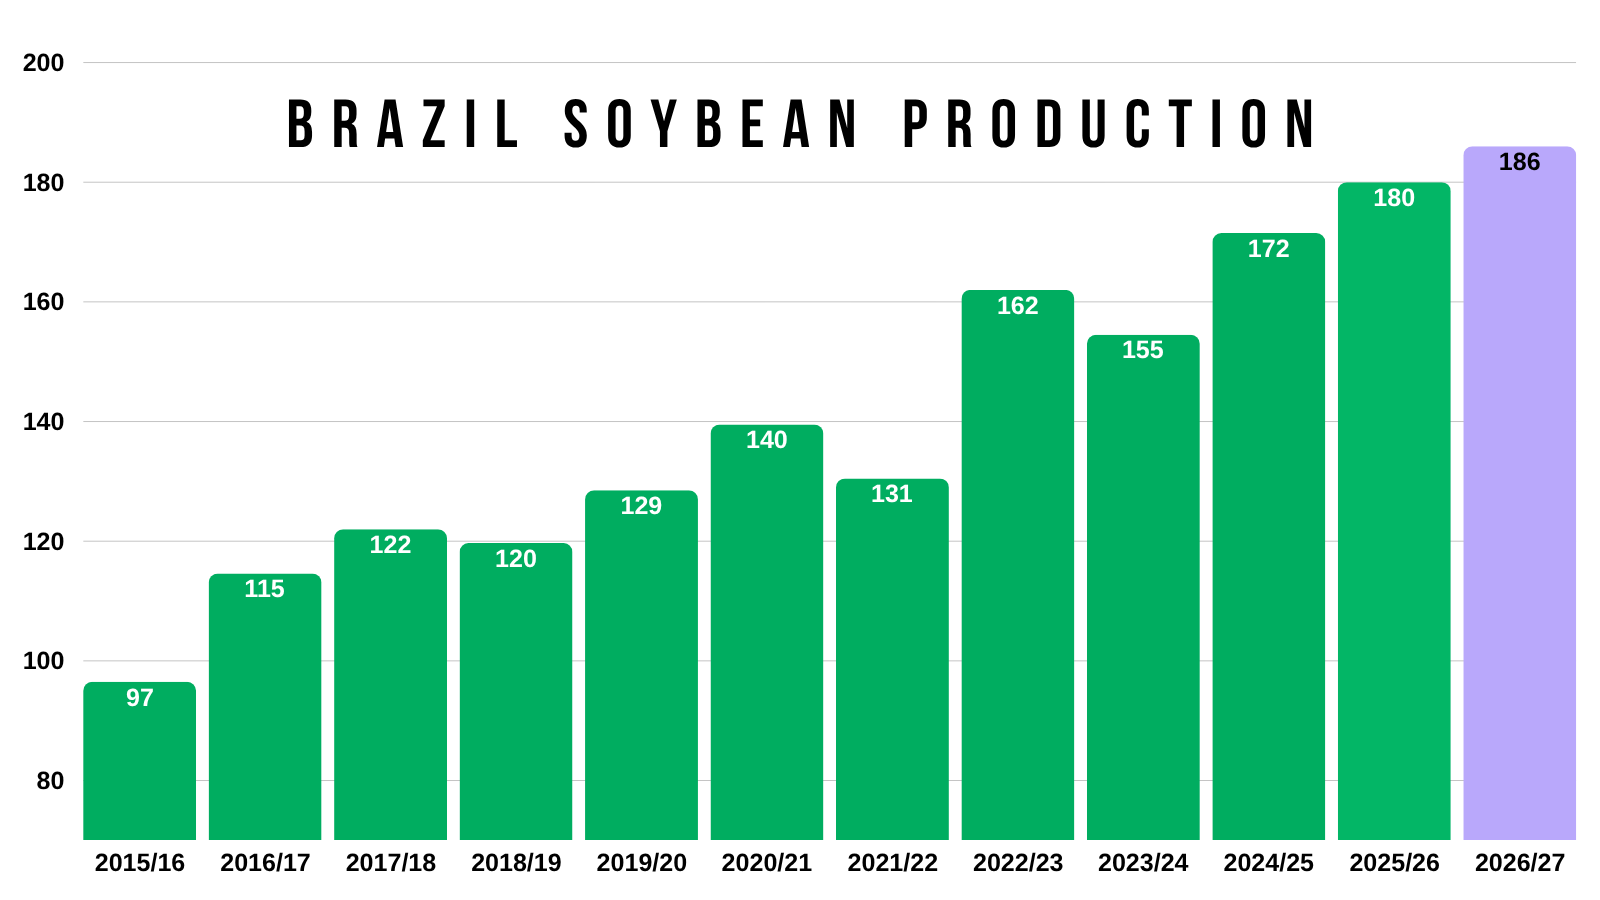
Why would this be a big deal?
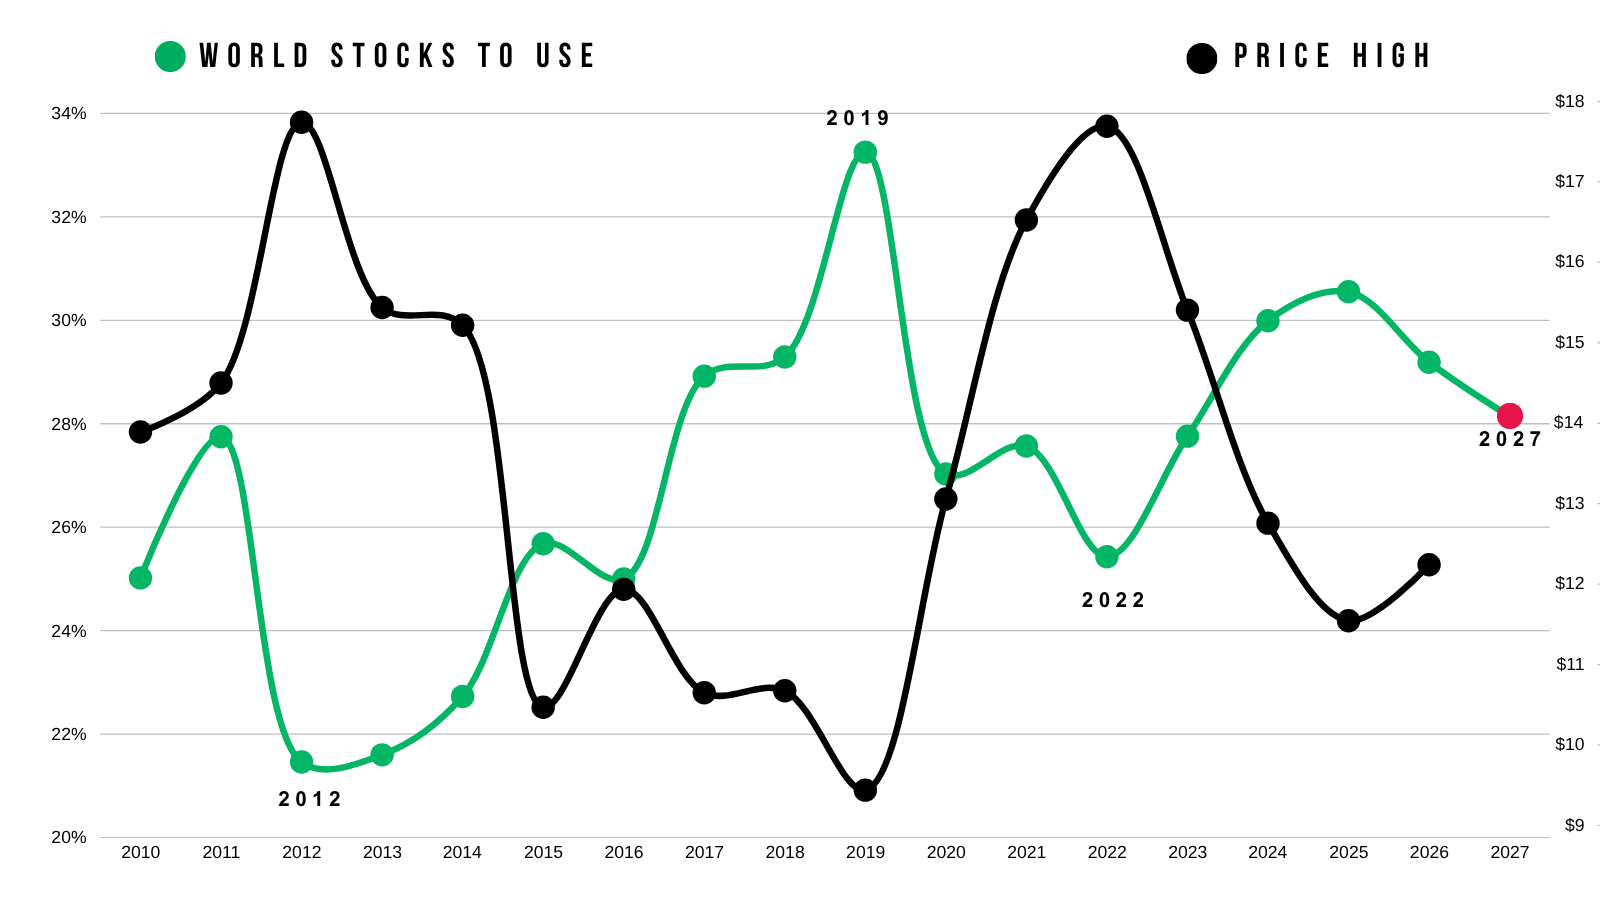
Look at Brazil production.
It's been a consistent ramp higher over the last decade.
Now look at the world situation.
The world situation is one of the better ways to gauge how soybeans should be priced.
As there is a clear correlation between the world stocks to use and our soybean prices.
We are not yet at 2022 levels, but the tightest since then.
Despite the record crop after record crop in Brazil, the world balance sheet continues to get tighter and tighter.
So what happens if the worlds largest producer doesn’t continue to out produce or what if they run into a hiccup this year?
The possibilities and potential is certainly there for this world situation to get even tighter.
China Factor:
Trump is scheduled to meet with China on September 24th.
You could really view this meeting a few different ways.
There is of course always the risk that things go sideways and our relationship with China takes a hit.
Or it could create a positive outcome.
Either way, China continues to buy soybeans.
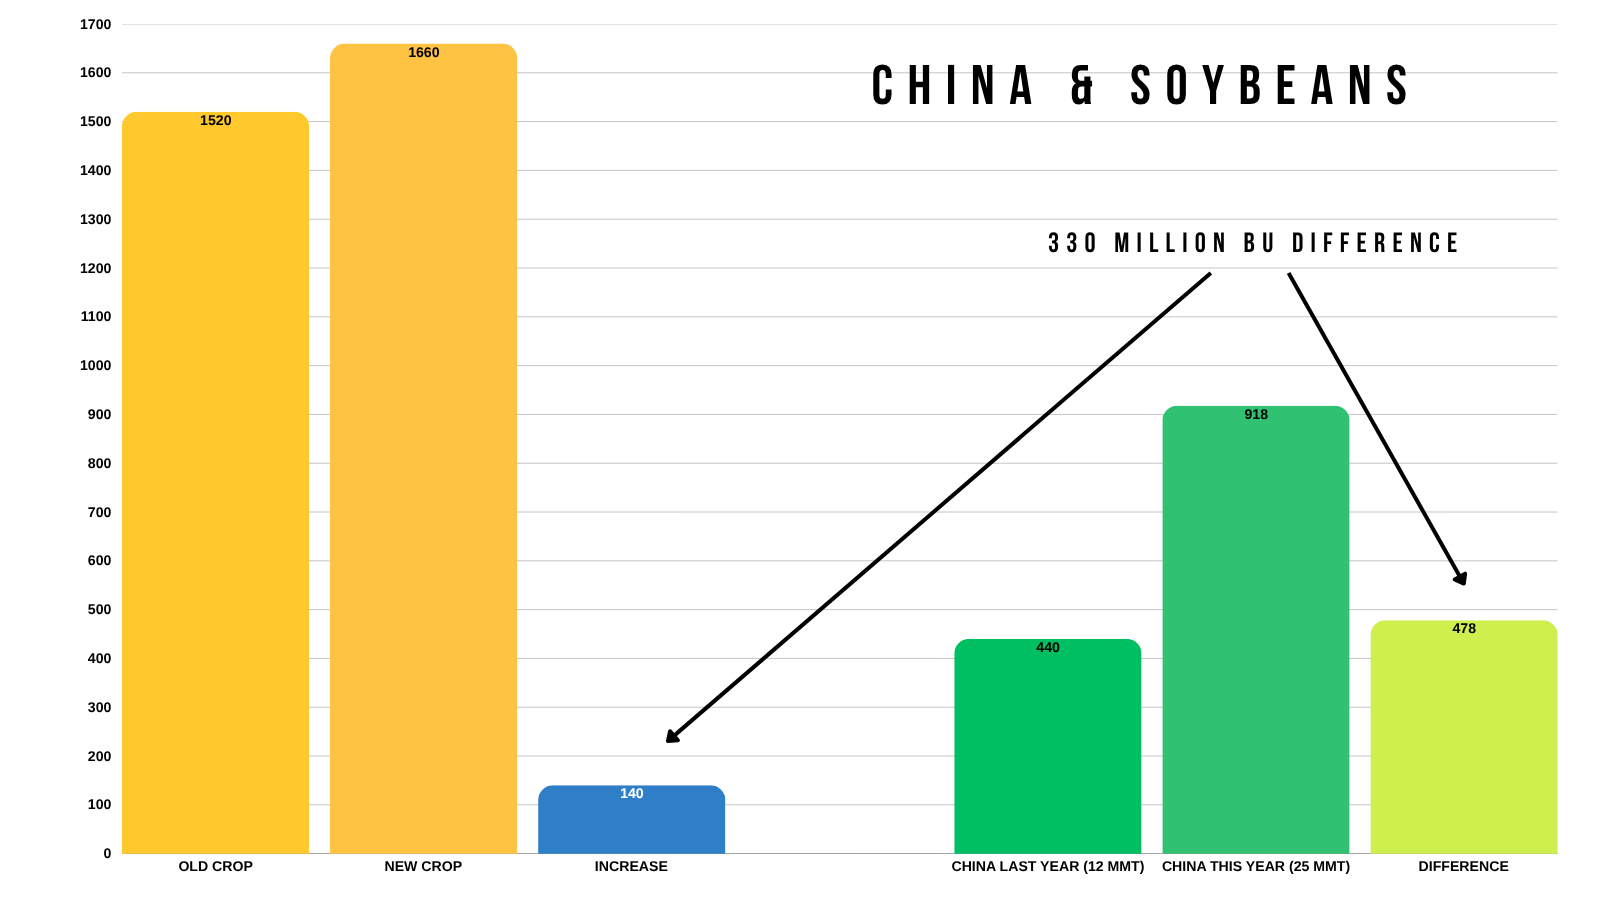
They're confirmed to have bought over 1/4 of the goal, and that number is higher if you account for unknown sales.
They did exactly what they said they'd do with the old crop purchases. They bought everything they said they would.
As we've been talking about for a while now, if they do exactly what they said they'd do in new crop, we simply don’t have the supply to meet that demand. Without rationing demand to non-China destinations via higher prices.
Given the USDA only expects our exports to be up 140 million vs last year, yet China agreed to buy 480 million more than last year.
So there is definitely some friendly potential in soybeans, this being the biggest one of those biggest factors.
We don’t necessarily need a poor crop to run into a tight situation. It could very easily simply be led by demand.
Nov Beans Chart:
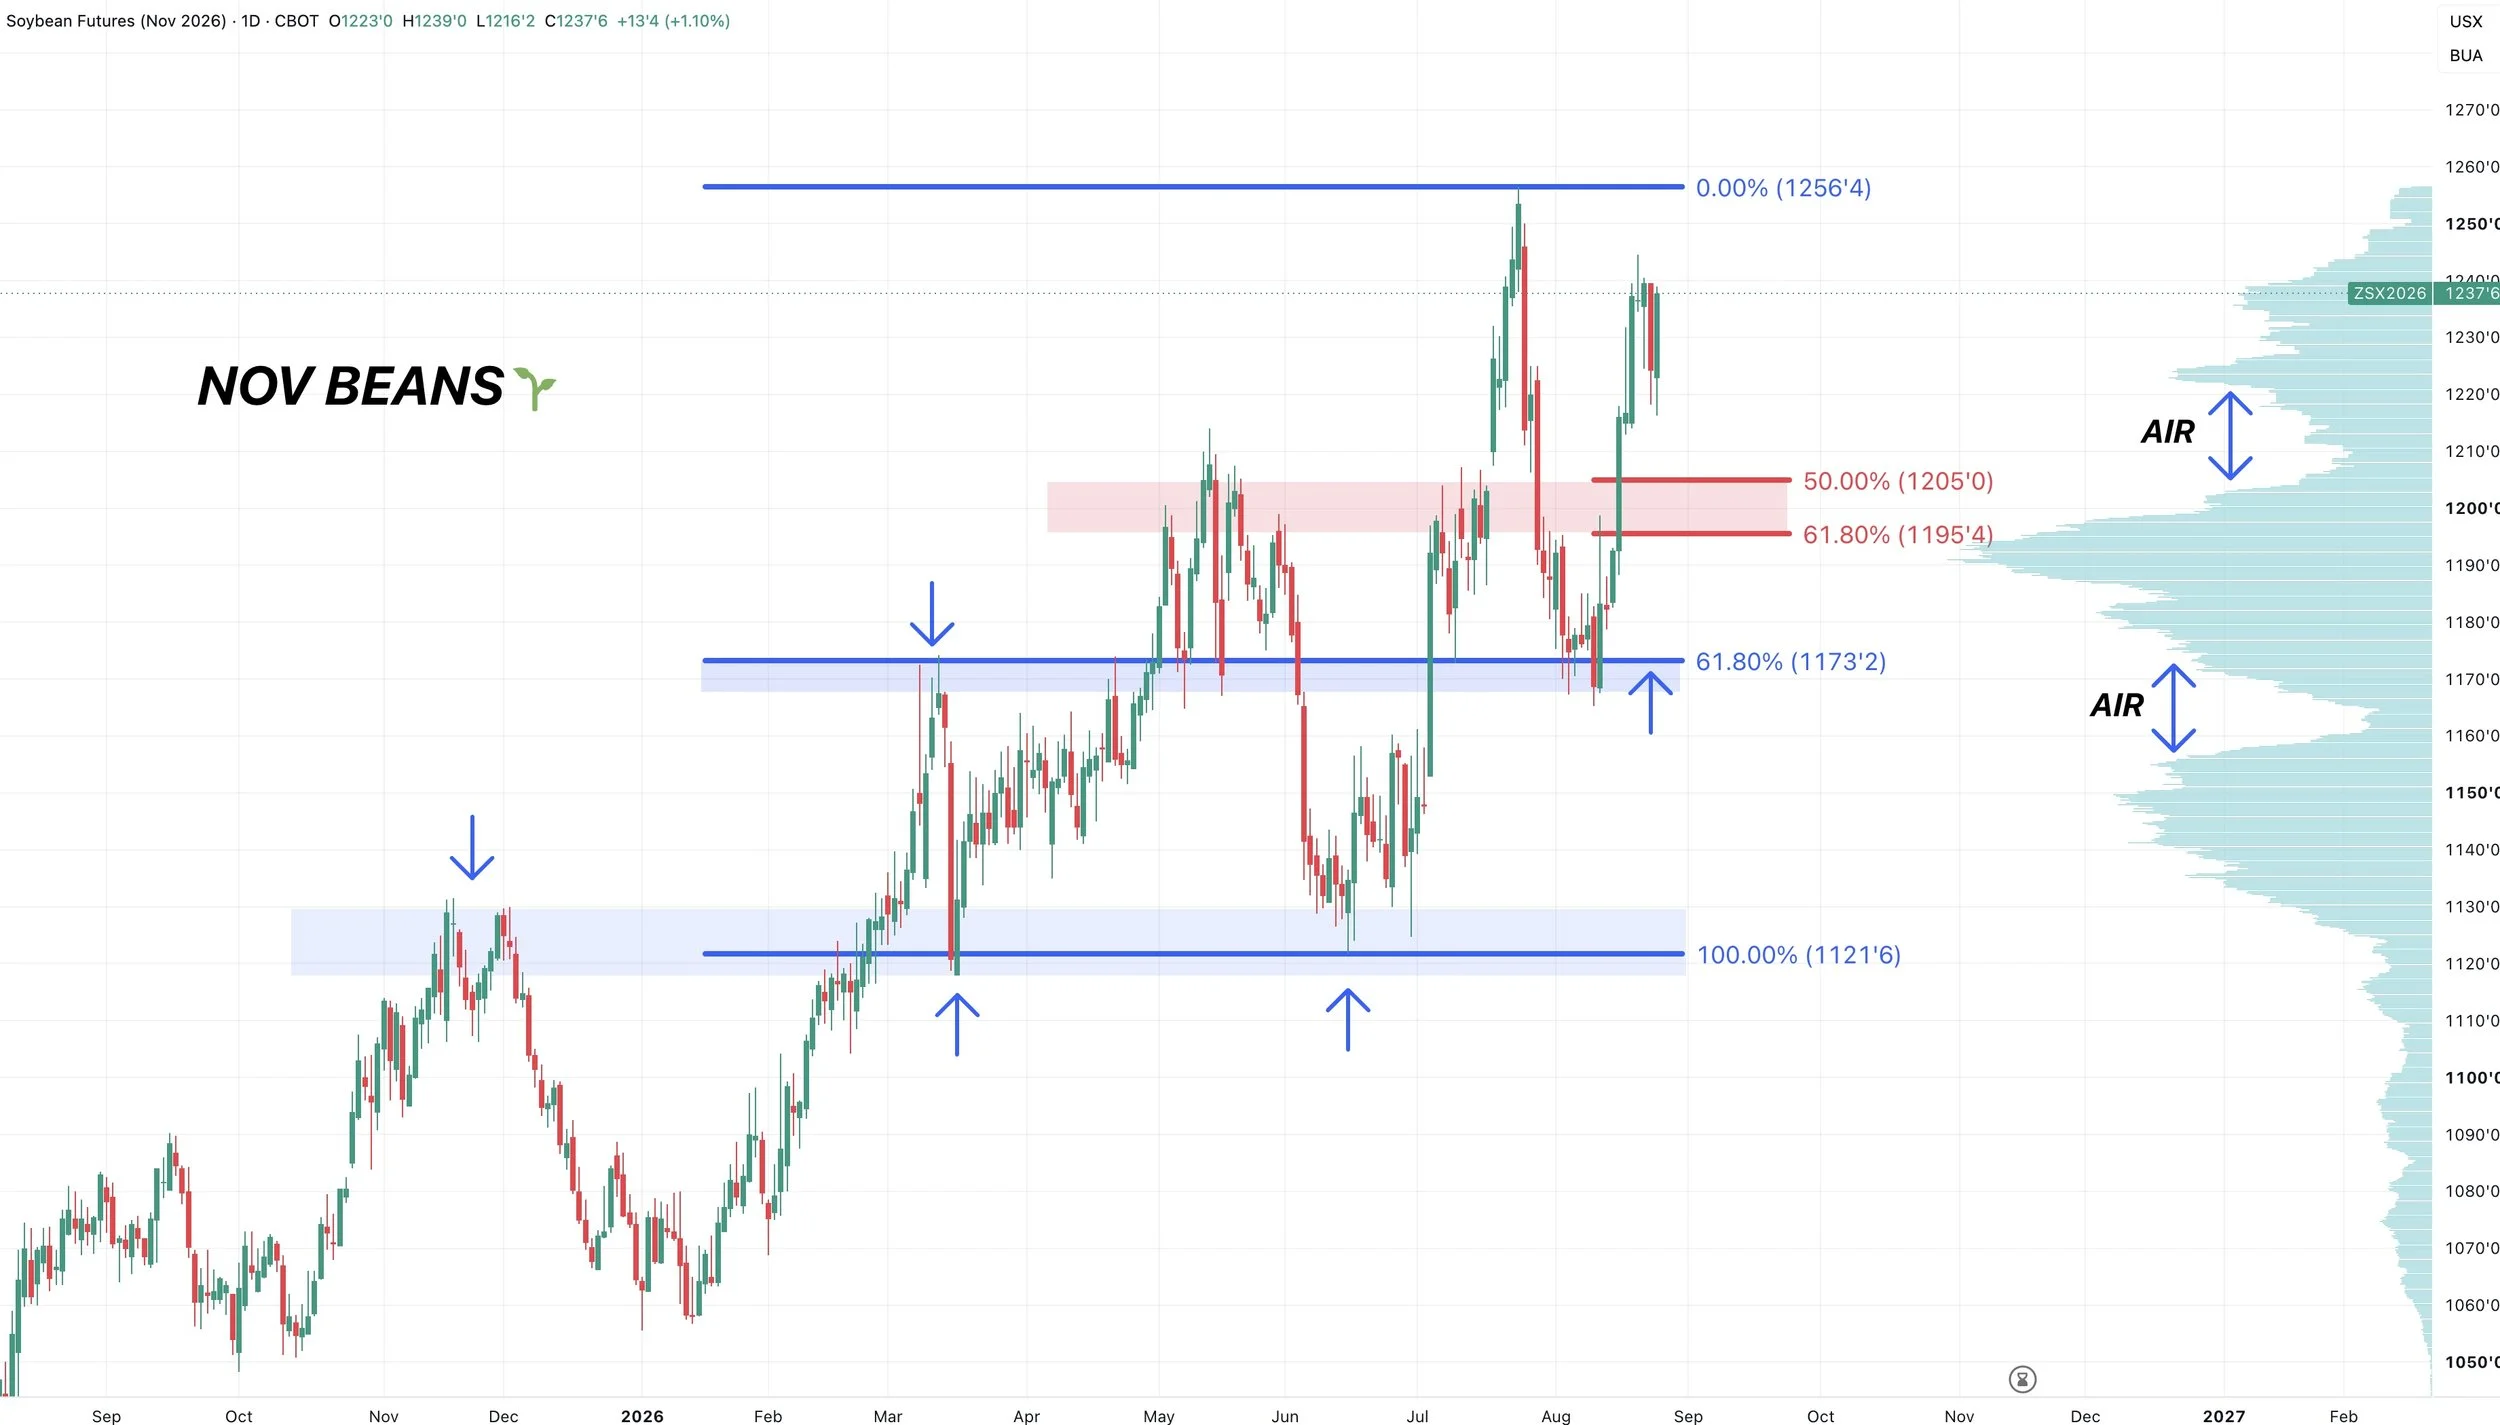
If the market gives us a good pullback, the area I would look for a potential bounce is going to be $11.95 to $12.05
That's the golden zone. Which also sits right at those highs from May.
Currently we are sitting at a shelf of volume.
If we break below, there is a volume gap to the downside towards that golden zone as well.
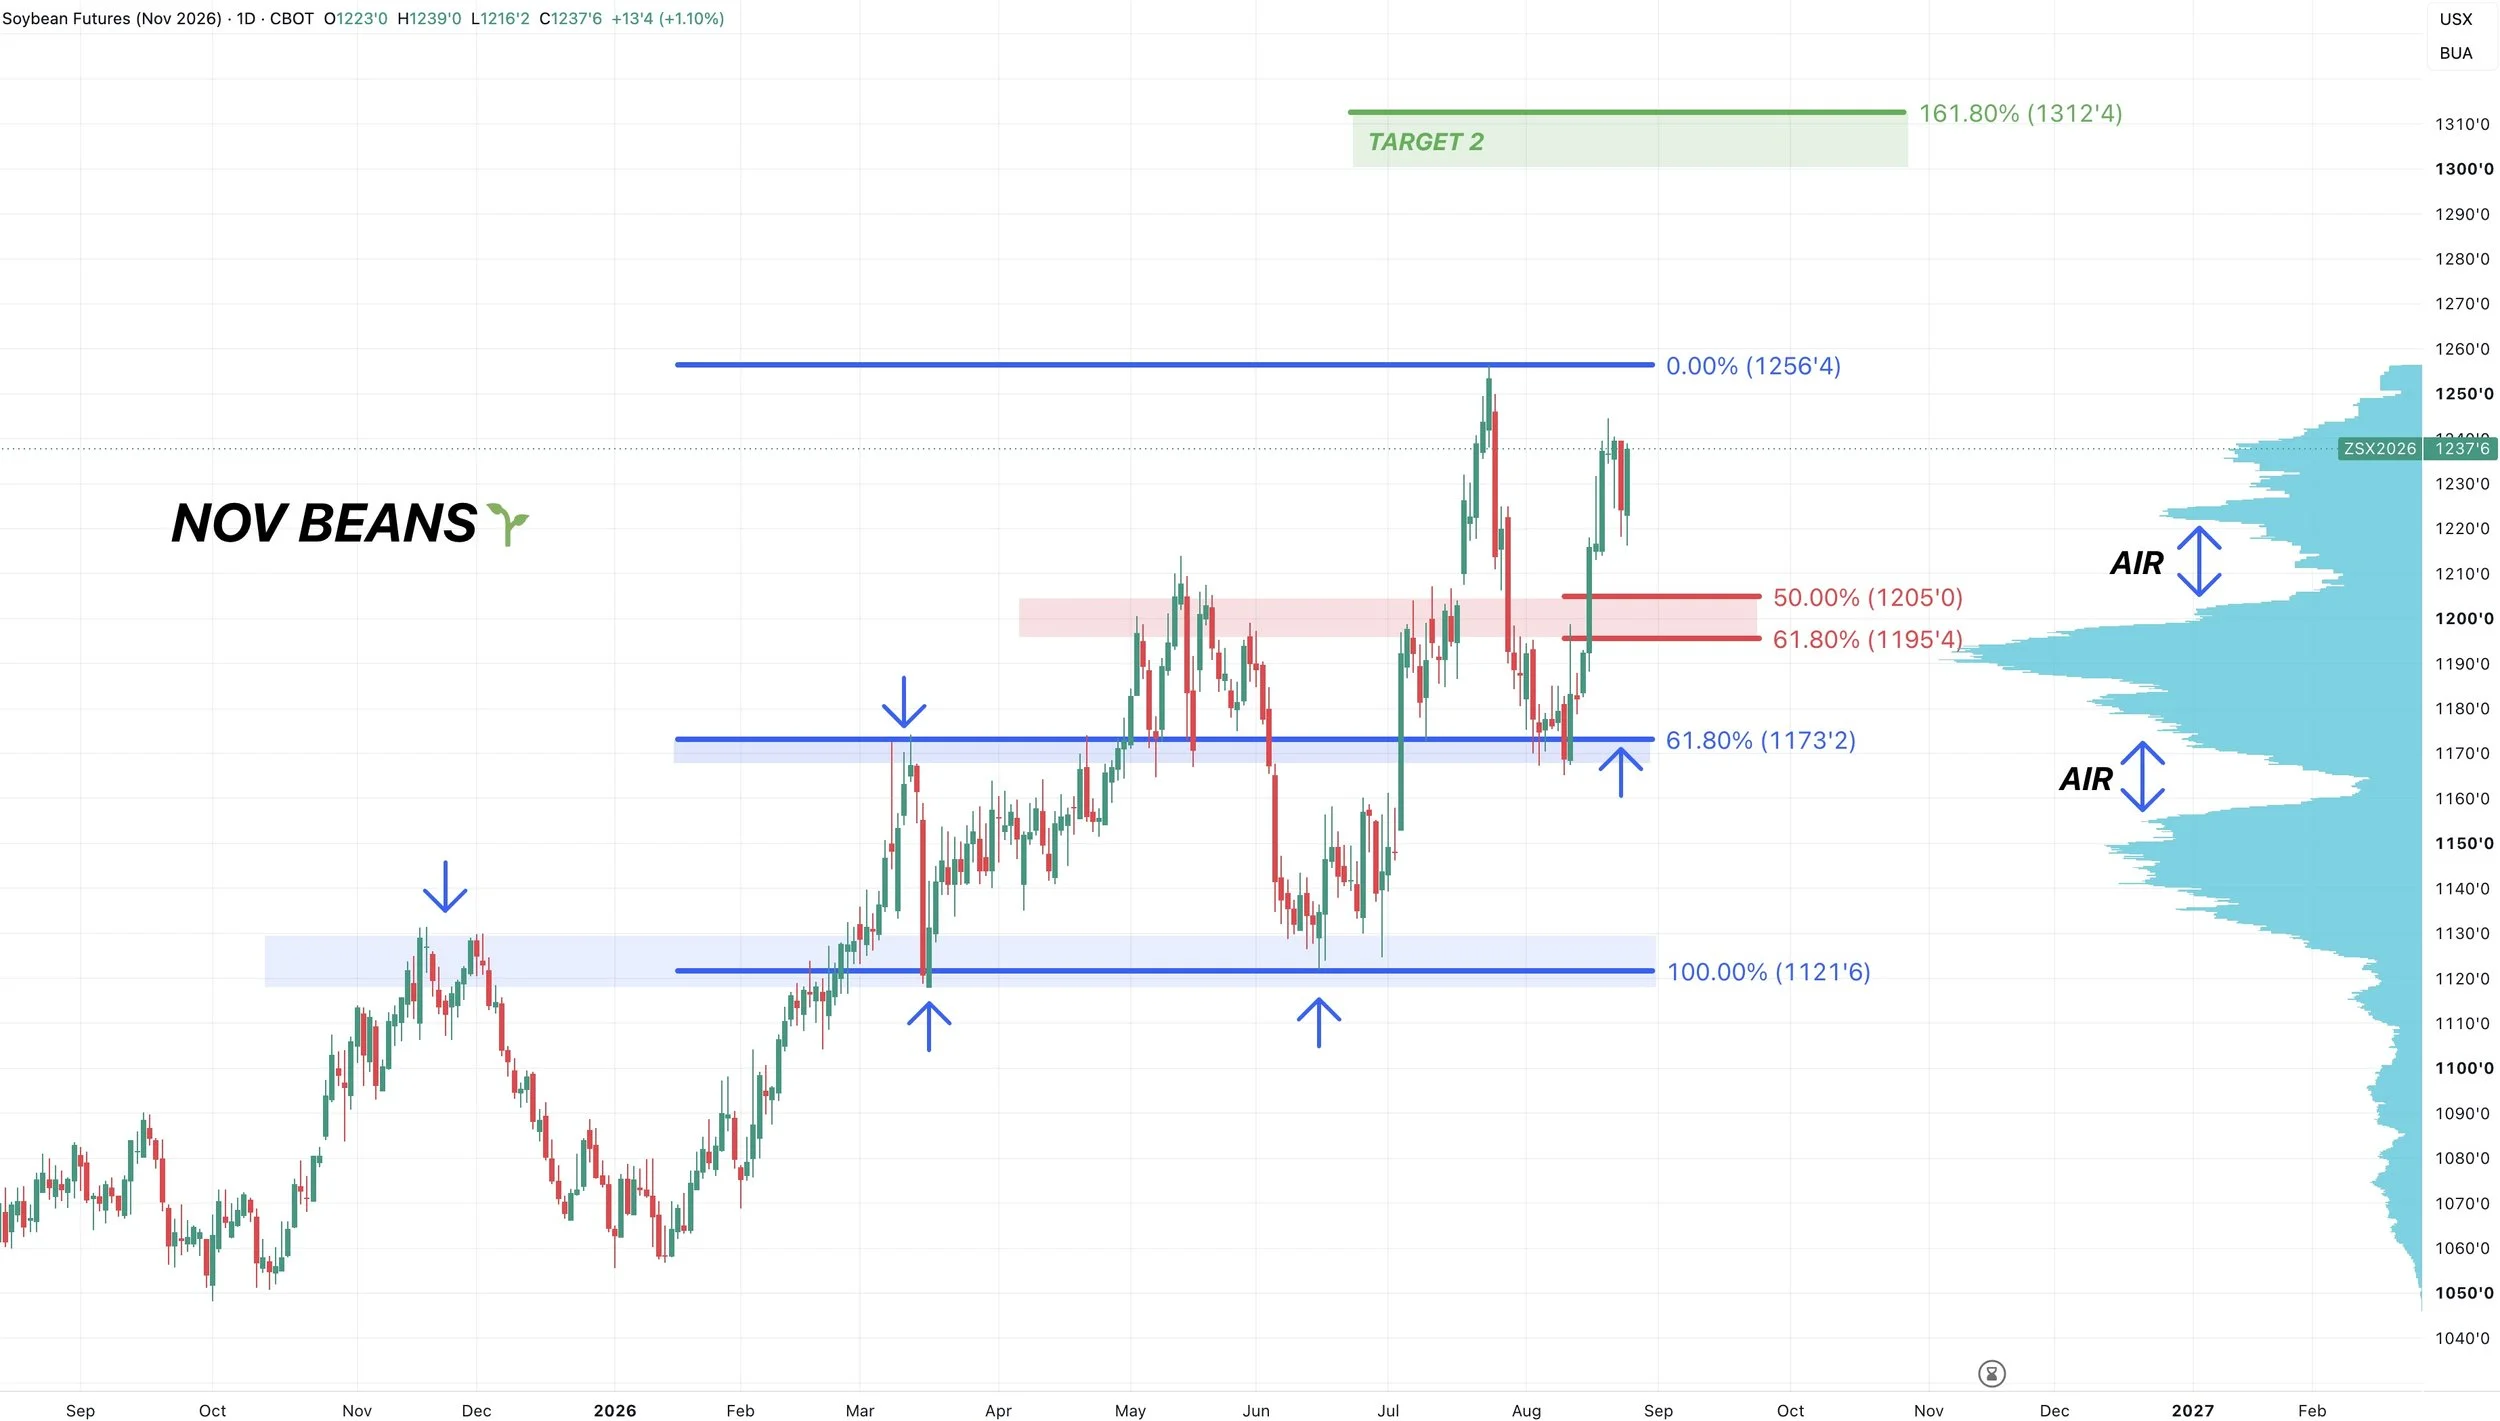
Now to the upside, if we are able to break those July highs of $12.56, I still have a target of $13.00-13.12
$13.12 is the 161.8% retracement and golden fib from the recent lows up to the July highs.
Continuous Front Month Chart:
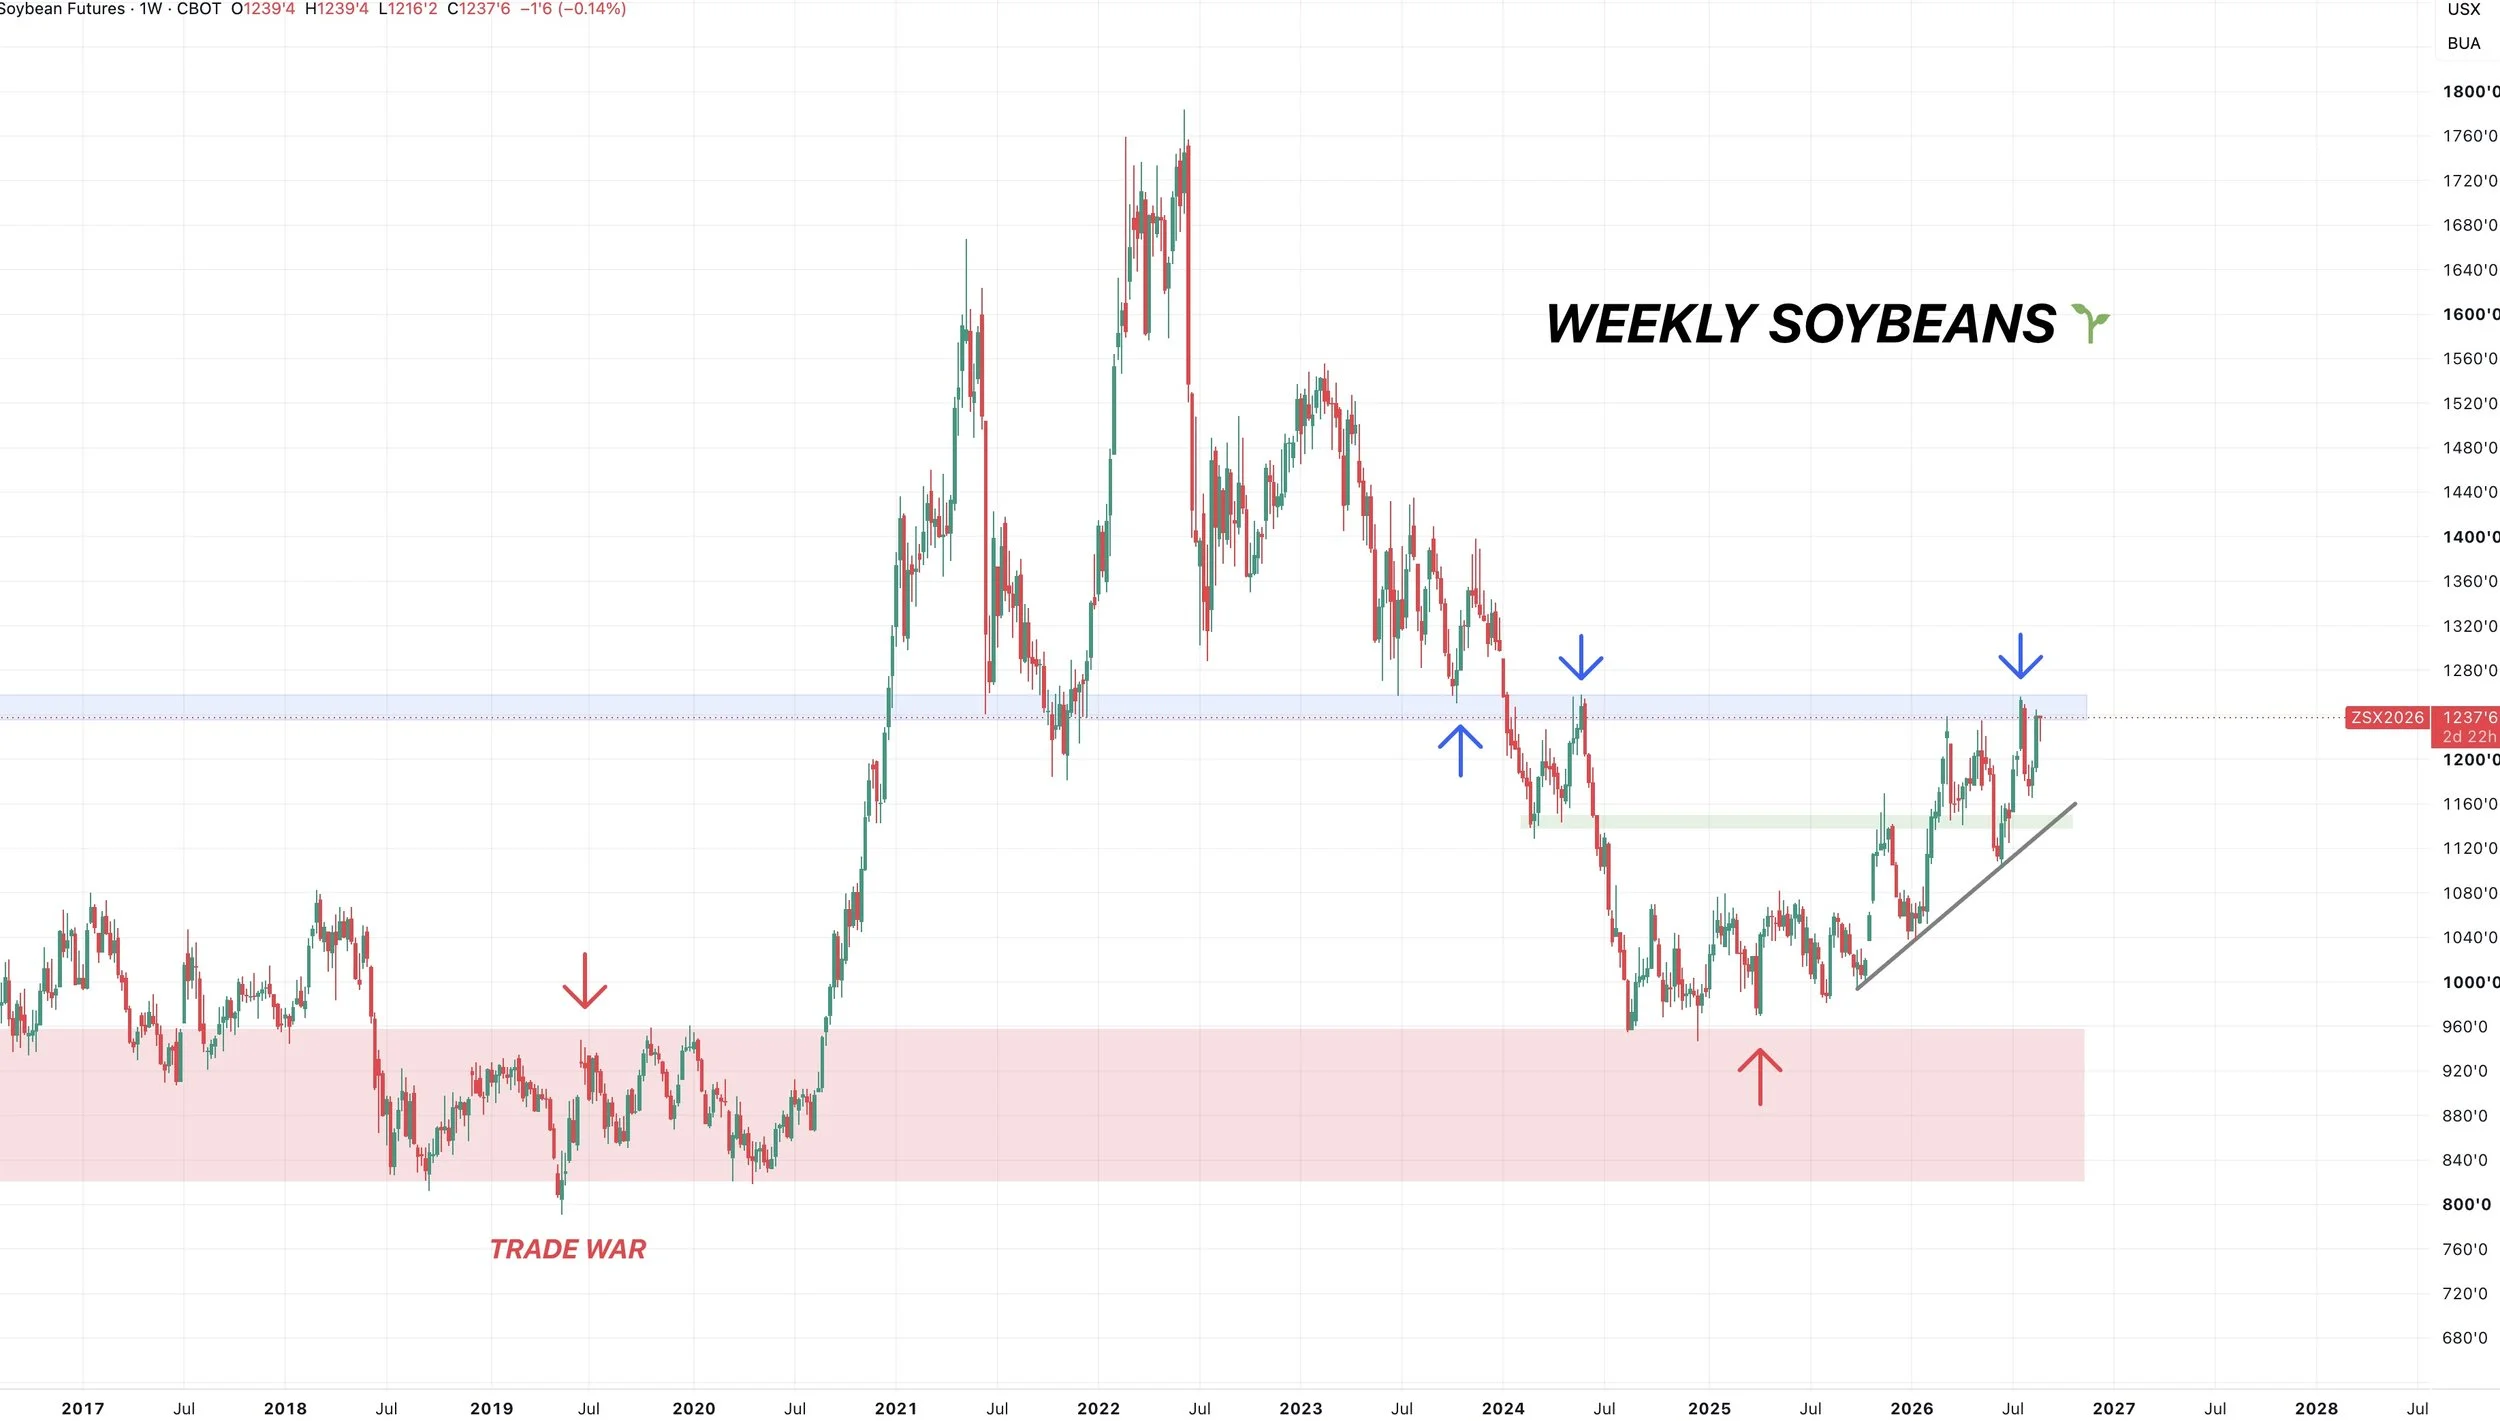
If you zoom out, the long term trend in soybeans clearly shifted higher a while ago.
Nothing is bearish about this chart.
But we are still dealing with some high time frame resistance around $12.50
It's been major resistance and support throughout the years.
Break above and it could offer plenty of upside.
Bean Oil Chart:
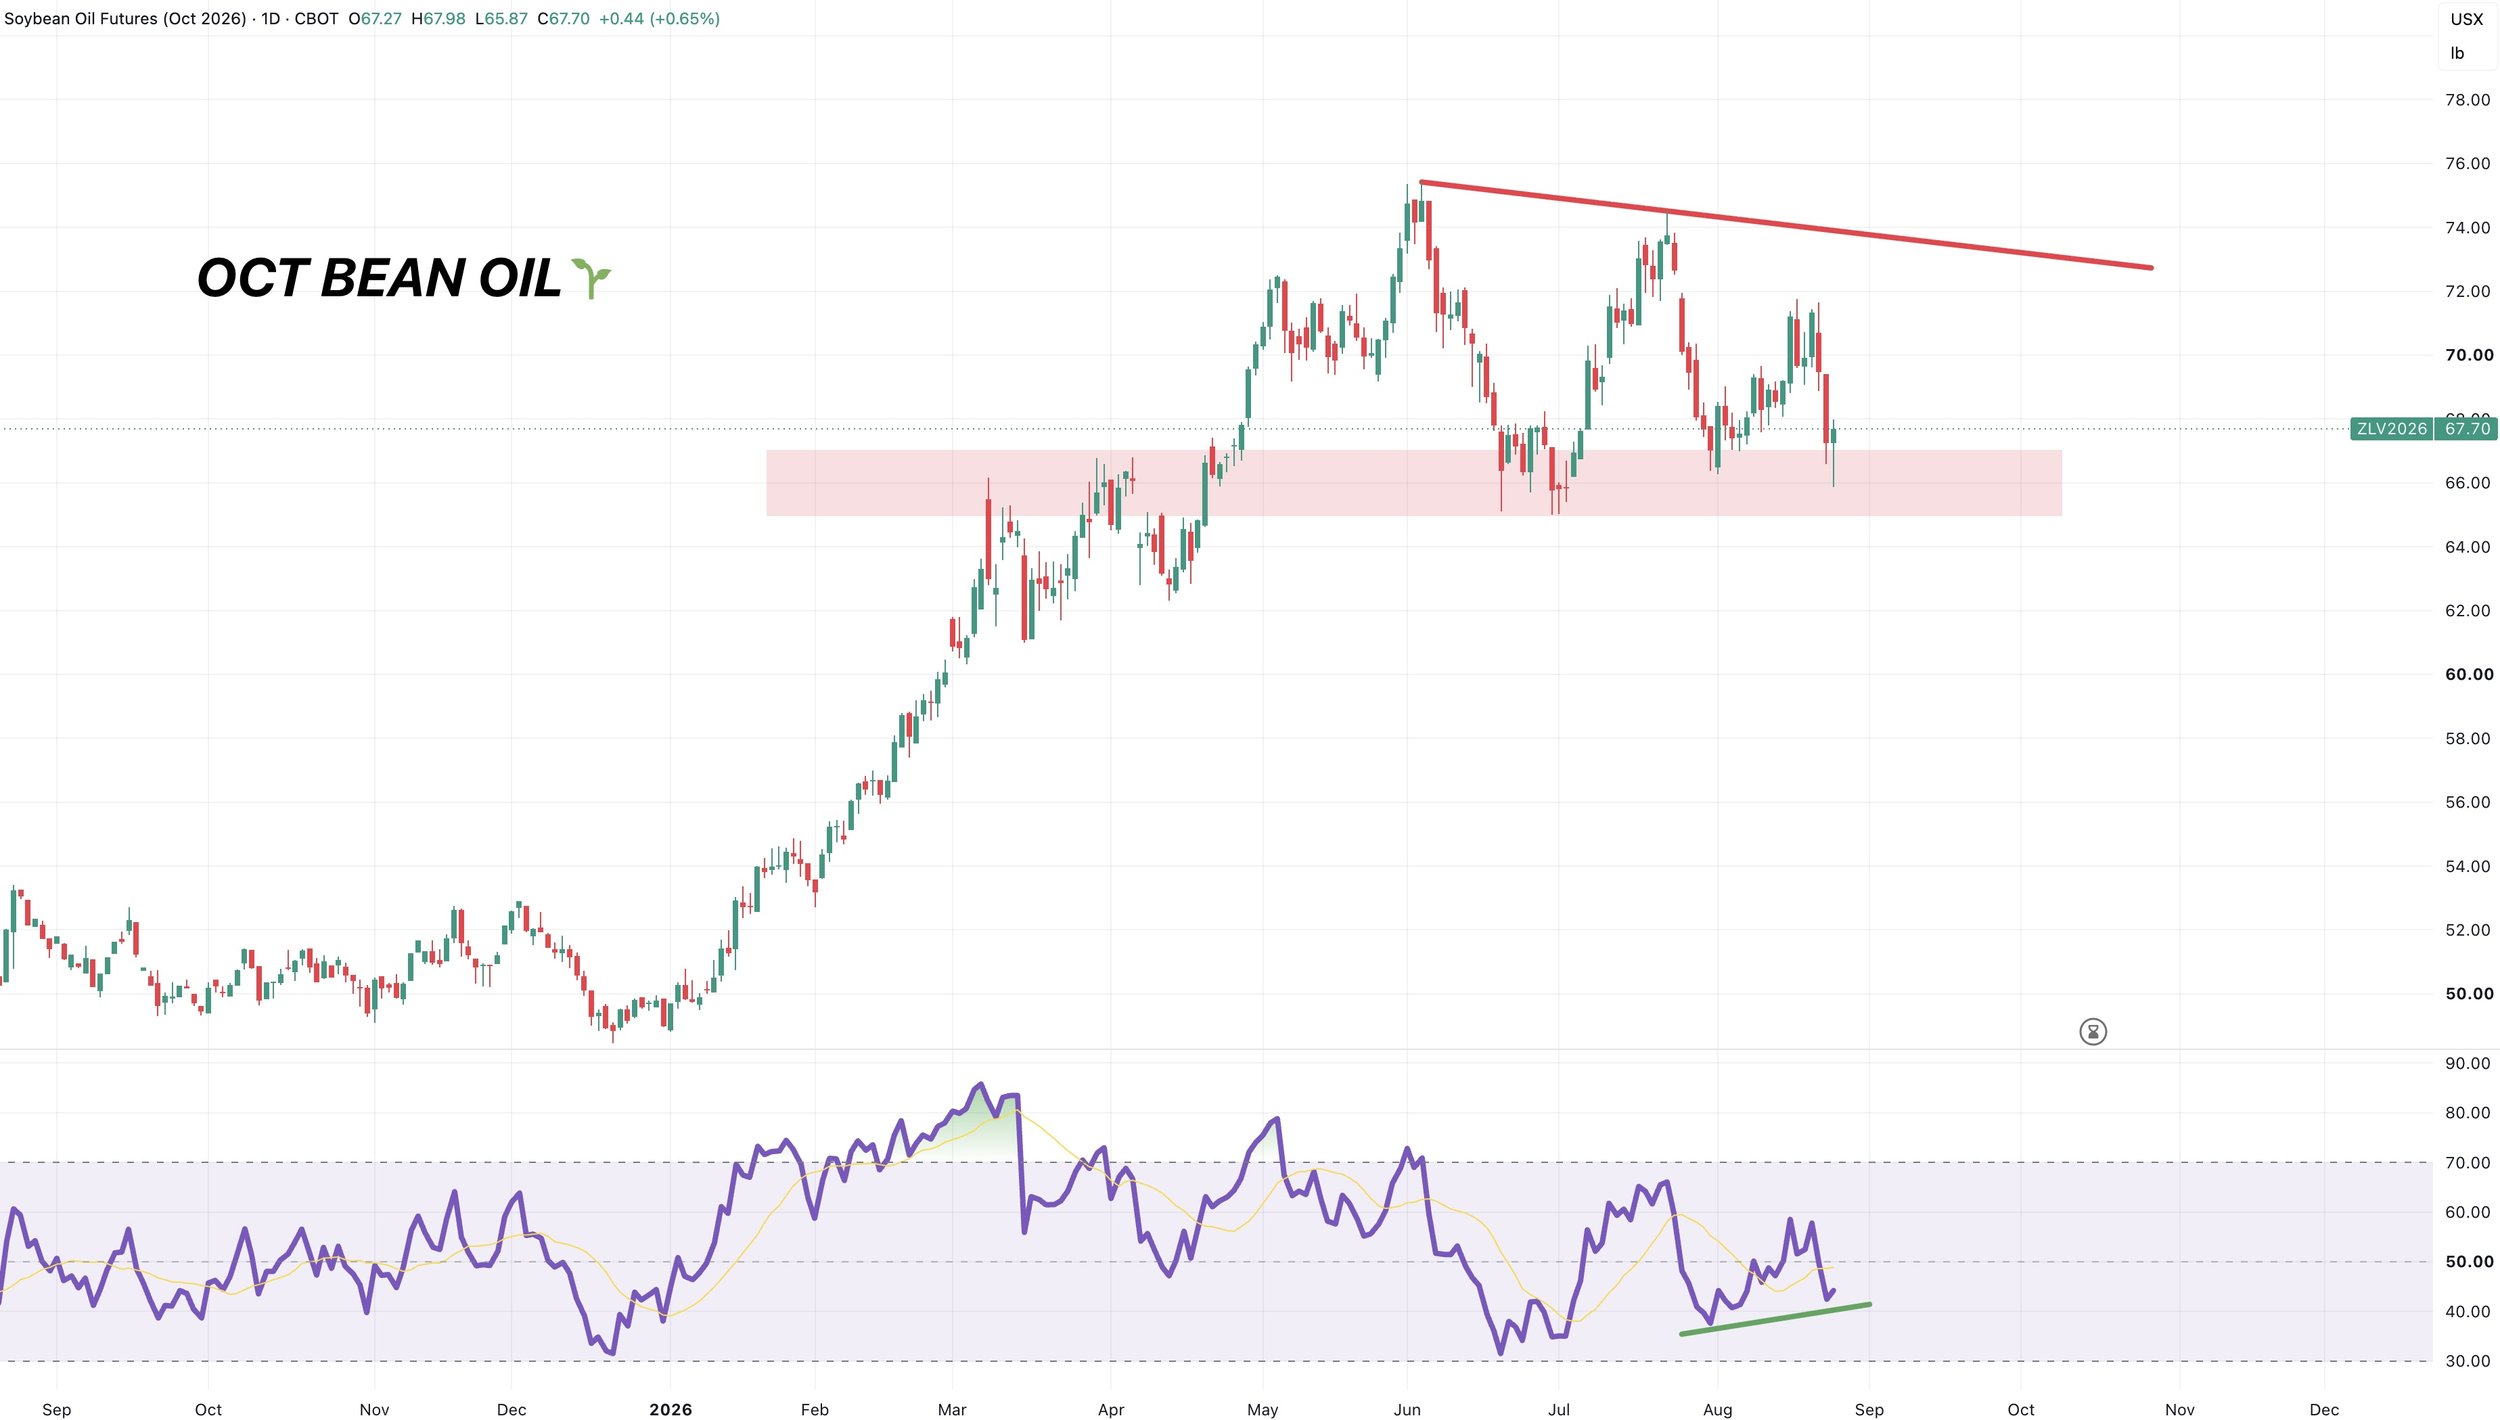
Bean oil is still a key factor to watch.
I don’t see the funds looking to puke out of their longs in the soybean complex unless bean oil gives them a reason to.
Currently it's sitting tight at support and showing bullish divergence on the RSI.
Wheat
Dec KC Wheat Chart:
I do not have much to update on wheat here today.
We did close well off the lows. At one point we were down -20 cents, yet we ended the day fractionally higher.
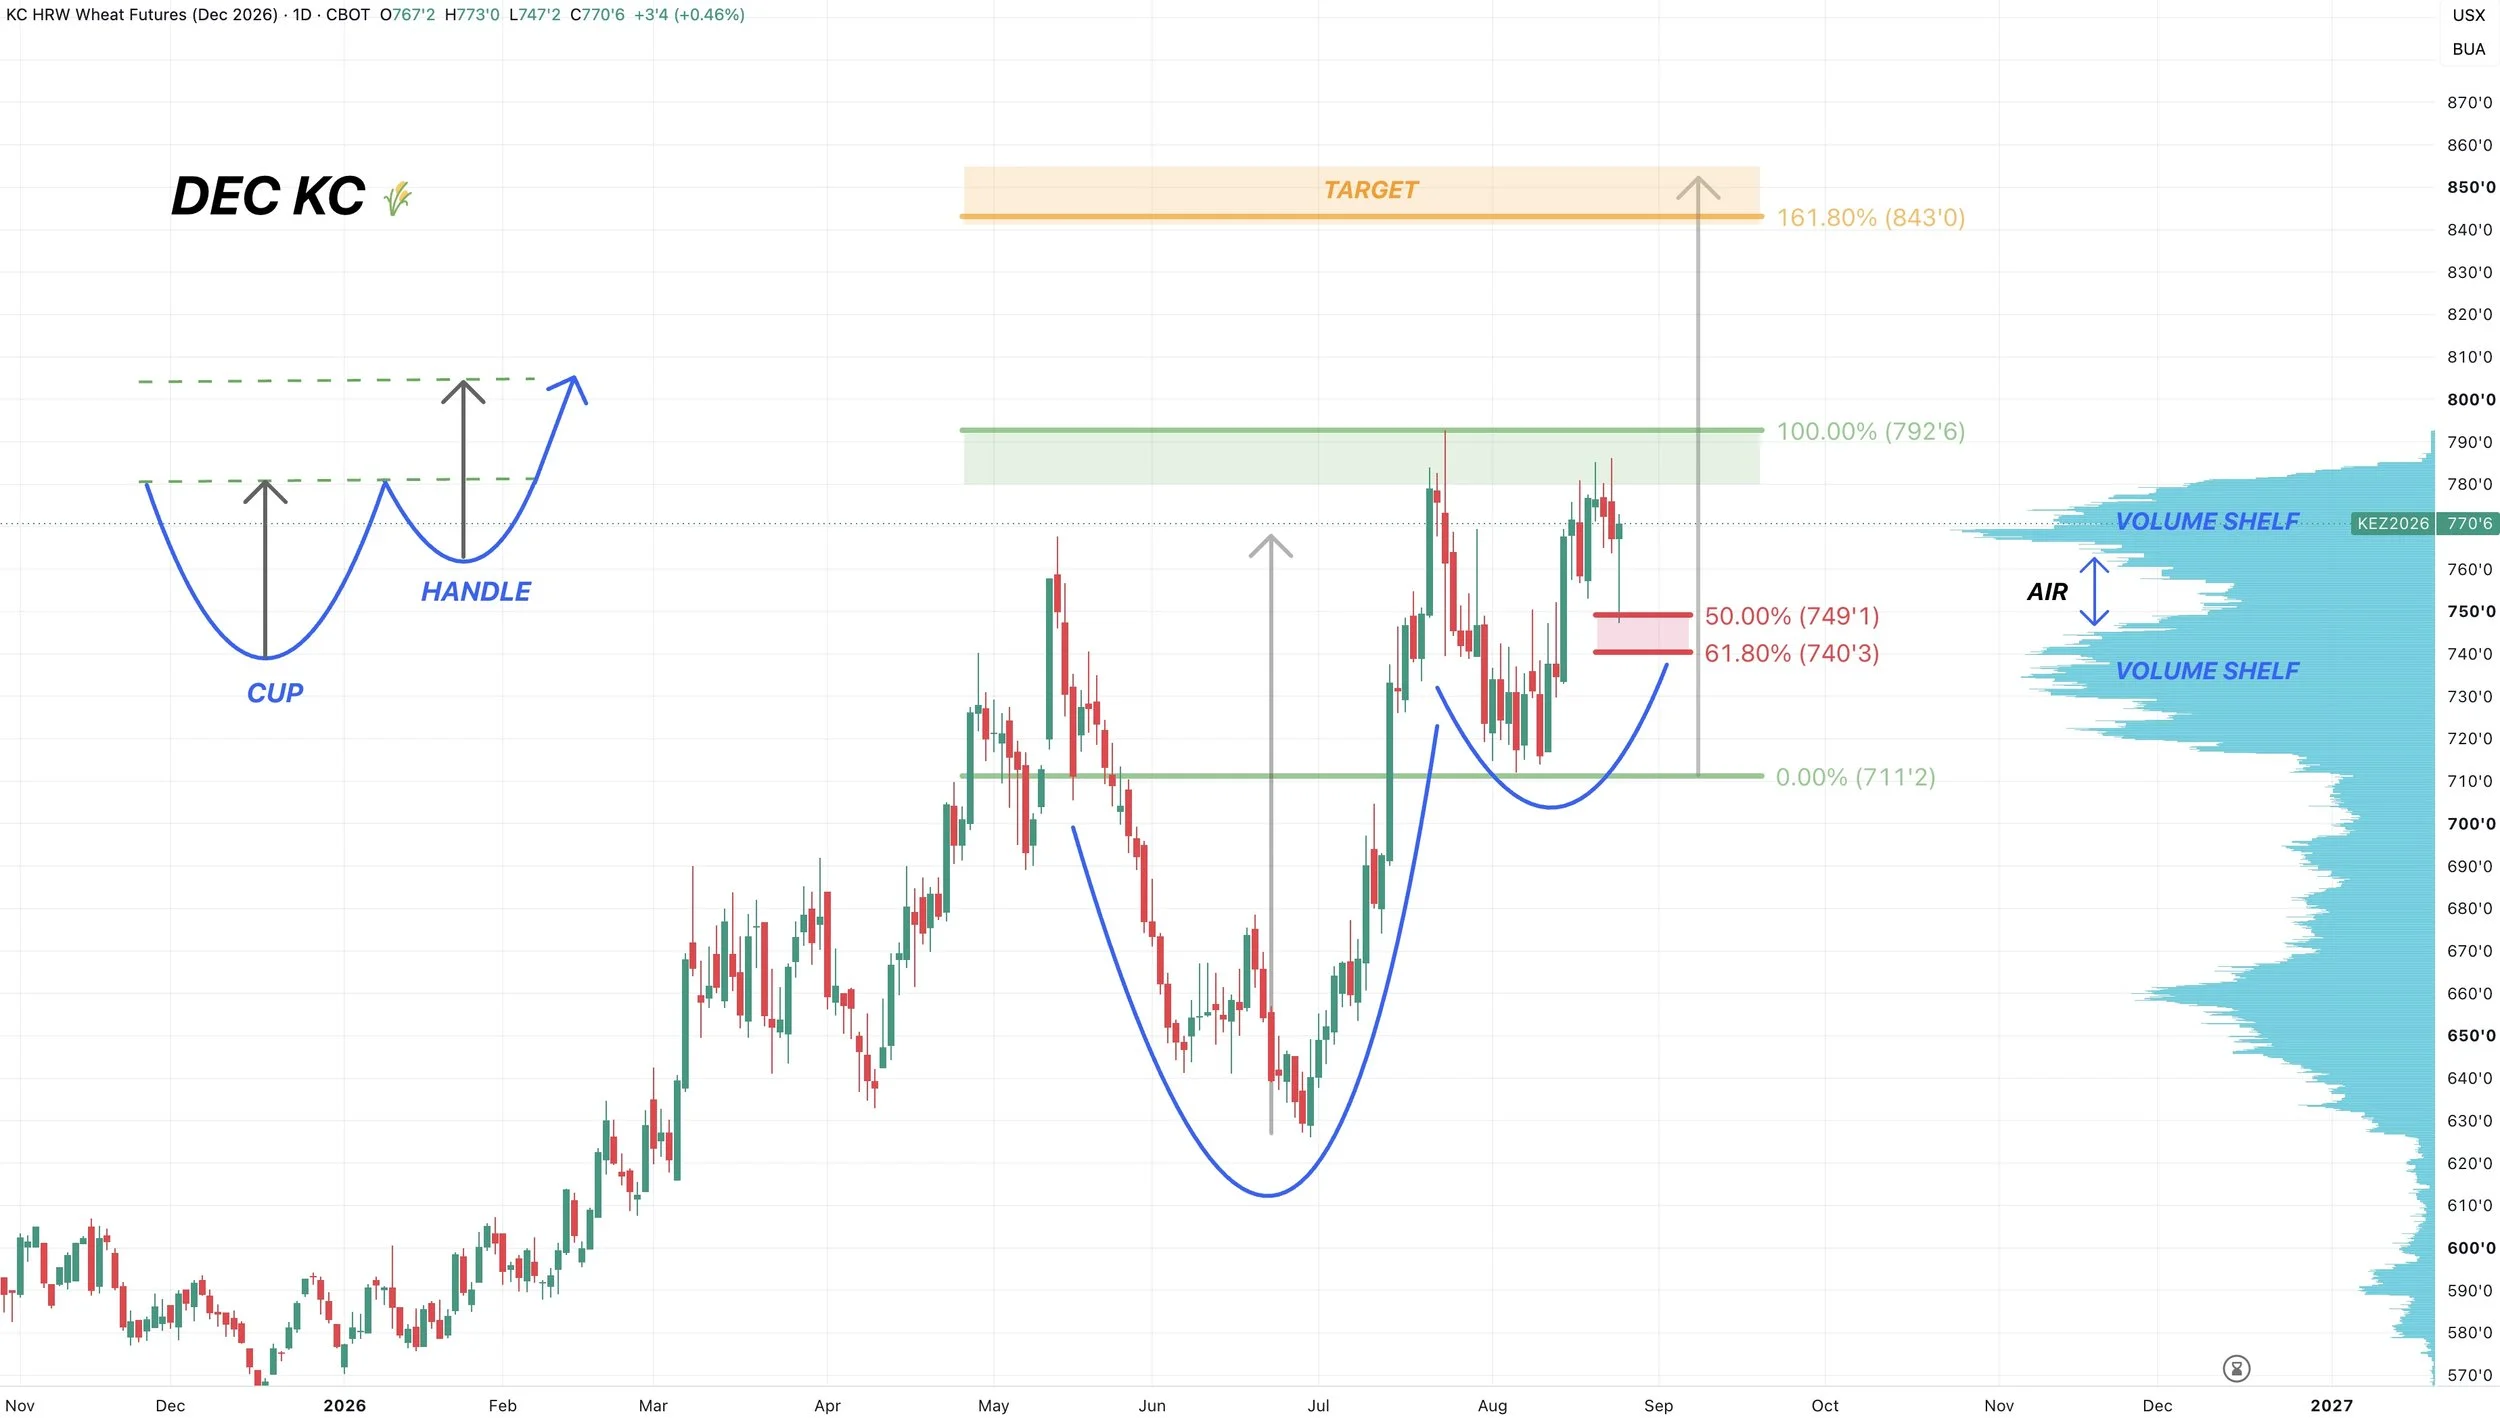
We still have this cup and handle pattern in place.
Currently, we are still chopping around at this volume shelf.
Volume shelves can act as magnets and launch pads.
If we get a pullback, we probably take a trip towards the bottom of the range and the other volume shelf.
If we break those July highs, I still have a target of $8.40 to $8.50
MPLS Wheat:
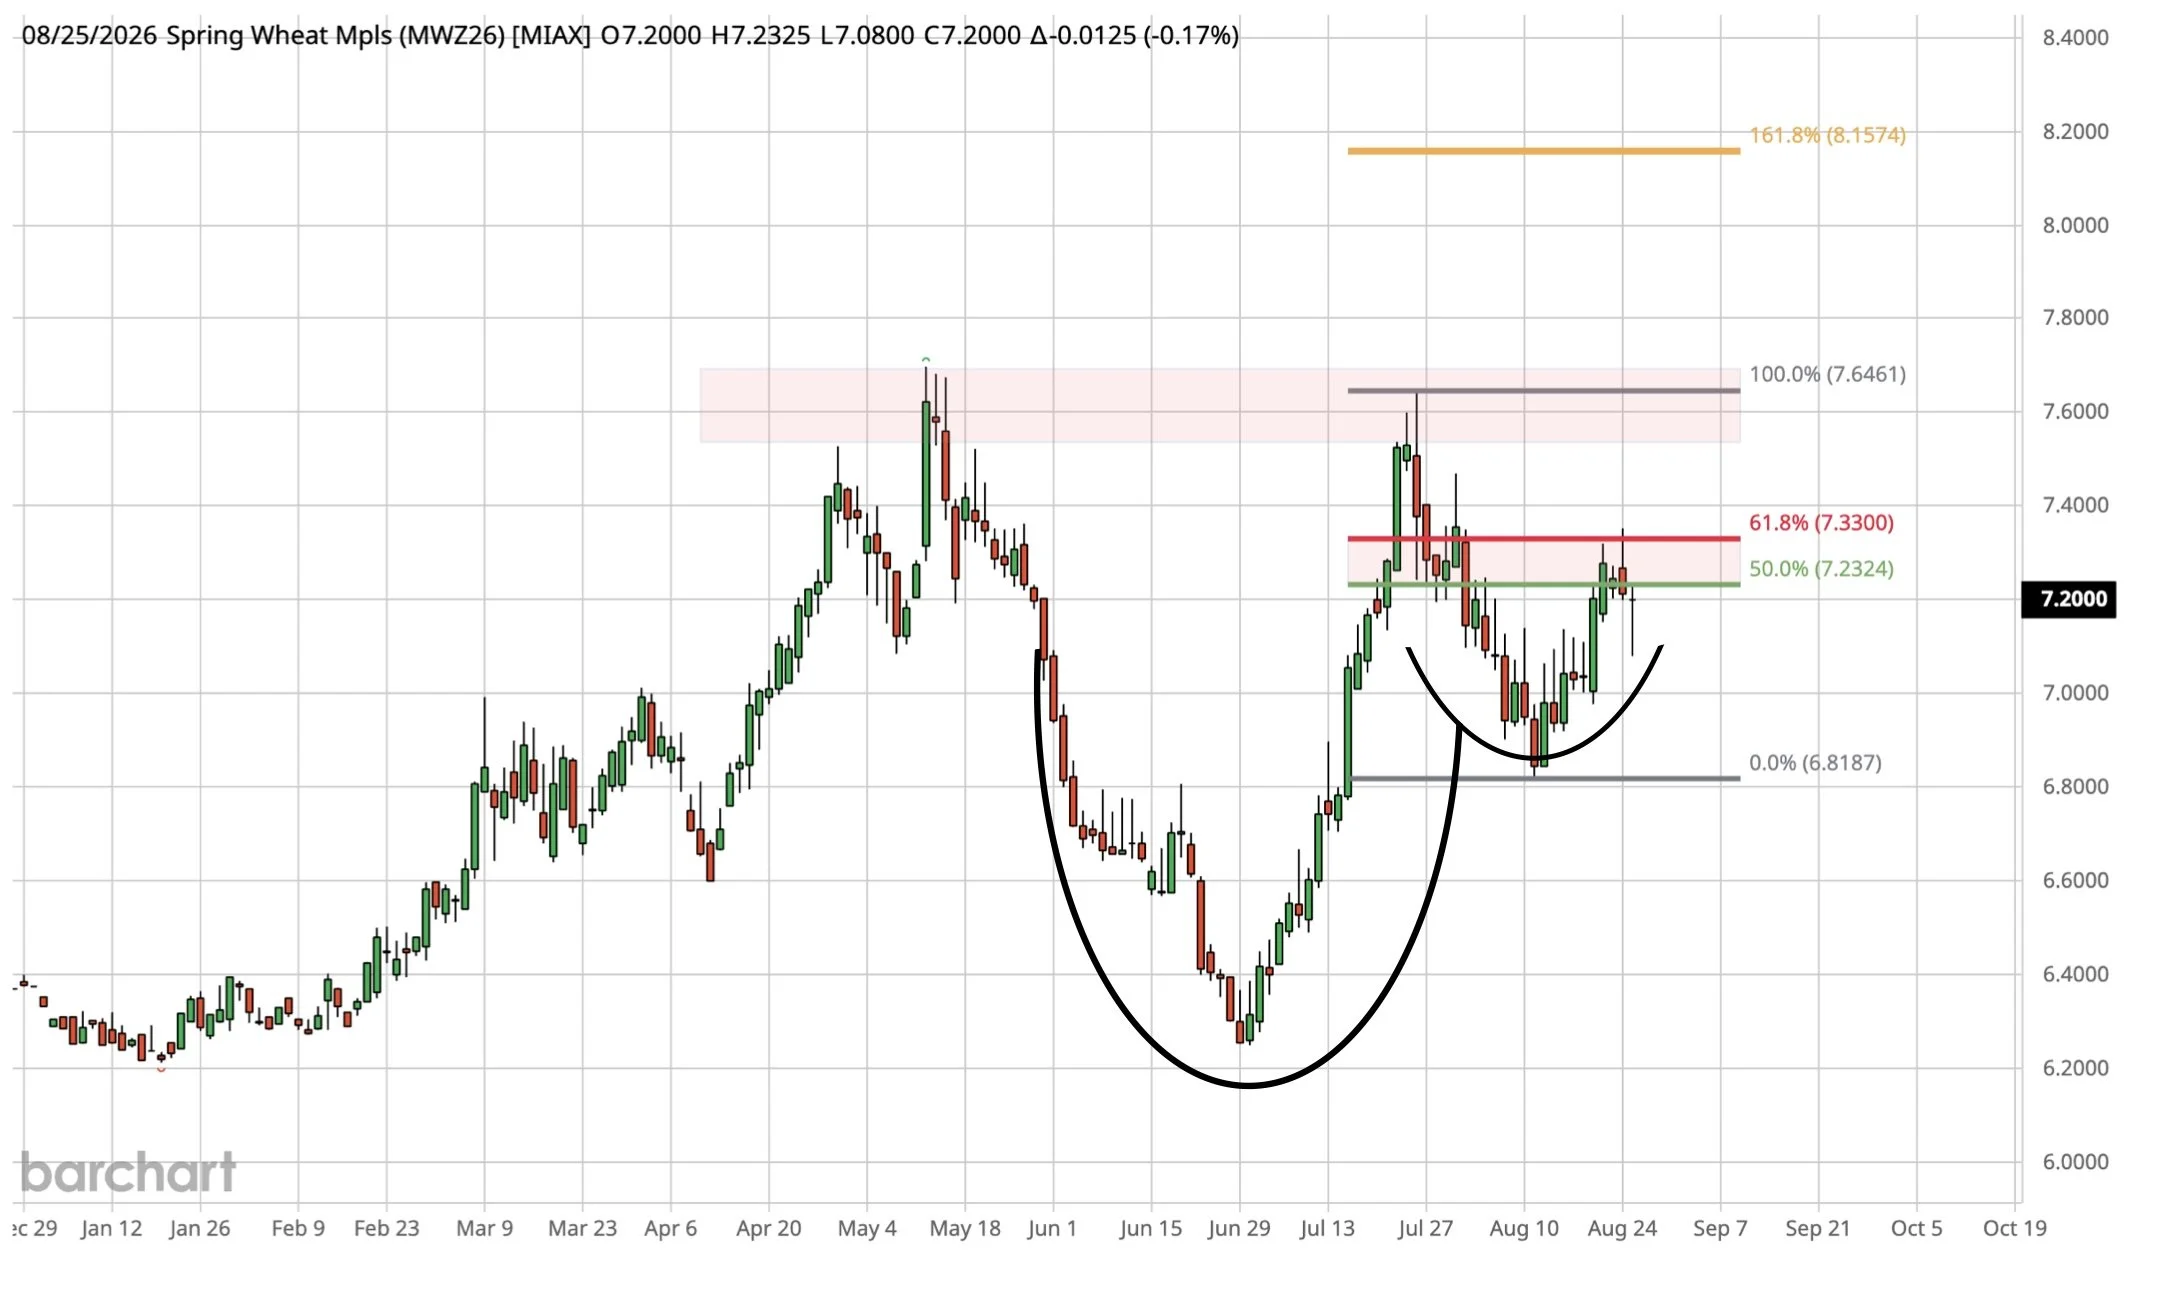
Still in this cup and handle pattern.
Still struggling to break above this golden zone. As we clawed back 61.8% of the highs.
Break above this level and we can test the highs.
Take out of those highs and I have a golden fib target that sits at $8.15
Cattle
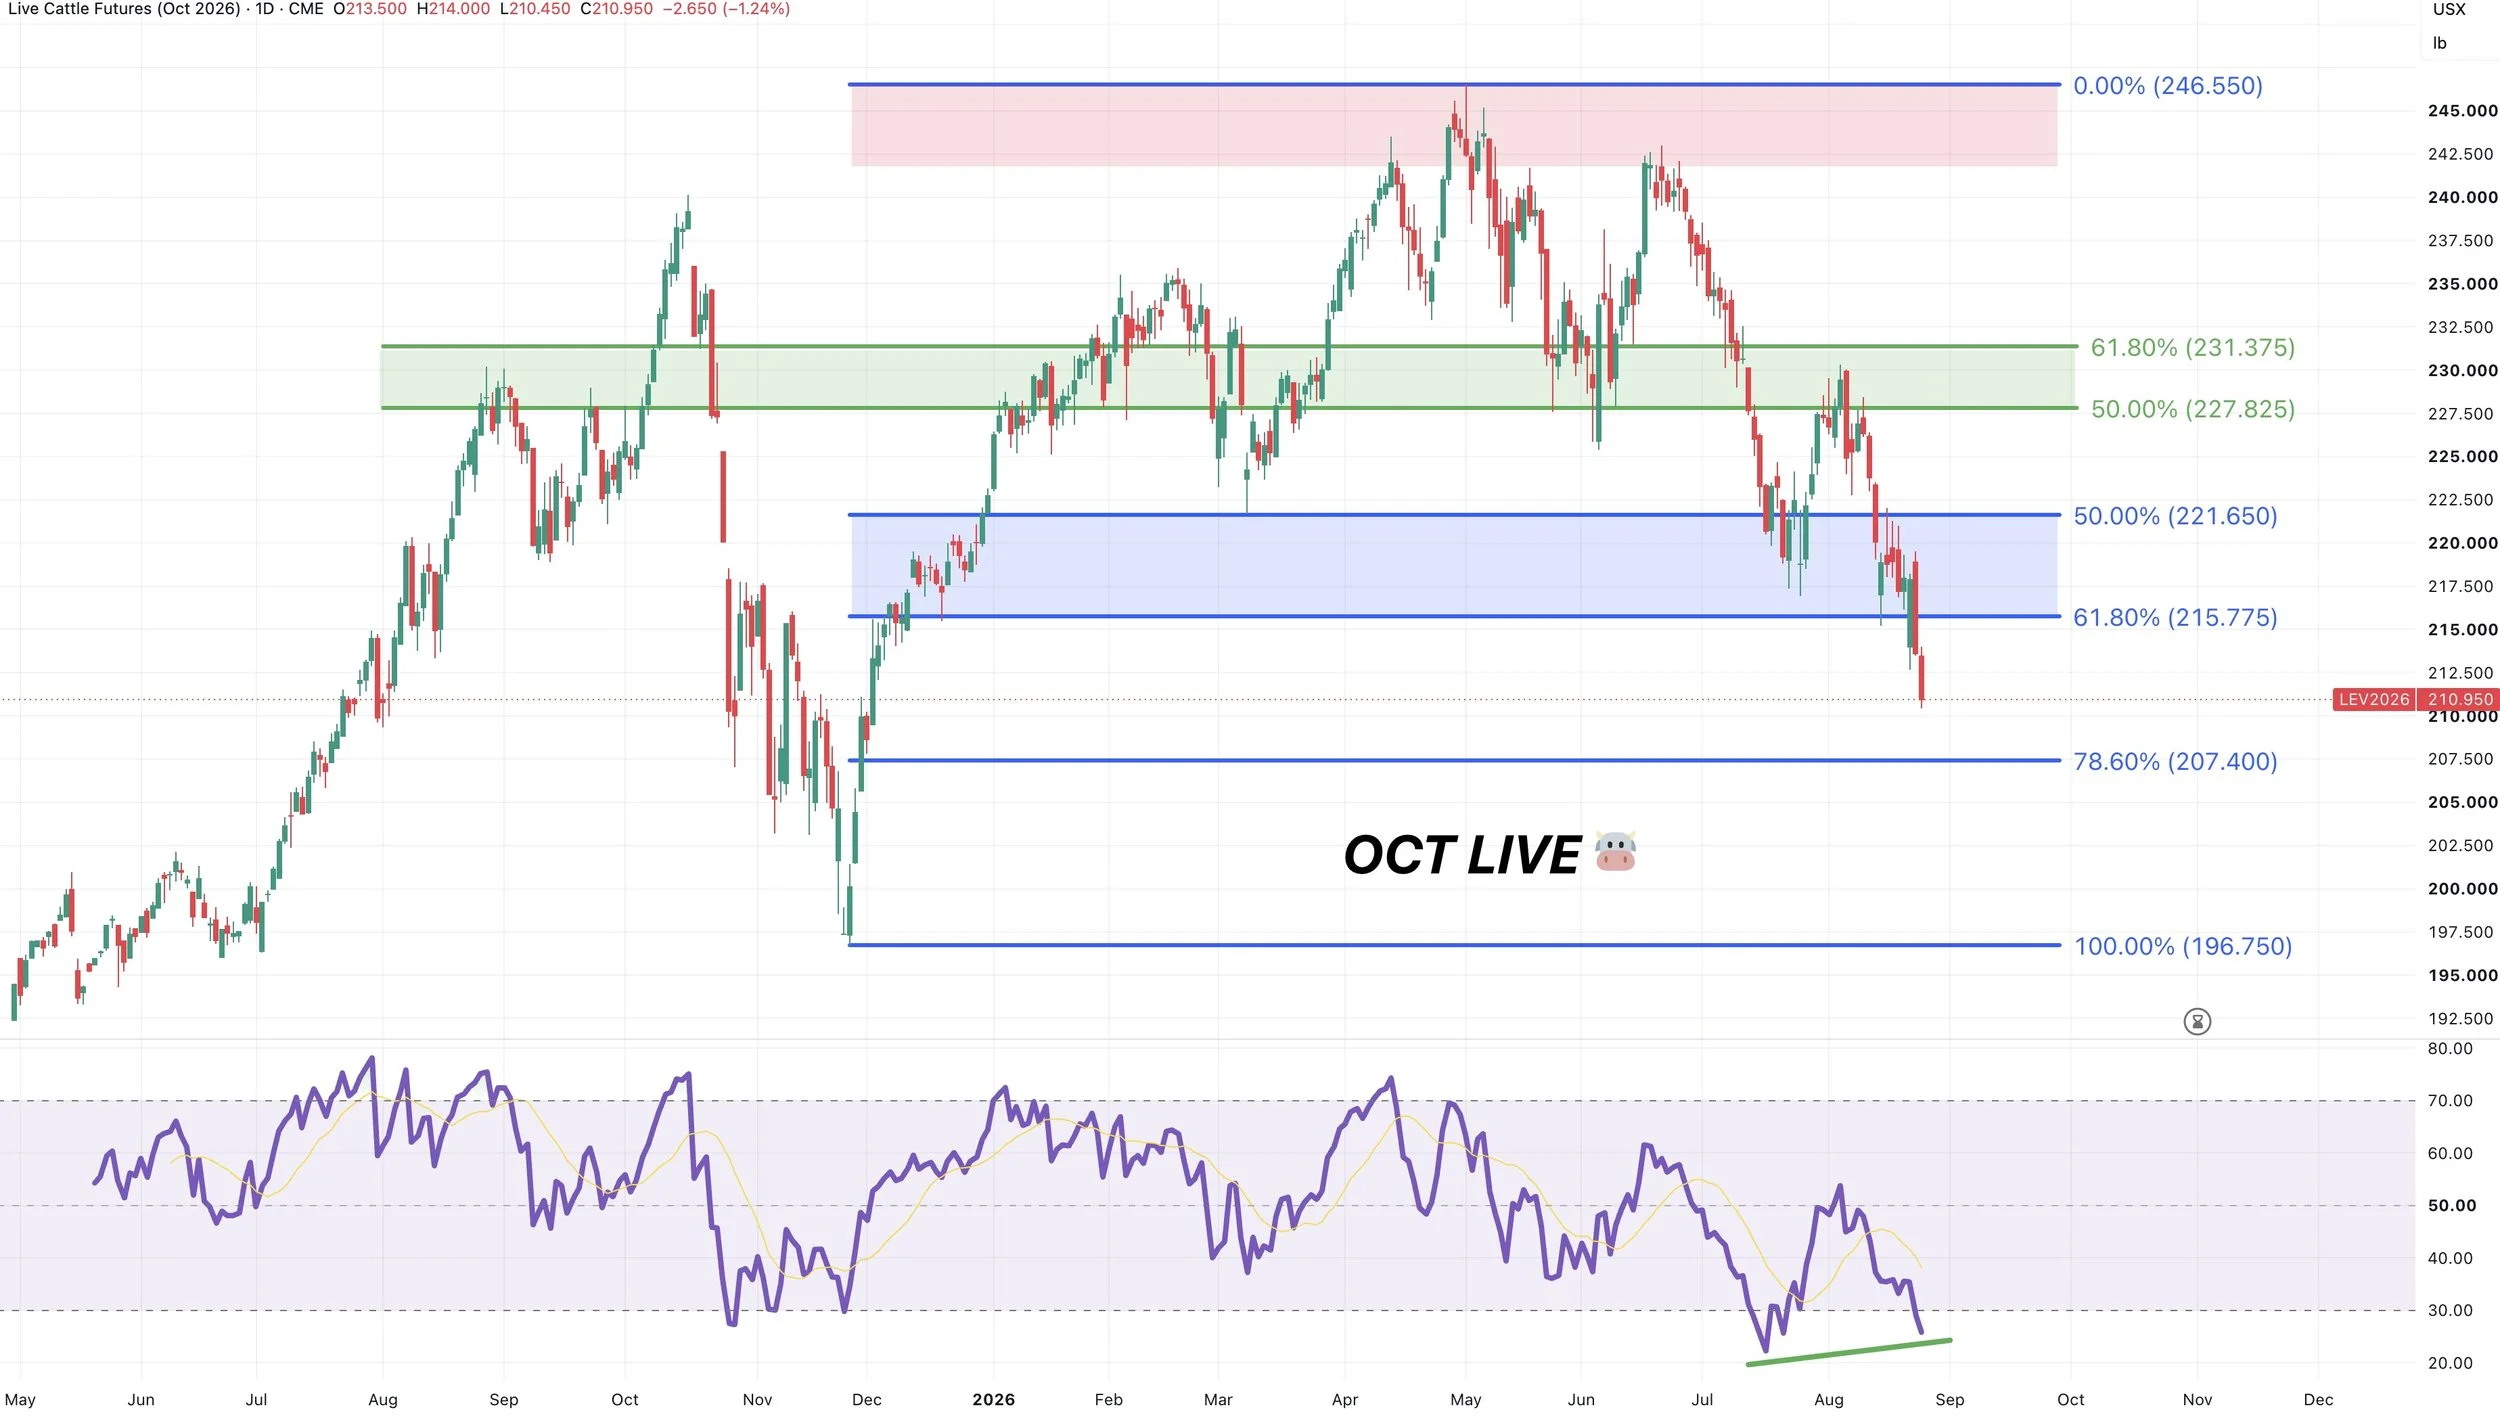
Oct Live Chart:
Cattle does not look good as the Trump administration continues to try to get beef prices lower.
We broke some major support.
We took out the 61.8% retracement down to the November lows, which opens the door a lot lower.
The only thing we have going for us is that there is still bullish divergence on the RSI. So we'd like to see us get a dead cat bounce soon. But you're basically trying to catch a falling knife here below support.
The overall trend is cattle is lower and any bounce is likely going to be viewed as just a relief bounce until proven otherwisde.
So I'm still in the camp of protecting any sizeable rallies.
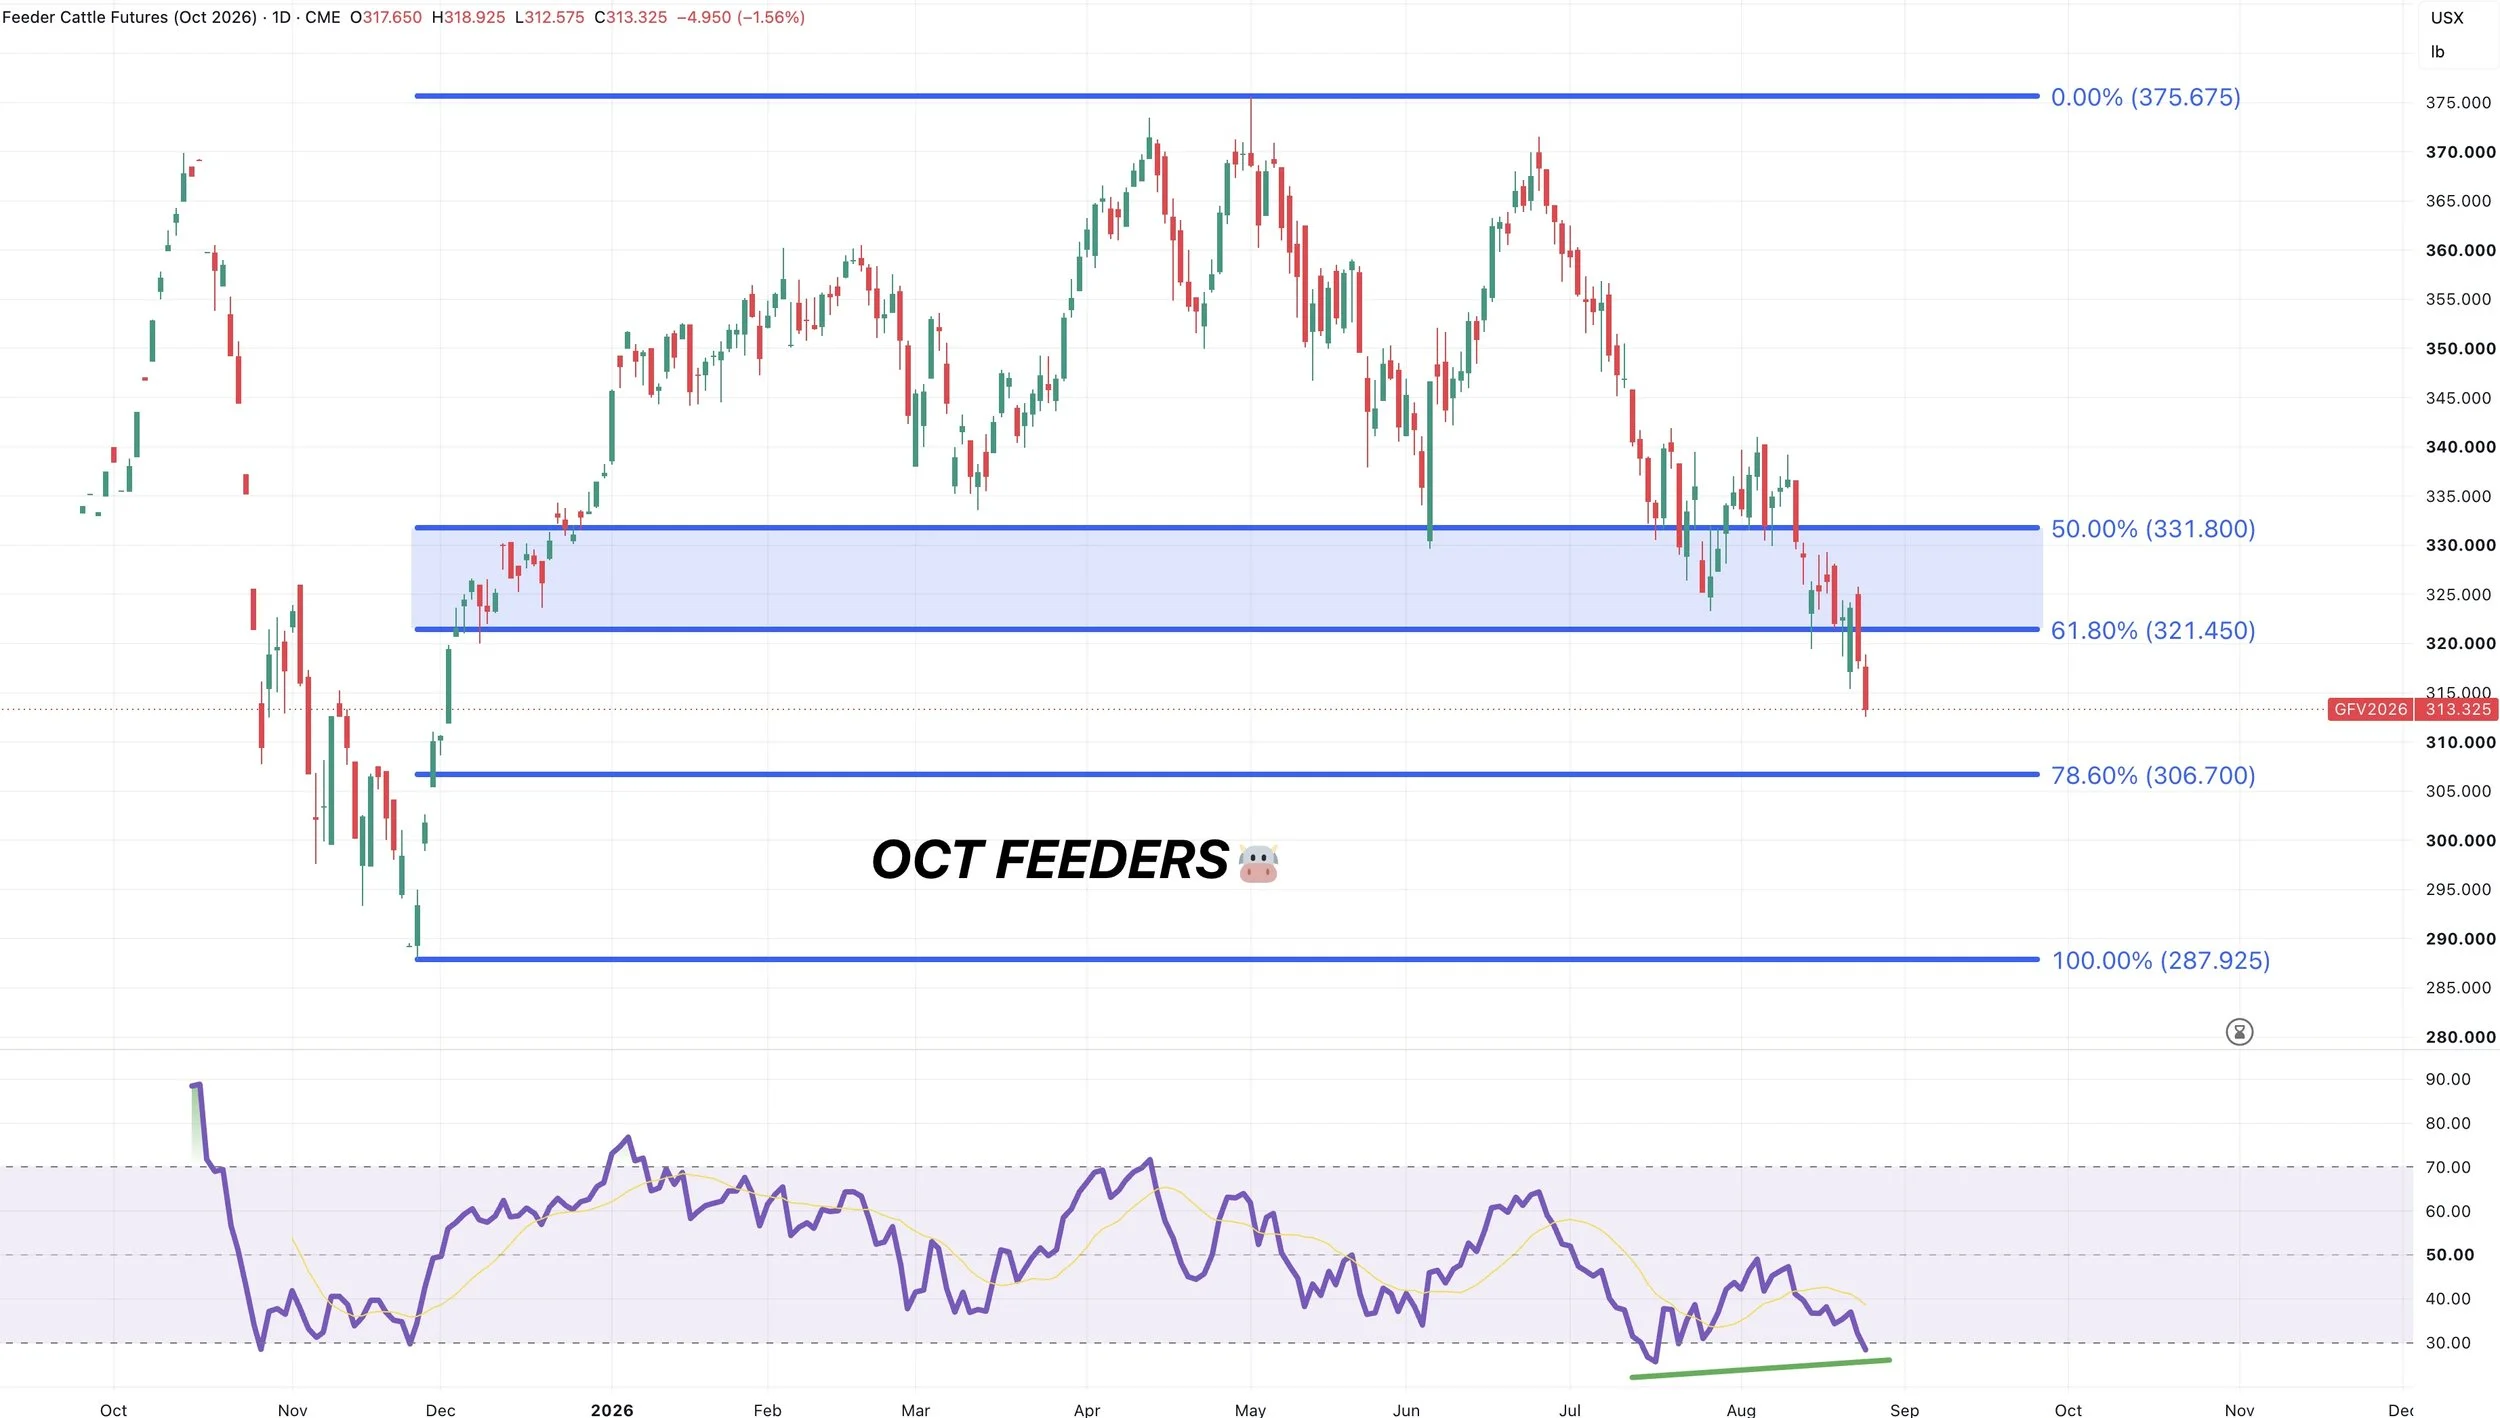
Oct Feeders Chart:
Also broke that key support.
So not looking too hot here, as breaking key support opens the flood gates lower.
One thing that's keeping some optimism for a short term relief bounce is that there is still bullish divergence on the RSI for now.
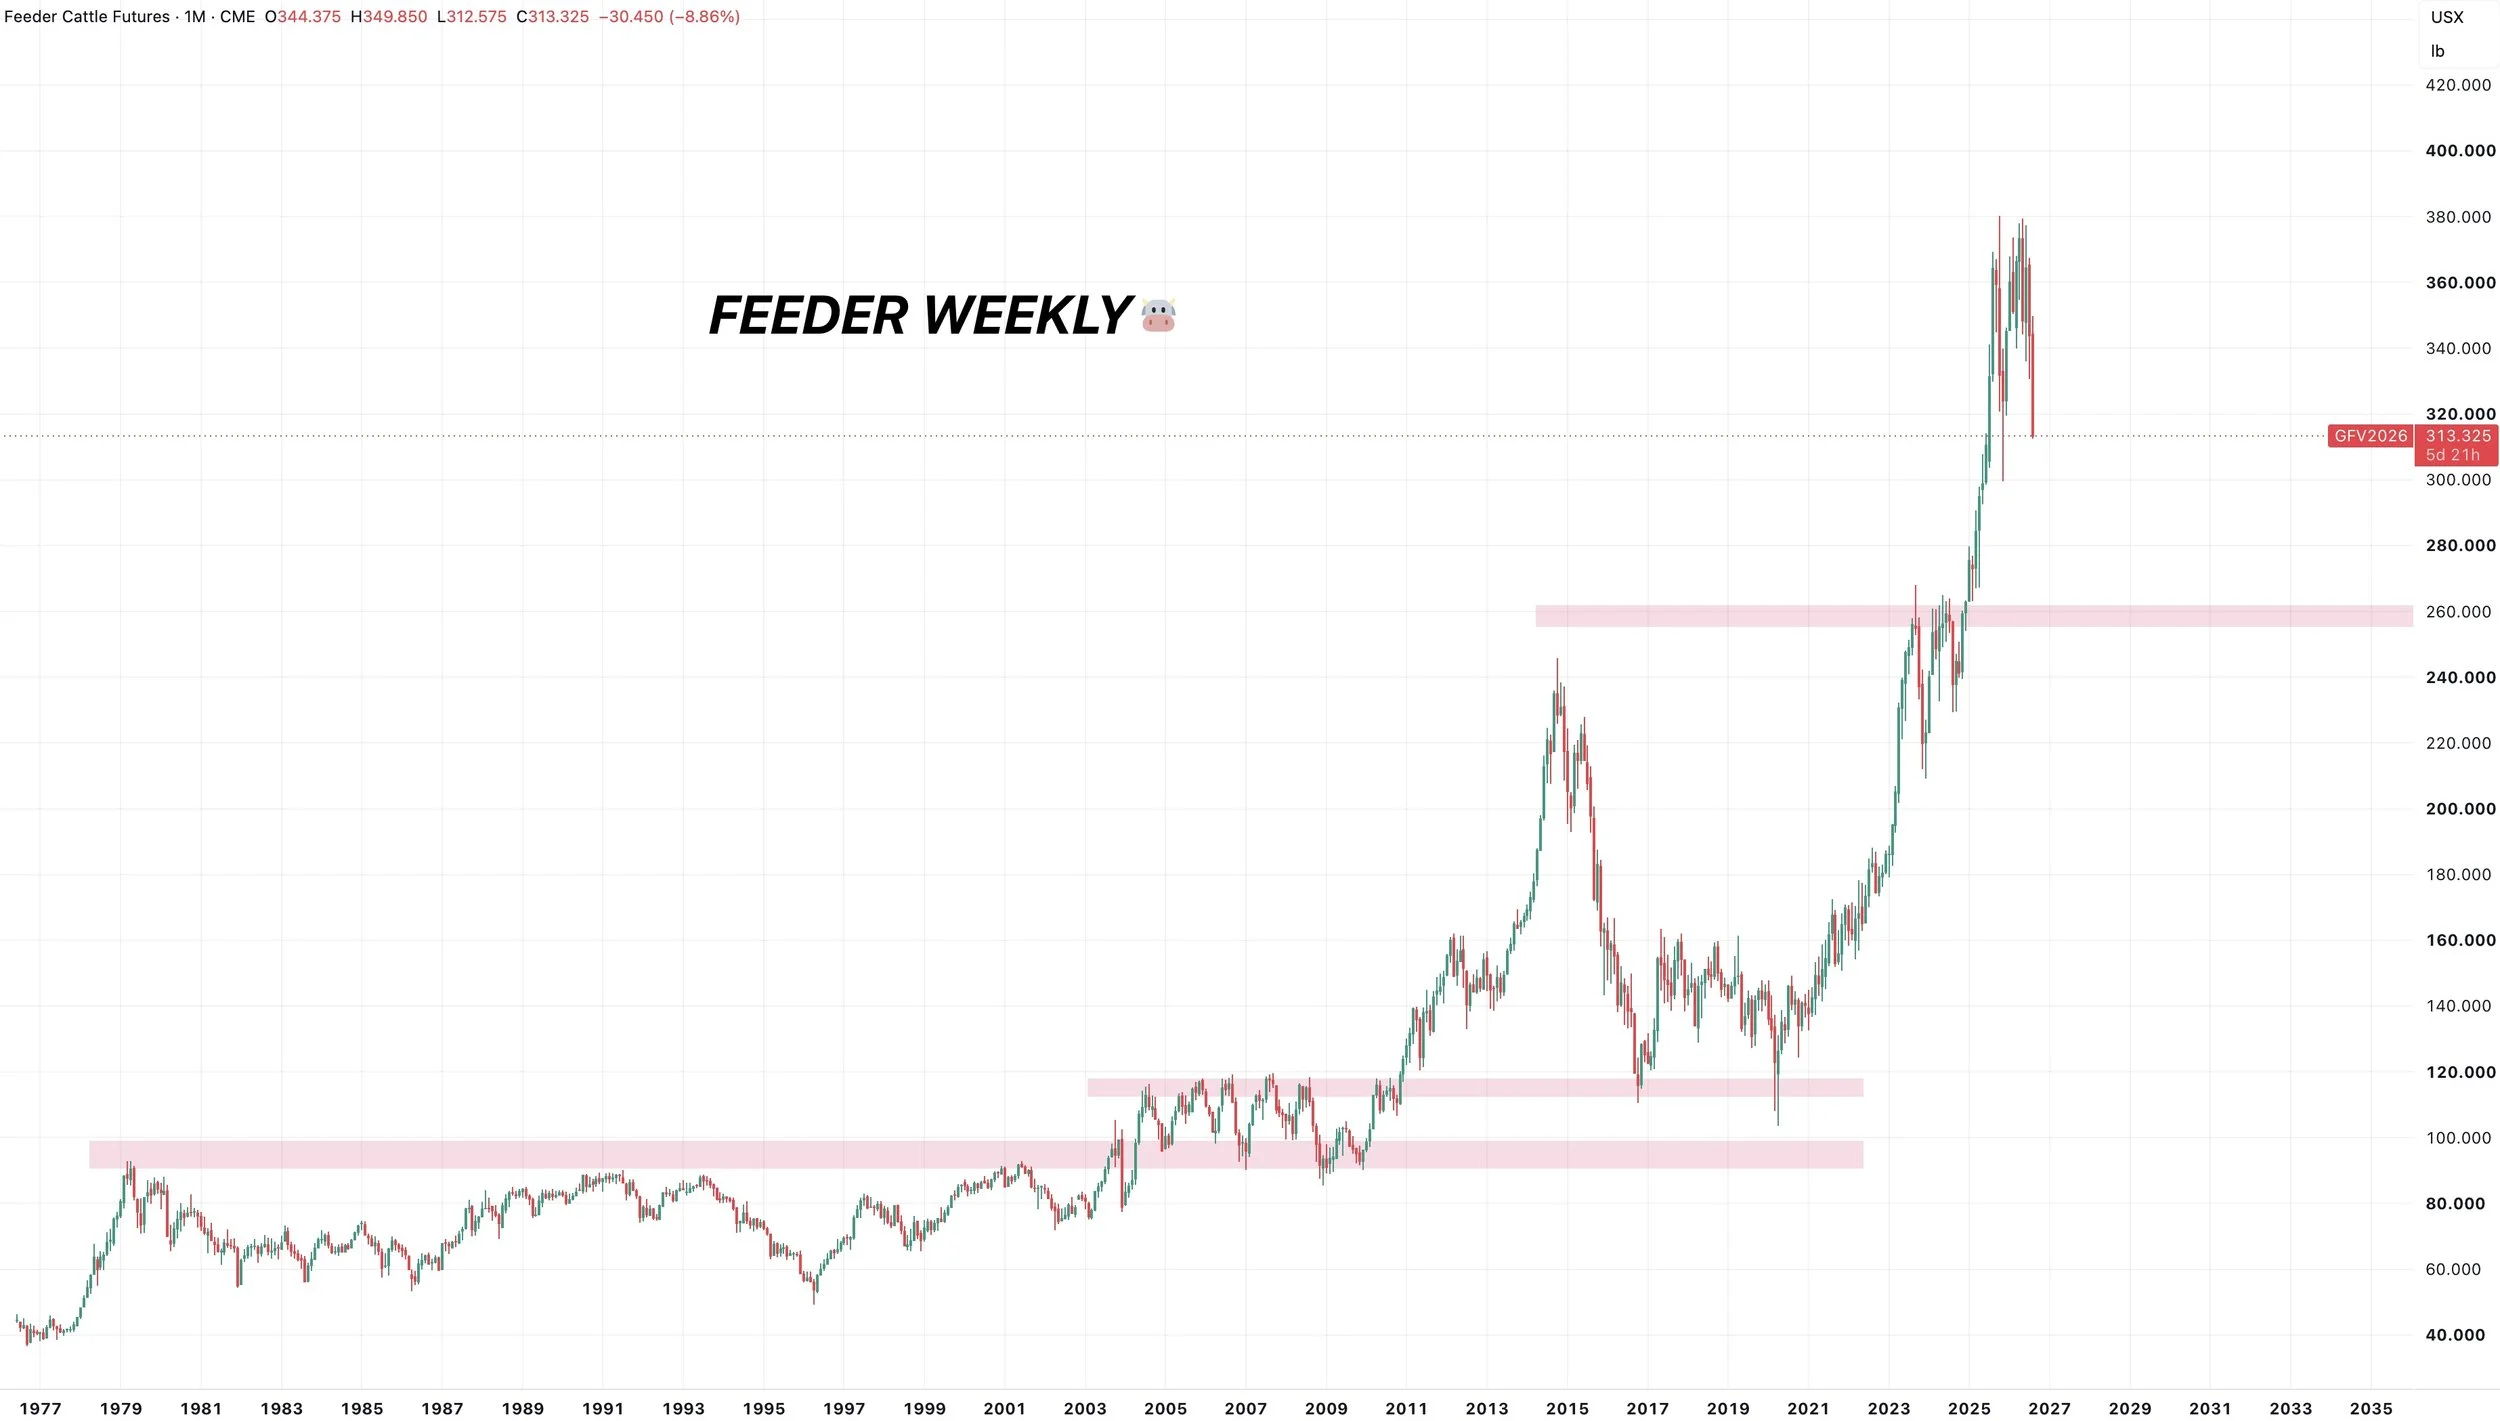
Monthly Feeders Chart:
If you zoom out, this market is still at it's highest levels of all-time.
There is still clearly plenty of downside risk in this market.
After the 2015 bull run, we came down and found our bottom at the highs from the 2000's.
So long term, seeing this market drift towards those old all time highs would not come as a major shock.
It's not going to be a straight line down if it even happened, and it could take months or even years for us to get that low, but the point is that there is plenty of risk and room to move lower long term.
Want to Talk?
Our phones are open 24/7 for you guys if you ever need anything or want to discuss your operation.
Jeremey & Office: (806)484-1214
Sebastian: (605)280-1186
Email: sfrost@dailymarketminute.com
Hedge Account
Interested in a hedge account? Use the link below to set up an account or give us a call.