
WHAT’S IT TAKE FOR TIGHT SCENARIOS?
MARKET UPDATE
You can scroll to read the usual update as well. As the written version is the exact same as the video.
Timestamps for video:
Overview: 0:00min
Corn: 1:20min
Bean: 8:35min
Wheat: 13:20min
Cattle: 17:00min
Want to talk?
Office: (806)484-1214
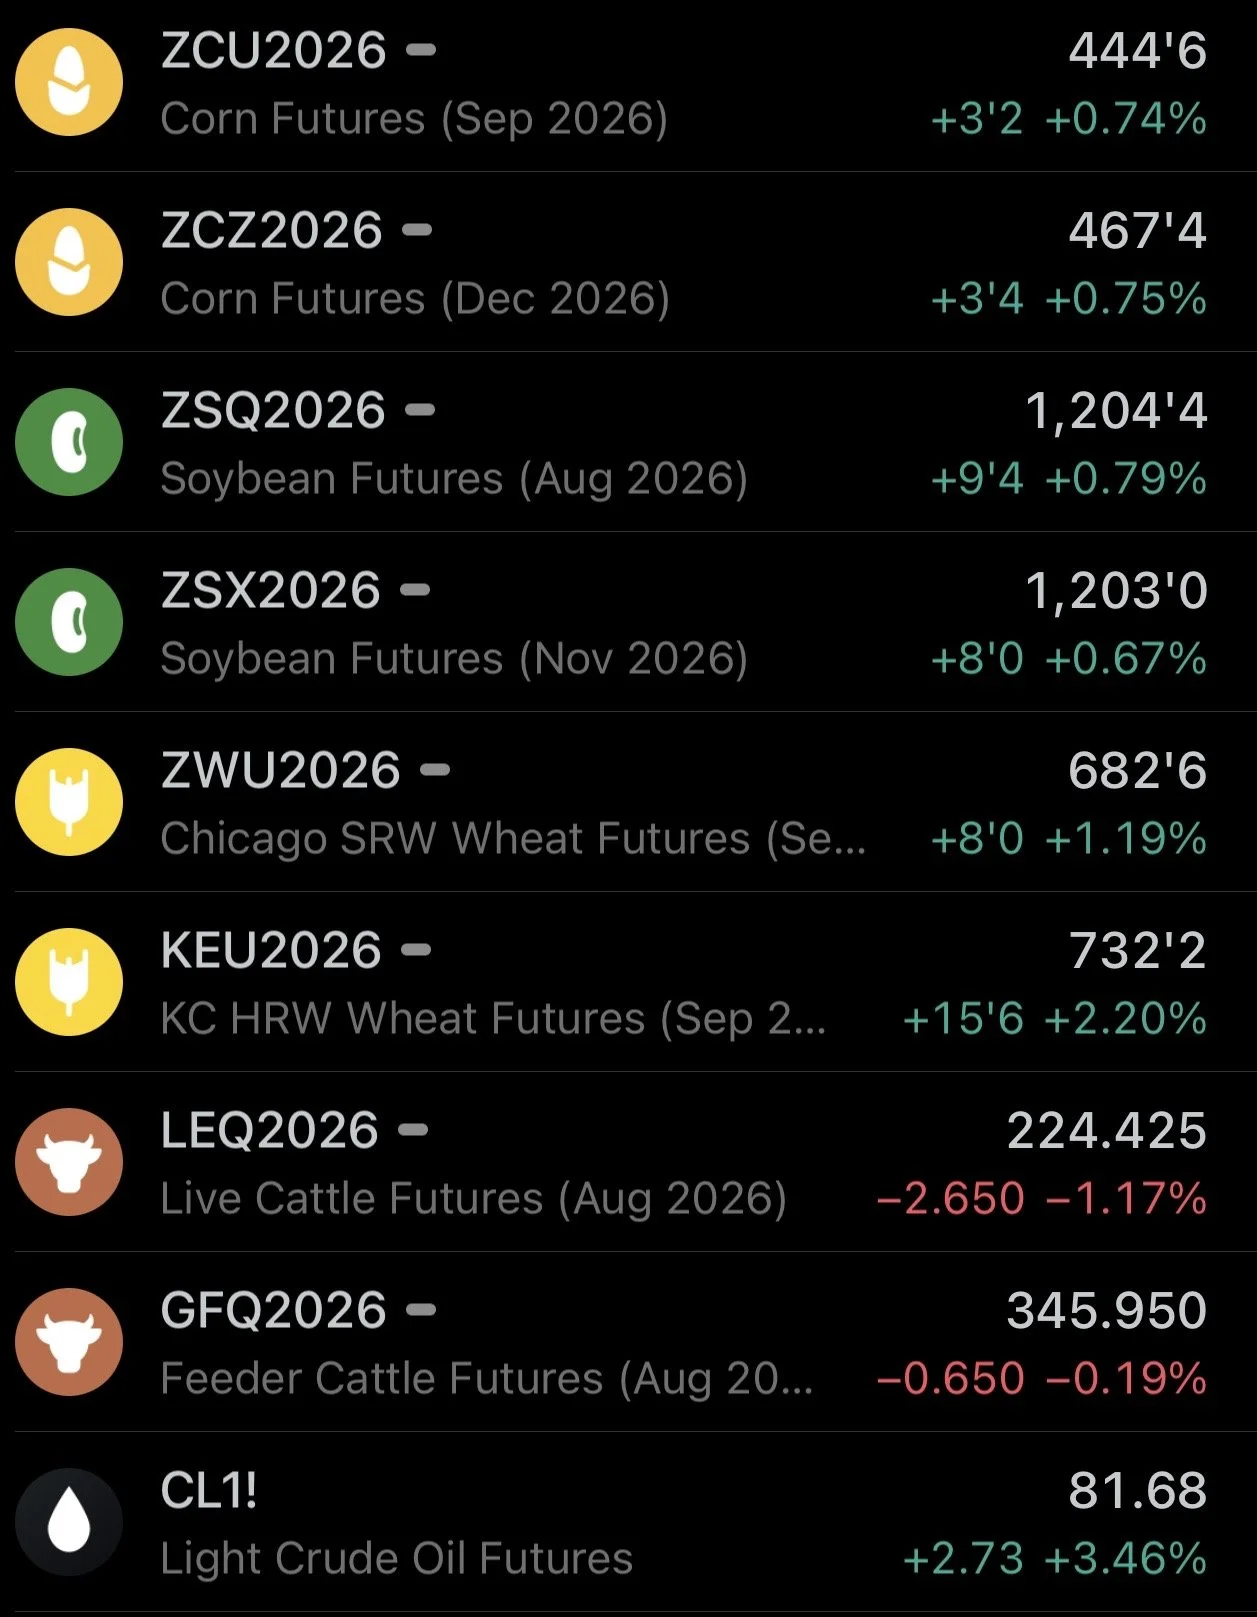
Futures Prices Close
Overview
Strong day across the board for grains with wheat continuing to lead the way higher, meanwhile cattle continues to drift lower.
August live cattle has been lower for 15 straight trading days in a row now.
Wheat continues to pull the rest of the grains higher with the Black Sea escalations. As the market continues to price in the potential of Russia's exports being limited.
Weather on Sunday night will of course be a big factor for next week. We have gapped open higher the last two Sunday nights.
Short term it really is all going to come down to weather and the Black Sea conflict.
Let's dive right in.
The Funds
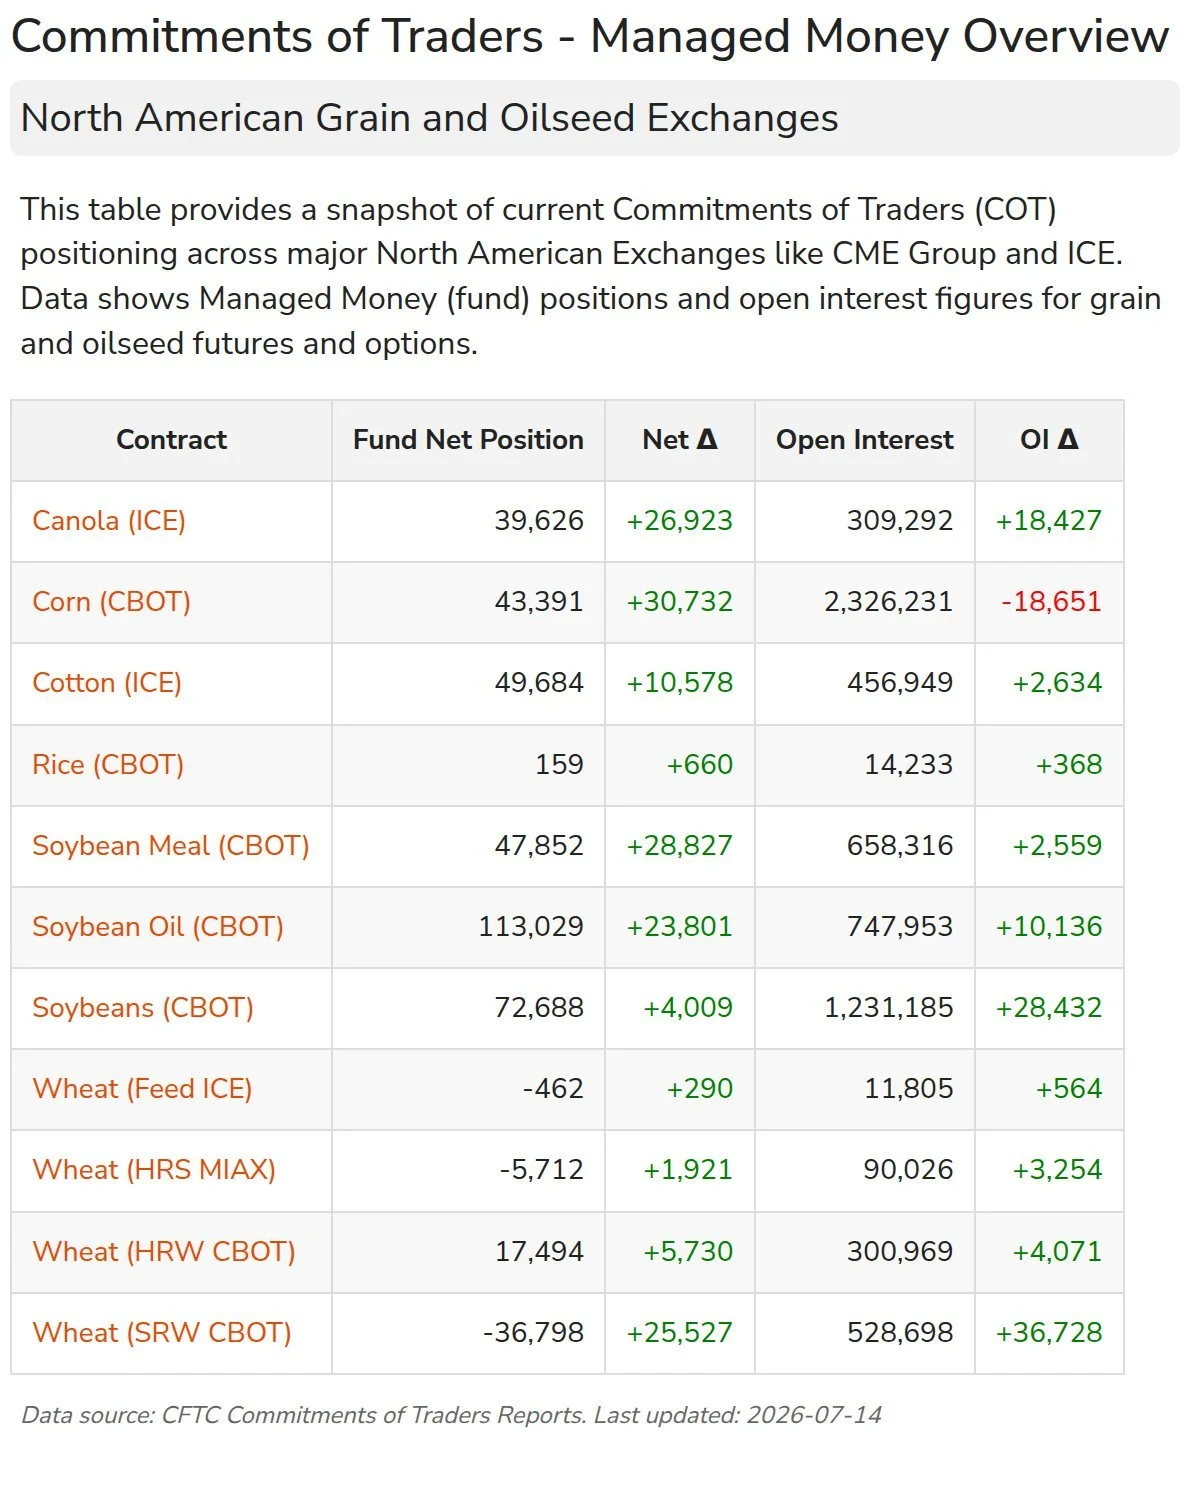
First I just wanted to give a quick update on the funds.
They are now long a small amount of corn again, but open interest dropped. Which means there is less people shorting corn vs actually getting long corn. As the total amount of positions in corn drop, yet the net position was higher.
They continue to add to their record long soybean complex position.
They bought a lot of wheat, and actually hold a slight long in KC wheat.
The funds have pretty much been short the wheat market for the last 4 years in a row. So you do have to wonder if they'll one day get tired of being short.
Chart from @GrainStats on X
Today's Main Takeaways
Corn
World vs US Story:
I have already went over these in corn before.
As you know, the world corn situation is the tightest in over a decade.
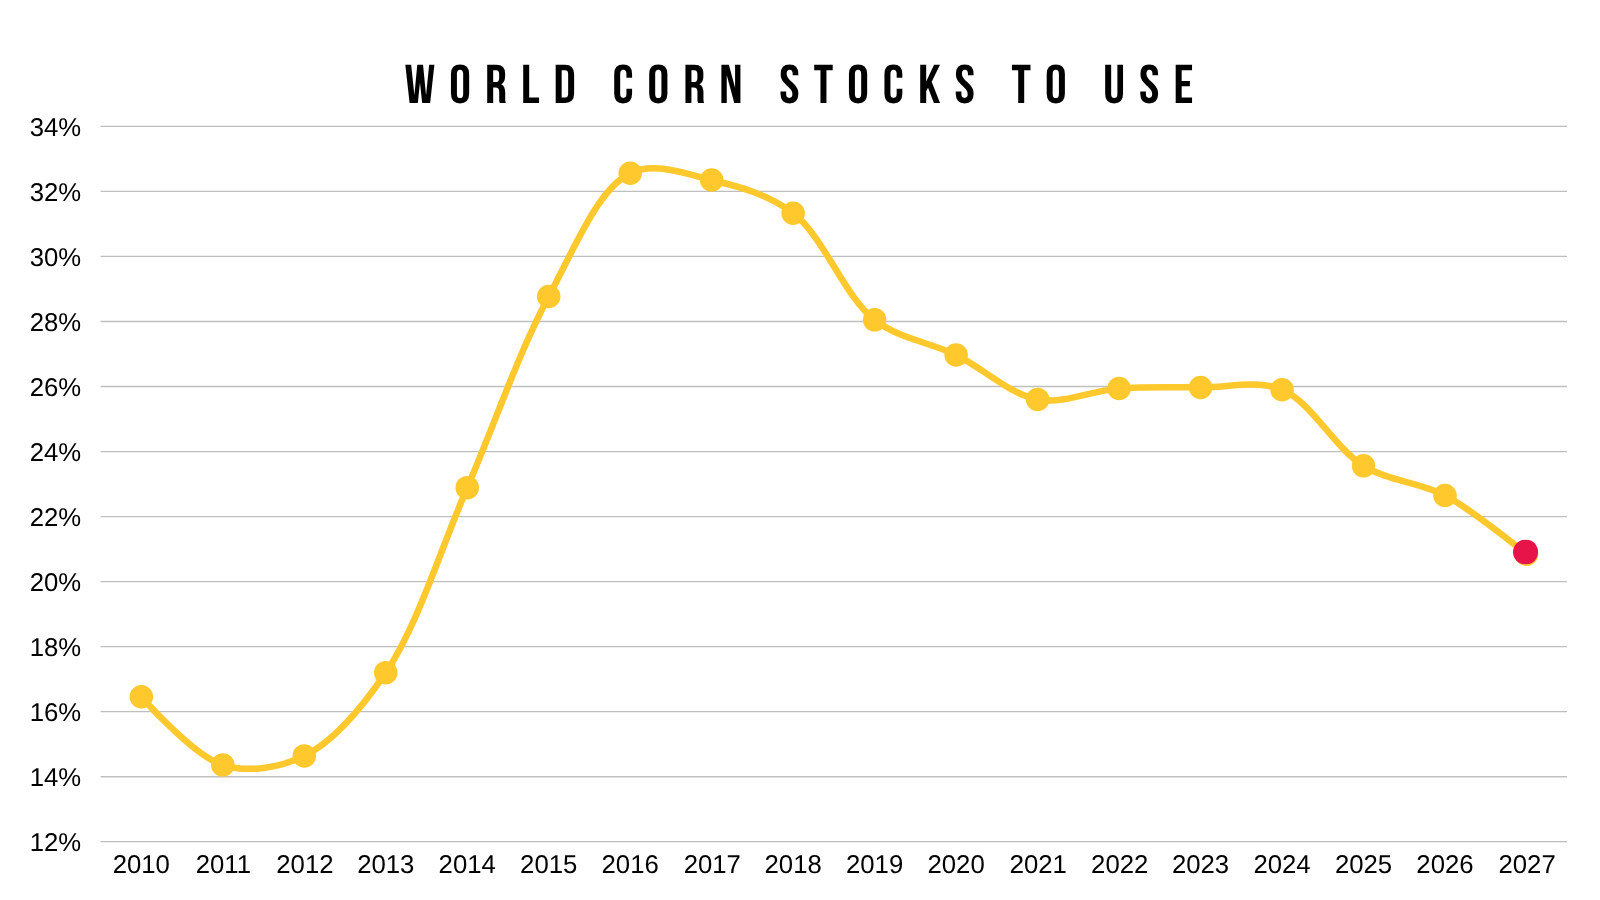
Does that really matter?
Yes and no.
This chart compares corn prices vs the world stocks to use.
There is clearly no correlation here at all.
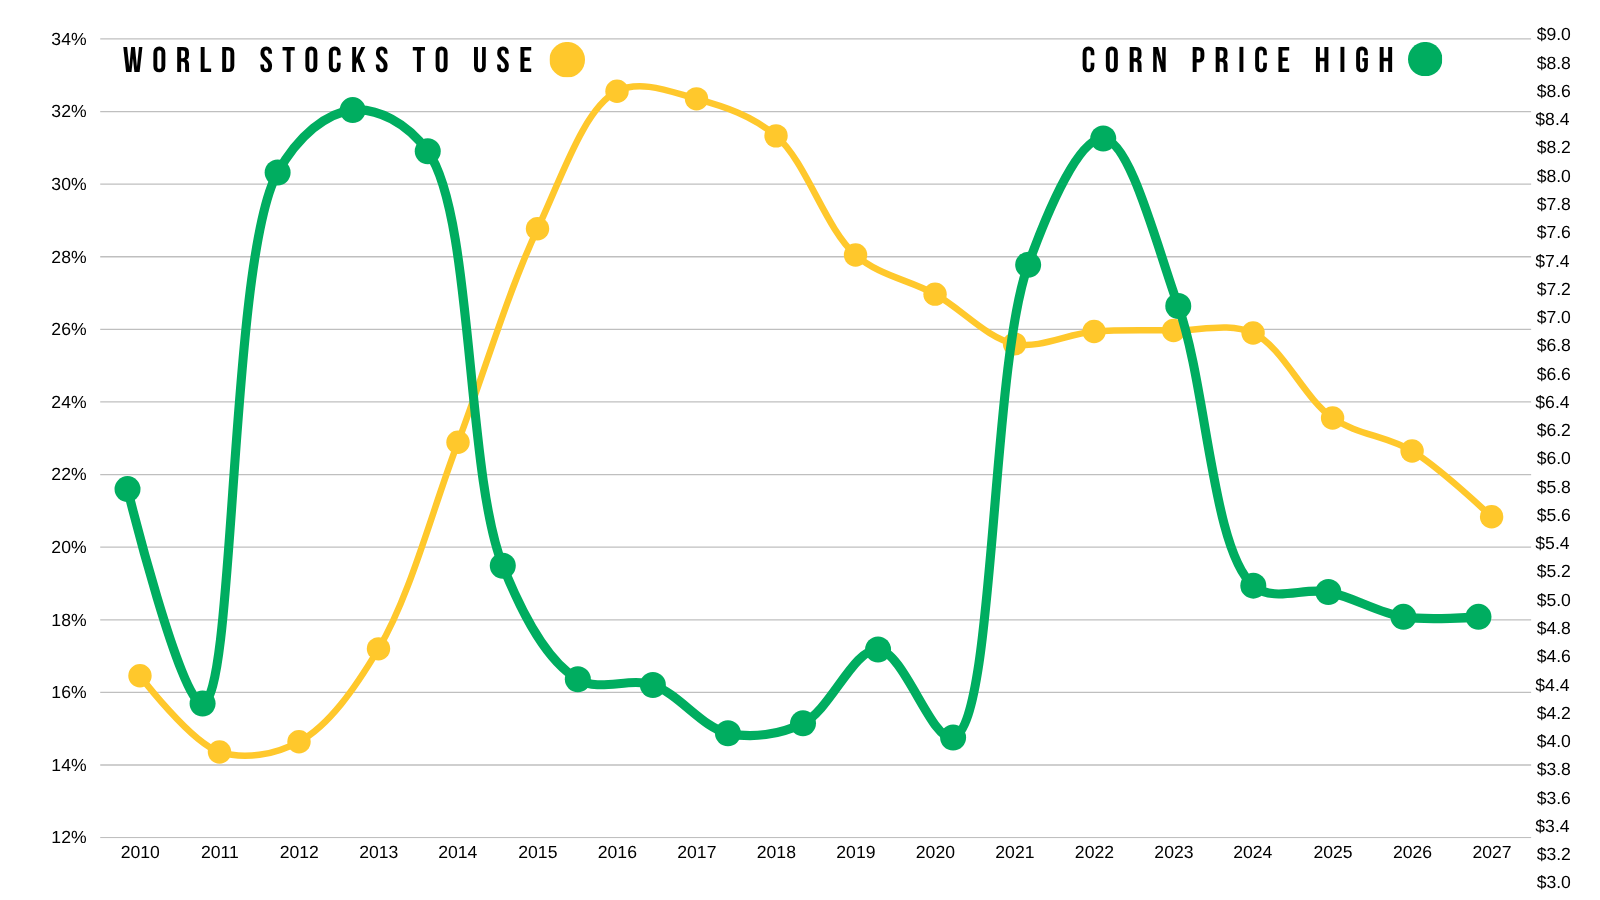
What a tight world situation does is essentially makes it that much more important for the US to have a big crop.
The world is the tightest it's been on corn despite both the US and Brazil having record crops. Because we are simply using more corn than we are producing globally.
For corn prices, the only thing that really matters is the US situation.
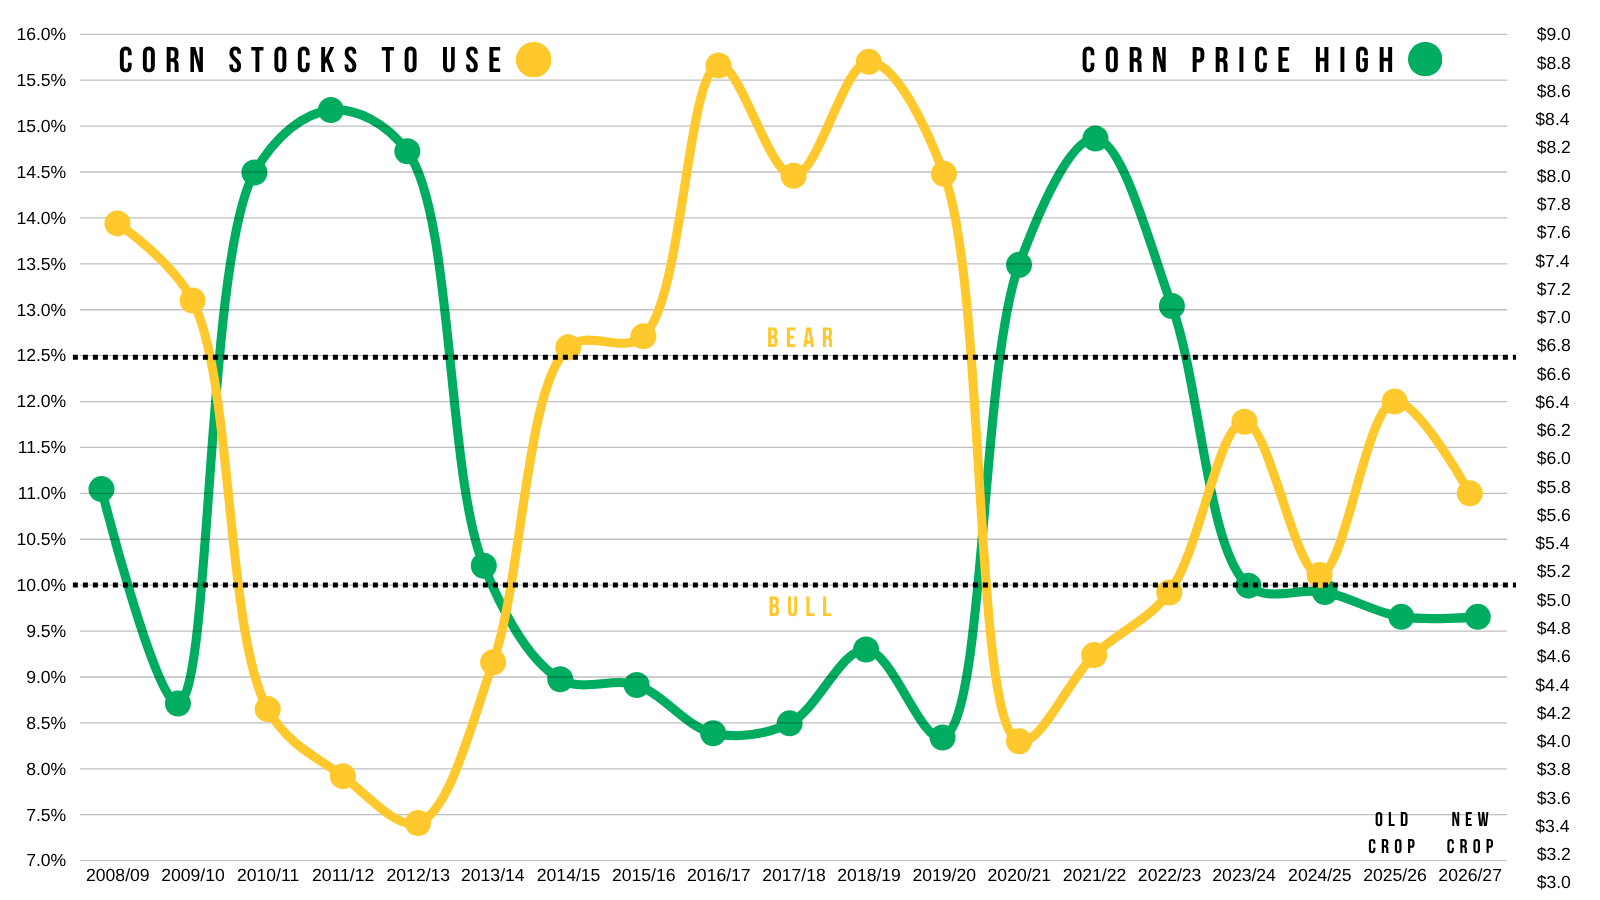
Here is the US stocks to use vs corn prices.
The old crop situation is still clearly not bullish.
But the new crop situation is becoming very interesting.
It's at 11% already. Without even knowing what the crop looks like.
If you want front month corn above $5.00, the key is having the stocks to use fall below 10%.
I have already went through why there are a dozen possible scenarios as to how corn's stocks to use can fall below 10%
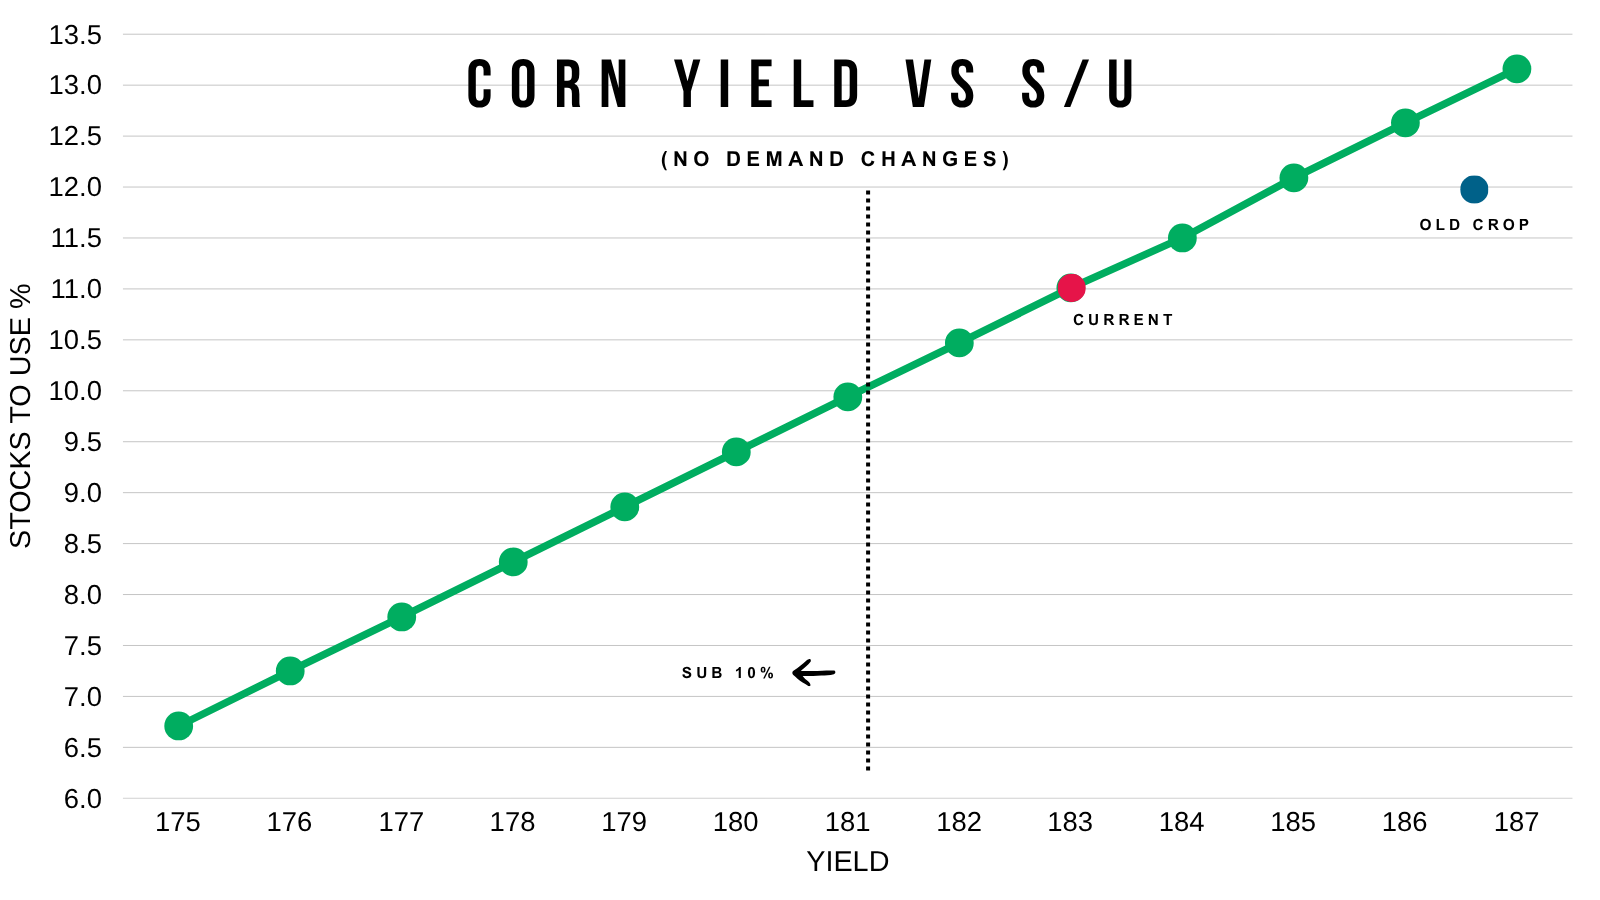
Here is a simple chart that shows how yield changes the stocks to use without touching demand at all.
Every bushel lost in yield, results in the carryout dropping roughly 100 million bushels.
Essentially, if yield slips anywhere from 181 to 179 you are looking at a completely different story in the corn market.
The possible story in corn is the best it's been in a while. As there really is no wiggle room.
Given we are starting at 11% without even knowing what the crop looks like.
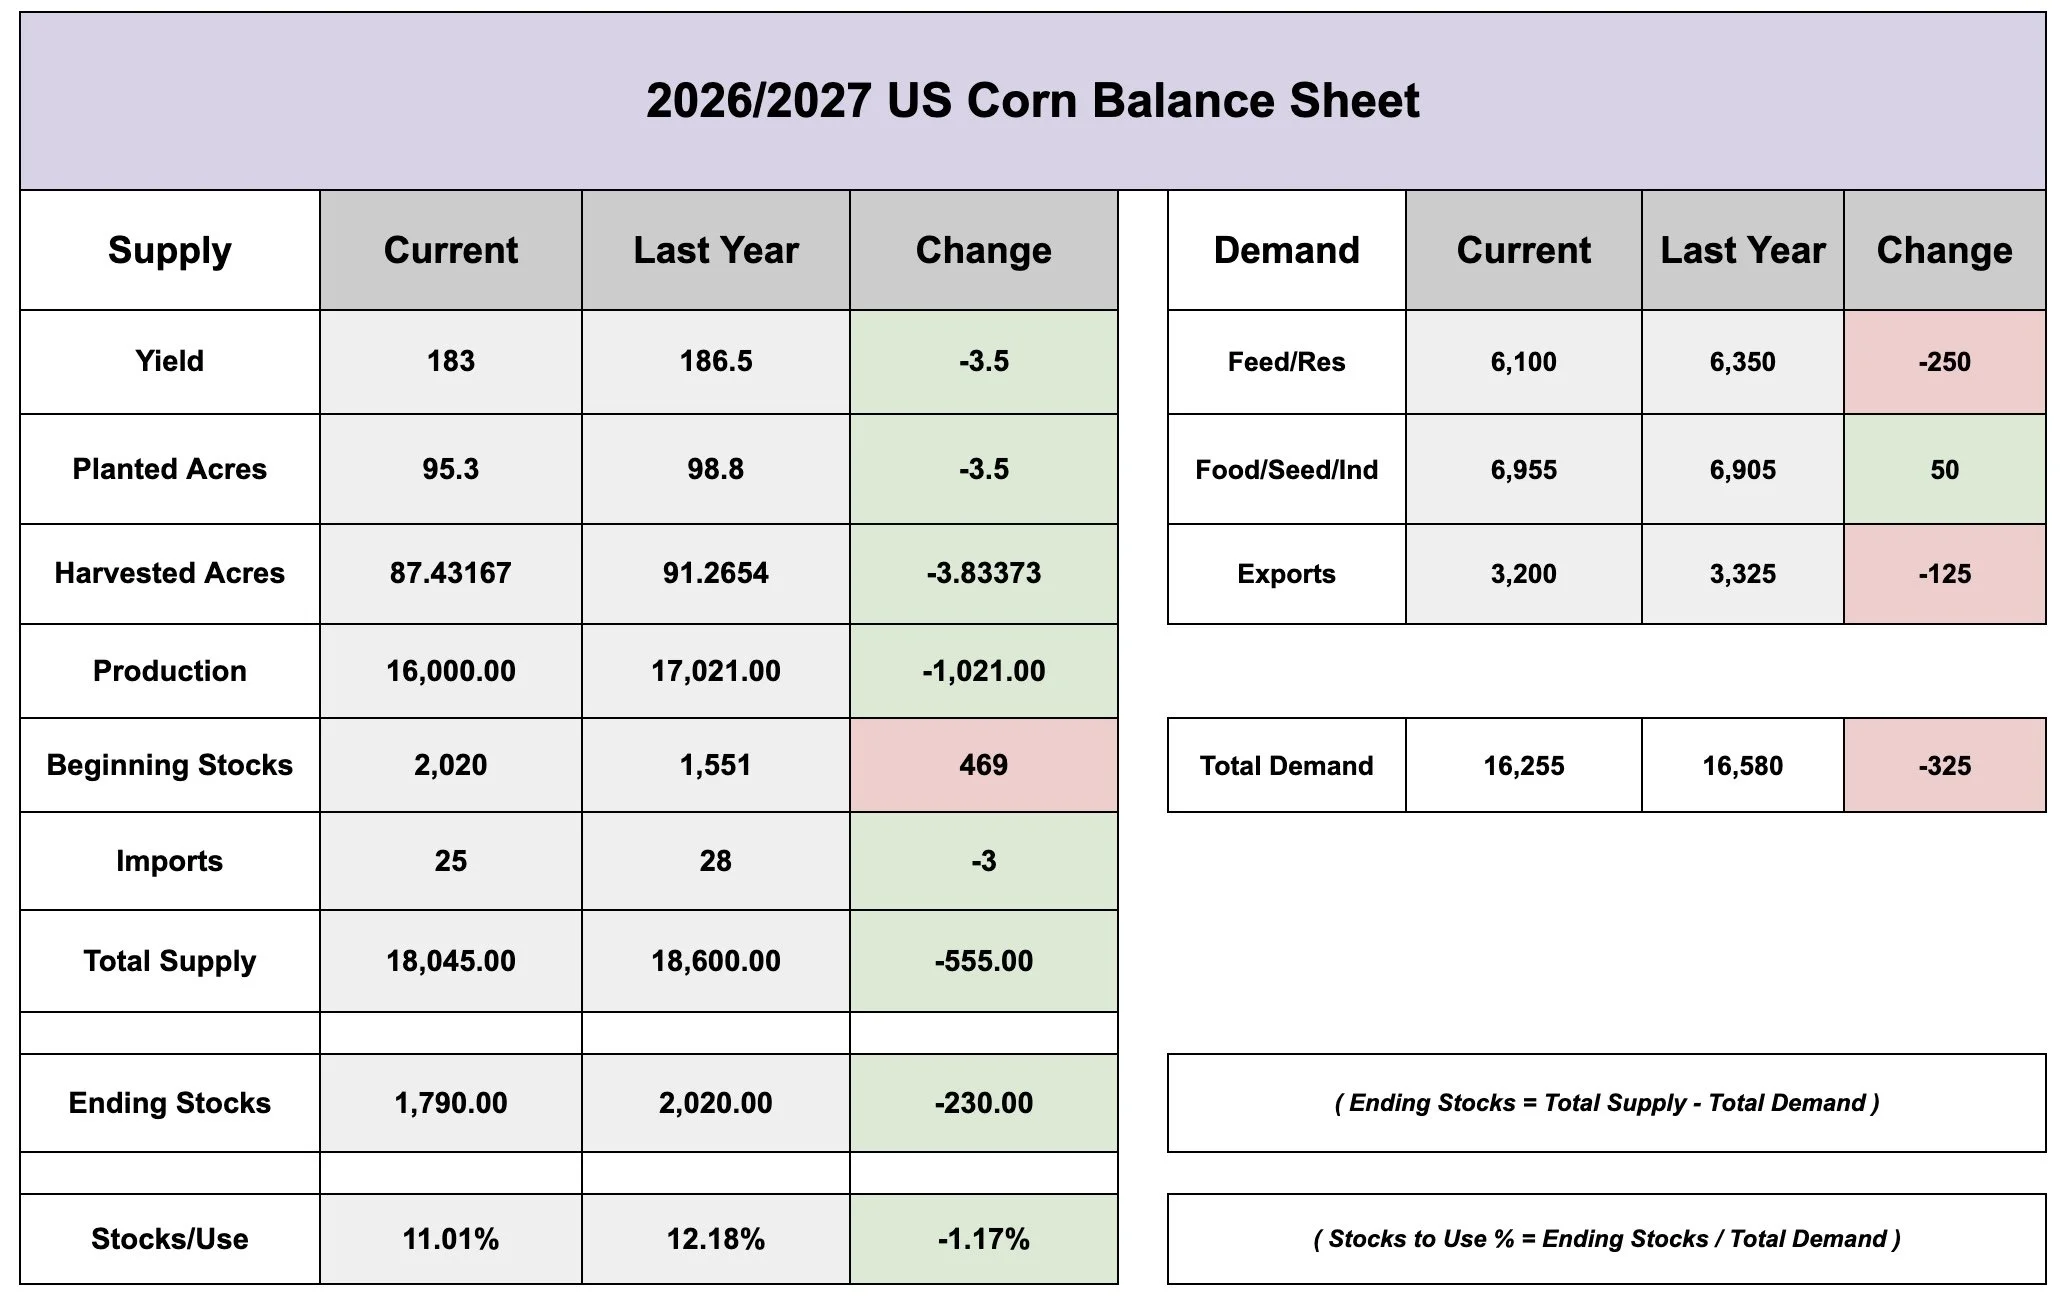
If we look at how the old crop and new crop balance sheets stack up with one another.
We have 3.5 million less acres this year.
We won’t be getting a 186.5 yield.
The USDA expects export demand to be worse, but that's not necessarily a given.
How do you justify lower demand? With higher prices.
You can’t say we are going to export less just because supply is less. Demand doesn’t just vanish without a reason. That reason is usually higher prices.
There is a reason we've built all of this record demand at these levels. Cheap prices "eventually" cure cheap prices via demand.
Prices go to levels where we find demand.
So that's why the new crop situation is a lot friendly than the old crop situation, and why there is plenty of potential in new crop.
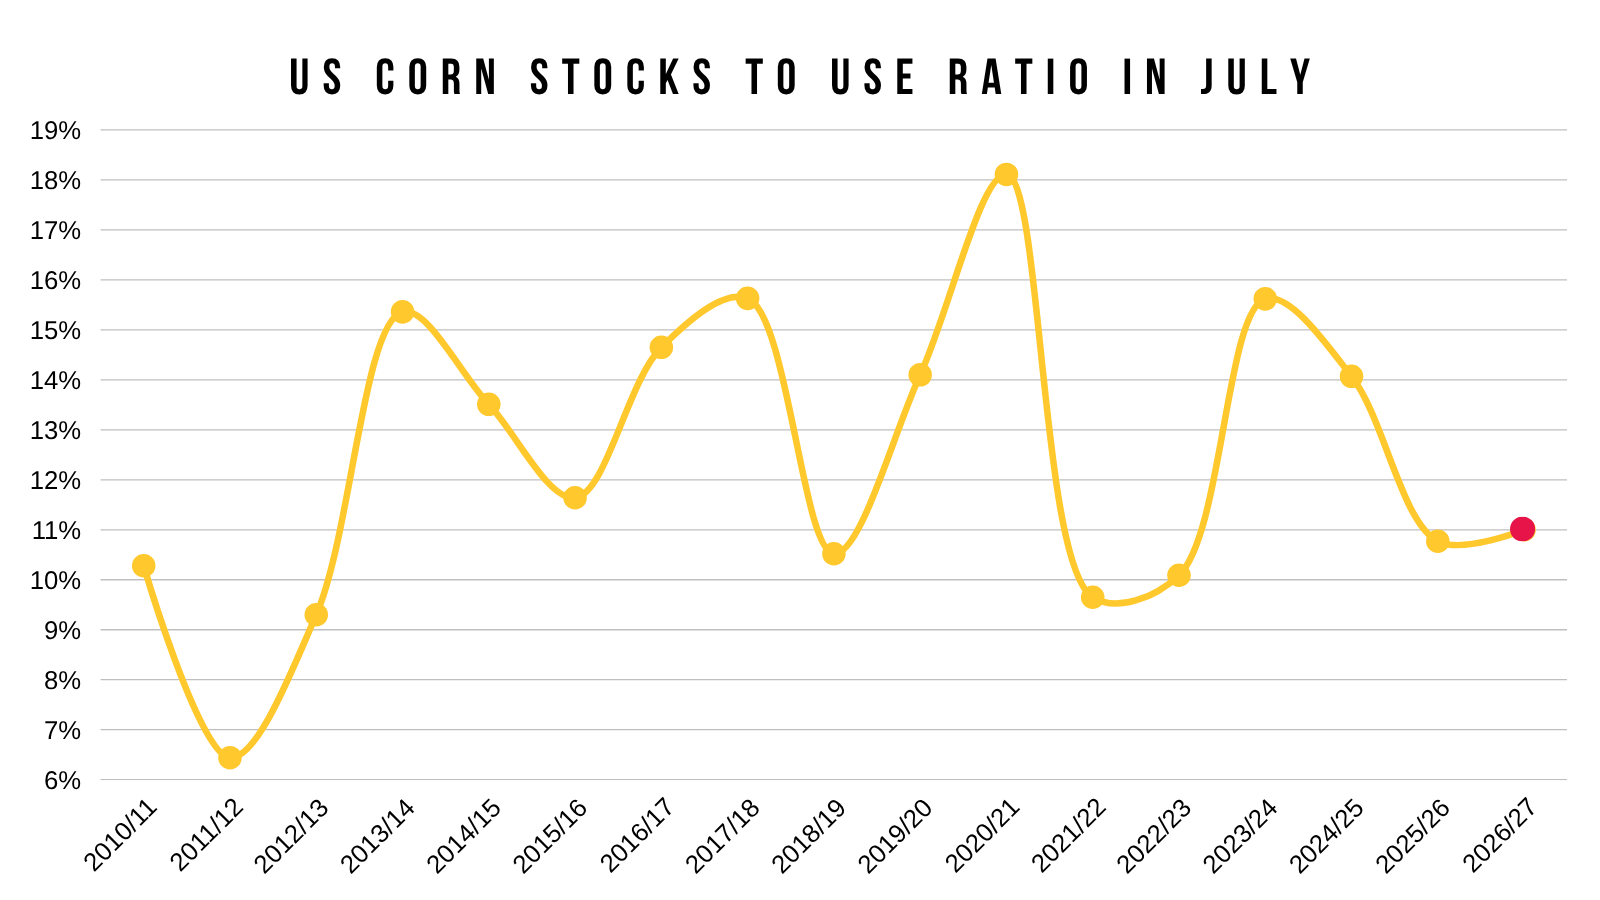
Here is where the past years stocks to use ratio for new crop was in July.
We are starting at some of the tightest we've seen in July.
Altough, you could have said the same thing last year. But then the USDA ended up raising yield from 181 up to 186.5 bpa.
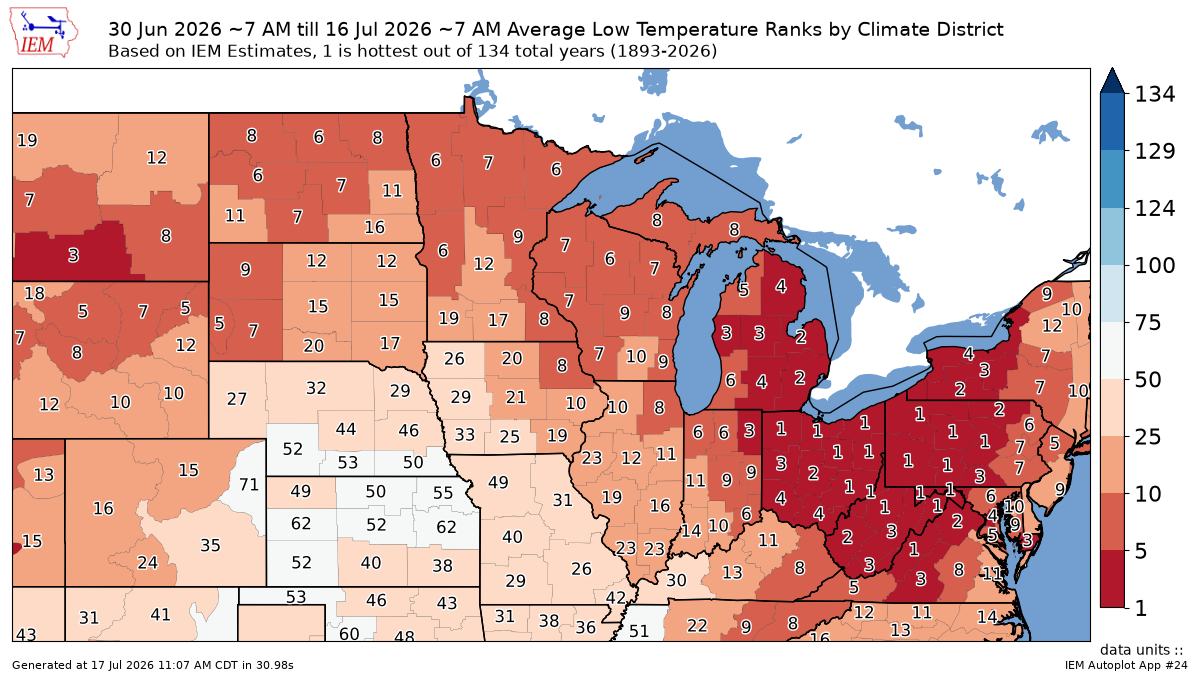
Here is the night time temp ranks for the month of July.
Some areas saw the hottest nights ever.
I can’t imagine this won’t have a slight impact.
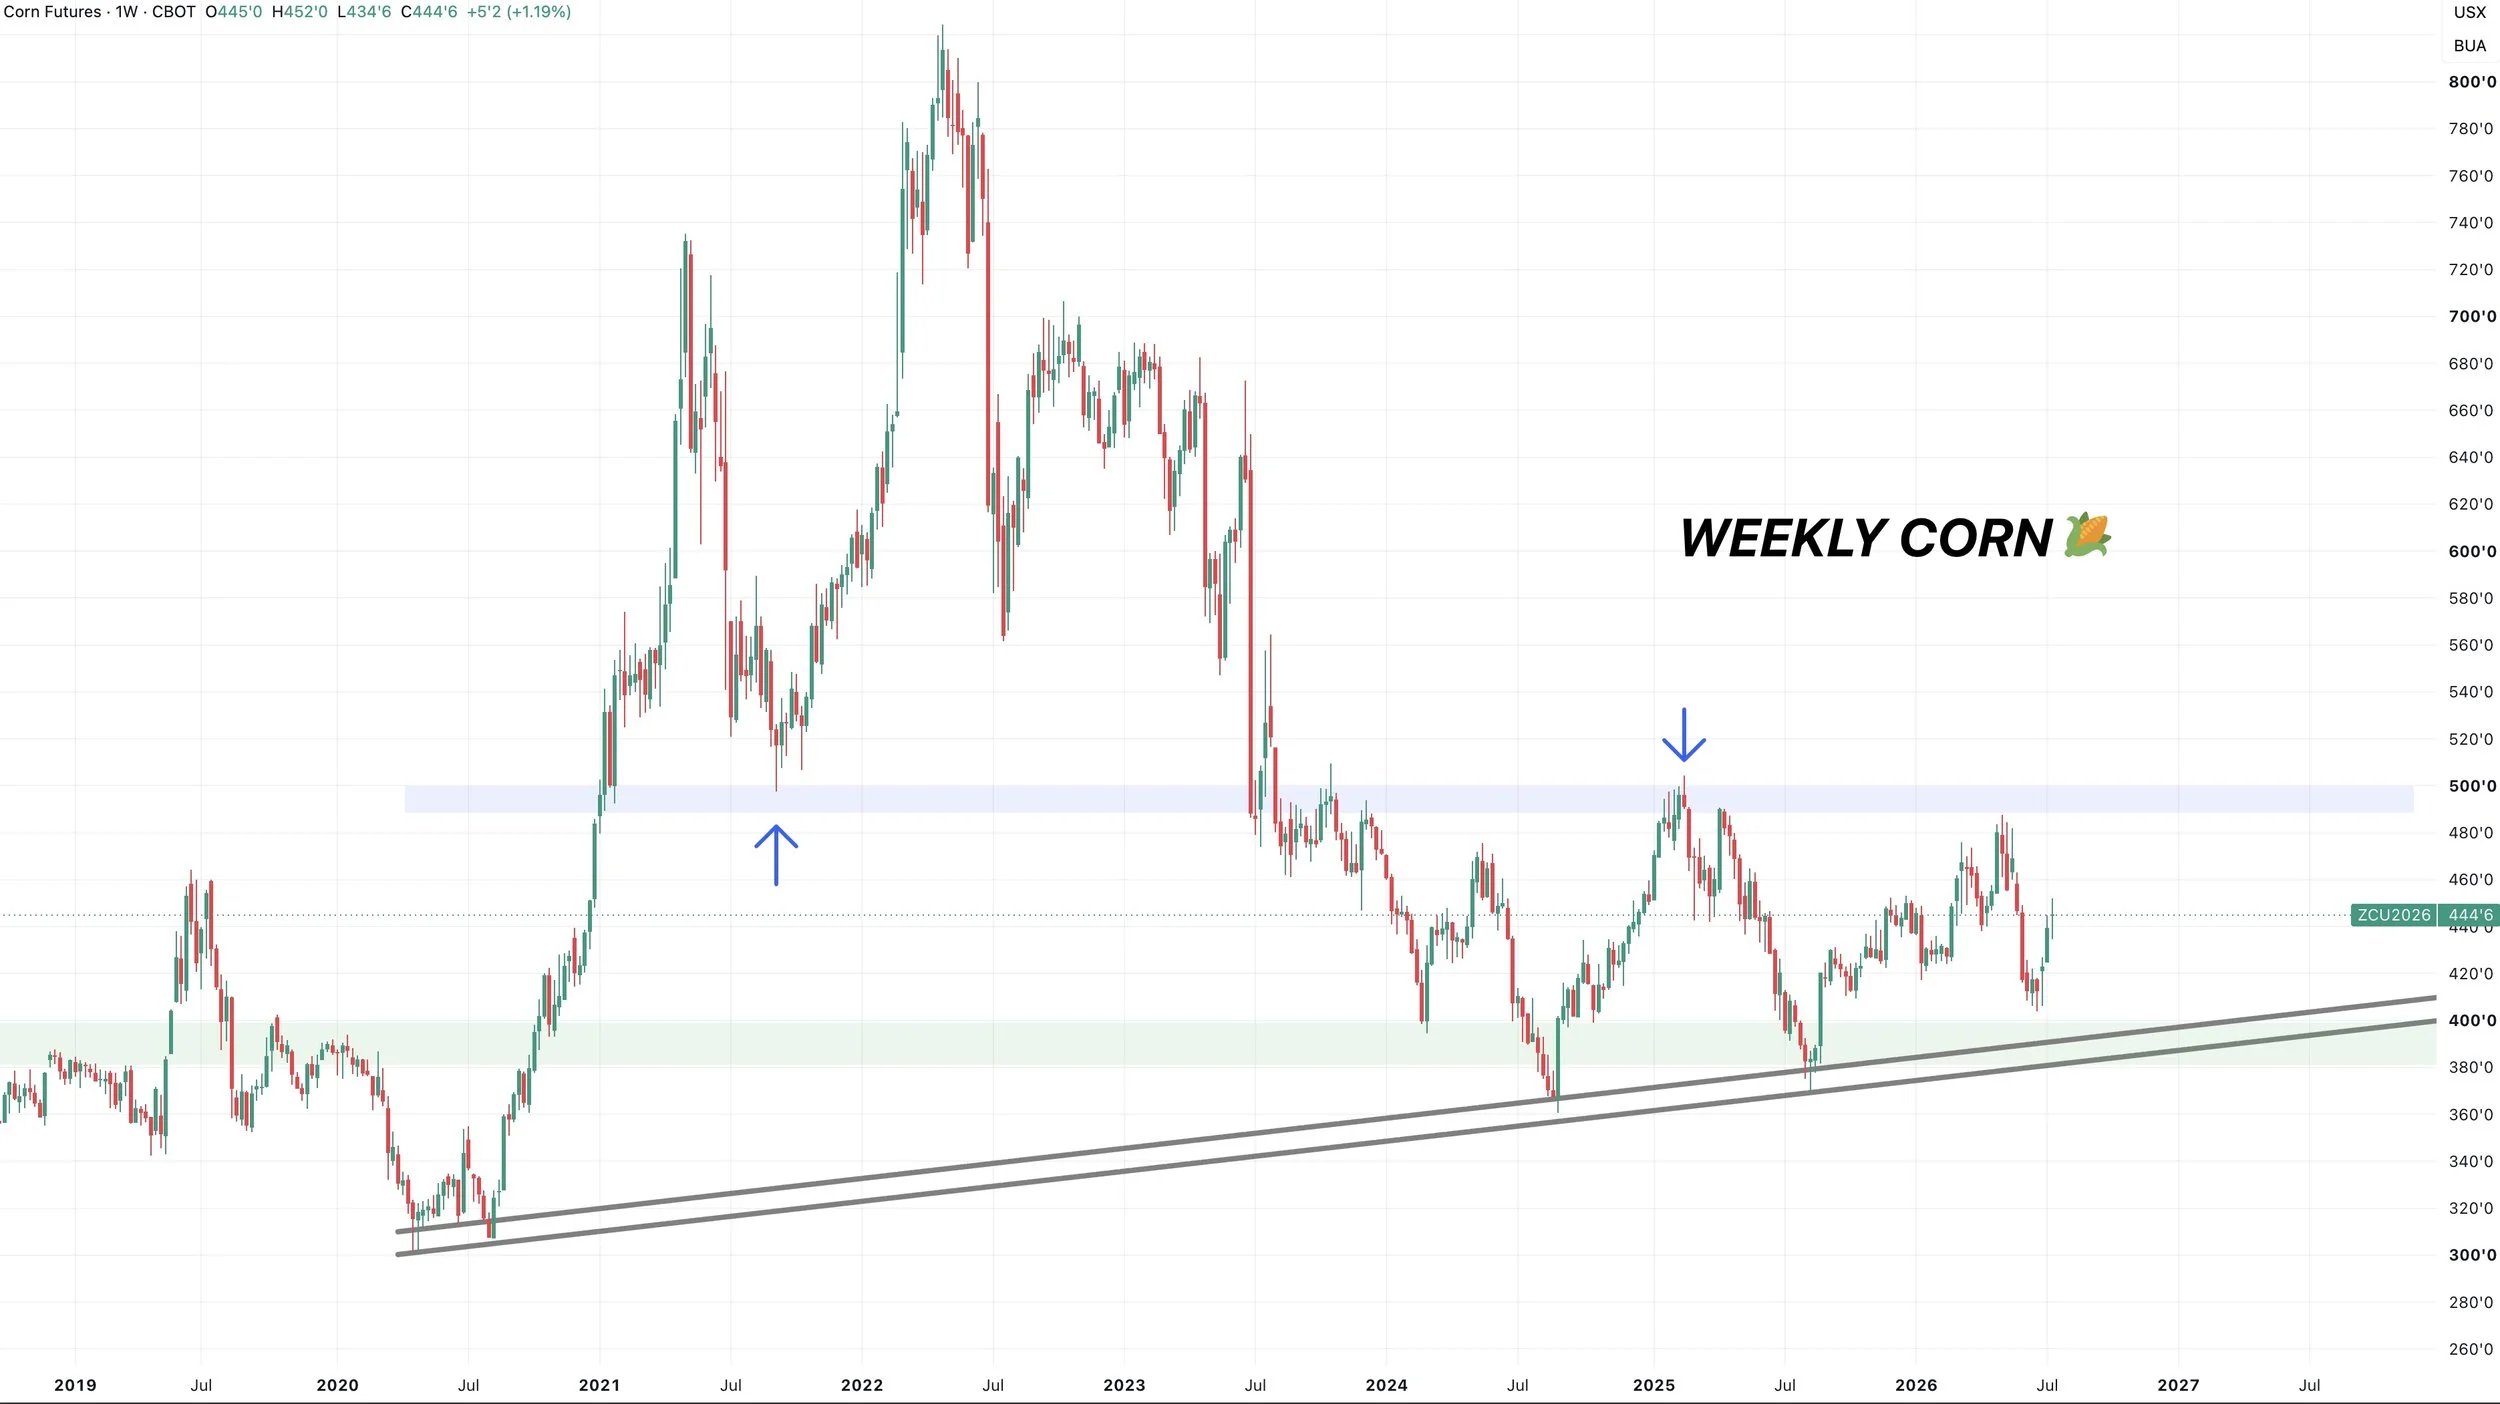
Short term, I am still cautious. It might take an outside factor for this rally to continue into harvest.
Seasonally, this is when we tend to struggle. Going into harvest when supply is the most abundant.
We have some weather premium already built in. We are 40 cents off the lows.
Bulls still need to be fed.
So it might take some outside help for this market to keep pushing higher. Which adds some concern.
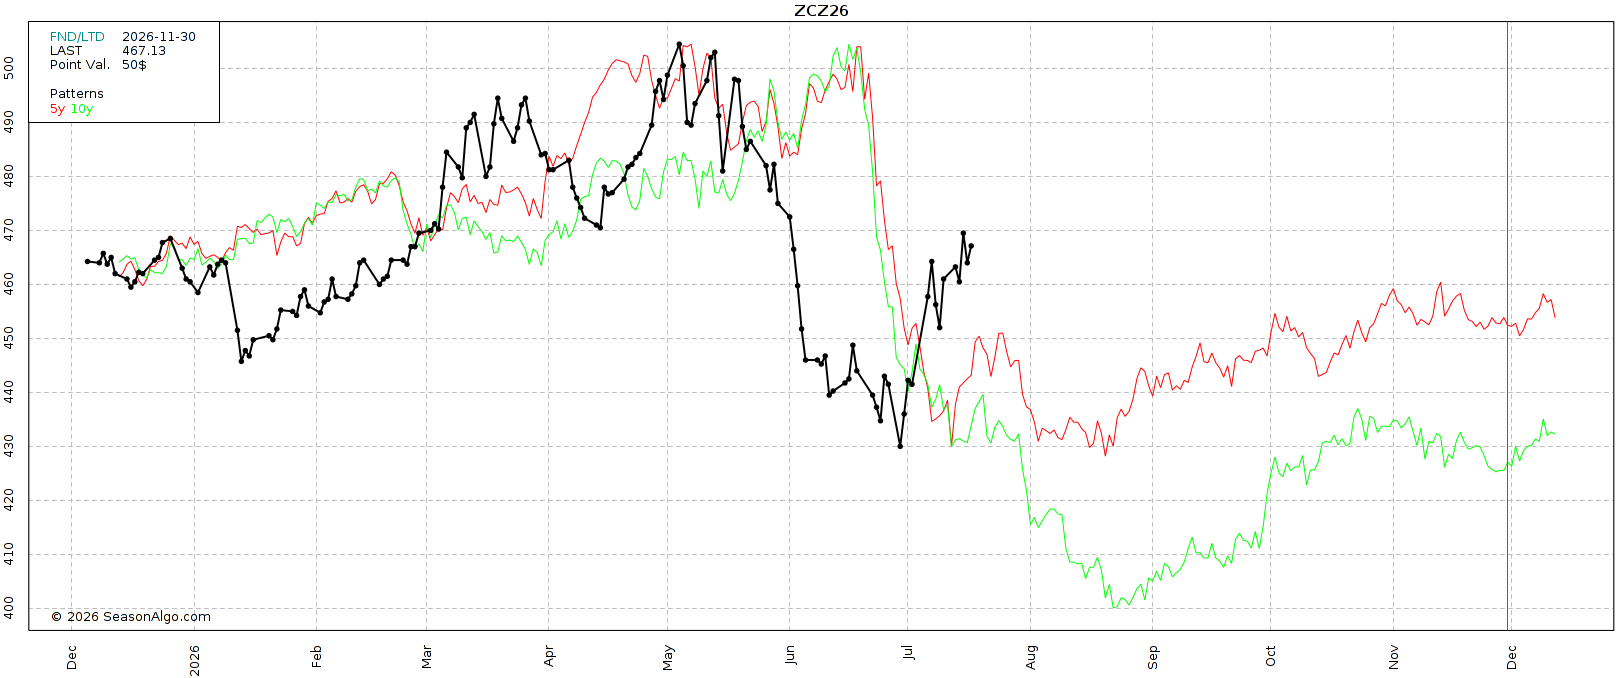
If it wasn’t for wheat, we would have probably would not have seen the moves we saw earlier this week with the cooler forecasts.
So short term, if corn wants to head higher, wheat might need to lead the way.
Unless of course we see some further issues with weather. Or if we get a big wild card such as China.
If the Black Sea situation continues, and wheat continues to rally, corn will follow along for the ride.
If not, we might lack some catalysts to justify us going a lot higher right now.
Although I am cautious short term, I do think there are several paths for new crop to go higher down the road.
Big Picture Chart:
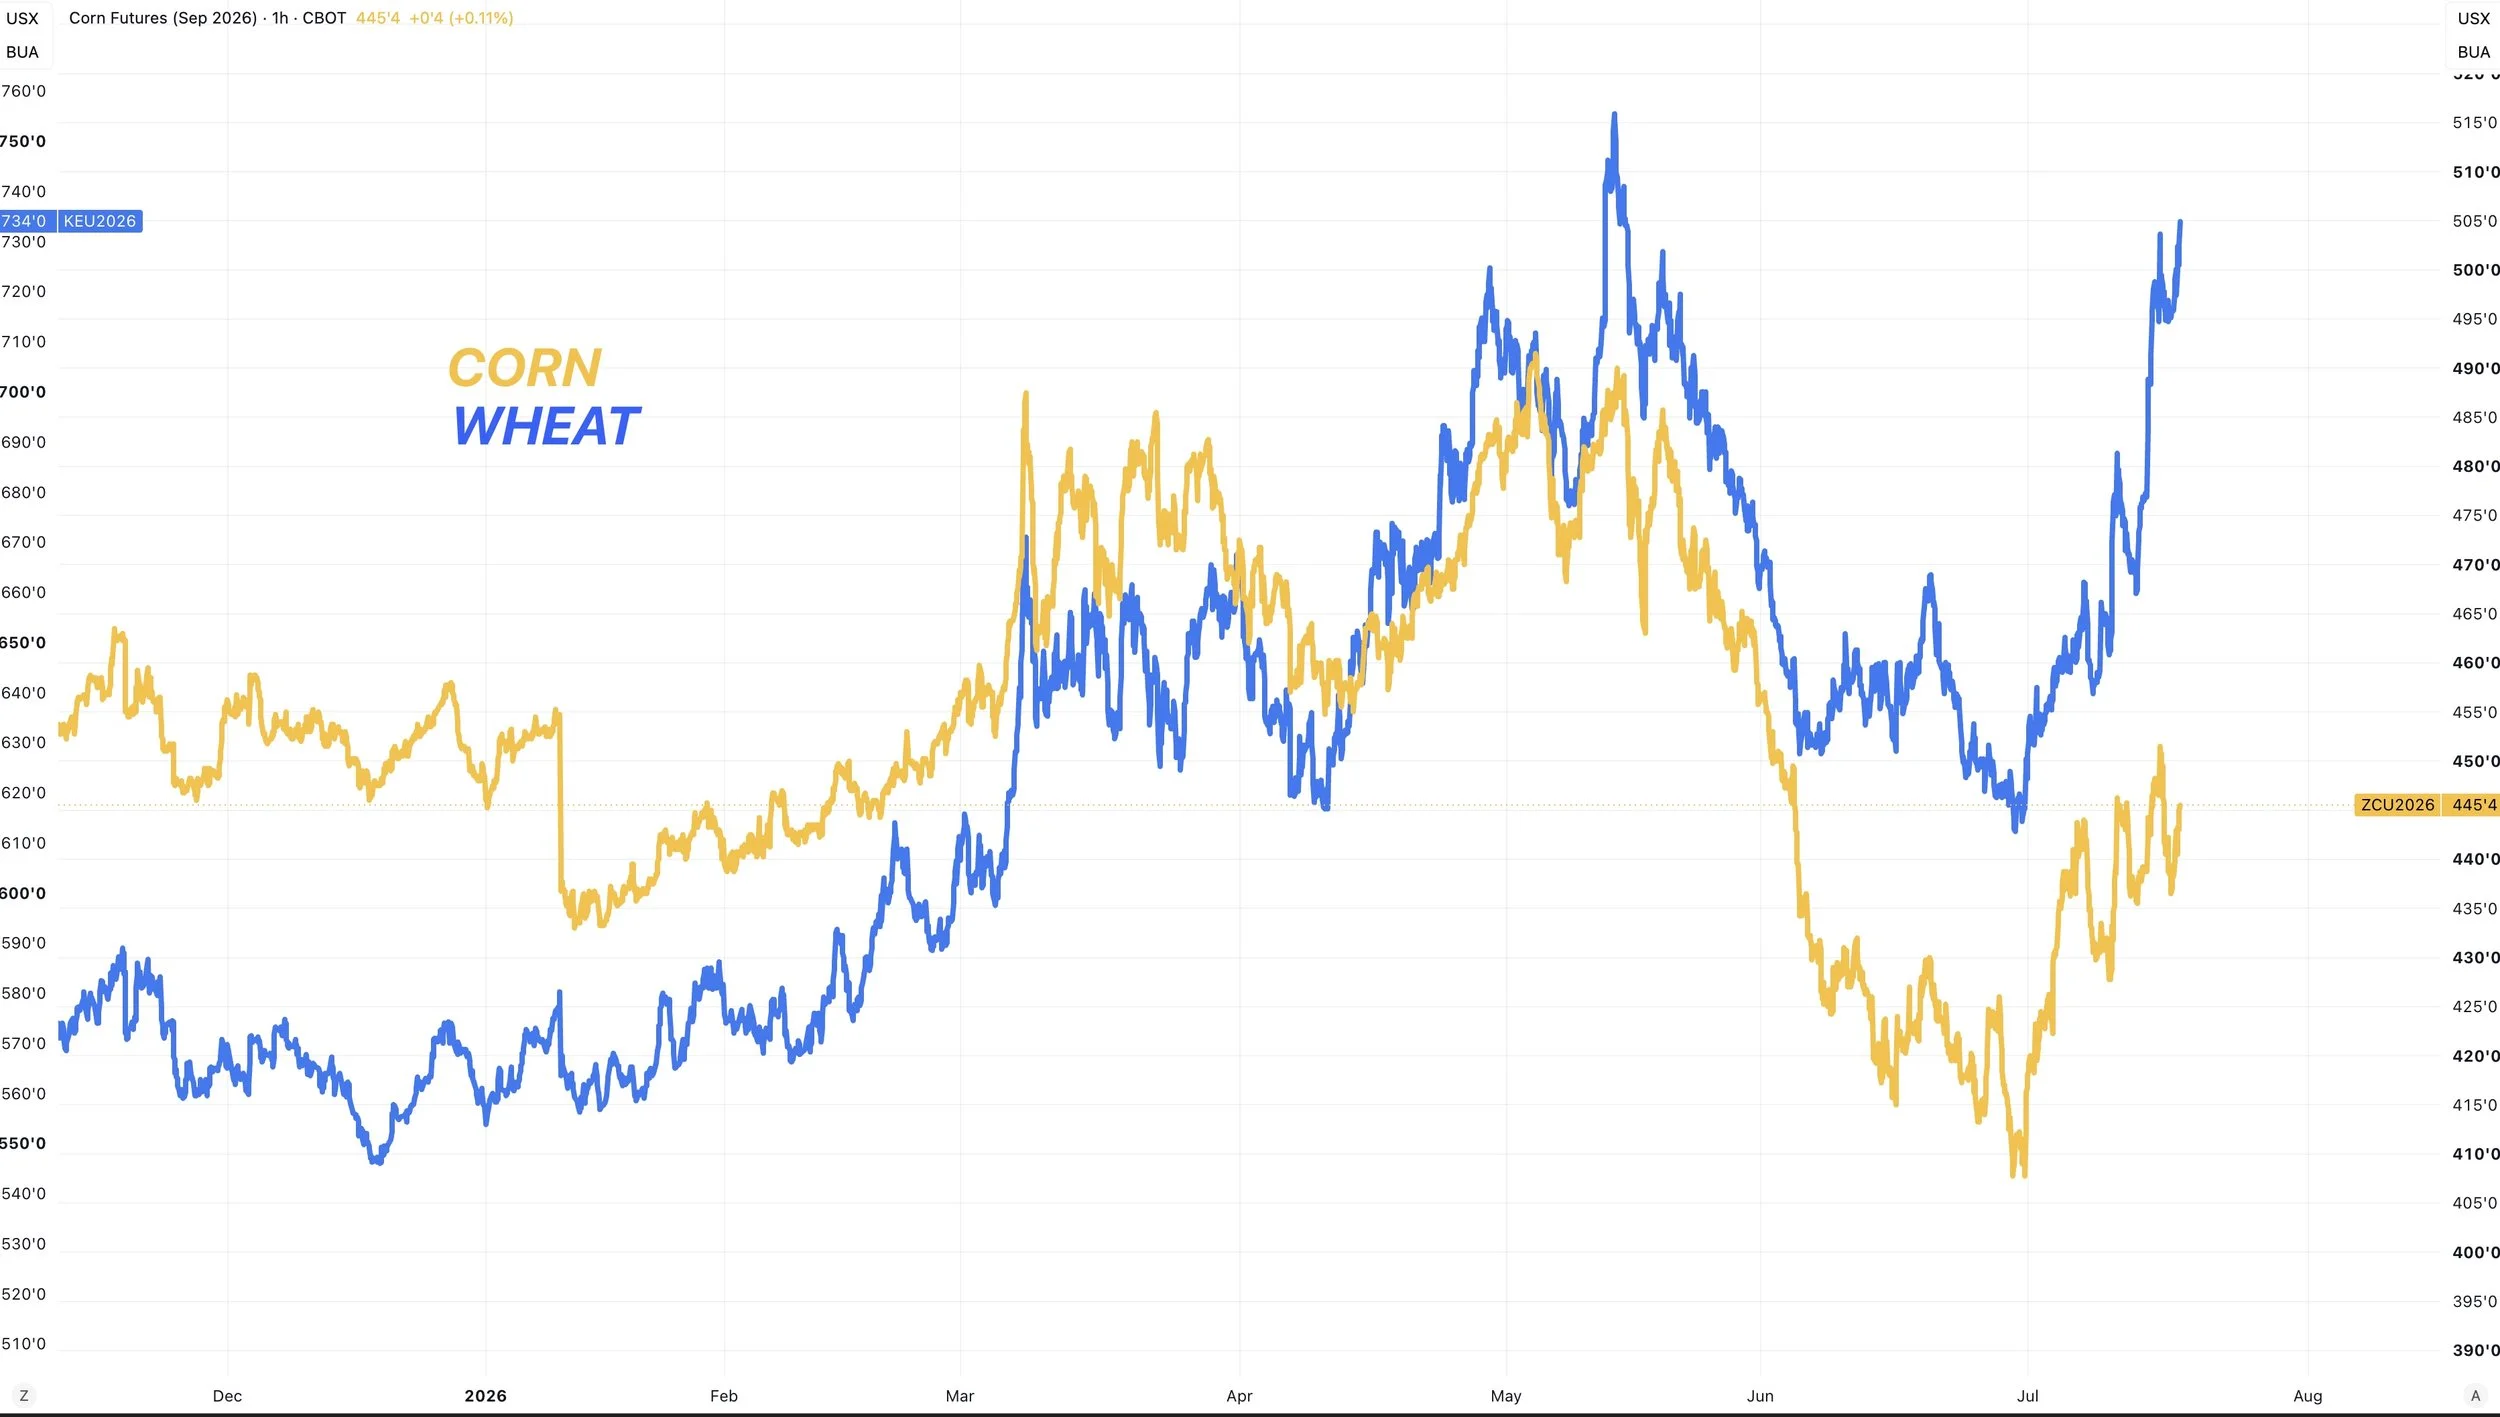
The big level to watch when taking a big picture approach is going to be $5.00
If you ever break above $5.00, then it would be an indication that corn is truly starting a long-term uptrend.
That would be our first higher high of the entire bear market.
It's where we topped out last year.
It's where we bottomed in 2021.
Break that there is upside, and we would officially be in a long-term uptrend.
Sep Corn Chart:
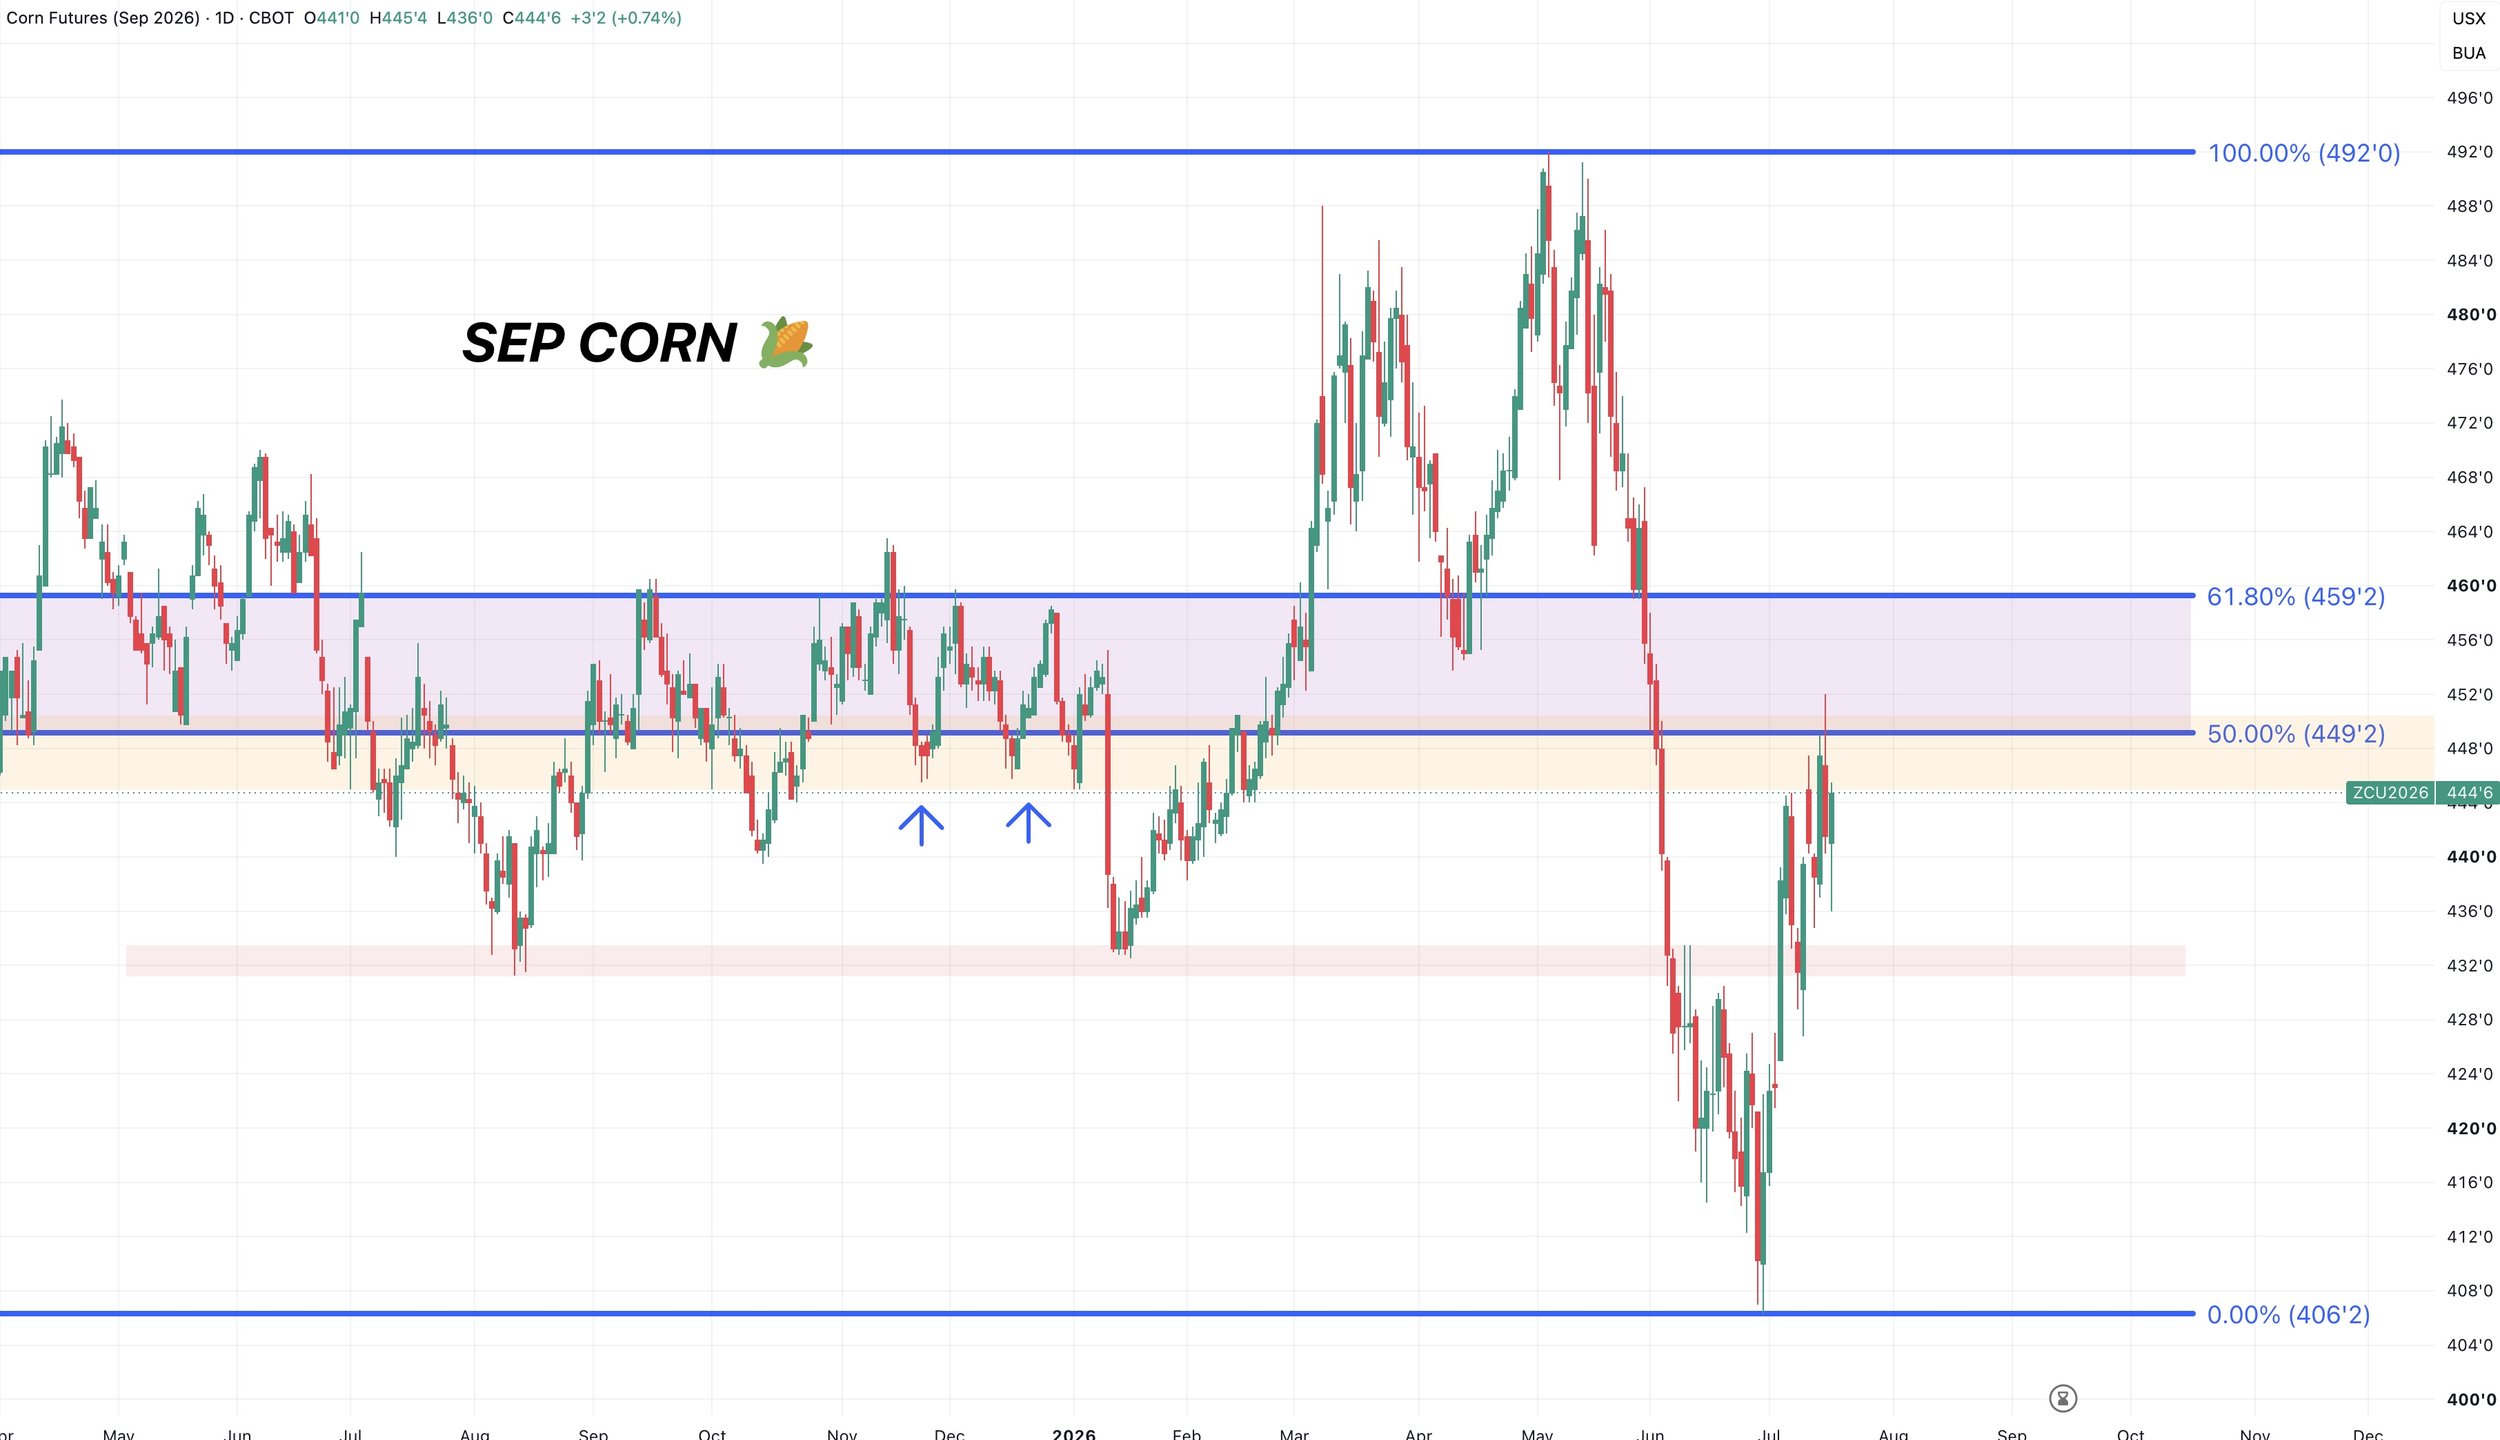
We are still battling a key level.
We clawed back 50% of the entire sell off.
We're up against that key support from fall.
If this is simply a relief bounce, this is an area we'd expect to struggle. The overall trend is still lower unless you break above $4.59 and the 61.8% level.
So it still makes sense to defend this level if you have not.
Dec Corn Chart:
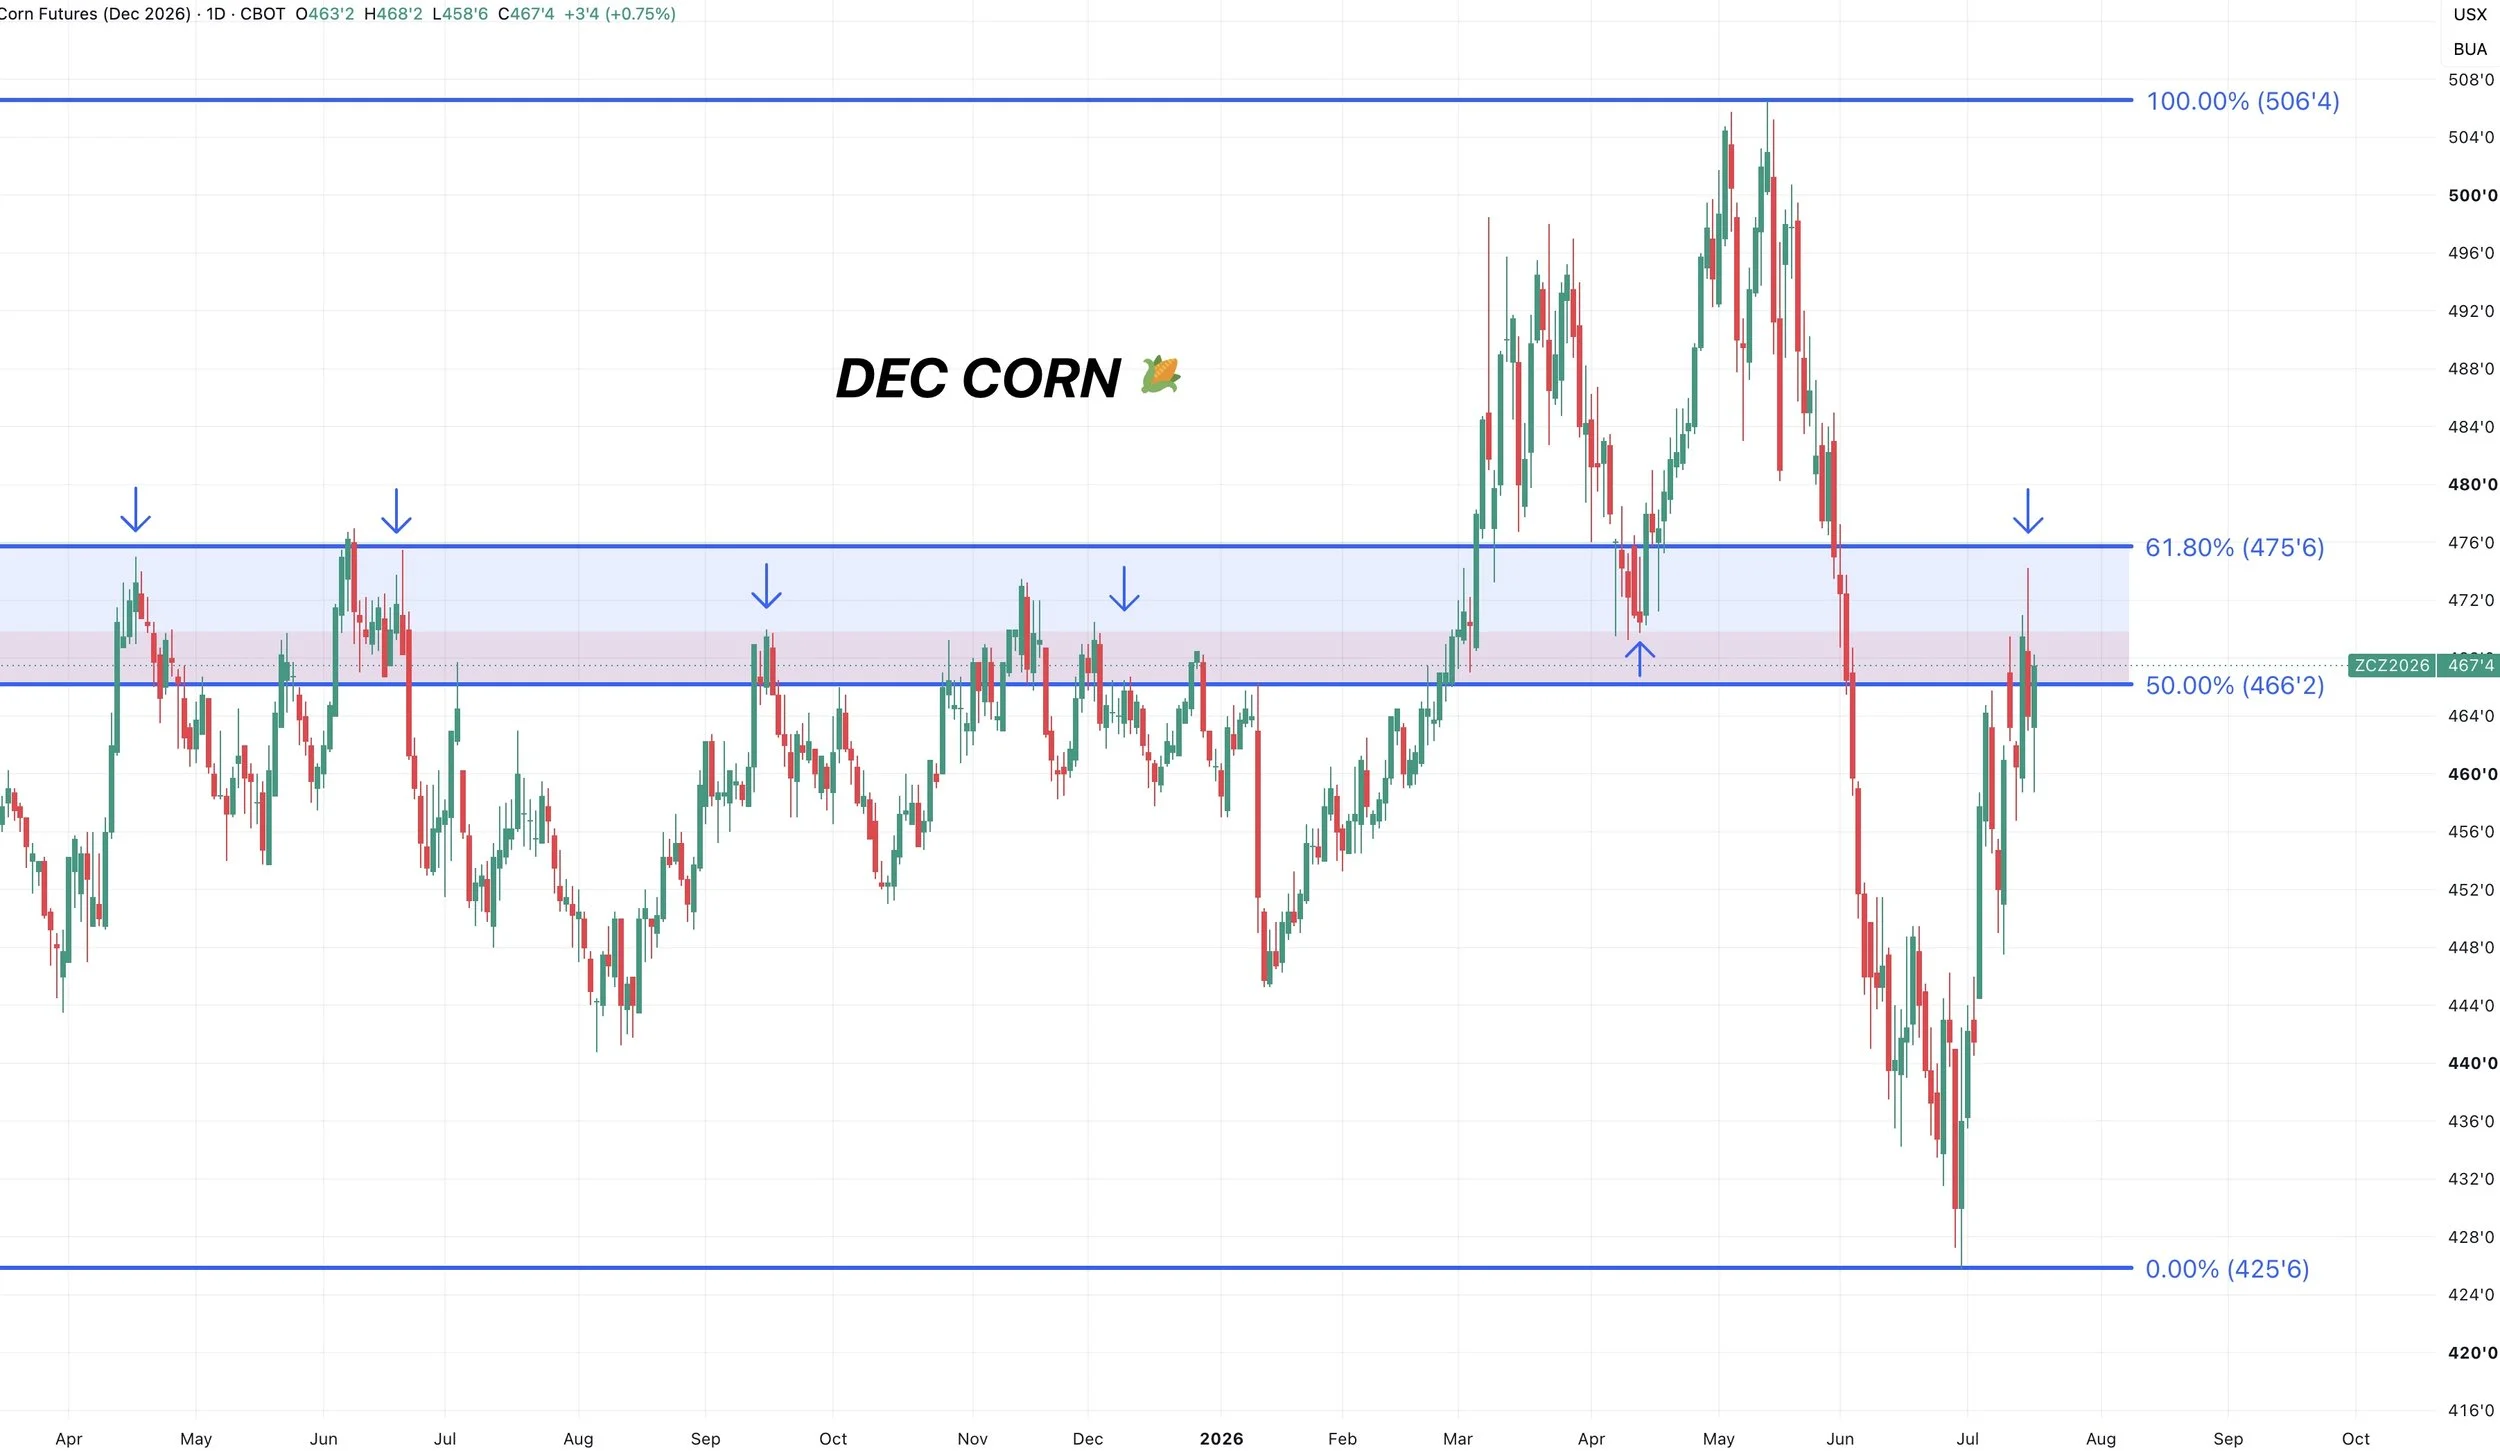
We followed up yesterday’s disappointment with a nice day today. Rallying nearly 10 cents off the lows.
Overall, if this is a relief bounce this is where we'd still expect us to struggle.
We are smack dab in the golden zone. Which is often a decision point. It's where the market decides this is just a bounce before heading lower, or this is the start of something more.
The overall trend in corn remains lower and this is viewed as a relief bounce unless we break above the 61.8% level at $4.67
Not only are we in the golden zone. But we are in an area of key support and resistance.
Right where we bounced in April. Right where we failed to break through last year countless times.
Hence the sell signal and hedge alert on Monday morning's gap higher.
If you are someone who knows you have to move something or needs to be more proactive, we want to protect this levels.
One great way to do so is simply by utilizing puts to keep your upside open while securing a floor.
If you are someone with plenty of time on your hands, I don’t mind being a lot less aggresive as I still see a story long term.
Soybeans
US vs World Situation:
I've went over how the US situation impacts the corn market.
So let's take a look at soybeans.
This chart shows soybean prices vs our US stocks to use ratio.
What do we normally need to see to get $13.00 or higher soybeans?
During the last bull market, the stocks to use ratio was around 6%. Currently the tightest in a few years, but not quiet to that level yet.
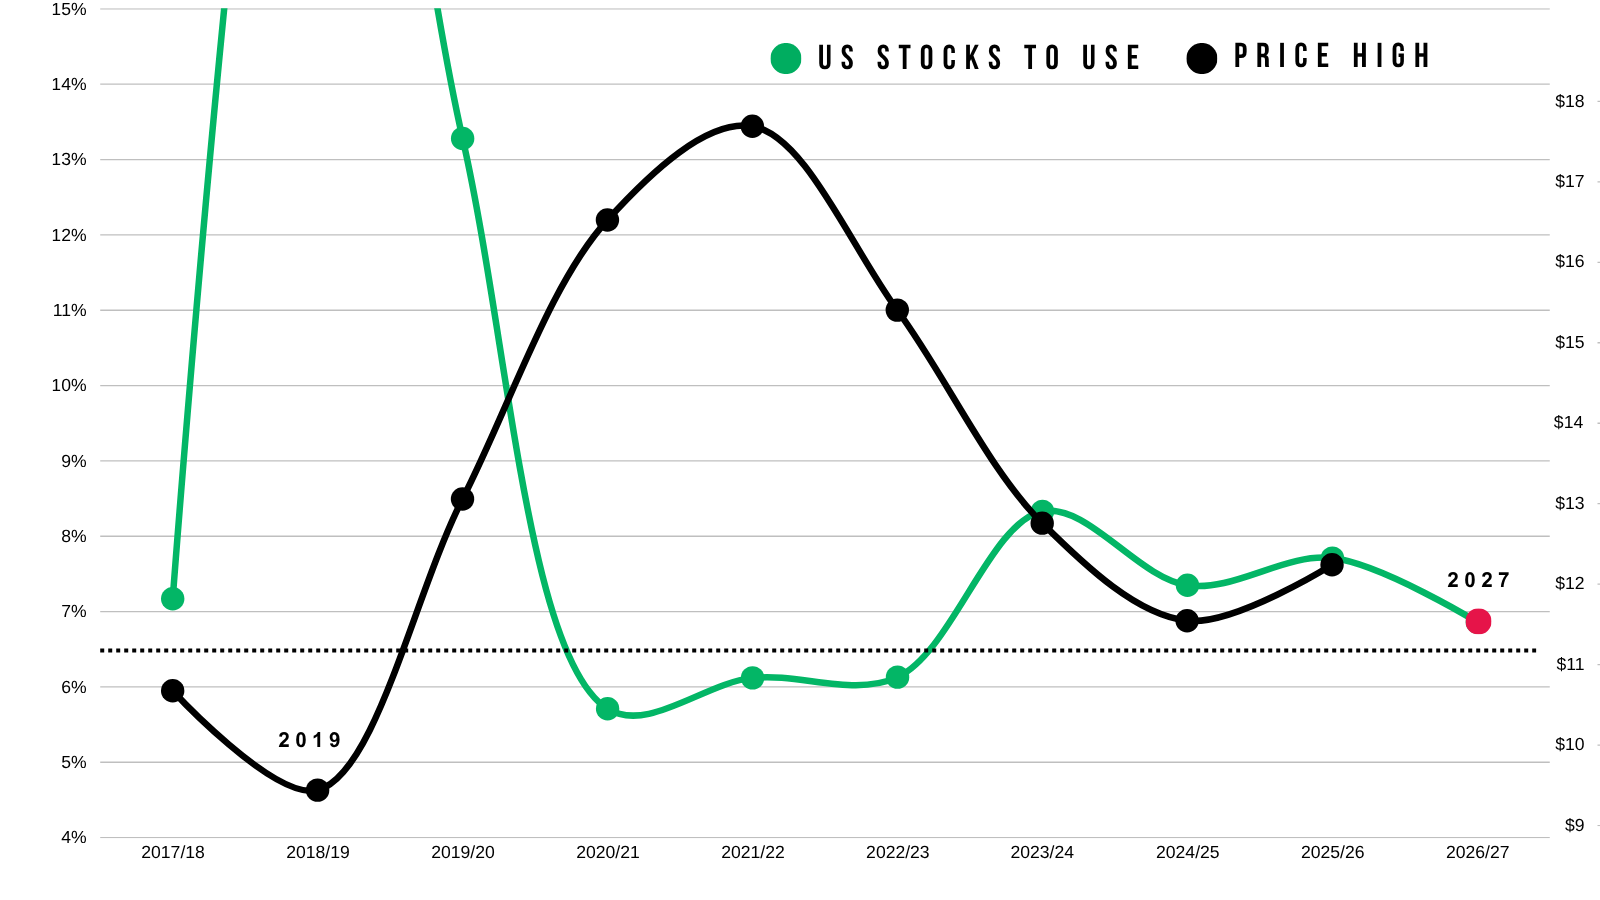
If you look at the current balance sheet, it's sitting right at 7%.
On the verge of entering that "bullish" territory.
I also included what could happen if yield slips. It drastically cuts into the carryout.
So based on prior years, even if the balance sheet falls slightly, we do enter into a territory that has been associated with a lot friendlier story.
Just for example, a 51 bpa yield cuts the balance sheet in half. Which wouldn’t make sense and probably would not happen.
If that happened, we would have to ration demand lower via higher prices to prevent the balance sheet from getting too tight.
So there is no room for error in soybeans.
If yield ends up 53 bpa, no we don’t have to get some super tight balance sheet and a lot higher prices. But the potential is certainly there.
This balance sheet is already tight enough to where it should prevent soybeans from just completely falling apart.
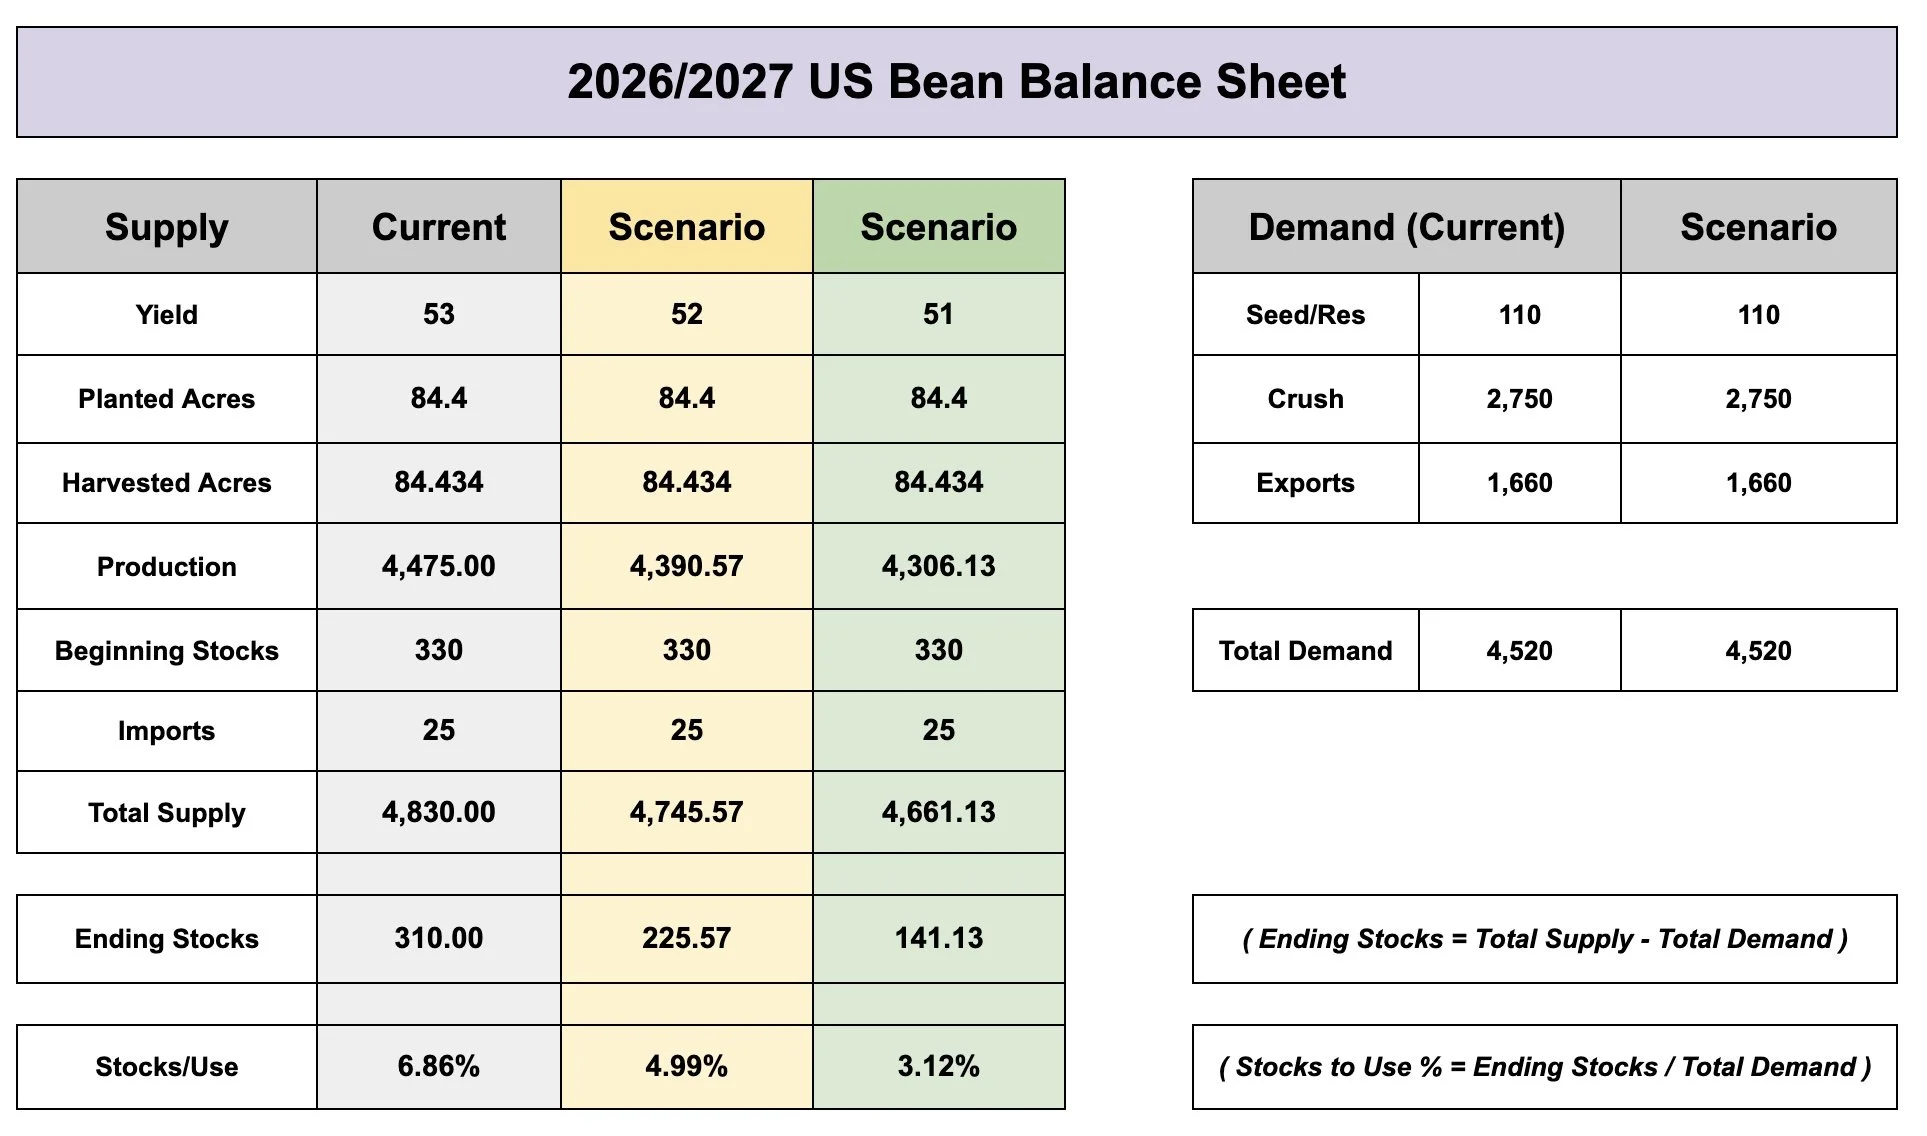
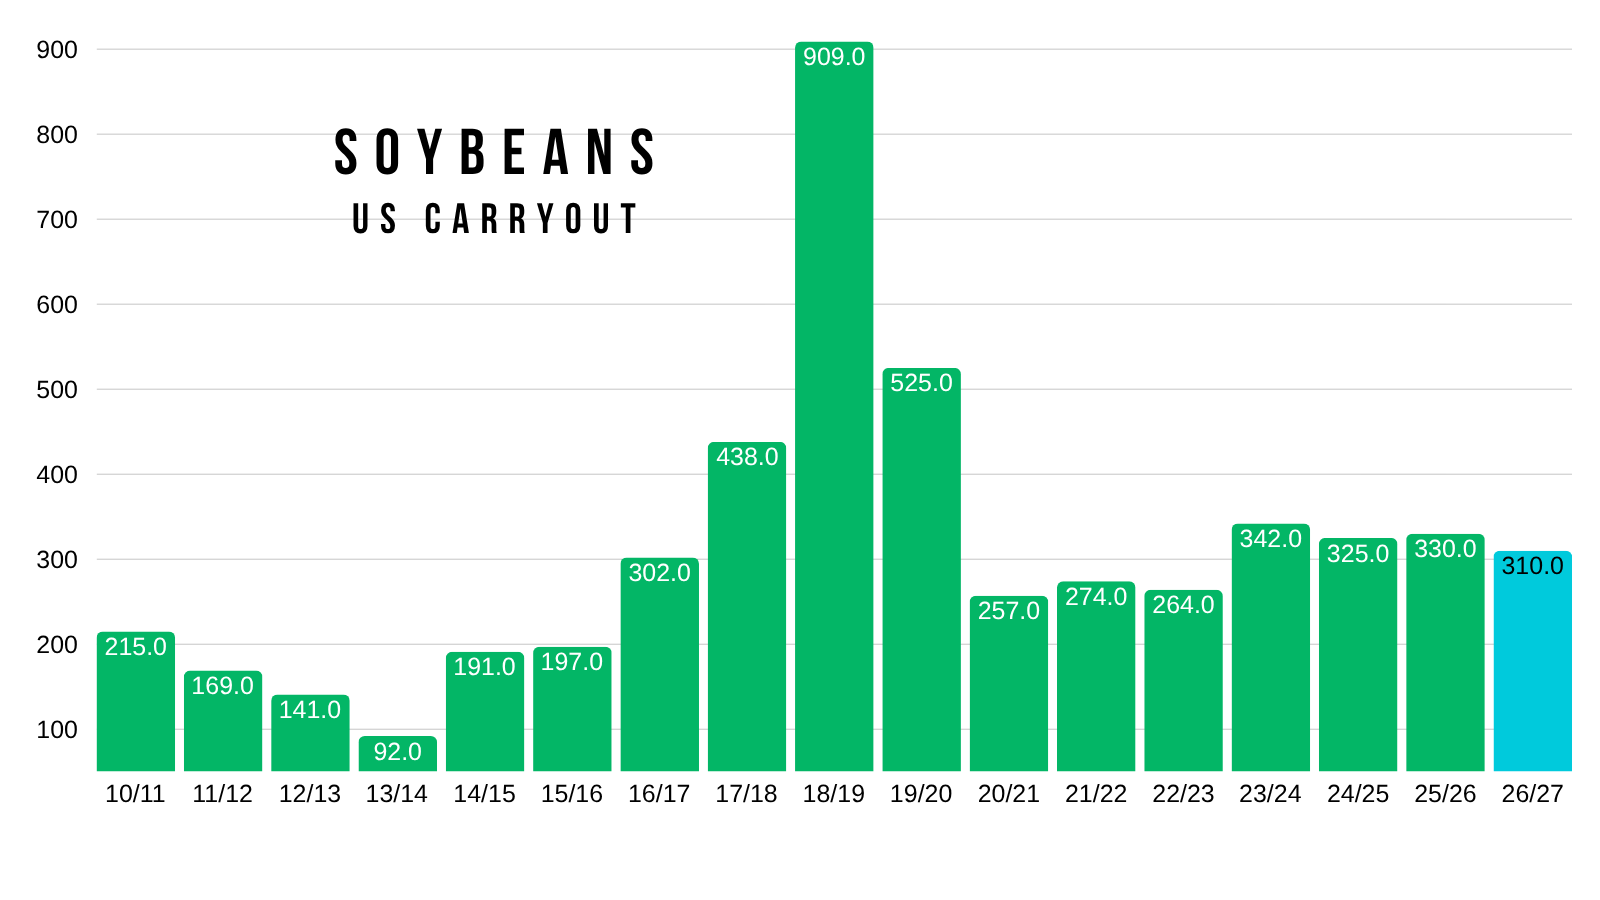
We have a carryout of 310 million in new crop right now. Without knowing what the crop looks like.
The last time we saw carryout below 300 million was the bull market. Something to note.
We are not there yet.
But there are "possible" paths for that to happen IF yield is not 53 bpa.
That's the story for bulls.
The world situation will also have a big impact.
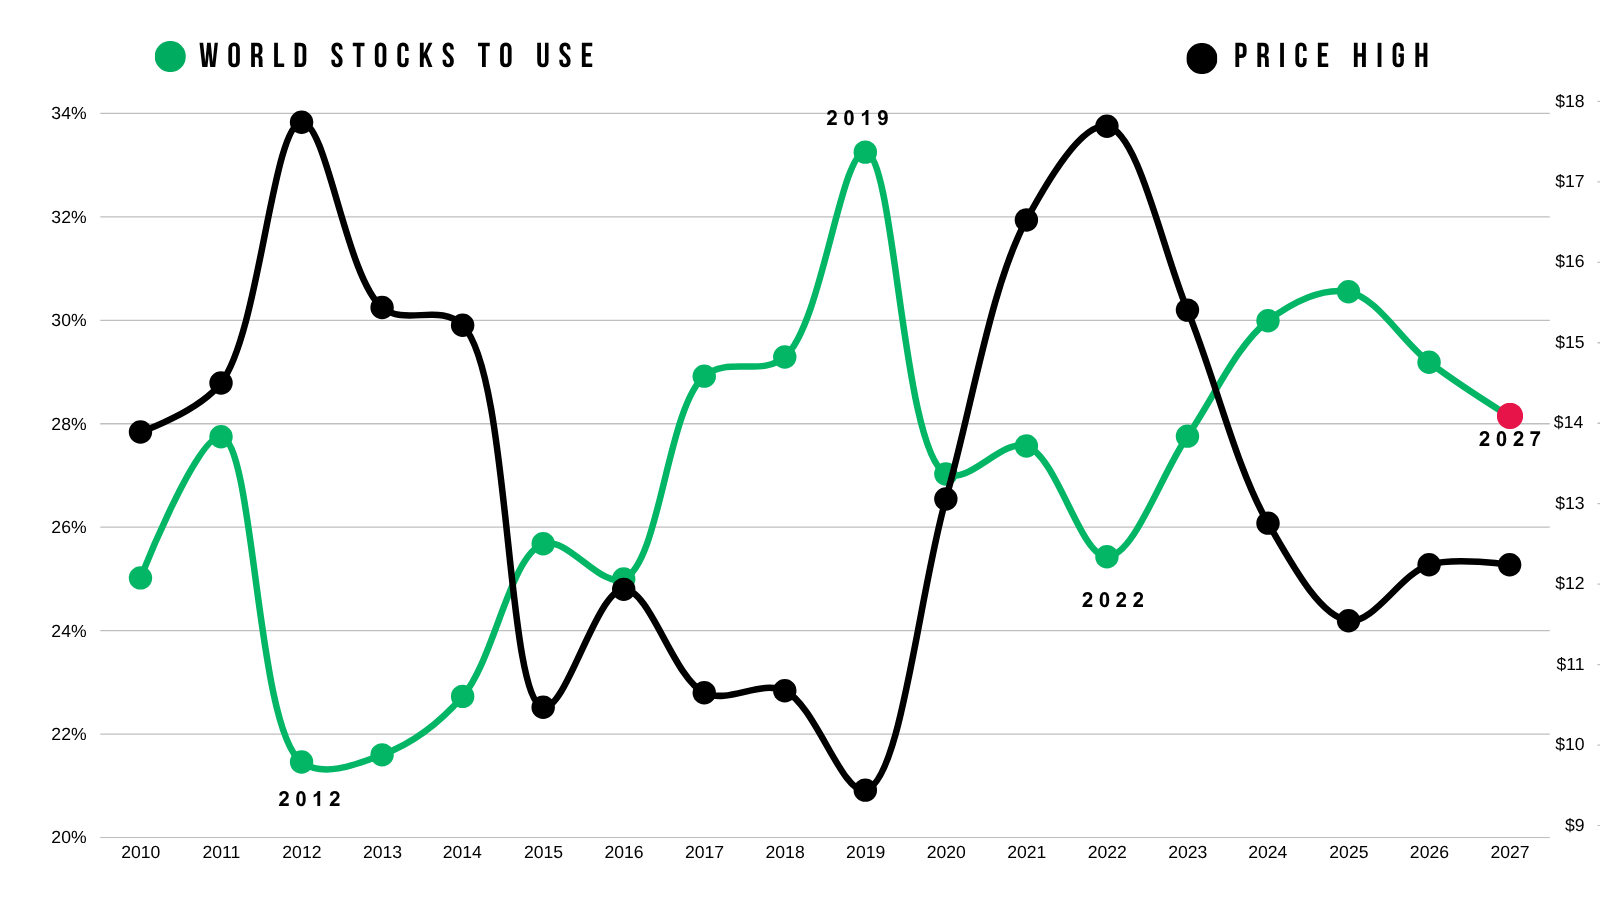
Unlike in corn where it's sitting at decade lows and not having a big impact, the world balance sheet does have an impact on soybeans.
Given that the US is not the only big player in soybeans like we are in corn.
I'd argue this is more important than the US situation.
The world situation is the tightest it has been in years. Not yet to 2022 type of levels, but clearly getting more friendly.
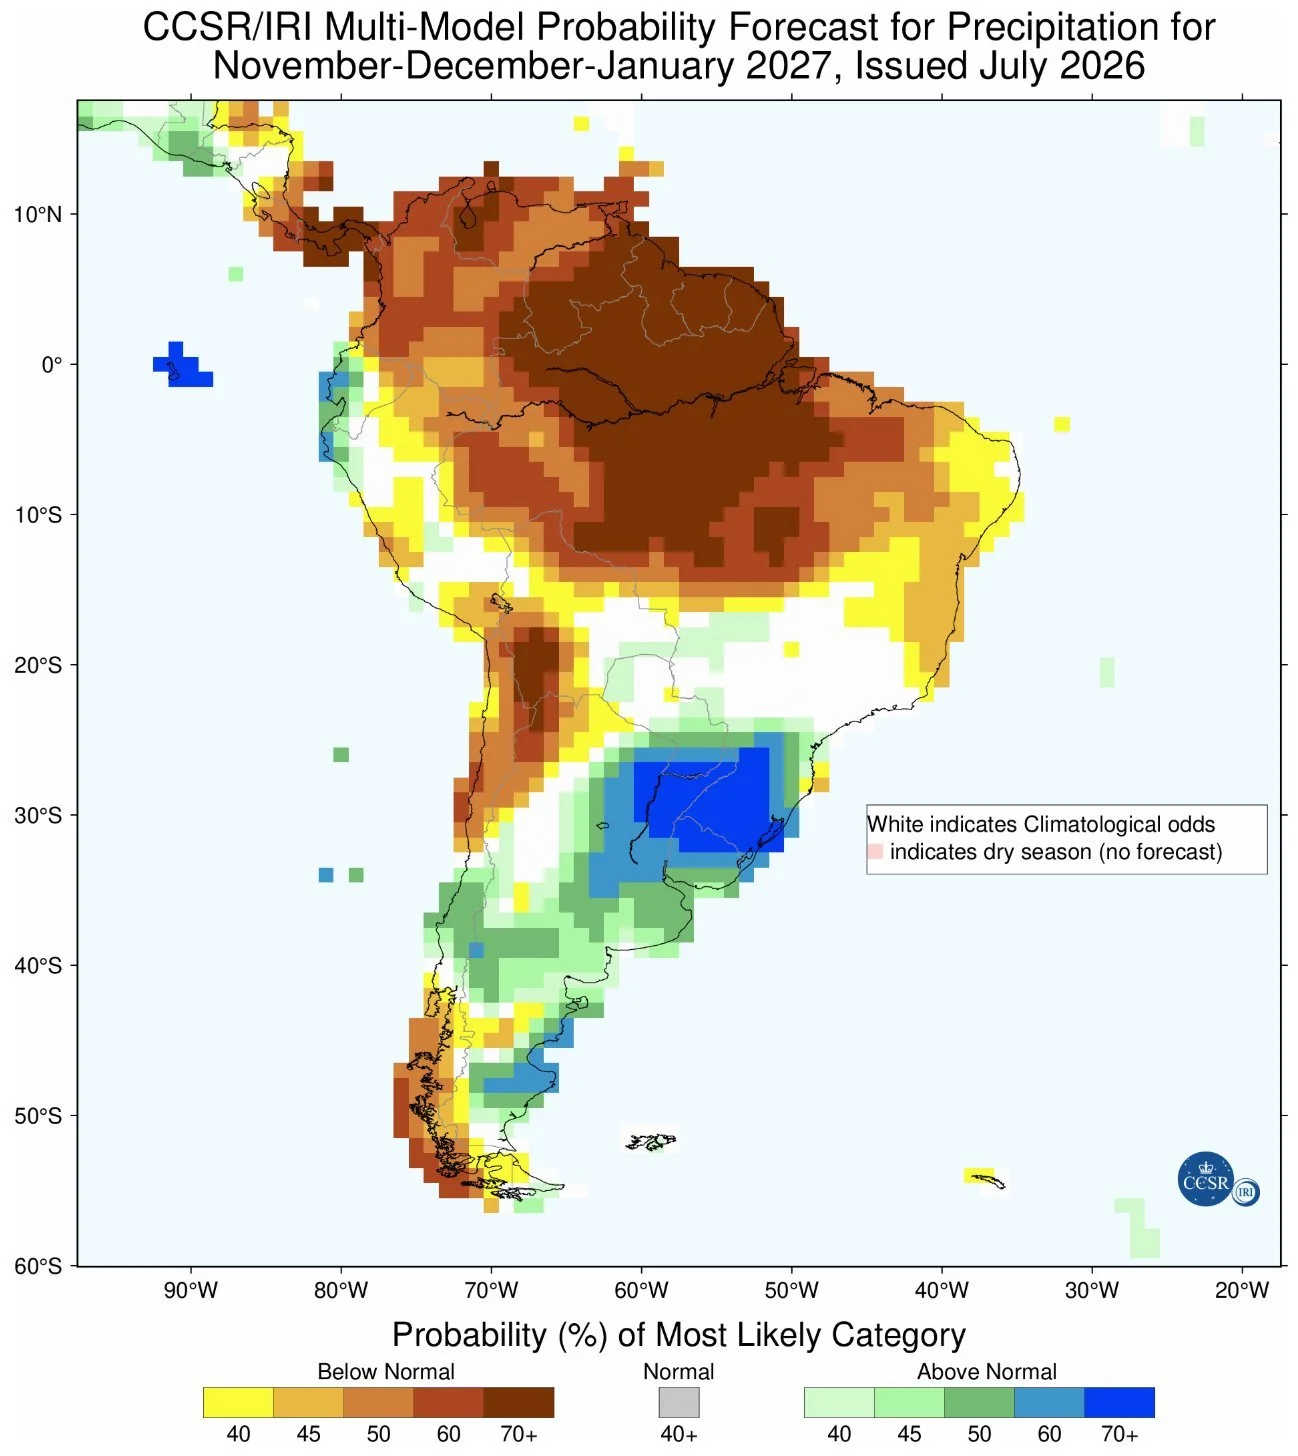
You can’t put any faith into these long term forecasts, but currently they are calling for a dry November to January for Brazil with the Super El Nino.
So that's definitely going to be something to keep on your radar.
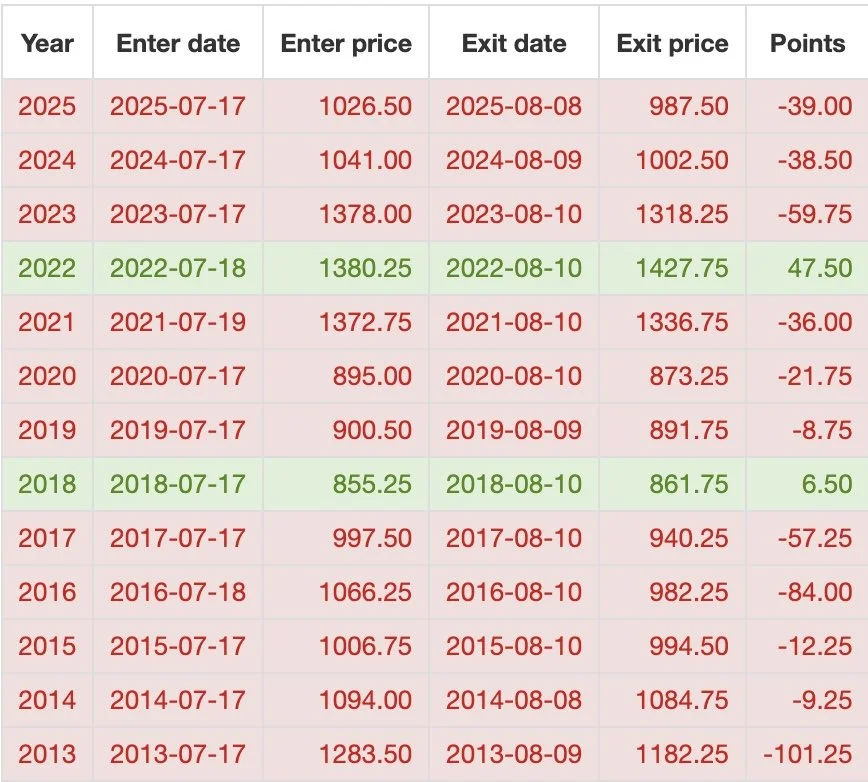
Short term, like in corn we are still in a seasonal time frame where it would not be a surprise to see us struggle if weather is not threatening.
From today by August 10th, we have been lower all but two years since 2013.
So that is one thing we need to be aware of short term over the next month or so.
Aug Bean Oil Chart:
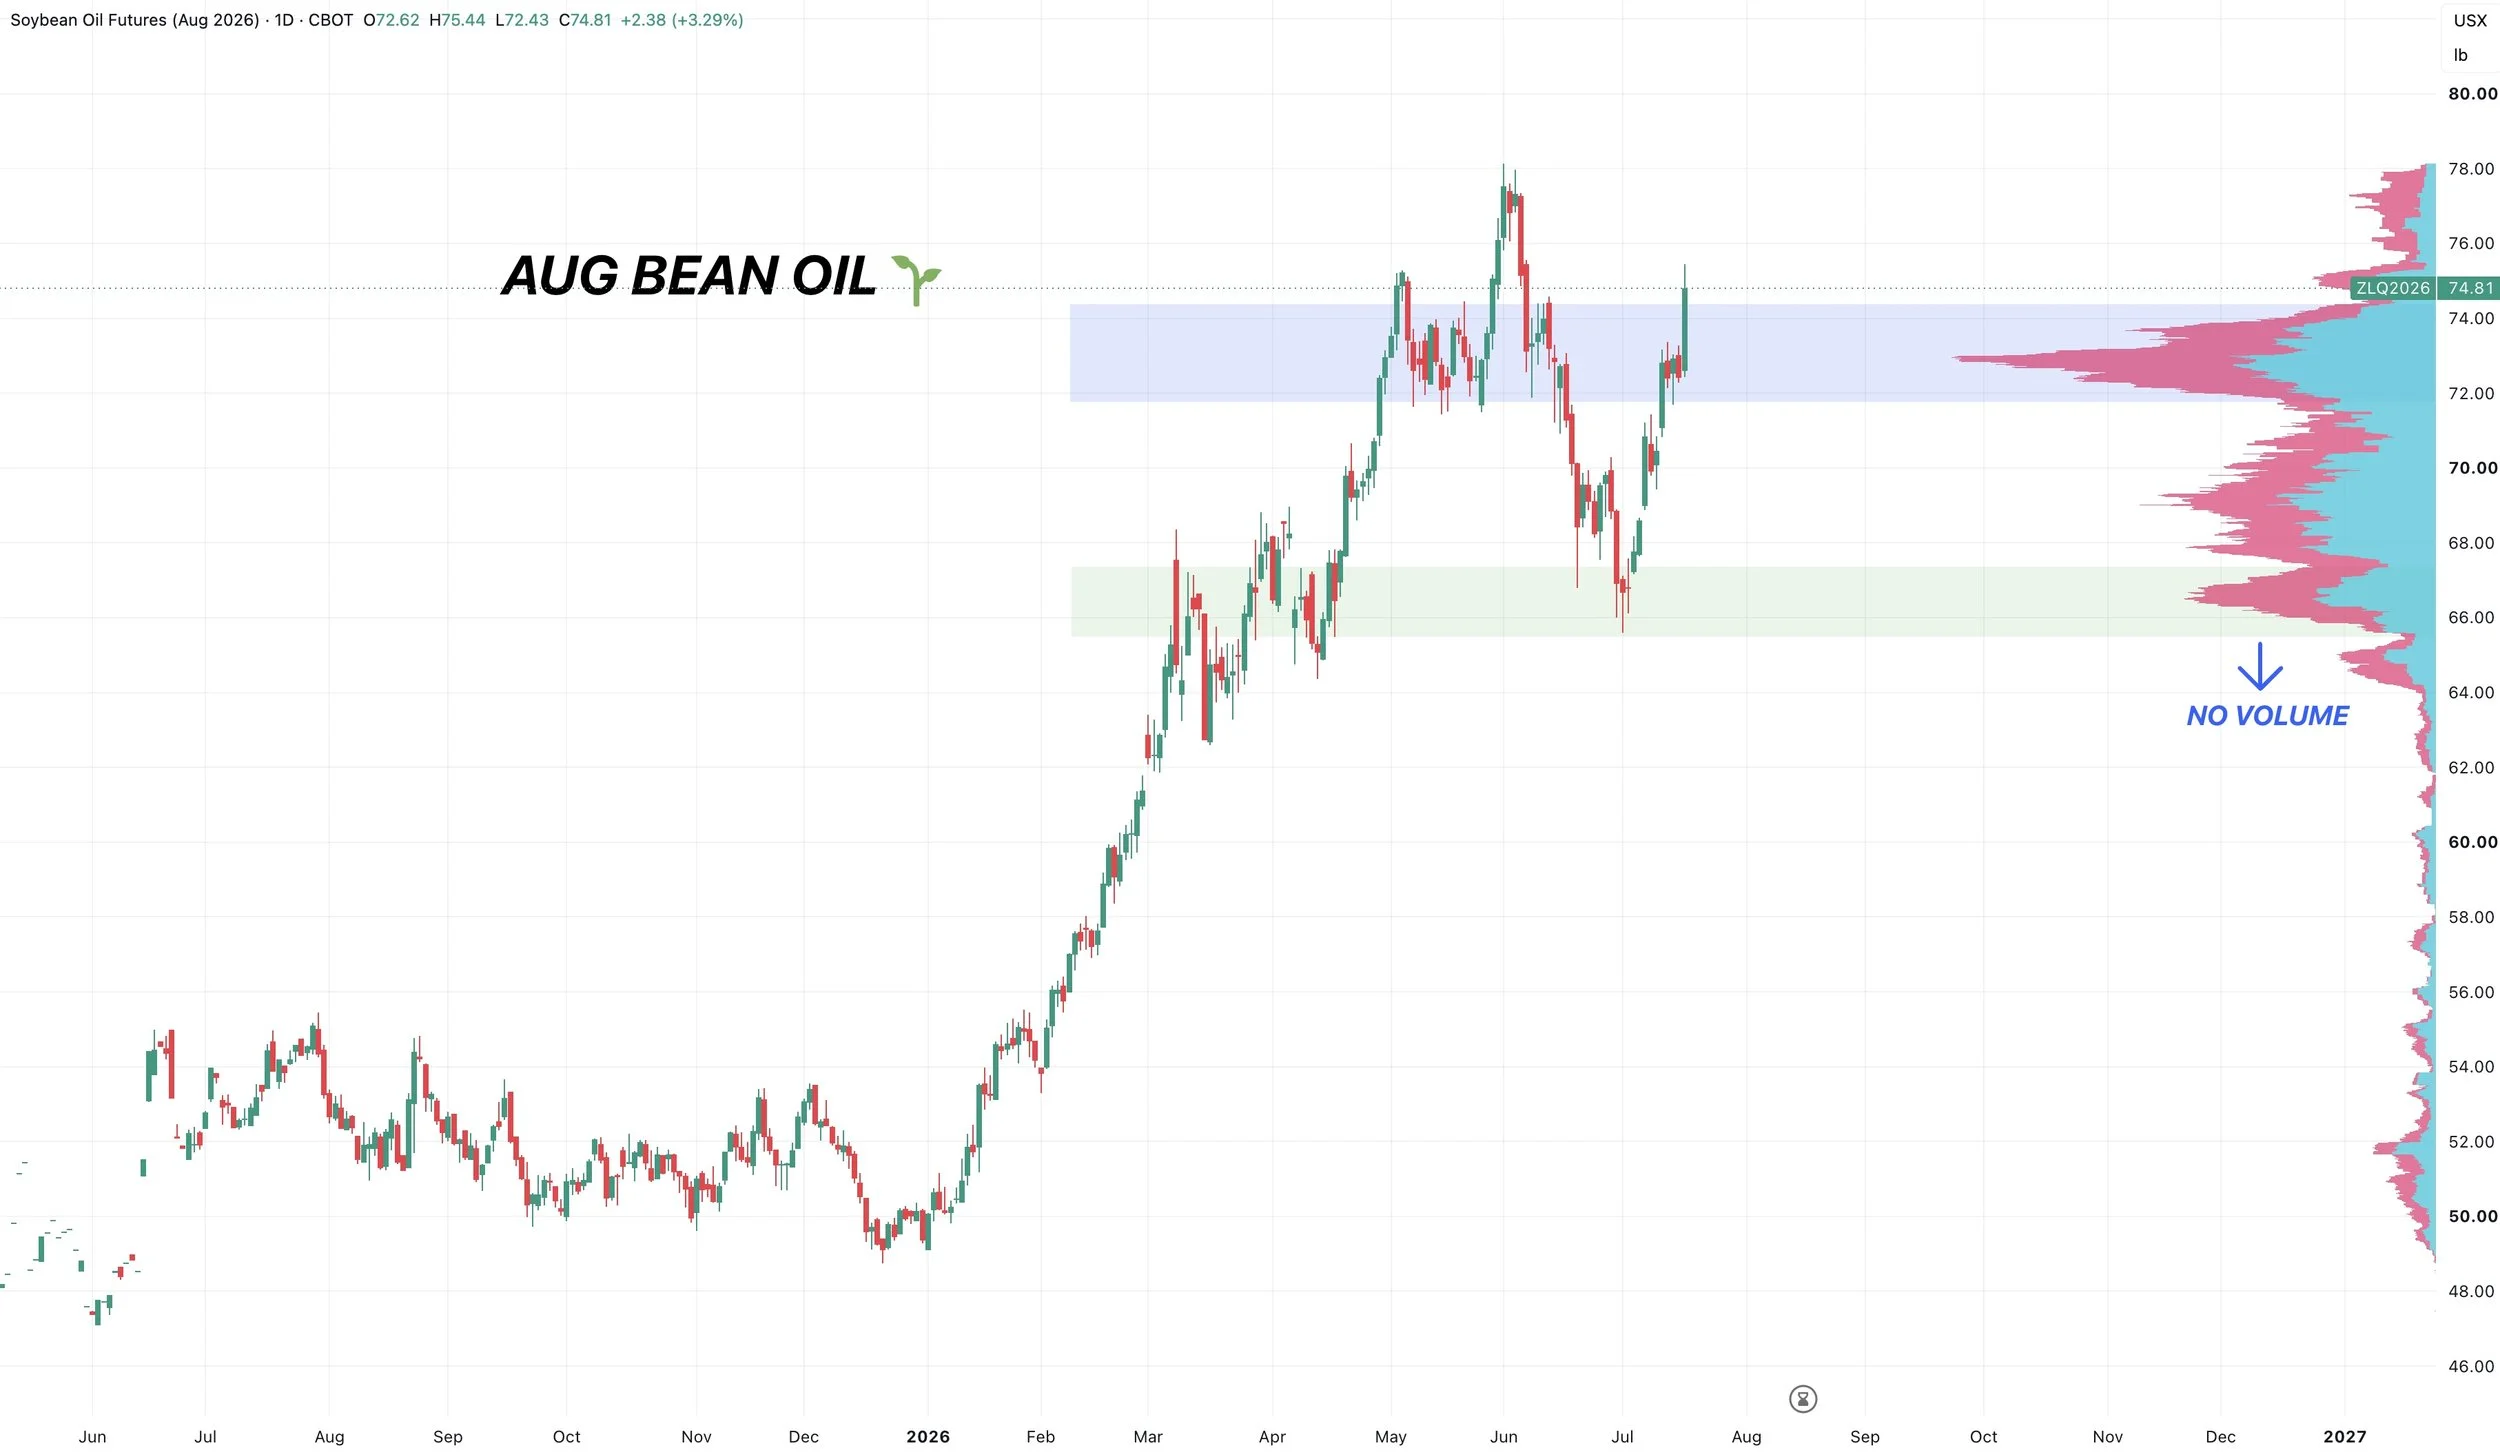
The bean oil chart looks solid.
We bounced right where we needed to.
Now potentially getting a breakout above this volume shelf.
As I've said time and time again, this is the funds darling. You'd like to think they don’t get too short the bean complex as long as bean oil holds up.
Crush Margins:
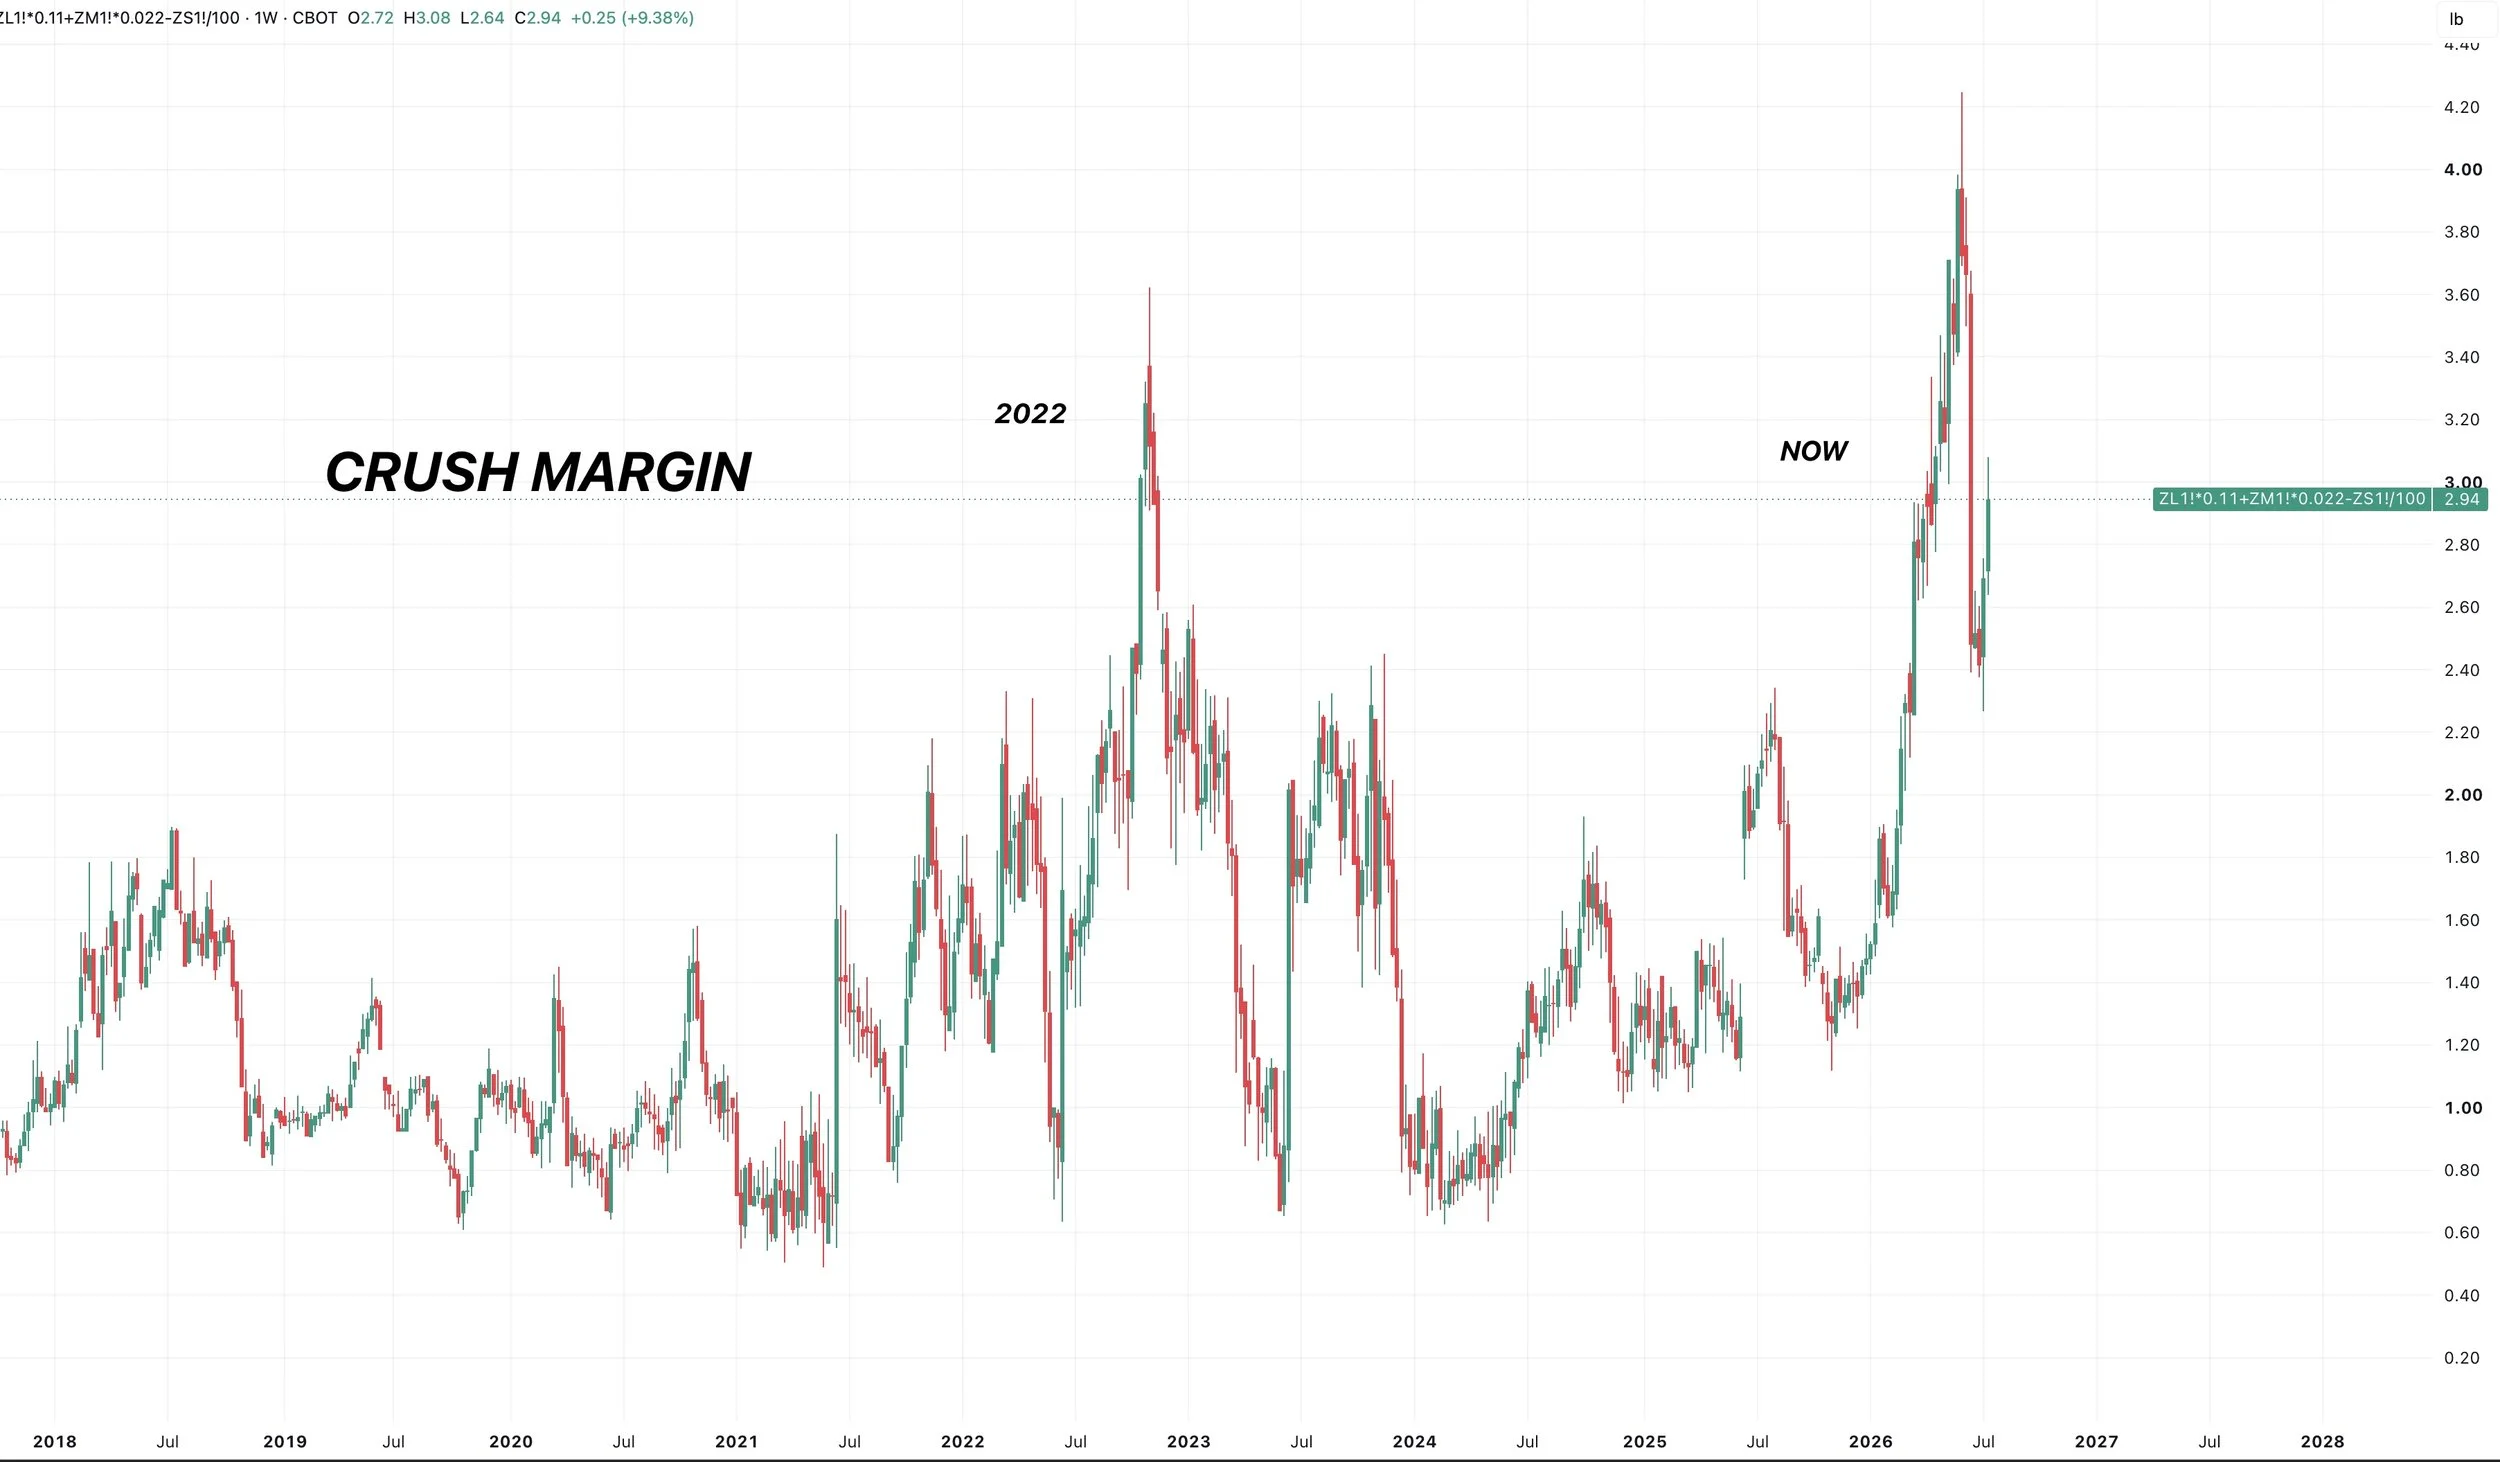
Crush margins cooled off from the recent highs.
But are still historically great. Seeing a decent rebound the last few weeks.
This is positive for crush demand.
Big Picture Chart:
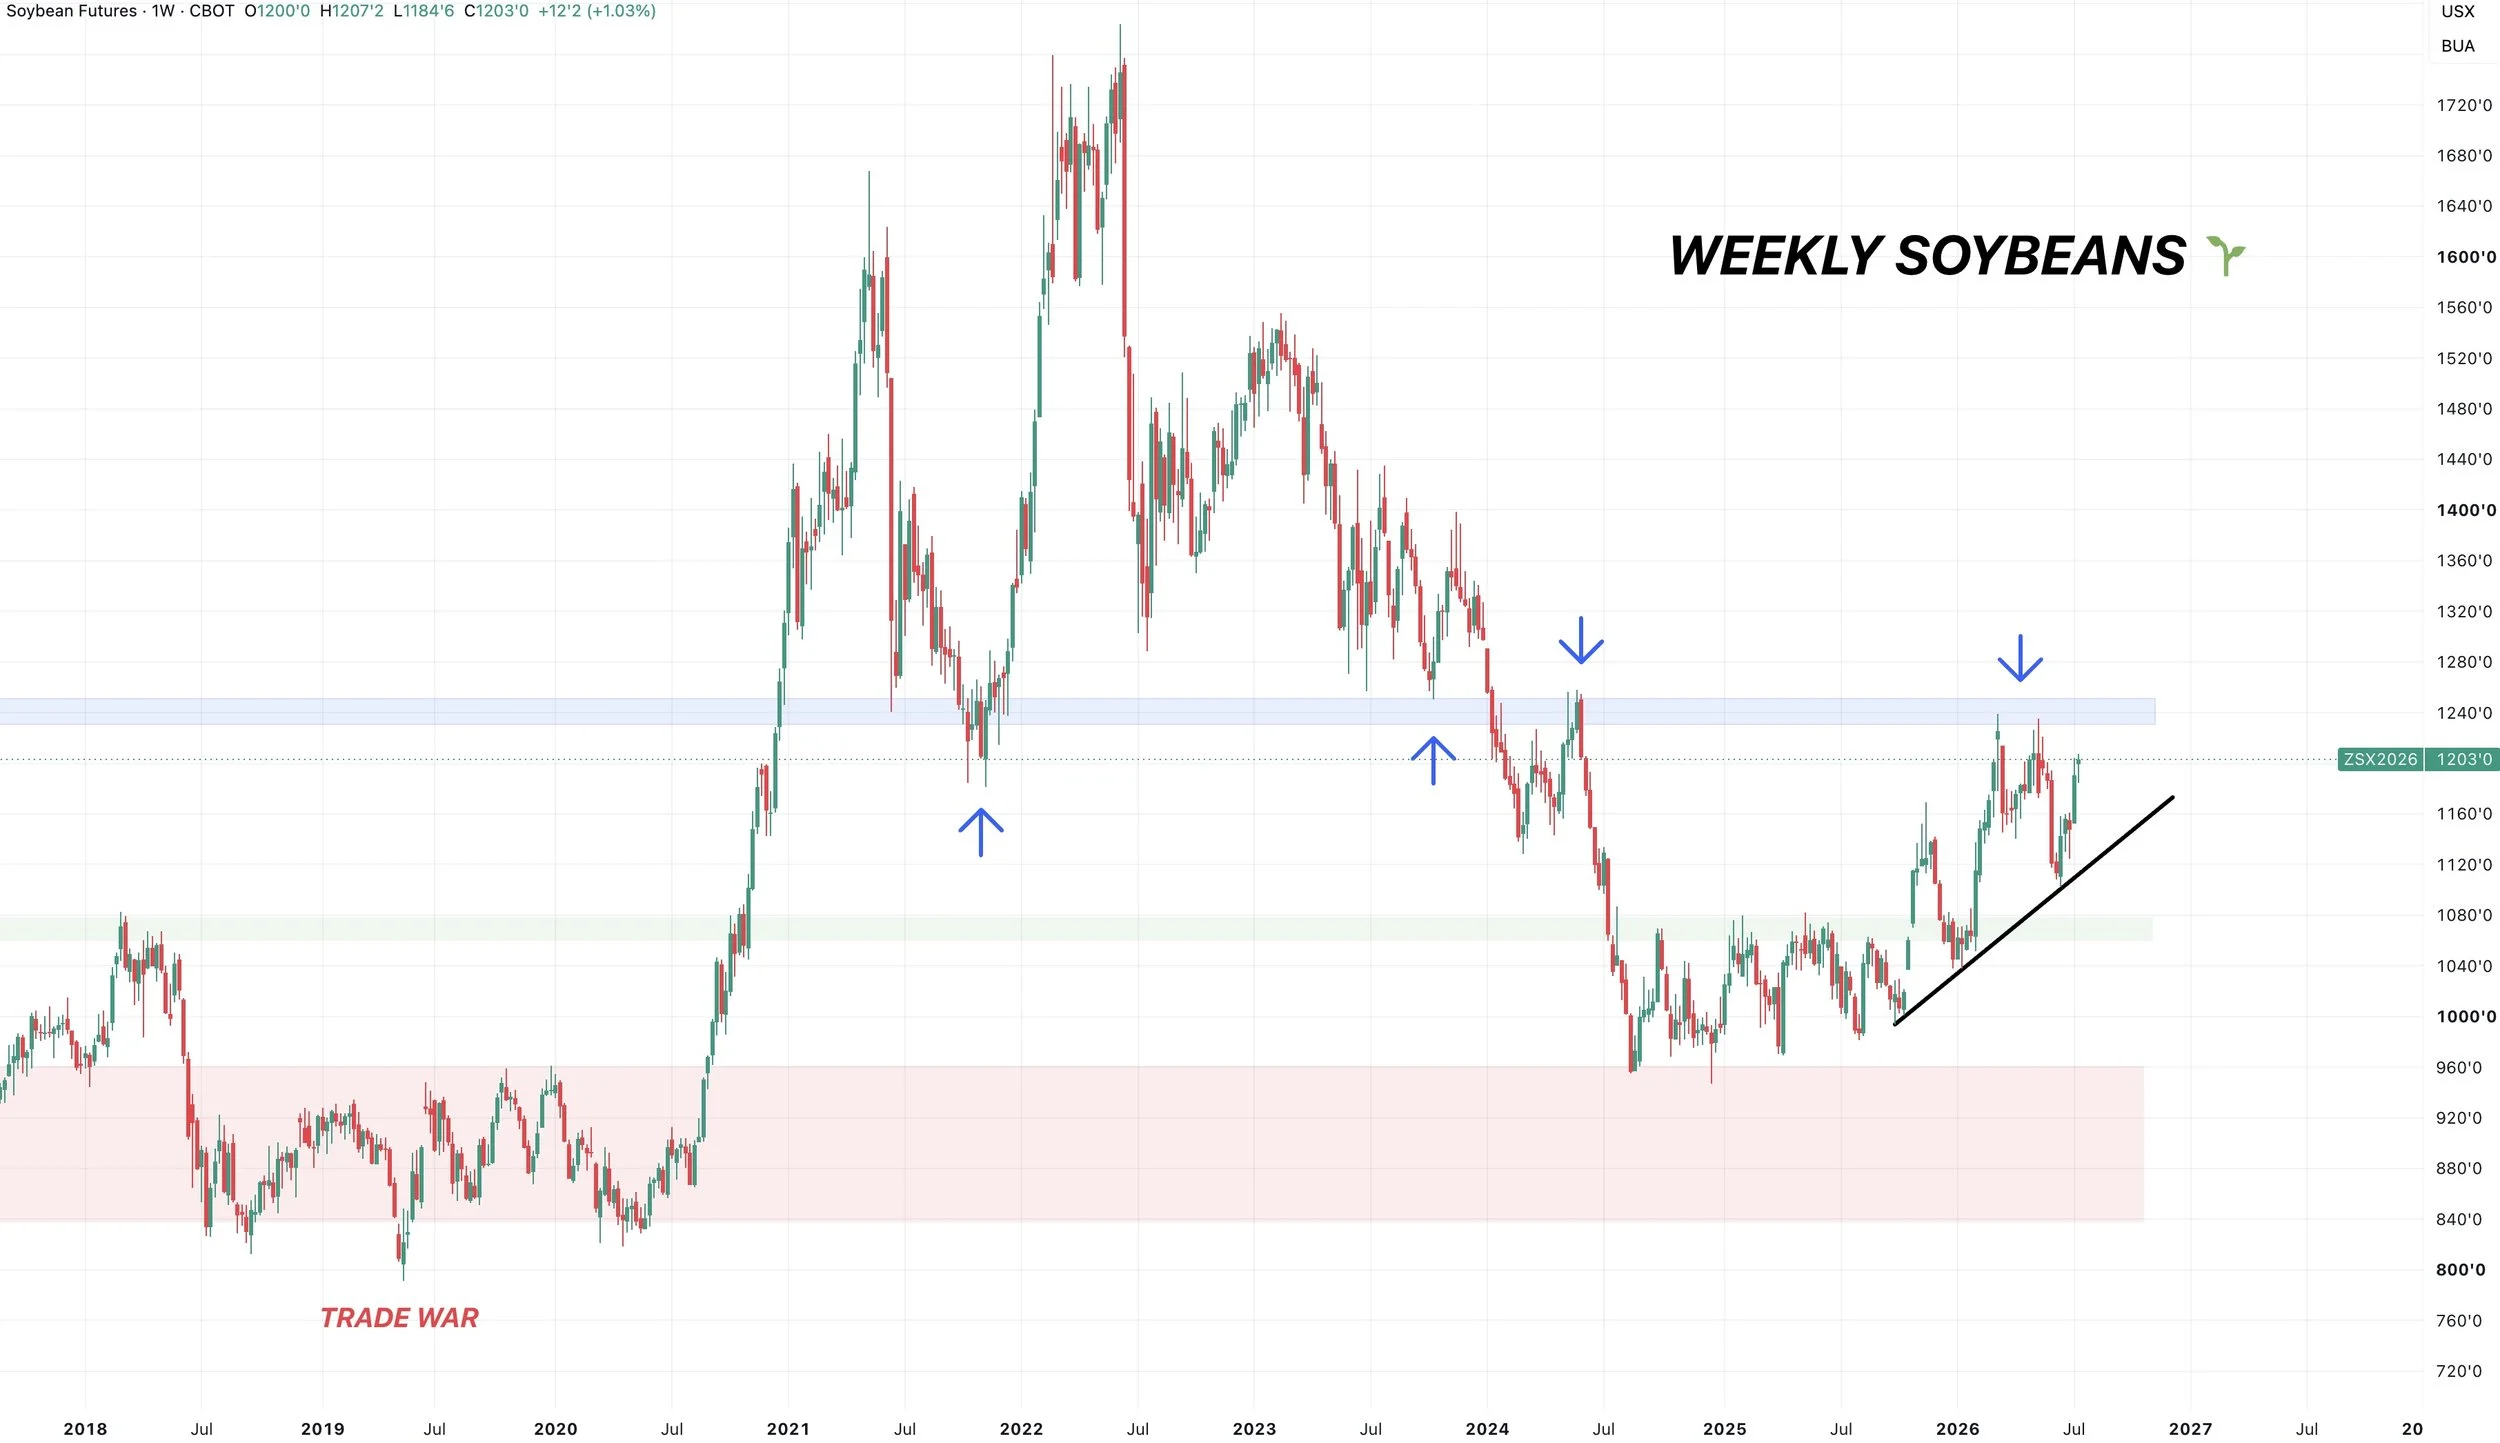
If you zoom out, soybeans look great when taking a long term approach.
If we are able to break above $12.50 we could definitely be in for a lot of upside long term.
But for now, that's going to be some big resistance.
Aug Beans Chart:
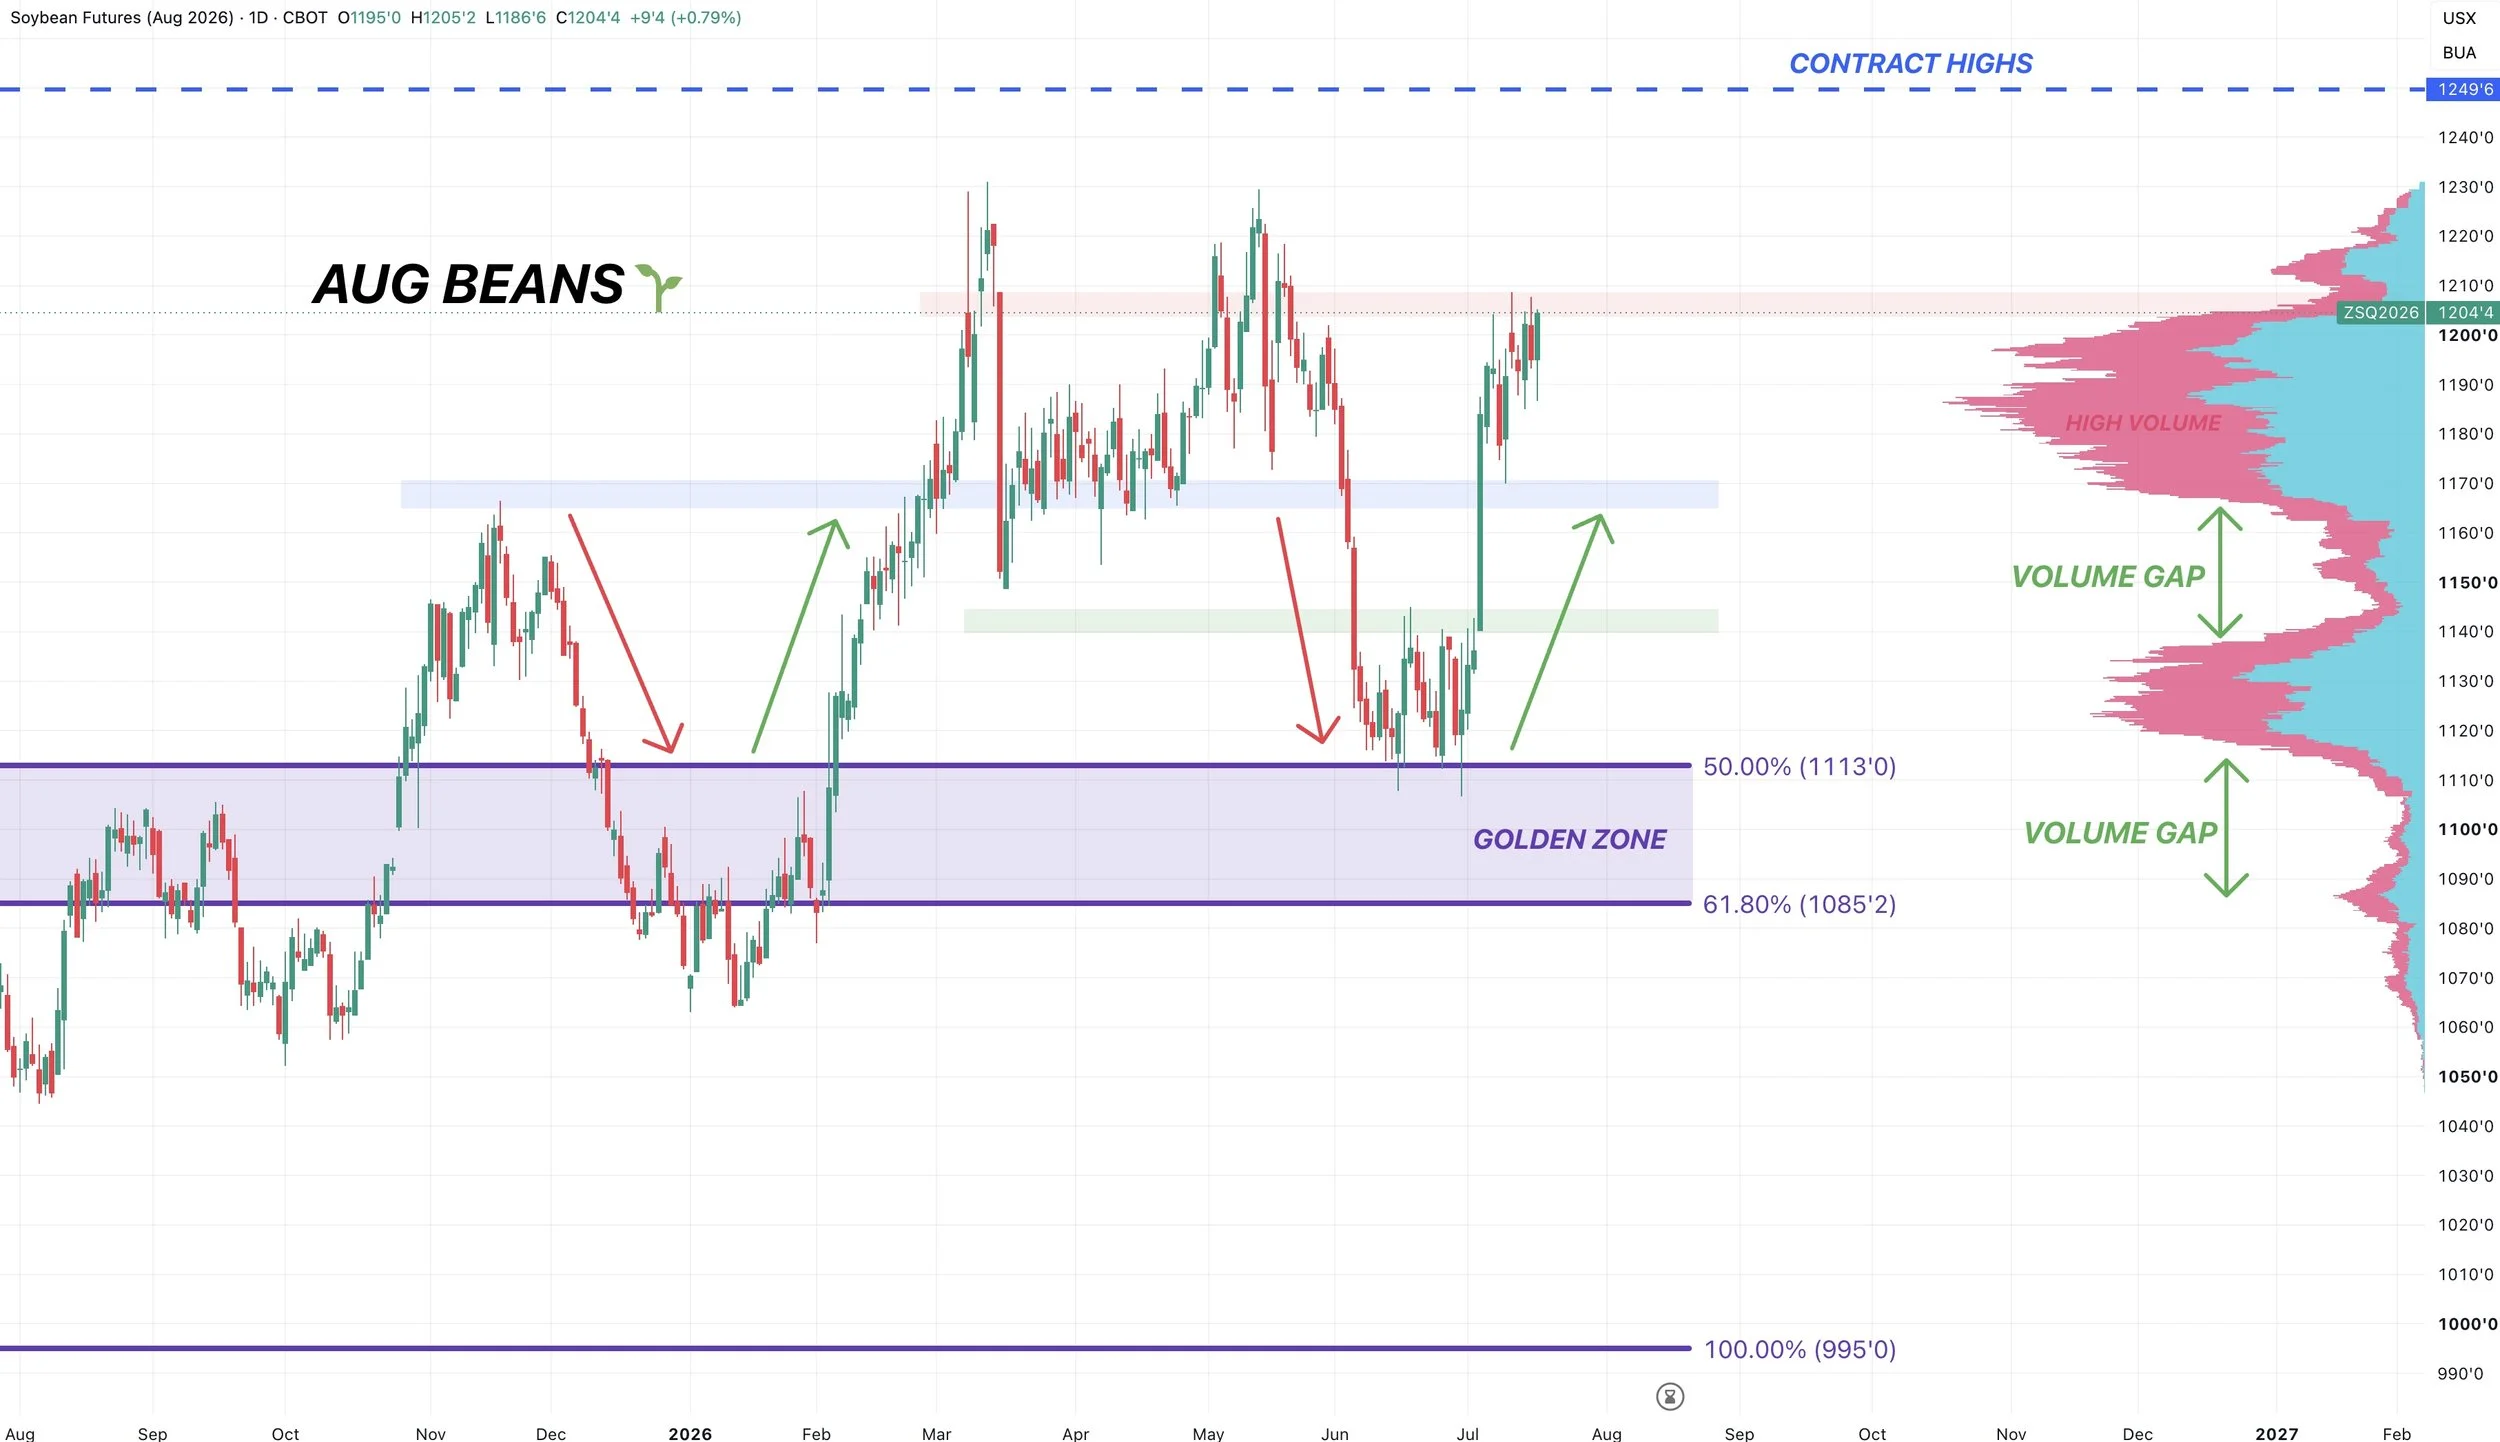
Still chopping around sideways up near these highs and the area of high volume.
If we are able to break above, the contract highs sit at $12.49
To the downside, bulls simply want to hold $11.65 to prevent a leg lower. As there is a gap of air to the downside.
Nov Beans Chart:
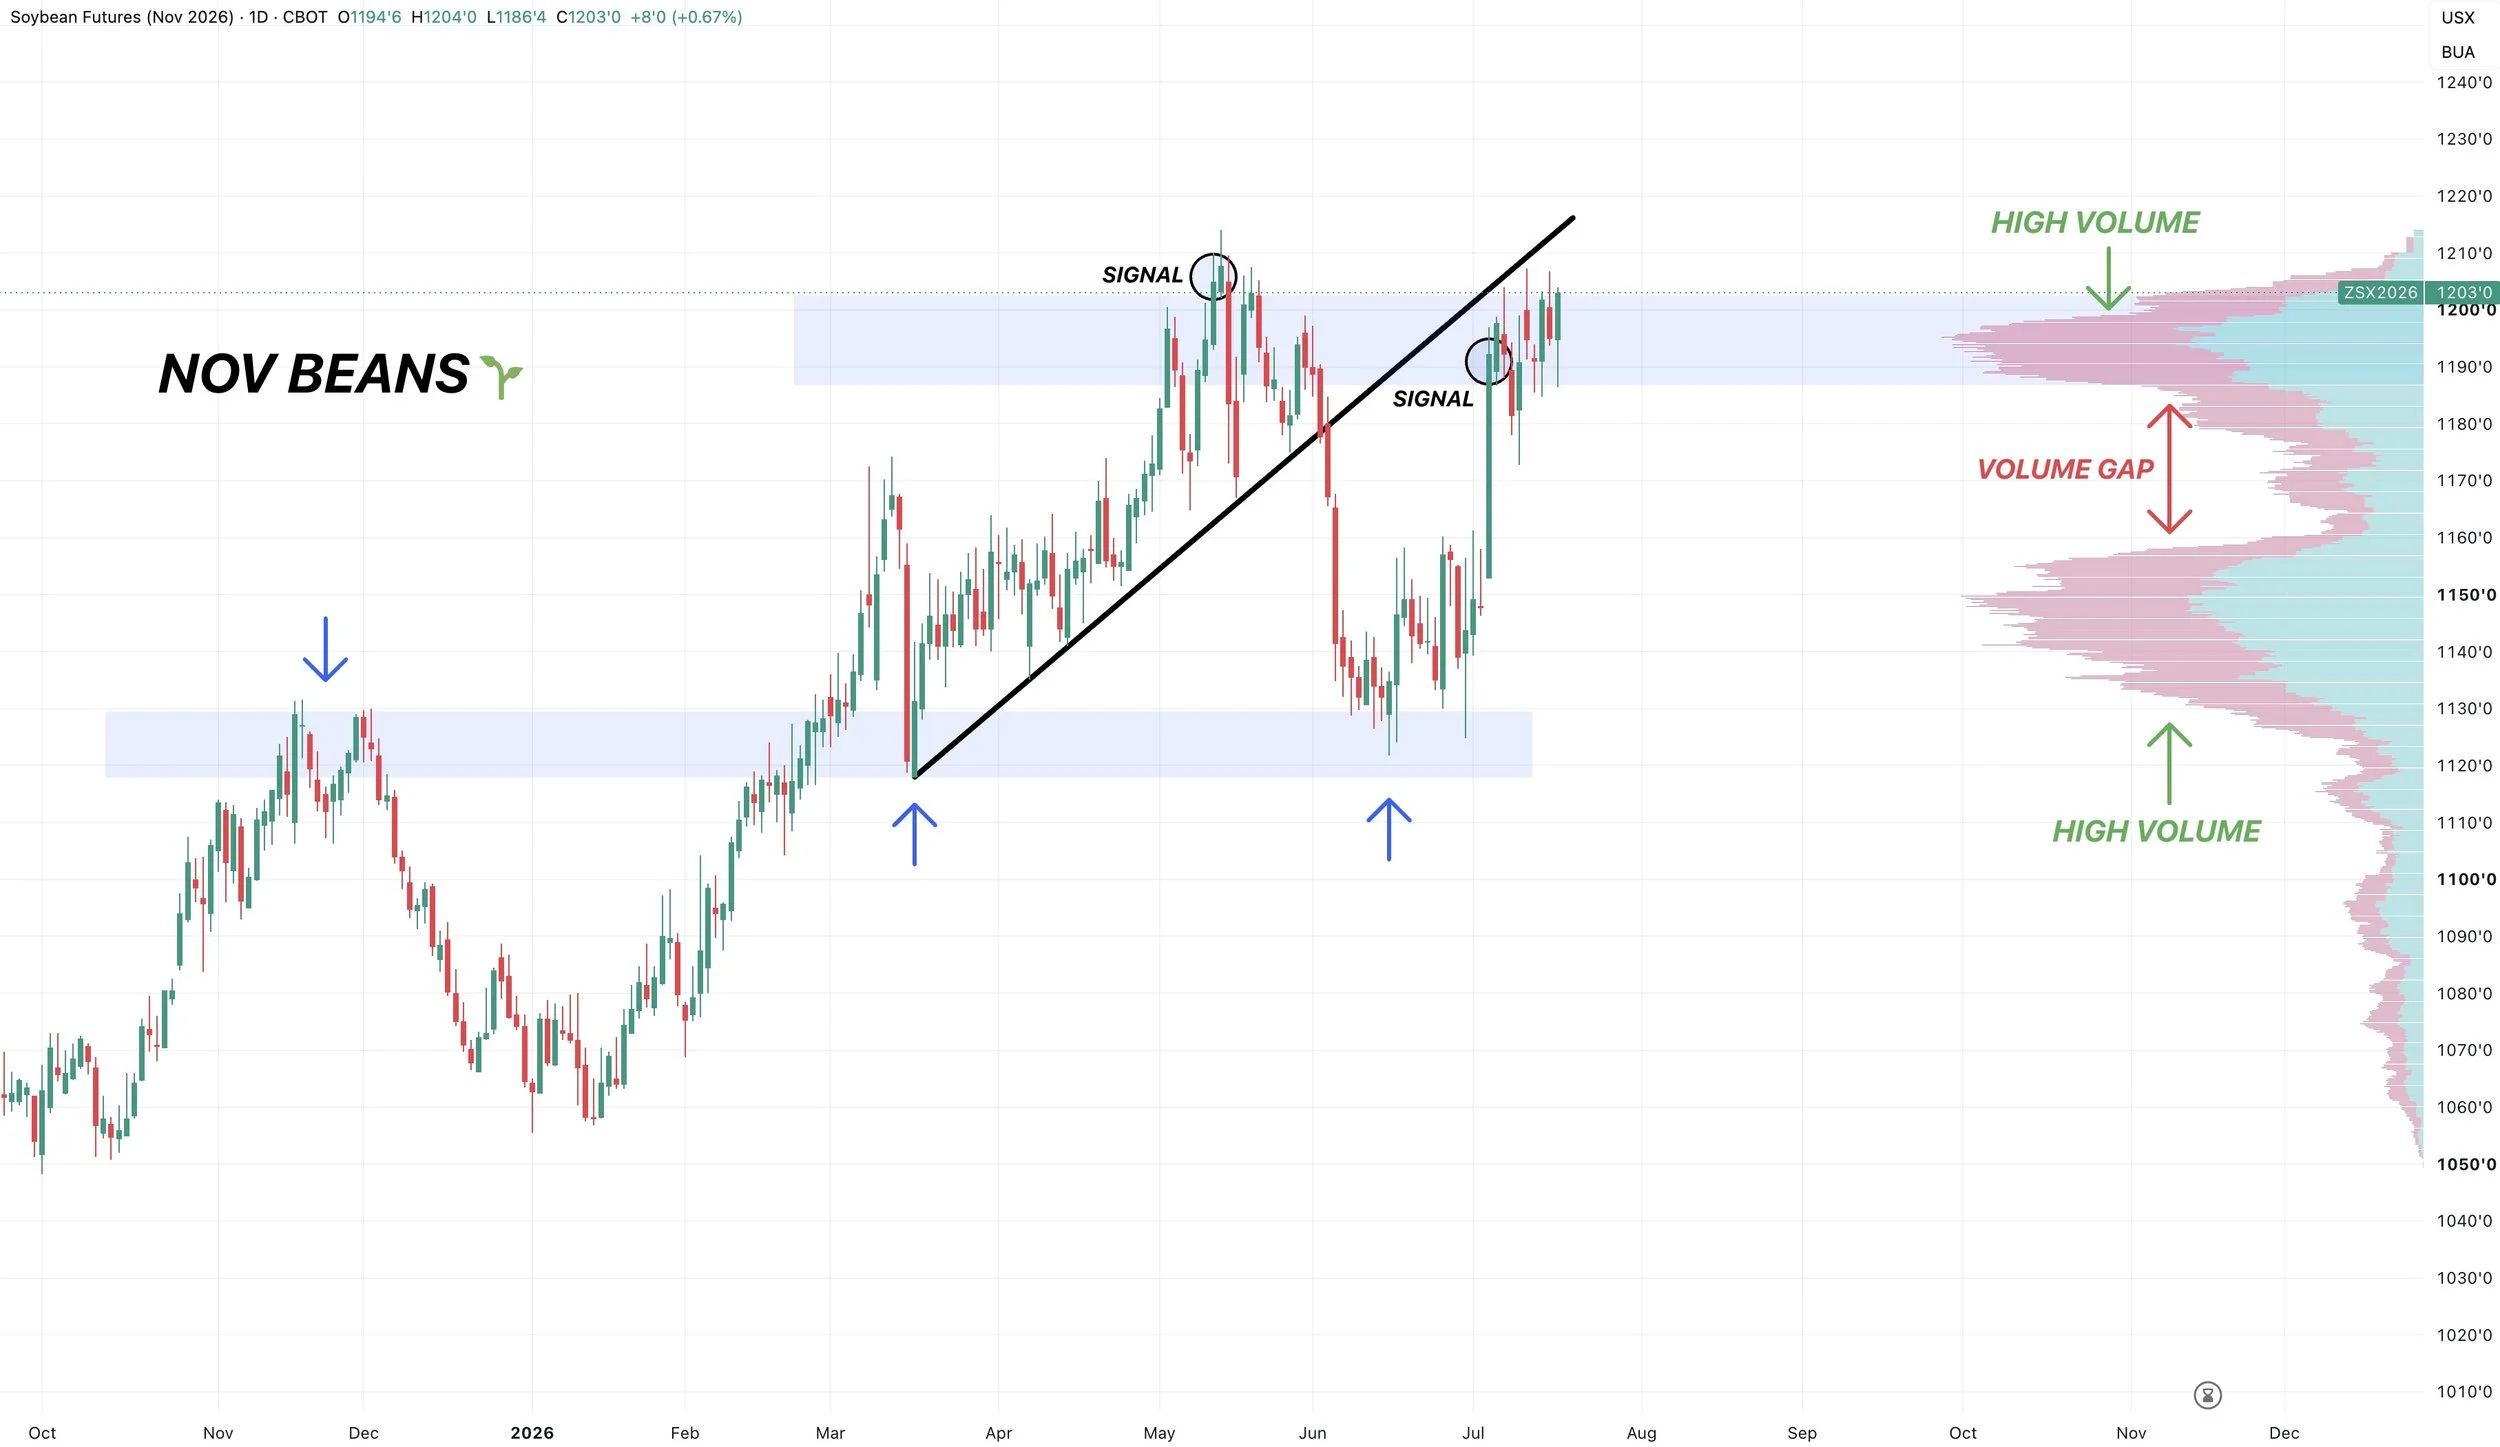
Also still simply consolidating at this big volume shelf.
Waiting to see if we break out here or reject.
We had that sell signal and hedge alert up here last week, I will have my next upside targets out if we break out of this range.
I do still think it makes sense to defend these levels if you need to do so, hence the recent signal.
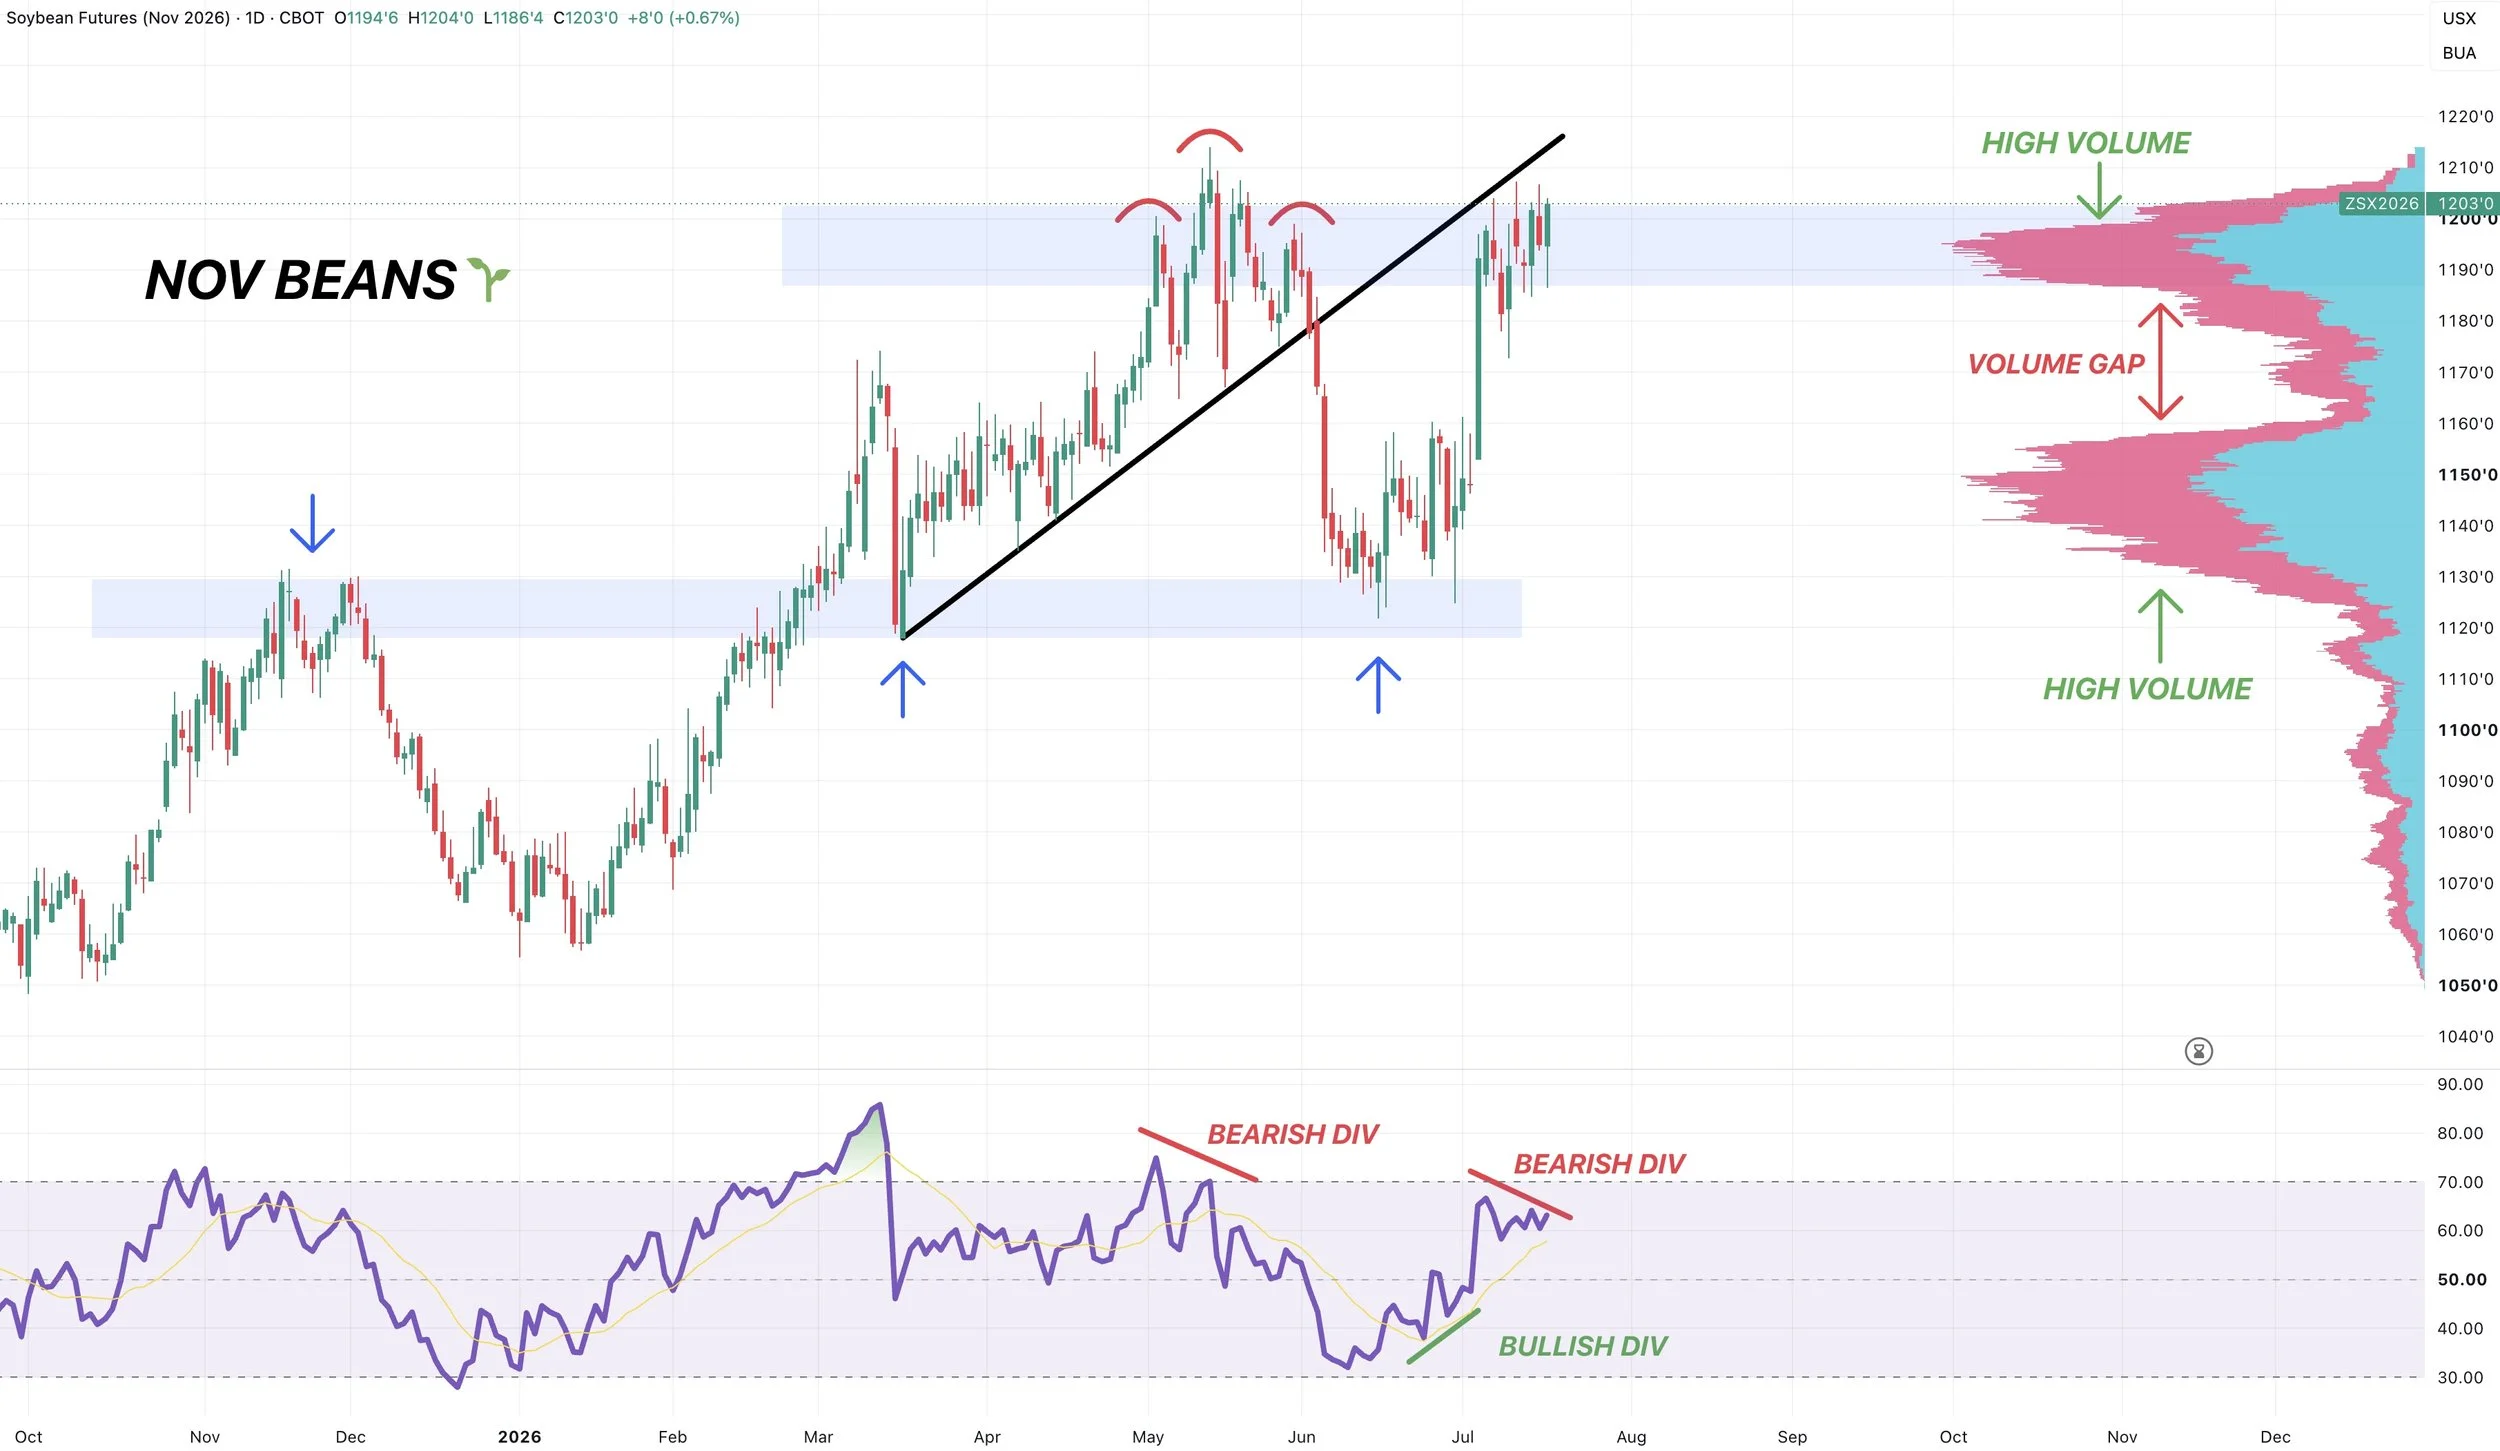
One reason I am still being cautious up here is that we have bearish divergence on the RSI.
Prices made new highs. The RSI did not.
Wheat
I am not a Black Sea expert. At all. So I have no idea how long this conflict is going to last.
What I do know is that if it lasts a long time, it could have pretty massive impacts to the world wheat situation.
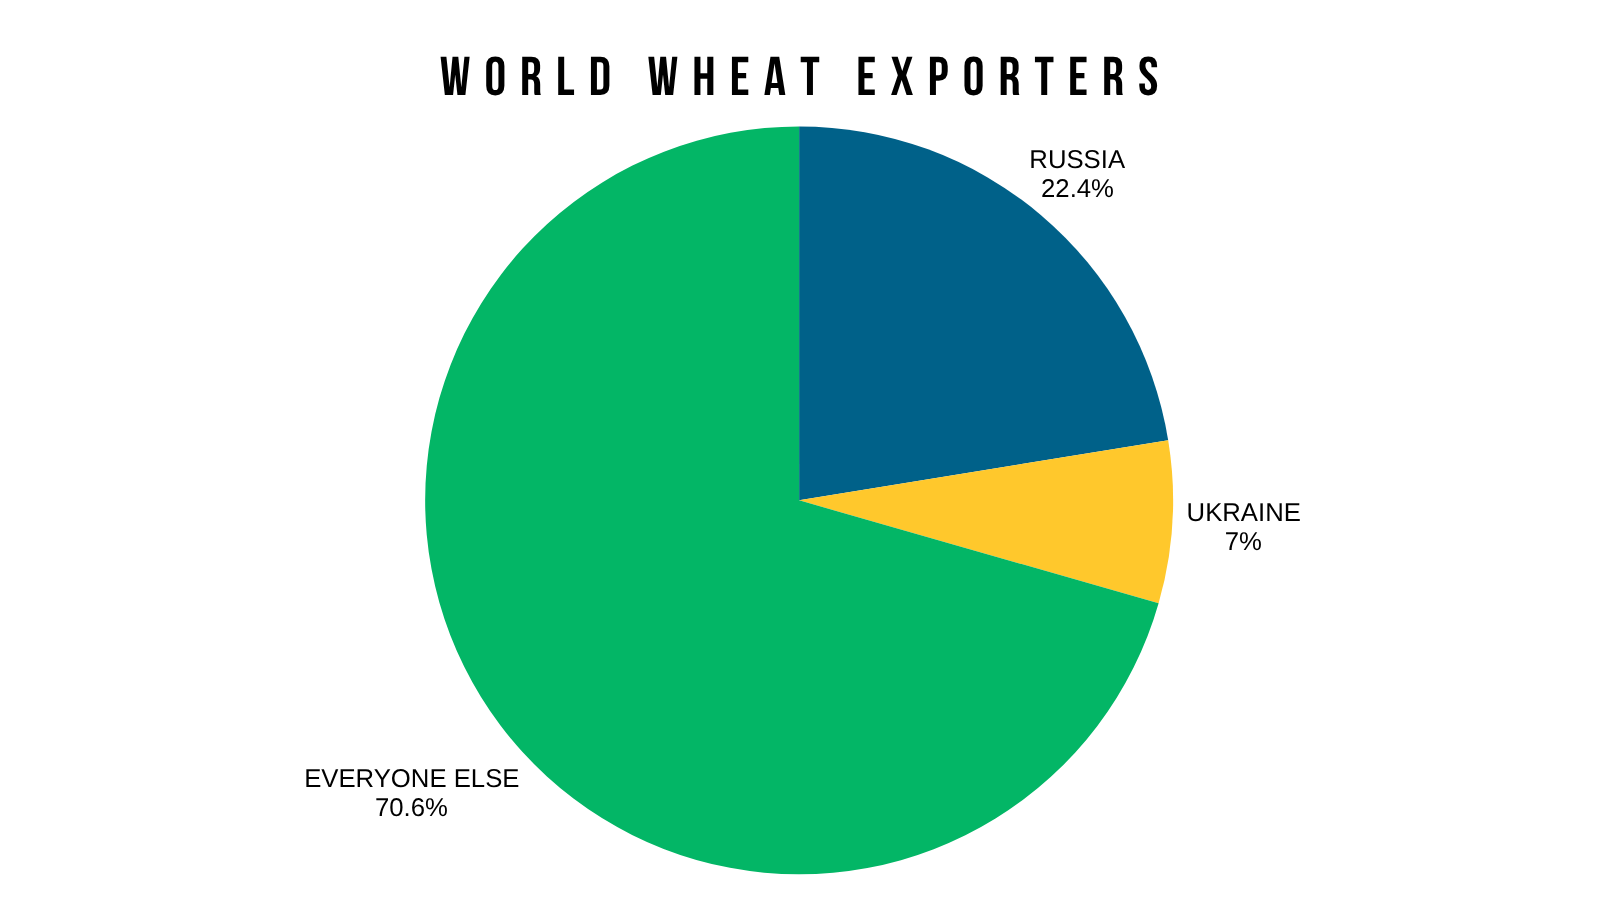
What do you think happens if the world's largest wheat exporter has 1/3rd of their wheat exports restricted for a few months?
As the Kerch Strait handles around 30% of all of Russia's wheat exports.
It could be a very big deal.
Why is it a big deal?
Well Russia exports 25% of the world's wheat. If 30% of Russia's exports are at risk, that means 7.5% of the world's wheat exports are at risk of being restricted.
The world has to get that wheat from somewhere else.
To pull that demand towards other origins, the price of wheat goes higher. As it needs to incentivize other exporters to fill the gap left from Russia.
The key here is going to be, does this actually materially change Russia's wheat exports or is this just a short lived scare?
It's hard to say.
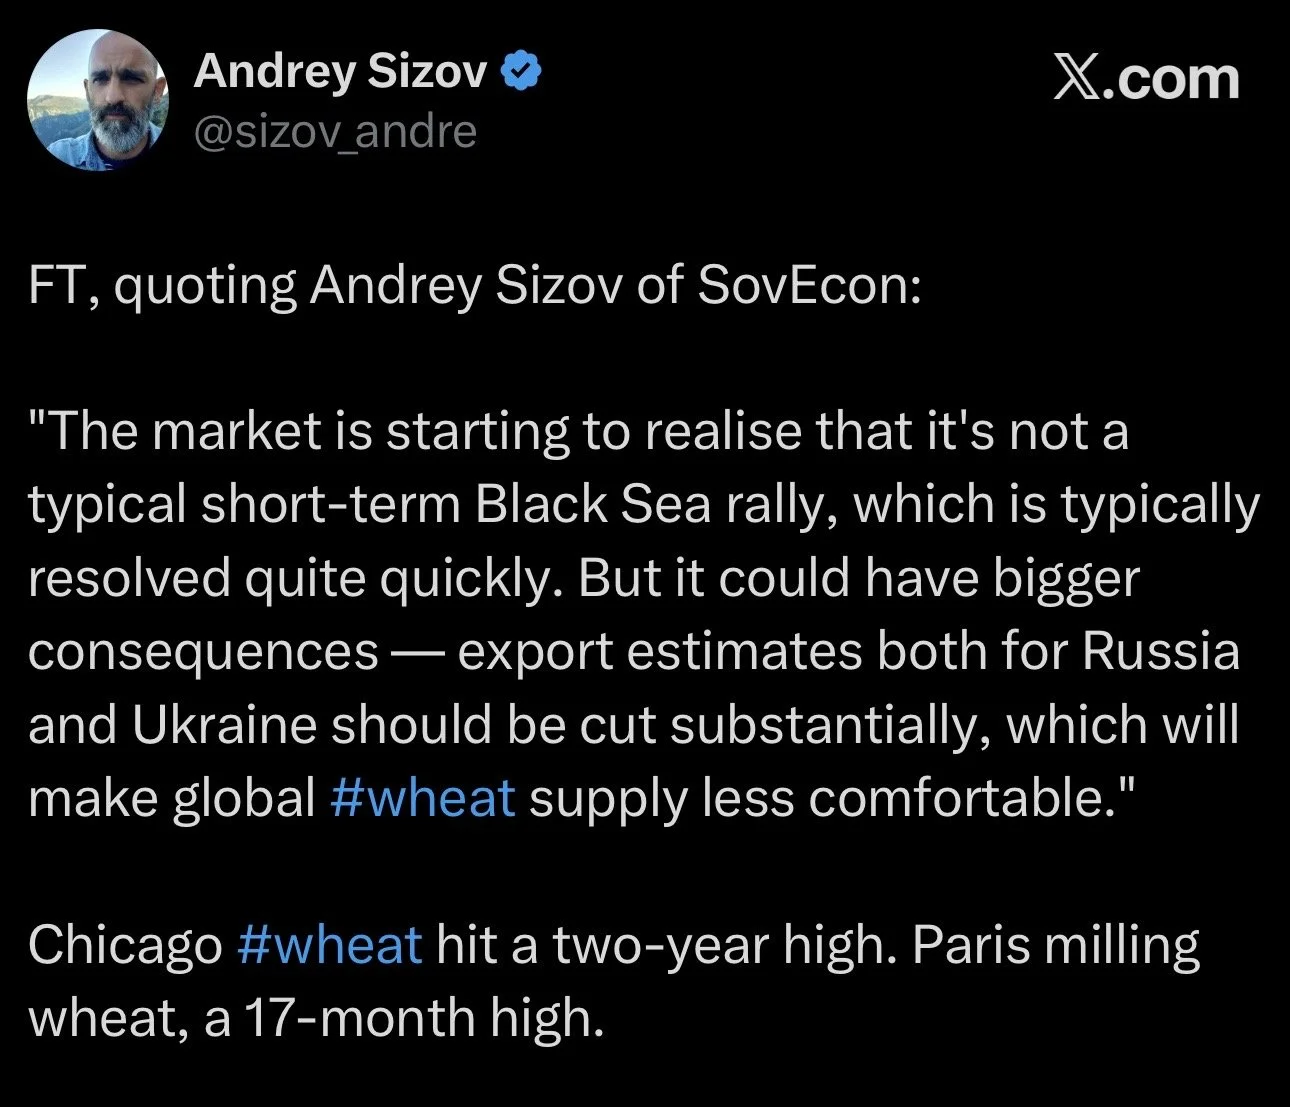
Black Sea guru Andrey Sizov says that if it lasts for a prolonged period of time, which it could, it will absolutely result in big changes to the world wheat situation.
If it lasts for a while, things could definitely get interesting for grains as a whole.
Sep KC Chart:
Great day today after having that reversal-type candle yesterday. As we closed right at yesterday’s highs.
KC wheat broke above that golden zone. Which is a good sign, as it opens the door to challenge the highs.
Since we broke that zone, it likely means this market has posted a bottom for a while.
The next obvious target has to be the recent highs at $7.58
If you take out that level, you then open the door higher.
Since that level is also contract highs, there could be room to run.
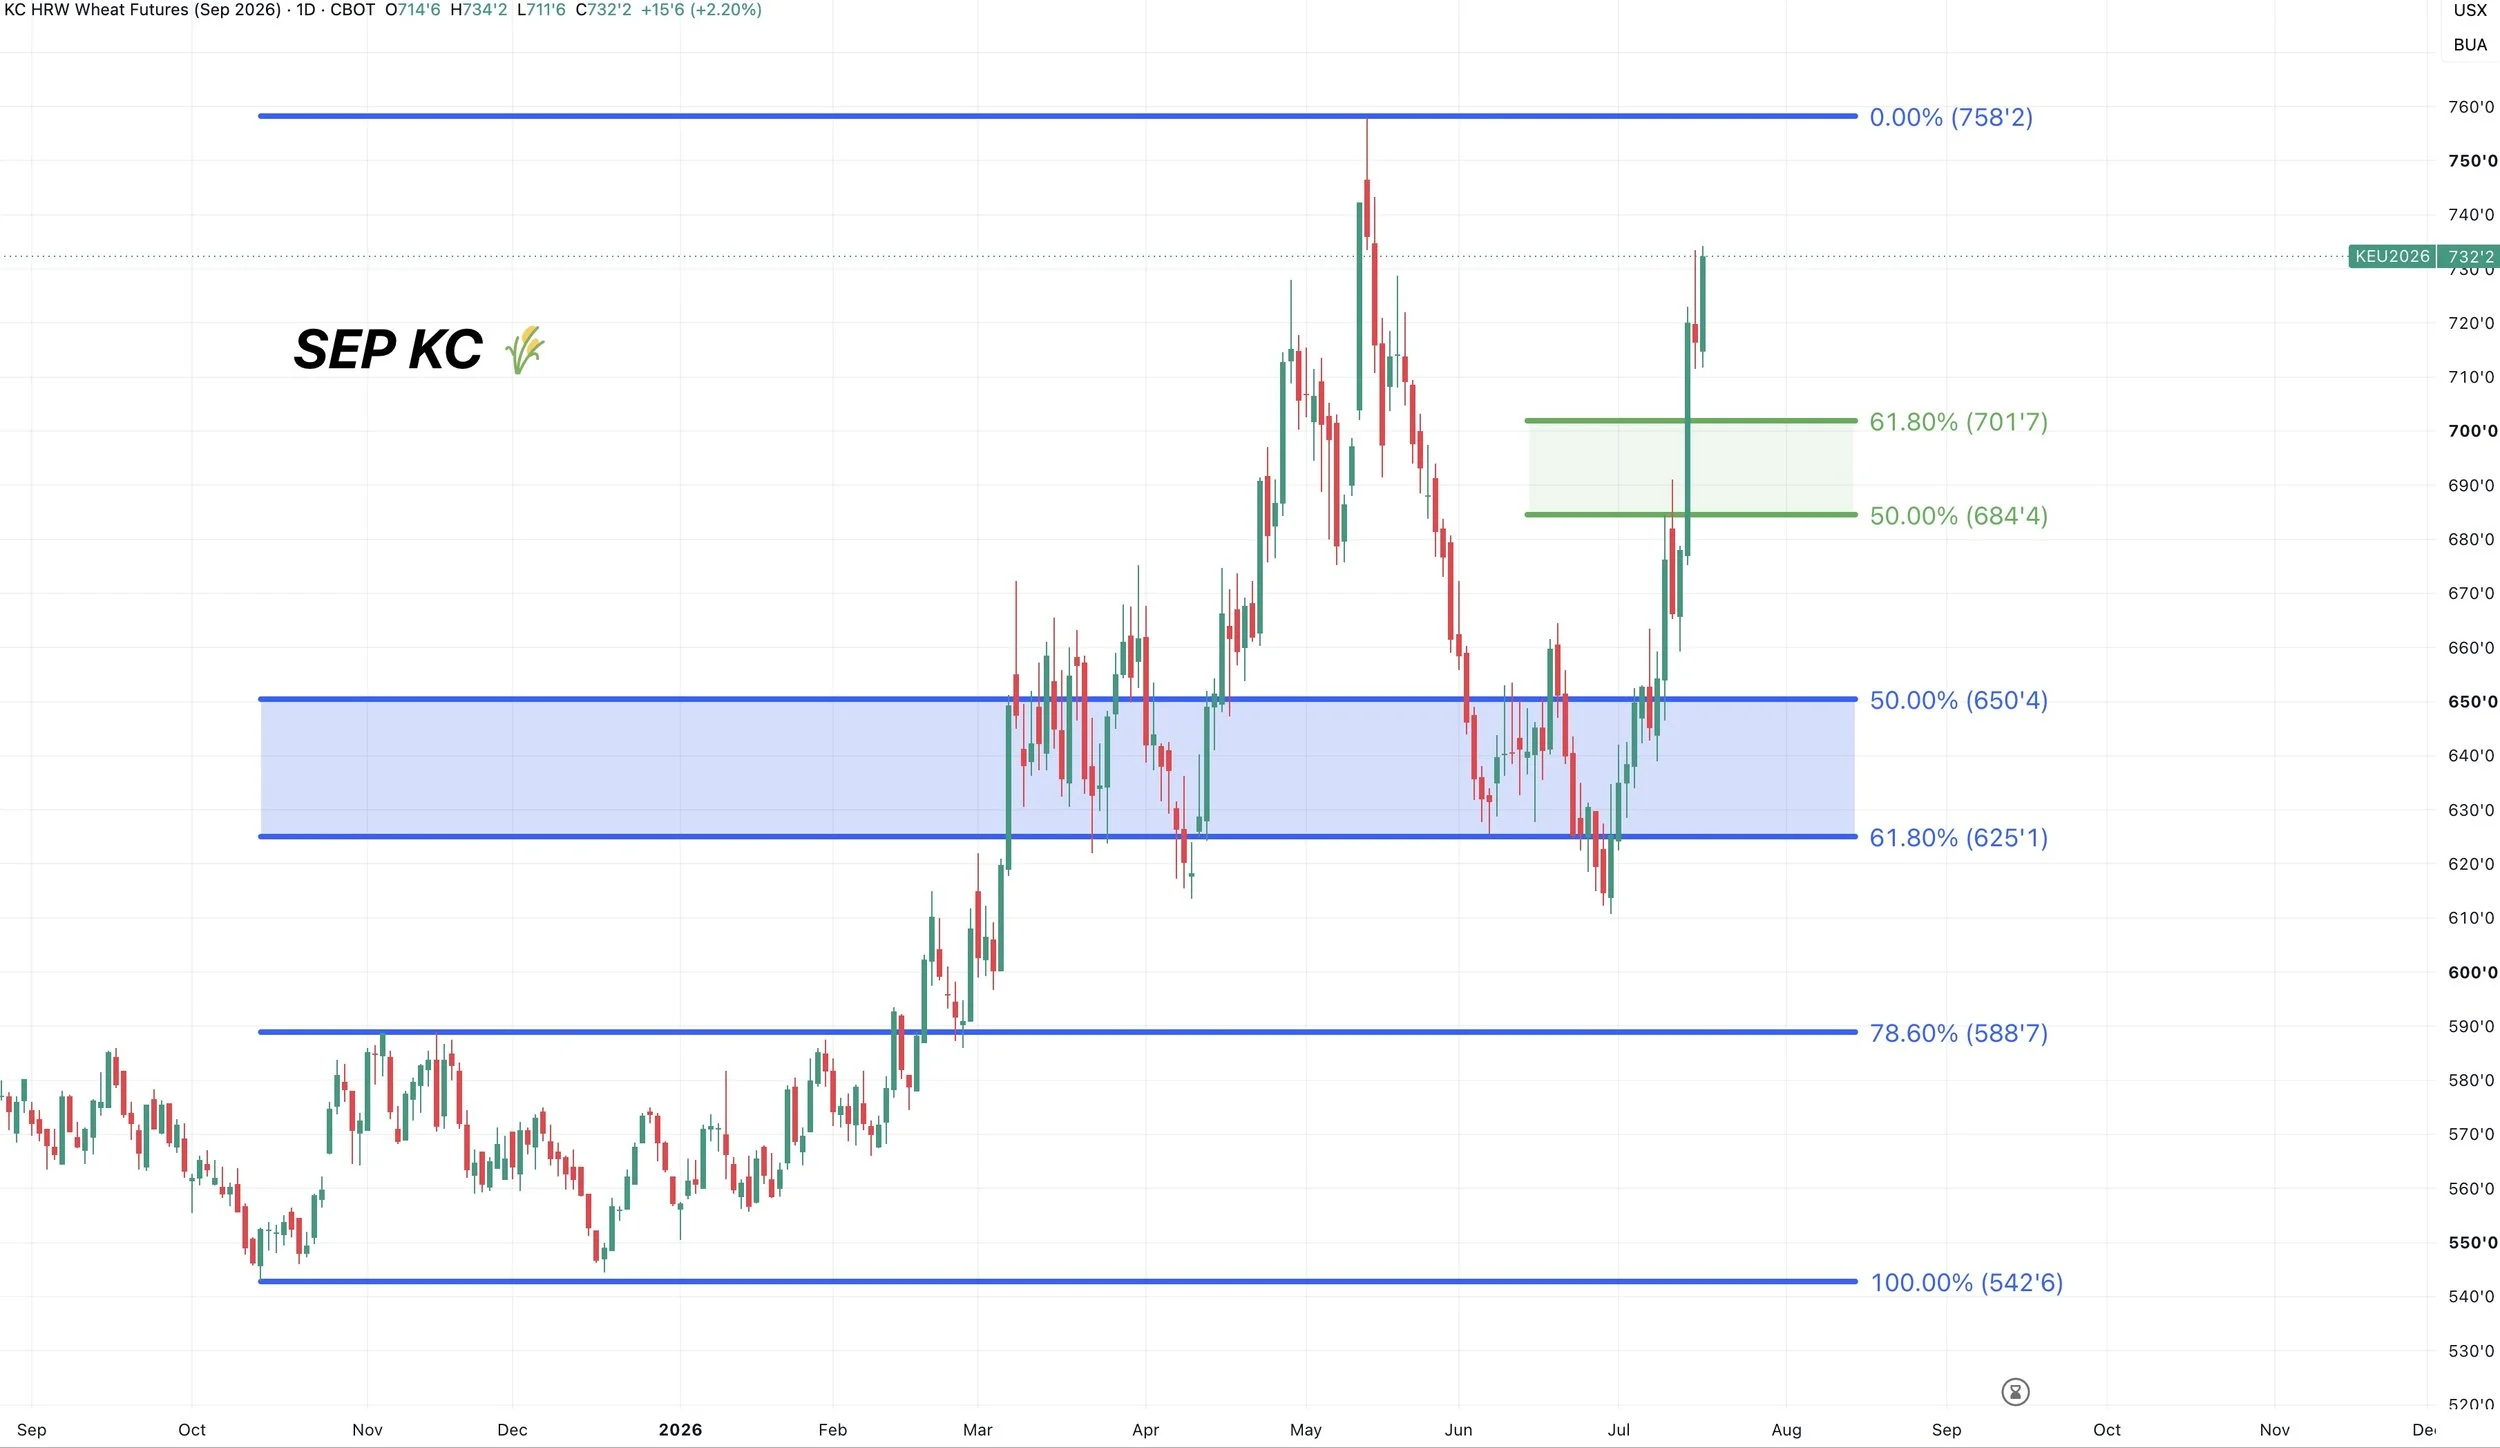
If you need to move wheat, it probably makes sense to incrementally reward this market. As we don’t know how the Black Sea situation will unfold.
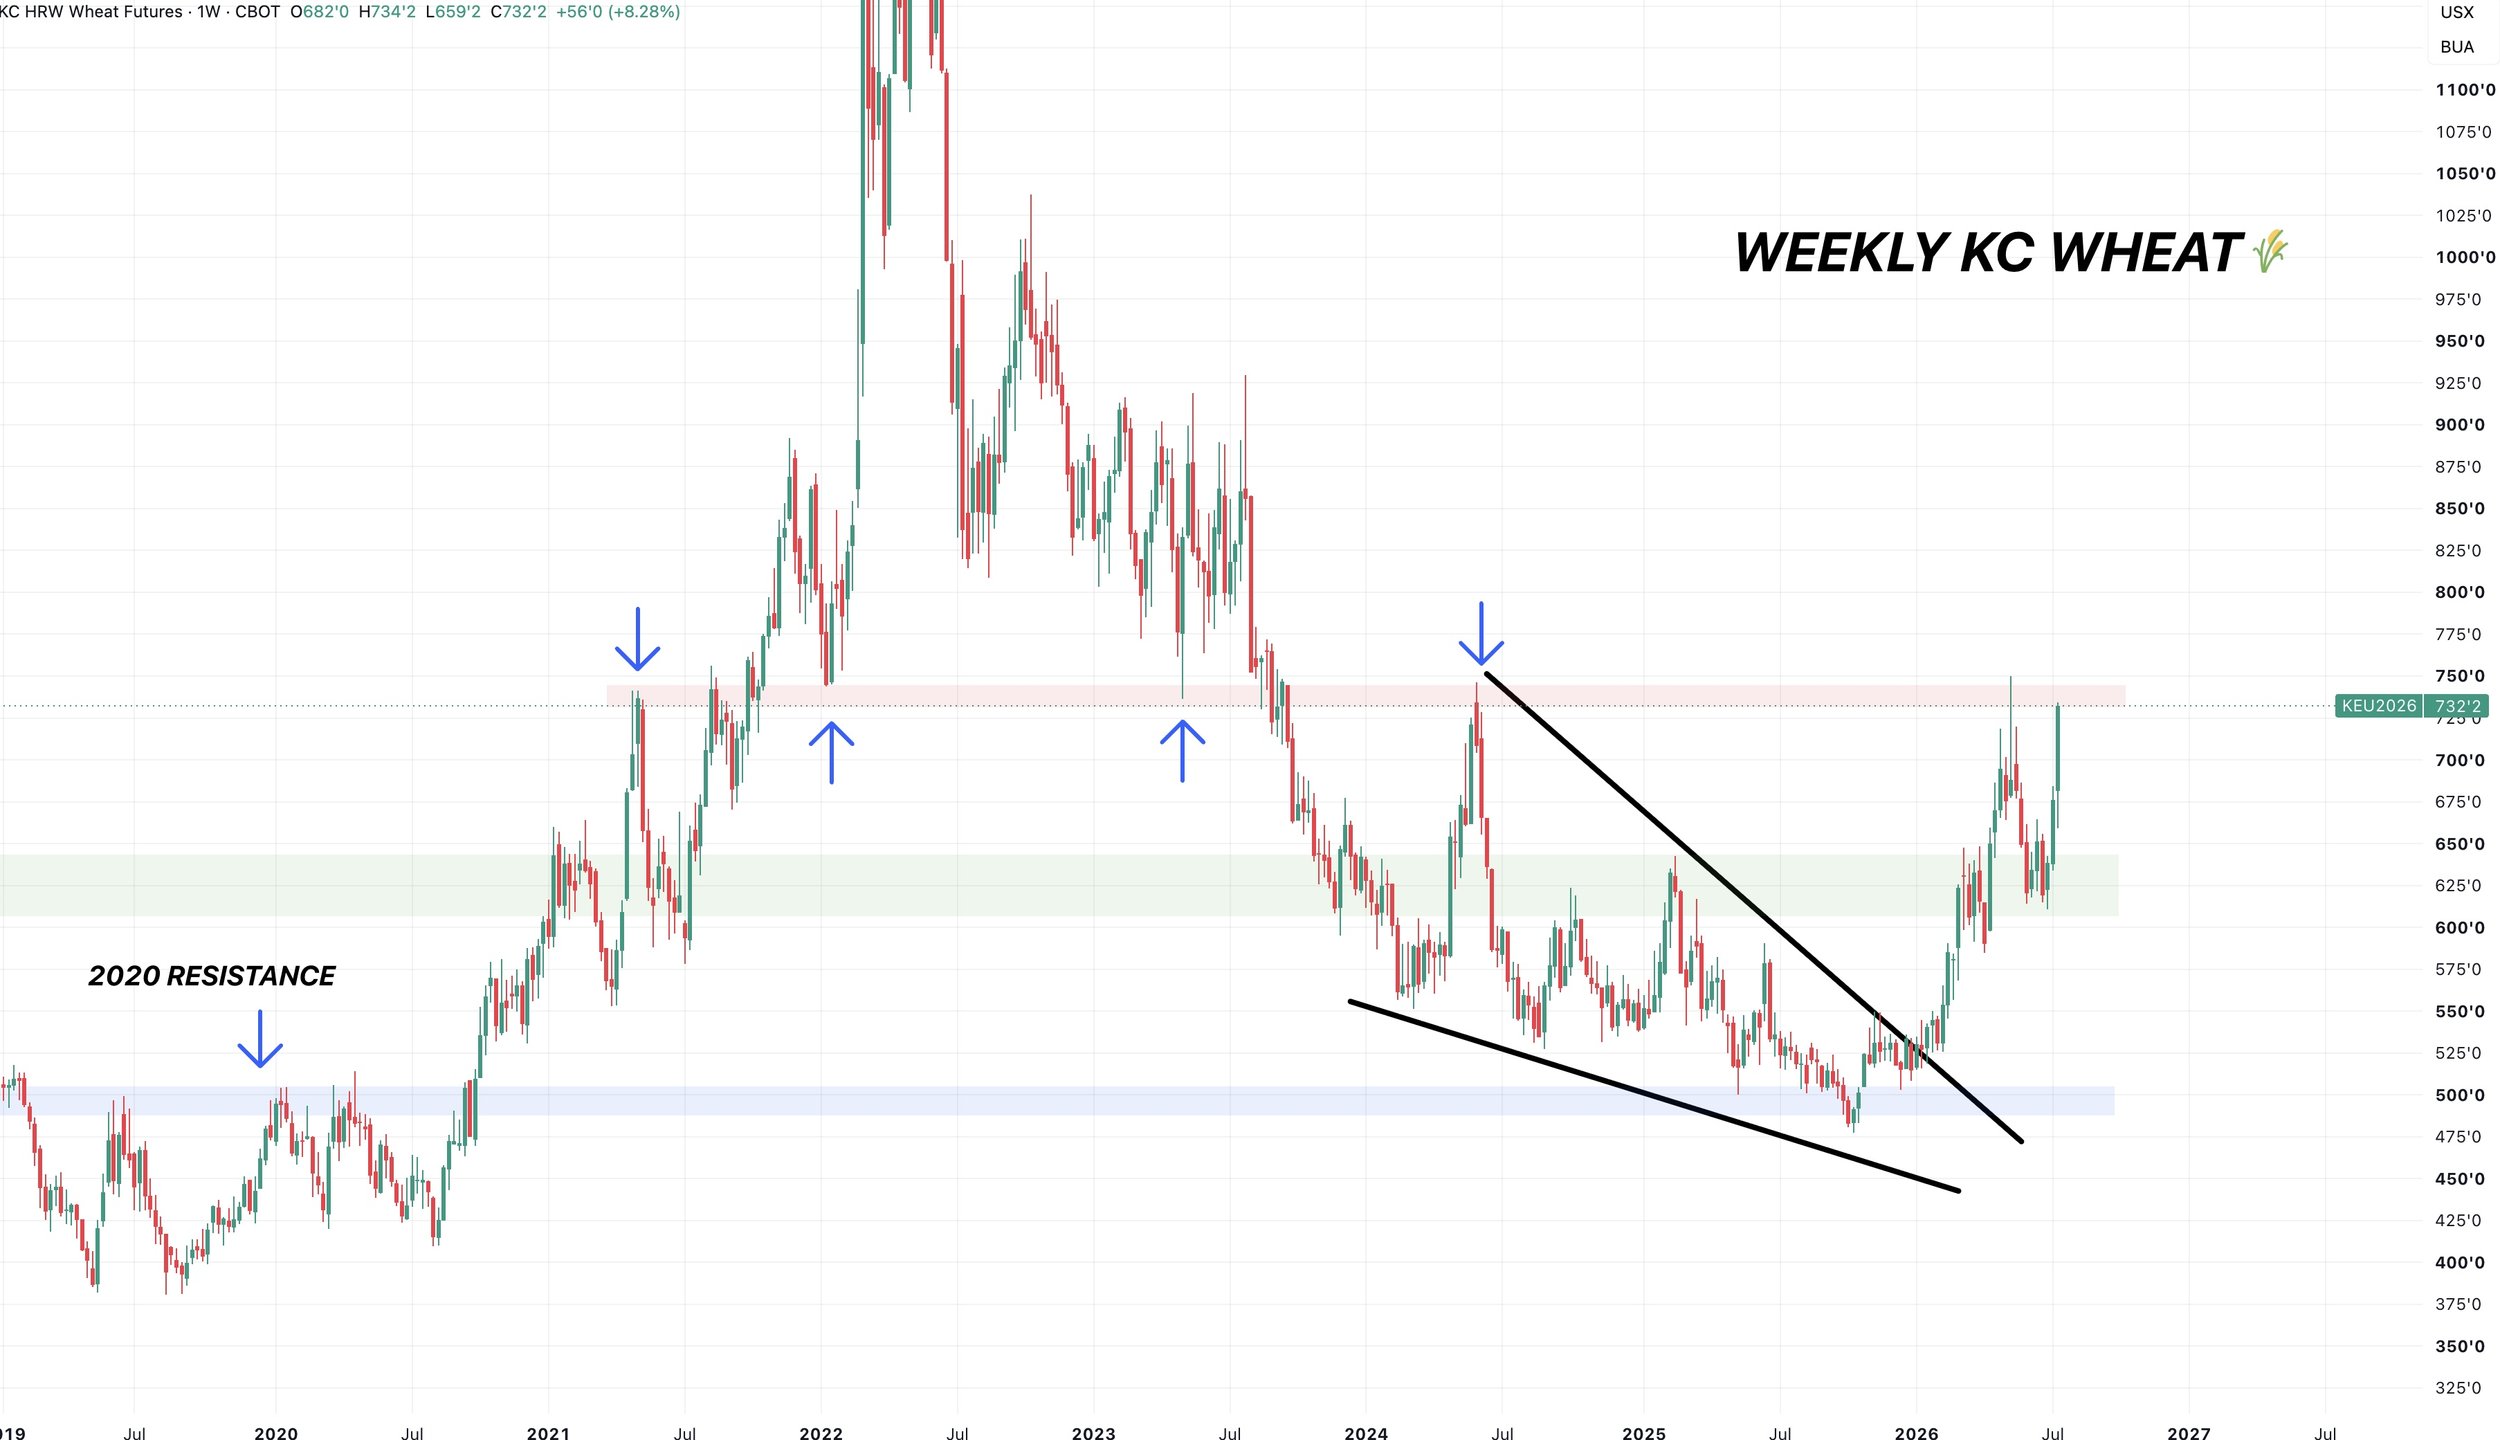
If we look at the big picture chart, if you break the recent highs there is definitely potential room to run.
We topped there this year.
We topped there in May 2024.
It was the 2022 lows.
We topped there in 2021 on two separate occasions.
So that $7.50 level is a pretty big level, and breaking it would look very promising.
The overall long term structure of this chart is definitely friendly.
Possible Bull Targets:
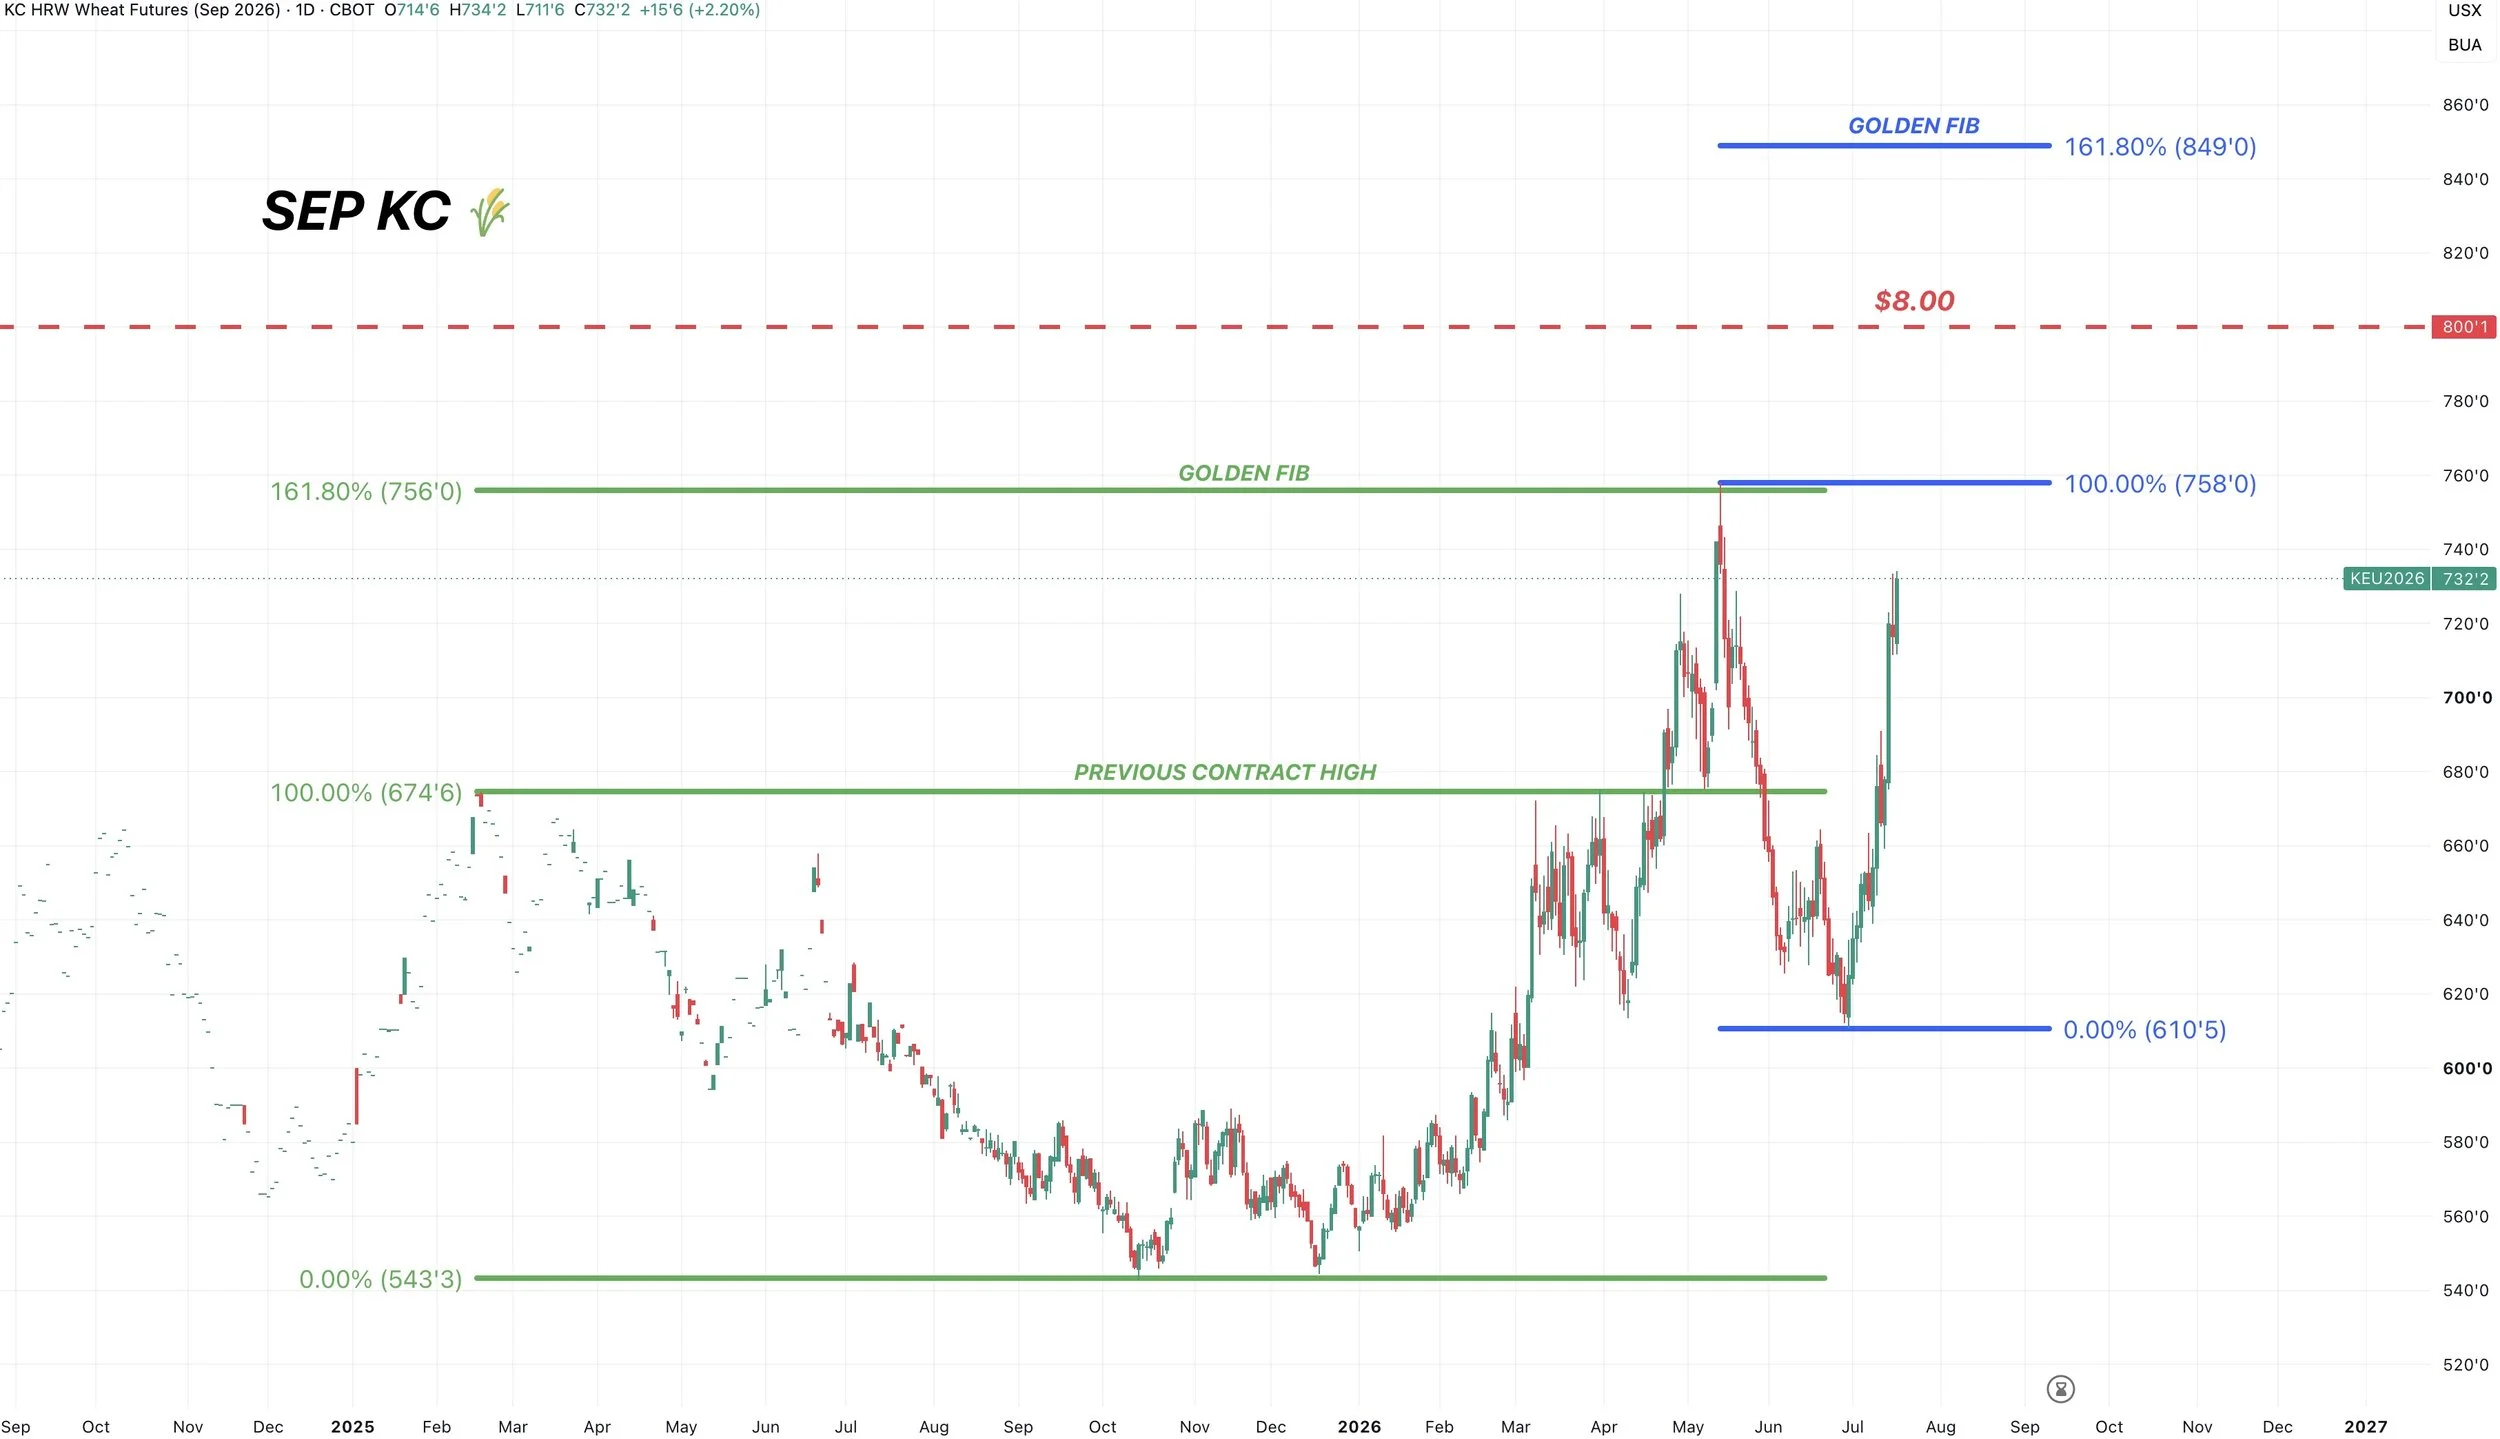
We identified that old target back in May by using the golden fib from the contract lows to the prior contract highs.
161.8% of the contract lows (0%) up to the contract highs (100%), came in at $7.56. Right where that May rally tapped out at.
Now if you took 161.8% of the recent lows, up to the May highs, it comes in at $8.49
So that would be a possible bigger picture target as well.
But first we have to break those highs at $7.58 which is going to be the first target.
Then we have the $8.00 psychological level.
Then the possible $8.49 level.
When you don’t know how something such as a geopolitical event will play out, it might make sense to simply incrementally reward each level.
Of course none of these targets have to hit, as charts can’t outguess what Russia or Ukraine is going to do. And no one has any idea how long the story will last or not. But they are possible levels to de-risk if they come.
In events like this, you can also wait for some sort of trigger and reason to sell. For example, the weather rally was priced in when we traded limit up but reversed right after the USDA report.
Cattle
Aug Live Chart:
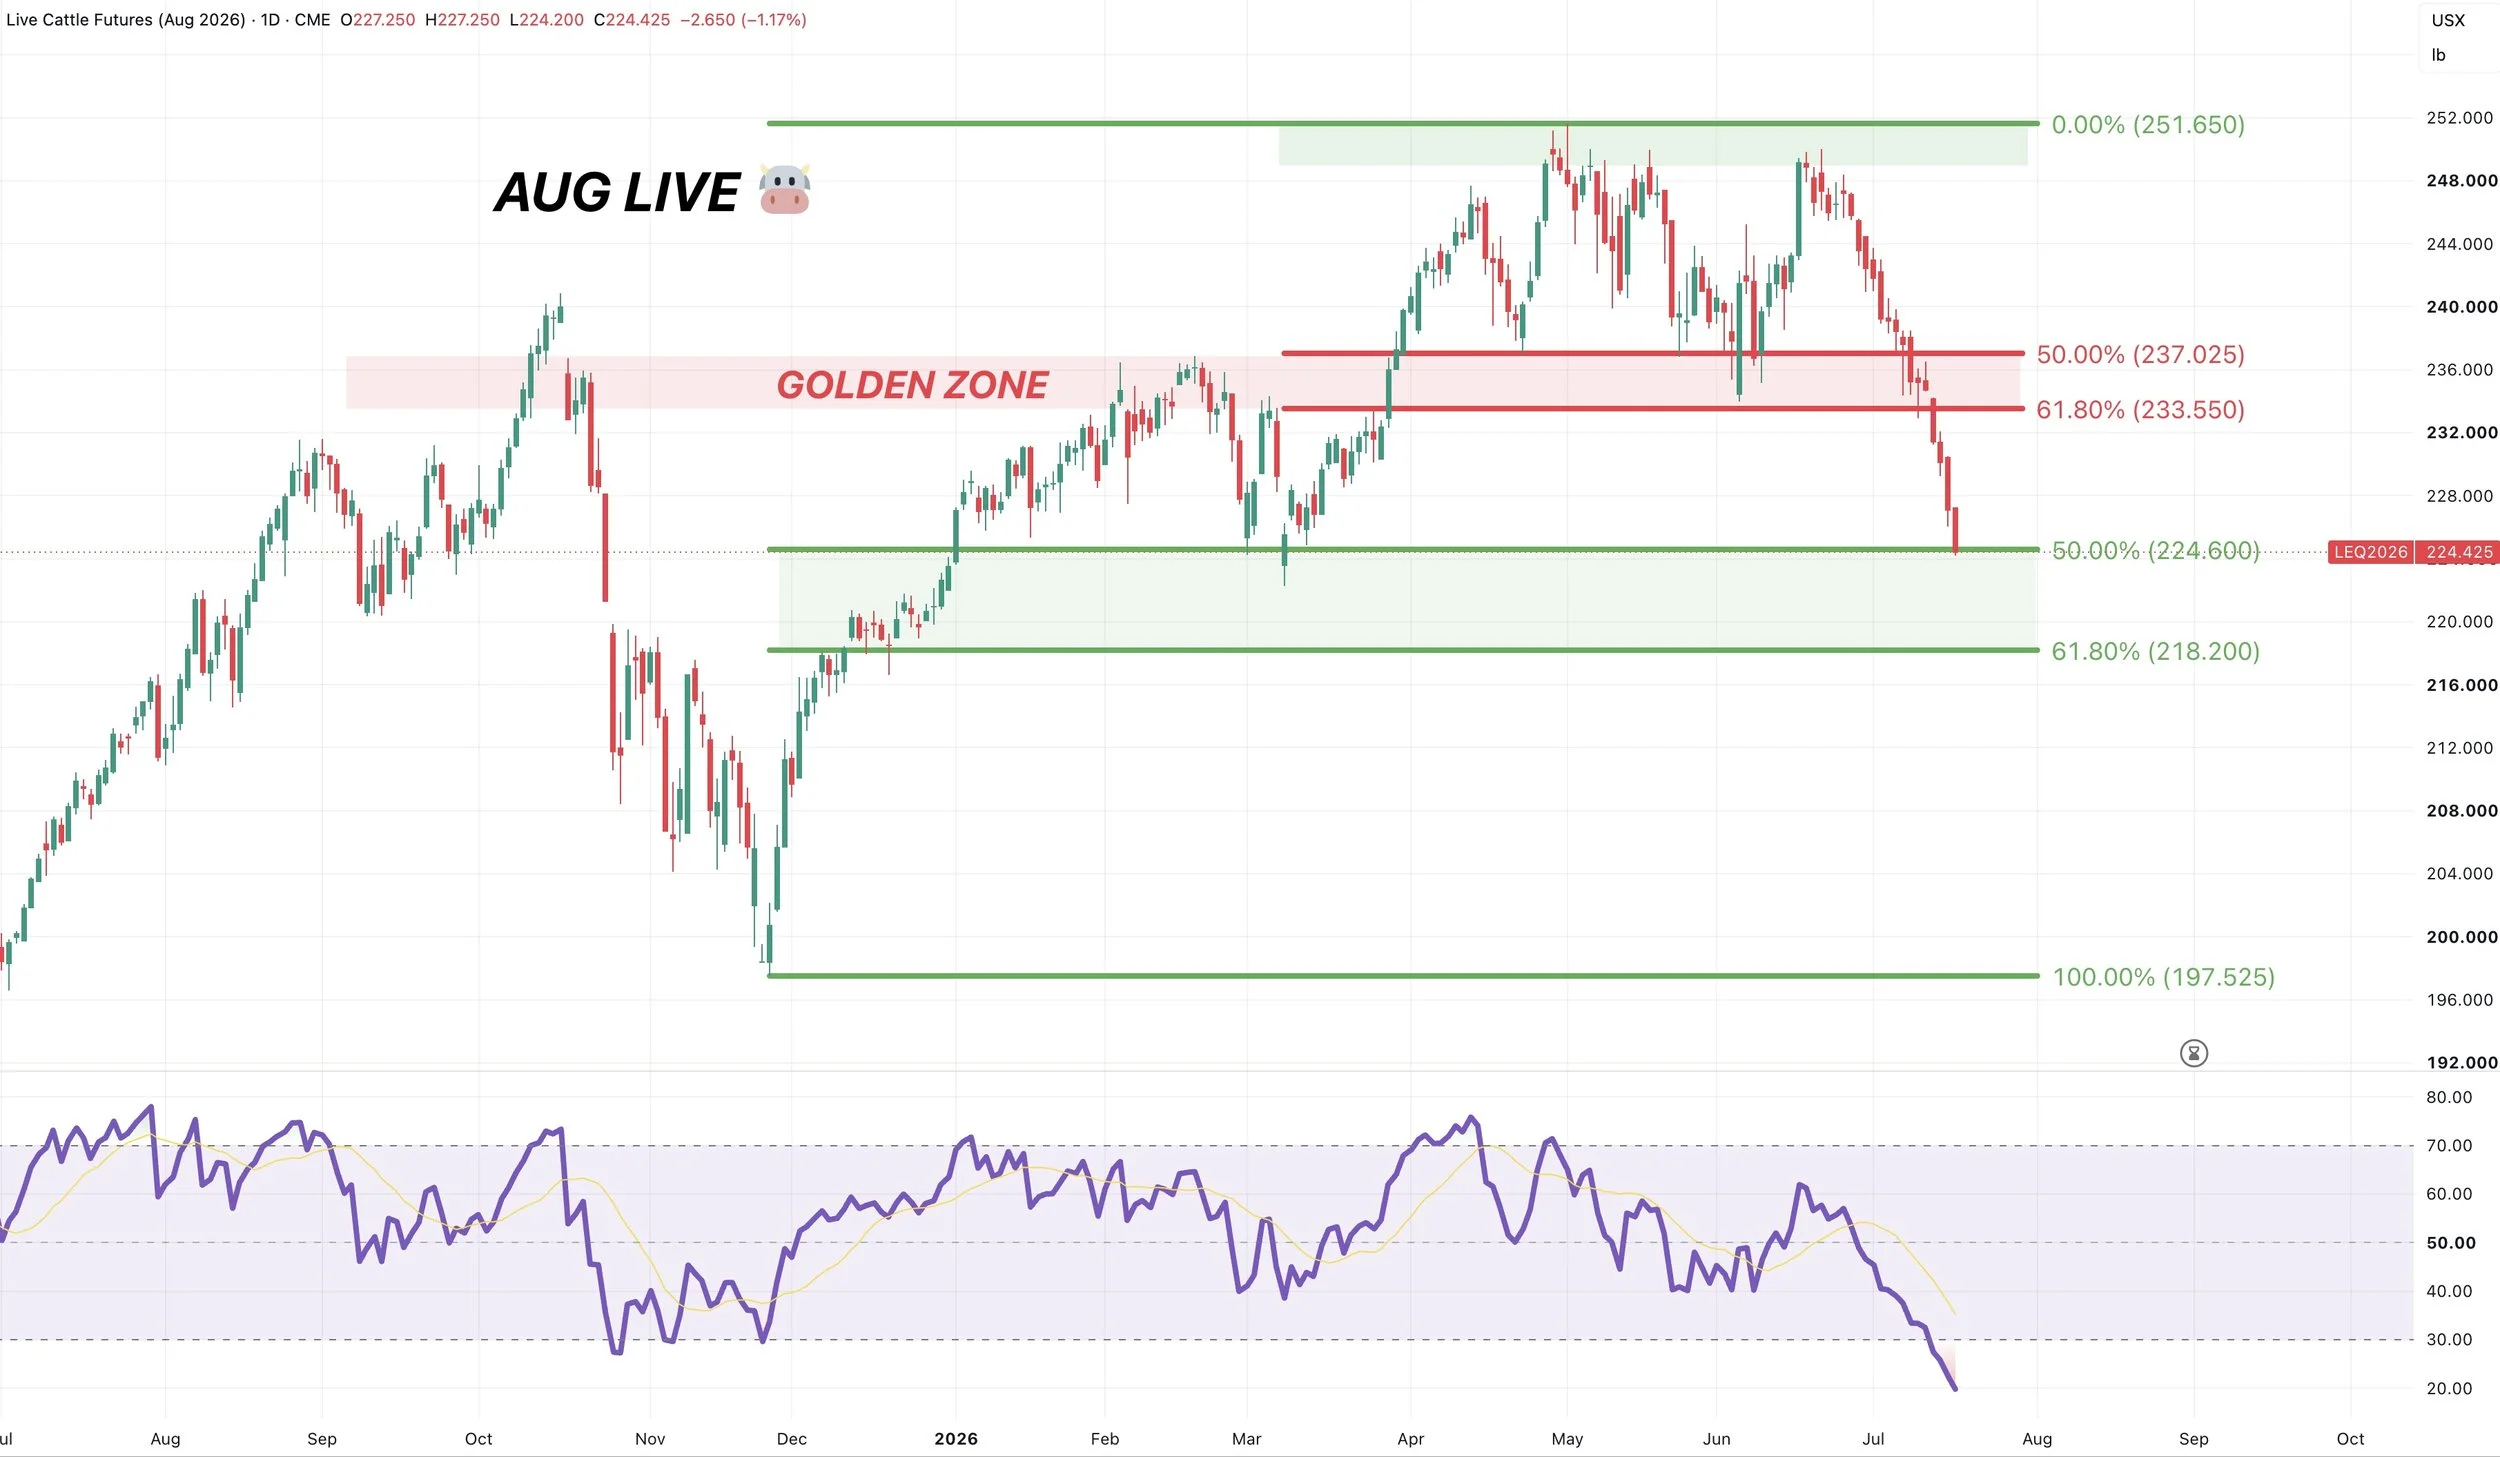
Live cattle has been lower for 15 days in a row.
The trend is clearly lower from here.
The warning sign was breaking the golden zone down to the March lows like we had been talking about.
We are now getting oversold and entering the golden zone all way down to the December lows.
So we should expect some sort of dead cat bounce here soon.
If you lose this golden zone, it would be a bad sign.
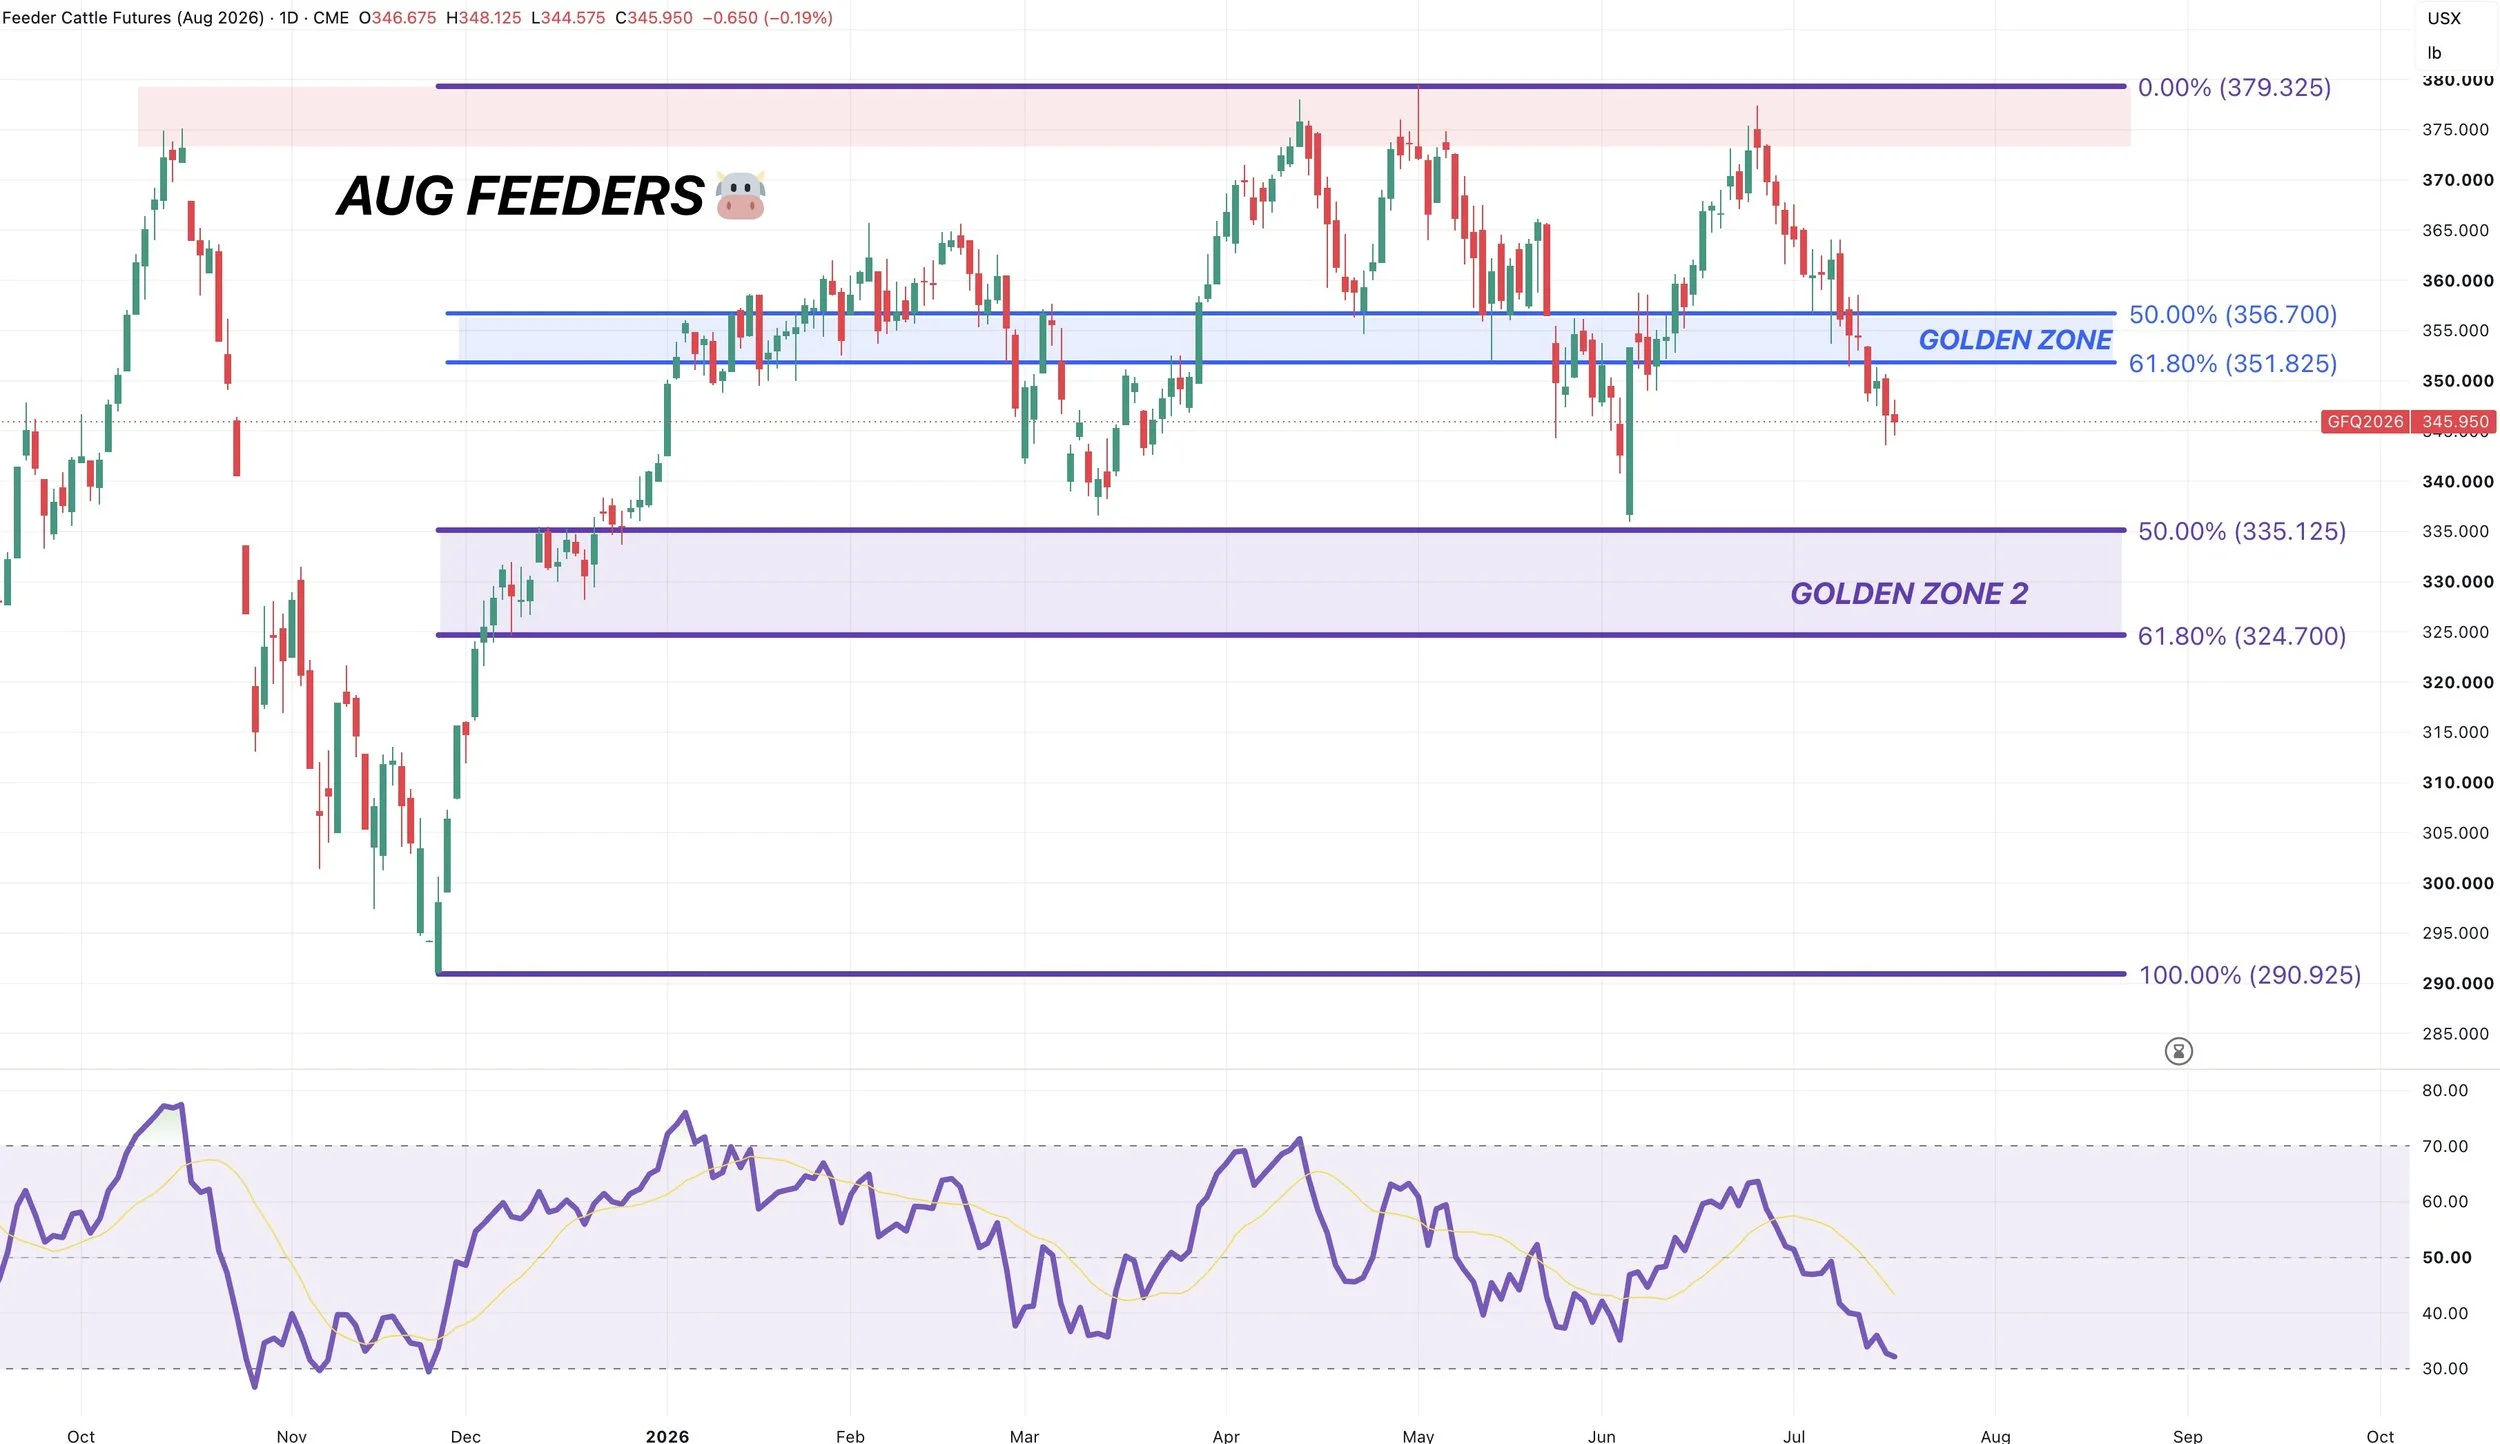
August Feeders Chart:
Holding up a lot better than live cattle.
But also broke some key support, so would not be surprised to see further downside.
Like in live cattle, we are getting a little oversold. So could be due for a dead cat bounce.
Want to Talk?
Our phones are open 24/7 for you guys if you ever need anything or want to discuss your operation.
Jeremey & Office: (806)484-1214
Sebastian: (605)280-1186
Email: sfrost@dailymarketminute.com
Hedge Account
Interested in a hedge account? Use the link below to set up an account or give us a call.