
REPEAT OF 2010? BEARISH STOCKS FAVOR REVERSAL?
MARKET UPDATE
You can scroll to read the usual update as well. As the written version is the exact same as the video.
Timestamps for video:
USDA: 0:00min
2010 Deep Dive: 5:30min
Corn: 8:45min
Beans: 13:45min
Wheat: 16:15min
Cattle: 17:30min
Want to talk?
Office: (806)484-1214
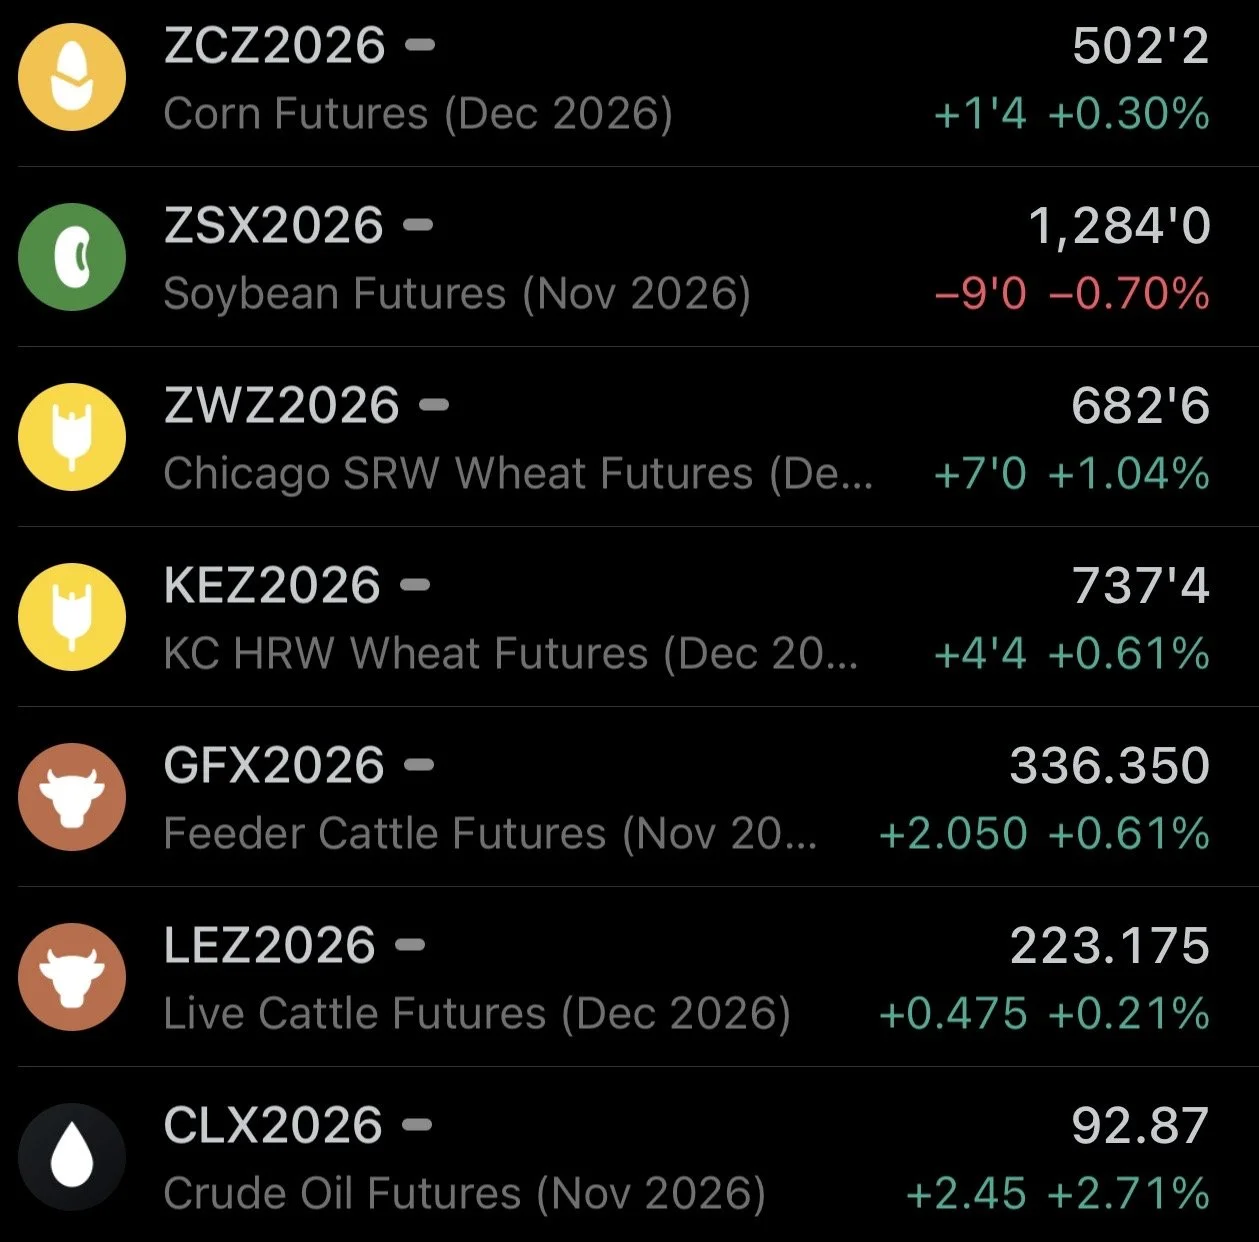
Futures Prices Close
Overview
Corn and wheat slightly higher while the soybean market traded lower today following yesterday's eventual USDA quarterly stocks report.
Meanwhile, the cattle market, specifically feeders continues to catch a bid.
Today we'll be going into what this report actually means and doing a deep dive into what happened back in 2010. As there are some interesting comparisons that shouldn’t go unnoticed.
Then we'll of course be going over the charts. As I do believe both corn and wheat are approaching some good areas of support.
But let's jump right into the report.
USDA Breakdown
Jeremey broke a lot of it down yesterday, but let's look at the potential impacts this report could have and what it all means.
Below are the numbers vs the estimates.
Corn production came in slightly lower on less harvested acres. While they left yield alone. However the big surprise was of course the stocks. As they came in +170 million higher than the USDA's WASDE report.
Since the USDA didn’t really cut production that much, this means that the USDA cut old crop demand. Which was were the shock came in.
But before we get too far into corn, let's run through the rest of the report quick.
For wheat, it wasn’t a big market mover. The stocks number was slightly friendly, while the production number was slightly bearish.
For soybeans, the report was on the friendly side. They did not cut soybean production, but soybean stocks came in down -10 million bushels vs the WASDE.

Since the USDA did not cut soybean production, yet stocks were lower. This means that the USDA has old crop soybeans gaining +10 million bushels of demand.
Who knows exactly how the USDA will change things next report, but if we take this report at surface level. This 10 million would carry over to the new crop balance sheet in the form of less beginning stocks.
Bringing the carryout from 310 million down to 300 million.
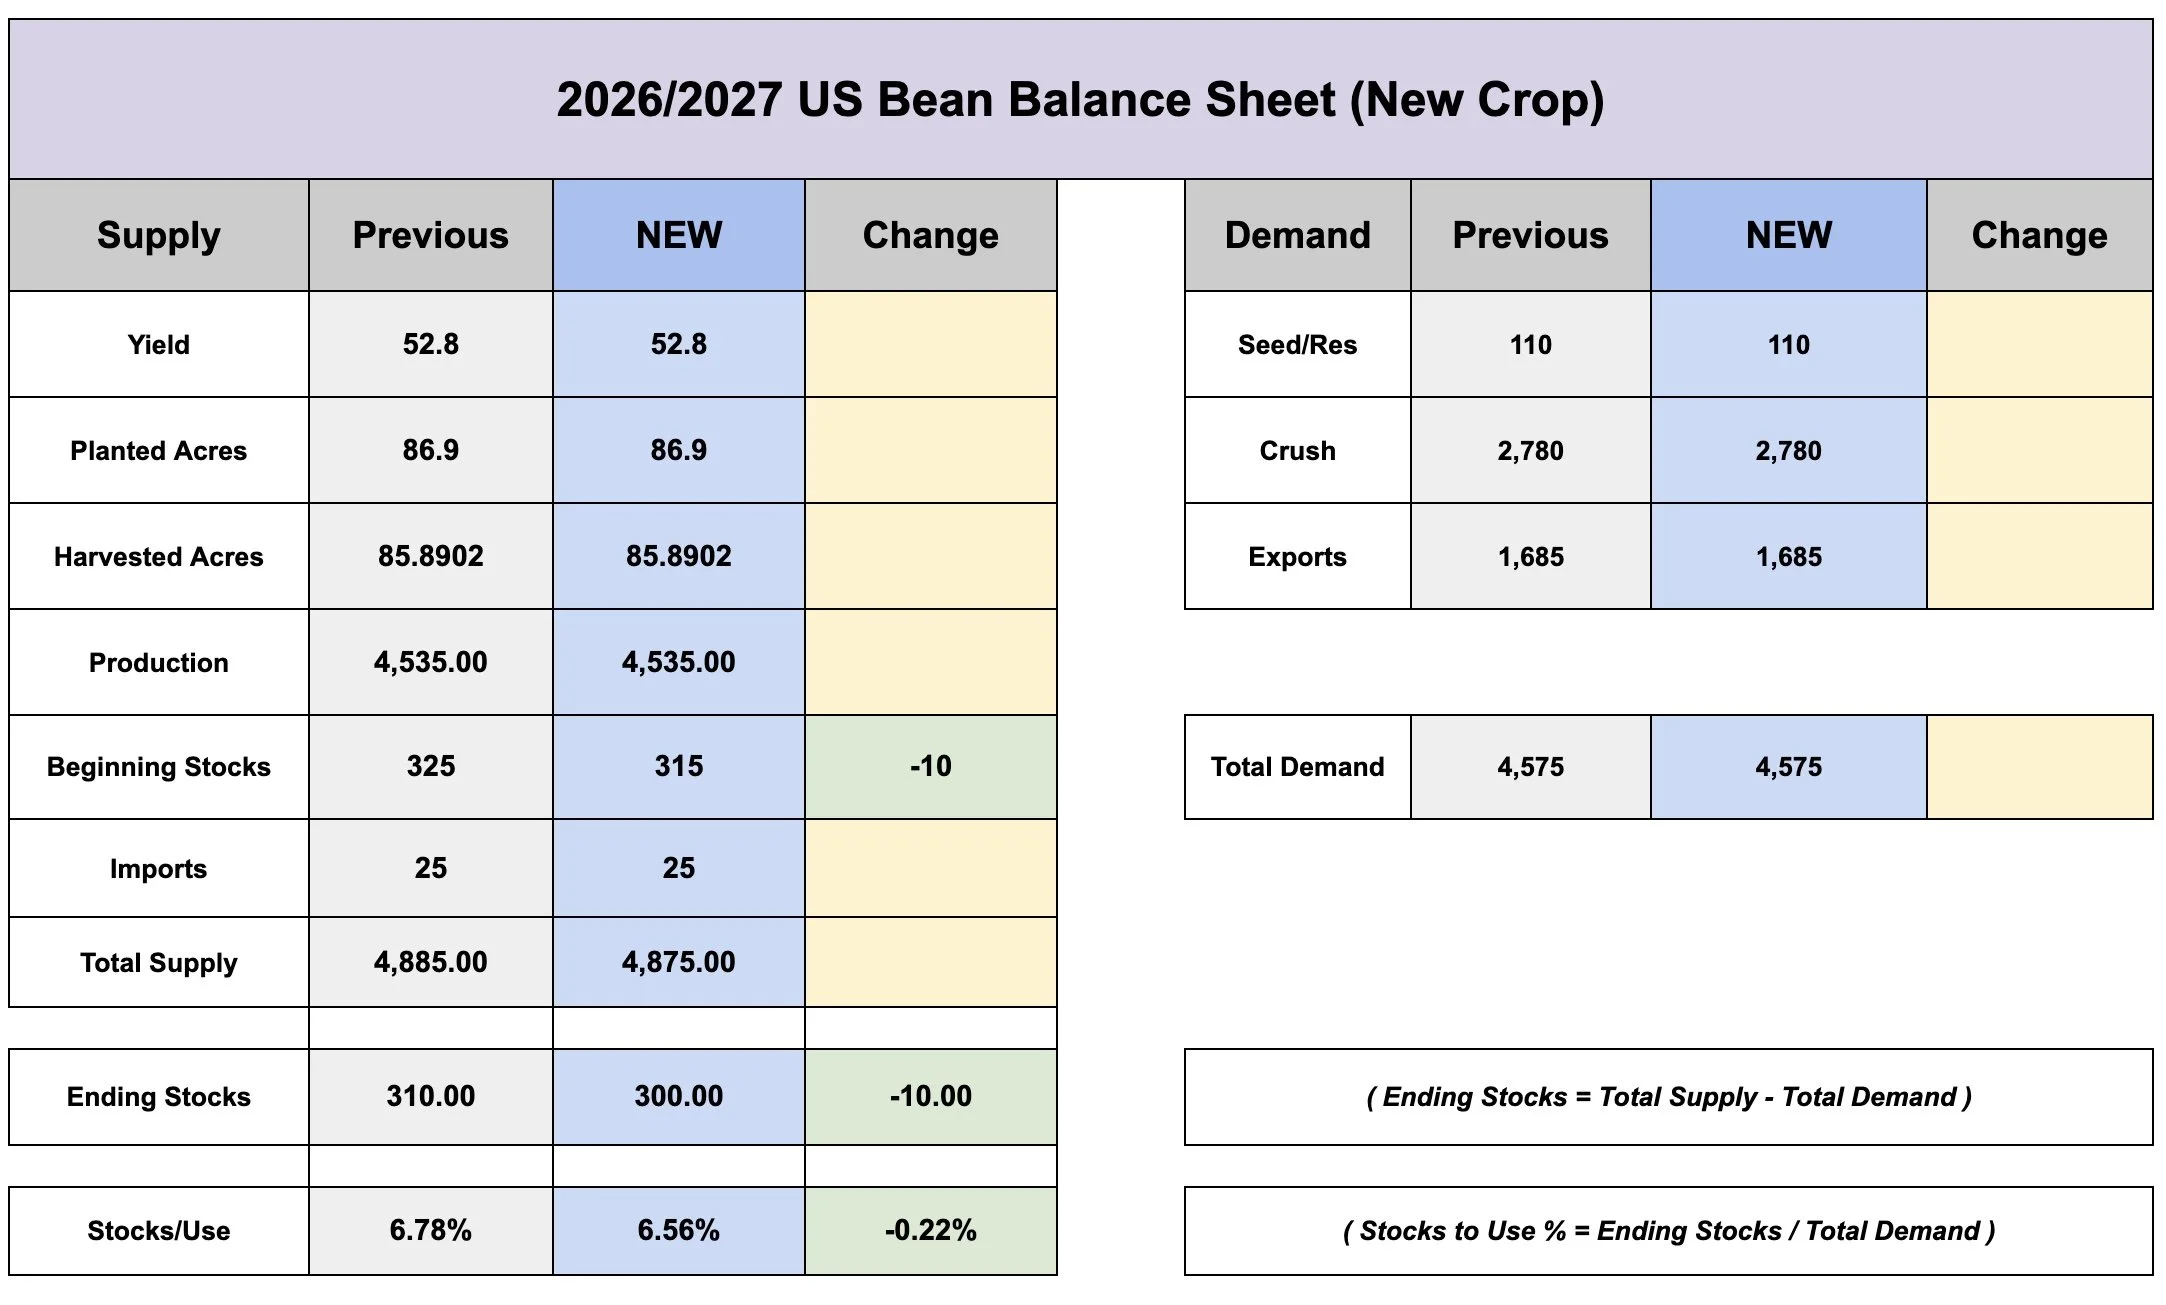
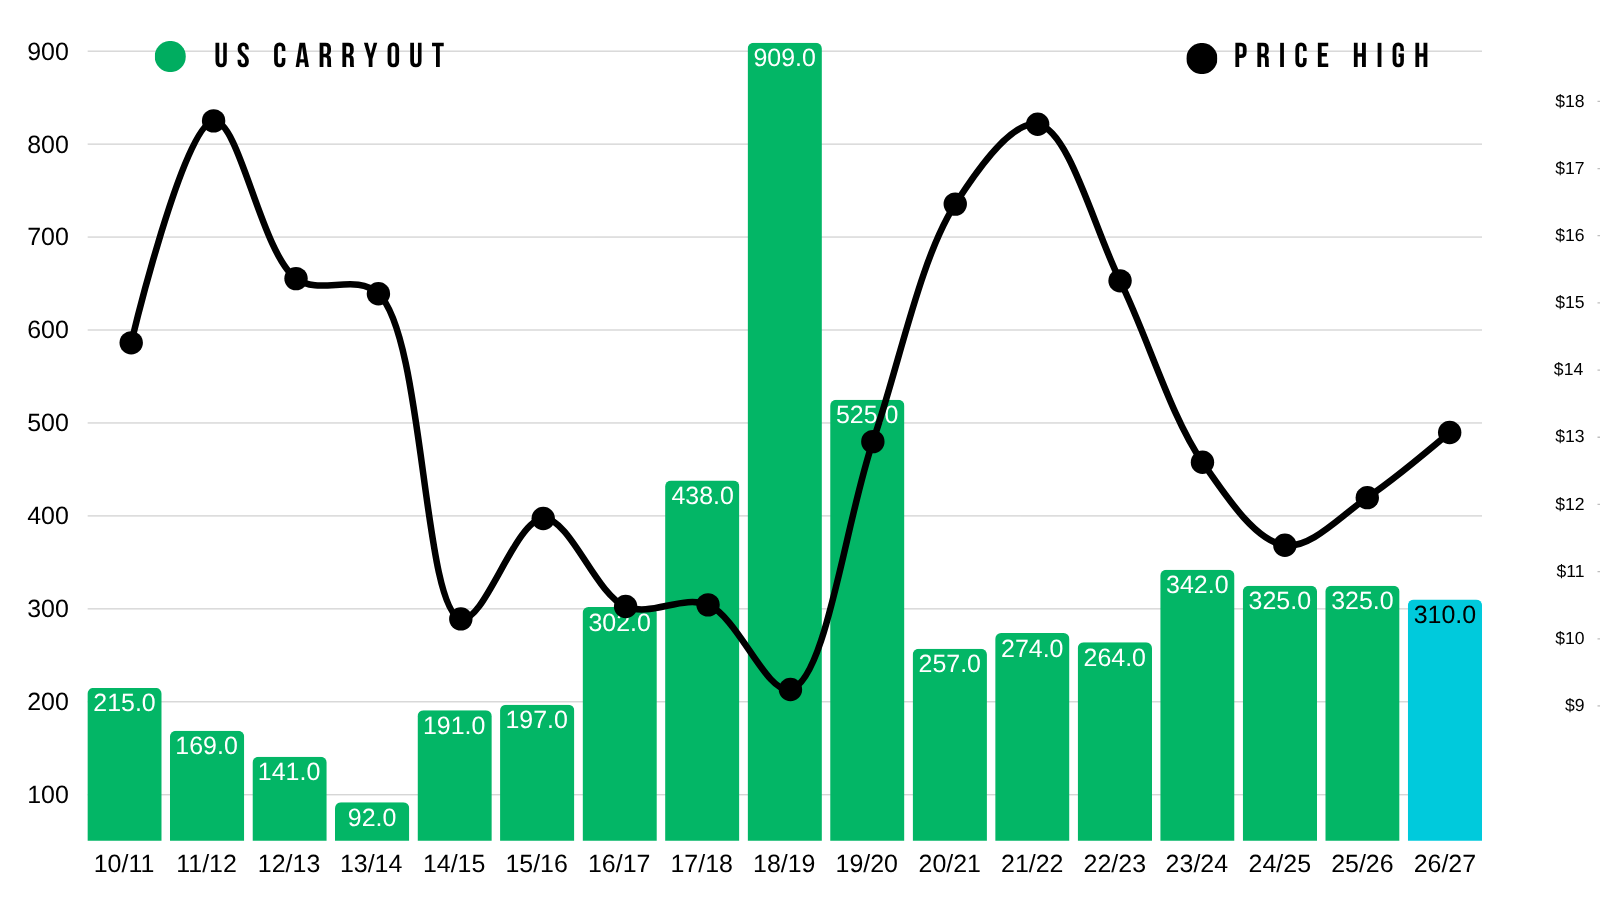
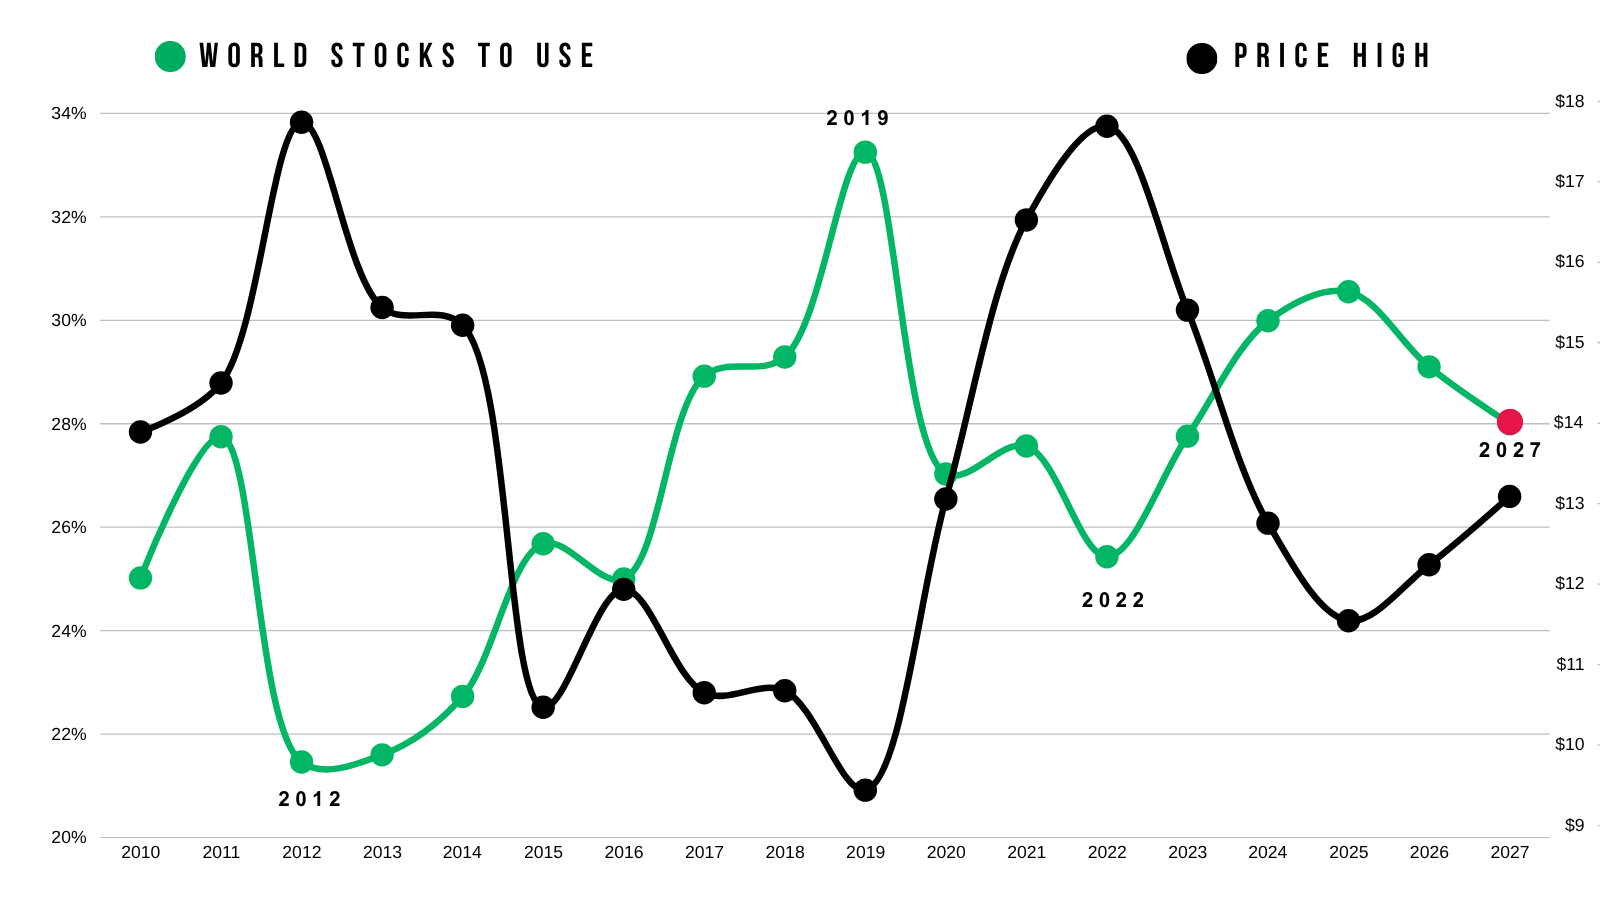
We always talk about how a sub 10% stocks to use in corn is viewed as bullish.
Well a sub 300 million carryout in soybeans would be viewed in a similar way.
We haven’t had a sub 300 million carryout since the bull market.
Now for corn.
As we mentioned, the USDA bumped stocks by +170 million.
Why did they do this?
As we mentioned, since they only cut production slightly, this means the USDA cut the old crop demand numbers.
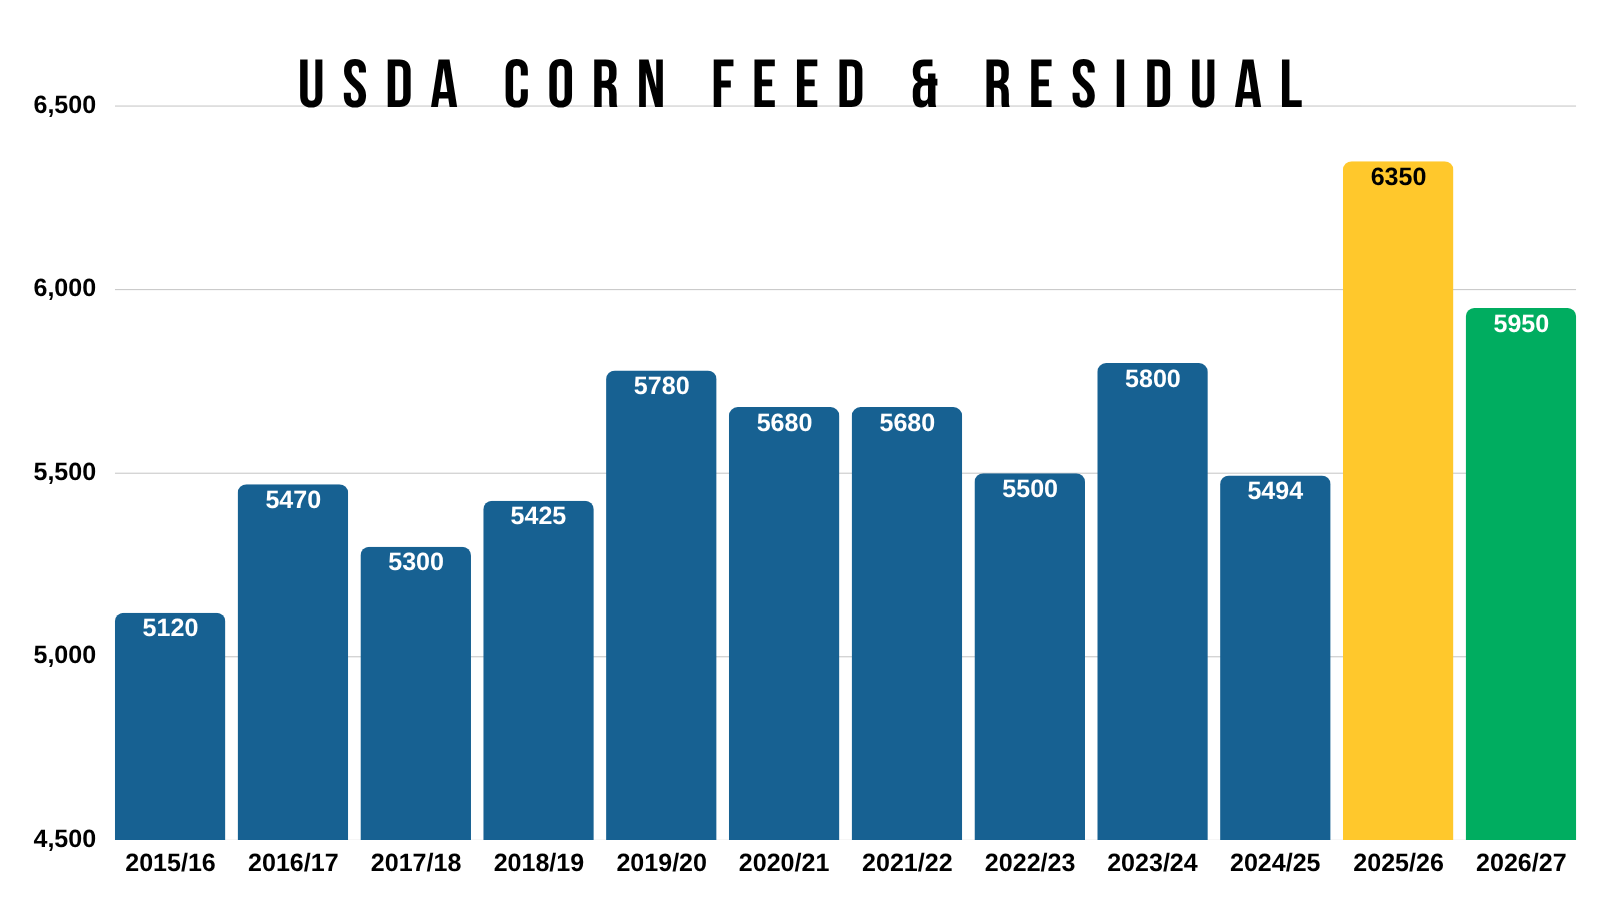
We already have a good grasp on exports and ethanol. As there are reports to track those two. Which means the USDA likely dropped the feed and residual demand.
The feed and residual number has been a heavily debated topic since last year. The number didn’t make a ton of sense to begin with, as the old crop number was +900 million more than the prior year and +400 million more than the new crop balance sheet. Both of which are massive differences. So it's not shocking the USDA finally lowered it.
The USDA literally uses this number to mess with the balance sheet however they want. It's the category where they put unexplained bushels. There is no way for anyone to track this number. It's simply a "play" number. No one knows how the USDA even comes up with this number. So yes, it's somewhat bogus, but that's what we have to deal with.
You would’ve liked to see the USDA offset that drop in feed and residual with a bigger cut to old crop production, but they didn’t.
We'll touch more on this in a little bit...
But what exactly does this do to the balance sheet?
At surface value, since the USDA increased the old crop balance sheet by +170 million, you would then add +170 million bushels to the new crop balance sheet via beginning stocks.
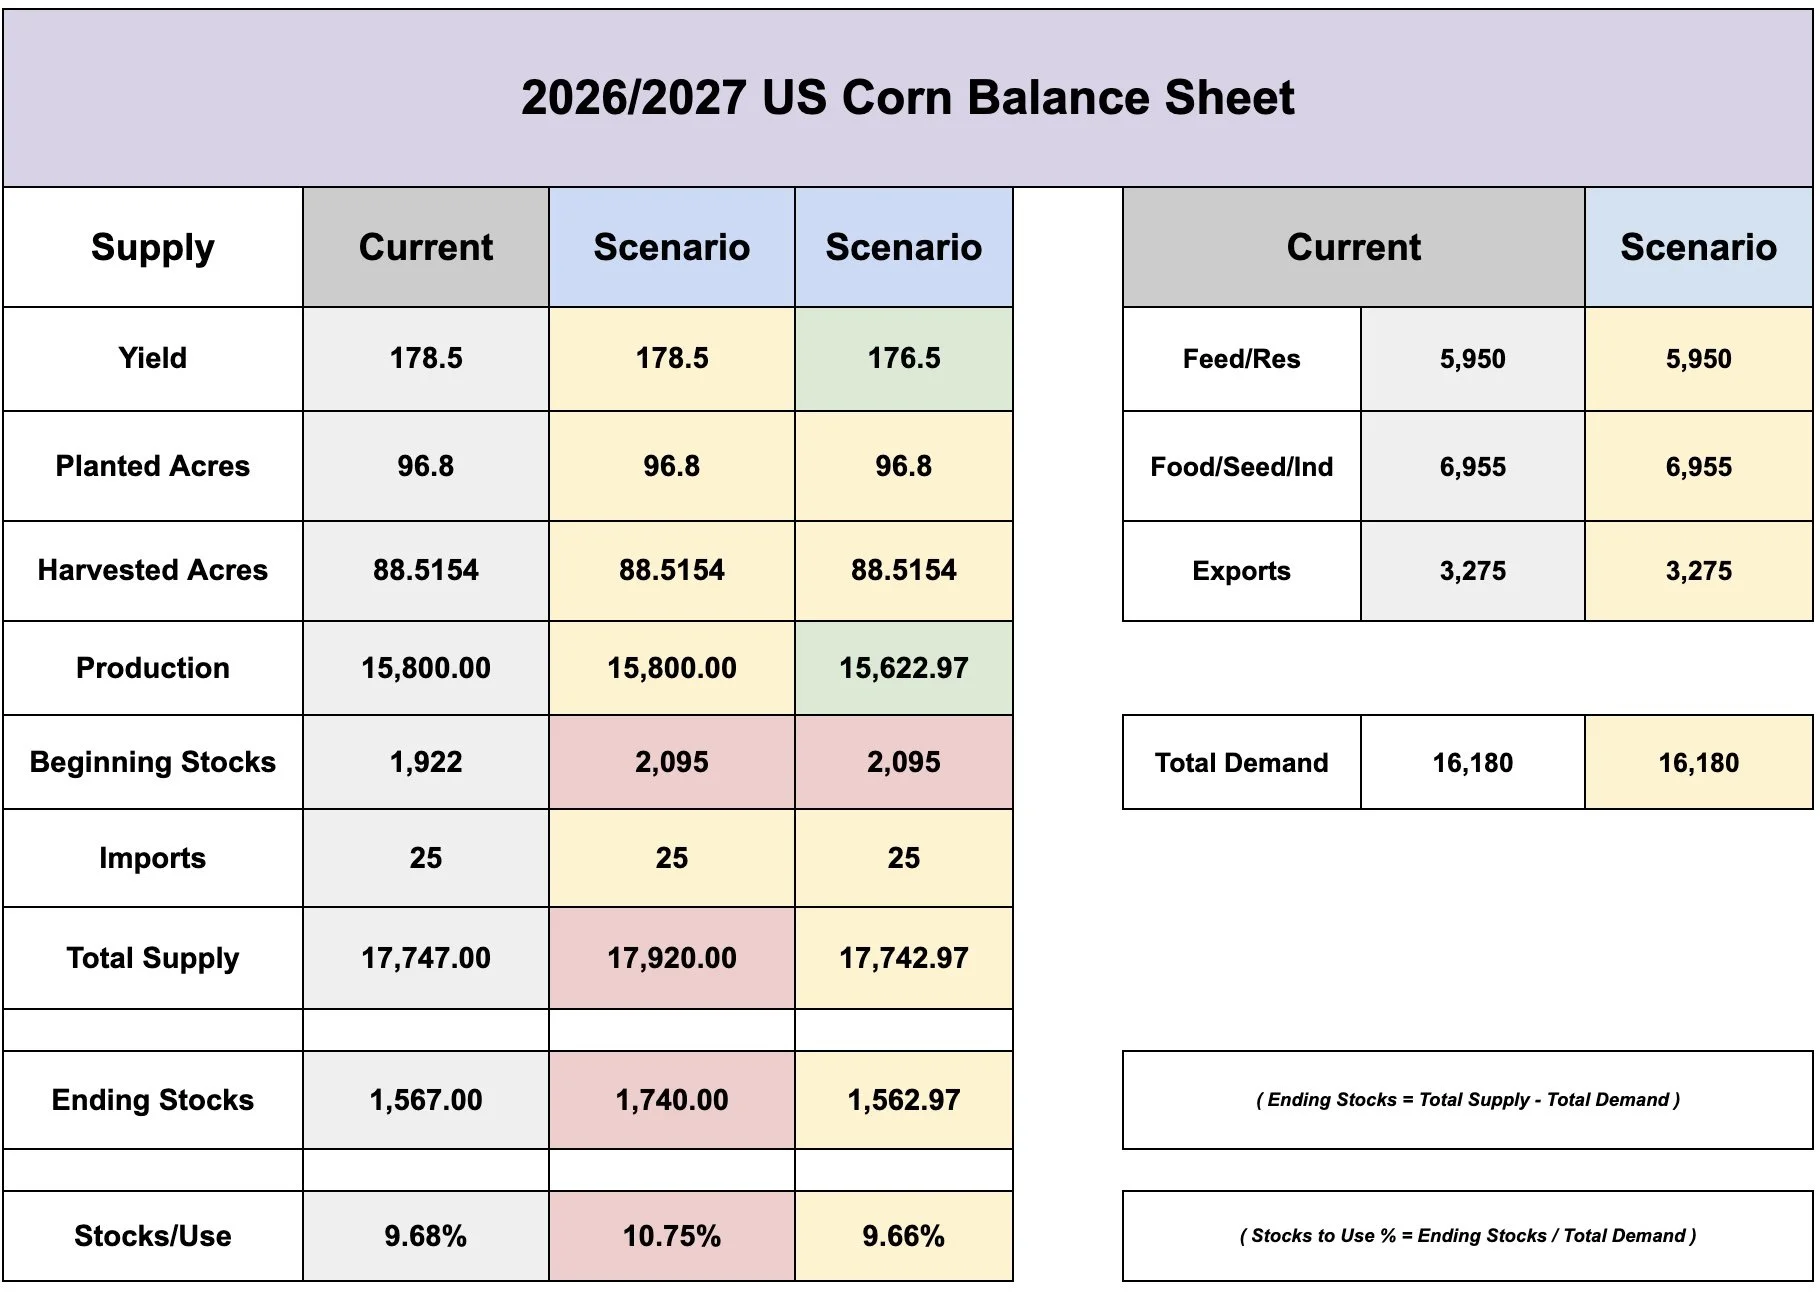
Column 1 is the current balance sheet.
Column 2 is the balance sheet with the extra beginning stocks.
This change drasticallly bumps the old crop stocks to use from 9.7% all the way up to 10.7%. No longer below that magic 10% number. Which is why the market had as bearish of a reaction as it did.
What this also did is it gives the balance sheet a larger room for error when it comes to yield.
Column 3 is the balance sheet with the new beginning stocks, minus -2 bpa on the yield. From 178.5 down to 176.5. If you notice, the balance sheet and stocks to use stays the exact same as was before the extra beginning stocks even with -2 bpa of less yield.
So basically, there is an extra 2 bpa of wiggle room on yield now. In the next report, the USDA could cut yield by 2 bpa and it would stay the exact same. Without touching demand of course.
Here is what a 9.7% vs a 10.7% stocks to use looks like.
The current number vs how these extra stocks would affect the balance sheet without changing anything else such as yield or demand.
It would be a big change.
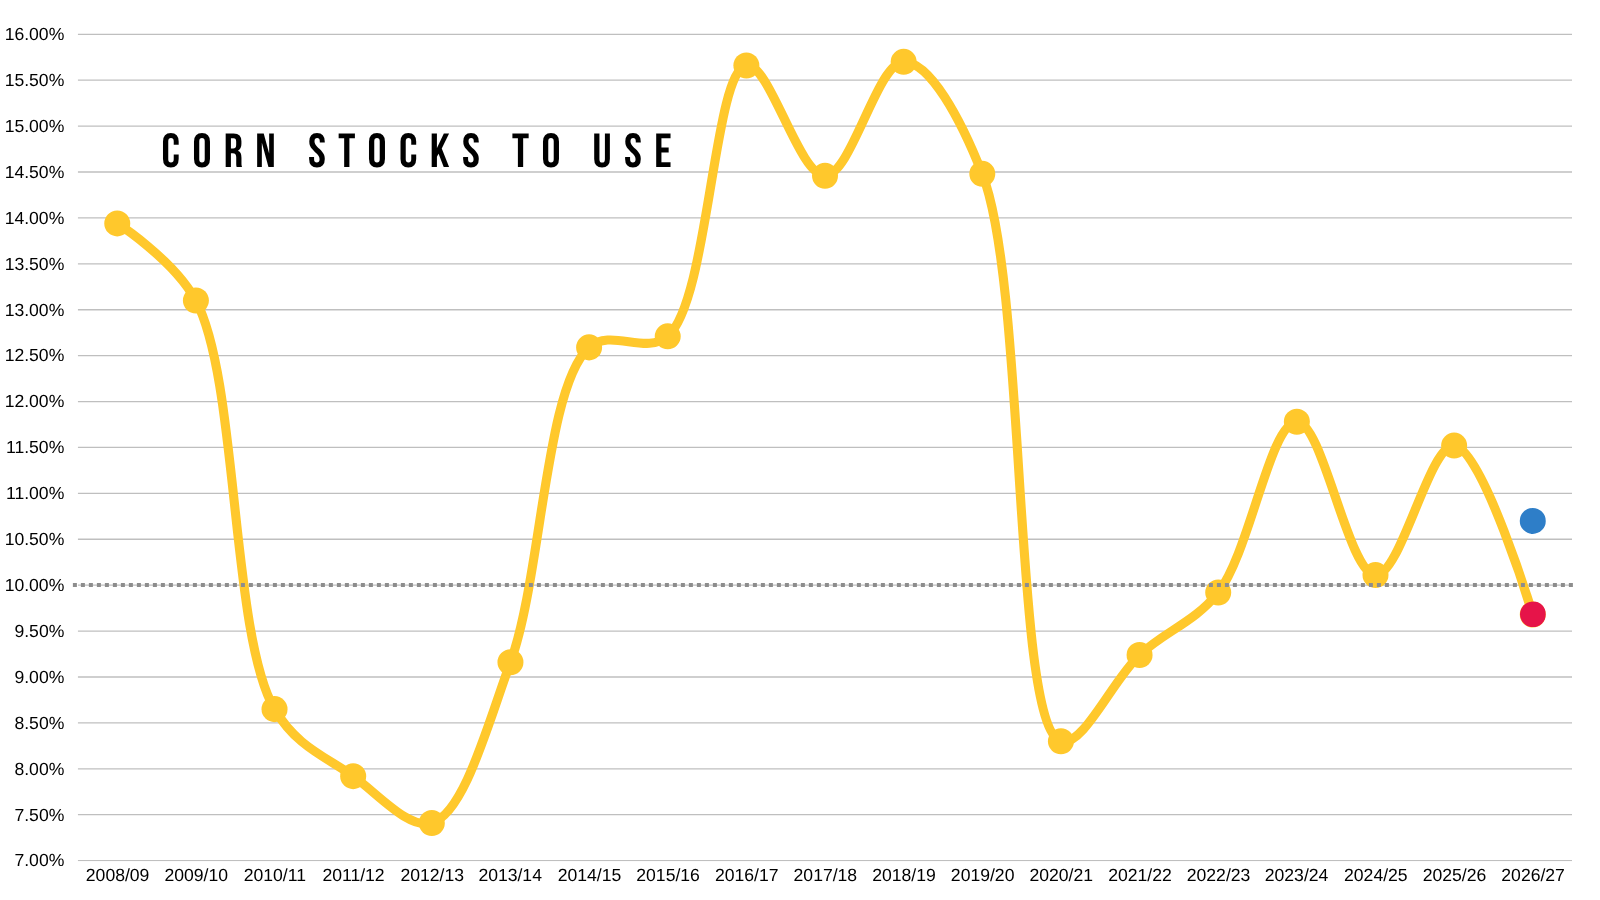
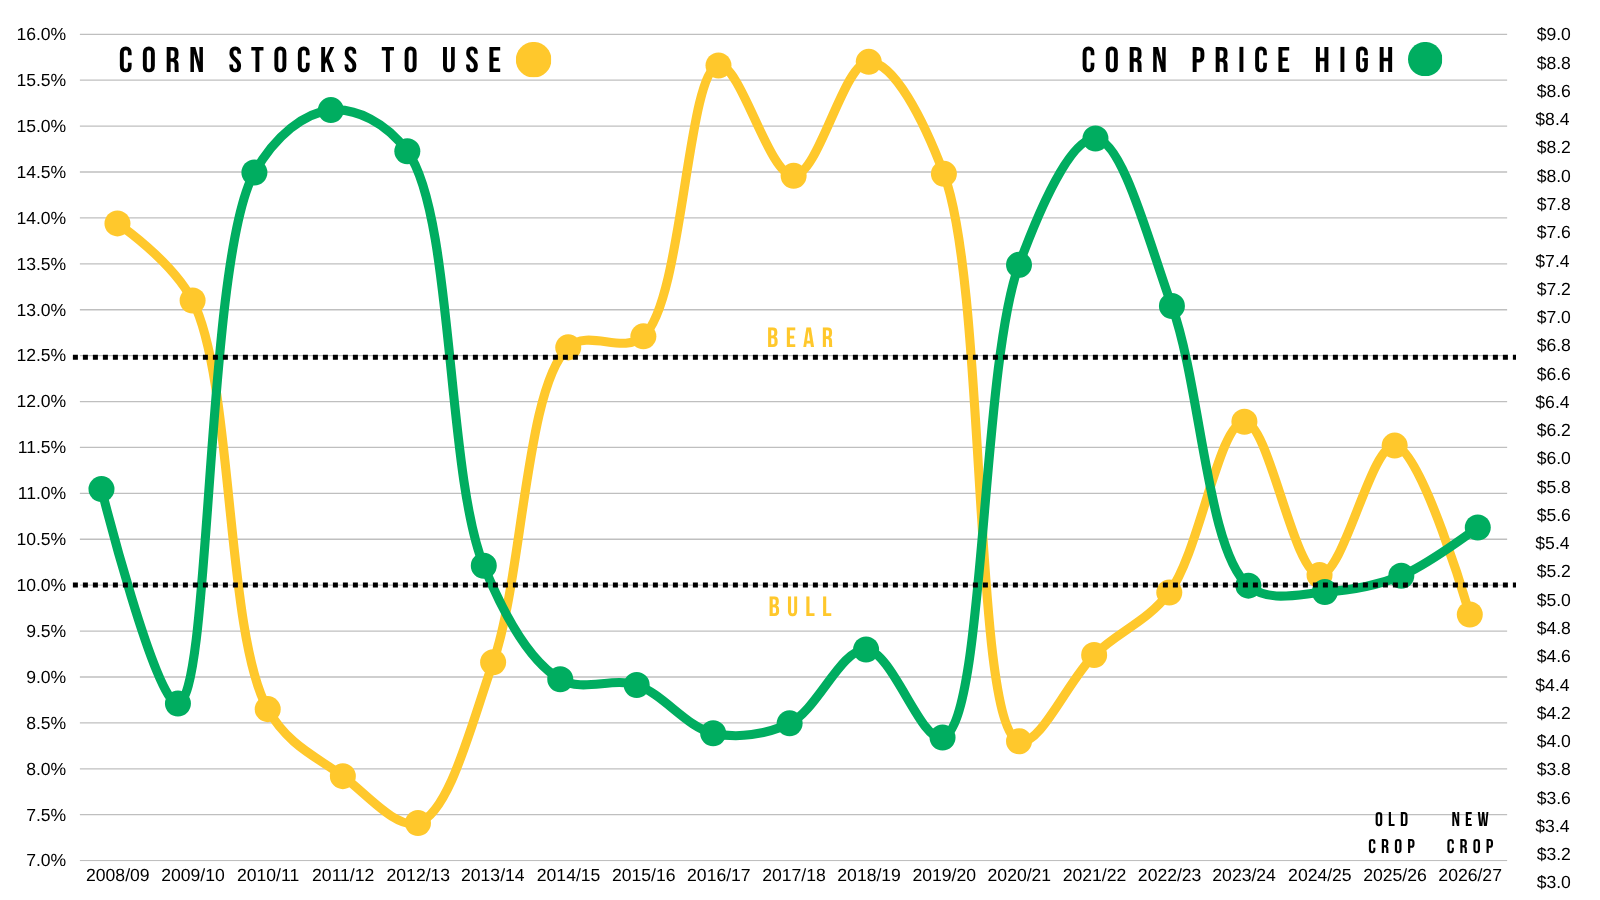
That change would bring you out of that "bullish" territory we always talk about.
So on the surface you would say that it's bearish. And the market had a valid reason for reacting the way it did.
(This chart shows stocks to use vs corn prices)
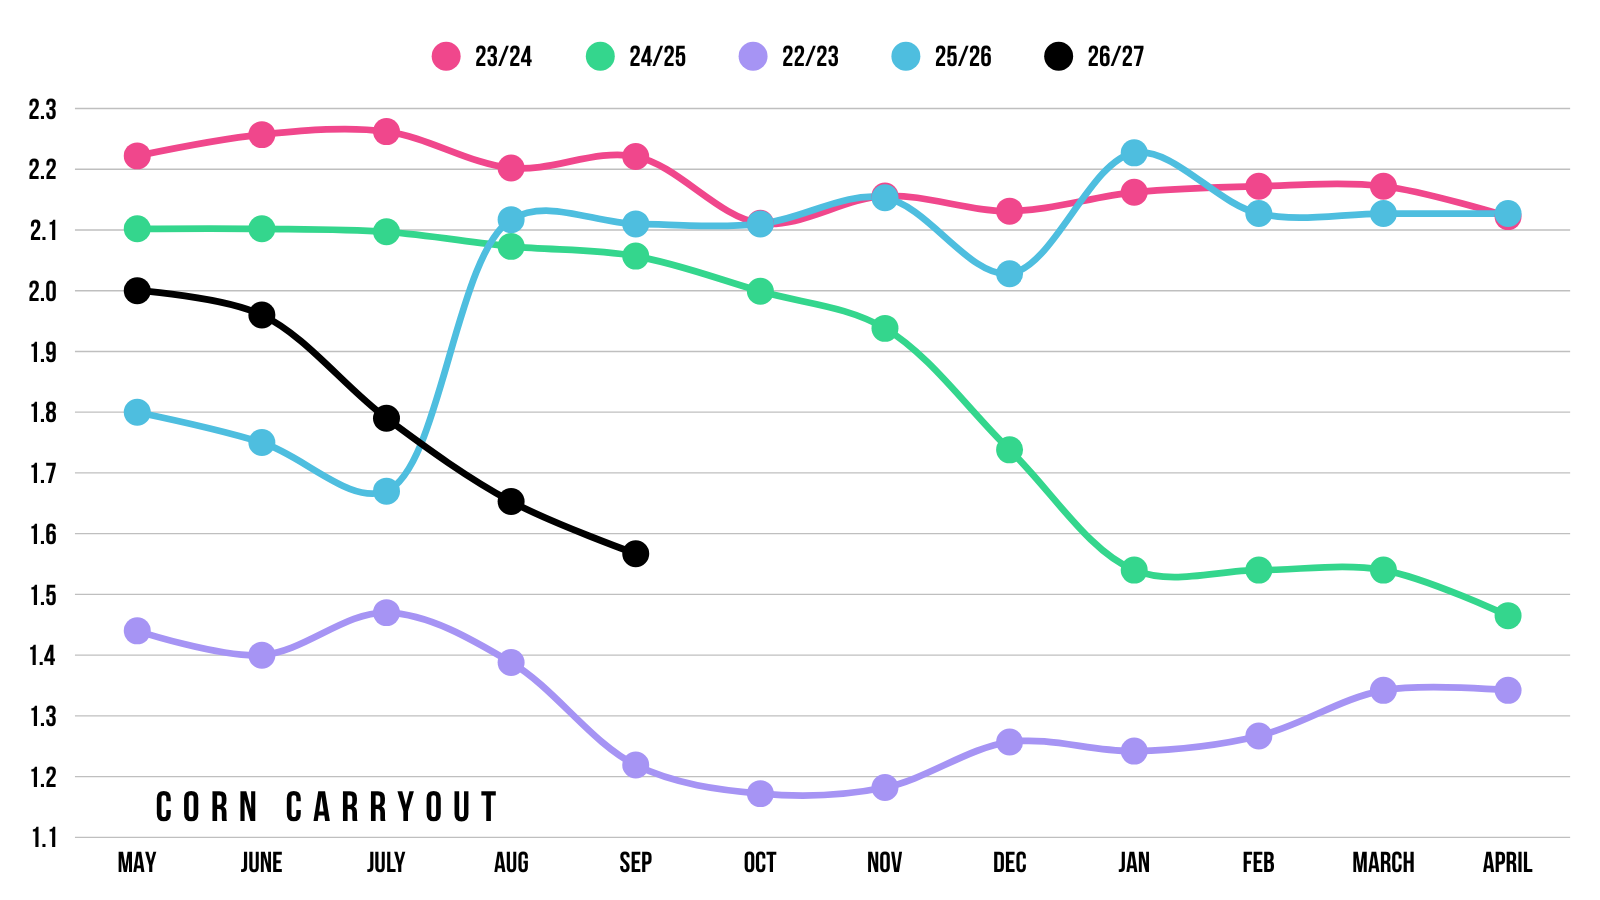
But I am very confident the USDA will be lowering yield from here.
Why would the USDA cut the old crop demand by that much? Maybe it's because they already know they are going to be dropping the new crop yield..
Small crops get smaller.
The trend for the balance sheet has clearly been lower.
Which brings me to my topic..
Deep Dive into 2010 vs 2026
You've heard us compare this year to 2010 several times this year.
But that comparison might’ve actually just got stronger believe it or not.
In yesterday's audio, Jeremey talked about what happened on this report back in 2010. But let's dive deeper into this comparison.
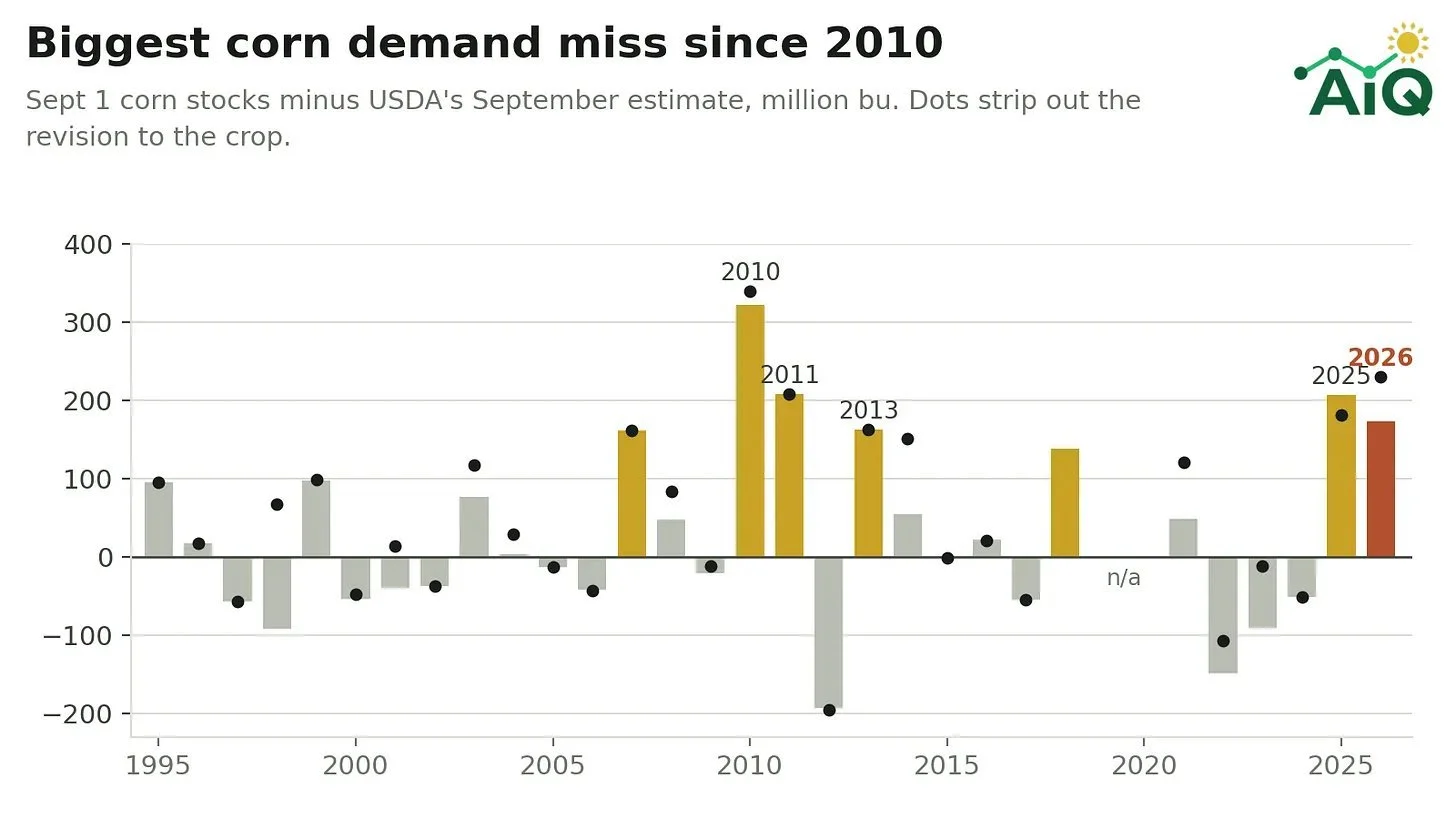
First off, here is a great chart from Nico (@NicoAIQ on X).
The bars show the Sep corn stocks minus the USDA's Sep estimates.
The dots take away the changes to the production, aka they track the demand change.
The USDA missed demand by 230 million bushels yesterday.
The only year that had a larger demand miss?
2010.
What exactly happened in 2010?
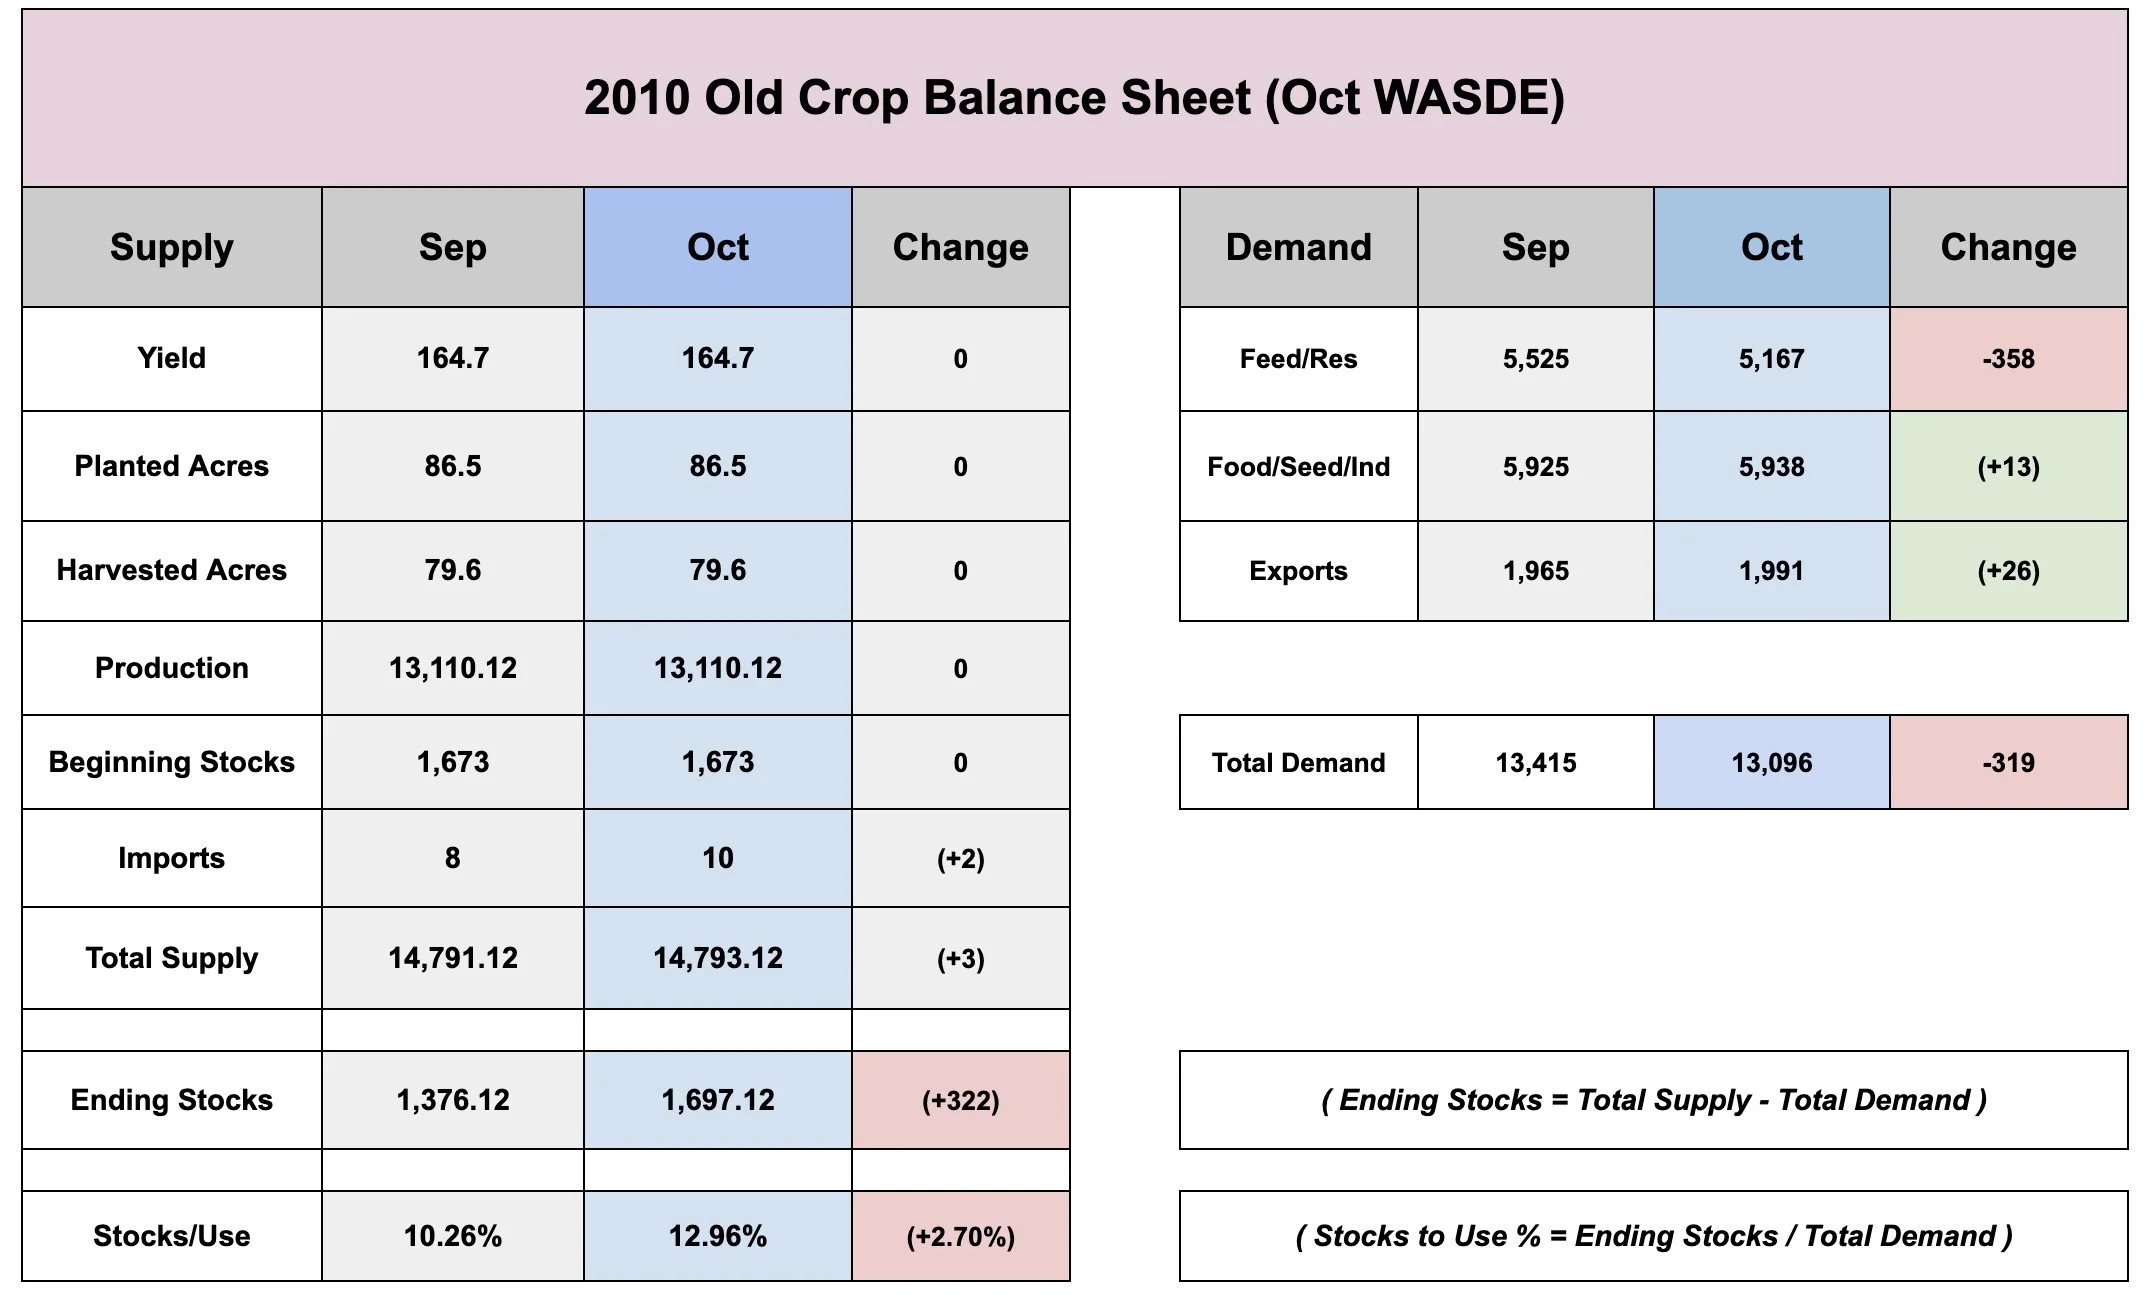
In the 2010 Sep stocks report, the USDA added 322 million bushels of old crop. Due to a massive miss on feed and residual demand. Similar to this year, although 2010's was an even larger miss.
Here was the changes they made to the old crop balance sheet in the October WASDE. All they did was cut feed and residual massively.
What happened next?
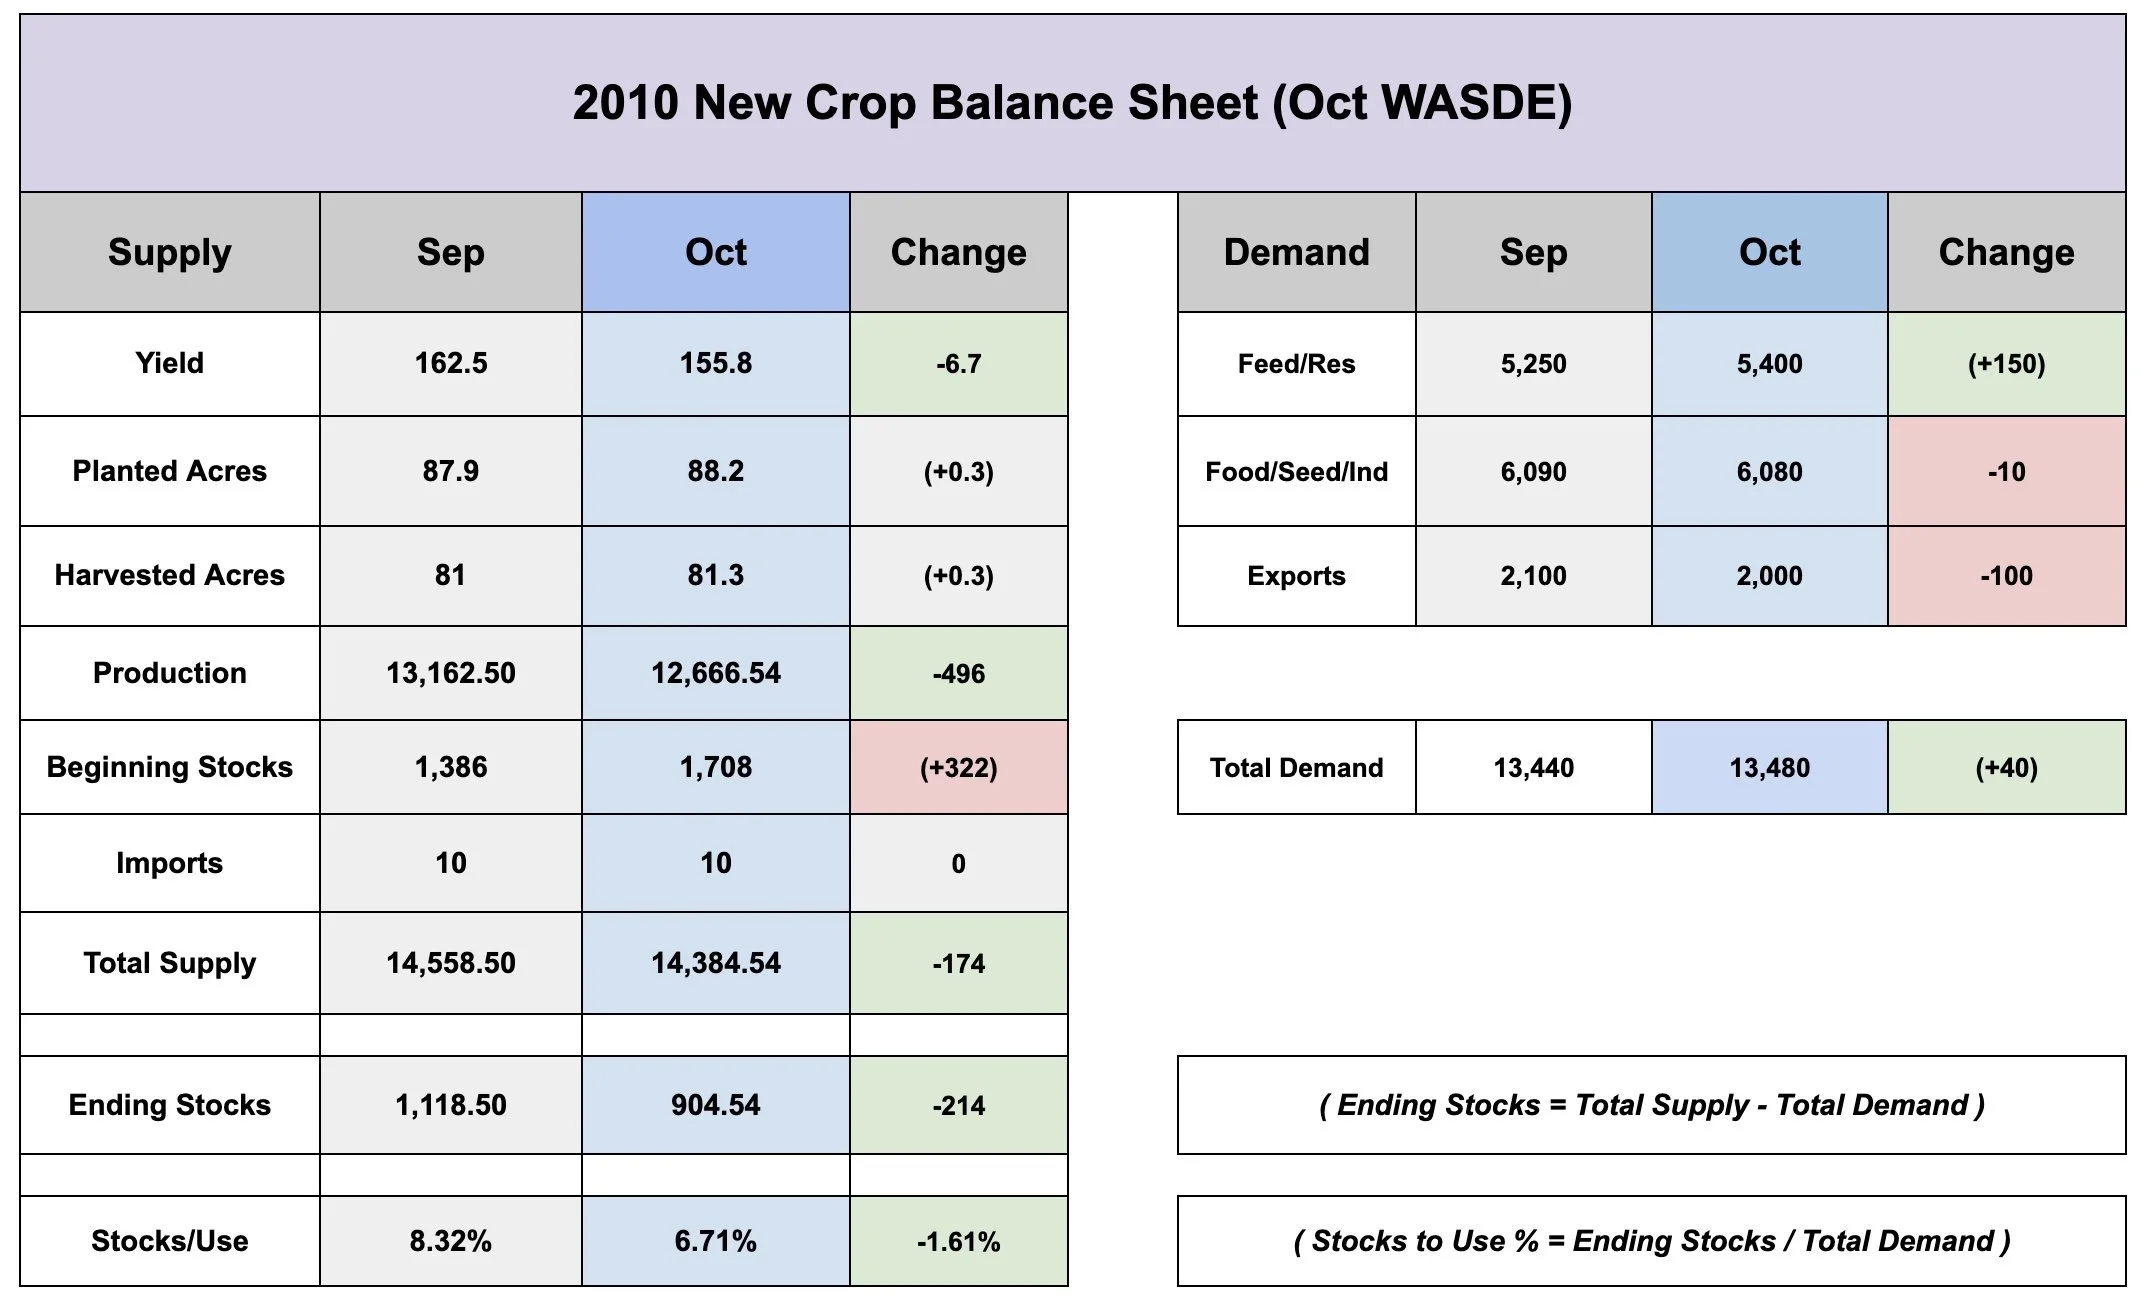
Here is the new crop balance sheet changes from the October WASDE. Which happened 8 days after the stocks report.
Beginning stocks increased by over 300 million from the old crop stocks report.
The USDA then cut yield from 162.5 down to 155.8 bpa.
Which led to production dropping nearly 500 million.
So despite the massive increase in old crop, the new crop balance sheet actually got smaller. As new crop carryout dropped over 200 million.
Because the drop in yield more than offset the extra old crop.
Maybe we don’t see the exact same situation play out this year, but I would have to imagine that the USDA will be cutting the crop to some extent.
Again.. maybe the USDA knows they are going to have to cut yield this year.
So they dropped the feed and residual first to help offset the losses to supply. Just like they did back in 2010. Given that feed and residual is their "plug n play" number.
This report isn’t the only thing that makes me think this year has similar vibes to 2010.
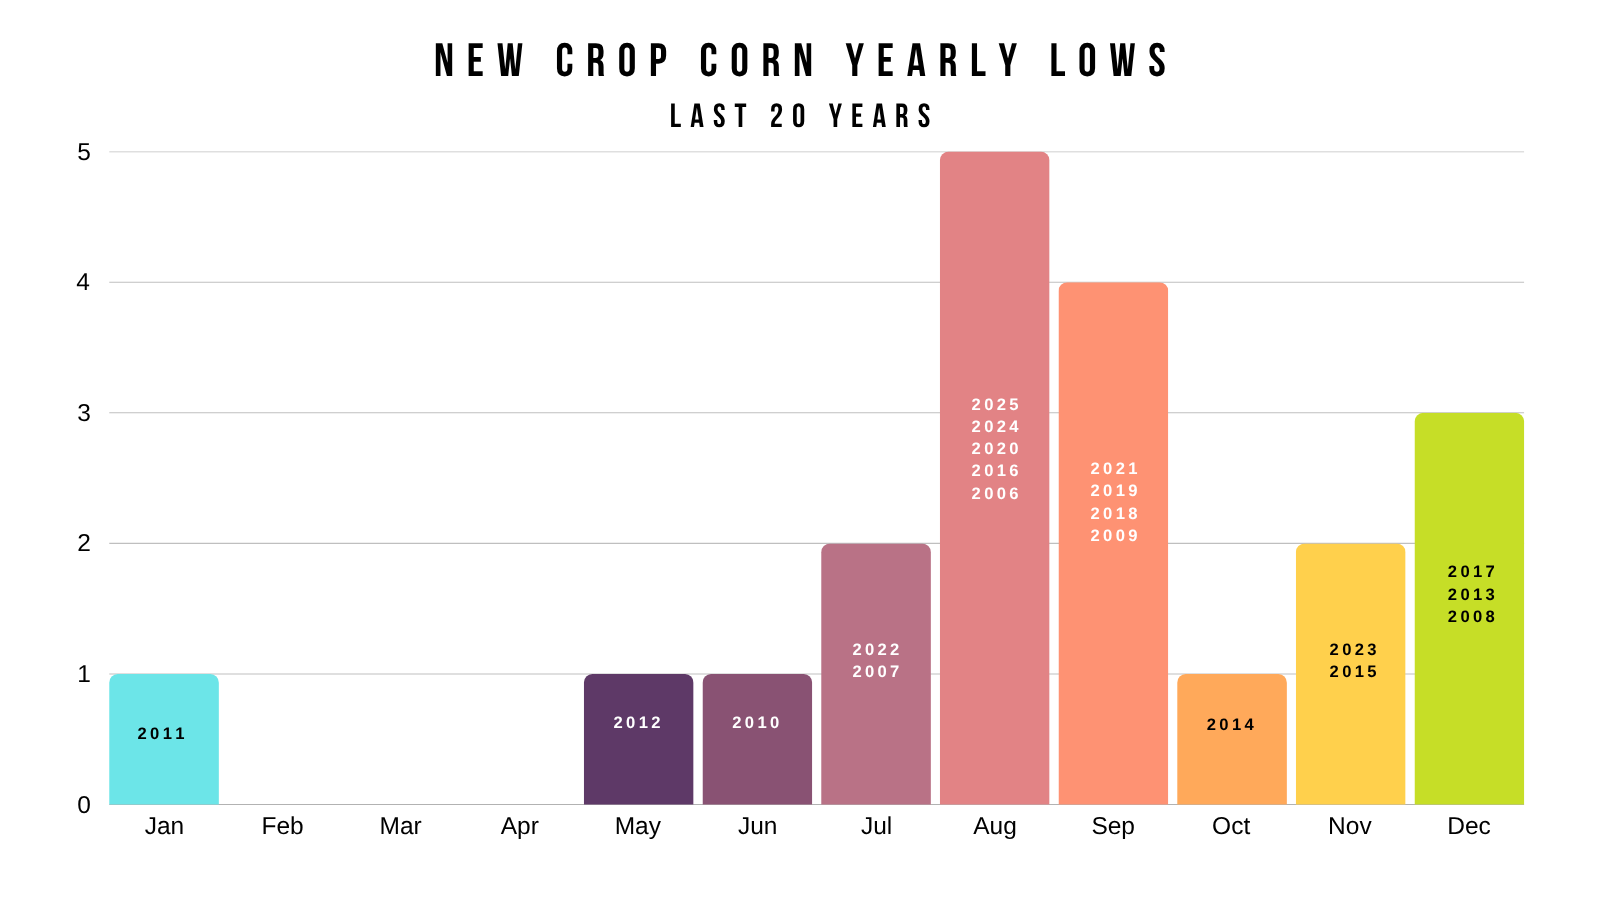
The other big one is price action.
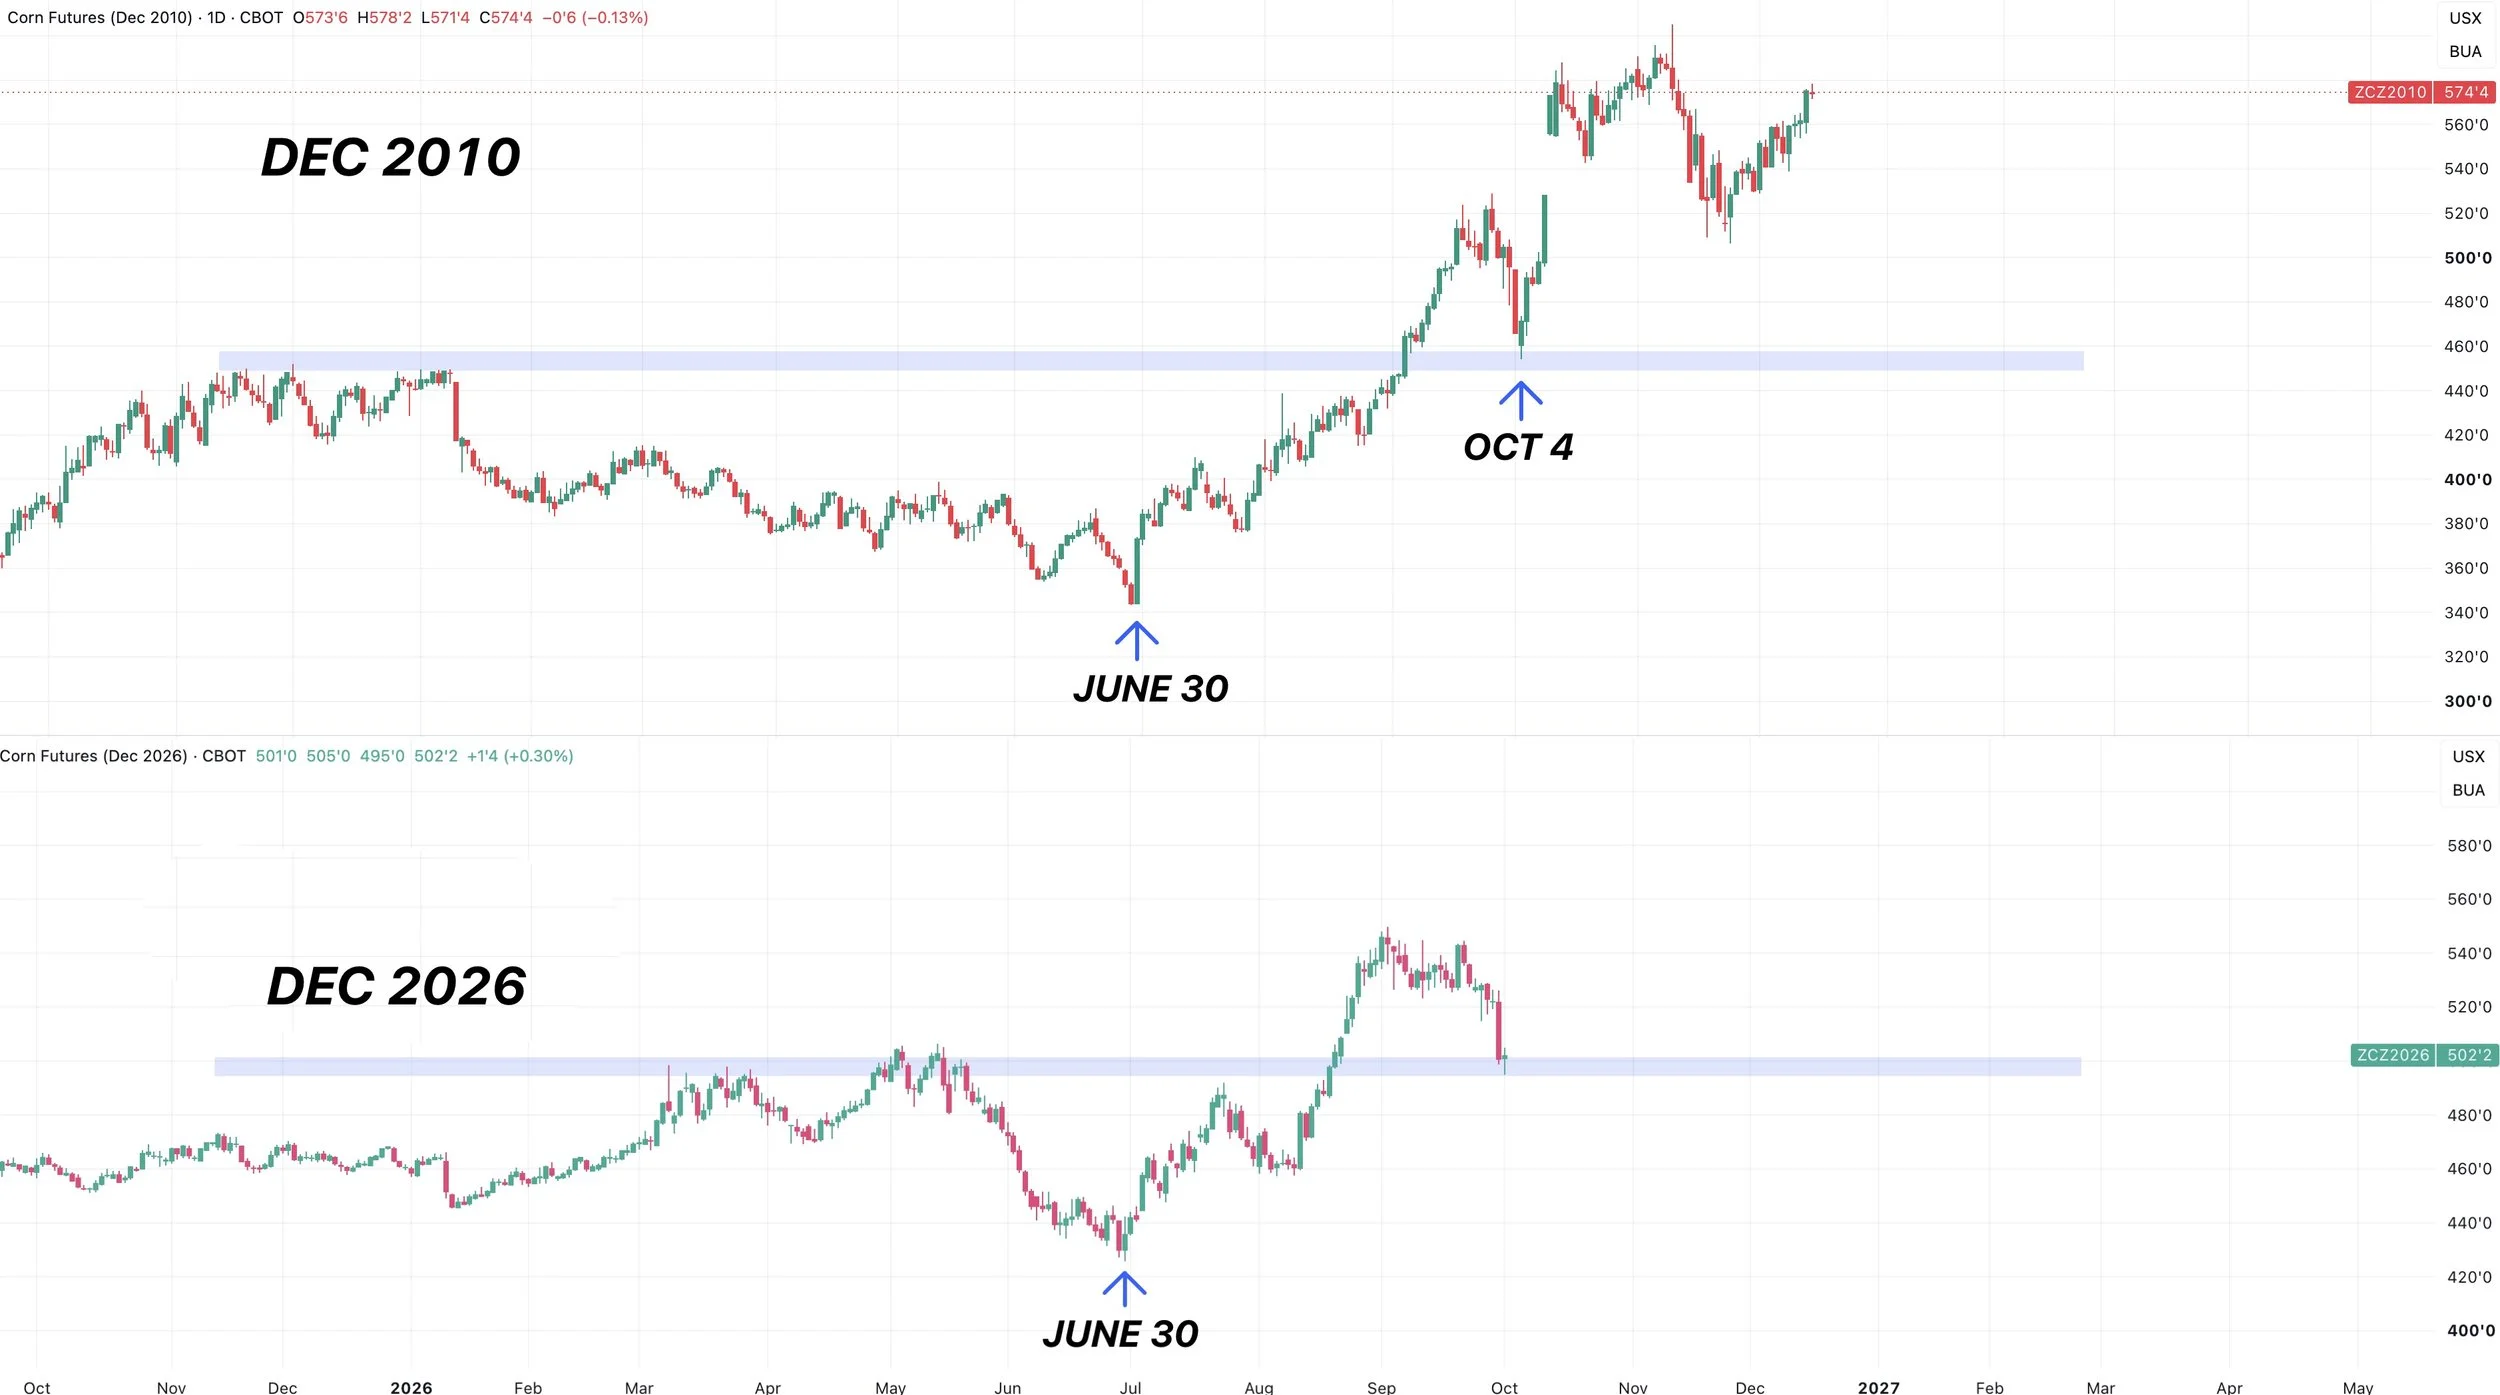
Before this year, corn has only posted it's lowest price of the year in June one time ever.
The year was 2010.
Here is a side by side chart comparison.
In 2010, corn bottomed on June 30th.
When did we bottom this year?
June 30th.
In 2010 we sold off after the Sep stocks report.
We then came down and tested the previous highs before finding a floor and heading higher.
Similar to what corn is doing right now. We sold off on the Sep report. We are testing the previous highs.
This year doesn’t have to play out exactly like 2010.
History does not repeat. But often times it does rhyme.
You can’t deny that the two years offer some intriguing comparisons.
Today's Main Takeaways
Corn
Fundamentals:
I'm not going to spend much time on the fundamentals today.
Overall, long term corn still has plenty of friendly factors going for it heading into 2027.
I still believe the crop is getting smaller from here.
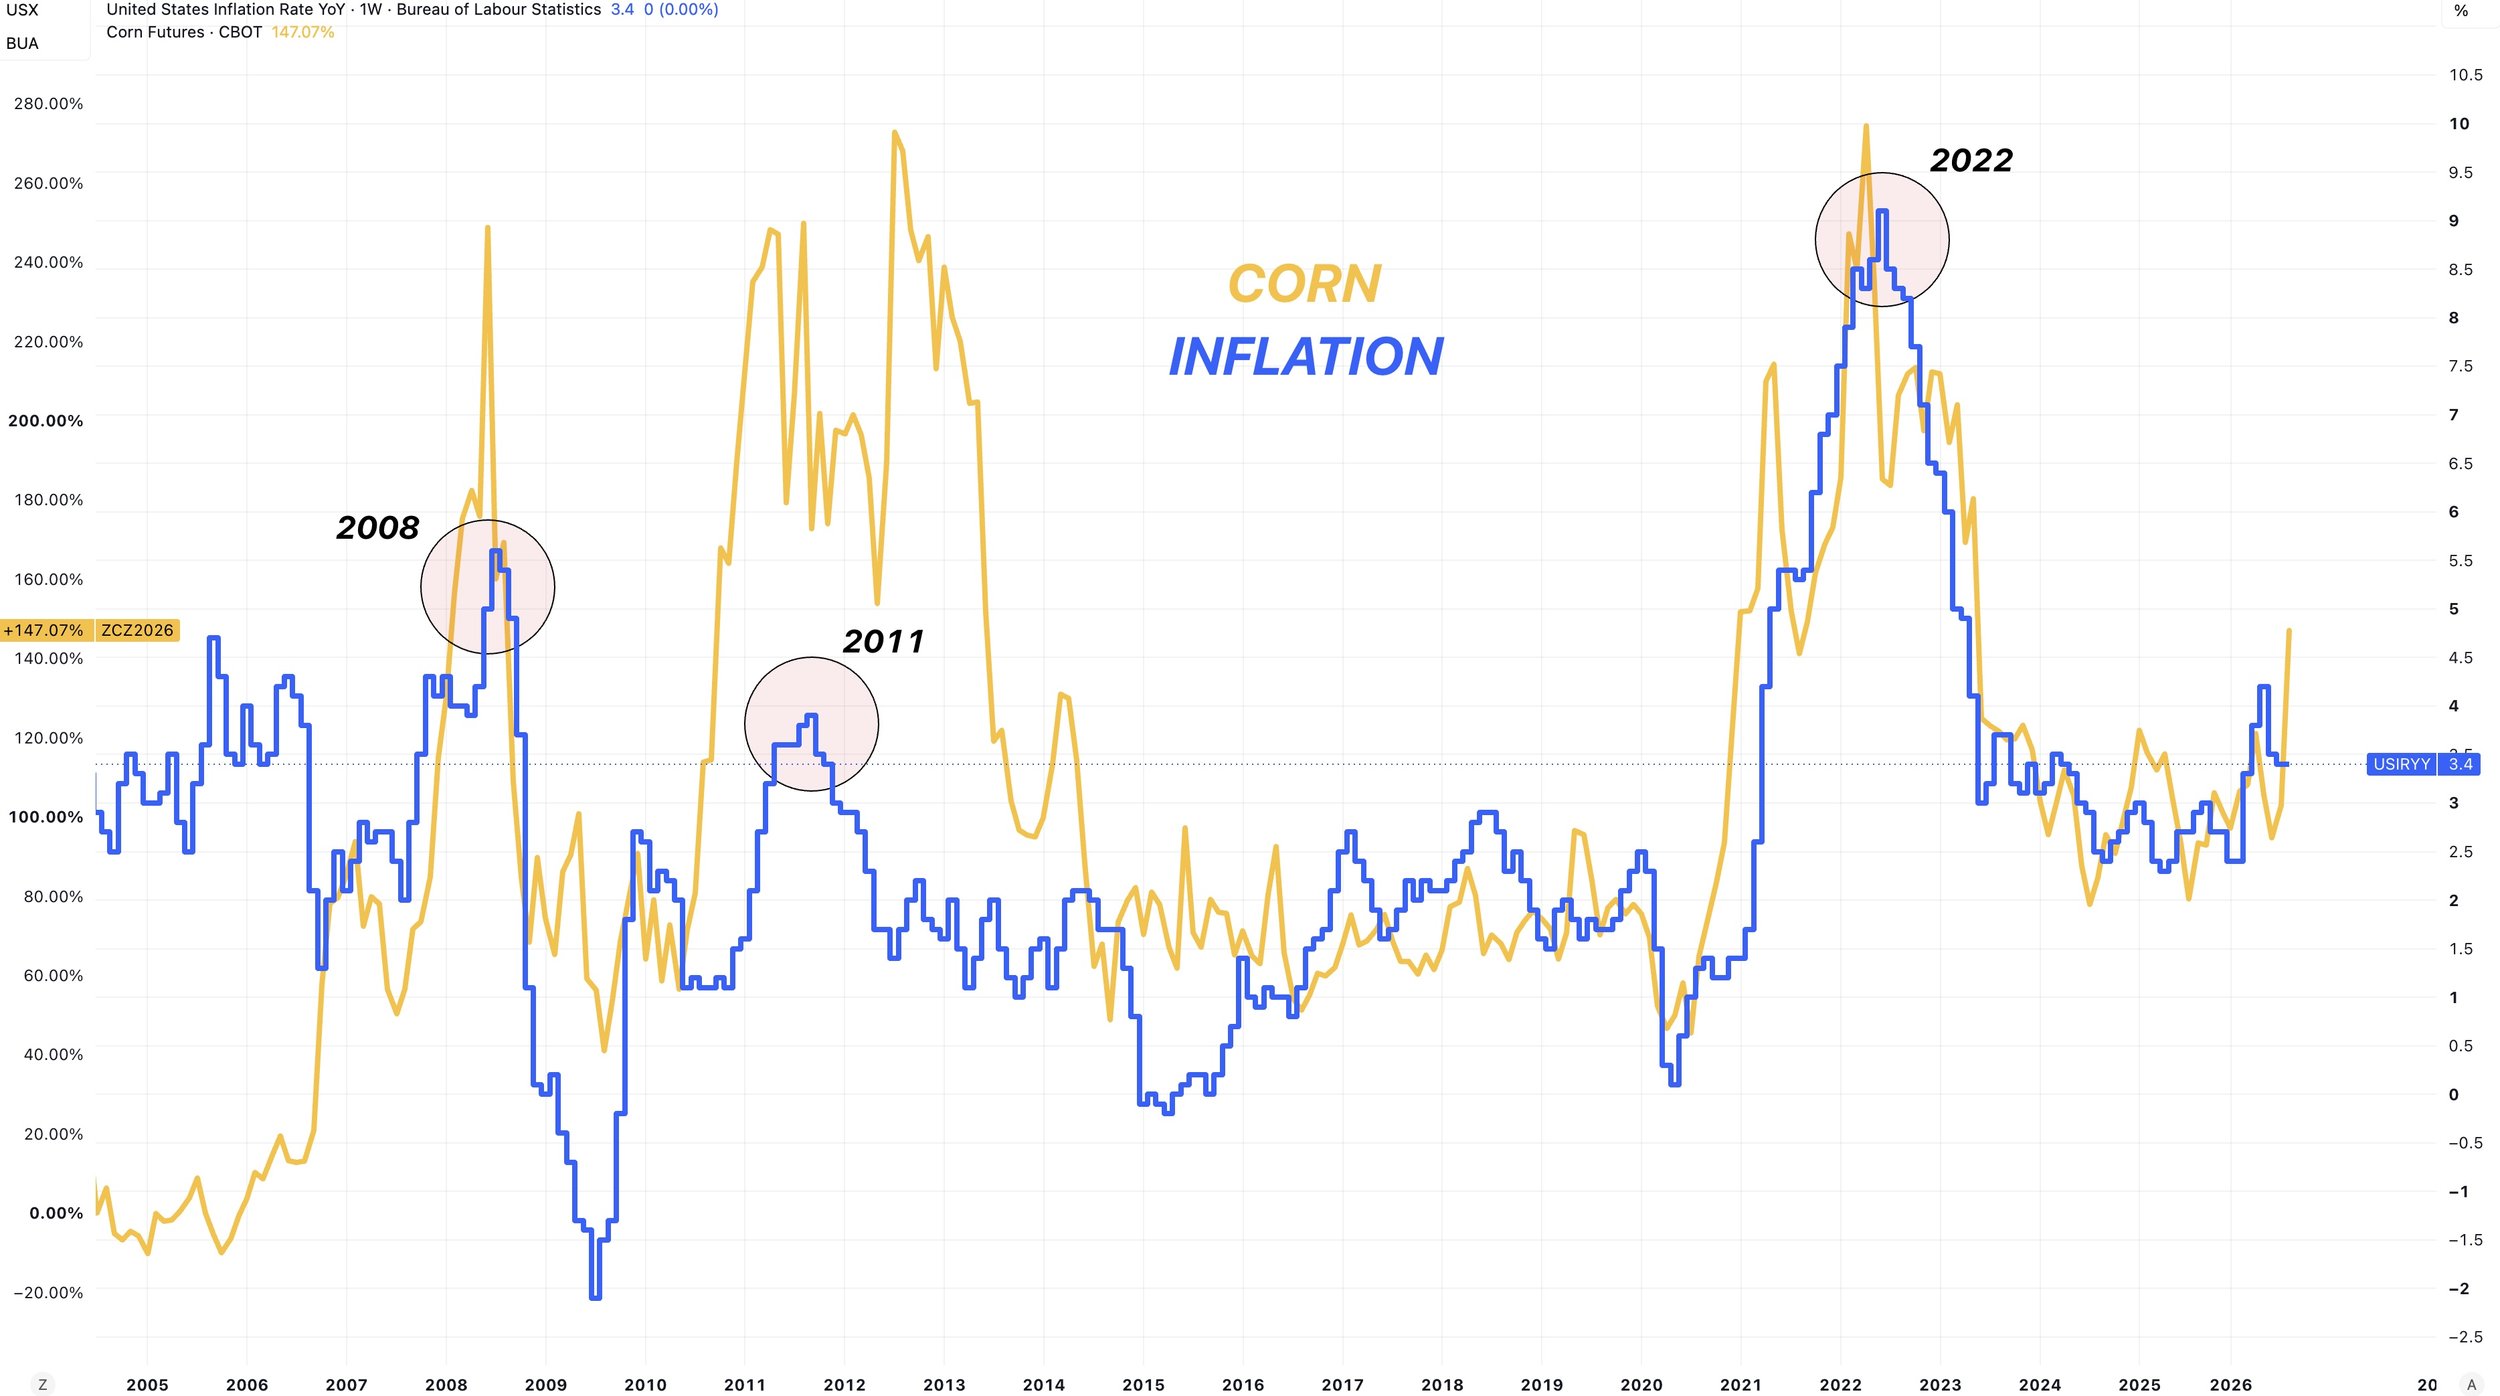
You have the macro story with inflation, diesel, and crude.
The inflation story hasn’t went away.
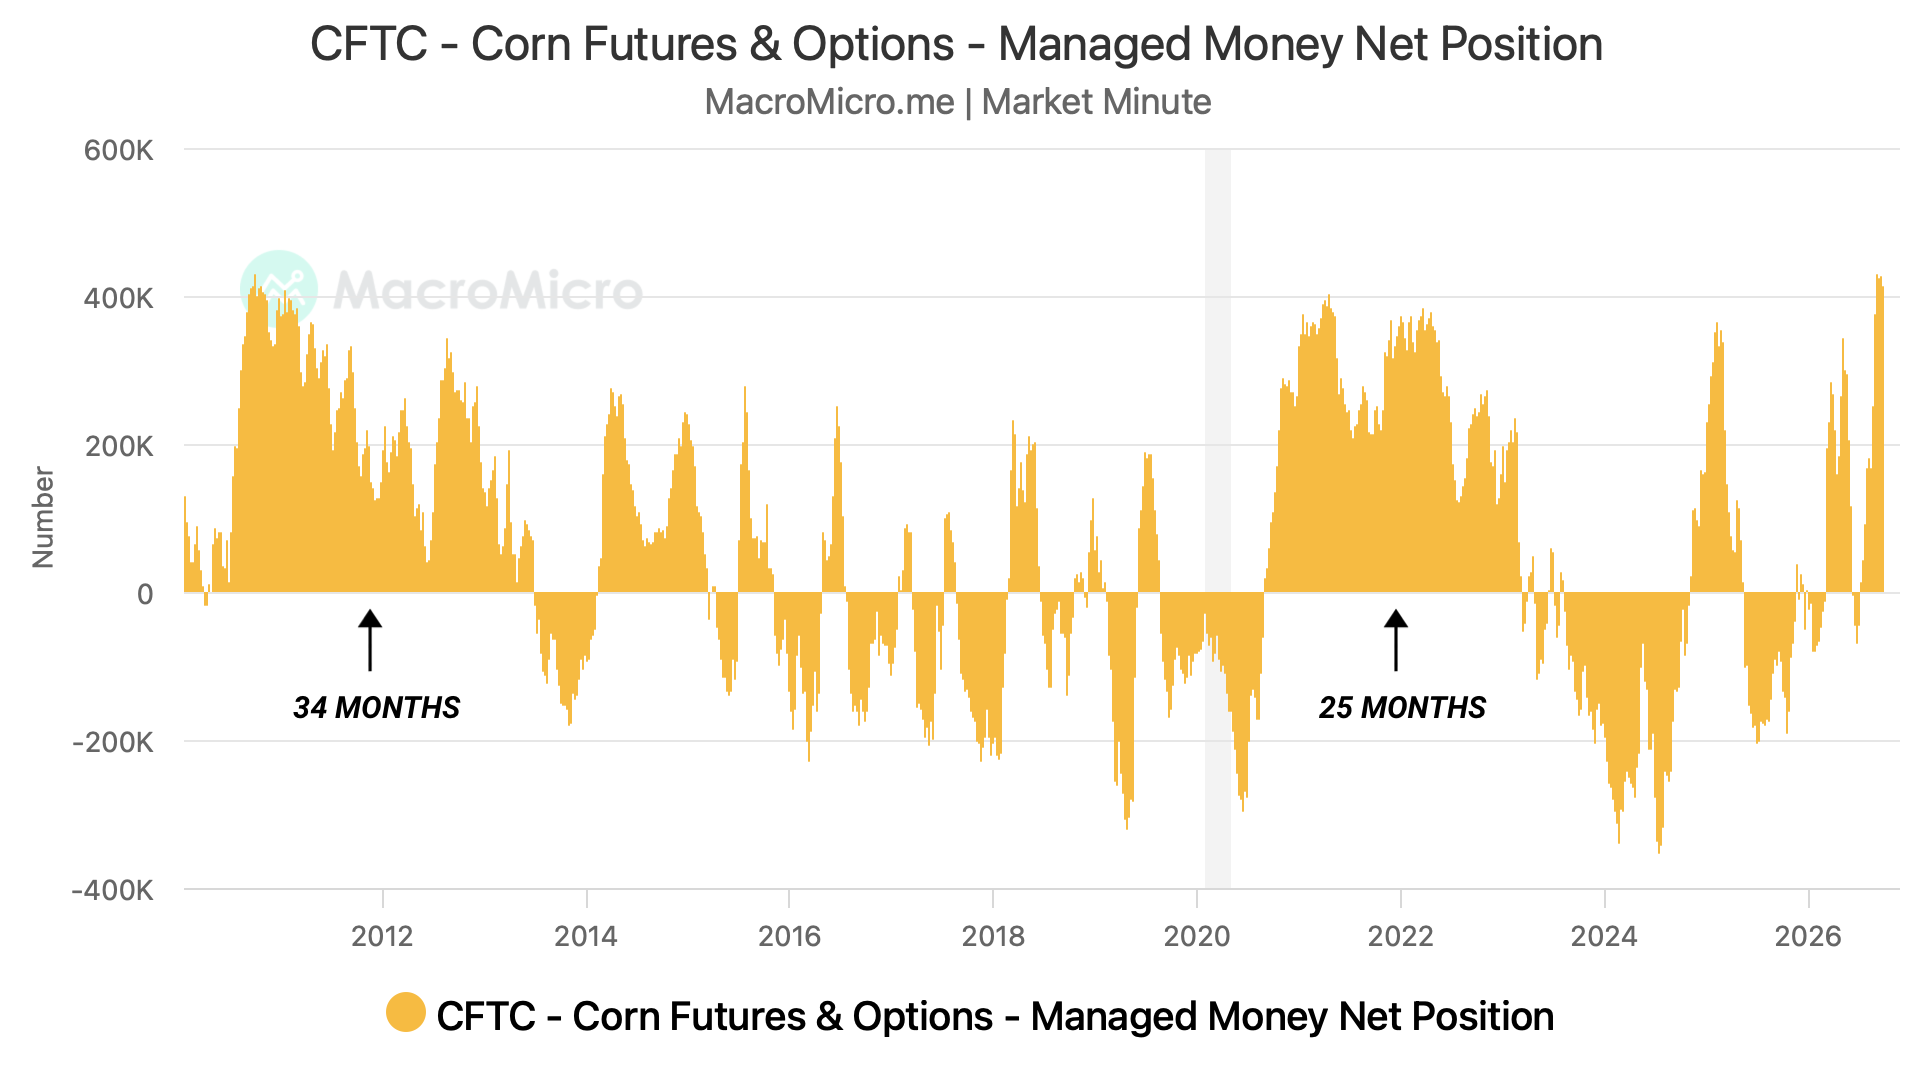
Inflation is a common theme in bull markets, and probably one reason for the record length in funds from the grains.
It was estimated that the funds sold 75k of that record position yesterday.
Some would argue, what happens if they liquidate the rest?
Valid concern.
But I still think they are going to defend that long position for the most part.
There are only 2 other times in history the funds have been long over 400k contracts.
2010 and 2021.
Both times they didn’t give up that position without a fight, and held on for a few years.
Bottom Line:
I've seen a lot of people who were super bullish when corn was trading at $5.50 suddenly saying the corn story is over.
They have it completely backwards.
Human emotions are a funny thing. Everyone gets the most bullish at the top as it builds confidence. Everyone gets the most bearish at the bottom because it sparks fear.
I sent out a sell and hedge alert on Sep 2nd, as I have been very vocal about the short term risks heading into harvest. As there was a reason to be cautious up at those levels.
Now we've got the pullback we've been waiting for. One report isn’t a reason to think the big picture story in corn is suddenly super bearish.
The time to be cautious was 50 cents ago. Down here at support is not the time to finally flip bearish on corn.
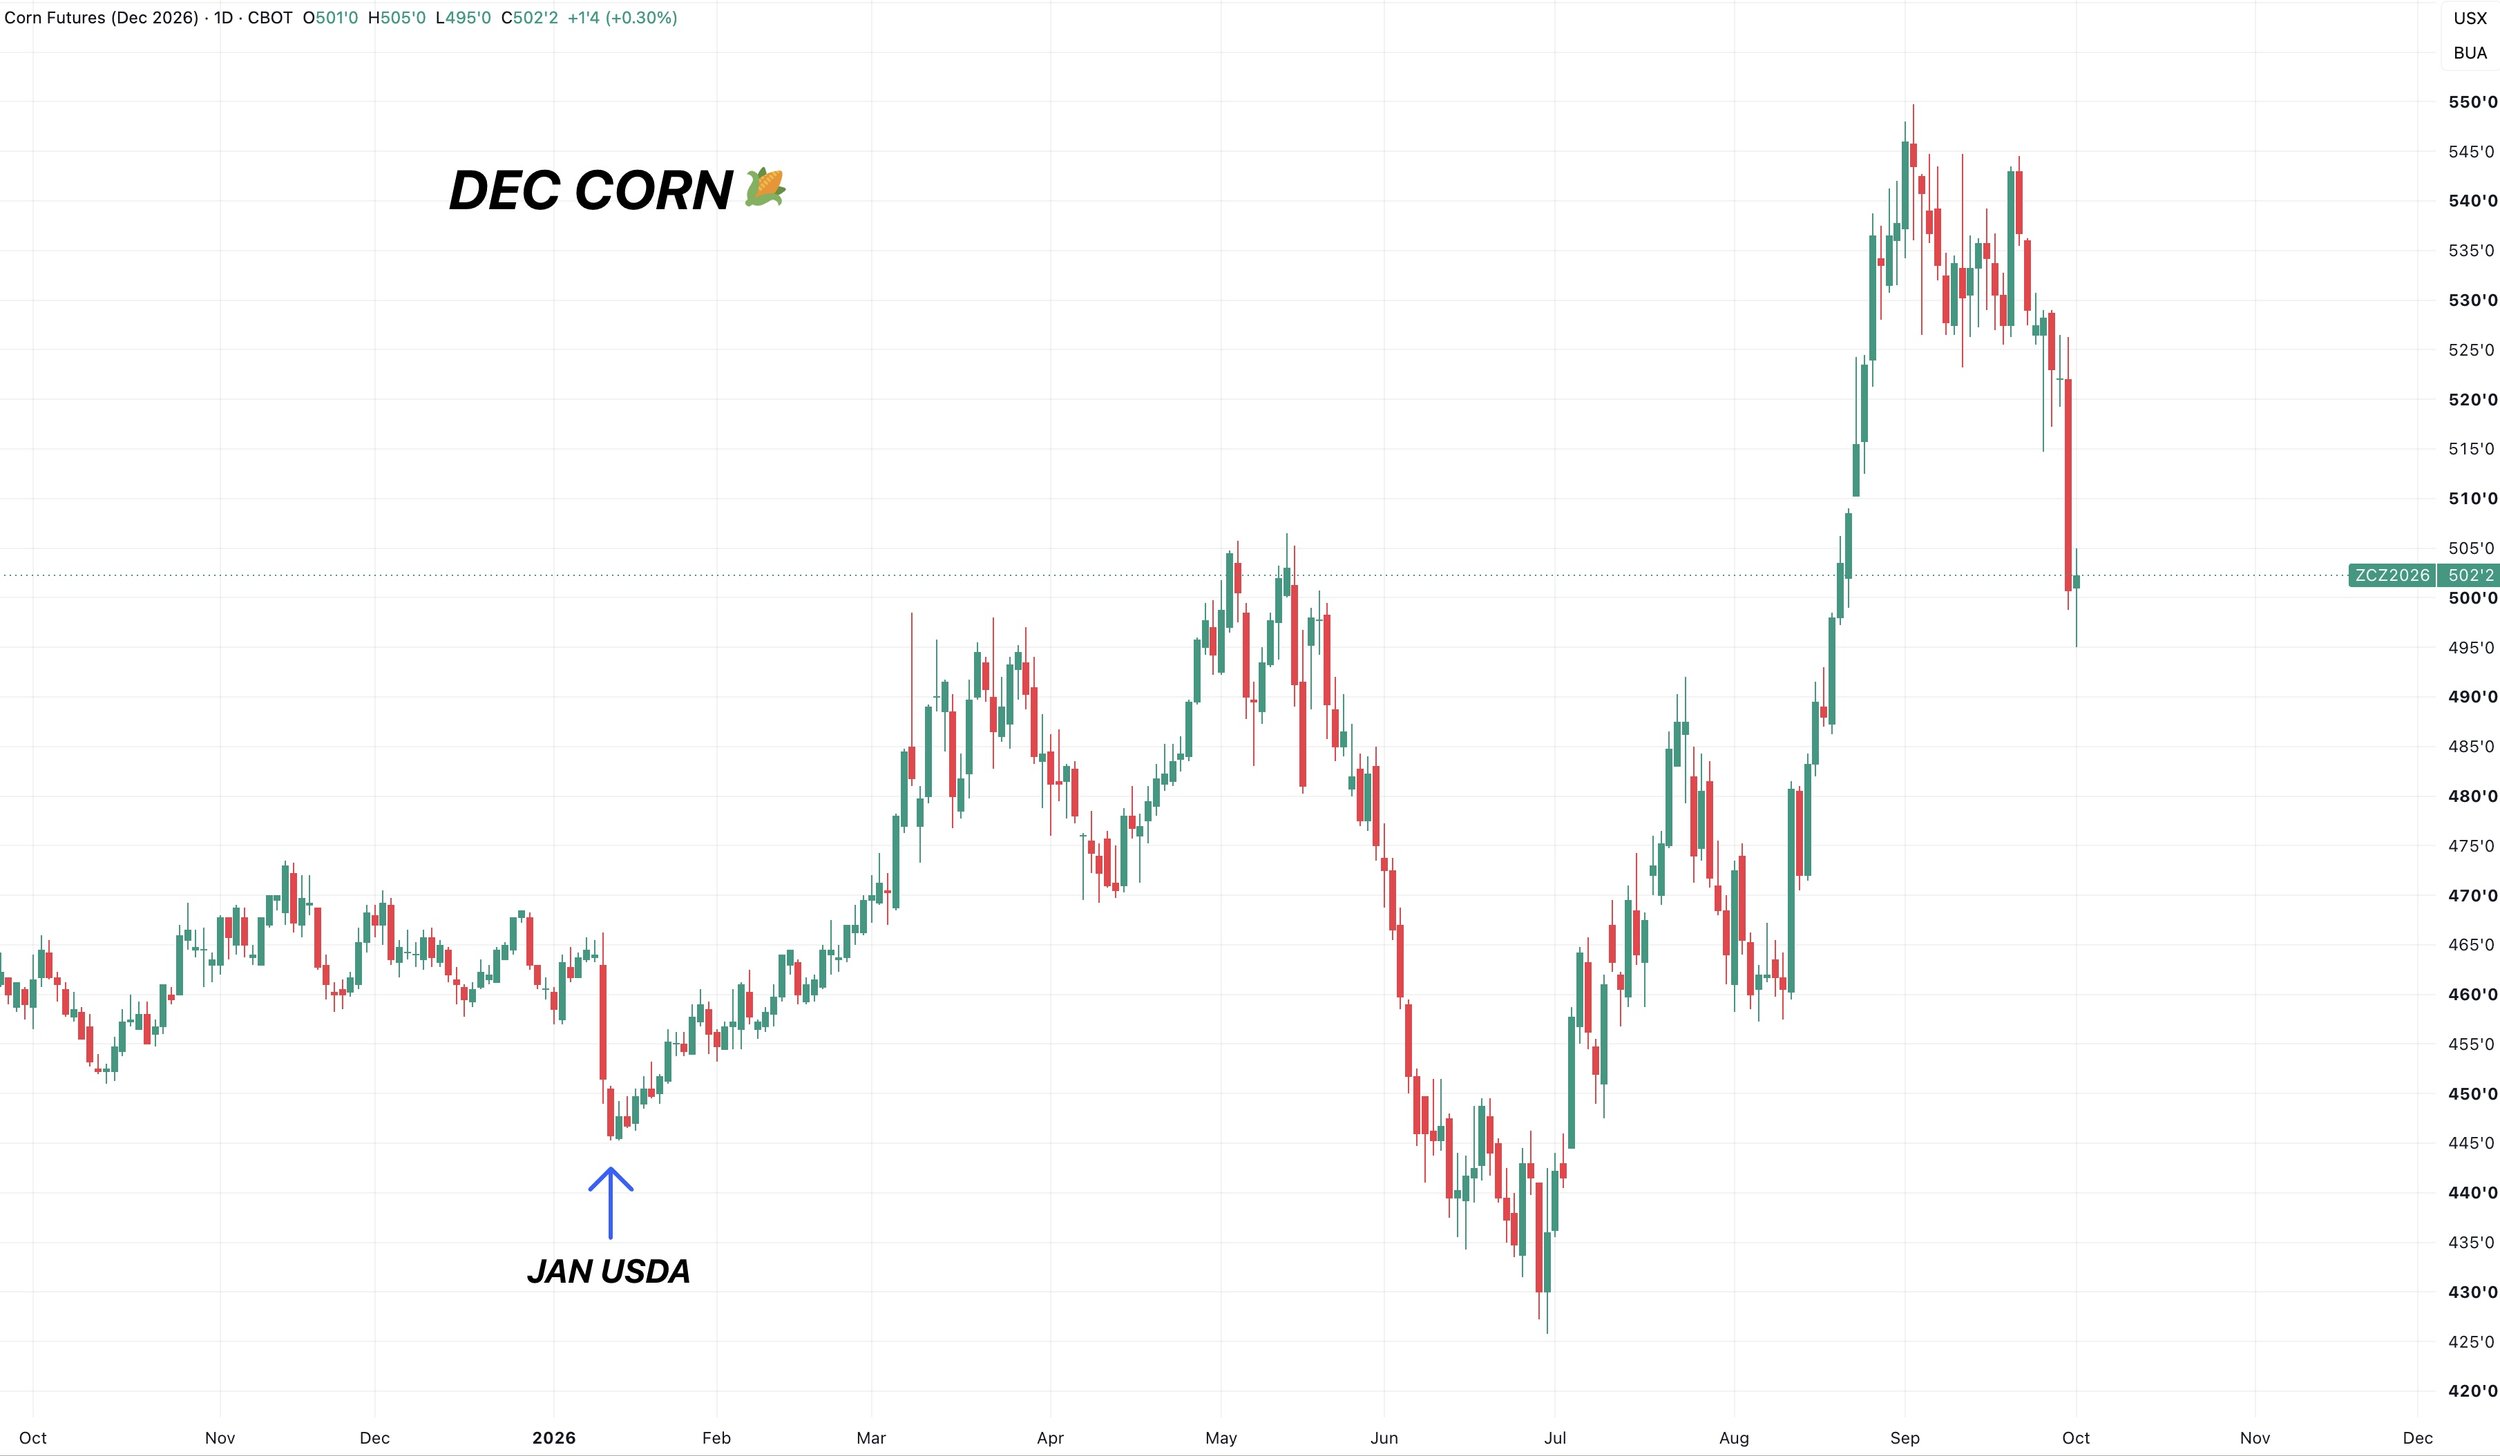
Do you remember the last super bearish report in corn this year?
In January we tanked. But it ended up marking the lows.
Markets often bottom on bad news and top on good news.
Bearish Report Favors Reversal?
Here is one last thing I wanted to show.
Corn just had it's worst performance for this report since back in 2011.
It's 3rd worst in at least the last 20 years.
But what has historically happened next when we traded lower on the day of this report?
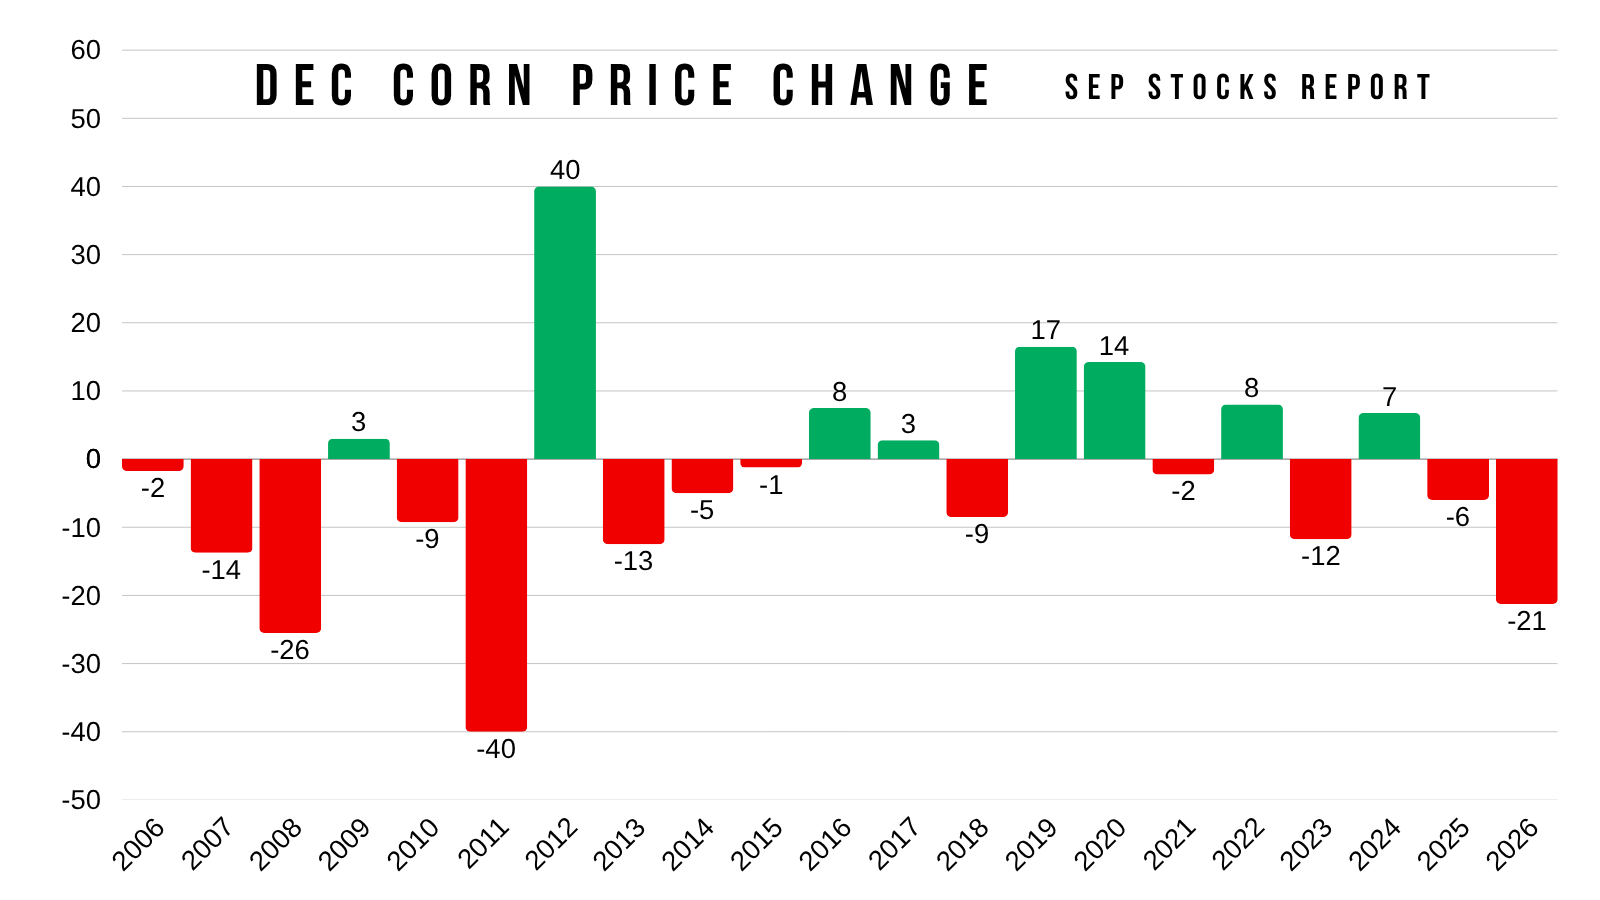
This next chart shows every year we traded lower on the day of the report, and what happened to prices exactly a week later.
In 9 of the 12 years we were higher just a week later.
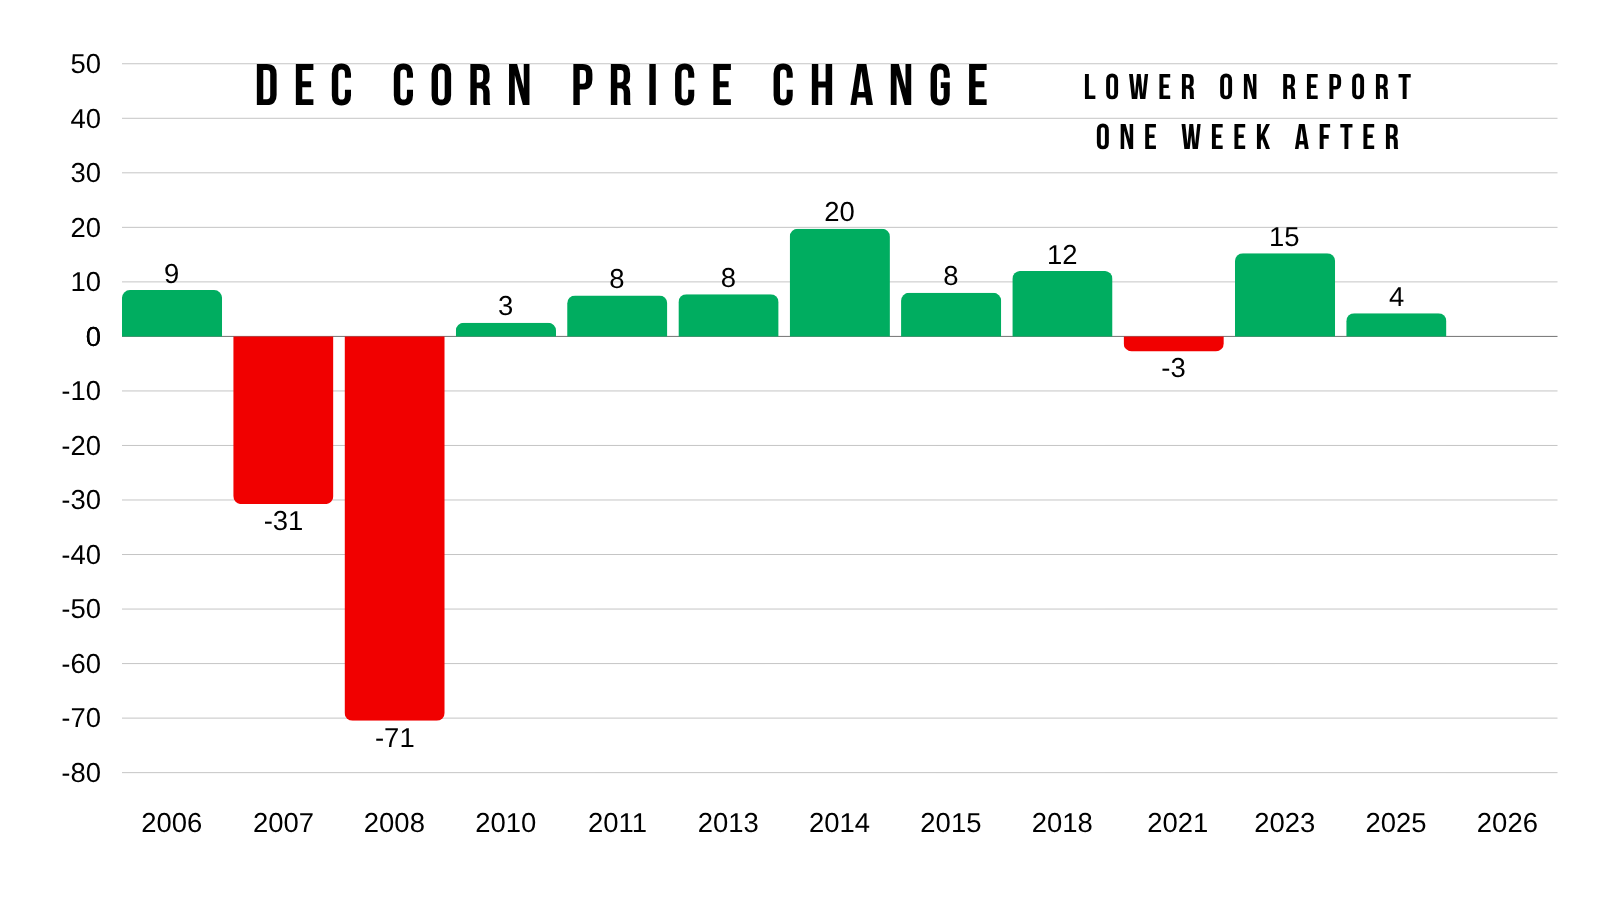
This one shows what happened to corn a month later following being down on the report day.
Same thing here.
A month later corn has been higher the last 9 of 12 years.
If you remove 2008 from both sets of data it's even more compelling.
As 2008 was an anomaly of a year, as the world was in the process of collapsing.
Corn Charts
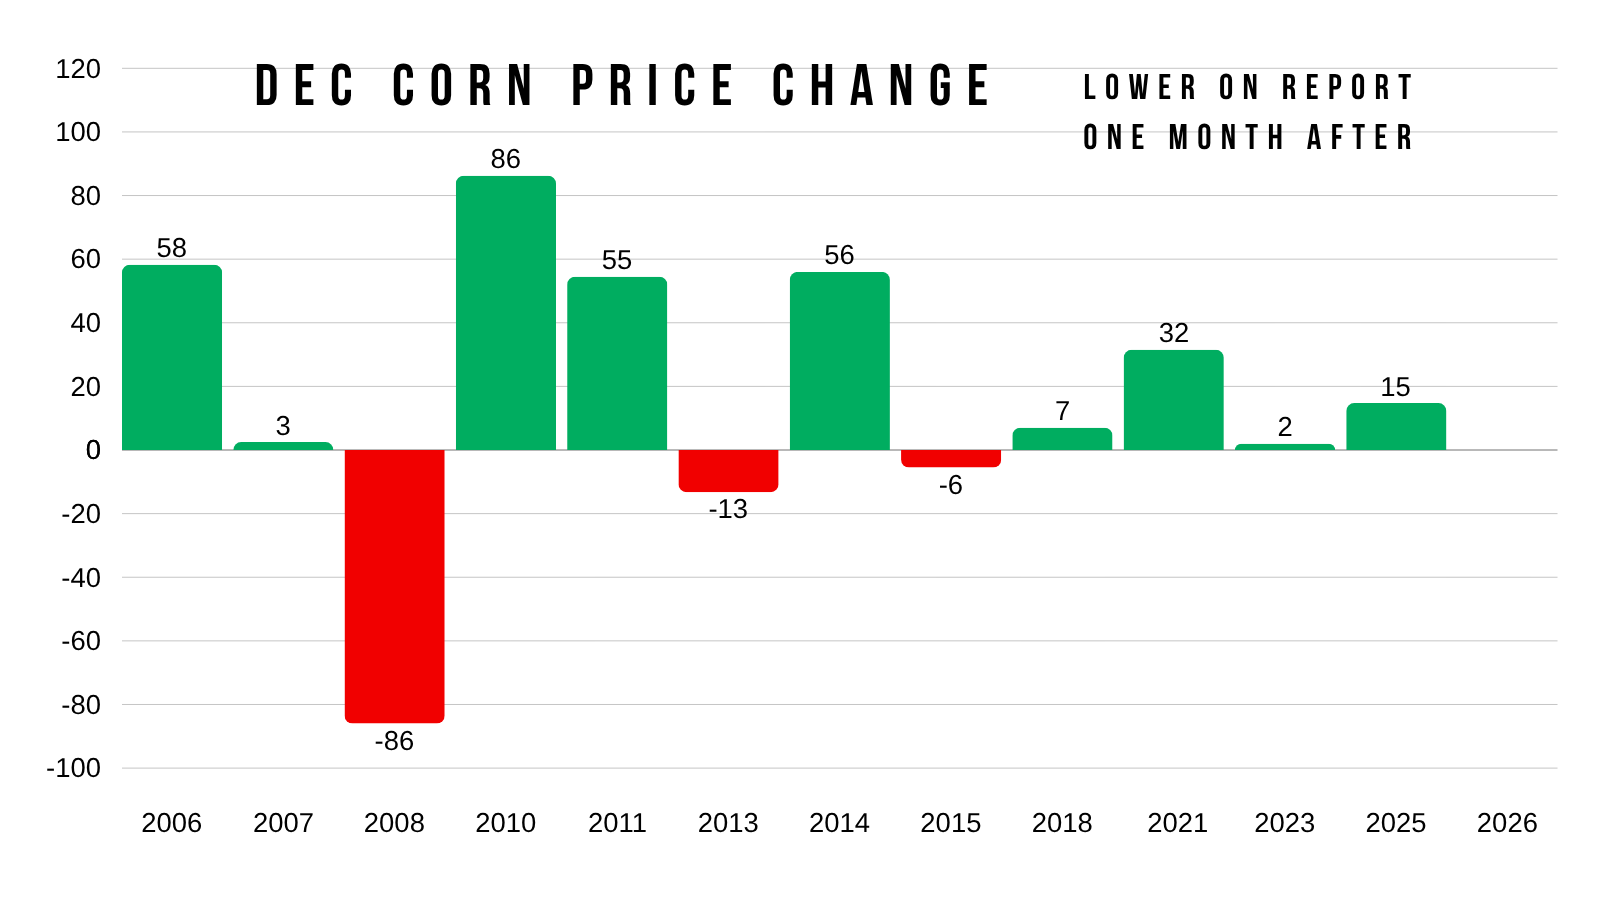
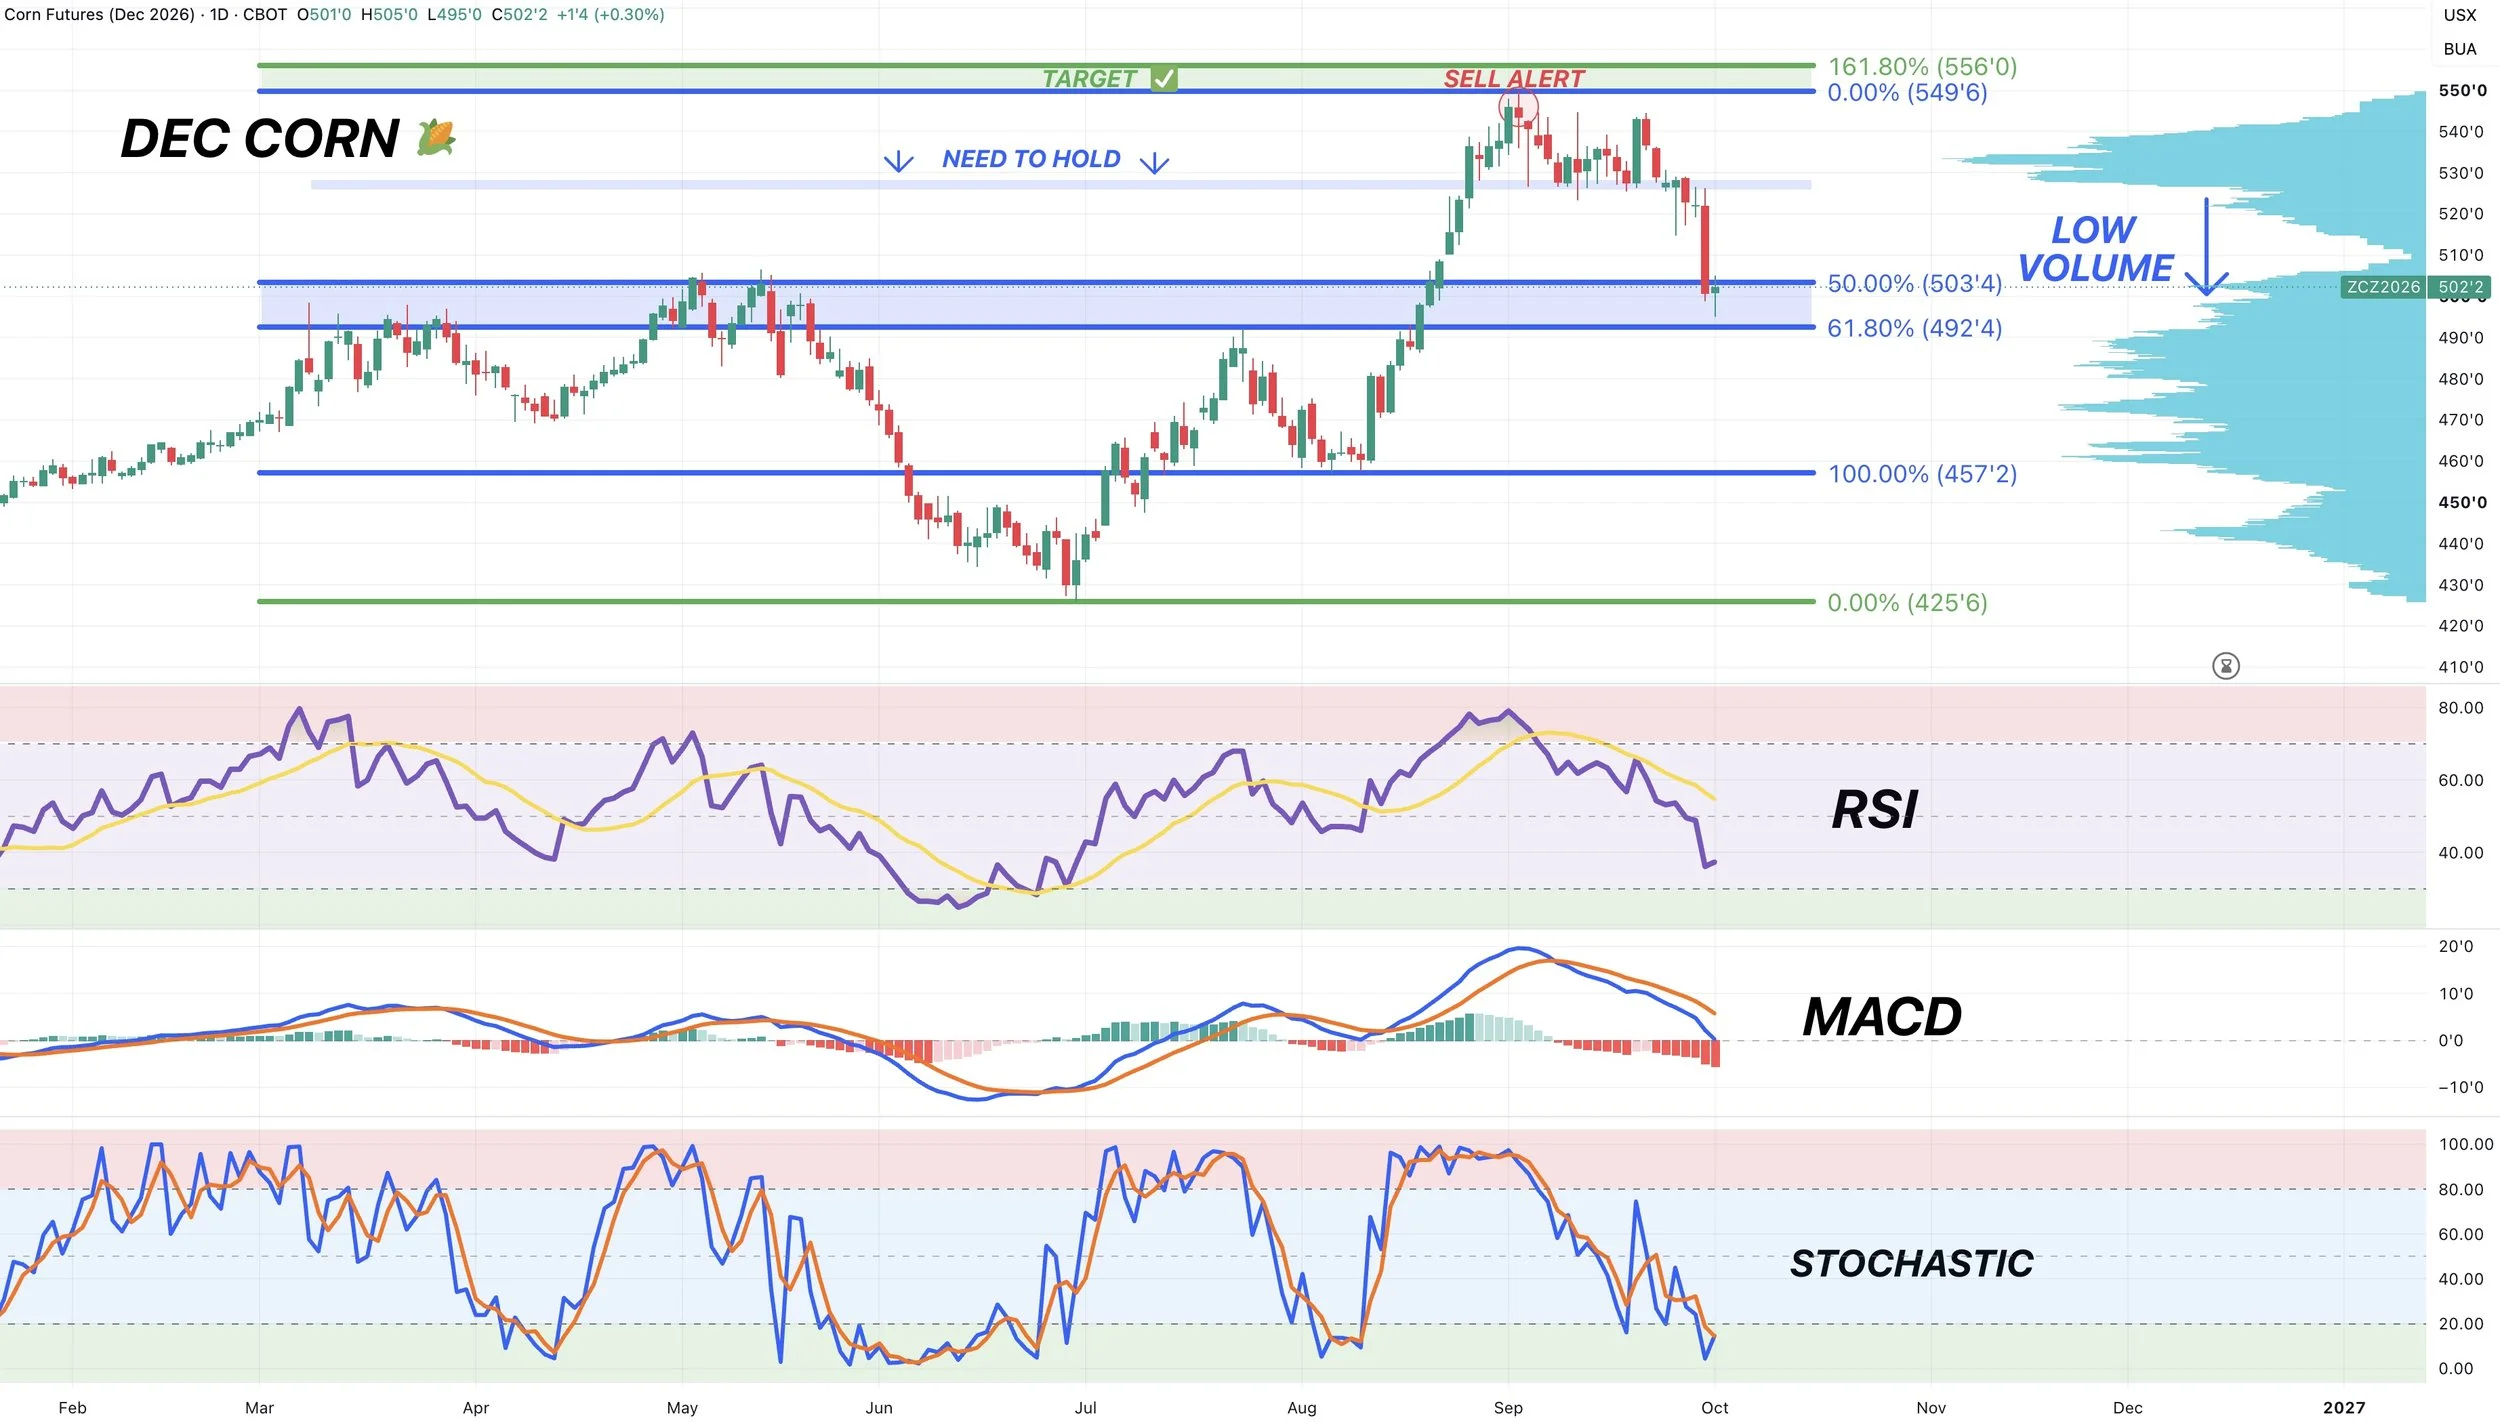
Dec Corn Daily Chart:
Obviously corn doesn’t have to find a bottom here, but this logically would be where I would expect us to carve out some lows.
For the last month, I have been pointing out that massive volume gap to the downside if we broke below that prior range.
Since we broke below the range, there was zero support below this market or volume to catch us. So we sliced right through the volume gap.
Now corn is sitting right in the golden zone. Having given back 50% to 61.8% of the entire rally from August.
Not only that but we are re-testing those highs from May.
We also are now back at an area of high volume, since we fell straight through the area of low volume.
So if we are going to find a bottom anytime soon, this would be the area I would expect it to happen.
If we fail to hold the 61.8% level and $4.90, then I would start getting more concerned. But for now, we're at support.
We have not yet sent out a buy signal, but if you were someone who wanted to re-own corn back near the highs, or you'll want to re-own if corn bounces higher from here, I do view this as a good re-ownership opportunity.
The indicators were a big reason for me being cautious the last several weeks.
As they showed no real sign or confirmation of a bottom.
However, the indicators have now cooled off.
The RSI is finally oversold. The last time we were this oversold was back when corn traded at $4.25
The stochastics have finally hit oversold status. Which is often needed when hunting for a major bottom.
Weekly Chart:
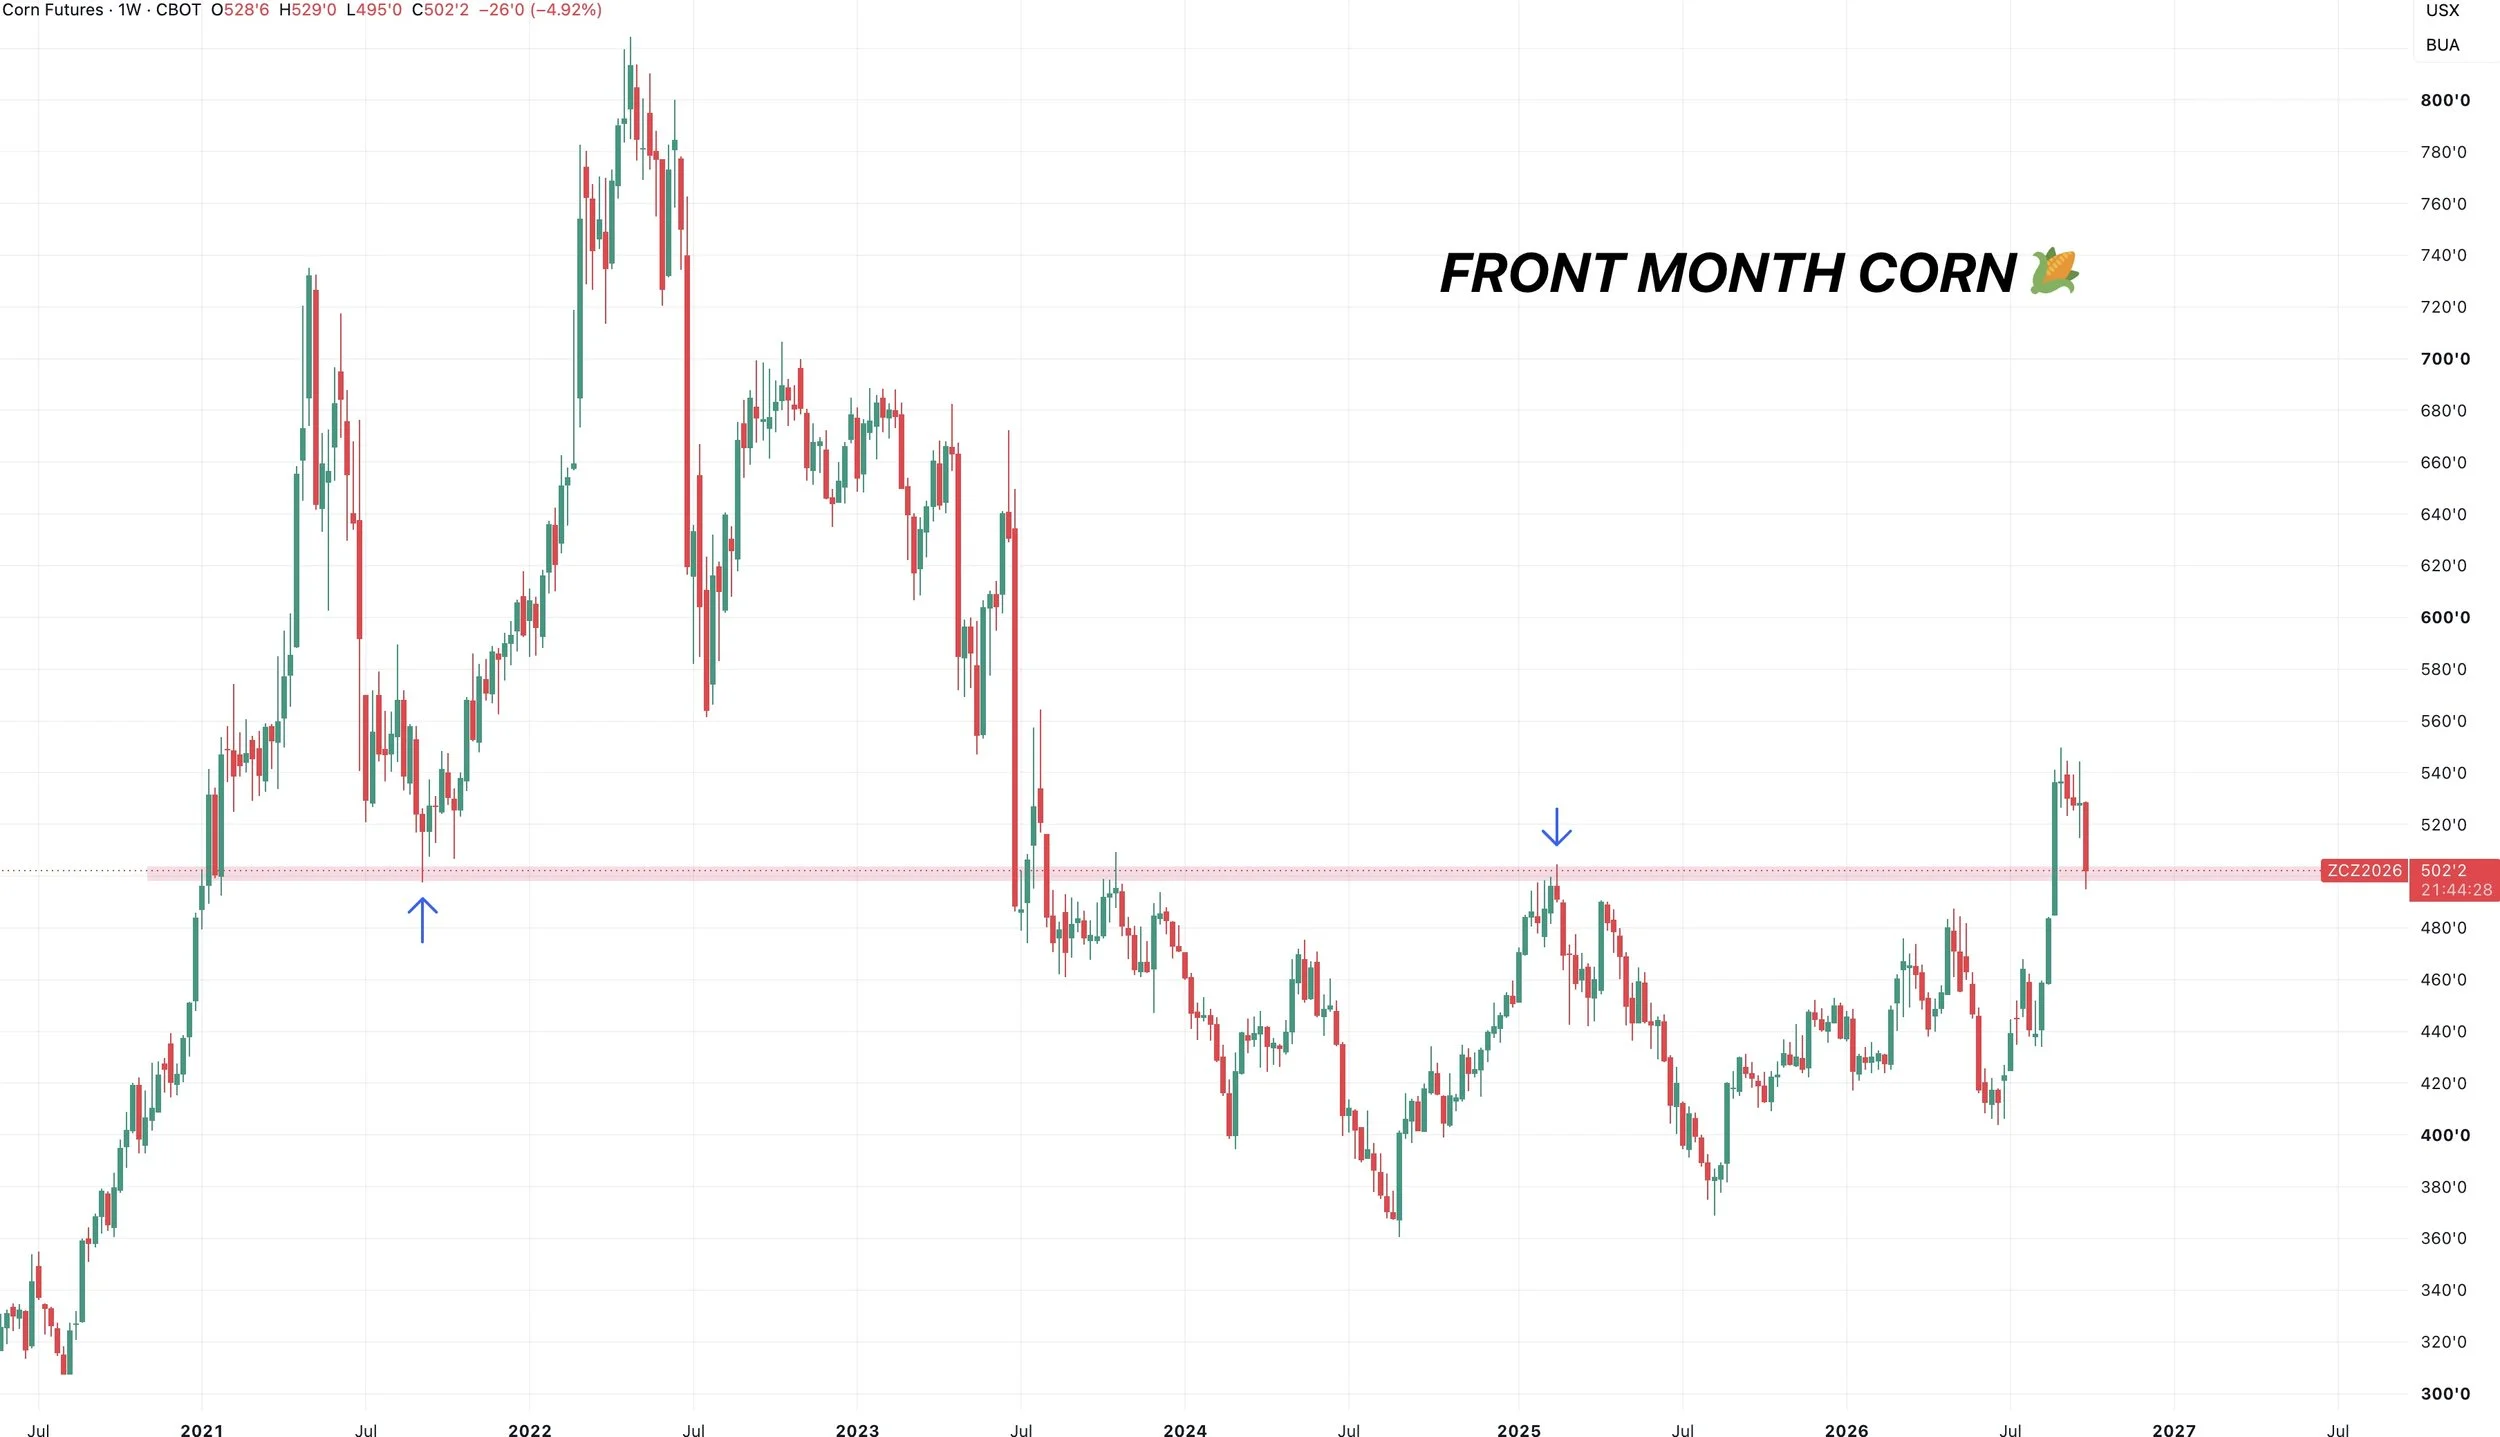
Let's zoom out.
Could this be a simple re-test on the weekly chart?
We were trapped in a massive 3 year range.
We broke out.
This was a major level. It was the highs from 2025 and lows from 2021. It marked us posting our first higher high of the entire bear market.
All we have done is now dropped back down to test that point of breakout.
Breaking out of a multi-year range is not bearish and the big picture structure is still perfectly in tact.
Soybeans
Fundamentals:
Long term I see plenty of potential as I do in corn.
However, something I have been talking about the last few weeks is the bearish seasonality for soybeans.
We tend to be weak at the end of September and early October.
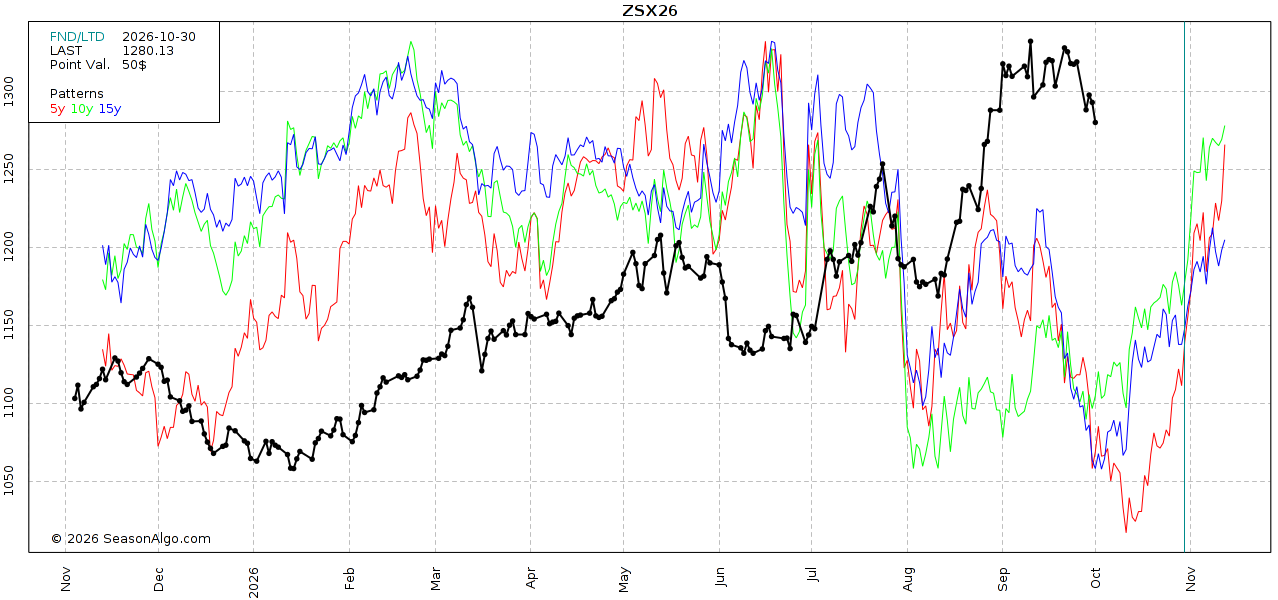
However, once we post this seasonal low here soon, soybeans have a strong tendency to run higher going into November.
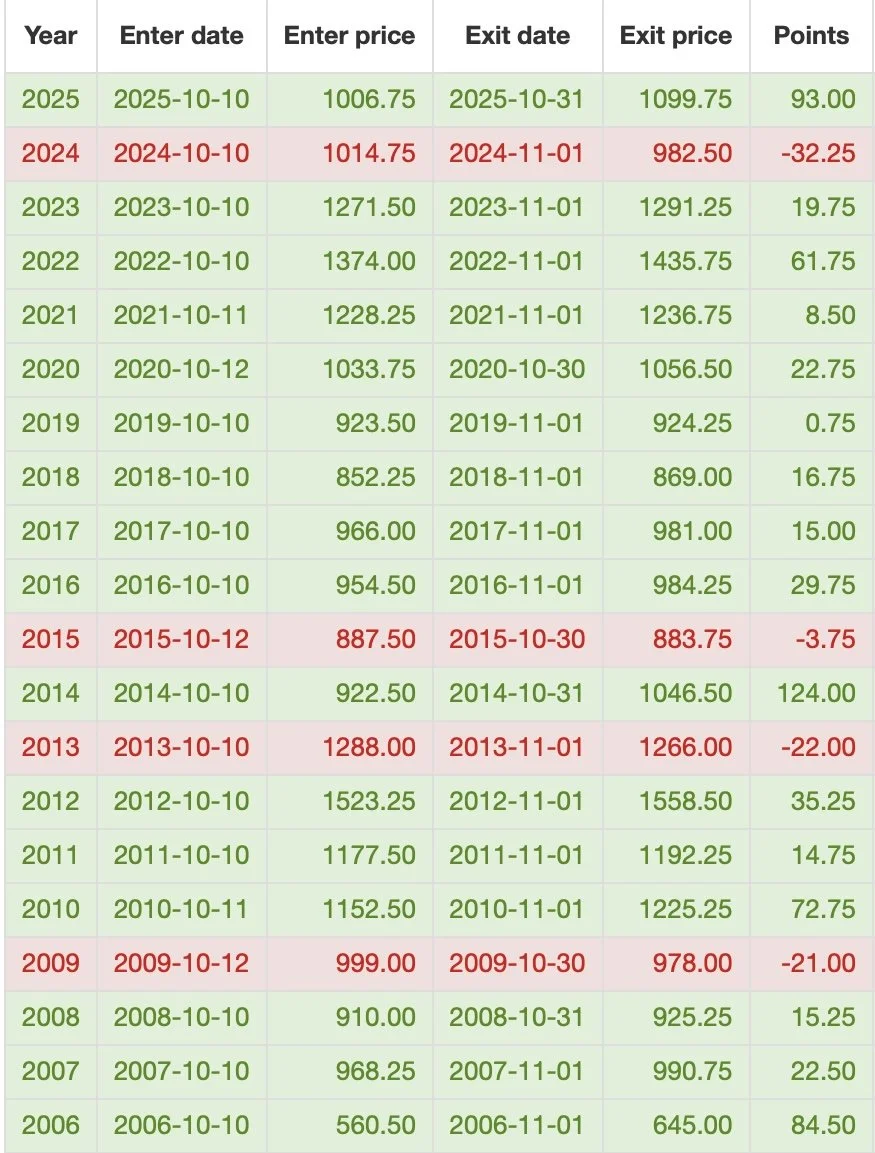
From October 10th to November 1st, soybeans have traded higher in 9 of the last 10 years.
Higher in 16 of 20 years.
That's a pretty strong set of data.
Once we get through this harvest pressure and seasonally weak time frame, there are still plenty of friendly things going for soybeans.
I'm not getting into all the fundamentals today as they haven’t changed from our last several updates.
You've got a dramatic improvement with exports this year. China is going to continue to buy, so we might have to ration business to non-China destinations as we don’t have enoughs soybeans to export the same amount as we did last year to non-China.
Crush is still a record. You still have the Super El Niño coming up which I can’t imagine will be making the world situation more bearish from here.
A tight world situation leads to higher prices historically.
It's at multi-year even with record Brazil and US crops. As I've went over countless times before.
Soybean Charts
Nov Beans Chart:
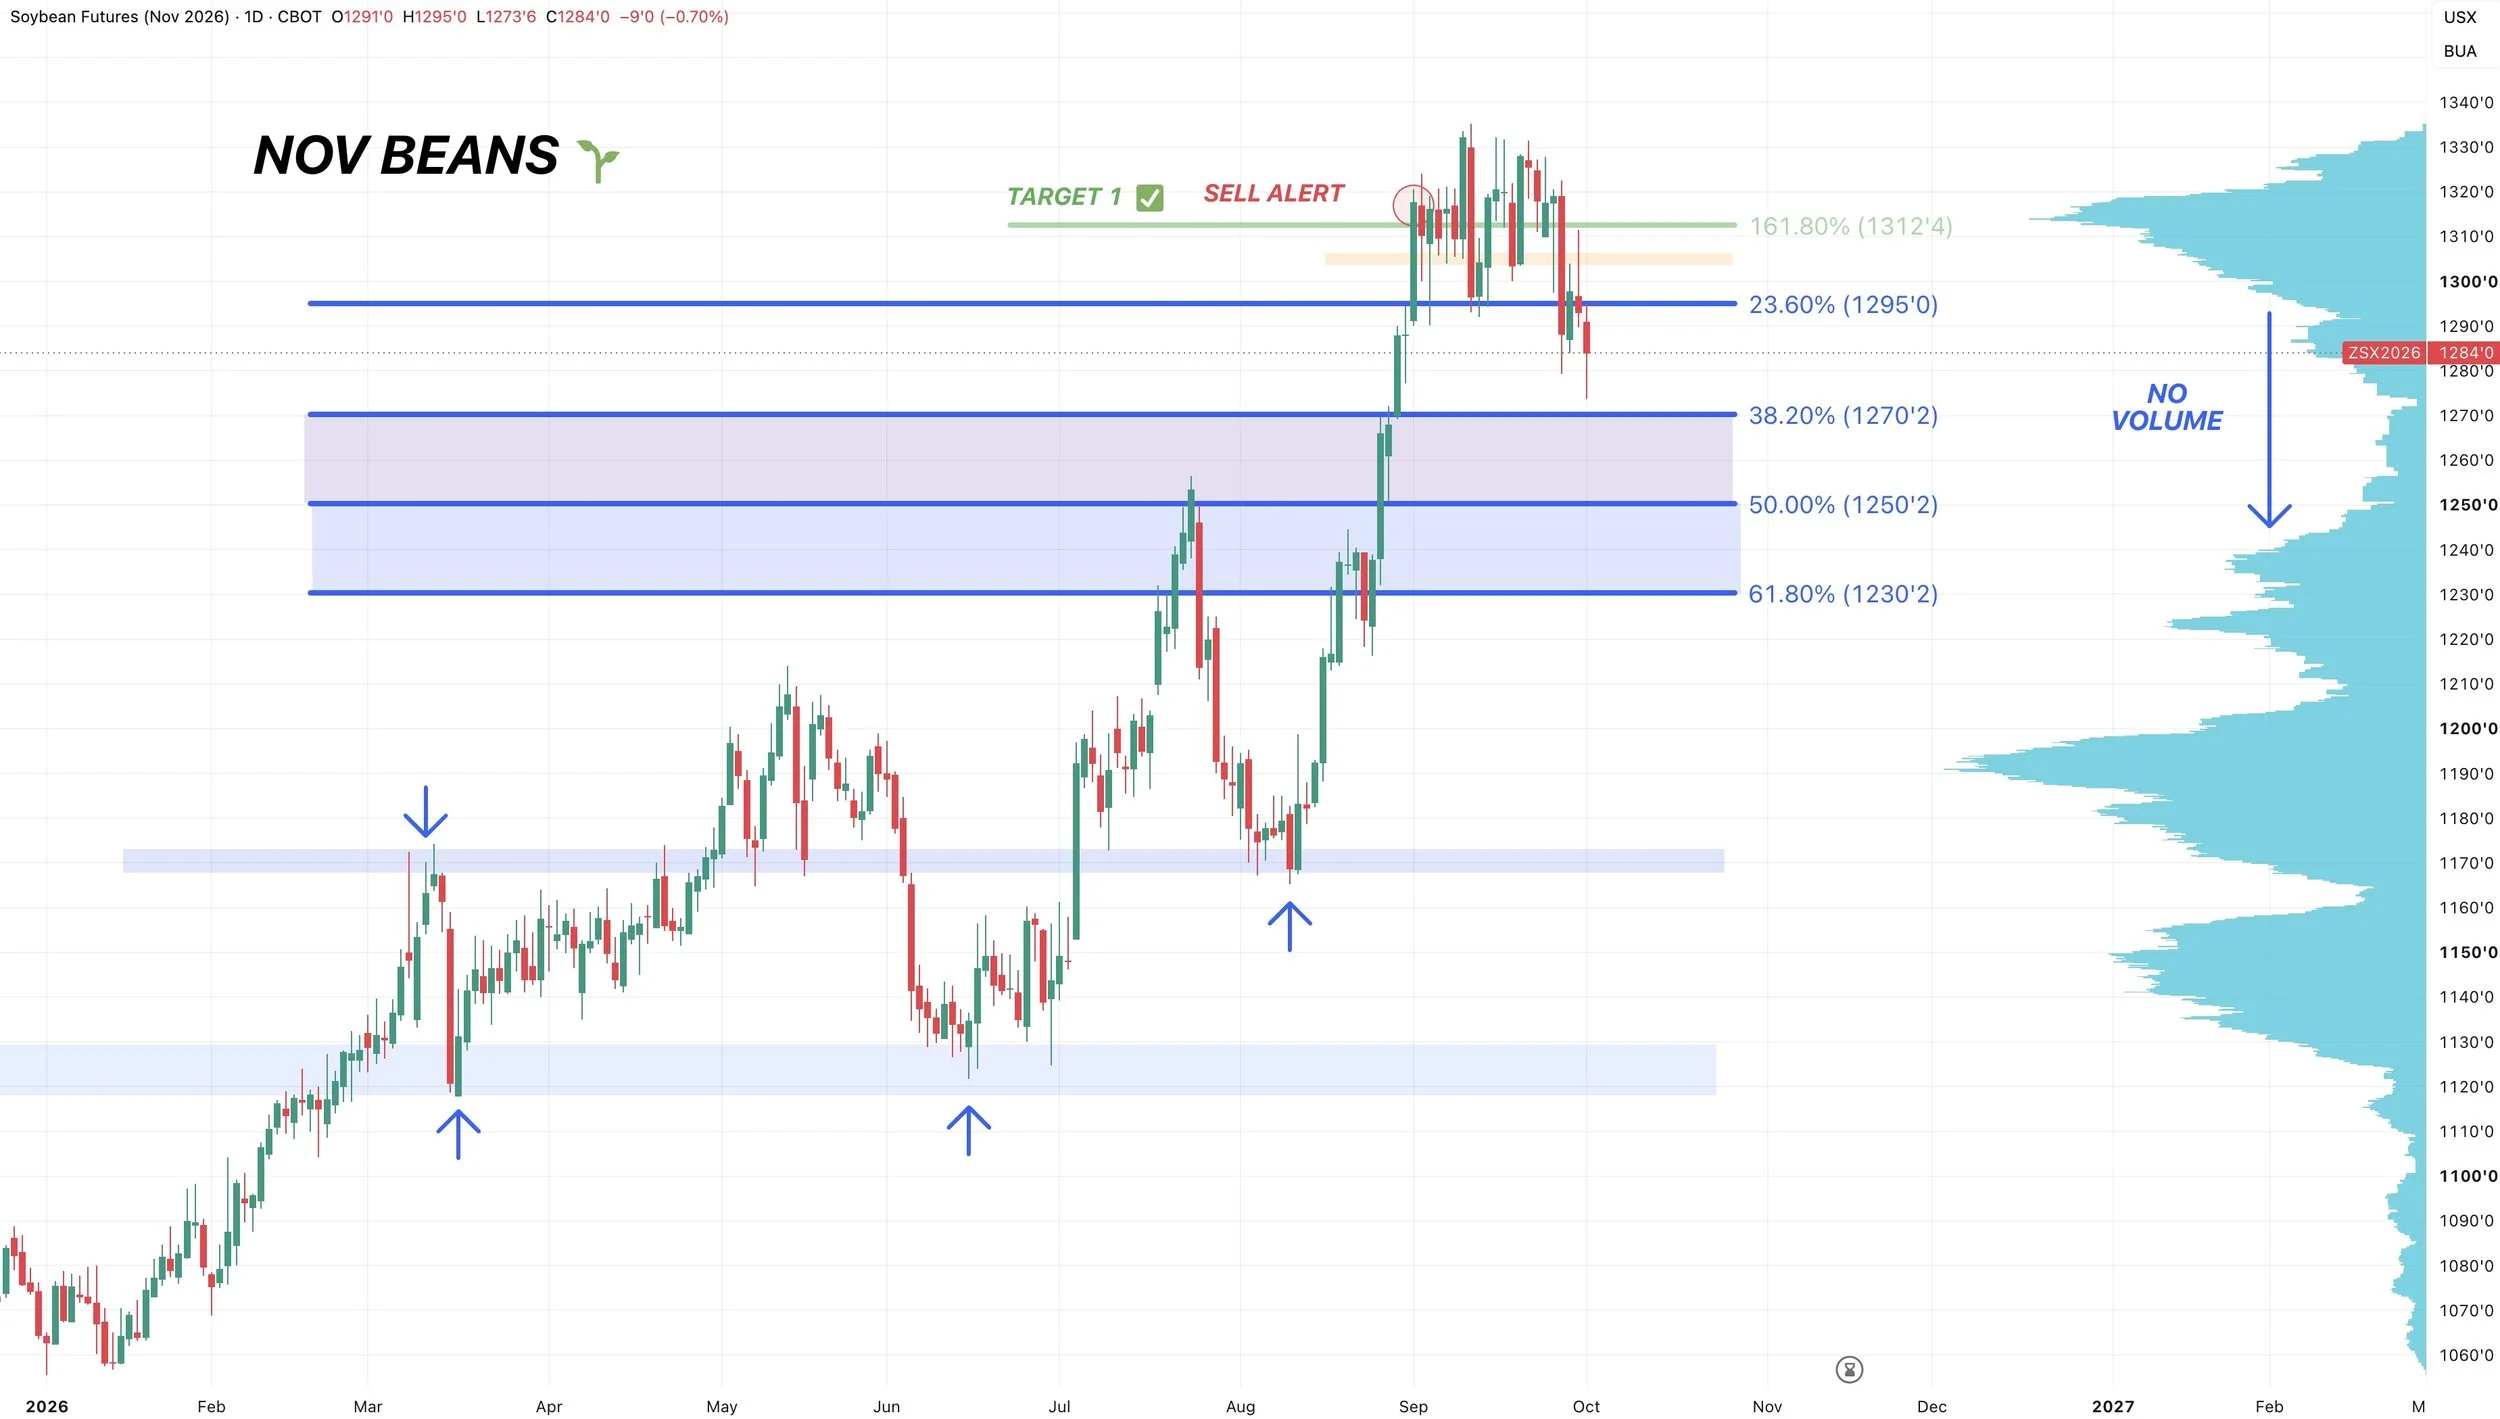
Soybeans posted new lows today, but closed well off the lows.
For me to be confident we've found a bottom, I need to see us close back up into that range above $13.00
If we are not able to do that, finding a bottom between $12.50 to $12.70 would make sense.
It gives back 38.2% to 50% of the rally from August.
If we got down to the 50% level we would also re-test the highs from July.
We need to see us get back into that prior range fast as there is still very low volume below that support.
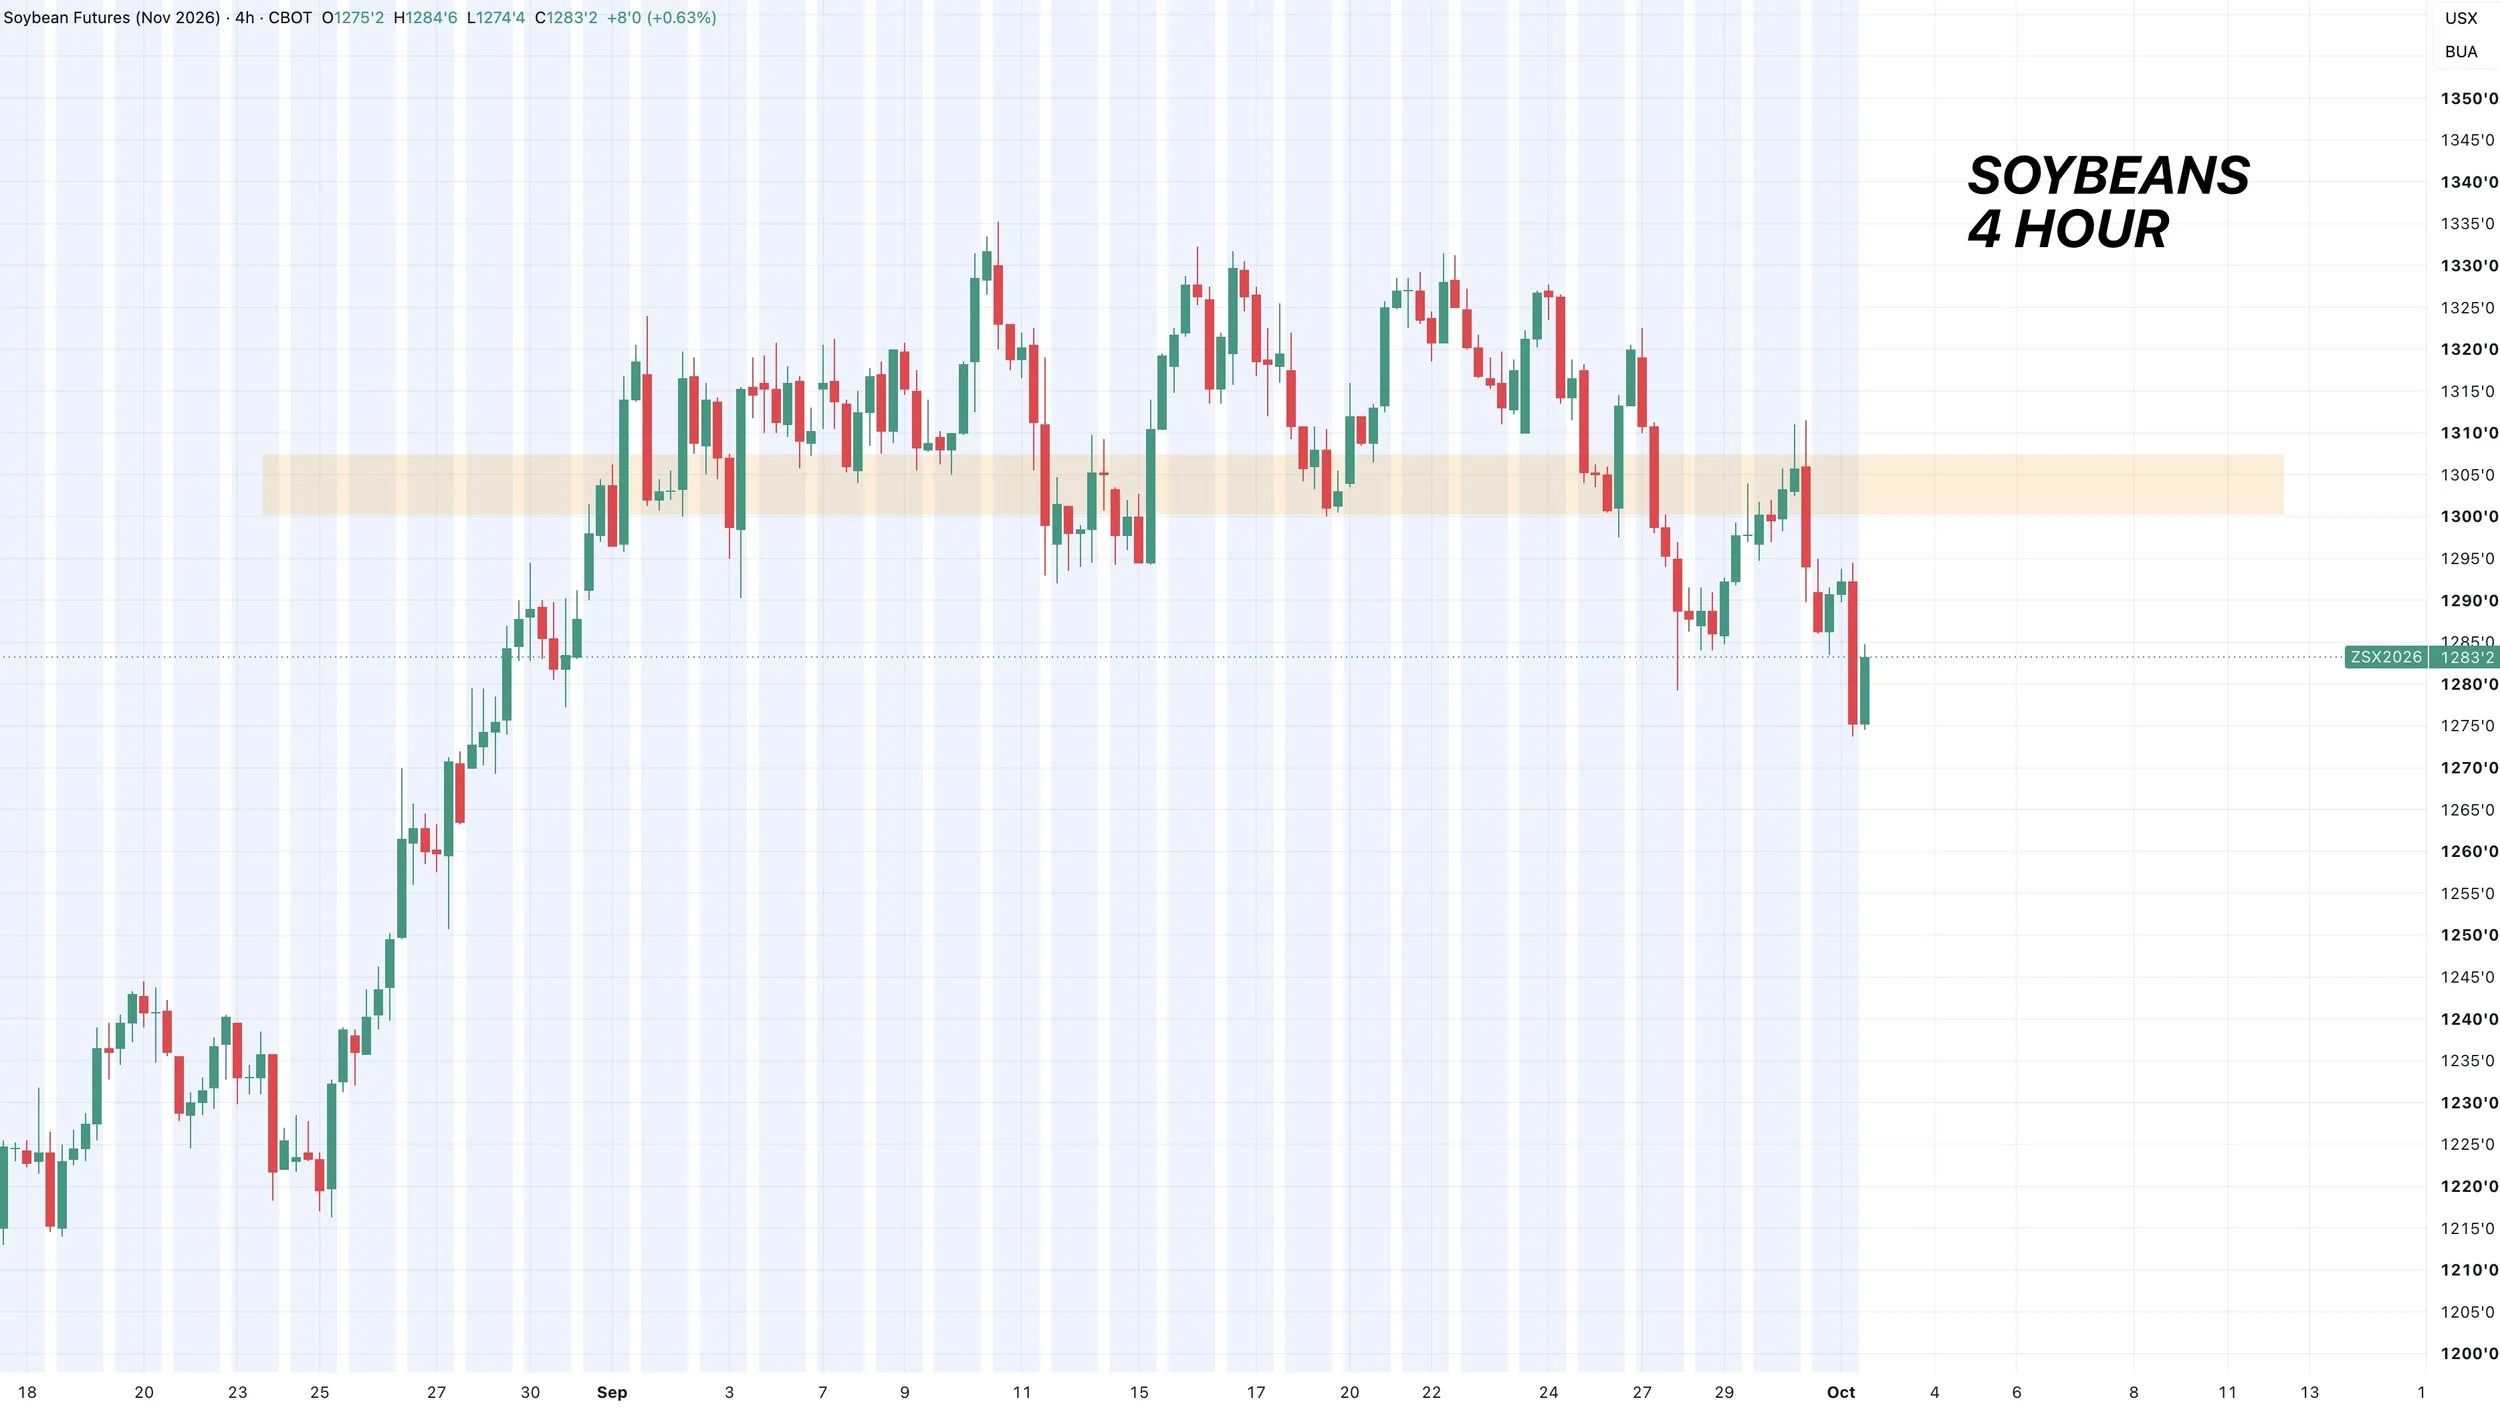
Here is a 4 hour chart for a better visual.
We had that clear support.
We broke it.
We came up and re-tested it. We then rejected it.
So we need to break above to be more confident the bottom is in.
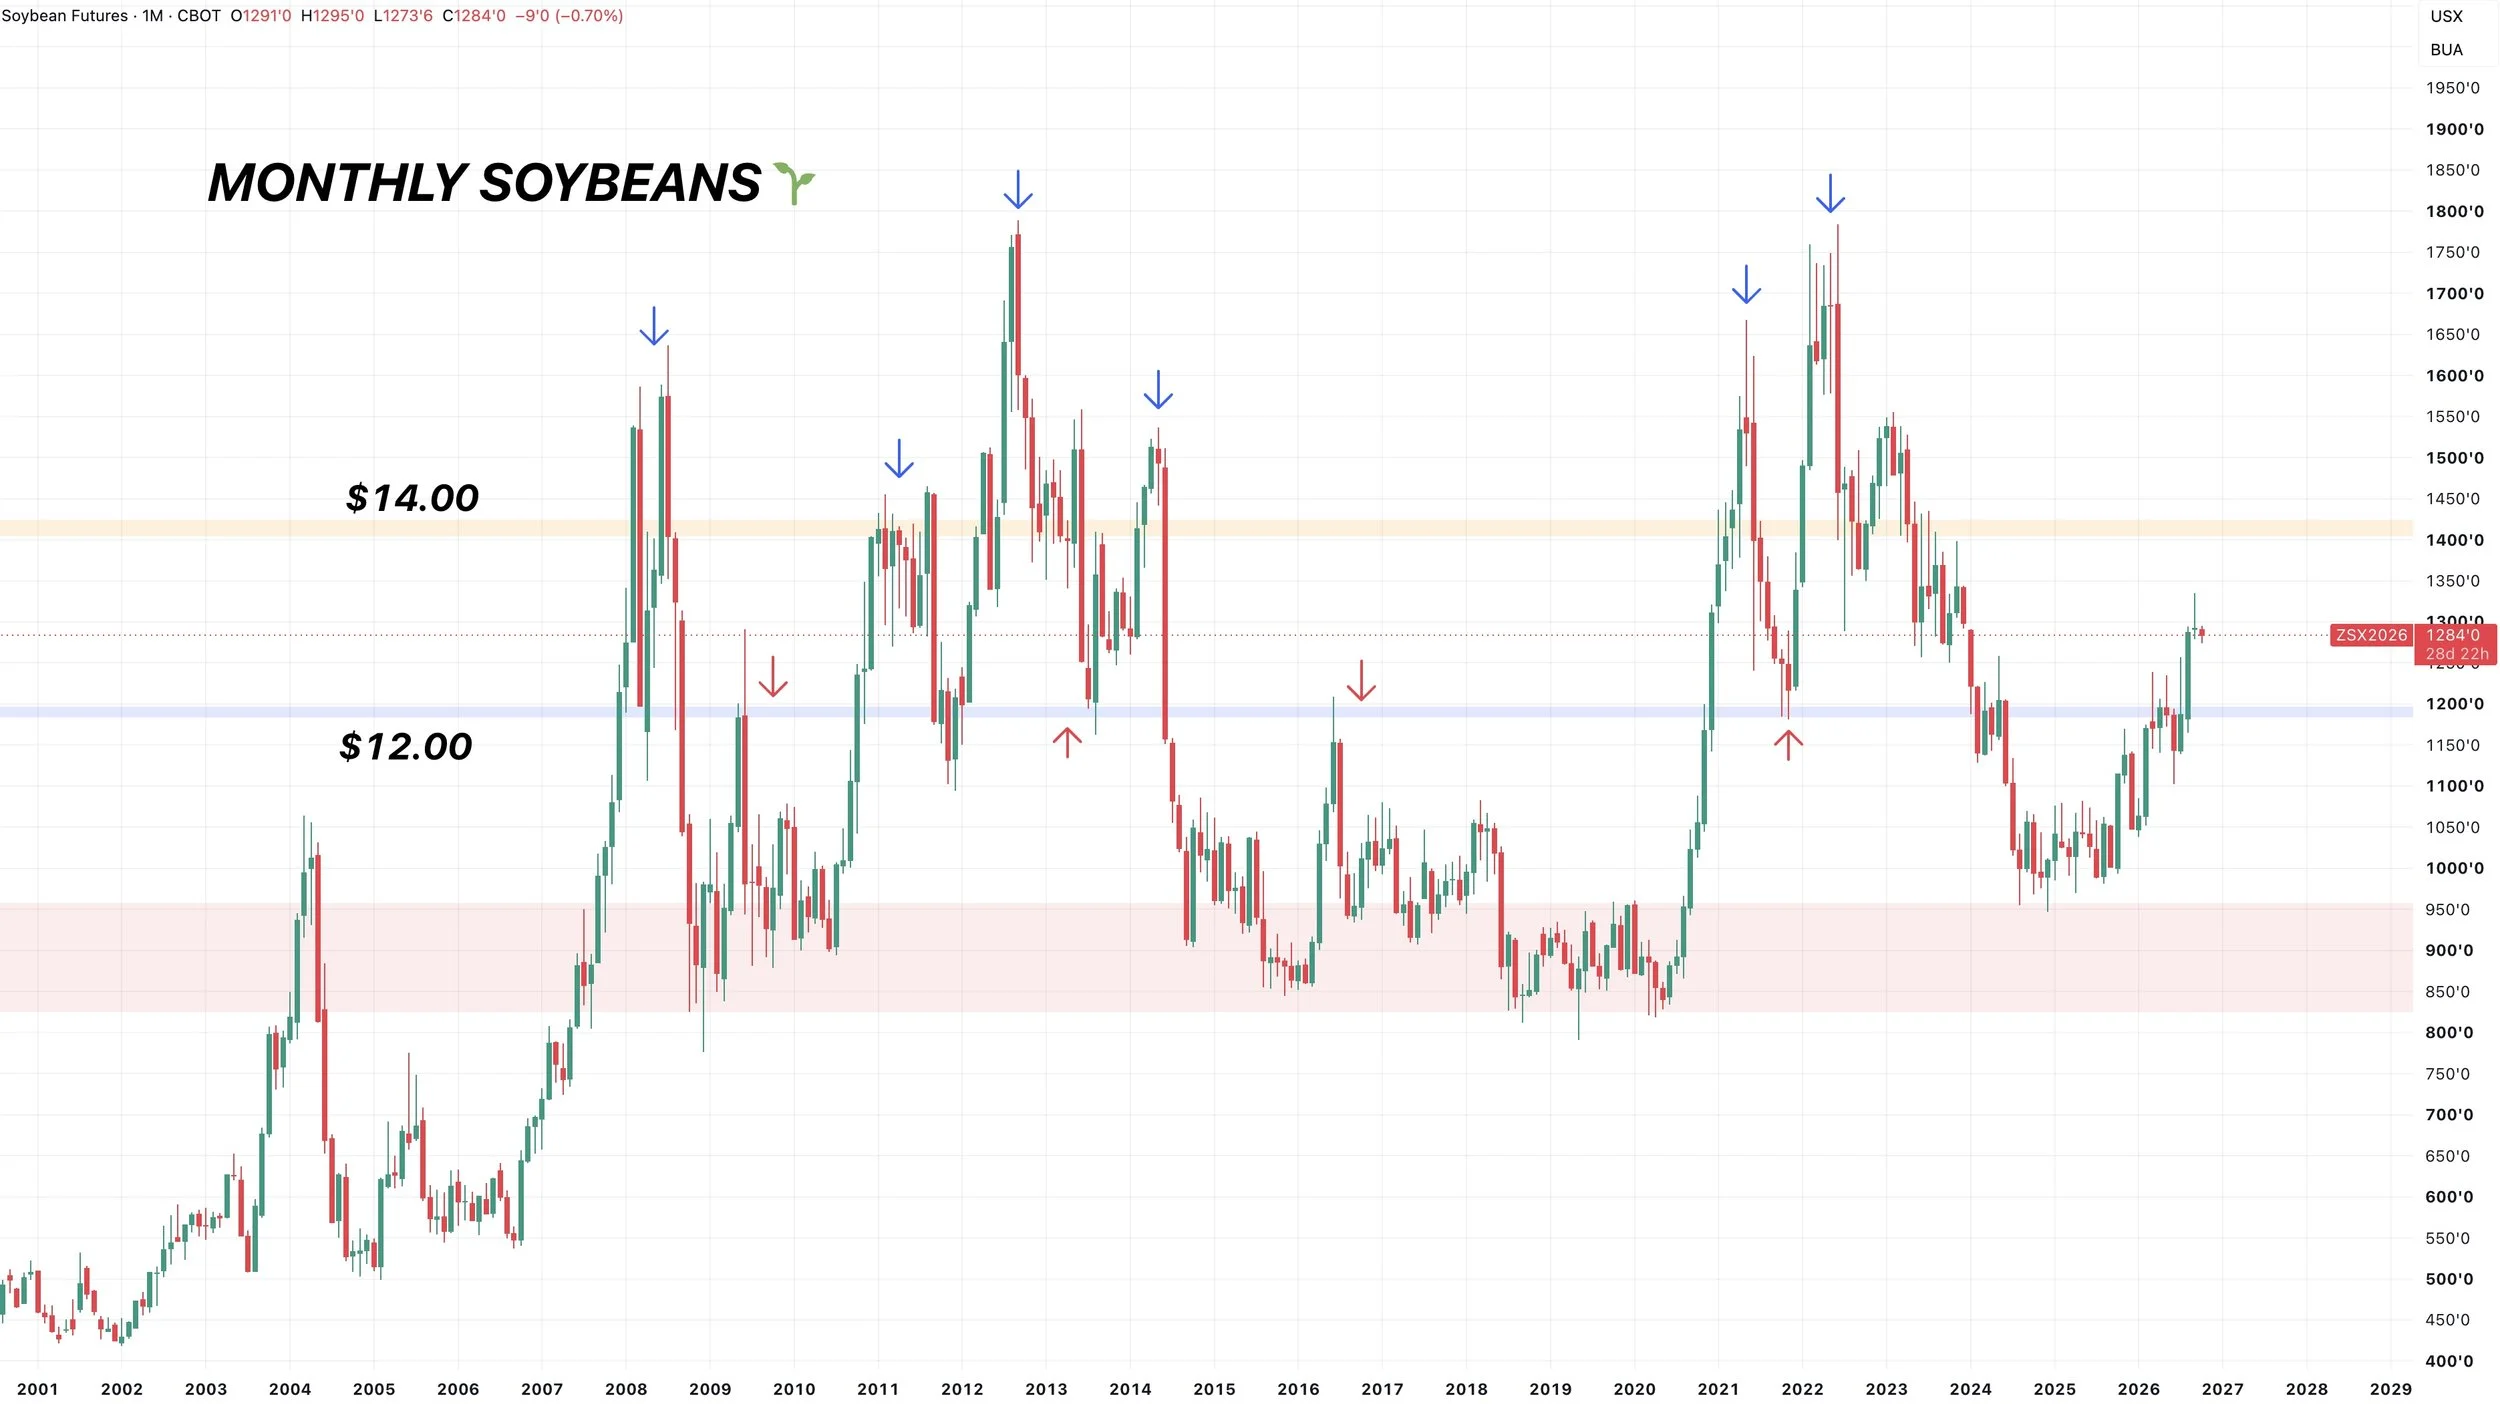
I still think beans will ultimately see $14.00 at some point in time even if takes a while or perhaps even not until next year.
Every monthly close above $12.00 has led to at least $14.00
Wheat
Dec KC Chart:
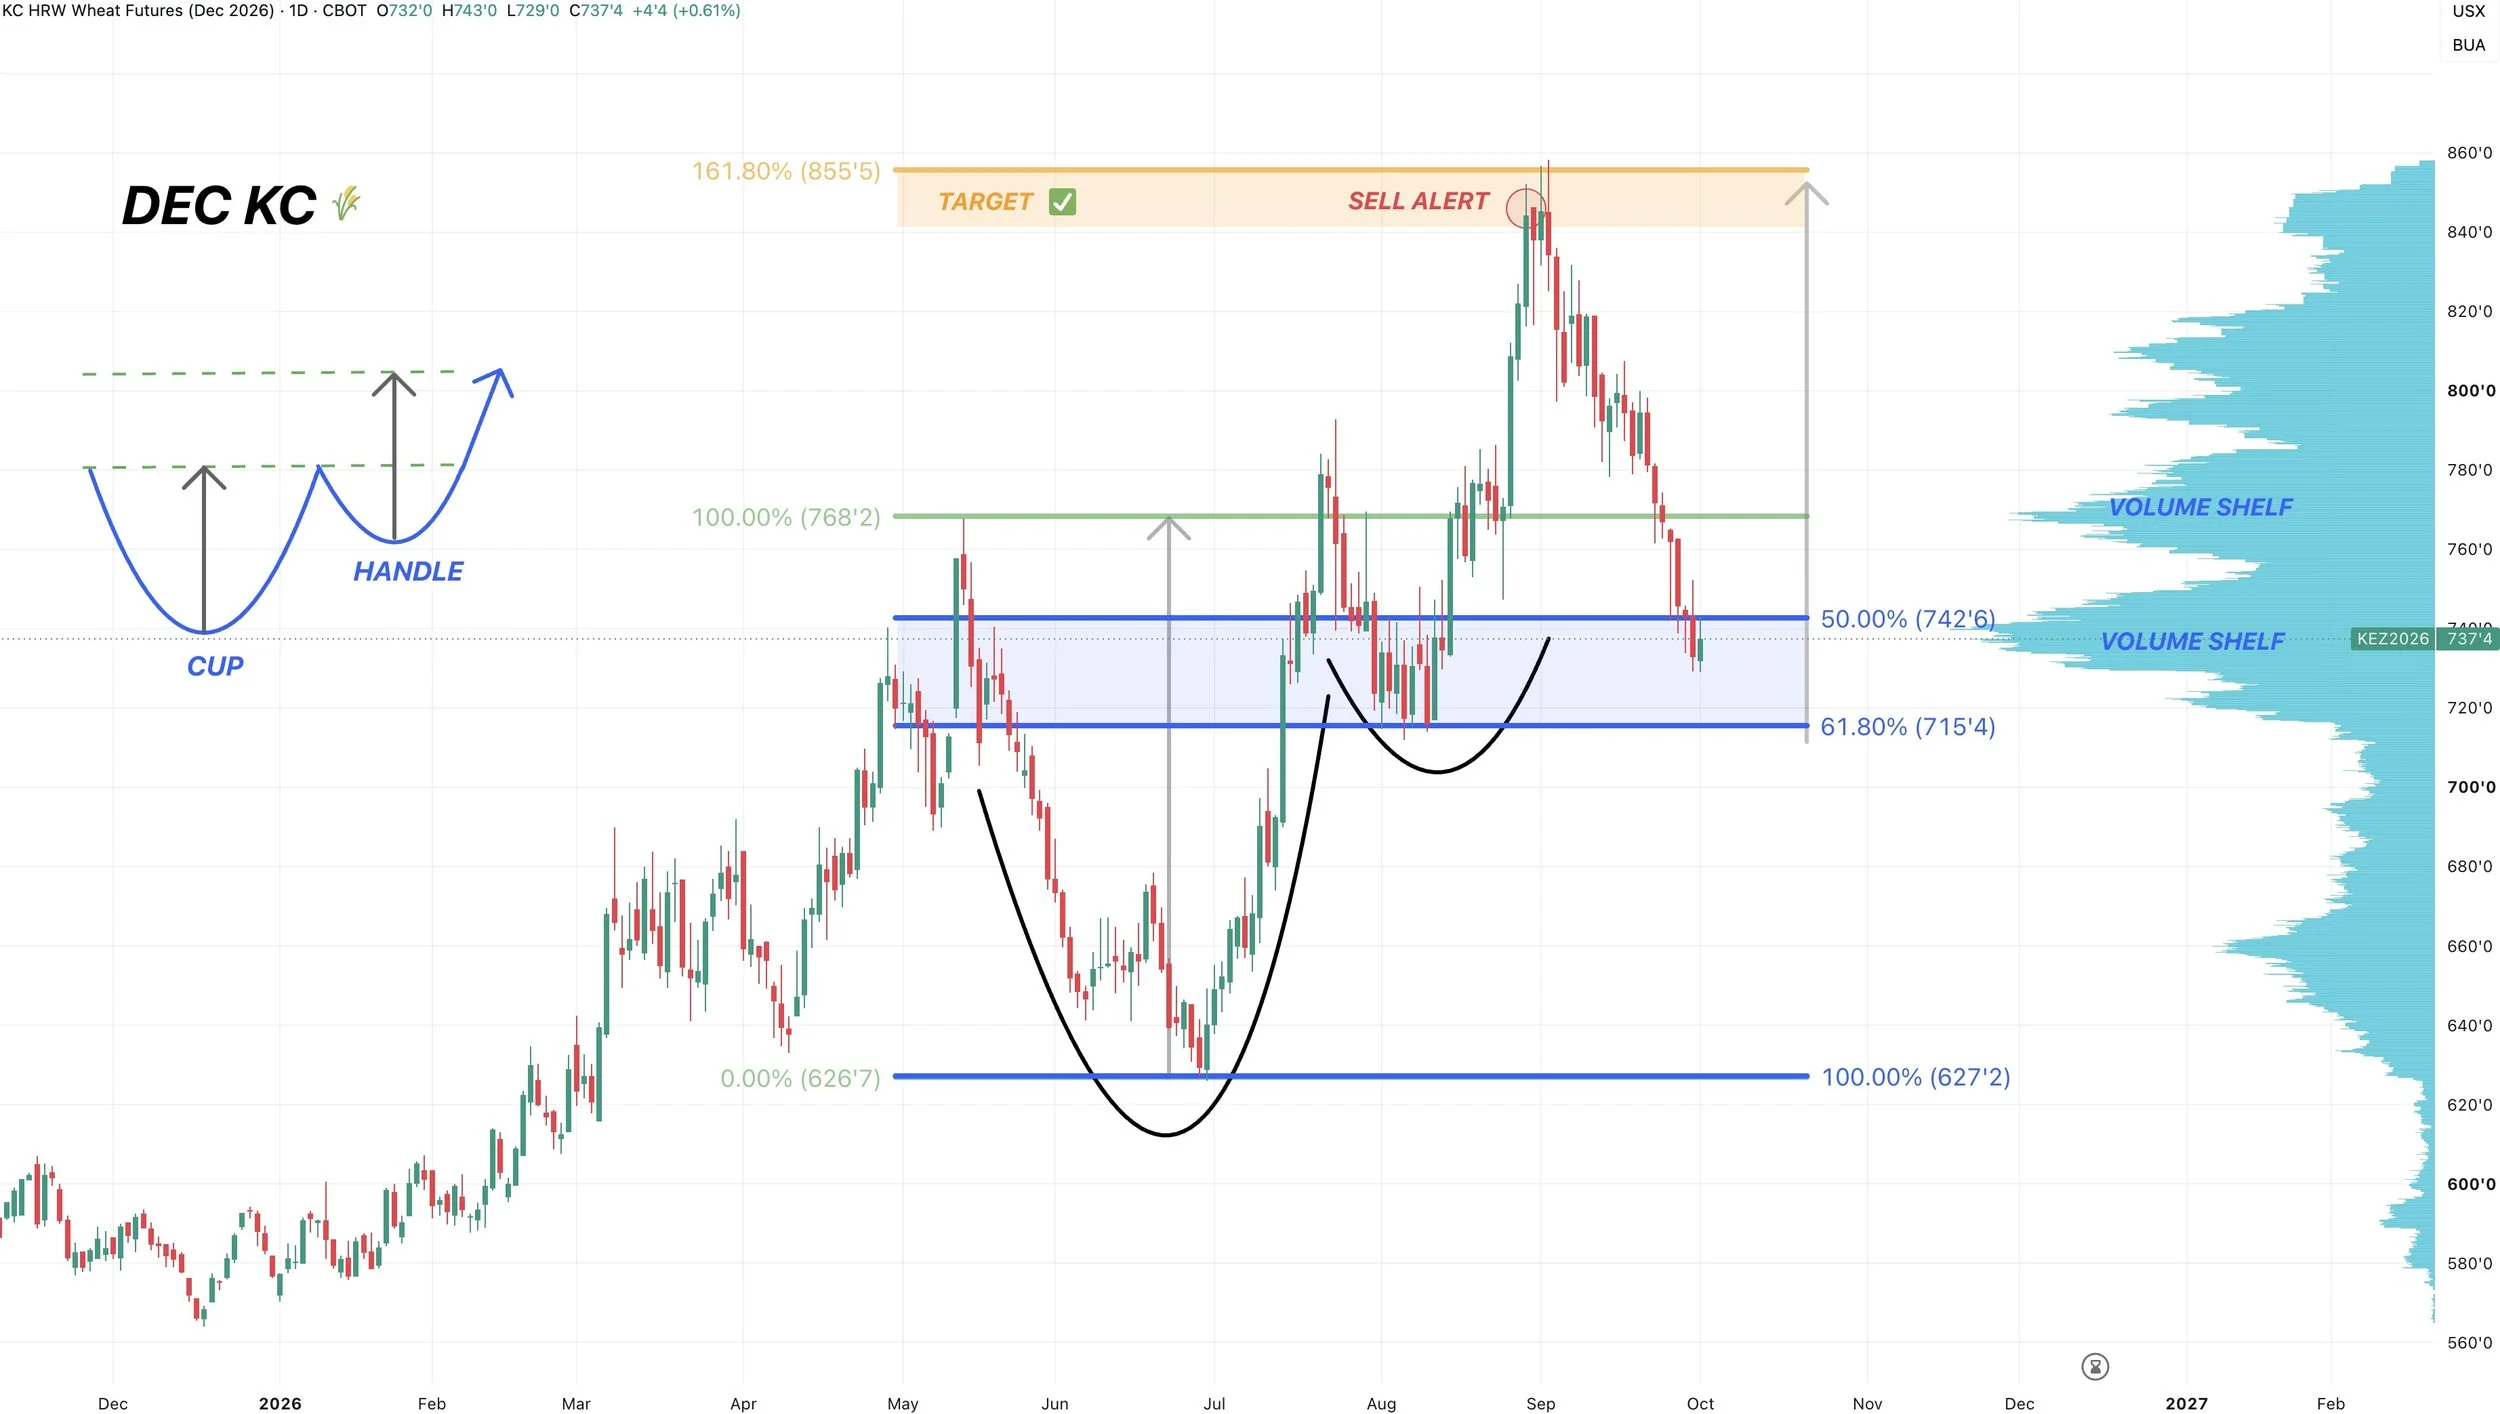
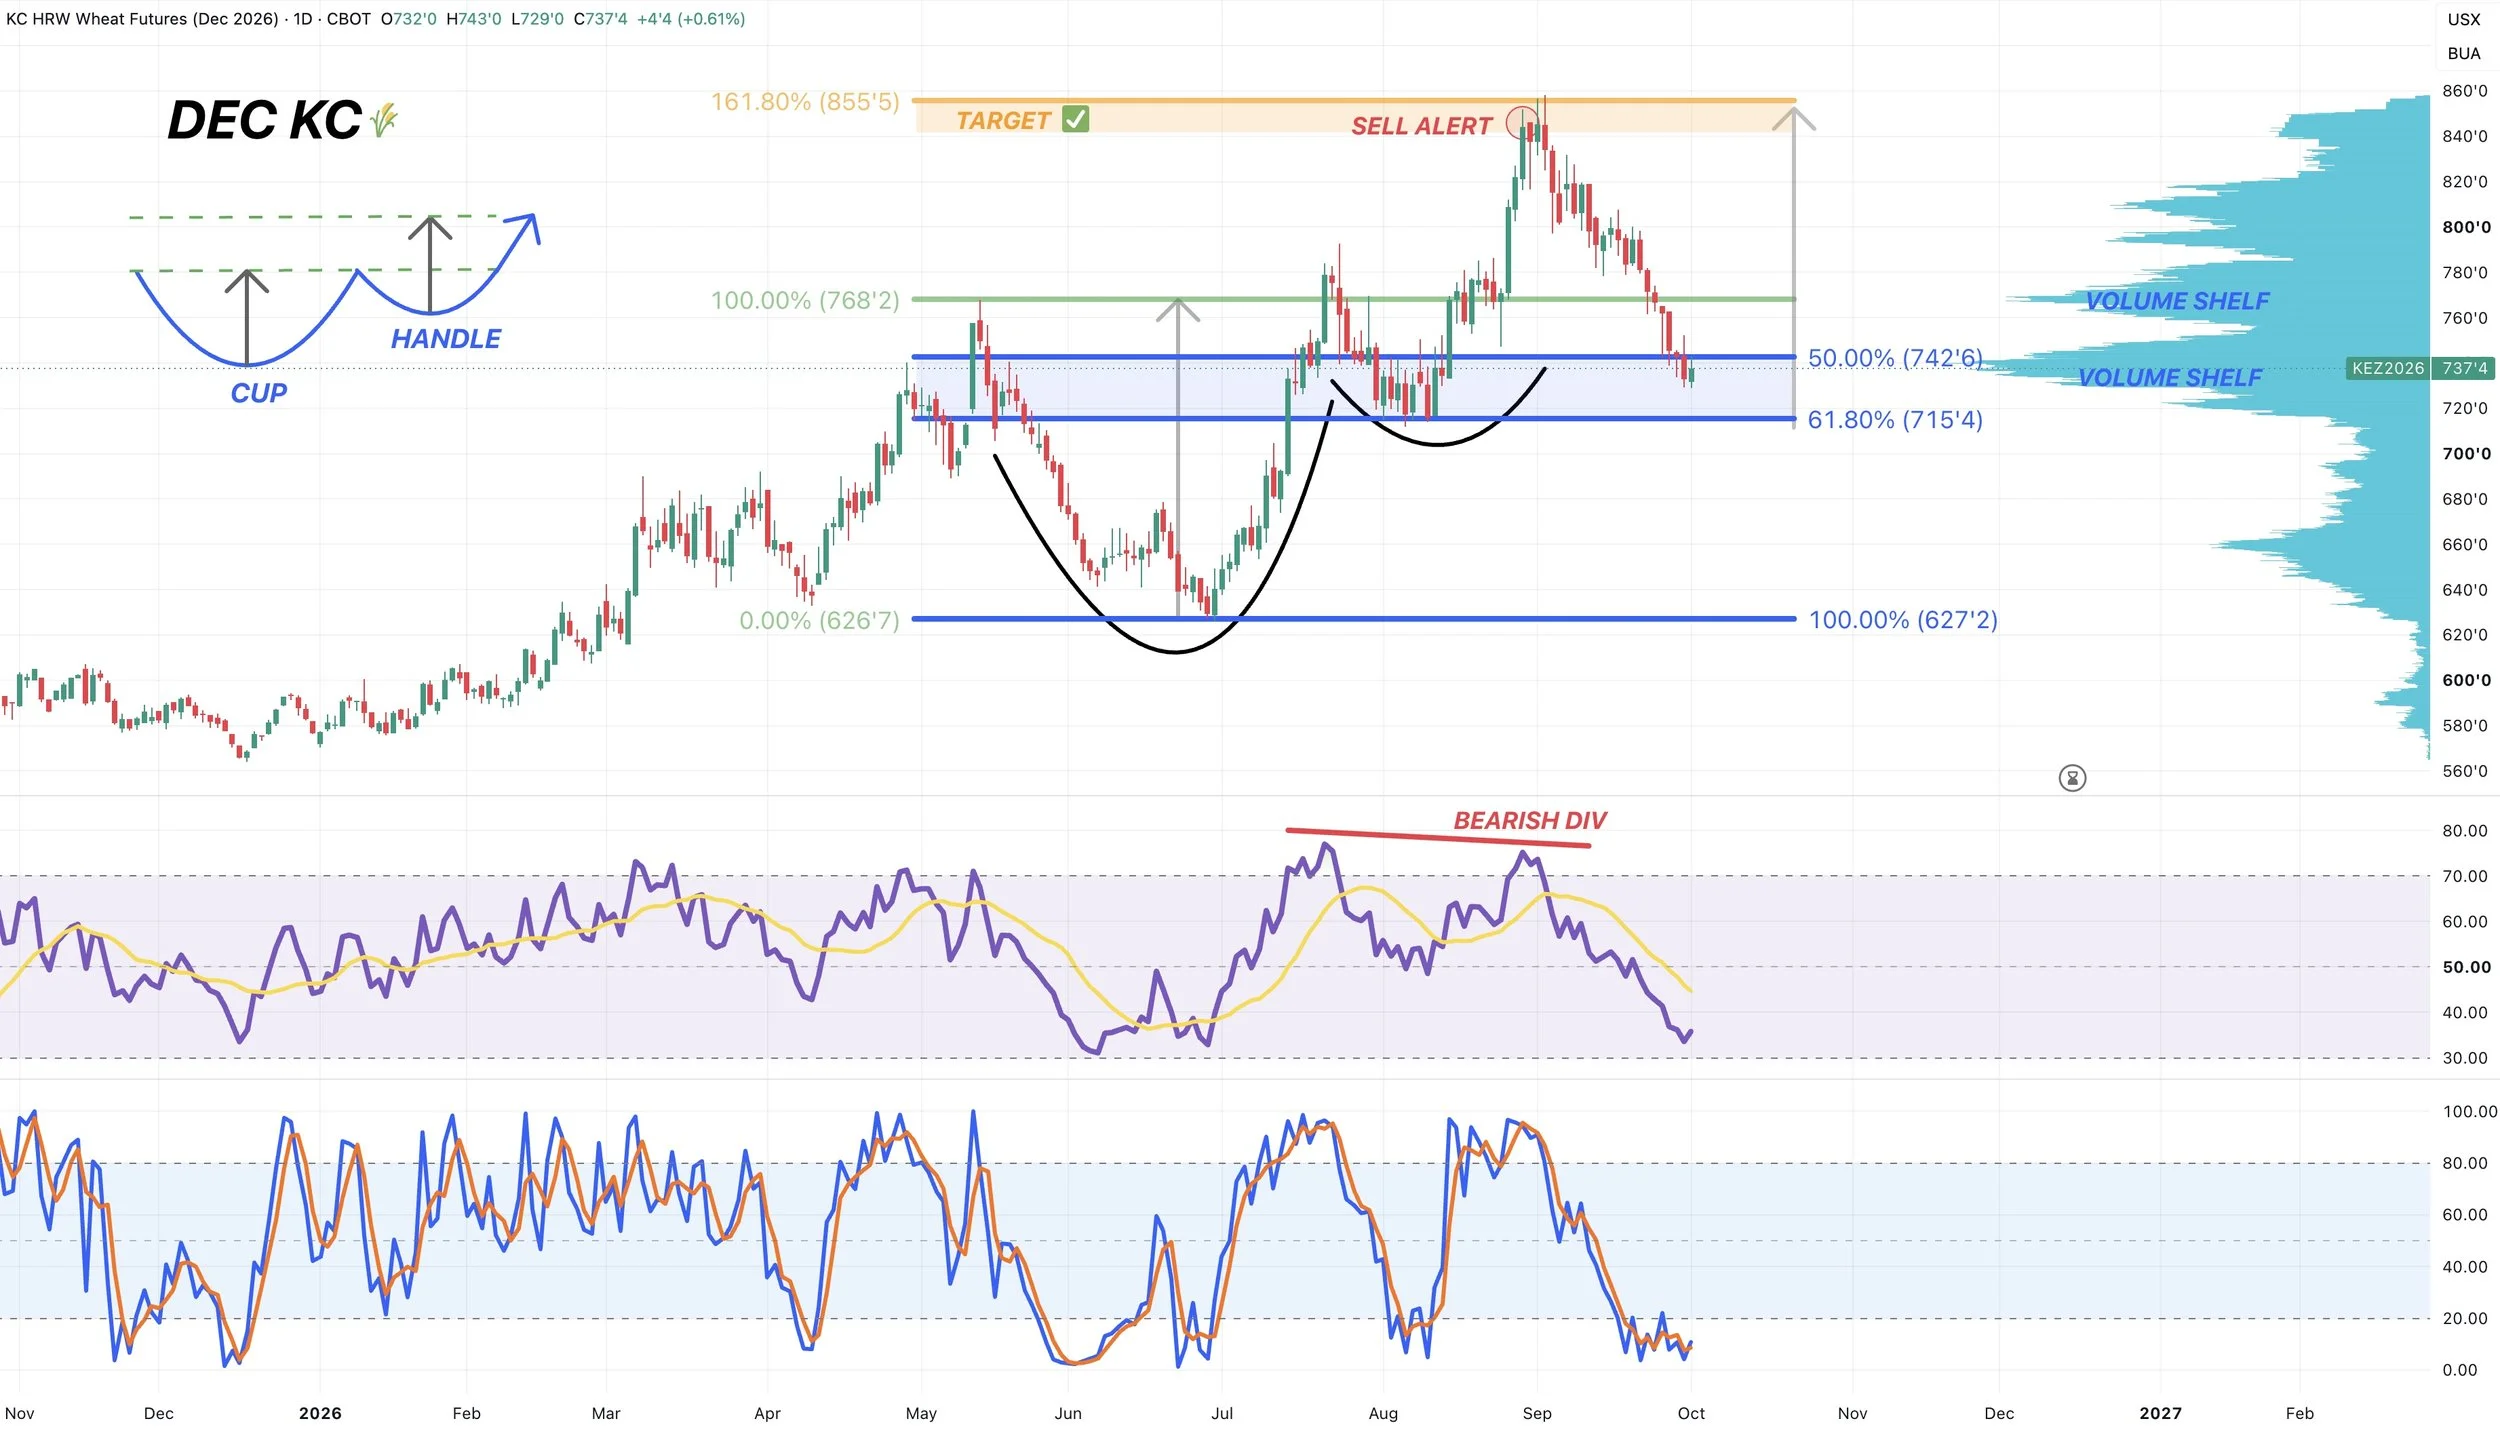
Wheat is sitting right in the golden zone down to the June lows.
This is where bulls need to step up to prevent the chart from falling apart.
If we are going to bottom, this is where we would expect us to carve out some lows.
Not only is this the golden zone, we are re-testing those highs from May.
We're also sitting at a massive shelf of volume which can act as a magnet and support.
If we start to break below this golden zone, then there would be a reason to be concerned as there would be zero volume or support below.
But for now, sitting right at support down here.
The last time we were this oversold wheat was trading over $1.00 lower than it is today.
Weekly KC Chart:
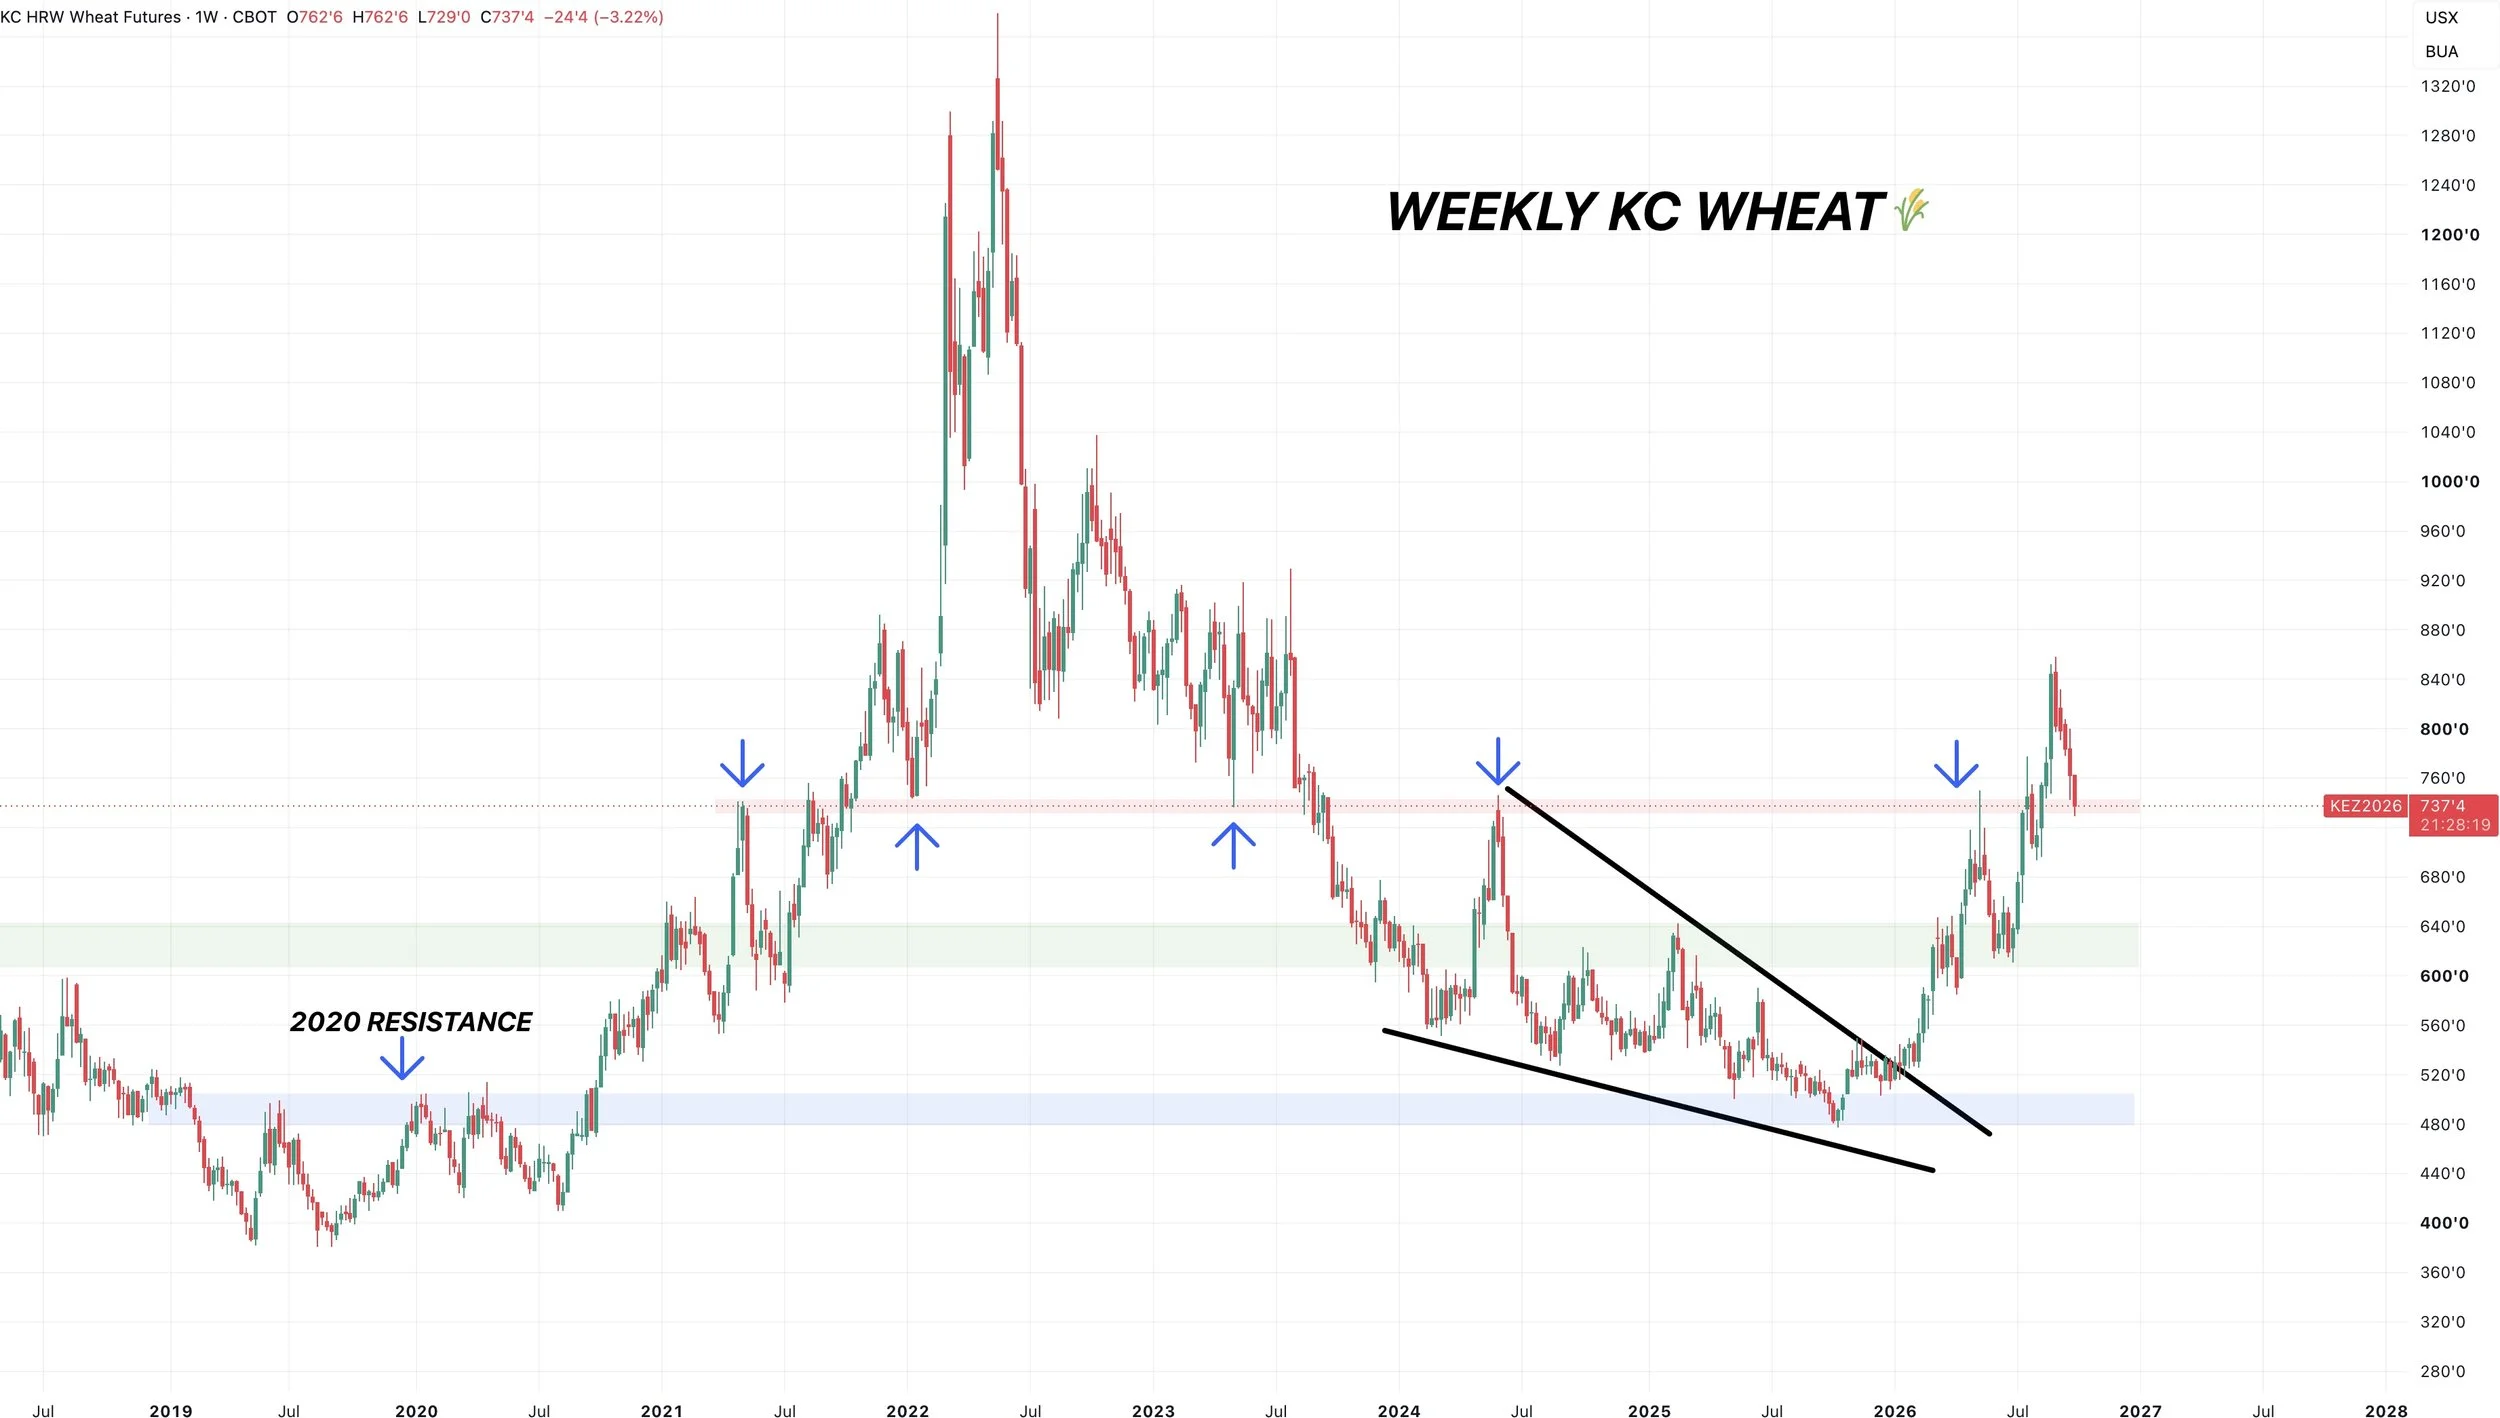
If you zoom out, this still looks like a simple high time frame re-test.
We broke through some major resistance earlier this year.
We're now coming down and trying to turn it into support.
$1.00 to $1.50 sell offs in wheat are actually very normal even in a bull market. The last bull market had multiple.
The big picture structure still looks perfectly fine as of now.
Cattle
Nov Feeders Chart:
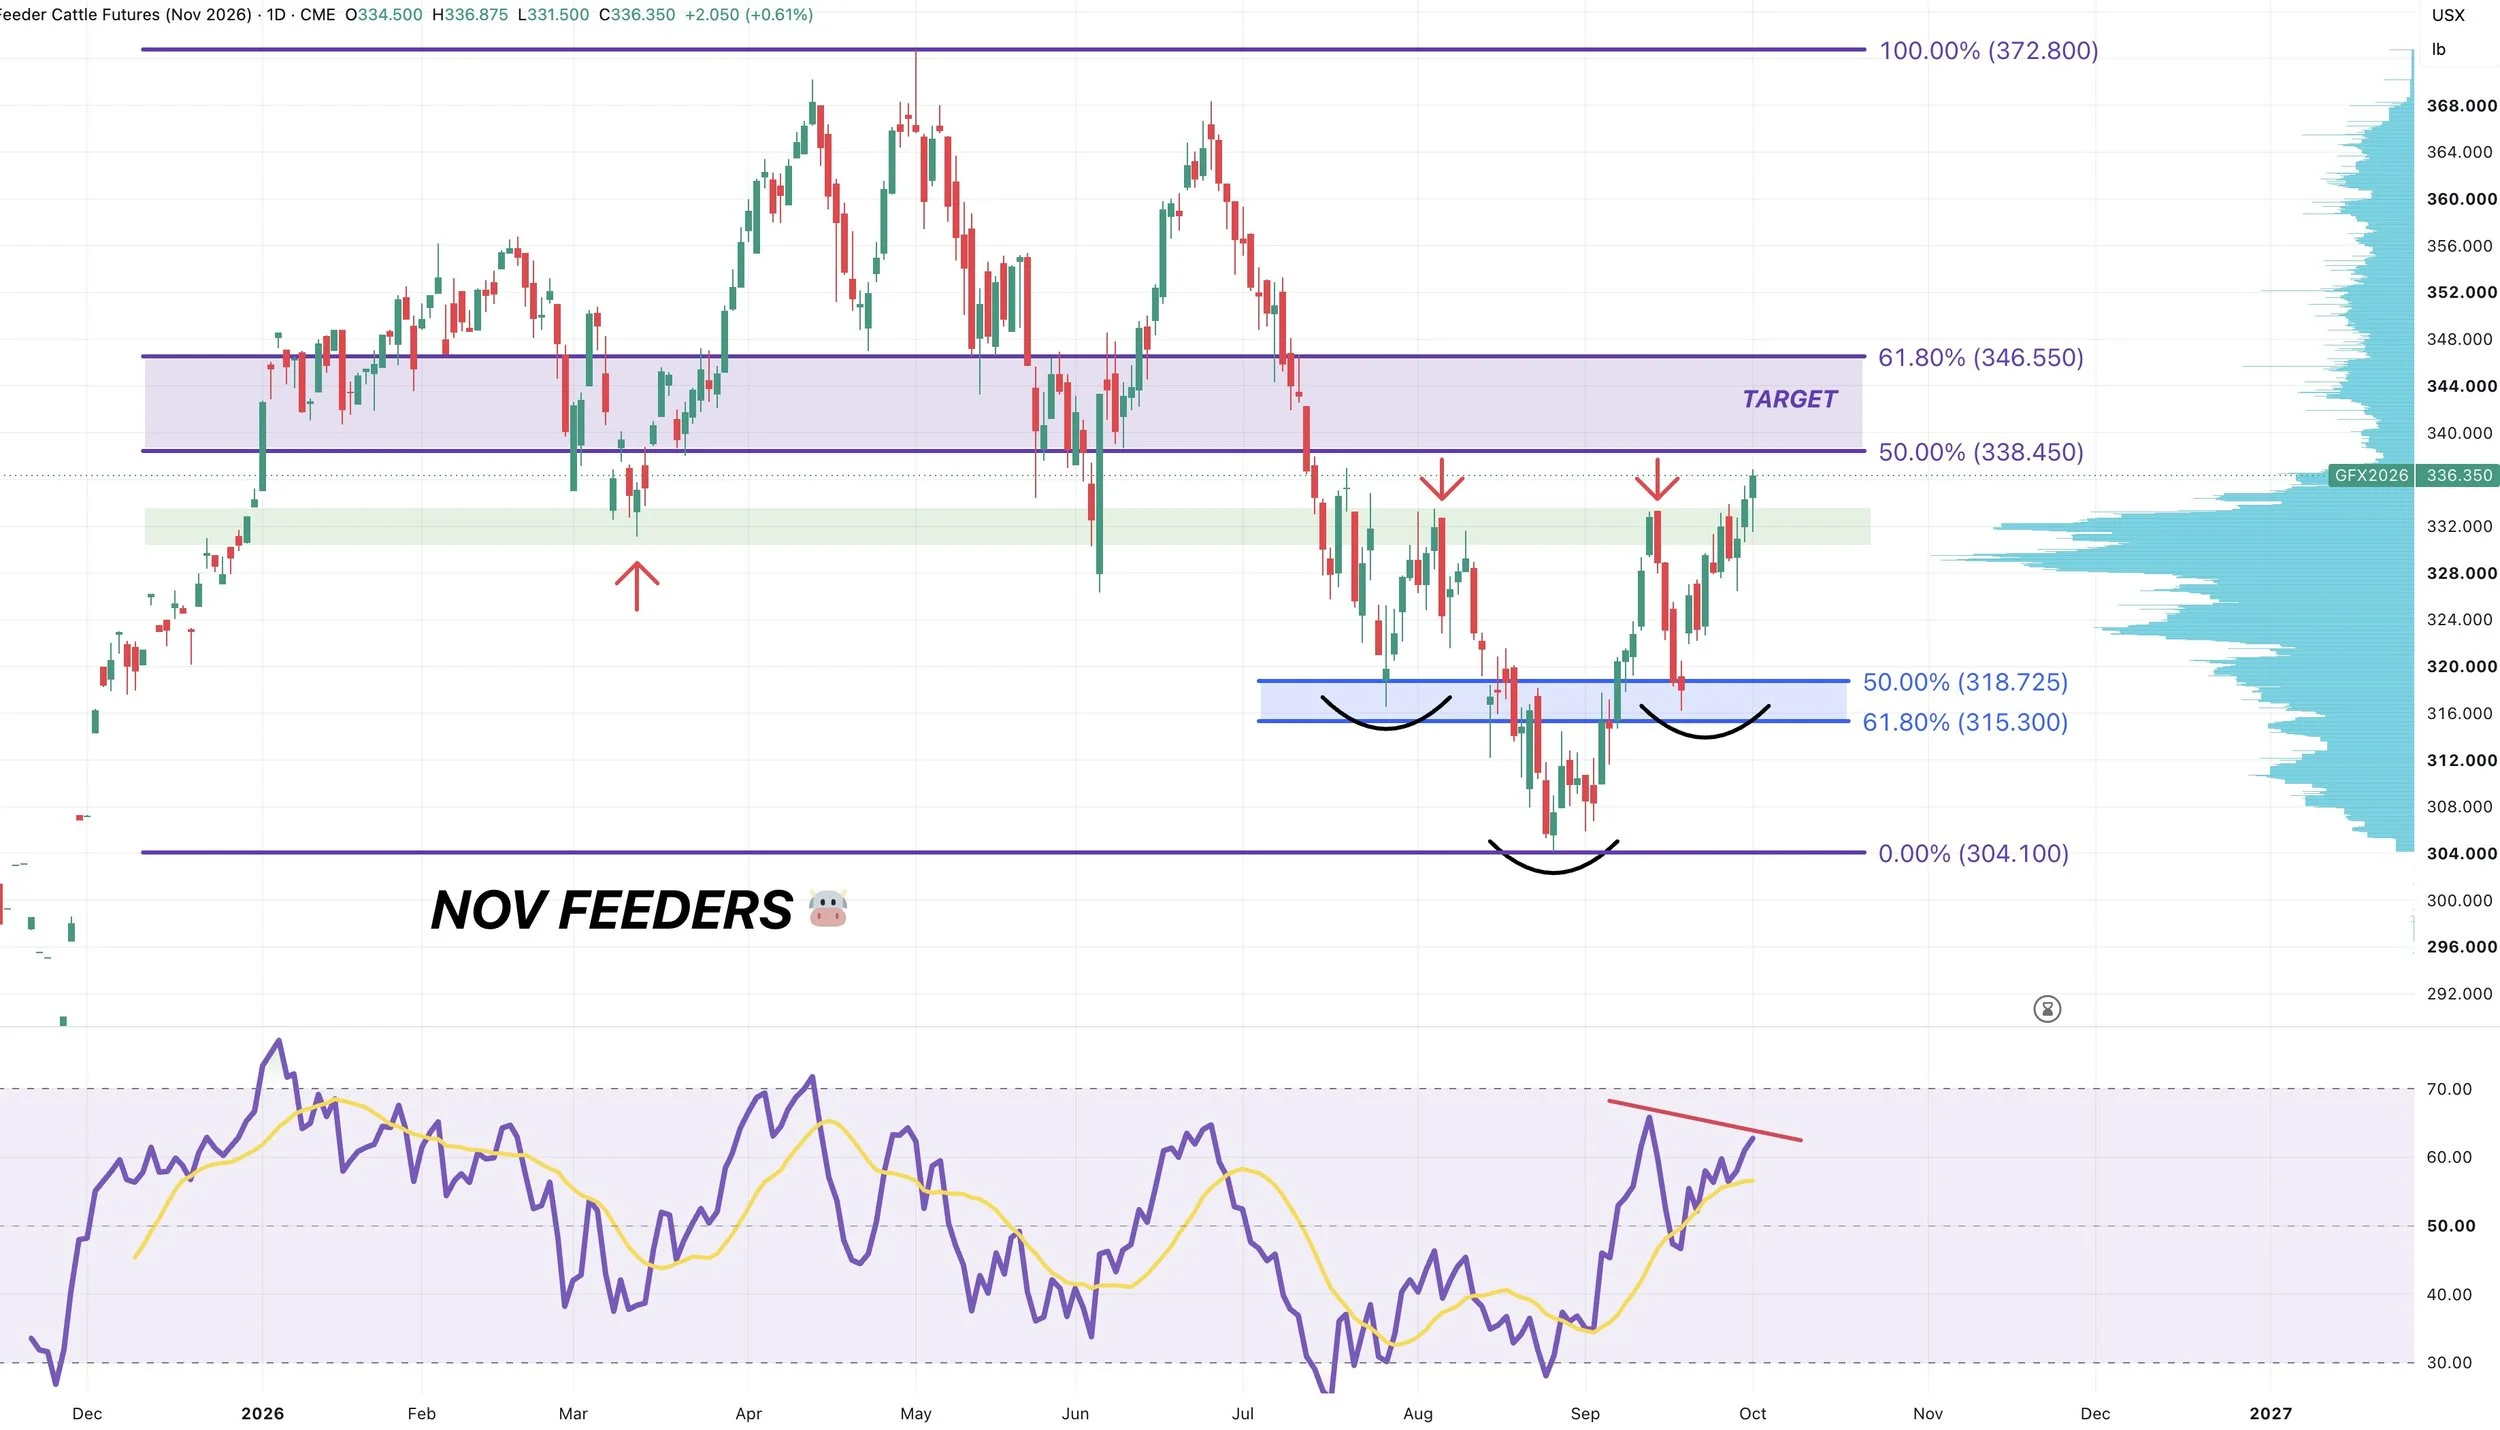
Feeders are breaking out above resistance, breaking out of this inverse head and shoulders pattern we've been talking about the last few weeks.
I would be looking to do some risk management soon up in this golden zone, which claws back 50% to 61.8% of the May highs.
We are starting to show some bearish divergence on the RSI. Prices are making new highs but the RSI is not.
This doesn’t mean we cannot keep going higher from here, but this is going to be something we want to keep our eyes on and another potential reason to de-risk in that target box.
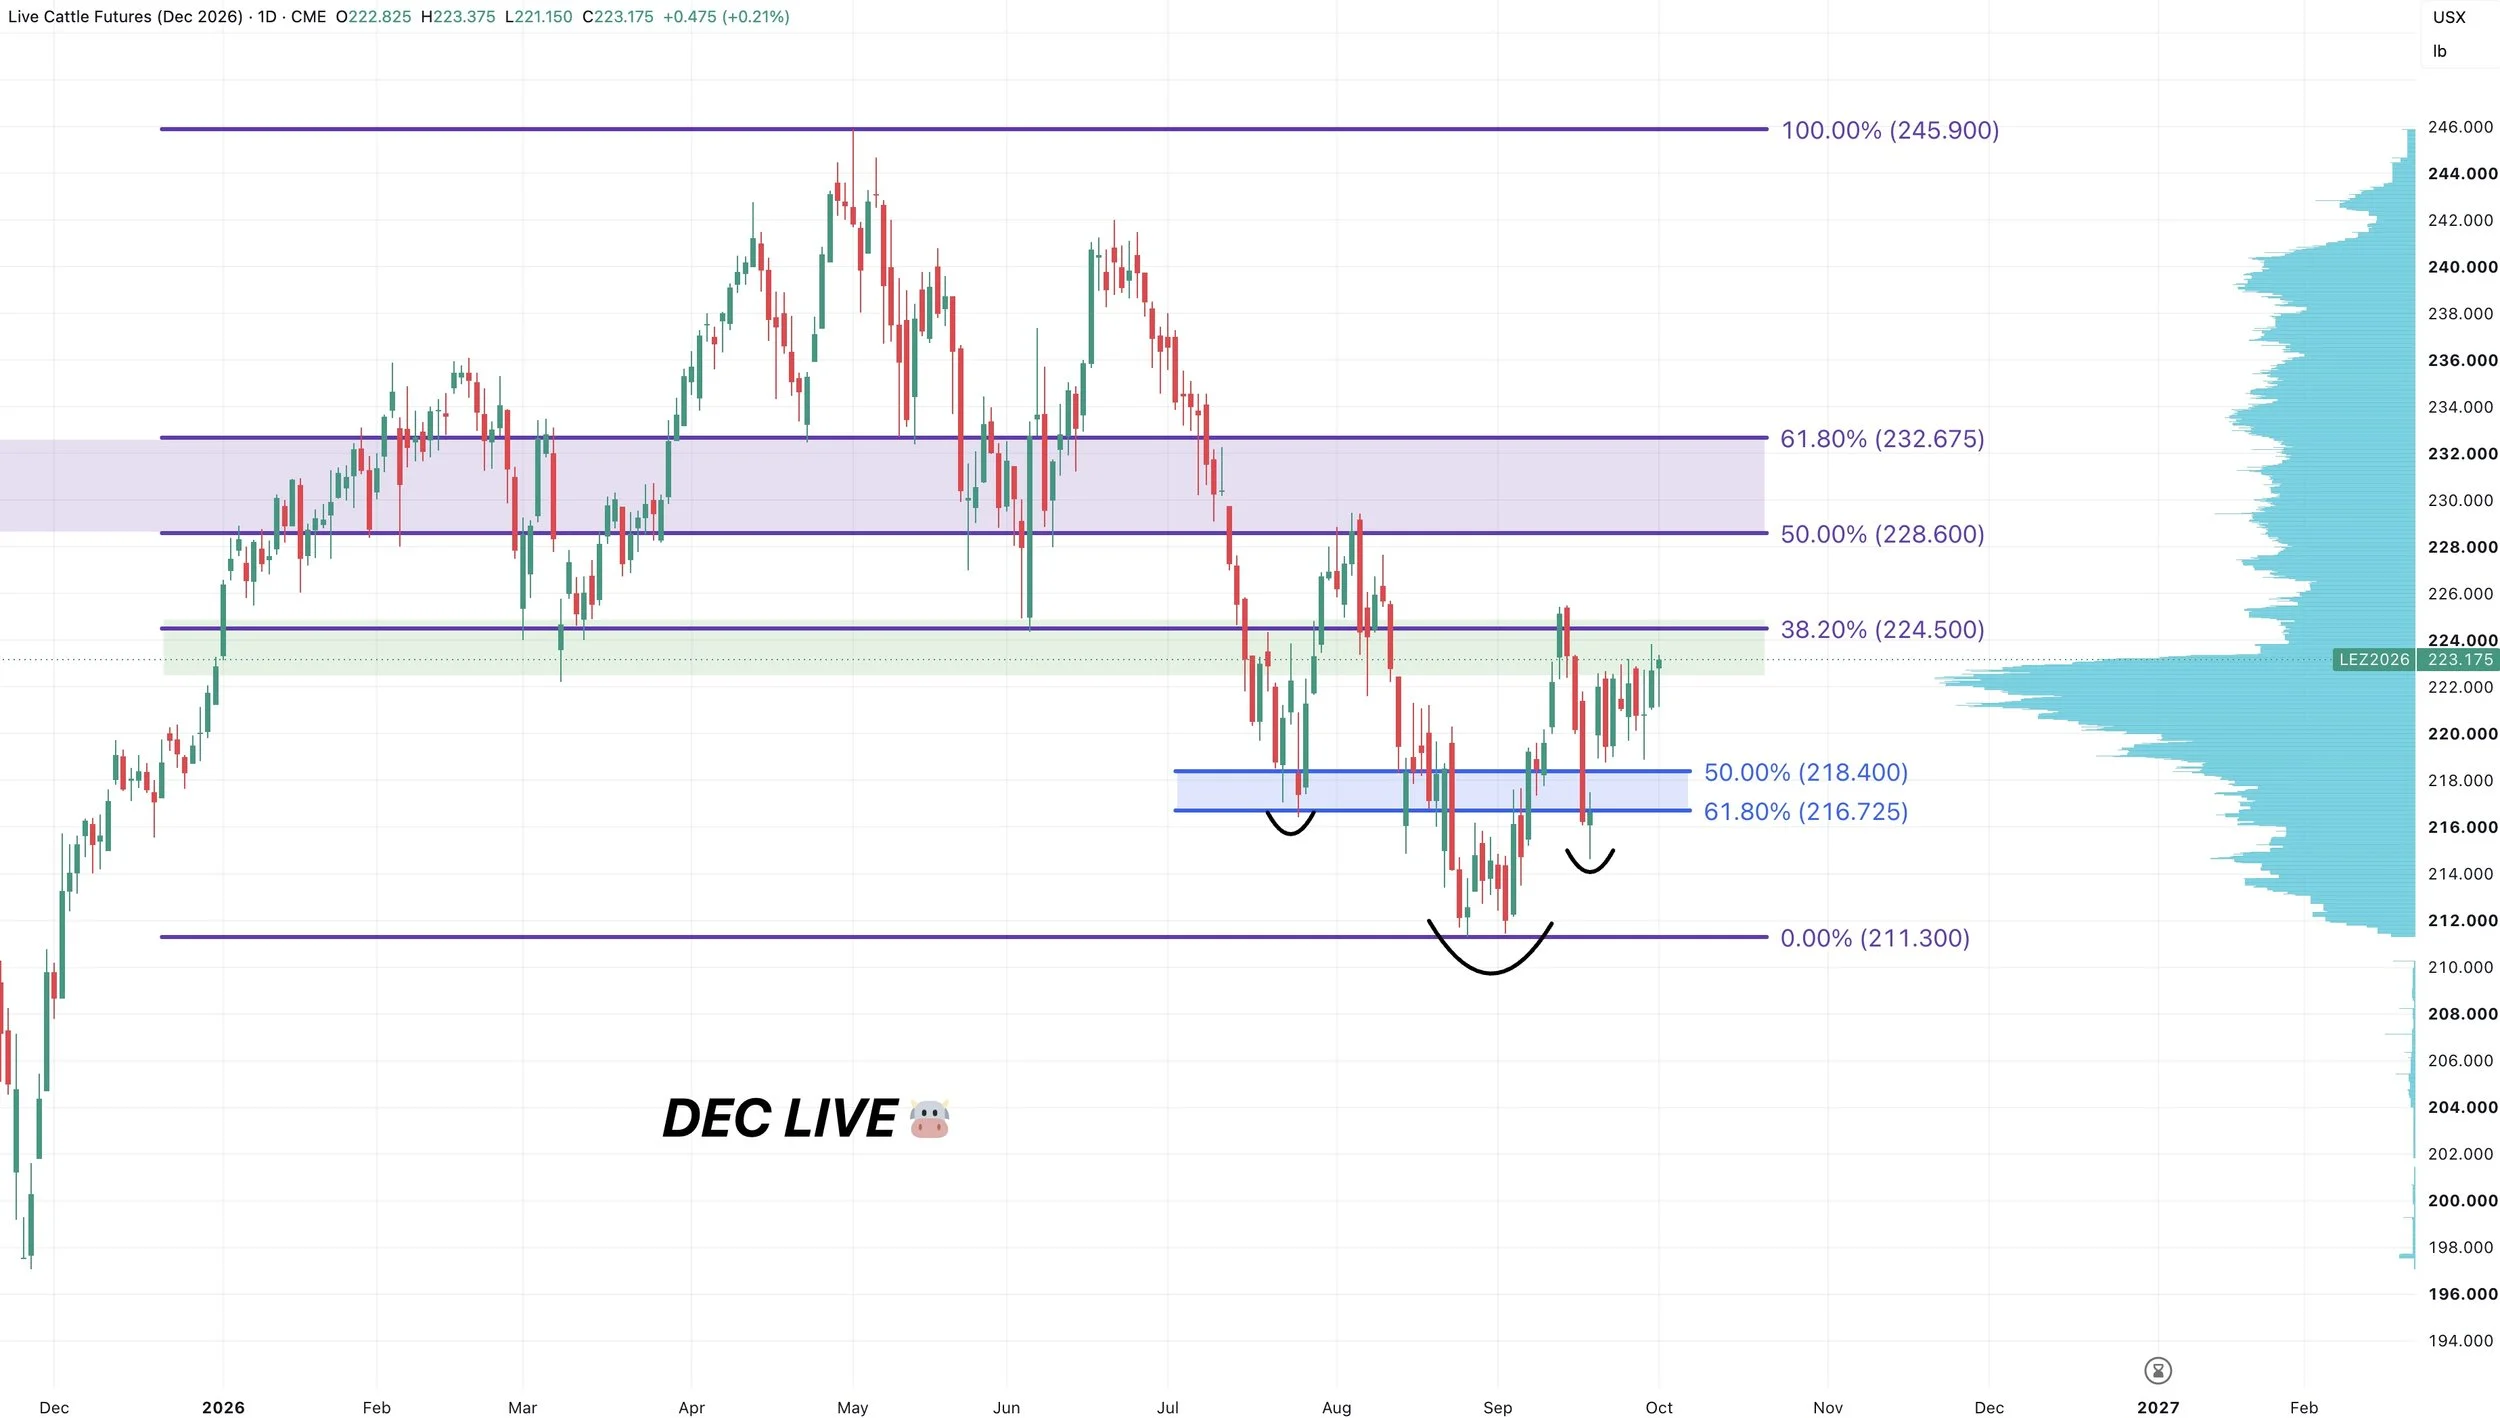
Dec Live Chart:
Not nearly as strong as feeders.
Feeders have broken out, live cattle has not.
Live cattle is still stuck at this big level of resistance. The lows from March and June, along with the recent highs.
So a clear level of resistance here.
We do still have that inverse head and shoulders pattern like in feeders, but need to break above those recent highs.
As I could see a scenario where feeders reach their target box but live cattle does not and fails at this resistance. So I'll be watching both closely.
Want to Talk?
Our phones are open 24/7 for you guys if you ever need anything or want to discuss your operation.
Jeremey & Office: (806)484-1214
Sebastian: (605)280-1186
Email: sfrost@dailymarketminute.com
Hedge Account
Interested in a hedge account? Use the link below to set up an account or give us a call.