
GRAINS KNOCKING ON YEARLY HIGHS
MARKET UPDATE
You can scroll to read the usual update as well. As the written version is the exact same as the video.
Timestamps for video:
Crop Tours: 0:00min
Corn: 1:50min
Corn Charts: 7:00min
Beans: 9:15min
Beans Charts: 11:15min
Wheat Charts: 12:50min
Cattle Charts: 14:20min
Want to talk?
Office: (806)484-1214
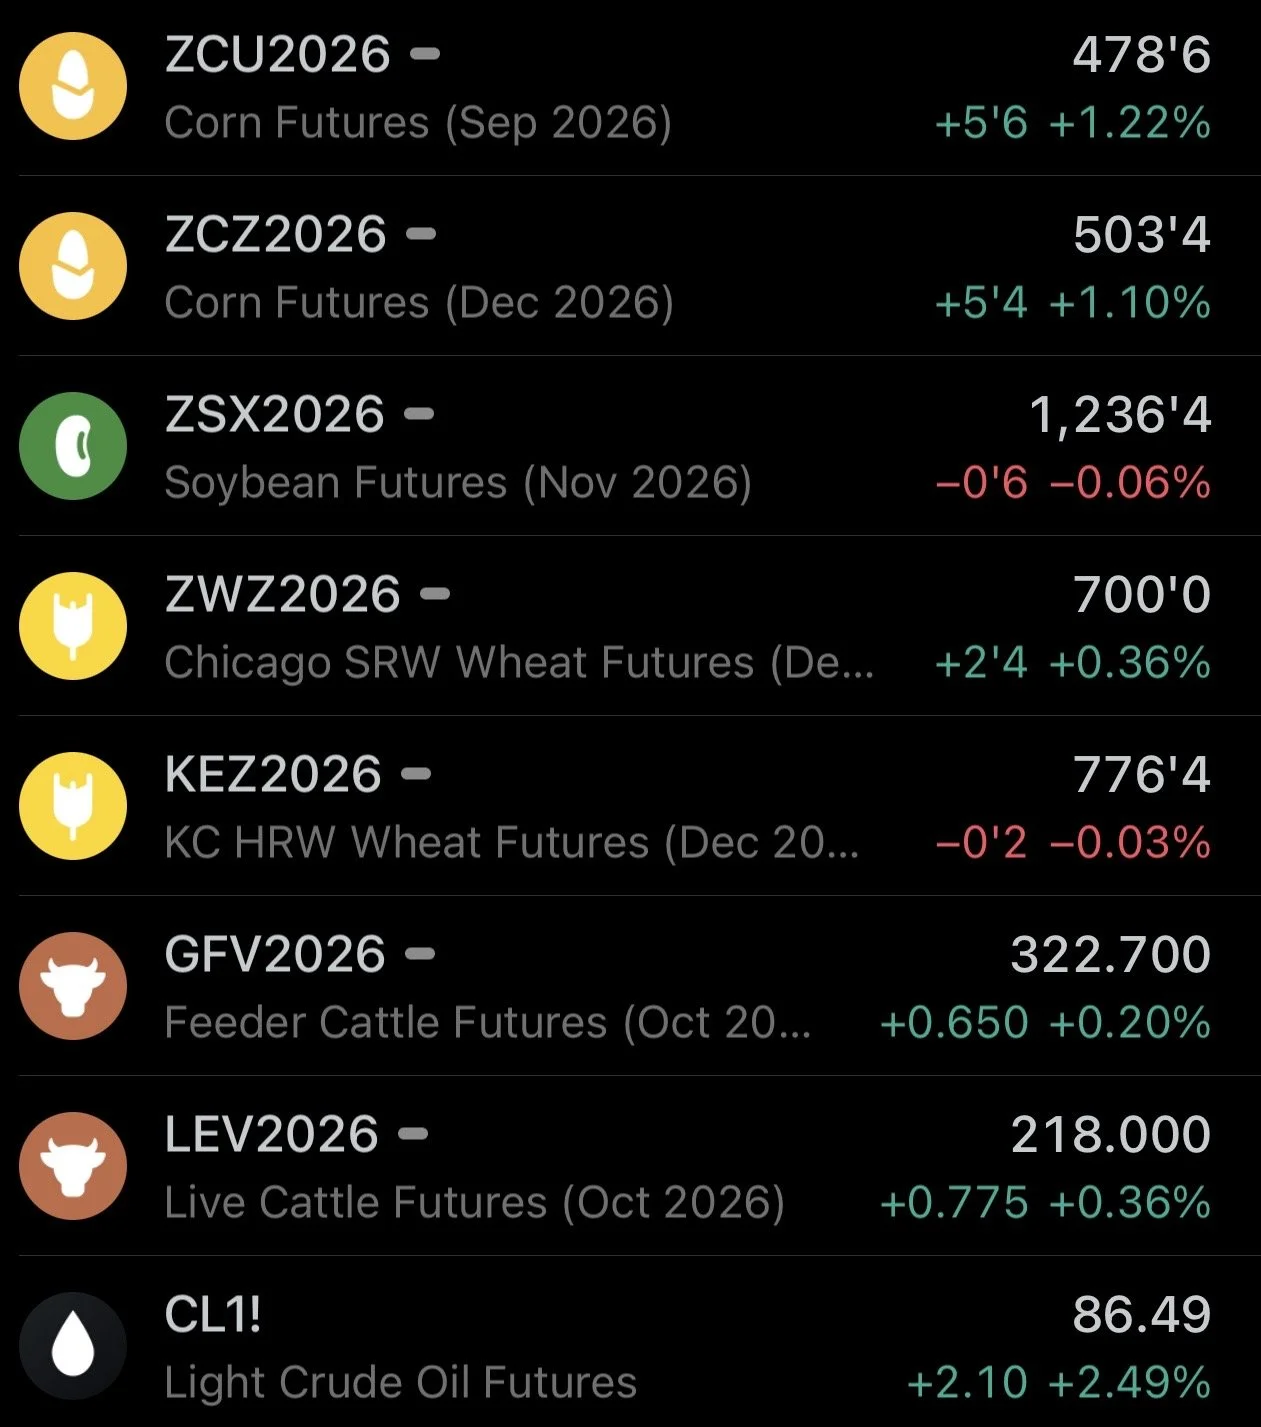
Futures Prices Close
Overview
Corn continues to lead the counter seasonal rally off the back of the Pro Farmer crop tours that continue to show disappointing results.
Corn, soybeans, and wheat are all knocking on the door of their highest prices they've seen all year long. Within striking distance of contract highs in all three as well.
Dec corn is up +45 cents the last week alone, since last week's USDA report.
Let's jump right into the crop tours as this is the main headline that's caught the market's attention.
Crop Tours
The results have been coming in quiet a bit worse than most were expecting.
This has led to the market to starting to question what happens to the balance sheet if yield drops even further. Below the USDA's recent 180.7 bpa. We'll get into this later, but it would make things very interesting.
So far we only have the data for 5 states. They did western Iowa, but the full Iowa results will be out tonight.
Corn:
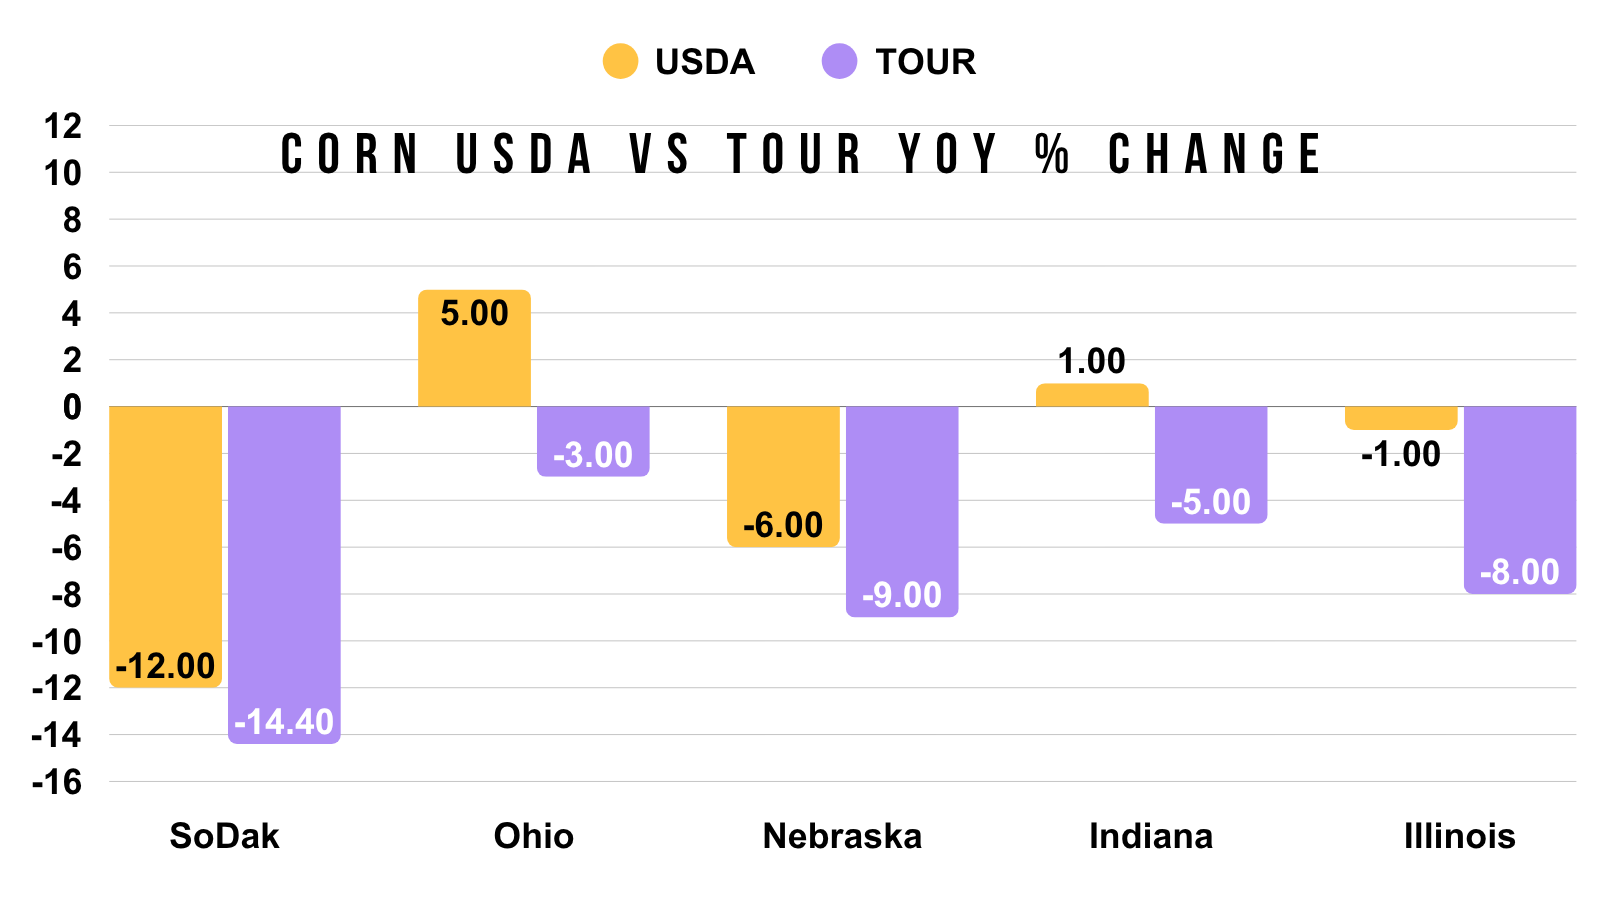
Below is a chart that shows how the USDA expects each states yield vs last year. Along with how the crop tour expects yield vs last year.
The crop tour has yields lower than the USDA for every single state they've toured so far.
Even states such as Ohio and Indiana where the USDA expects a better yield than last year, the crop tours are showing worse yields than last year.
Soybeans:
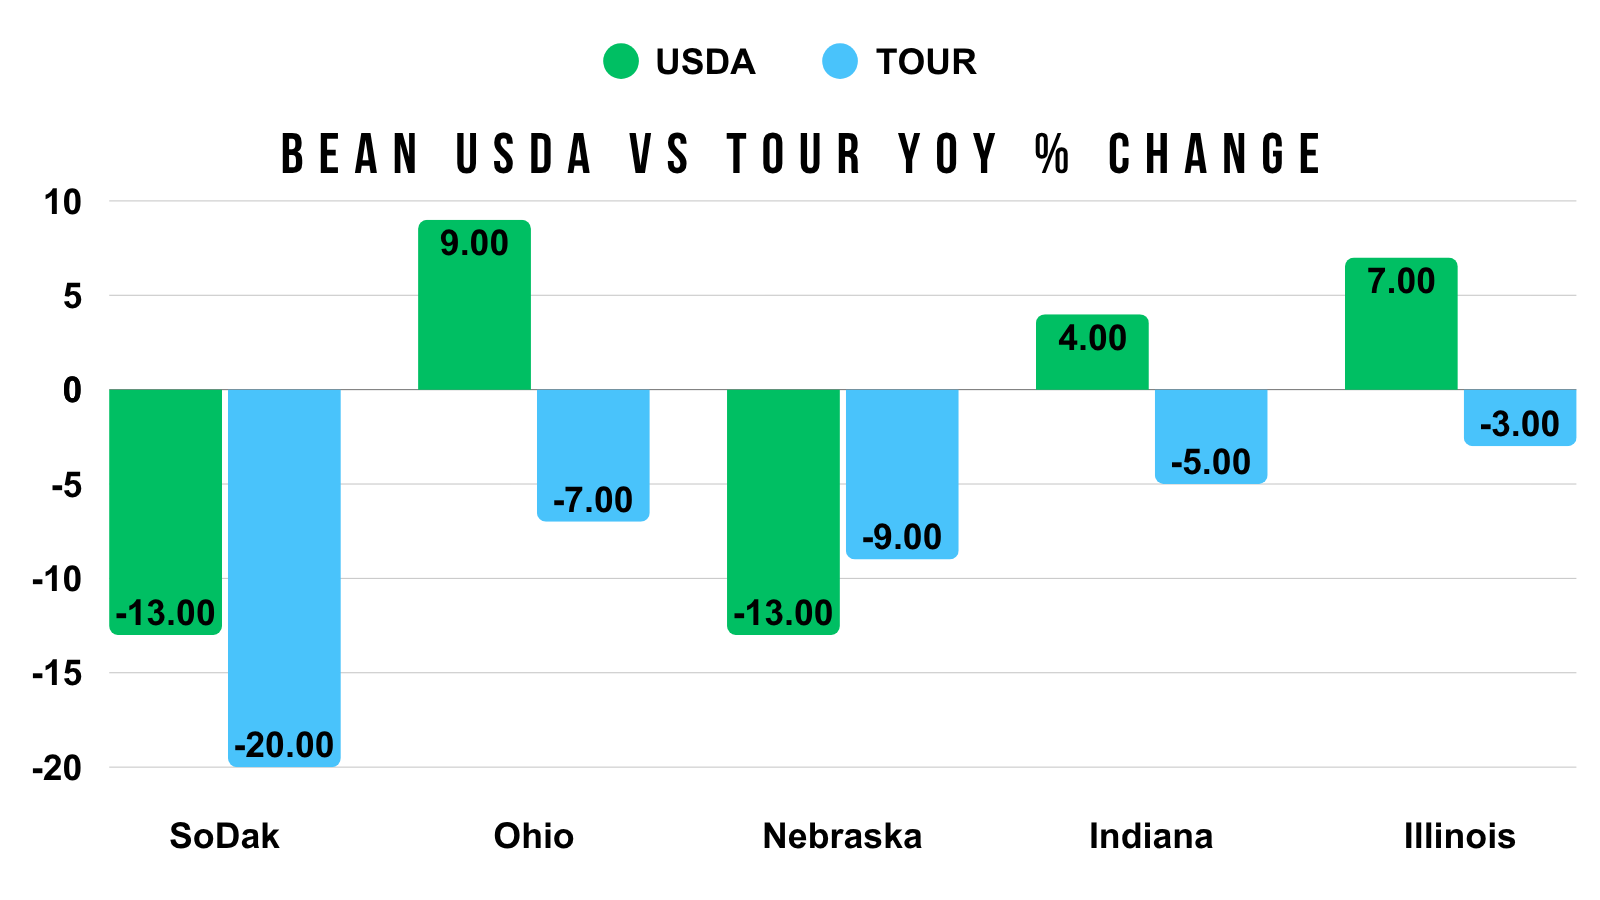
The tour has pod counts lower than the USDA expects yield in every state besides from Nebraska.
Again we are seeing similar results here like in corn.
The USDA has yield improving vs last year in Ohio, Indiana, and Illinois. Yet the tour's results are showing lower pod counts in all of them.
Today's Main Takeaways
Corn
Fundamentals:
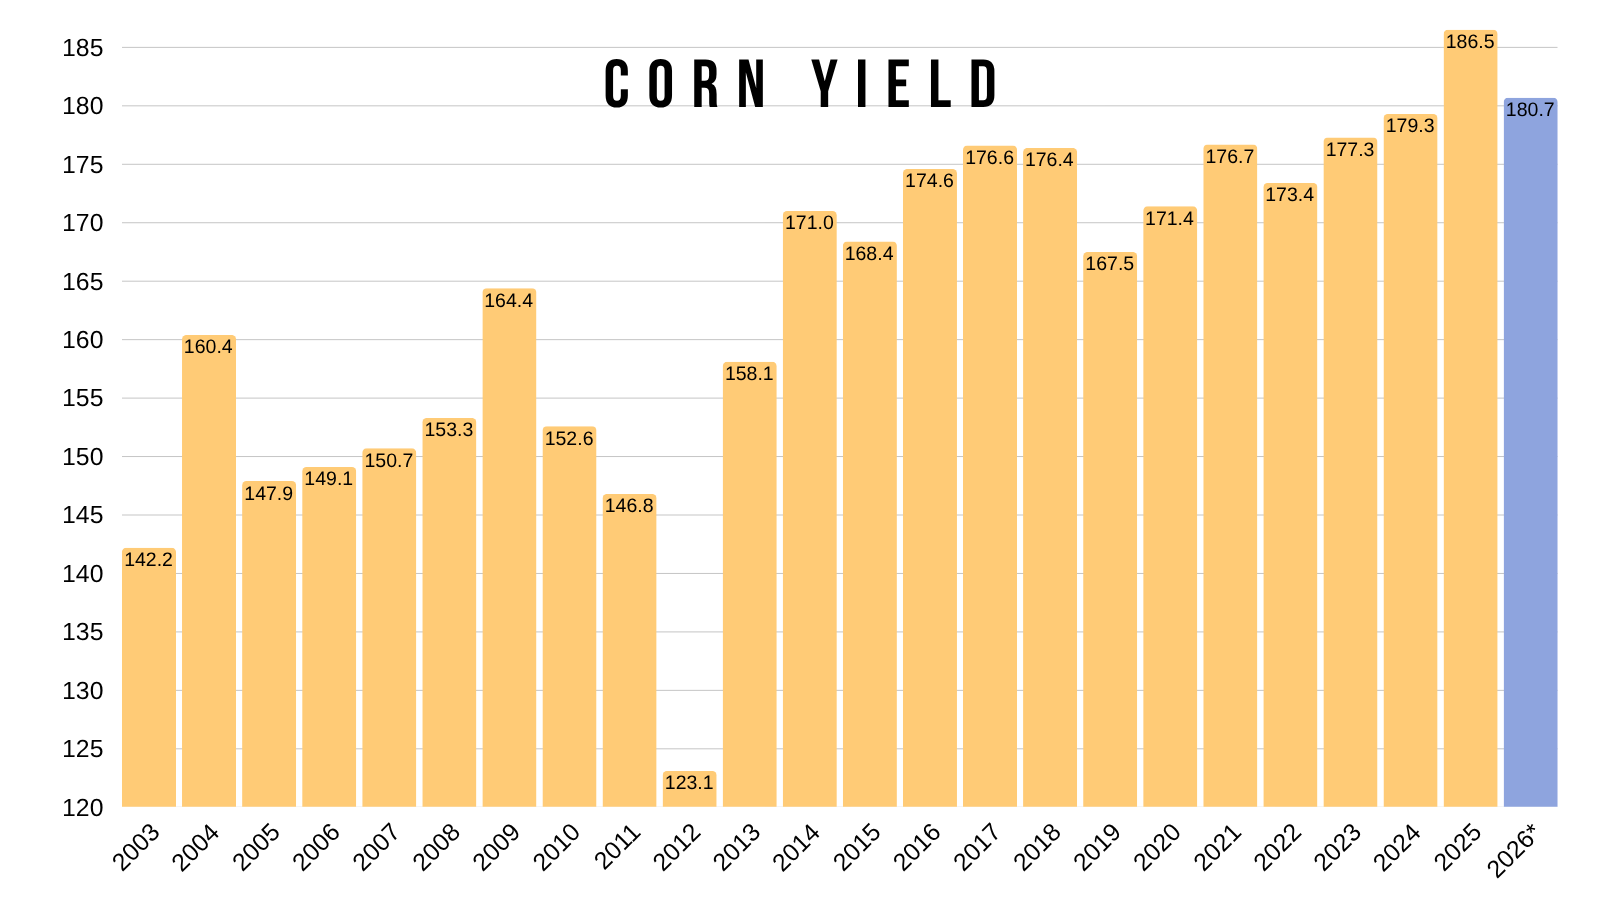
These tours are sparking a lot of conversation about a yield below 180.7 bpa.
And what happens if yield were to come in lower than that, perhaps in that 175 to 178 range?
A 180.7 bpa yield would still be the 2nd largest yield of all-time.
A 178 yield would be the 3rd largest of all-time.
So a yield below 180 would not be out of the realm of impossible.
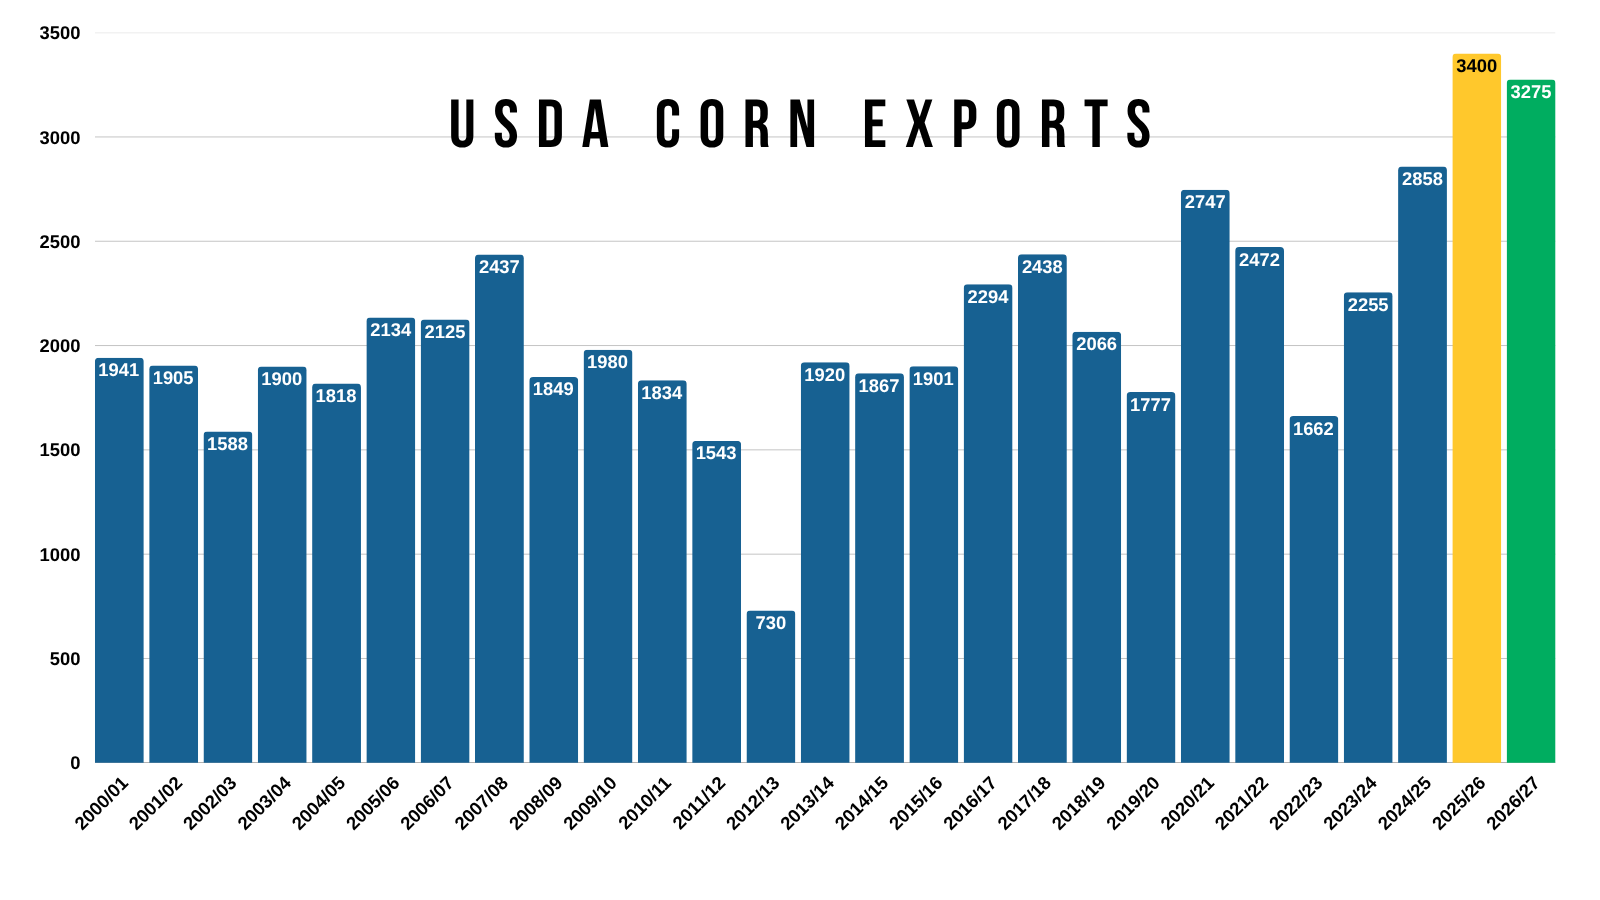
If yield gets much lower from here, we simply cannot meet the record demand we've been creating with these low prices the last few years.
We could realistically see one of the largest crops we've ever seen and still run into some bull market conditions simply due to demand.
Our exports have literally doubled since 2022/23.
What happens if yield is sub 180?
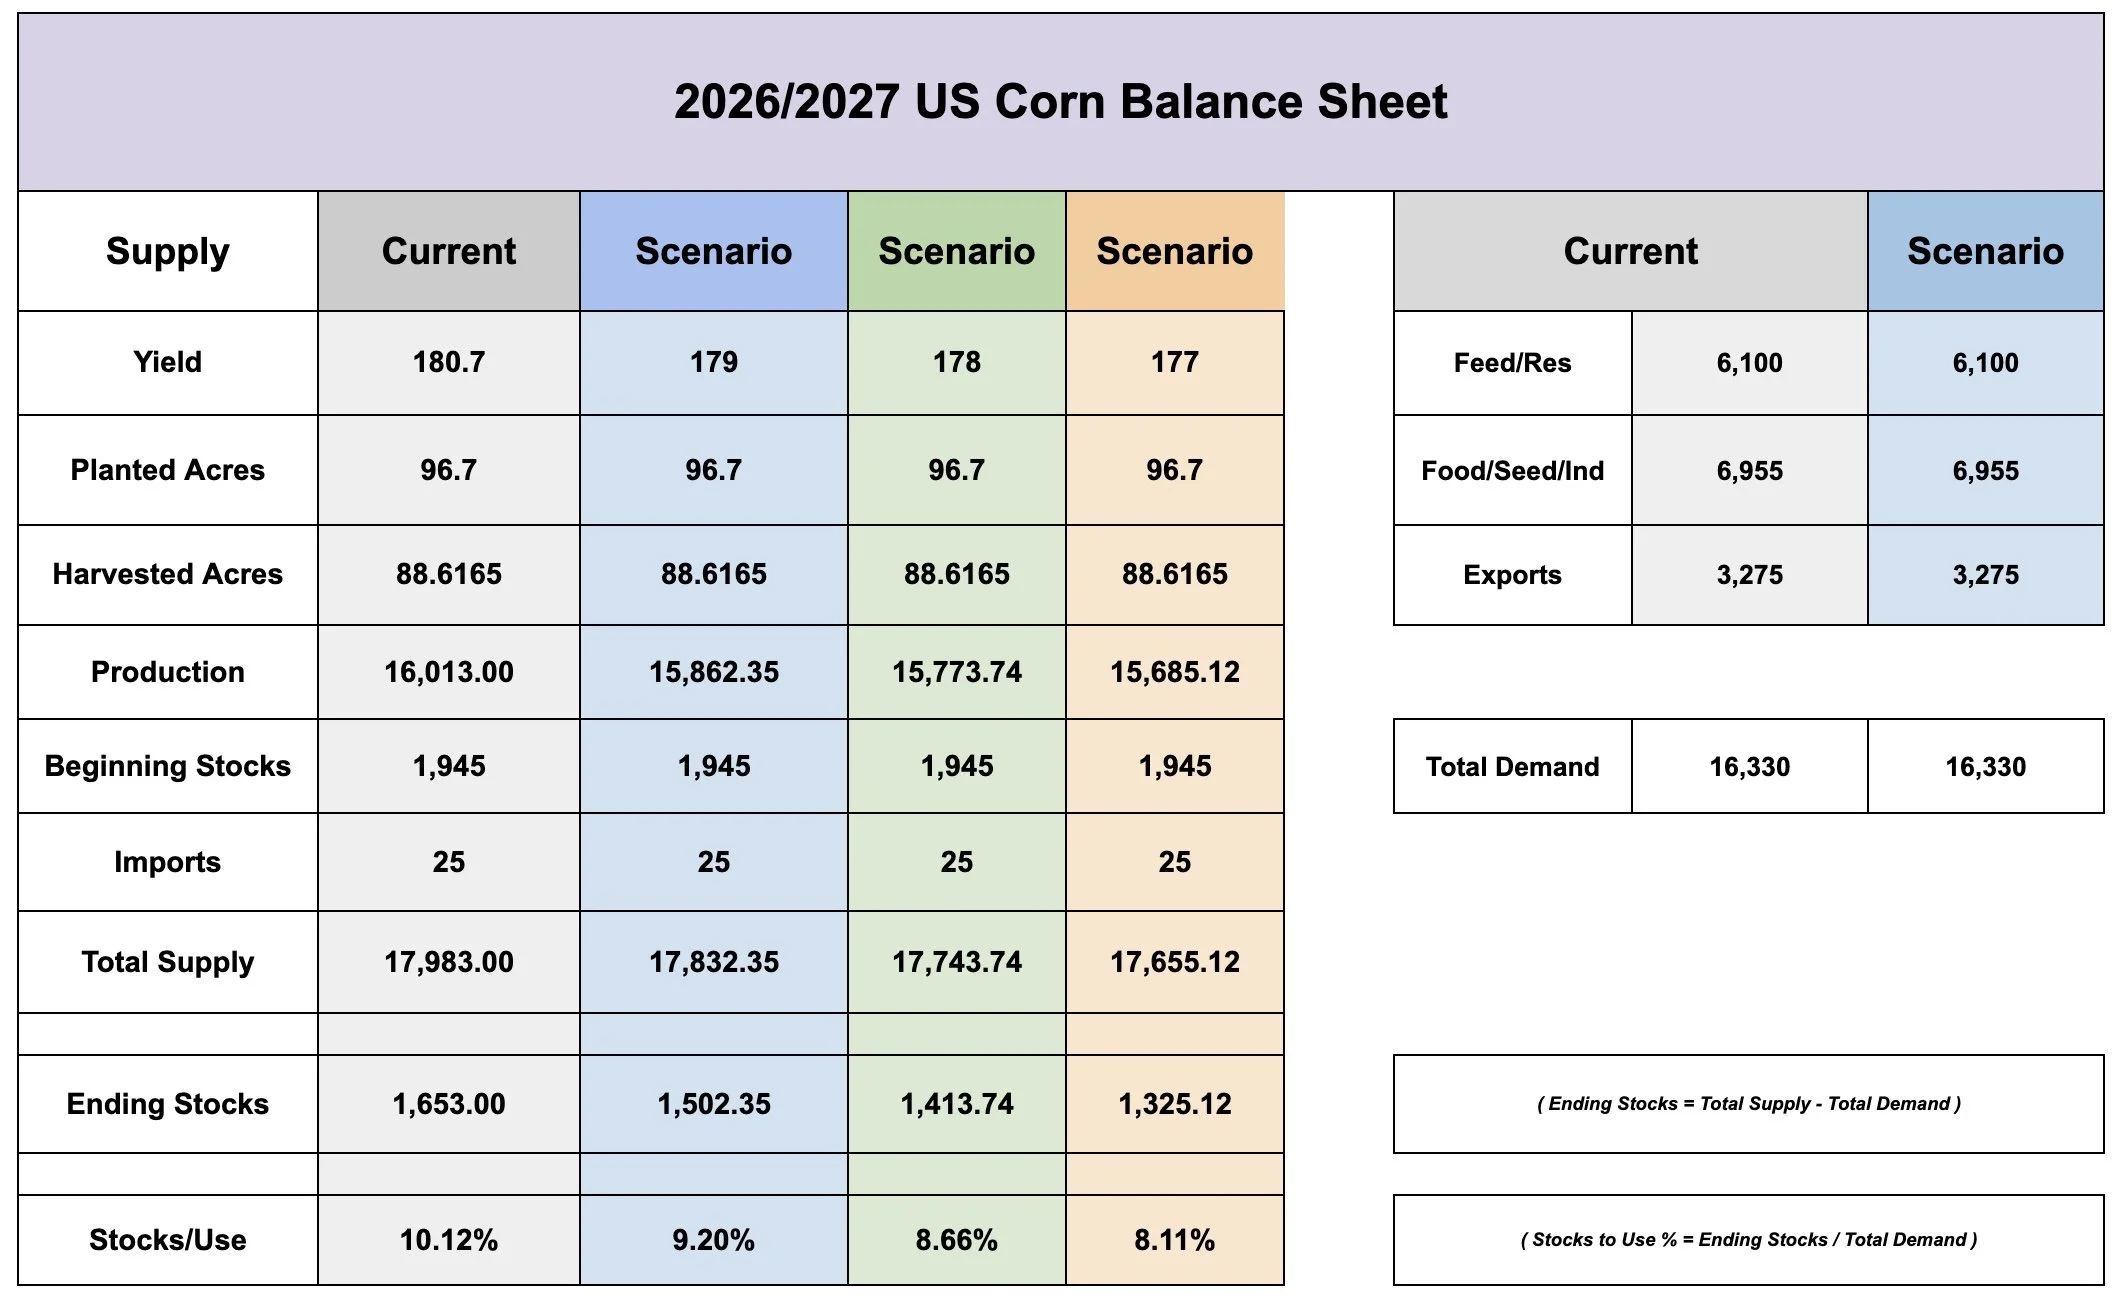
Let's throw the numbers into the balance sheet.
For these examples, we will be leaving demand unchanged.
179 yield = 9.20% S/U
178 yield = 8.66% S/U
177 yield = 8.11% S/U
Those are all very bullish scenarios with a sub 10% stocks to use.
Normally, the USDA will try to offset losses in supply with losses in demand.
However, just because we have less supply does not mean that the demand is simply going to disappear.
To justify us losing demand, prices would need to go higher.
Demand isn’t going anywhere unless we have high enough prices to incentive doing so. Prices at these levels are not going to do that.
This record demand needs to be met with supply, or we should go higher.
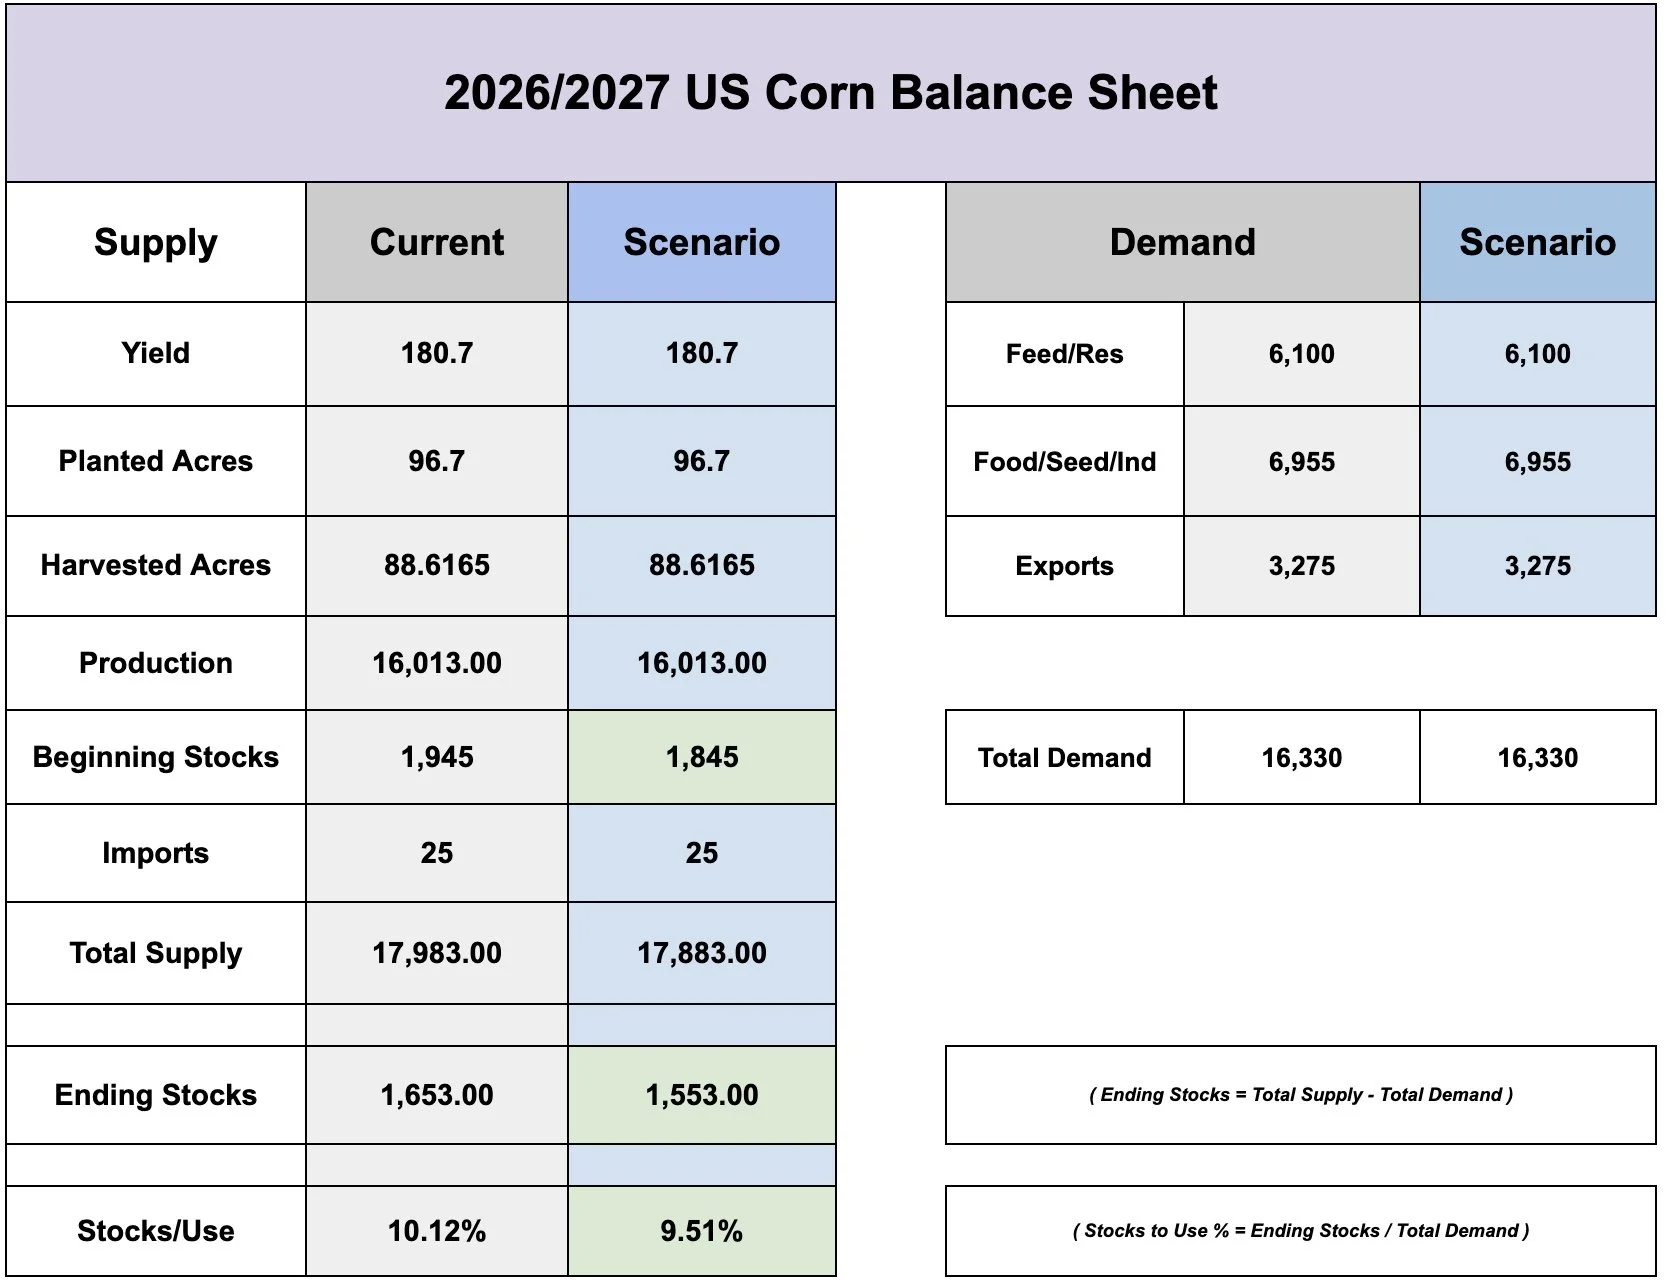
One very possible thing we could see happen is the USDA bumping up our old crop exports once again.
Let's say they bump them by +100 million.
That alone drops the new crop balance sheet below a 10% S/U even if yield ends up at 180.7 bpa.
Like we've talked about a thousand times.
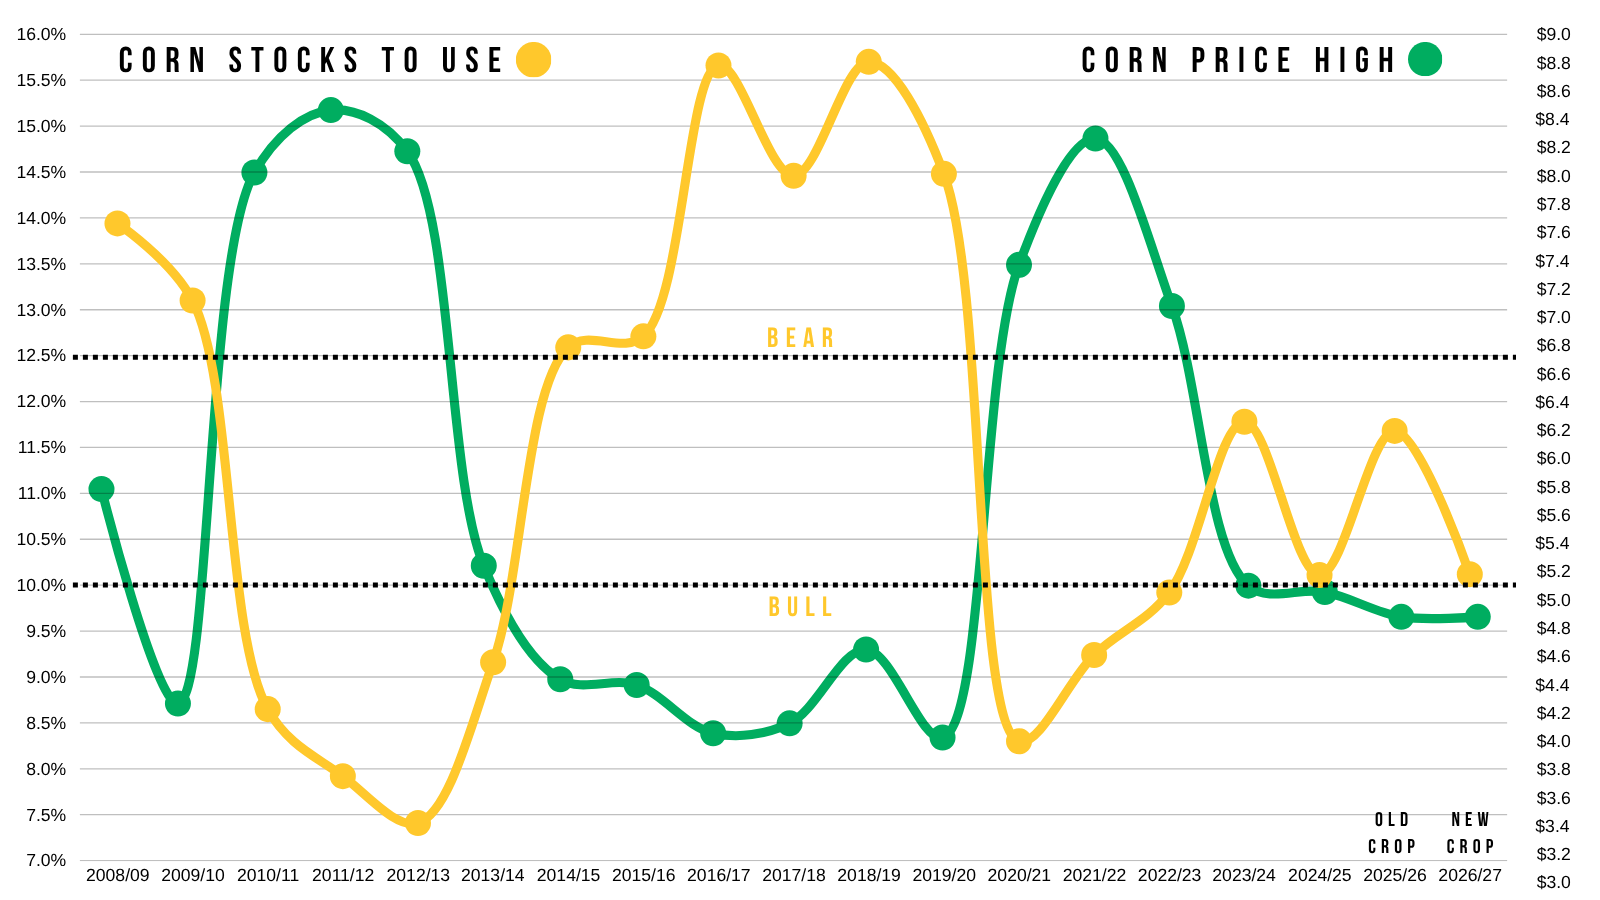
If you want corn much above $5.00 or so, that stocks to use needs to fall below 10%.
Each bull run has had a below 10% stocks to use.
As we've talked about the last week, we are starting off in a very tight spot.
As of the August USDA, we have the tightest situation for August since 2022.
With the potential to get even tighter if yield doesn’t rise or if the USDA doesn’t find more acres again.
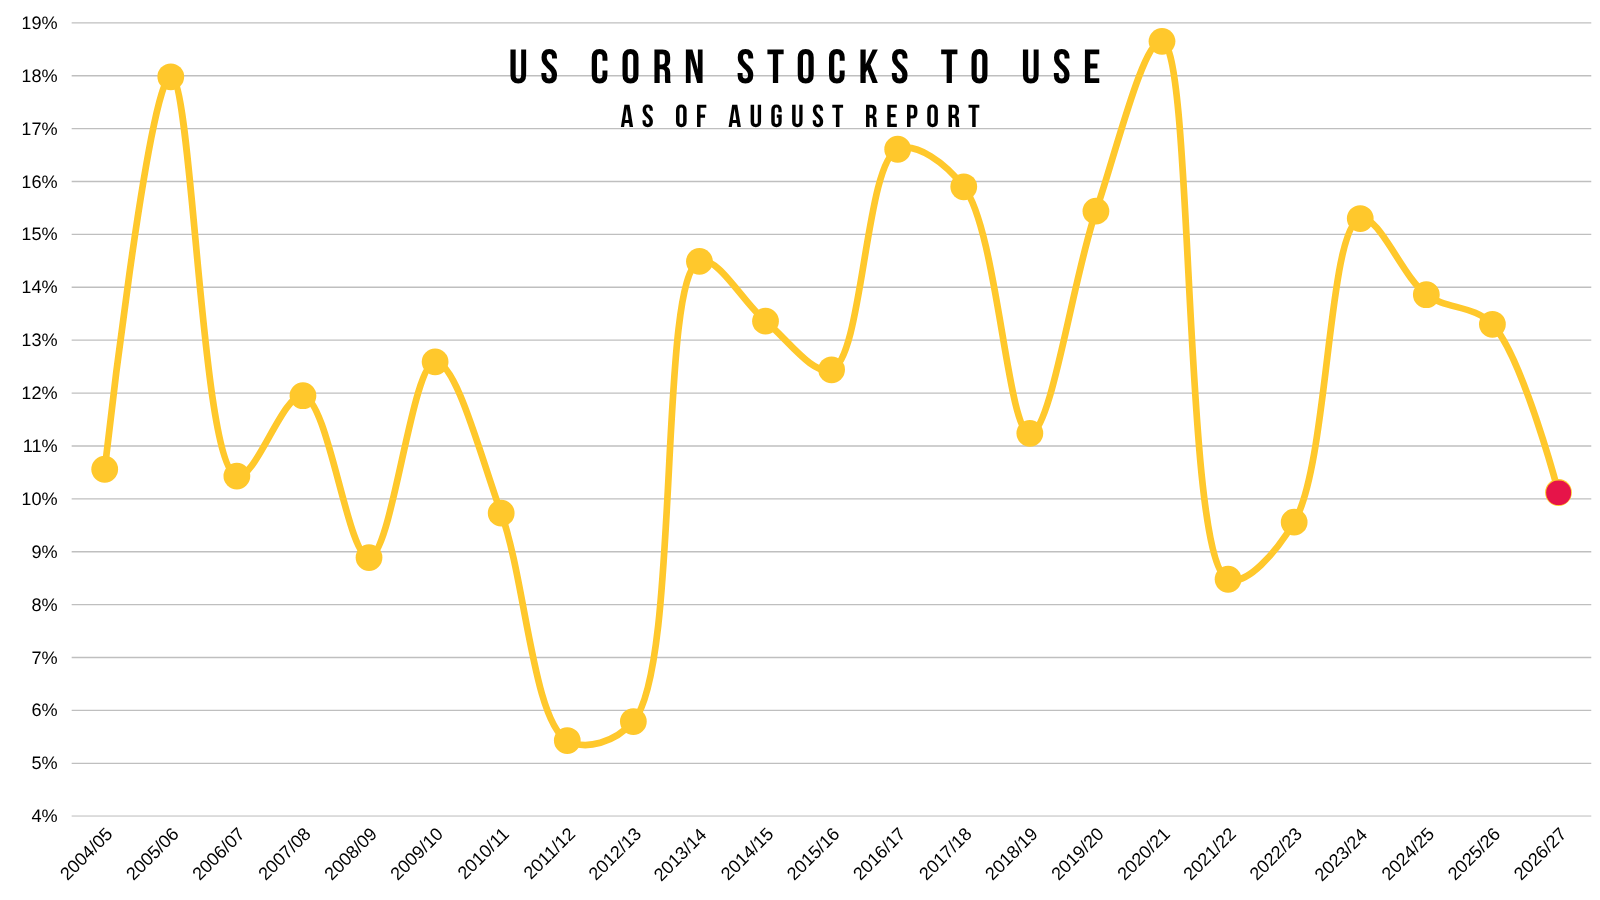
Not only do we have the tight US situation.
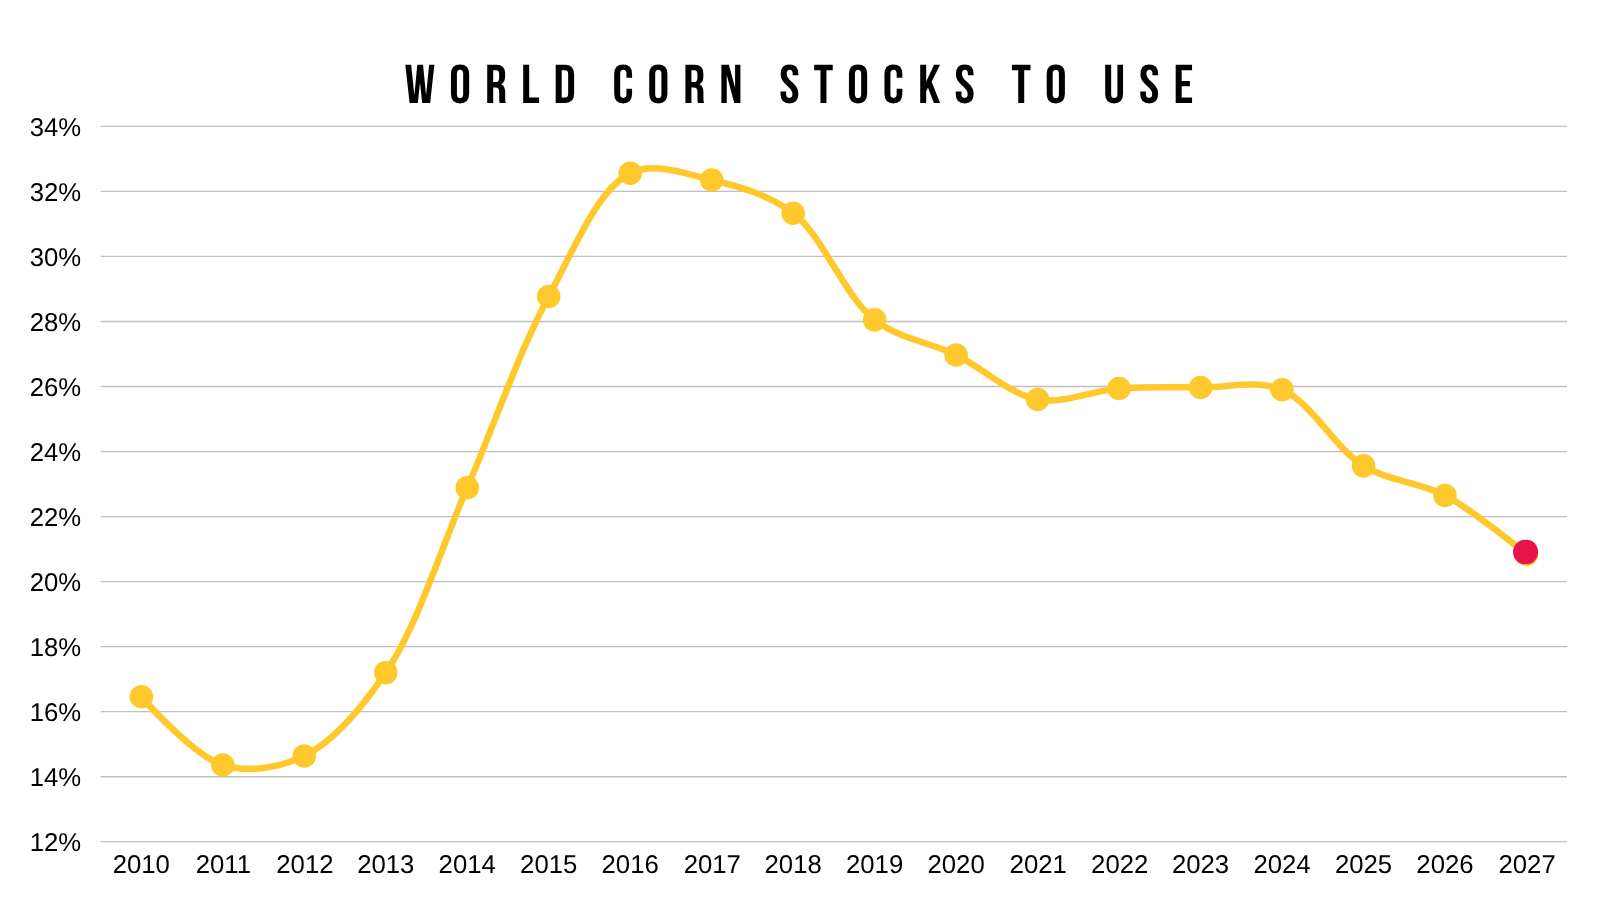
Let's not forget the world is the tightest it's been on corn in over a decade.
So the world clearly needs the US to perform. Or we simply can’t meet the global demand.
Highs by Month:
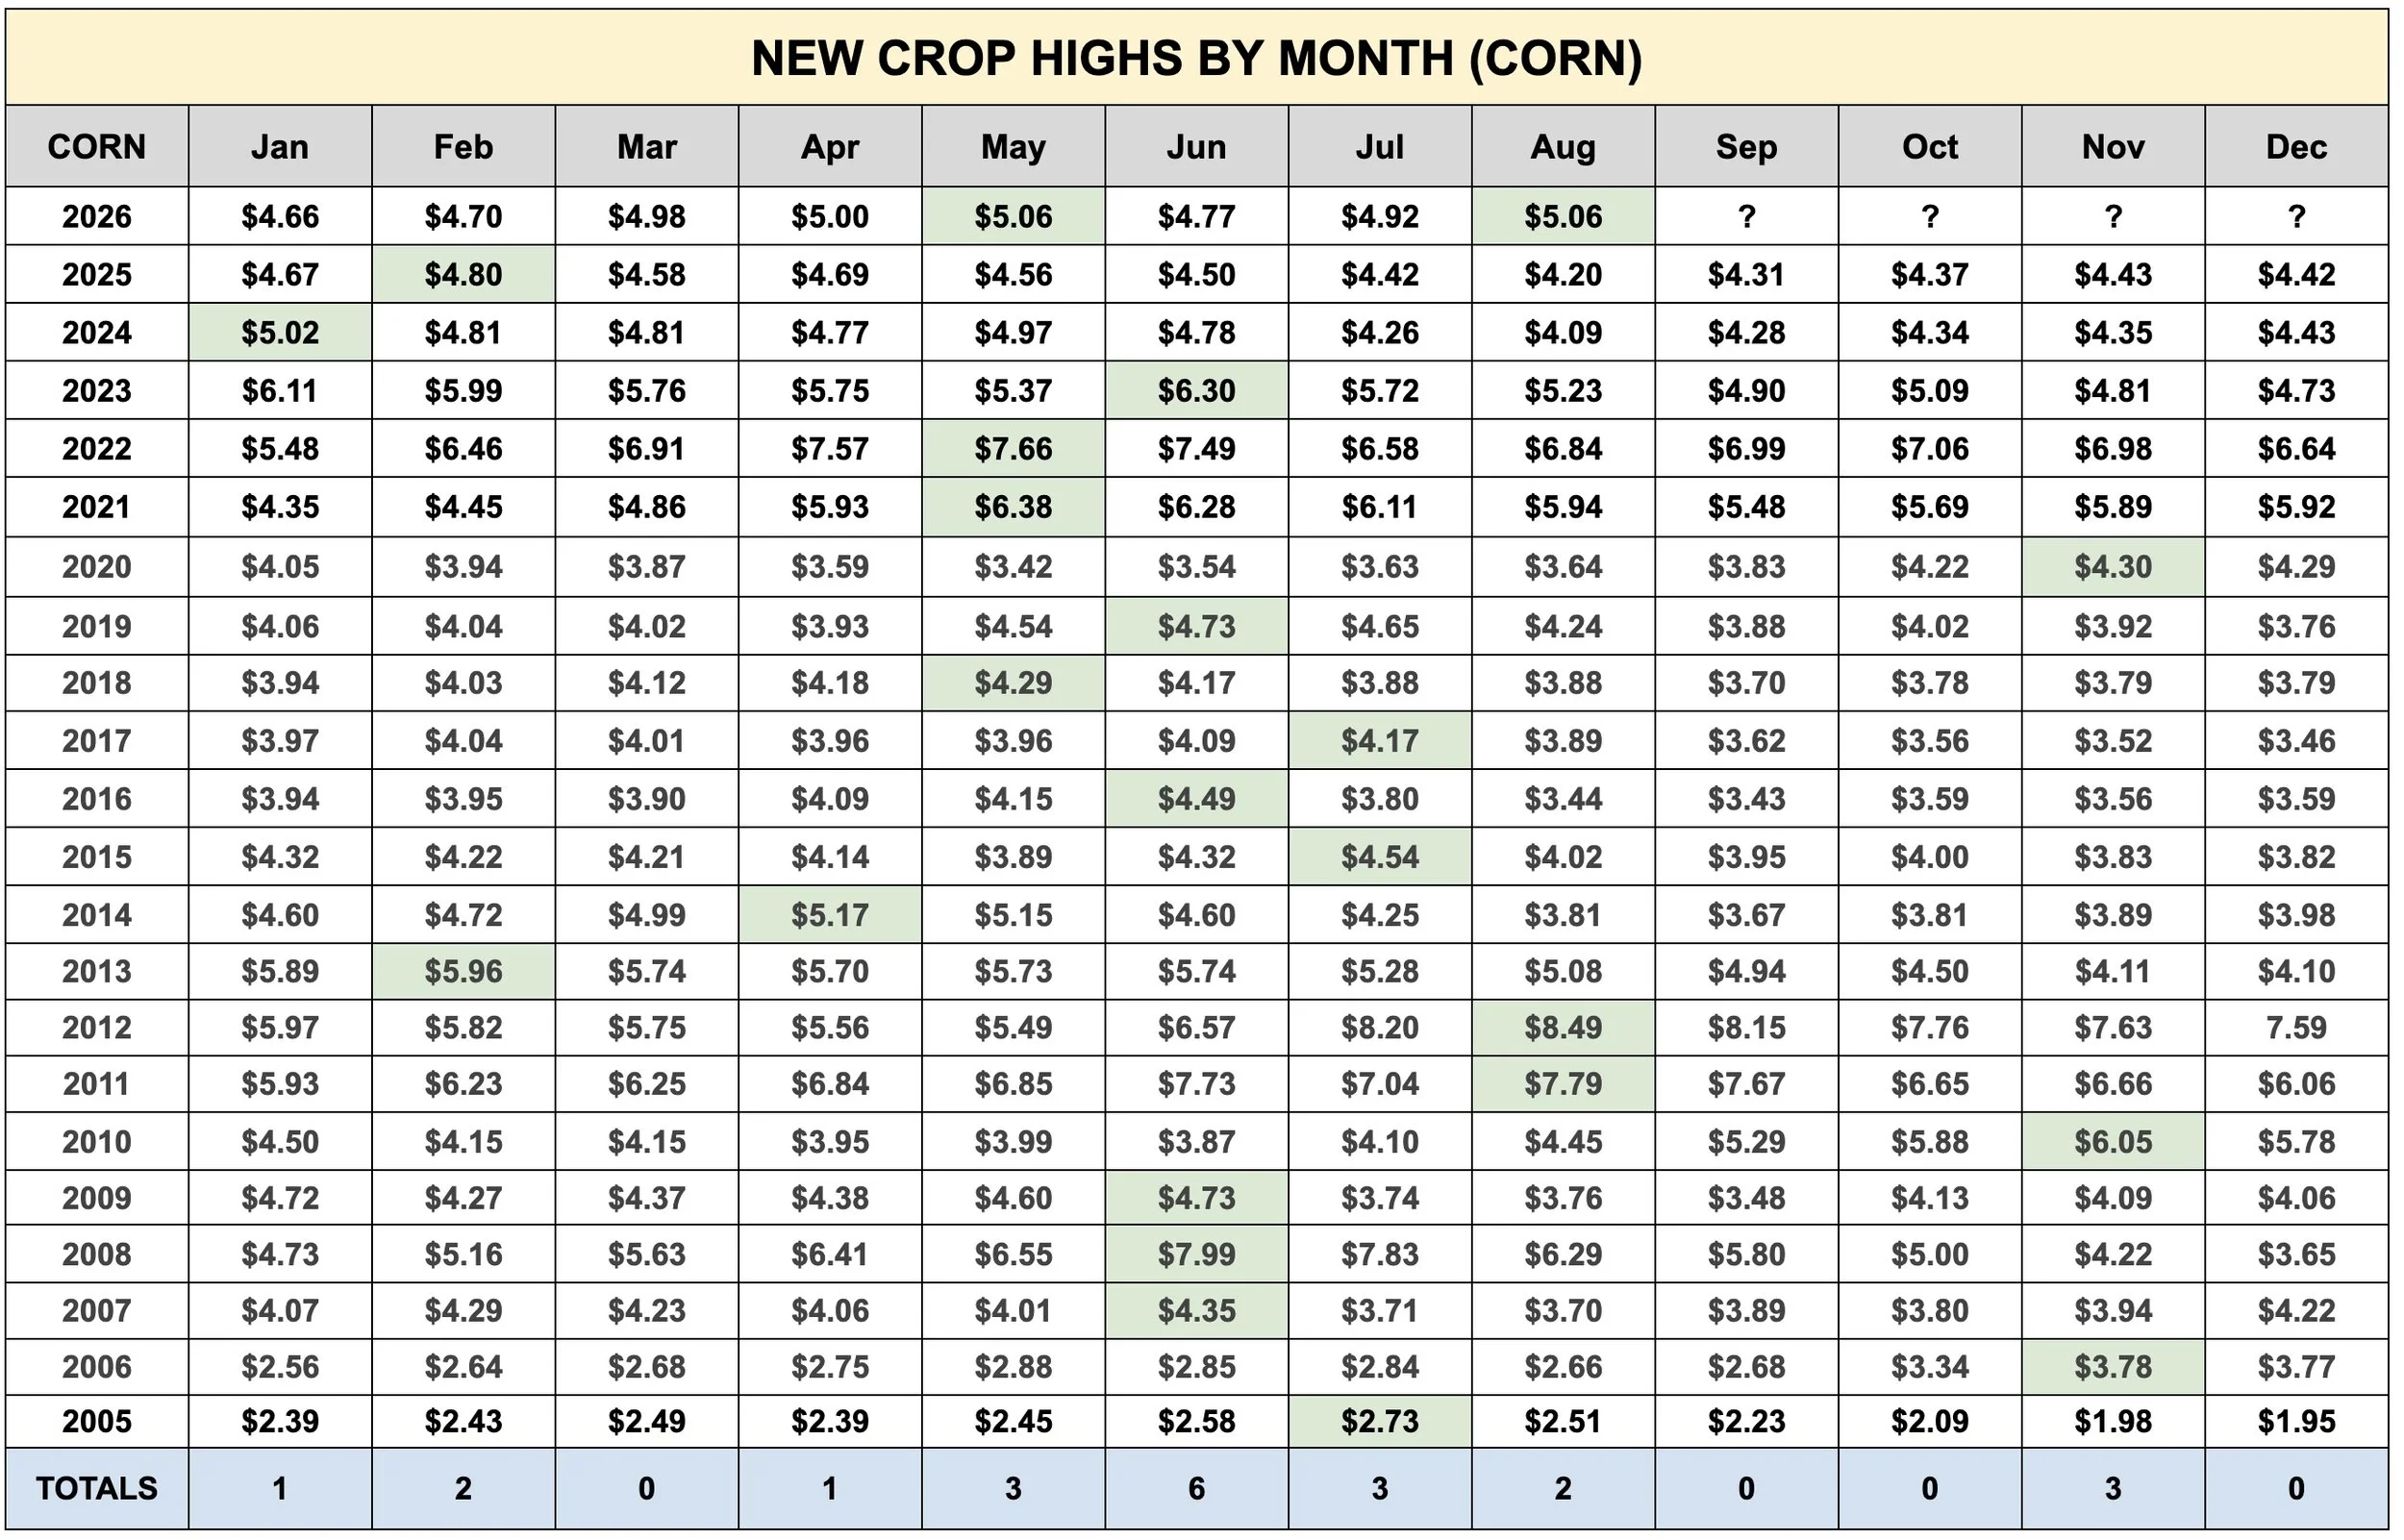
We haven’t shown this chart since May. This shows new crop corns highest price for every single month the last 20 years.
Today we came within a penny of those May highs.
We have not posted our highs for the year in August since 2011 and 2012.
Other things to note, we have never posted our highs in September or October.
The last two bull markets came after we posted our highs in November the year prior. (2020 and 2010).
So if you are looking for an indication we are going a lot higher. Posting new highs into the end of the year has been a good sign.
Yesterday's Alert:
Yesterday we did send out a sell and hedge alert.
This was mostly geared towards those who:
Are behind in their marketing
Are short on time
Lack storage
Need to move off the combine
Our thoughts are still that corn has a ton of upside potential.
So if you are in a comfortable spot in your marketing and don’t need to do anything, we like being plenty patient. As I think we will see more opportunities down the road.
Jeremey talked about this in depth yesterday. But one thing we do NOT want to do is put ourselves in a situation where we are oversold.
We've been in a multi-year bear market. Nothing would be worse than selling everything and having this market go crazy high.
Do we "have" to go massively higher? No. But we have to respect that the potential is there for the first time in a long time. So it makes sense to keep plenty of dry powder in case that does happen, even though, it doesn’t "have" to happen.
But those who are in one of those situations where you need to be more proactive, you can not completely ignore this opportunity.
We are at our highest price we've had all year, heading into harvest.
This has been a phenomenal counter seasonal rally.
They don’t happen that often.
Normally we are posting our lowest price for the year right about now, not our highest price.
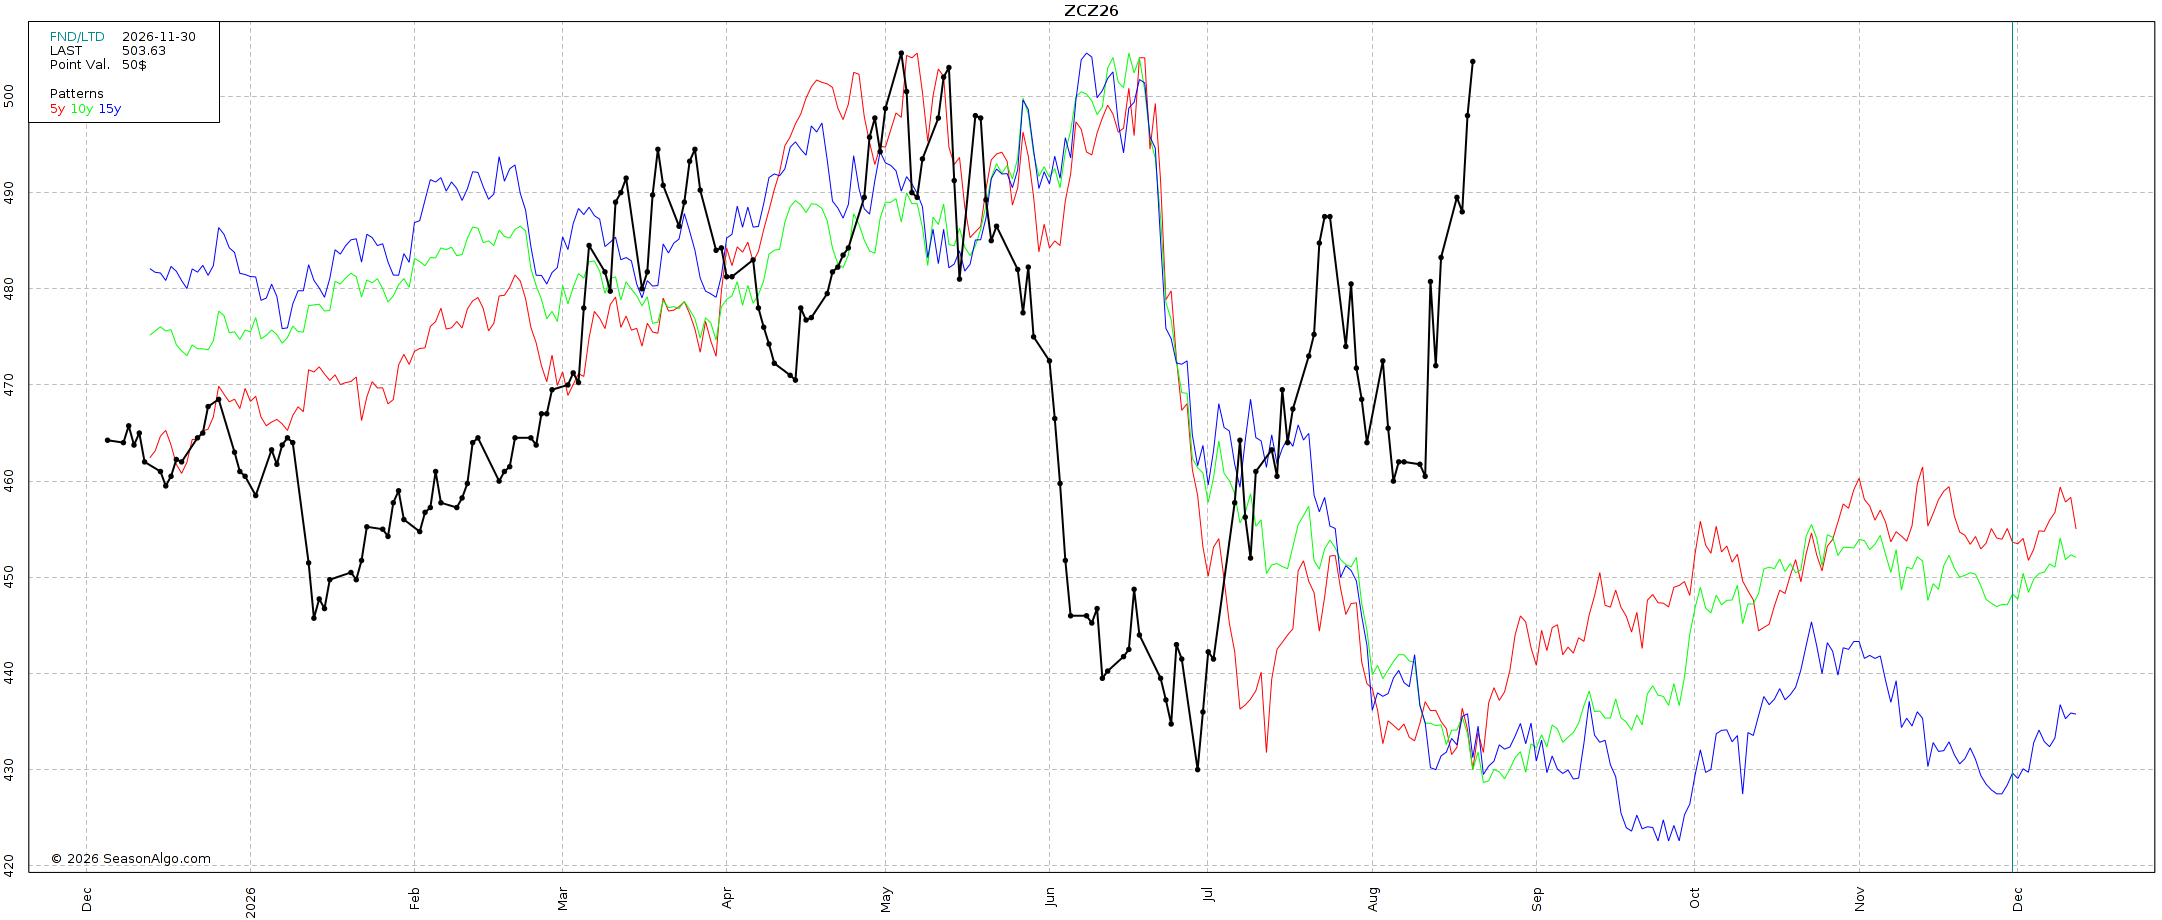
If you compare Dec corn over the last several years.
This is the highest price we've seen for today's date since 2022.
Surpassing 2023 and sitting far above both 2024 and 2025.
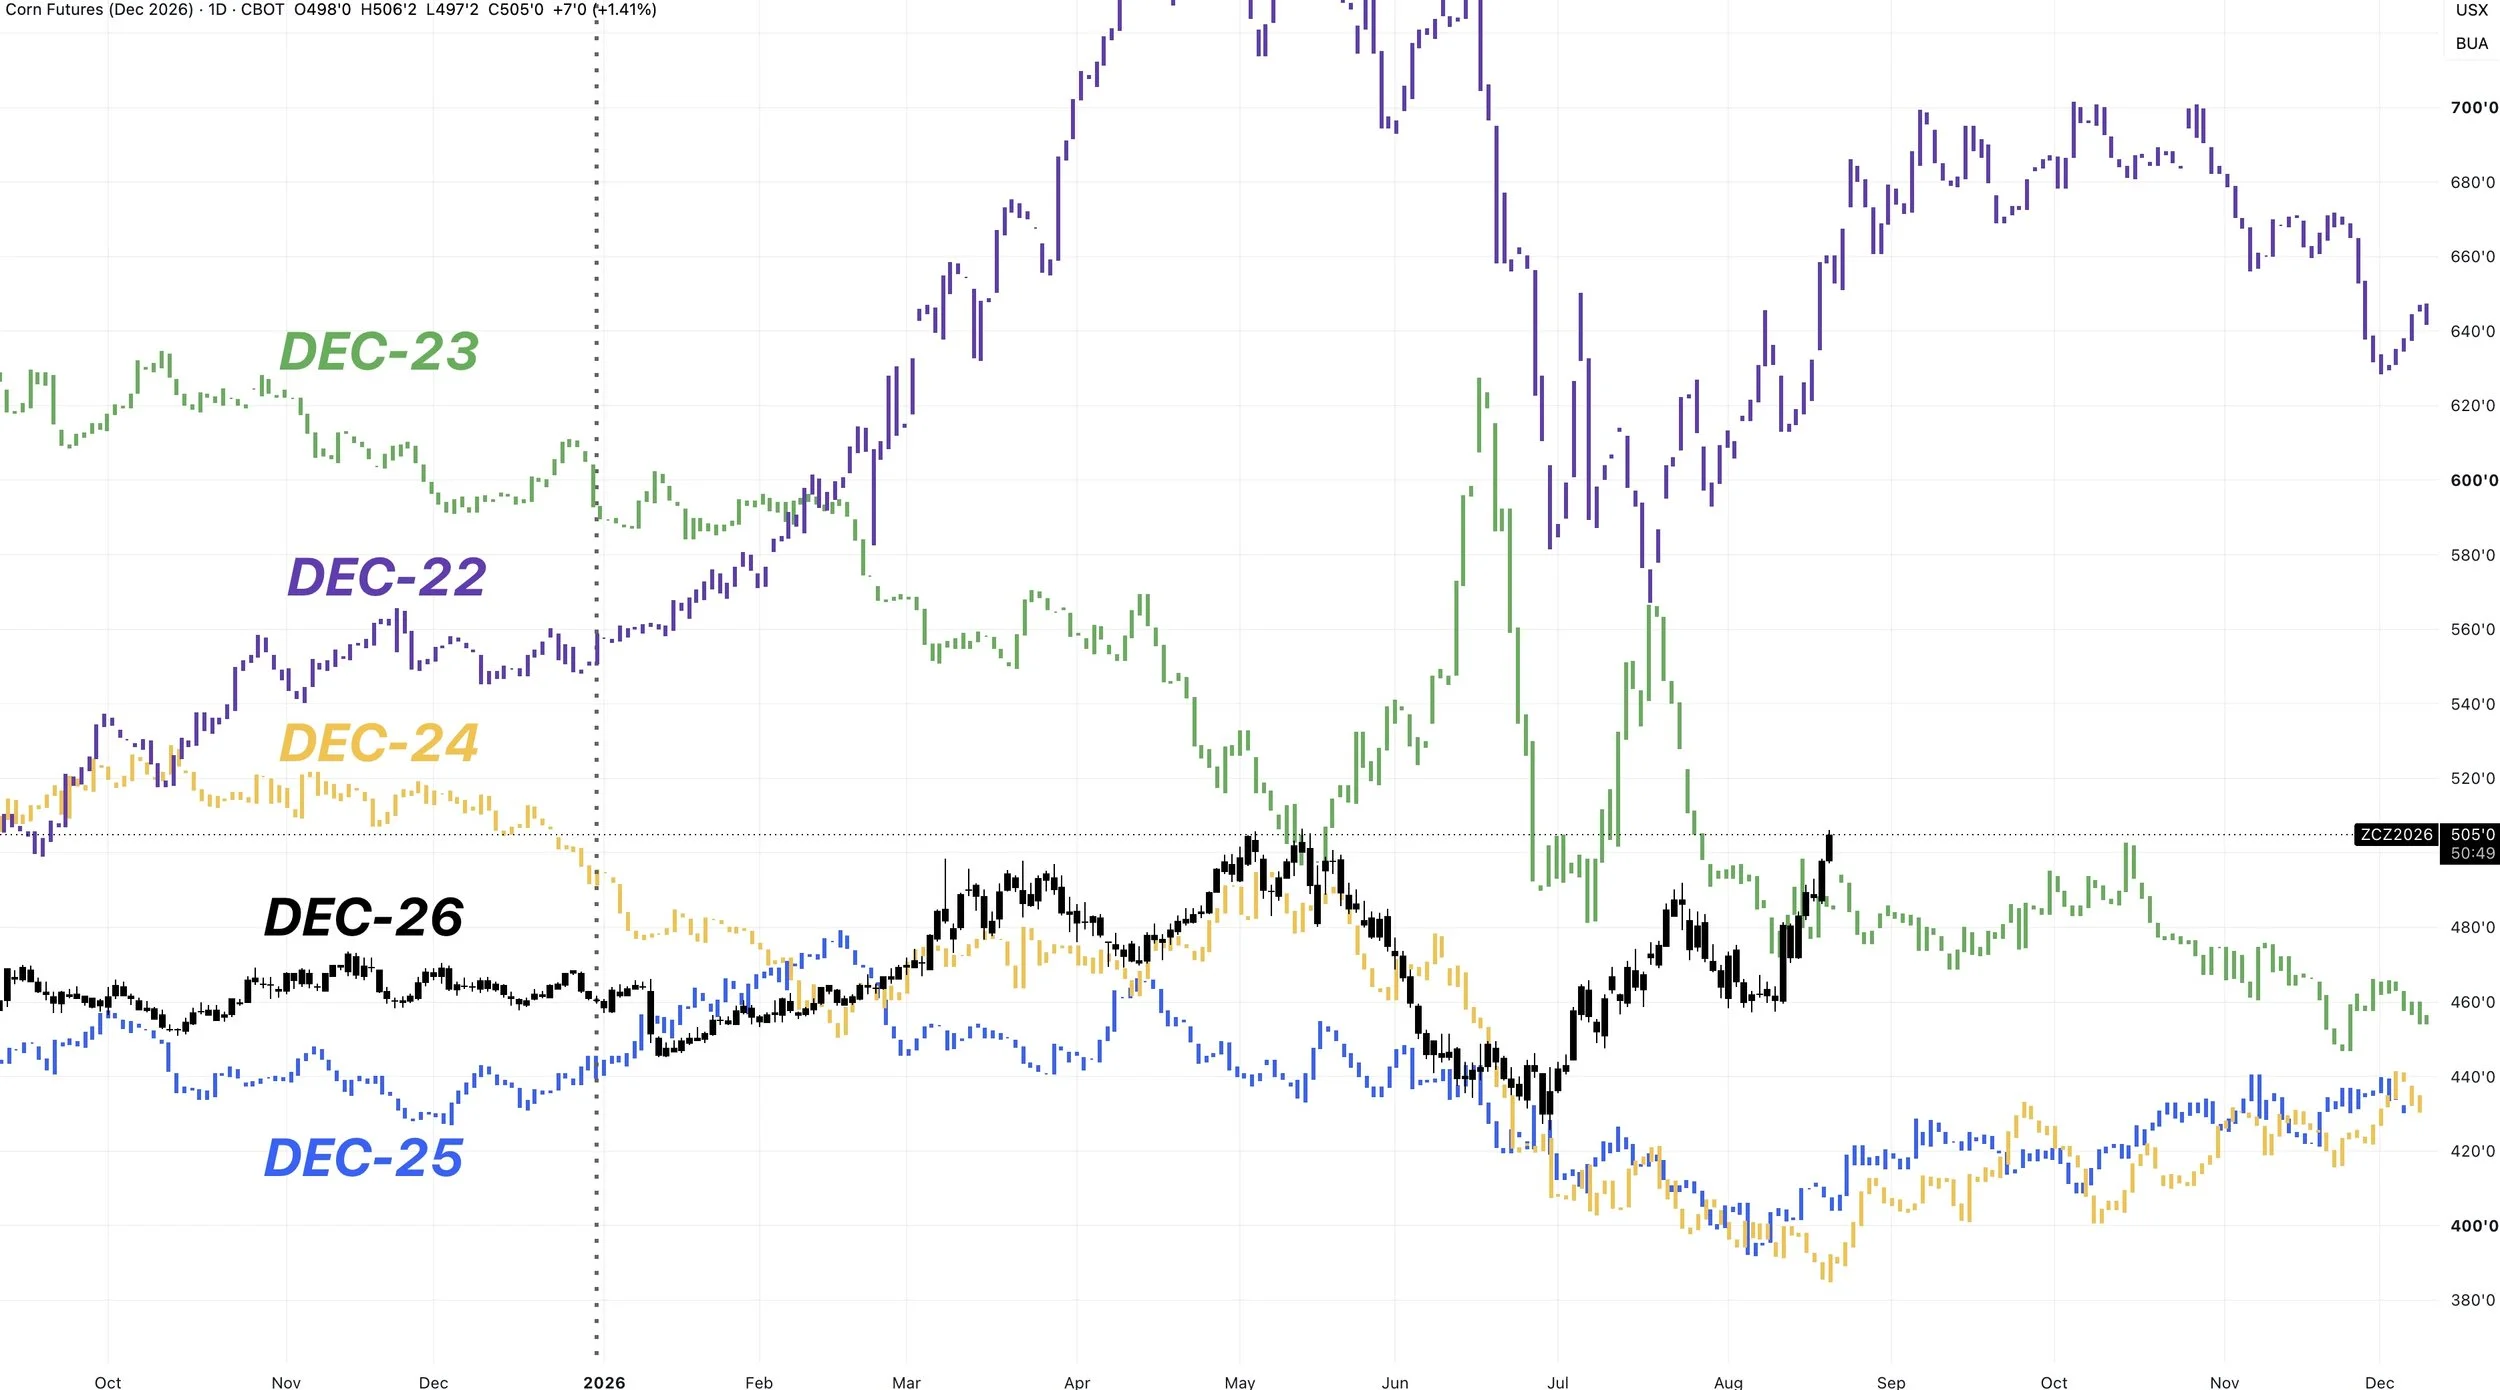
In yesterday's alert, we covered a few different strategies you could consider.
We always prefer to use options as a tool to lock in a floor or keep your upside open. As using options simply gives you a lot of flexibility in your marketing.
Some of those strategies included puts for downside protection. Selling calls to help pay for the puts. Or selling some cash and re-owning with options.
If you have questions on them, as always please give us a call or a text and we'd be happy to help.
Office: (806)484-1214
Alert: Click Here to View
Dec Corn Chart:
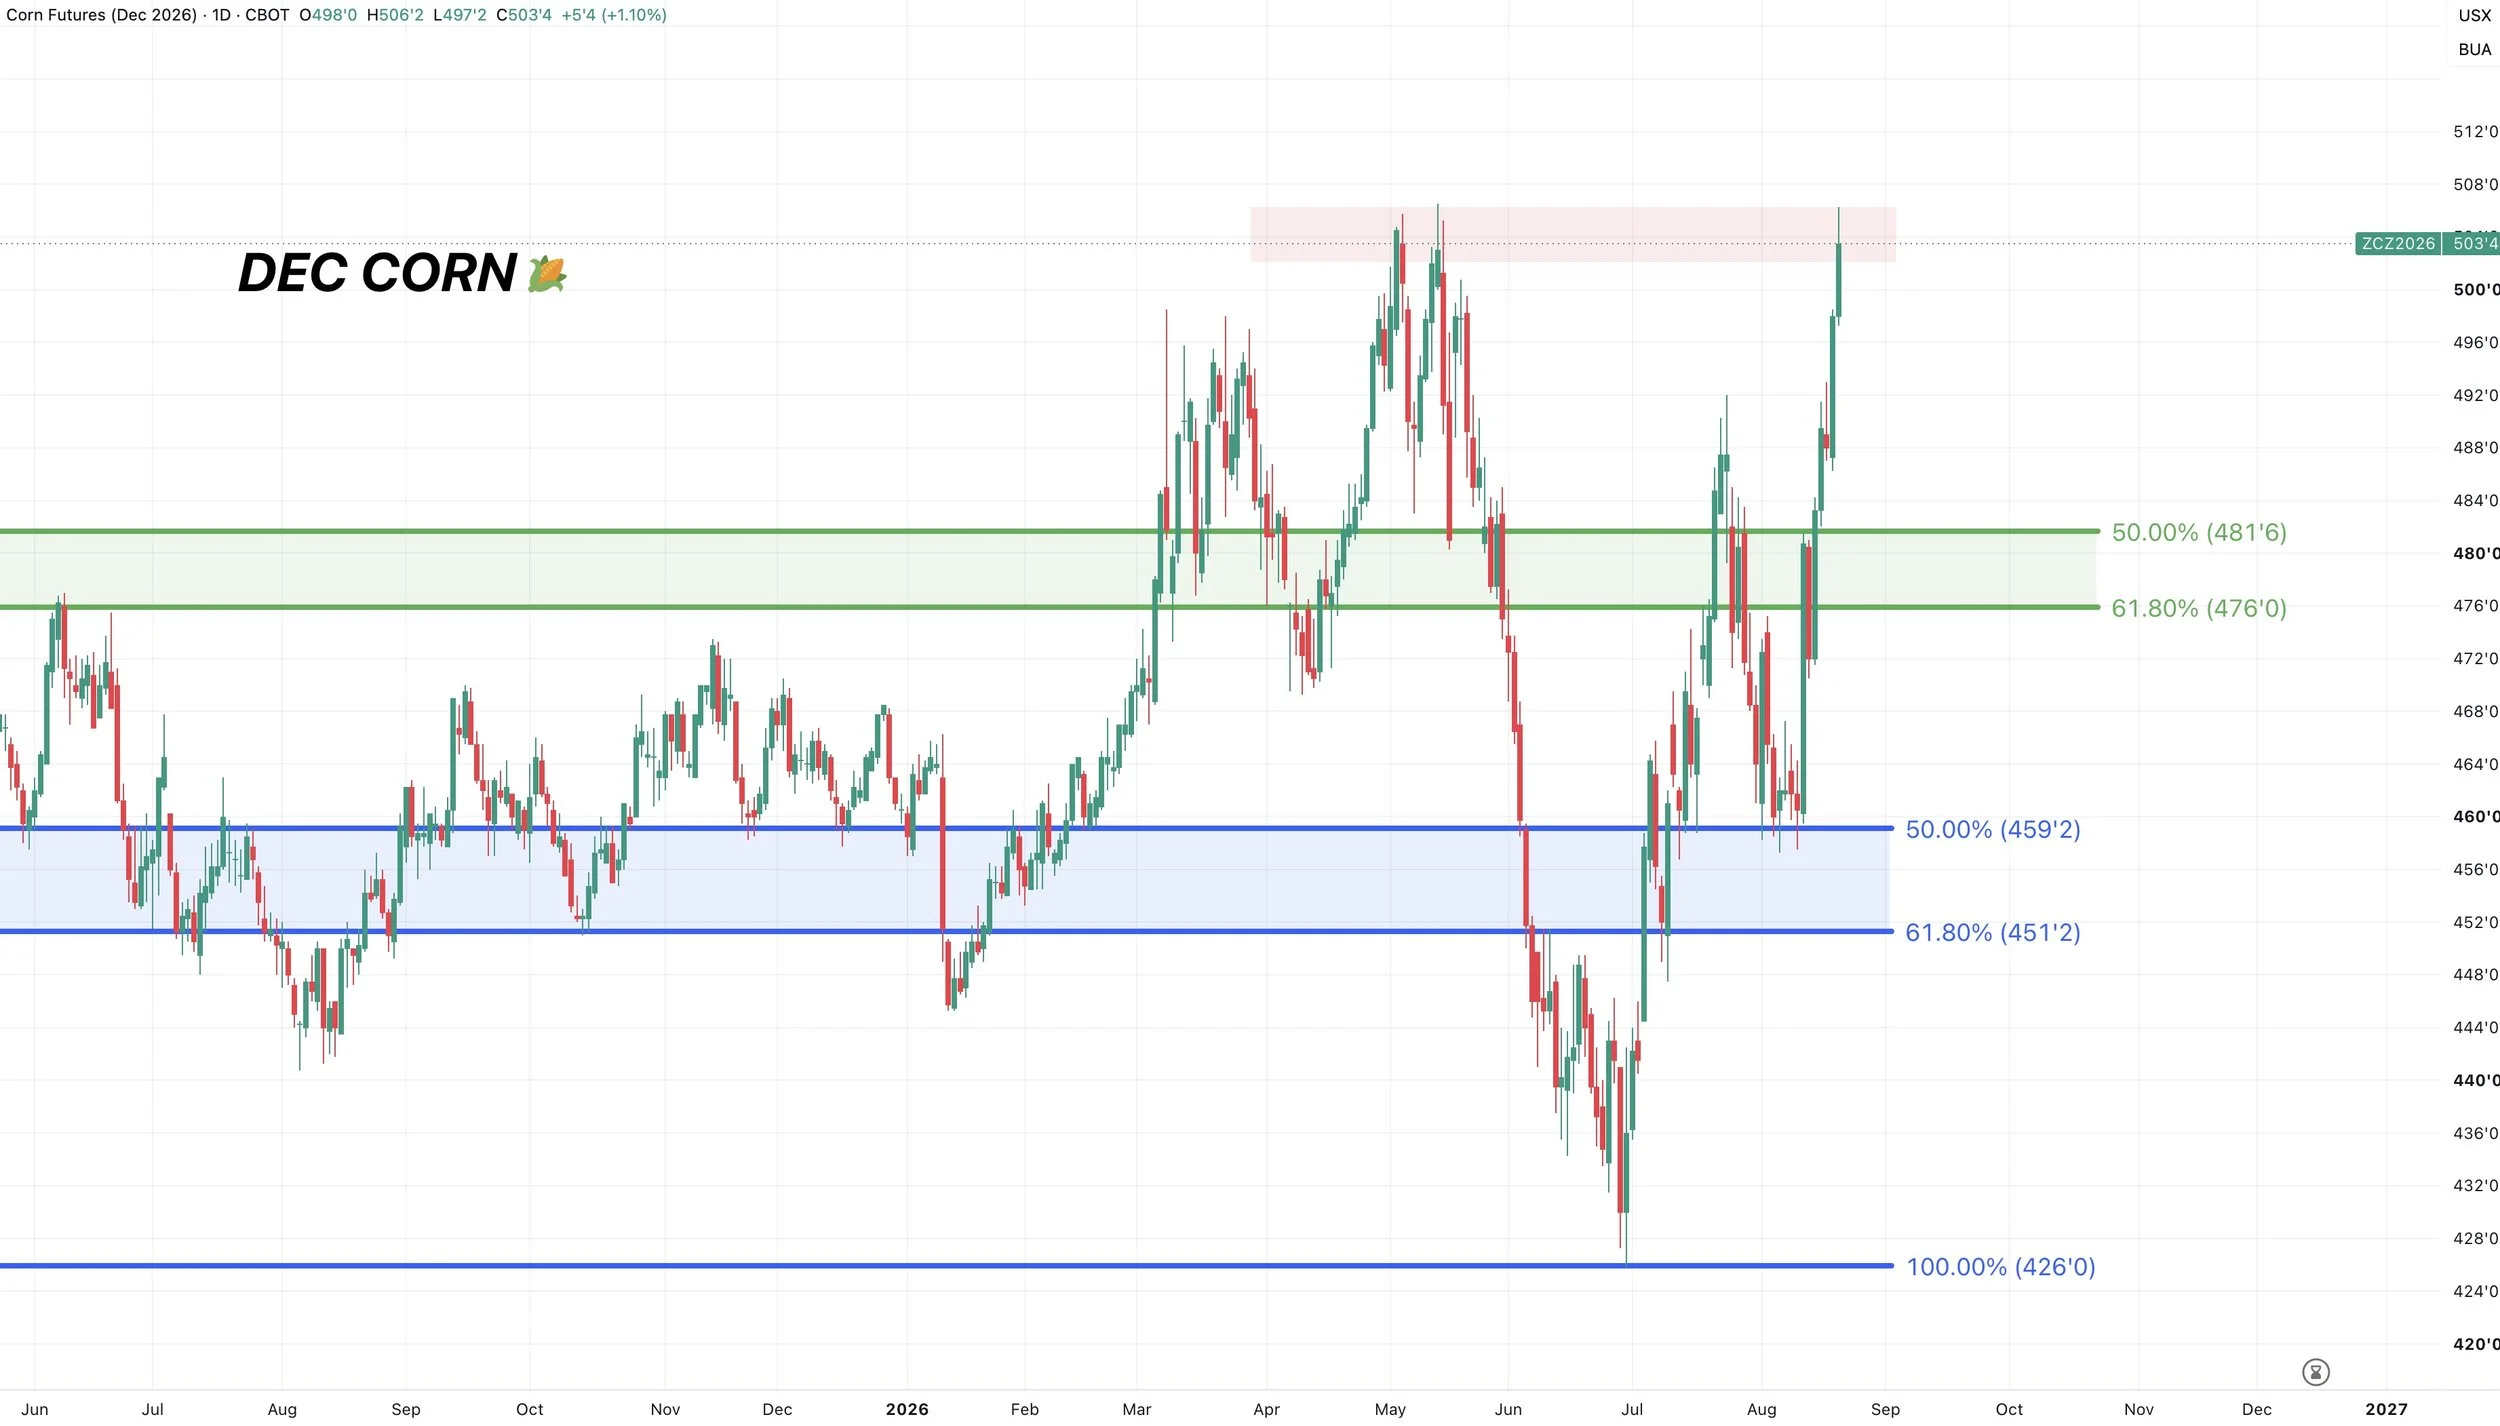
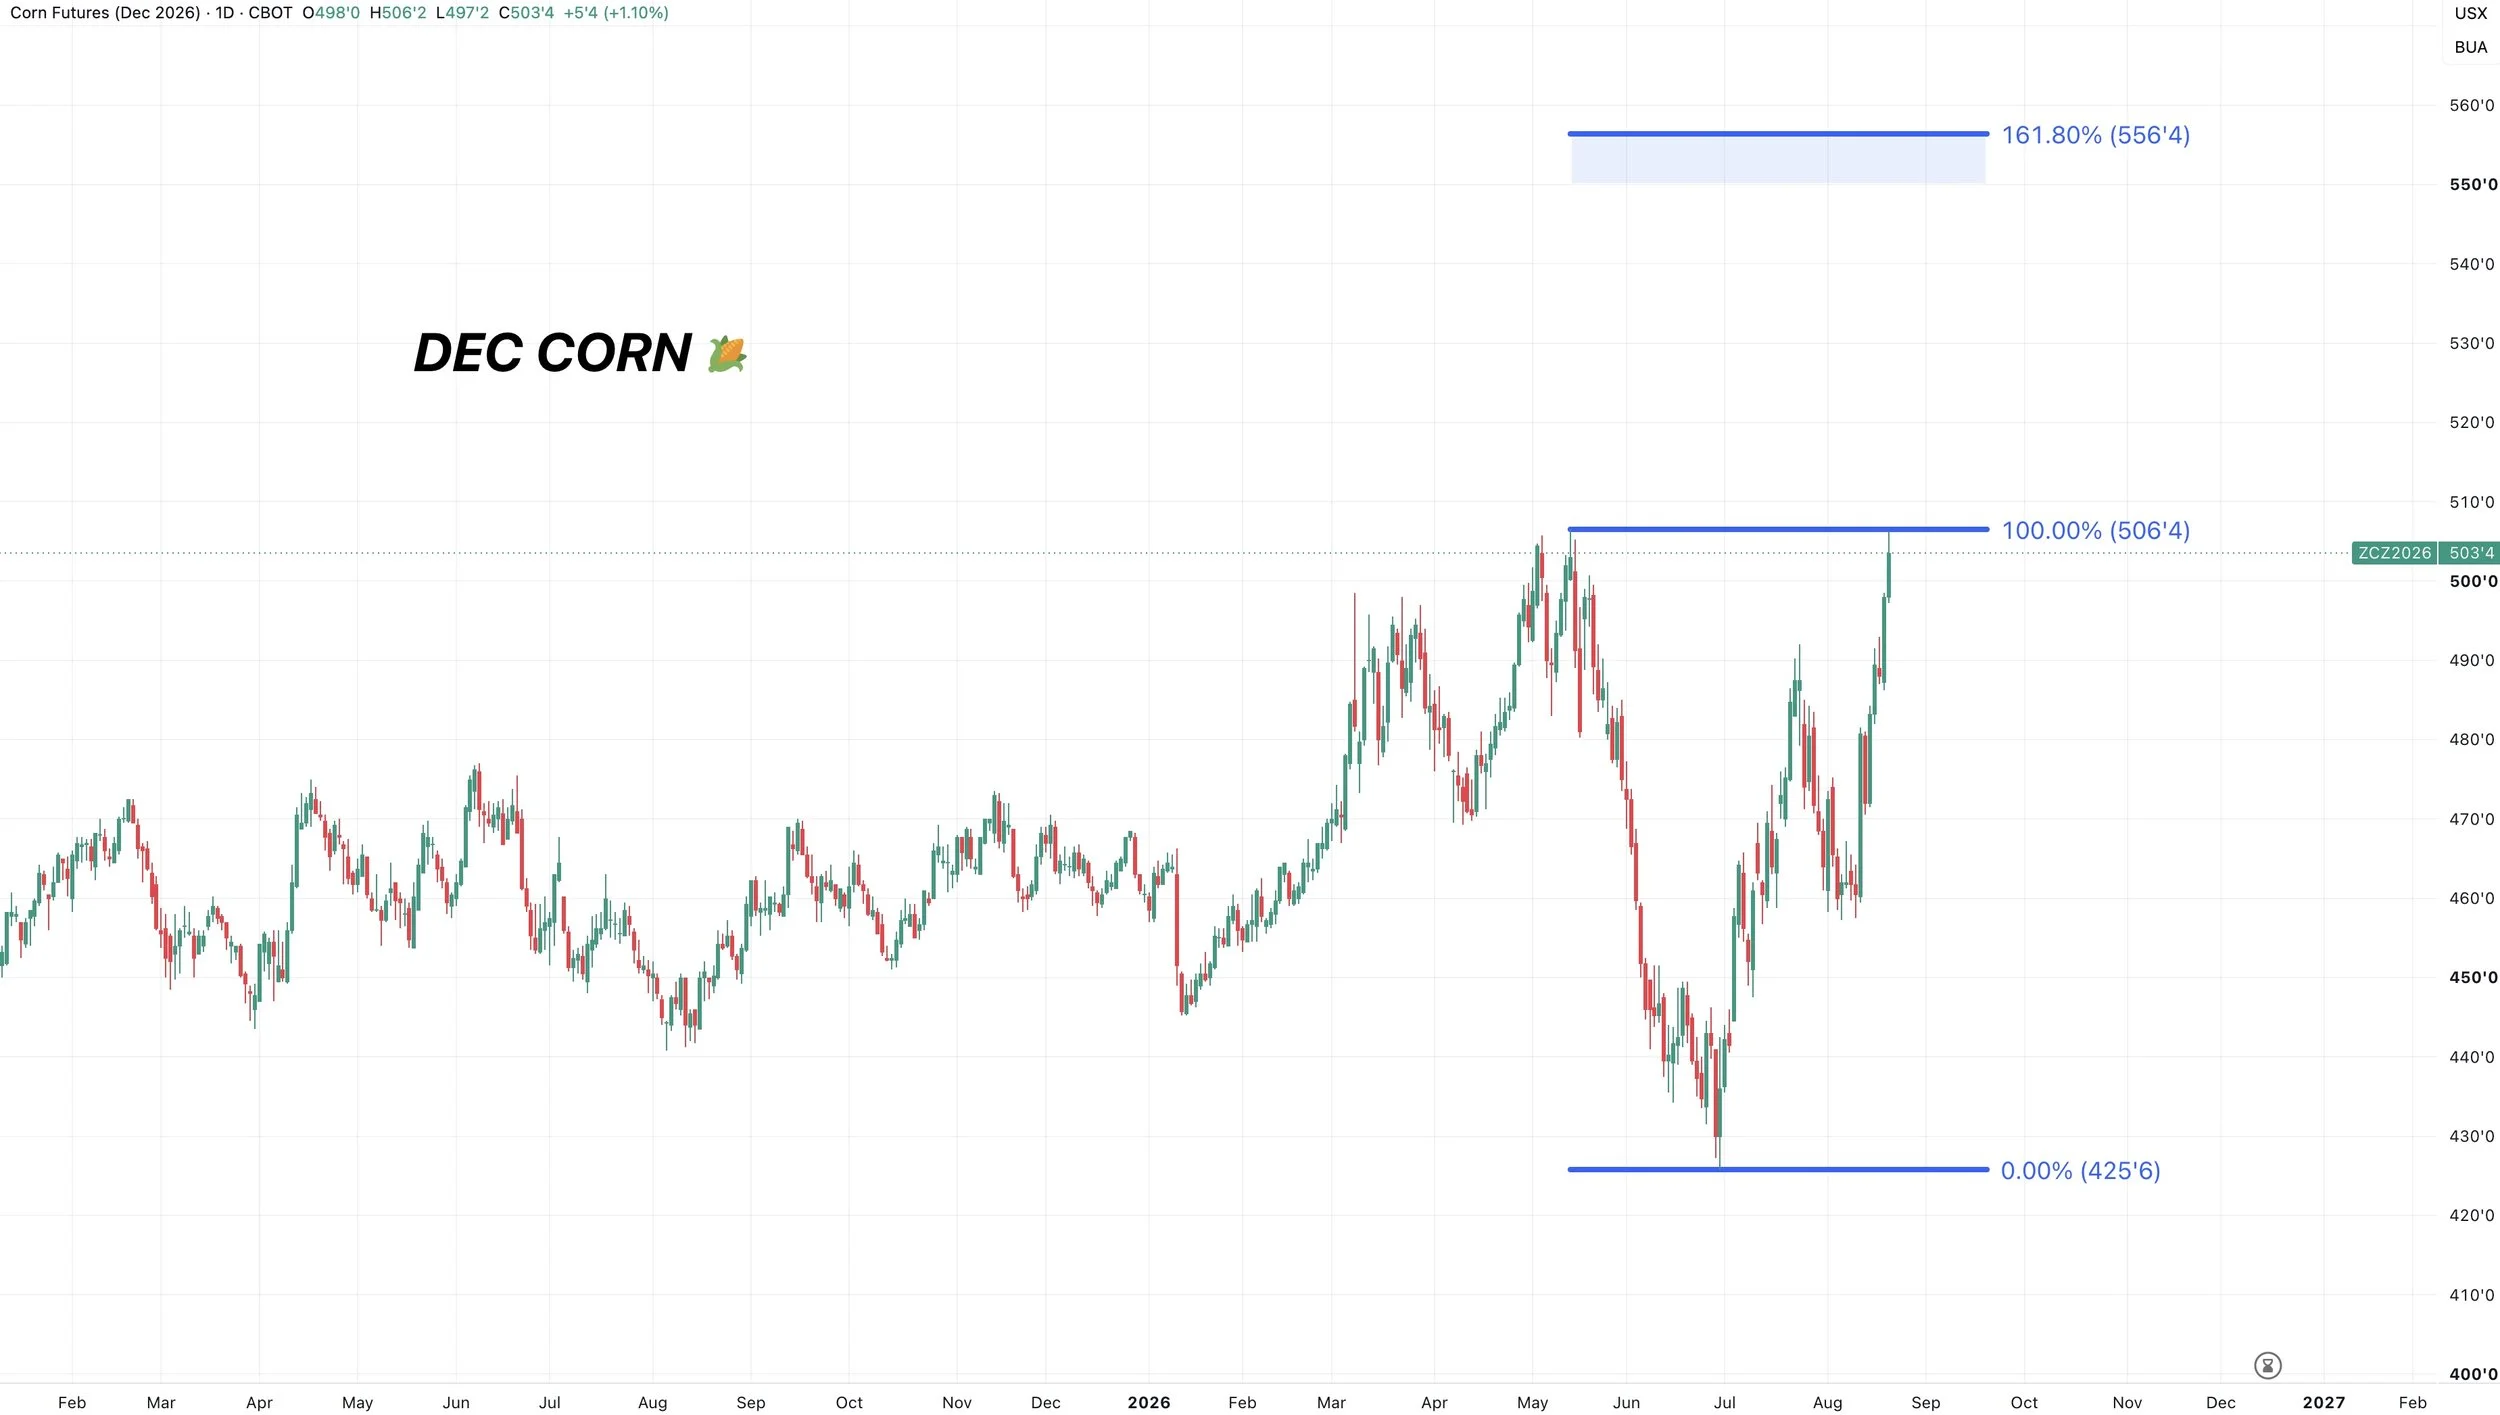
We tapped those highs from May and closed about -3 cents off the highs.
Could we just blast through here? Sure it's possible.
This could also turn into a short term double top.
Considering we just ran +45 in the last week without stopping.
Rallies need to breathe and a pullback would be healthy.
If we get a decent pullback, I think it would be viewed as a good re-ownership opportunity. As I like the idea of owning corn into the end of year.
If the pullback happened right here, I'd be eyeing the $4.75 to $4.80 range for now.
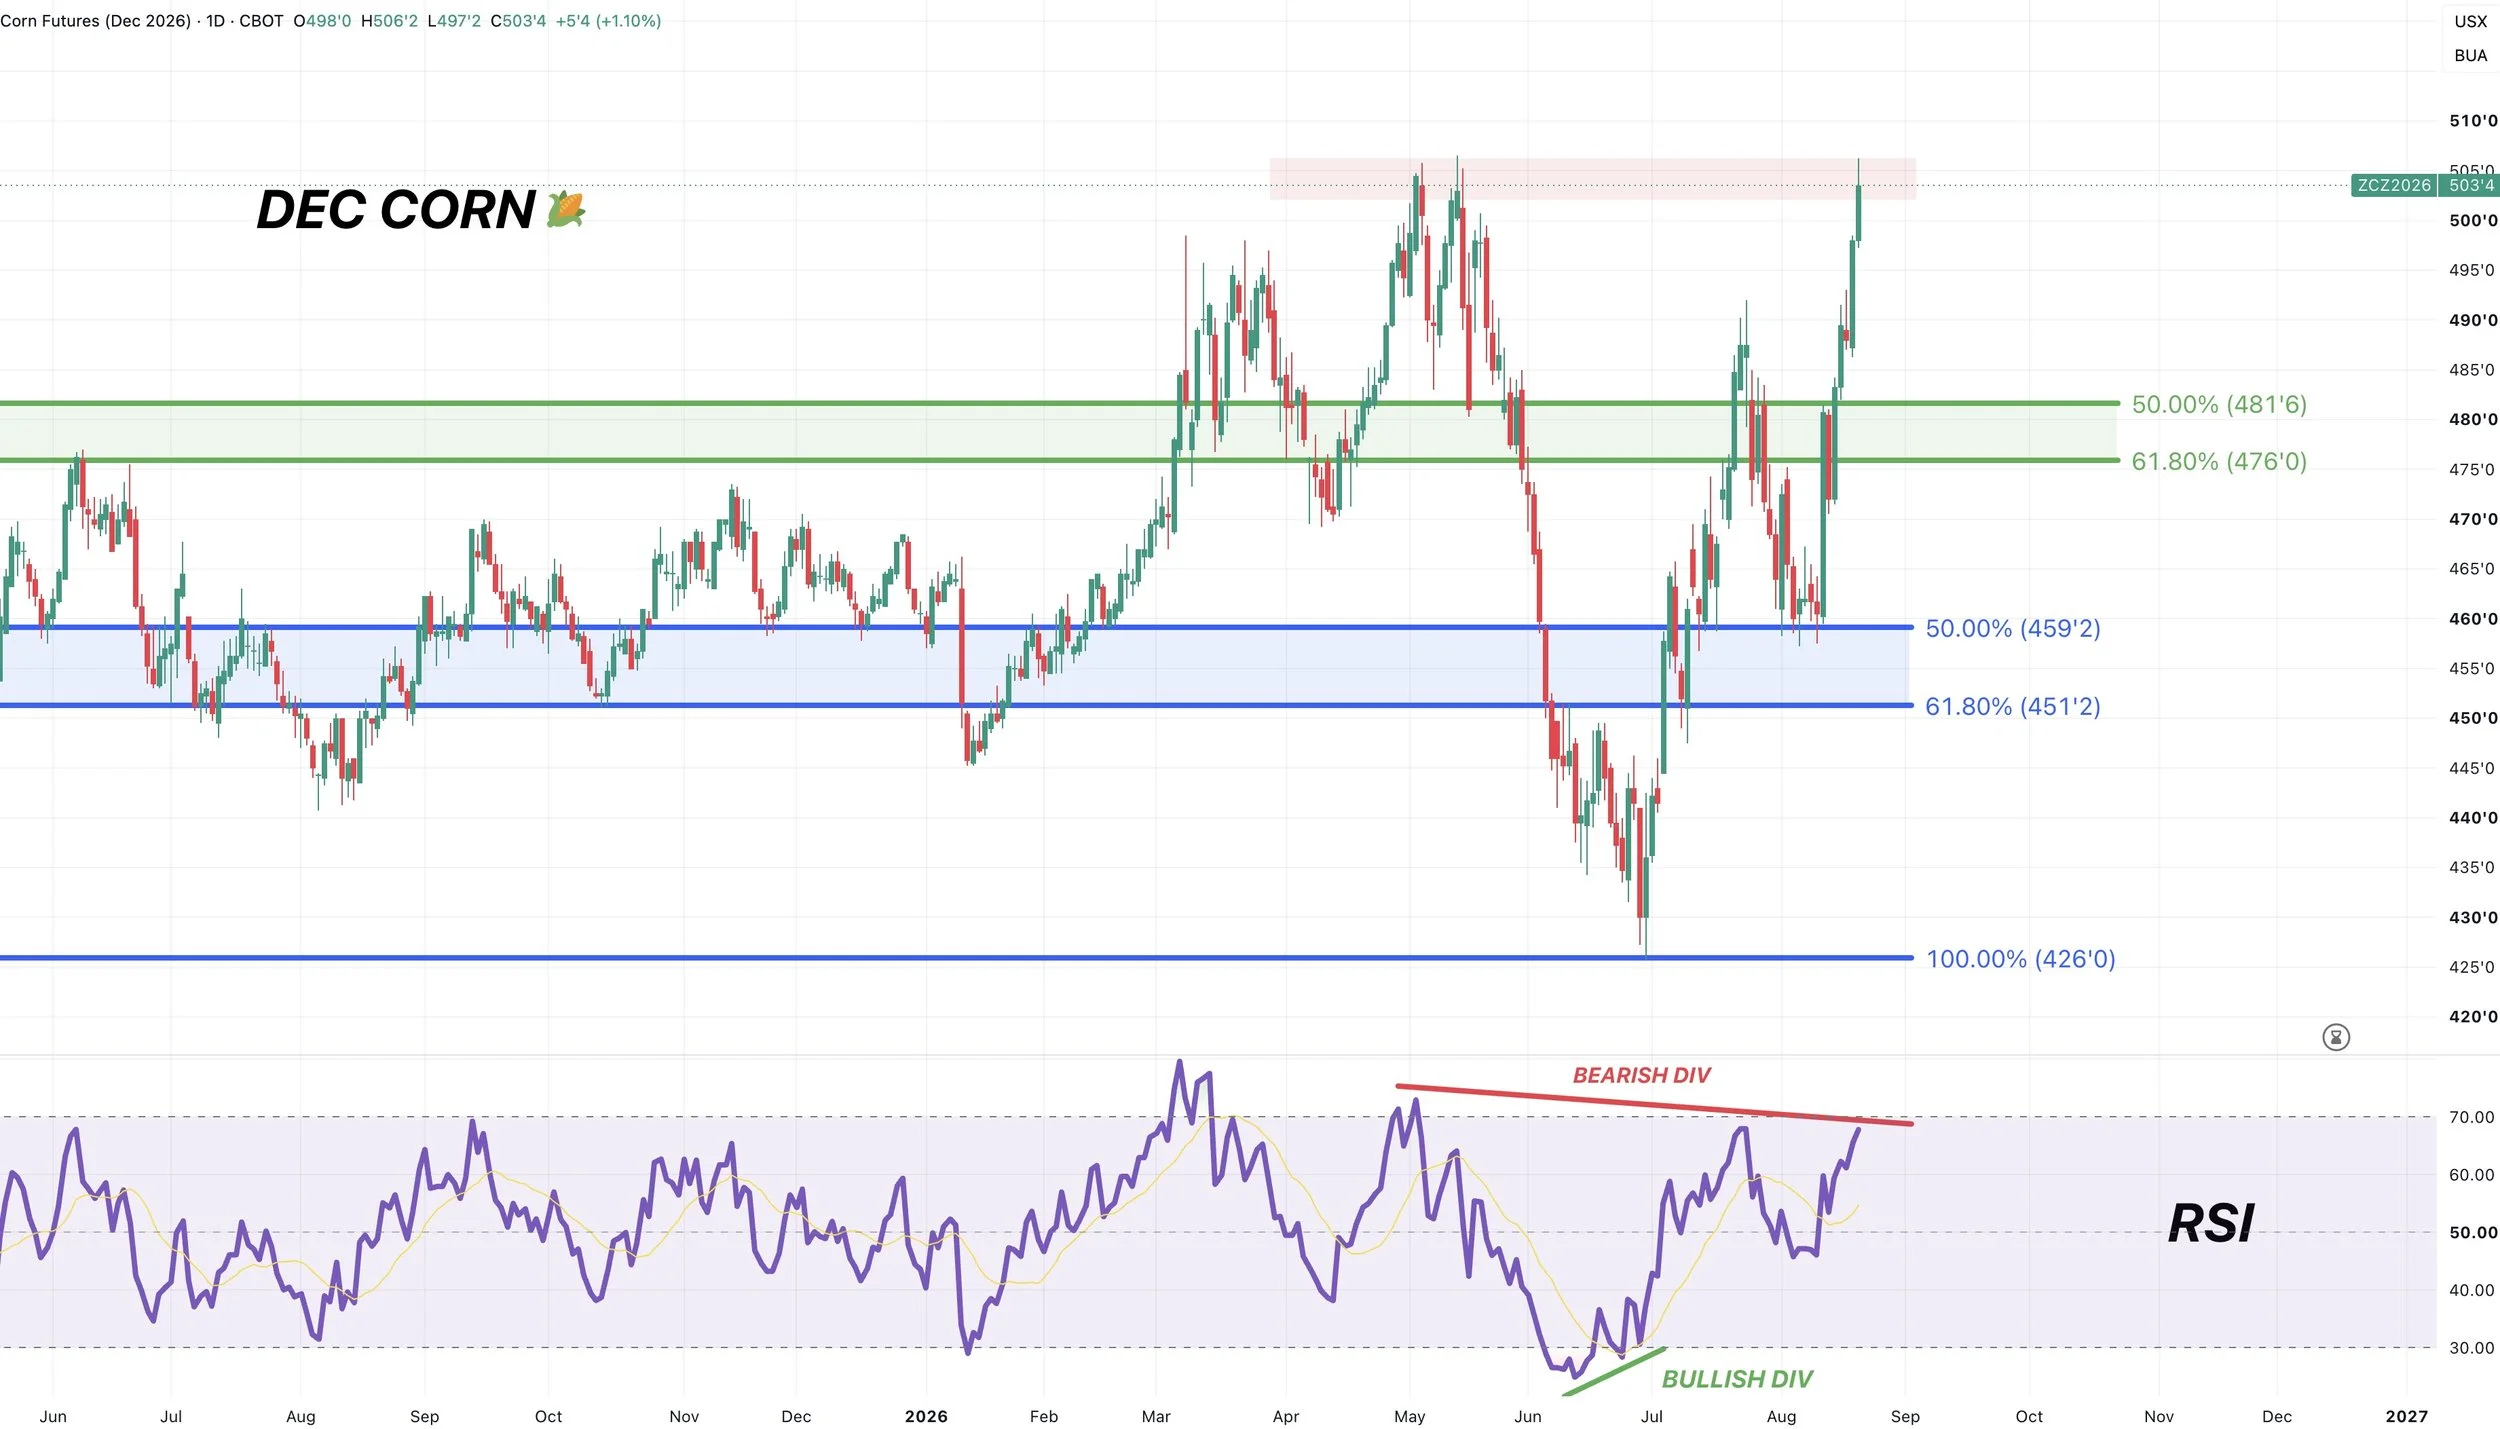
RSI Divergence:
We still have bearish divergence on the RSI.
It doesn’t mean we cannot go higher. Just a reason to have some caution here soon.
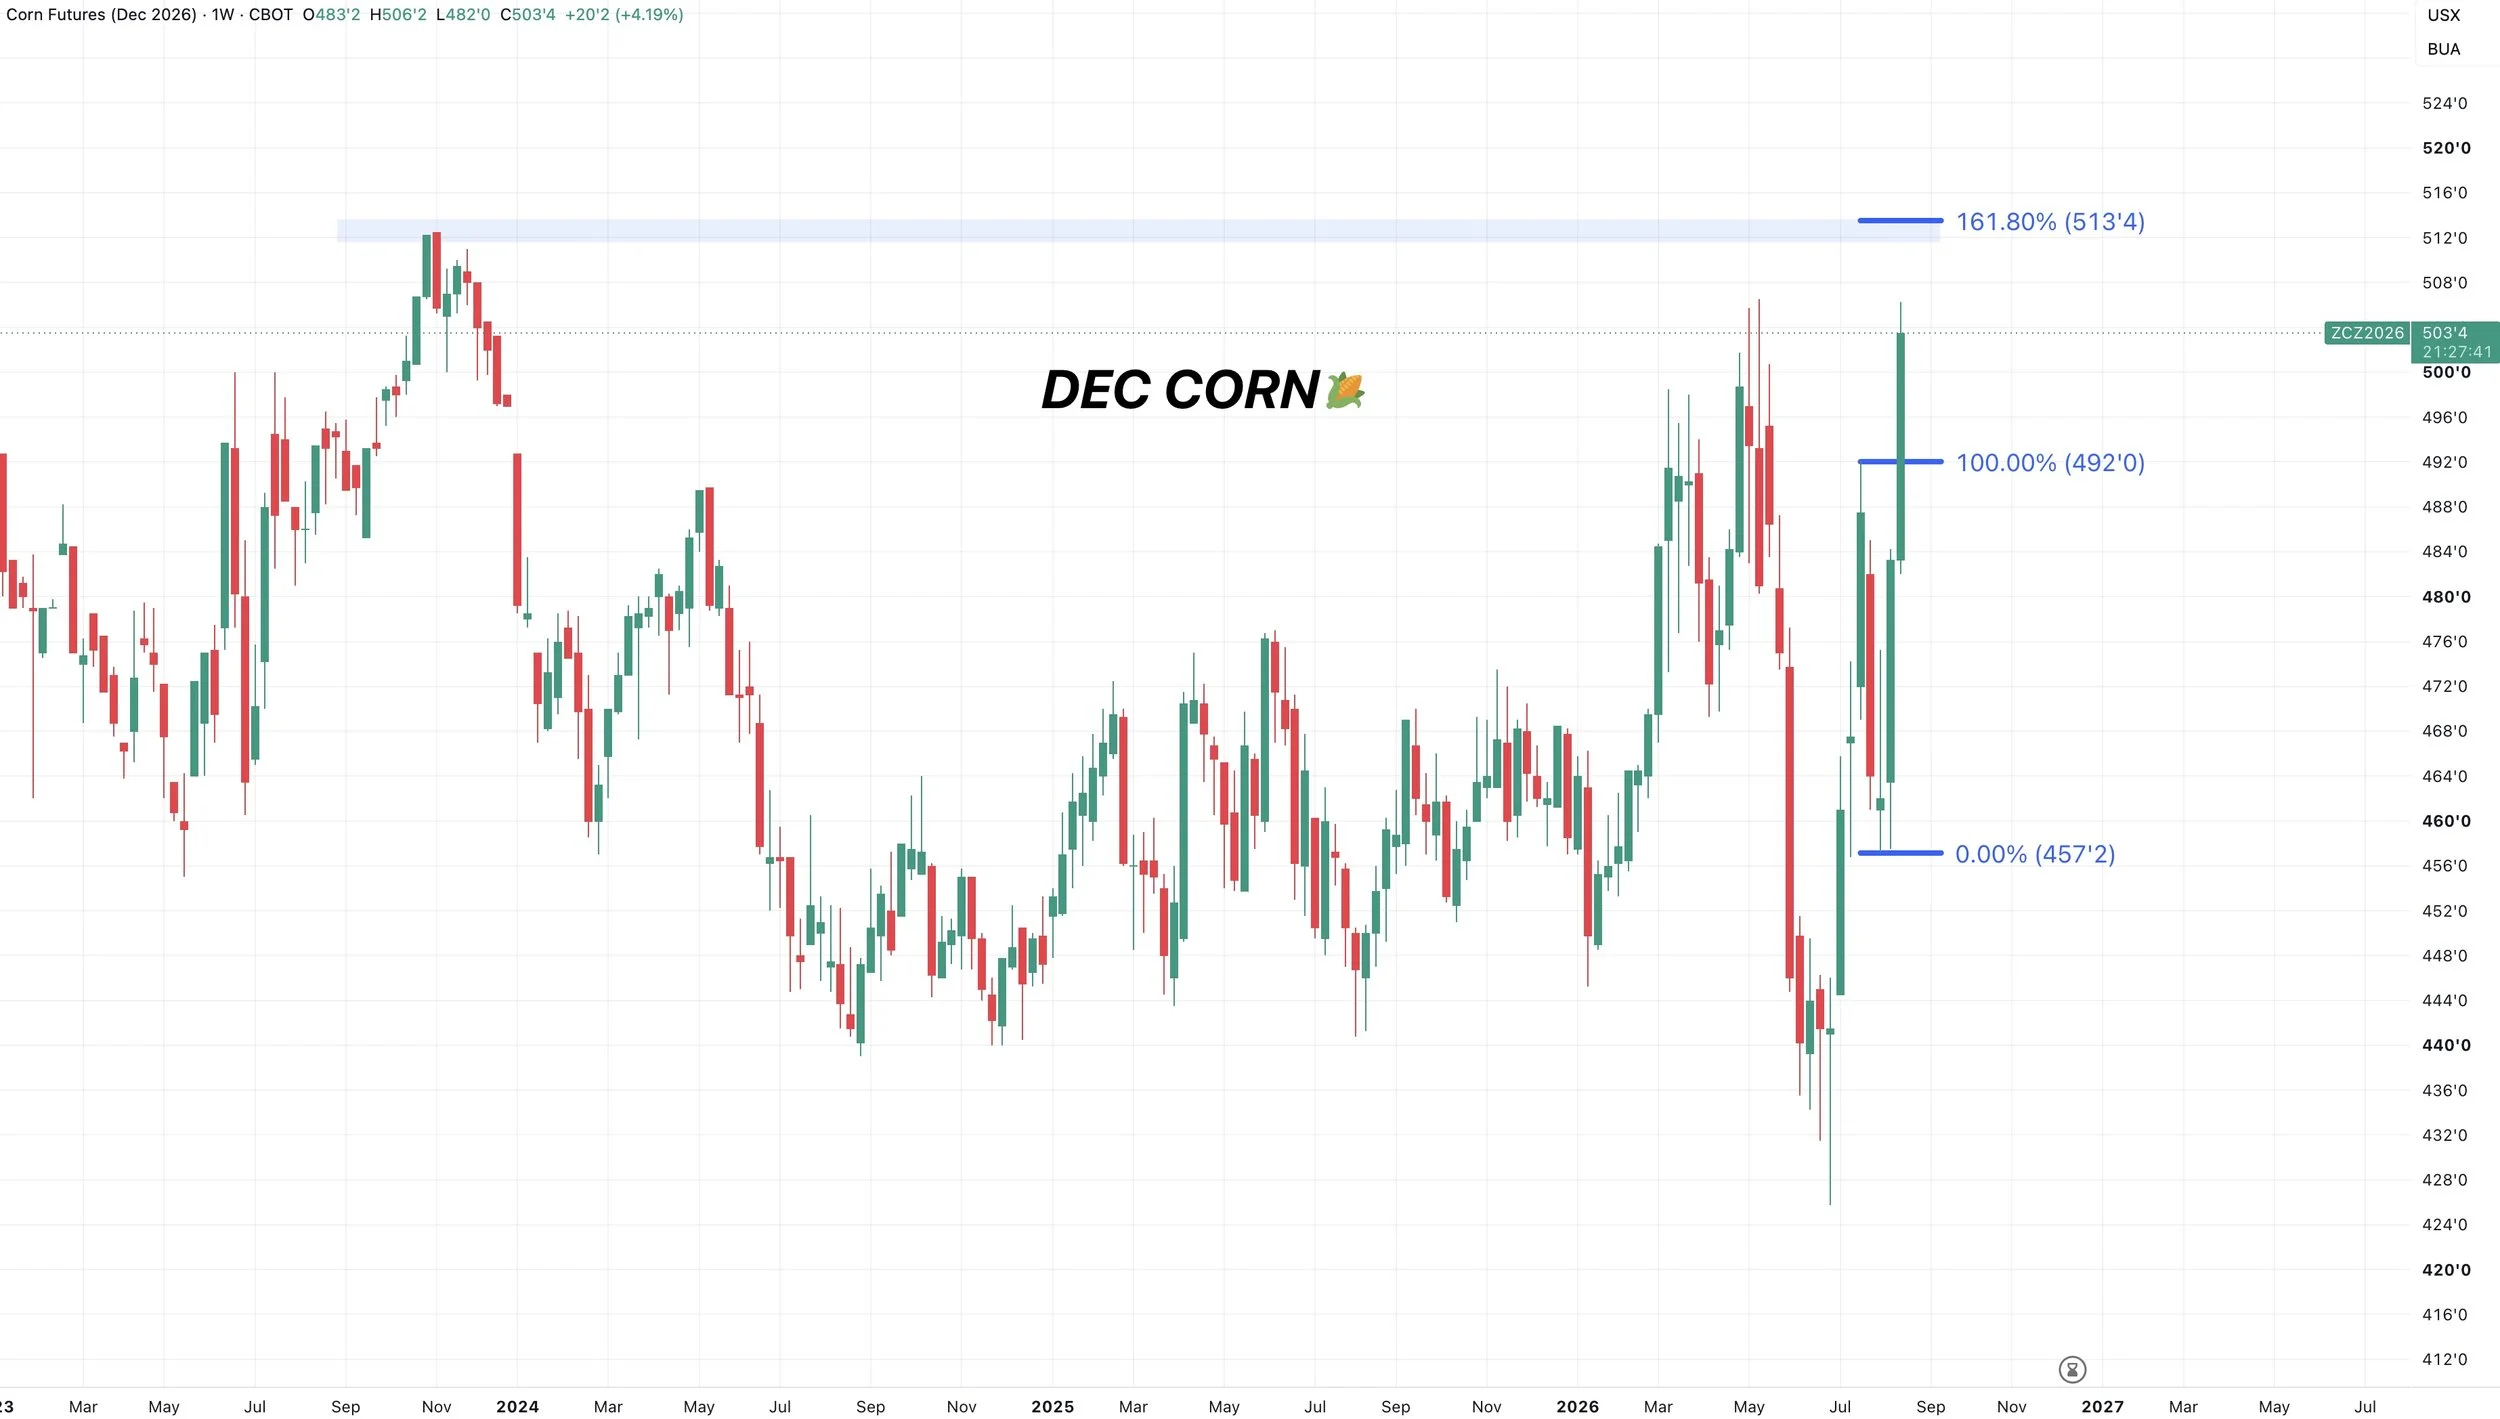
Possible Dec Targets:
As for our next targets.
$5.13 is the golden fib from the August lows up to the July highs. Meaning it's 161.8% of that move.
That same level is contract highs.
Beyond that, we open the door up to some higher possibilities.
I'm sure the next targets will change, but one we have out there is the $5.50 range.
$5.56 is the golden fib from the contract lows up to those May highs. Again, the golden fib means it's 161.8% of that move.
Continuous Front Month Chart:
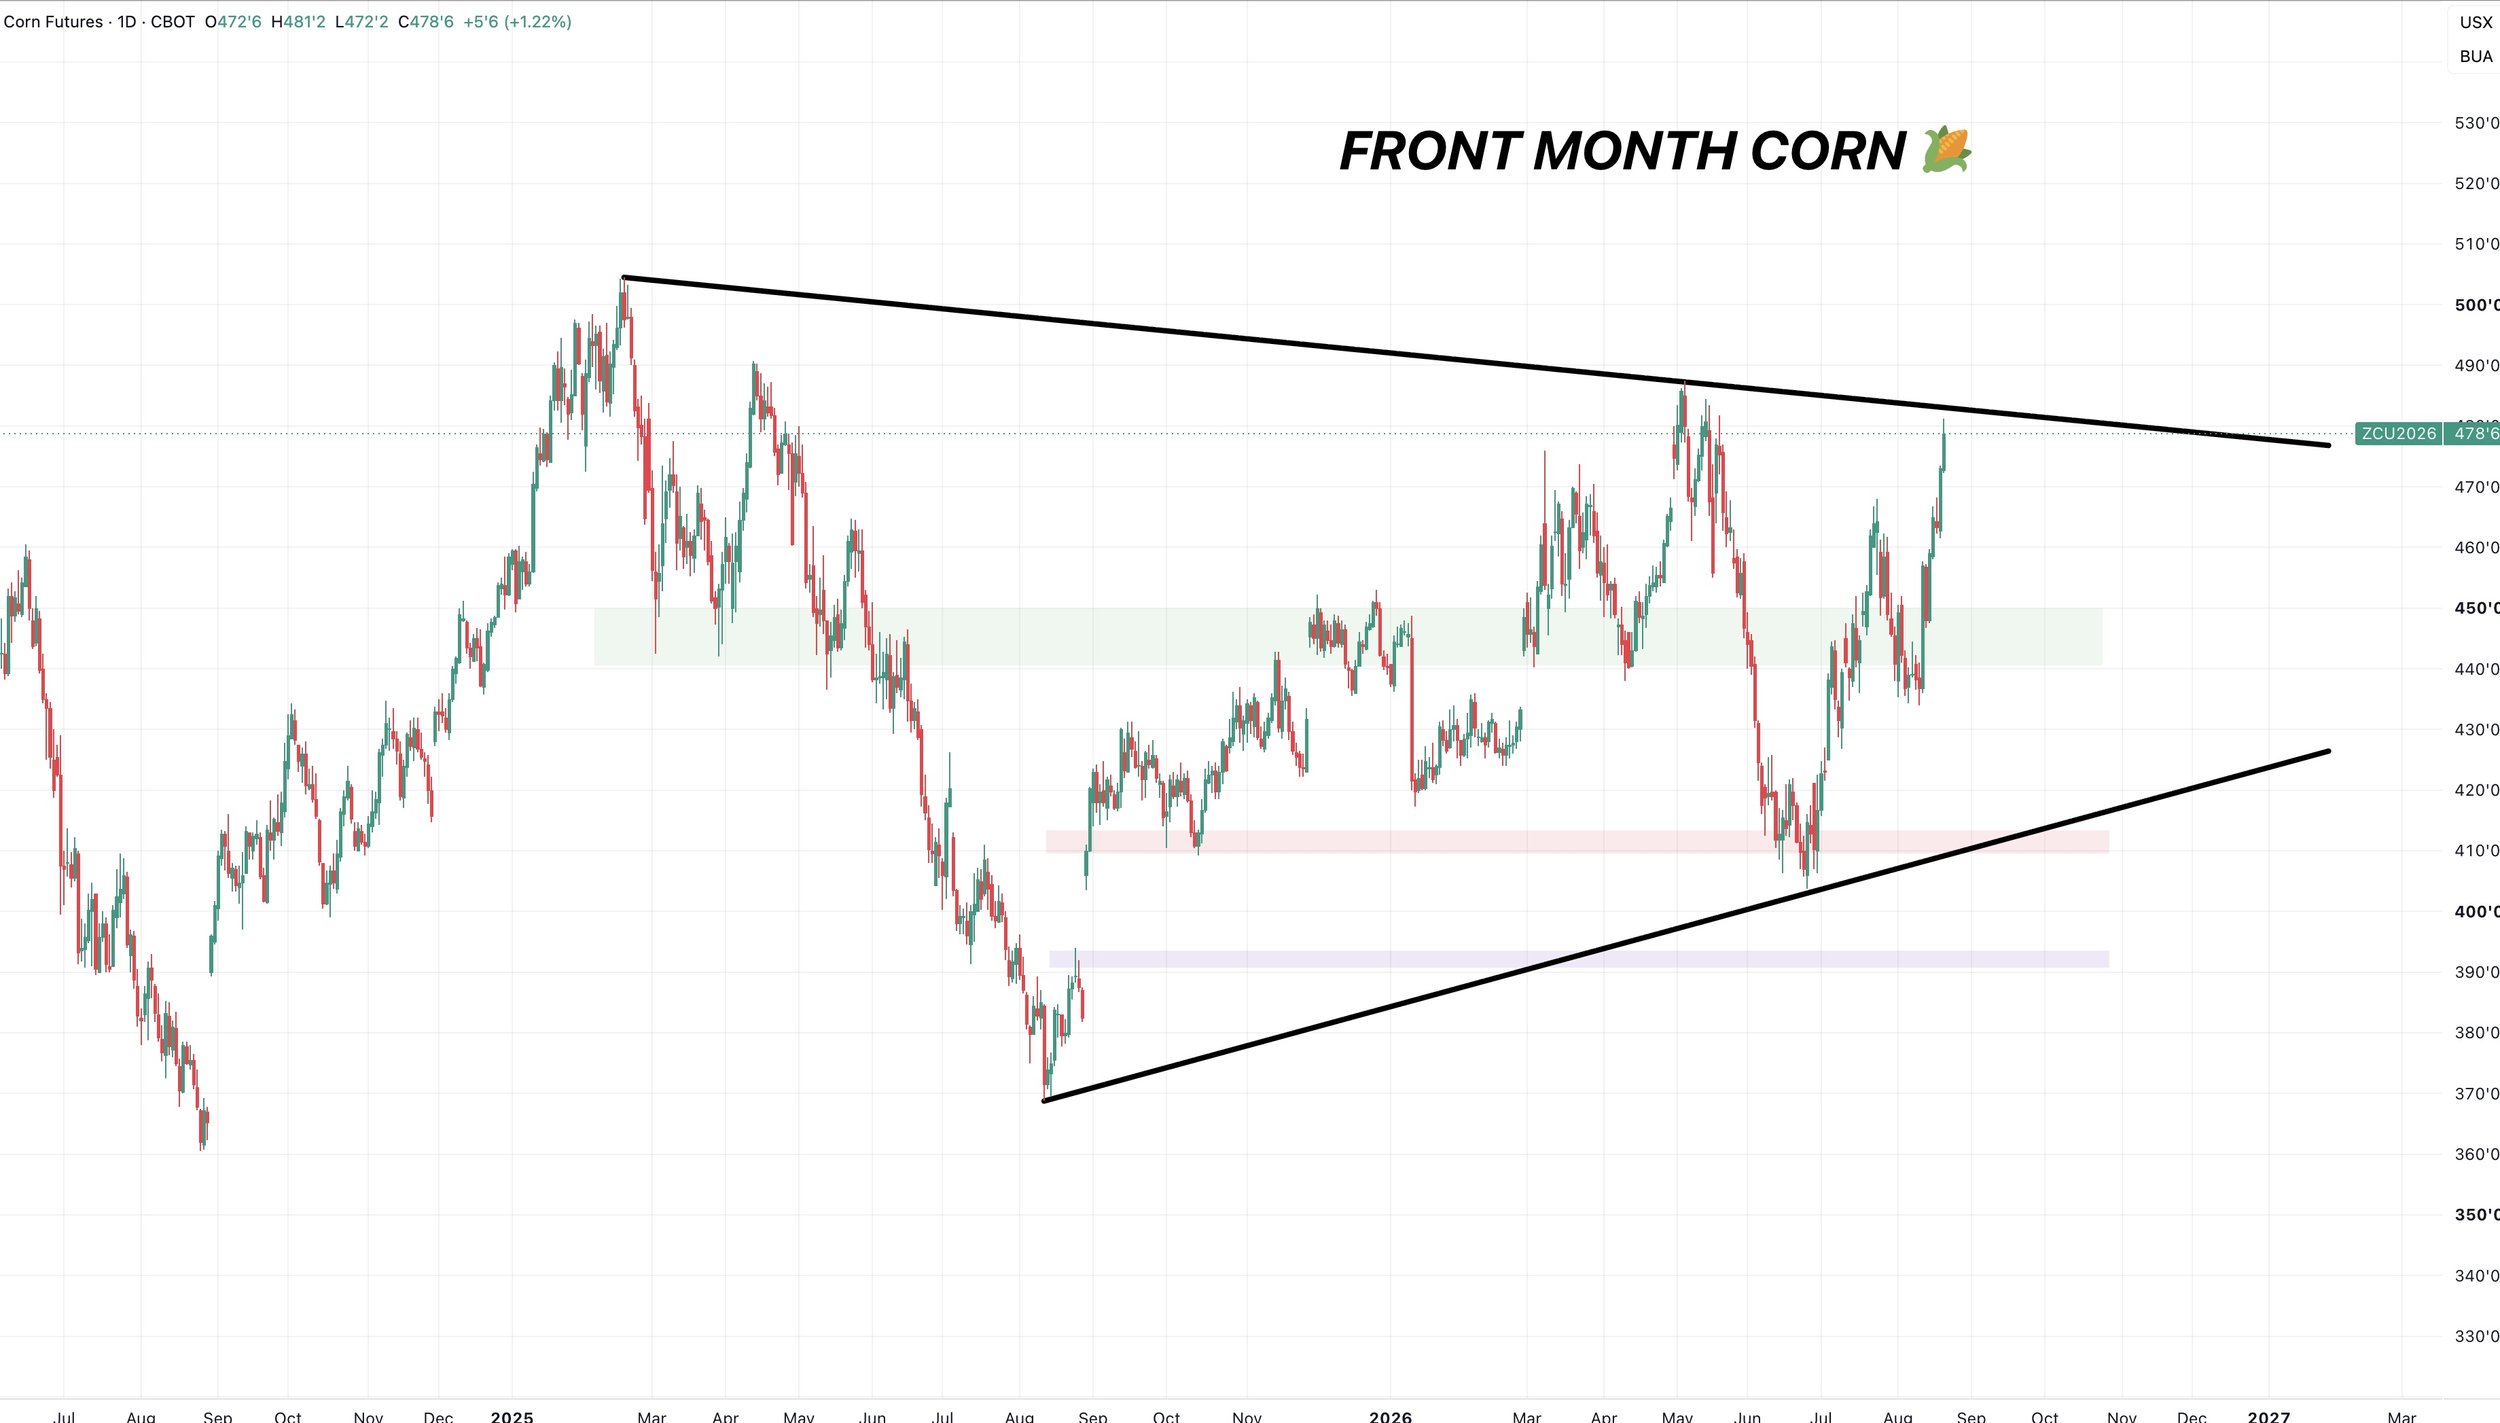
If we look at the continuous charts.
We are running into some possible resistance here as well.
With a simple trend line that marked the 2025 highs and the highs from May.
However, if we crack above that, things get interesting.
Monthly Chart:
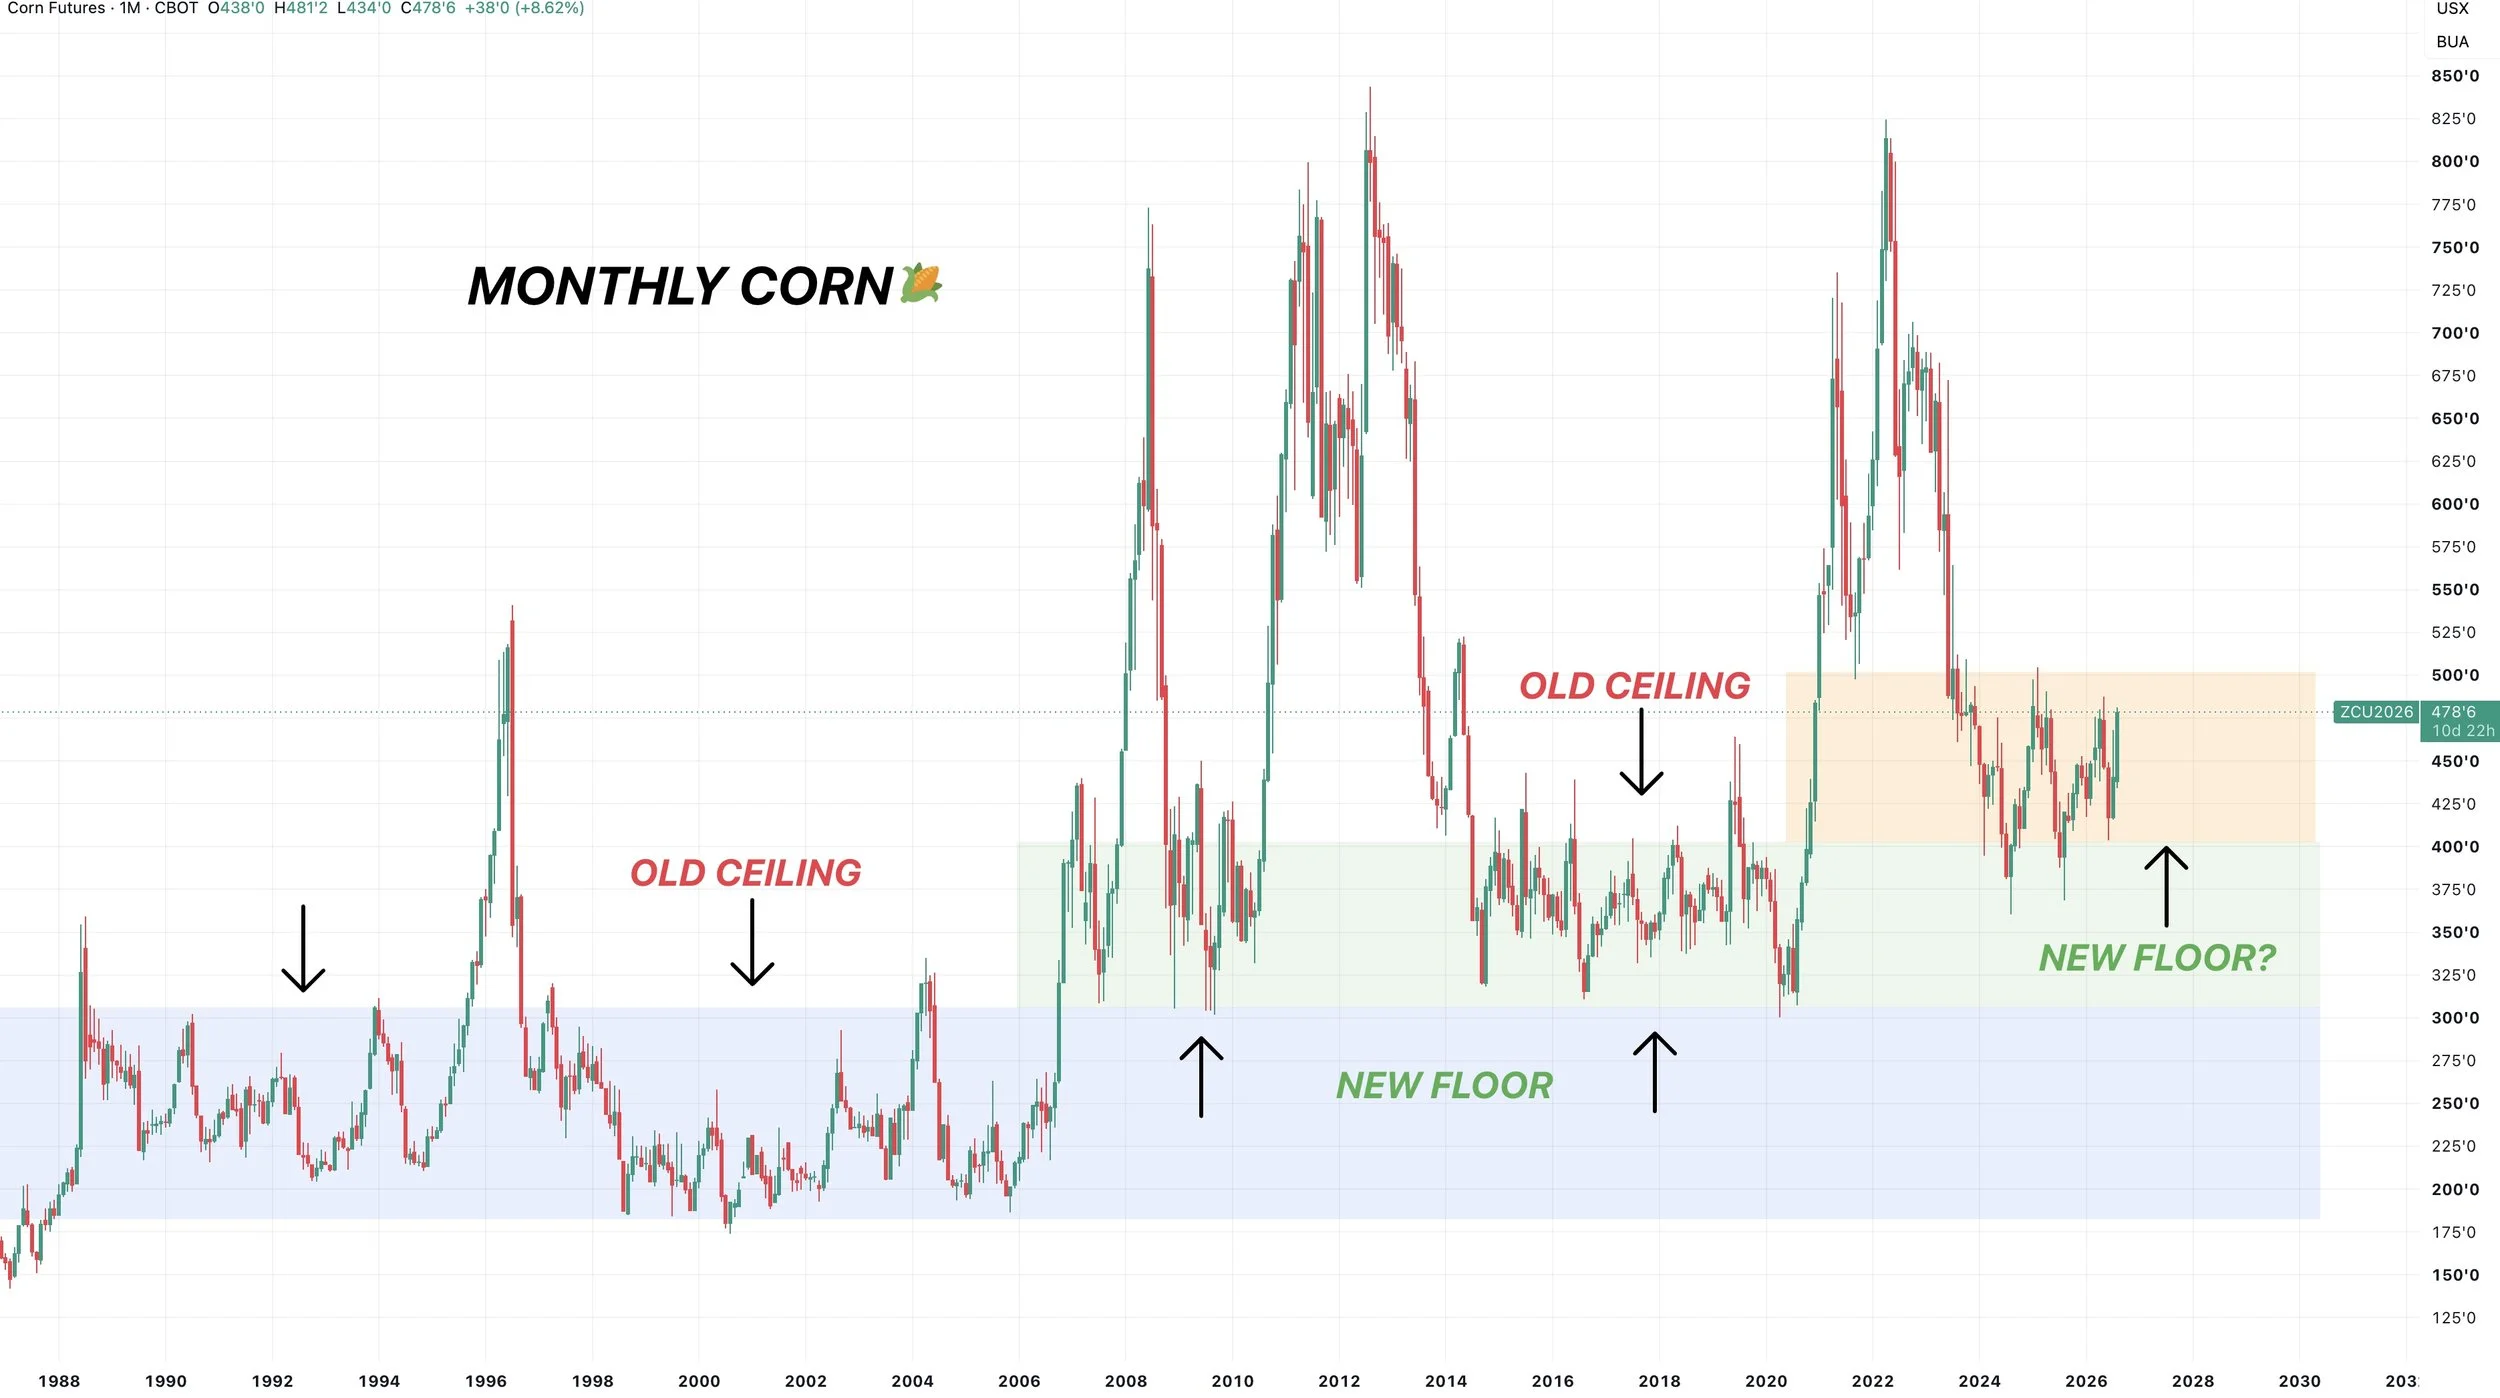
Corn tends to be trapped in a $1.00 range.
In the 90's and early 2000's that range was $2.00 to $3.00
From 2014 to 2020 that range was $3.00 to $4.00
Our new range has been $4.00 to $5.00
Each range has turned the prior ceiling into the new floor.
If we break above $5.00 on a front month basis, it would look like we are breaking out the range. It would also be our very first higher high of the entire bear market.
So if we break $5.00, it would be a good sign of things to come when looking at the long term structure.
Soybeans
Fundamentals:
Crush demand is hot.
China is consistently buying. We continue to see flash sales almost daily.
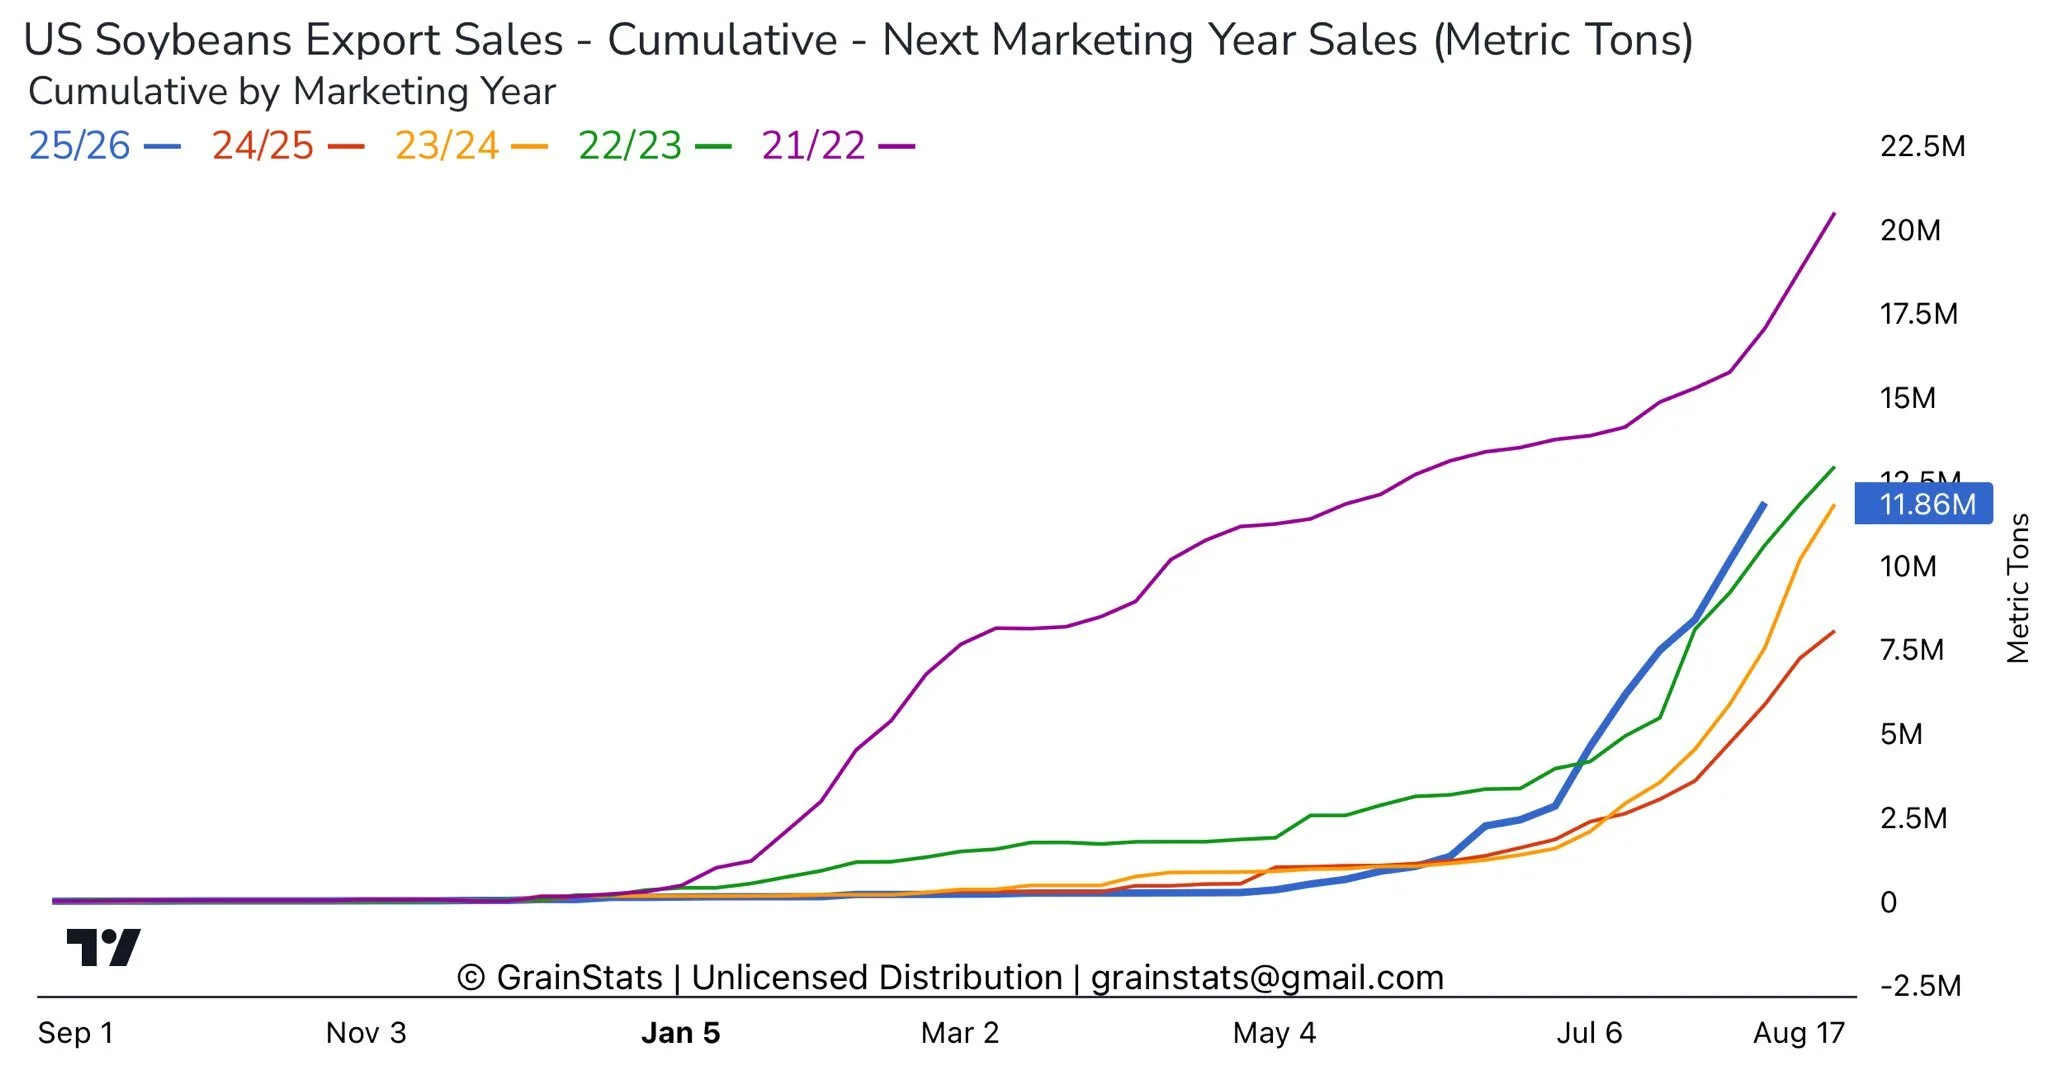
Here is a good graph from GrainStats (@GrainStats on X).
Our soybean sales for next marketing year are their best since 2021/22.
We've talked about this before, but if China ends up fulfilling that goal, the market has not priced that in yet.
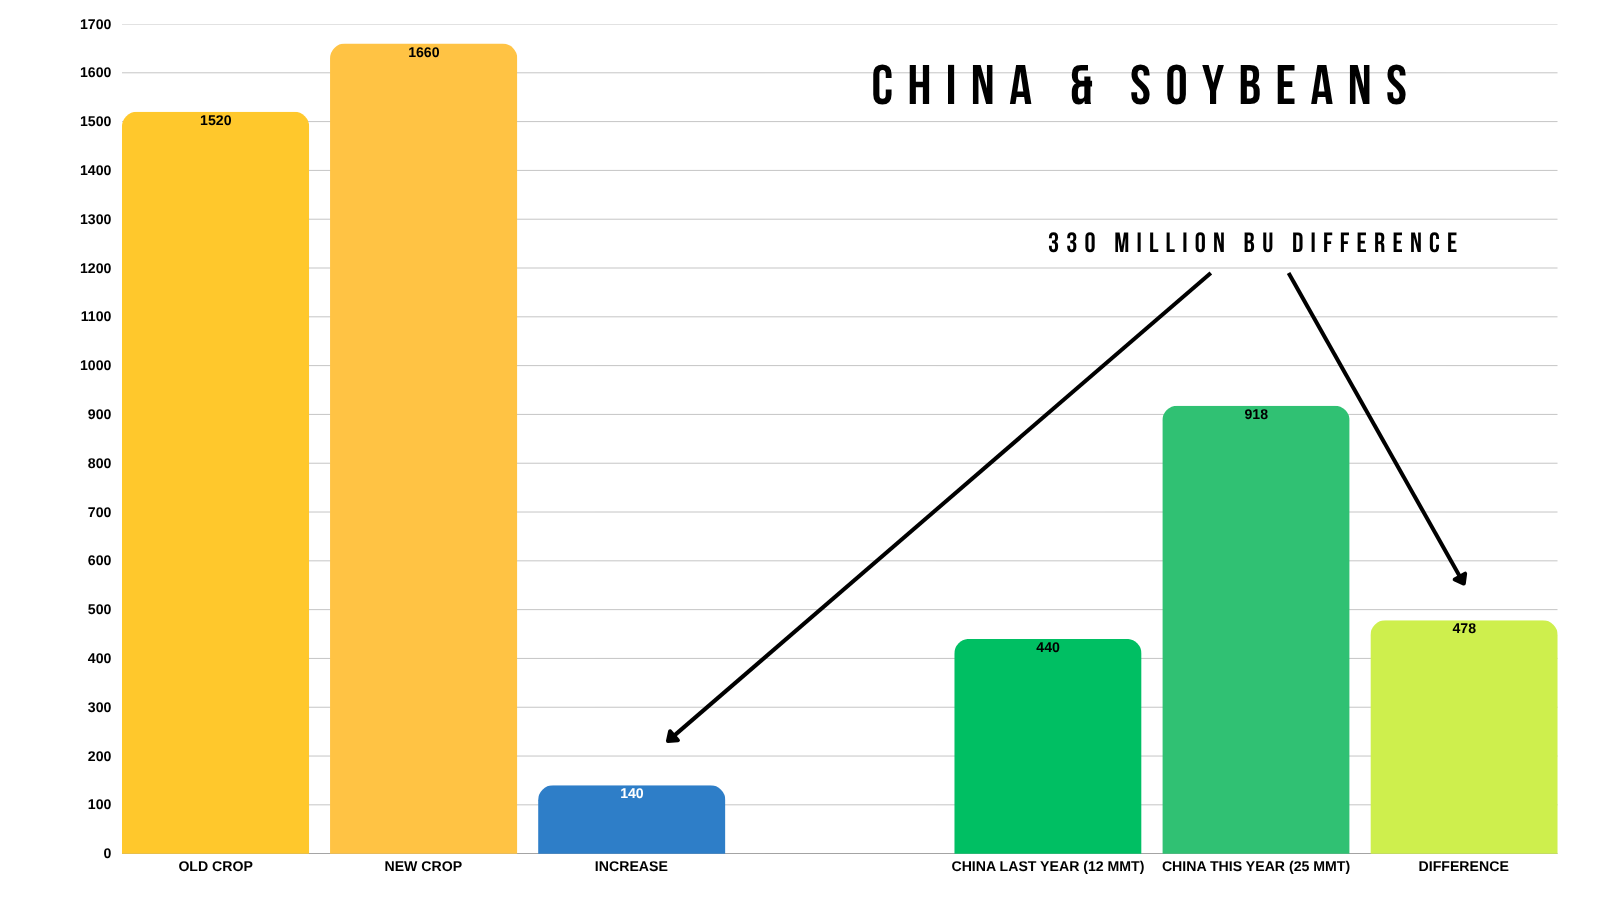
The USDA expects exports to be up just +140 million vs last year.
Yet.. China says they are going to be buying +480 million more than last year.
A massive 340 million difference between the two.
The entire US soybean carryout is 320 million bushels.
So we clearly don’t have the supply to fulfill that goal unless we ration demand to non-China destinations.
Prices likely need to go higher to ration demand.
This is one of the biggest bull arguments for soybeans.
South America is going to be the other big wild card.
If we look at the world situation for soybeans, it's not bearish.
it's actually the tightest it's been in several years.
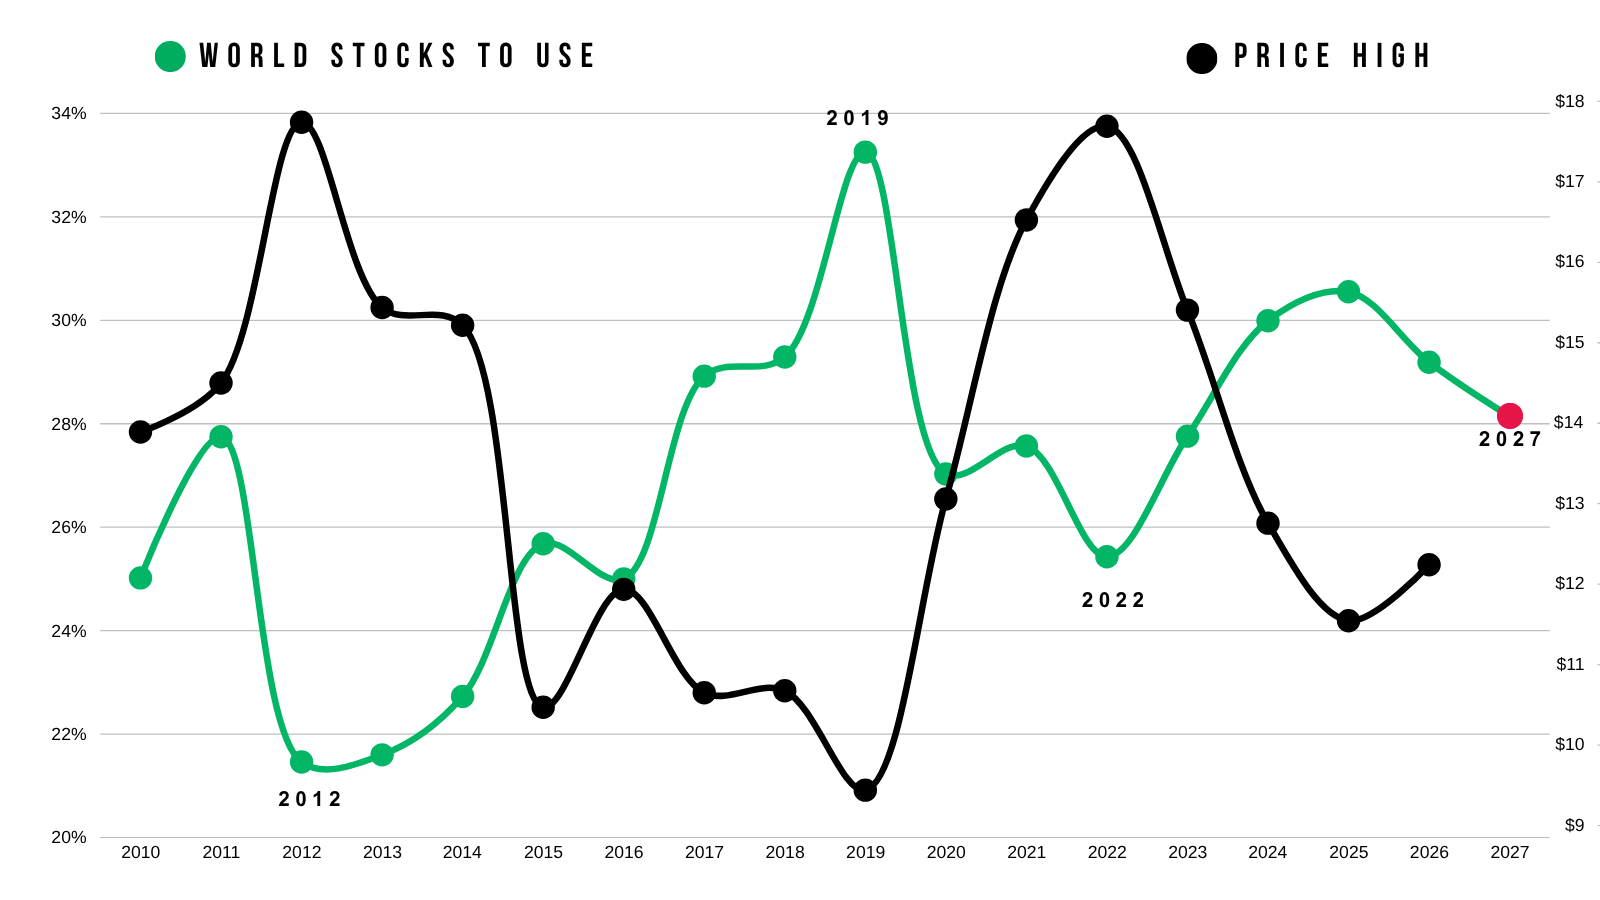
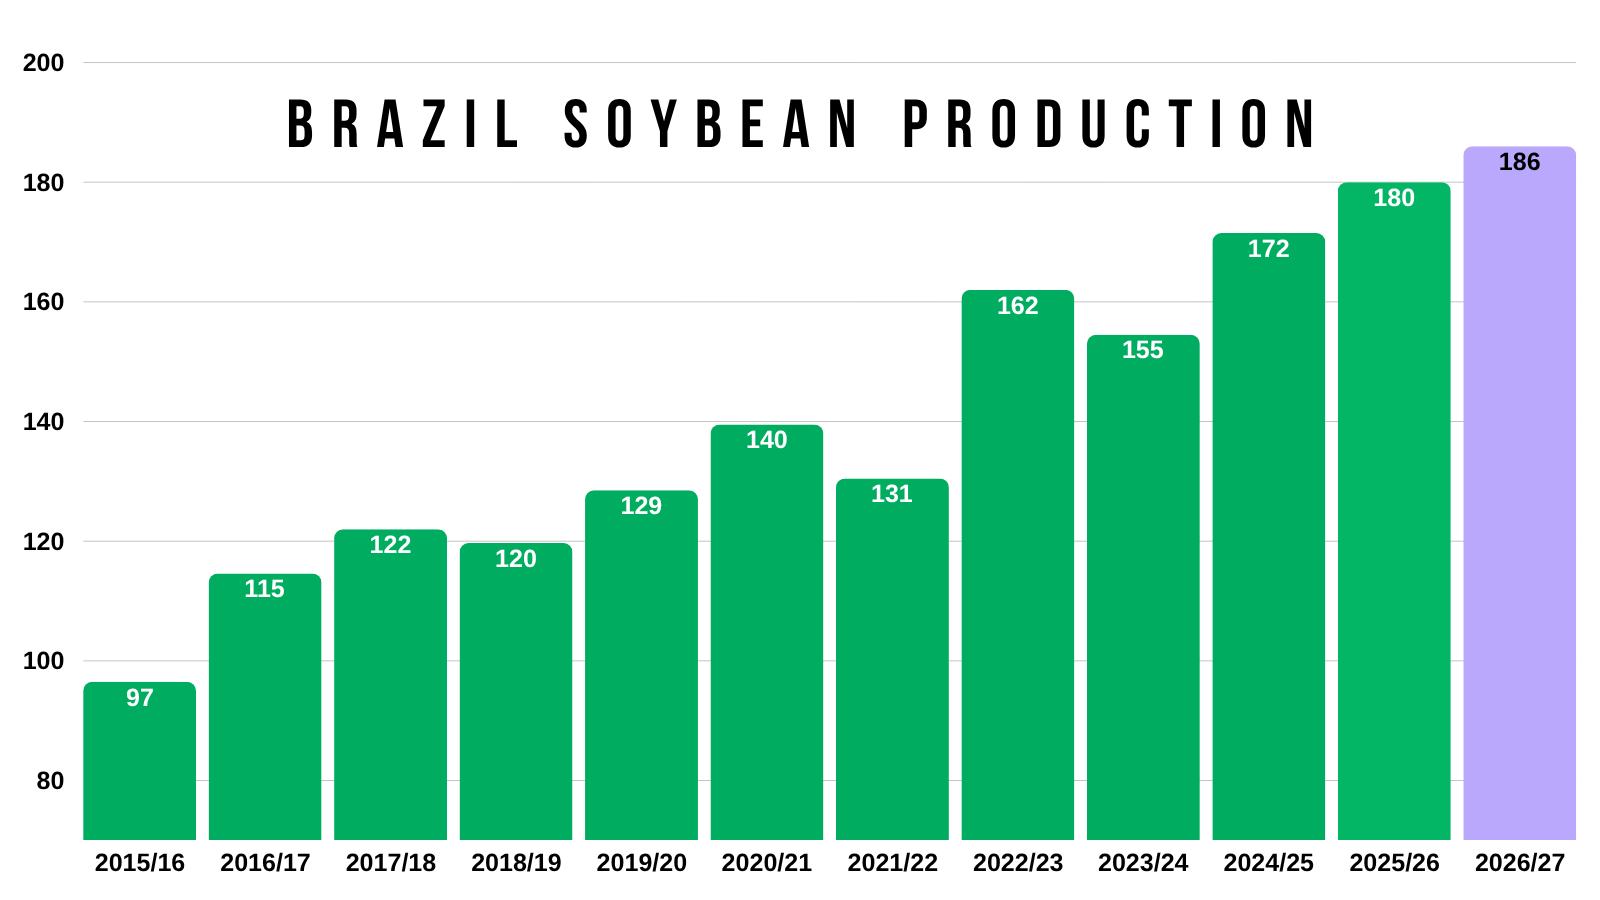
This is with Brazil consistently producing record crop after record crop.
What do you think happens if South America has a hiccup? Things would get awfully interesting for the soybean market.
The world's largest producer continues to put out record crops, yet the global situation continues to get tighter. Because demand is that strong.
I'm no weather guru.
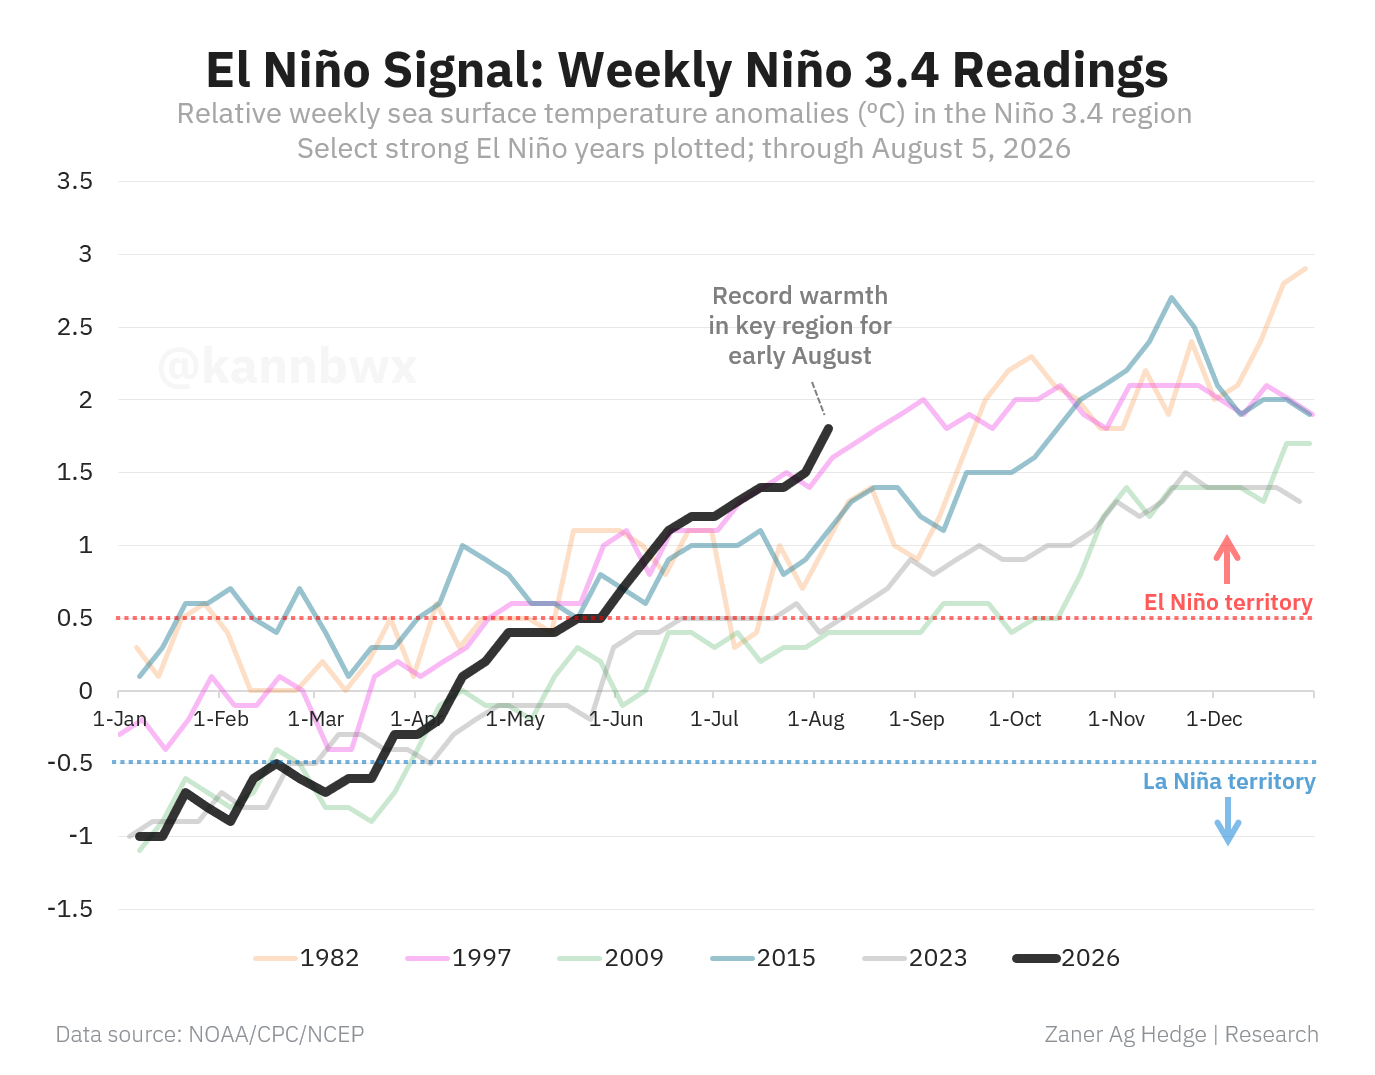
But right now they are saying that this current Super El Niño is the strongest of all-time.
Here's a nice chart from Karen Braun (@kannbwx on X).
This shows the sea surface temperature anomalies.
It's sitting at its warmest levels ever for this time of year.
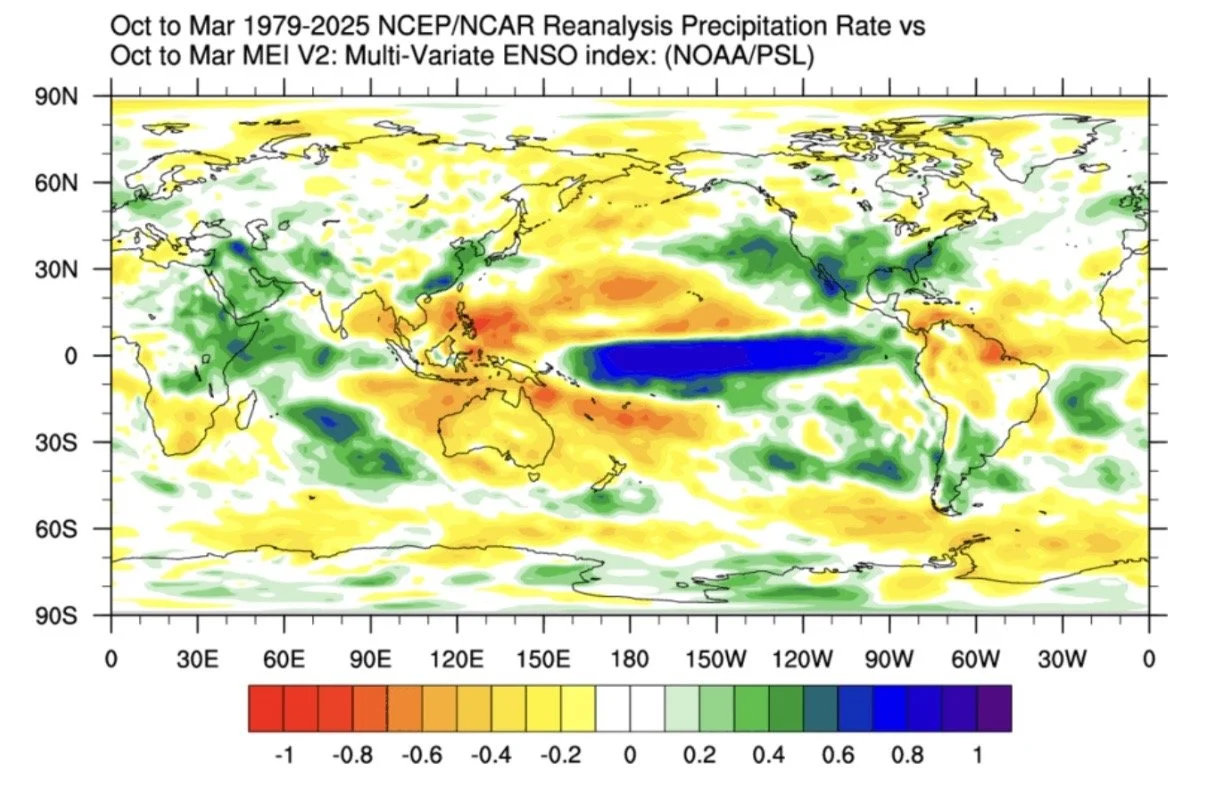
If we look at how El Niño is expected to affect the world globally.
This map shows how El Niño has historically impacted rainfall from October to March.
It's supposed to lead to dry conditions down in Brazil.
Their weather season starts here soon, in a month or two.
Nov Beans Chart:
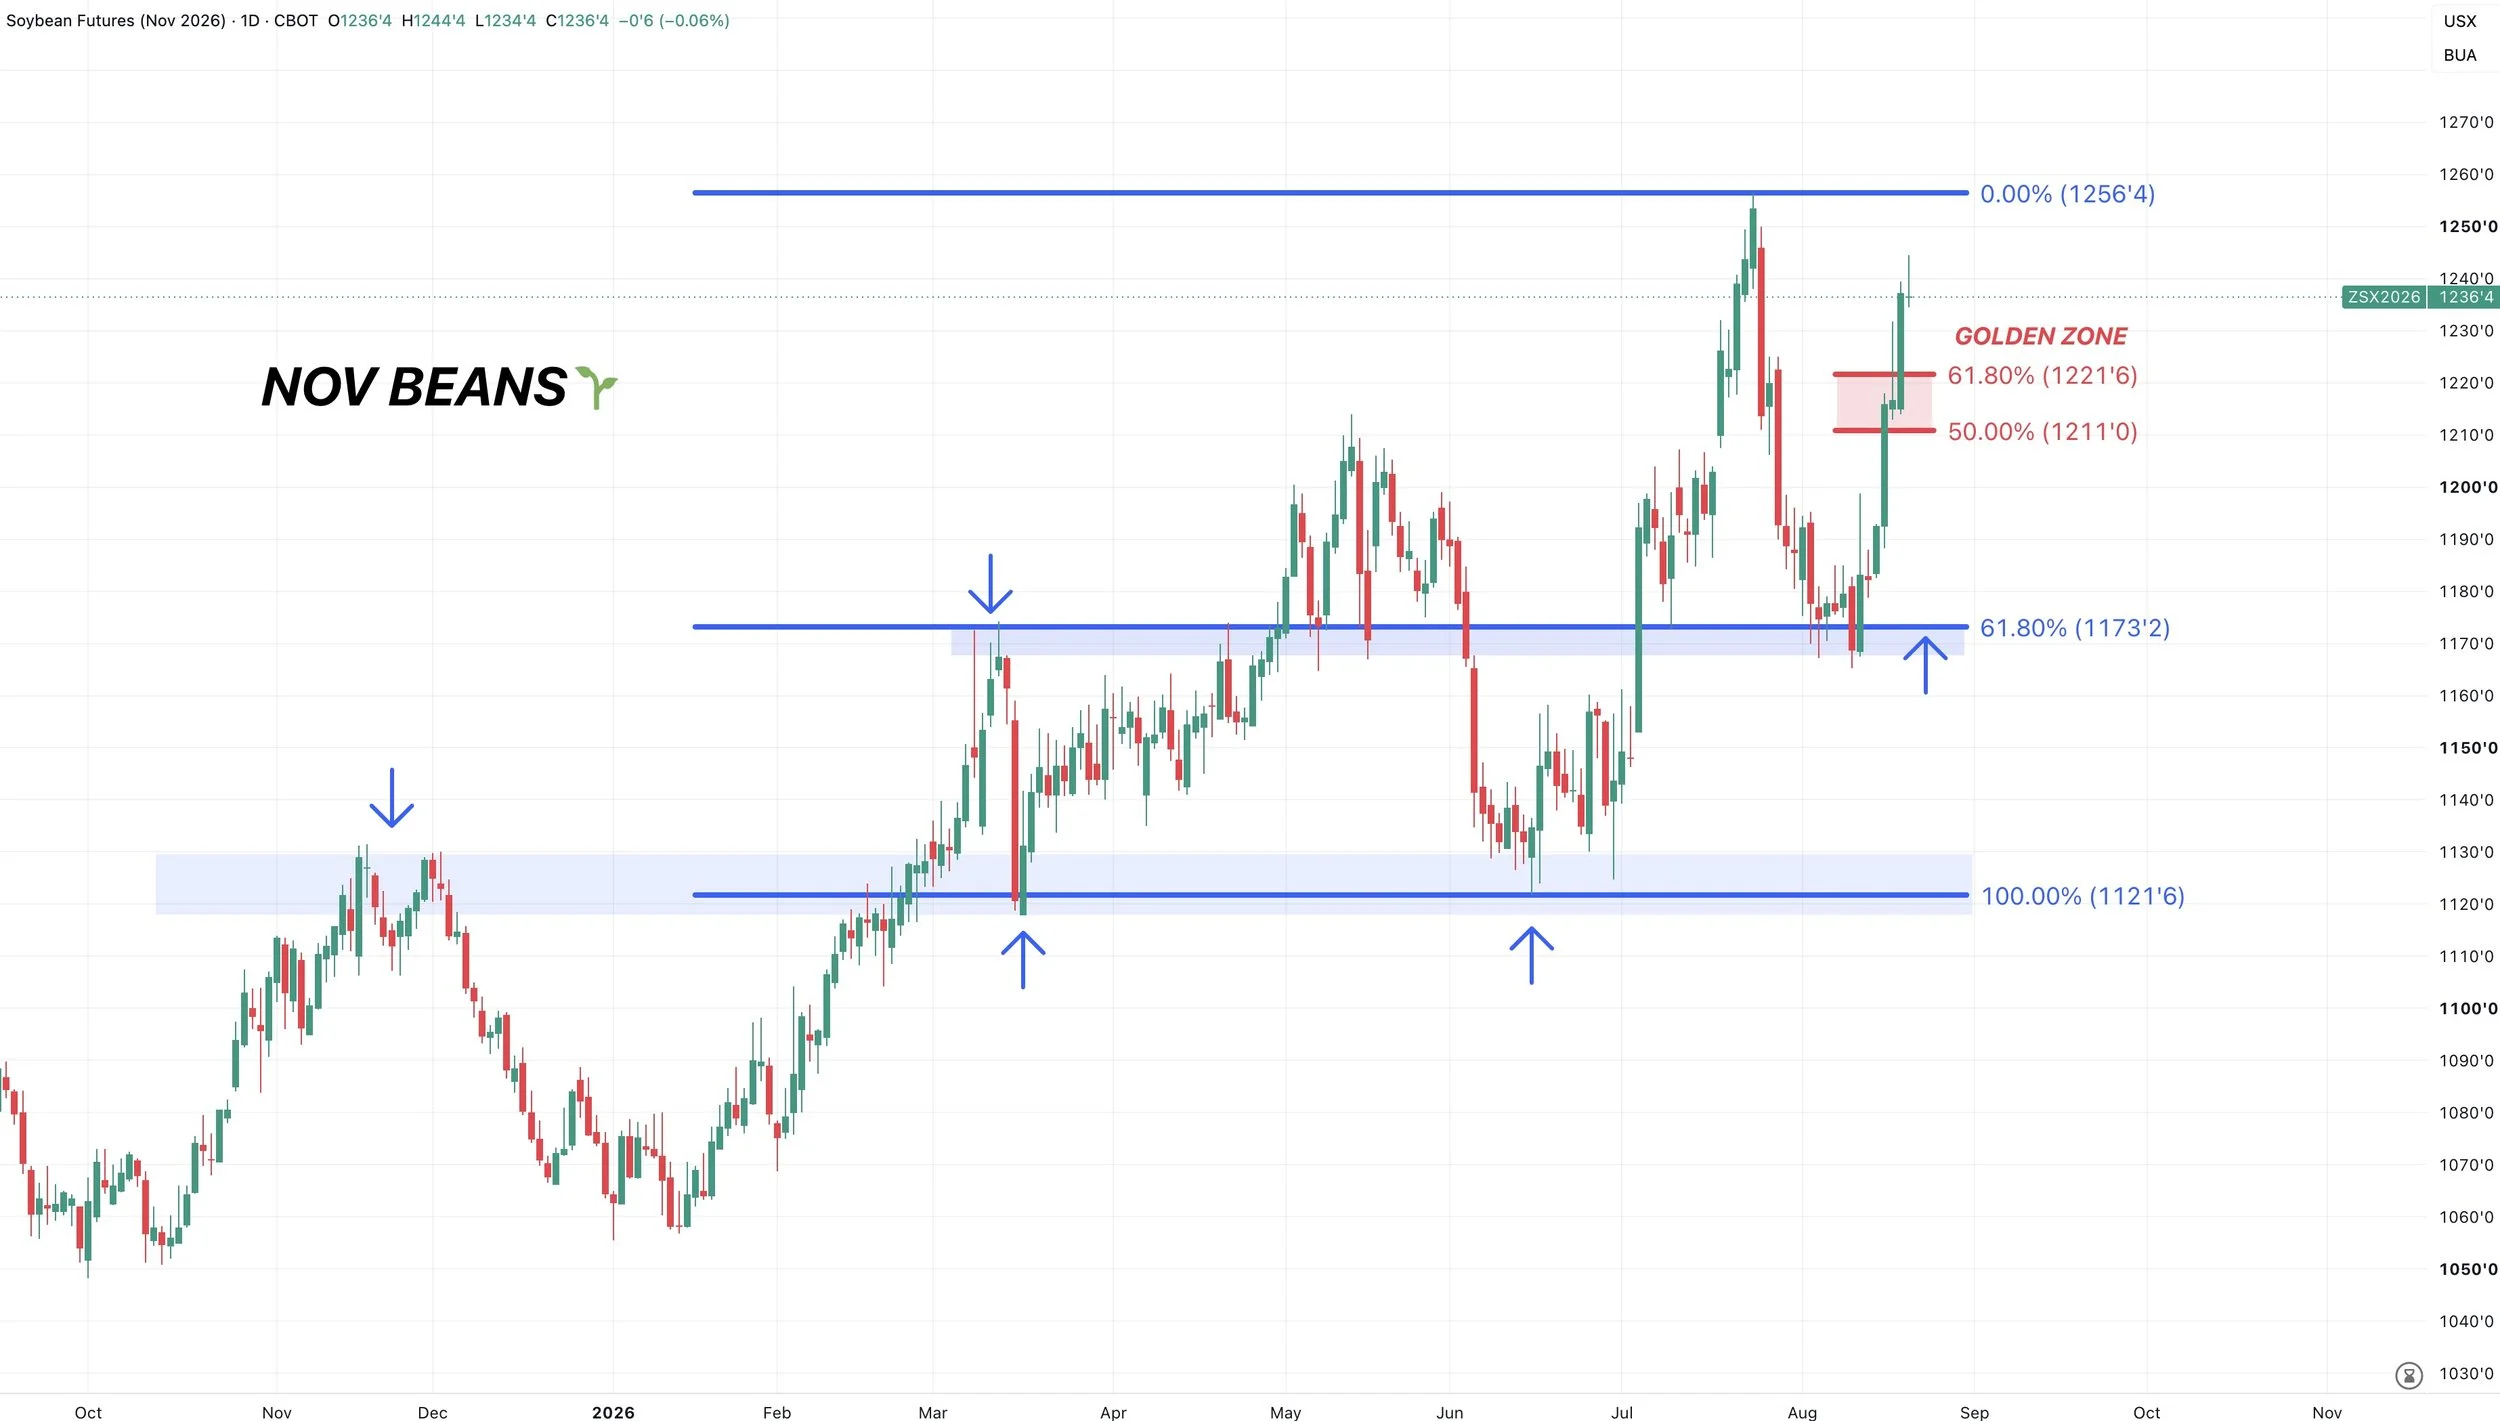
We've seen a great rally off that key support and buy zone.
Now to the upside, we broke above that golden zone. Which suggests this is not just a relief rally and that amplifies the odds of us holding those recent lows.
The first big level is of course going to be those recent $12.55 highs, which we are within striking distance of.
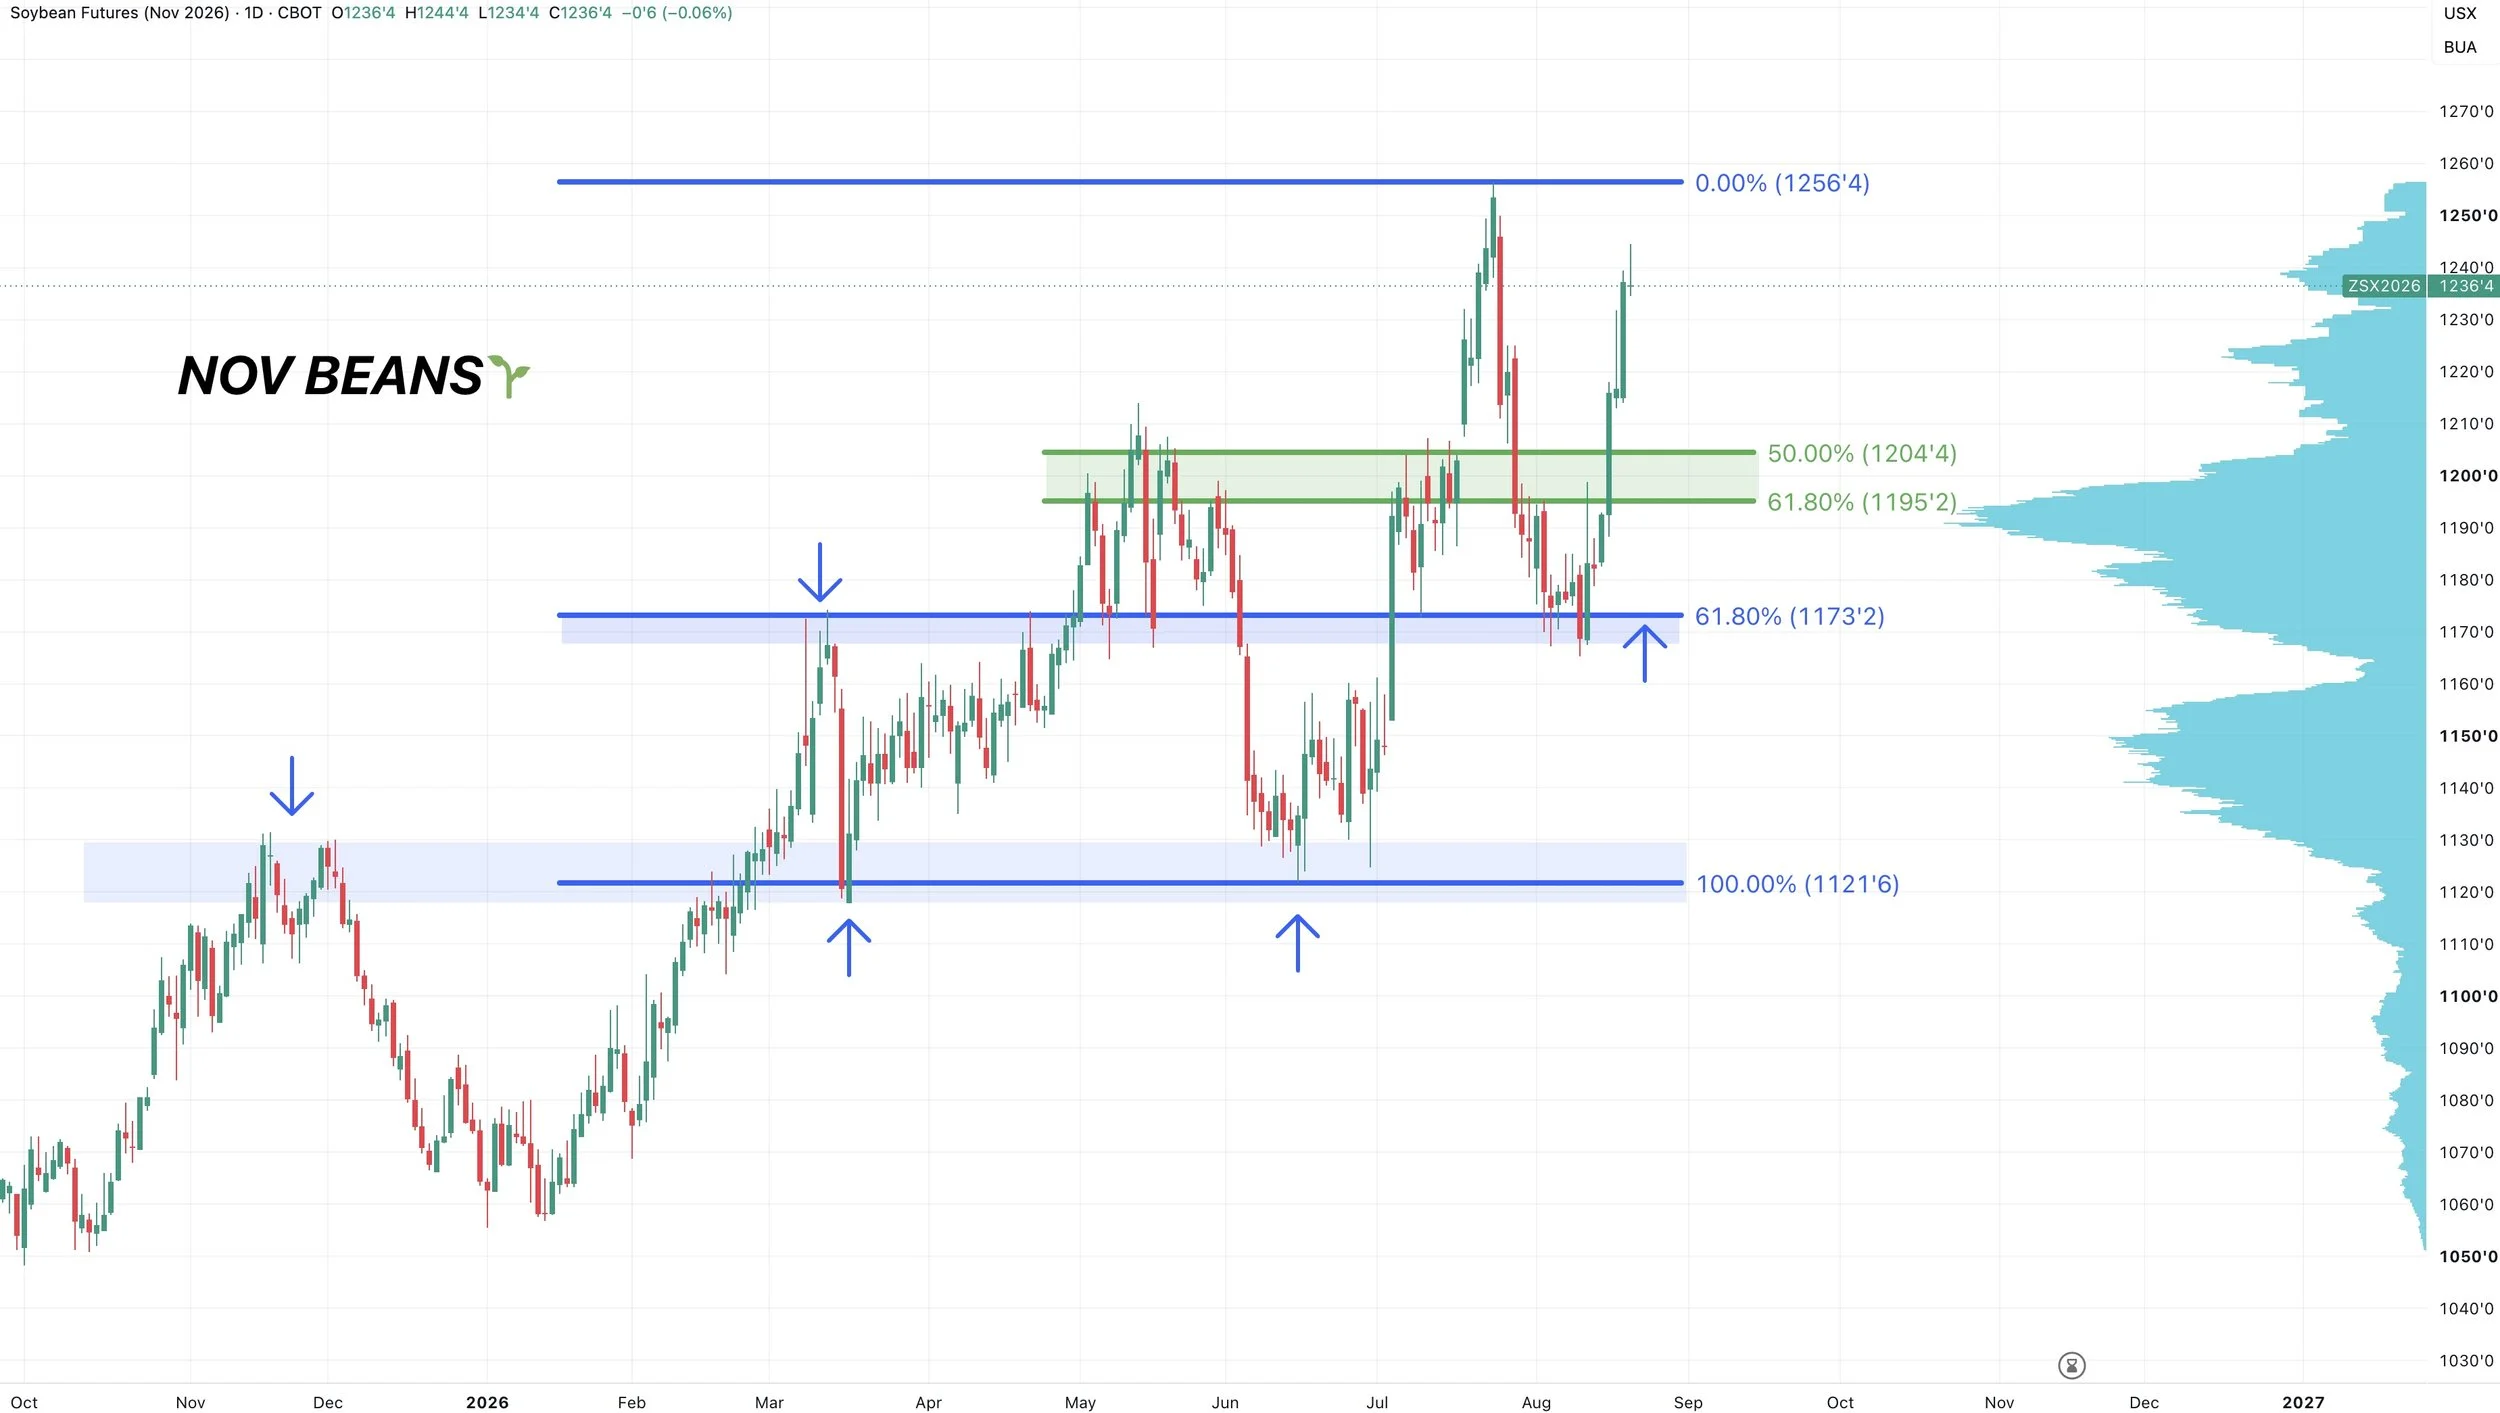
If we get a sizeable pullback, the levels I am currently watching are $11.95 to $12.05 if they come.
That would be the golden zone just above peak volume.
It's also the highs from May.
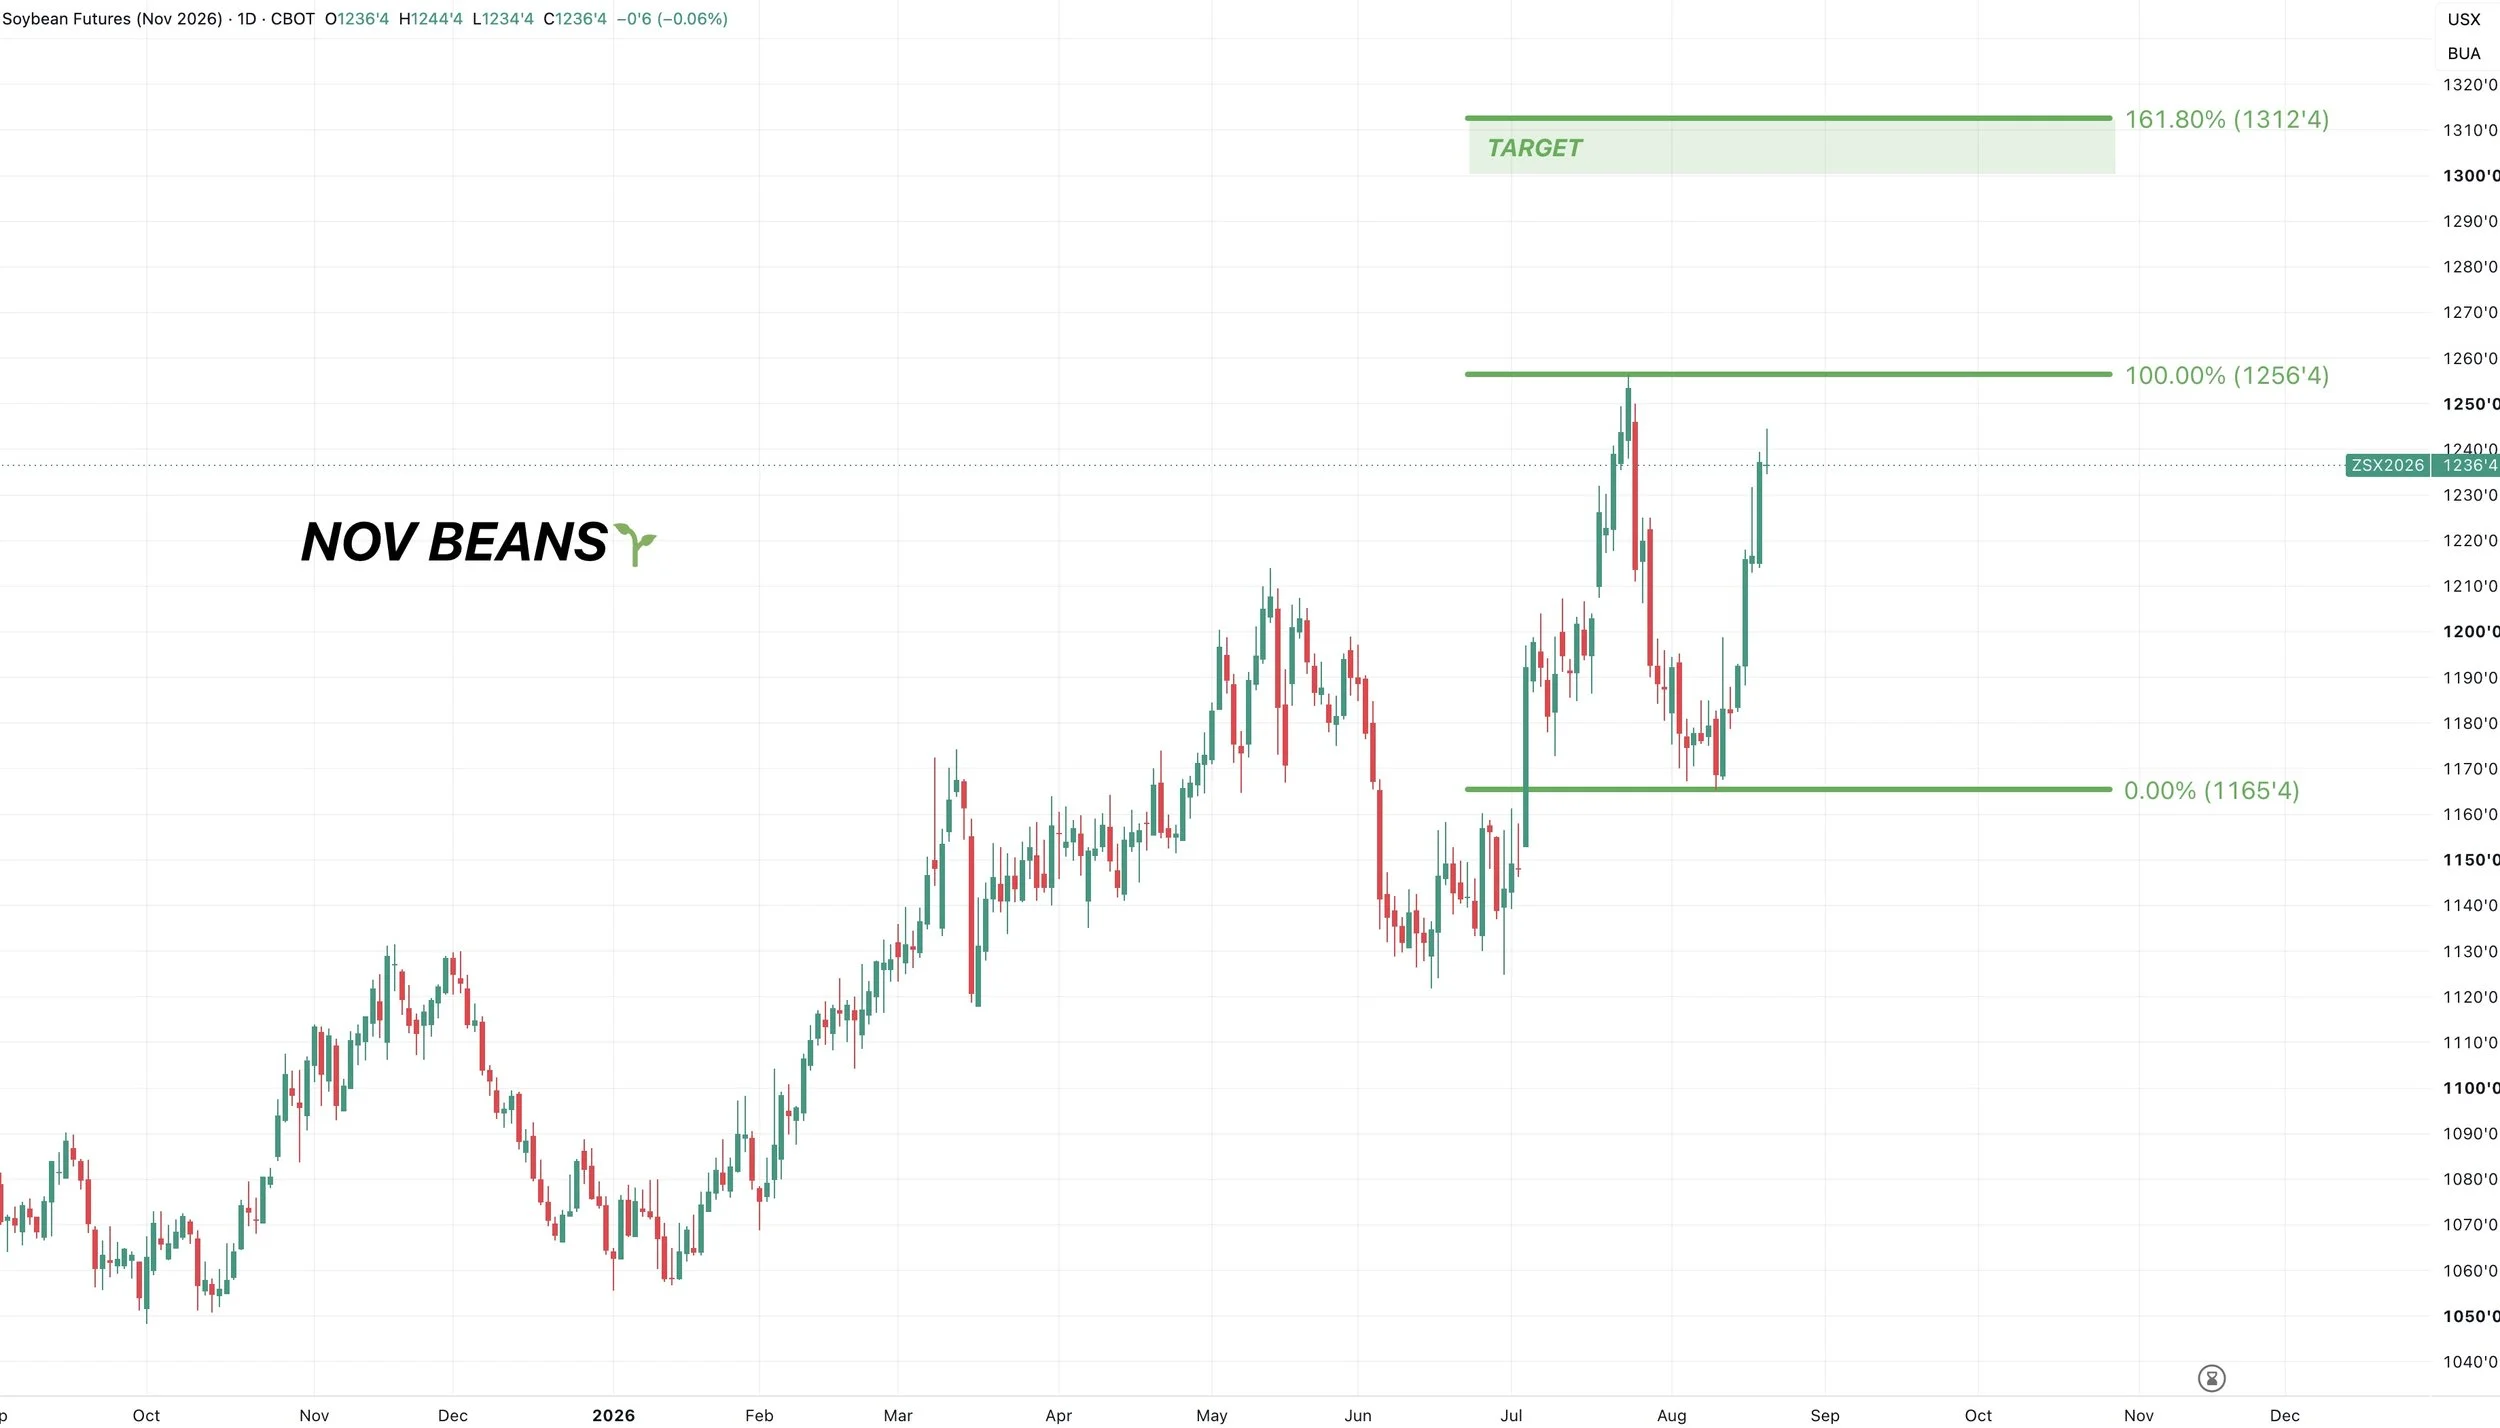
If we break above the recent highs, the next area I am looking to de-risk at is going to be around $13.00
$13.12 is the 161.8% level and golden fib from the recent lows up to those July highs.
Overall I like staying plenty patient in soybean marketing if you're at a comfortable spot and or rewarded those July highs when we talked about taking risk off the table.
Like in corn, we do not want to be oversold simply due to the potential.
Continuous Front Month Chart:
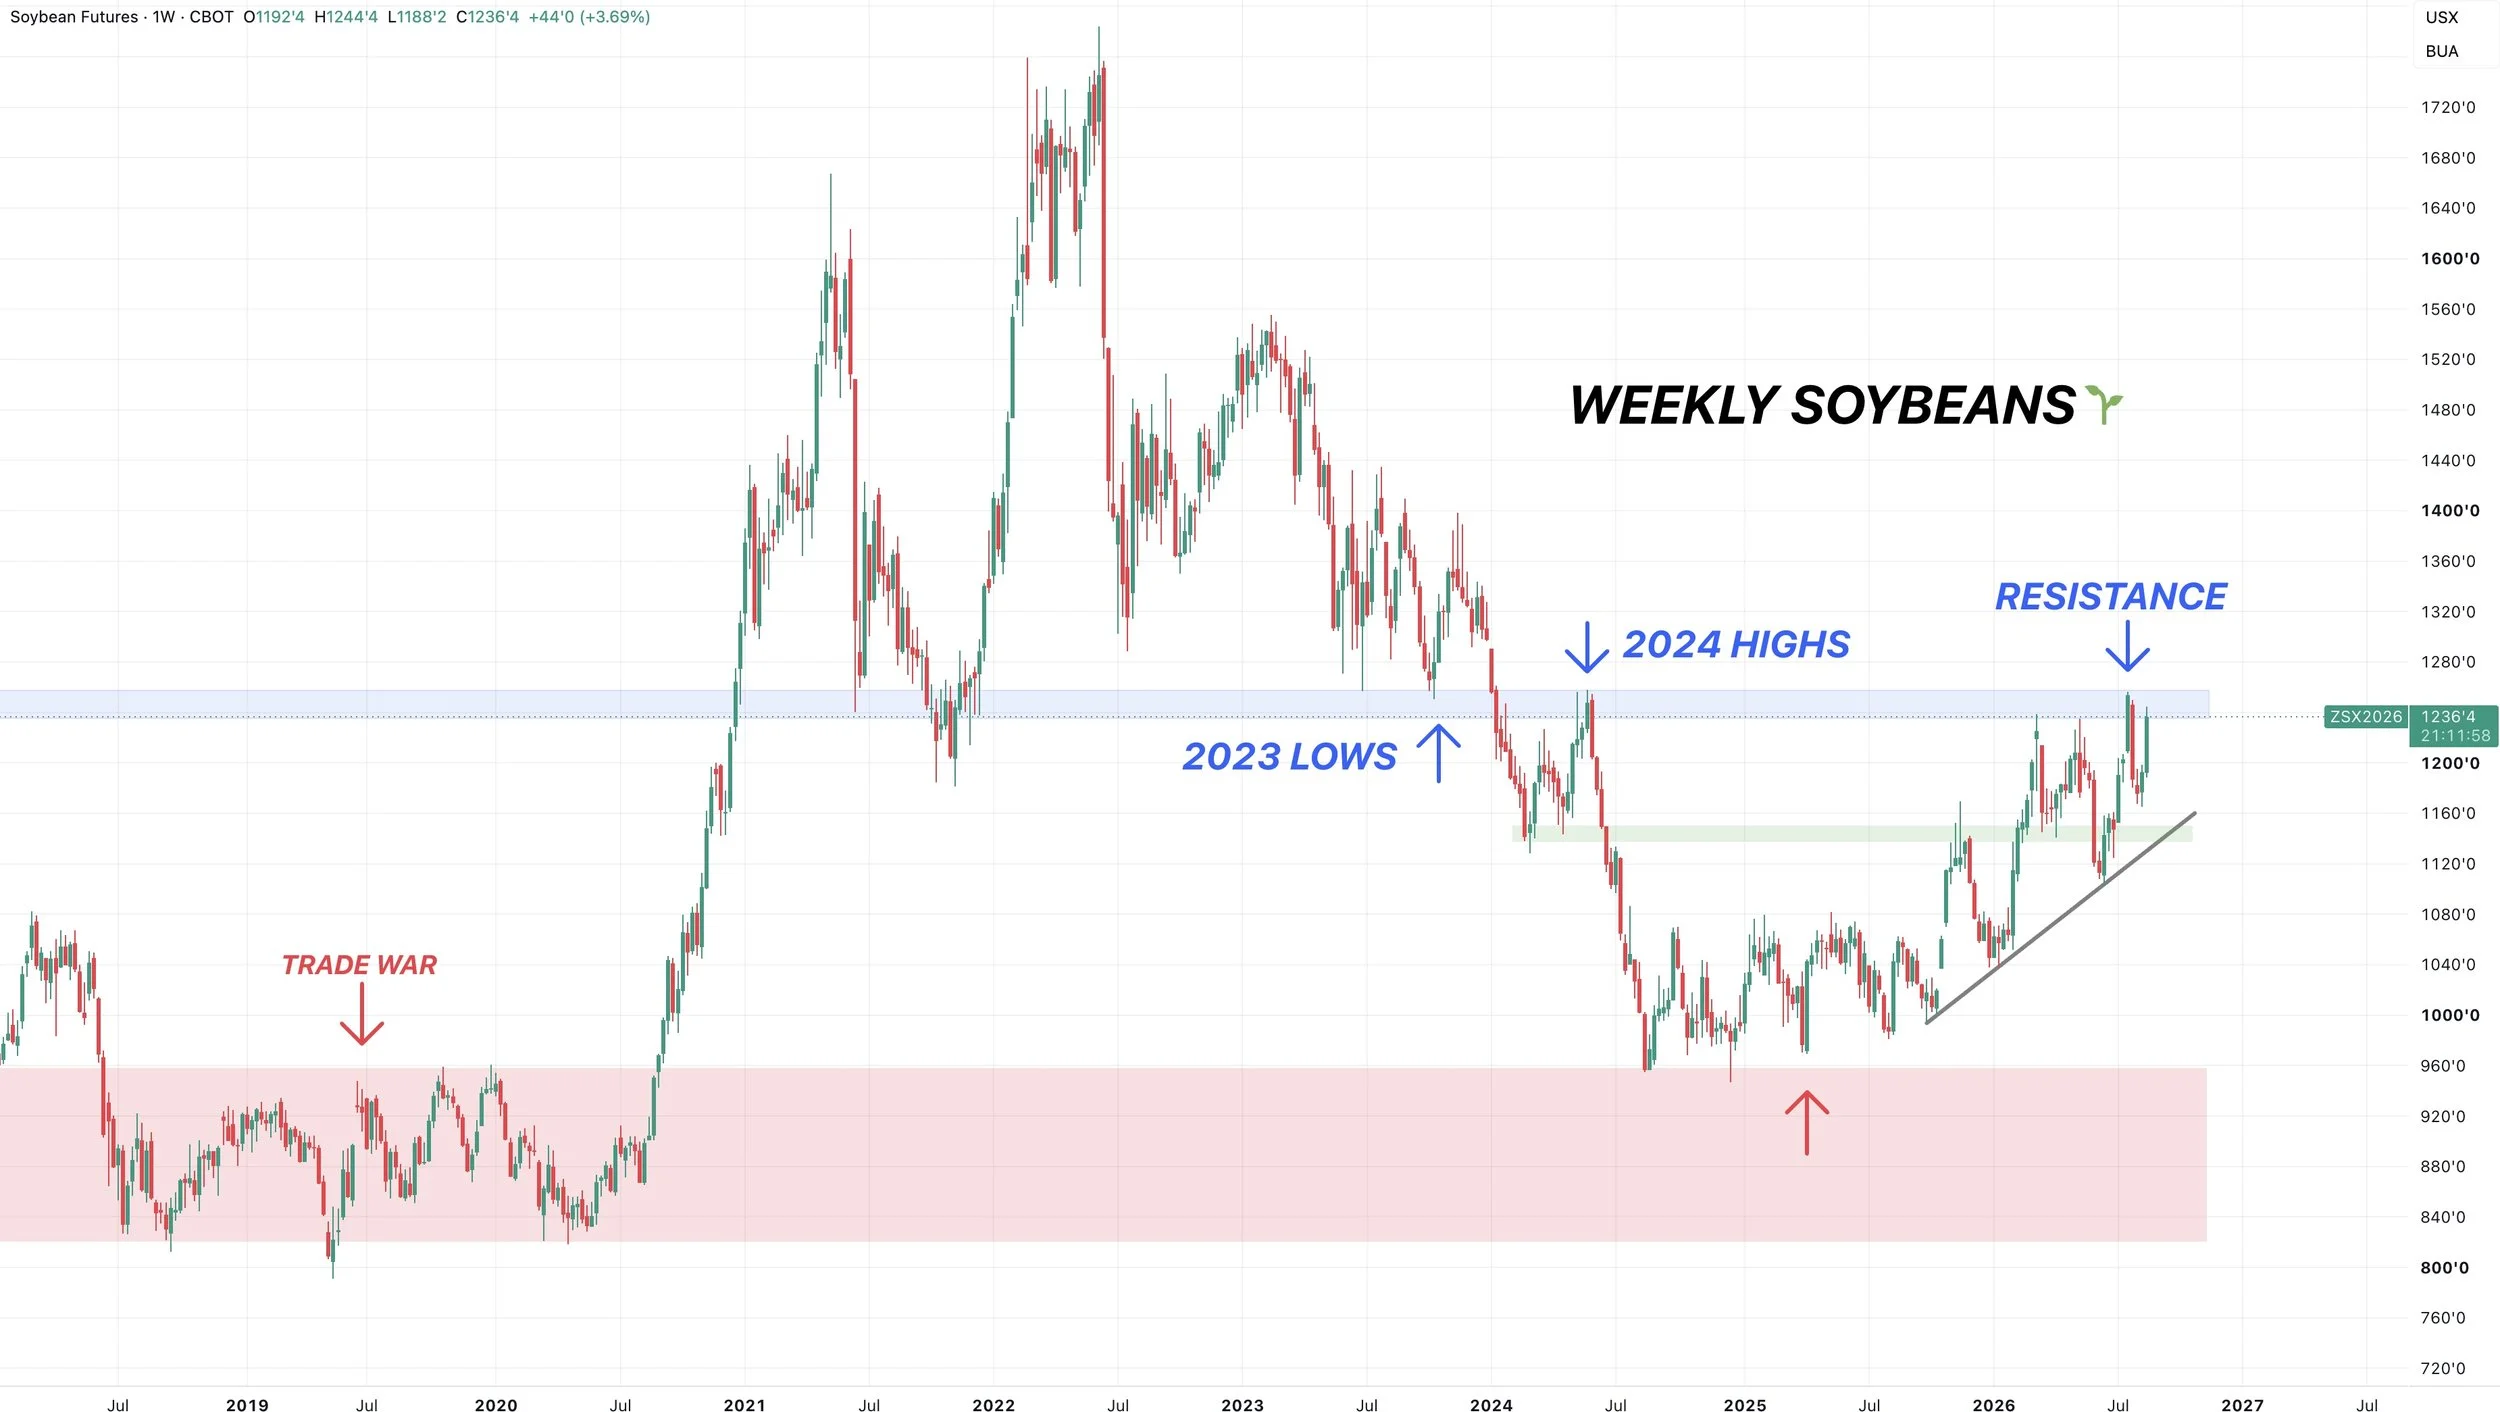
If we look at this chart, $12.50 is a major level.
It's right where we recently failed.
It's the highs from 2024.
It's the lows from 2023.
So a clear area of key resistance. If we break above it should result in further upside.
There is still an unfilled gap right around $13.00 as well.
The long term structure in soybeans remains pretty bullish purely looking at the chart.
Wheat
Dec KC Wheat Chart:
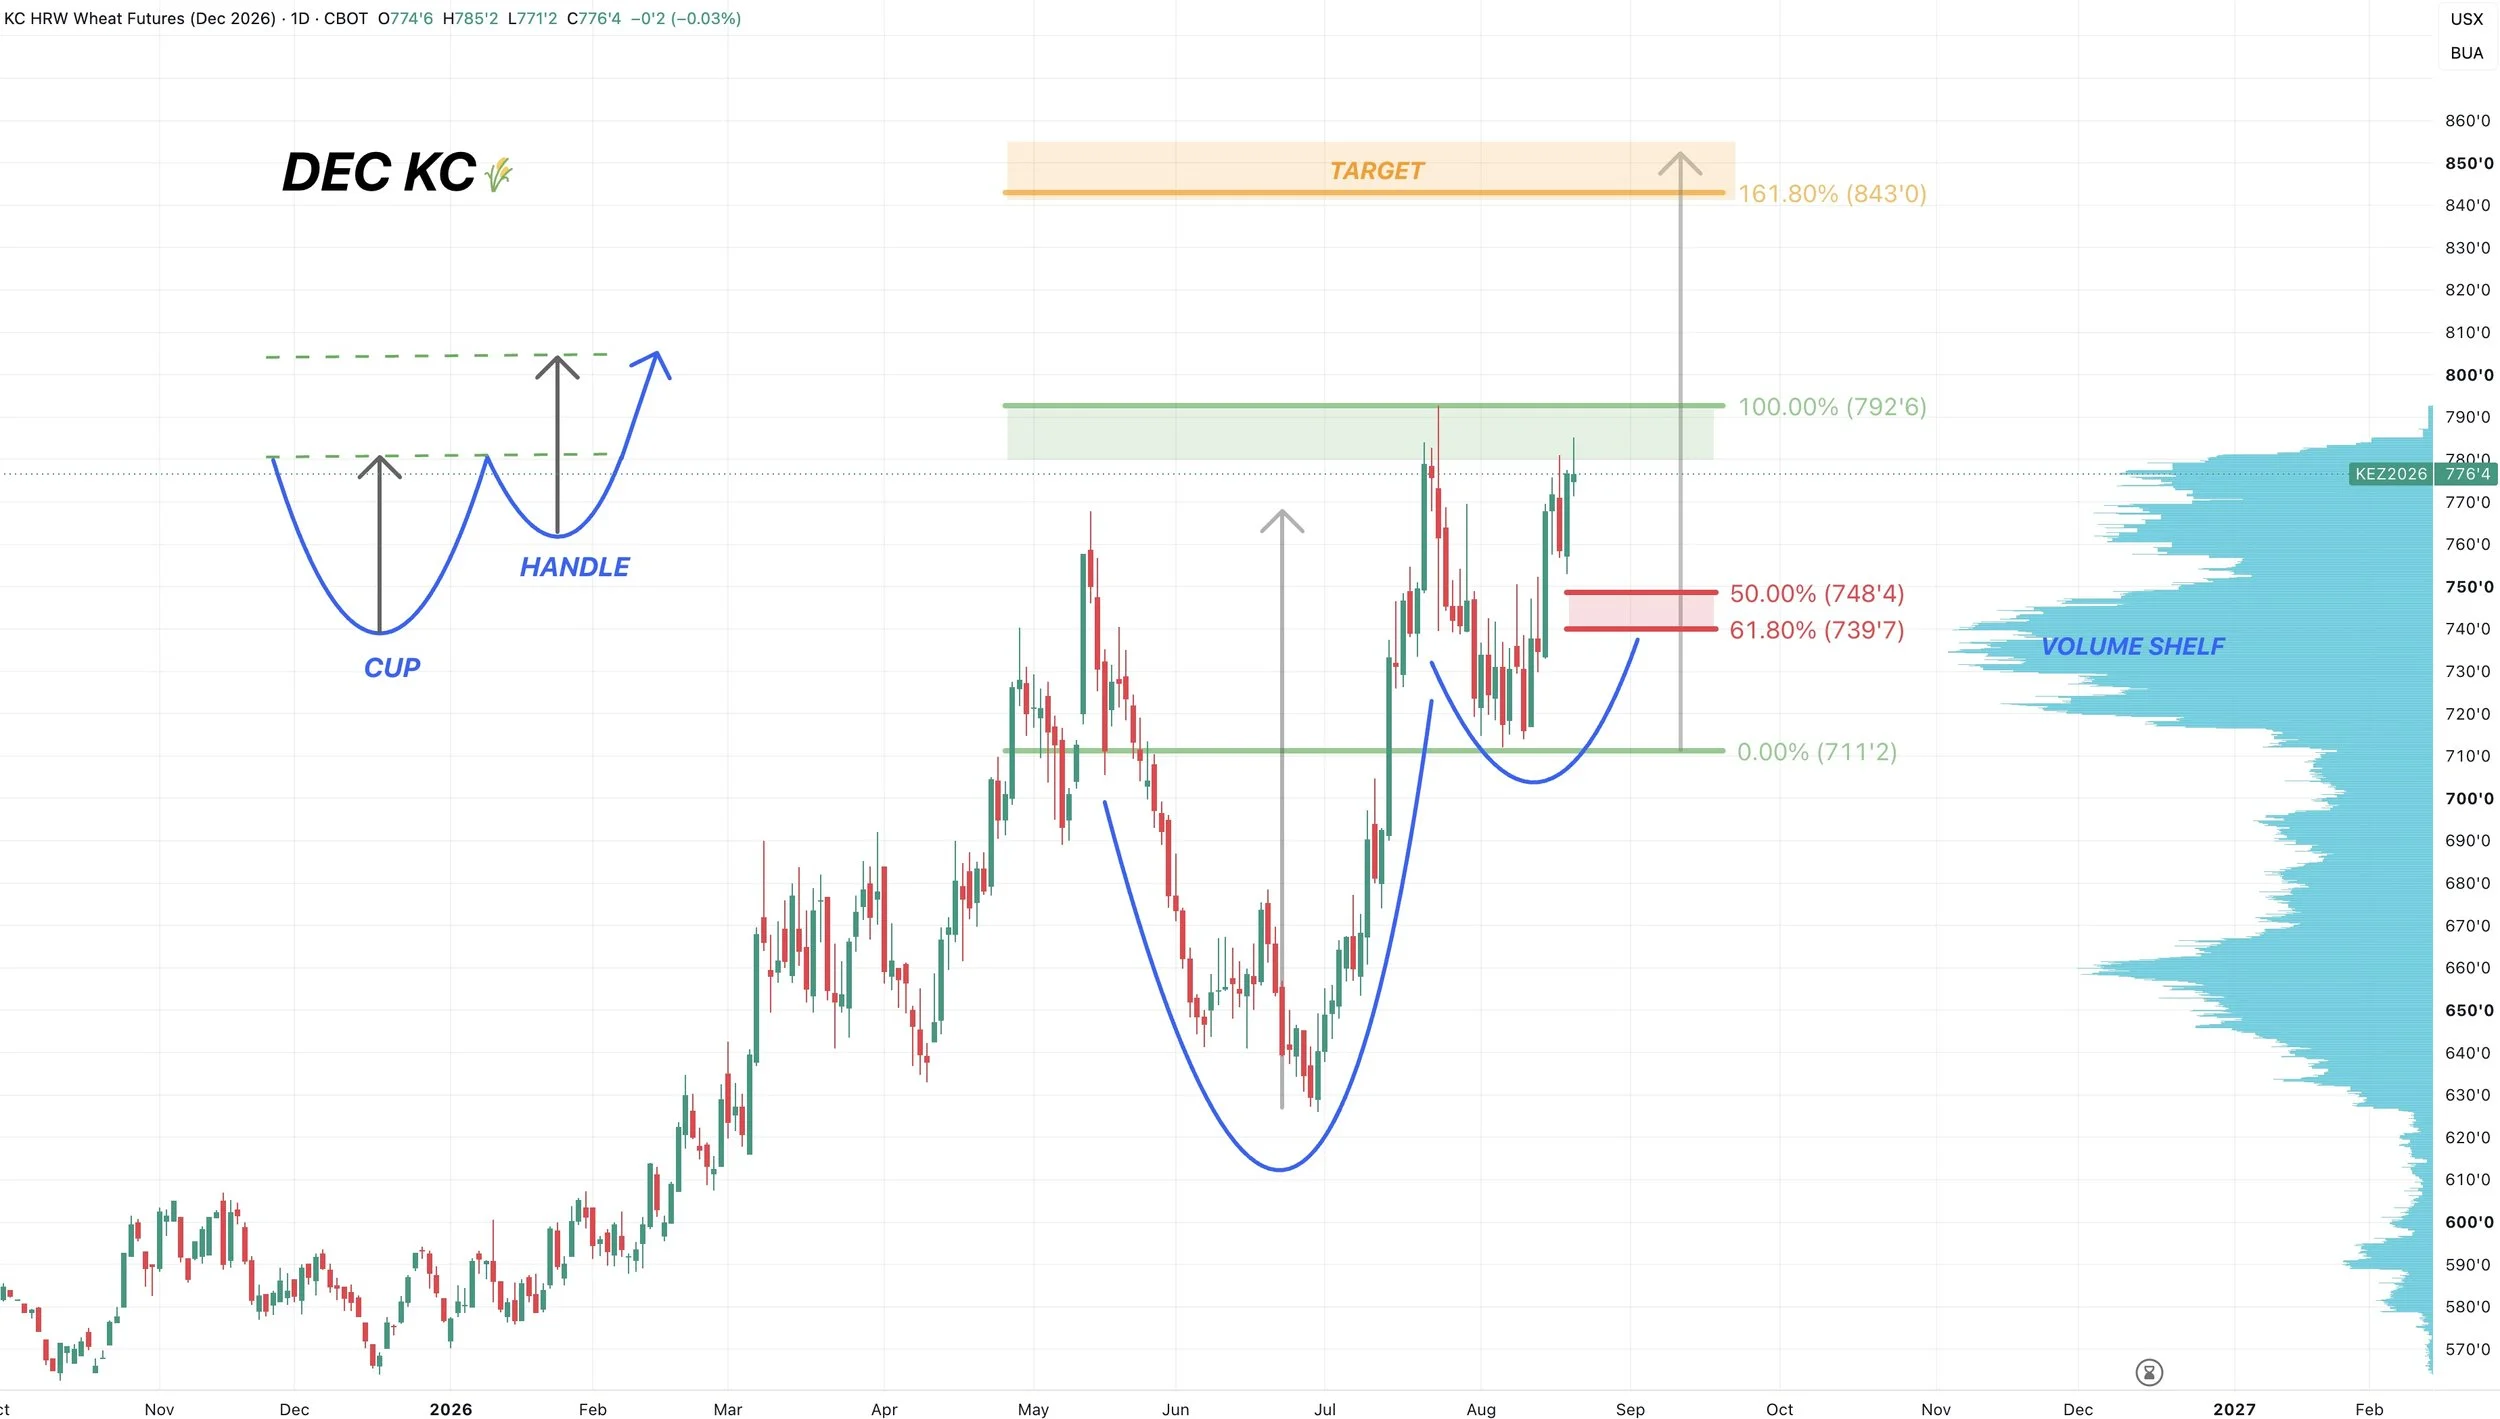
Currently battling those July highs.
If we happened to get a decent pullback here, the area I'd look for a bounce is $7.40 to $7.48.
Which is the golden zone and peak volume.
On the other hand, if we can bust above these July highs I have a target of $8.40 to $8.50
Which would be the implied move from this cup and handle pattern we are sitting in.
It would also be the 161.8% move from the recent lows up to the July highs.
Weekly KC:
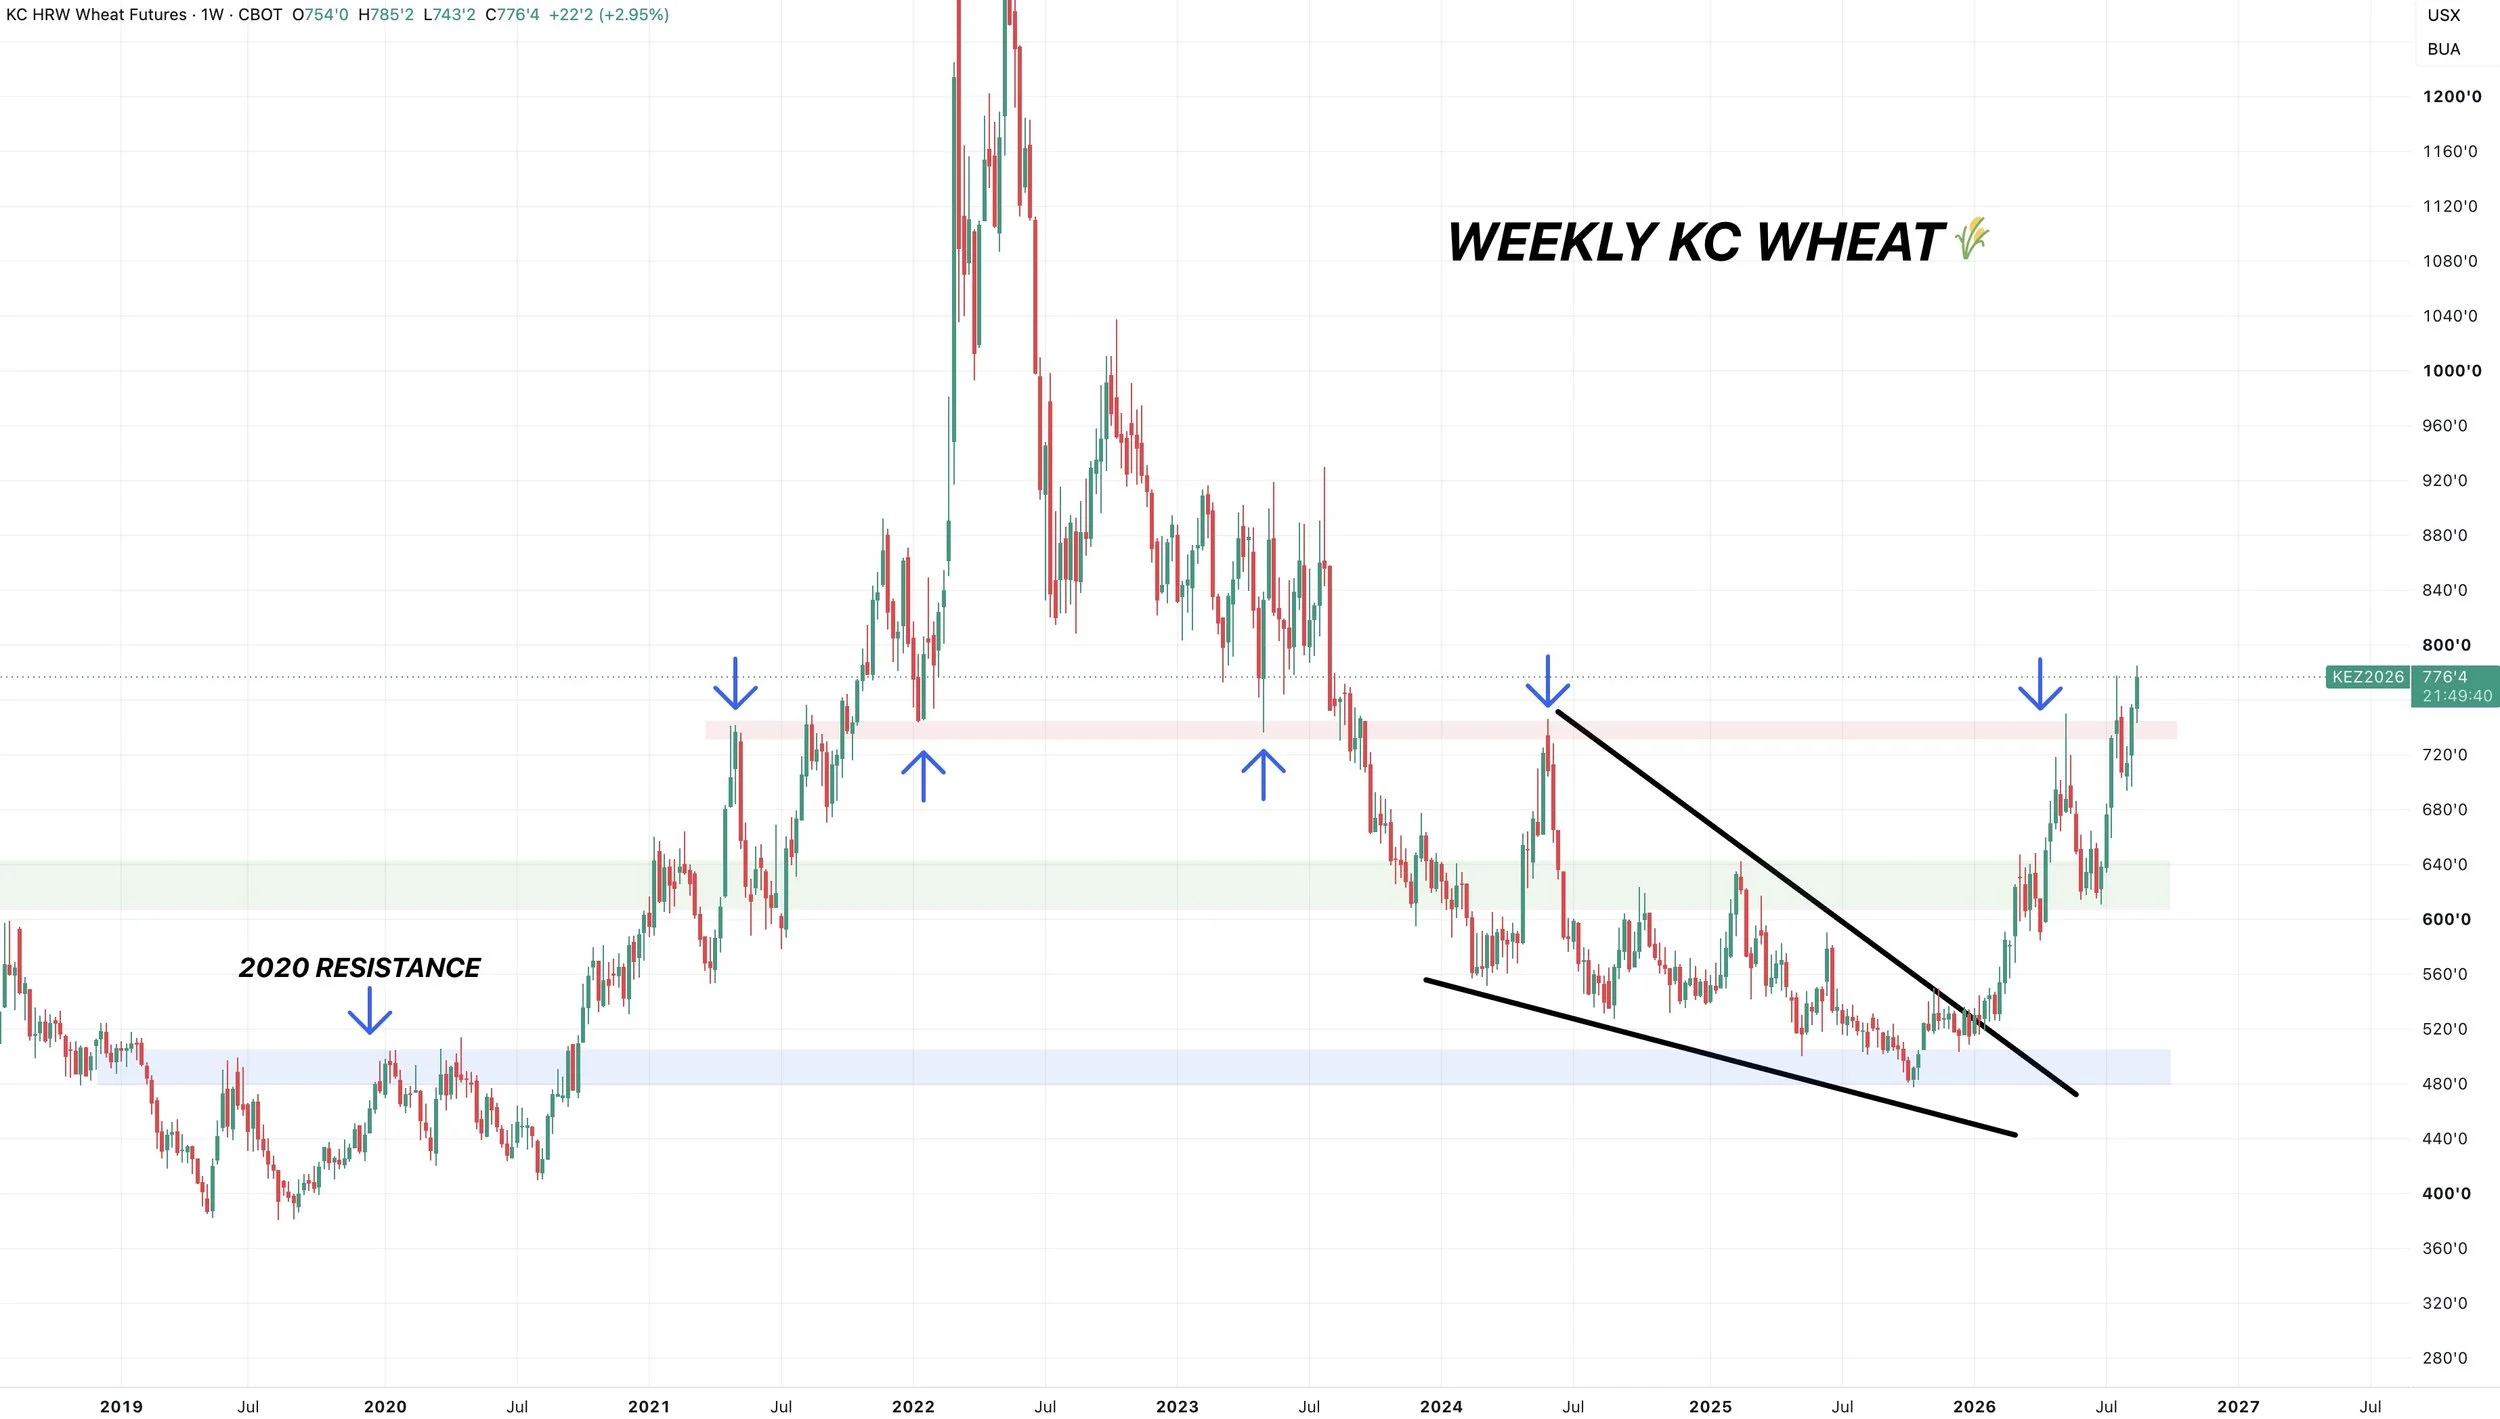
The weekly chart looks great.
It appears that we are finally breaking above that major $7.50 resistance on the continuous chart.
That level marked the recent highs.
It was the highs from May earlier this year.
It was the highs from 2024.
It was the lows from both 2023 and 2022.
Lastly, it was the highs from 2021.
So it's been a very clear area of support and resistance countless times.
Breaking above this could very well lead to further upside.
MPLS Wheat:
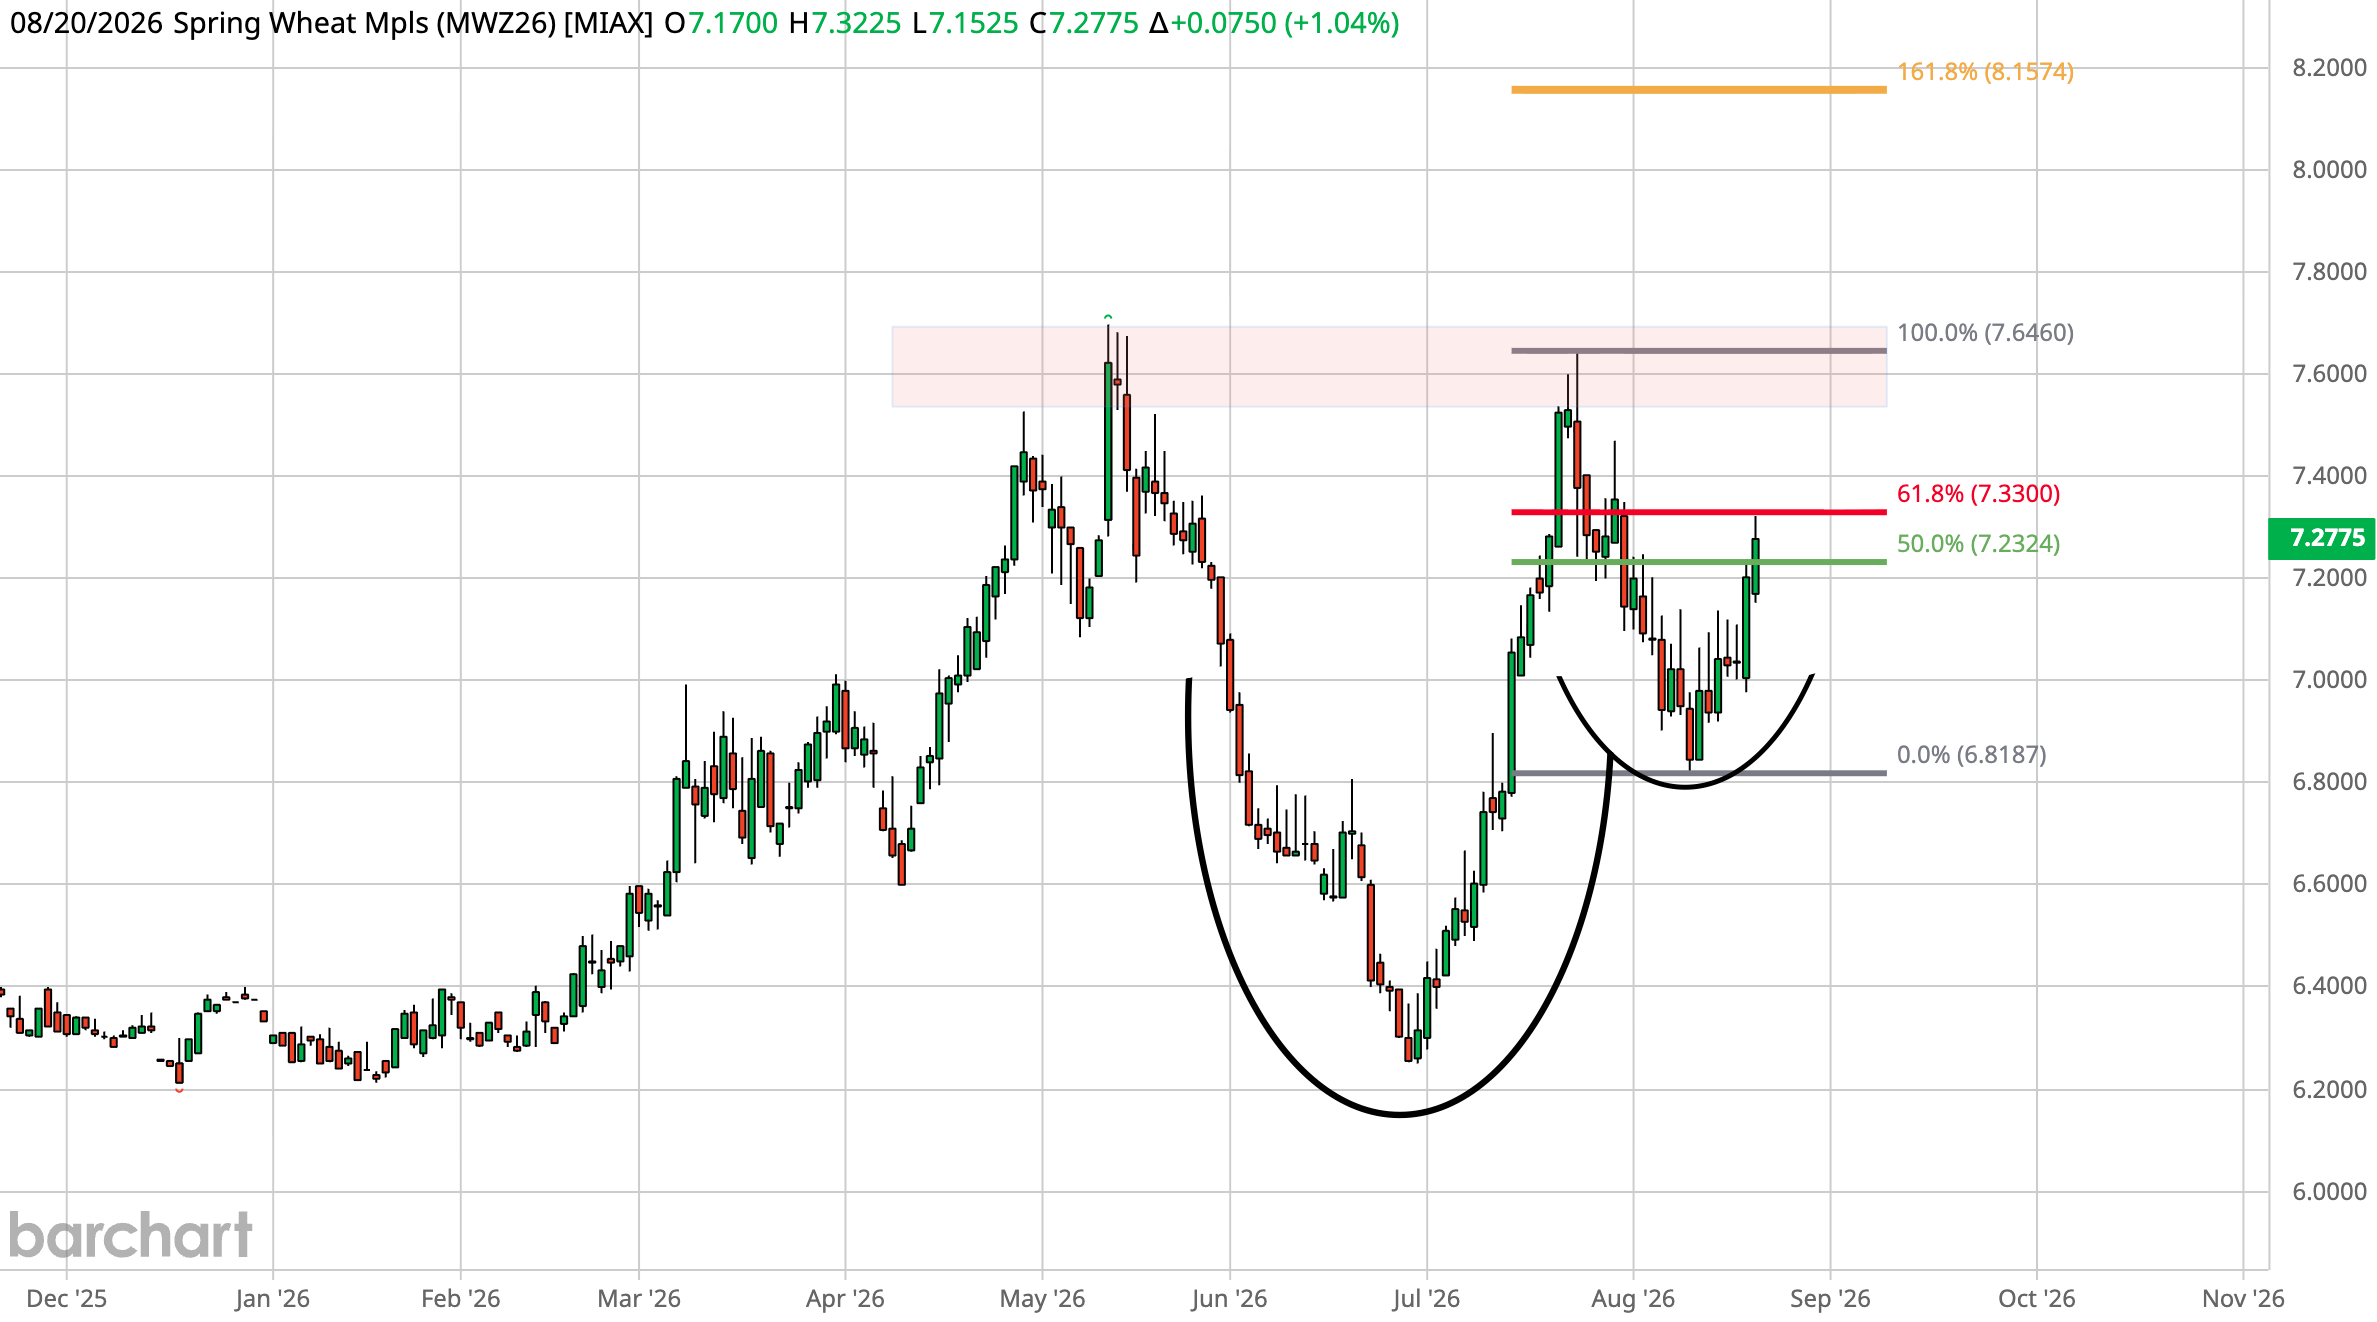
We've clawed back exactly 61.8% of the sell off. This is an important level.
If we can break above this level, could run towards the highs.
We are sitting in a cup and handle pattern just like the rest of the wheat complex.
If we break above the highs, the golden fib sits at $8.15
(Sorry for the different chart. My usual software I use for charting doesn’t include MPLS wheat)
Cattle
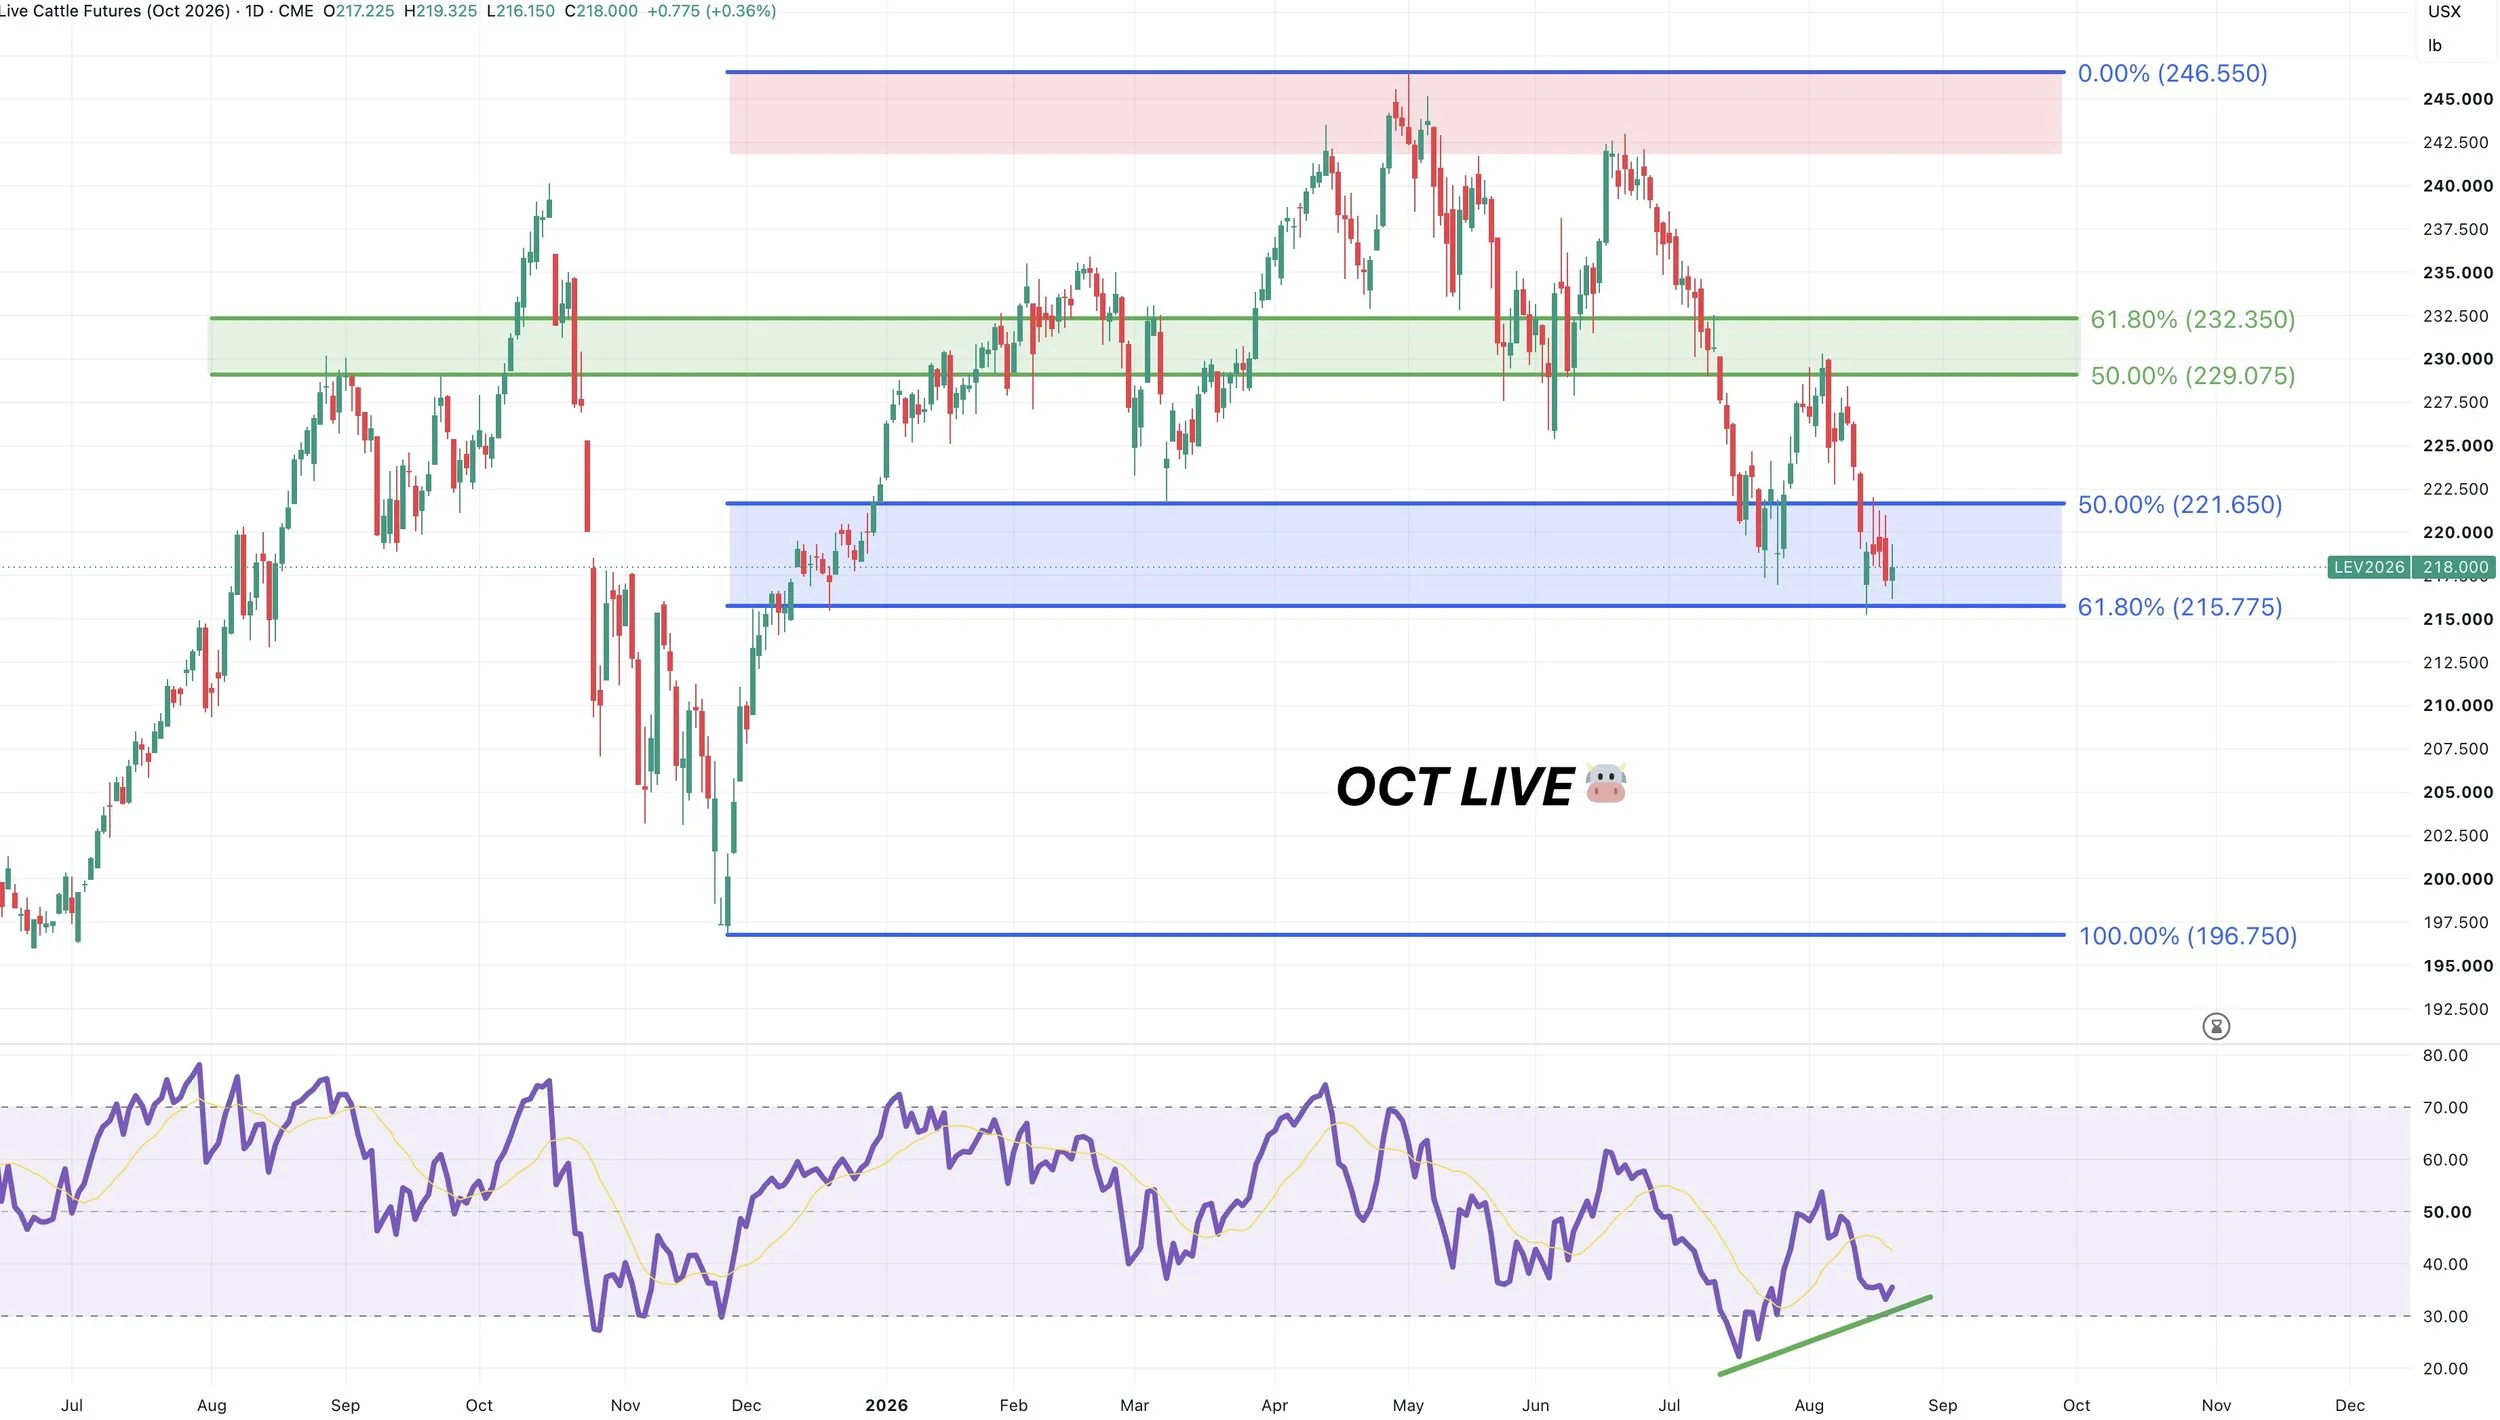
Oct Live Chart:
Still trying to cling on to must hold support here.
The 61.8% retracement down to the November lows.
If we lose this level, it could very easily open the door to get another leg lower.
We are showing some bullish divergence on the RSI still. Prices made new lows. Yet the RSI did not.
So that could be a potential sign we're losing some downside momentum here for now.
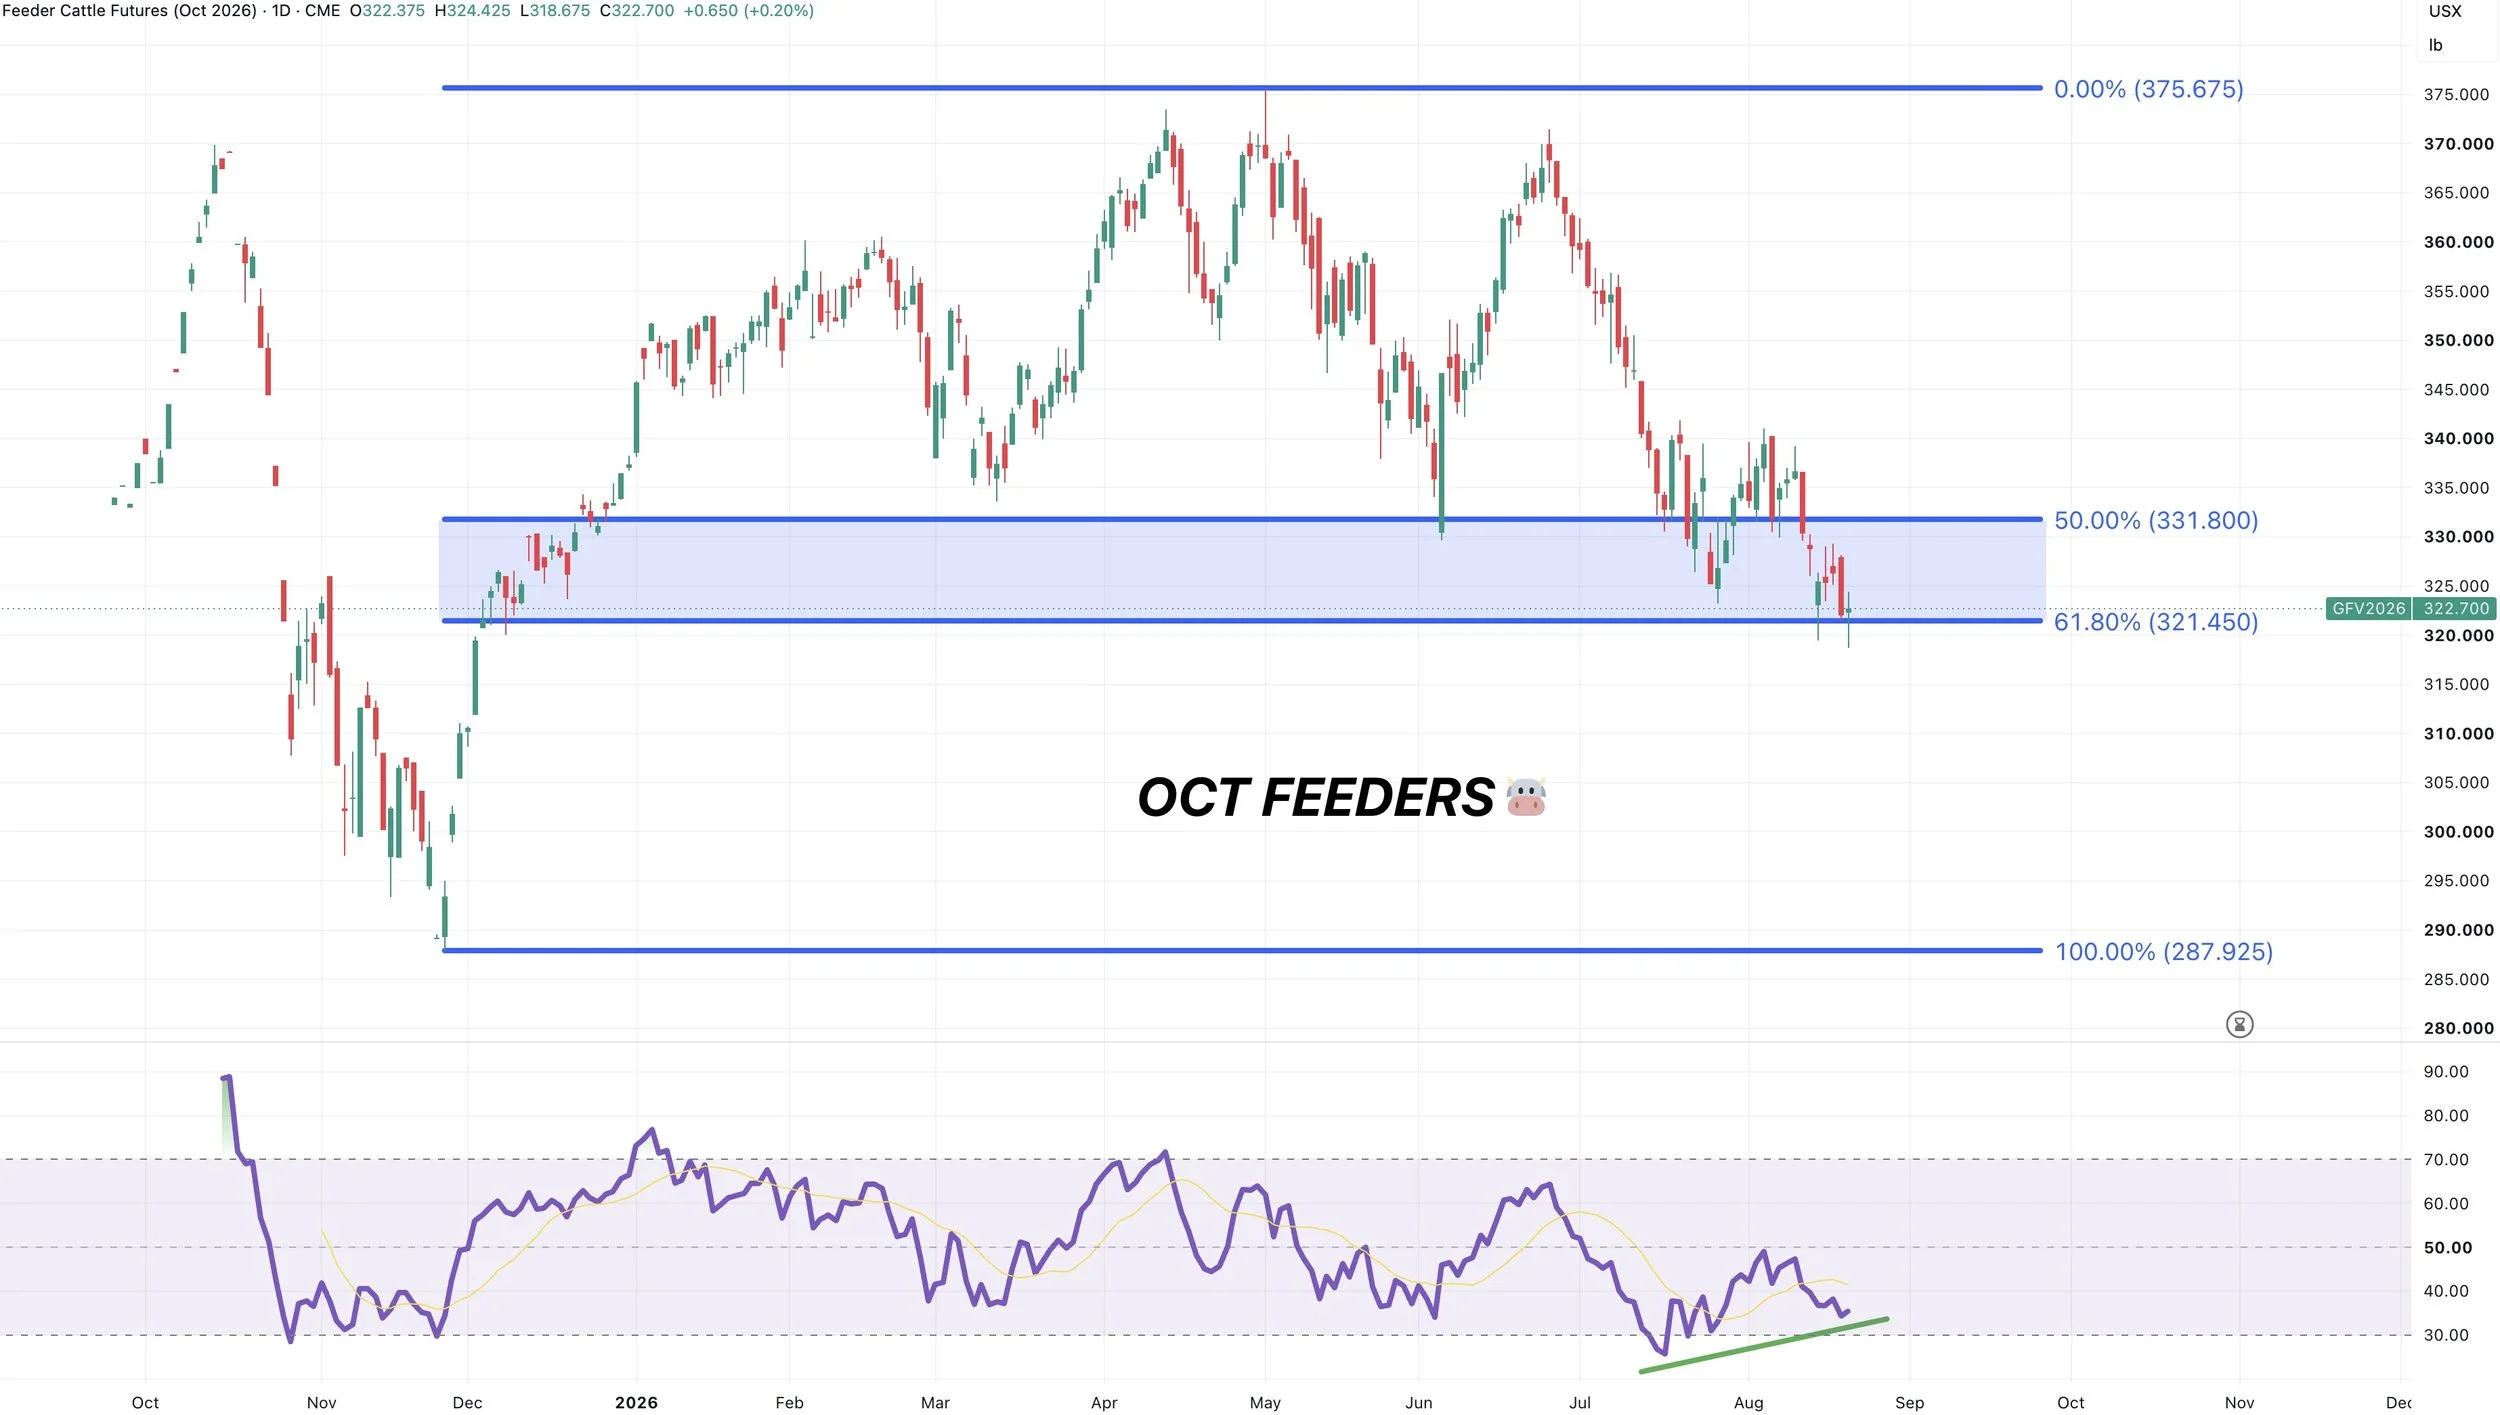
Oct Feeders Chart:
Same story here.
Fighting to hold that key level. We really want to see us hold this 61.8% retracement.
Like in live cattle, we are showing some bullish divergence. So we could be due for a bounce here at key support.
Want to Talk?
Our phones are open 24/7 for you guys if you ever need anything or want to discuss your operation.
Jeremey & Office: (806)484-1214
Sebastian: (605)280-1186
Email: sfrost@dailymarketminute.com
Hedge Account
Interested in a hedge account? Use the link below to set up an account or give us a call.