
AUDIO COMMENTARY
Some indecision in cattle
Grains built in a lot of negative information
Does this report change anything?
Yield changes in Nebraska don’t make sense
Why did USDA bump in Oct but cut yesterday?
USDA gave us more verbage this time
The harvested acres haven’t been reported
How is the USDA accounting for acres?
USDA says there is a huge range for production
World situations haven’t been resolved
Iowa should see less production
Two times Iowa was this far behind in harvesting, and the crop has been mature. Both resulted in yield being lowered
We are set up for an acre battle next year
The market will have to do something, demand will have to slow down, or the world will have to produce gangbuster crops
Who should look at courage calls?
Next year USDA has less corn acres & 184 yield
Soybean demand is not slowing down
Higher soybean yield would not be a surprise, but that record supply is being met with more demand
Spreads will be the best sign to watch
Simple technique to add to your bottom line
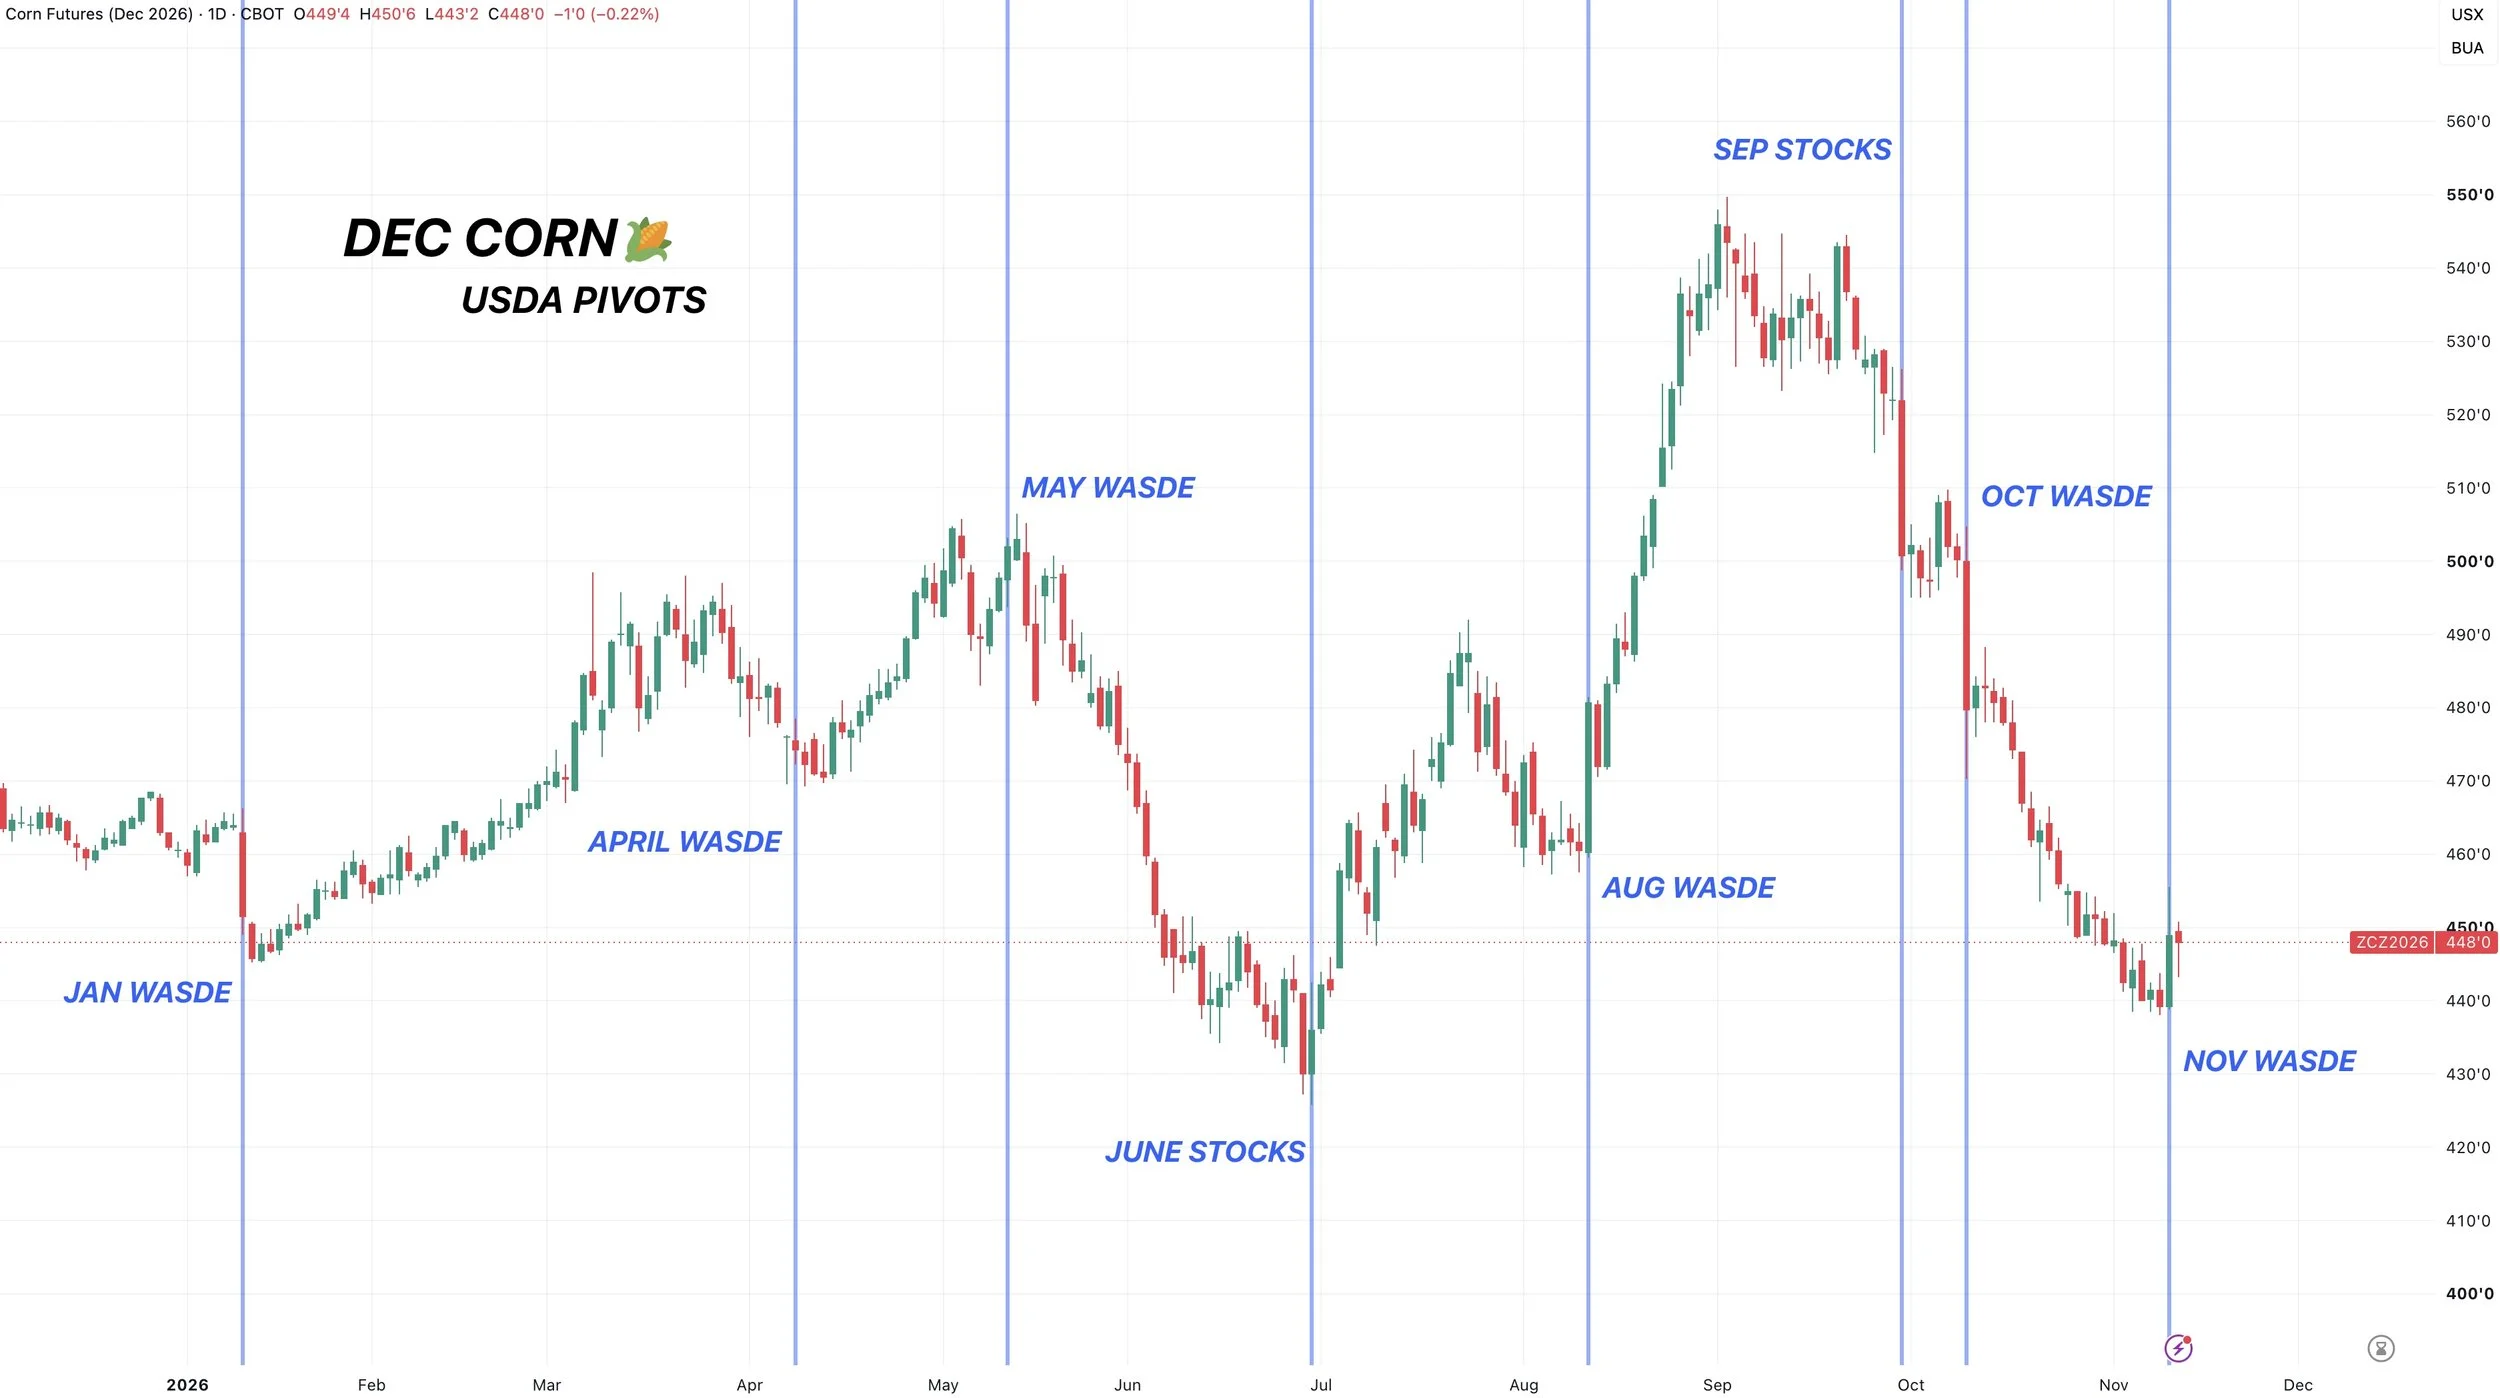
USDA reports have marked several pivots this year
Corn has not been choppy this year. It has been straight up or straight down all year
Chart breakdowns below audio*
Listen to today’s audio below
Want to talk?
Office: (806)484-1214
Want every daily update & alert?
CHART BREAKDOWNS
Dec Corn 🌽
The indicators are painting a friendly story.
We have bullish divergence on the RSI for the first time since those June lows.
Prices had been grinding lower. The RSI was not.
We also just saw the MACD finally cross bullish for the first time since that August rally.
The MACD has crossed bullish 4 times this year. Each time a decent bounce or rally followed.
So definitely some potential signs that the pain is over and the downside has been exhausted.
As these would both be two things we watch for when trying to identity a bottom.
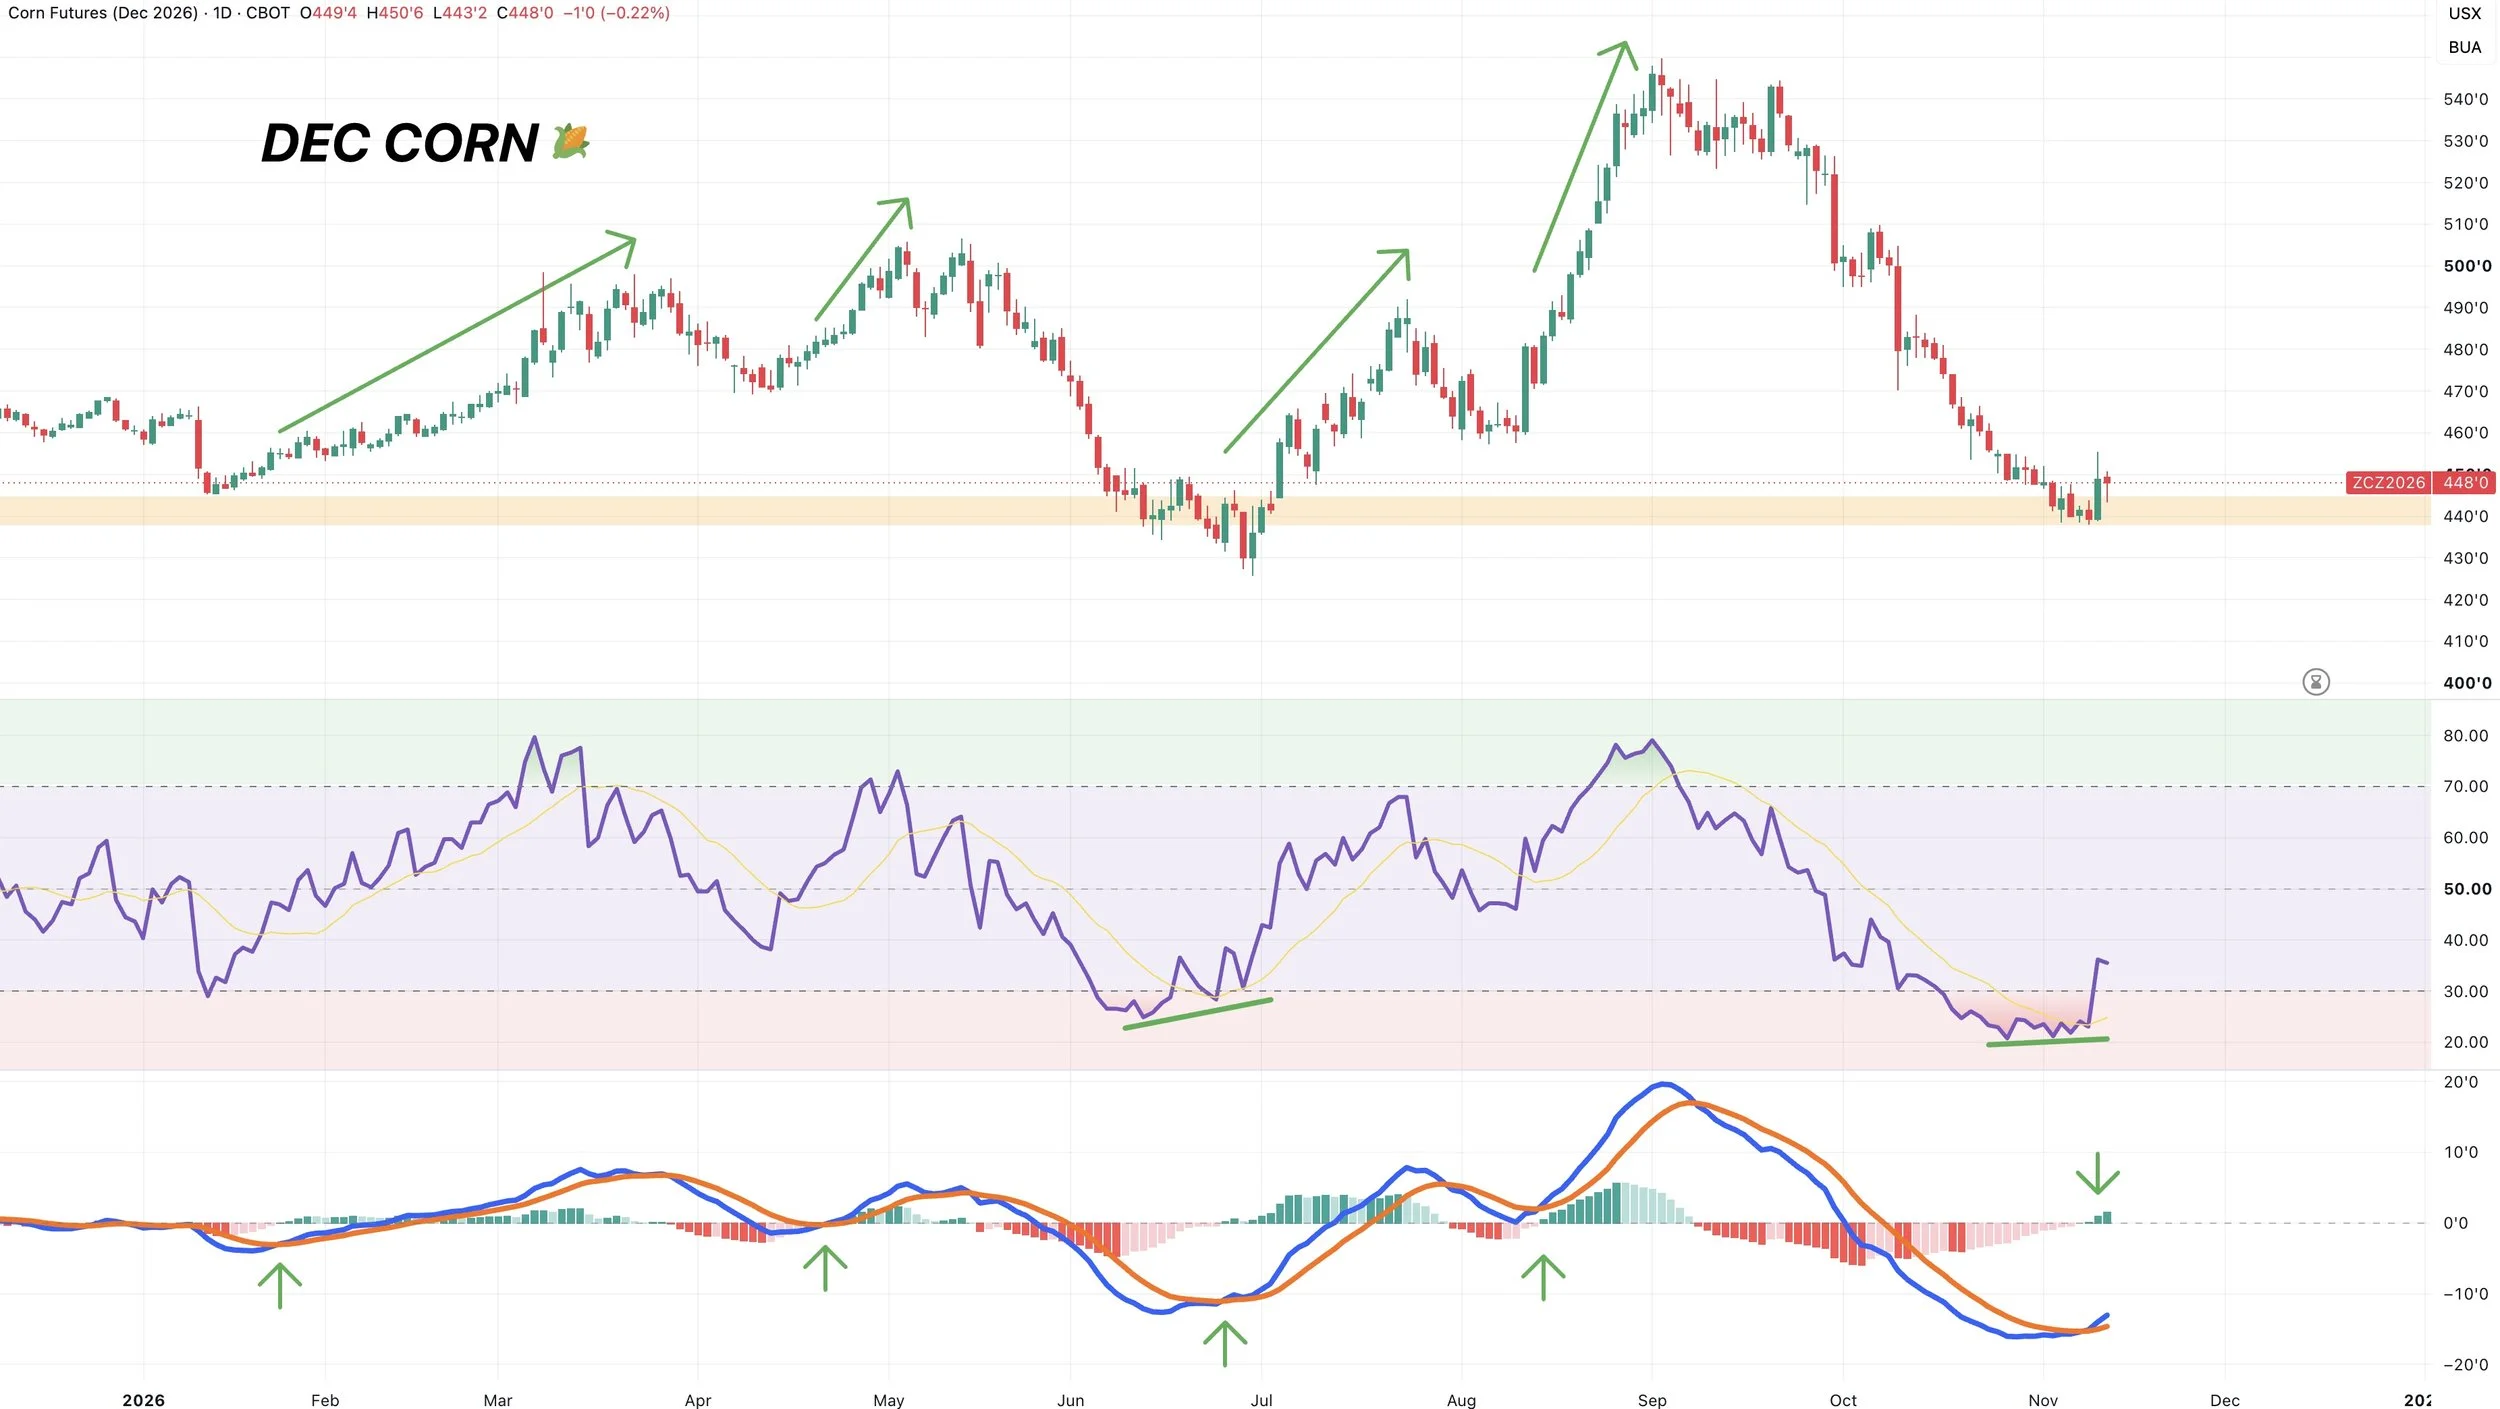
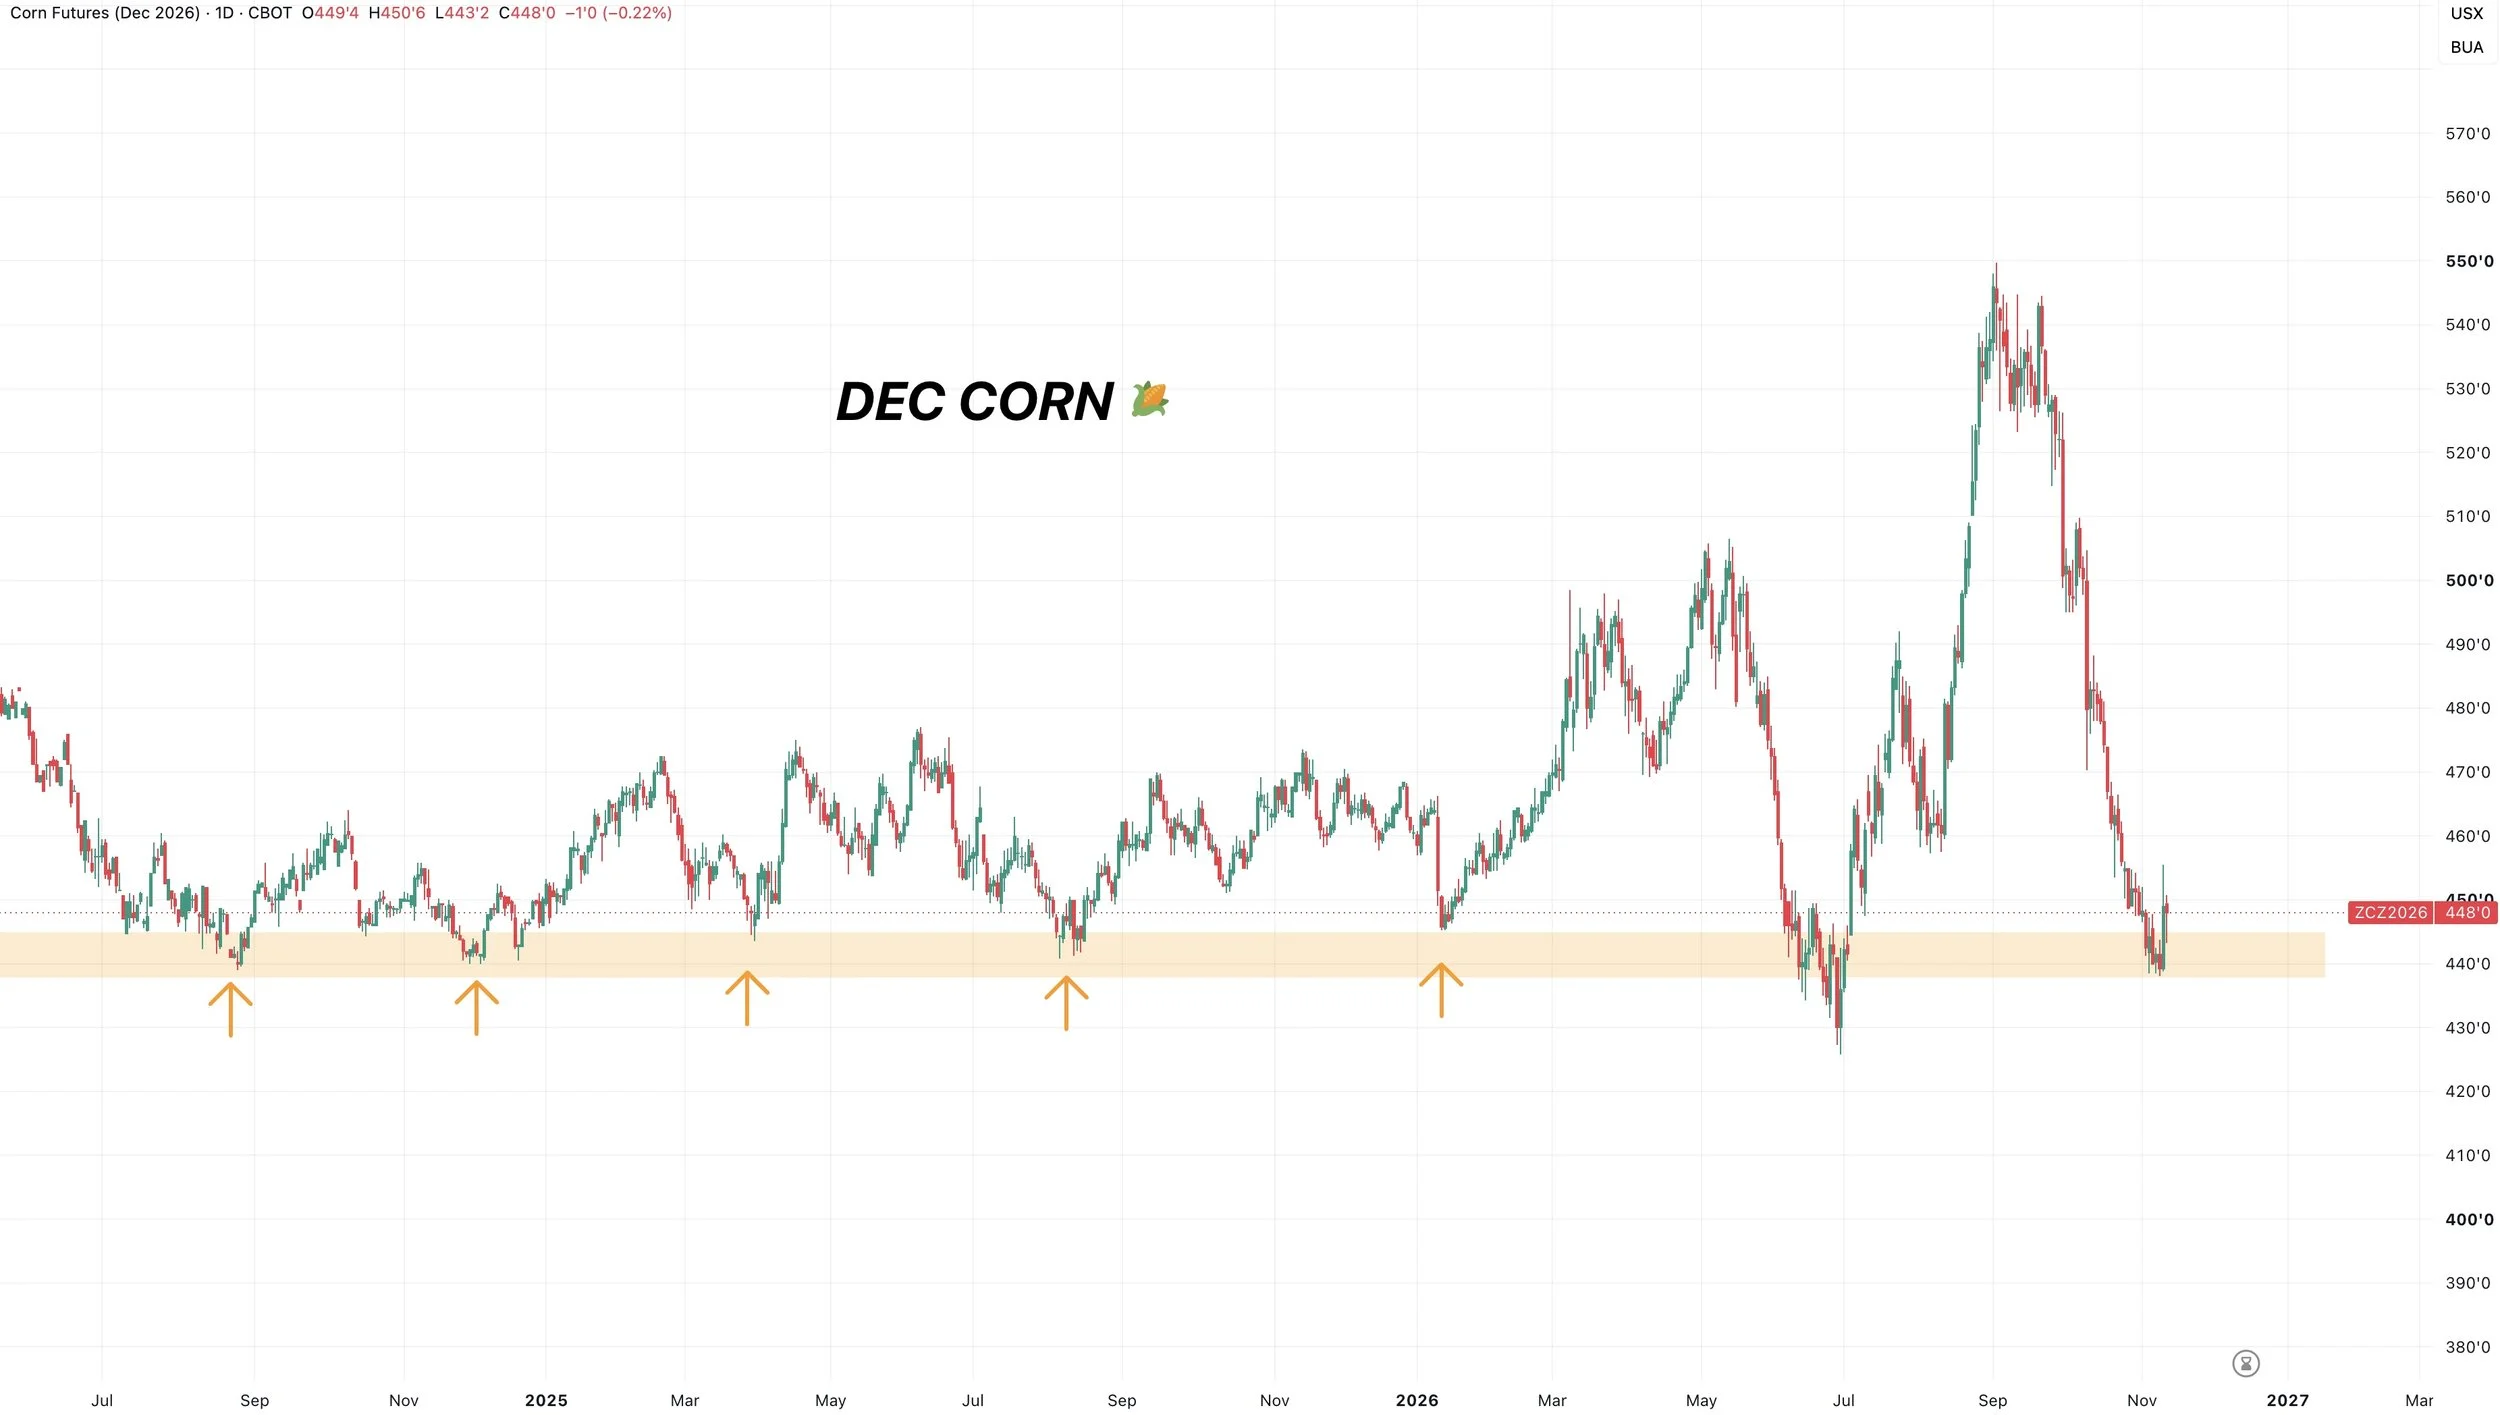
We held right where we needed to.
The last support before contract lows.
So these recent lows are clearly going to be the level we want to see us hold.
Corn has bottomed in this range 5 separate times. So looks promising for now.
Once again I wanted to point out that USDA reports have marked countless pivots in this market this year for corn.
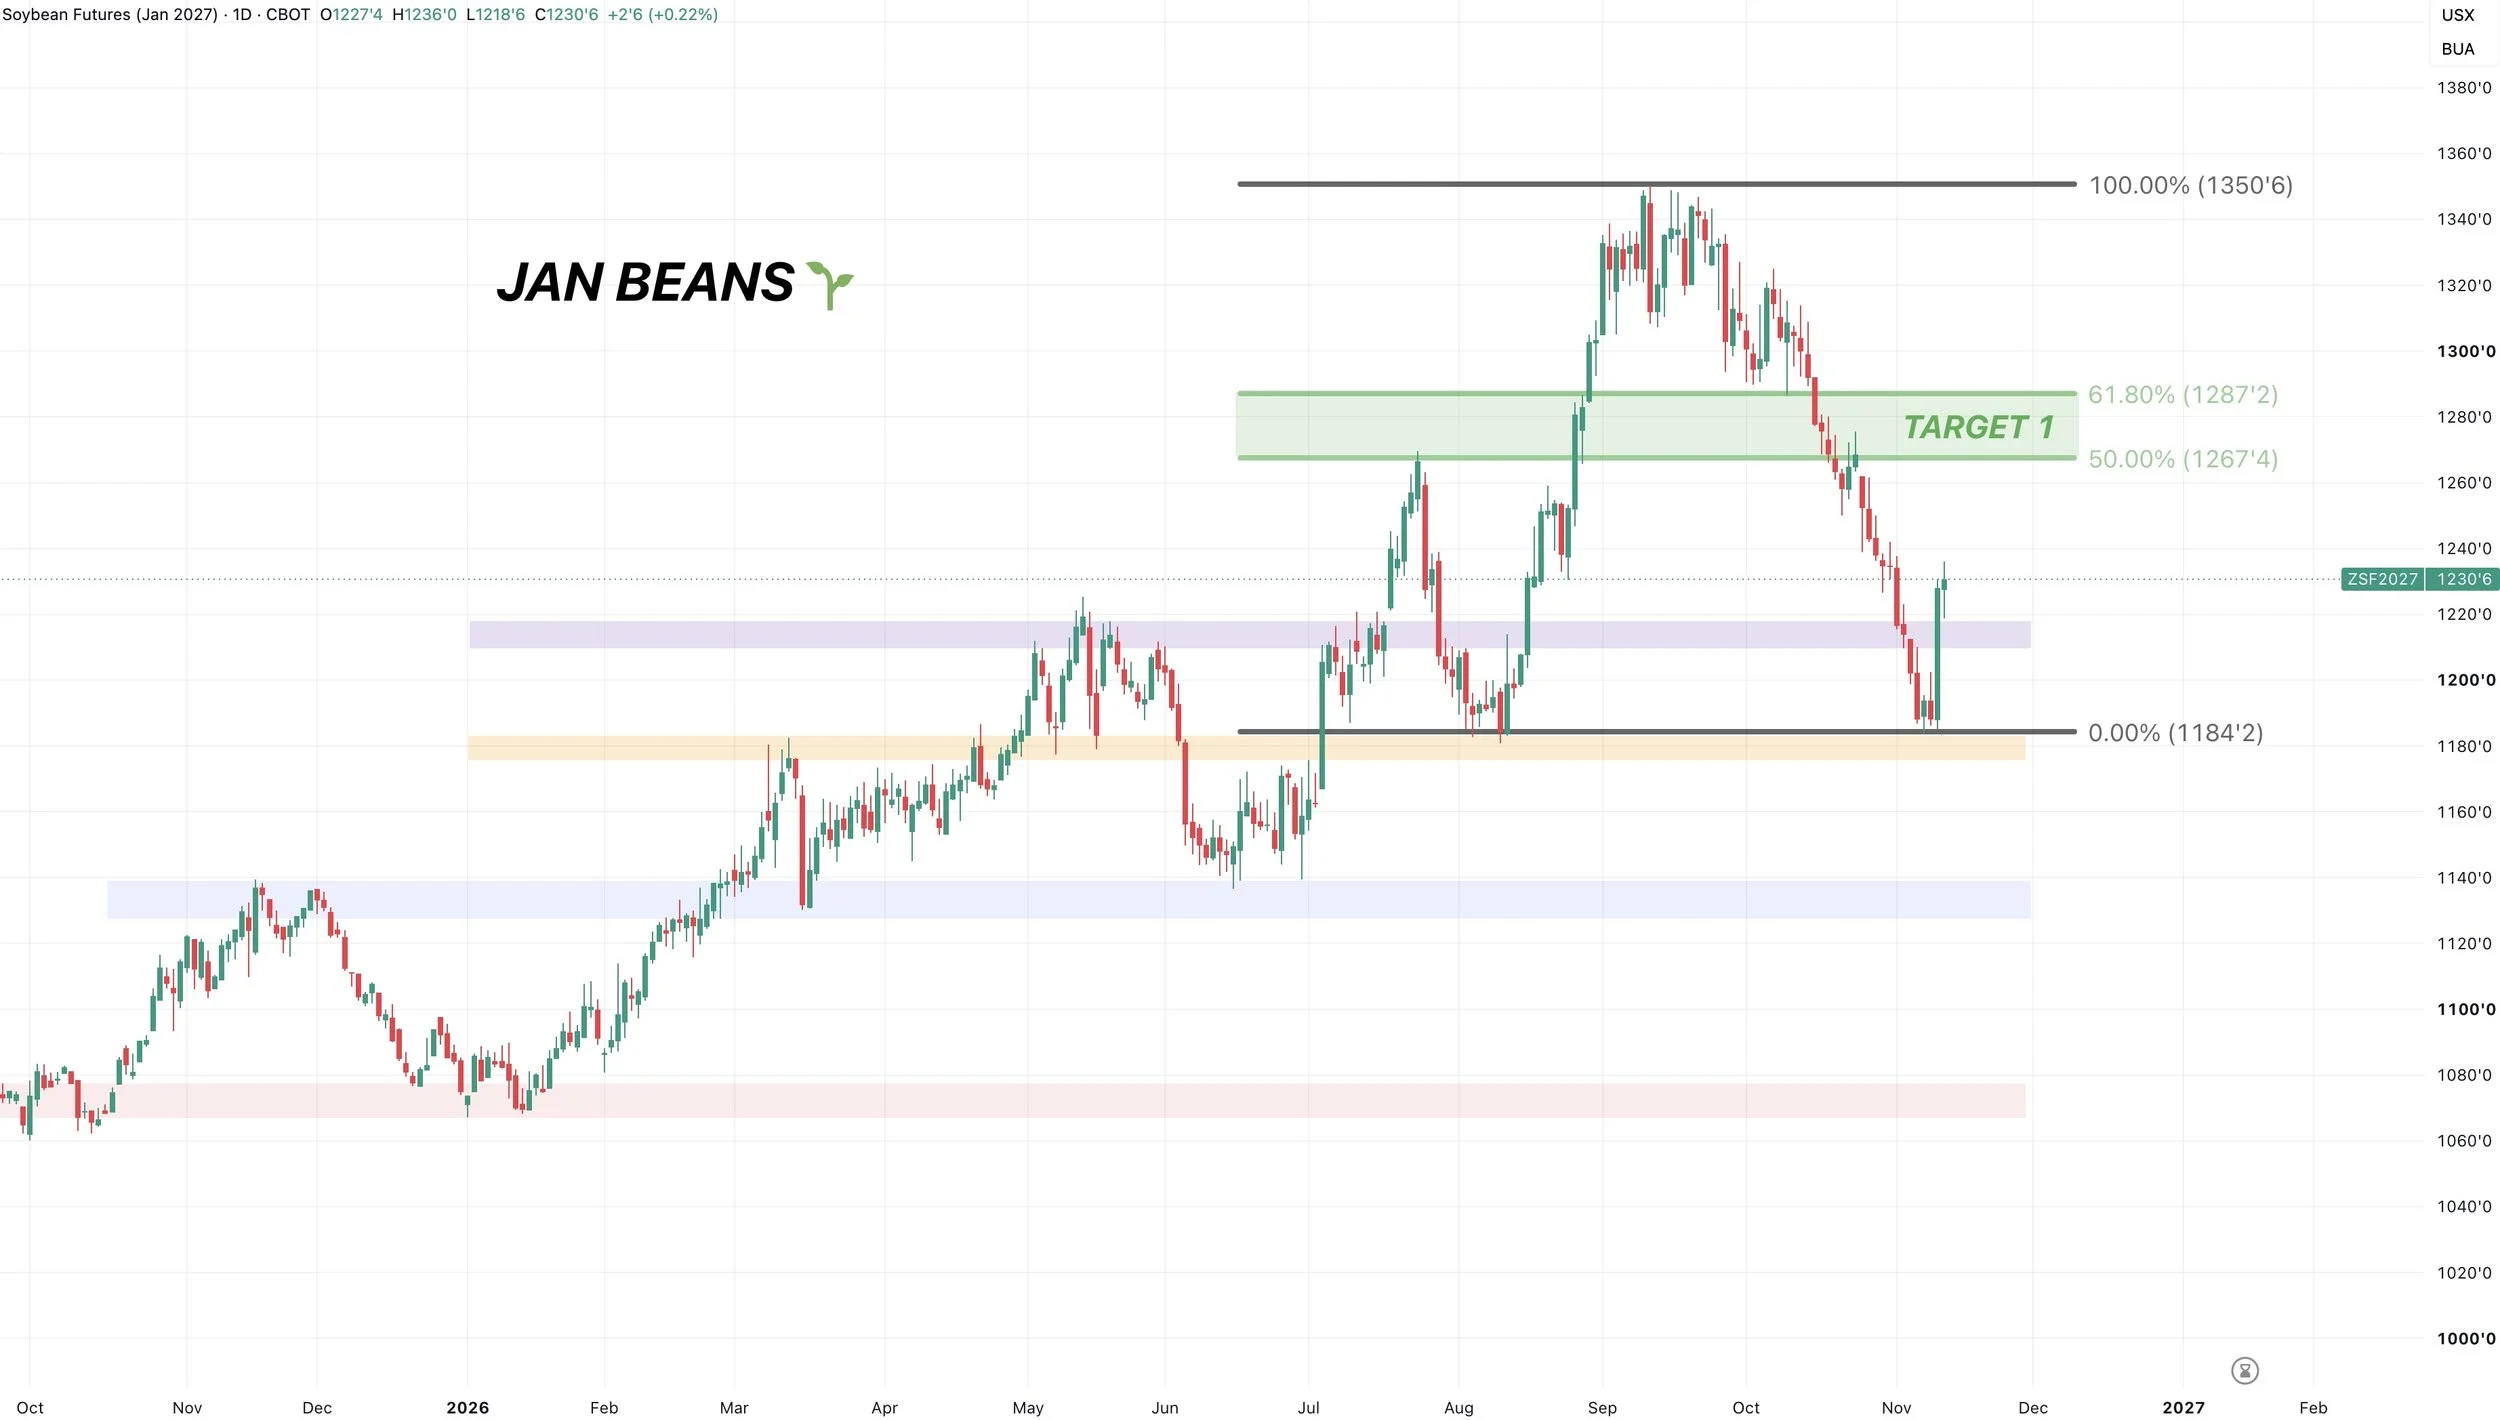
Jan Beans 🌱
The chart looks good. Yesterday was our 2nd strongest day of the entire year.
We held right we needed to. Bouncing off those August lows and creating a double bottom.
We had the RSI break out. The MACD is trying to cross bullish. All positive signs.
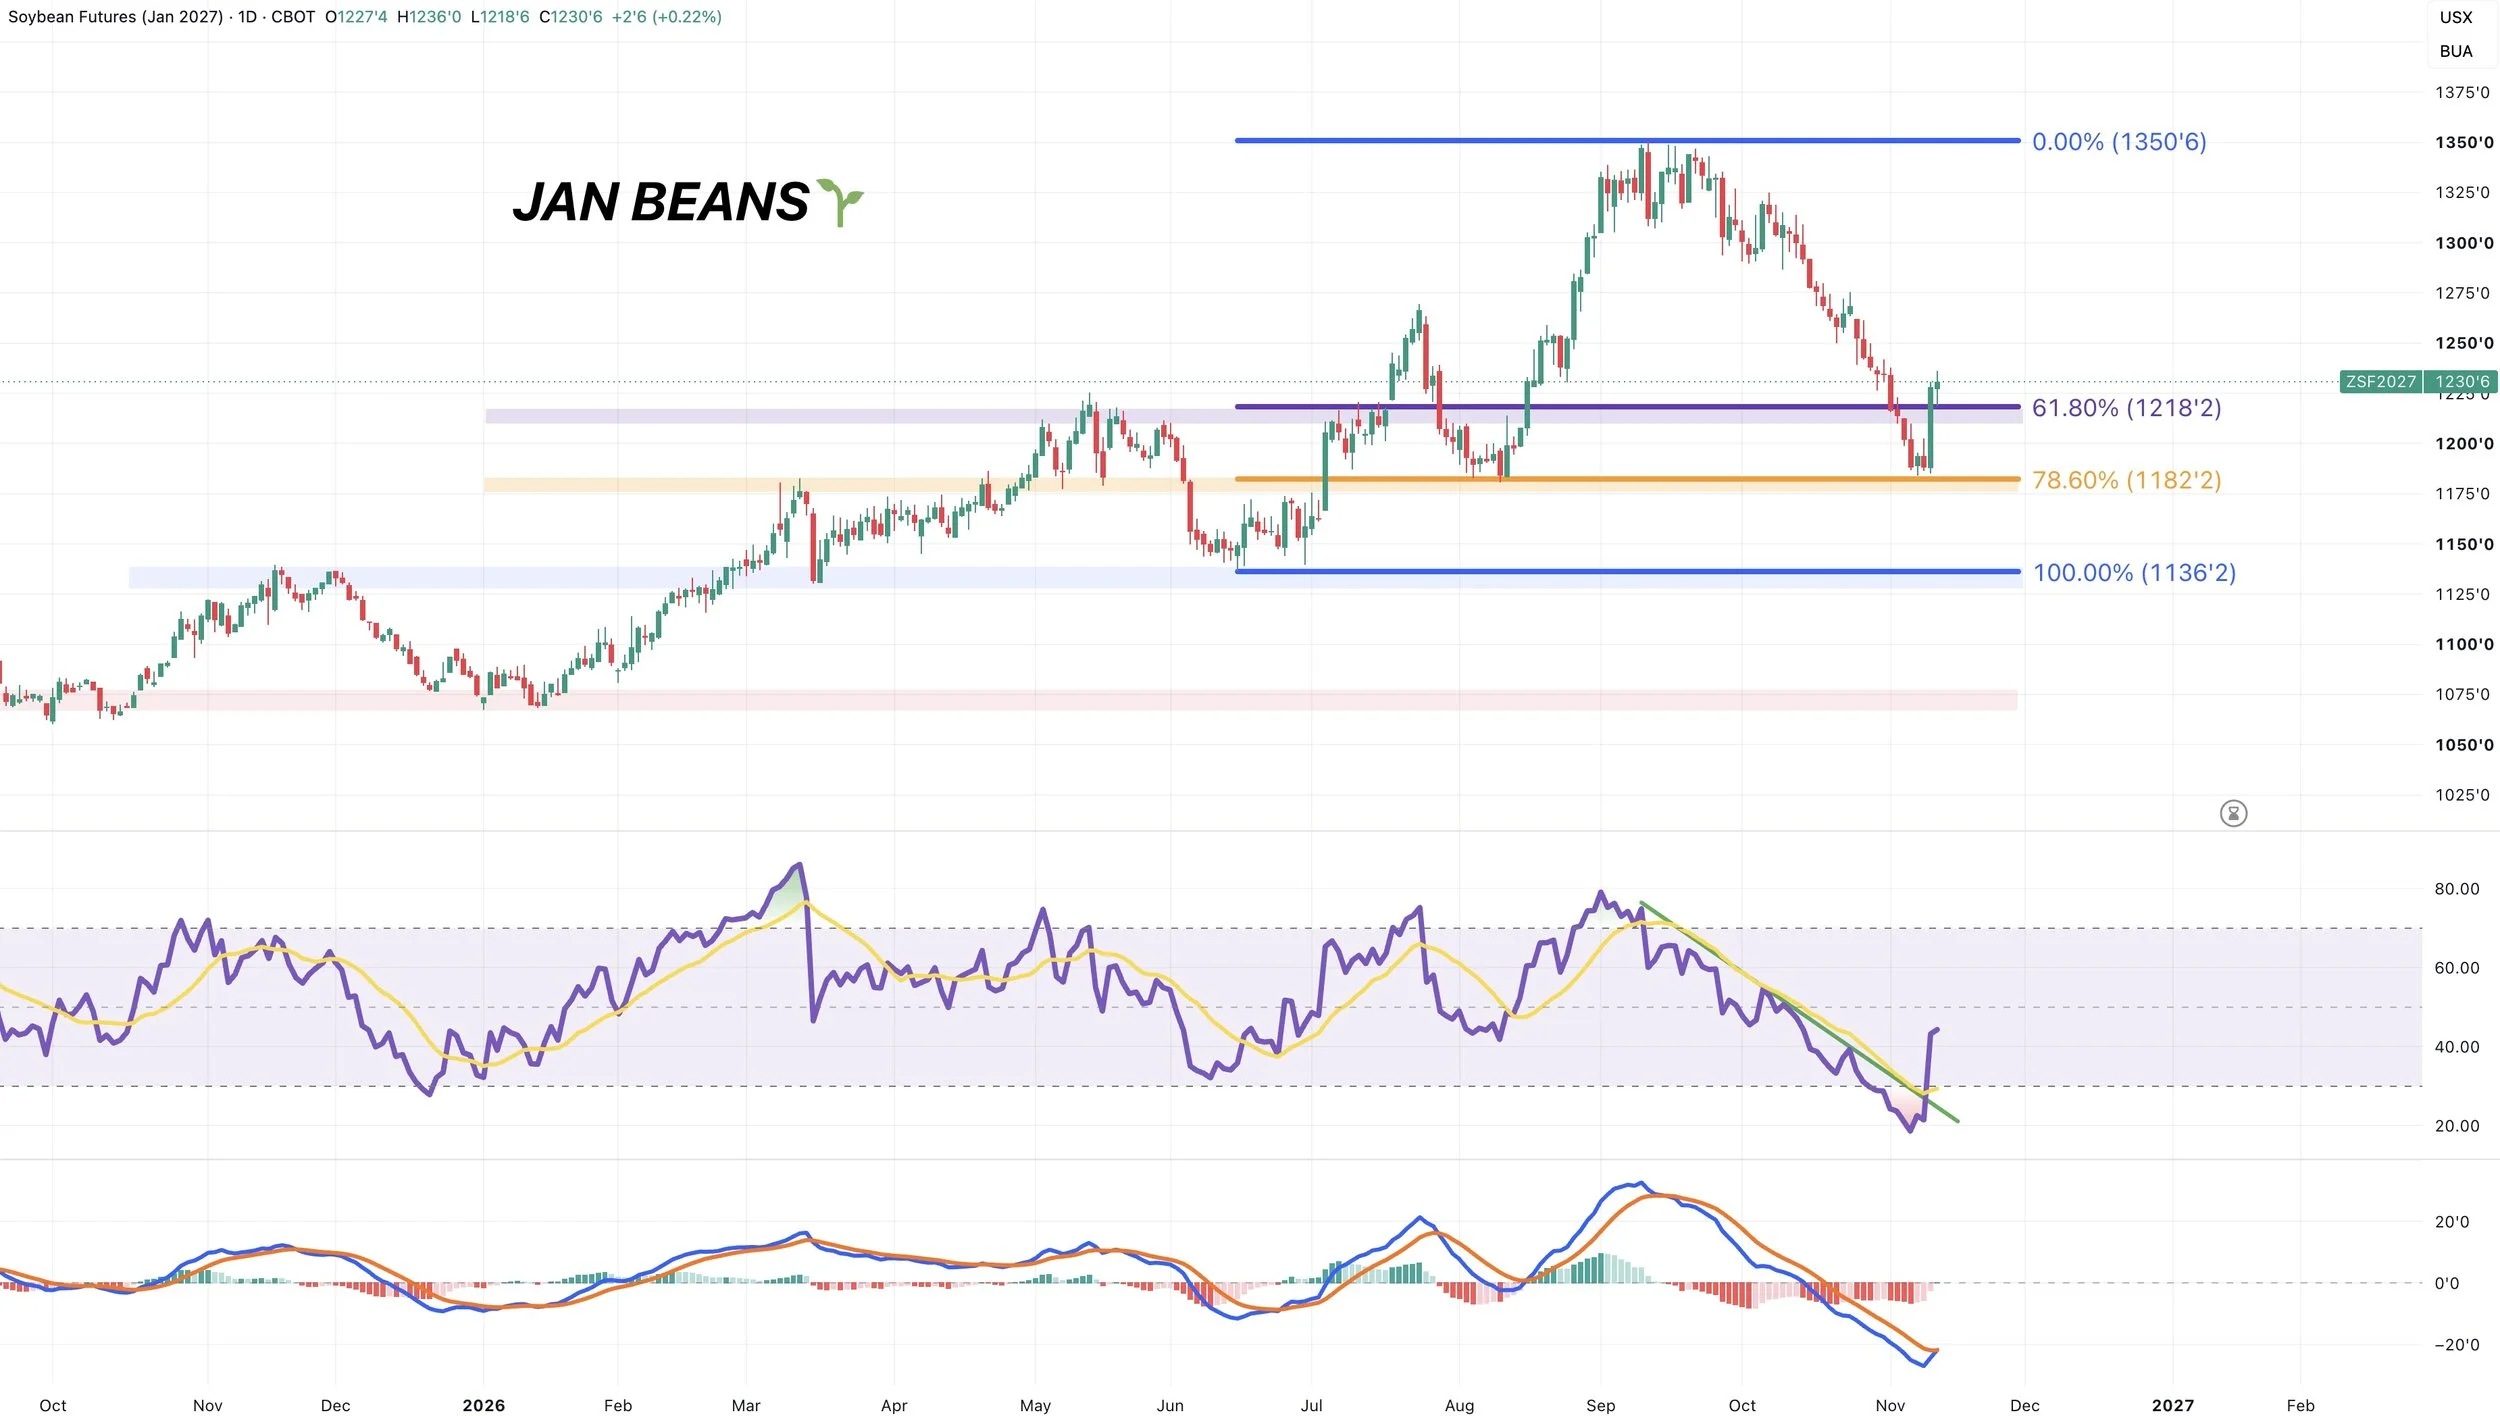
If this is simply a relief bounce. We’d be eyeing that $12.65 to $12.85 range.
That is the golden zone from the entire sell off. That is also the highs from July.
That is usually where the market will decide and tell us if this is just a relief rally or the start of something bigger.
For now that is going to be the first upside point of interest to watch until we see more development on the chart.
Dec KC Wheat 🌾
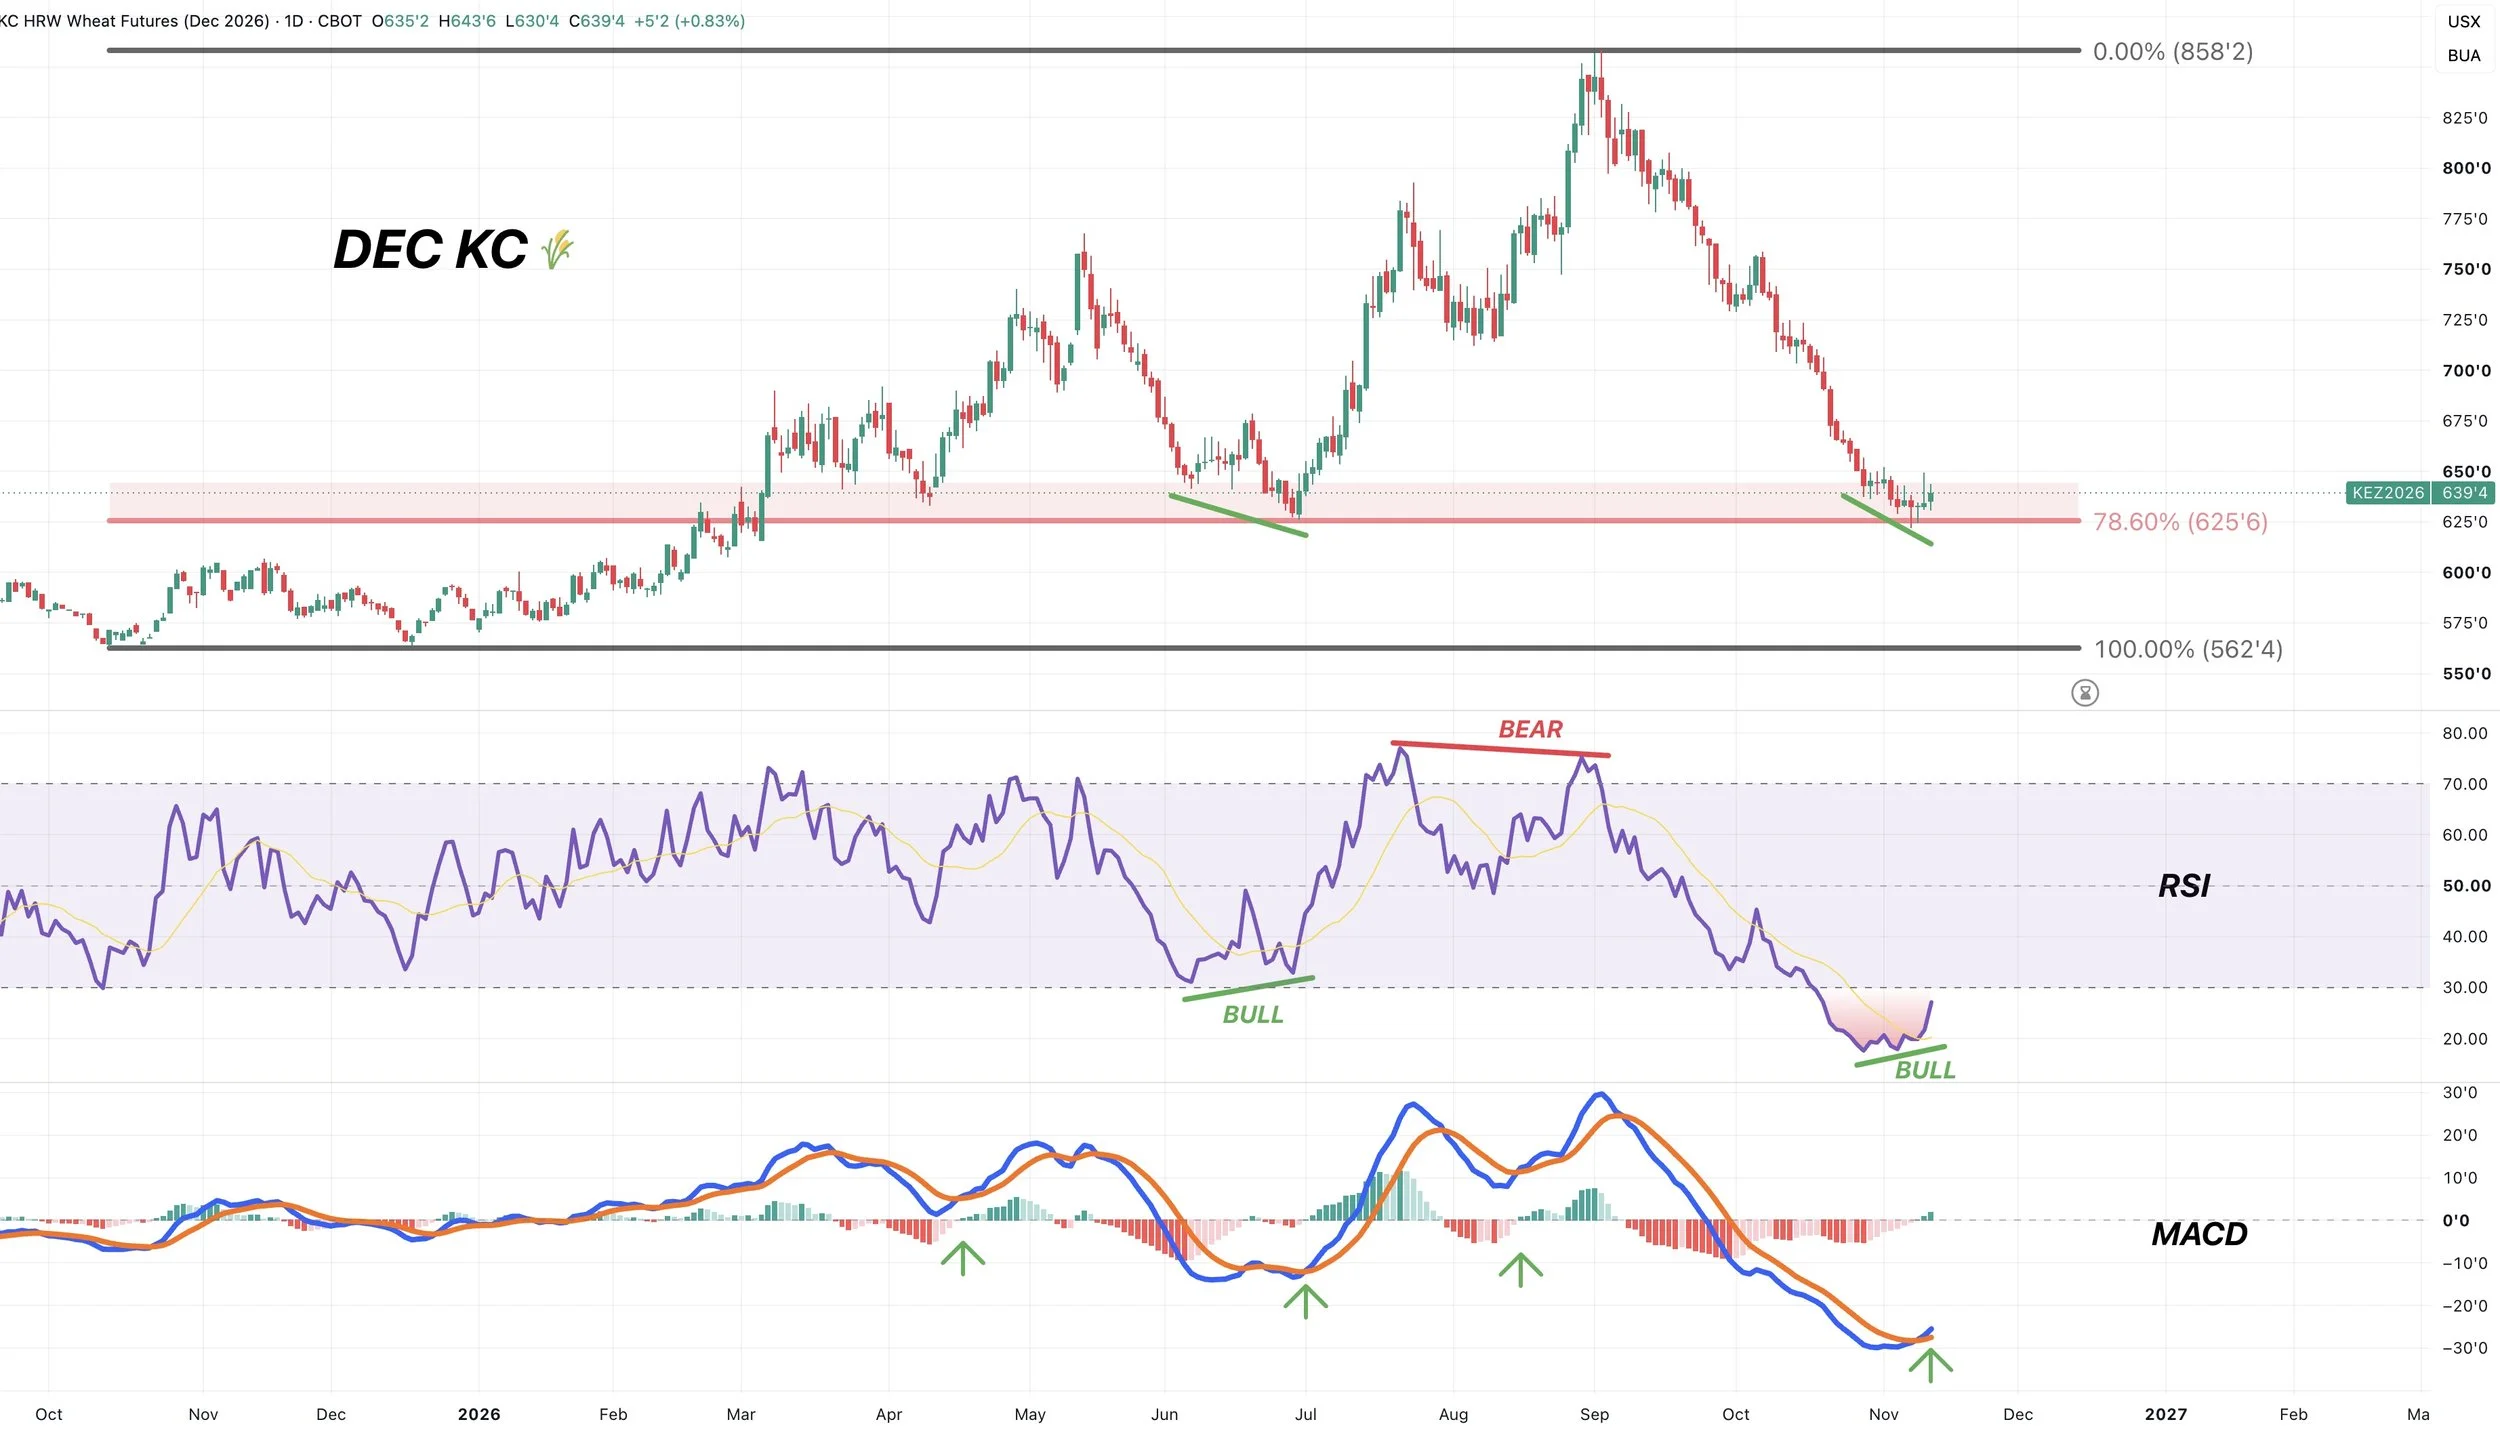
Wheat is also giving it’s best sign of a bottom I’ve seen.
We have bullish divergence on the RSI. The same thing marked the June lows. While bearish divergence marked the August highs. Which was one reason we had that sell alert on Aug 28th.
At the same time, we have the MACD crossing bullish for the first time since the August rally.
We are sitting at a very key level.
This is your last support before contract lows. As it’s the summer lows and gives back 78.6% of the entire rally from contract lows to contract highs.
Jan Feeders 🐮
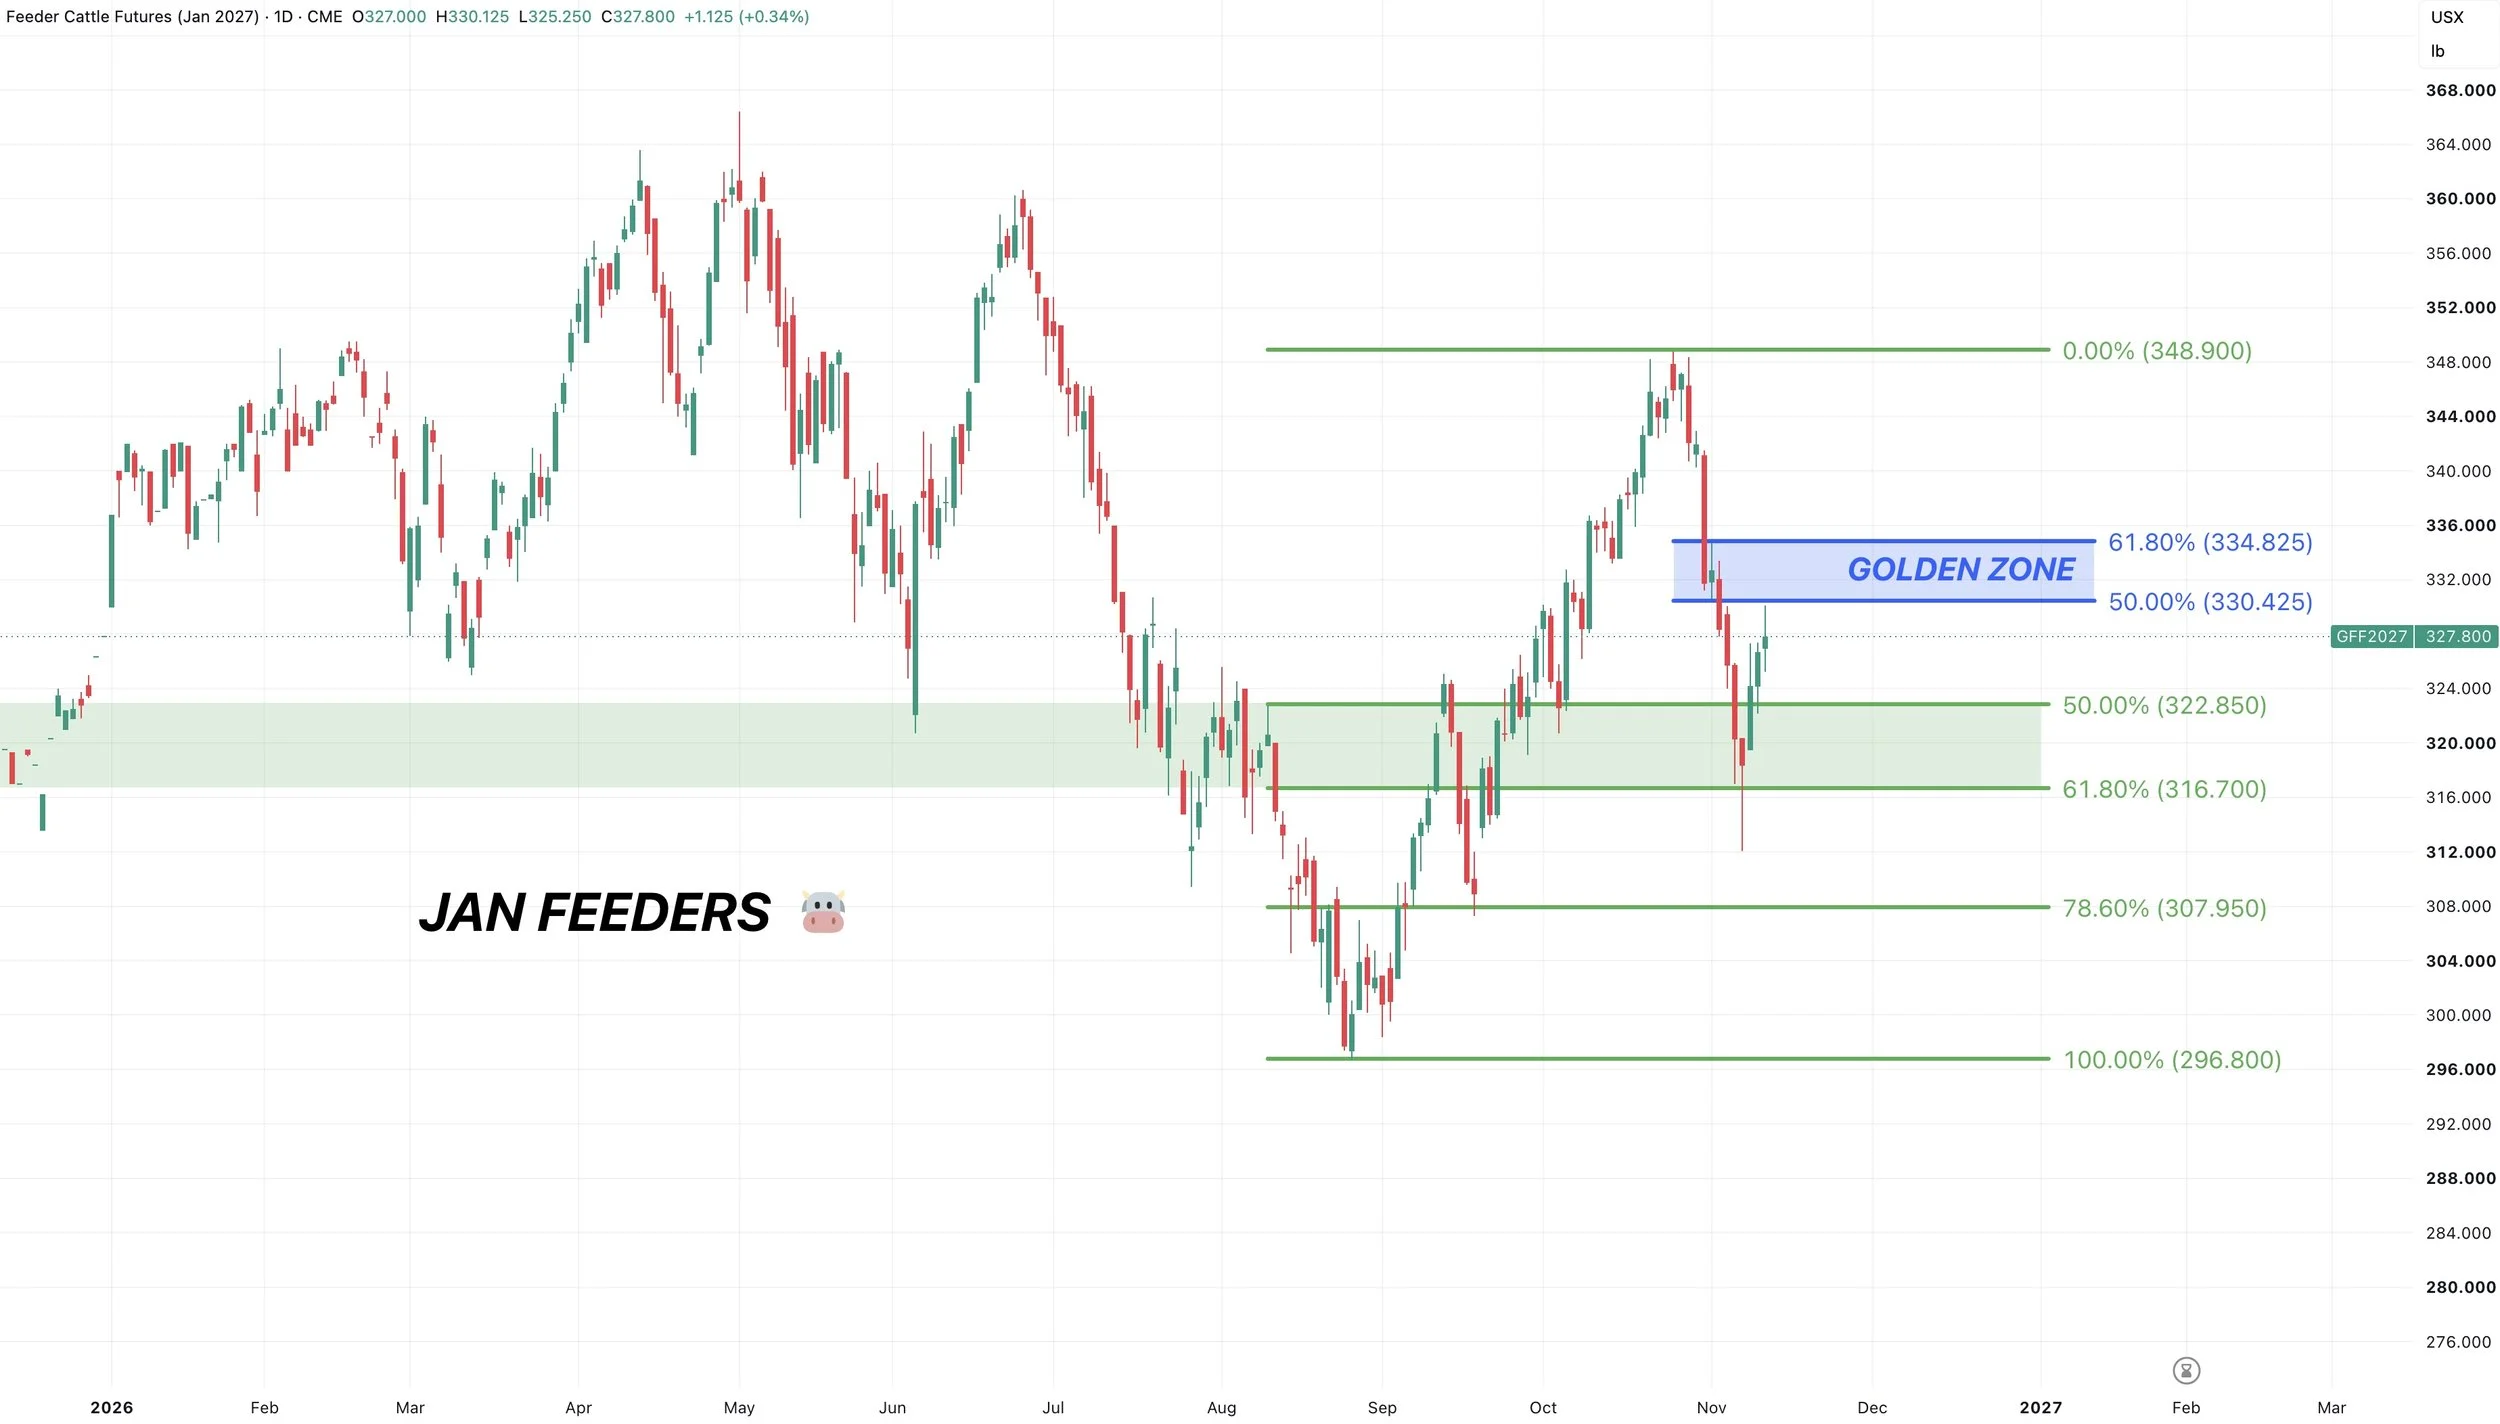
We held the golden zone to the downside where we needed.
However we are now nearing that upside point of interest.
We perfectly clawed back 50% of the entire sell off today.
If this is a relief bounce, this 50-61.8% zone would be the most common spot for us to fail.
If we reject here I would view it as a bearish sign and dead cat bounce.
So I am a little cautious here in cattle following the nice bounce from the lows.
Dec Live Cattle 🐮
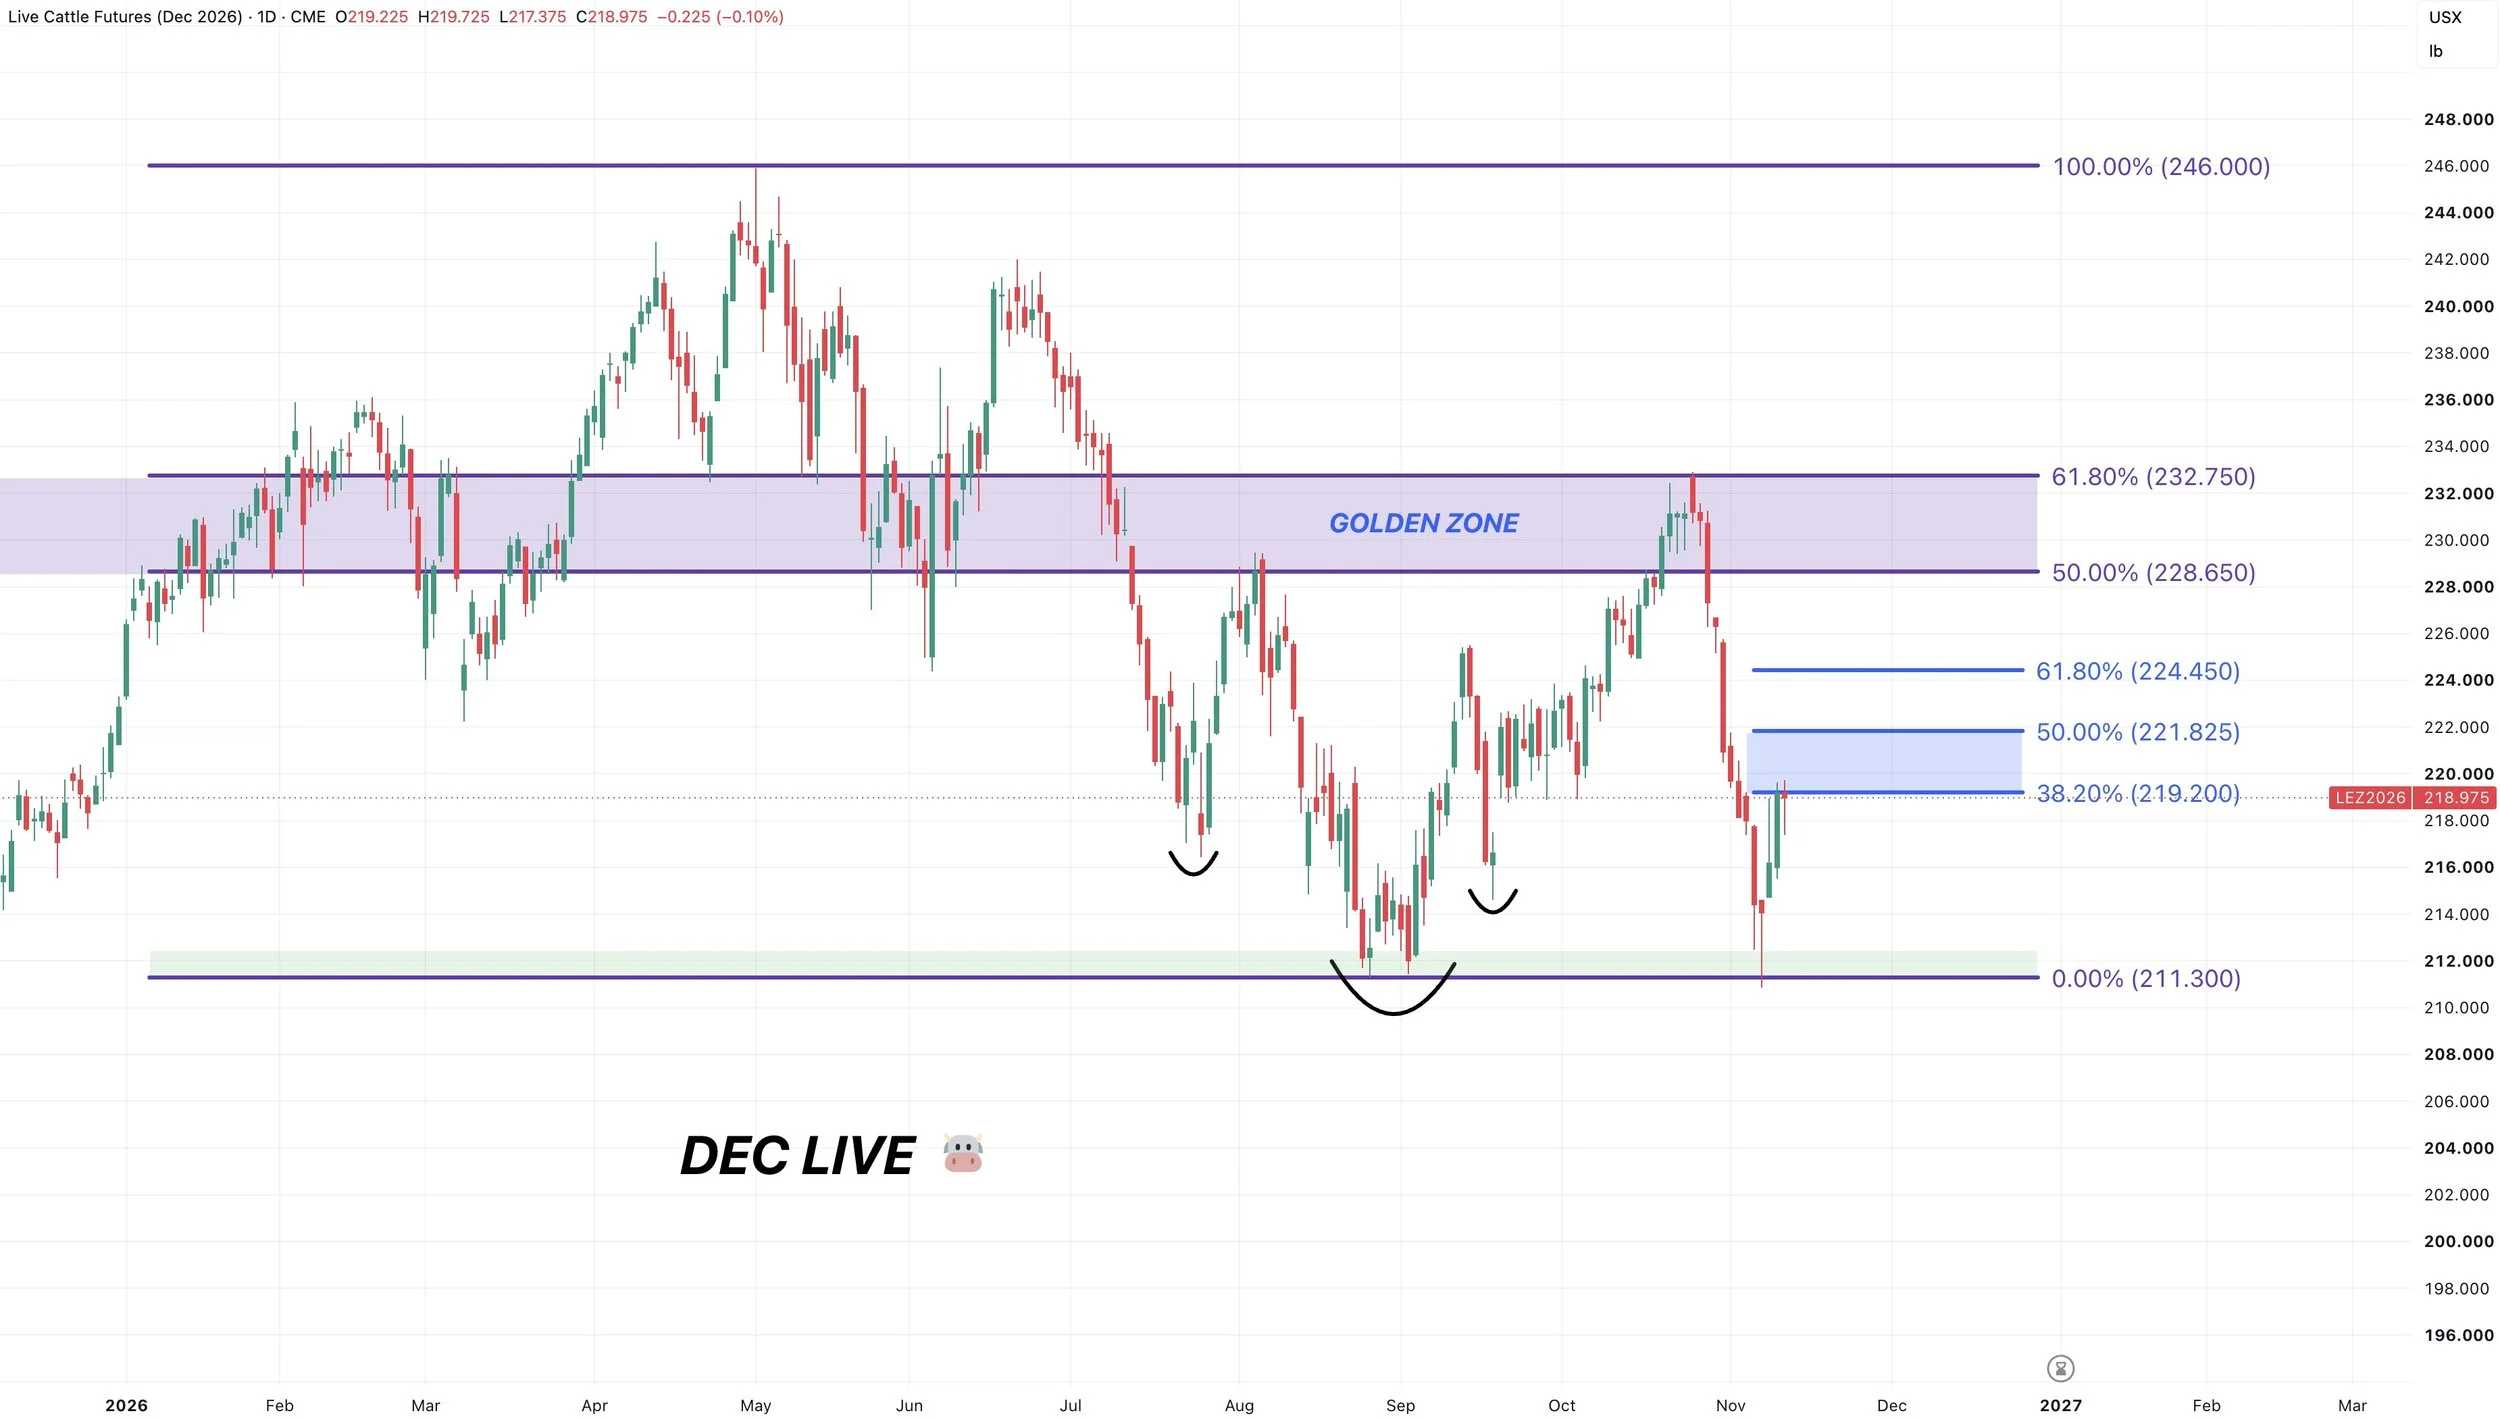
Live cattle continues to underperform feeders.
Unlike in feeders where we clawed back 50% of the rally, live has only clawed back 38.2%.
Which is less common but still a possible level for us to fail.
So unlike in feeders where the dead cat bounce target box is 50-61.8%. I moved the target box a set of fibs lower for live cattle.
If this is just a dead cat bounce, this would not be a surprising spot to fail.
I was also not a big fan of today’s candle. Yes we closed well off the lows. But when you do that after a rally, it is called a hanging man. And often times can lead to a correction. So tomorrow should give us some clues. As I would be cautious if we are unable to bust above this level.
Want to Talk?
Our phones are open 24/7 for you guys if you ever need anything or want to discuss your operation.
Jeremey & Office: (806)484-1214
Sebastian: (605)280-1186
Email: sfrost@dailymarketminute.com
Hedge Account
Interested in a hedge account? Use the link below to set up an account or give us a call.