
DECISION POINTS FOR GRAINS
MARKET UPDATE
You can scroll to read the usual update as well. As the written version is the exact same as the video.
Timestamps for video:
Overview: 0:00min
Corn: 2:30min
Corn Charts: 6:00min
Bean Hedge: 8:00min
Bean Charts: 11:40min
Wheat: 13:25min
Cattle: 15:20min
Want to talk?
Office: (806)484-1214
Get every daily update & alert
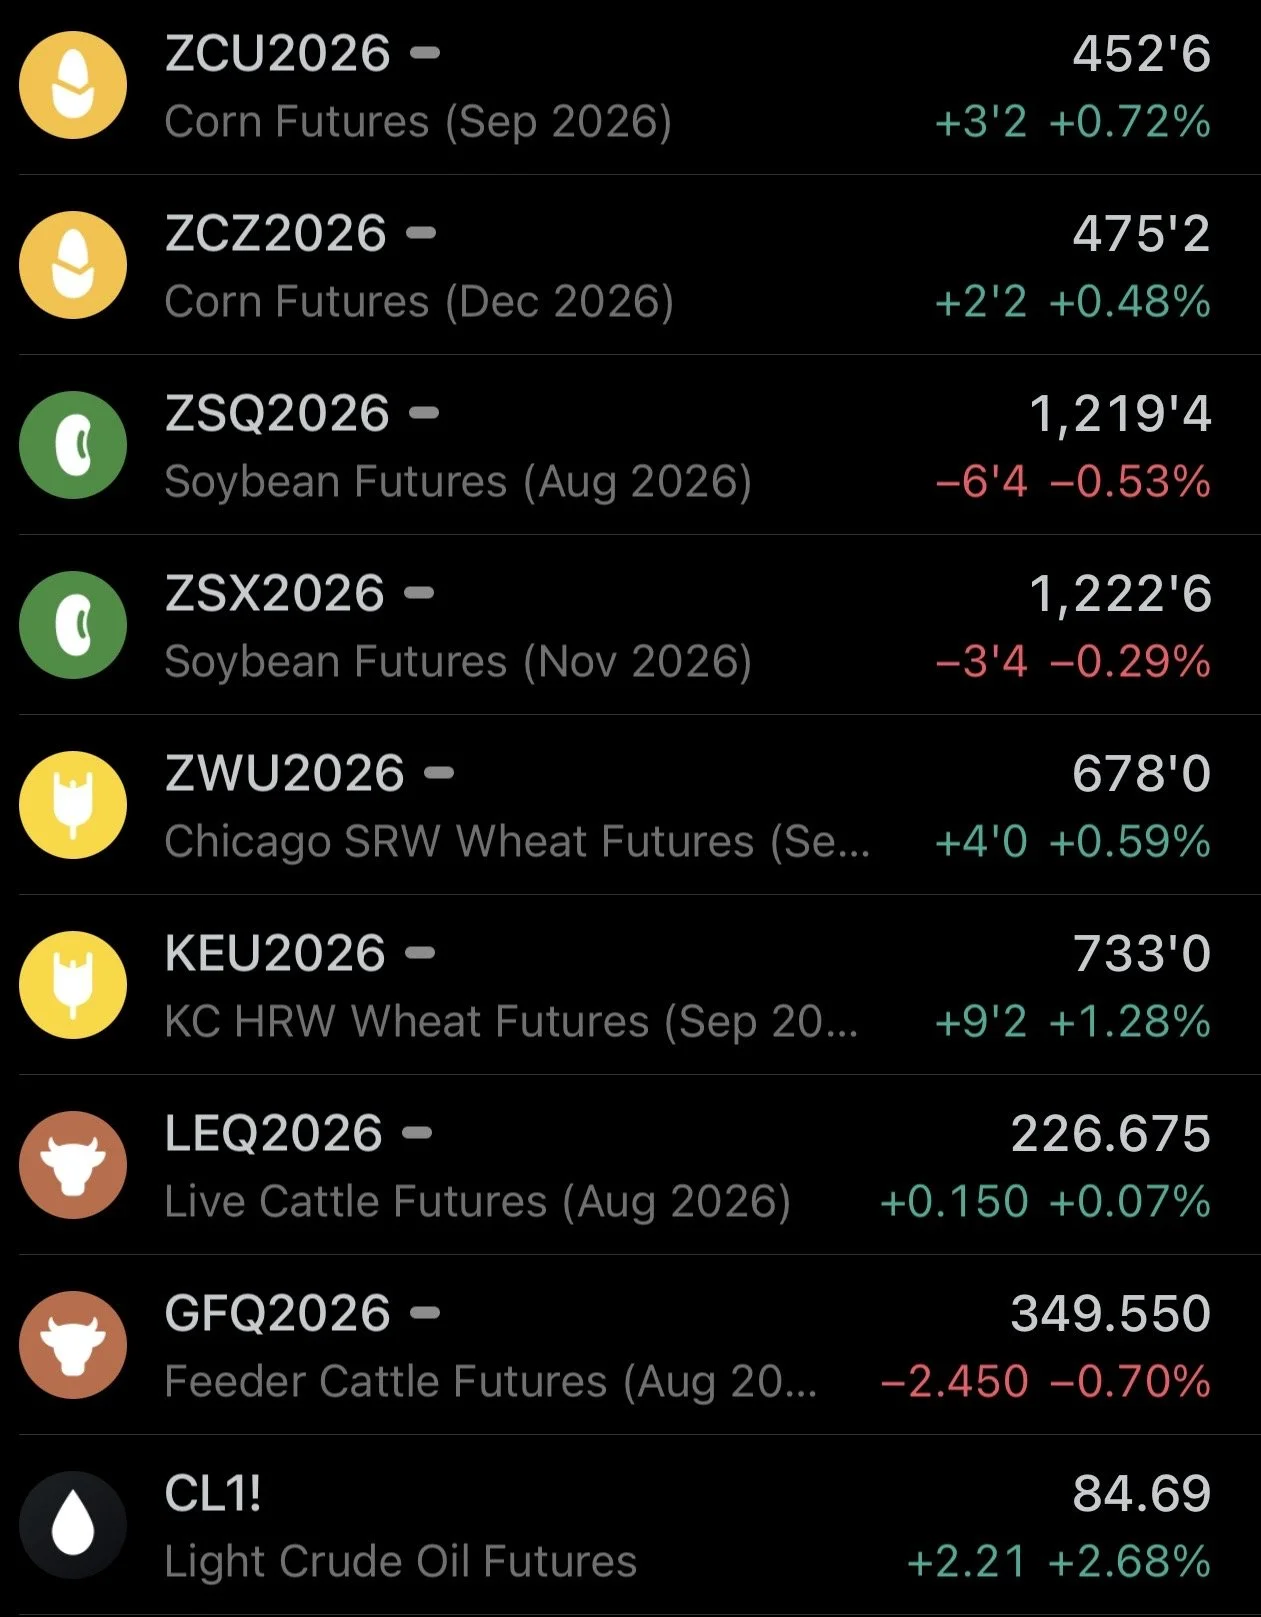
Futures Prices Close
Overview
Corn and wheat strong today while soybeans run into some weakness following the impressive day yesterday.
The markets focus remains on the weather, the Black Sea conflicts, and China buying.
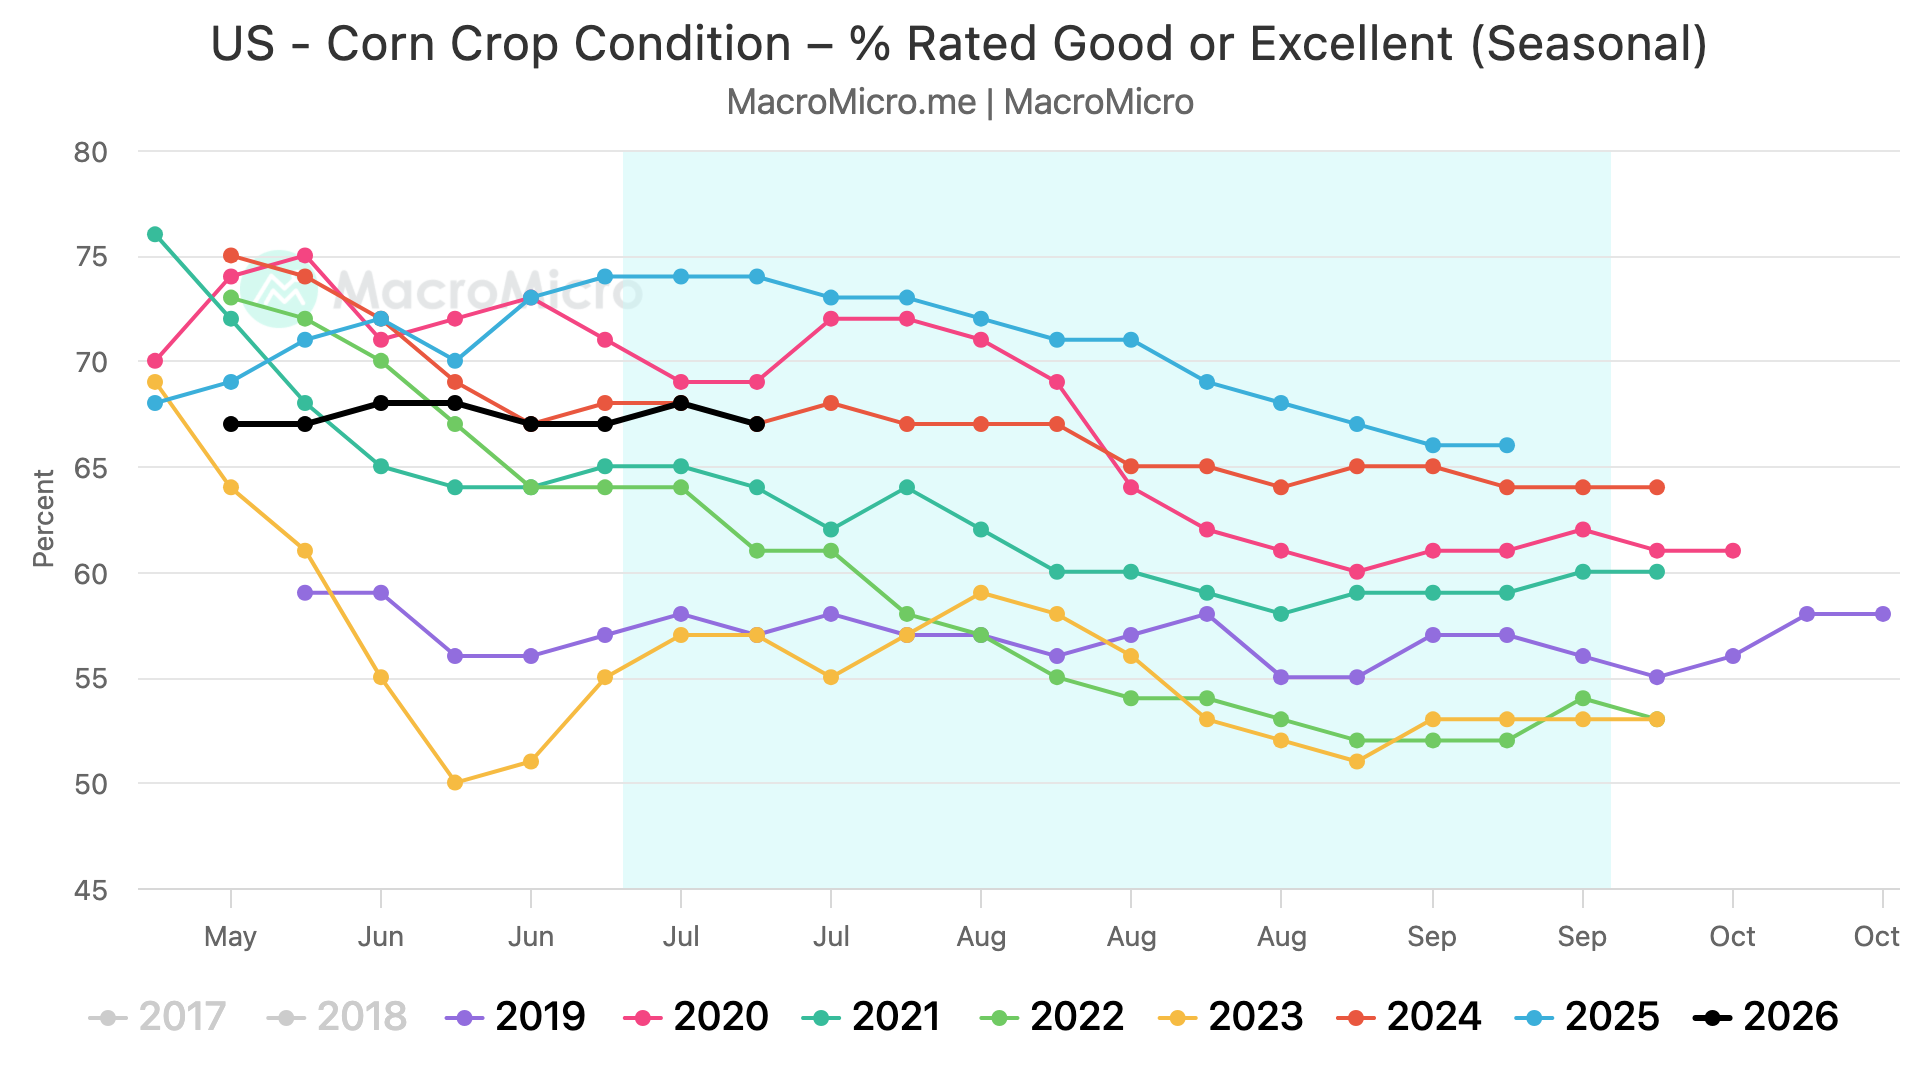
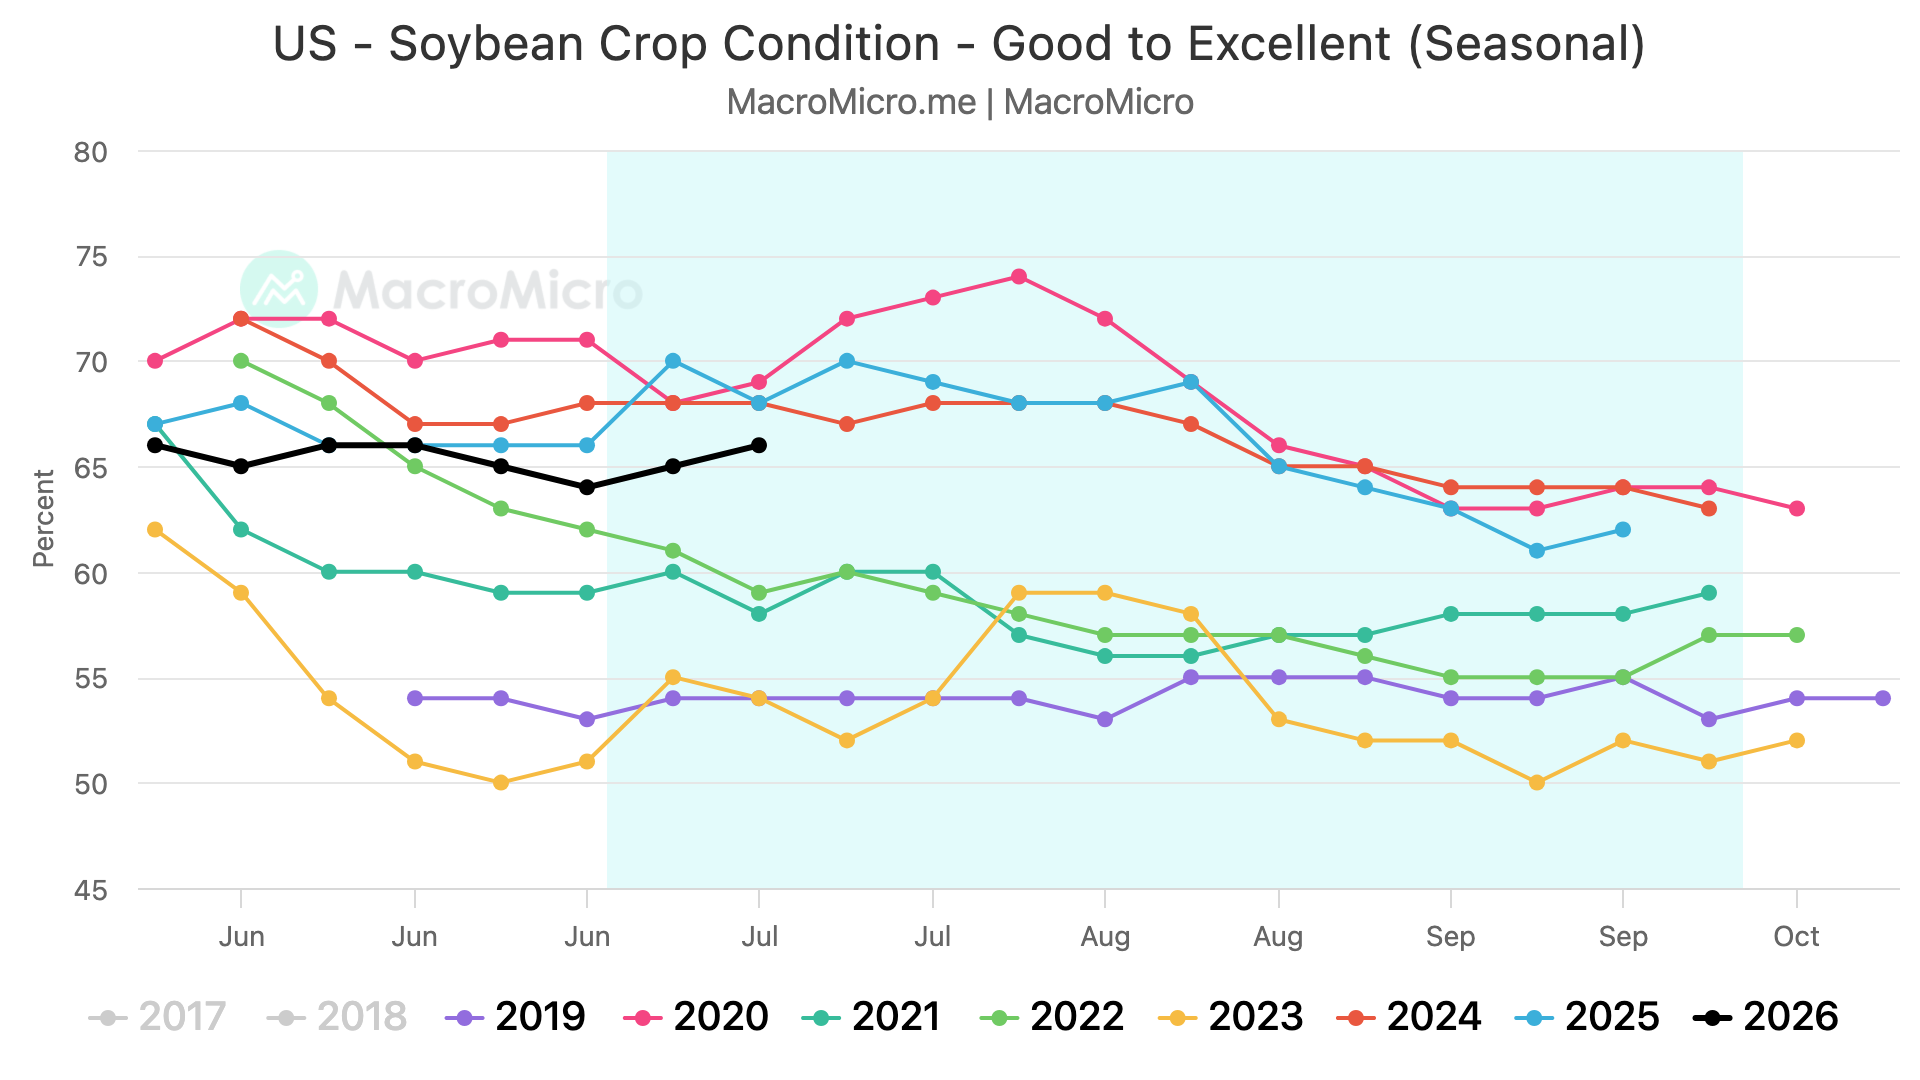
We had crop conditions yesterday.
Corn dropped 1 point, while soybeans improved 1 point.
Here is how those stack up vs prior years.
Corn is -7% below last year, but still +2% above the 5-year average.
Soybeans are -2% below last year, but +4% better than the 5-year average.
Overall the crop doesn’t appear great, but not bad either.
Big Yield Estimates
We have started to see some private yield estimates come out.
I believe StoneX's estimates come out August 4th.
Despite the weather issues, a lot of these guys are still predicting yield well above trend.
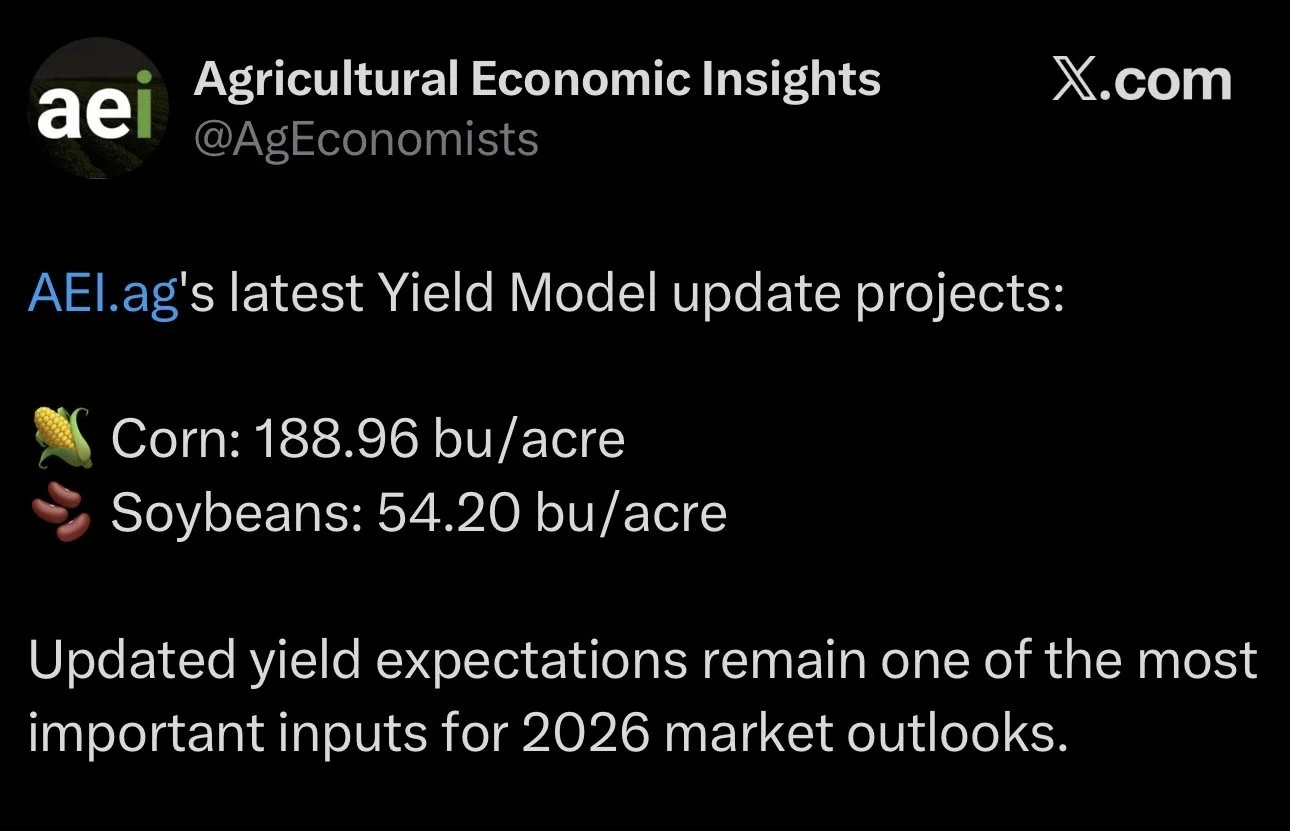
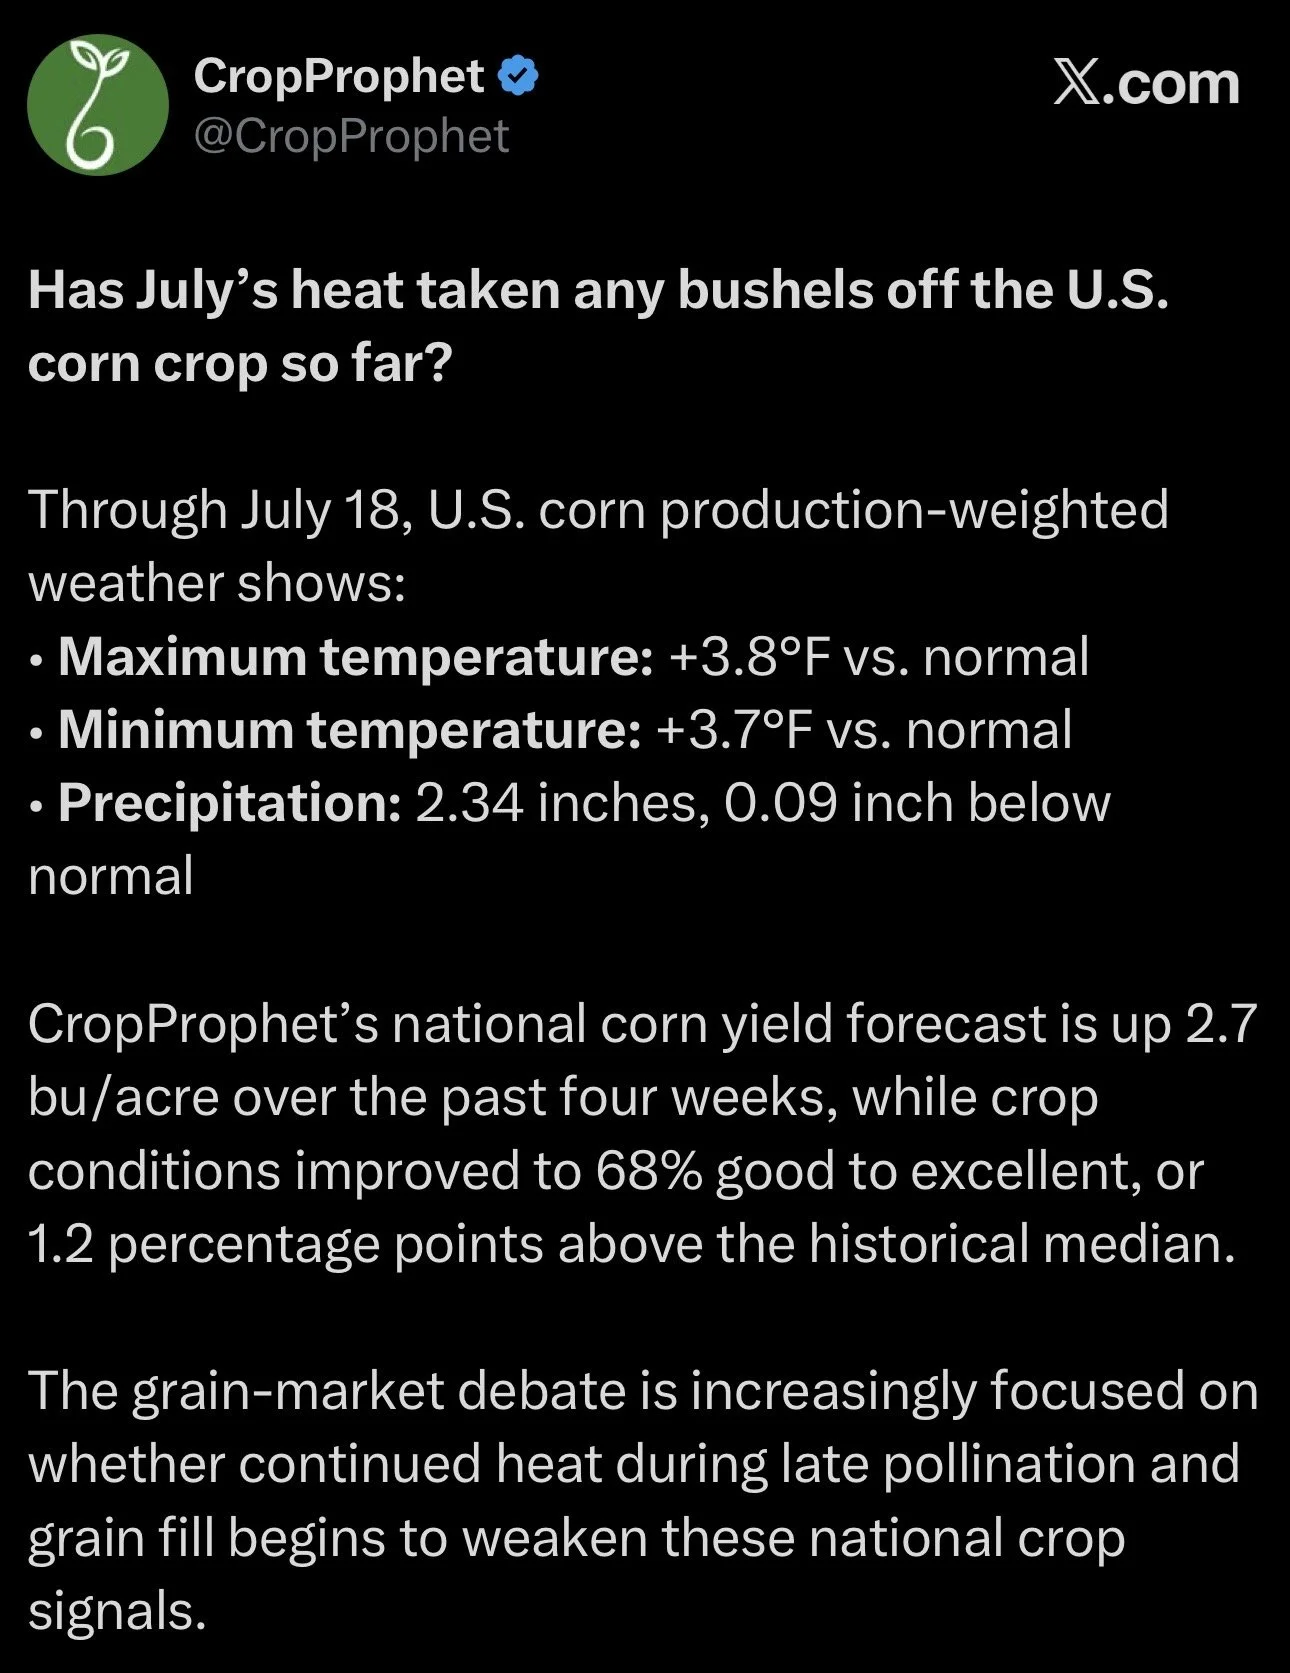
The two private estimates that have been posted are AgEconomics and Crop Prophet.
AgEconimics has nearly 189 bpa for corn and 54.2 for soybeans.
CropProphets exact number is not available for the public but it's above trend, they said their corn yield model has risen by 2.7 bpa over the last month.
Weather
Heat:
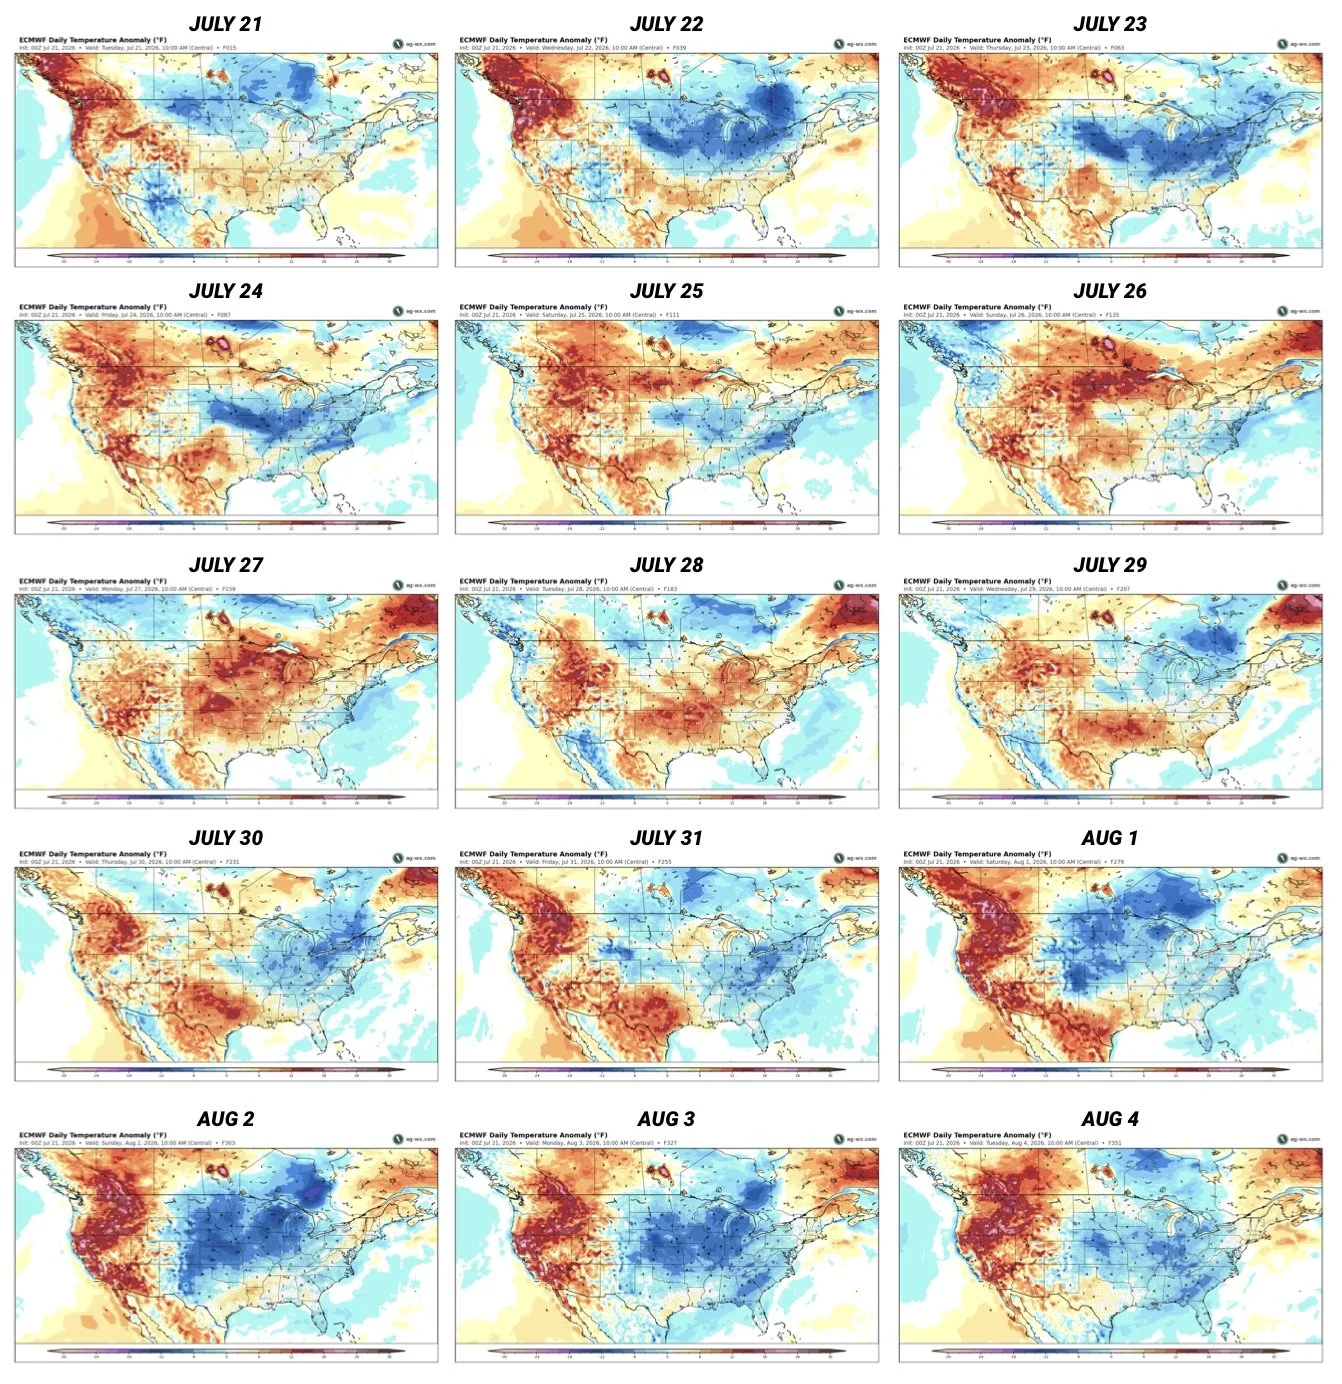
Here is every day for the next two weeks.
The end of this week is cooler than normal, however heat is suppose to pick back up for a few days starting early next week.
It's then expected to cool off next week and into the first week of August.
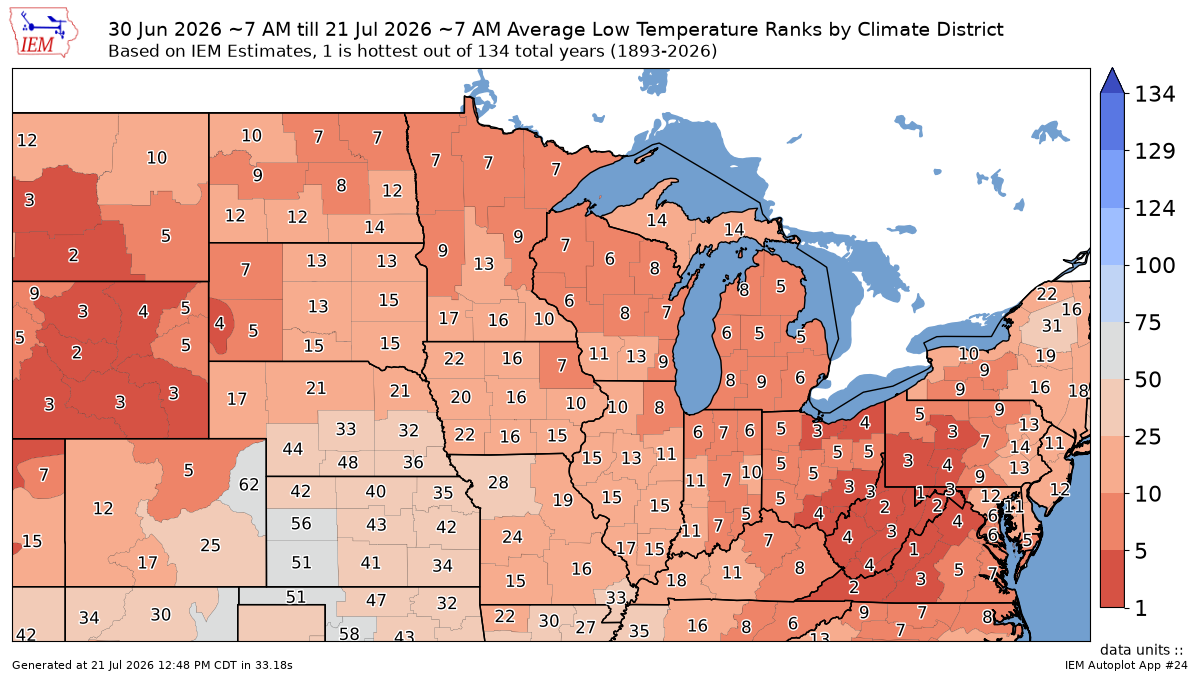
Here is the nightime temp ranks for the month of July so far.
We have seen one of the hottest July's ever when it comes to nighttime.
Precip:
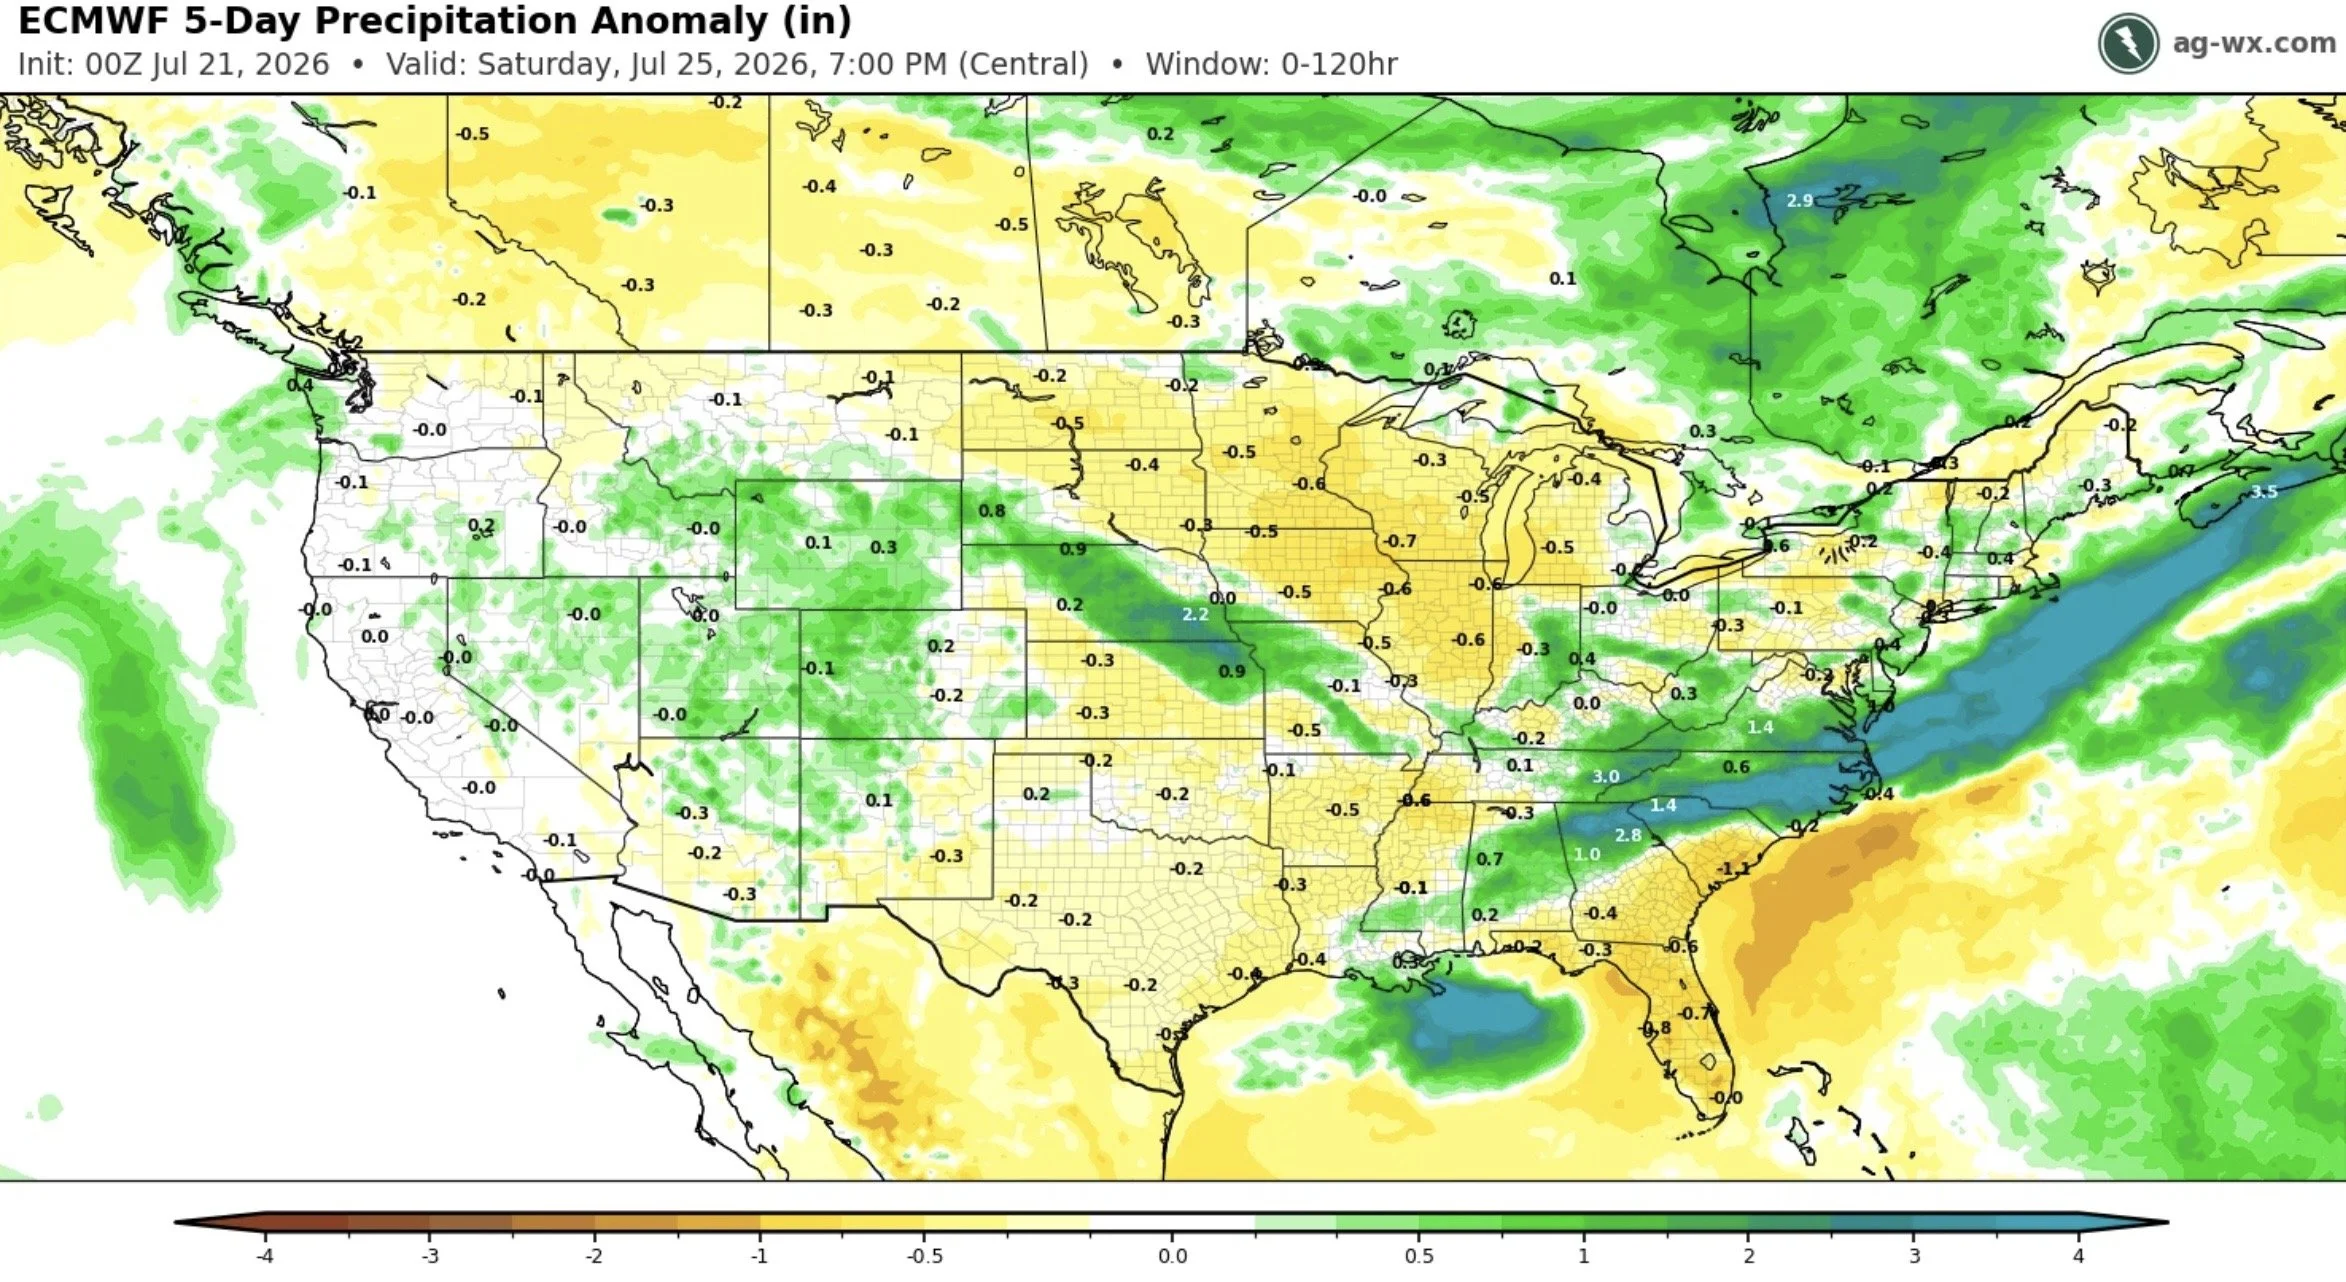
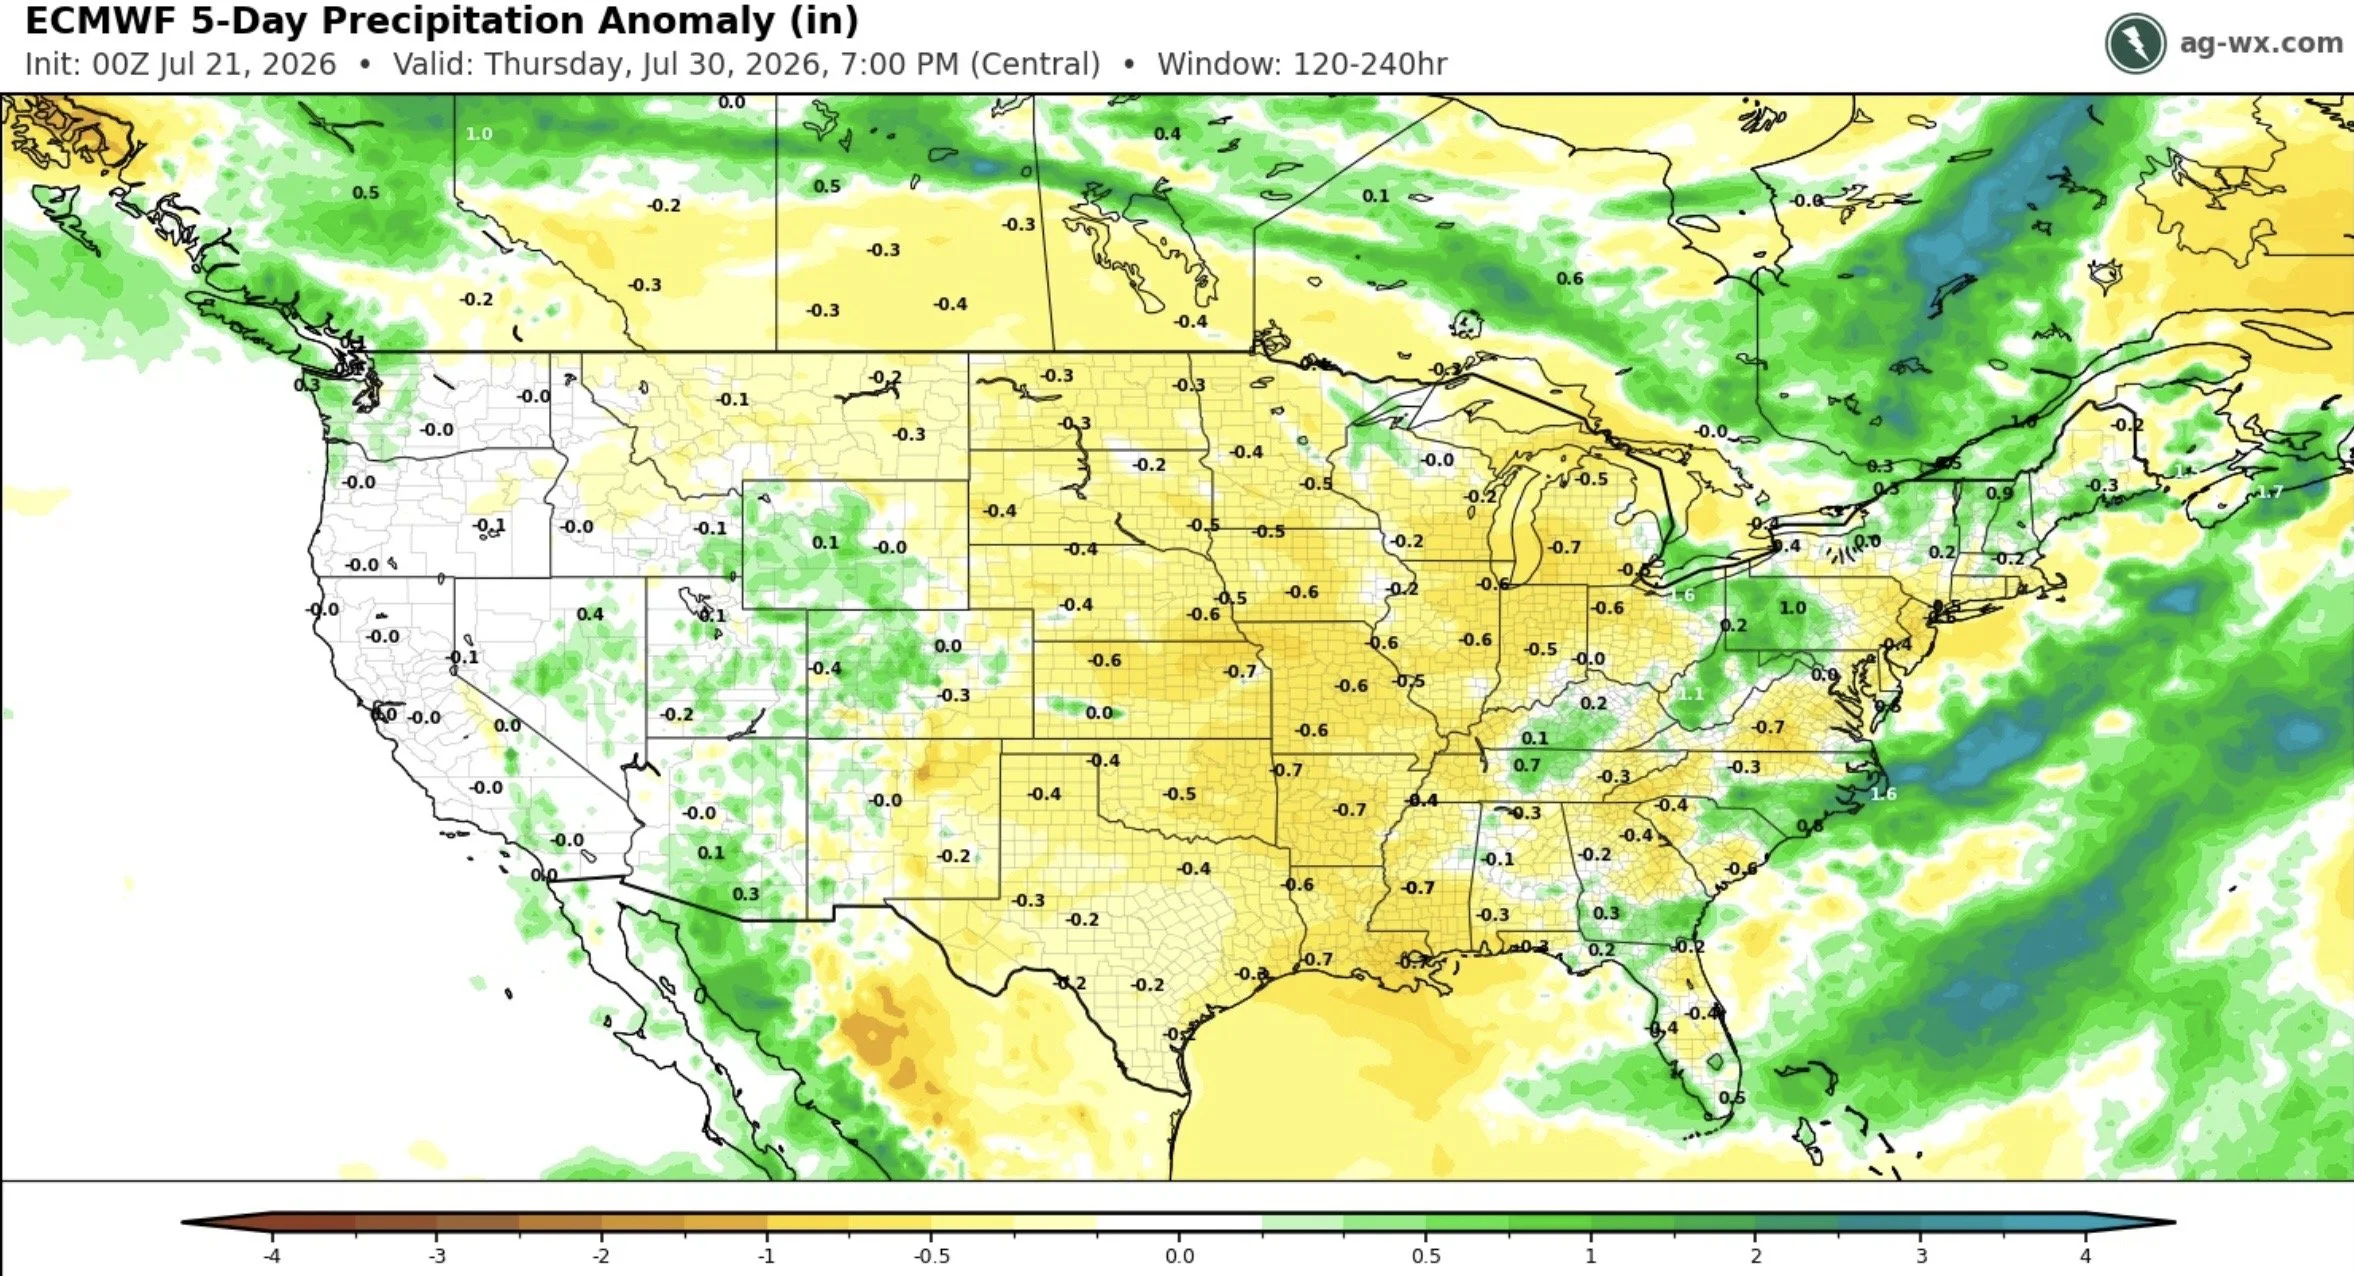
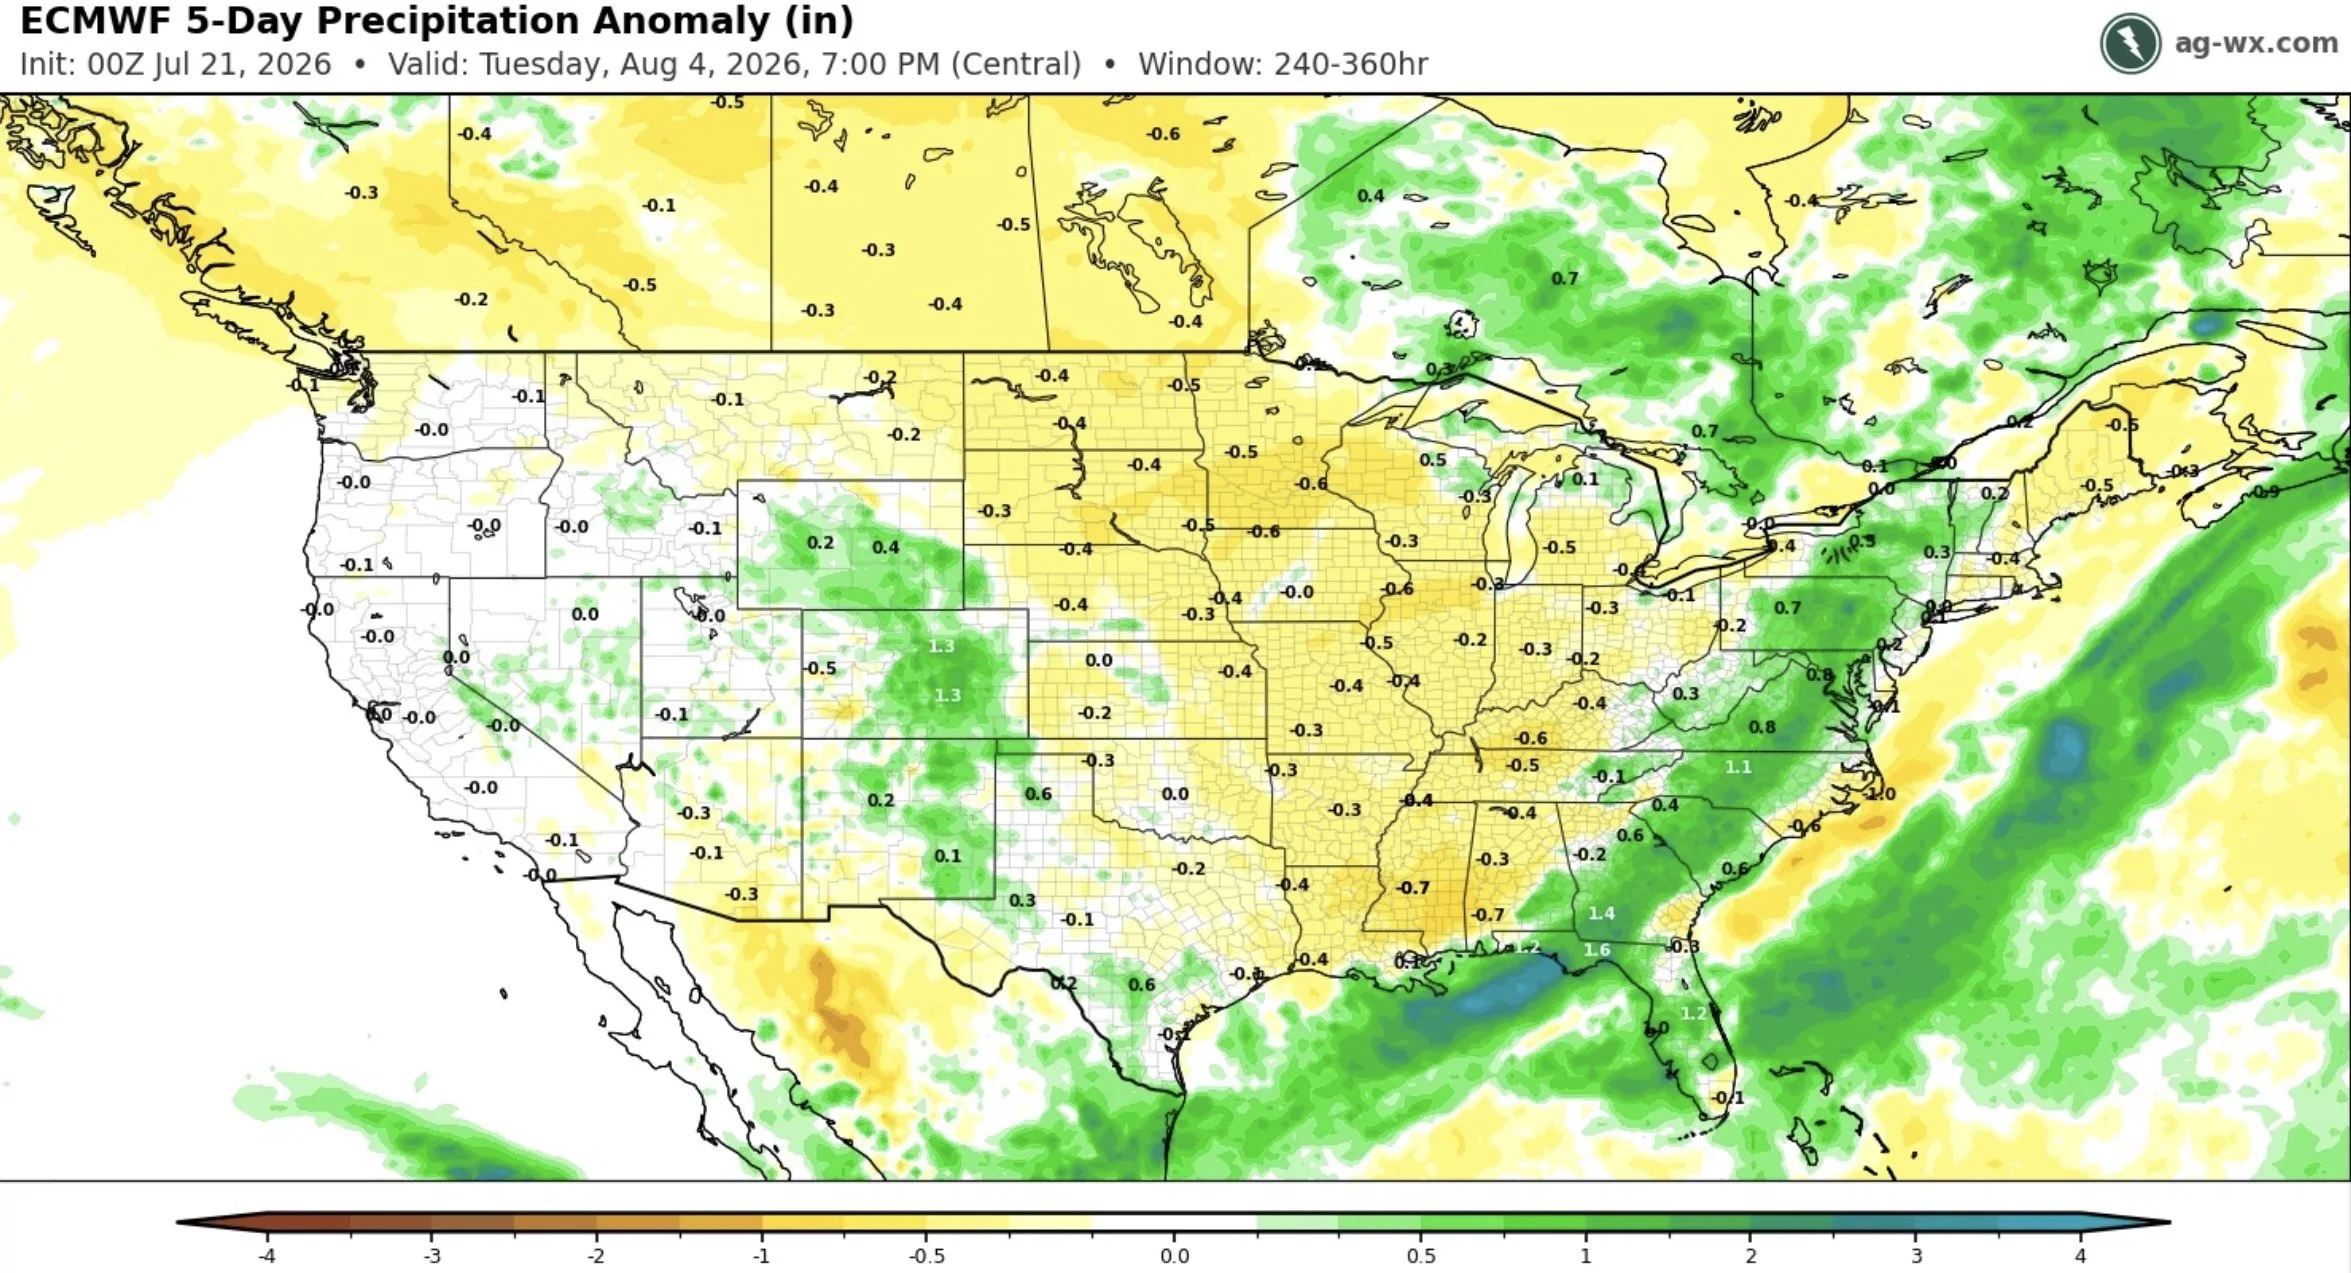
Now the forecasts do look pretty dry throughout the rest of the month.
If this continues, you could expect us to continue to add some weather premium.
But we have to keep in mind we have already added plenty of premium.
I mean corn is +50 cents off it's lows and soybeans are over +$1.00 off their lows.
0-5 Days
5-10 Days
10-15 Days
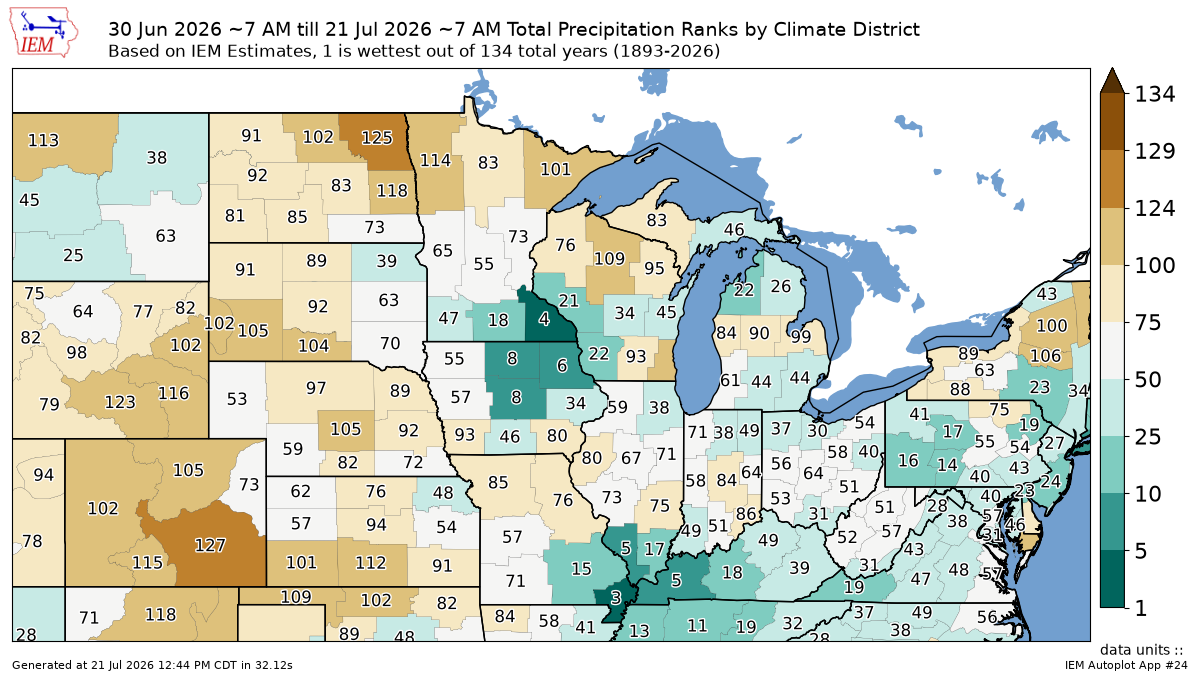
Here is the precip ranks for the month of July so far.
It's been pretty spotty.
Some areas out west such as Nebraska and areas up north such as North Dakota have been really dry.
But then you have places like Iowa and parts of the I-states who have seen plenty of moisture.
Weather hasn’t been perfect, but it hasn’t been detrimental either nationally.
Although I am sure some of those places out west could sure use some rain.
Today's Main Takeaways
Corn
Exports:
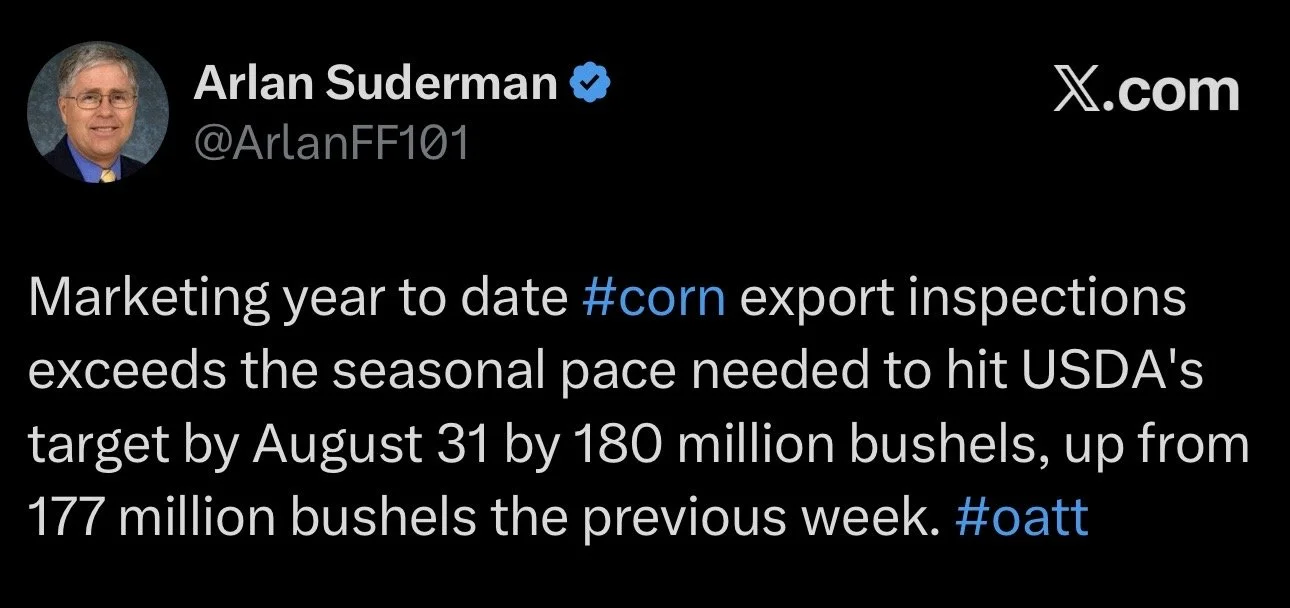
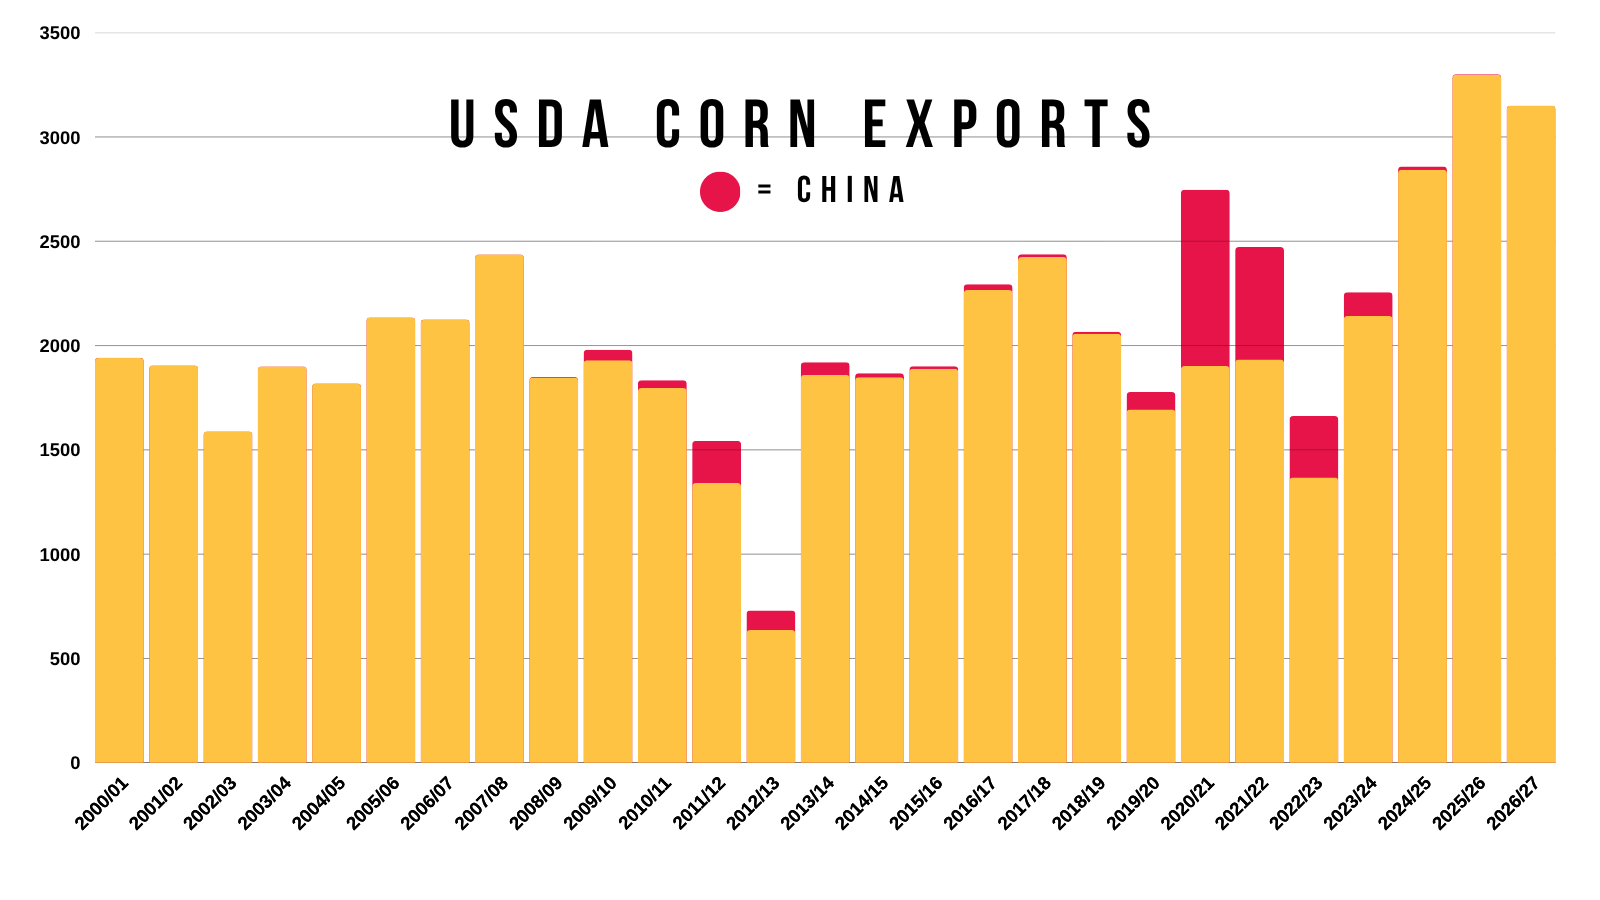
Corn demand remains phenomenal.
We are actually 180 million bu ahead of the USDA's target pace.
So that's a positive.
Short Term Thoughts: Define Your Risk
We have had a great rally off the lows.
We are +50 cents off the lows. We erased the entire sell off from June.
Over the next few weeks, it's really going to come down to two main factors.
Weather and the Black Sea.
We are in a full blown weather market now, and also have some geopolitics that add even more volatility.
Are the forecasts threatening enough to justify us continuing to rally?
At a certain point, the bulls will need to continue to be fed.
We have clearly already priced in plenty of weather premium. The question is, when is it fully priced in?
Supply scare rallies are meant to be protected.
Demand led rallies are meant to be respected.
Can we continue to rally off the back of weather or the Black Sea escalations?
Yes it is absolutely possible. If heat builds or it stays dry, we can continue to go higher.
If the Black Sea situation gets worse, we can continue to follow wheat higher.
However, since this is a supply scare rally, it needs to be treated as such.
We are still in a seasonal time frame where if weather turns favorable, we could very easily give back a large part of this rally.
So, if you are someone who knows you will have to move stuff off the combine or you need to make sales for whatever reason. We want to protect this rally in some sort of fashion.
One of our favorite things to do here is simply spending a little bit of money on puts to give yourself a floor and worst case scenario.
Oftentimes, if you are wondering whether you should protect a rally or not, ask yourself this simple question.
Would you be more mad if you sold and we went 50 cents higher?
Or if you did nothing and we went 50 cents lower?
Where is your risk?
Long Term Thoughts: Bull Case Remains
Now on the flip side. If you are someone who has a ton of storage and doesn’t have to do anything. We do not mind being more patient. As you can afford not to be as aggresive.
As I've talked about countless times, there is still a developing story in new crop corn.
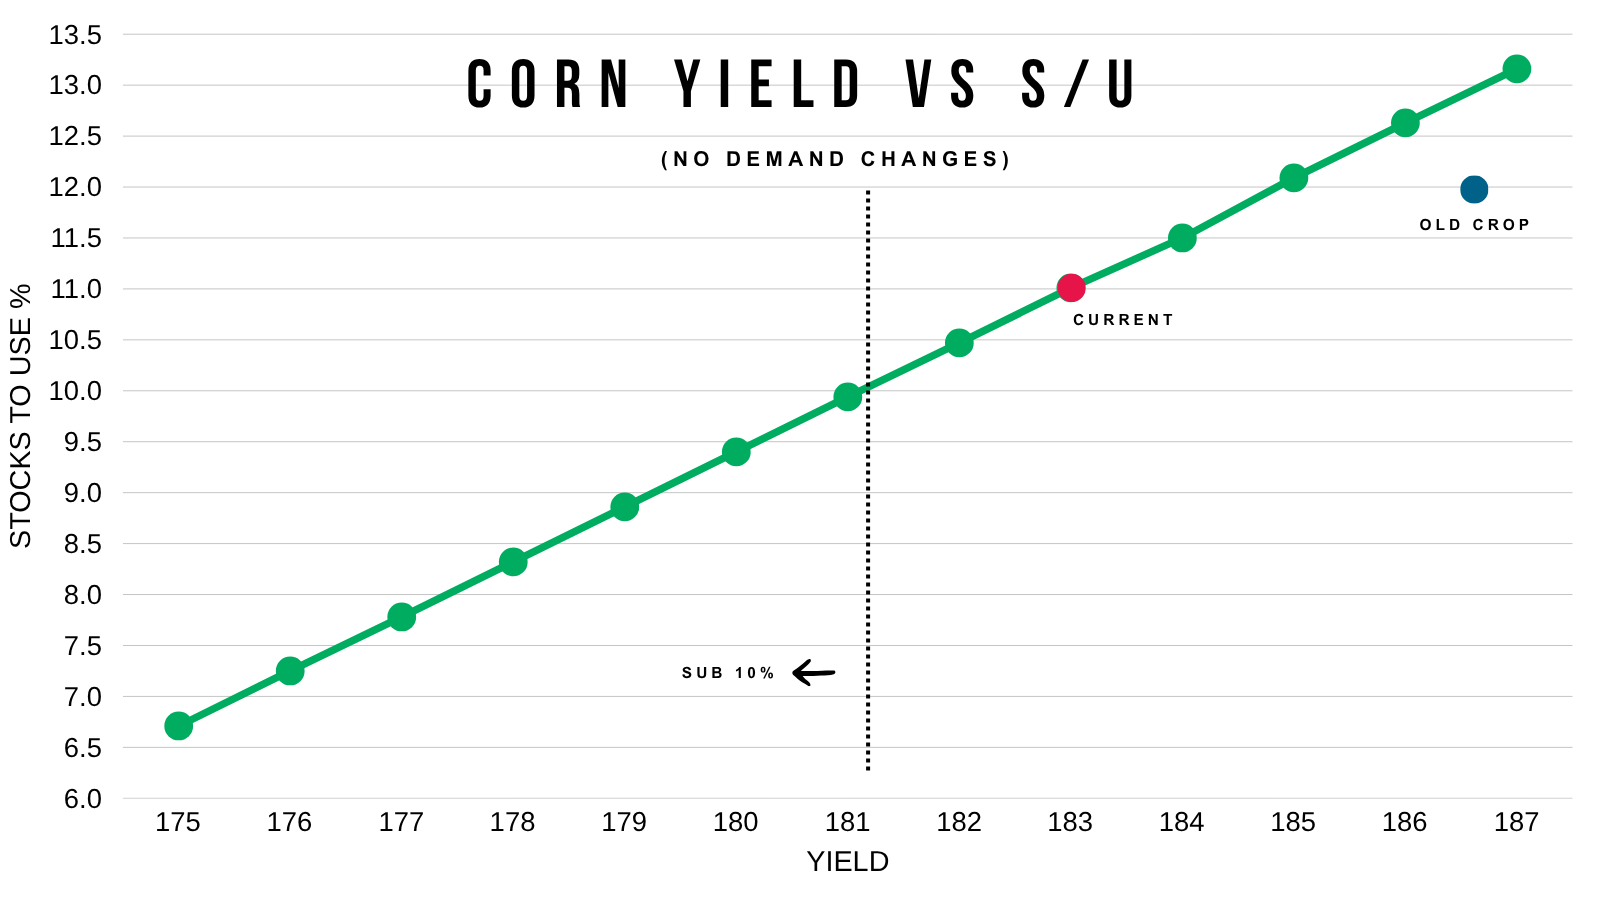
Like I showed last week, if yield starts to fall, we eat into that balance sheet fast. Anything 181 or below could potentially result in a sub 10% stocks to use. Which would be viewed as bullish.
Yes, we have all of these analysts claiming above trendline yields.
But we just had the wettest June on record, followed by the hottest July on record.
Weather hasn’t been perfect everywhere.
Last year, it took record acres AND a record yield to get the balance sheet as bearish as it was in old crop.
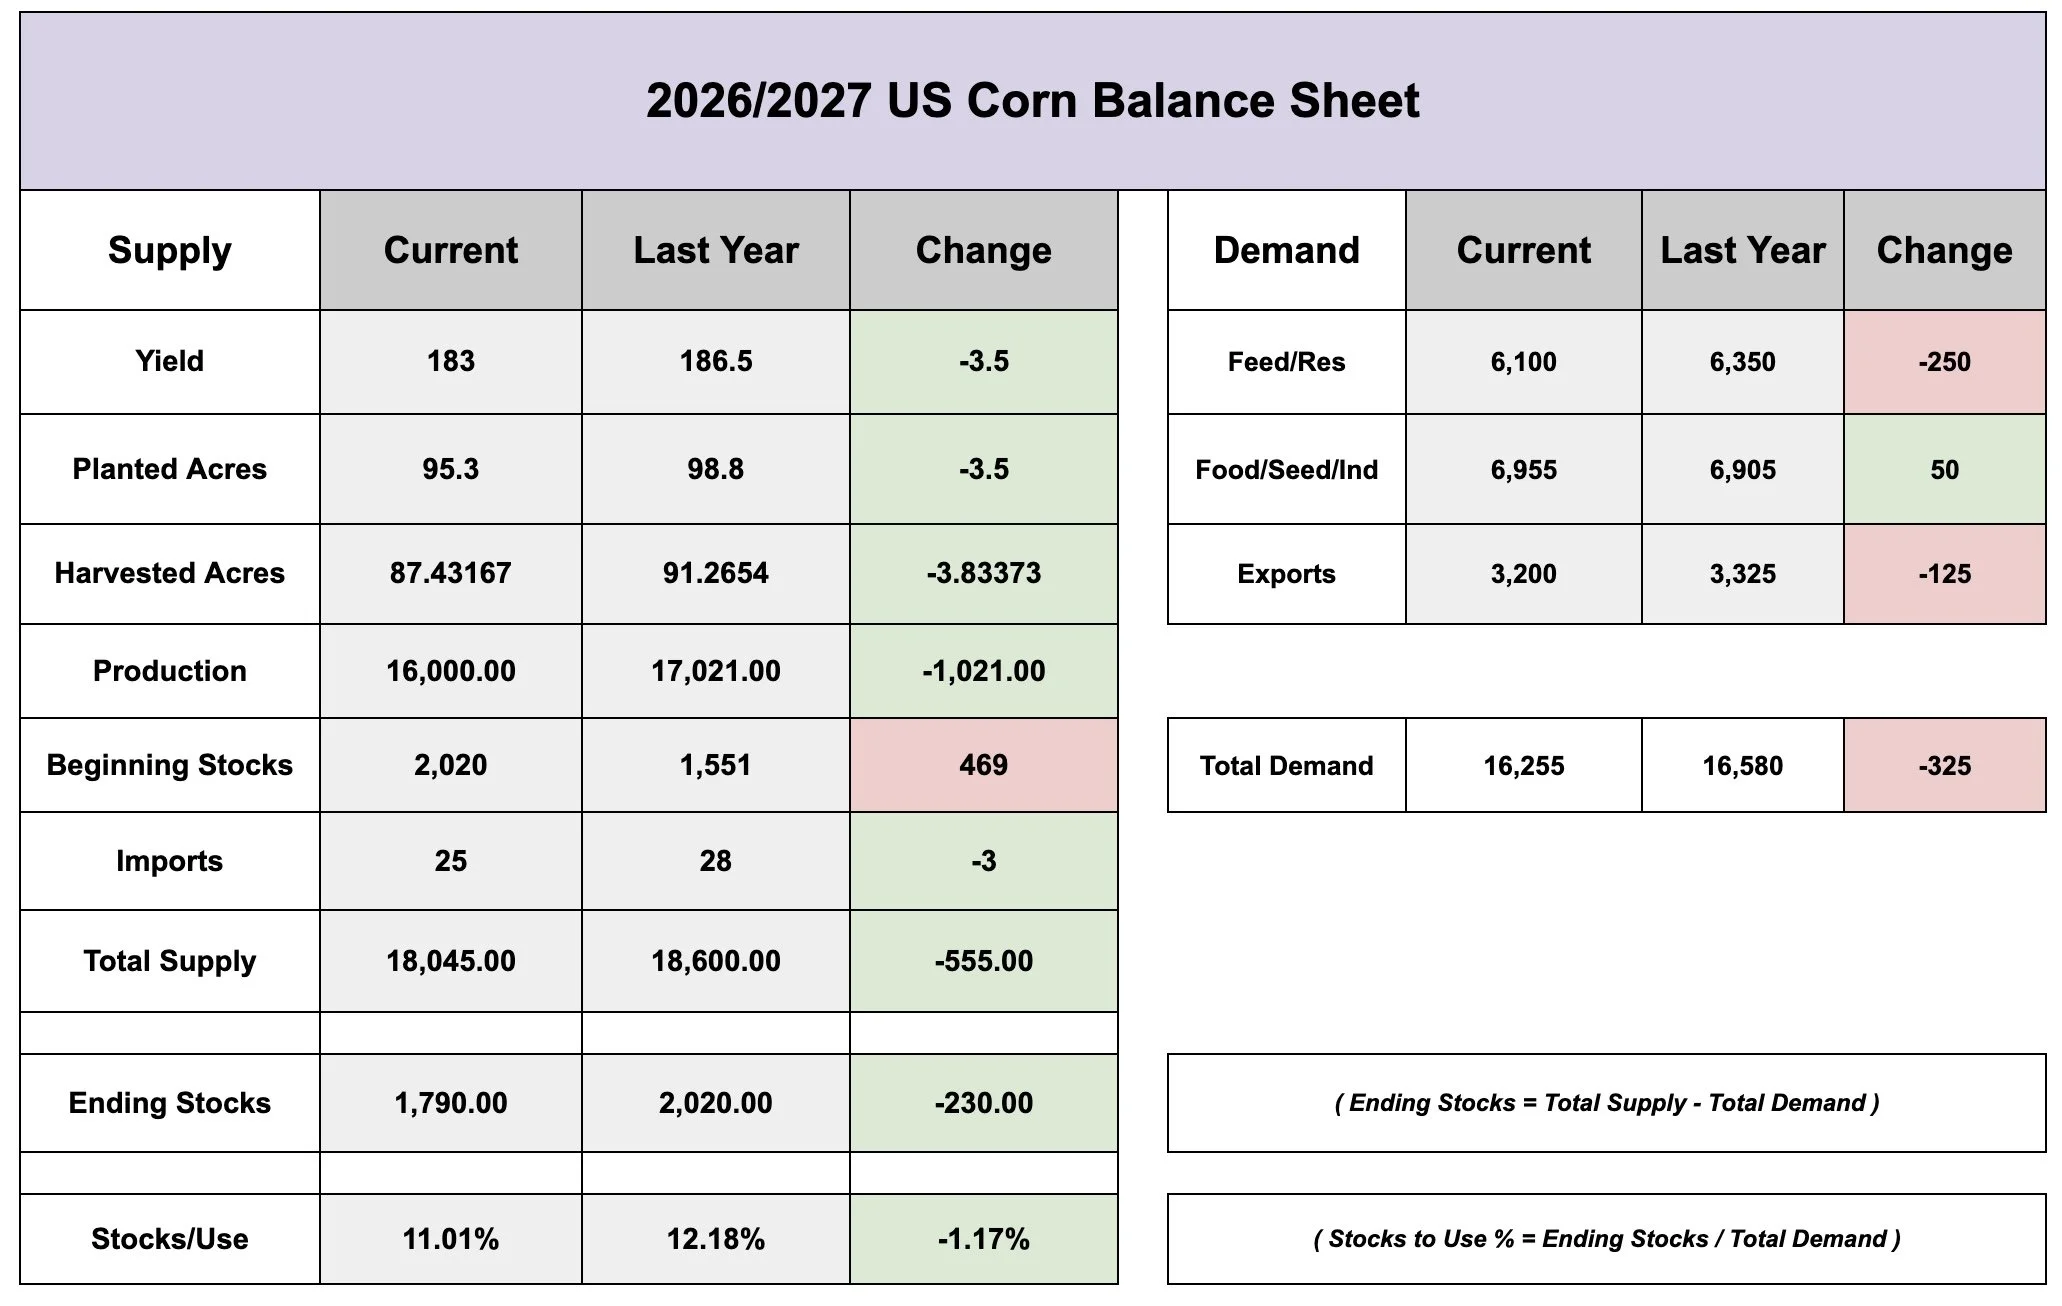
Right now, the new crop balance sheet is already looking at an 11% stocks to use. That is with using a 183 yield.
At the same time, demand hasn’t slowed down.
What happens when we lose supply but demand doesn’t slow down?
You'd argue prices need to go higher to incentive lower demand.
The new crop story is far more bullish than the old crop story.
We have yield expected to drop by a sizeable amount.
We have 3.5 million less acres.
New Crop vs Old Crop Balance Sheet
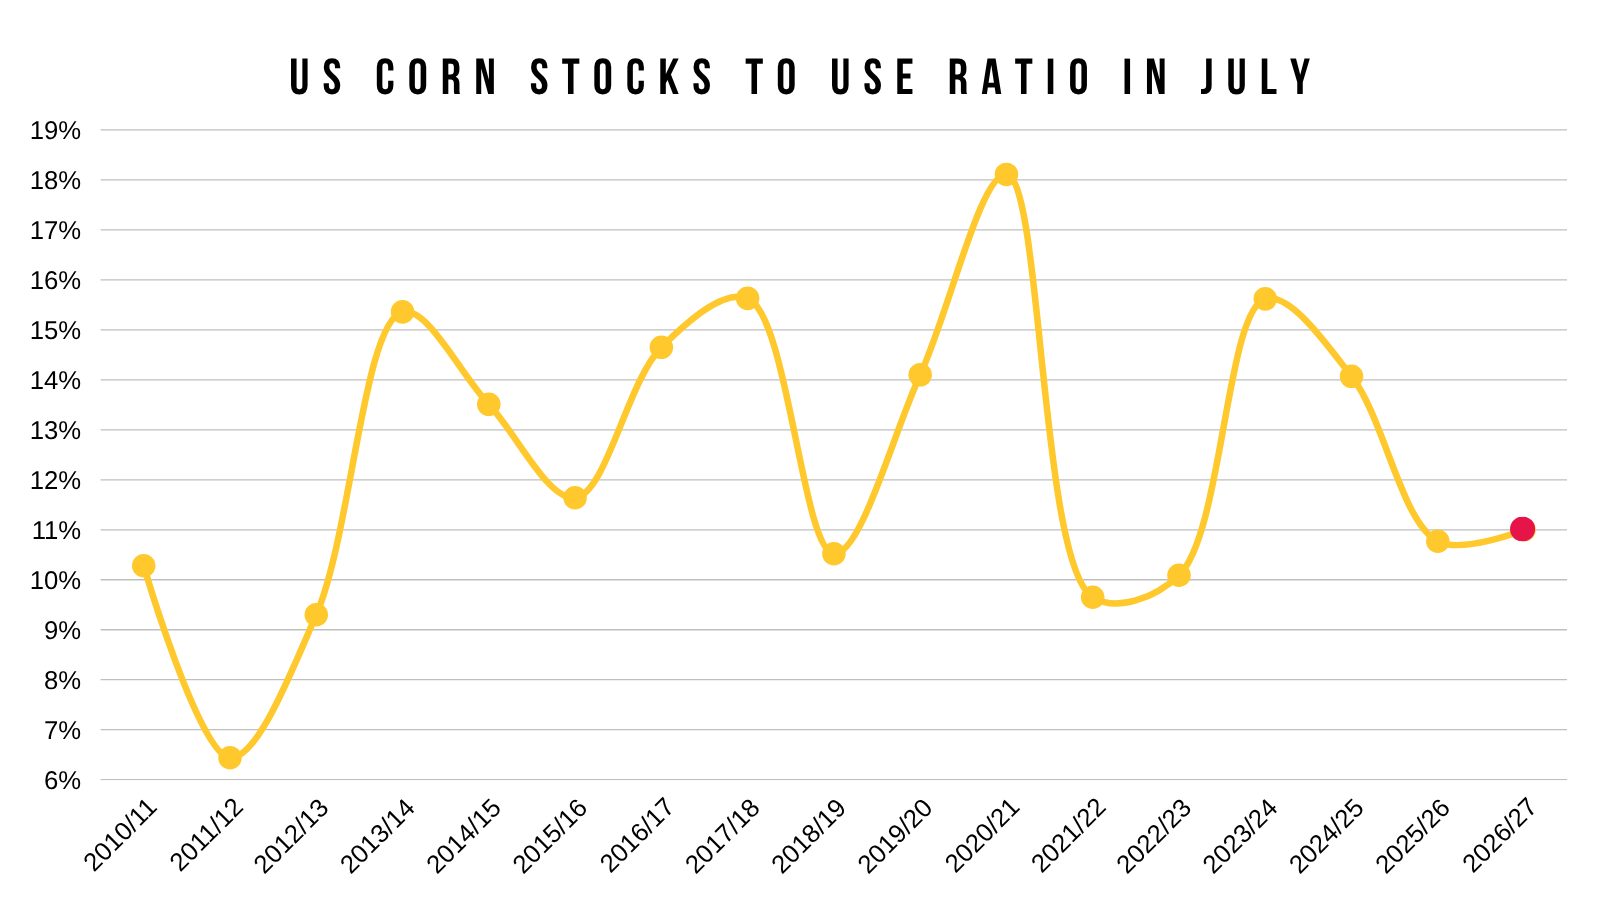
I wanted to again point out that our stocks to use for the month of July is one of the tightest we've seen in years.
It is on par with 2022. So we are already starting at relatively tight levels compared to where we usually are this time of year in the past.
Yes. You could say the same thing about last year. But the USDA raised yield from 181 to 186.5 bpa so it clearly changed things.
As we've talked about for months, we still think China buys corn at some point.
Around harvest is still when it would logically make the most sense for them to do so.
Which is another bullish wild card.
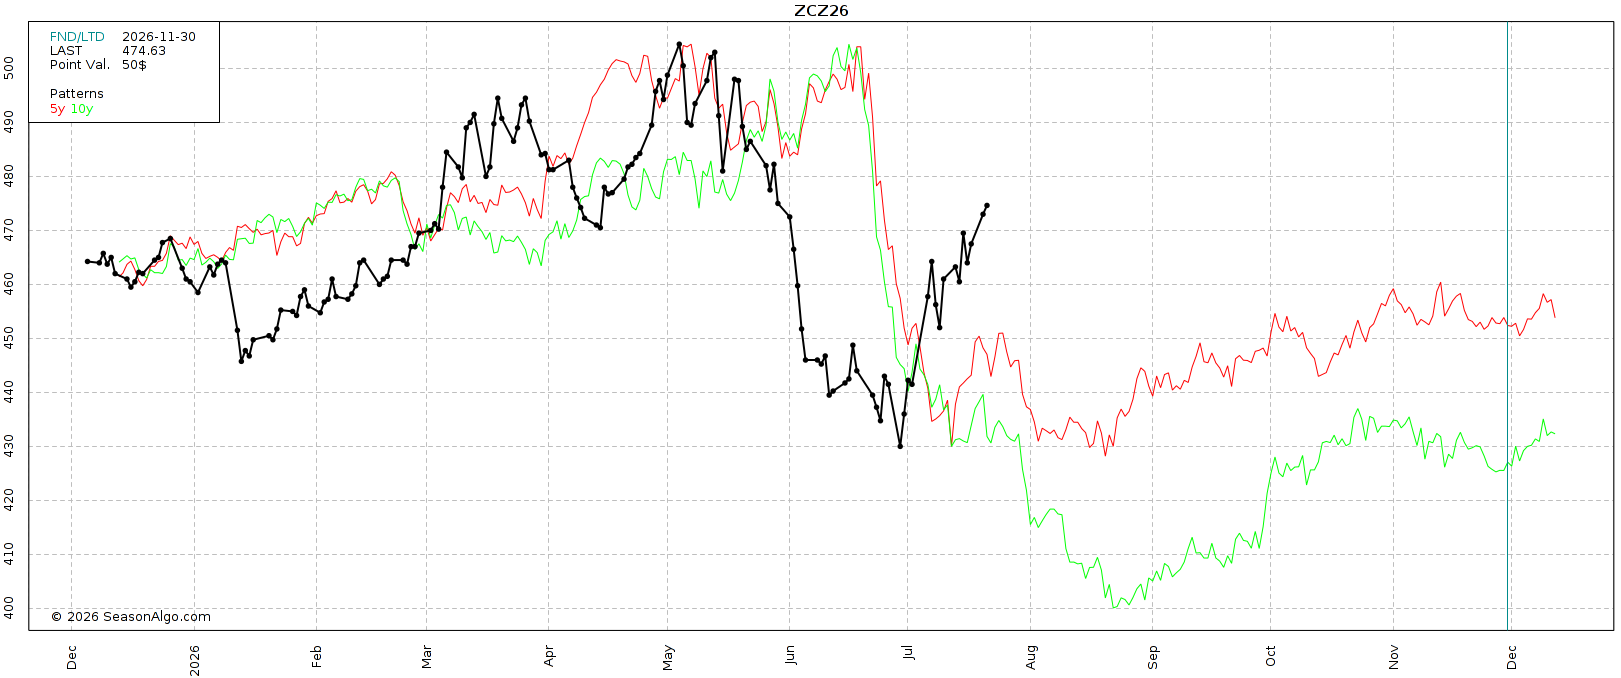
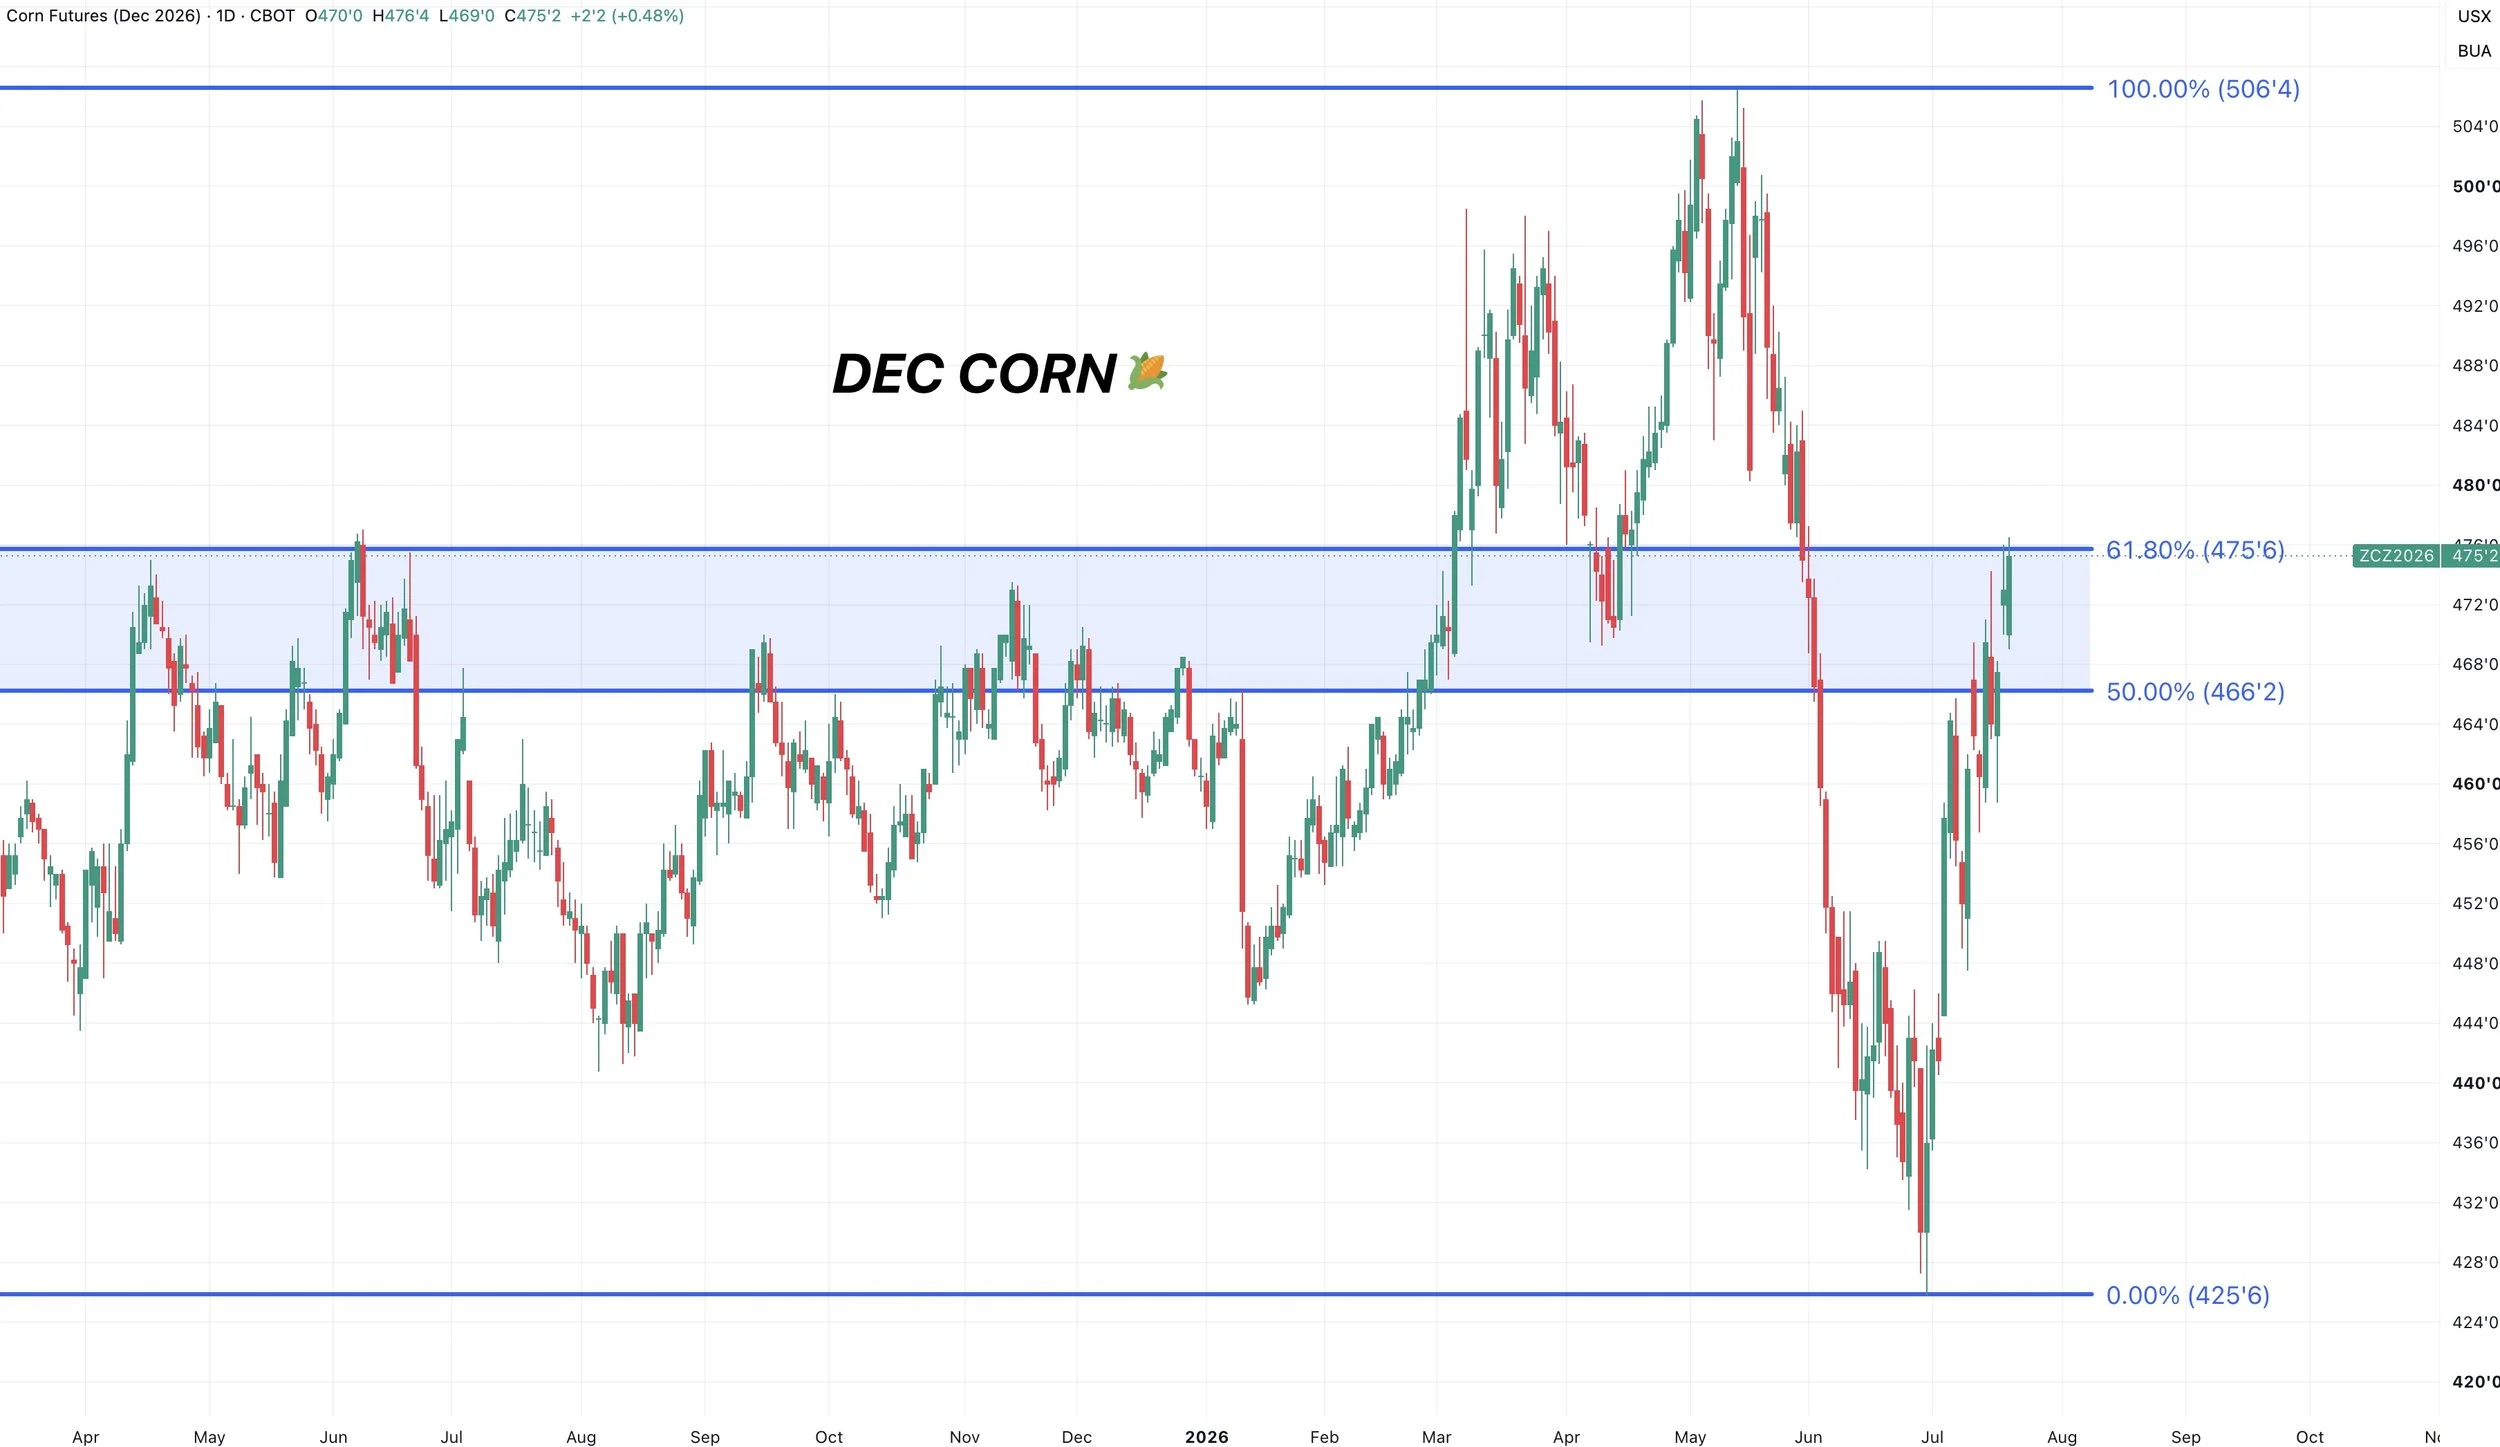
Dec Corn Chart:
We closed right at the 61.8% retracement of the entire sell off.
The most common level for a bounce to struggle.
So if this is purely a relief bounce, this would be where we'd expect to find resistance.
This is usually where the market decides if this is just a bounce in an overall downtrend or not.
As unless we clearly break above this level, the trend is still lower and offers risk.
If we break above, then it might suggest this is no longer a simple bounce in a downtrend.
So again for anyone that can’t afford to be patient, we like protecting this level.
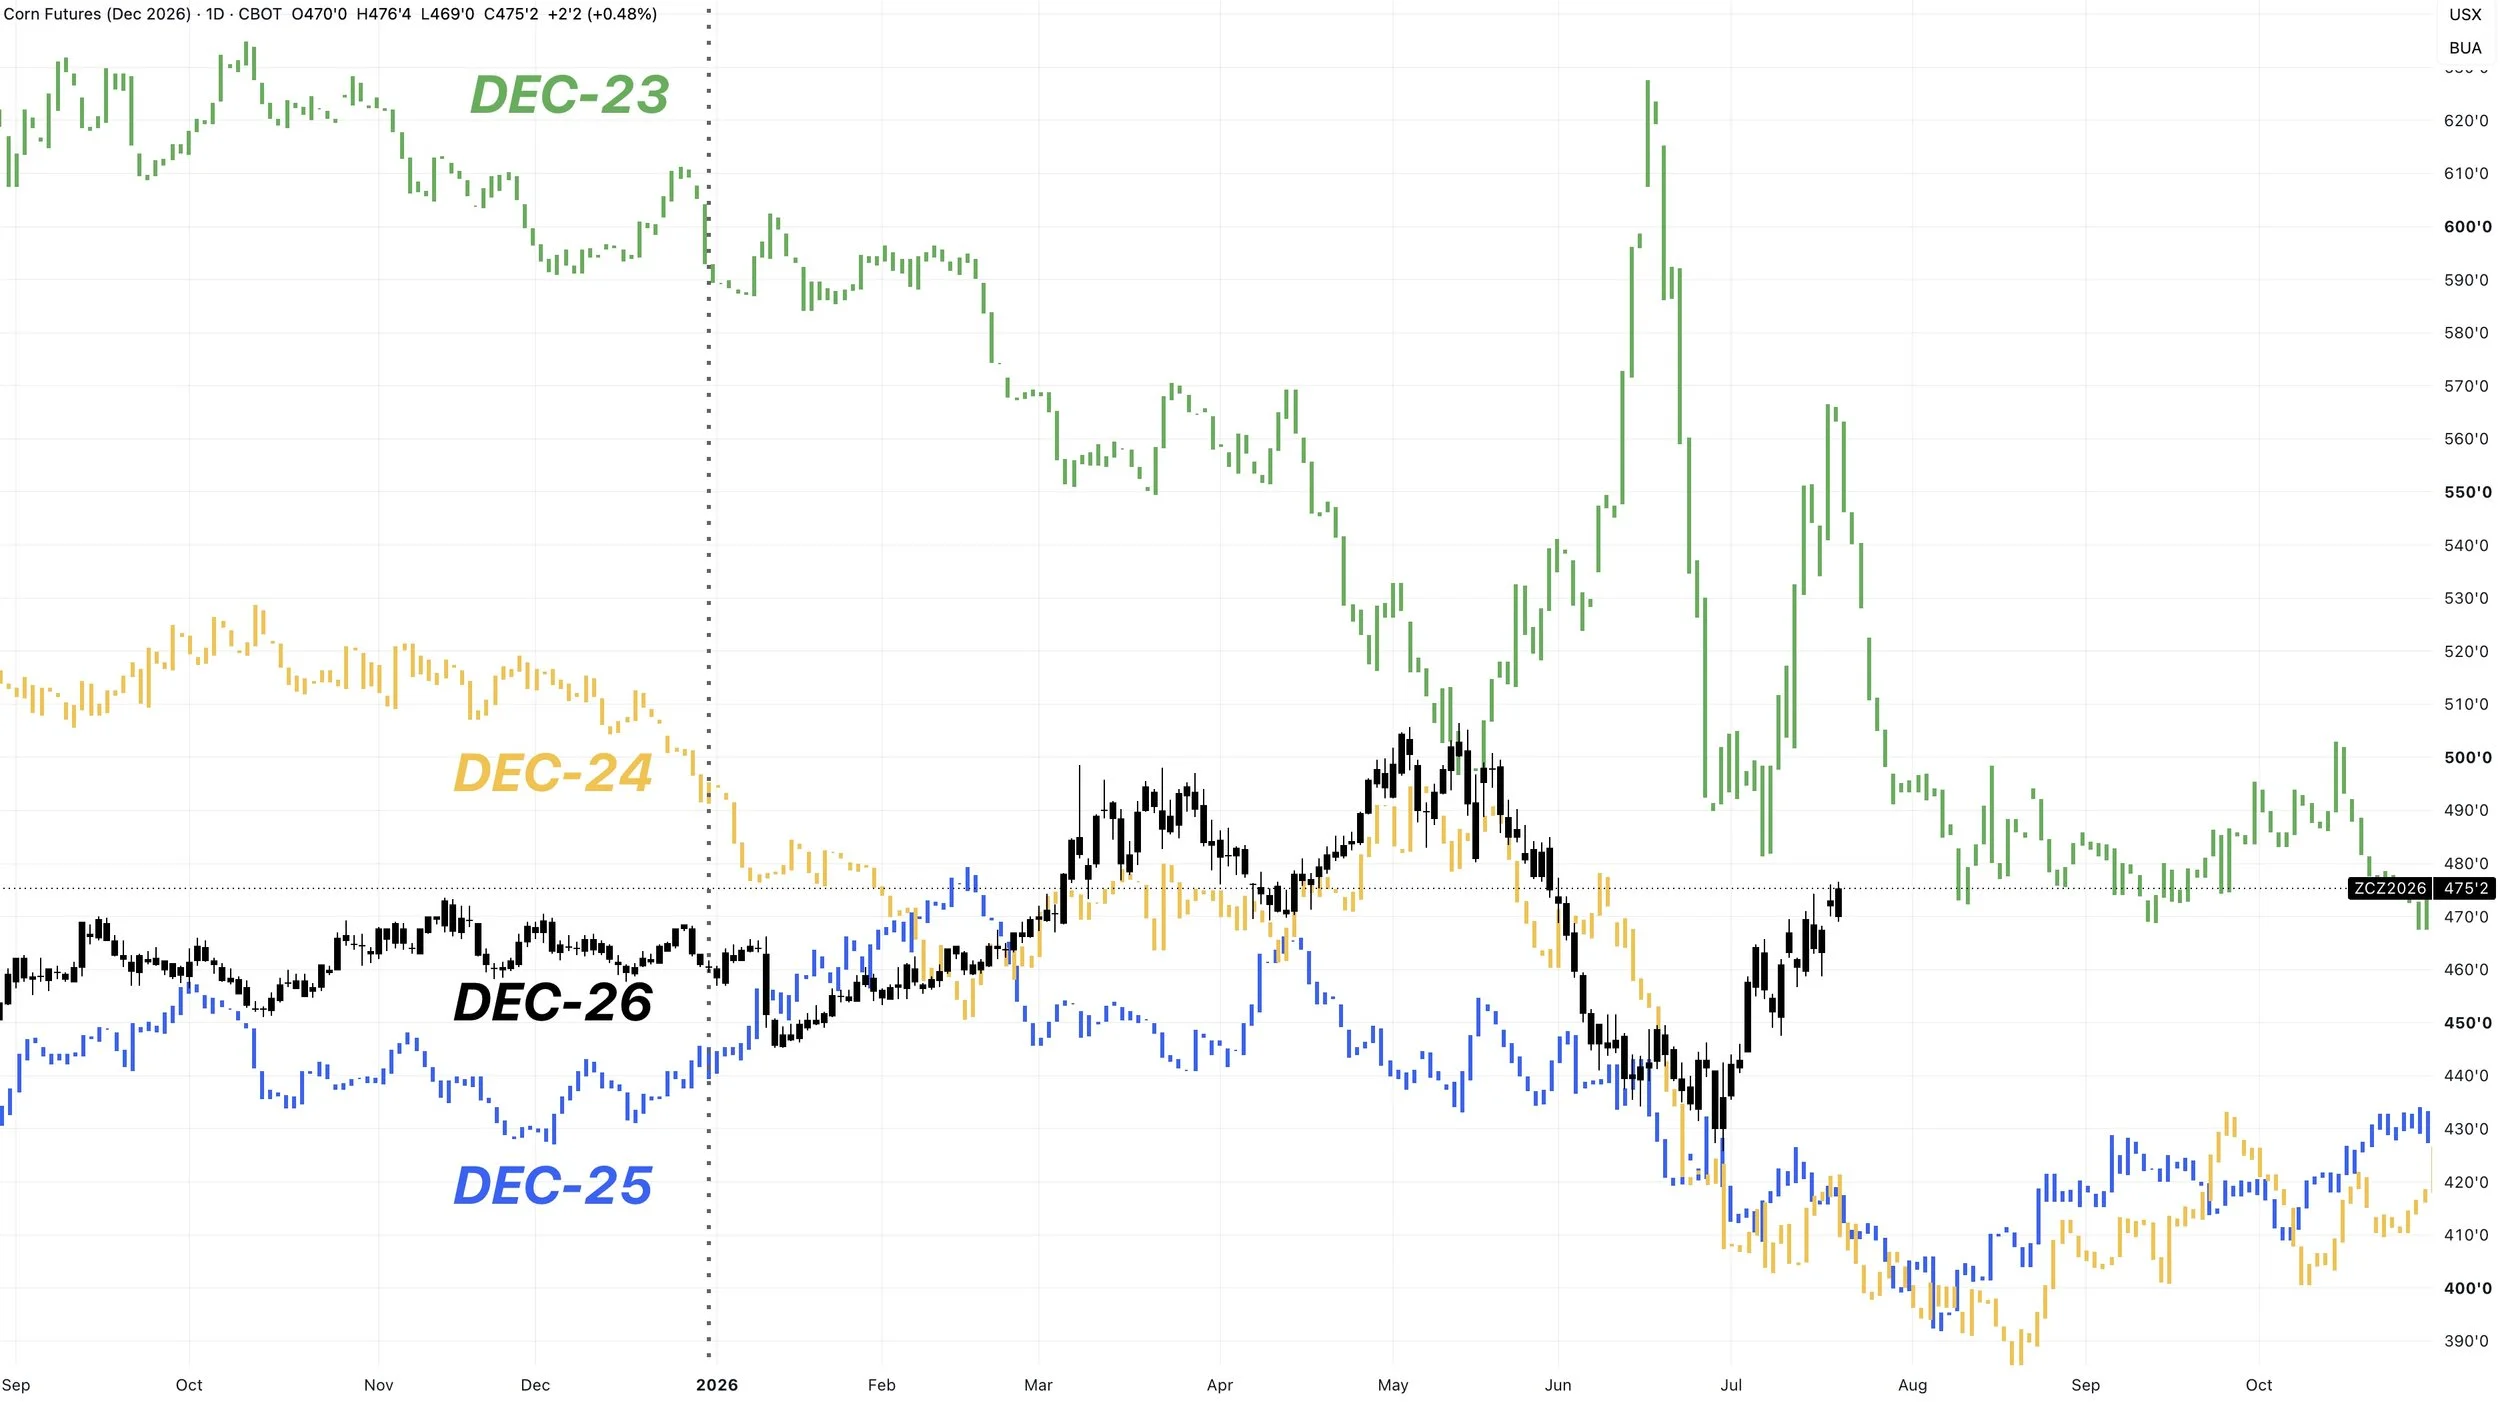
Dec Corn: 26 vs 25 vs 24 vs 23
We are a good 50 to 75 cents higher than we were in 2024 and 2025 at this same time period.
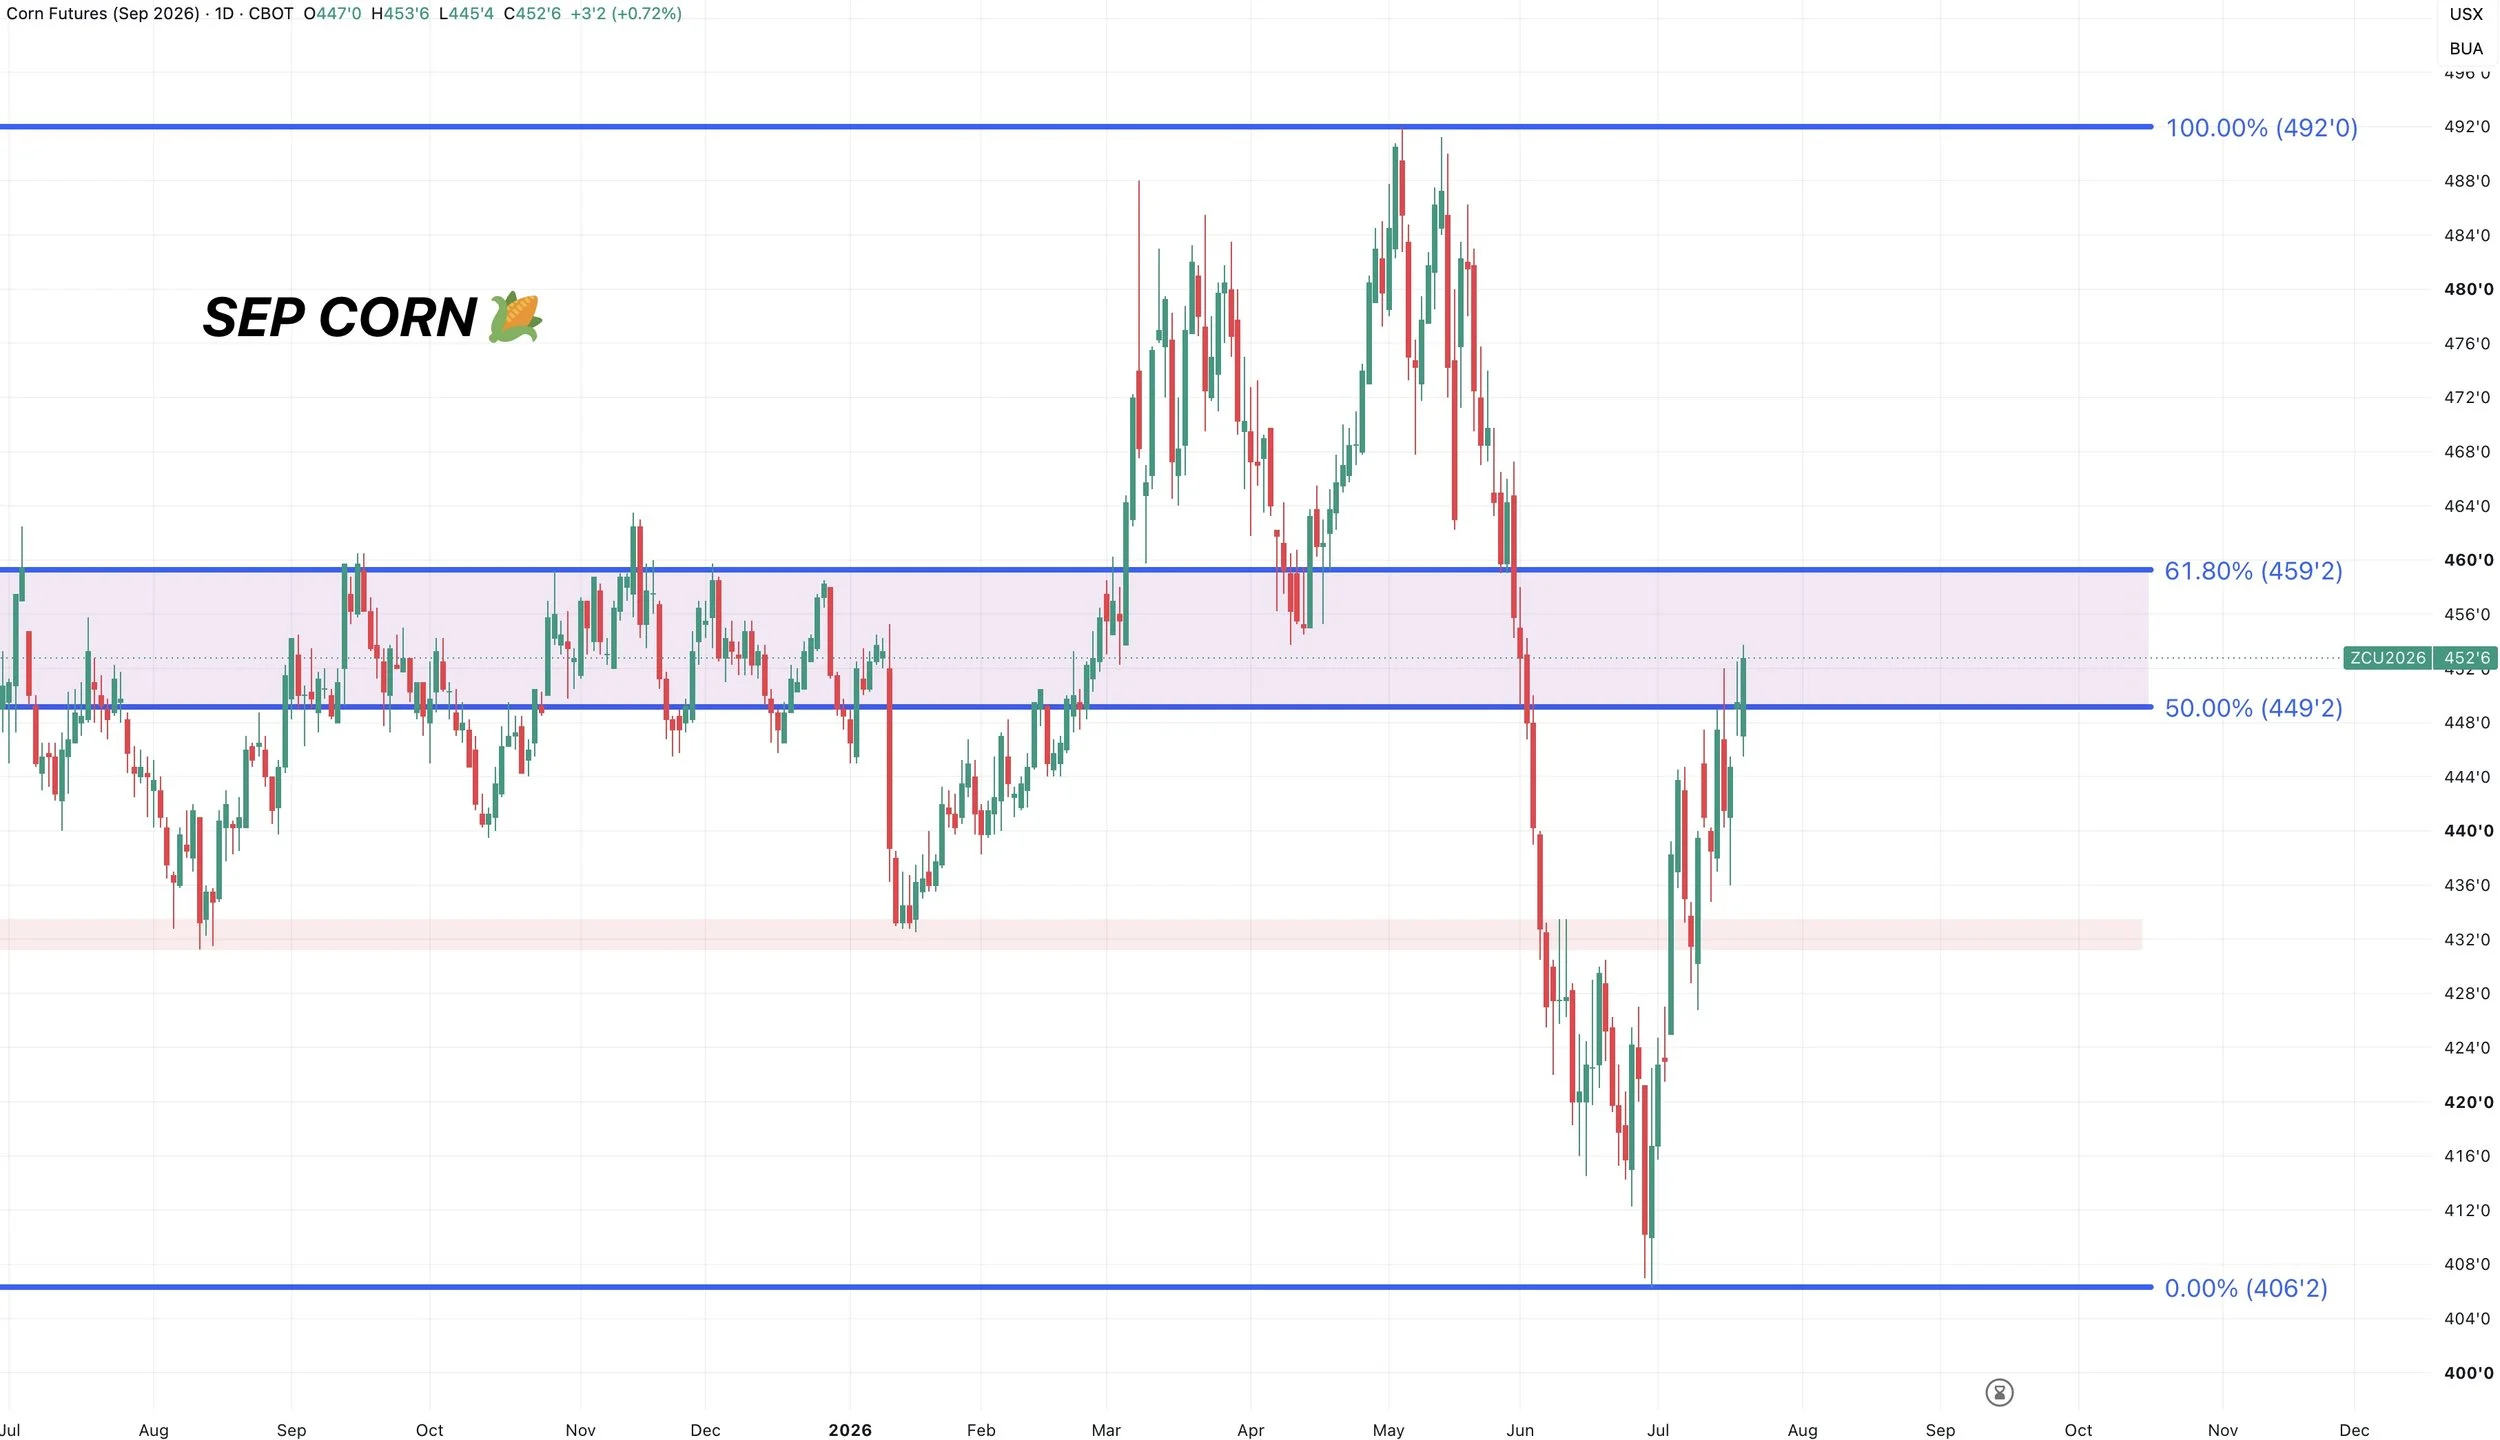
Sep Corn Chart:
Also right inside the golden zone where the market often makes a decision.
The most common area for a bounce to fail.
This area has also been key support and resistance countless times.
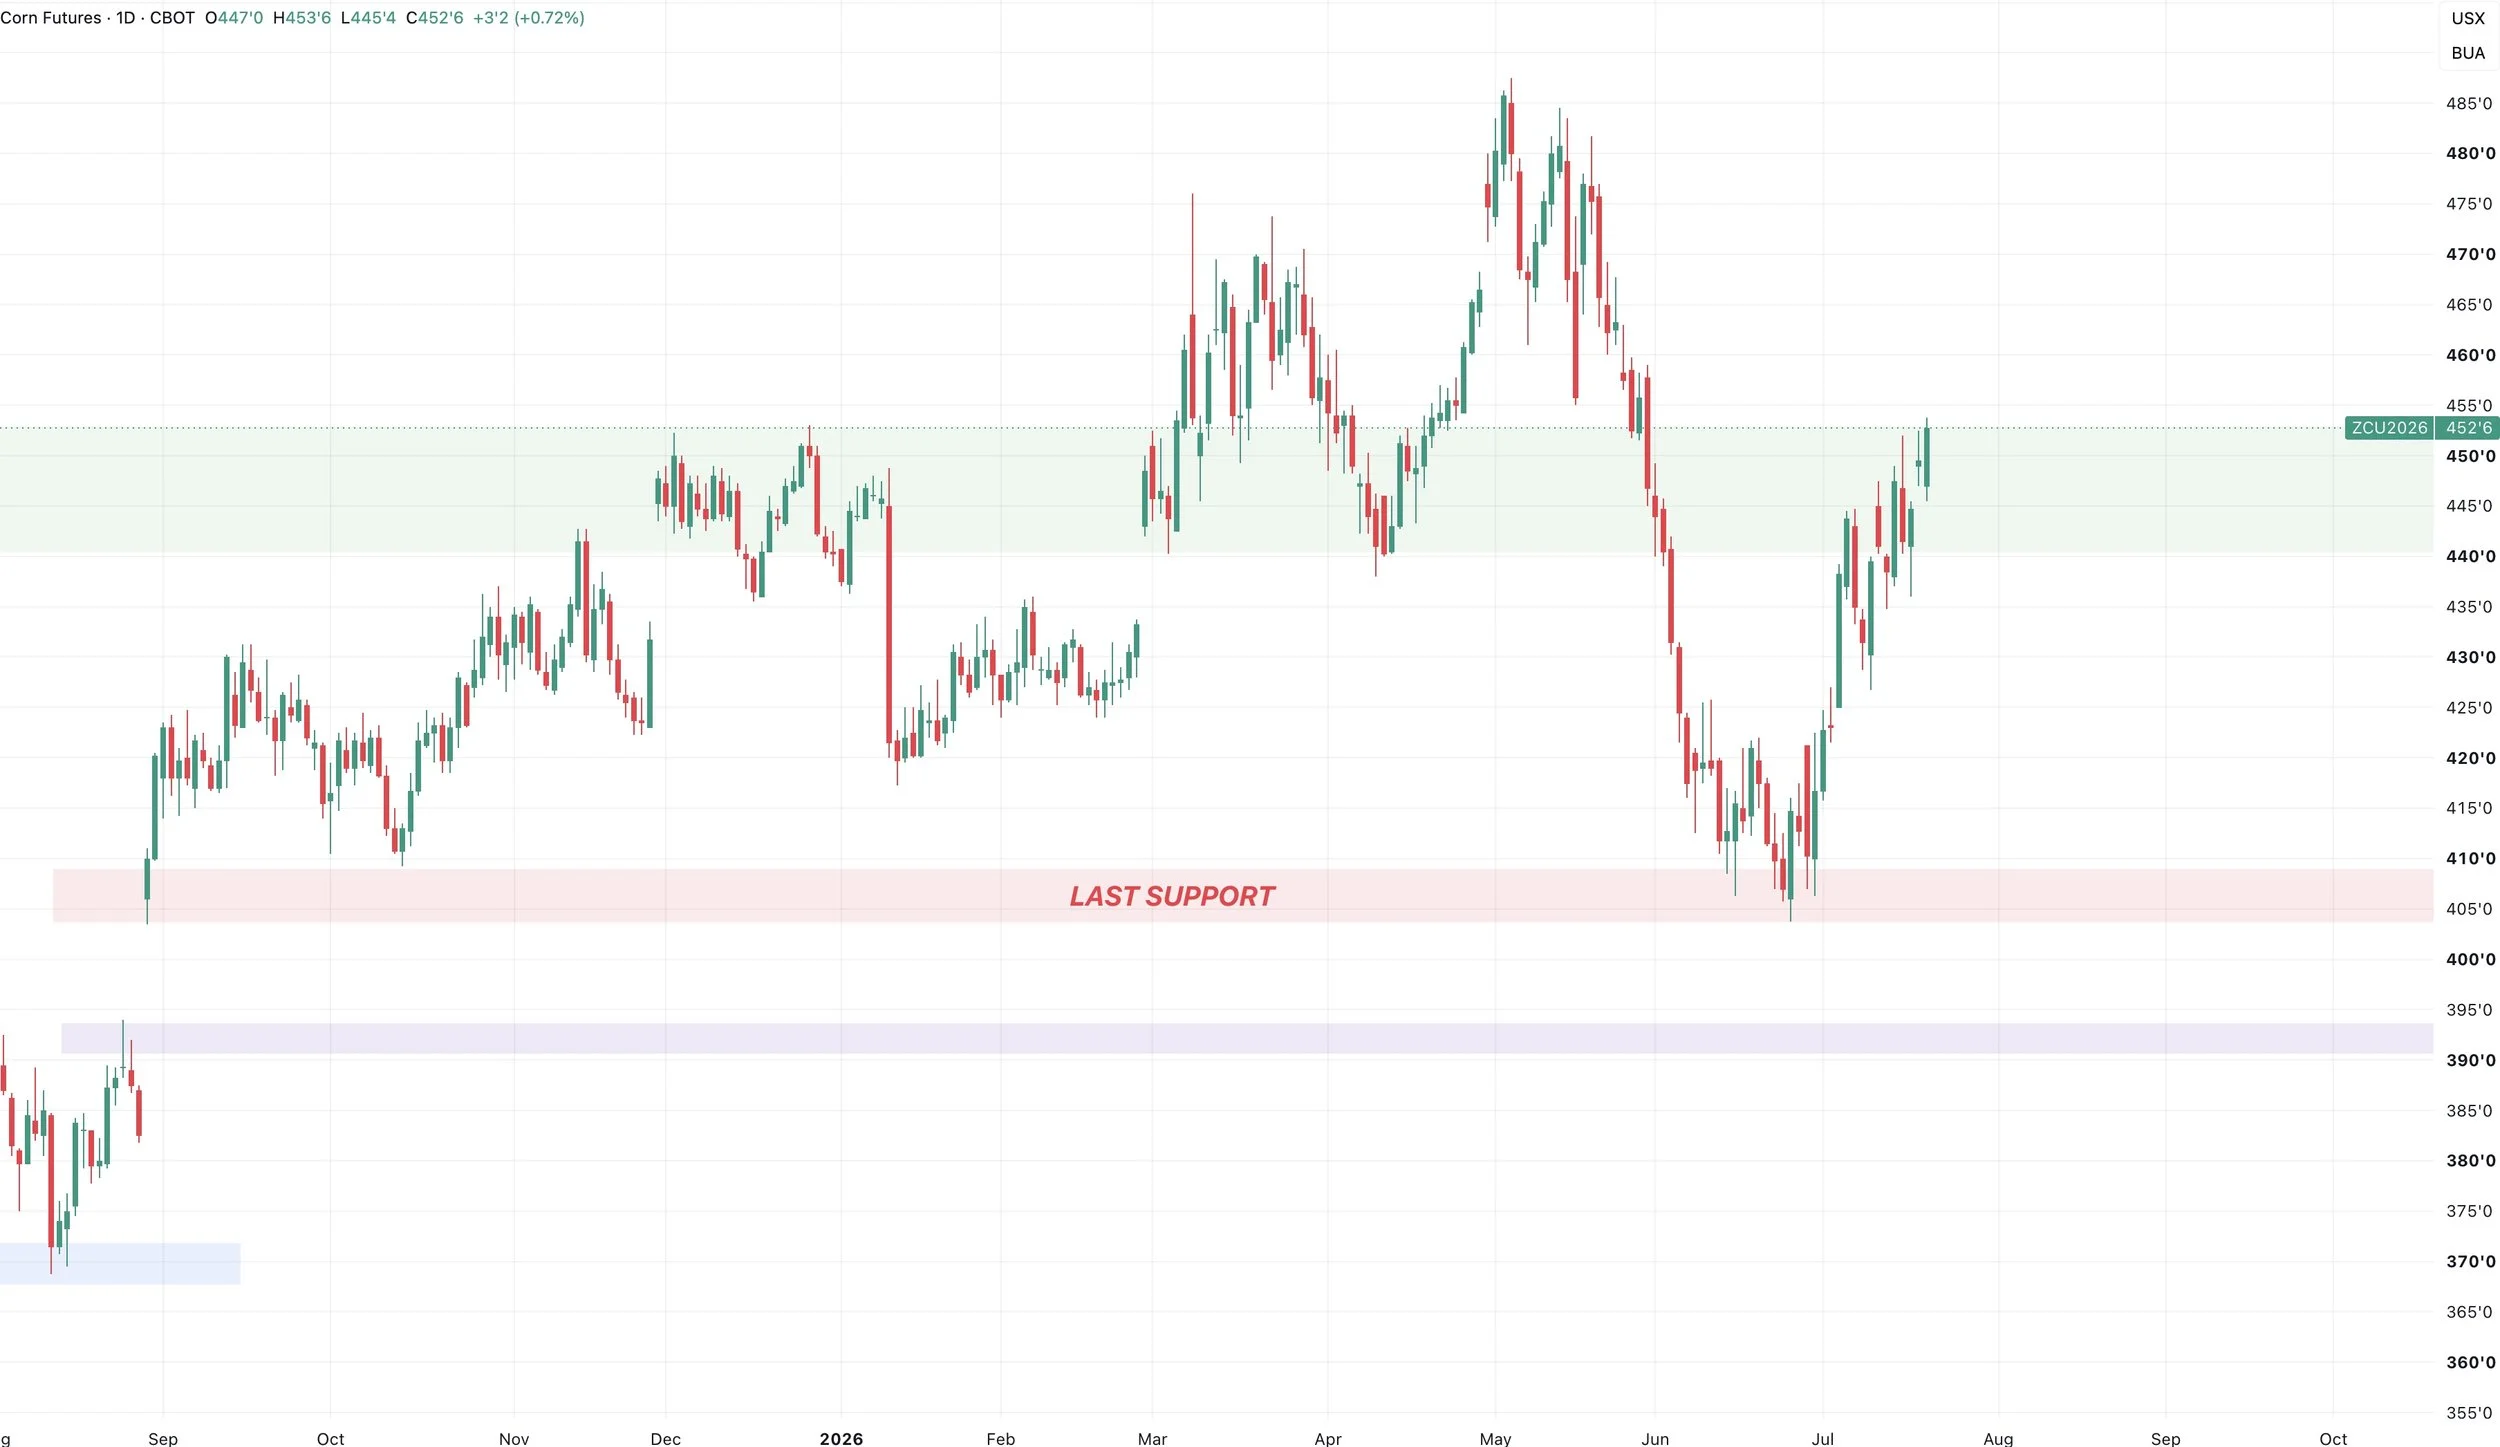
Front Month Corn Chart:
Sitting right up against those highs from the end of last year.
So could possibly offer resistance as well.
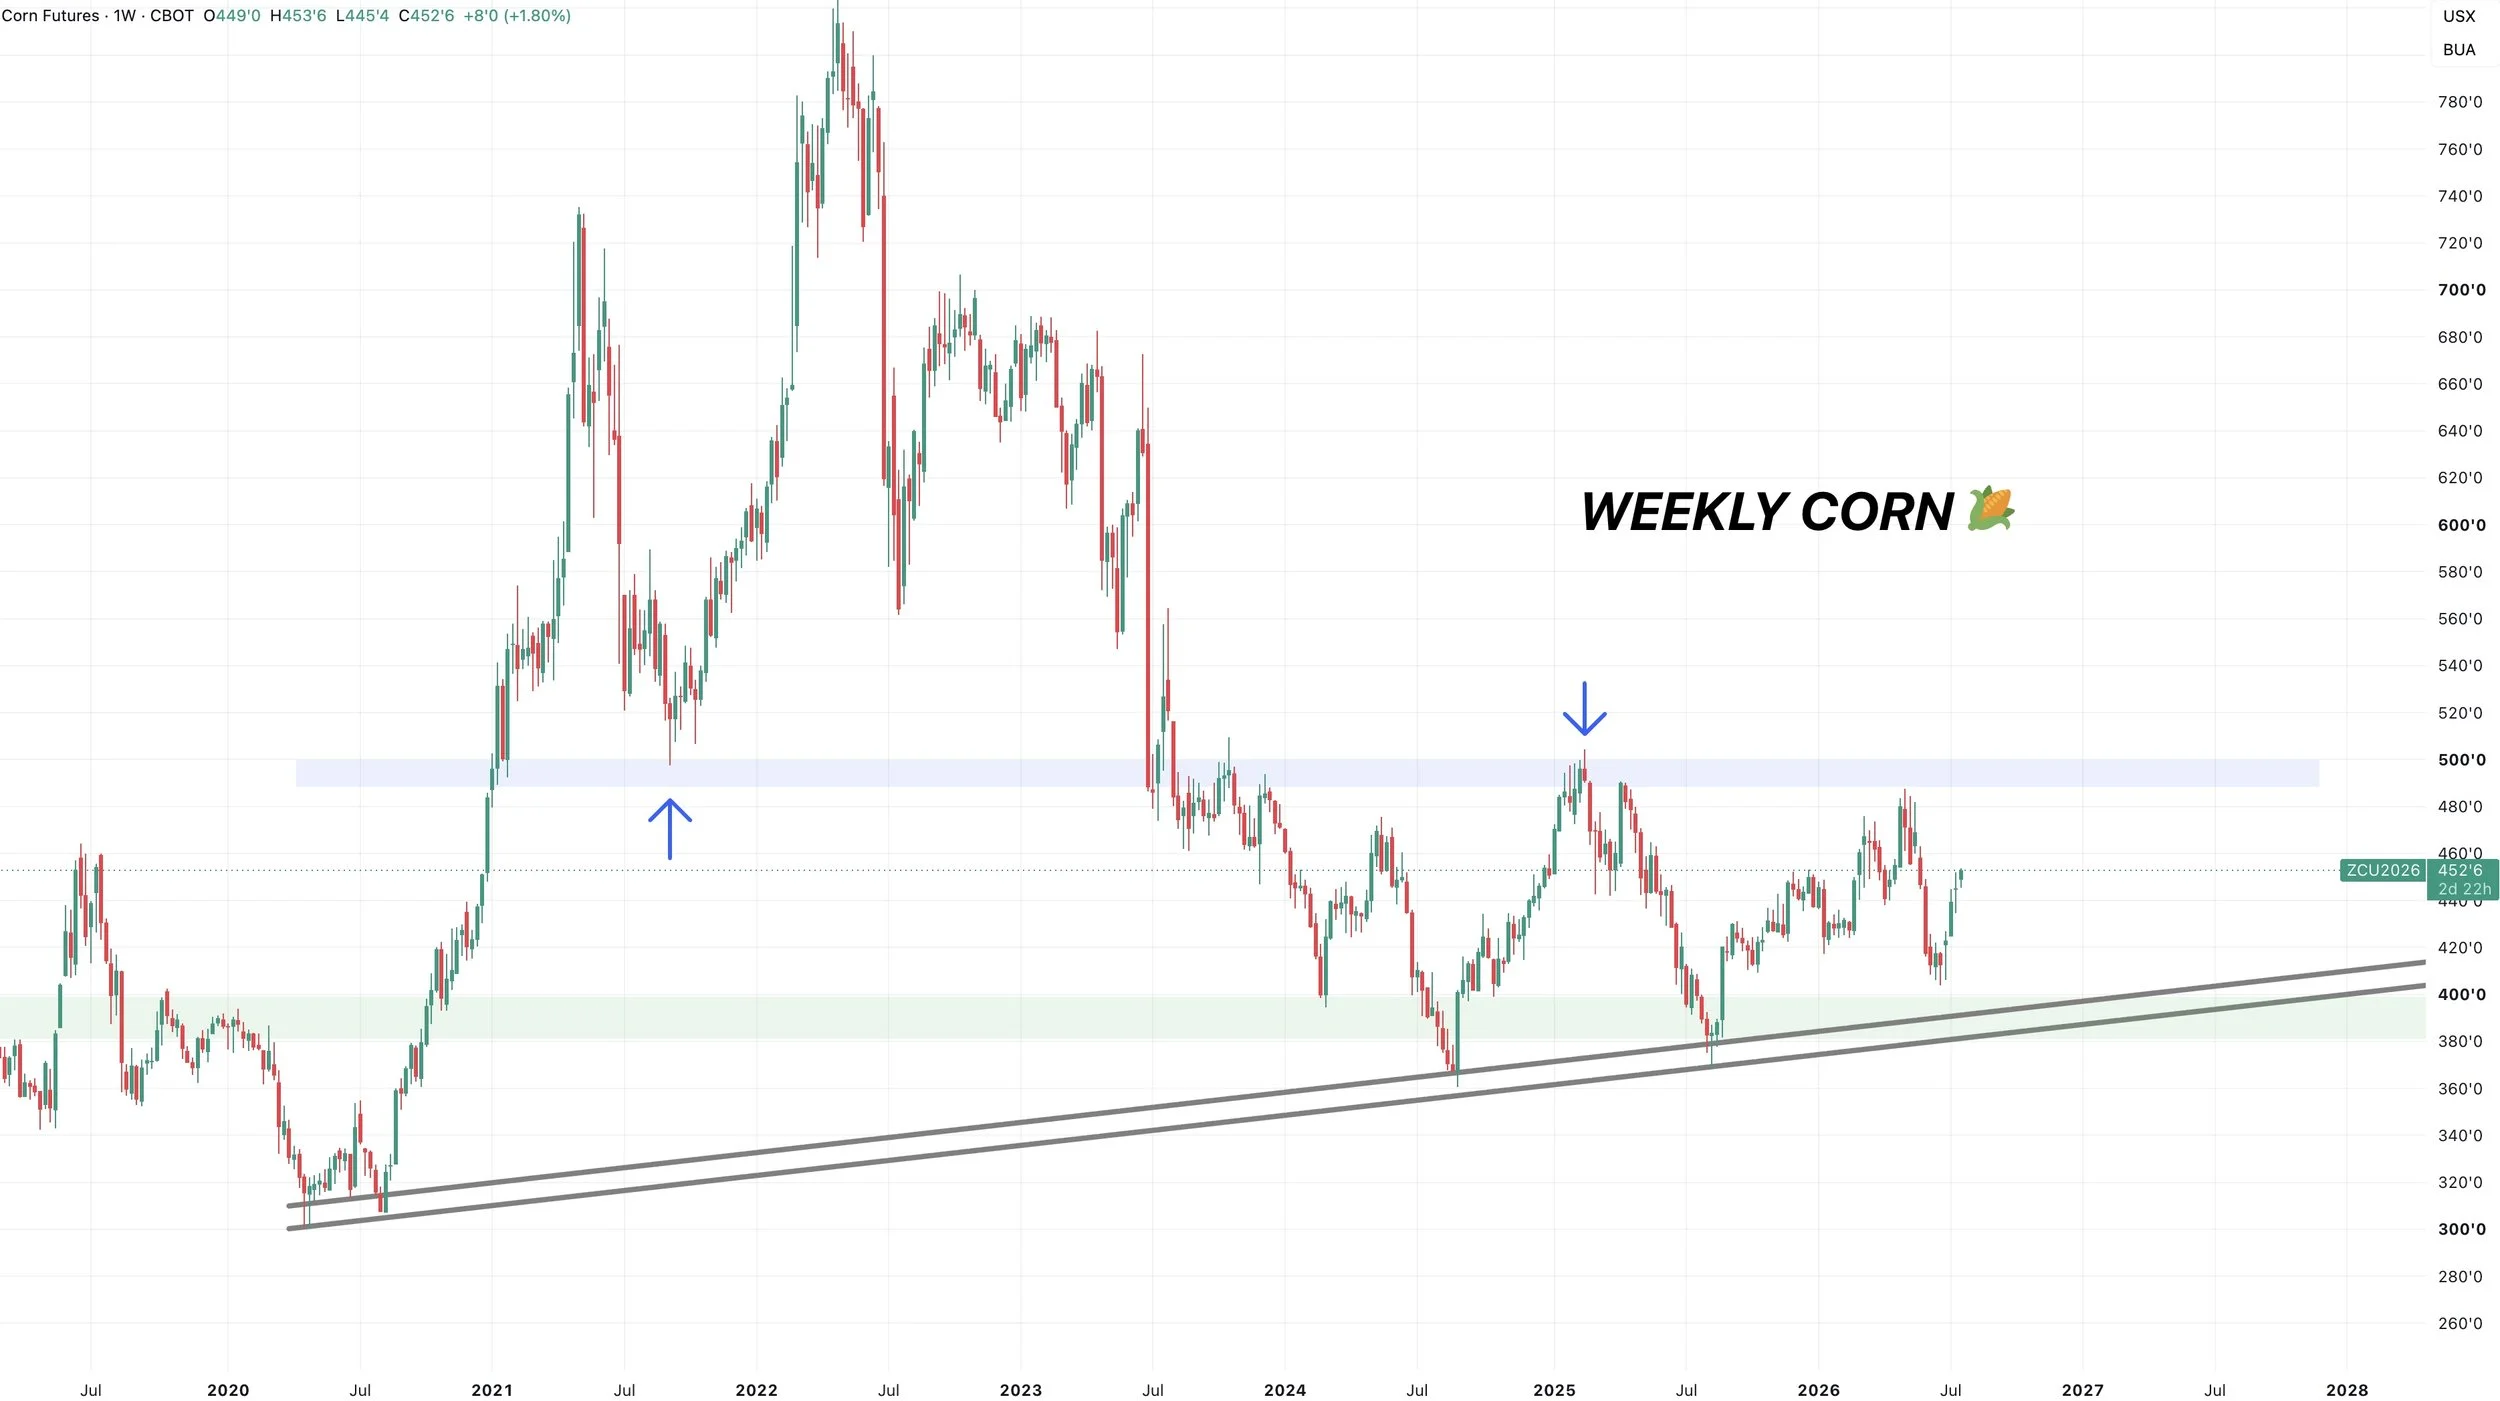
Weekly Corn Chart:
If you zoom out to the weekly chart.
$5.00 remains the key level to break when taking a long term approach.
It's the highs from 2025 and lows from 2021.
If you break above that level, we'd have our first higher high of the entire bear market.
The big picture trend would then be higher and offer plenty of upside potential.
Soybeans
China keeps buying:
This rally hasn’t been entirely driven by the weather scare.
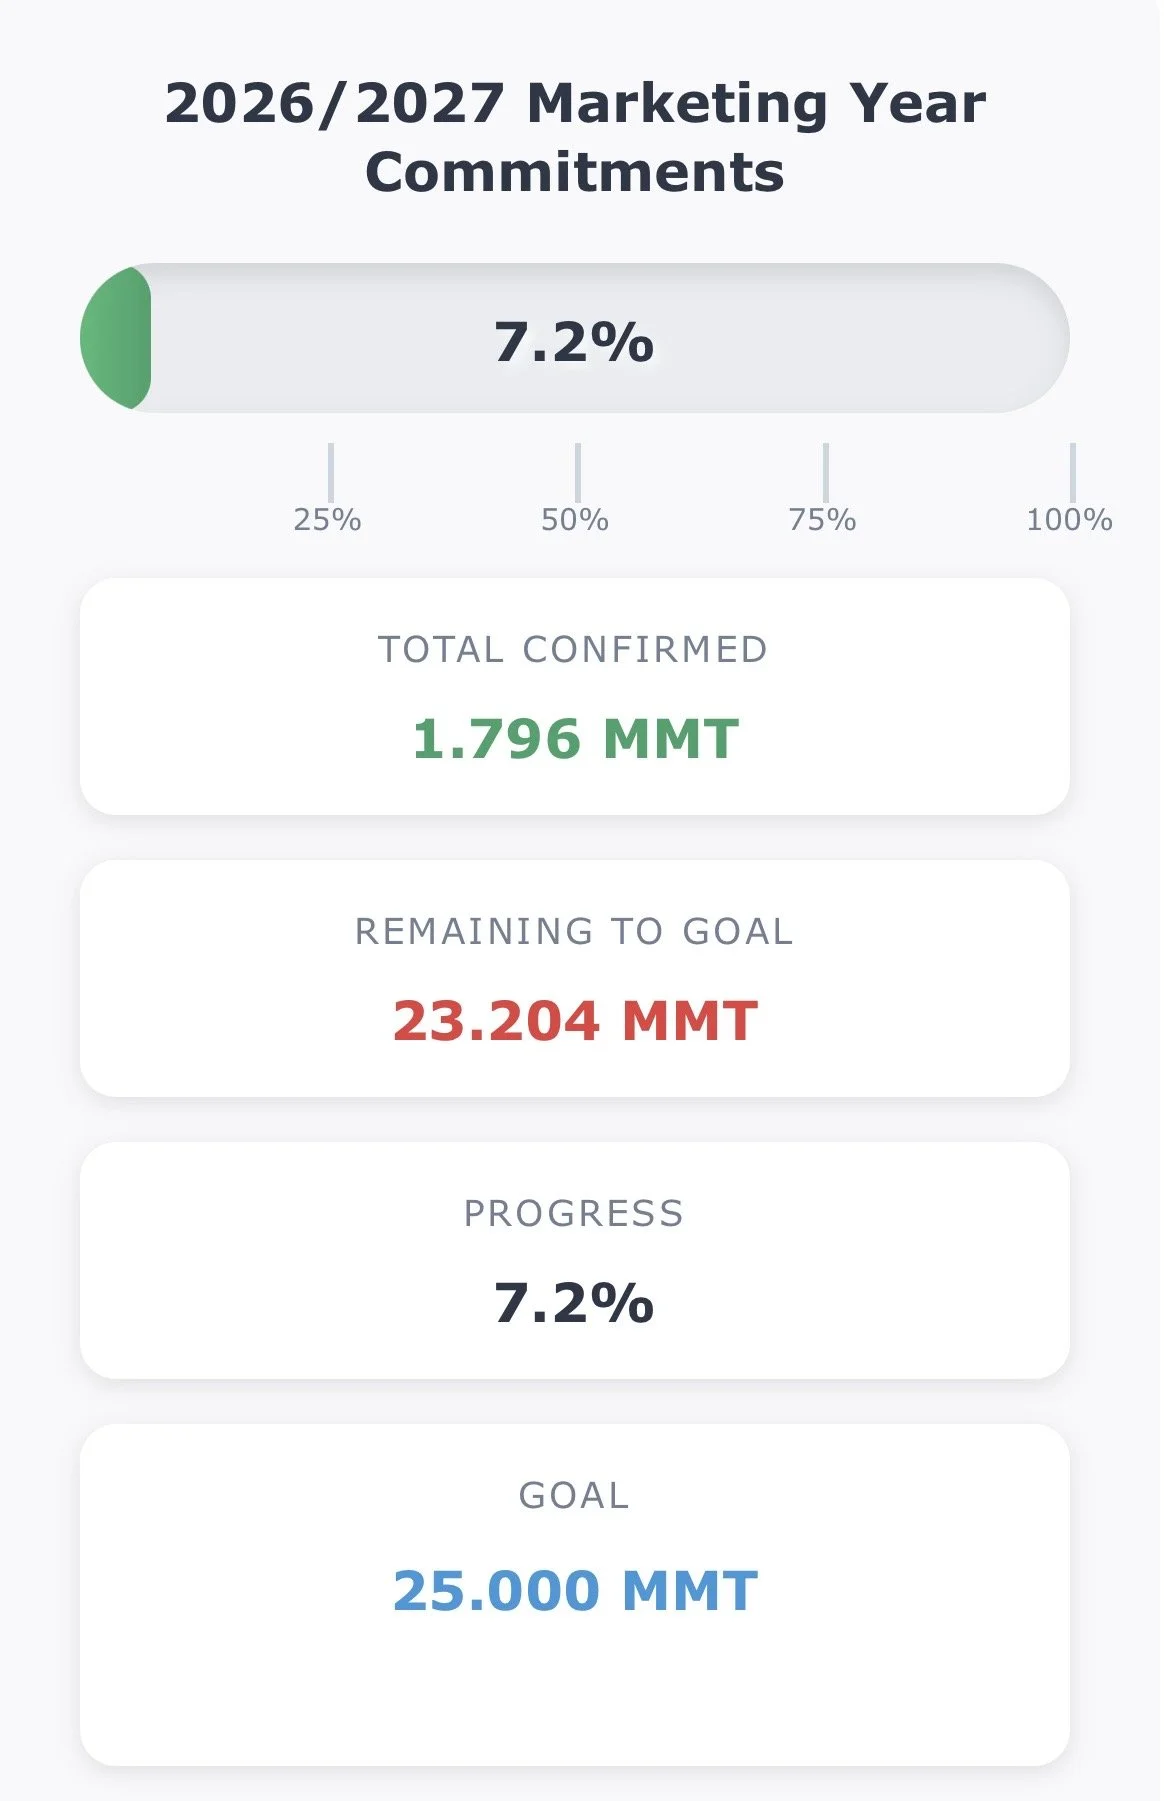
A lot of it also has to due with the fact that China has been buying new crop beans. As we continue to get flash sales of soybeans to both China and unknown destinations.
I am still in the camp that China is going to continue to do exactly what they said they'd do.
I don’t really see any reason they wouldn’t.
Currently they've bought around 7.5% of their goal, but the actual number is higher as this doesn’t include the sales we've seen to unknown. Which is almost always China.
Chart from @GrainStats on X
Today's Hedge Alert:
Can the market keep running? Yes.
Does it have to? No.
Like in corn, weather is going to play a key role.
If the weather models flip, there is still plenty of risk.
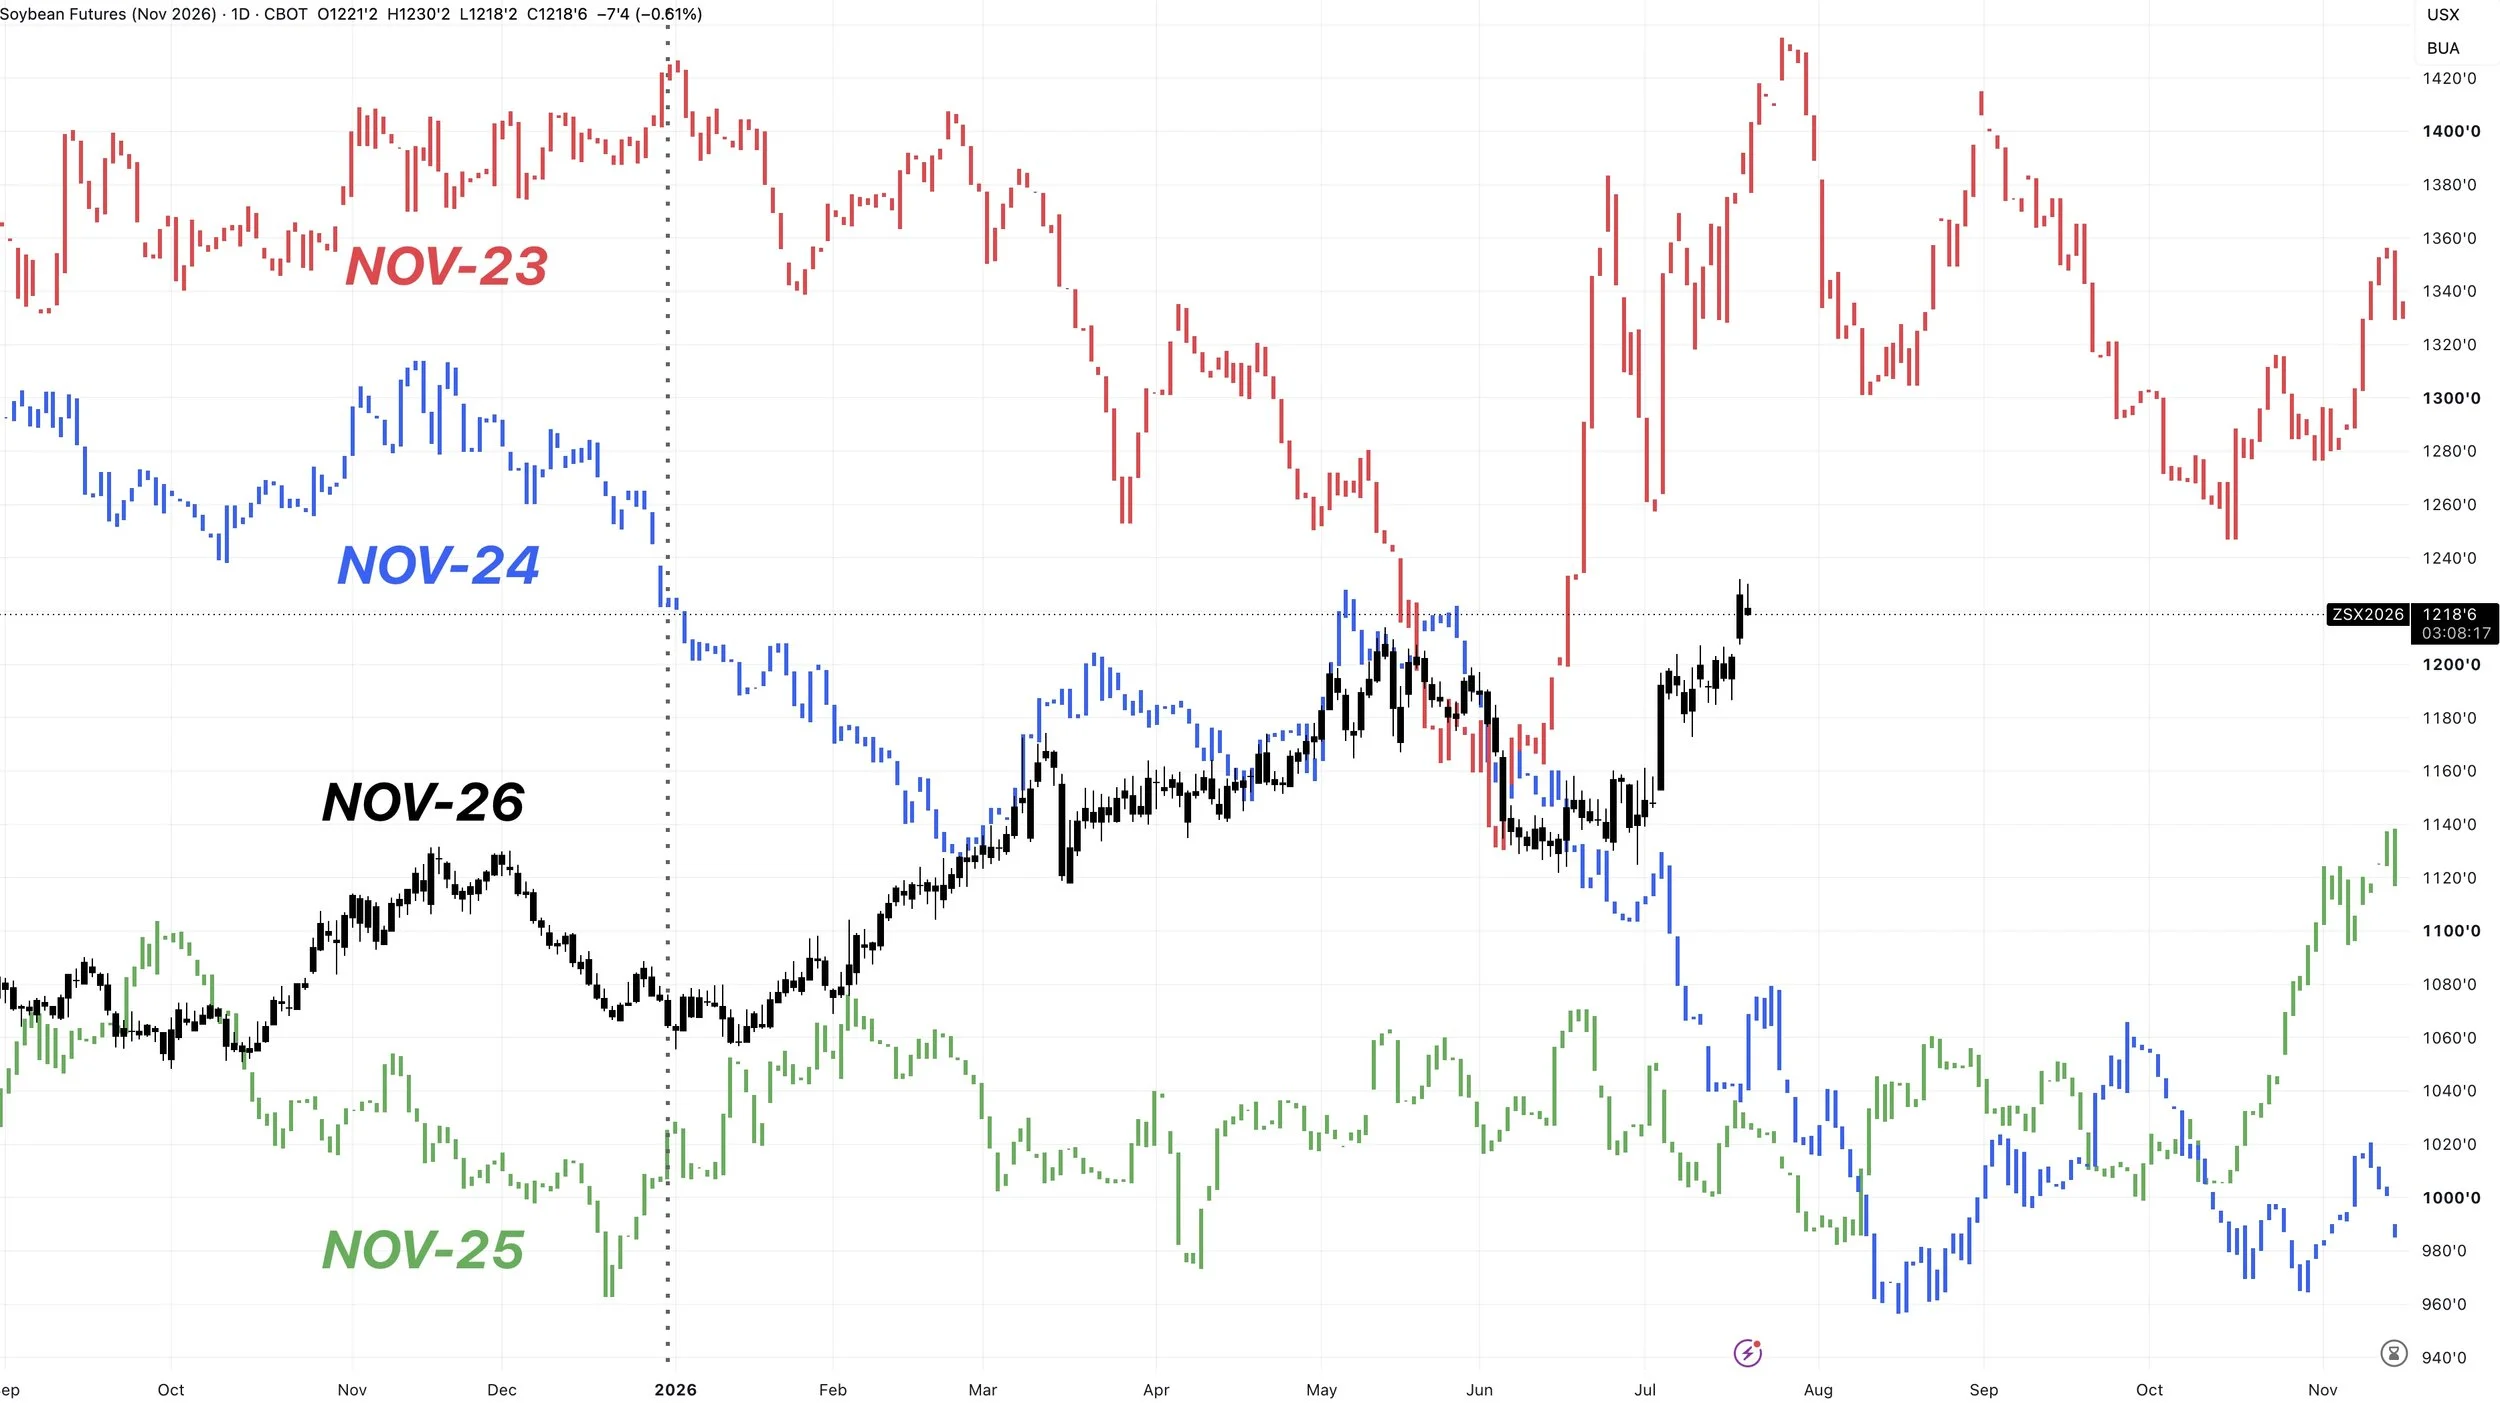
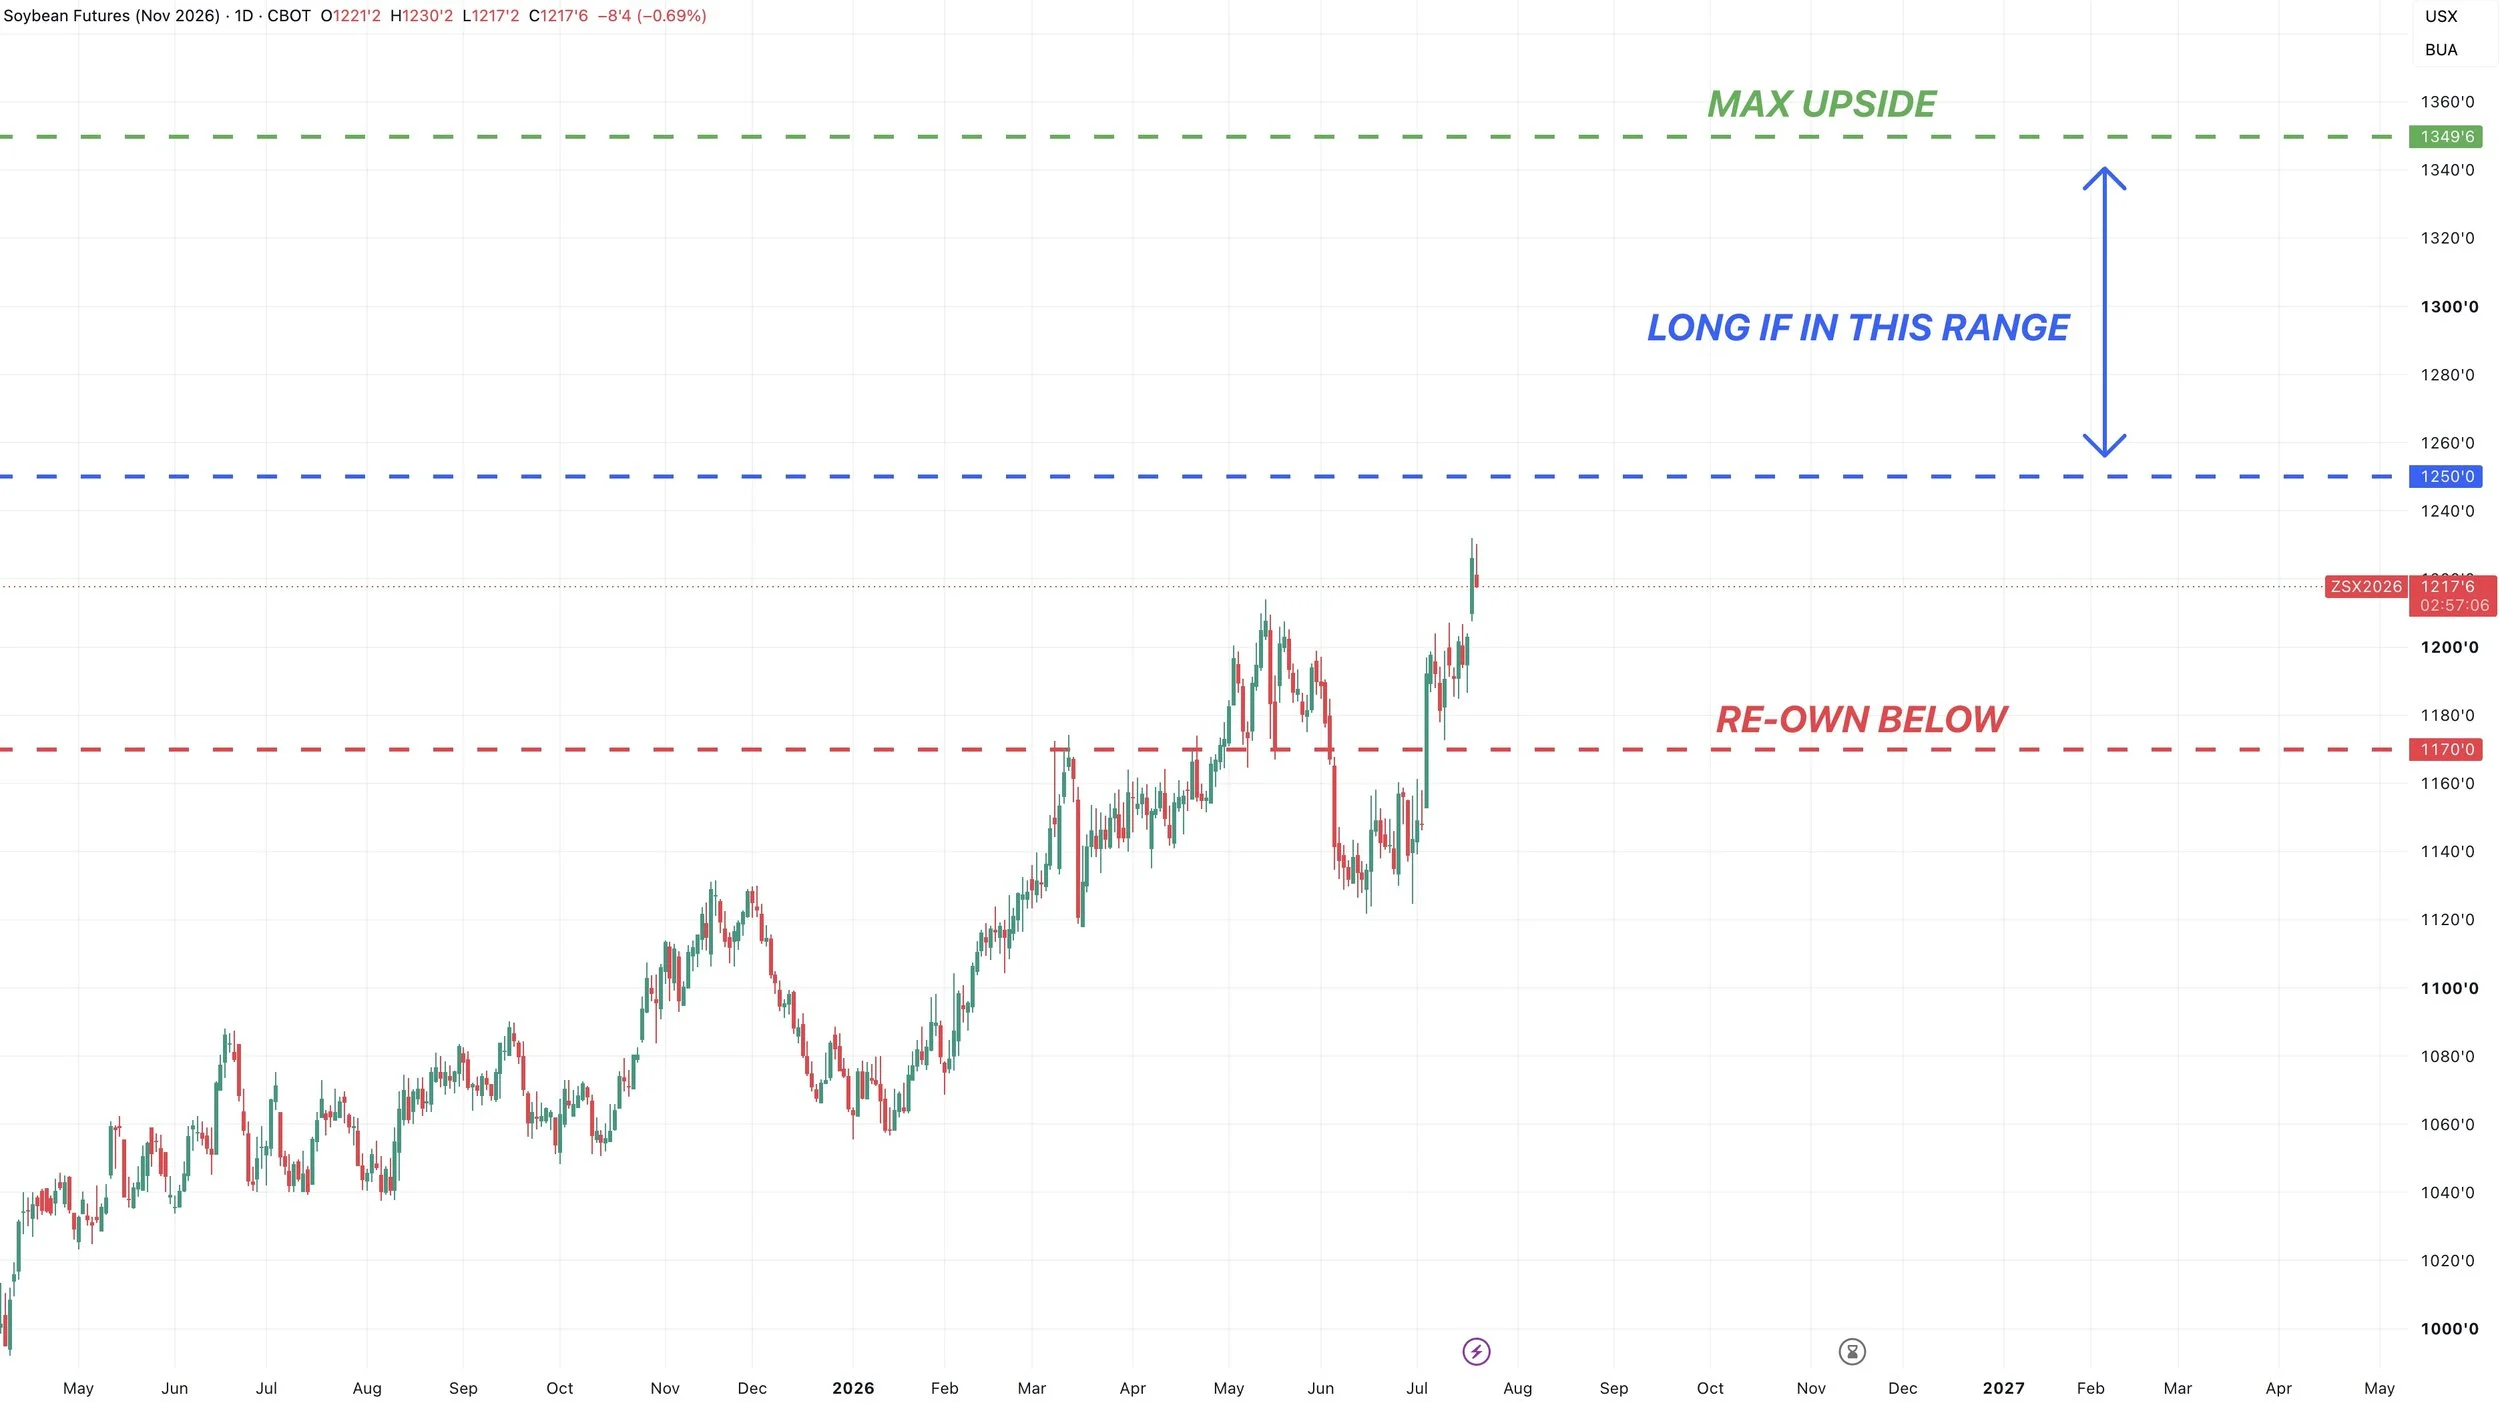
Nov soybeans are trading at their highest levels since 2023. By a pretty wide margin.
Sitting over $2.00 higher than we were in 2024 and 2025.
With that we issued a hedge alert. As there are several ways you can protect your downside while keeping your upside open.
In our hedge alert, we went over two possible strategies you could utilize based on if you have a good basis or poor basis.
If you have any questions on this alert or want to talk through a strategy with us please give us a call or a text.
Office: (806)484-1214
If local basis is attractive:
Consider making a new crop cash sale. Make sure to try and get a basis push because we are seeing good buying demand which means elevators are making sales and may provide an opportunity to negotiate a stronger basis.
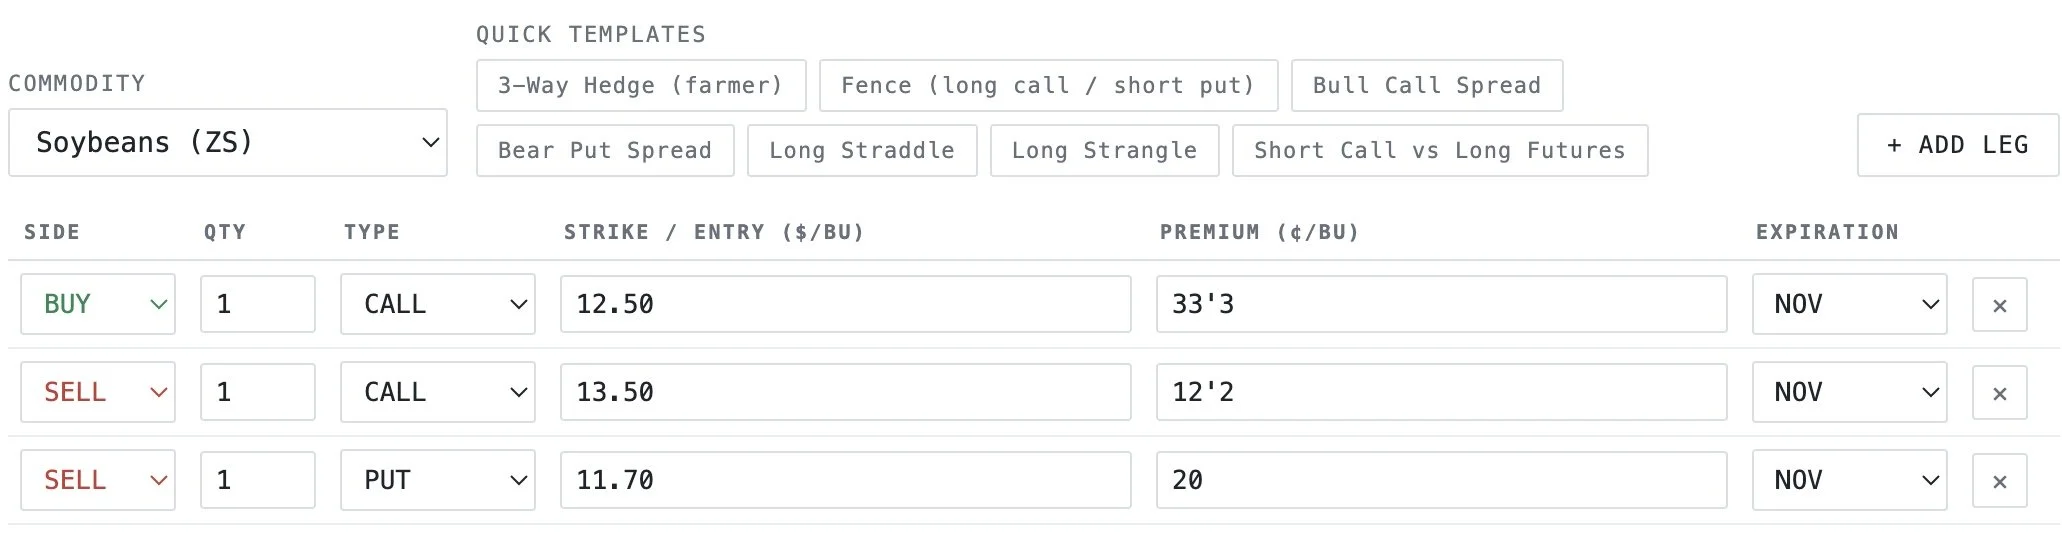
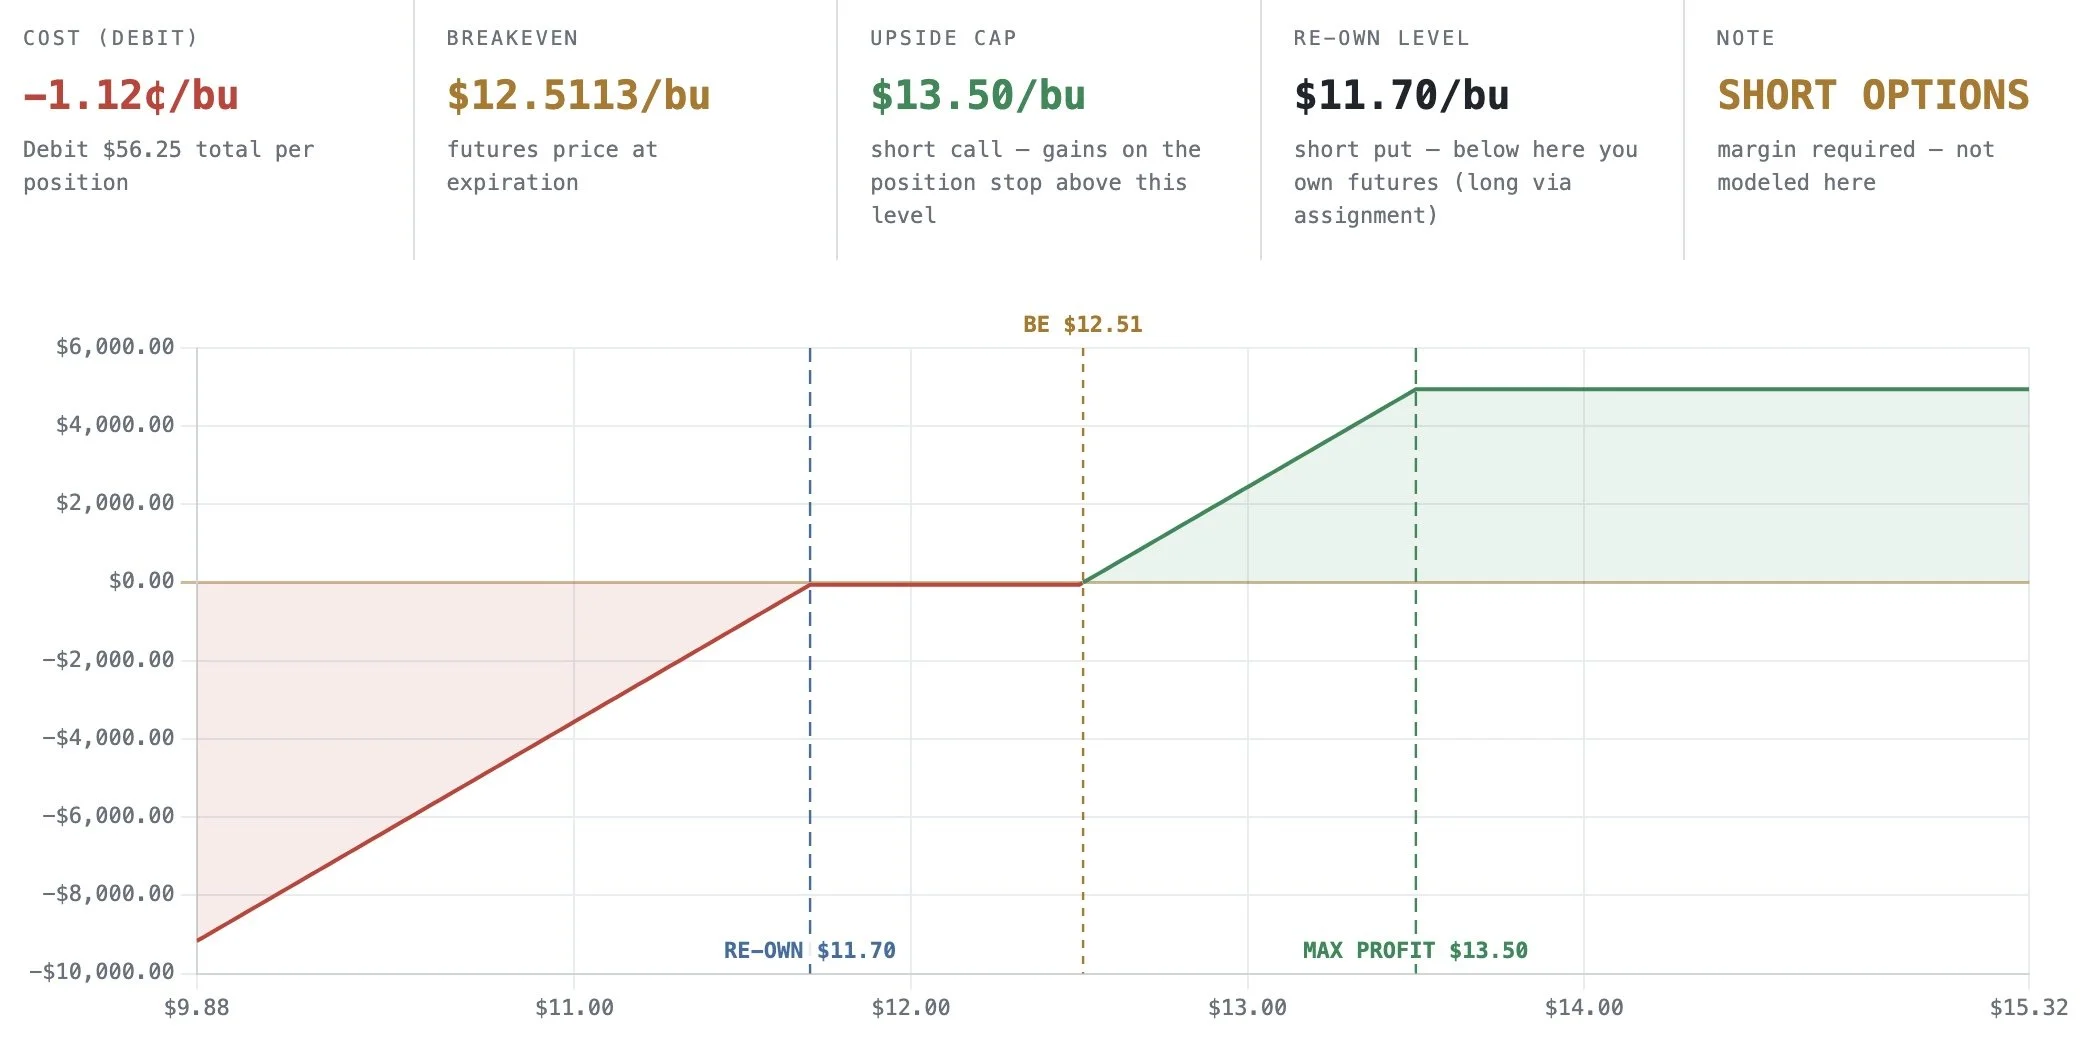
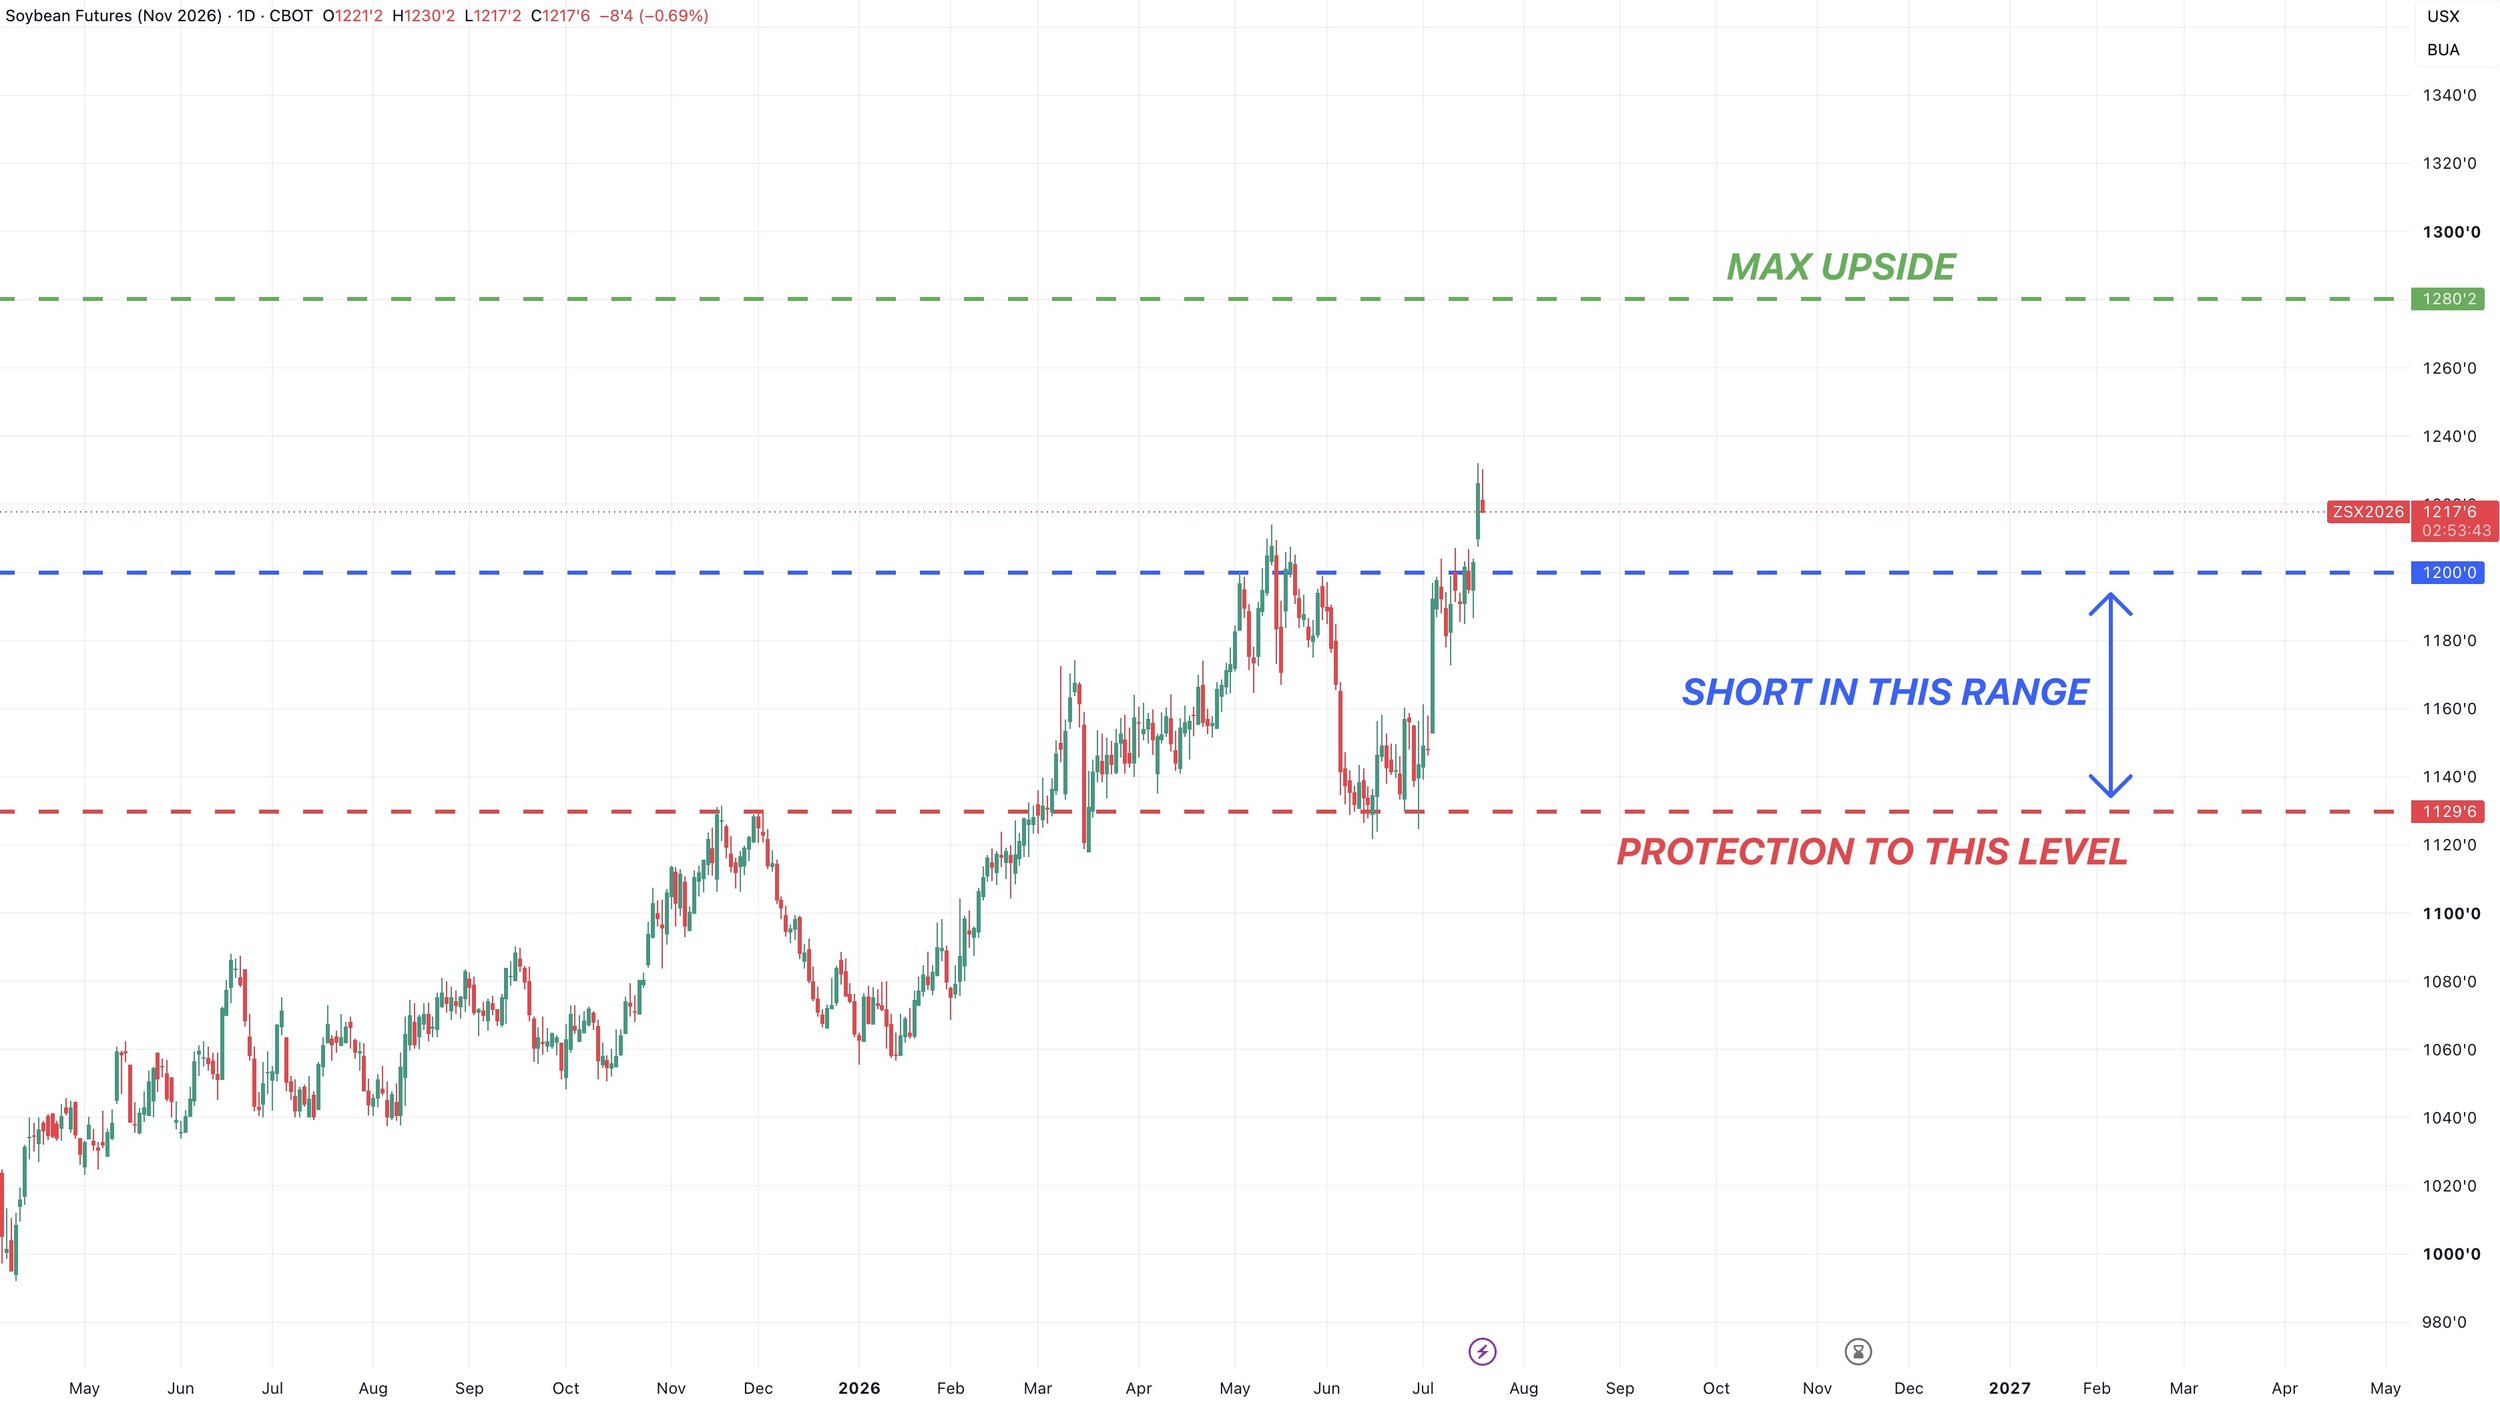
If you’d like to keep some upside exposure after making a sale, consider buying a $12.50/$13.50 call spread and paying for it by selling the $11.70 put. The net cost of this is 0 to 2 cents, but selling the put does require margin. Selling the put allows you to re-own soybeans 50 cents lower in exchange for $1.00 of upside.
Here is a chart that shows the trade and how it works.
Here is another way to look at it.
You make the cash sale and re-own with this strategy.
From $12.50 to $13.50 your calls make you money. Keeping your upside open until $13.50, as that is your max upside.
If we go to $11.70 you will re-own your sale with futures.
Between $11.70 and $12.50 you only lose the cost of the trade. Which is around 0 to 2 cents.
We are trading at $12.23 right now.
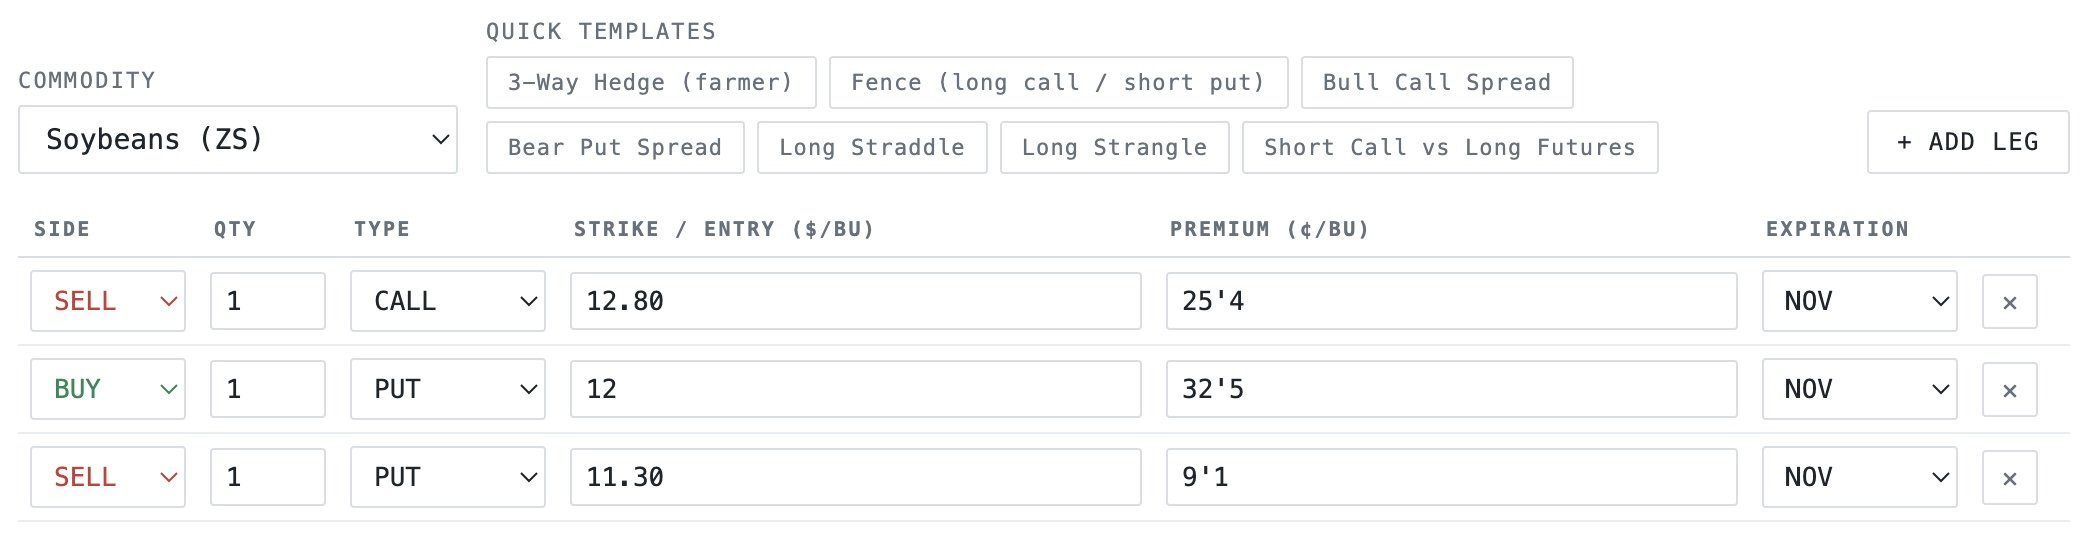
If local basis is weak and you believe it will improve:
Instead of making a call sale, you can sell the $12.80 call to buy the $12.00/$11.30 put spread.
This gives you 70 cents of downside protection in exchange for the potential of having to sell futures about 60 cents above today’s price if we keep rallying.
Here is a chart that shows how the trade works.
The trade makes money from $12.00 all the way down to $11.30 so it gives you protection until that level. Which was the recent lows.
Your max upside is $12.80
Long Term Thoughts:
I apologize if I sound like I'm beating a dead horse. But this is still the bull case moving forward.
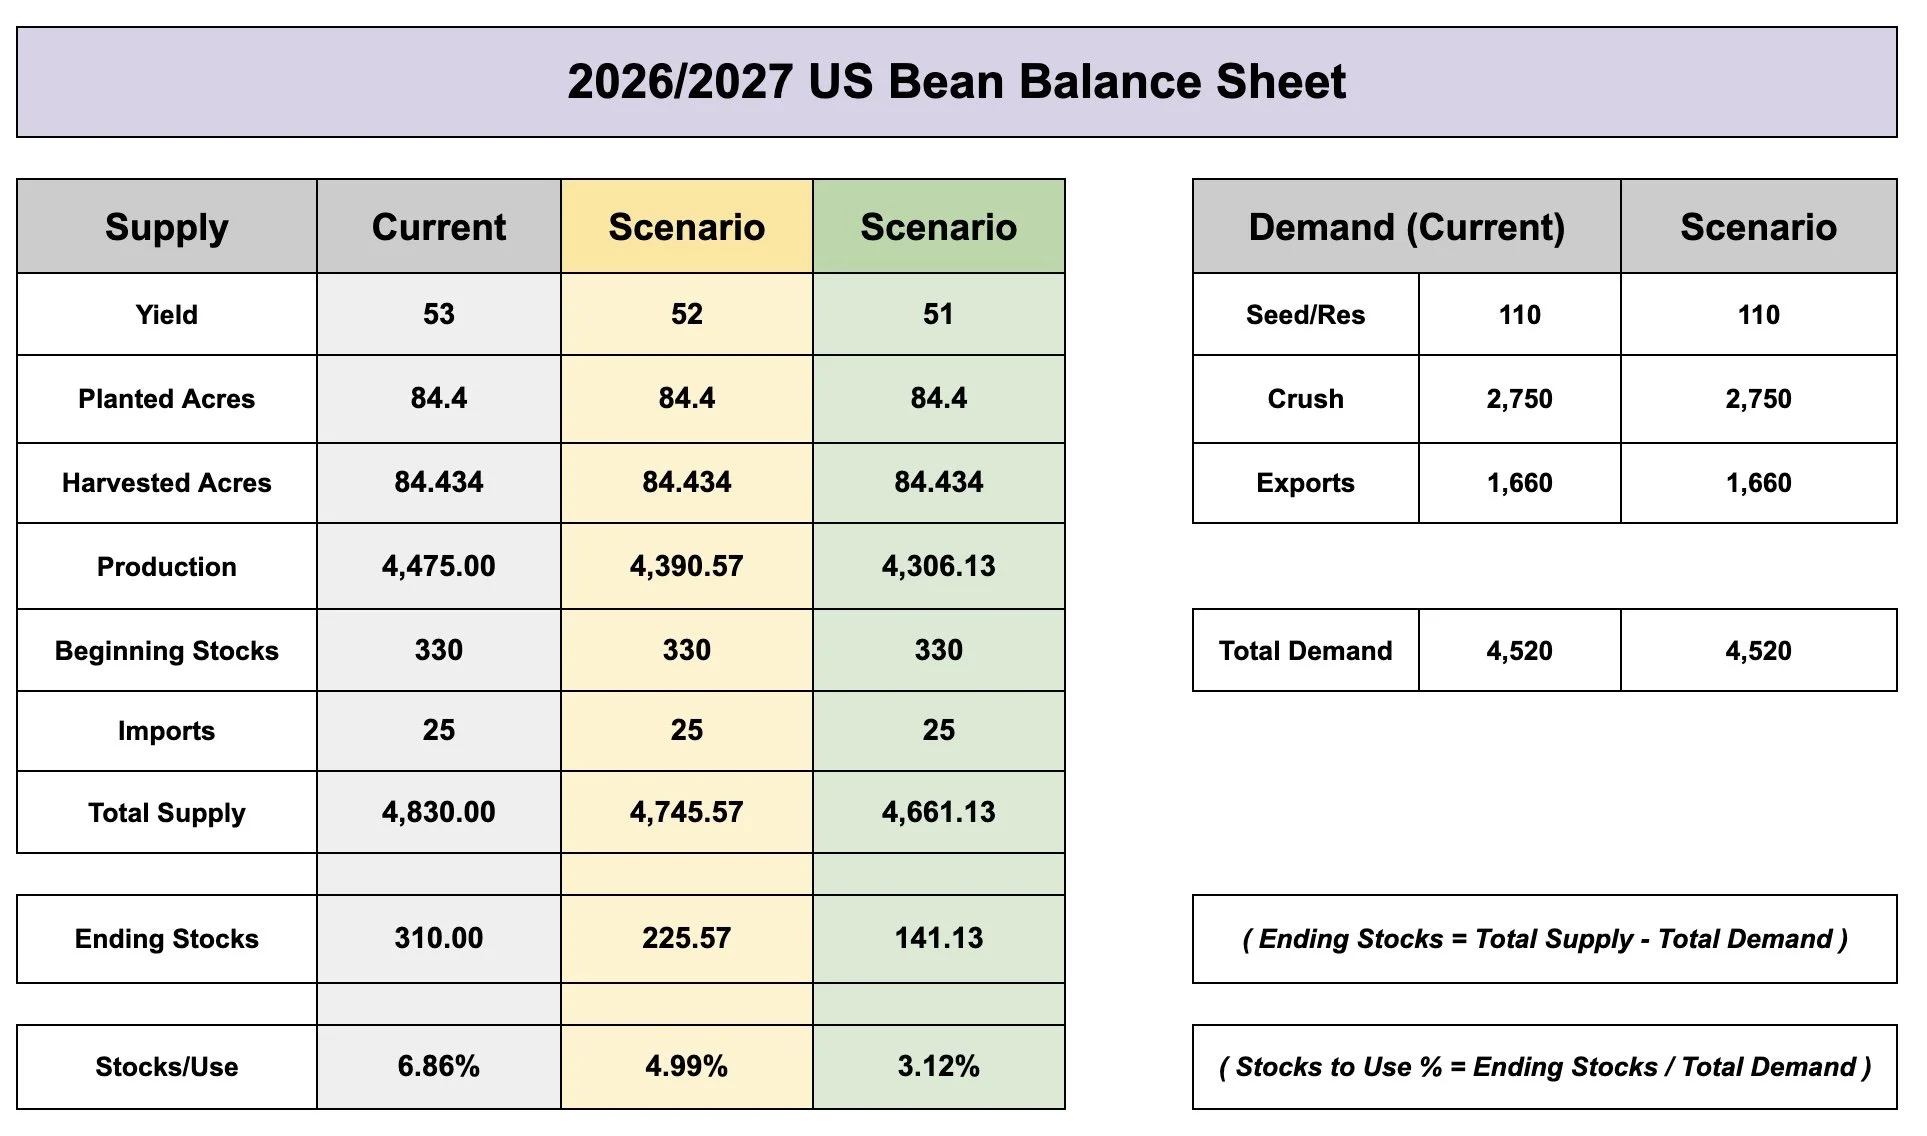
As I've talked about countless times, there is absolutely zero room for error on the soybean balance sheet.
Even a slight tweak to yield could completely change things.
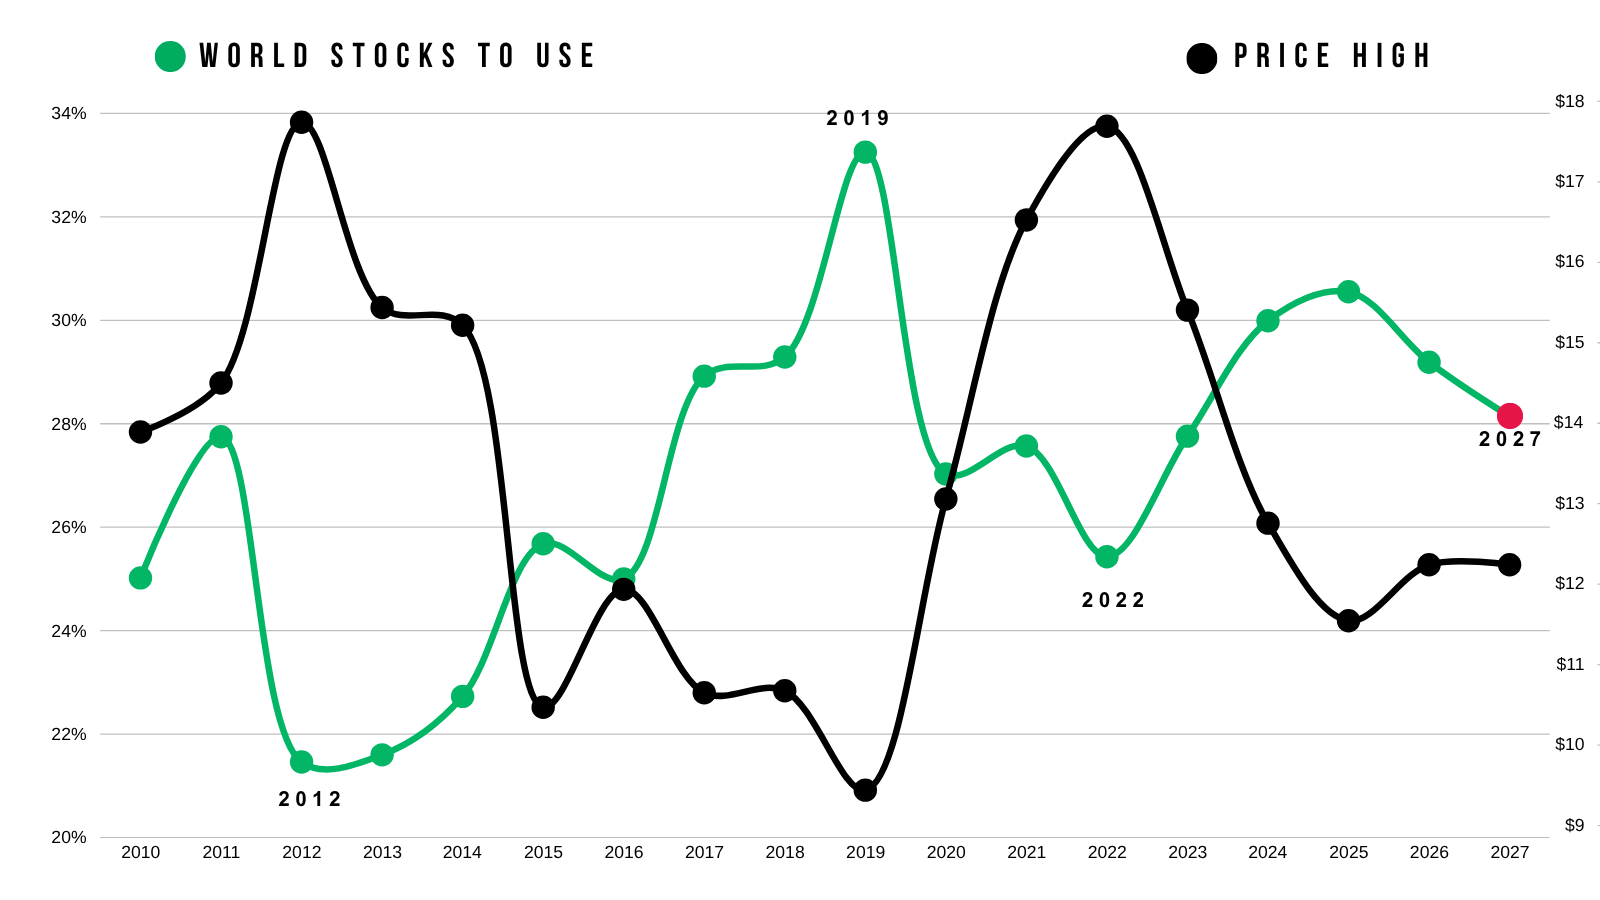
The world situation is already the tightest it's been in years.
Not on par with 2022, but the friendliest we have seen in years.
Unlike in corn, a tight world situation in soybeans usually leads to higher prices. Given it's not dominated as heavily by the US like corn is.
We are also dealing with a Super El Nino.
Which could potentially effect things down in South America, and adds even more wild cards to the deck.
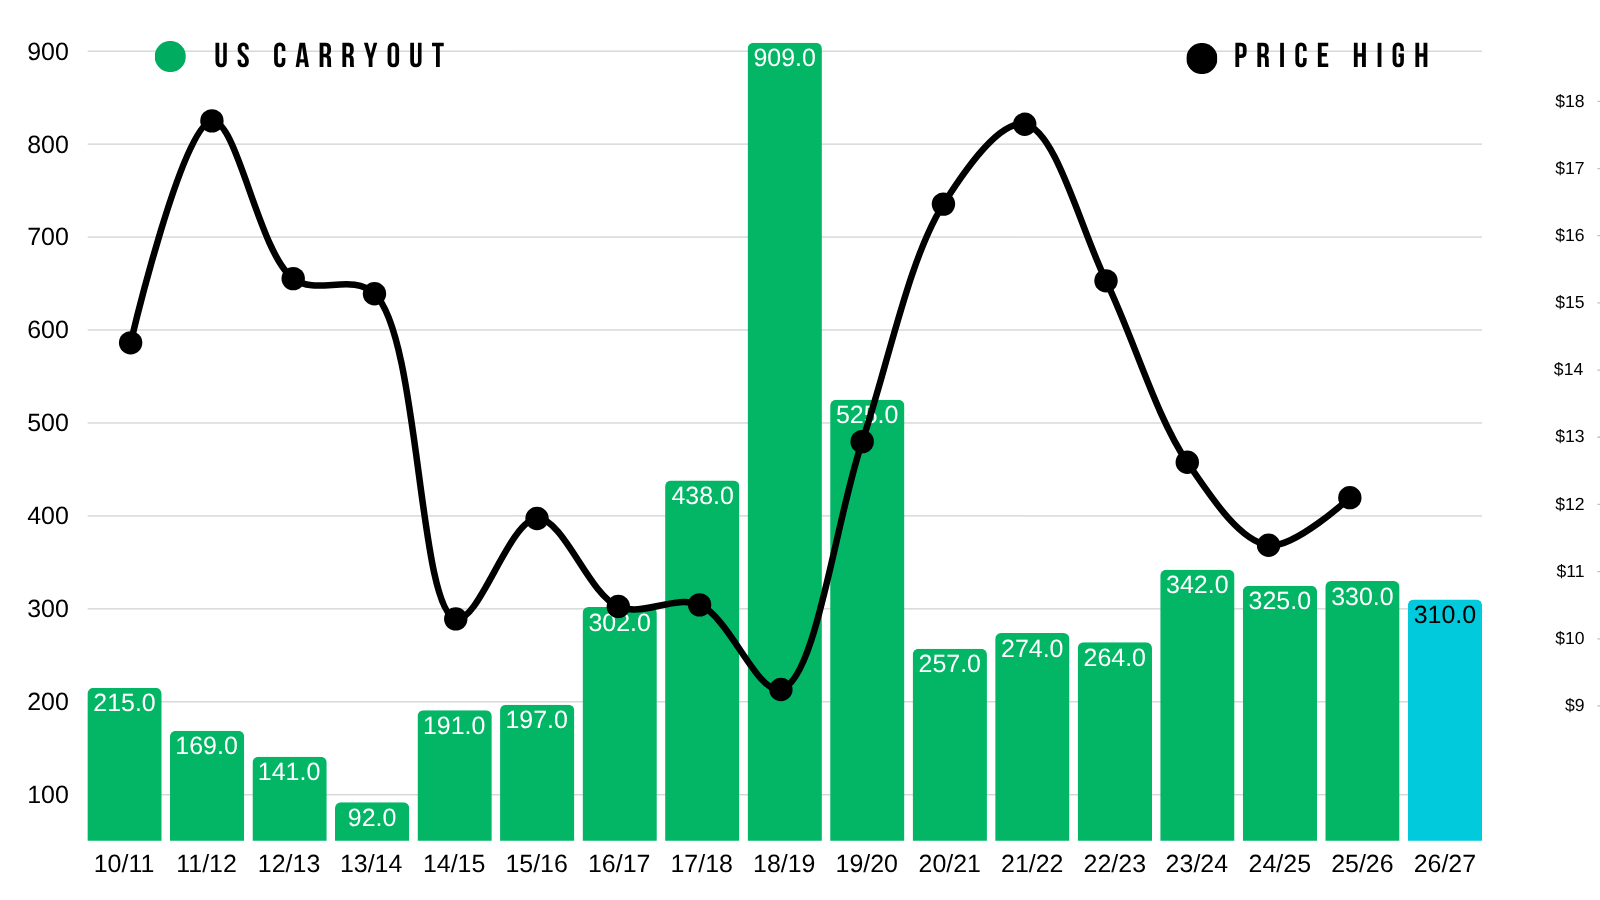
The US situation is also the tightest it's been in years, with the possibility to get tighter IF we do not raise a trendline yield.
As the last time we saw our carryout drop below 300 million, prices were much higher than they are today.
Aug Beans Chart:
We are testing those highs from March and May.
It's a big level. We have failed here twice previously. So it's clear resistance, and an area where it wouldn’t be a surprise to see us struggle.
However, if we are able to break above then it opens the door higher.
As the only point of resistance would be the contract highs at $12.50
Overall the trend is still higher long term.
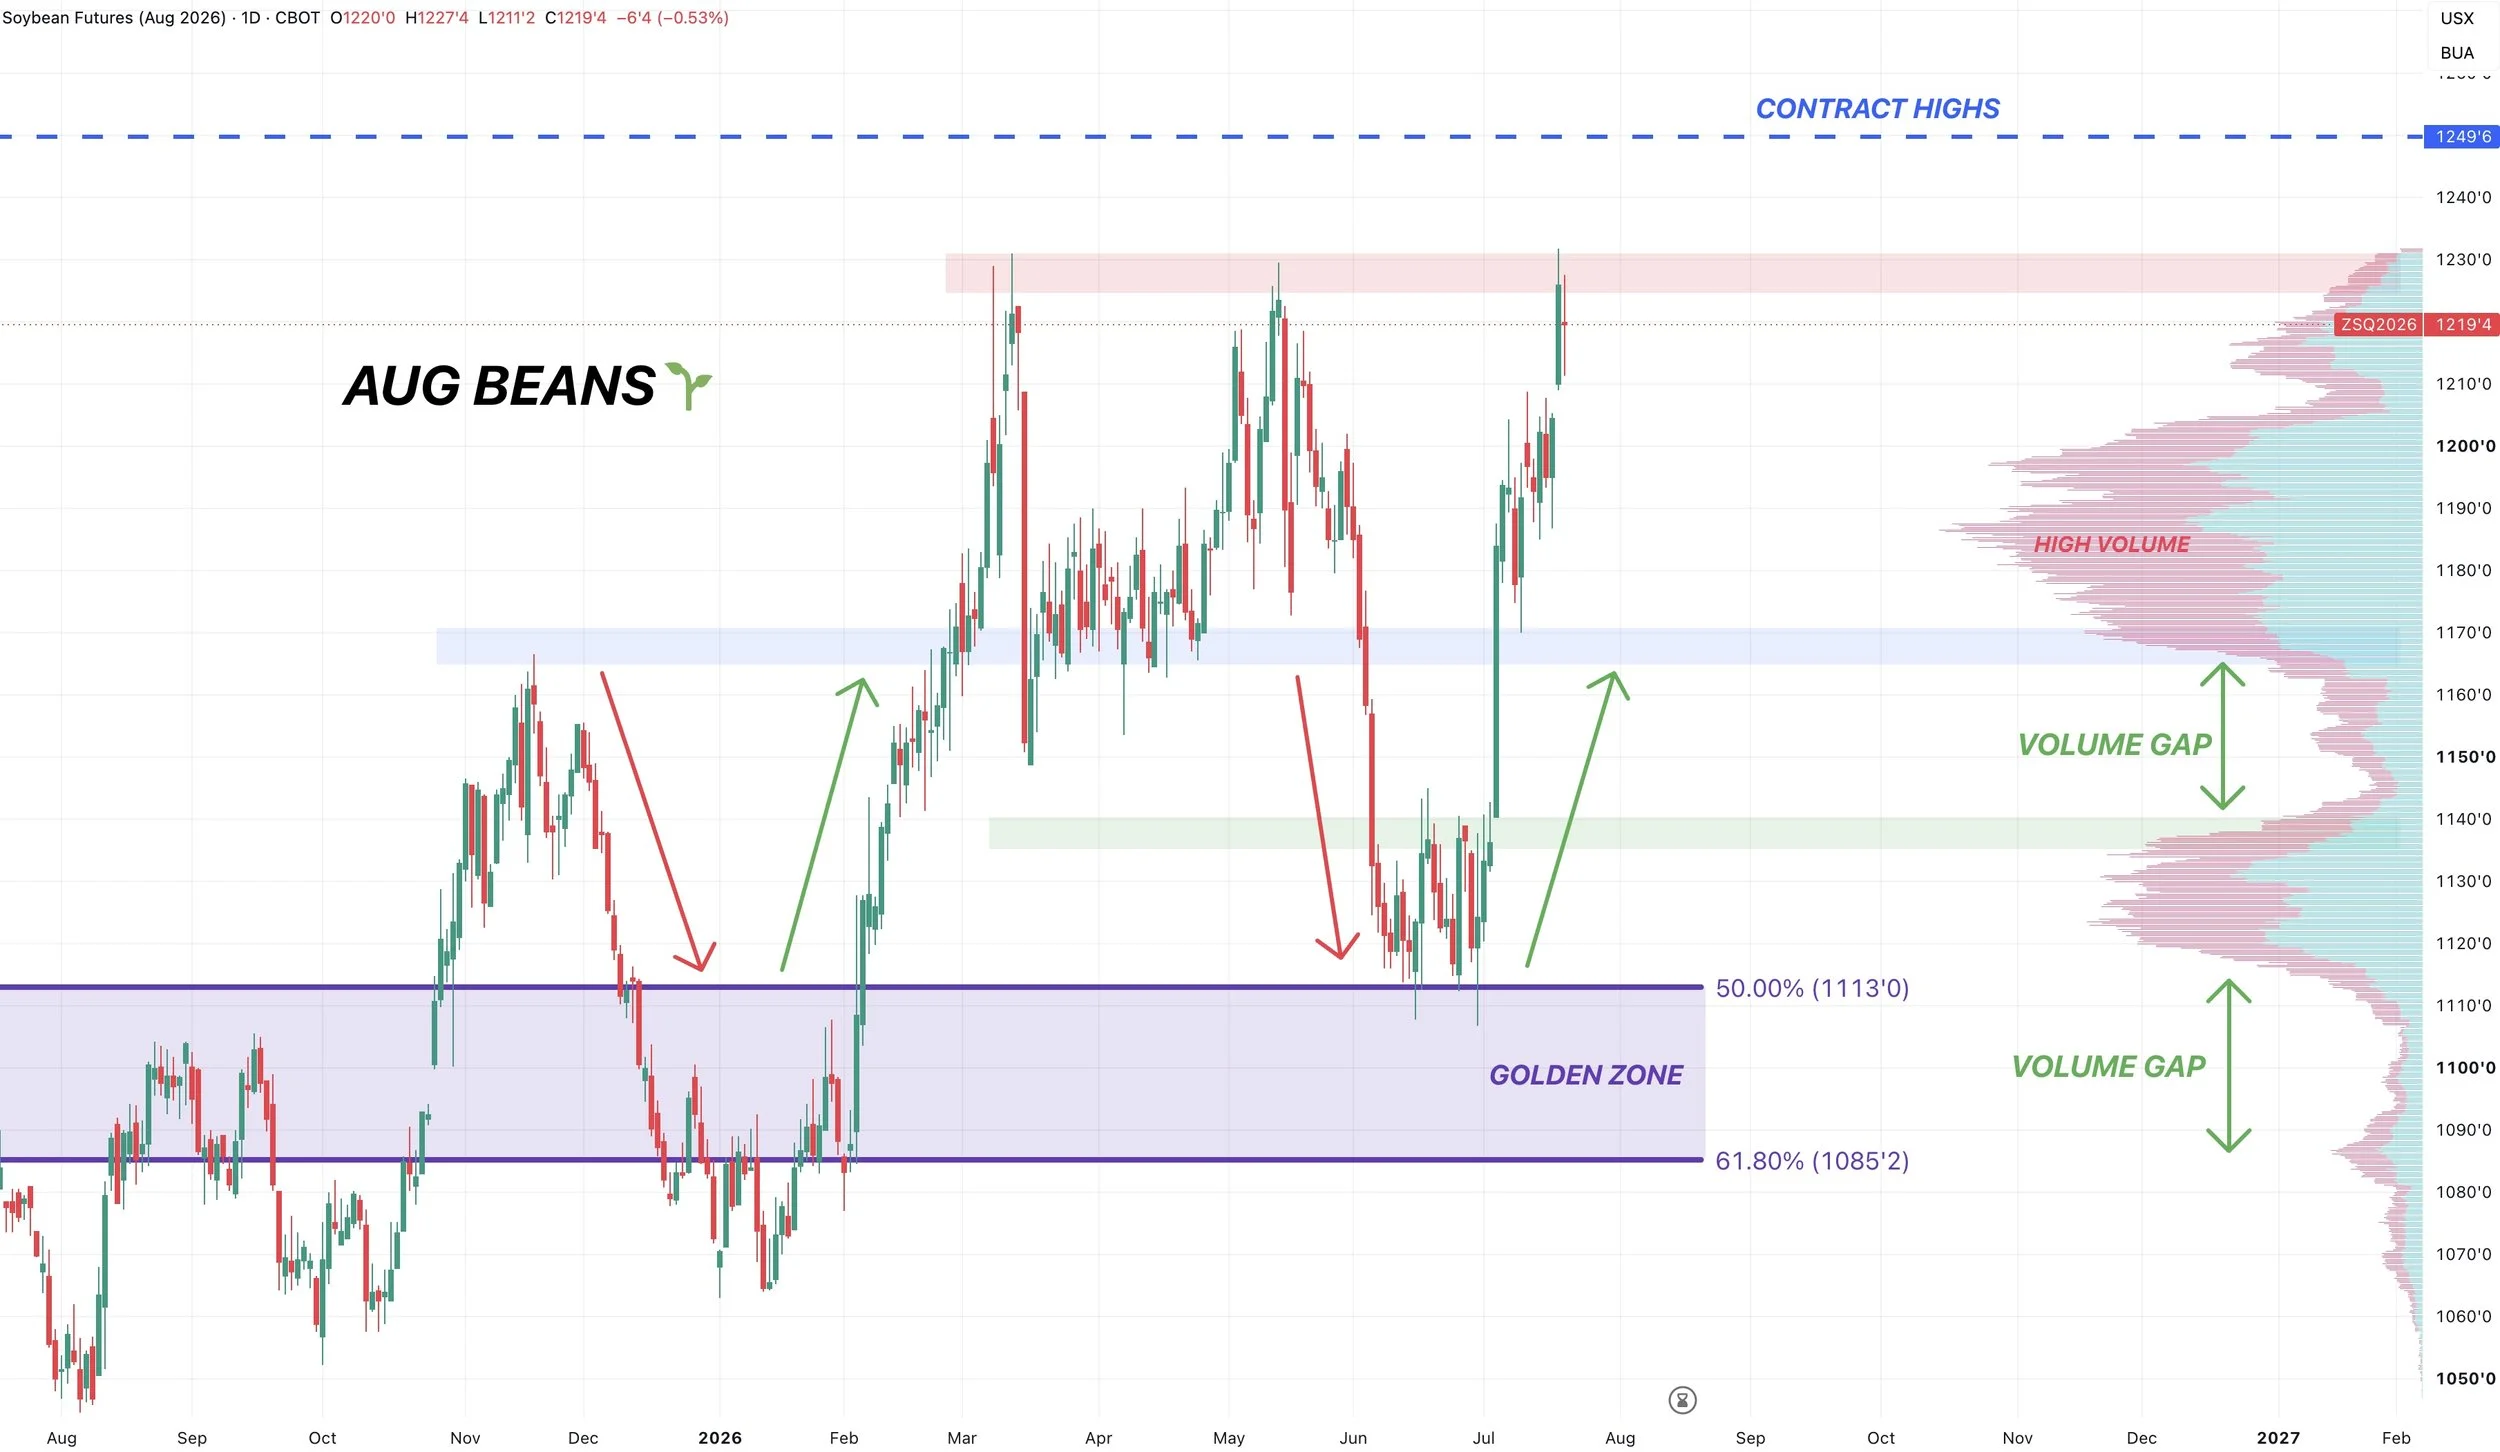
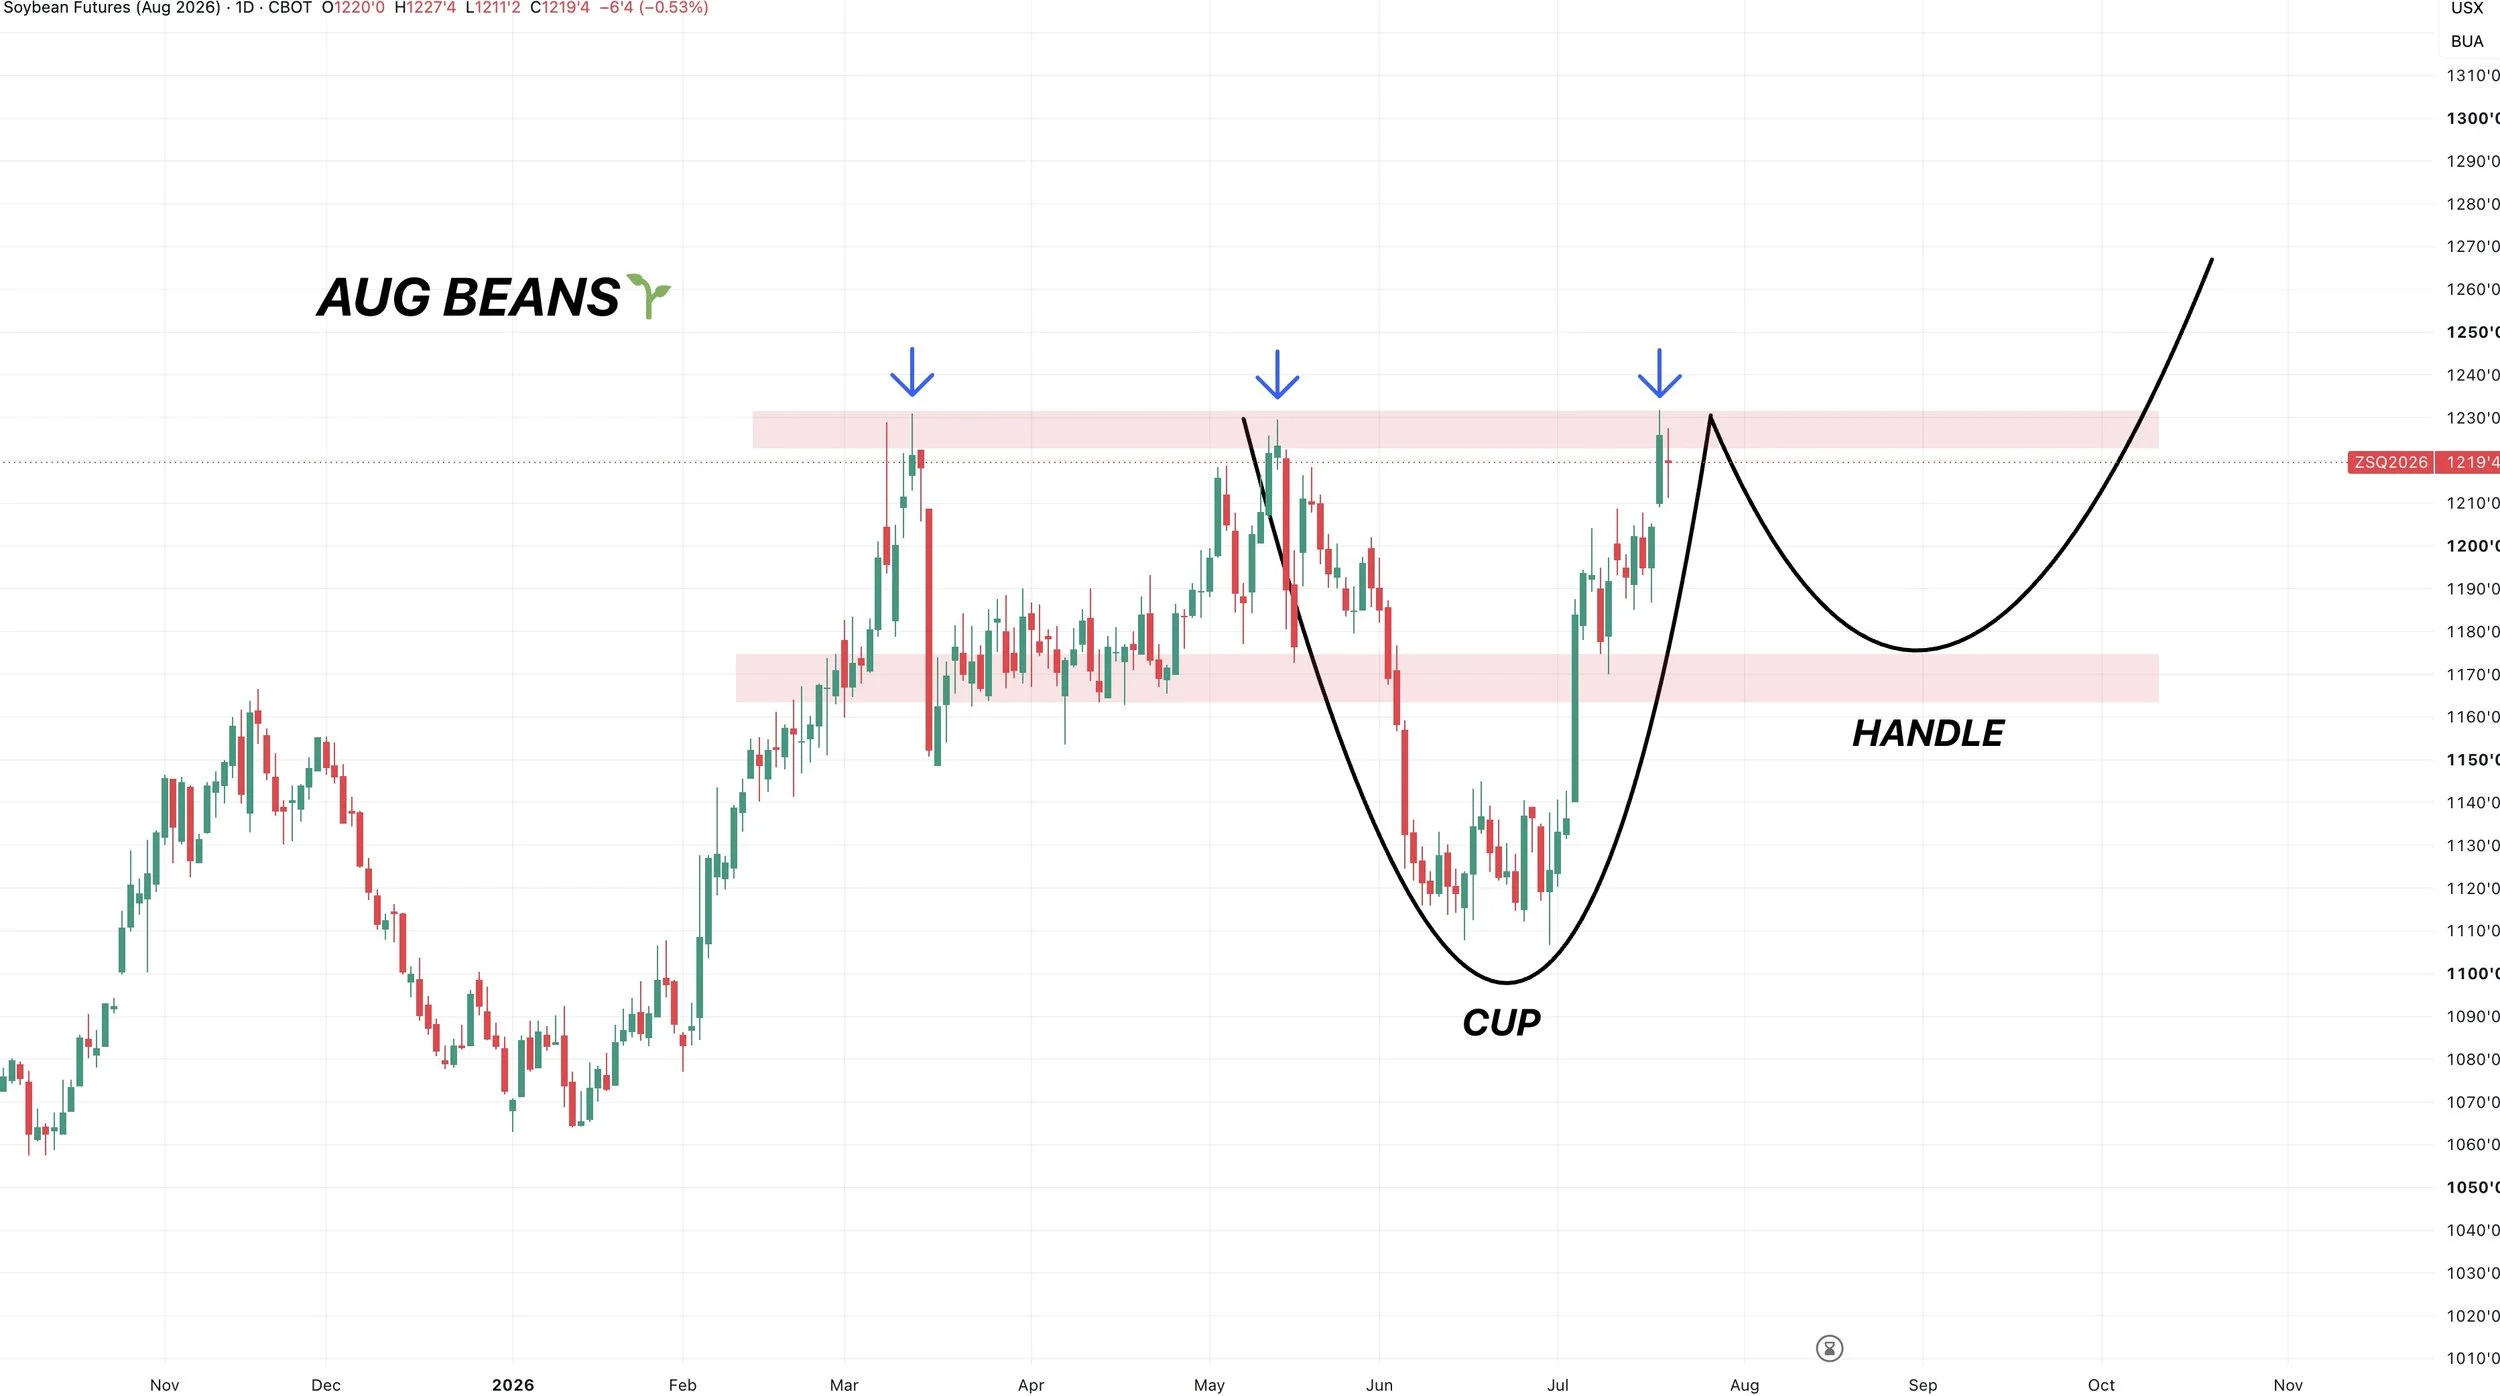
We do not have to fail here again.
But if we do, it could set up a possible cup and handle pattern. Which is bullish long term but would result in a pullback.
Obviously doesn’t have to play out like this, as we do not have to reject here. But if we do reject here, something to watch.
This is big resistance, so if we break through it could very well offer farther upside. But for now it's viewed as resistance.
Front Month Beans Chart:
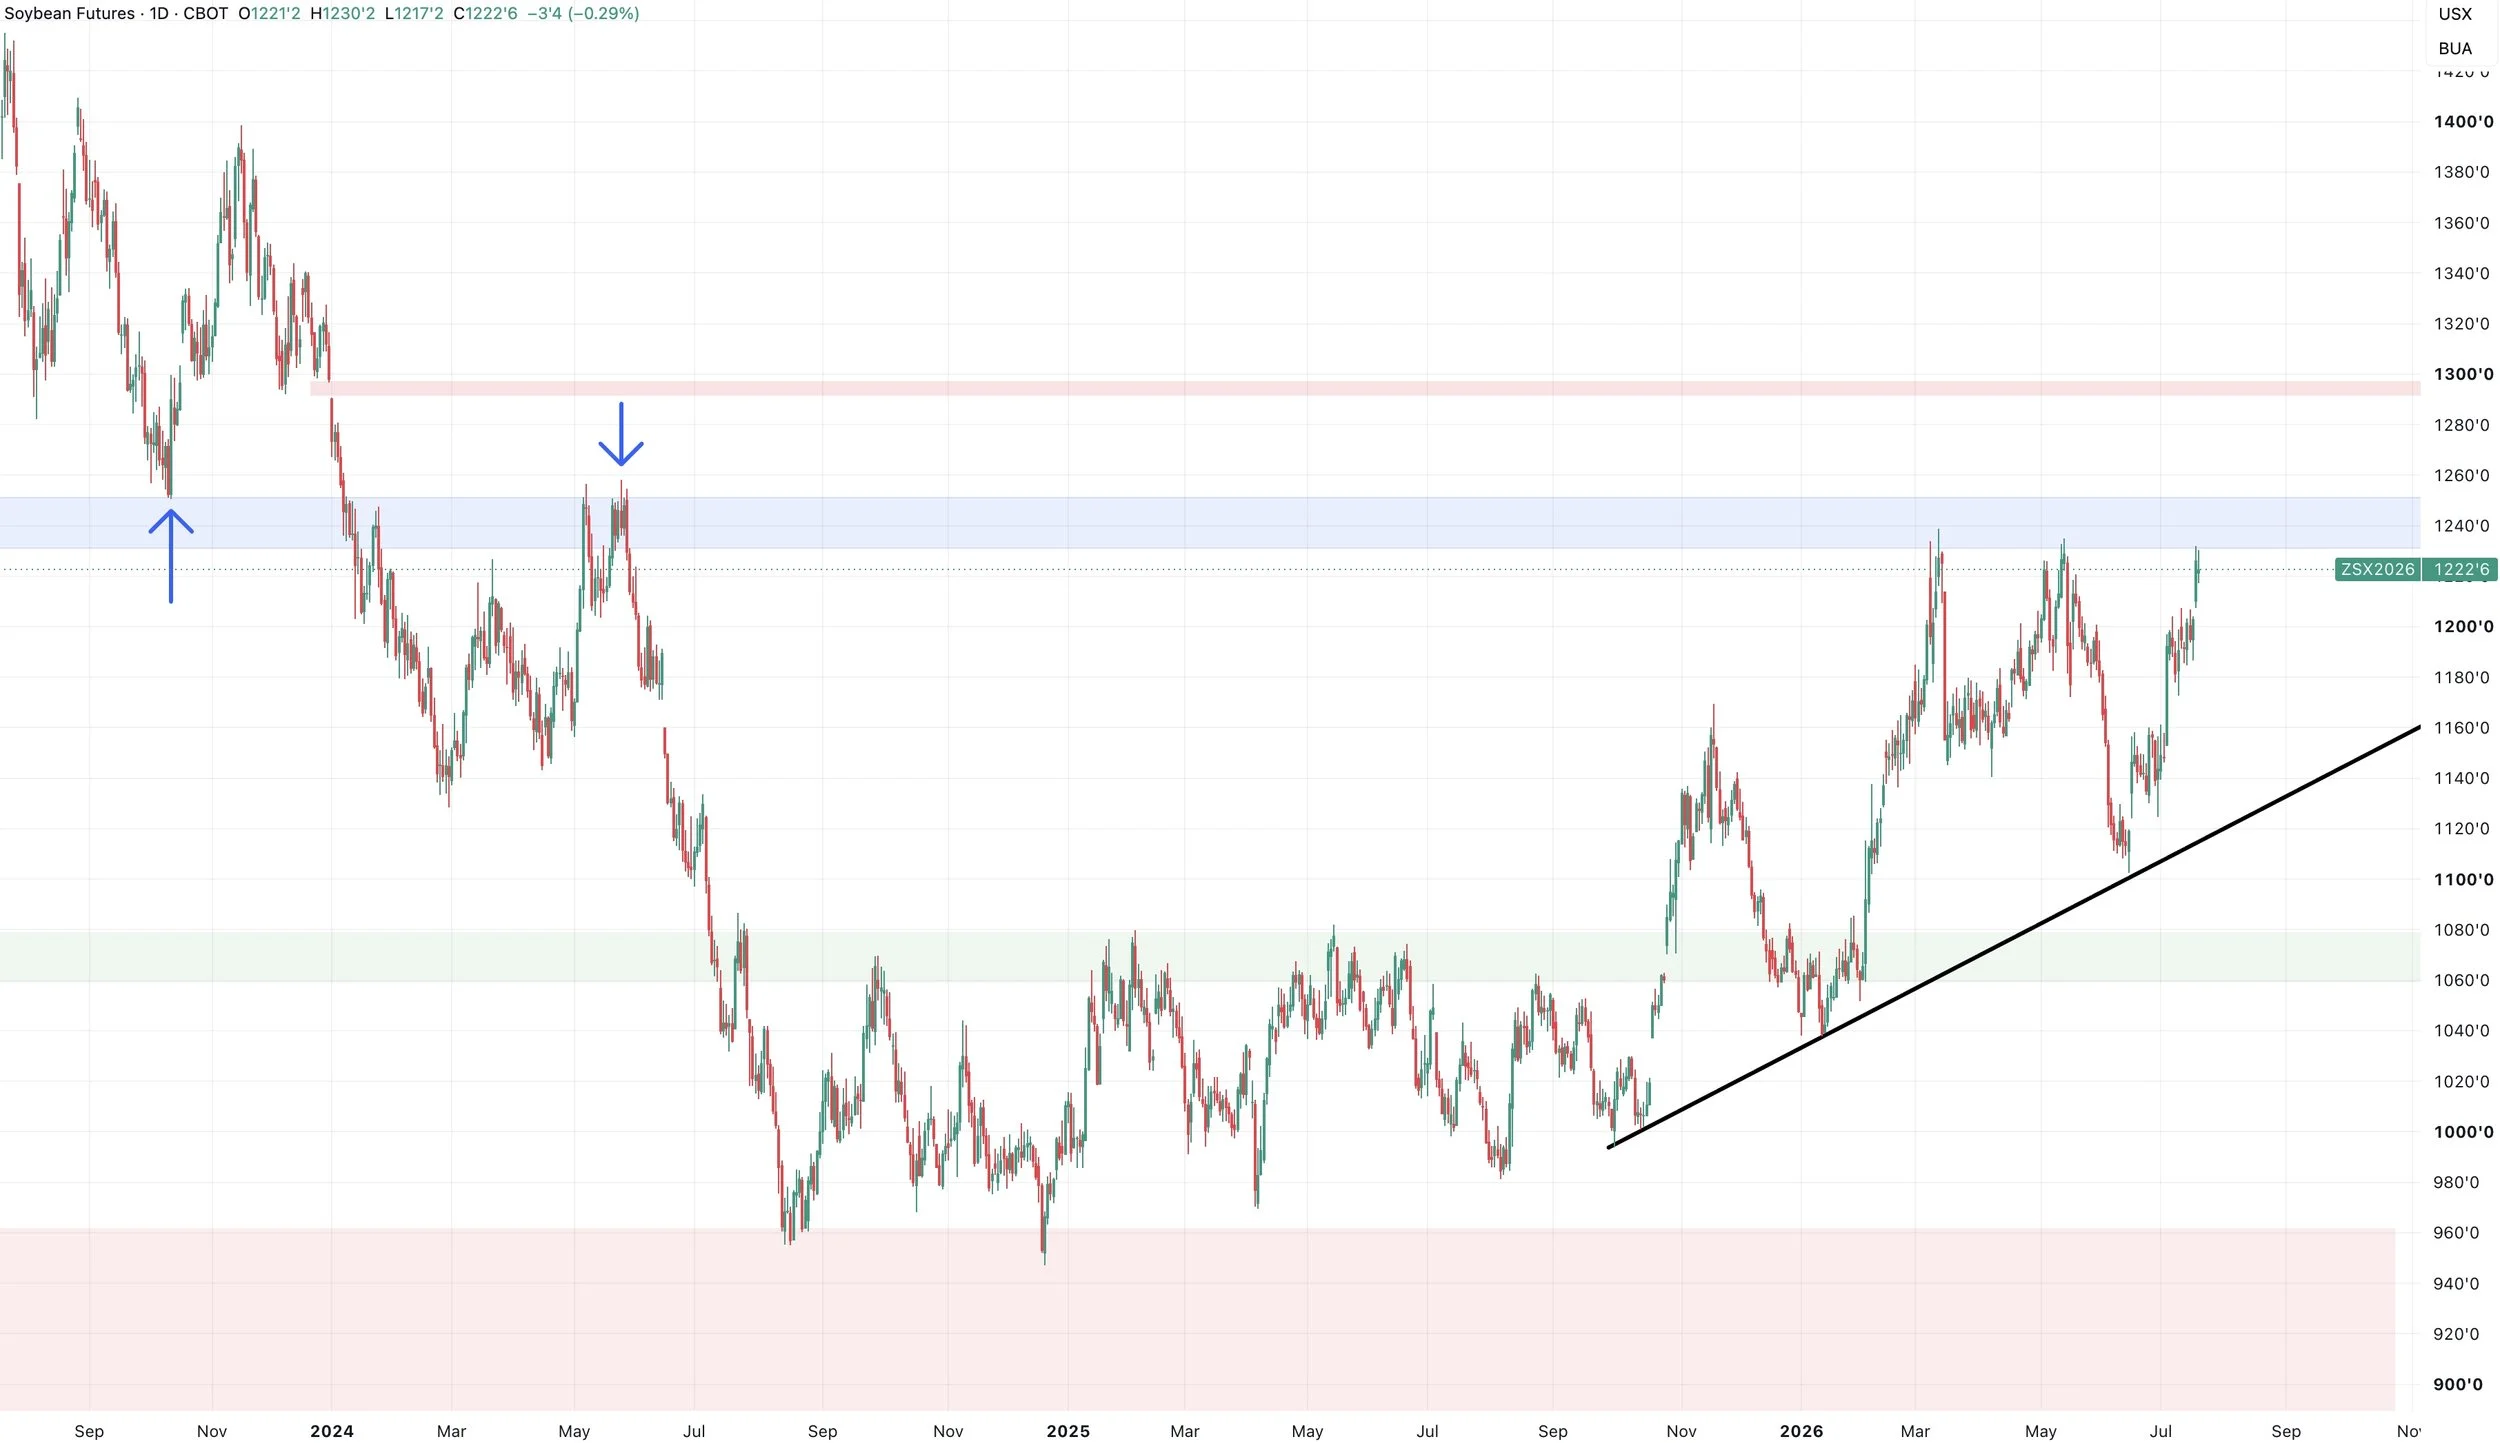
If we are able to break above $12.50
Which is the contract highs in August beans.
It is also where this market topped in 2024 as well as bottomed in 2023.
We do have an unfilled gap from 2024 that sits right at $13.00
Nov Beans Chart:
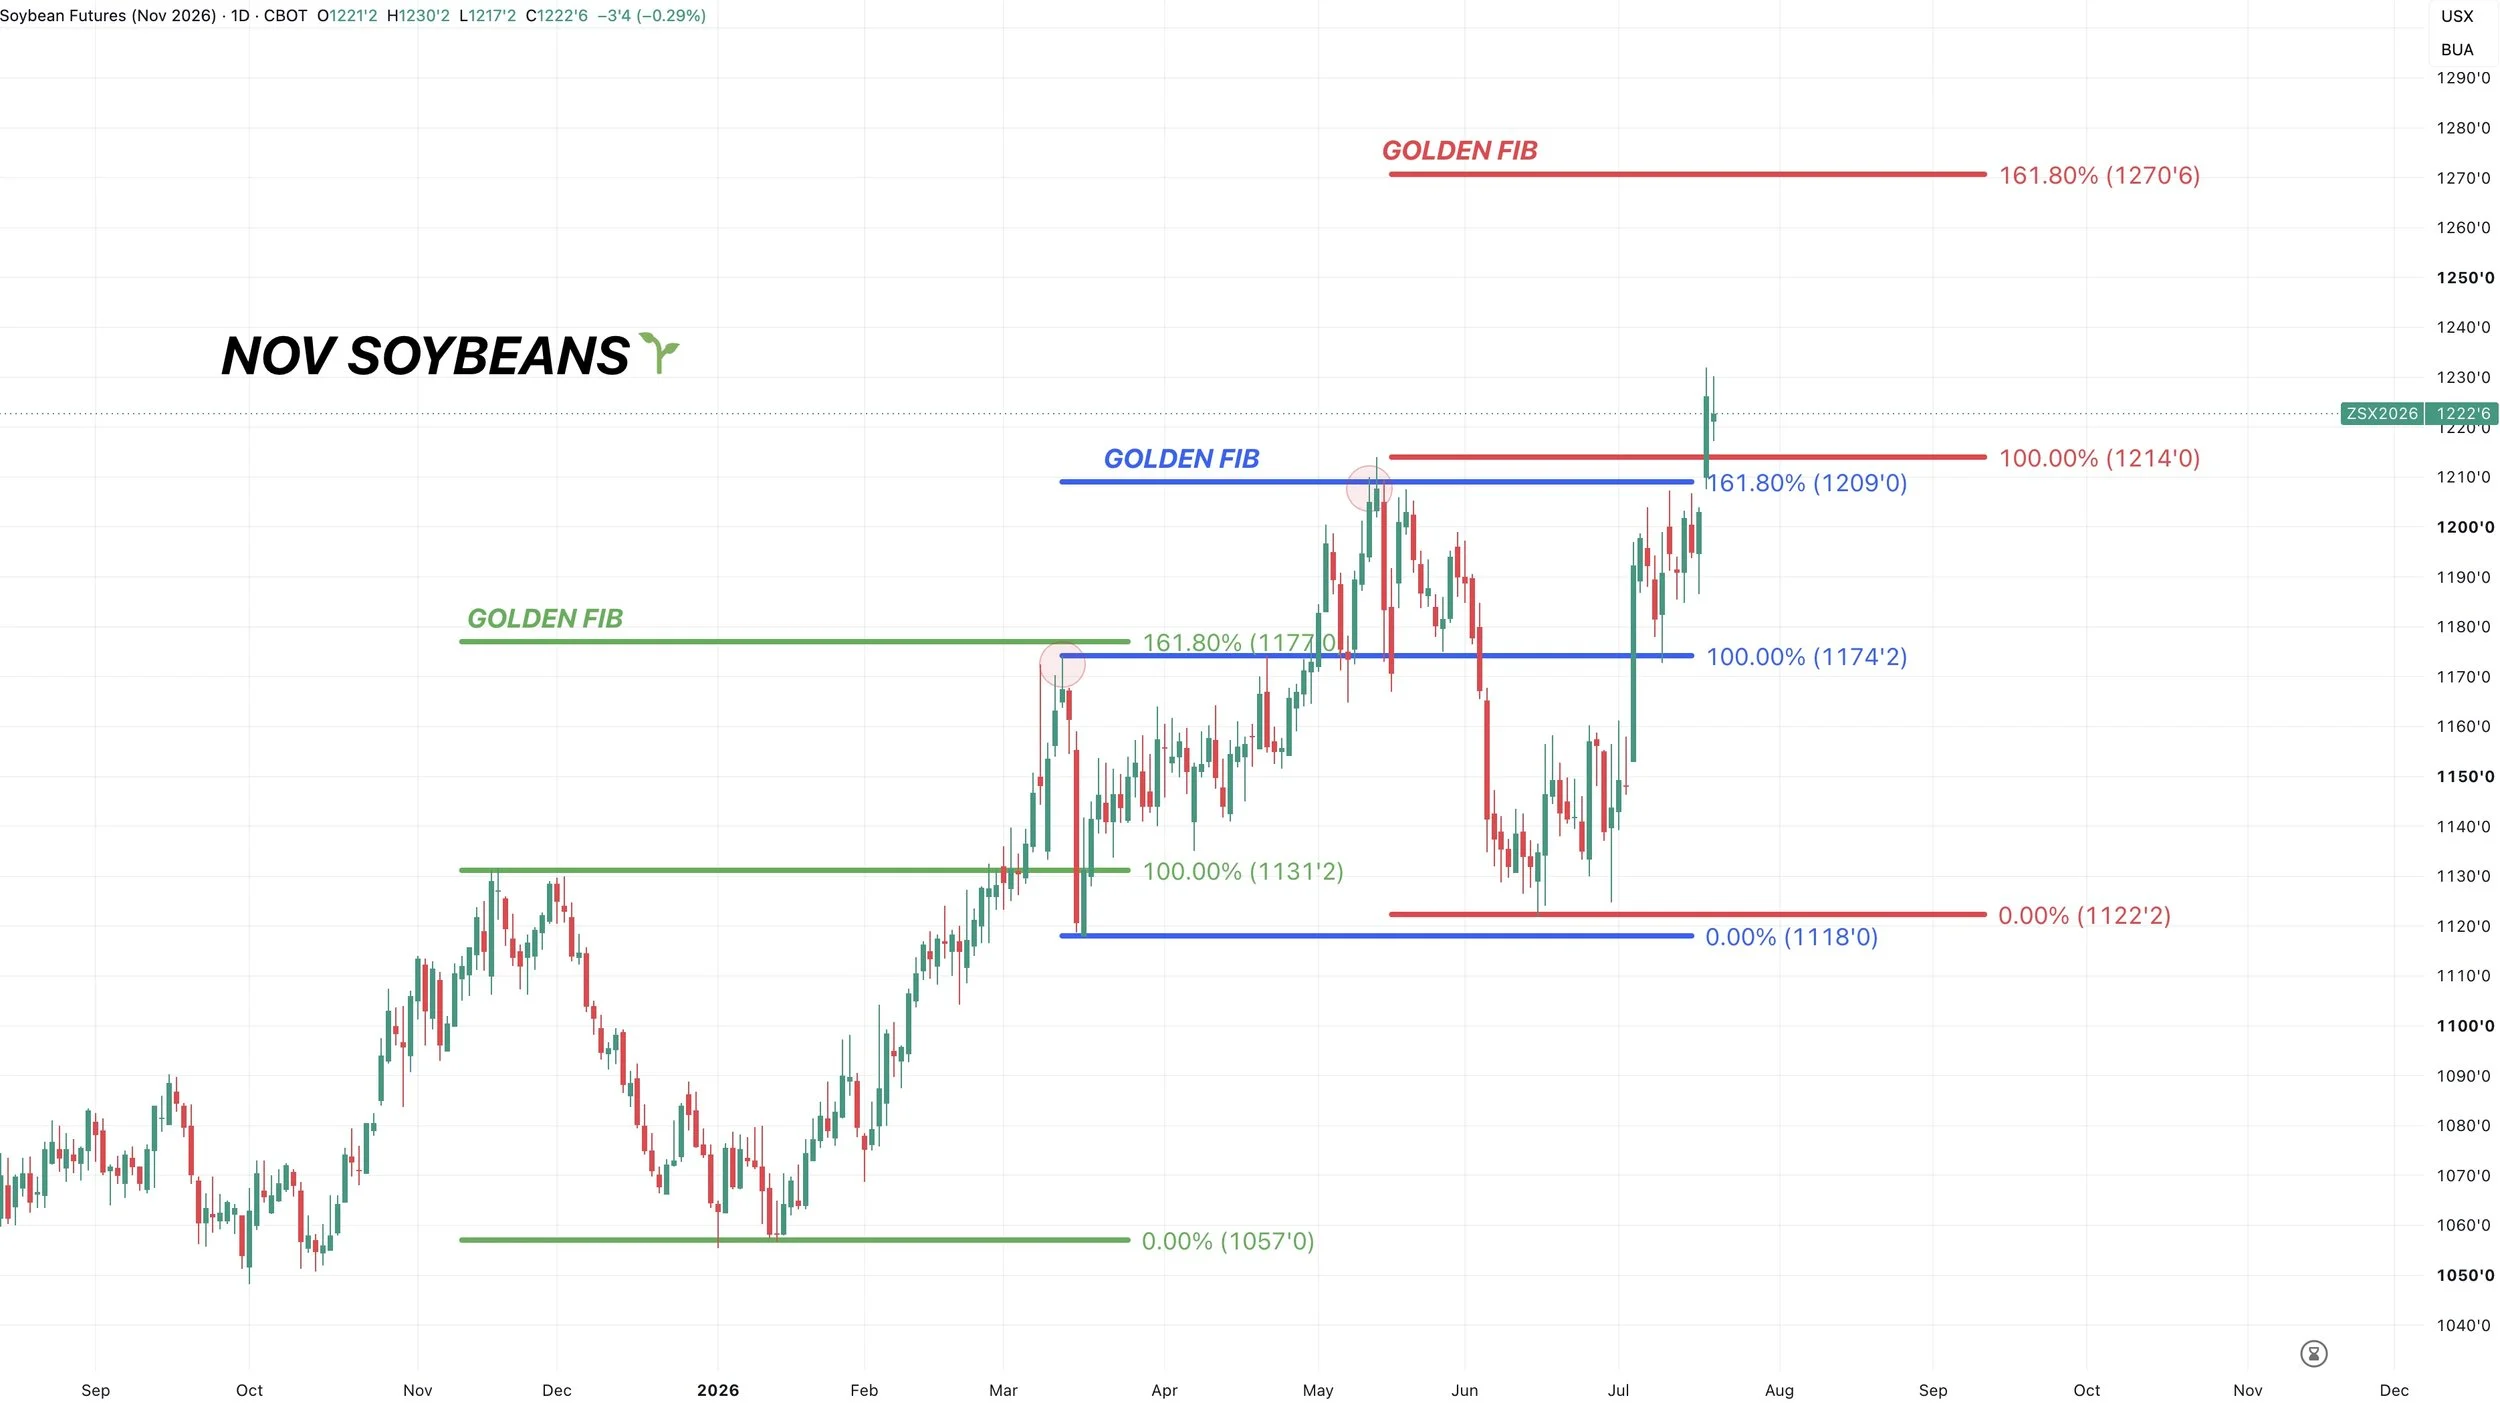
The chart looks good. We got the breakout from the volume shelf and prior highs.
Altough, old crop soybeans are at some potential resistance.
Overall, bulls simply want to continue to hold that volume shelf, as there is air below that level.
The trend in this market is clearly higher for now.
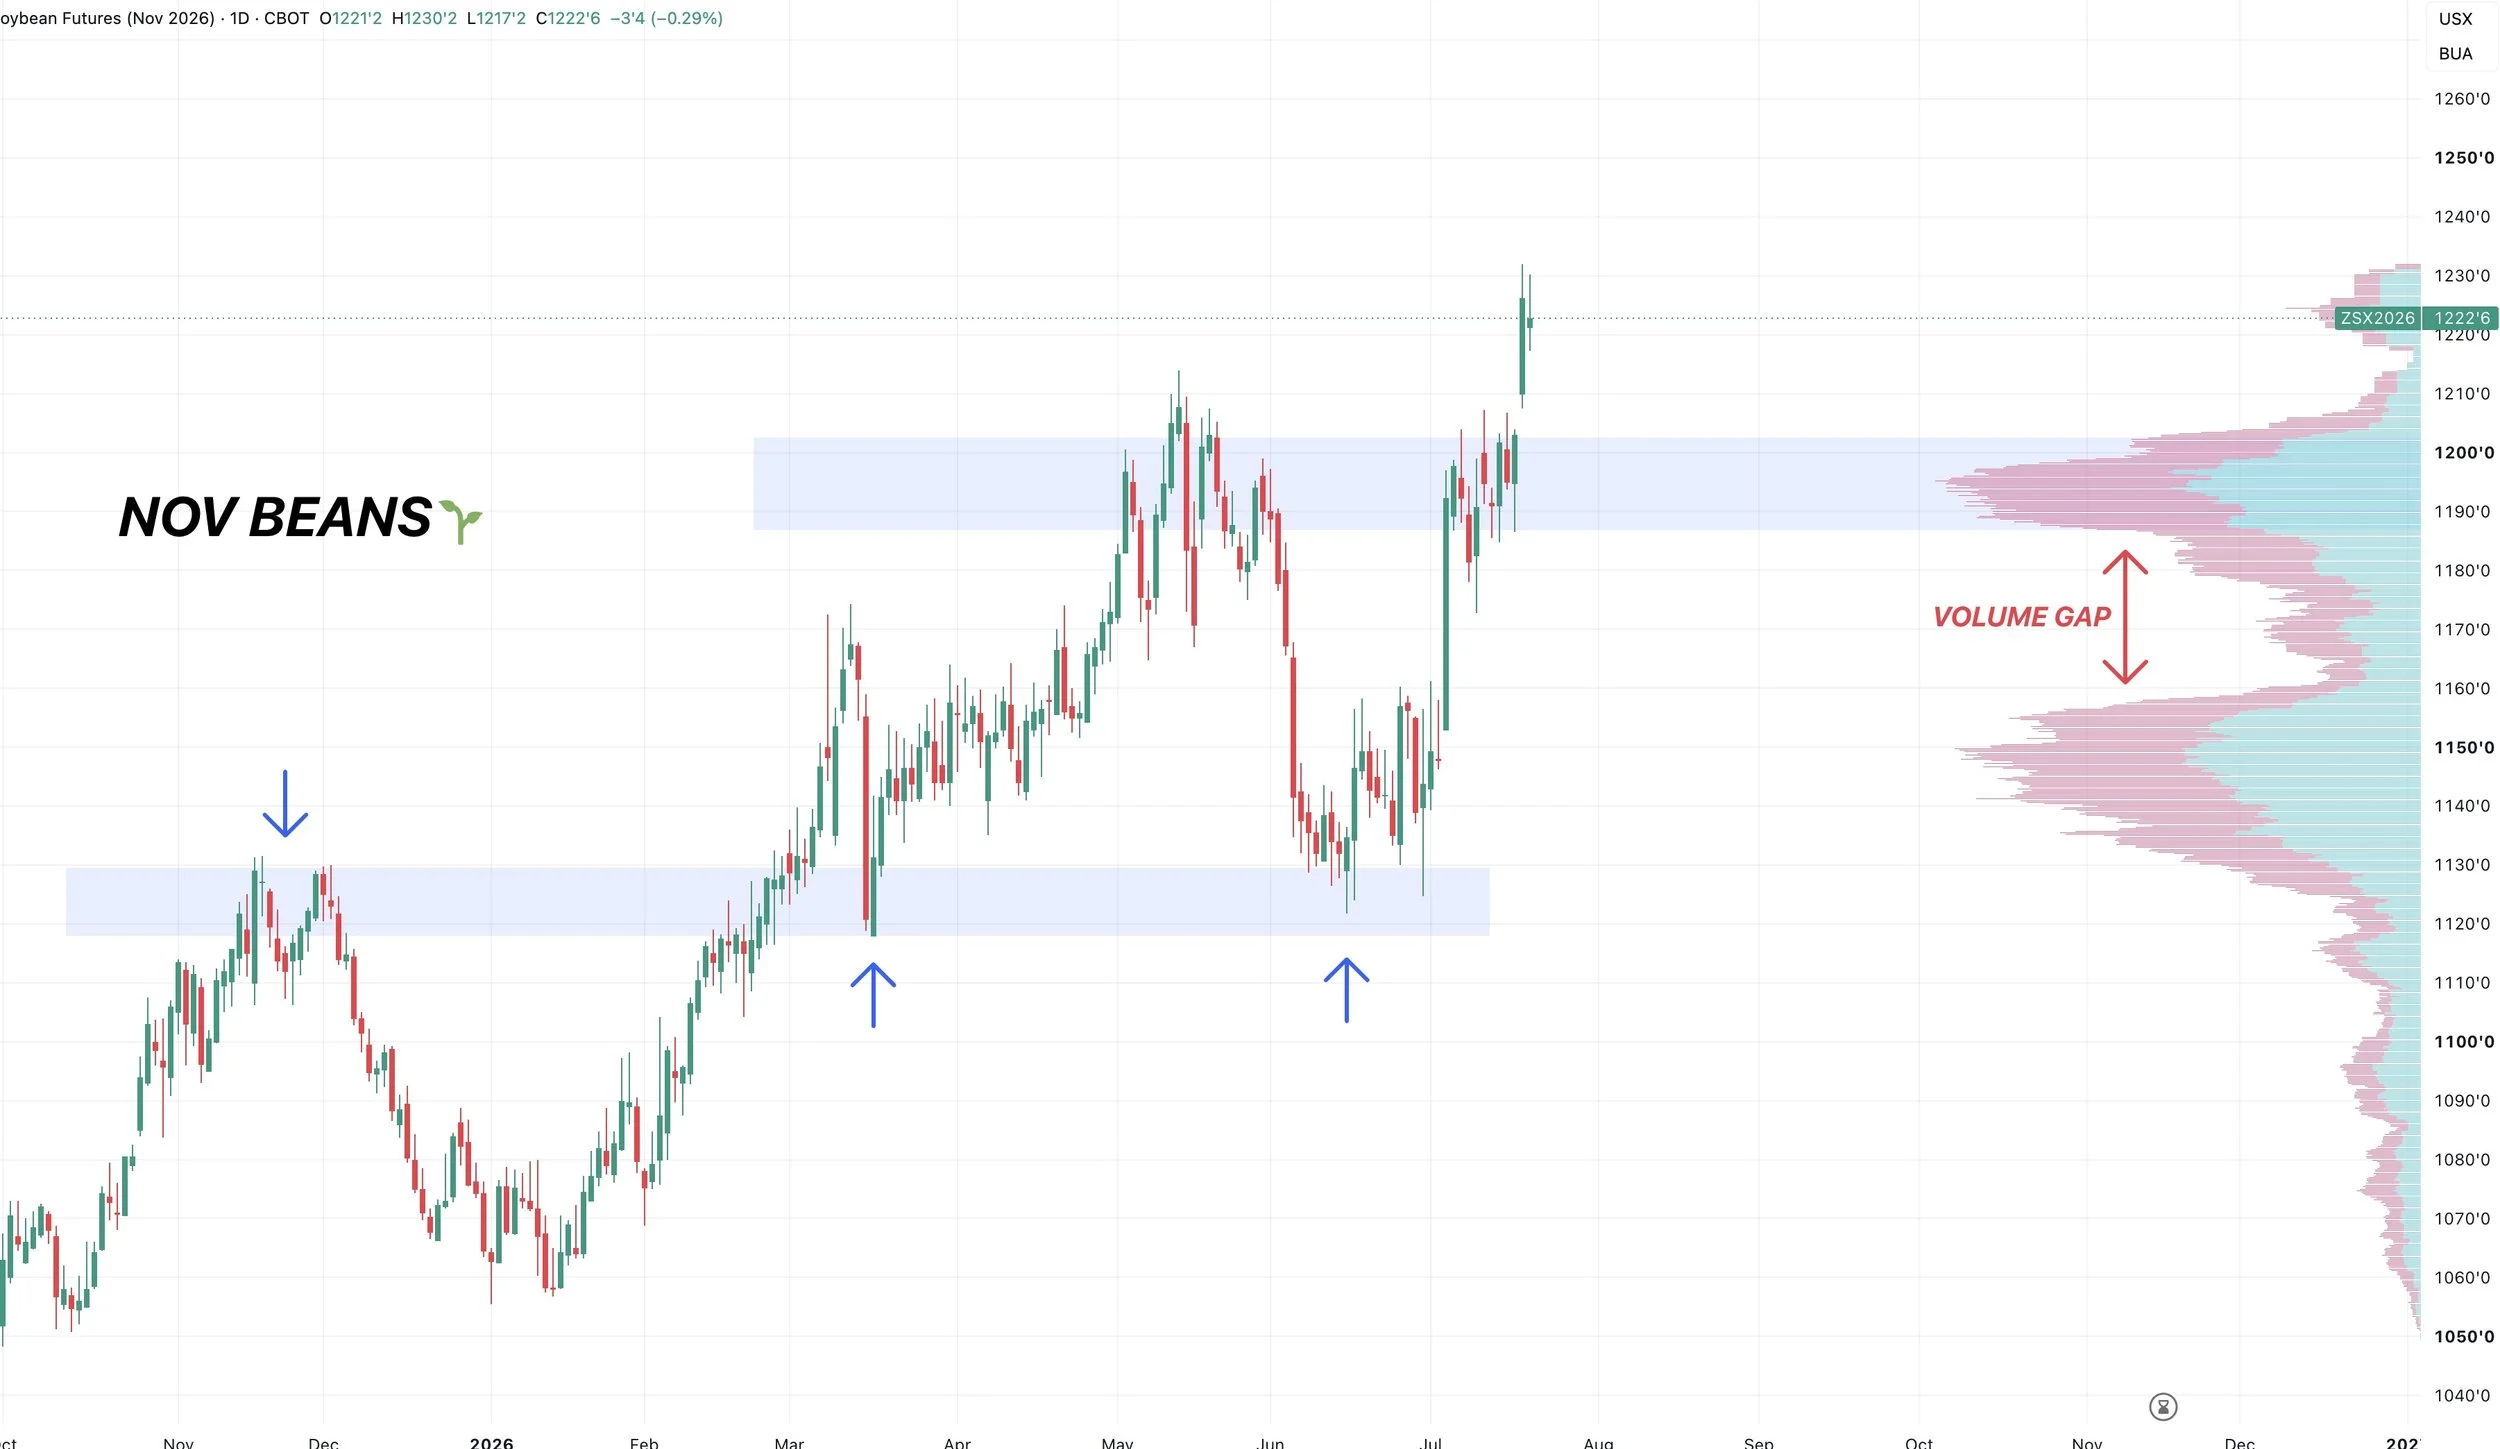
I still have a possible long term target of $12.70 but this target is always subject to change.
Which is the golden fib from the recent lows up to the May highs.
The golden fib has marked the last two local tops in this market.
Wheat
KC wheat isn’t in a weather market like corn and soybeans are.
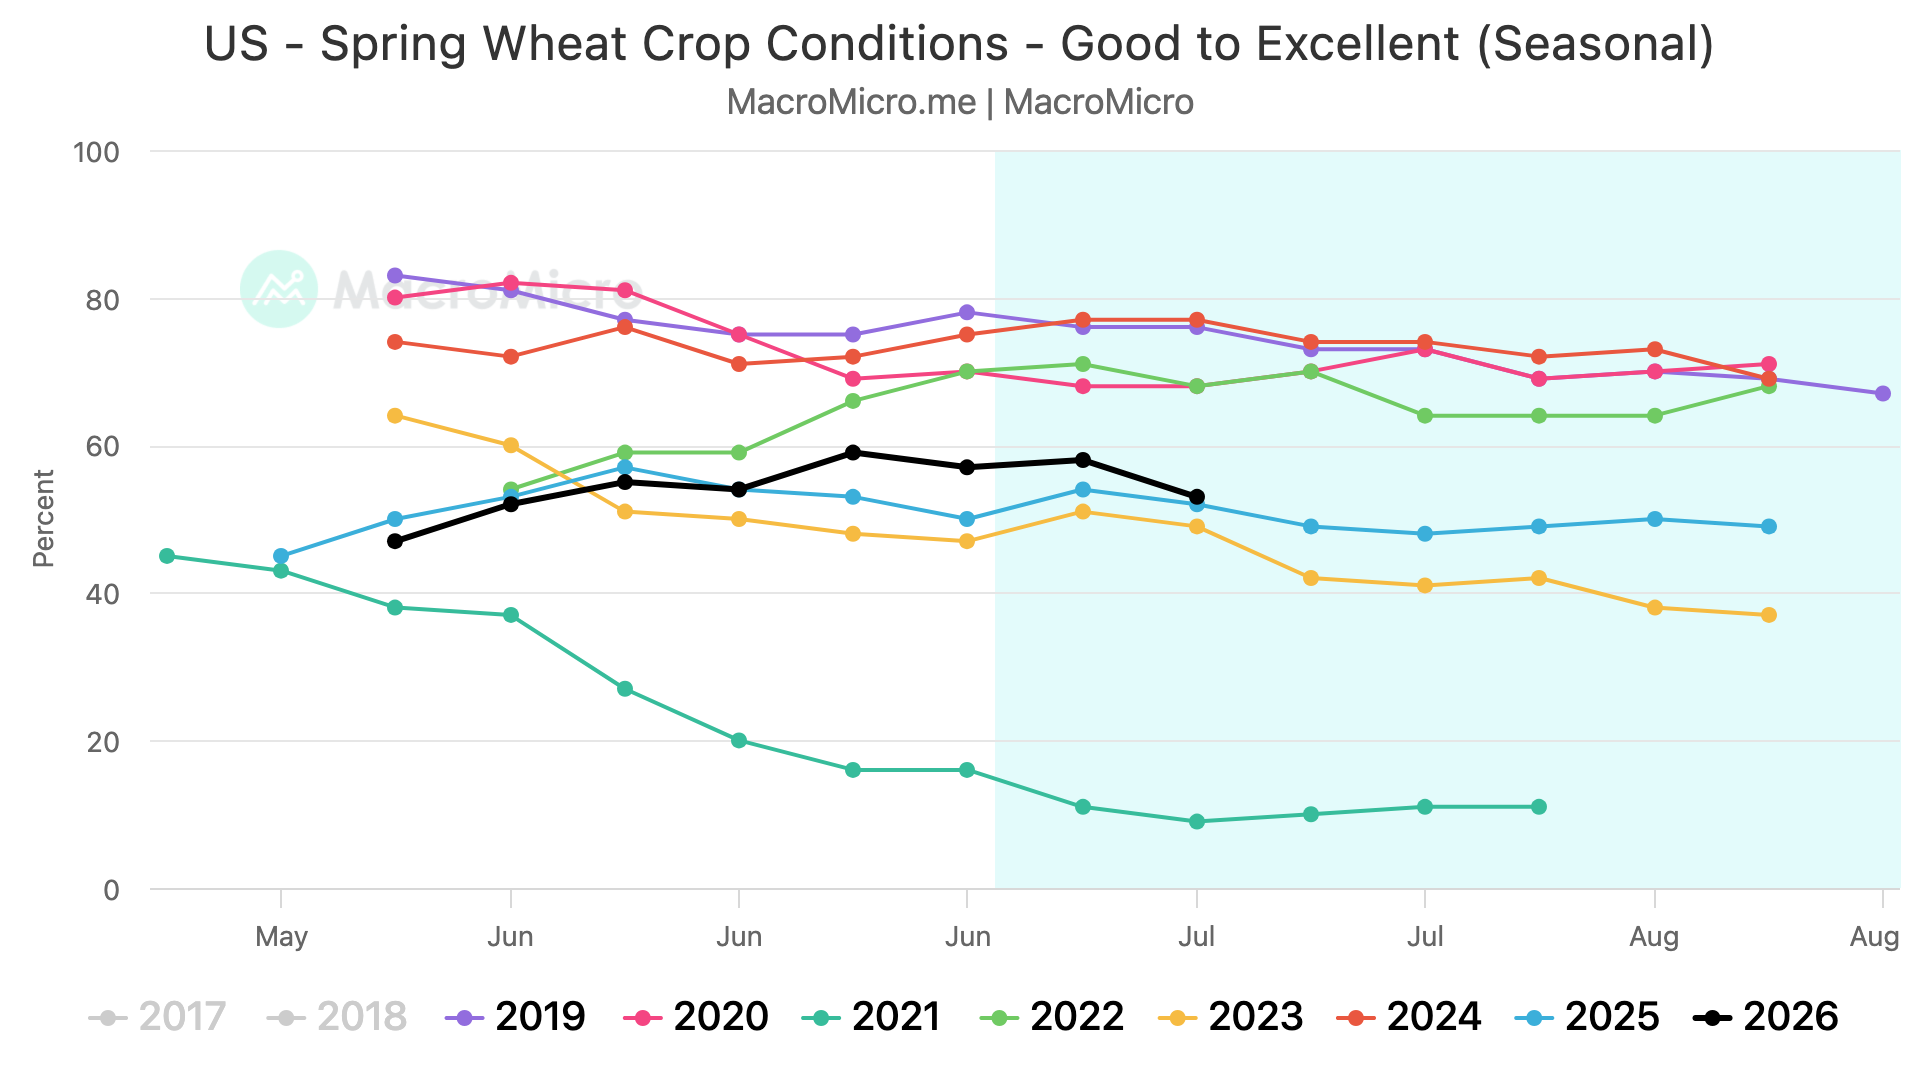
Altough spring wheat has been seeing some possible concerns.
It's been awfully hot and dry up in North Dakota.
We just saw spring wheat ratings drop 5% this week.
Where wheat goes from here is really all going to be about the Black Sea.
Do the escalations continue or not?
How much of Russia's exports actually get restricted?
No one really knows.
If escalations get worse, wheat probably heads higher. If escalations die down, wheat could head lower and give back some of the recent rally.
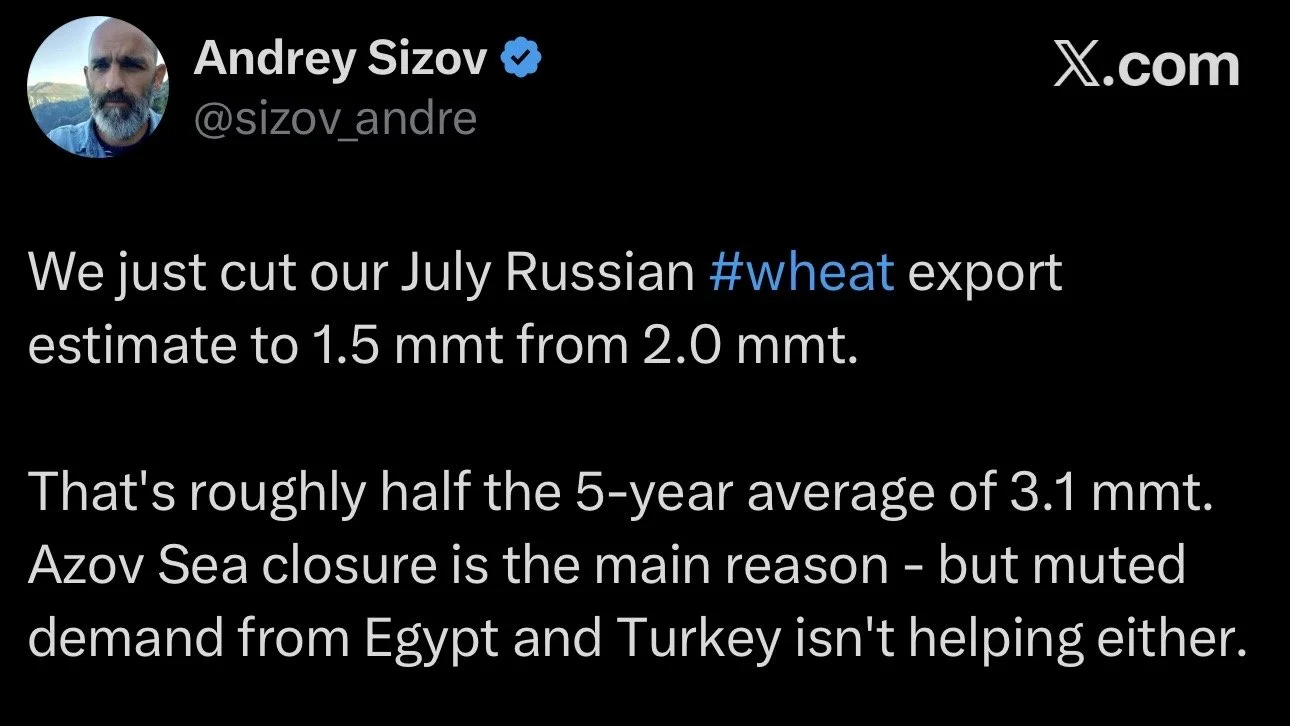
Analysts are already starting to walk back their Russia exports for the month of July.
If the Black Sea remains closed and exports remain restricted. It could be a very big issue down the road. Given 7.5% of the world's wheat exports runs through the Kerch Strait.
Front Month Chart:
If we look at this chart, we are right back up against those highs from not only earlier this year, but also 2024.
So this is a big level and could offer resistance.
If you are someone who knows you have to move wheat, it's never the worst idea to do so at resistance.
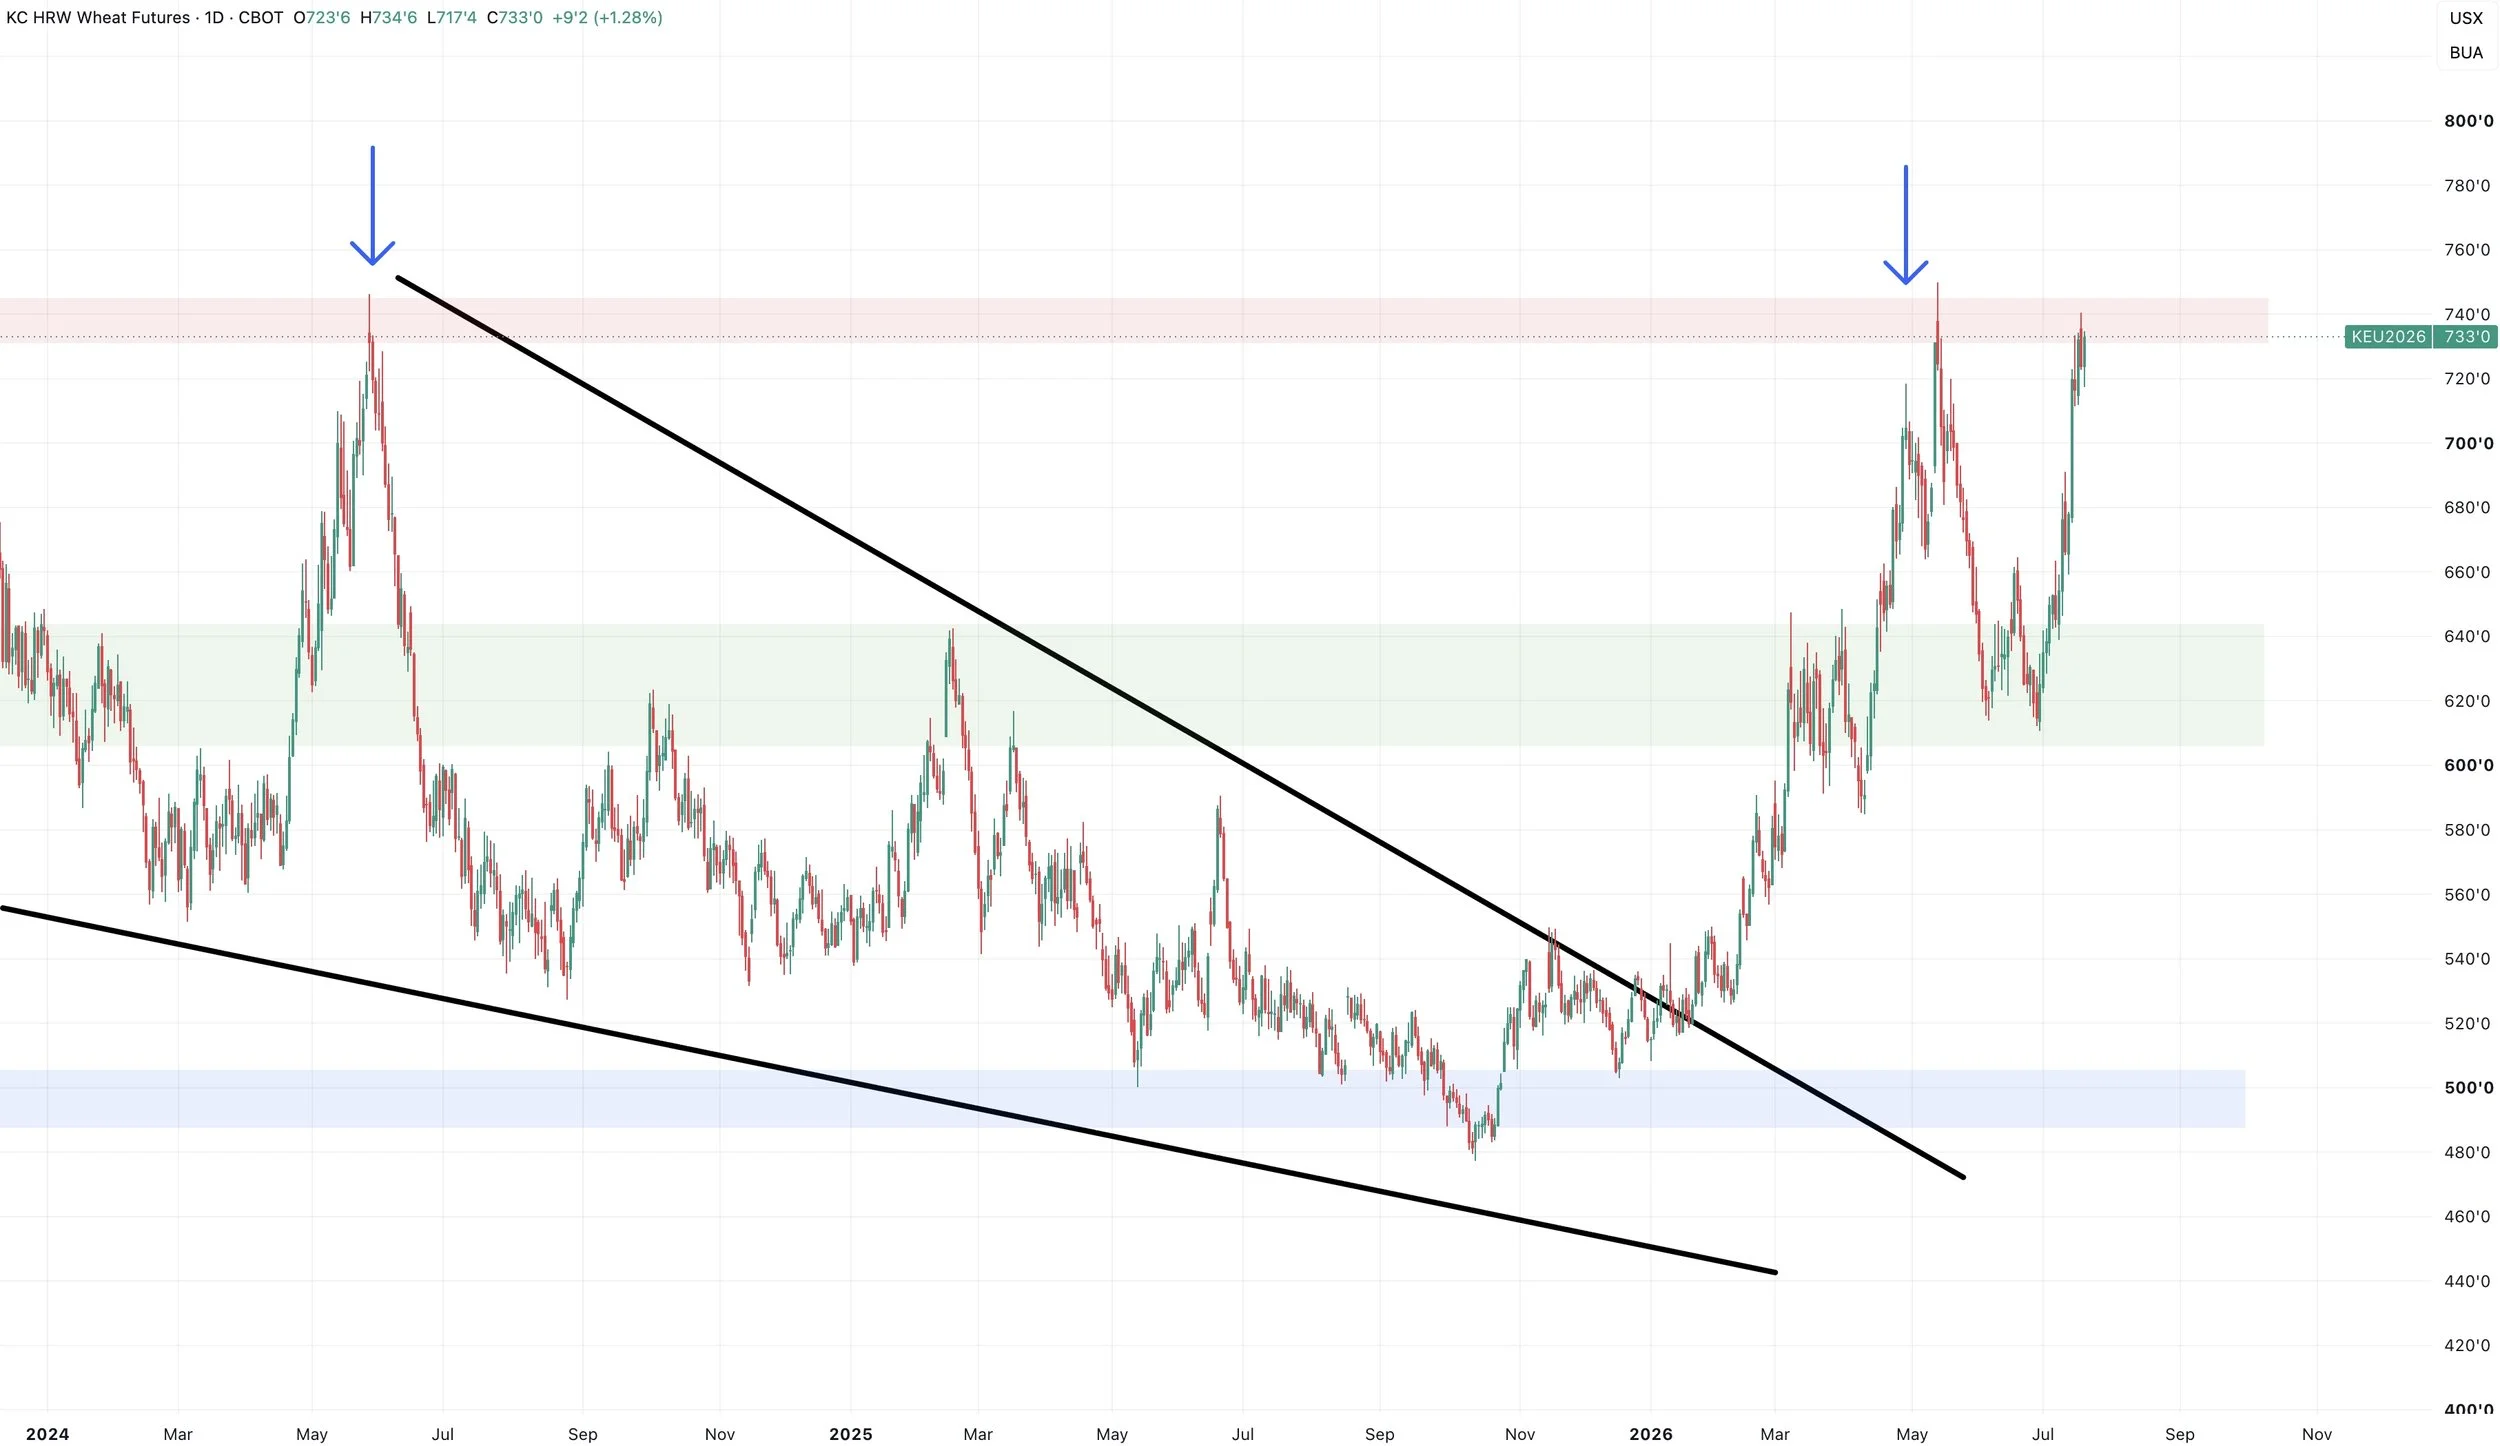
If we failed here, I could see a possible cup and handle pattern playing out in wheat as well.
Again, doesn’t have to happen.
But if we fail here it would be one possible scenario we are watching.
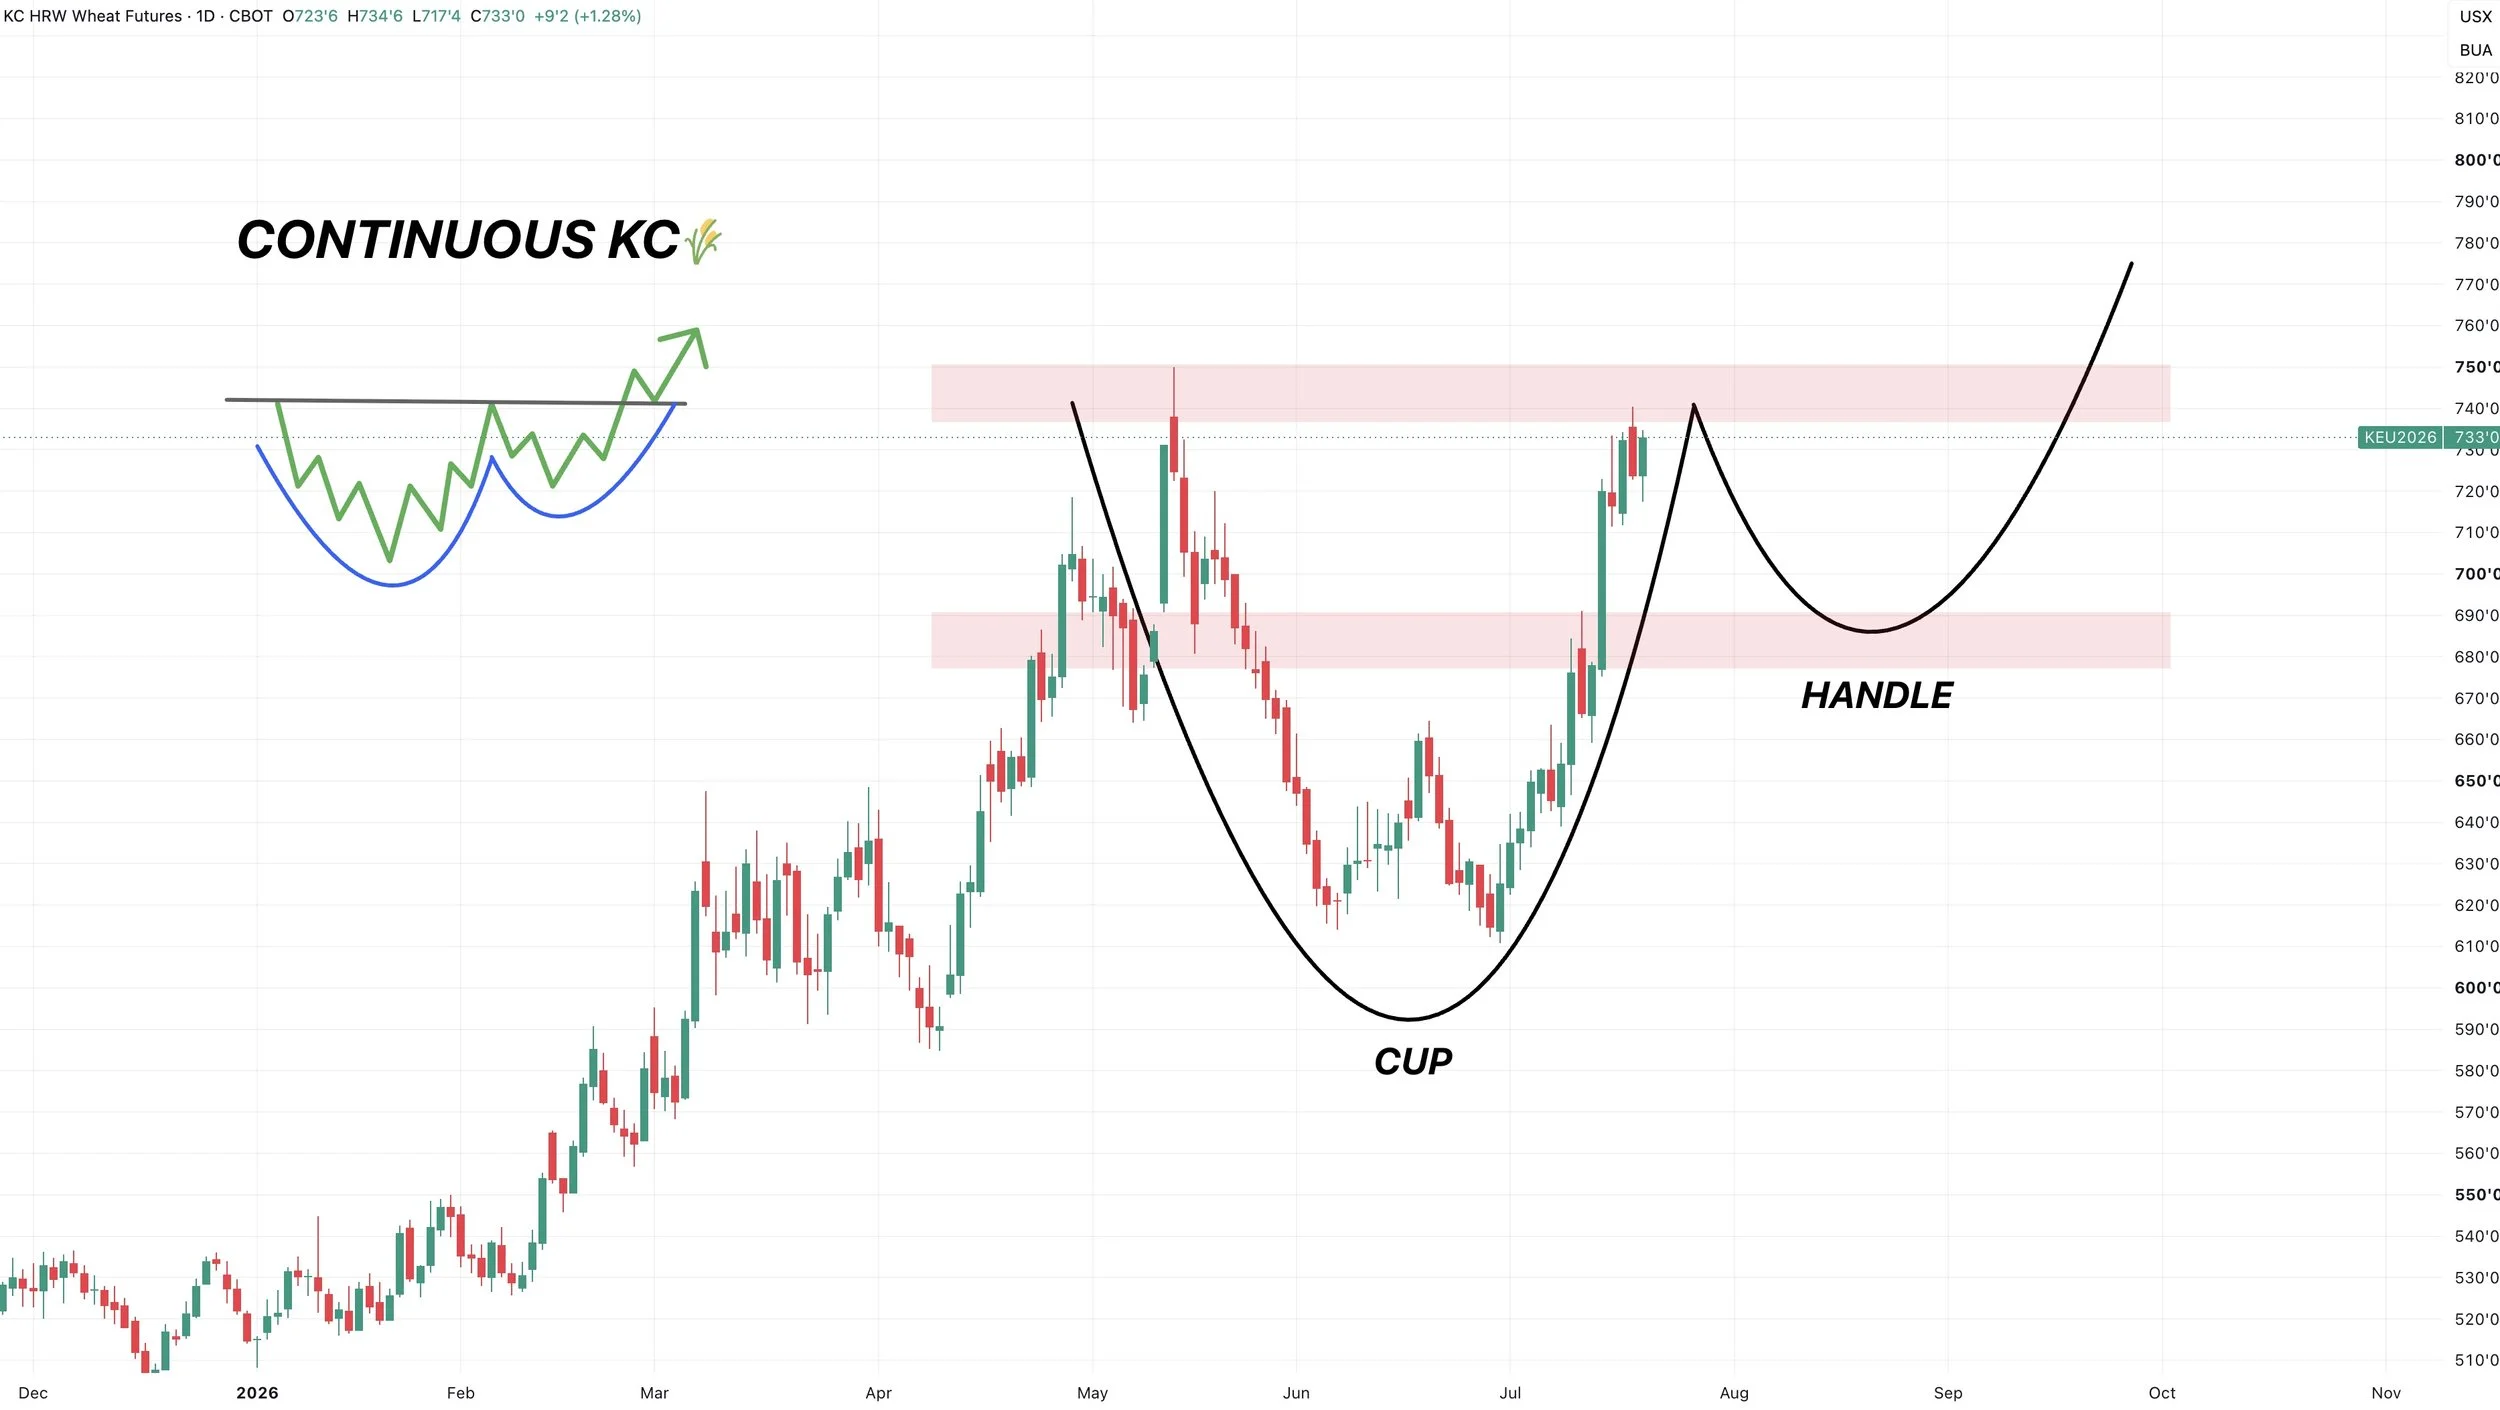
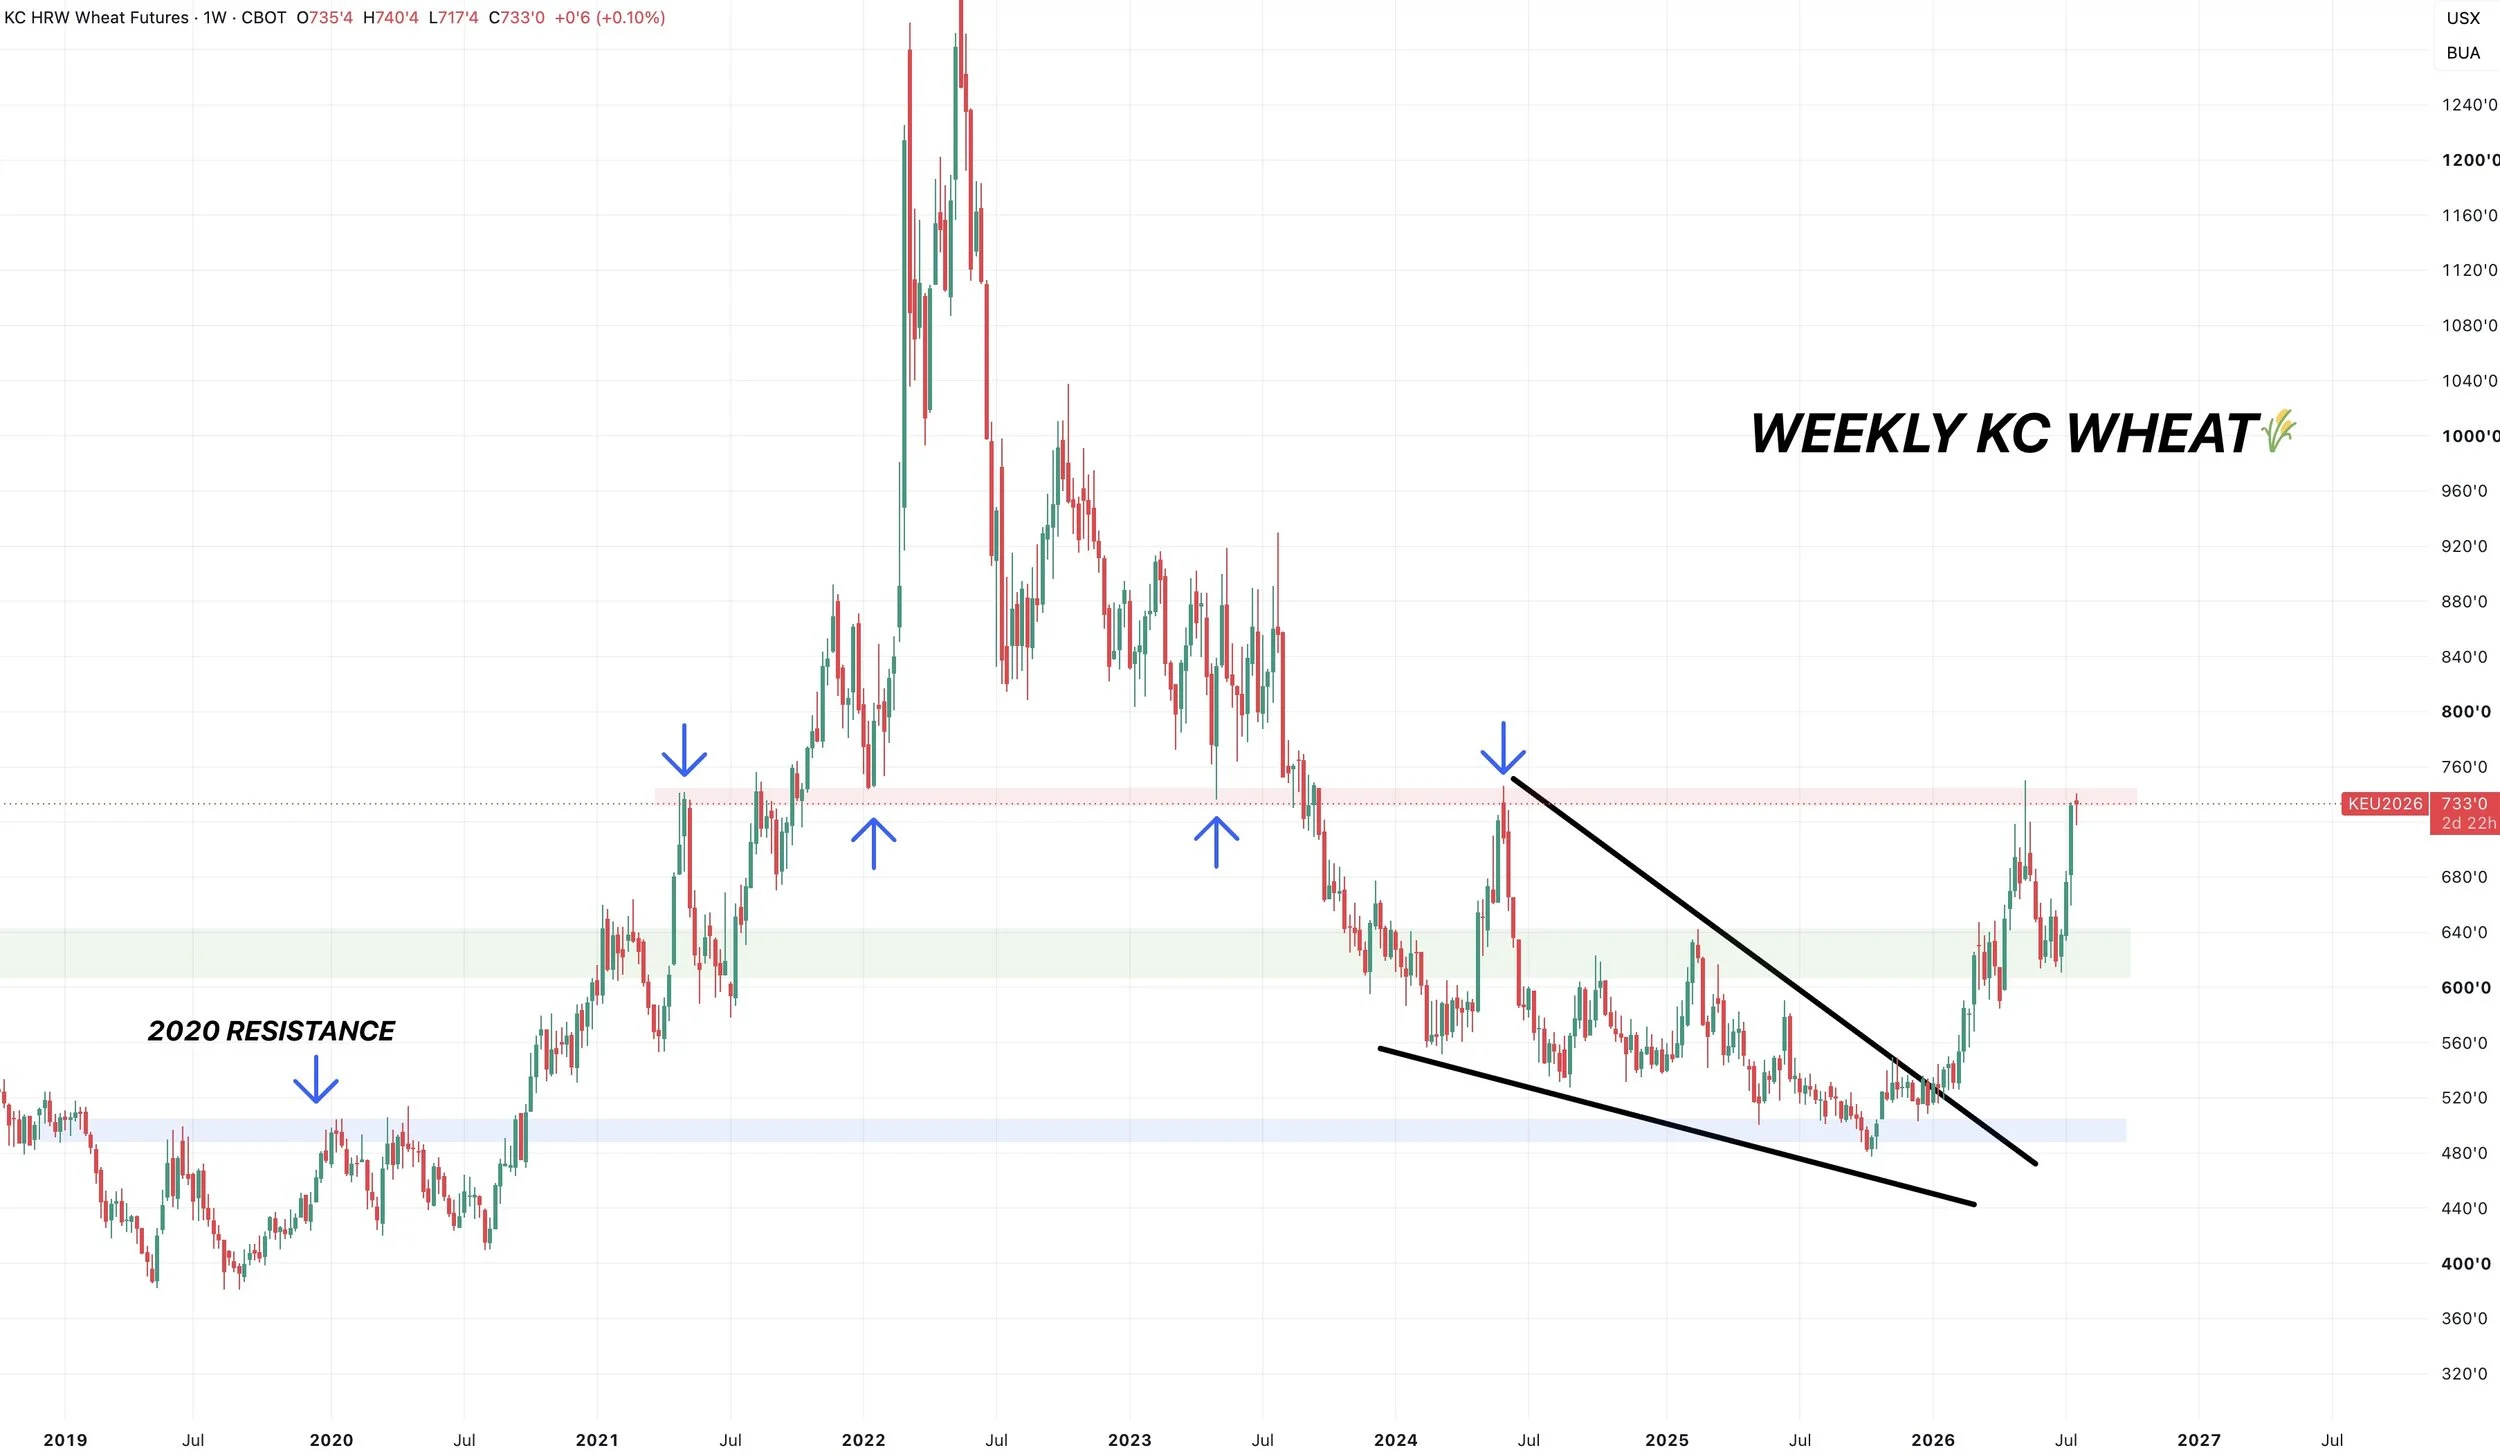
On the flip side, if you break above these highs it opens the door a lot higher.
This is massive resistance.
When you break massive resistance, it opens the door higher.
This is the highs from 2021.
The lows from 2022.
The lows from 2023.
The highs from 2024.
The highs from this year.
Clearly a pretty big level. I think there is a good chance it eventually breaks through, but it might not happen right away.
Cattle
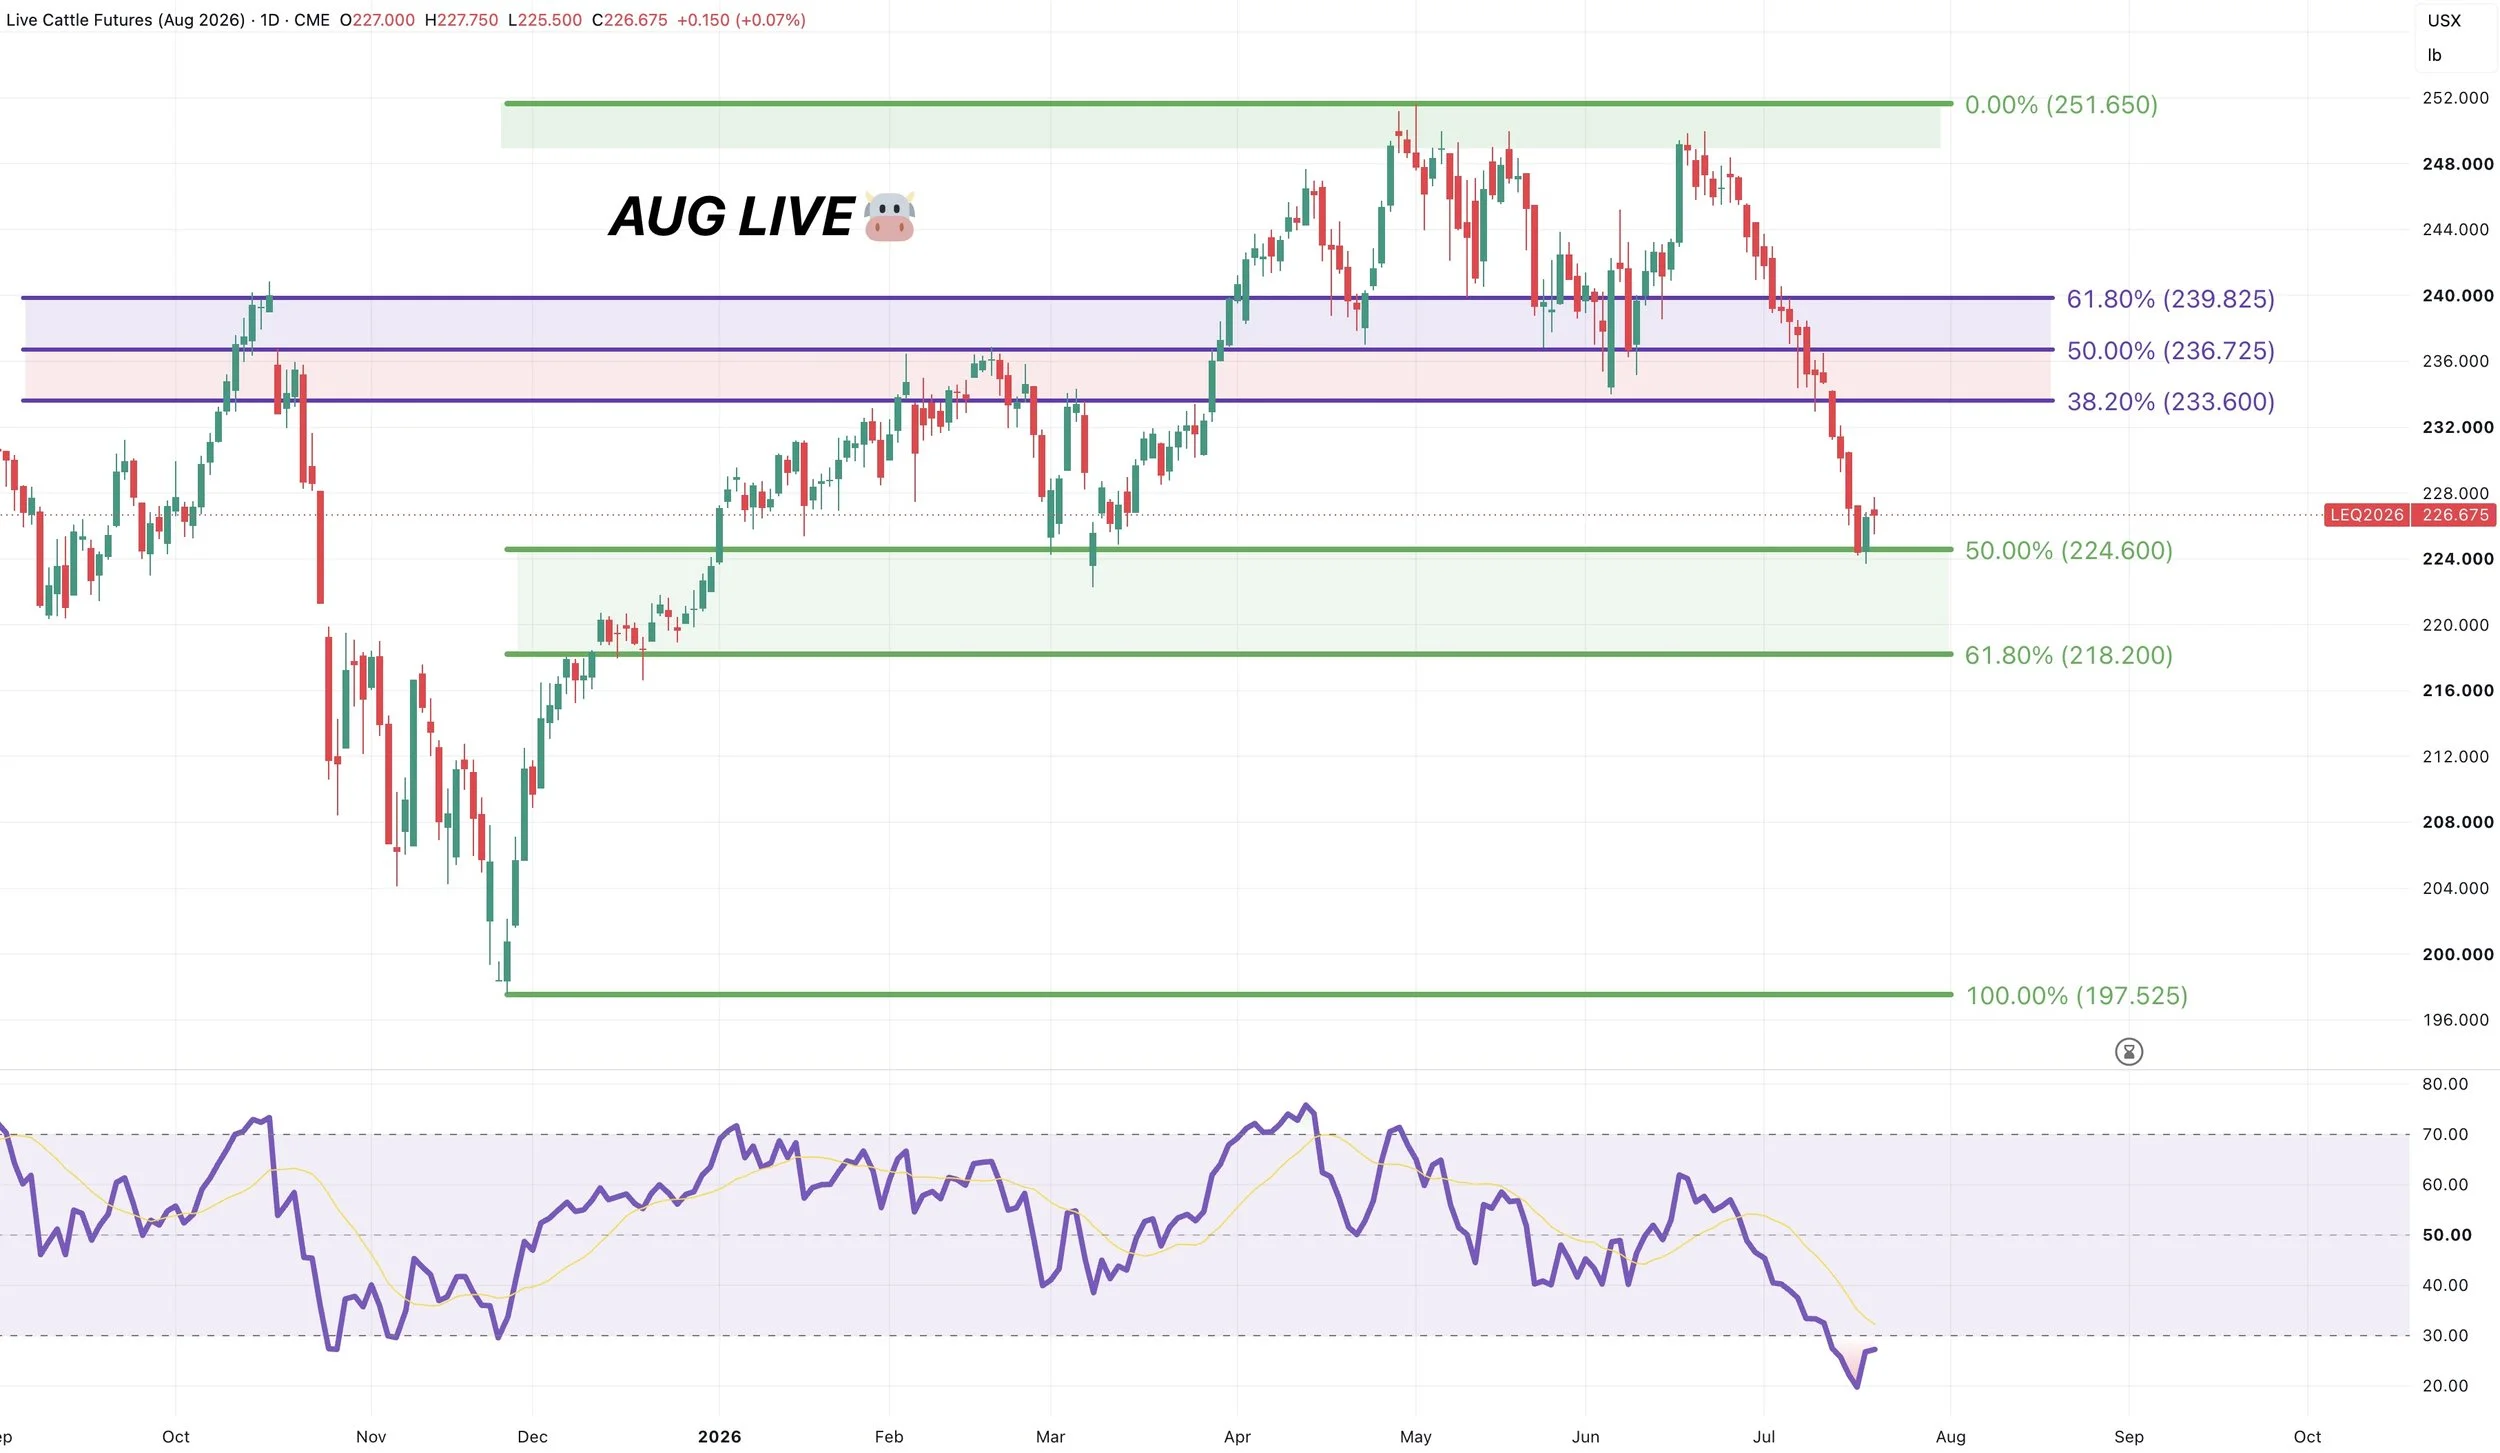
Aug Live Chart:
Still very oversold. So could potentially get a dead cat bounce.
If we are able to claw back half of the sell off I'd be looking to protect it.
Bulls need to the 61.8% retracement down to the lows from last year. Losing that level would not be good. So far we are bouncing at the 50% level and March lows.
August Feeders Chart:
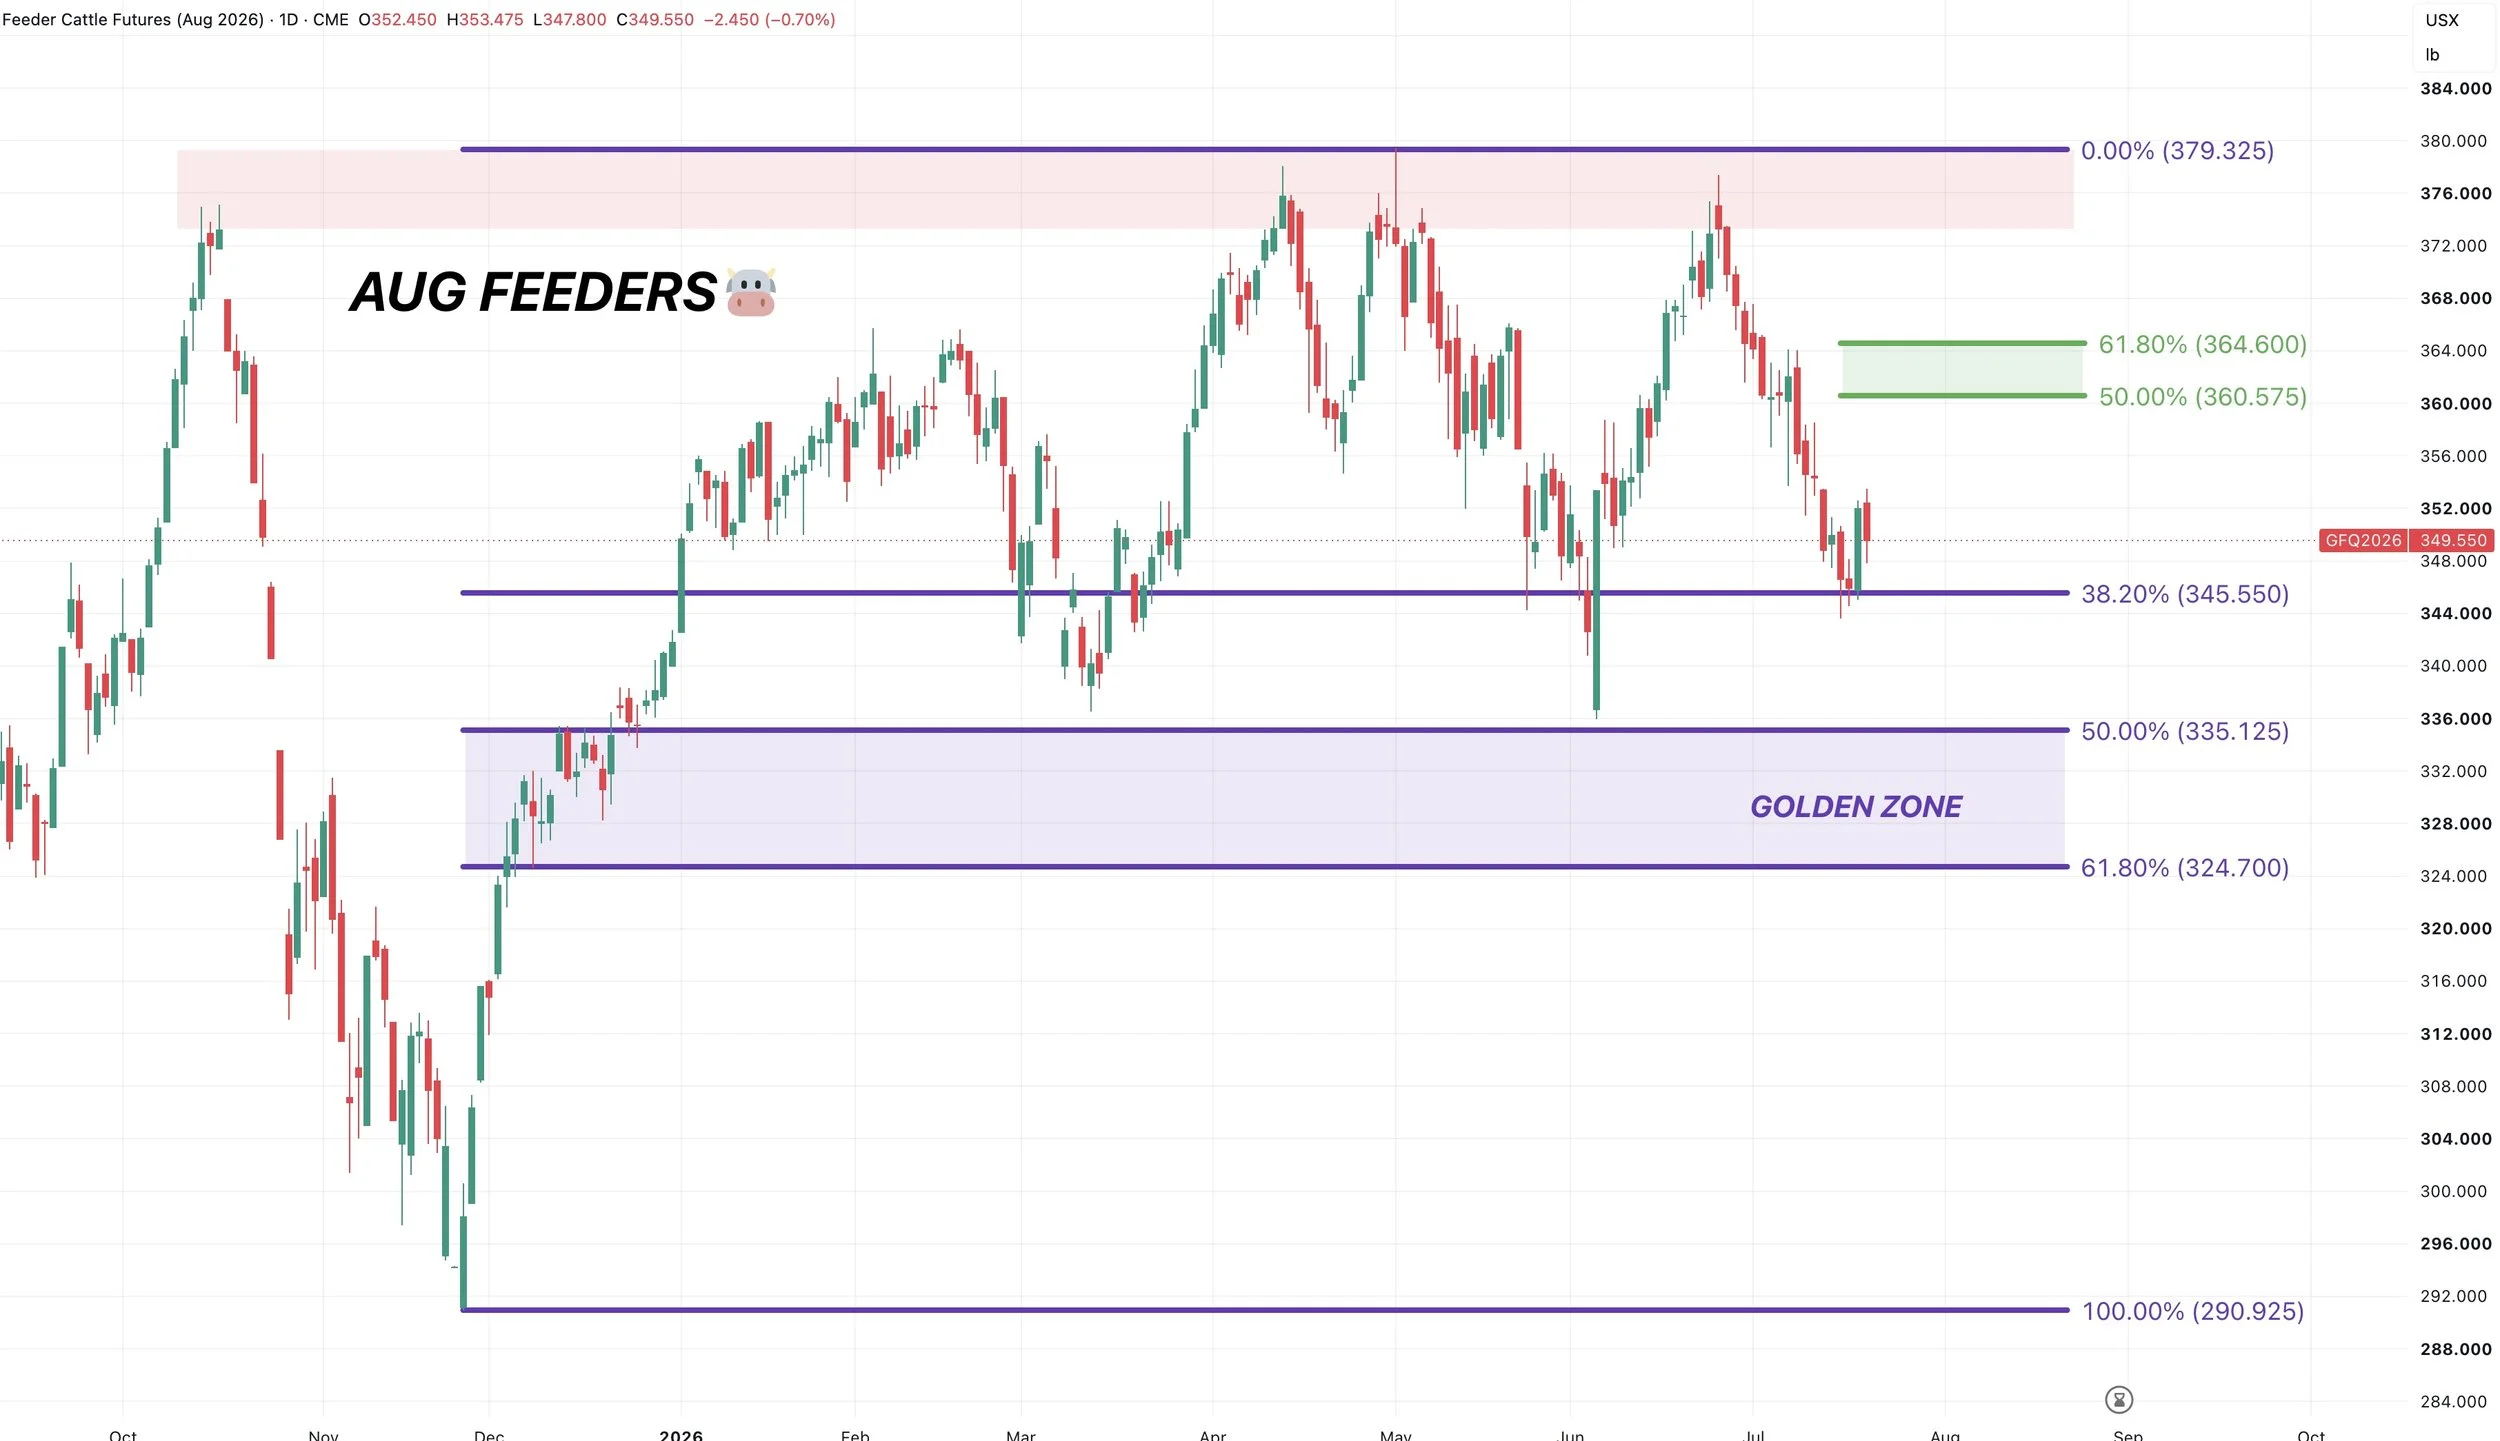
I would want to protect a move towards the golden zone if we get a bounce up there.
To the downside, if we fail to hold the 38.2% level and recent lows we could drop towards the 50% to 61.8% levels.
Want to Talk?
Our phones are open 24/7 for you guys if you ever need anything or want to discuss your operation.
Jeremey & Office: (806)484-1214
Sebastian: (605)280-1186
Email: sfrost@dailymarketminute.com
Hedge Account
Interested in a hedge account? Use the link below to set up an account or give us a call.