
MARKET UPDATE
You can scroll to read the usual update as well. As the written version is the exact same as the video.
Timestamps for video:
Overview: 0:00min
Corn: 2:25min
Corn Charts: 7:45min
Beans: 10:00min
Bean Charts: 14:50min
Wheat: 16:20min
Cattle: 19:20min
Want to talk?
Office: (806)484-1214
Miss Our Harvest Sale?
Don’t miss our next sell alert or future updates. Here is extended access to our offer from last week
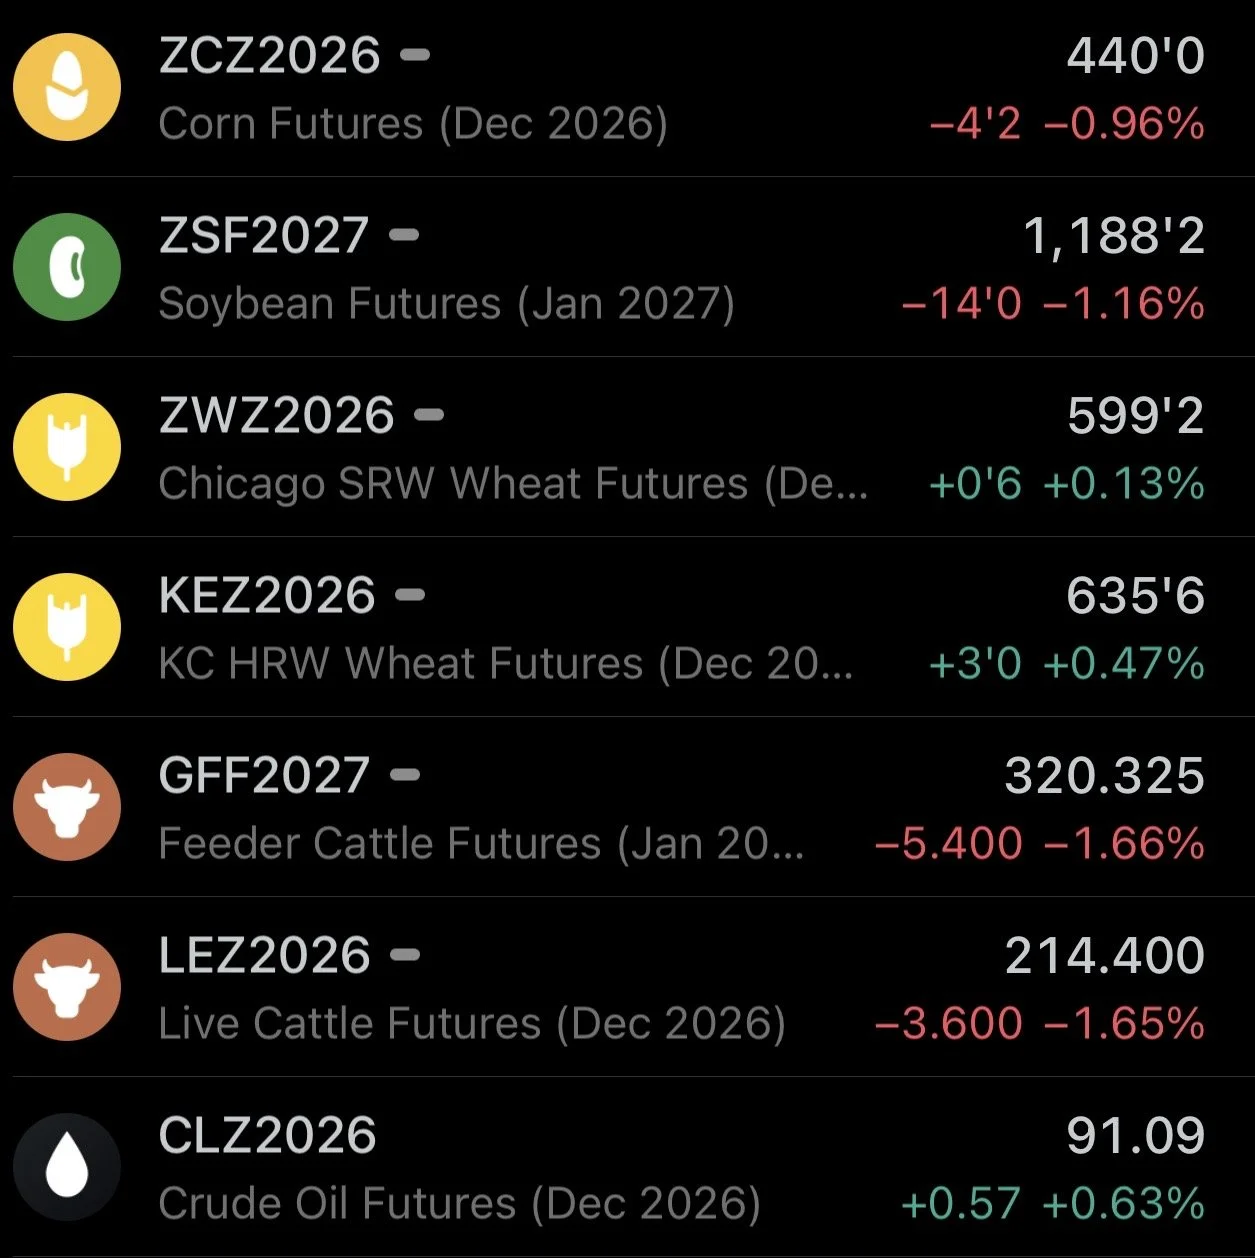
Futures Prices Close
Overview
Corn and soybeans both lower with wheat leading the way slightly higher.
Soybeans have been lower for 9 days in a row. Corn still hasn’t had two green days in a row in over 50 days.
The sell off in both corn and wheat has been historic.
As both are facing one of if not their longest weekly losing streak in history.
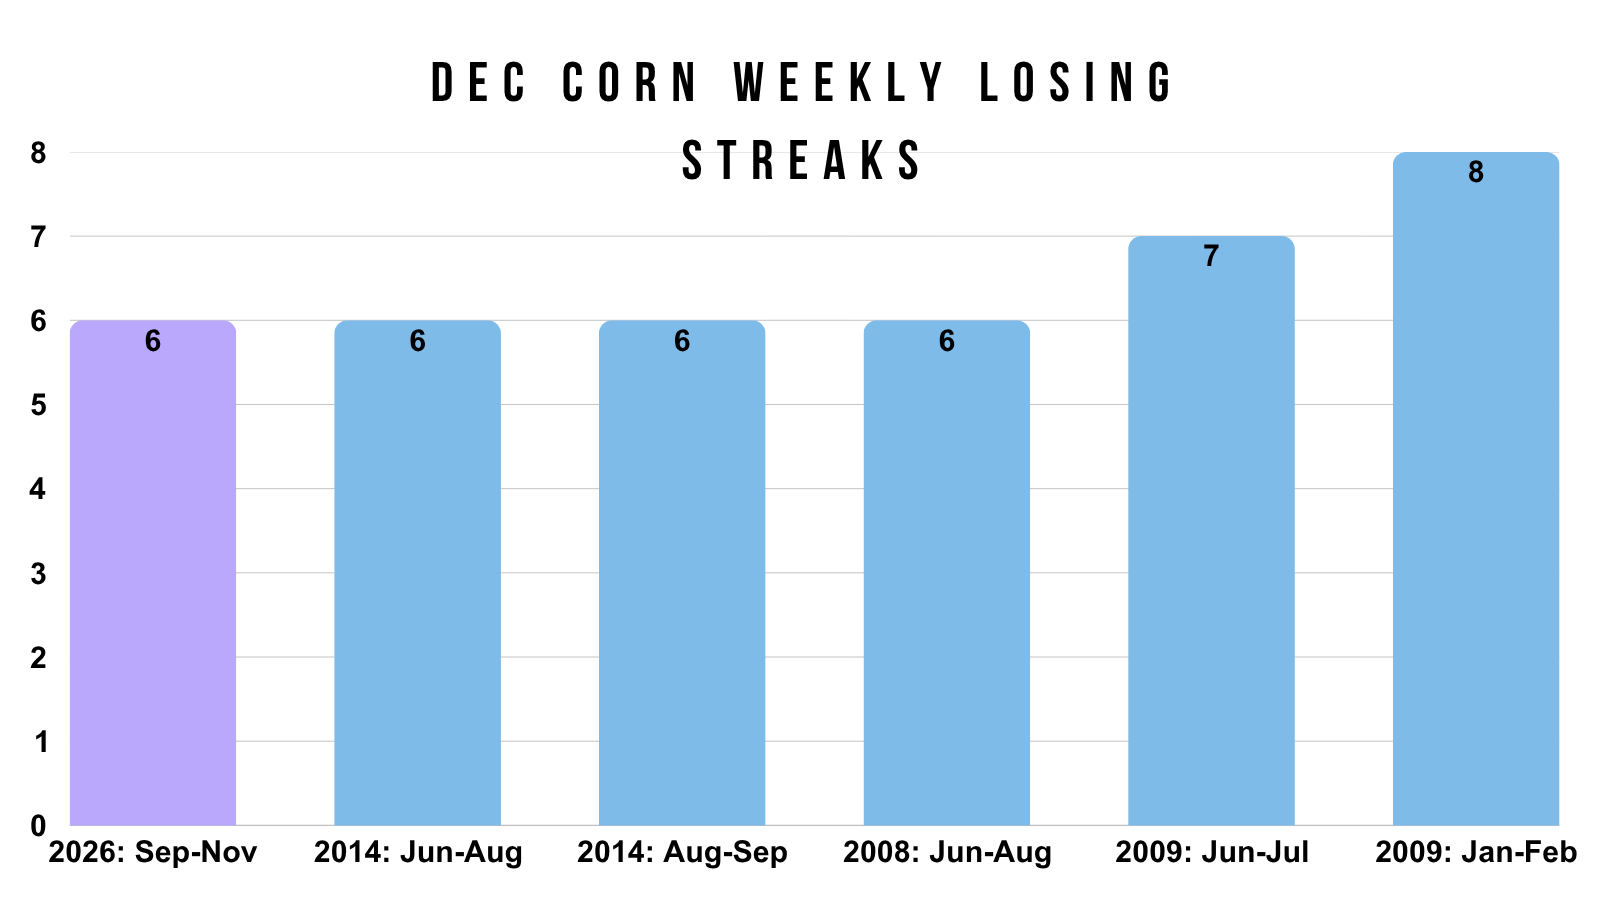
Corn has been lower for 6 weeks straight. The longest streak in over a decade.
This is just the 6th time in the last 20 years where we've seen this long of weekly losing streak.
2009 is the only year we've seen a longer streak. Where it did it twice.
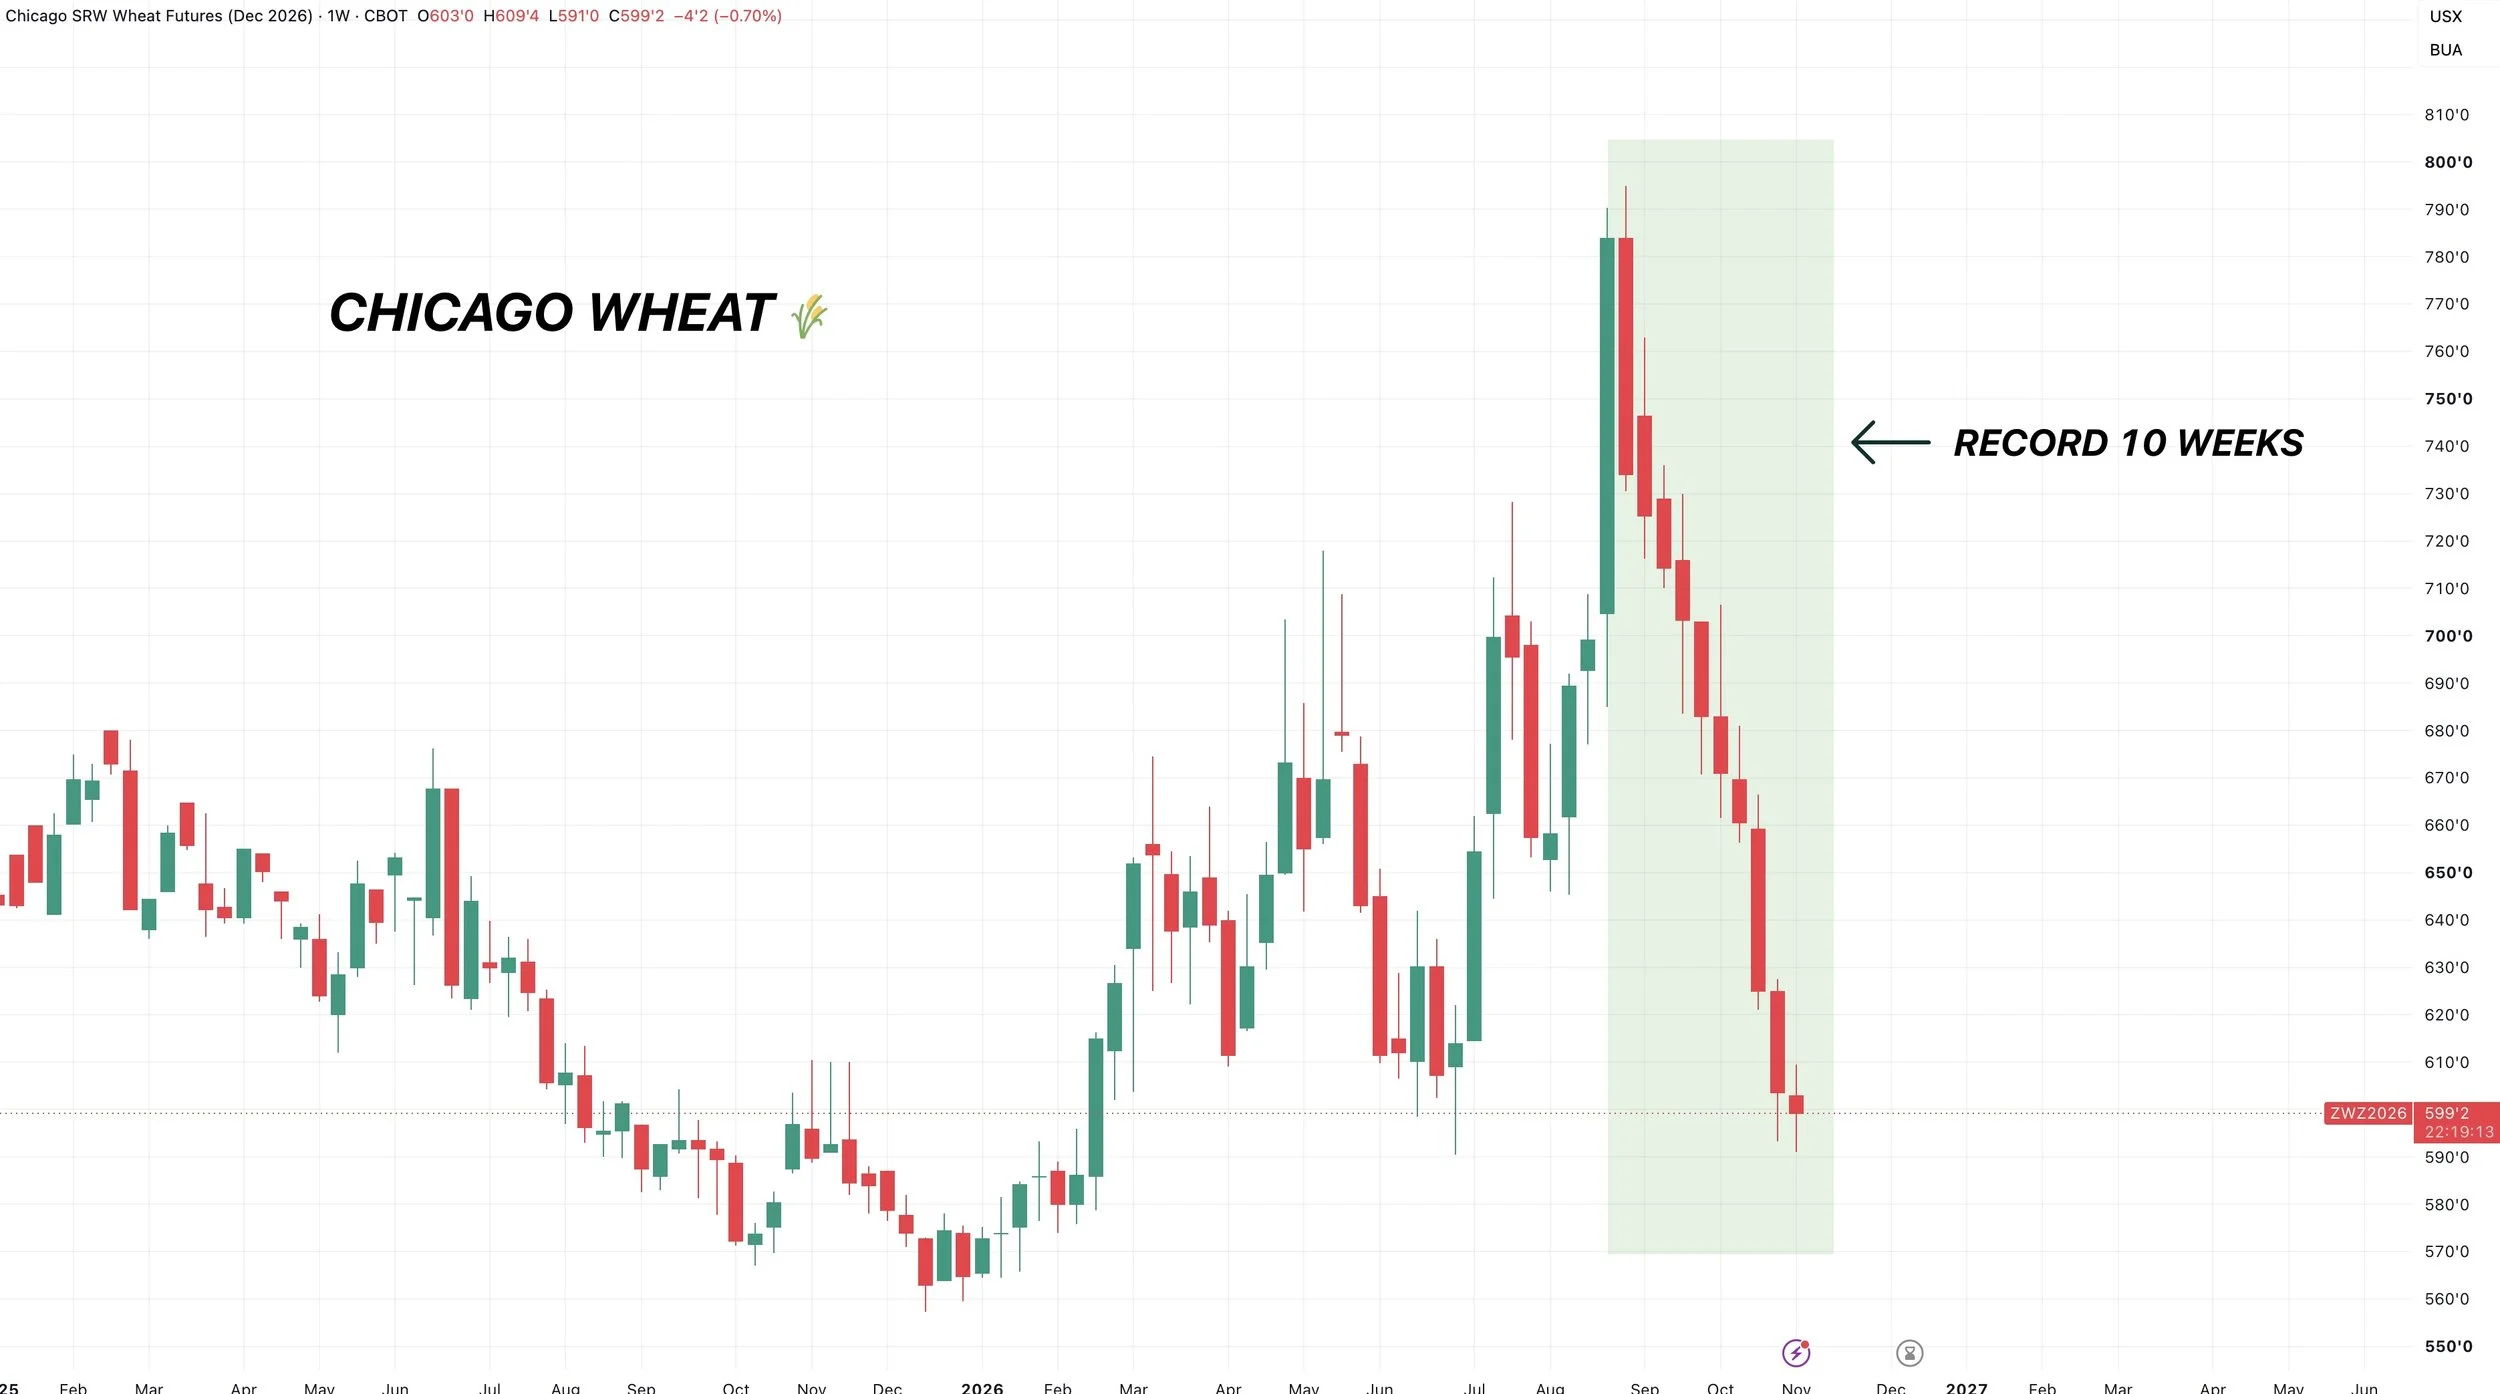
Wheat has been lower for 10 weeks straight now.
That would be an all-time record streak.
Cattle continues to bleed as they were hit hard again for the 8th day in a row. Live cattle has now given back the entire rally, sitting near the yearly lows.
The fear over in the equities certainly didn’t help. I have to throw the stock market in today's update.
The stock market did not like the election results.
Why?
It's largely the growing concern that the democratic party has been calling for restrictions and even talked about bans on AI. So basically the market is worried that the election results are going to slow down the AI boom.

Personally, I do not believe AI is going anywhere. We are still in one of the largest tech revolutions in history. But there is fear in the streets.
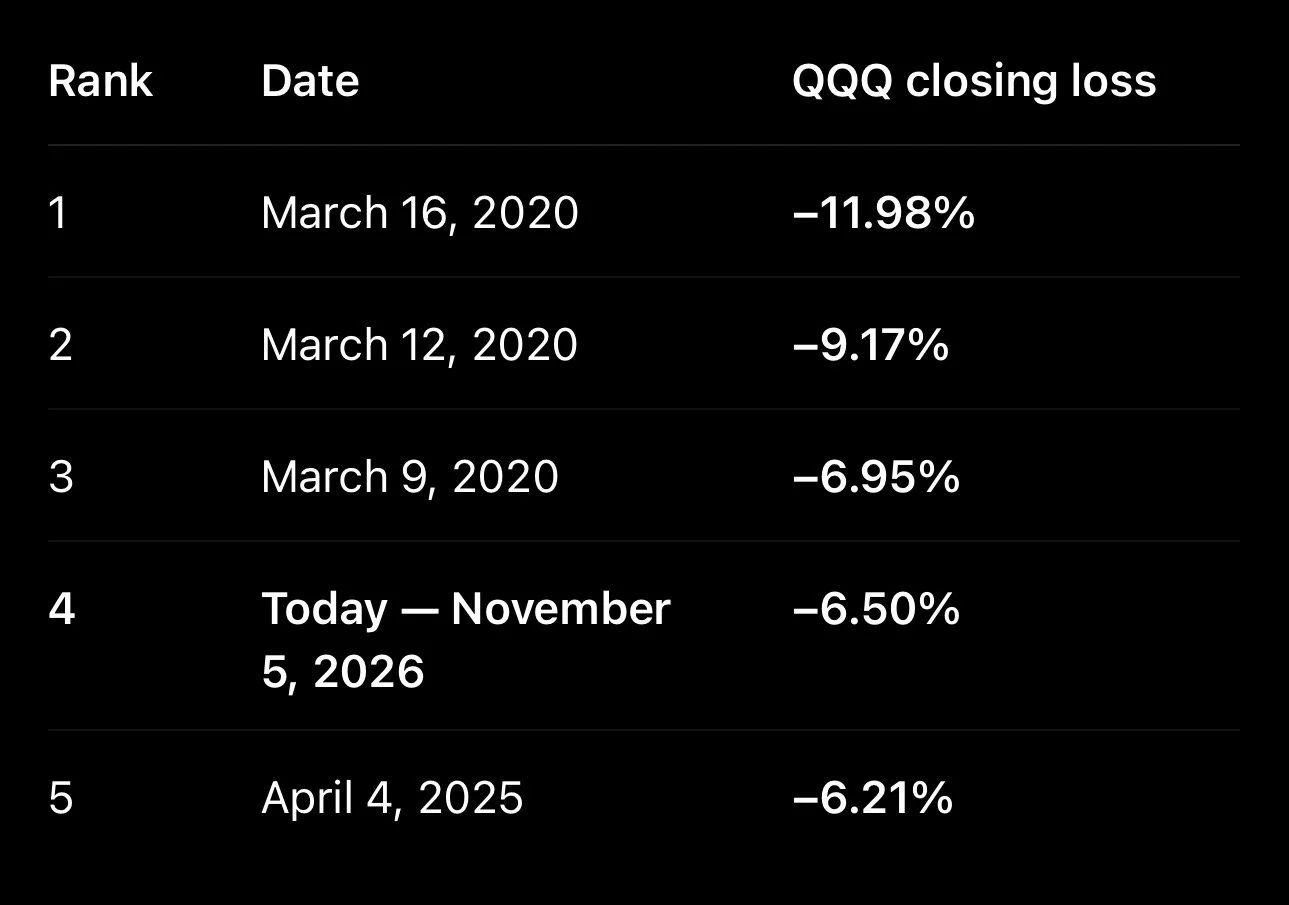
QQQ (aka tech stocks) just saw it's 4th largest daily loss in the last decade.
Only behind COVID.
China Wants Tariff Cuts
We did see some China headlines out today.
They essentially came out and said that for them to buy those non-soybean ag purchases, they want to see tariffs dropped.
USDA Next Week
All eyes are going to be on this USDA report.
The market has continued to price in the idea of bigger crops.
We got the analyst estimates for the report.
Corn they have 180.3 (vs last month's 181.2)
Beans they have 53.5 (vs last month's 53.1)
So the trade is expecting corn yield to drop nearly a bushel with soybeans to see a bump in yield.
There is a pretty massive estimate range for corn. With the high being 173 and the low being 183. However the other 17 of 19 analysts have their number between 179 to 181.

Today's Main Takeaways
Corn
Fundamentals
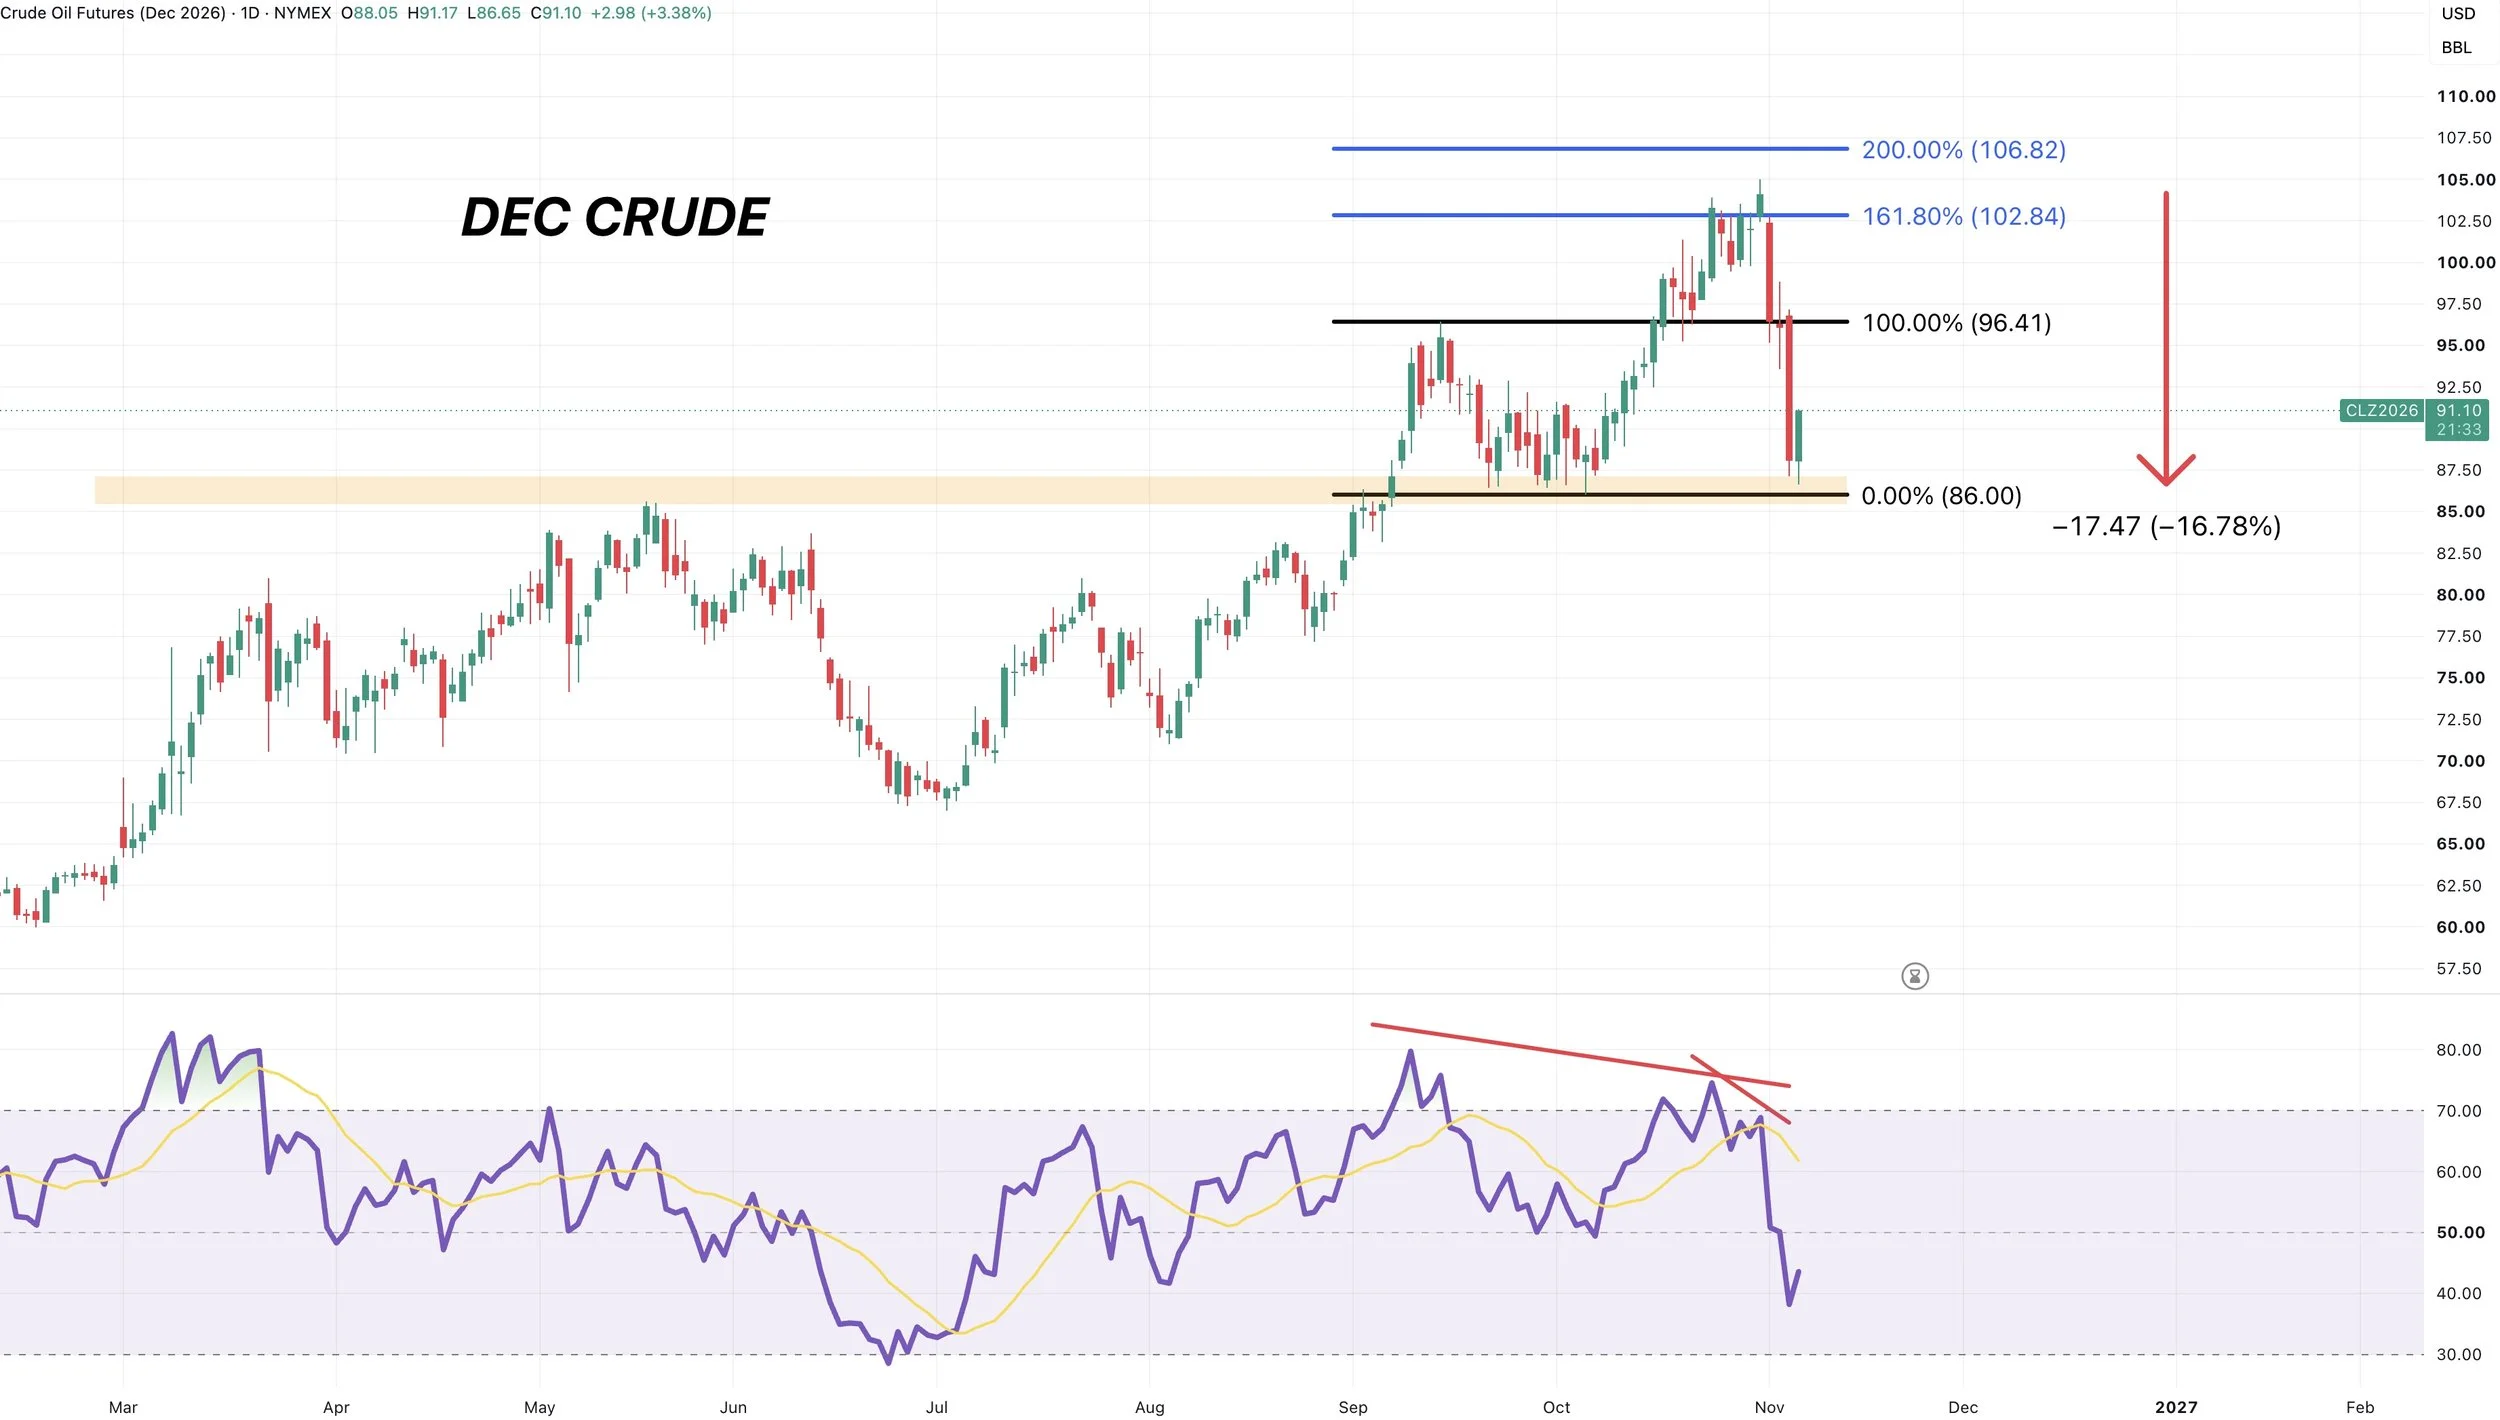
Crude Smoked:
Crude has been getting utterly smoked lately.
It was down -16% at one point this week.
We had been talking about that building bearish divergence last week right at that golden fib extension.
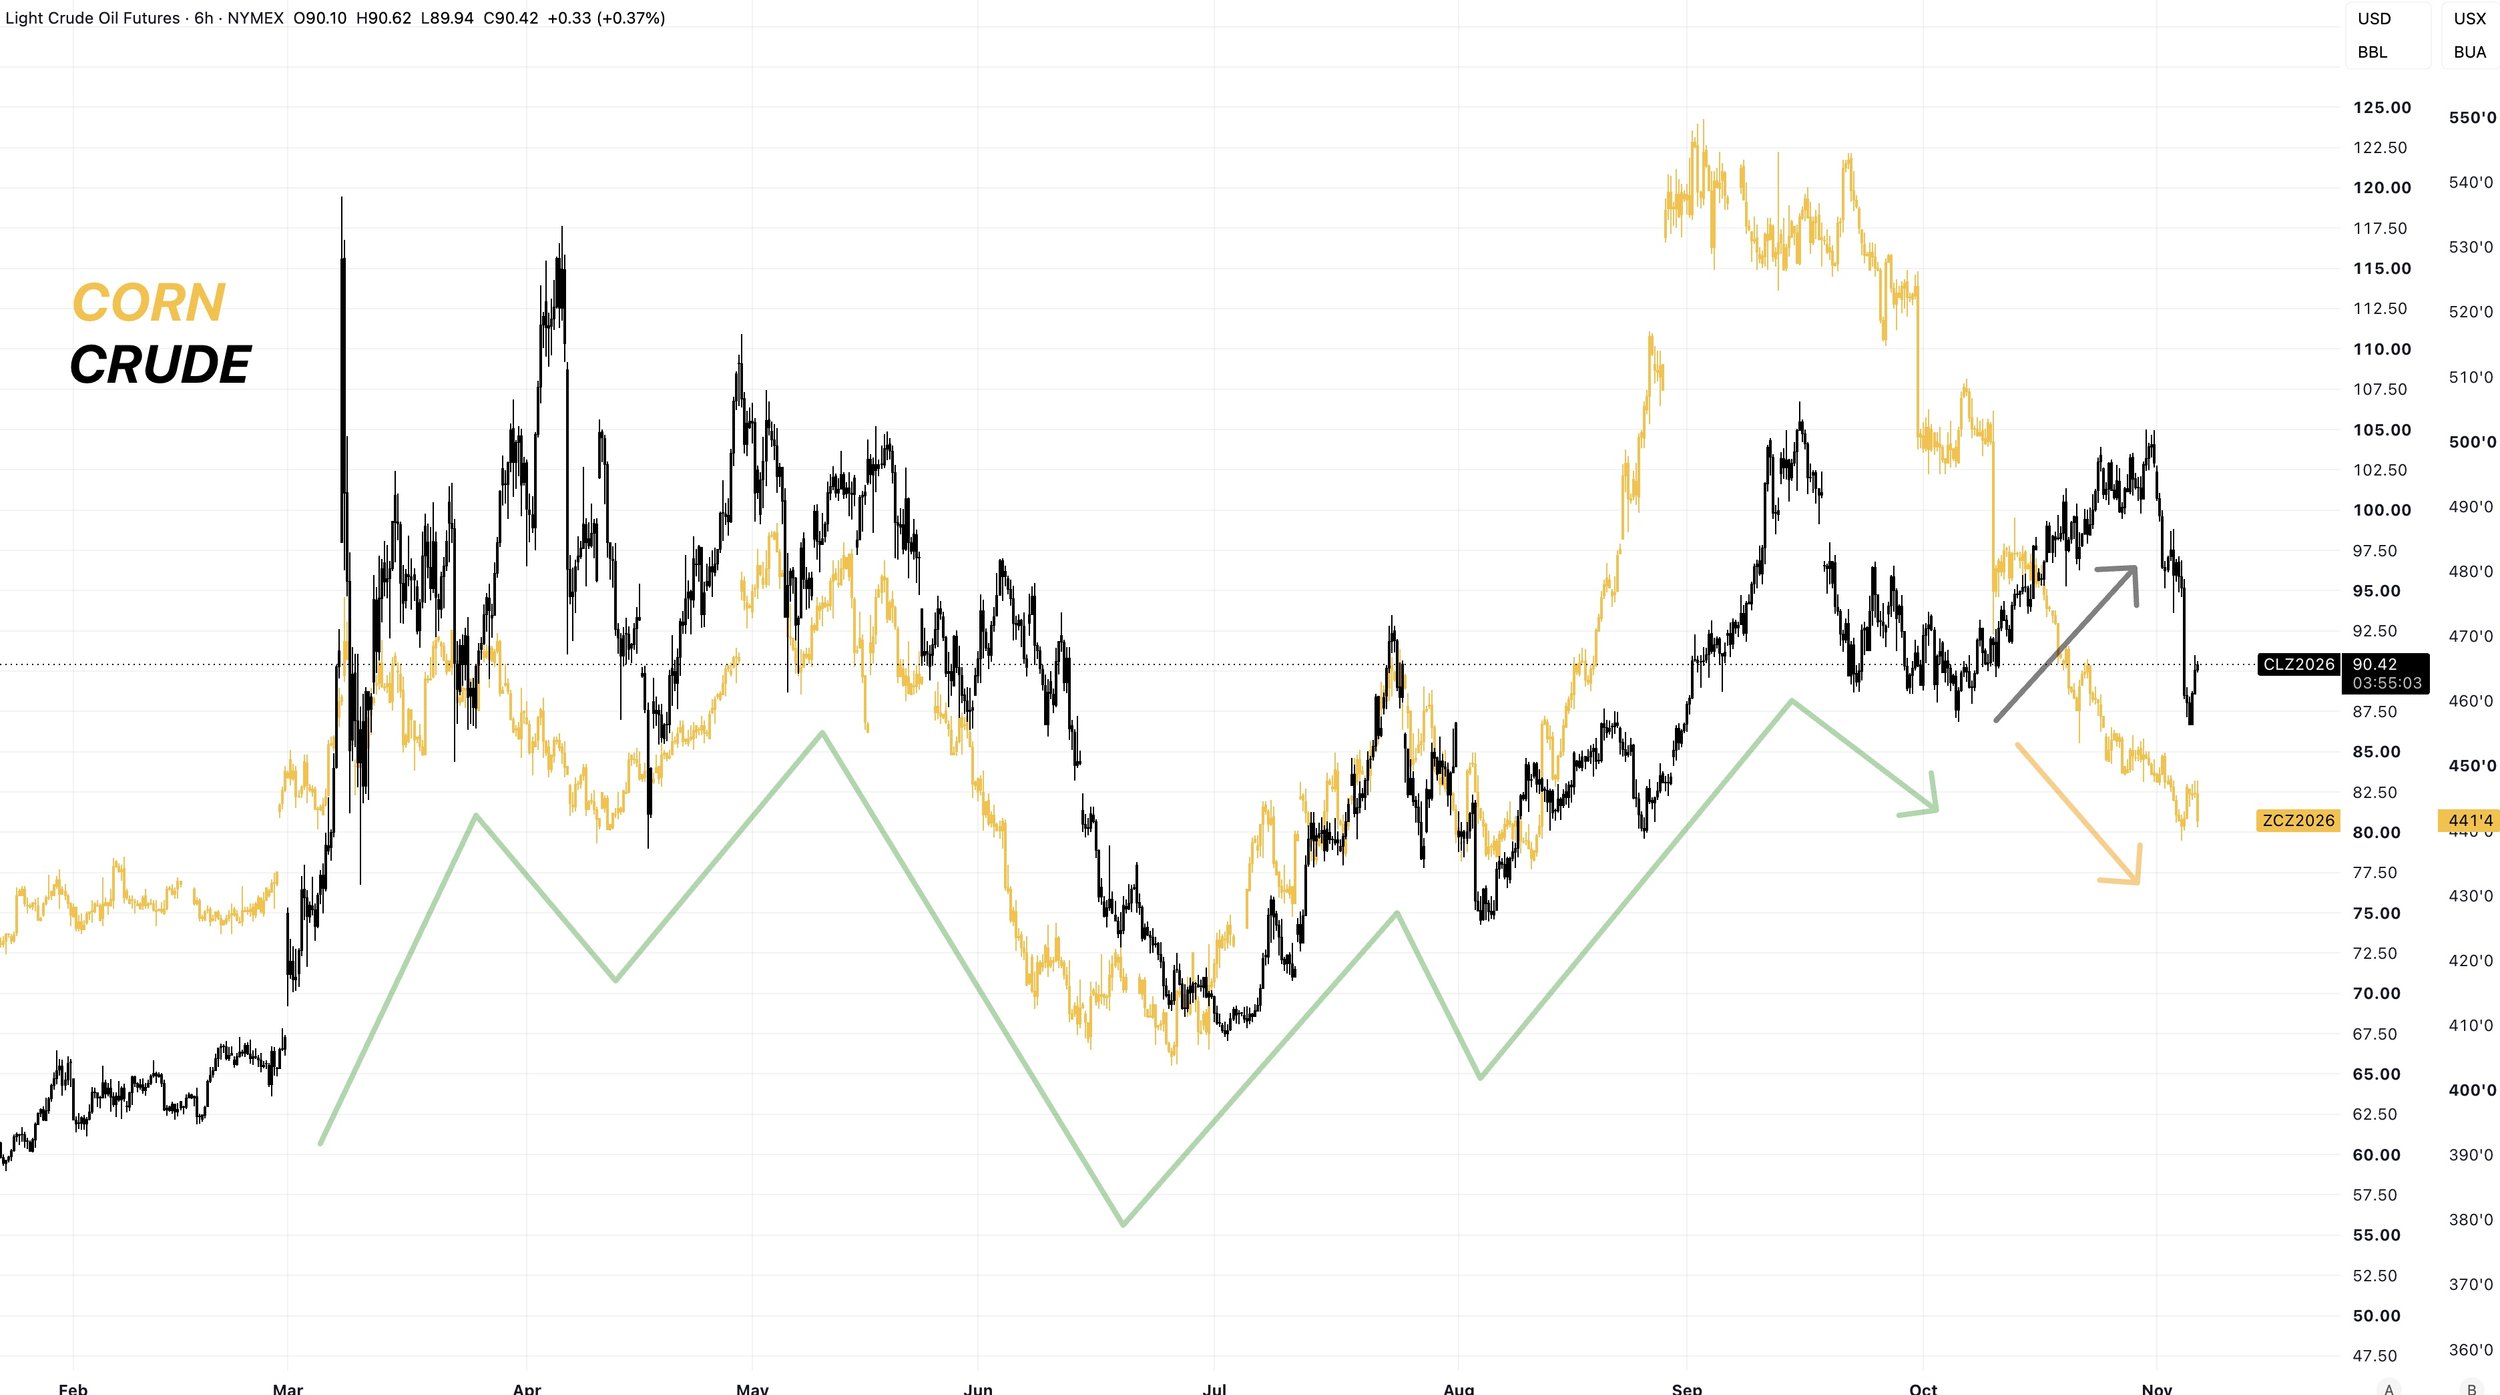
But it's actually impressive and encouraging how well corn has held up during this big sell off in crude.
They had been tracking each other's moves all year long, up until recently where they started to have the biggest divergence between the two we've seen this year.
Crude has now followed corn lower and caught up.
Mexico Sees Value:
Some are concerned with export demand in corn.
Which is a valid concern, altough I do think it's far too early to be concerned. As I think corn exports will catch up once we start seasonally shipping less beans and more corn.
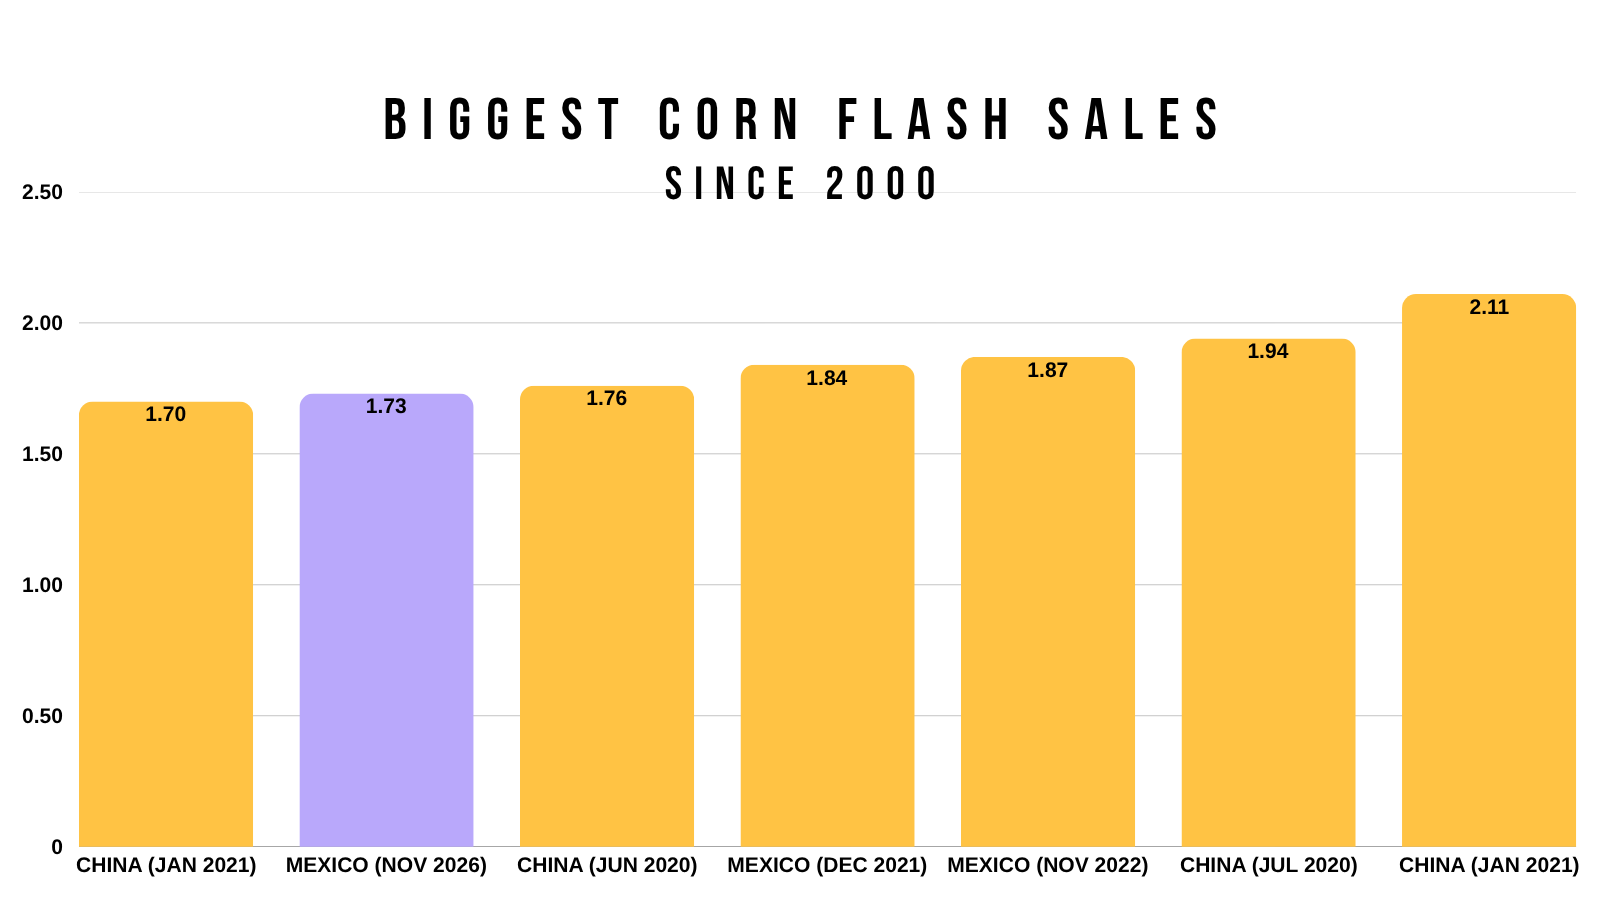
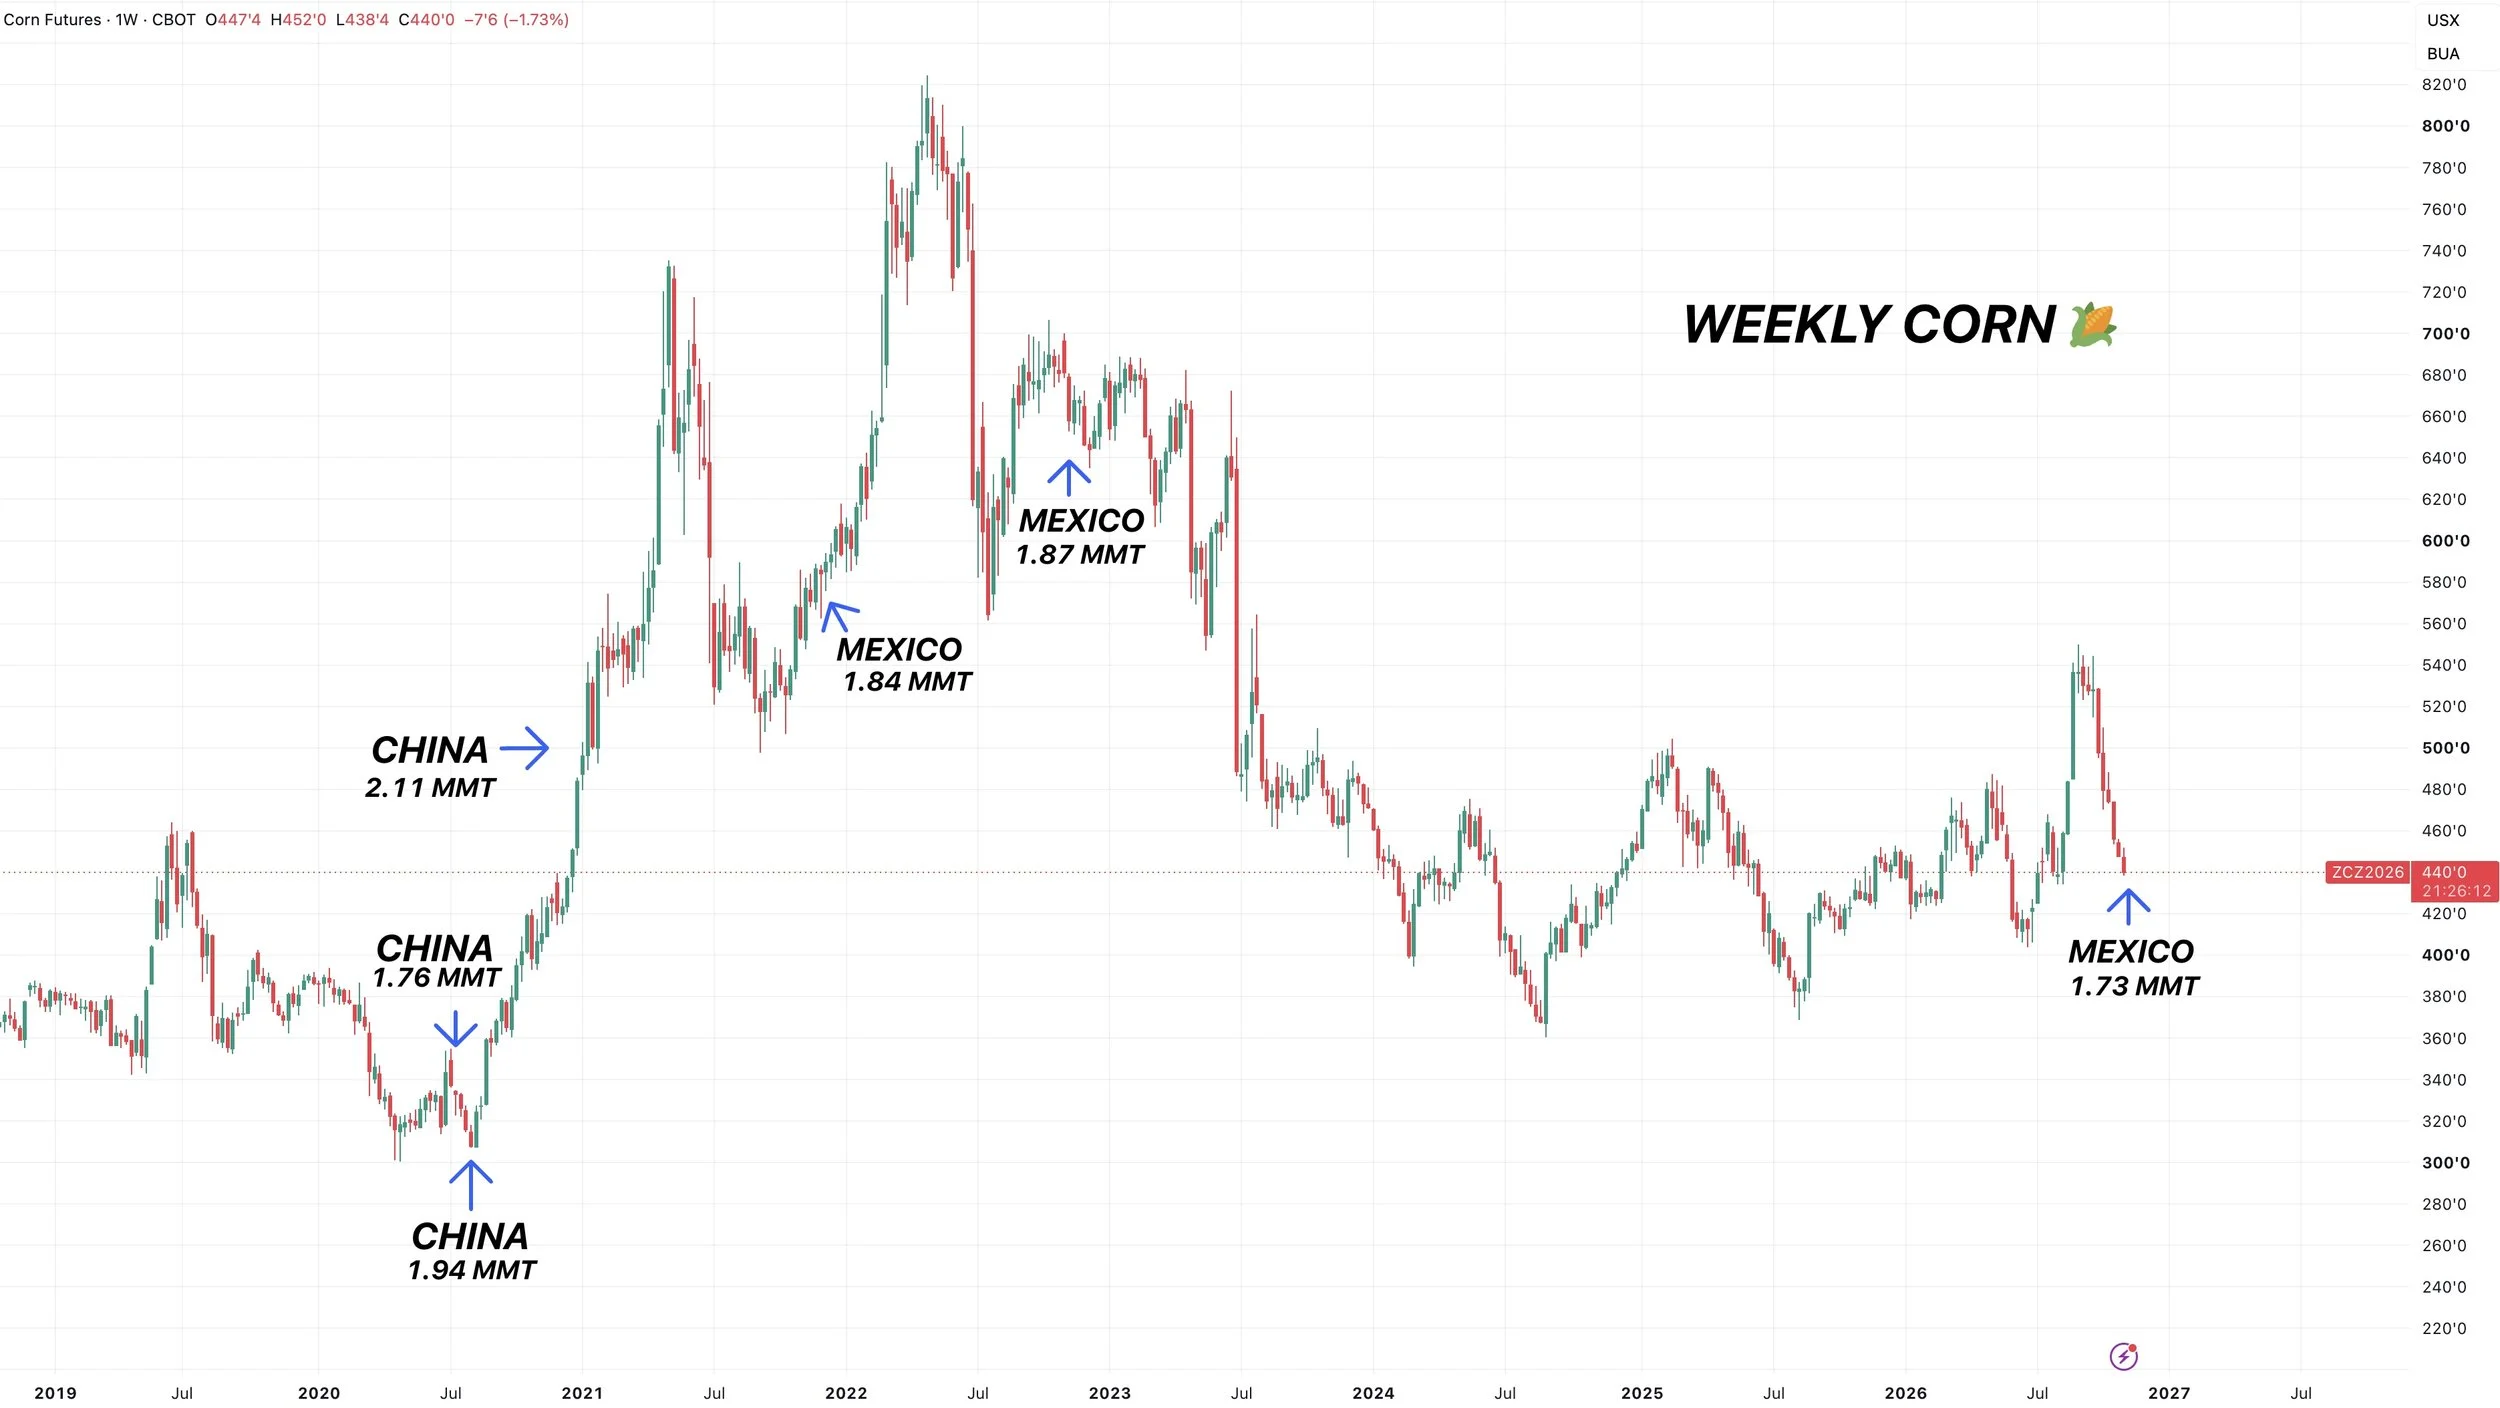
But we just saw Mexico step in and buy one of the top 10 largest flash sales in history.
So they clearly think corn is undervalued down here.
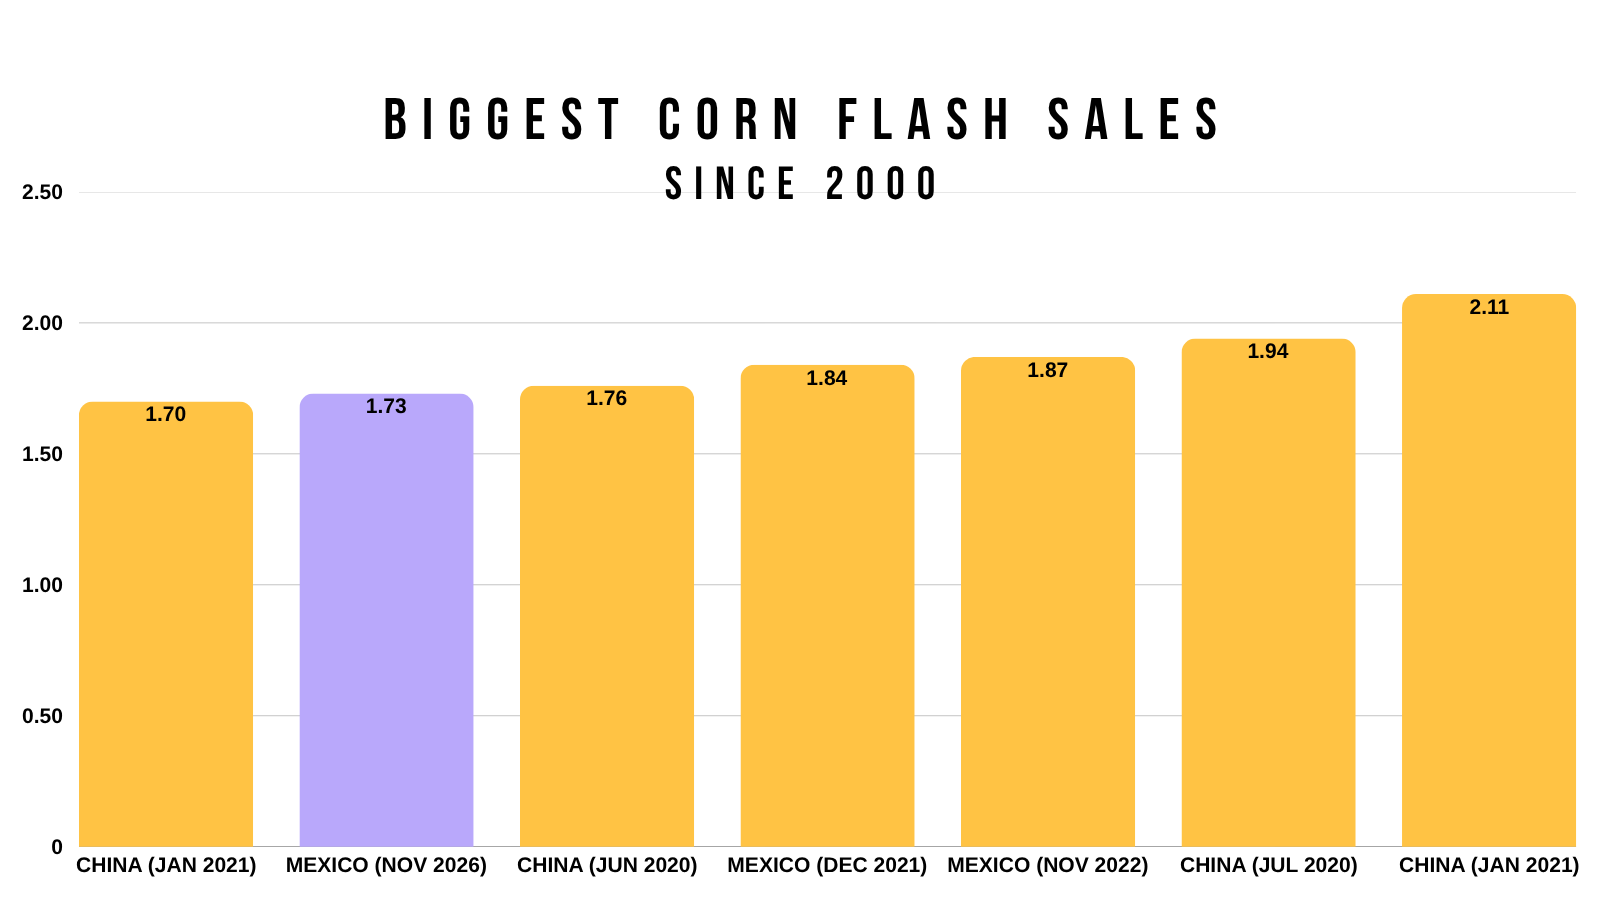
Here is a chart that show cases those buys that were above 1.70 MMT.
Not all the time, but in some cases, a rally did soon follow.
This is the largest buy since the bull market. Which was great to see.
Would obviously be nice if China stepped in here as well.
USDA Report:
The USDA is obviously going to be the big wild card in deciding where the market goes from here.
Will they trim yield? If yield is lower, are they going to do it next week or wait until January? What if StoneX is right and yield is 183?
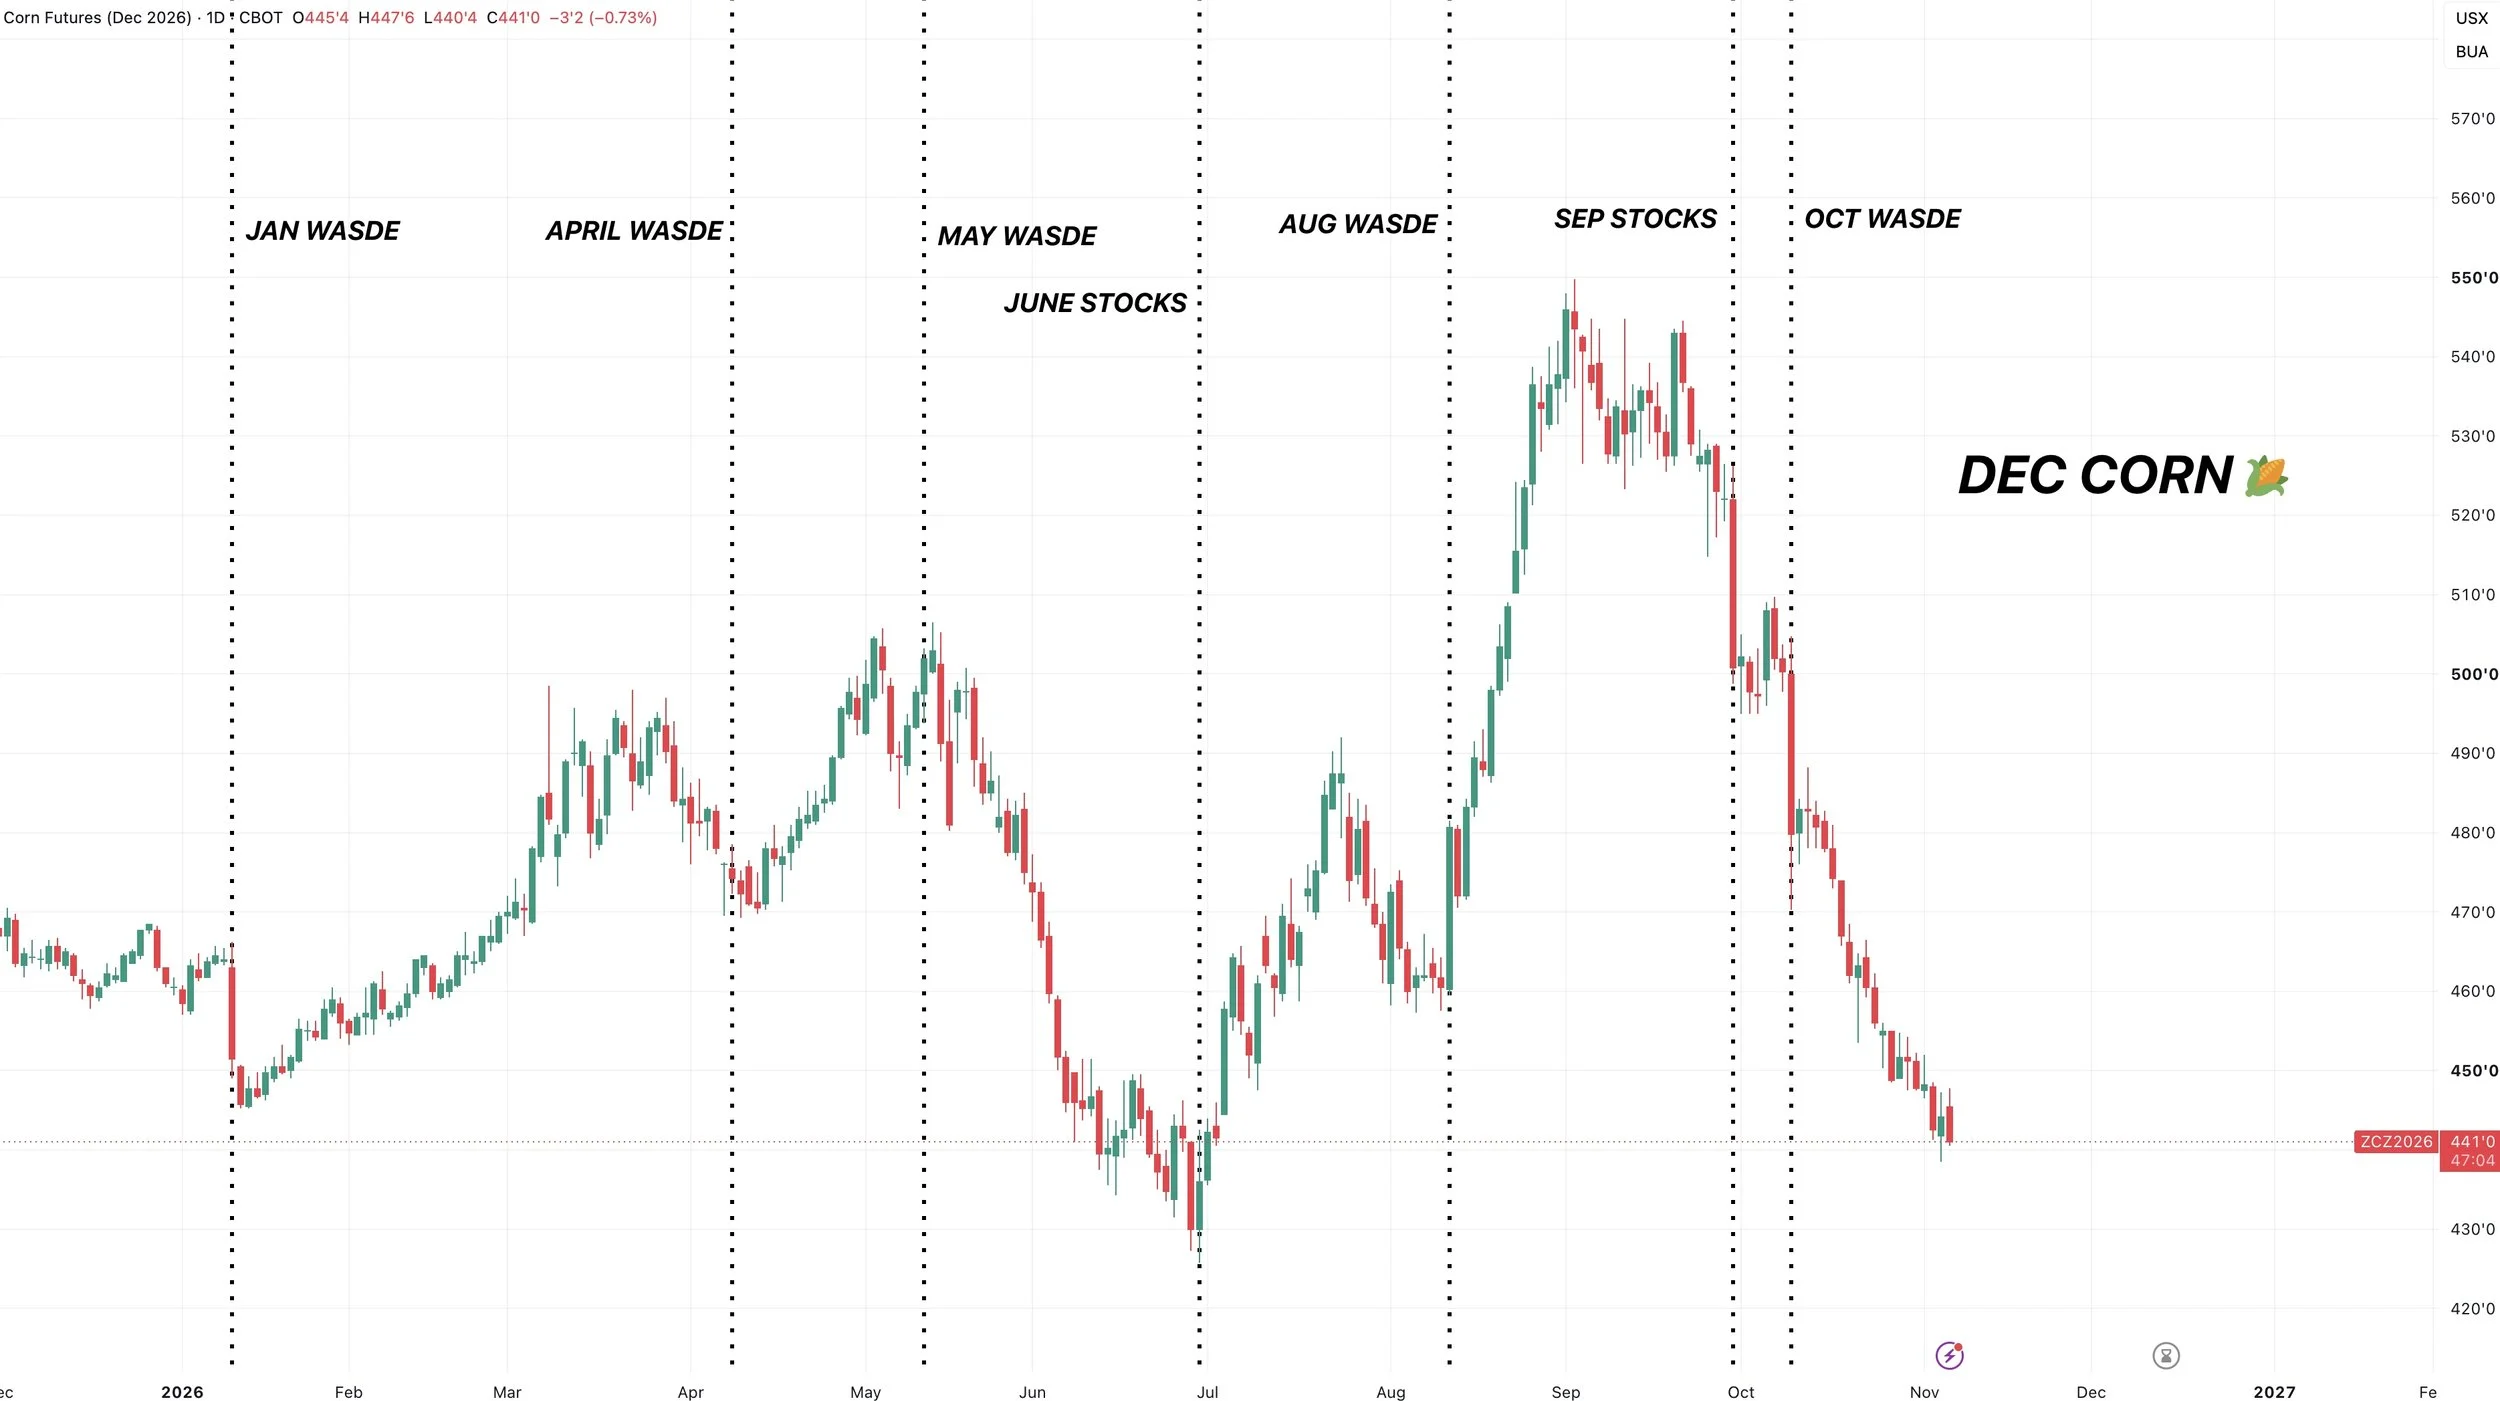
USDA reports have marked plenty of pivots in this market.
We bottomed after Jan WASDE. Bottomed after April WASDE. Topped after May WASDE. Bottomed on June stocks. Bottomed on Aug WASDE. Fell apart on Sep stocks and Oct WASDE.
Carryout vs Stocks to Use vs Price:
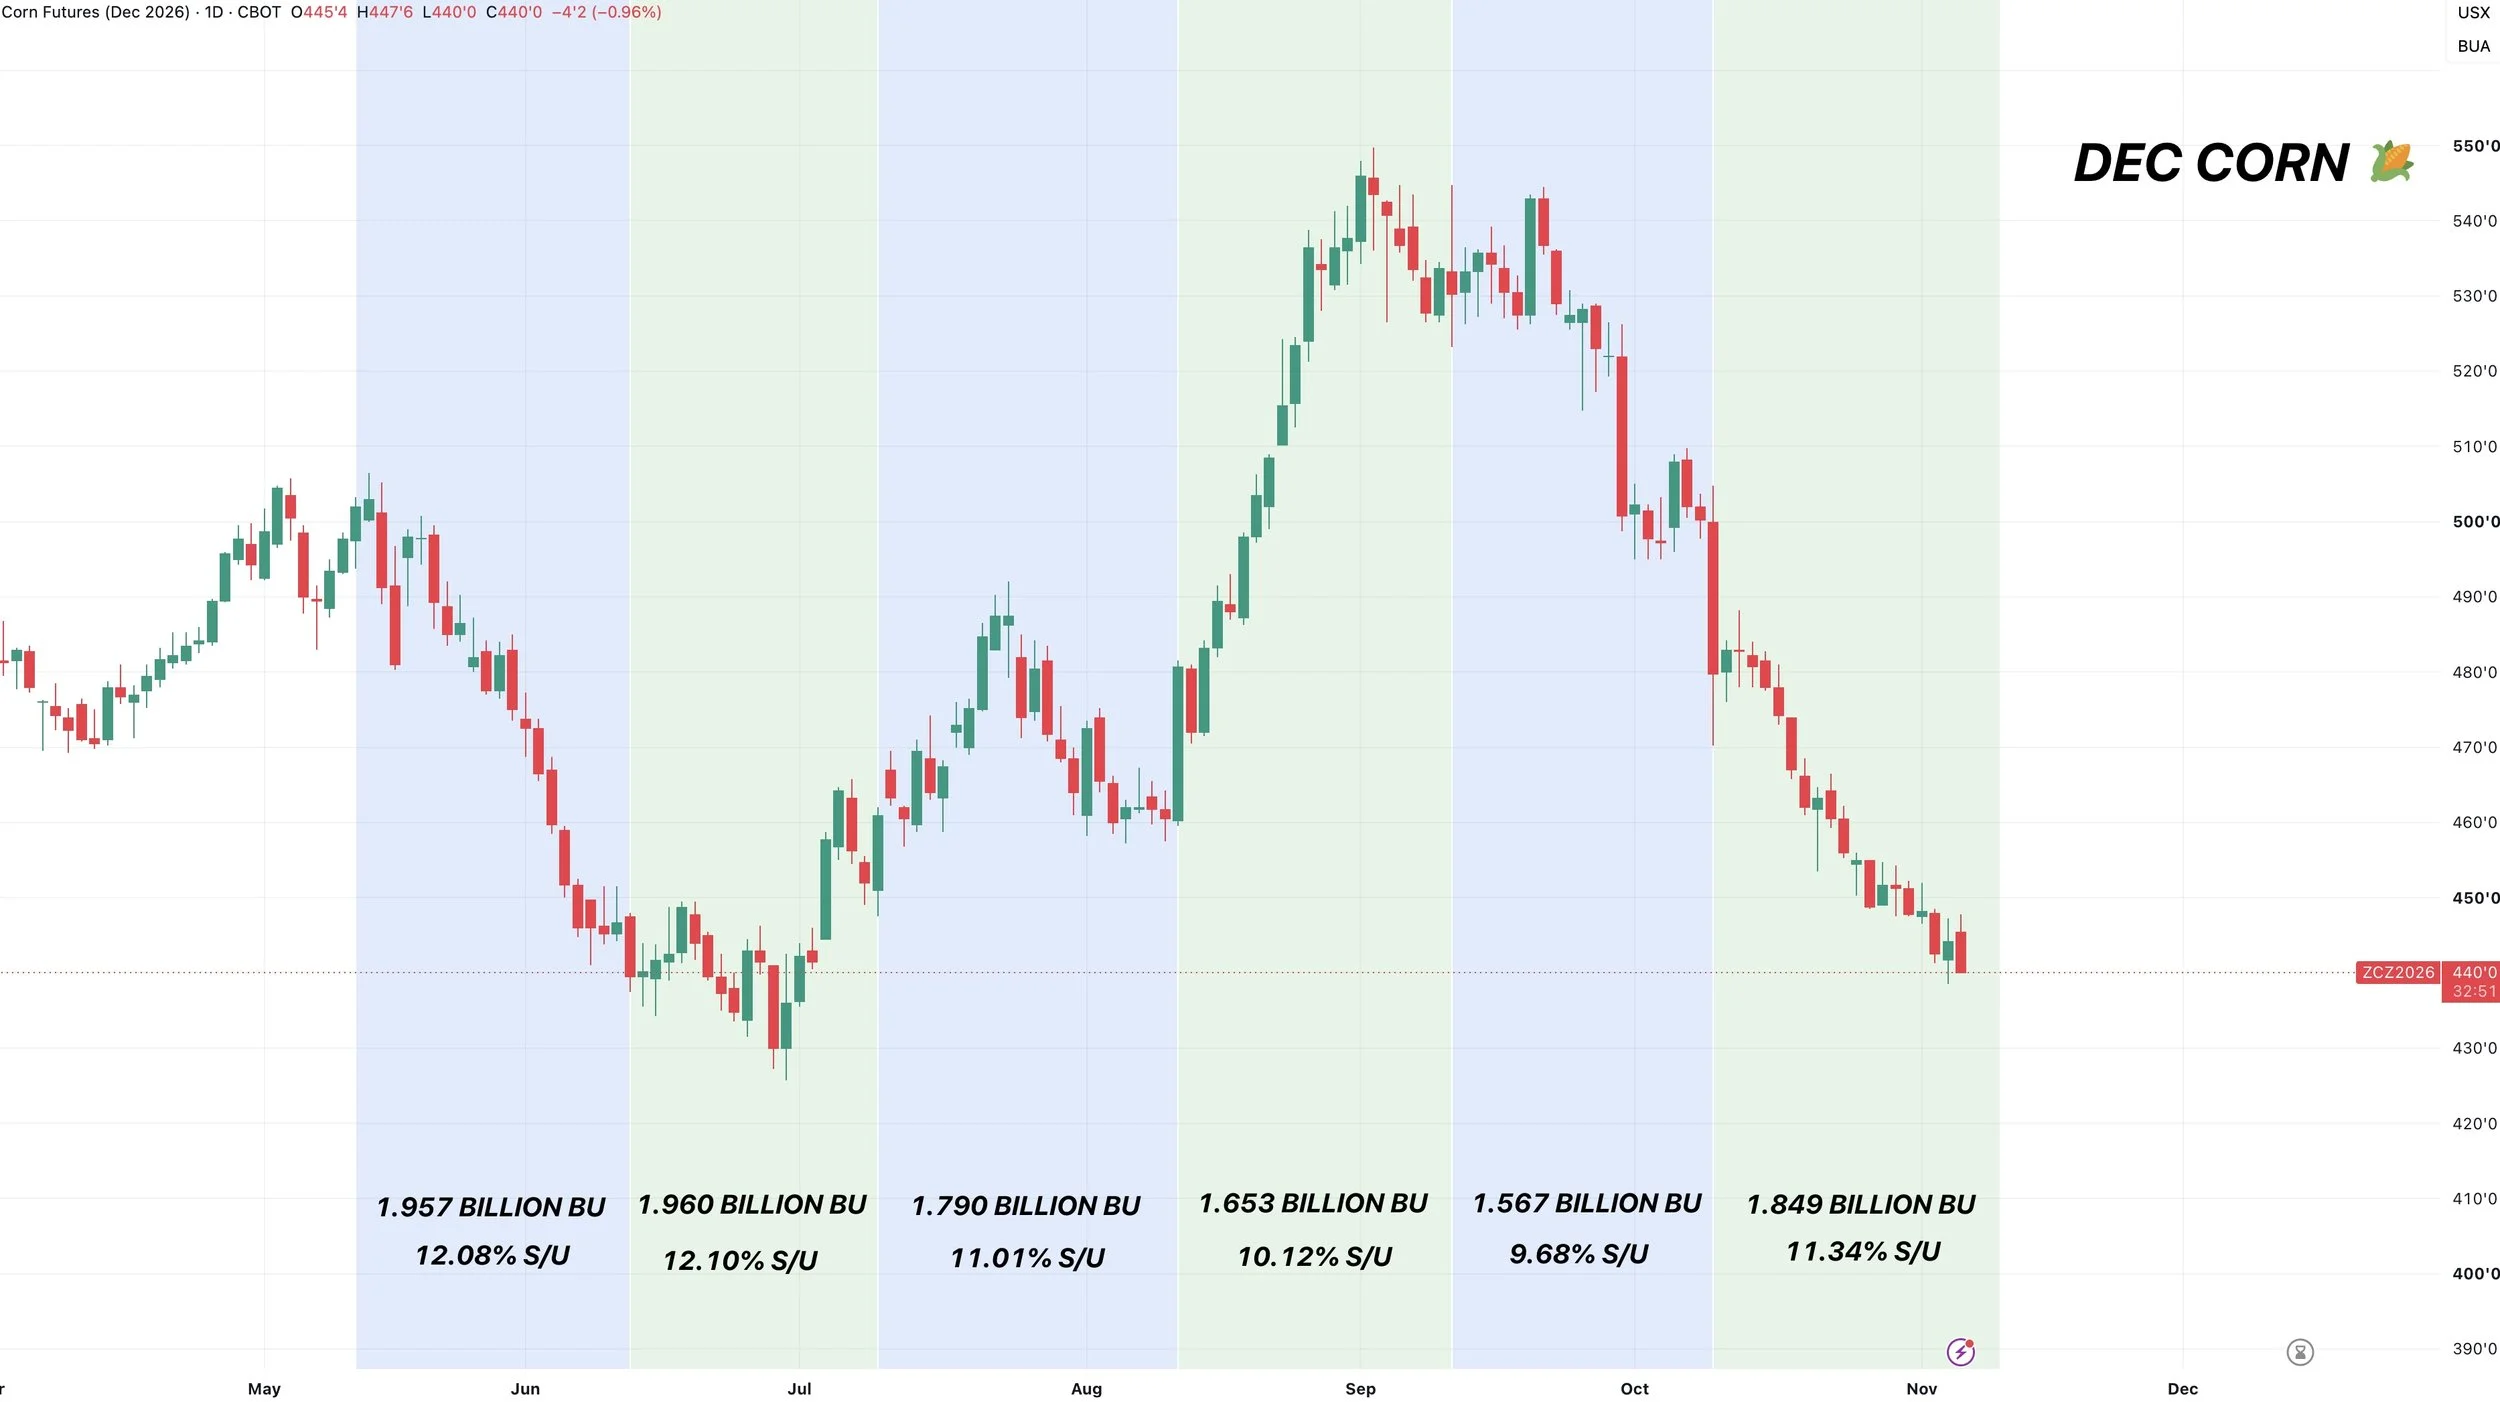
Here is a chart for Dec corn that overlays our carryout and S/U from every WASDE report this year.
The last time corn was down at these levels, we had a 2 billion bushel carryout and over a 12% stocks to use.
Currently, the situation is clearly far more bearish than it was back in August, but our situation is still tighter than it was when we were at those summer lows.
With a 1.85 billion bushel carryout and 11.3% stocks to use from the last USDA report.
If the USDA does not increase the balance sheet from here, I would argue we are undervalued.
Balance Sheet:
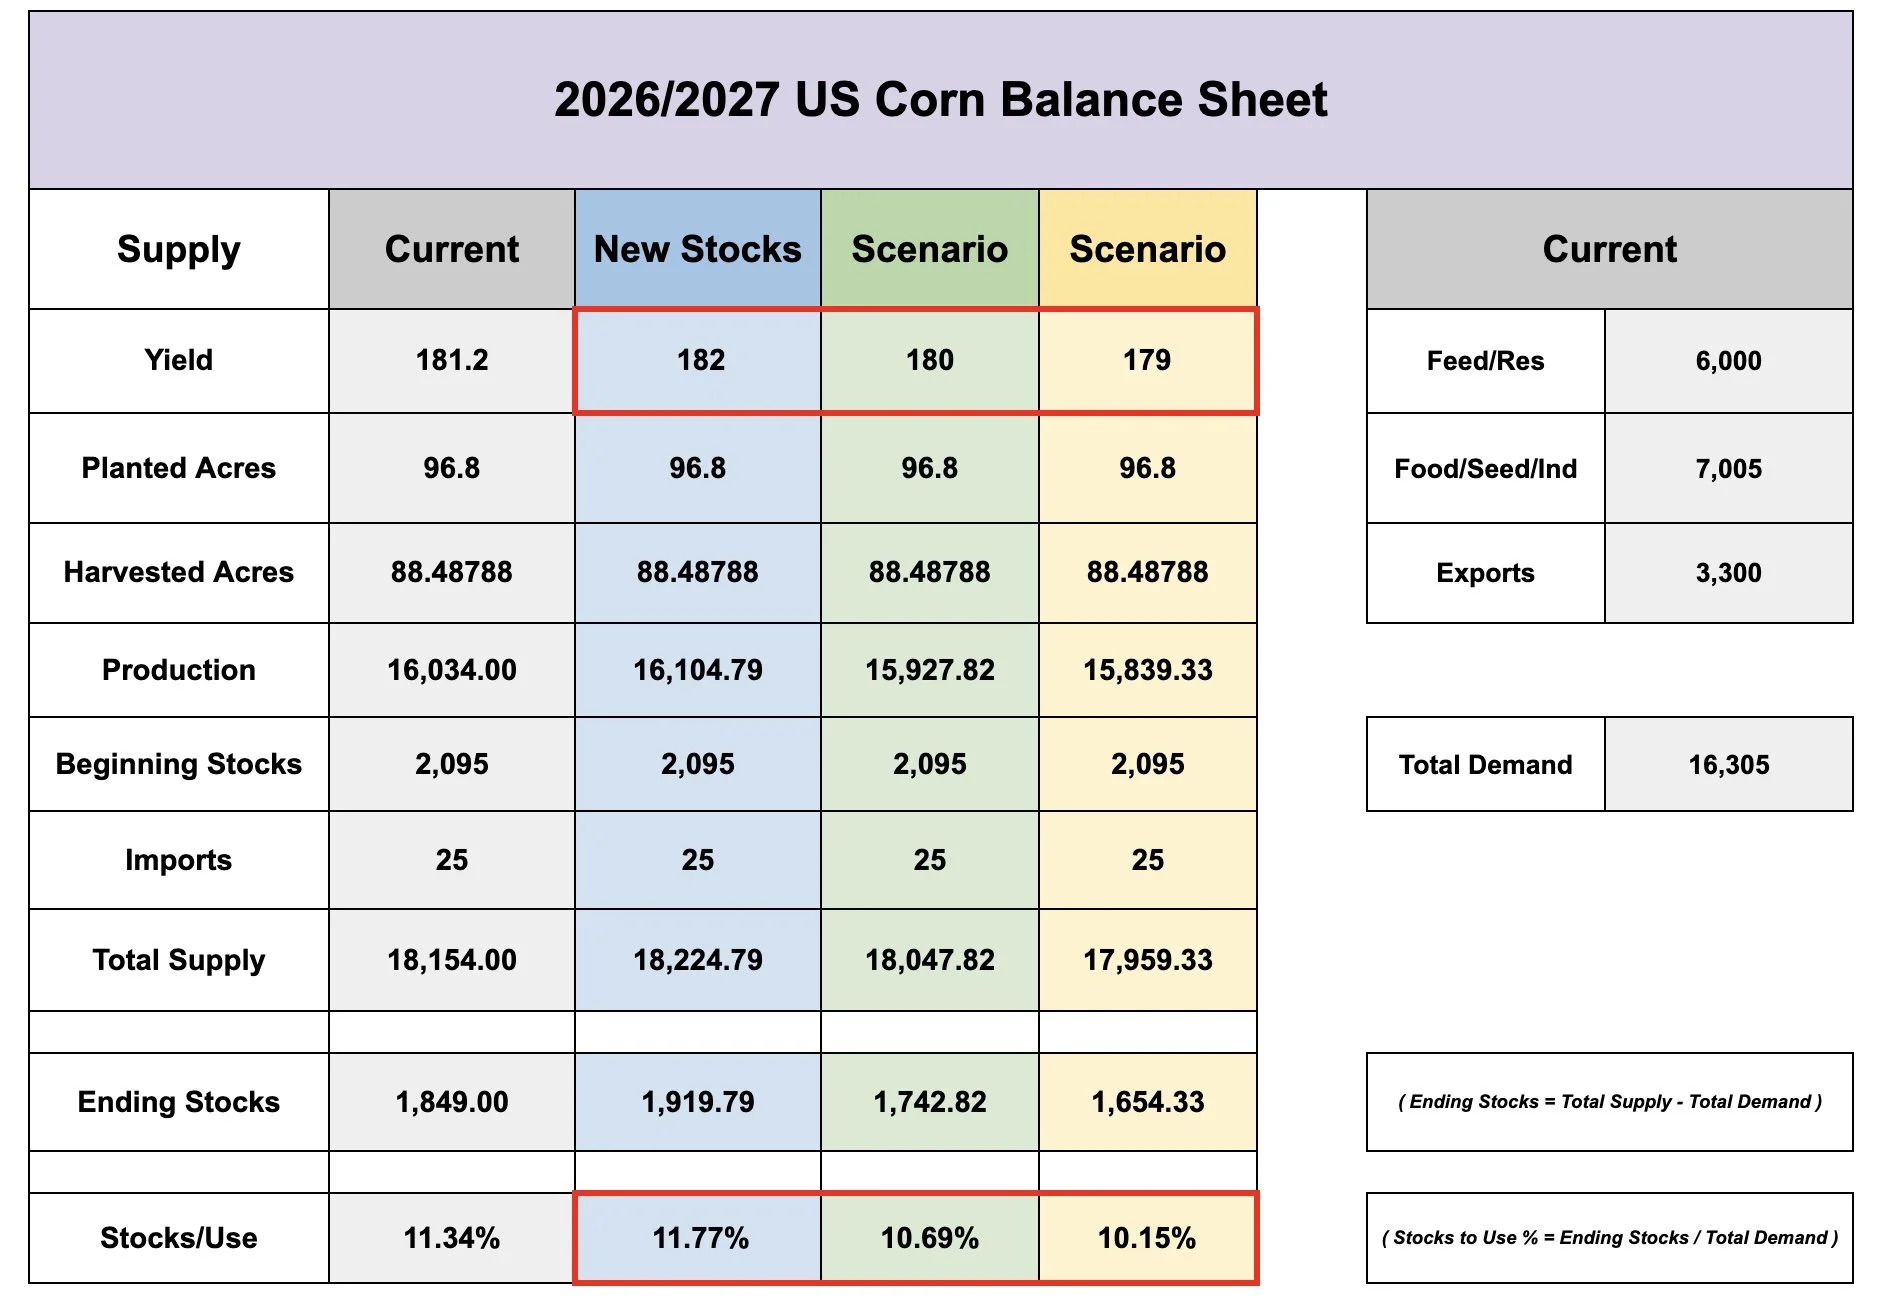
Let's take a look at how yield would impact the balance sheet from here.
I threw on the current 181.2, 182, 180, and 179.
Before touching demand, a 179 yield would put you back closer to that 10% stocks to use range.
If demand holds up, and yield is closer to 179 then we are probably priced too low here.
On the other hand, yes, if the USDA once again throws a curveball and actually raises yield, the balance sheet would not look bullish.
Ratings vs Yield:
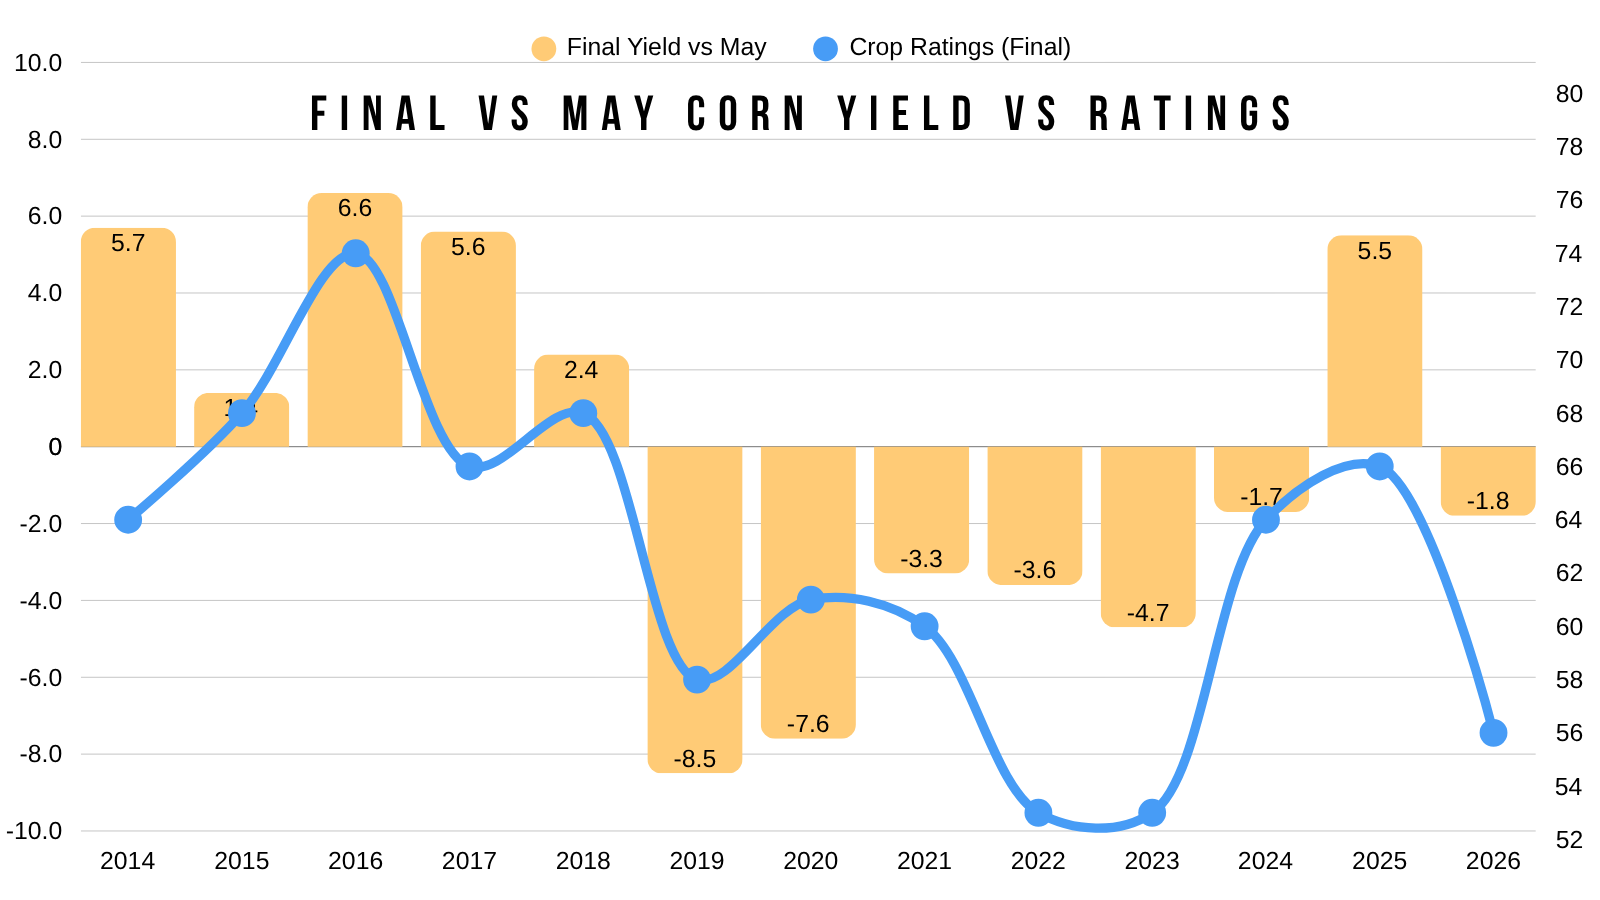
Here is final crop ratings vs how yield deviated from trend.
We have one of the worst rated crops of the decade.
Yet the USDA isn’t calling for much of a deviation from trend. With just a -1.8 bpa decrease.
Anytime we've seen crop ratings remotely this poor, it has resulted in a larger drop in yield.
So my bias is that yield ultimately comes down. I'd like to see it happen next week, but maybe the USDA slow plays it until January.
Is StoneX Right?
StoneX has the highest guess of any analyst.
They are guessing yield is 183. Up from the current 181 and way above the average analyst guess of 180.
So how accurate have they actually been?
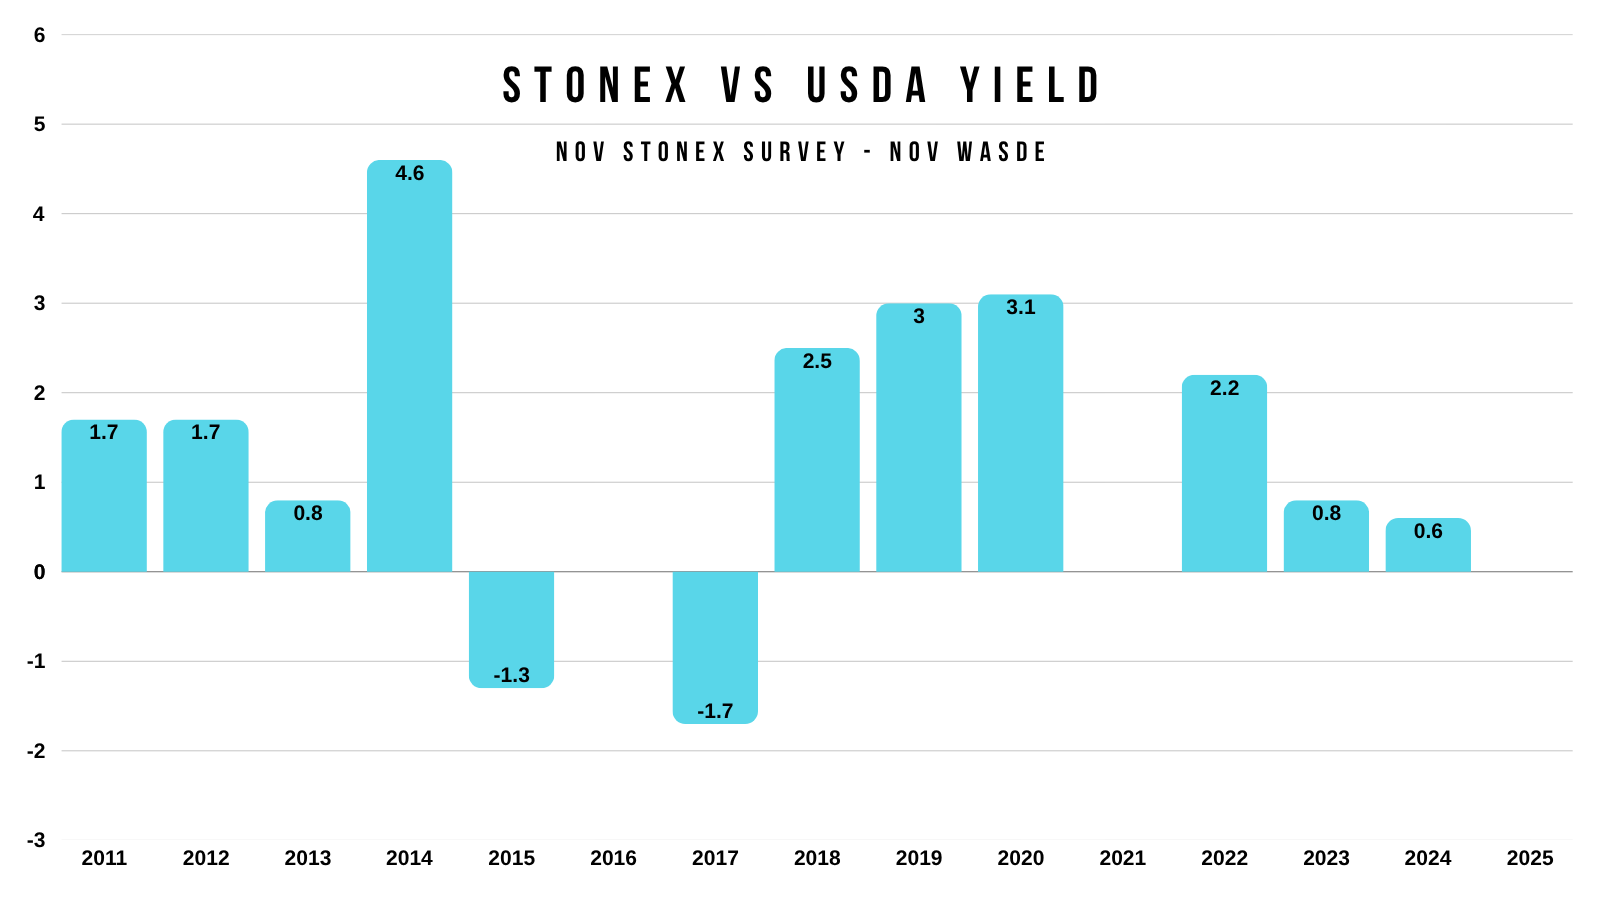
First let's look at how their November survey stacks up with what the USDA did in the November WASDE.
StoneX's guess was higher than the USDA's print in the last 10 of 15 years.
They were spot on in 3 years.
Their number was lower than the USDA just twice.
When they guess too high, on average their miss has been +2.1 bpa above the USDA.
When you add every estimate higher or lower, the median miss is +1.2 bpa higher than the USDA.
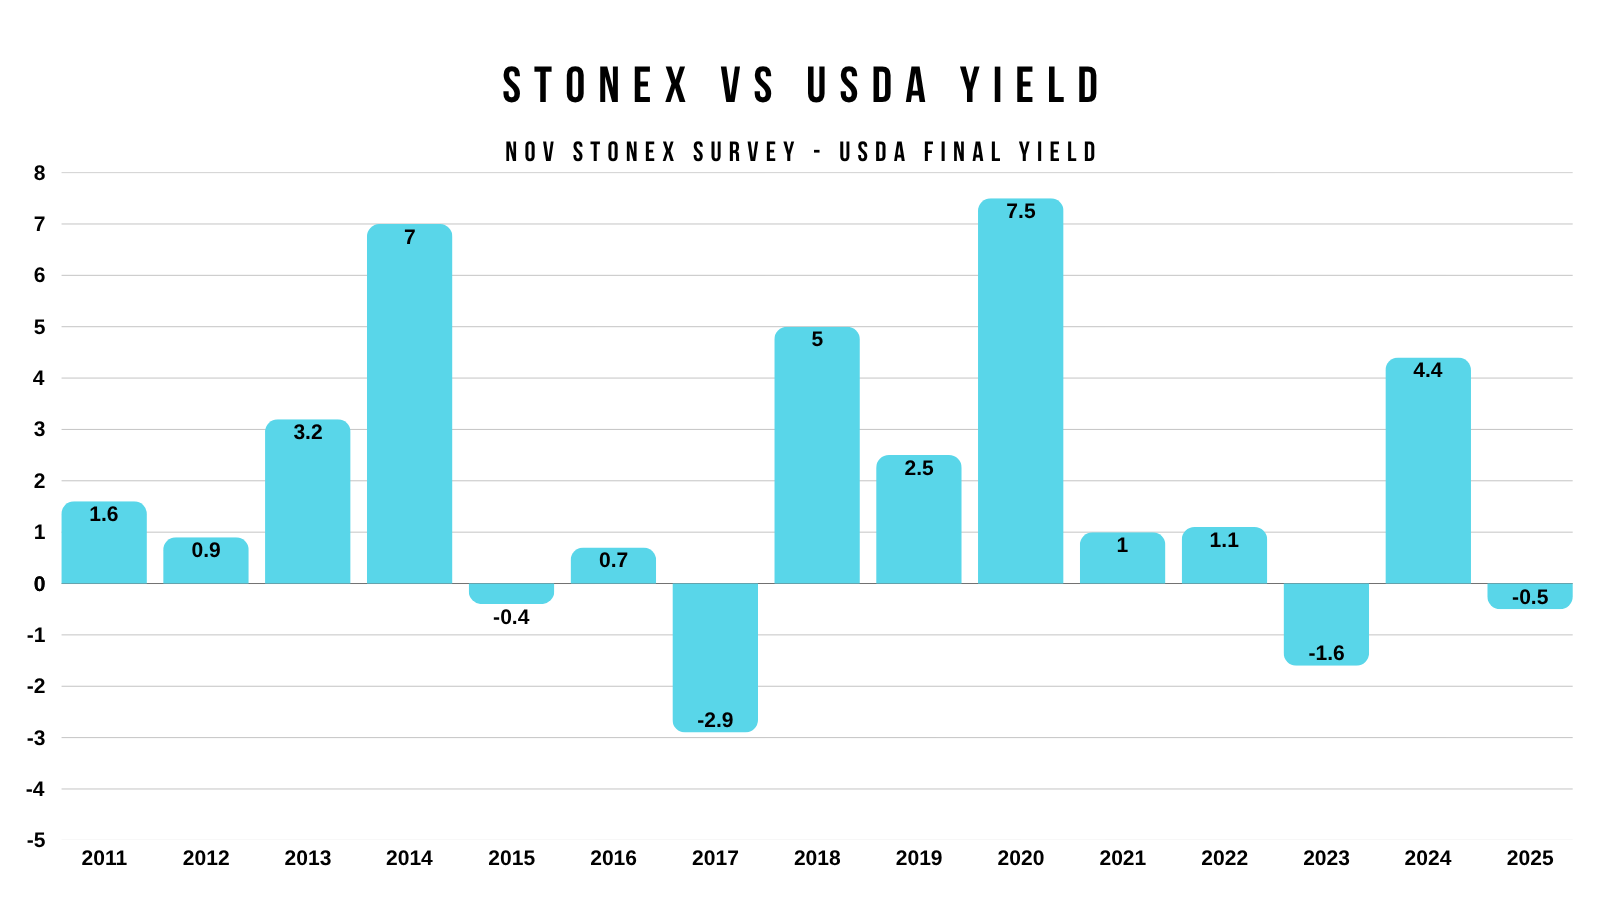
Here is StoneX's November survey vs the USDA final yield instead.
StoneX has been above the USDA in the last 11 of 15 years.
When they guess too high, on average it's been by +3.2 bpa.
If you add the high and low misses together, the median miss is about +2 bpa above the USDA.
Bottom Line:
I think corn is undervalued here. Does that mean the bottom is in? No, as we still don’t have any concrete proof of one.
This market hasn’t put together back to back positive days in months. We need to see some signs of life.
But I think we are reaching a point where we are undervalued, and I expect us to see some better prices over the course of the next few months. As long as the USDA doesn’t throw a wrench in things for the 3rd report in a row.
We had that re-ownership alert a day or two ago. So I do think this is a good area for some to consider re-owning if you would like to keep some upside exposure in case. Implied volatility is the lowest it's been all year long. That doesn’t mean the market has to go higher, but it's means it's the cheapest it's been to own options. Whether you want downside protection or upside exposure.
We are starting to see some potential positive things on the charts, so let's get into them.
Dec Corn Chart:
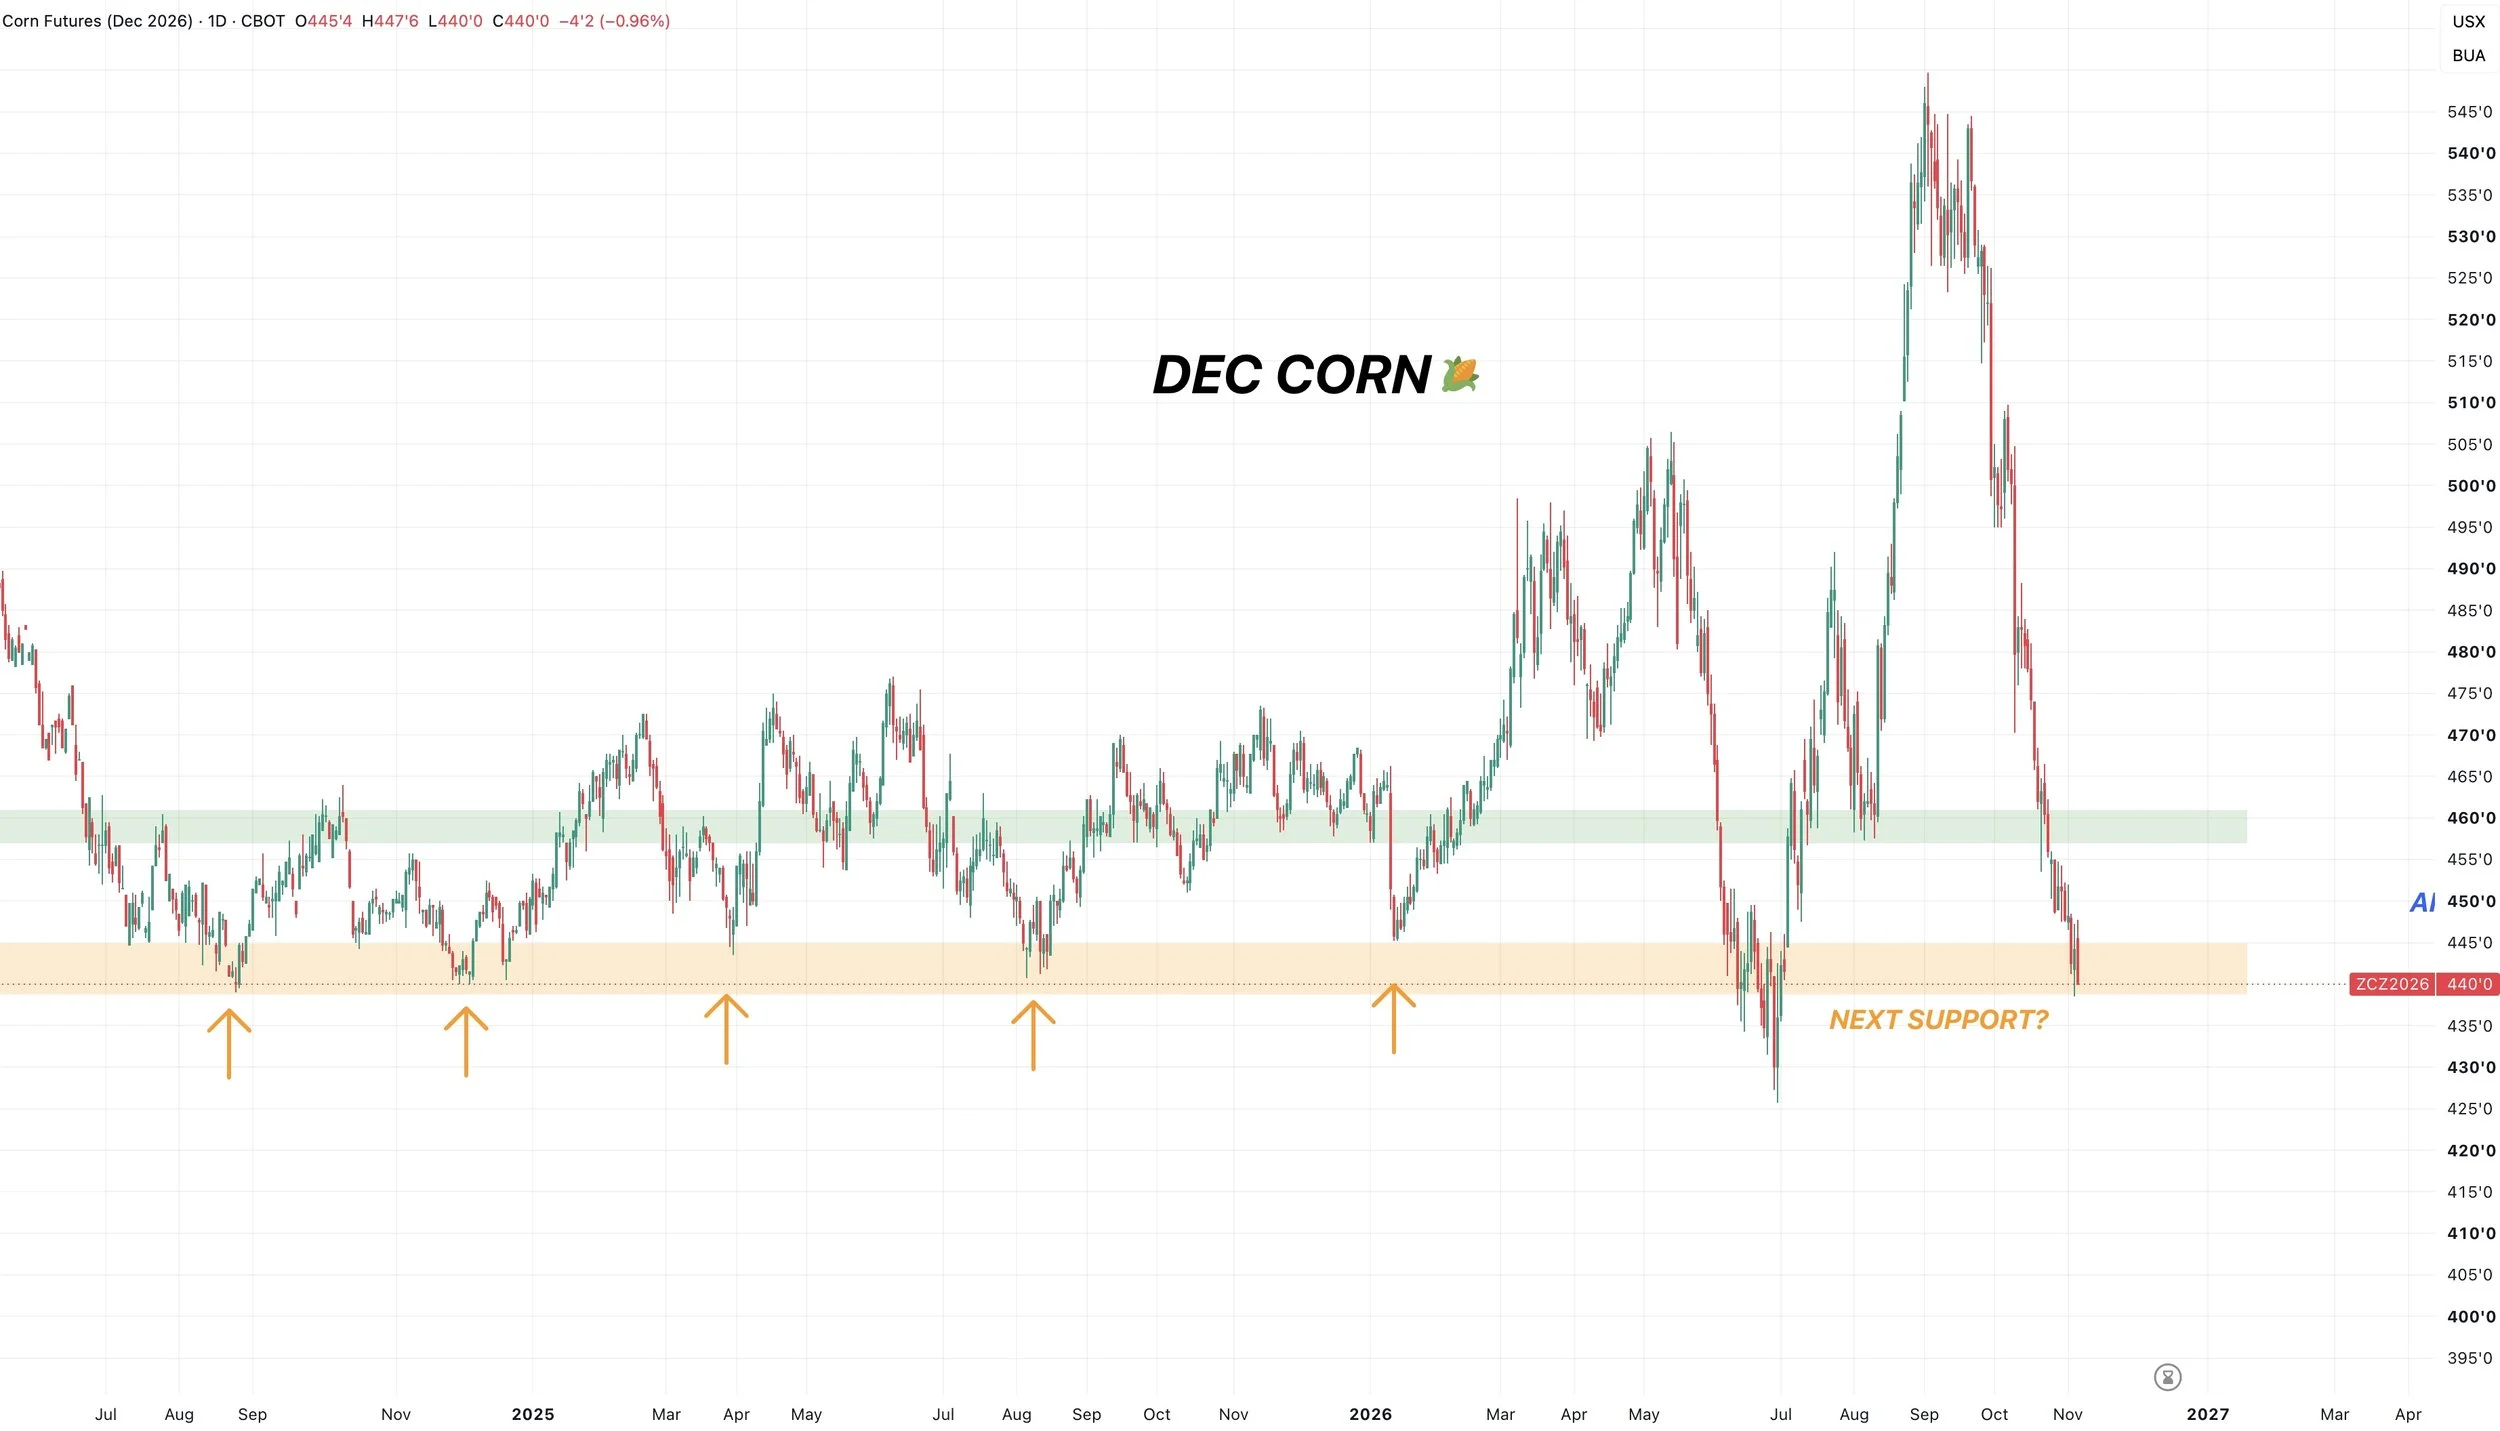
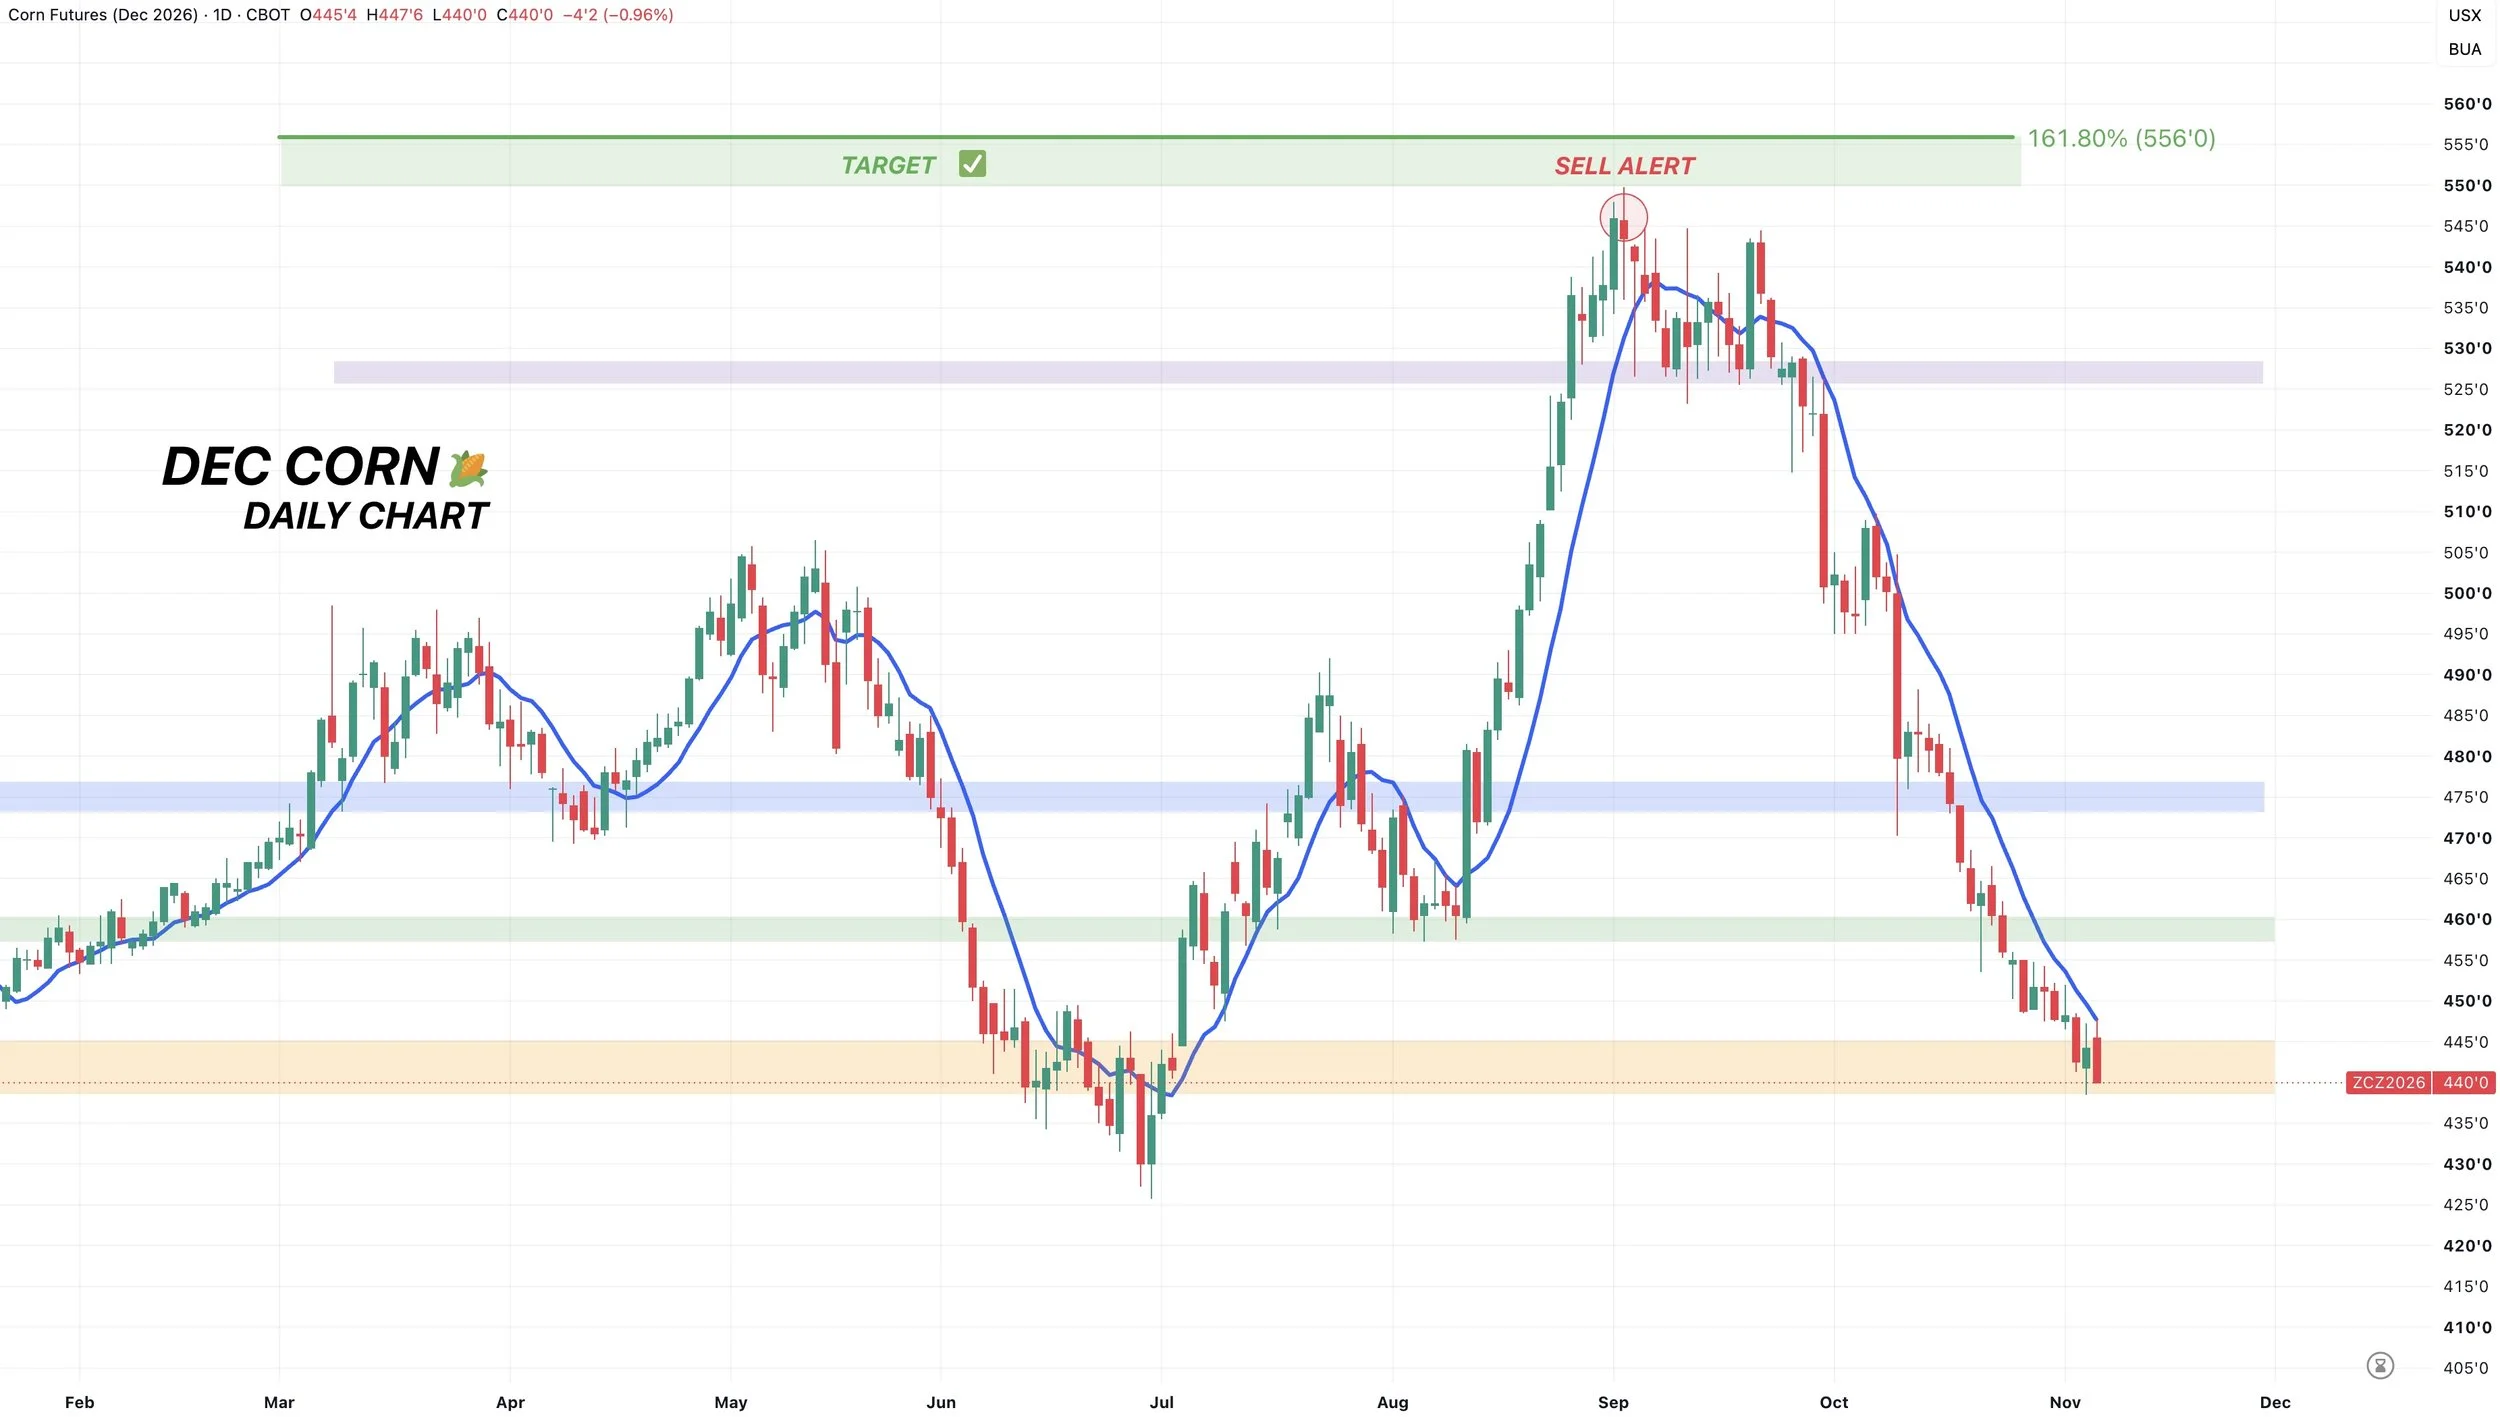
Dec corn has bottomed at this $4.40 to $4.45 level on 5 separate occasions over the last few years.
If bulls are going to find some life, this would be where we want to see it happen.
As this is the last support between us and the contract lows. So that's your risk if we break below this support.
We have only closed below this level a handful of days back in June.
It's hard to definitively call a bottom until we see some upside follow through, but it does feel like the upside outweighs the downside here.
It's obviously too early to talk about upside targets until we find a bottom first.
9-Day MA:
This is going to be one thing to watch when looking for a bottom.
The 9-day MA.
When a market is on a nice rally, it often stays above the 9-day which we did on that entire August rally.
Since we broke in September, we have not closed above the 9-day. As we've continued to reject off of it.
Breaking above this 9-day would be the first that maybe we want to start to bounce.
RSI:
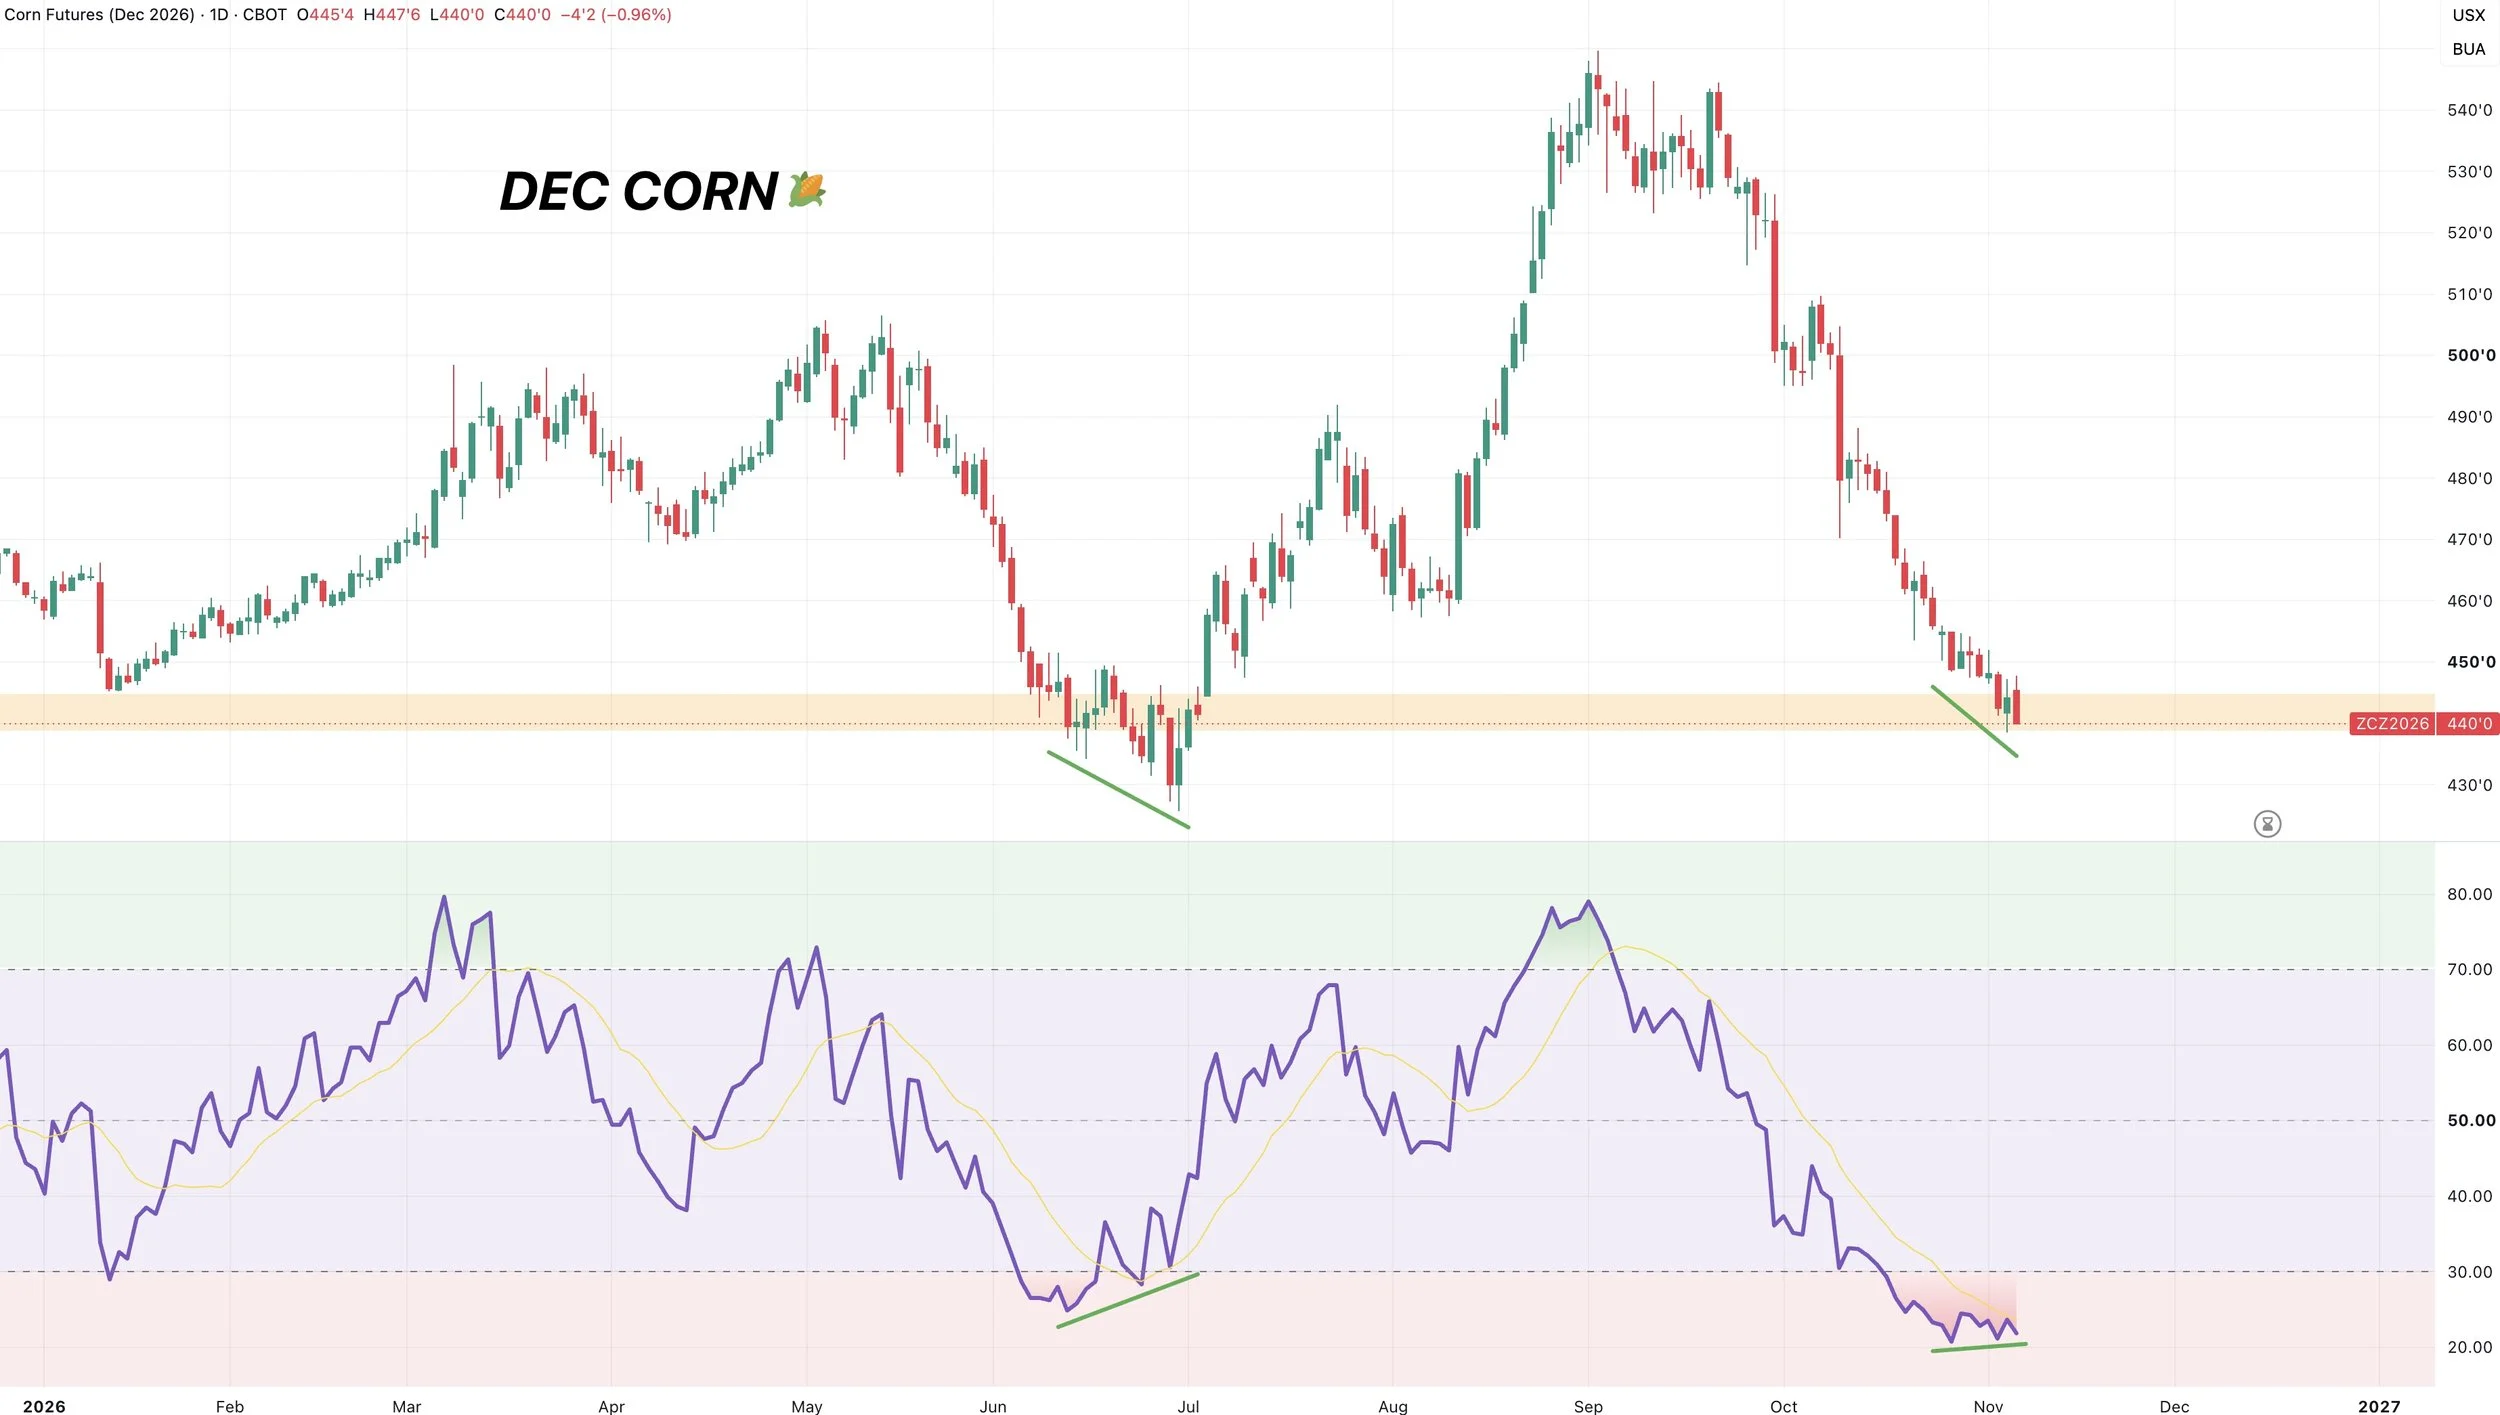
I did want to also note that we do still have some potential bullish divergence developing for the first time since the June lows.
Prices are making new lows. Yet the RSI is not.
Obviously need to get some follow through higher, but if we are able to start to bounce here this would give some confidence of a low.
As bullish divergence is a sign that the downside momentum is getting weaker.
Add on to the fact that corn is the most oversold it's been in 3 years.
MACD:
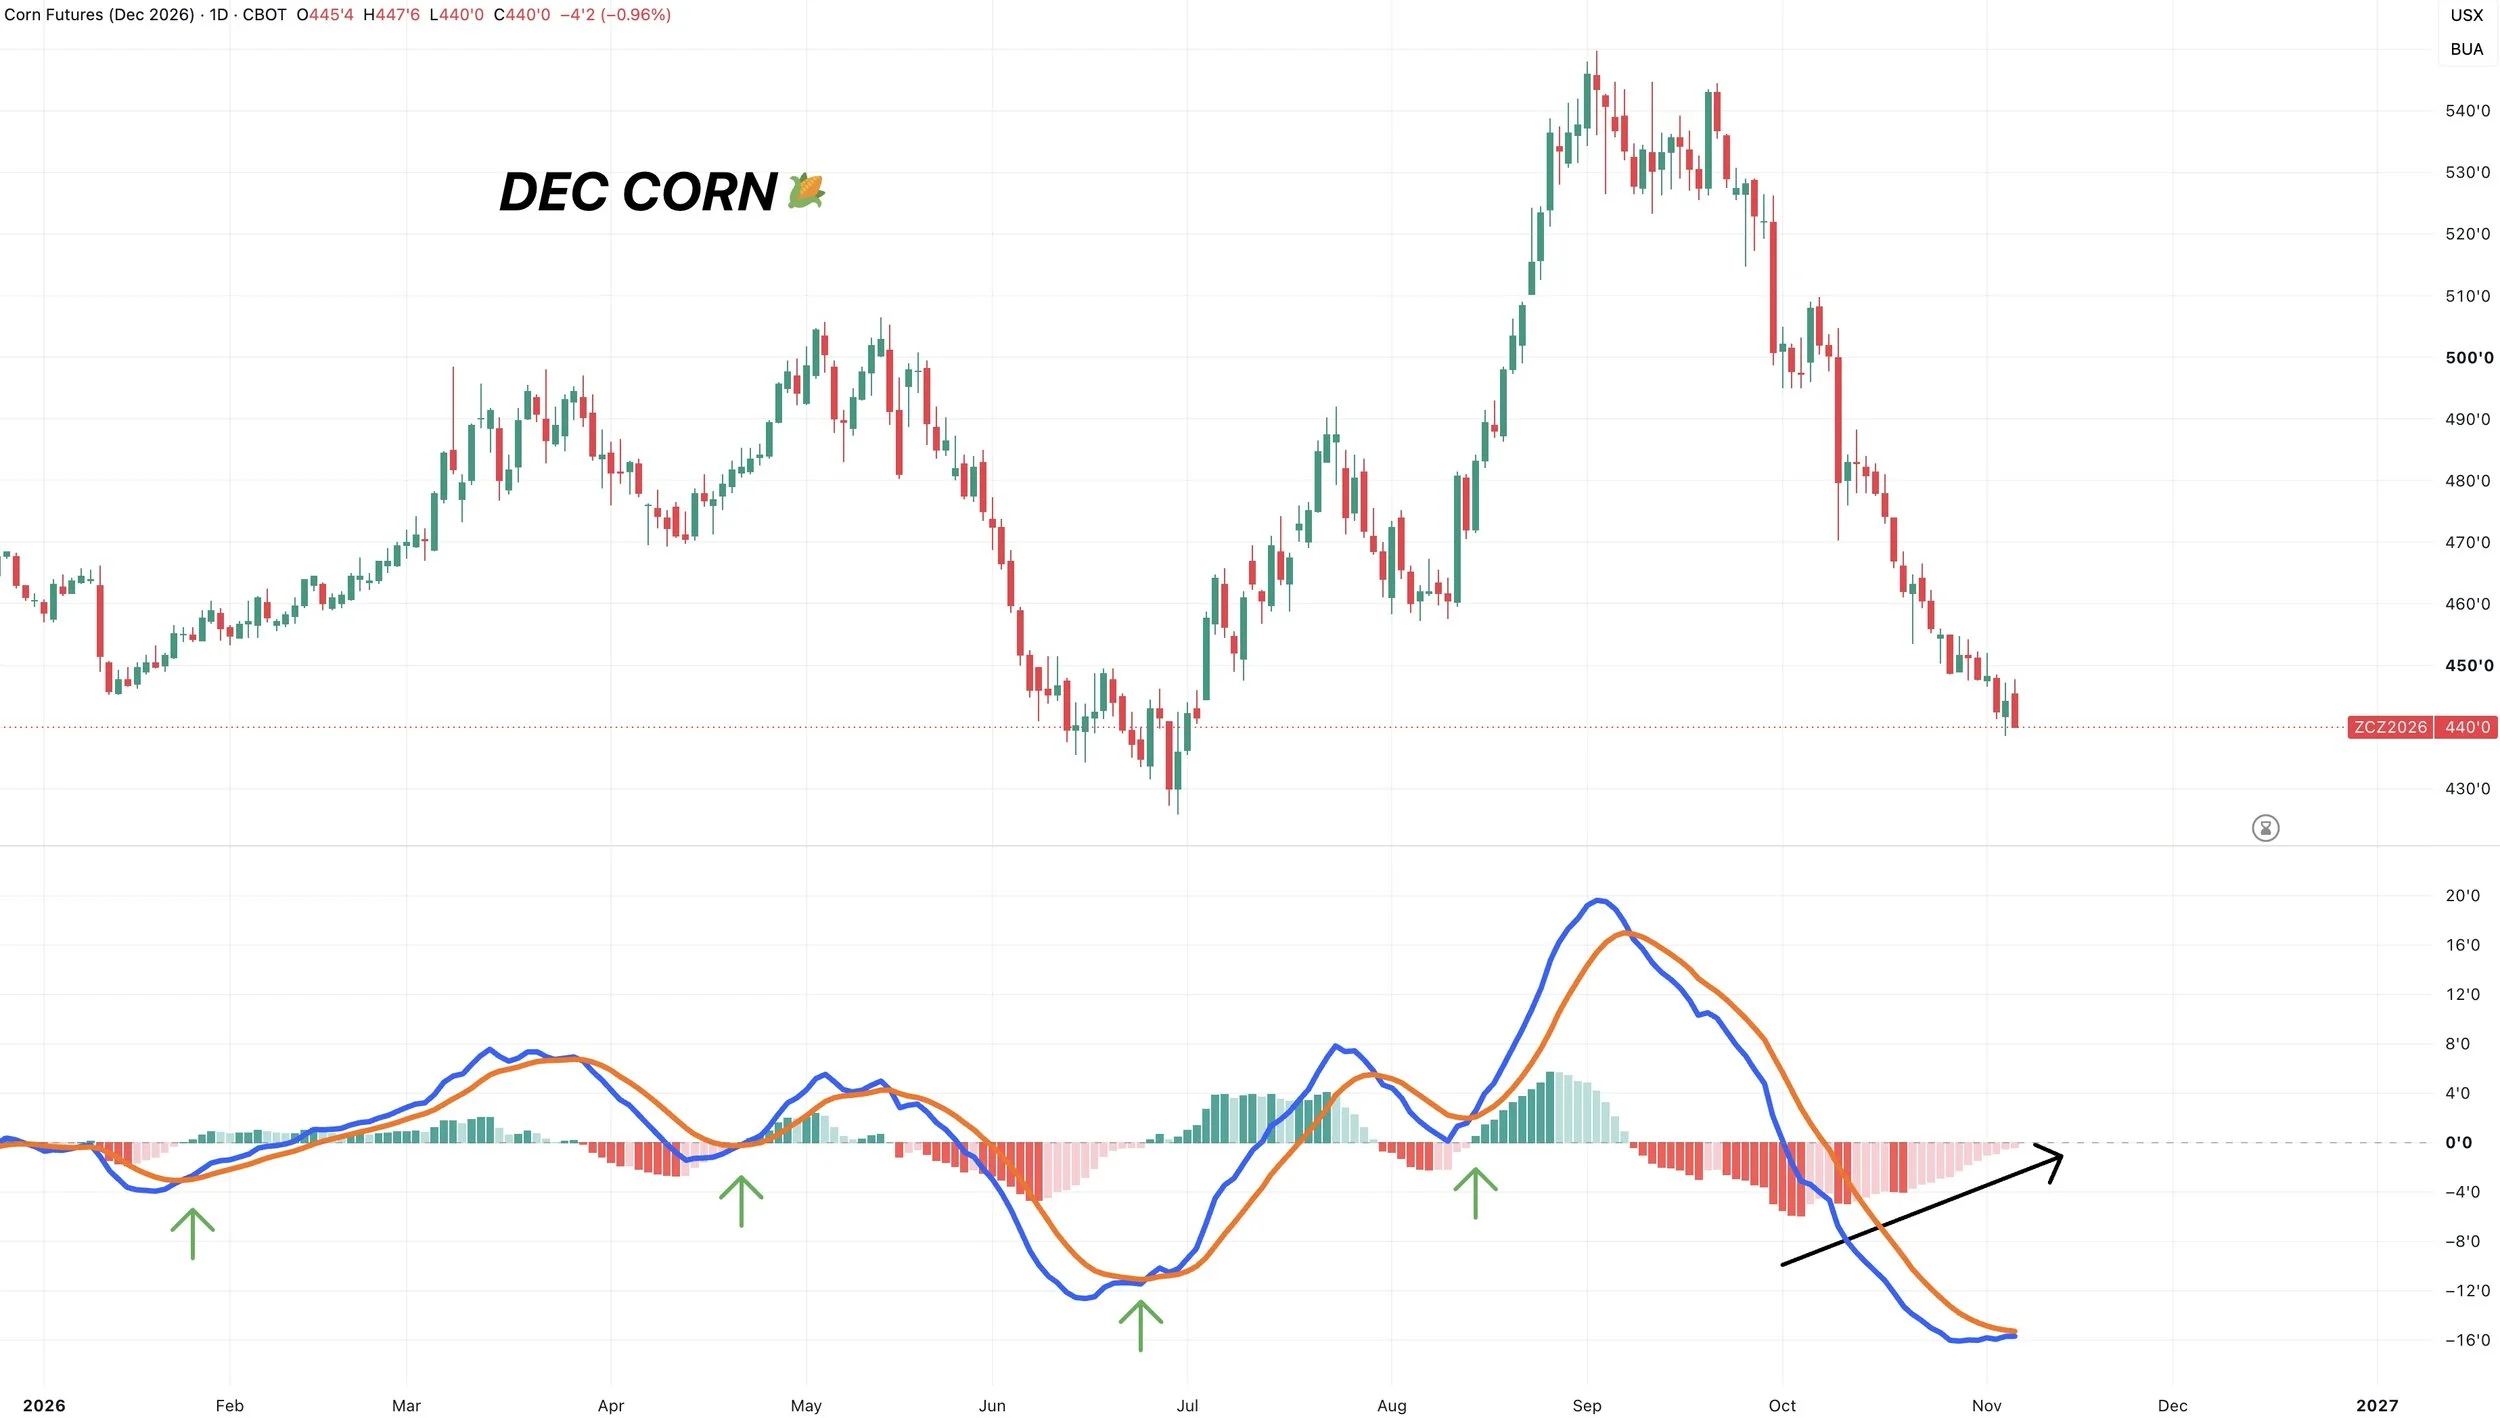
I've been talking about this MACD for a while as well.
It is getting extremely close to crossing bullish.
Suggesting a potential change in momentum.
It's crossed bullish 4 times this year. Each a bounce followed.
It has not yet crossed, but is getting very close to doing so.
Soybeans
Fundamentals
Big Yields & Big Demand:
Soybeans continue to take a hit on the idea of a bigger crop, which is a valid concern. As I could see bean yield improving unlike in corn.
But even if yield is slightly higher, there is probably a good chance at least part of it get's offset with an increase to export demand.
Soybean exports are up 76% vs last year.
The USDA only has their estimate up 11% vs last year.
So it feels like that number will for sure need to be bumped at some point.
And as long as the USDA doesn’t make a massive increase to yield, demand should offset a good part of it.
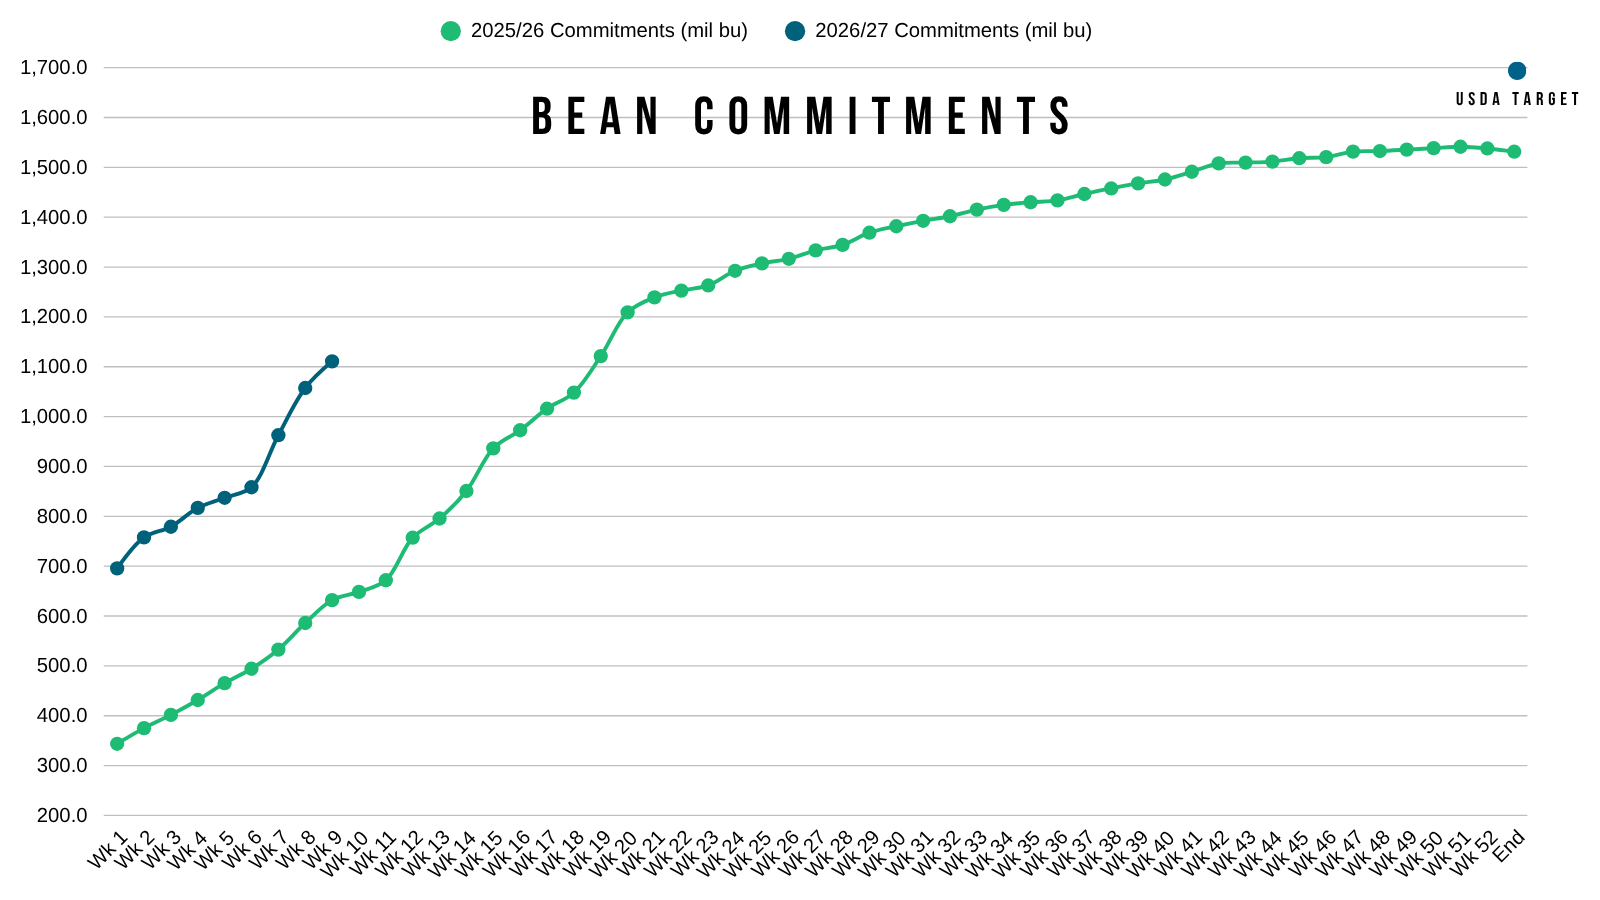
China continues to gobble up soybeans and inch closer to that goal.
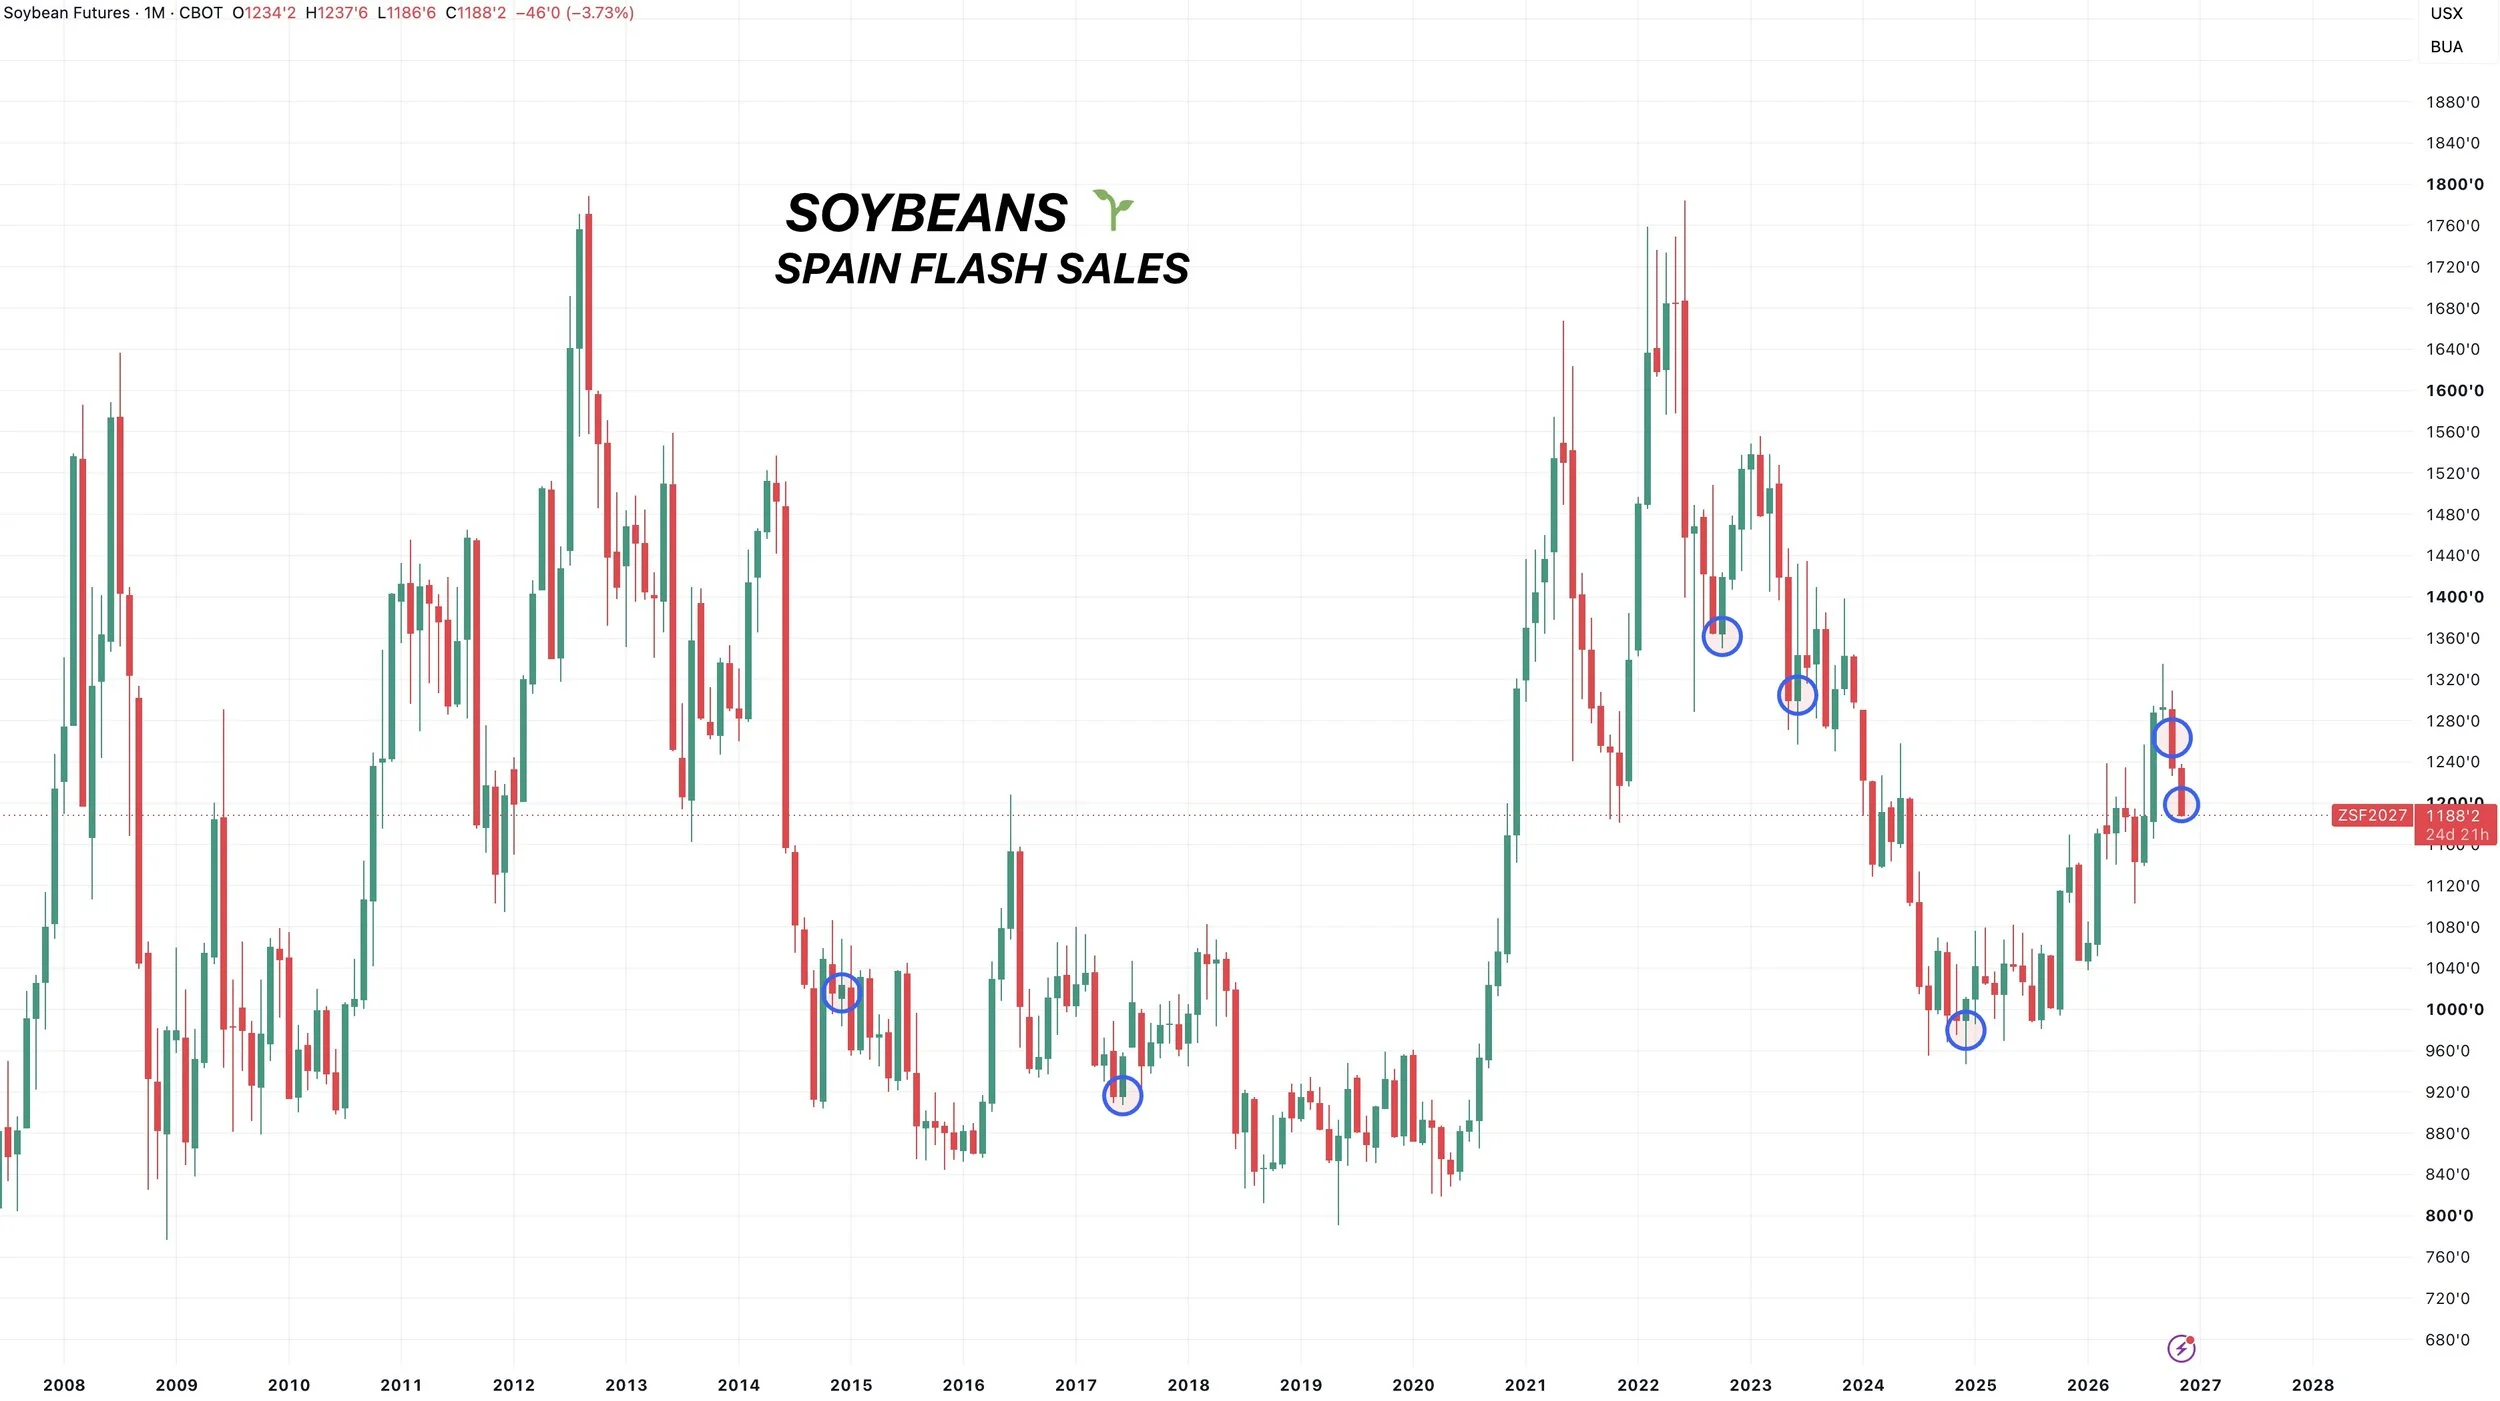
We've also seen Spain stepping in and buying soybeans.
Spain literally never buys soybeans.
Before this month, Spain had only bought soybeans 5 times in at least the last 15 years.
The last time they bought beans was the bear market lows of 2024.
They have now bought soybeans twice in the last few weeks.
They only buy when they see value. So this should be a hint that they think soybeans are undervalued.
Super El Niño:
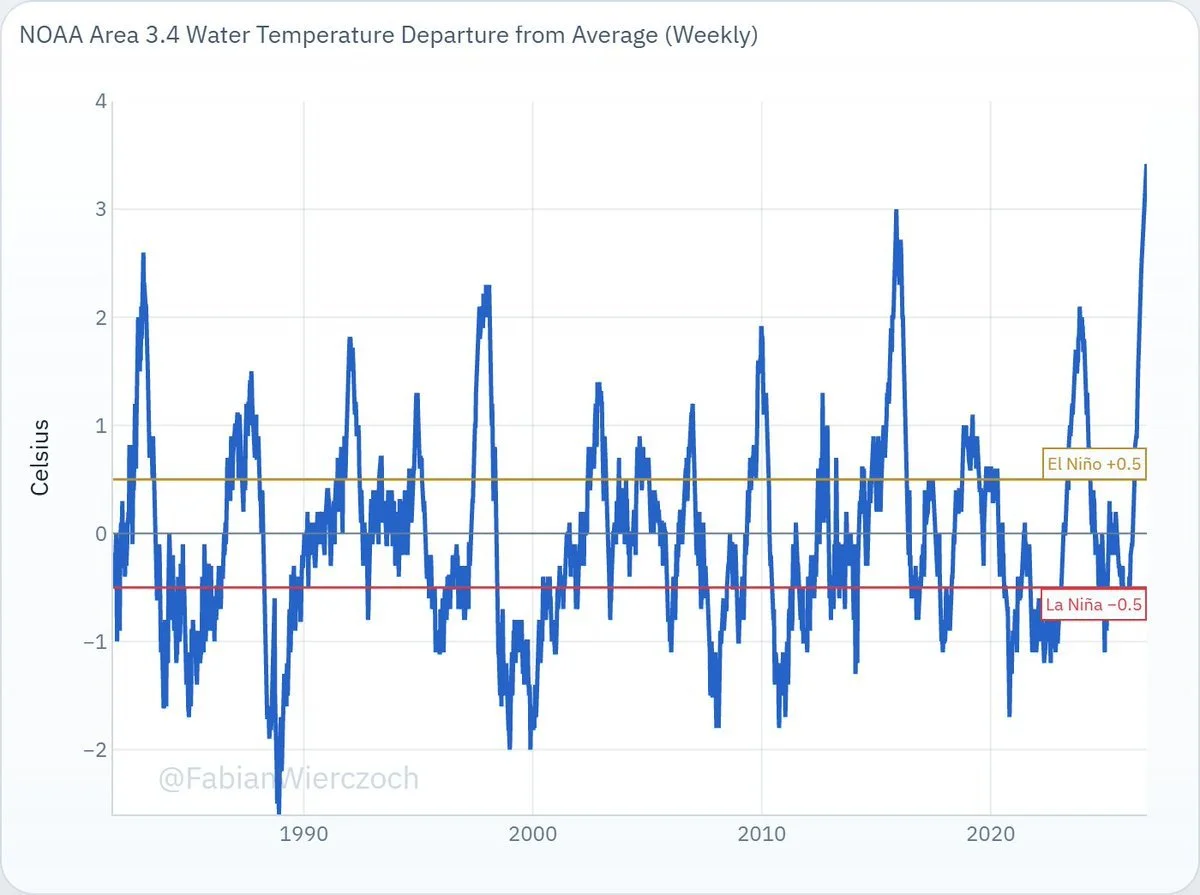
The market has seemed to have forgotten about the Super El Niño.
Here is a chart that tracks water temperature vs normal.
When it's above, it's an El Niño. When it's below, it's a La Niña.
It is reading at it's highest levels of all time.
The last time we saw a Super El Niño was back in 2015.
Maybe this makes a big impact. Maybe it does not.
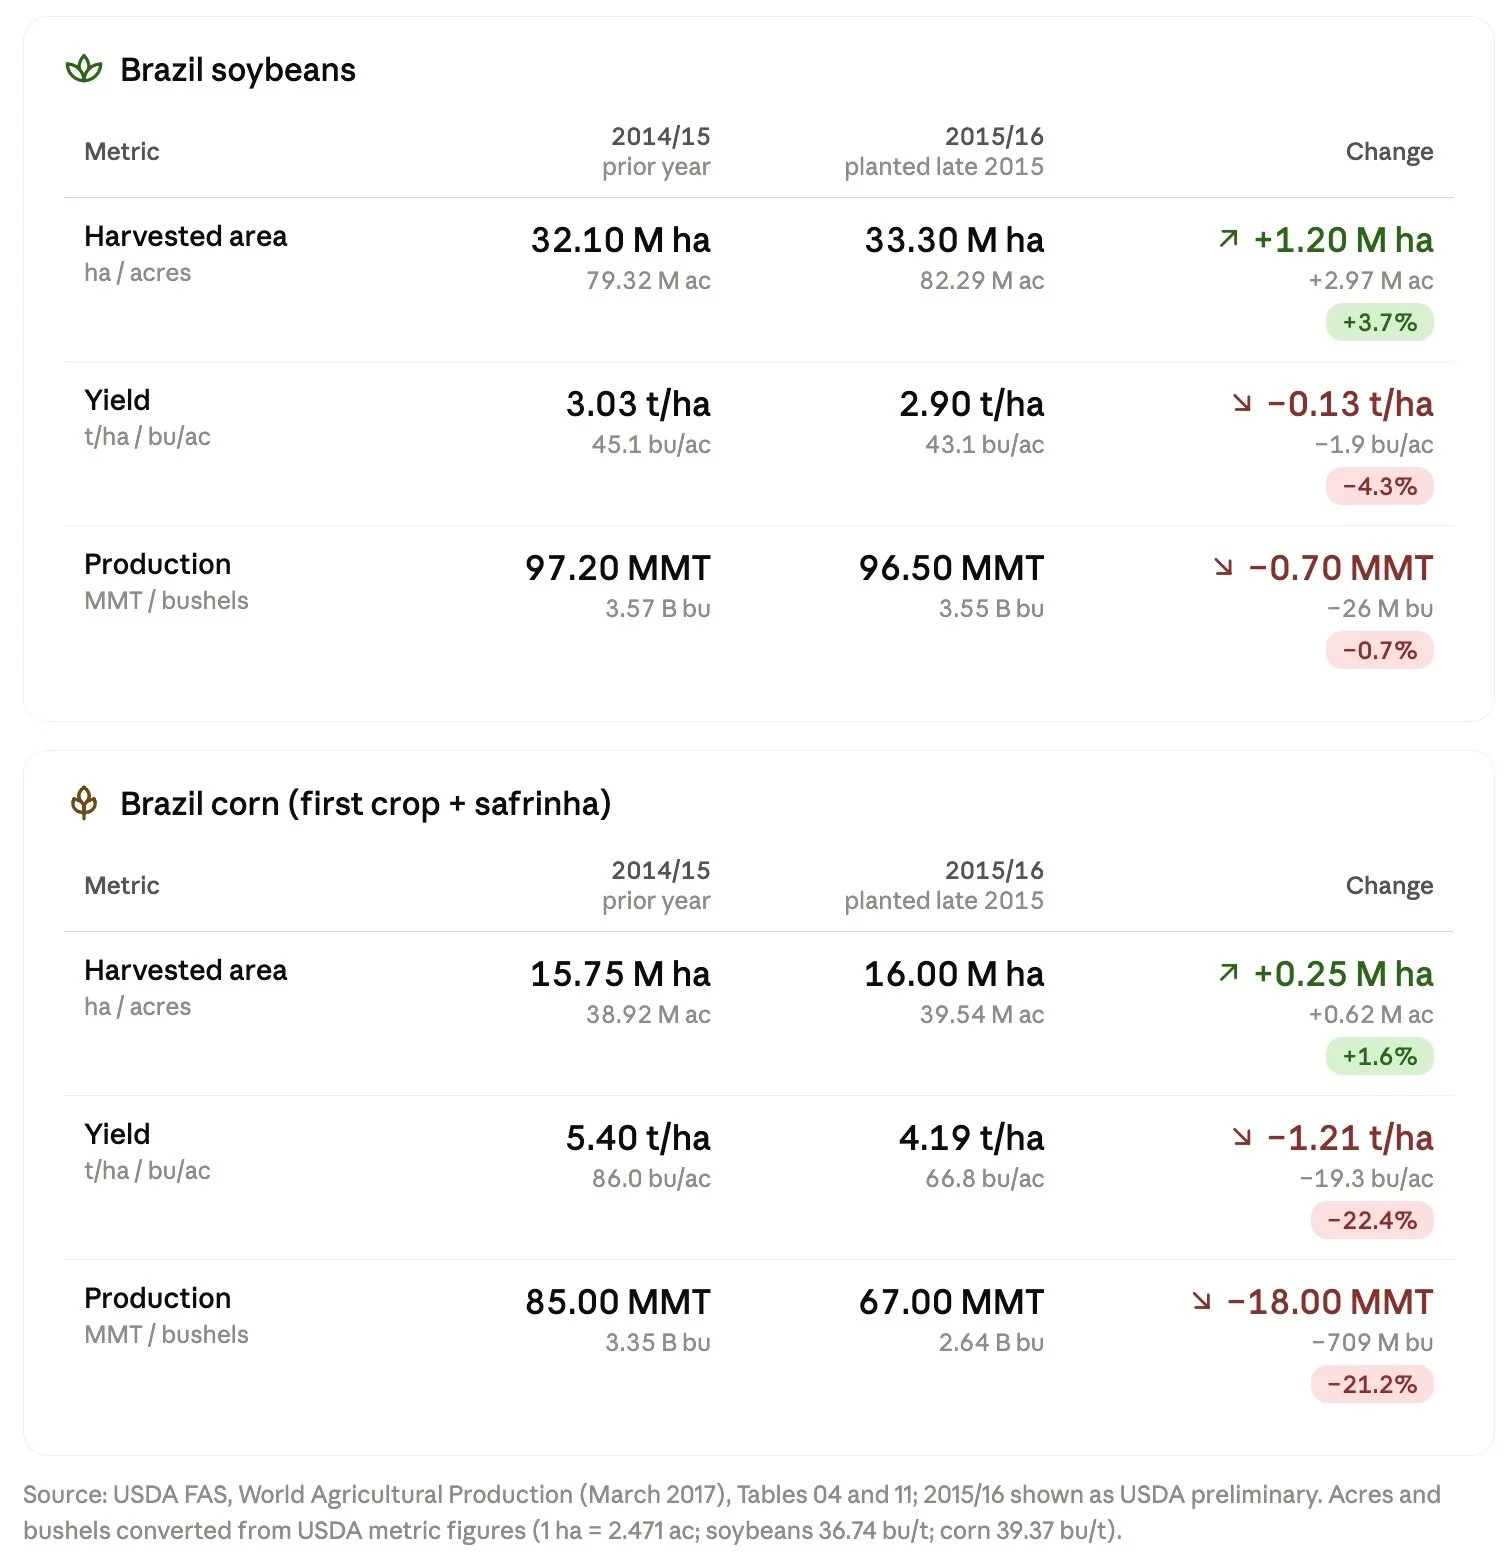
But what happened in 2015?
For starters, corn production dropped -20% in Brazil.
Soybean yield dropped -4% vs the prior year.
However, more soybean acres saved the production number. As the increase in acres mostly offset the losses in yield.
But this is not the same scenario.
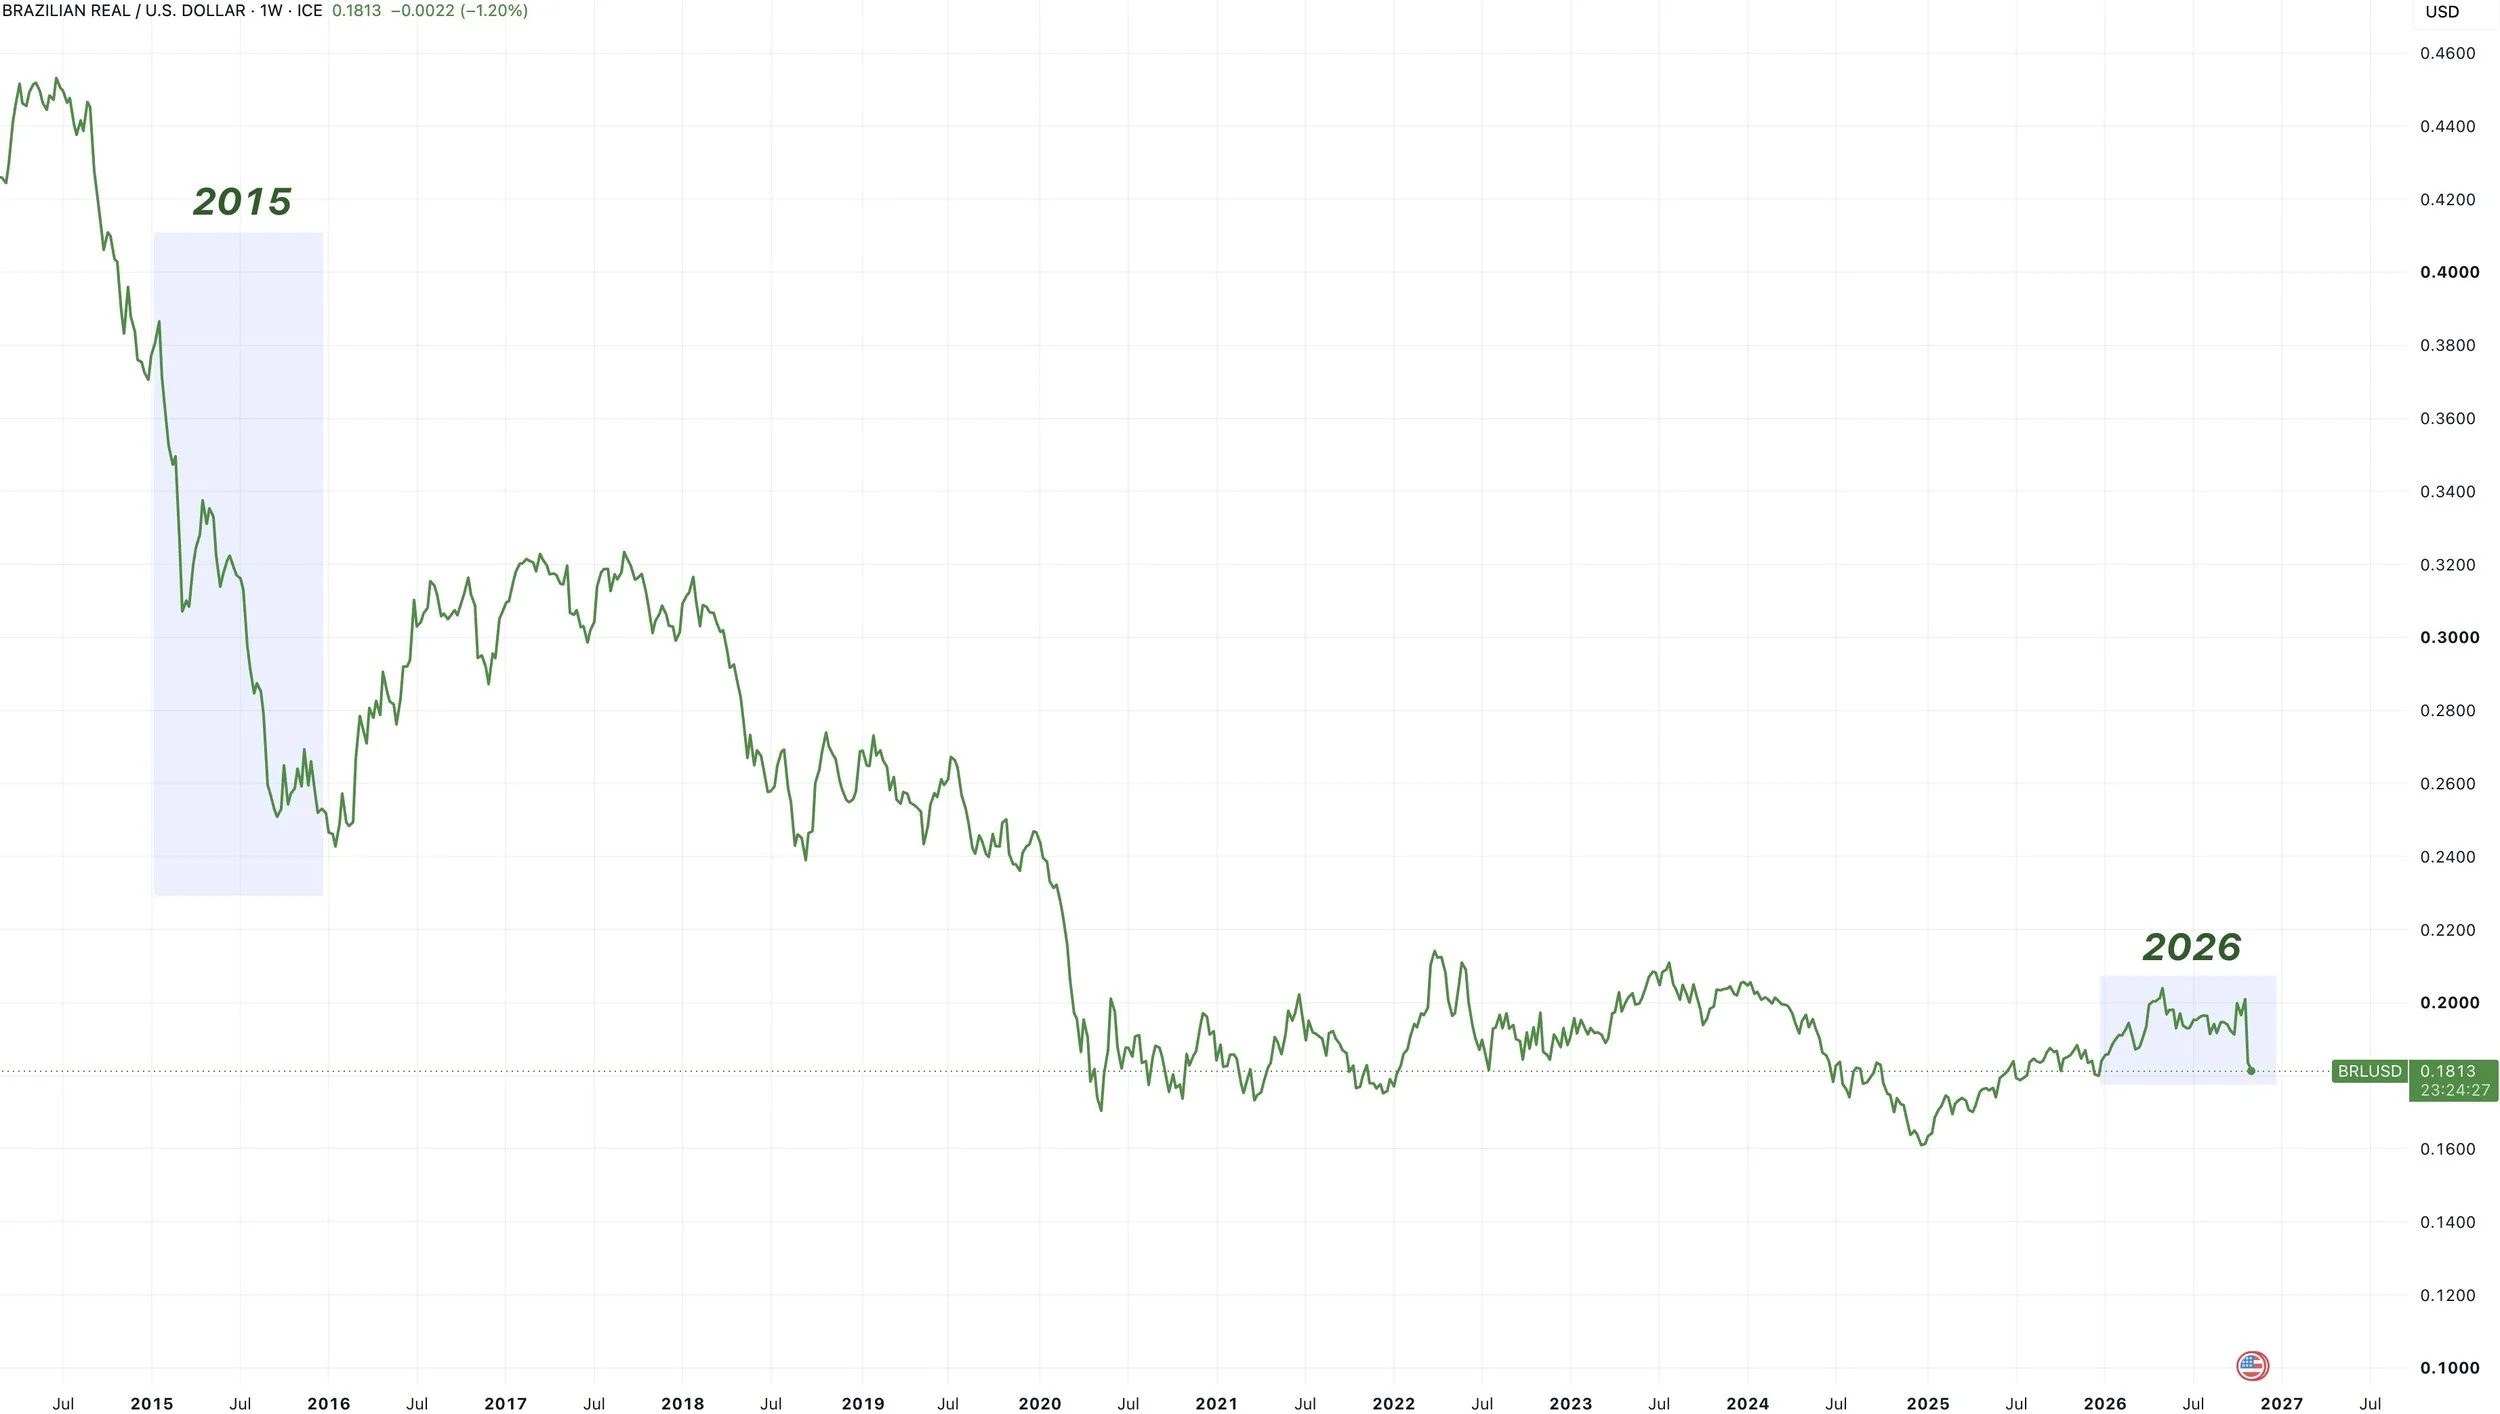
In 2015, the Brazilian real got demolished.
It was down 35% that year. So this helped bring in more acres.
The real is actually still up on the year this year. Along with the fertilizer situation.
Brazil acres this year are projected to see their weakest year-over-year growth in the last 20 years.
I do not think we will be getting those extra acres this time around.
The market hasn’t cared about this, because it's simply too early and planting is going just fine down there.
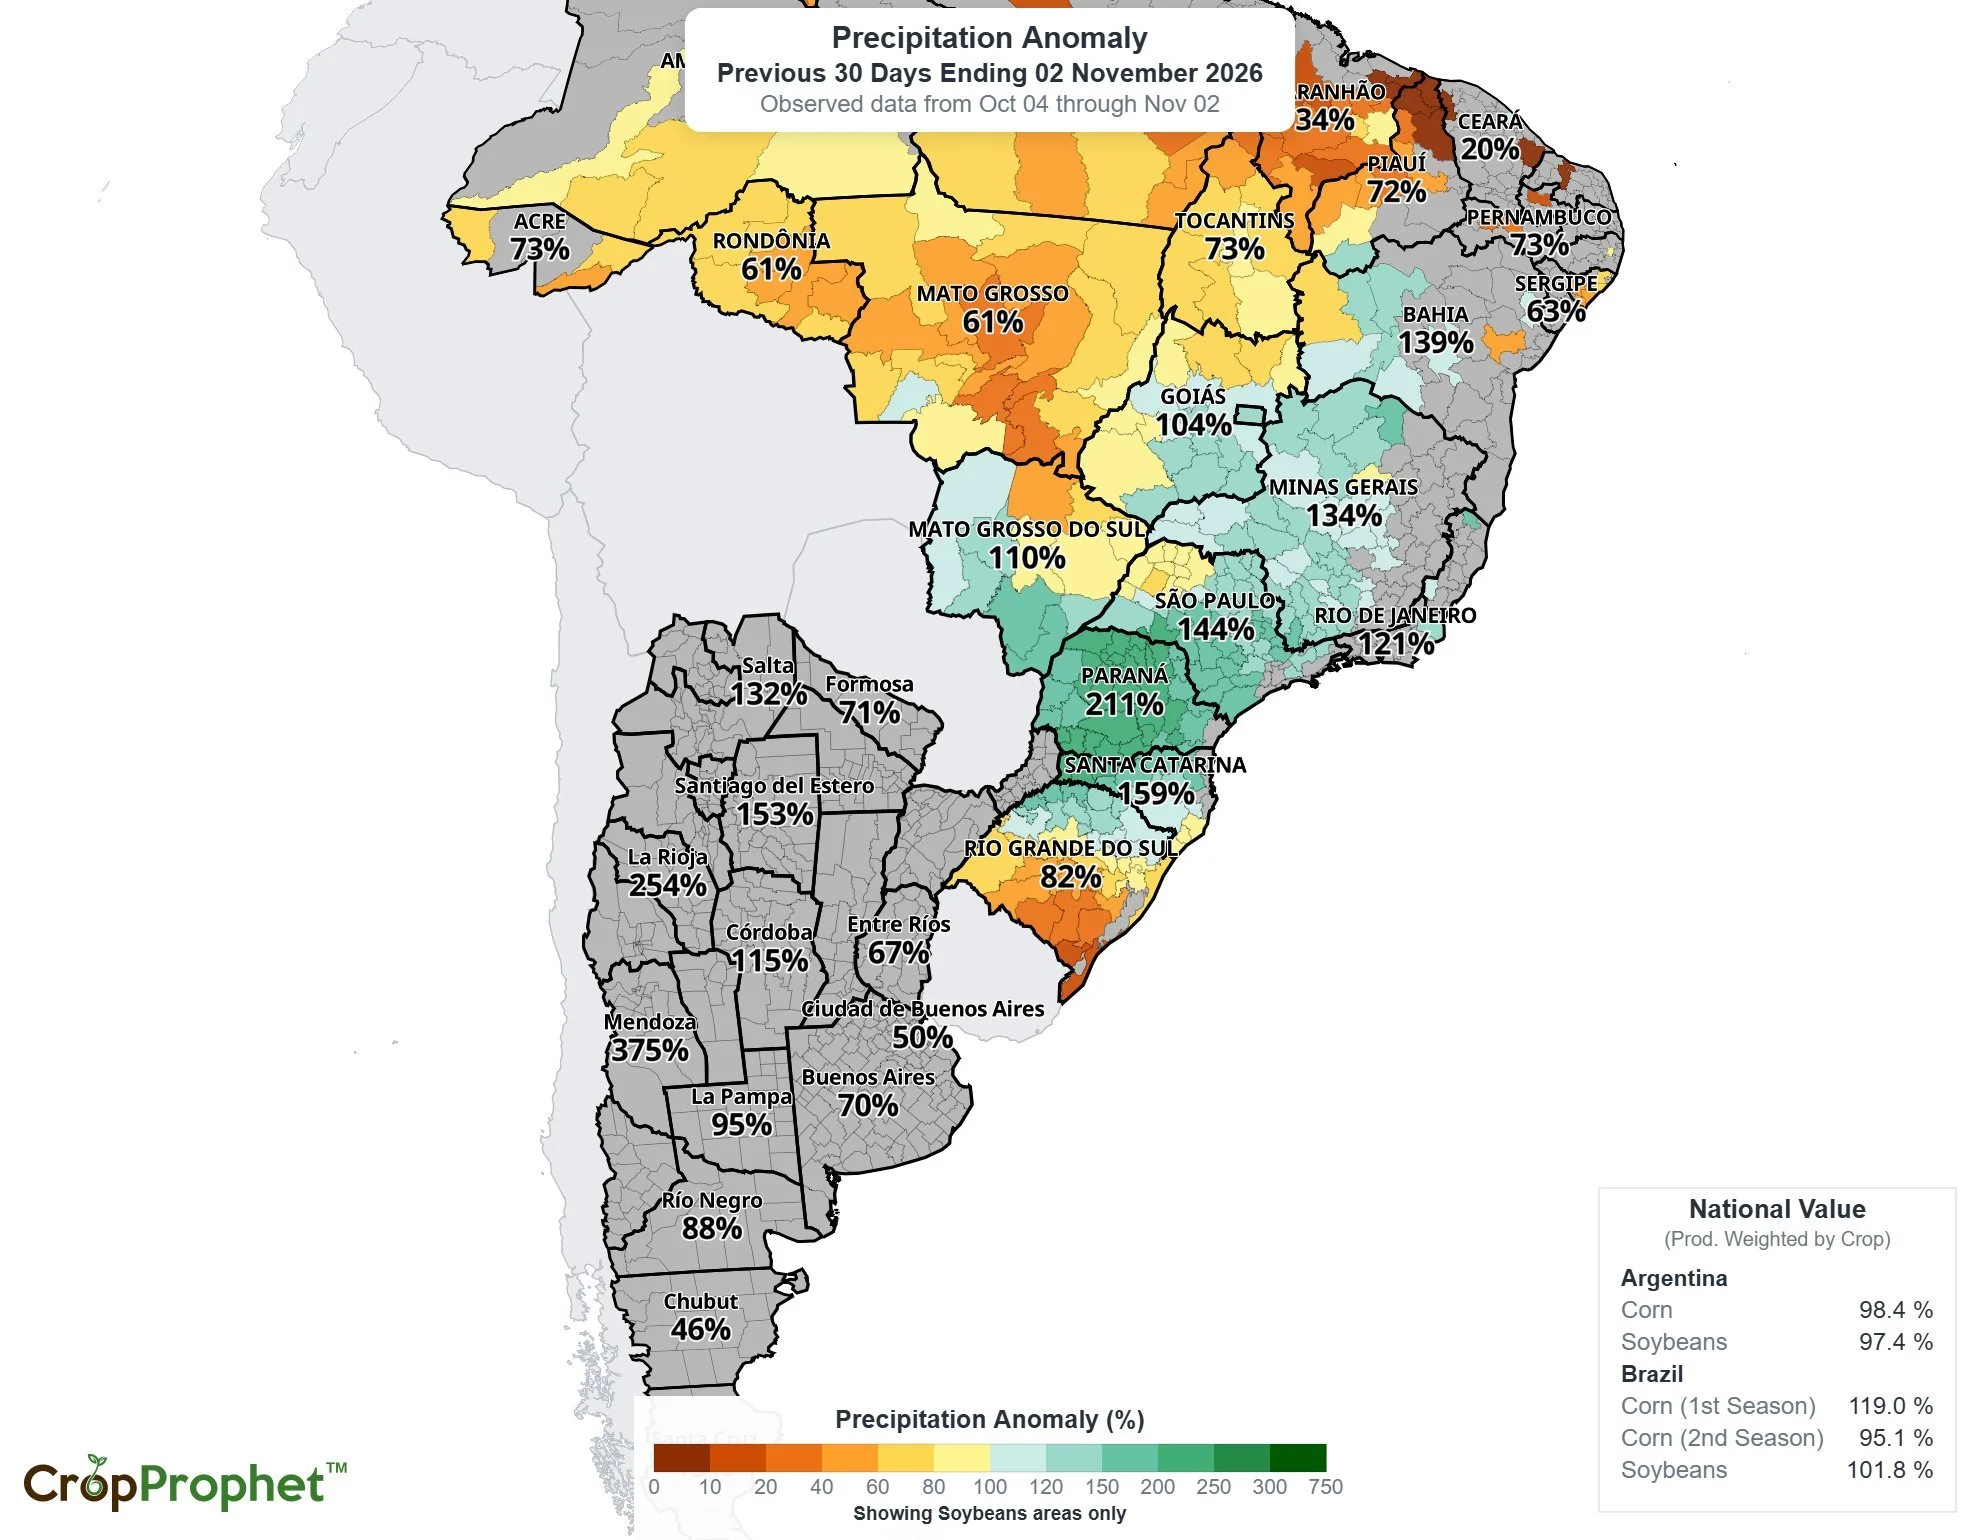
But look at their last 30 days of precip.
Here is a good map from Crop Prophet.
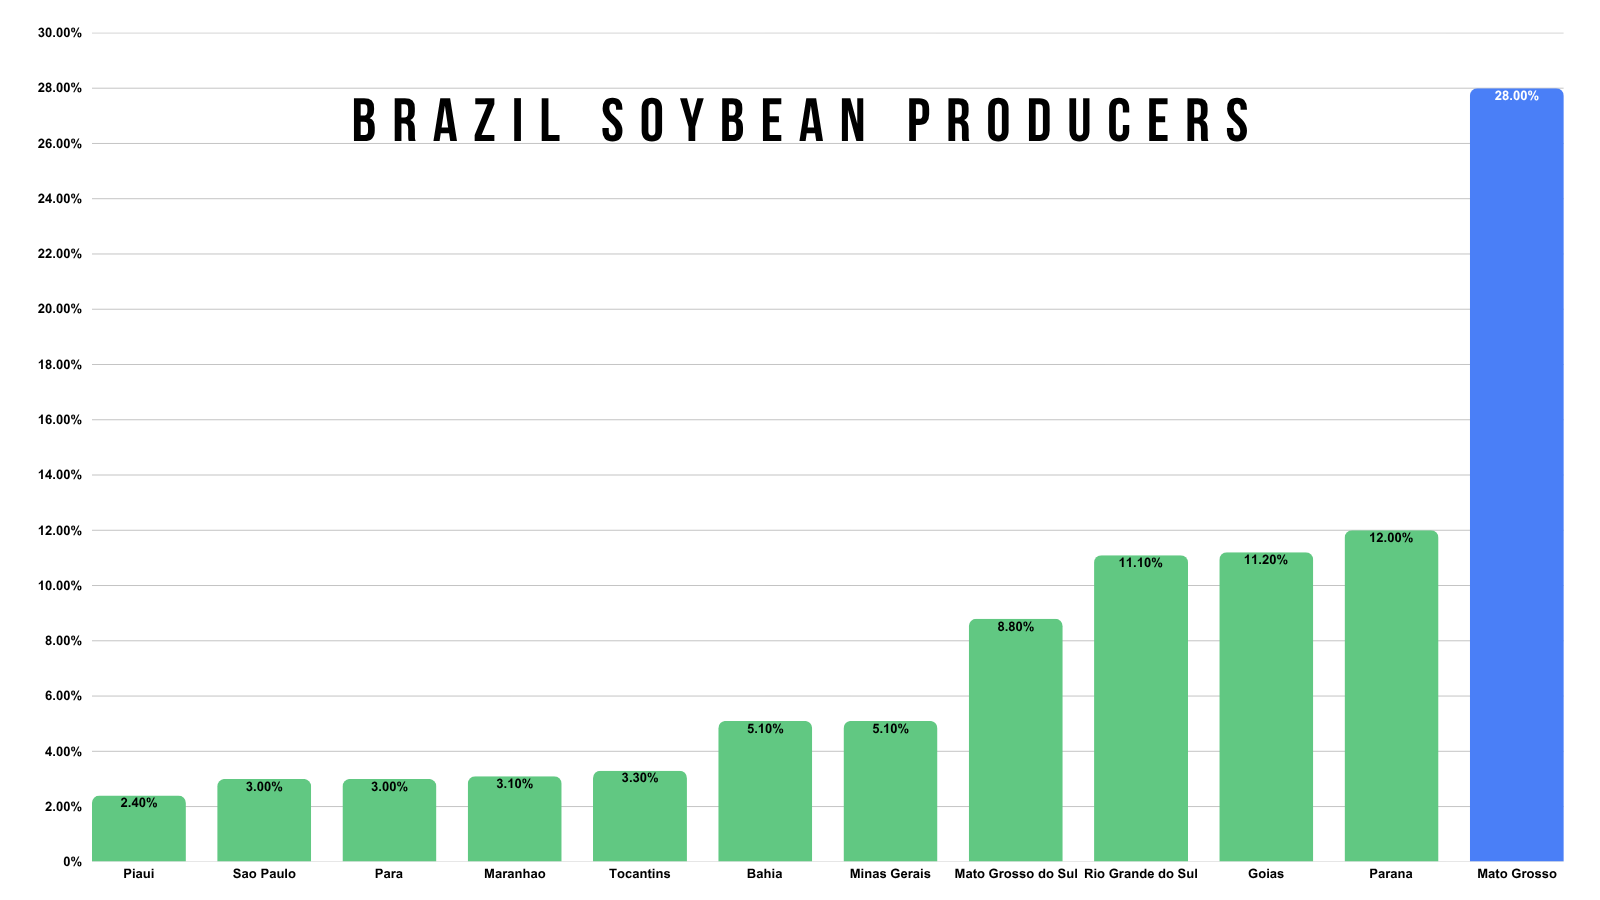
The two largest soybean growers in Brazil are Mato Grosso #1 and Paraná #2.
The last 30 days Mato Grosso has only received 60% of their normal rainfall.
Where as Parana has received over 200% of their normal rainfall.
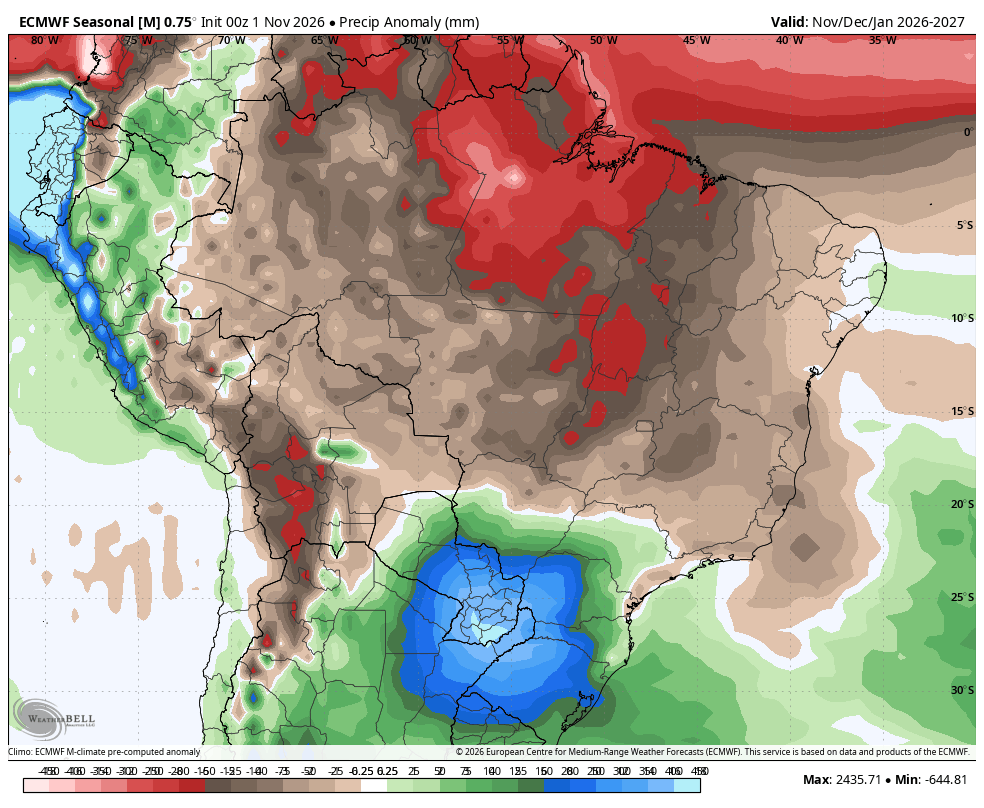
As we've talked about for months, a Super El Niño historically makes the north super dry and the south super wet.
Mato Grosso alone accounts for nearly 30% of all of Brazil's soybean production.
So if they run into some hiccups, it would be a big deal.
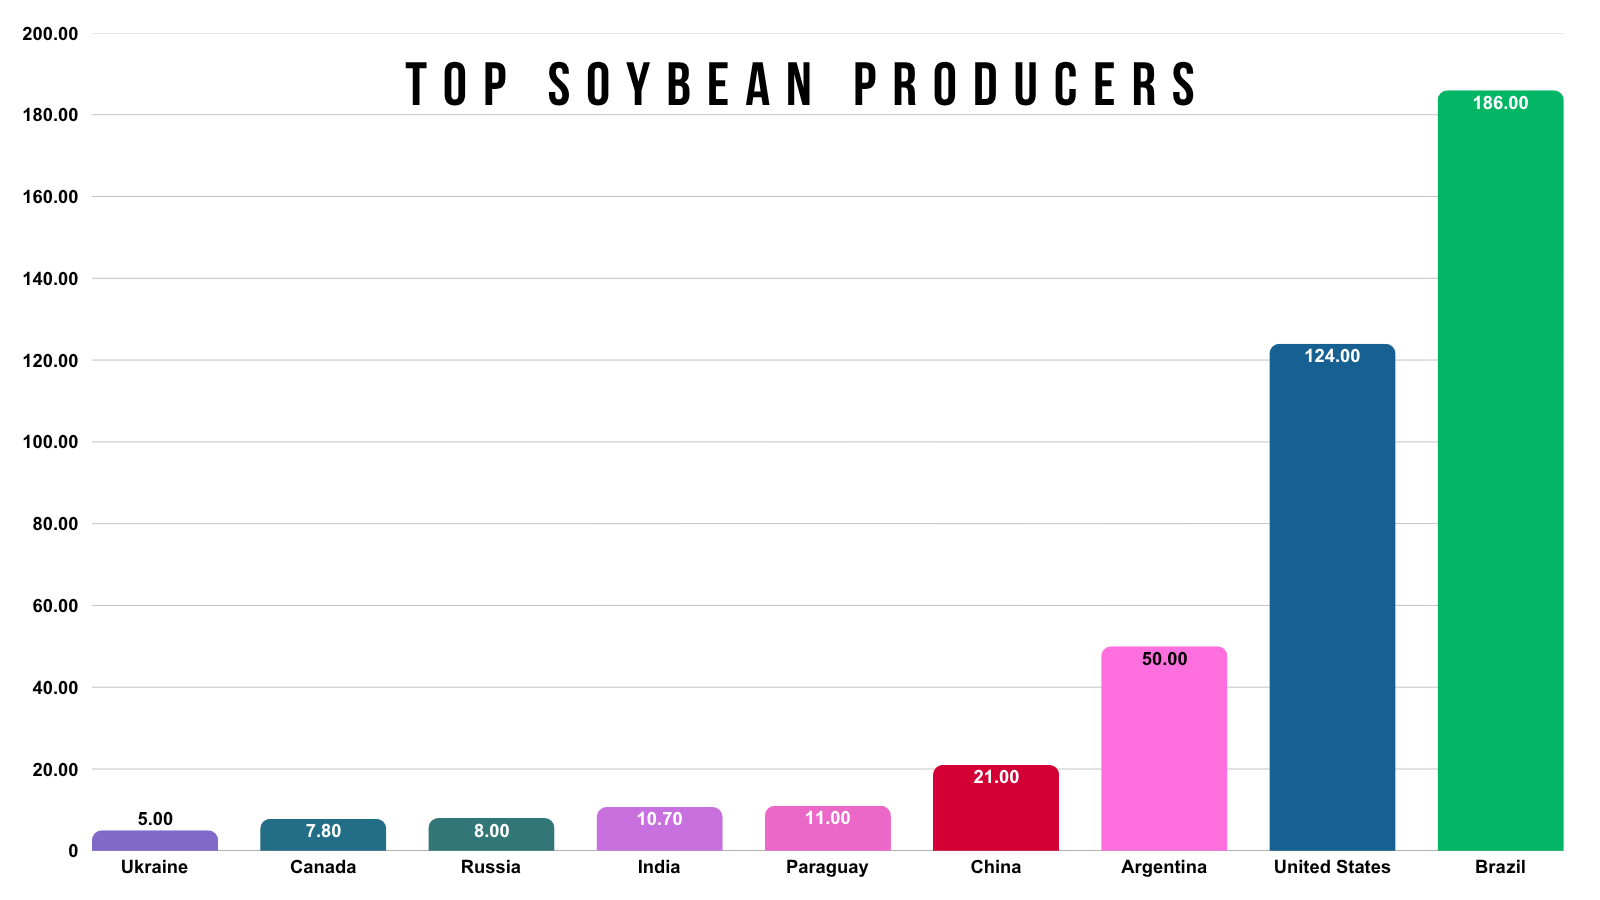
Not to mention that Brazil now accounts for dang near half of the entire global soybean production.
They sit at over 40% of global bean production.
Where as the US is now just over 25%.
Clearly, if things don’t go well it down there it's a problem for the world.
Again, it's slightly early for the market to start pricing in any sort of problems down in South America. As there are no concerns for now.
But if problems arise, it's going to be a big ticket item over the next 30 to 90 days. And it is absolutely still a possible wild card.
Here is the Nov-Dec-Jan outlook.
This also calls for super dry conditions up north, with super wet conditions down south.
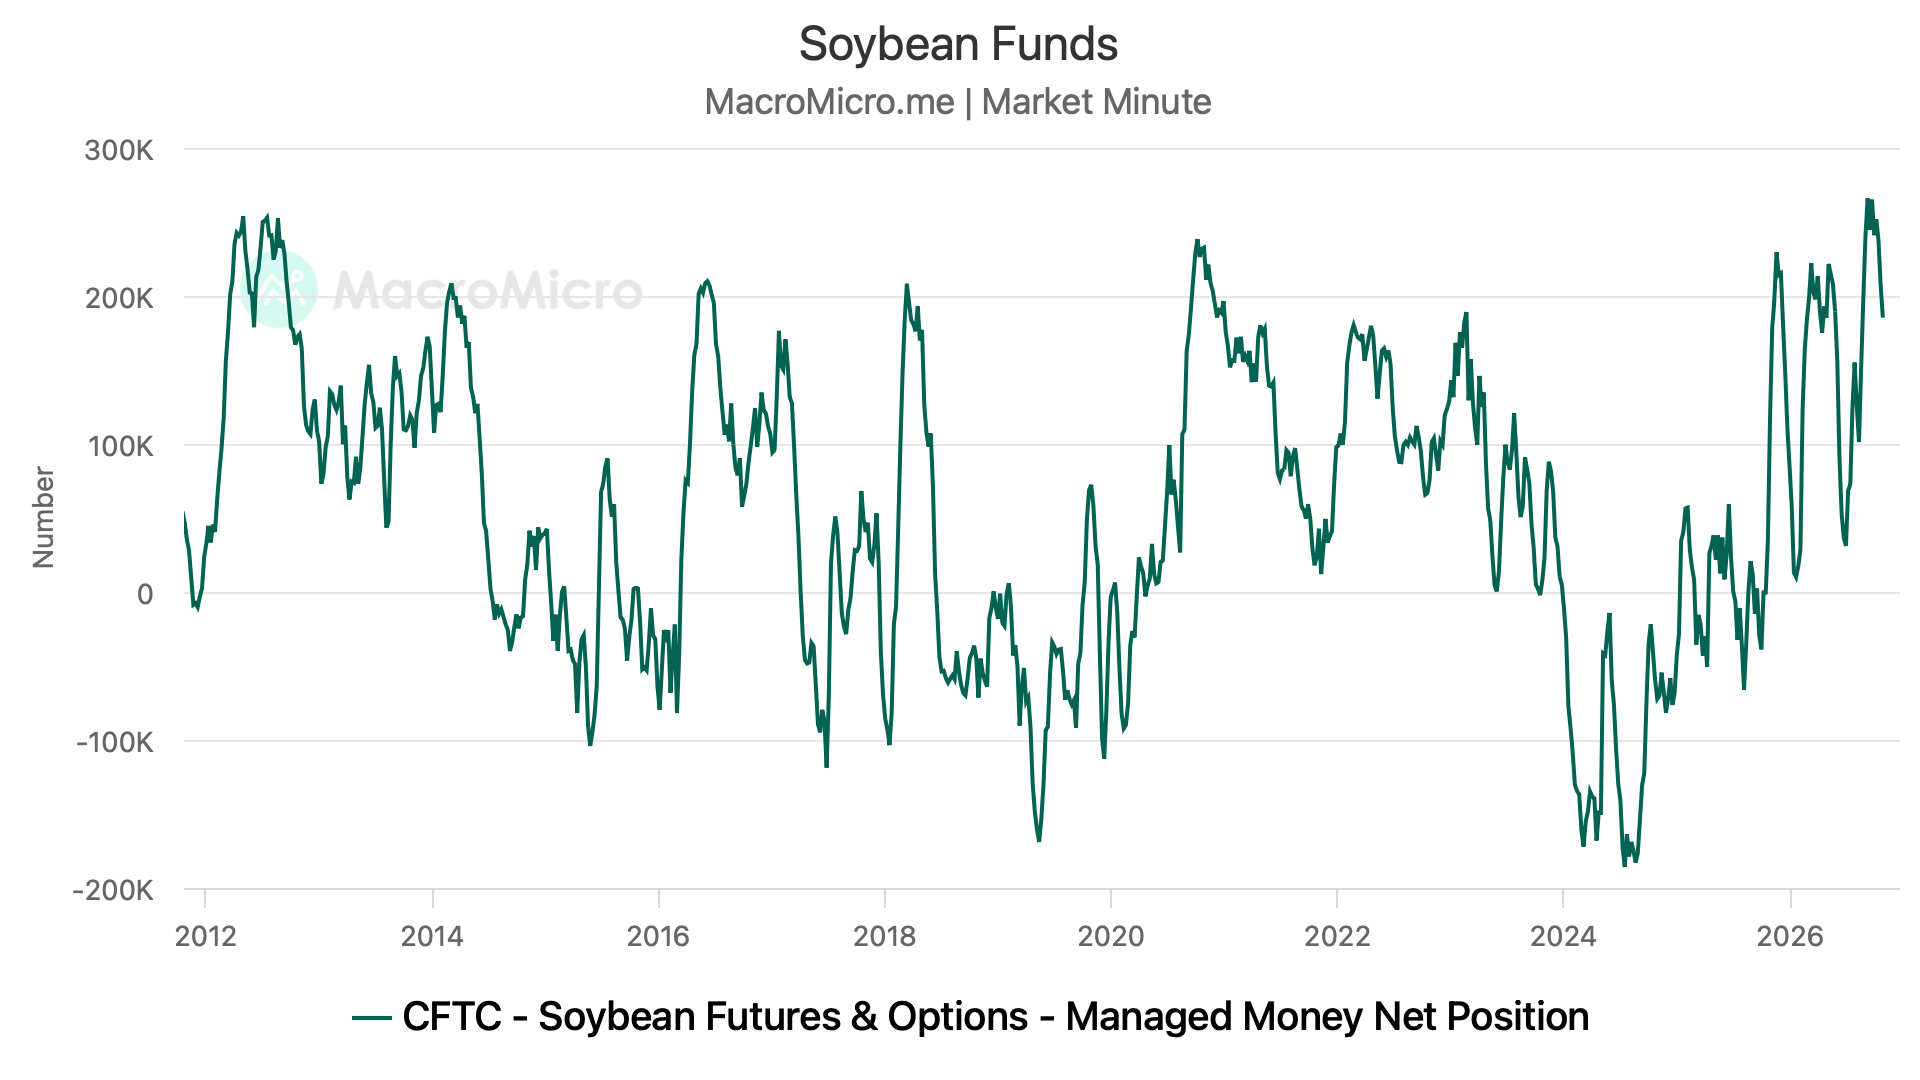
The funds are still heavily long soybeans despite shedding a lot of the length.
Yes, that leaves room for them to sell.
But I also don’t think they want to full on puke out of that short position right before Brazil's weather season.
I would think they'd at least stick around to see how things unfold down there.
If things get spicy, they'll add more. If no problems happen, they'll probably cut the position. But I don’t see them cutting it before seeing what happens first.
They are long for a reason and probably want to find out.
If you look, the funds are usually only actually full on short soybeans during a bear market. So that 2019 time frame and 2024.
Bottom Line:
The idea of a bigger crop is a valid concern, but the demand estimates are probably too low anyways. Meaning a slight bump in yield should be offset with more demand. The risk is we get a major bump or number closer to StoneX.
Brazil weather hasn’t mattered yet, but there it is absolutely still a wild card that could massively shake up the world bean situation. It's too early to make a bold assumption, but a very possible bullish wild card.
Like in corn, it does feel like we are finally entering levels where we feel undervalued. And long term I see beans with a pathway higher.
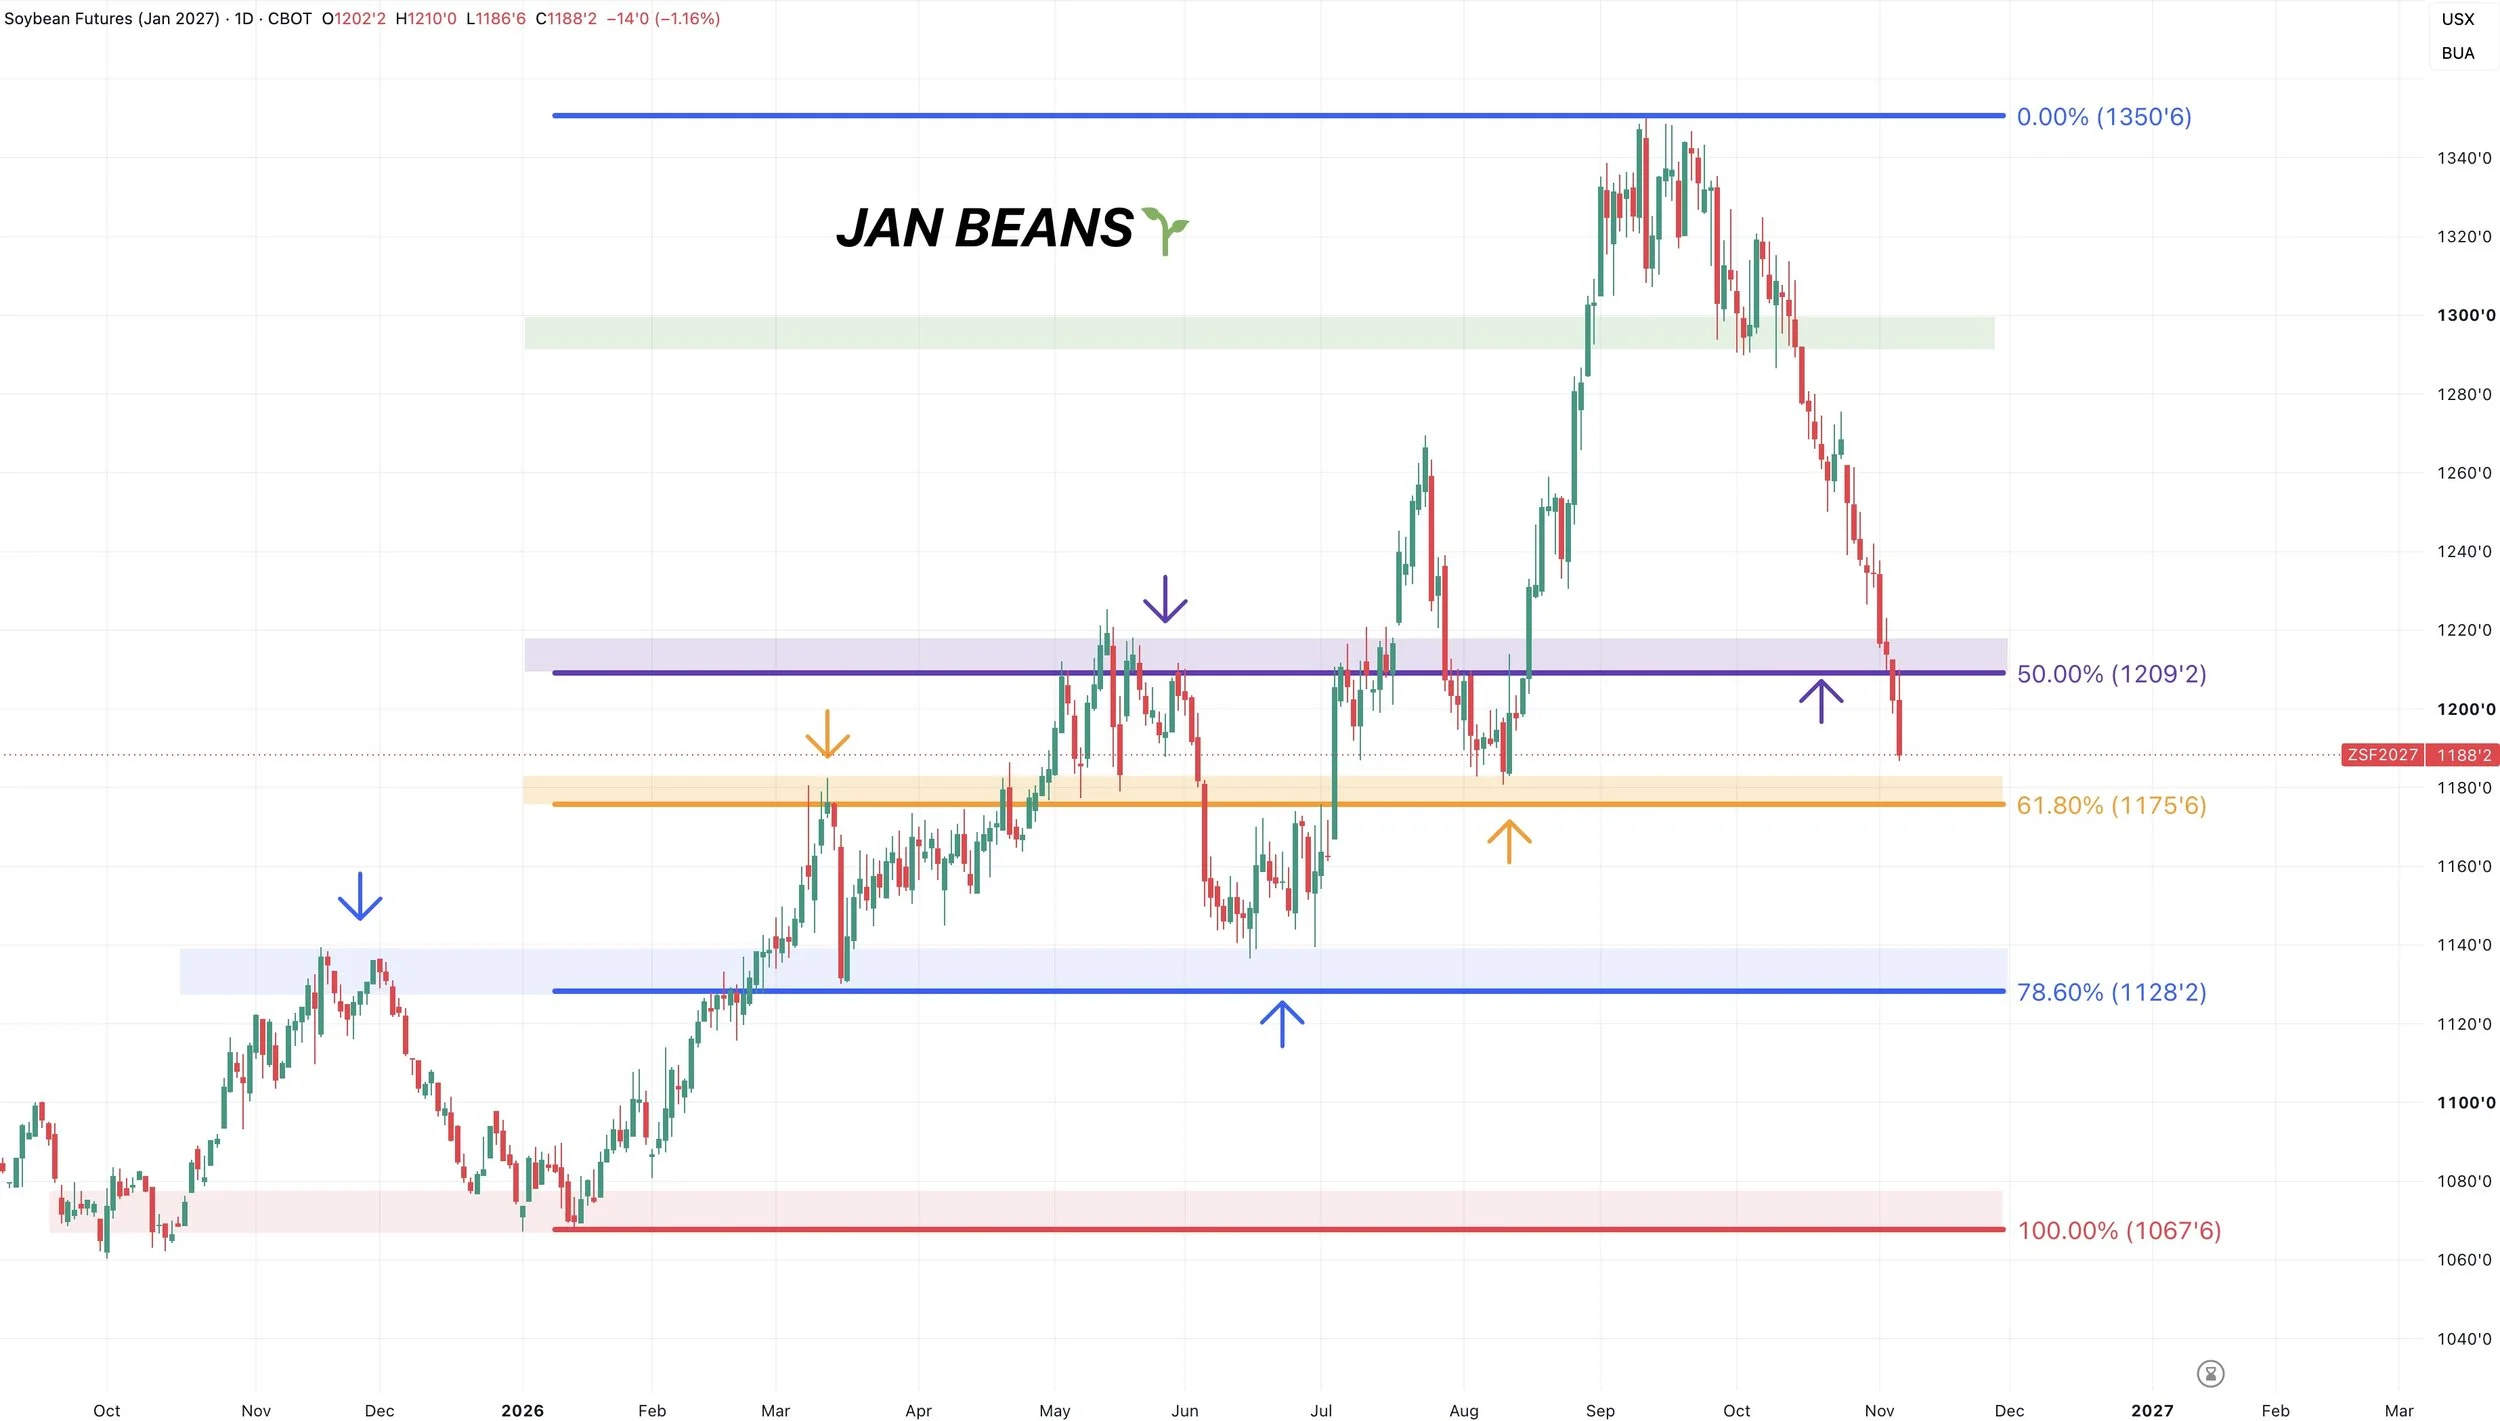
Jan Beans Chart:
We lost that key support yesterday. Which was disappointing to see. As we failed to hold the 50% retracement down to the yearly lows. That same level was the highs from May.
As a result we are quickly approaching the next point of interest.
It looks like we might be wanting to head towards that next level of support, which I said was a risk if we failed to hold that prior support.
The next support comes in around that $11.80 range. That's the August lows and March highs.
The 61.8% retracement also sits at $11.75.
We do not want to break below that level.
Dec Meal Chart:
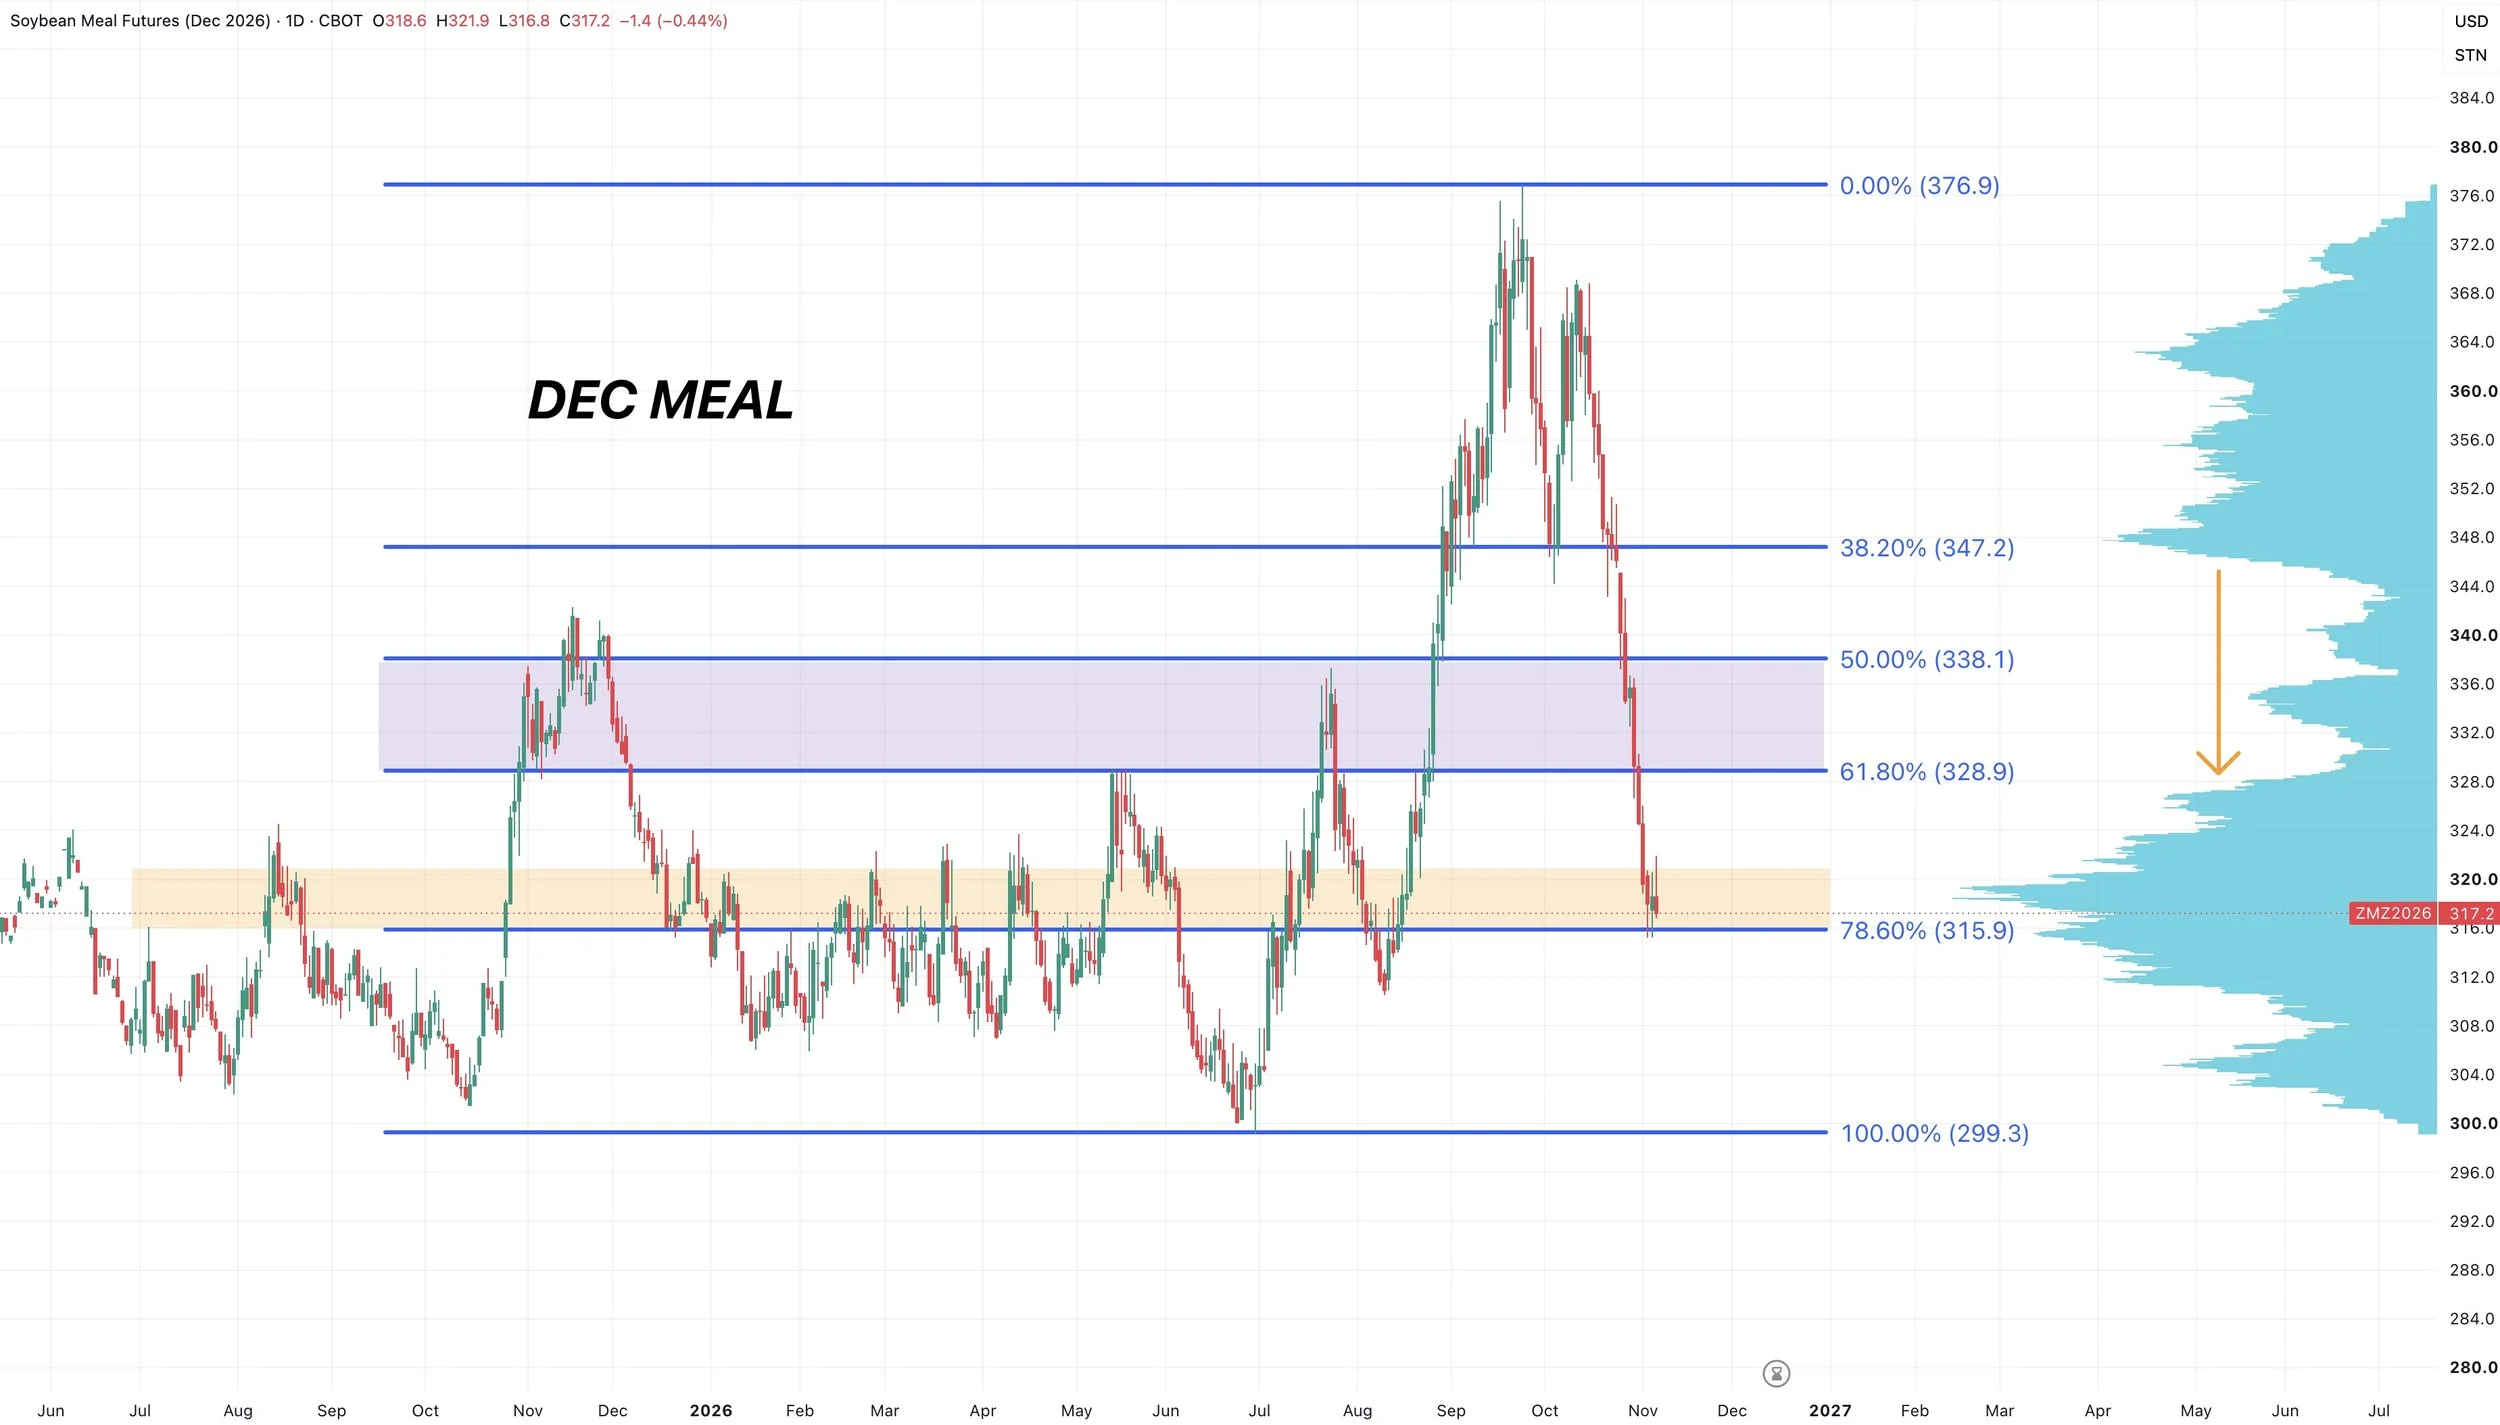
Meal broke below that golden zone from contract highs down to contract lows.
Now testing the next retracement and support level.
We are now at peak volume as well which could offer support.
Ideally we want to see us hold those recent lows.
Front Month Meal Chart:
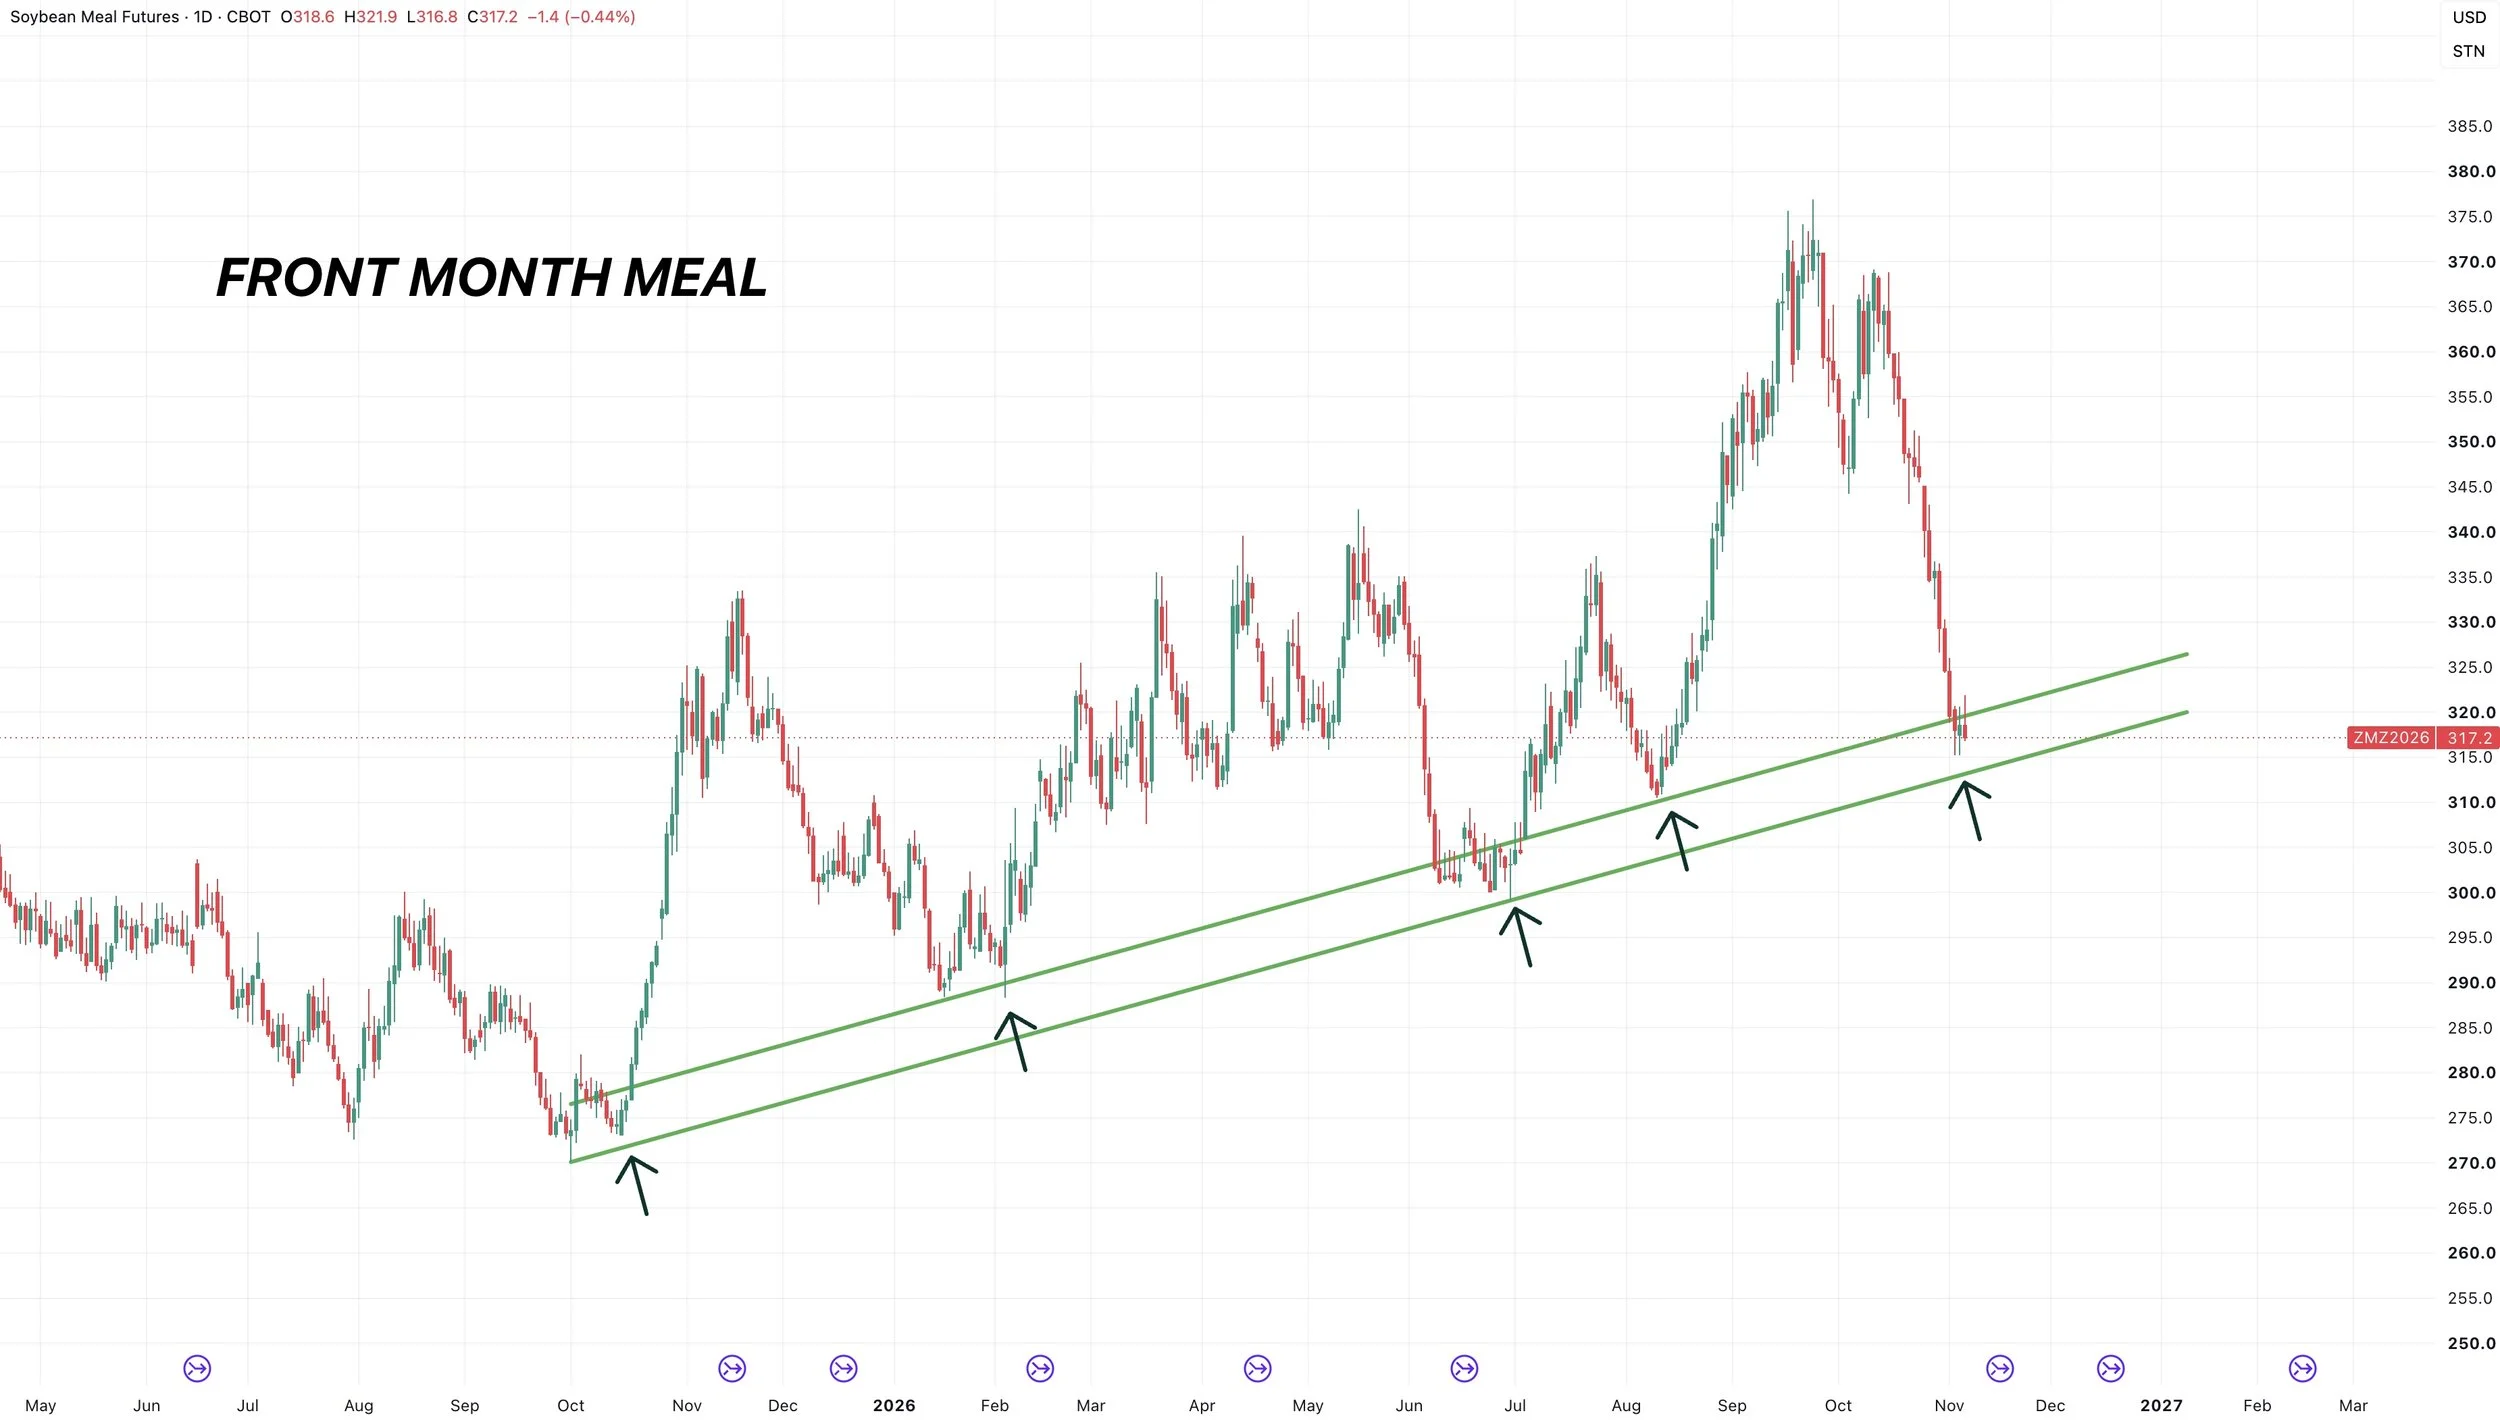
On the front month chart, we do have this simple upward channel support that has marked the bottom for this market all year long.
So we'd like to continue to hold the uptrend.
Bean Oil:
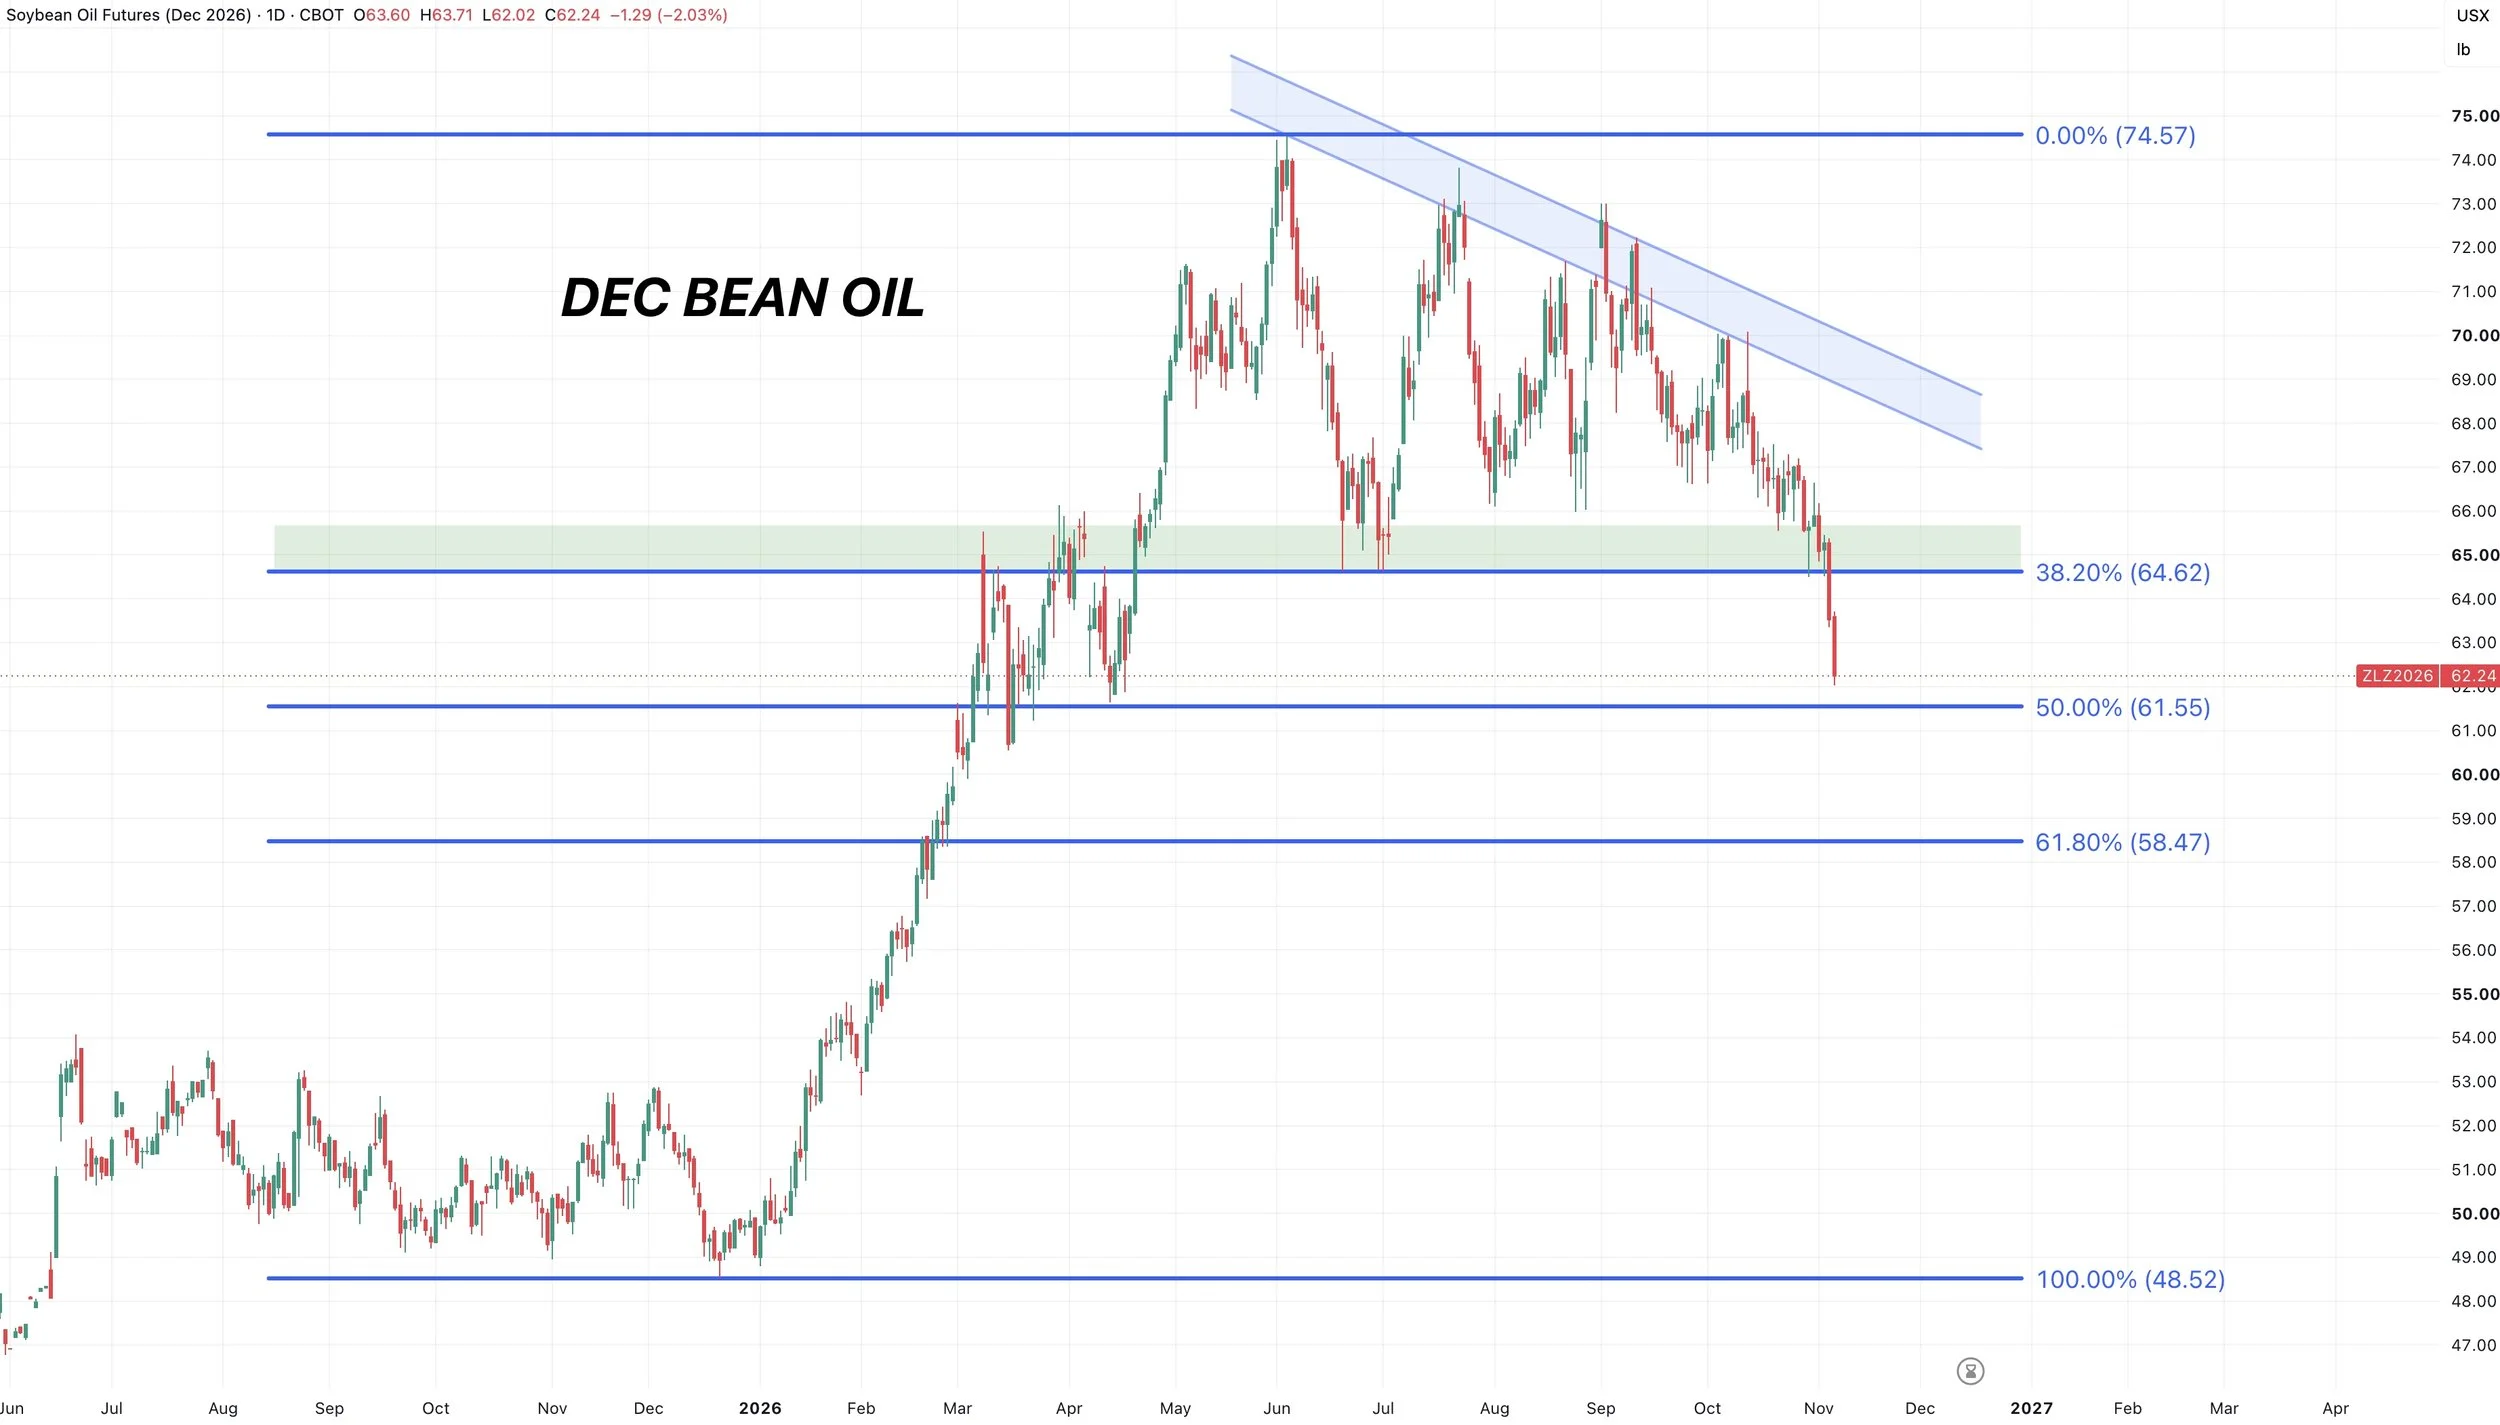
Bean oil puked below support which hasn’t helped soybeans.
We failed to hold that bottom of that range we had been holding all year.
We also failed to hold the first retracement, which was 38.2% of the entire rally this year.
We are now approaching the 50% level and that range from early spring.
Ideally we see bulls step in here or there is still plenty of downside risk.
Wheat
Fundamentals:
Nothing new or exciting in the wheat market as usual.
The focus in the USDA is going to be corn and soybeans, as there won’t be any production changes to the wheat market.
The market doesn’t care about the Black Sea.
Demand has sucked. Which is a big reason the market hasn’t cared about the Black Sea. Because the Black Sea export issues haven’t led to more demand for us anyways.
But we did just see exports print a marketing year high the other week, and China claims they are interested in US wheat. Maybe they are waiting for some tariff cuts before they start buying non-soybeans.
US wheat has not gotten a lot more competitive on the export market, which provides some optimism. As it would make sense for China to buy some wheat.
You've still got a record small US wheat crop.
Fundamentally, it does feel like wheat is starting to get undervalued down here, and I think wheat will once again have it's time to shine eventually.
Like in corn, implied volatility has tanked. Meaning options are cheap. So for those that want upside exposure, it makes more sense to own options now than it did two months ago.
Dec KC Chart:
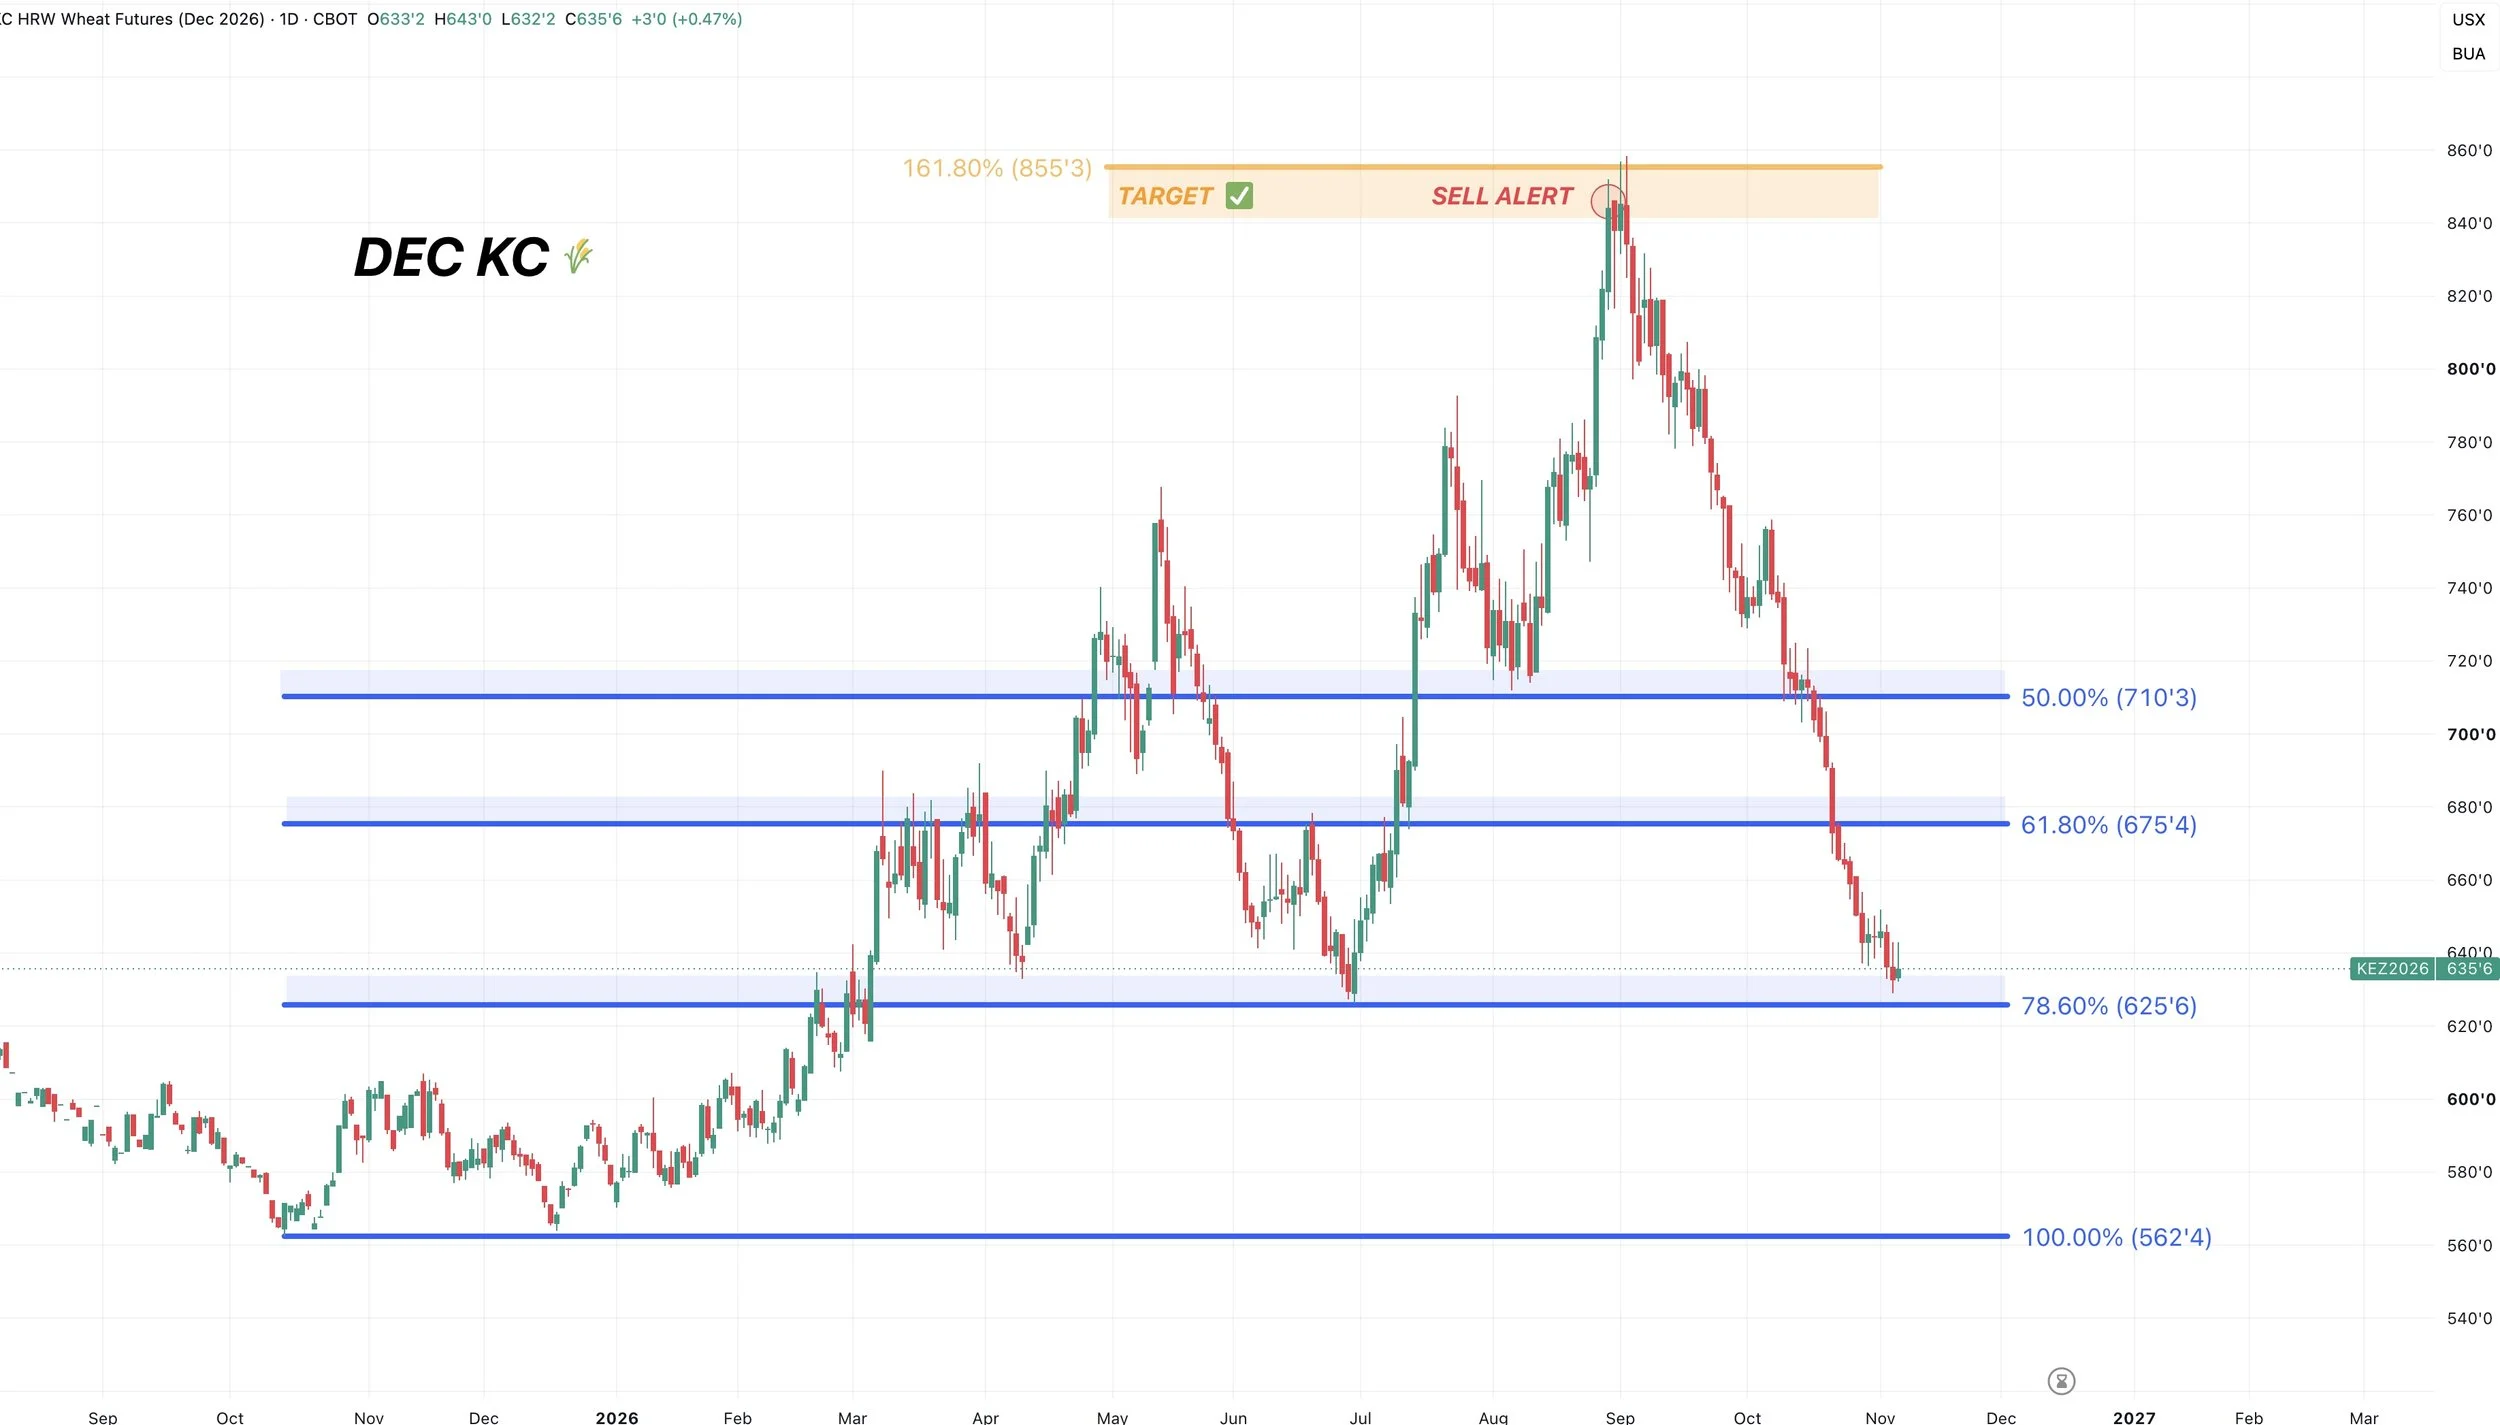
Pretty sideways action for the last several days across the wheat market.
We still have a very simple outlook here.
You are sitting at your last support between you and contract lows.
This is the last retracement from contract highs to contract lows. As we've given back 78.6% of the entire rally.
This is also those June lows.
Bulls do not want to see us break below this level.
RSI & MACD:
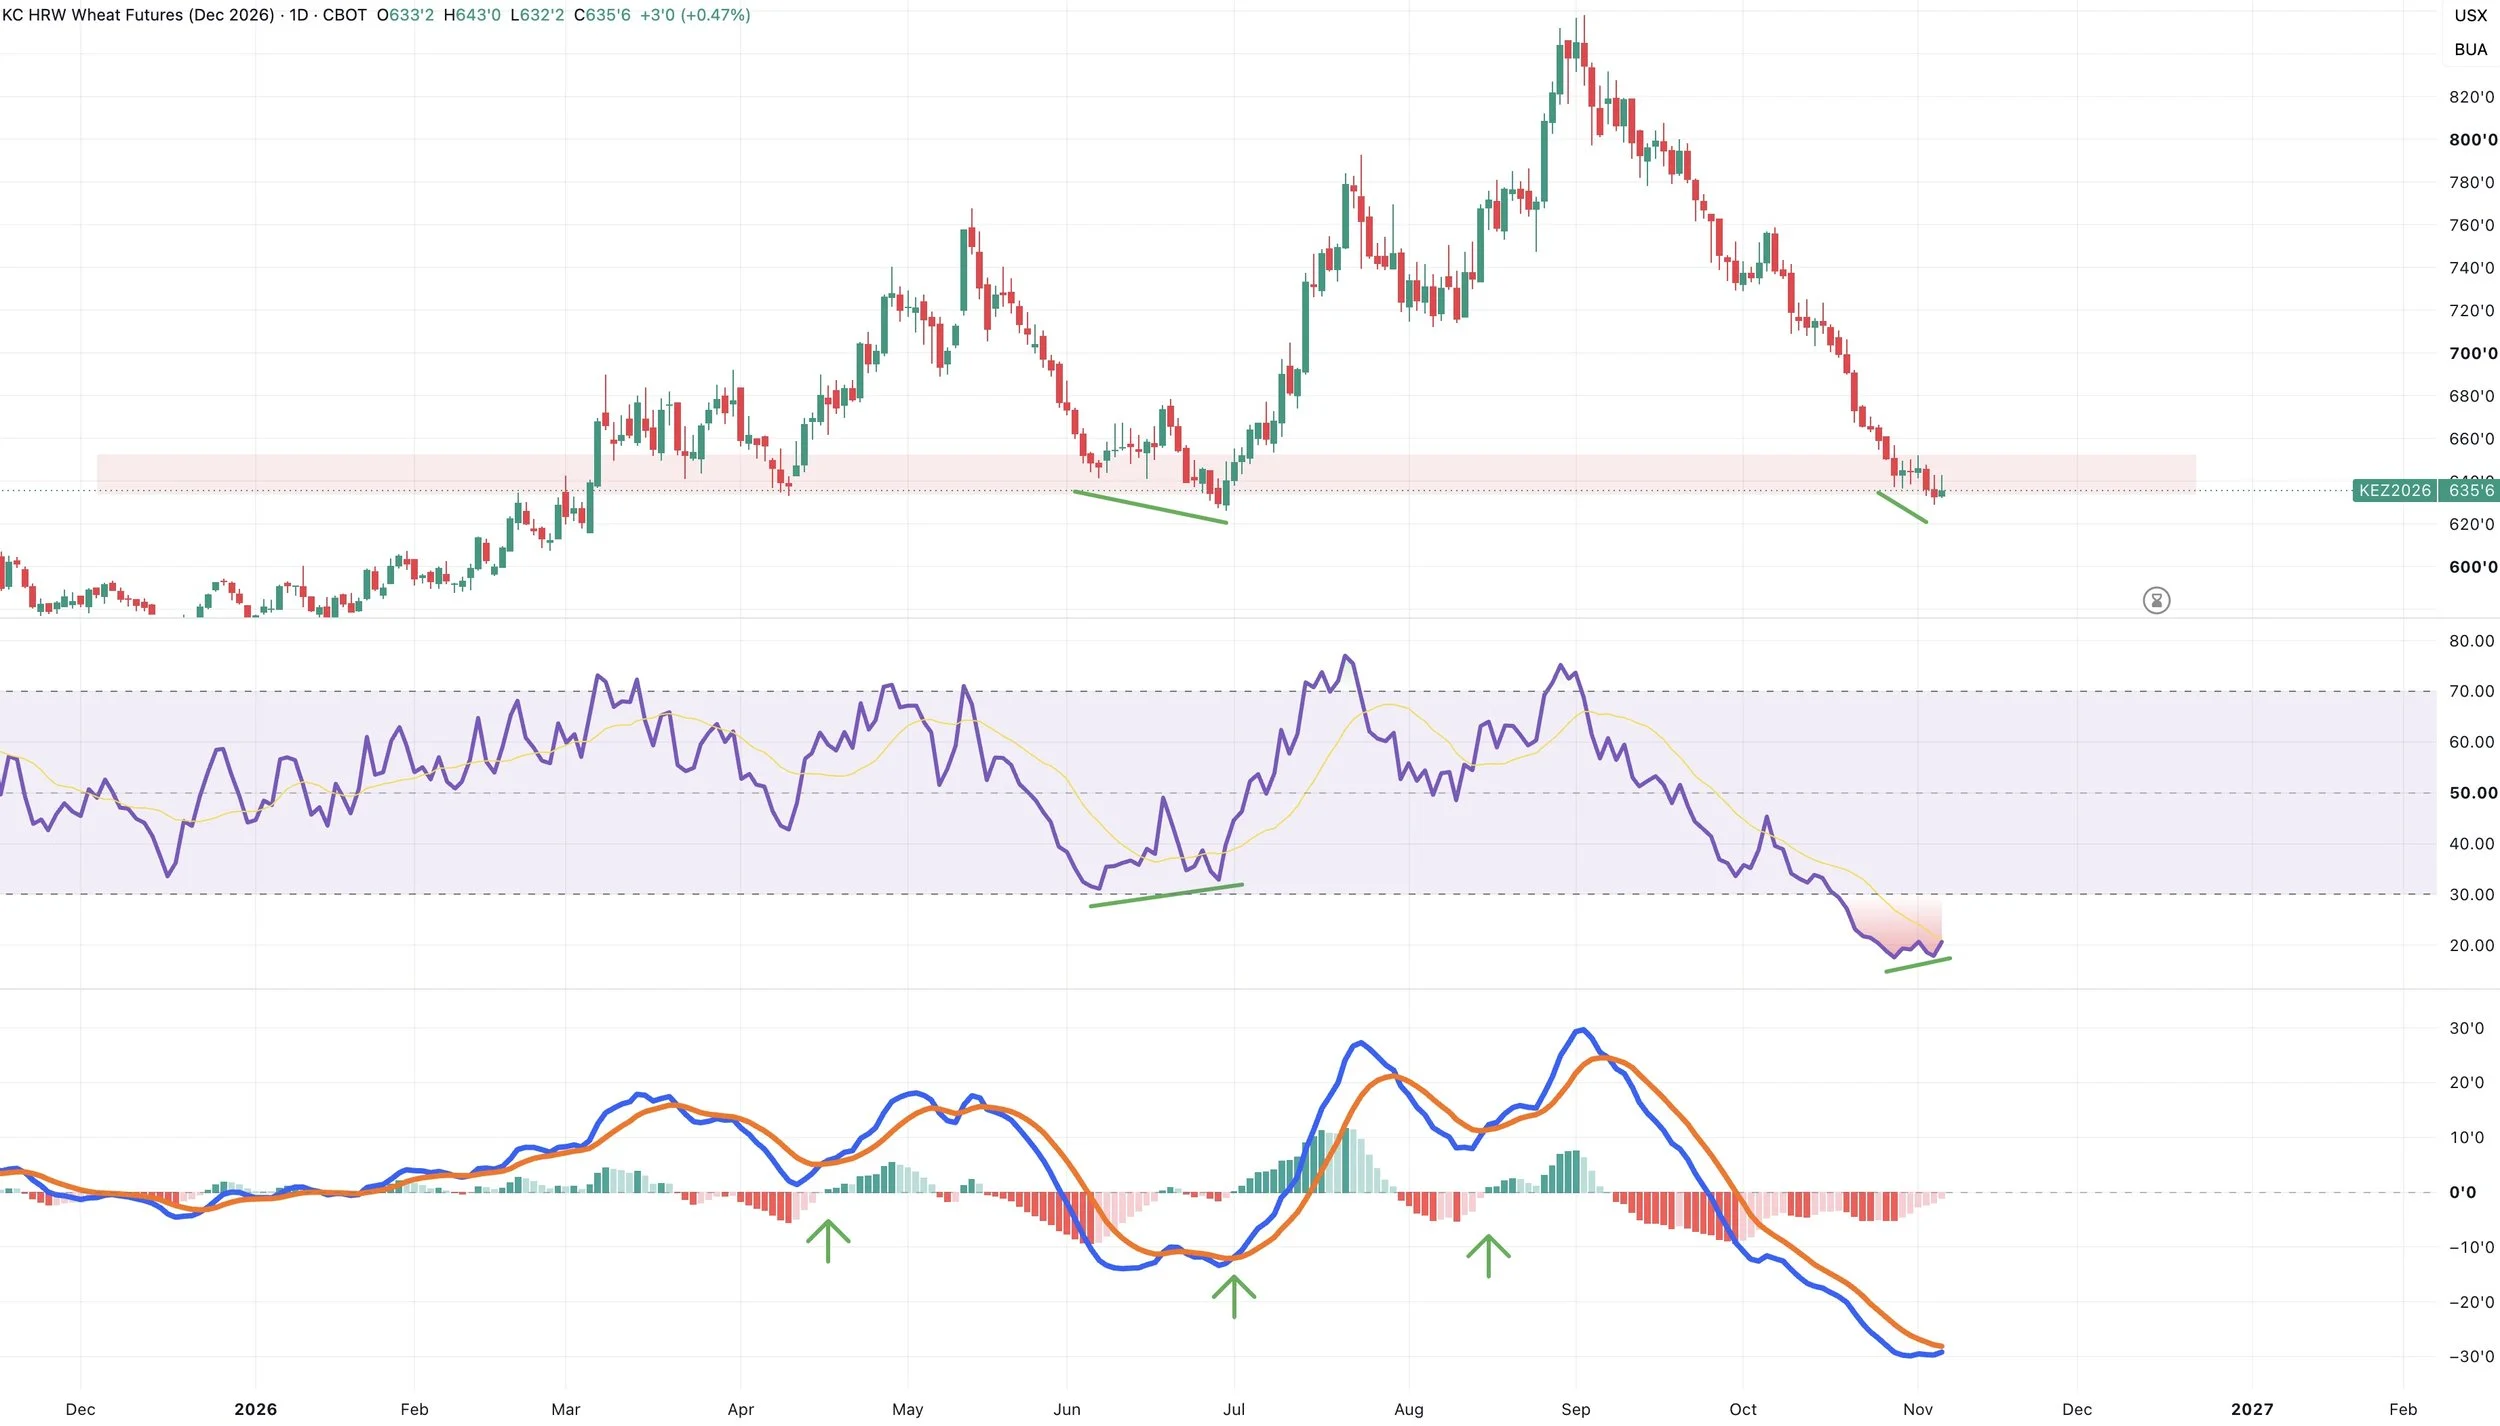
On the indicators, we are actually seeing some "potentially" positive things just like in the corn market.
We have some slight bullish divergence on the RSI, but if the RSI prints a new low it becomes invalid.
The last time we had bullish divergence was the June lows. So something to note if we continue to see the RSI make a higher low.
At the same time, we have the MACD very close to crossing bullish.
The last time it crossed higher was that $1.00 rally back in August.
The time before that was the June lows.
So if it crosses bullish again, it would be a positive sign.
9-Day MA:
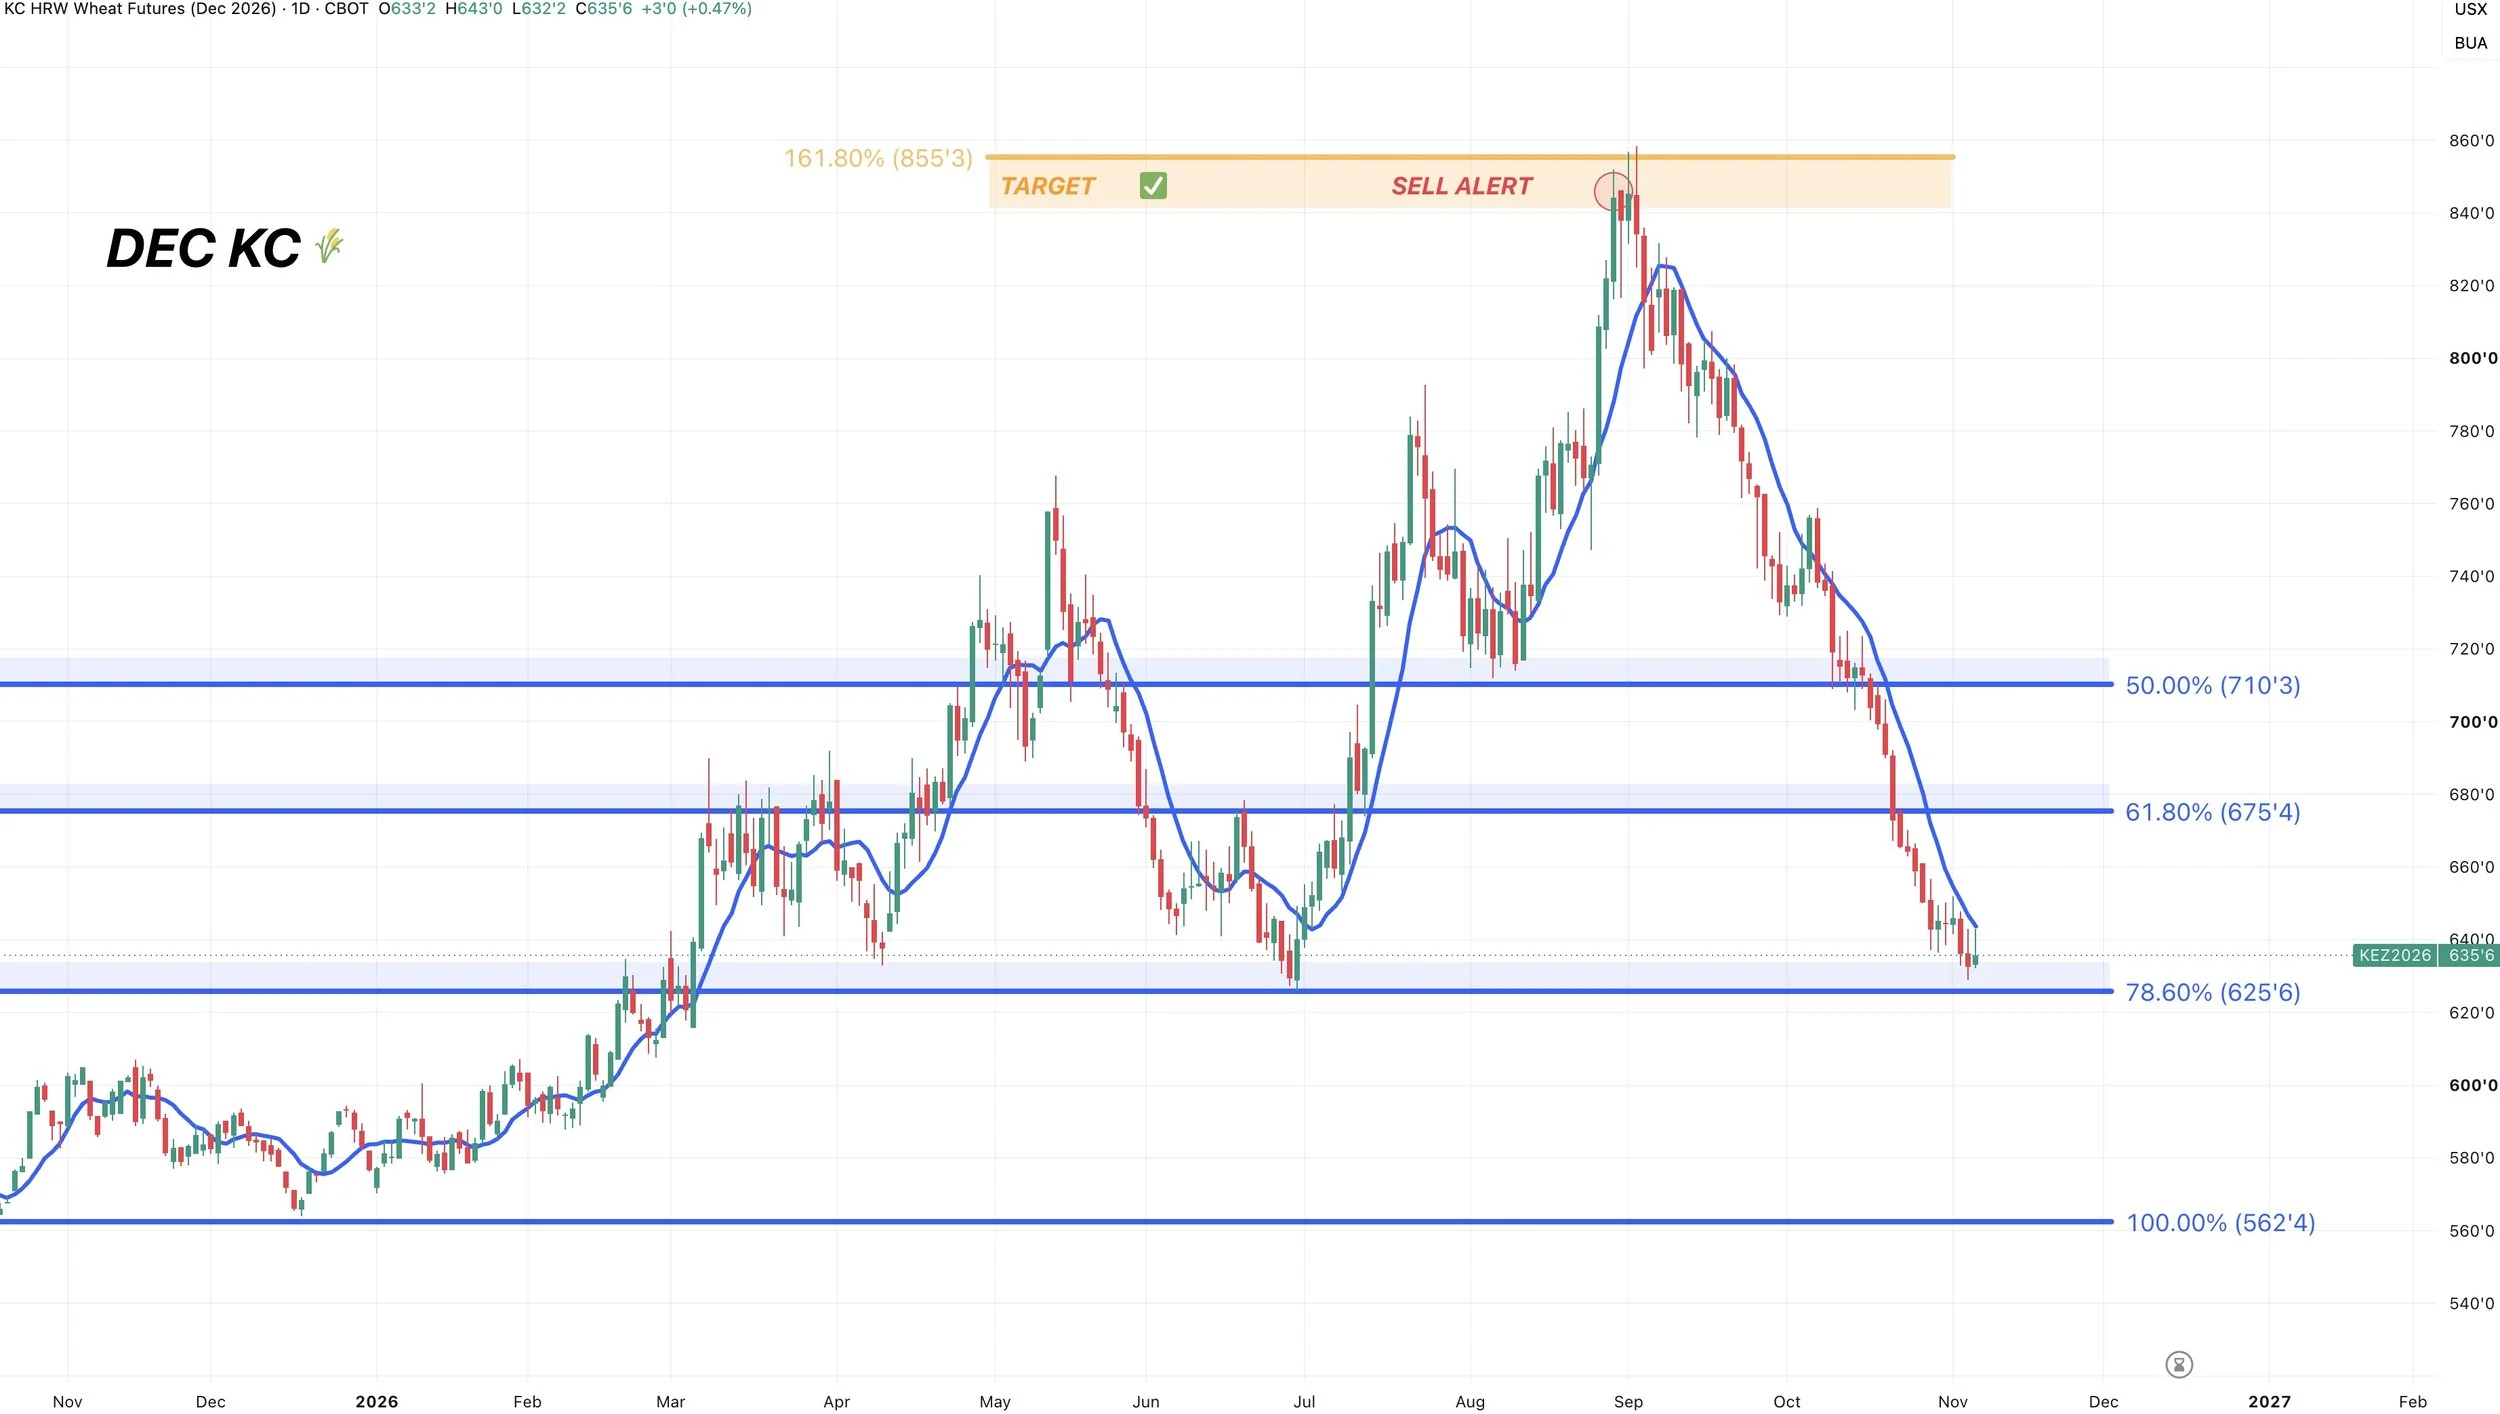
Like in corn, the 9-day MA will be another thing to keep our eyes on.
If you notice, on most rallies we stay above it.
On most sell offs, we stay below it.
Since the highs, we've only closed above it once.
Meaning we have closed below it the last 42 of 43 sessions.
So if you start to get some closes above, it would be one potential sign of some relief.
Dec Chicago Wheat Chart:
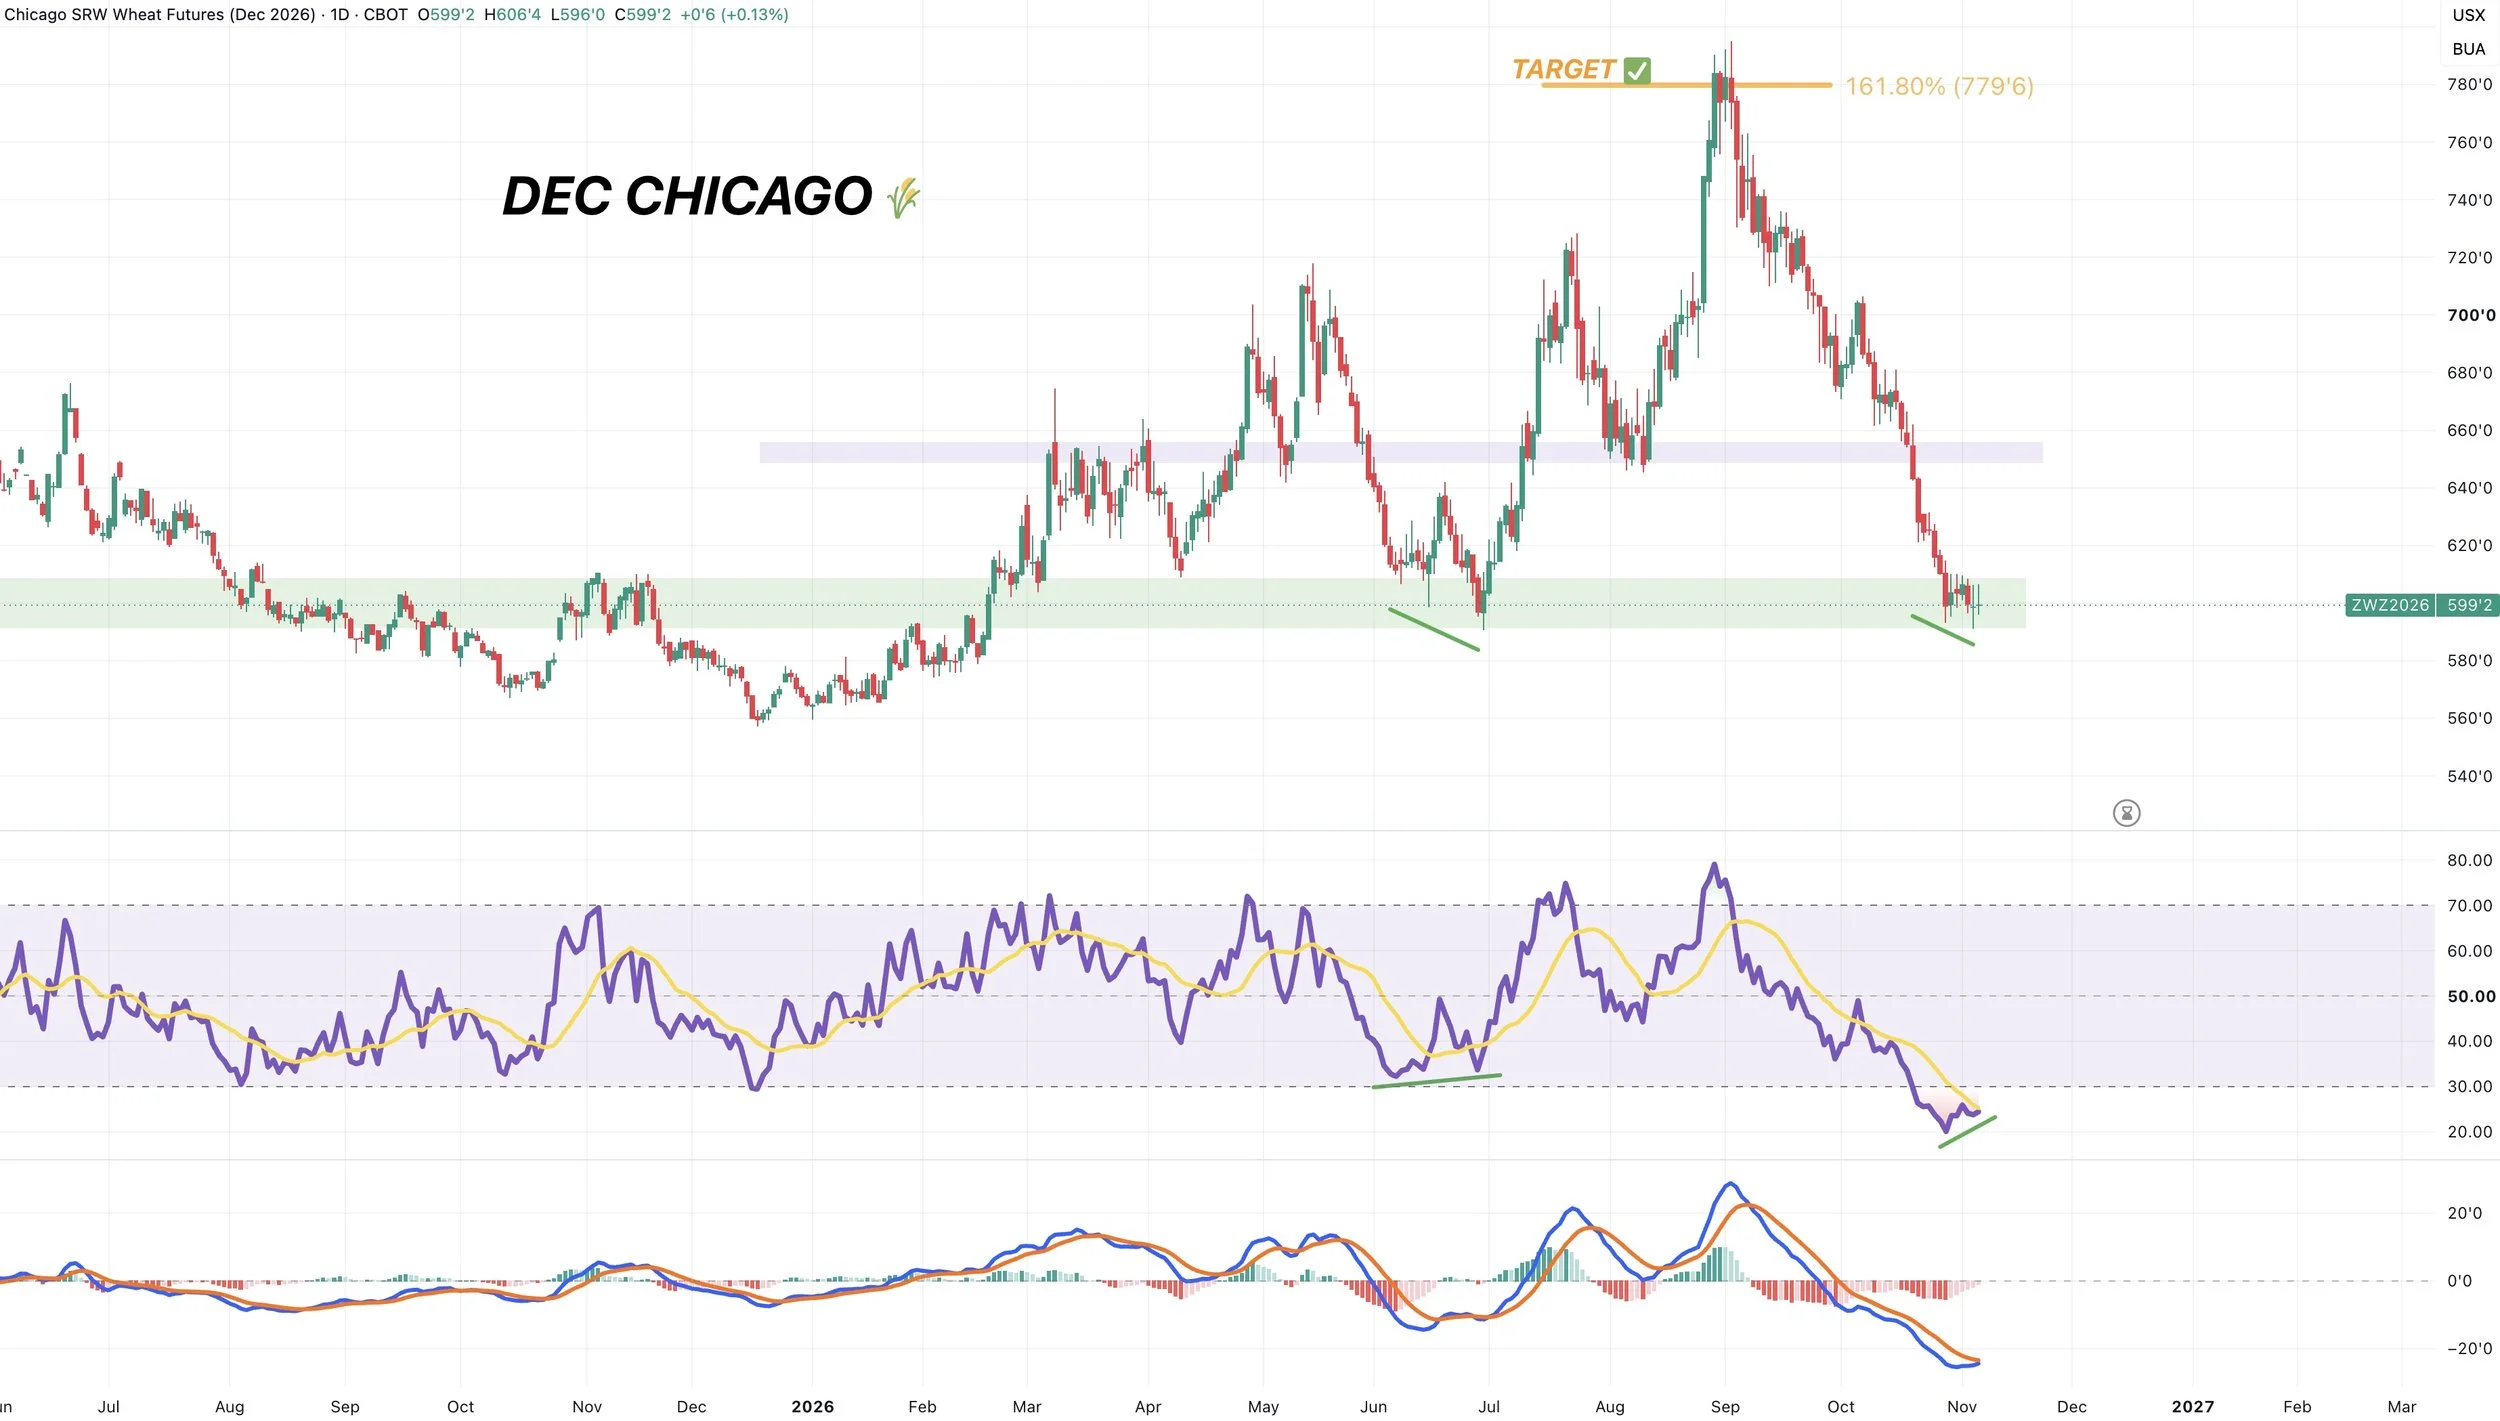
Also clinging onto the last support before contract lows.
With the summer lows and highs from last fall.
Bulls do not want to lose this level. As that would make things even uglier.
Like in KC, the indicators are potentially starting to show signs of life.
We have more clear bullish divergence on the RSI here. With the MACD also looking like it wants to cross bullish, although it has not yet.
2-Month Pivots:
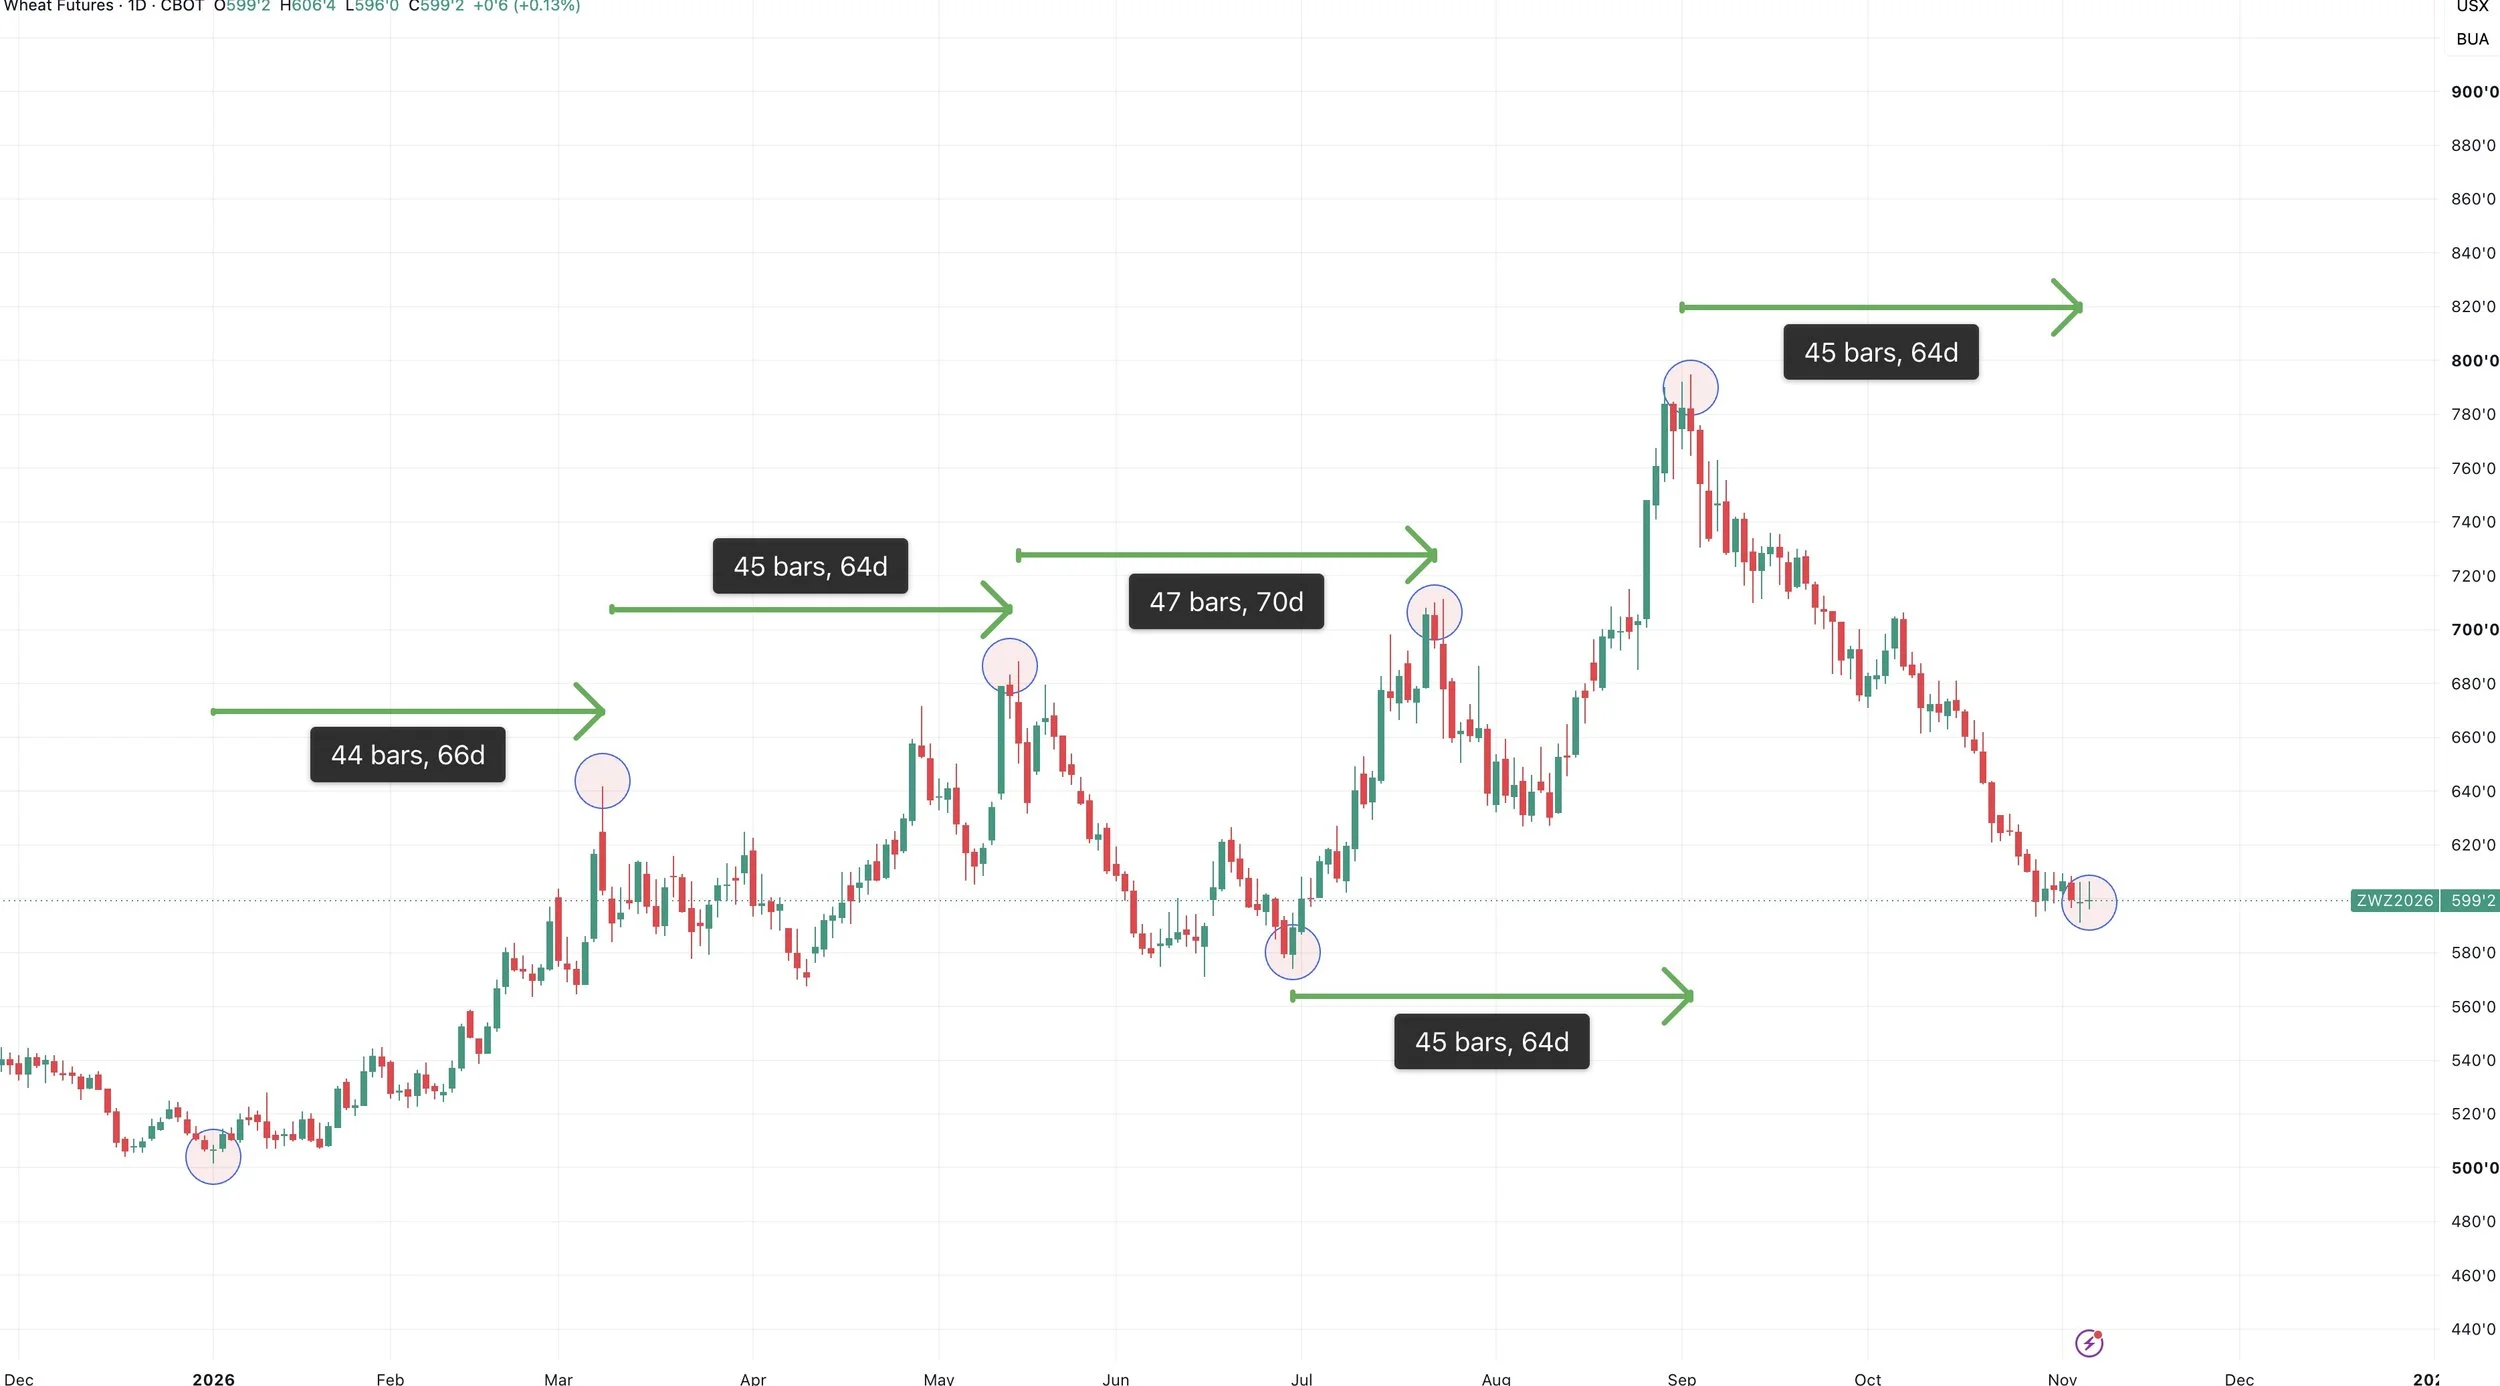
I've been talking about this the last week or two.
Roughly every 45 trading days (or 2 months) there has been a pivot in the wheat market.
This could mean absolutely nothing and be a complete coincidence.
But the chart is starting to show some "potential" signs of life right at the start of where the next pivot would be.
Cattle
Screwworm:
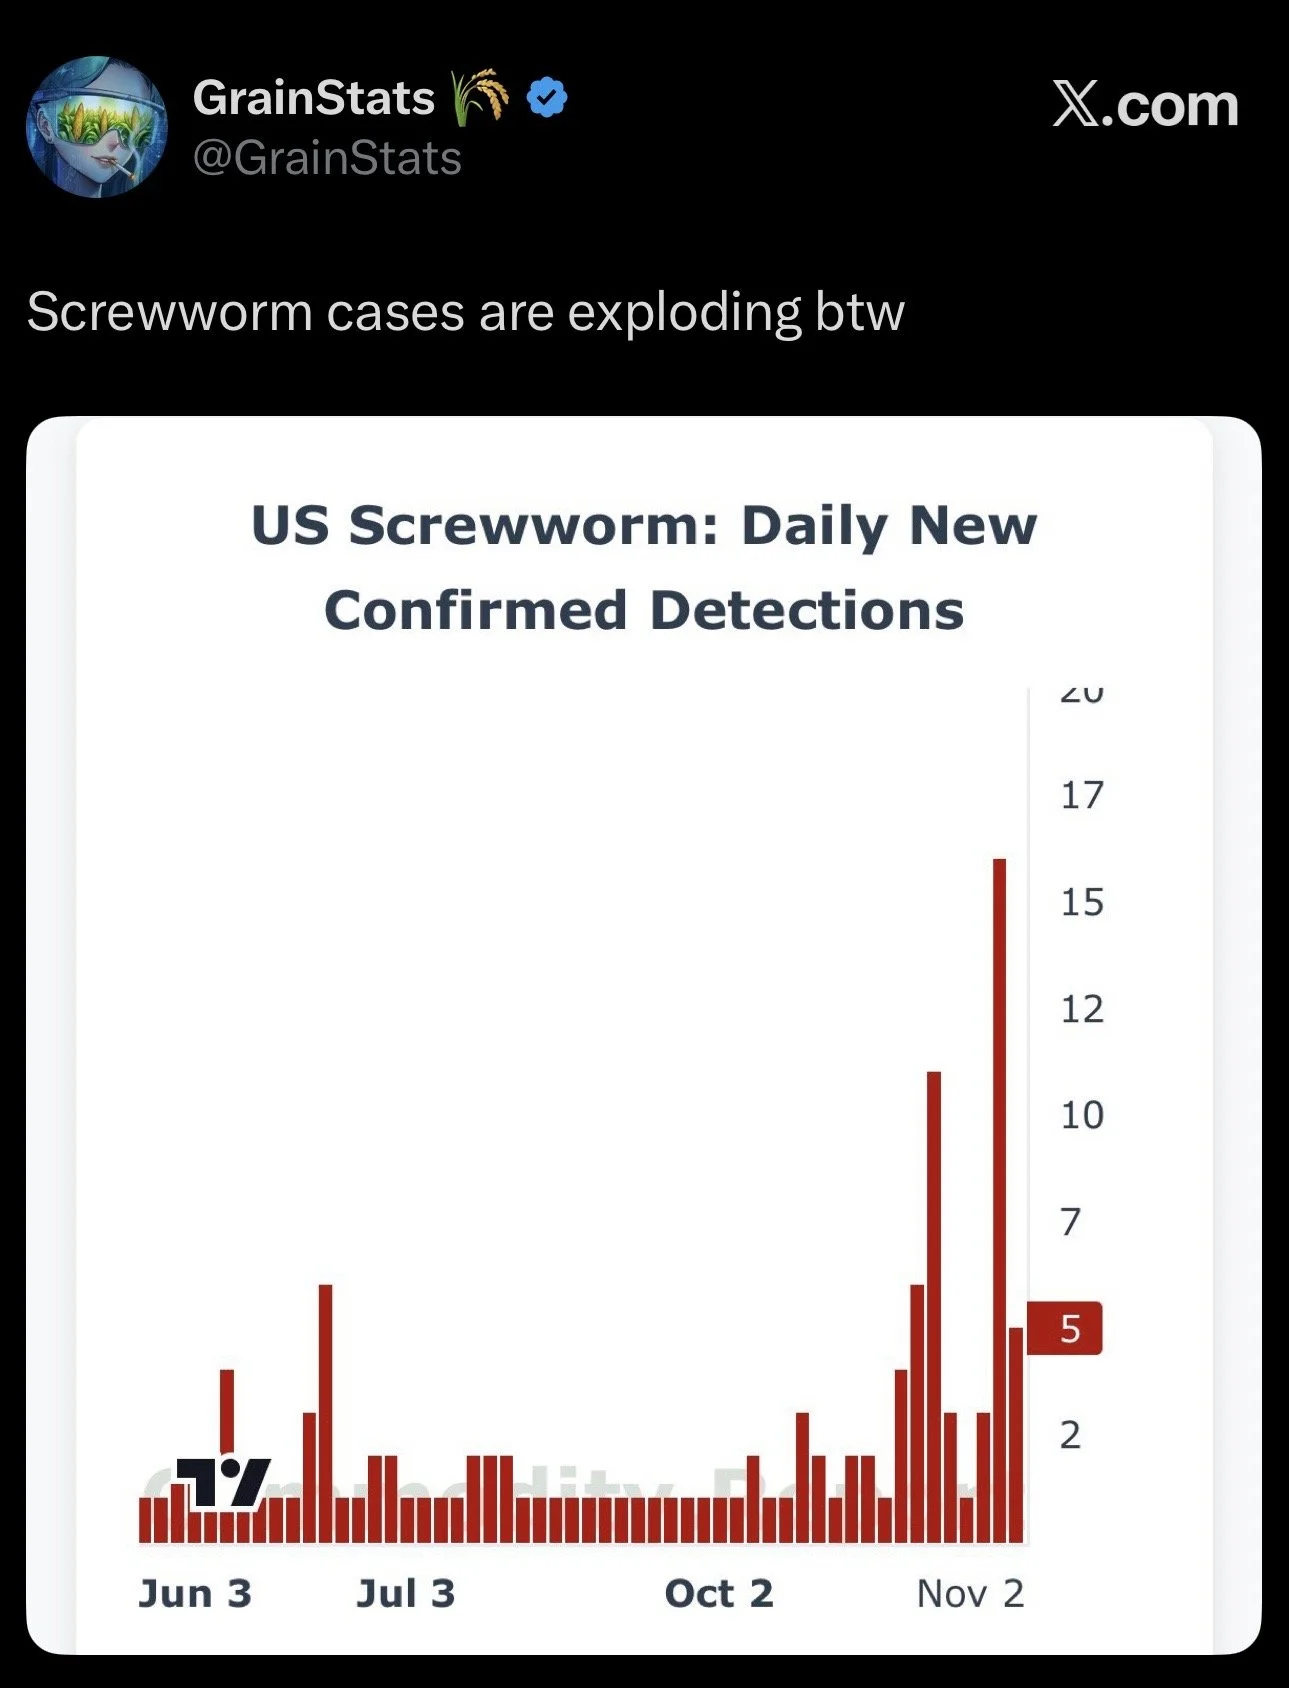
I did want to point out that screwworm cases have been picking up heavily as of recently.
We had that bullish COF report a week or two ago, and that report ended up marking the highs.
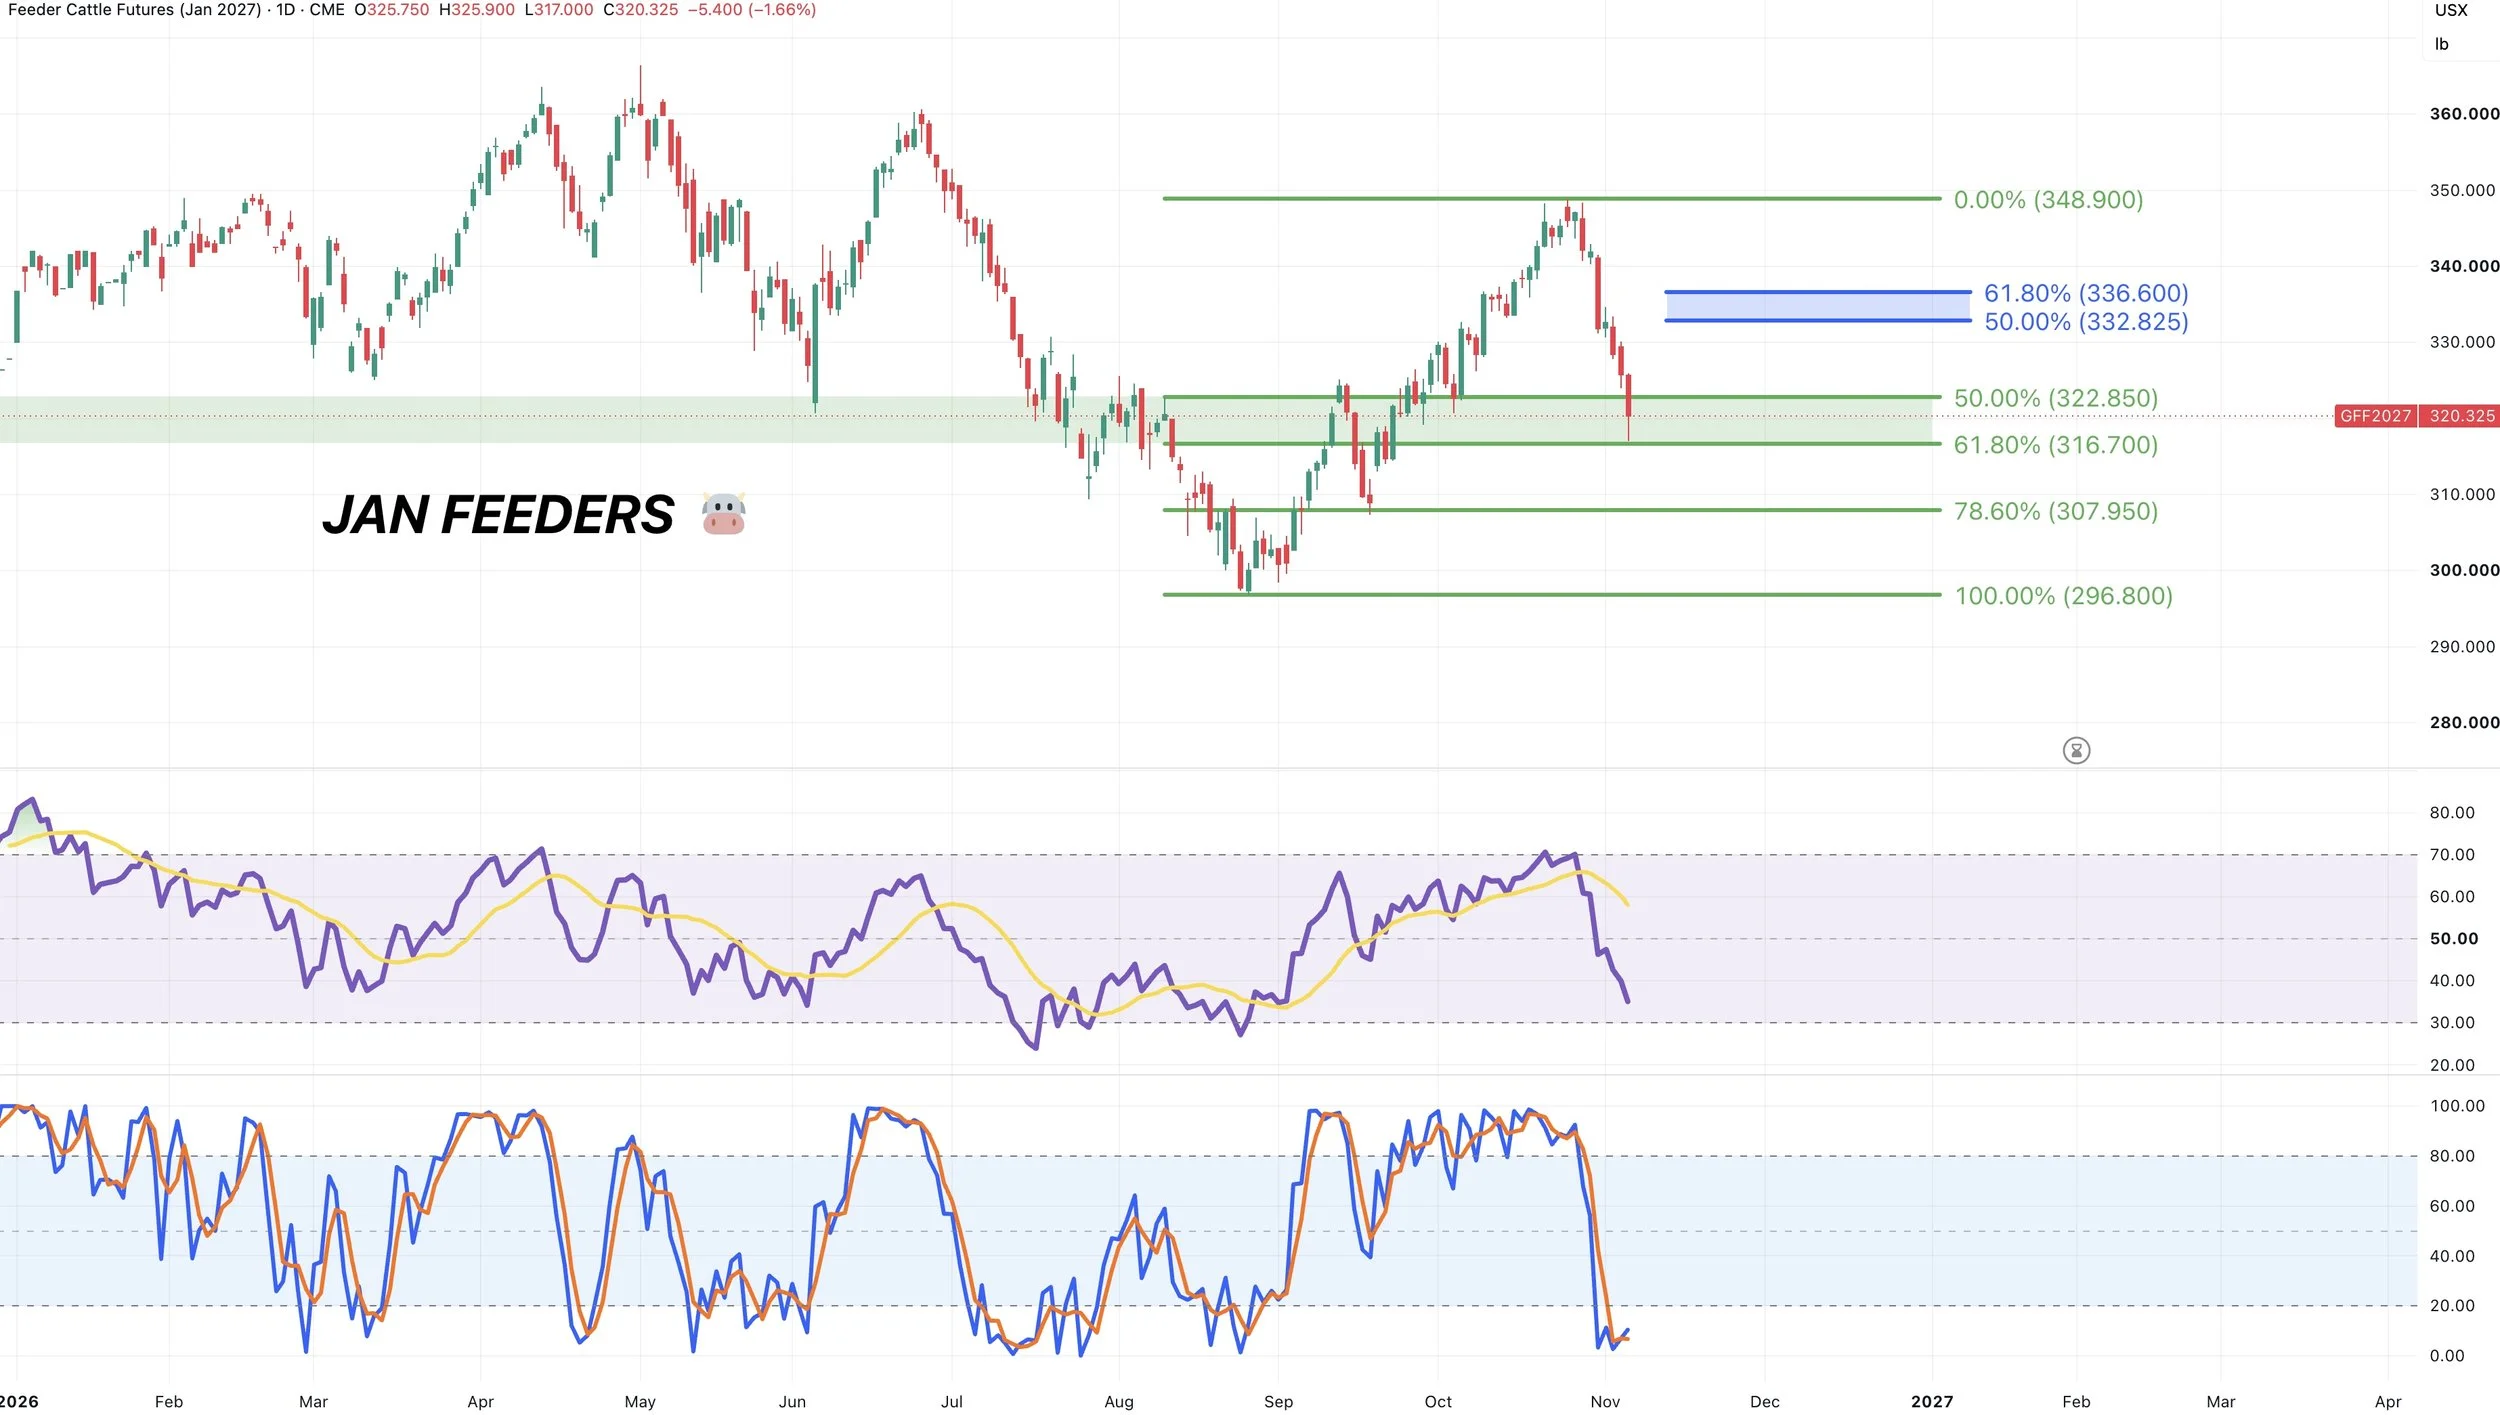
Jan Feeders:
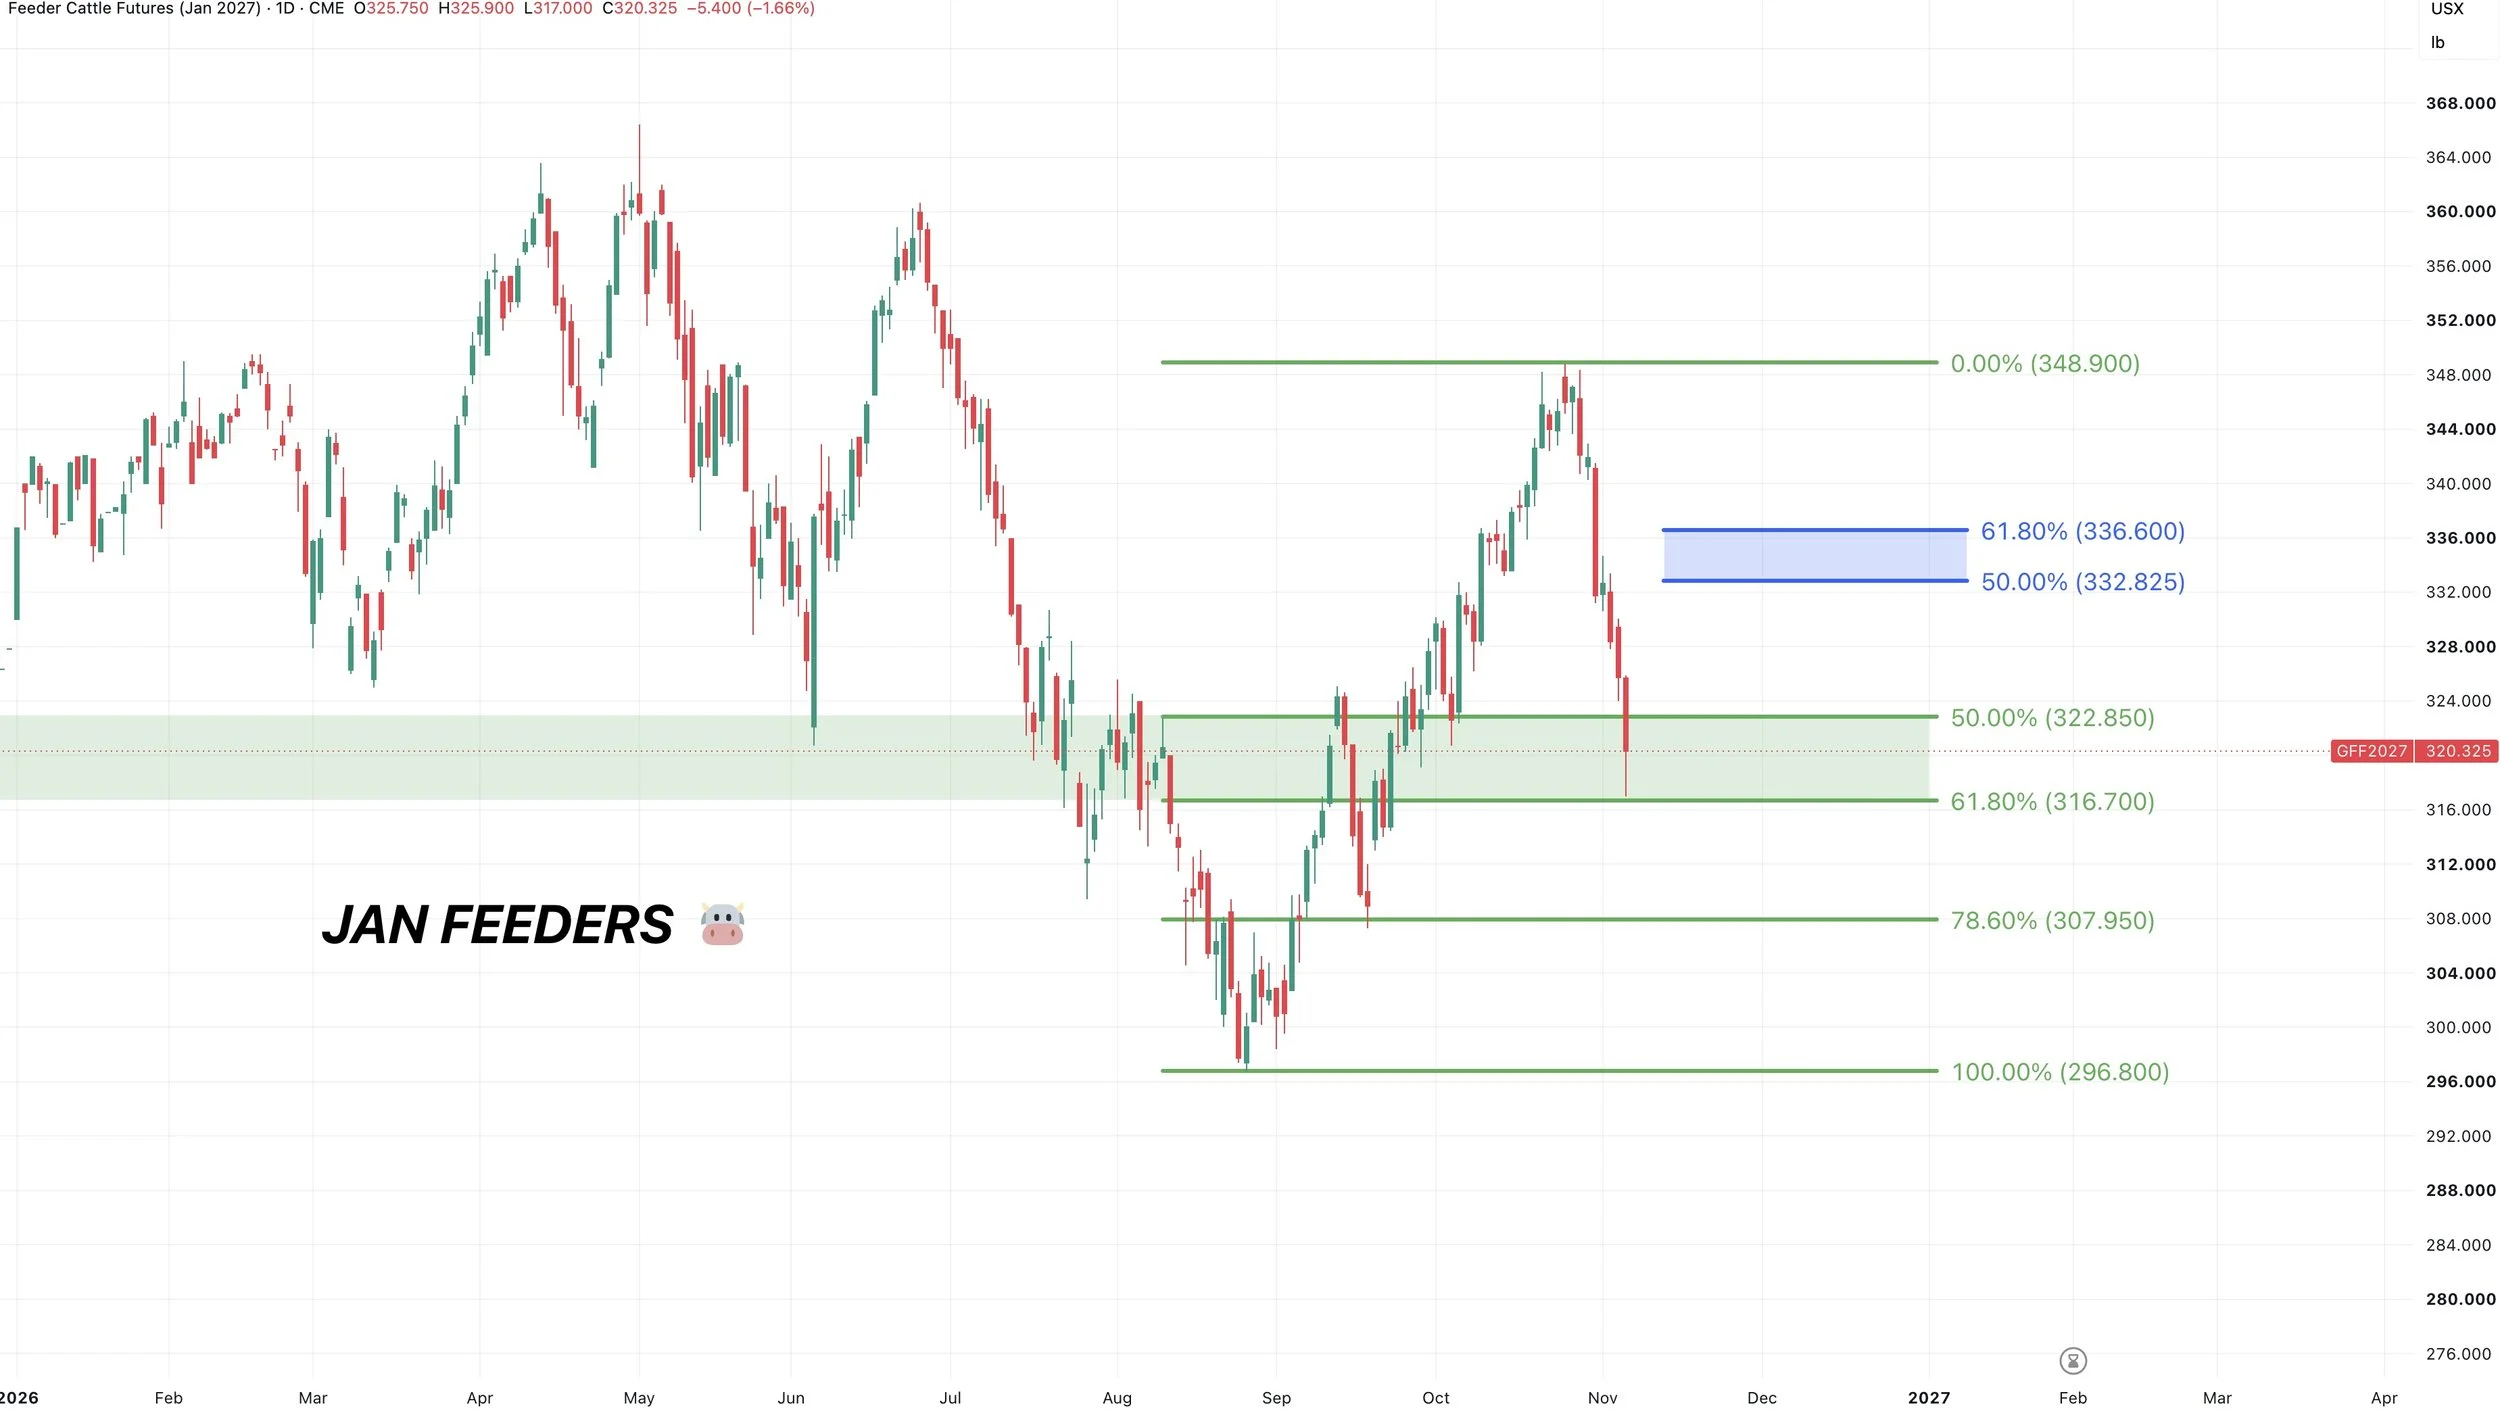
We had that sell alert a few weeks ago with the warning signs we were seeeing.
If you missed it: Click Here
Feeders are now at a pretty key spot here to the downside.
They perfectly gave back 61.8% of the entire rally off the lows before bouncing today.
Aka the golden fib and the most common place for a correction to end.
I view this as a must hold level for feeders if you want to keep the trend higher.
Lose this level and you could head towards the next support.
We did close well off the lows today, leaving a nice looking candle right at some key support. So today's lows are a key level to watch and would give someone a clear risk level to work with.
If this is a bottom, we could eye the 333 to 337 area for a relief bounce.
Stochastics:
The stochastics are now finally over sold.
Which is one thing you usually want to see when looking for a bottom.
That doesn’t mean you always bottom when the stochastics bottom. Because you don’t.
But usually for a market to bottom, you often want to see these bottom out.
Dec Live Chart:
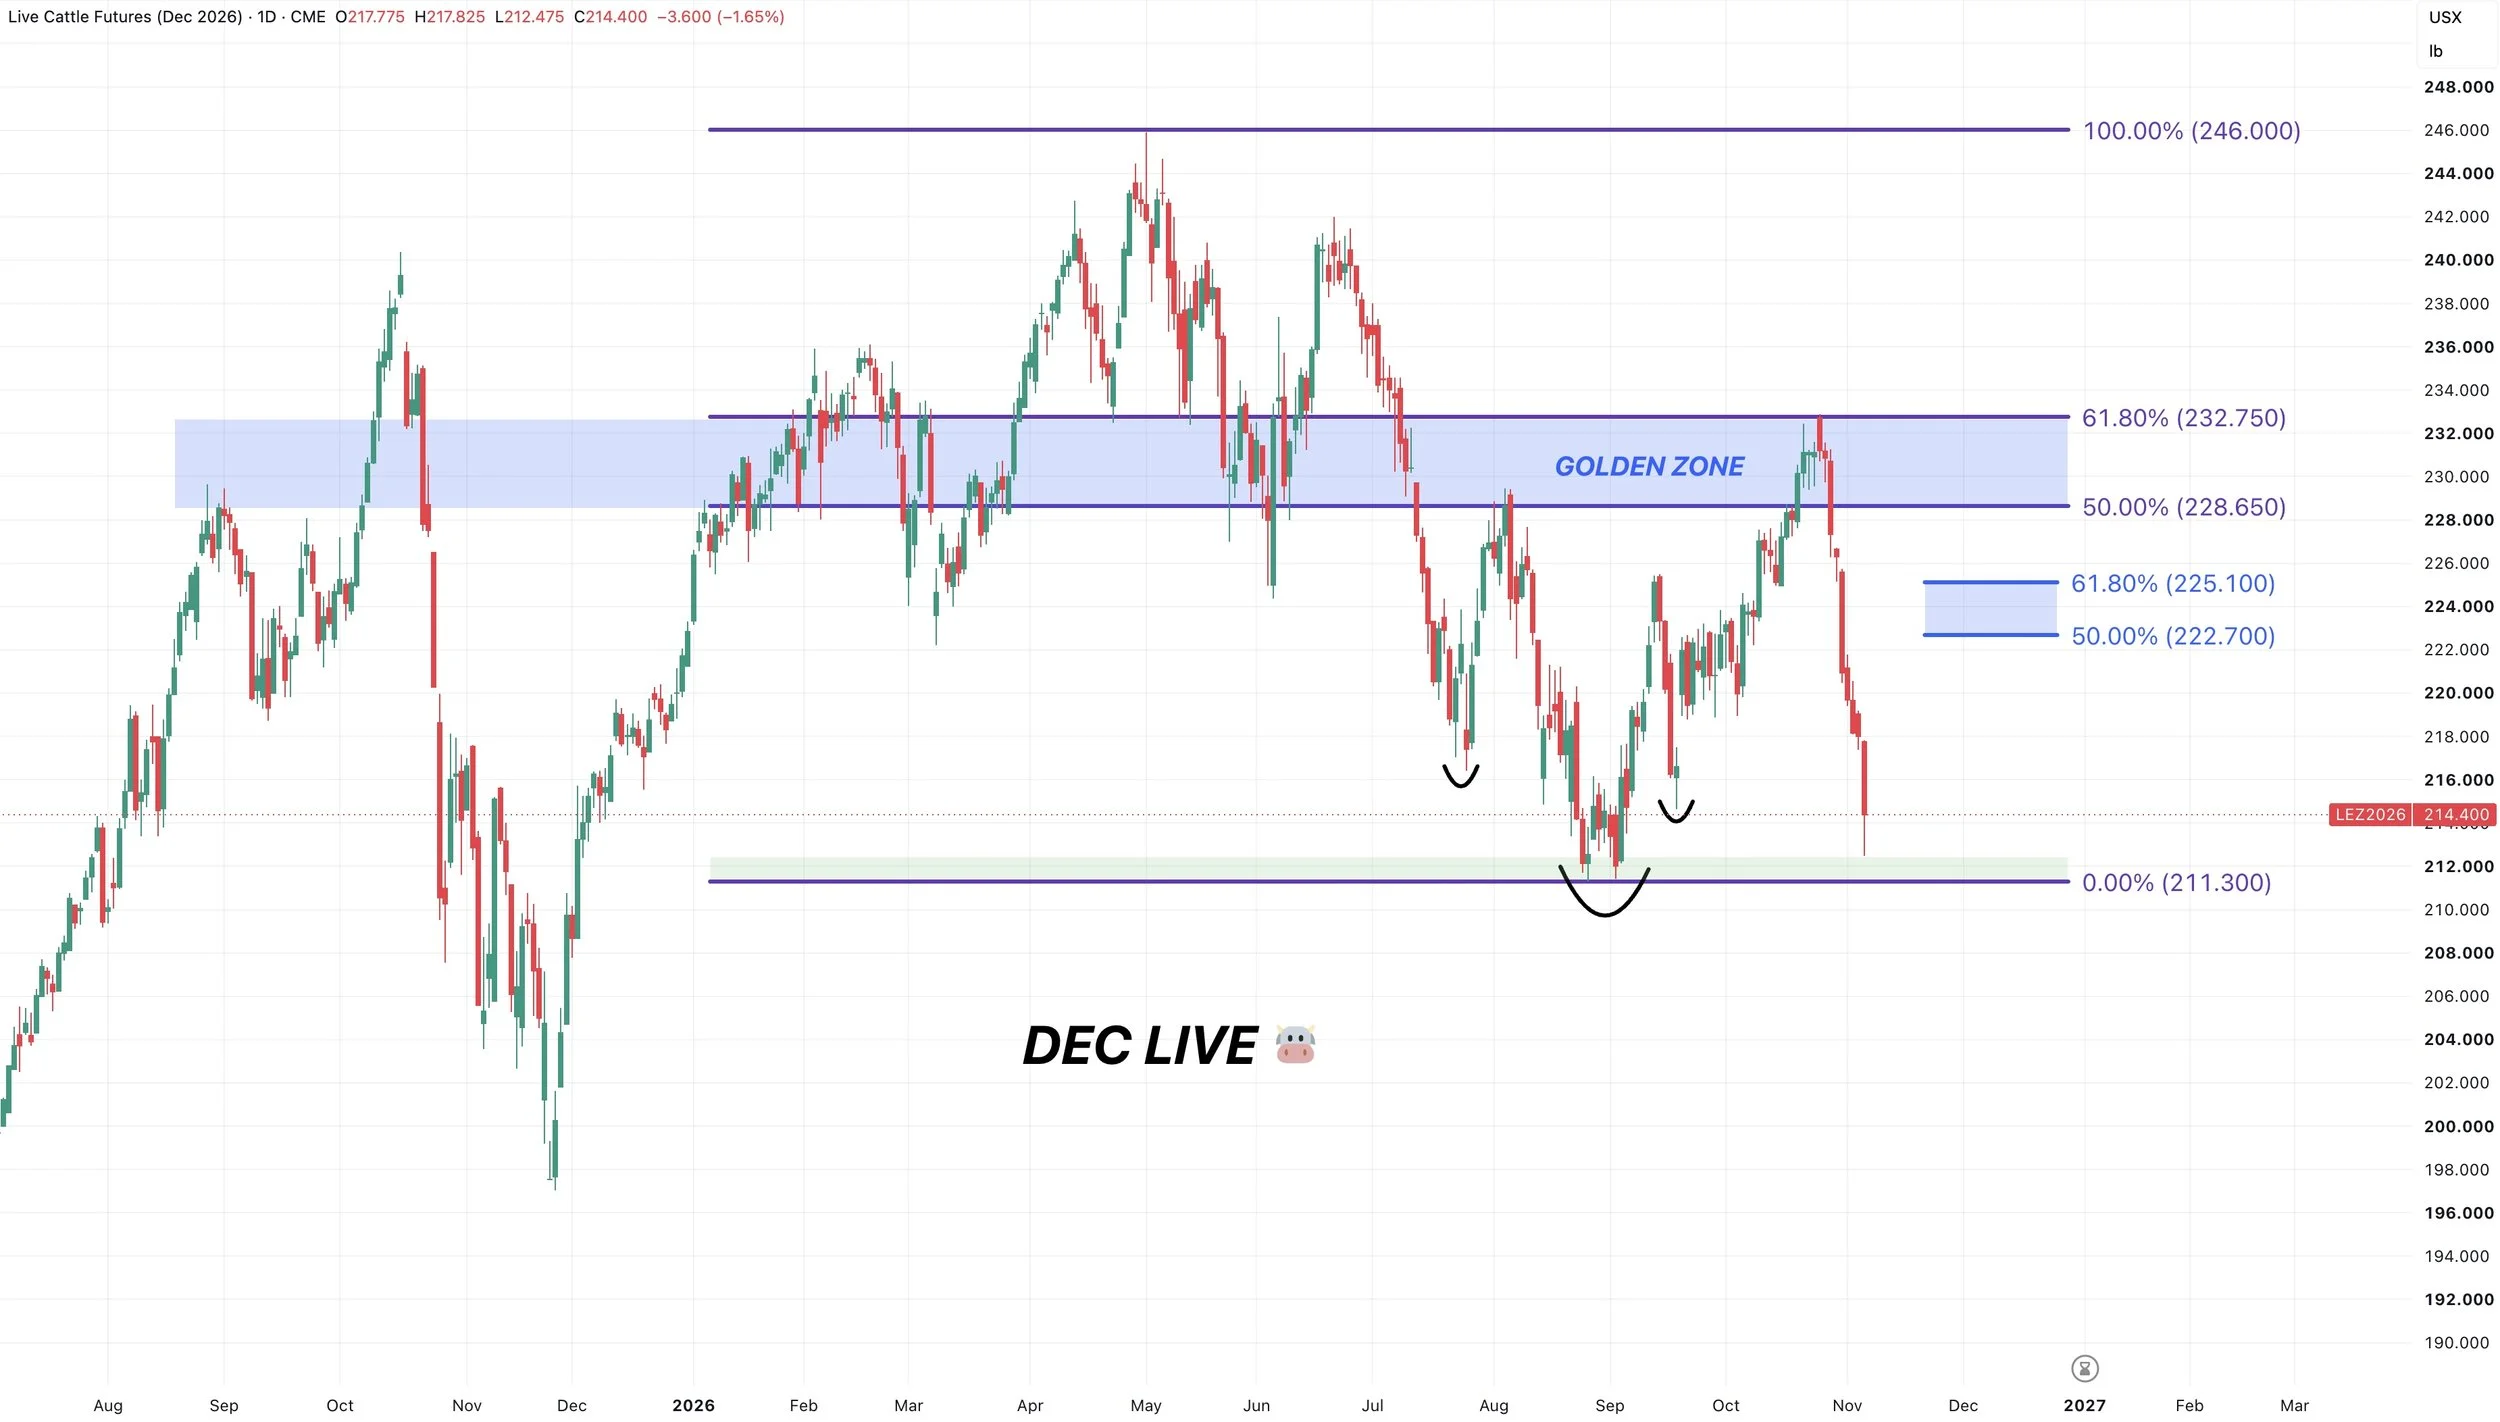
Live cattle had as perfect of a rejection as you could possibly think of near the highs.
We kissed that 61.8% level before finding a top.
Now this market has just taken it in the shorts and is right back at the lows. As we've given back the entire rally now unlike in feeders.
Bulls need to hold the those September lows to prevent this thing from continuing to fall apart.
Obviously too early to call a bottom. But if this is the bottom, a normal relief would often take you intot hat 223 to 225 range.
But personally, as I've said for a long time, I still believe cattle is overall in a longer-term downward trend for now until proven otherwise.
Want to Talk?
Our phones are open 24/7 for you guys if you ever need anything or want to discuss your operation.
Jeremey & Office: (806)484-1214
Sebastian: (605)280-1186
Email: sfrost@dailymarketminute.com
Hedge Account
Interested in a hedge account? Use the link below to set up an account or give us a call.