
KEY SPOTS ON THE CHARTS FOR CORN & BEANS
MARKET UPDATE
I apologize, there is no video update today. Only the written version as we were having technical difficulties
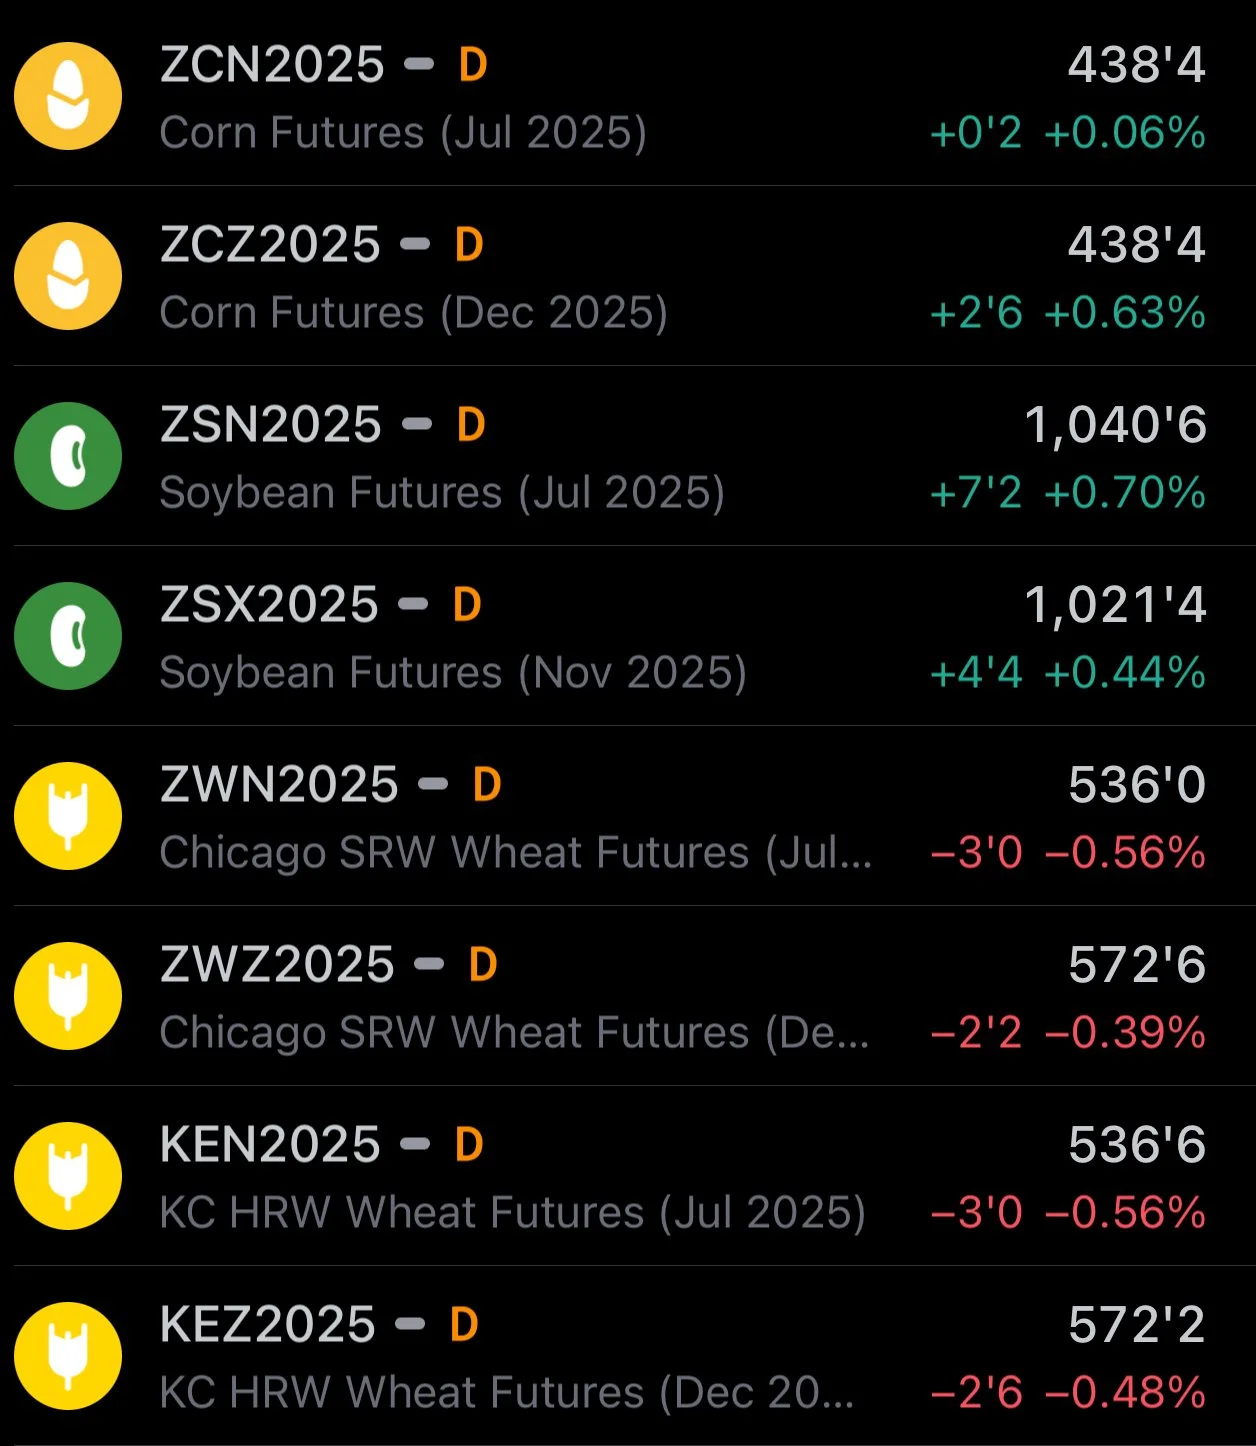
Futures Prices Close
Your free trial has expired.
Make sure you subscribe so you don’t miss future updates & our next signal.
Overview
Grains mixed today. Corn and soybeans saw a turn around Tuesday that was mostly led by a relief bounce. As this was corn's first day trading higher in 8 days and beans 2nd day higher in 7 days.
Overall the recent downfall and pressure has been driven by favorable forecasts for both.
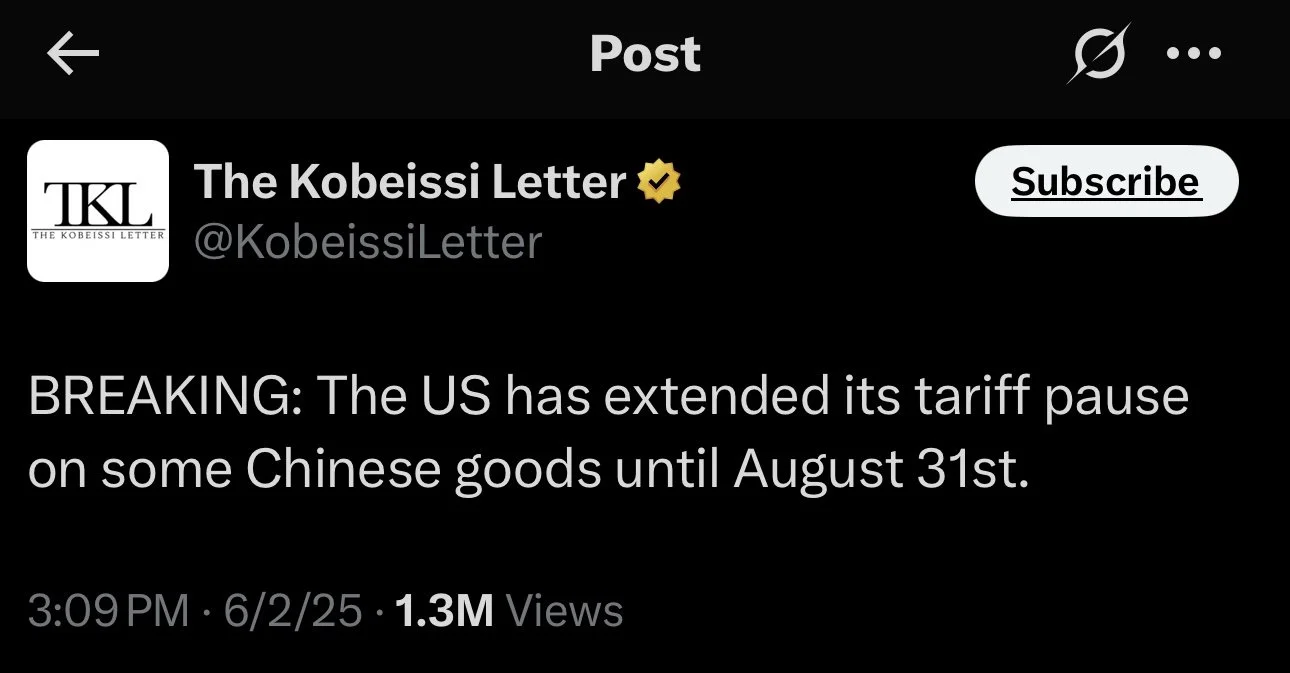
Soybeans saw a little support from China headlines.
Rumors are that Trump and China will talk this week. The US also delayed some of it's tariffs on China until August 31st.
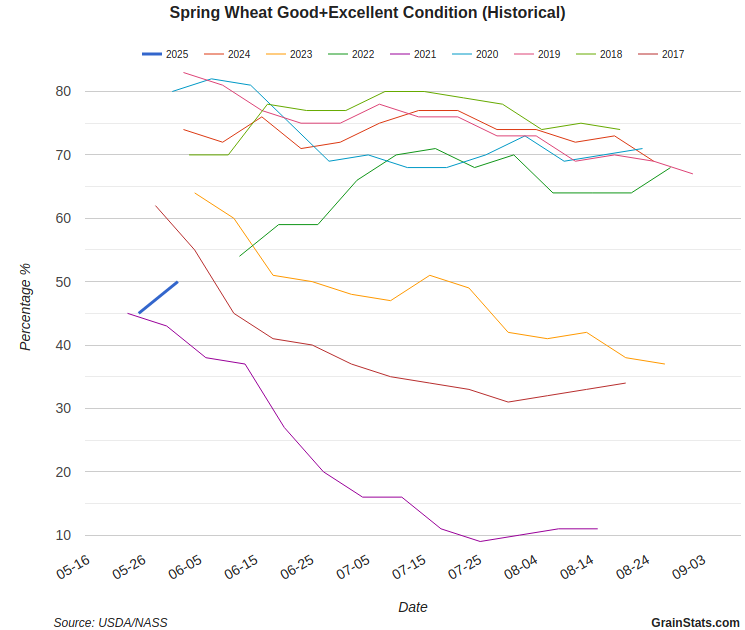
Wheat recently rallied off a weaker dollar and a drone strike in Russia over the weekend, but was lower today. Spring wheat led the way lower today as crop conditions yesterday surprised higher yesterday.
Jumping from 45% G/E last week to 50% this week (trade was expecting 47%). This is still well below last year's 74% and is the 2nd lowest since the 1990's only behind 2021. But the caught the trade off guard by the jump.
Chart from GrainStats
The US Dollar
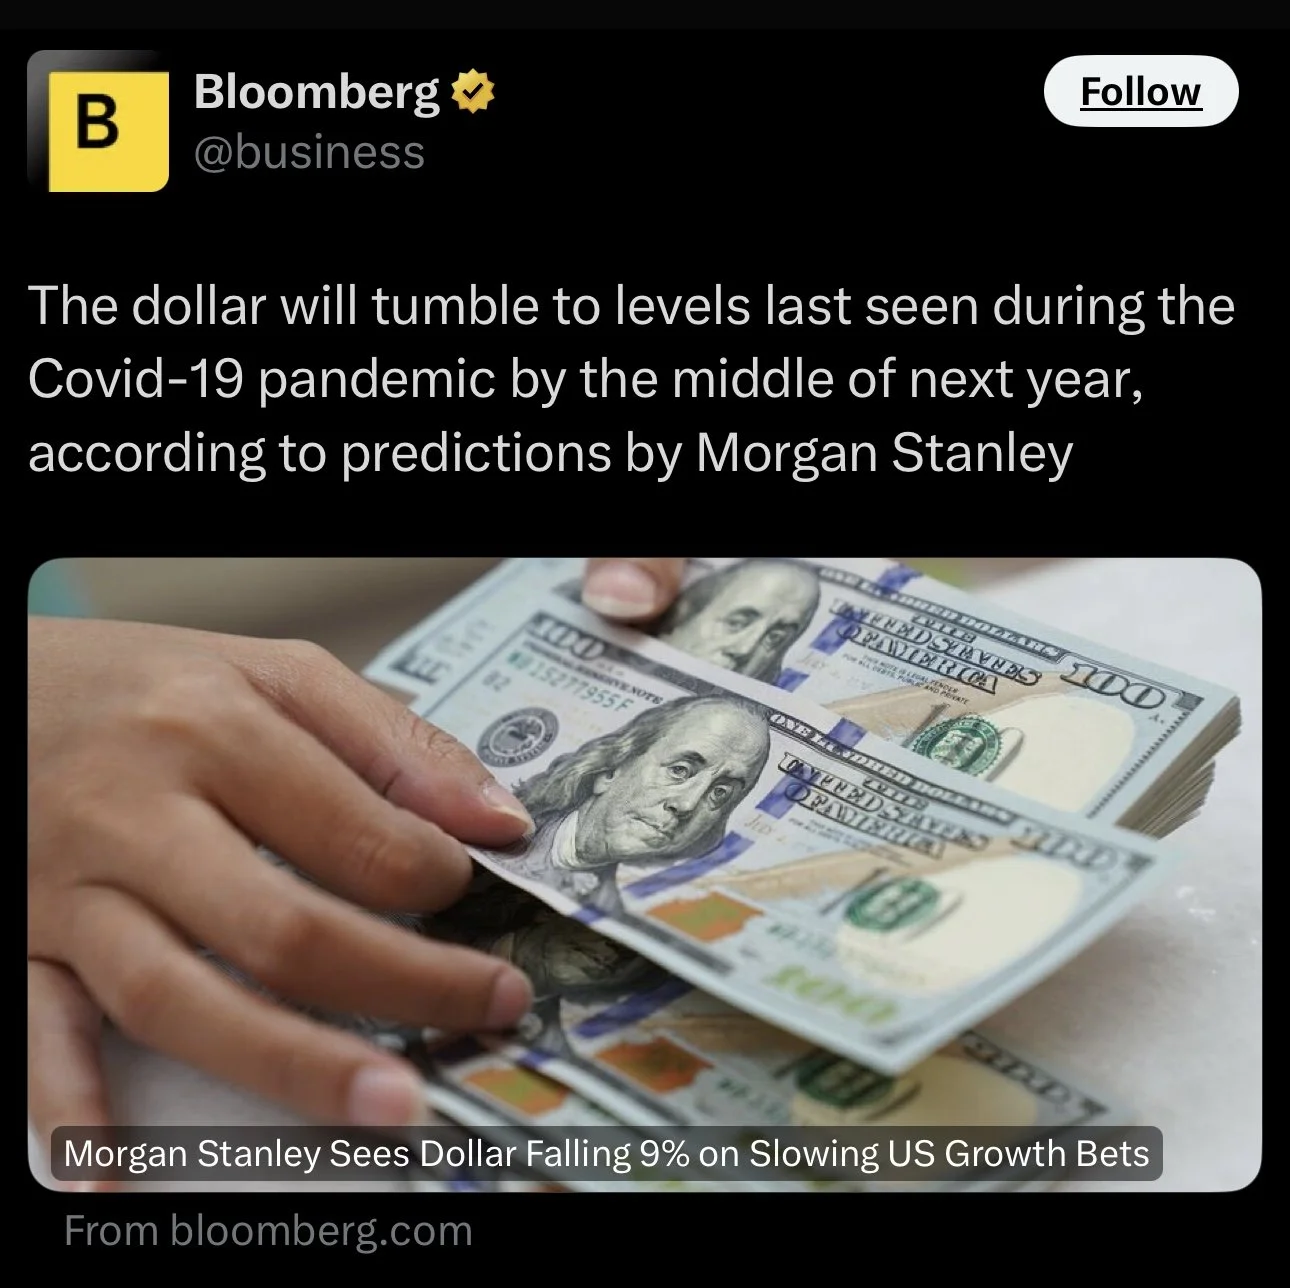
Several banks are predicting the US dollar will continue to fall.
Yesterday Morgan Stanley predicted that the US dollar will fall another -9% over the next 12 months (which is on top of the -10% fall we've seen YTD).
They believe Trumps trade policies, interest rate cuts, and currency hedging will lead to the US dollar dropping to it's lowest level since COVID.
This would be a very positive factor for the grain markets. Overall it could lead to buying across all commodities. But for grains specifically, it also makes us that much more competitive on exports and helos us create that much more demand.
This could potentially help build into that longer term demand story for the grains.
If this did lead to some big demand led rally in the future, that is the actual type of rally you want to see. As a demand led rally lasts longer than a supply driven one.
Grain prices are already low and demand has already been great. If the dollar keeps falling we are going to keep on exporting a ton of grains.
If you remember last year when corn was trading sub $4.00, that rally into the end of the year was led by demand and our exports rising.
Yes, yield dropped -2 bpa but it was really exports that ate into the balance sheet and gave us the ability to see carry out go from +2 billion to 1.4 billion.

Weather
Grains have struggled because forecasts are favorable.
The next week also offers more rain across the corn belt.
So we won't be seeing any weather threat in the near term.
A "drought scare" could still happen later. But the next week isn’t bullish. We've just seen too much with some more on the way.
When it's June and the forecasts are showing rain, it is hard for a market to rally.
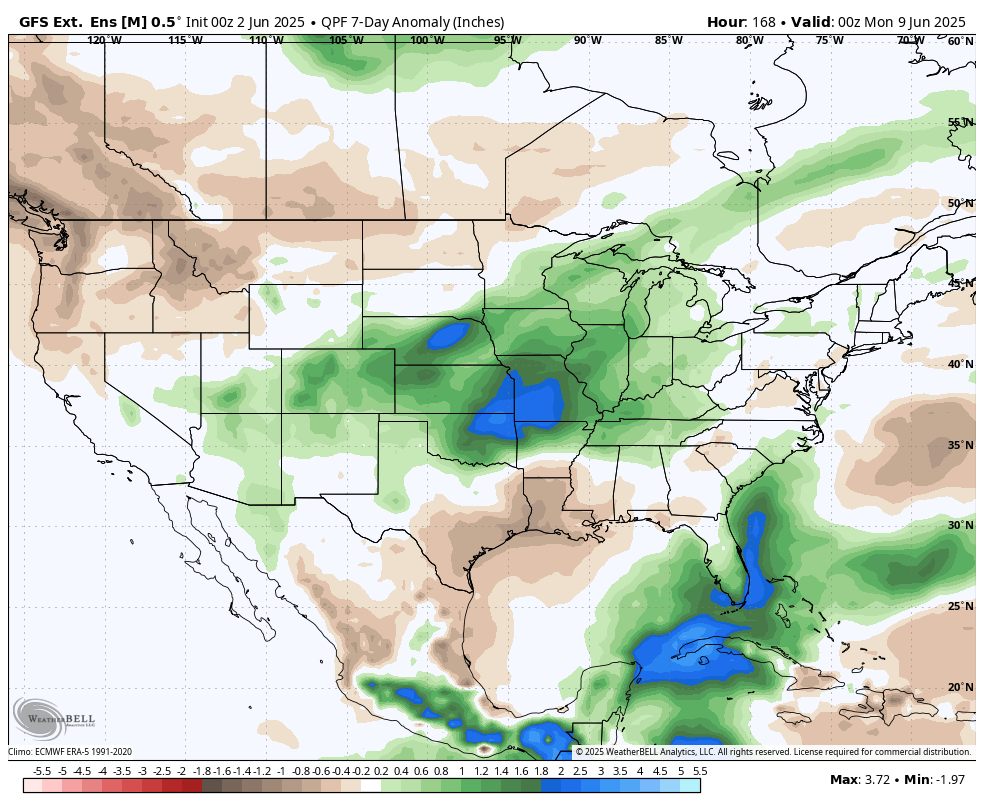
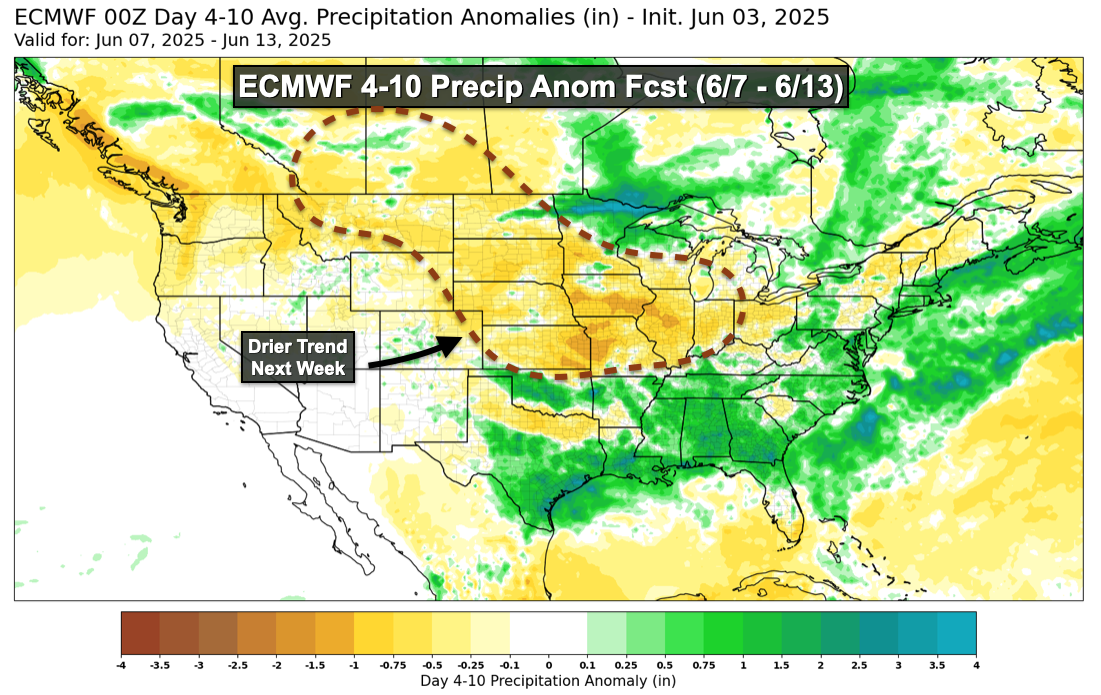
However things are expected to start drying out next week in areas such as Iowa and Illinois.
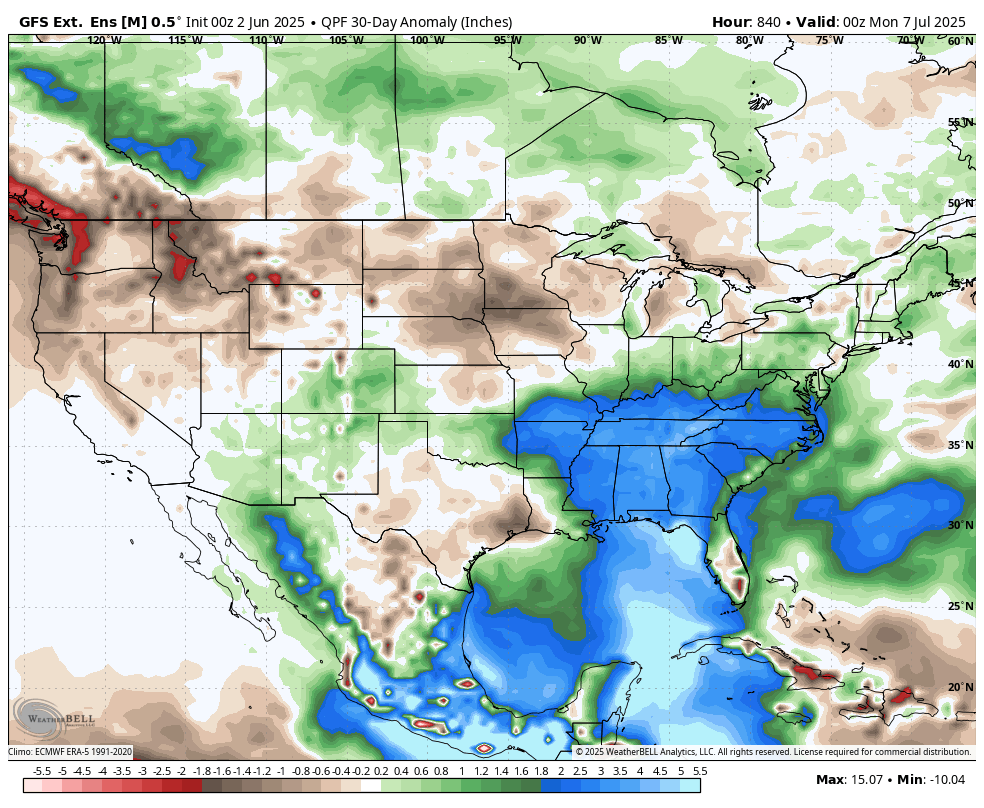
Here is the next 30 days anomaly.
The south looks like they are going to contiue to be pounded with rain while areas such as Iowa and the western corn belt shift drier.
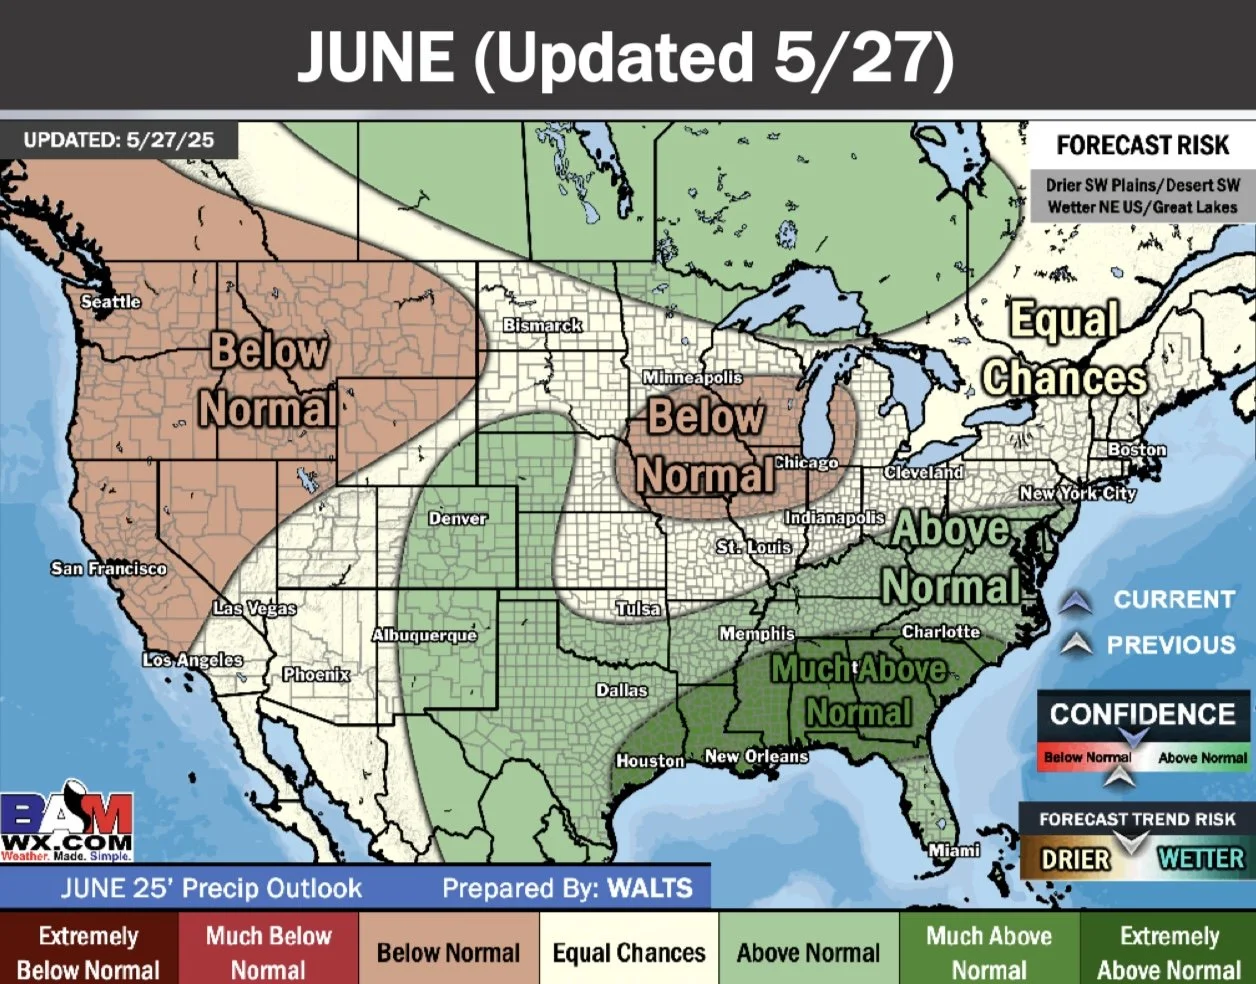
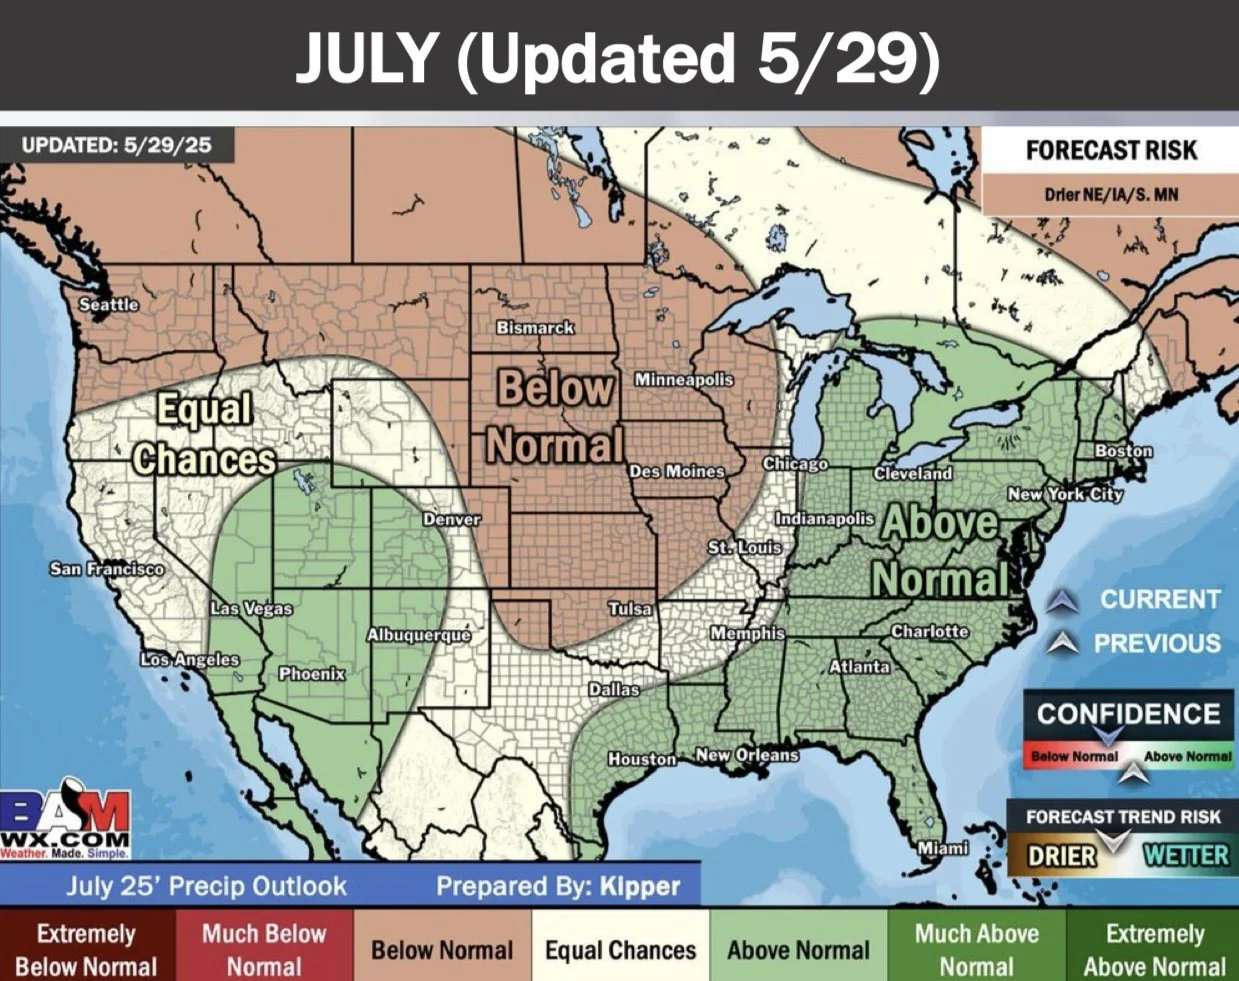
Here is BAM Weather's June and July outlooks.
This is why a "scare" could still happen.
The extended forecasts are still dry for a good portion of the corn belt especially out west.
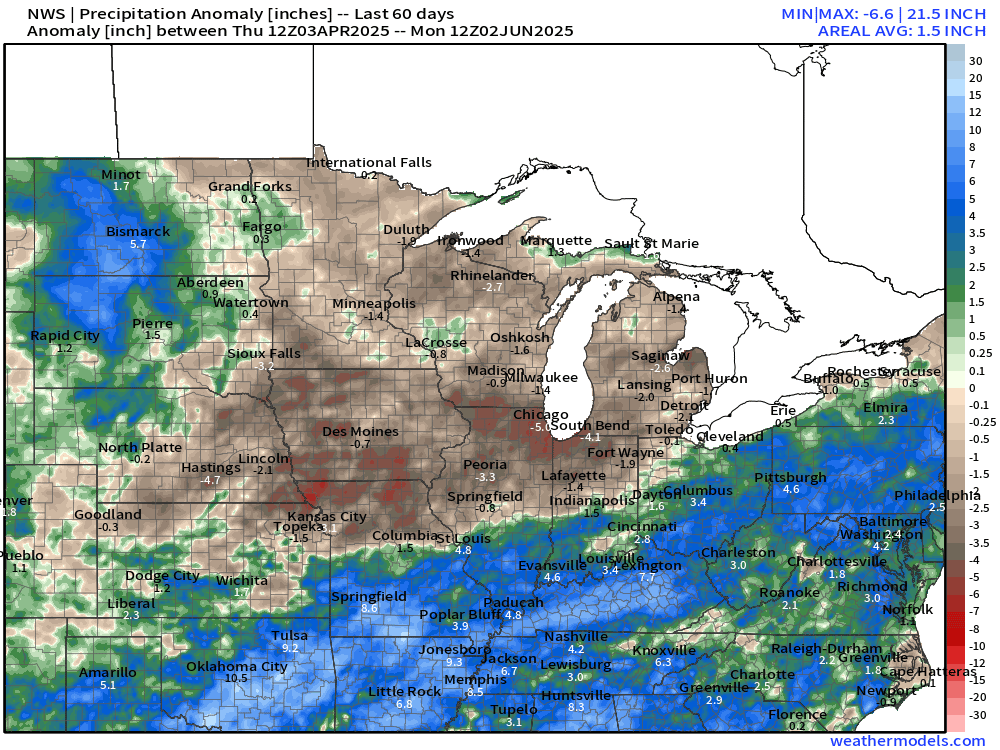
If we look at the last 60 days of rain, the dry areas are those same areas that are forecasted to be dry in the extended forecasts.
Iowa, northern Illinois, Minnesota, and Wisconsin for example.
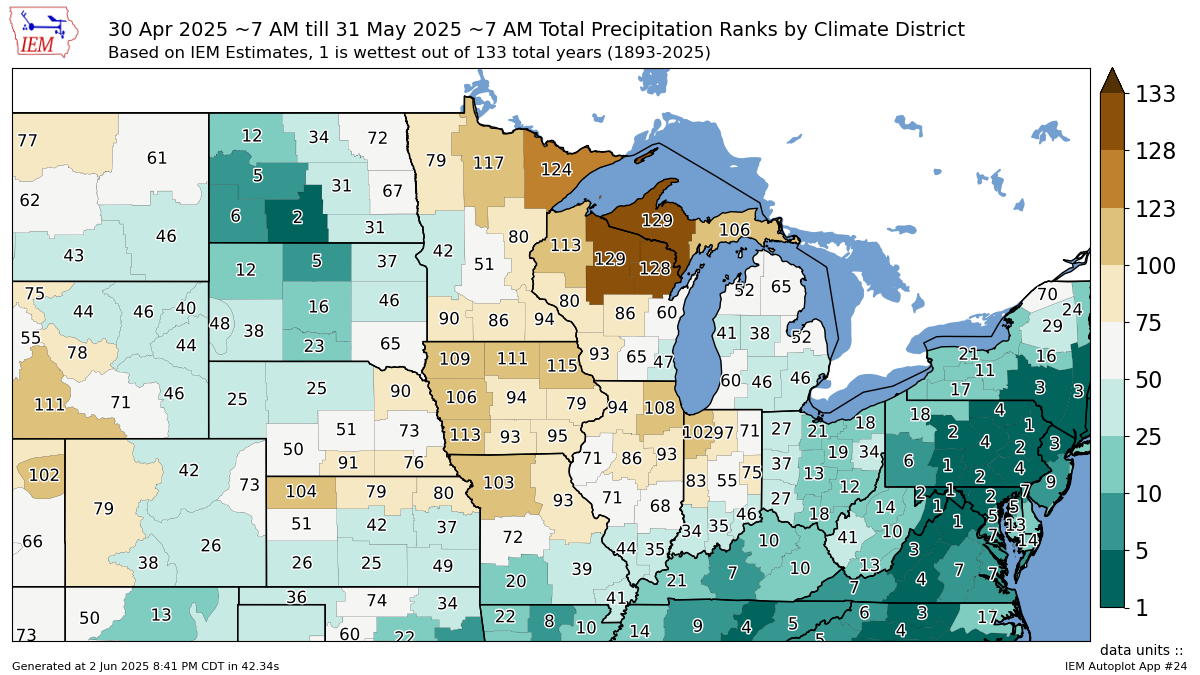
Here is the precip rankings for the month of May.
Again the key dry areas were Iowa and northern Illinois.
Todays Main Takeaways
Corn
Fundamentals:
Seasonally we are suppose to go higher until mid-June. But we haven’t. We just posted new calendar lows.
Mid-late June is when we seasonally make our highs due to the uncertainty in pollination weather.
Seasonally we then fall apart fast towards the end of June and into July.
So that is of course something we have to be aware of here. If we get into late June and prices still haven’t started to work higher, history says we go lower. Which means maybe we don’t get that usual opportunity.

Another argument bears are making is that Brazil has a huge corn crop.
Which is true.
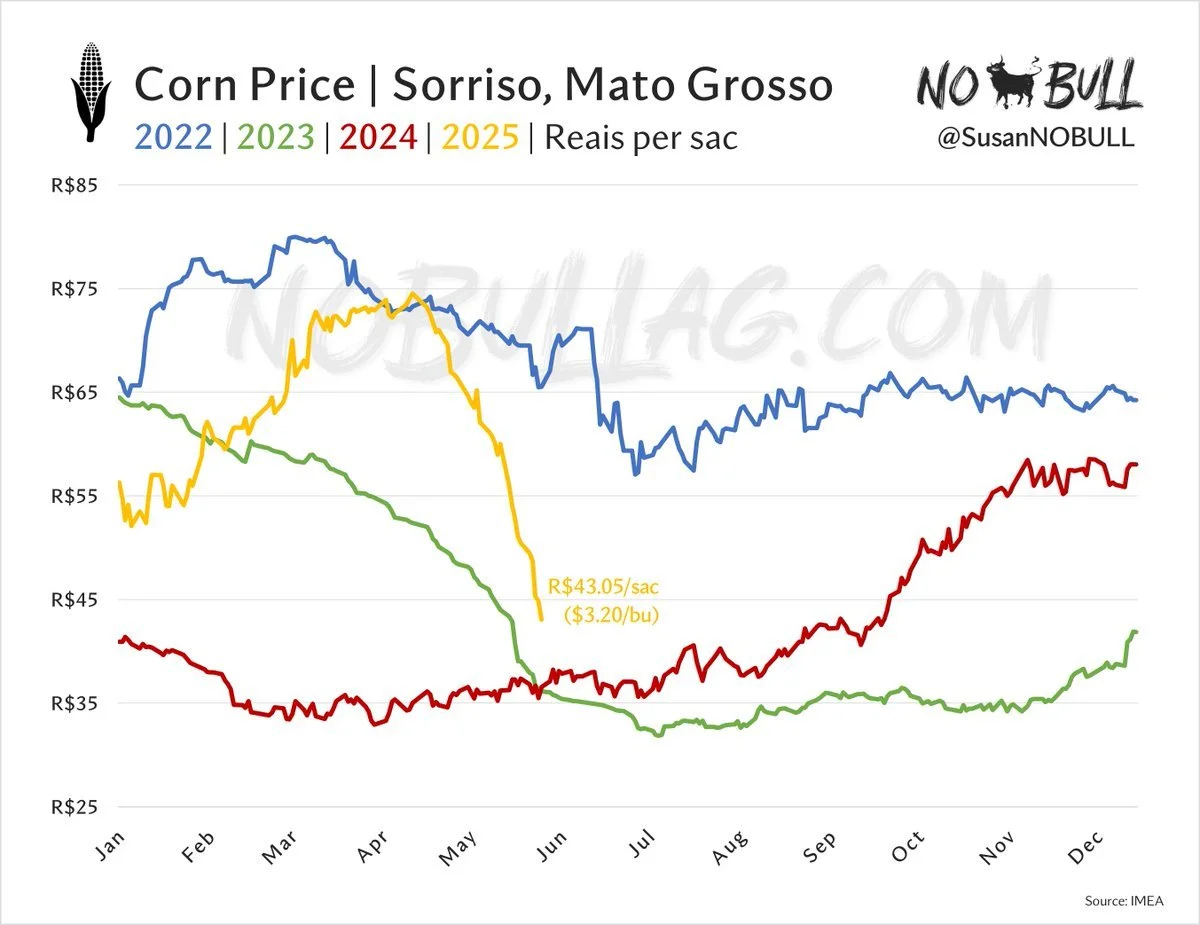
Here is a chart from NoBull Ag that shows Brazil's corn cash prices.
They've tanked -40% the past month. Which indicates they have a big crop on the way.
On the other hand, does it really matter if Brazil's corn crop is bigger than last year if they are using more corn than last year?
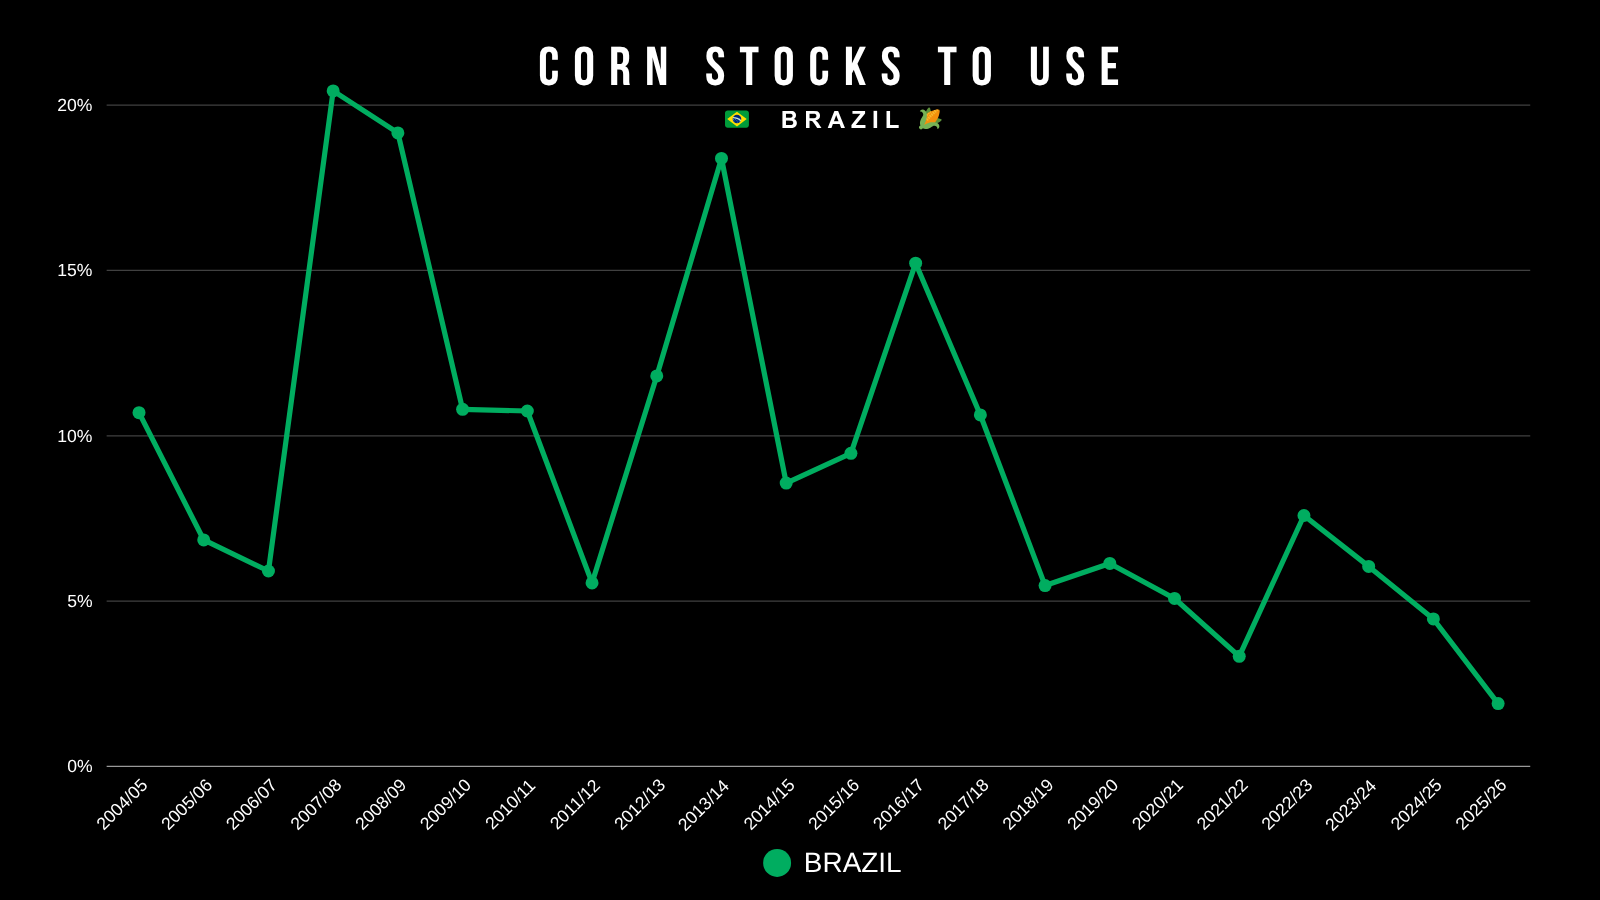
Below is Brazil's stocks to use ratio for their corn.
It projected to come in at an all-time low. Which means they don’t just have all of this extra corn sitting in hand despite having a large crop.
If the dollar keeps falling and corn prices remain low anyways, there is no reason we shouldn’t continue to export corn. Lower prices lead to more demand like we saw last year.
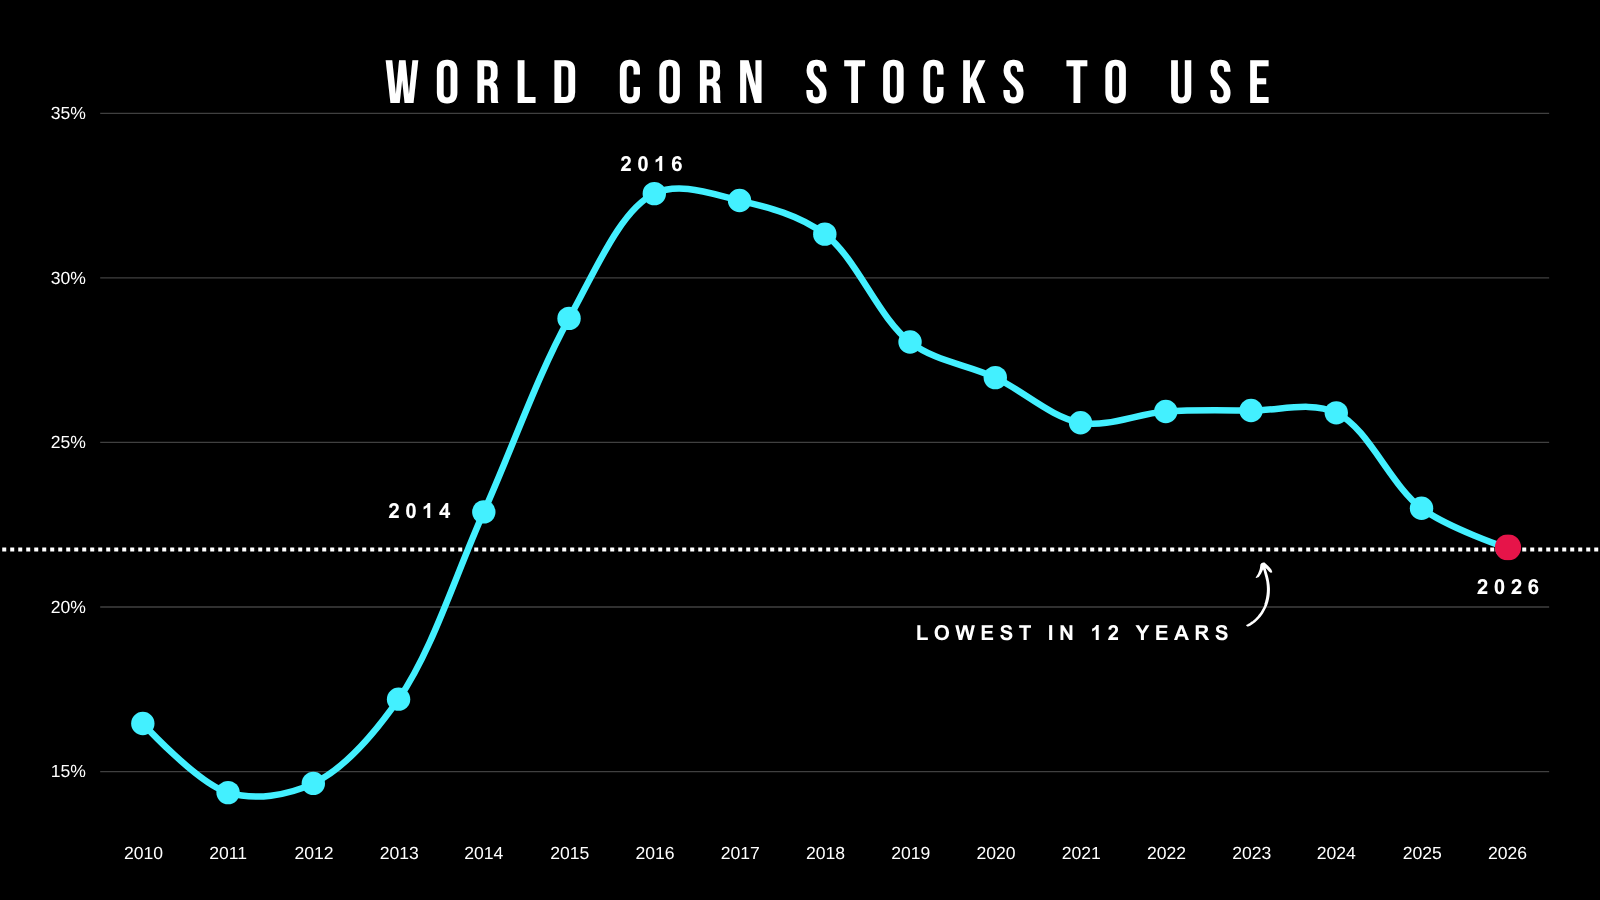
Below is our world stocks to use ratio. It is the tightest since 2013.
But right now all that matters is weather.
The weather has just been too favorable for the market to care about other fundamentals.
If weather leads to any hiccups, we are going to see the effects of the world situation being the tightest in 12 years.
This market is tough. Because we do have a really tight old crop situation. With a stocks to use ratio below 10% which usually is associated with much higher prices than $4.30 corn.
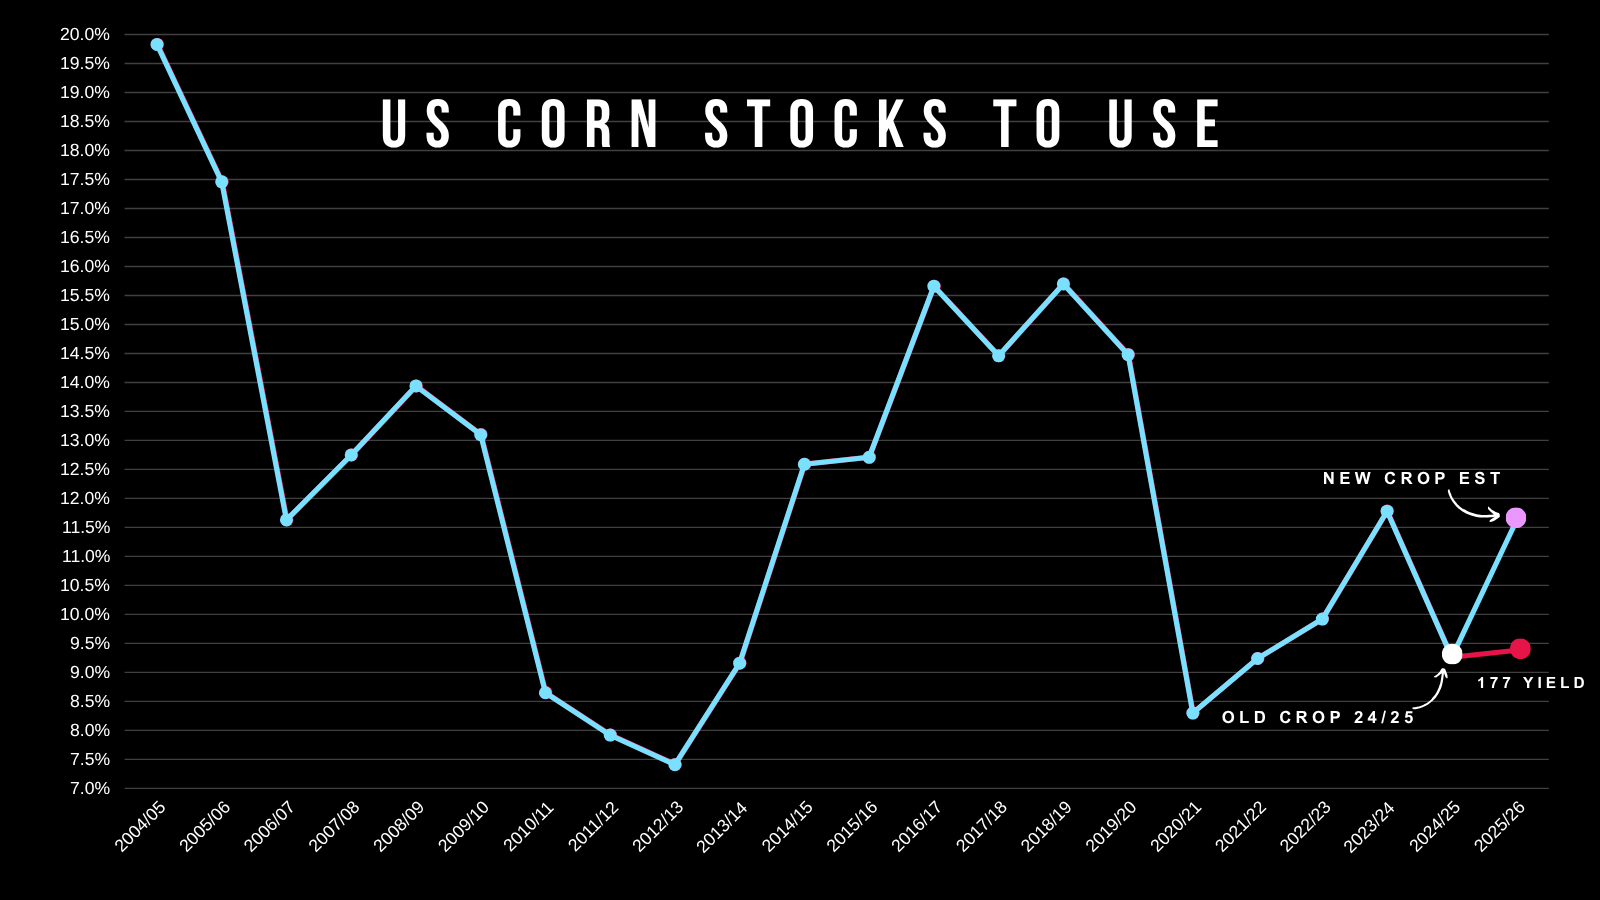
Our new crop situation isn’t "tight" but typically we see our biggest print of the year in May and this number works it's way lower.
Yes we could see a +180 yield. But we've never seen 180 even in years like last year where we saw a pretty ideal growing season. Even if we do get a 180 yield, that wouldn’t be until after pollination.
The crop isn’t made in May. We have to have pretty good weather until August-September to raise a perfect crop. The market is already pricing in a 180 bpa crop.
If we get a 180 yield, we will be cheaper than where we are today. But you have to imagine what would happen if yield only wound up being 177 or so, given that the market is already pricing in a perfect crop.
(In red on the chart is our stocks to use ratio with a 177 yield and no changes to demand).
Technicals:
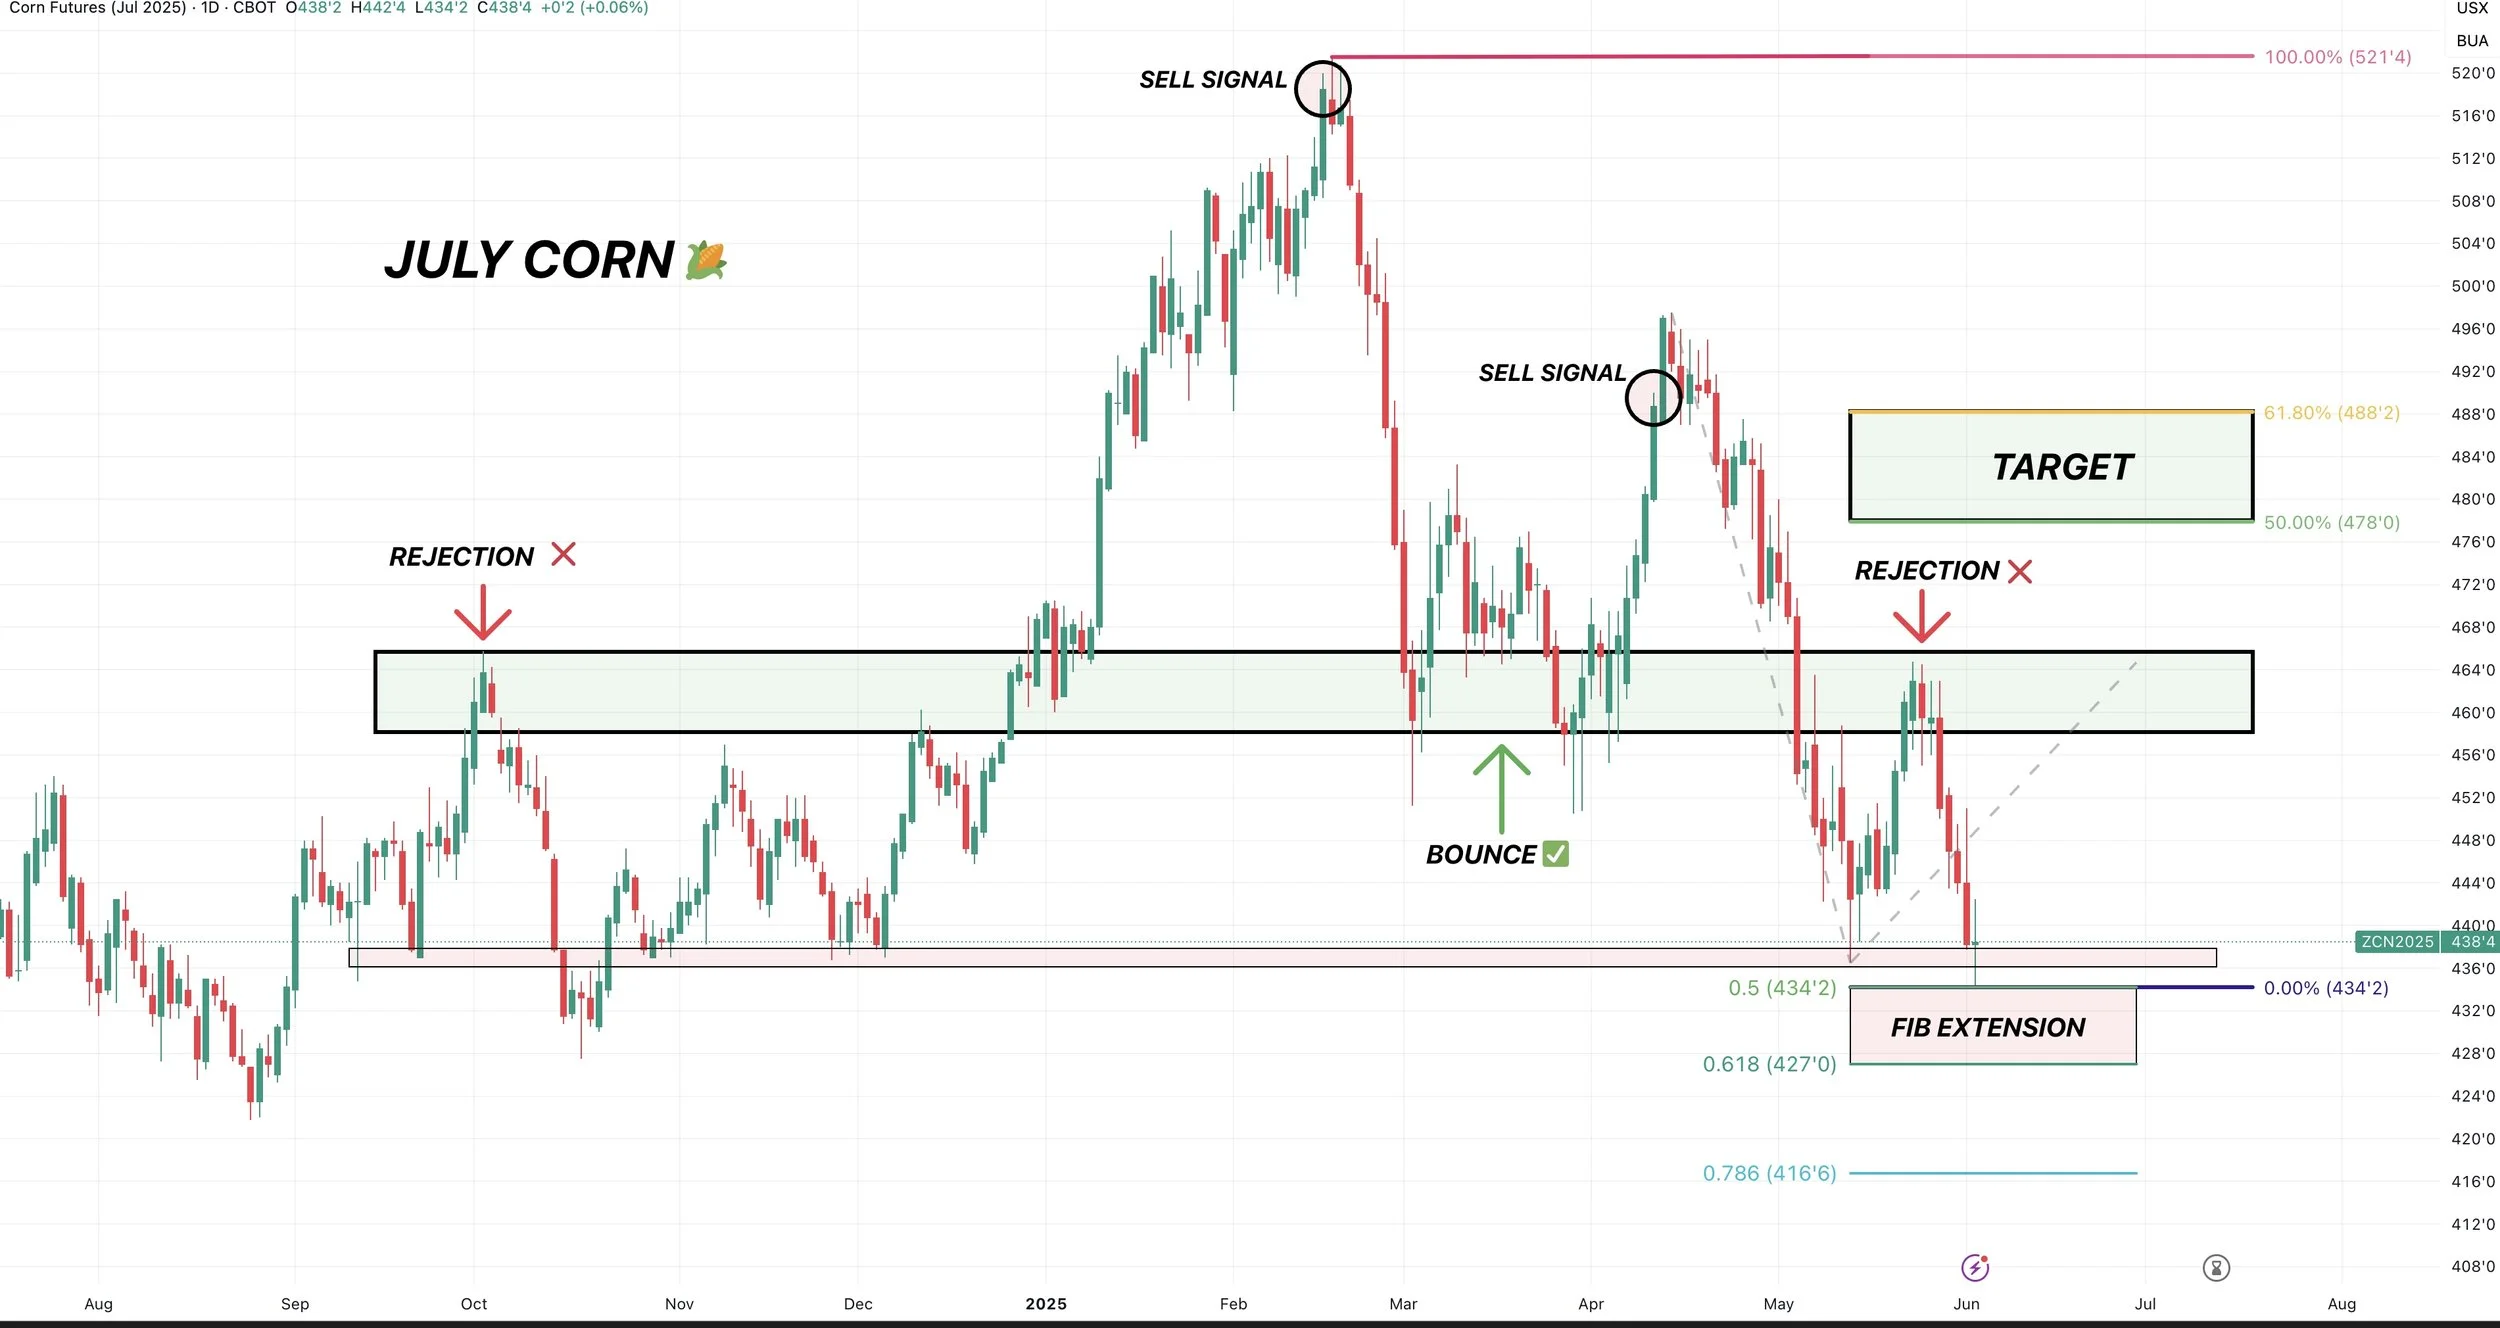
We rejected right off that level that was resistance back in October and support back in March.
Where should we bottom?
Normally we look at retracement levels to try to identify a bottom. But since we posted new lows we cannot do that. As there is no prior low to retrace to.
Instead we are going to use a fib based extension.
I will try to explain what this is as best as possible:
What this does is it measures the intial move down, and projects what the next move might be.
The extension goes from the April highs, down to the May lows, then up to the highs from 2 weeks ago.
The most common spot for a market to bounce is the 50% to 61.8% extensions.
Which means this 2nd sell off, should equal 50-61.8% of the first sell off.
The Math:
The first sell off from April highs down to March lows was -60 cents
50% of 60 cents is 30 cents
61.8% of 60 cents is 37 cents
The recent was $4.64
$4.64 - 30 cents = $4.34 (50% extension)
$4.64 - 37 cents = $4.27 (61.8%) extension.
So that is where bulls really want to bounce and where a bounce would make sense.
If we fail the 50-61.8% levels, then the next support is the 78.6% extension which is $4.17 and would be new contract lows. So important spot to hold here.
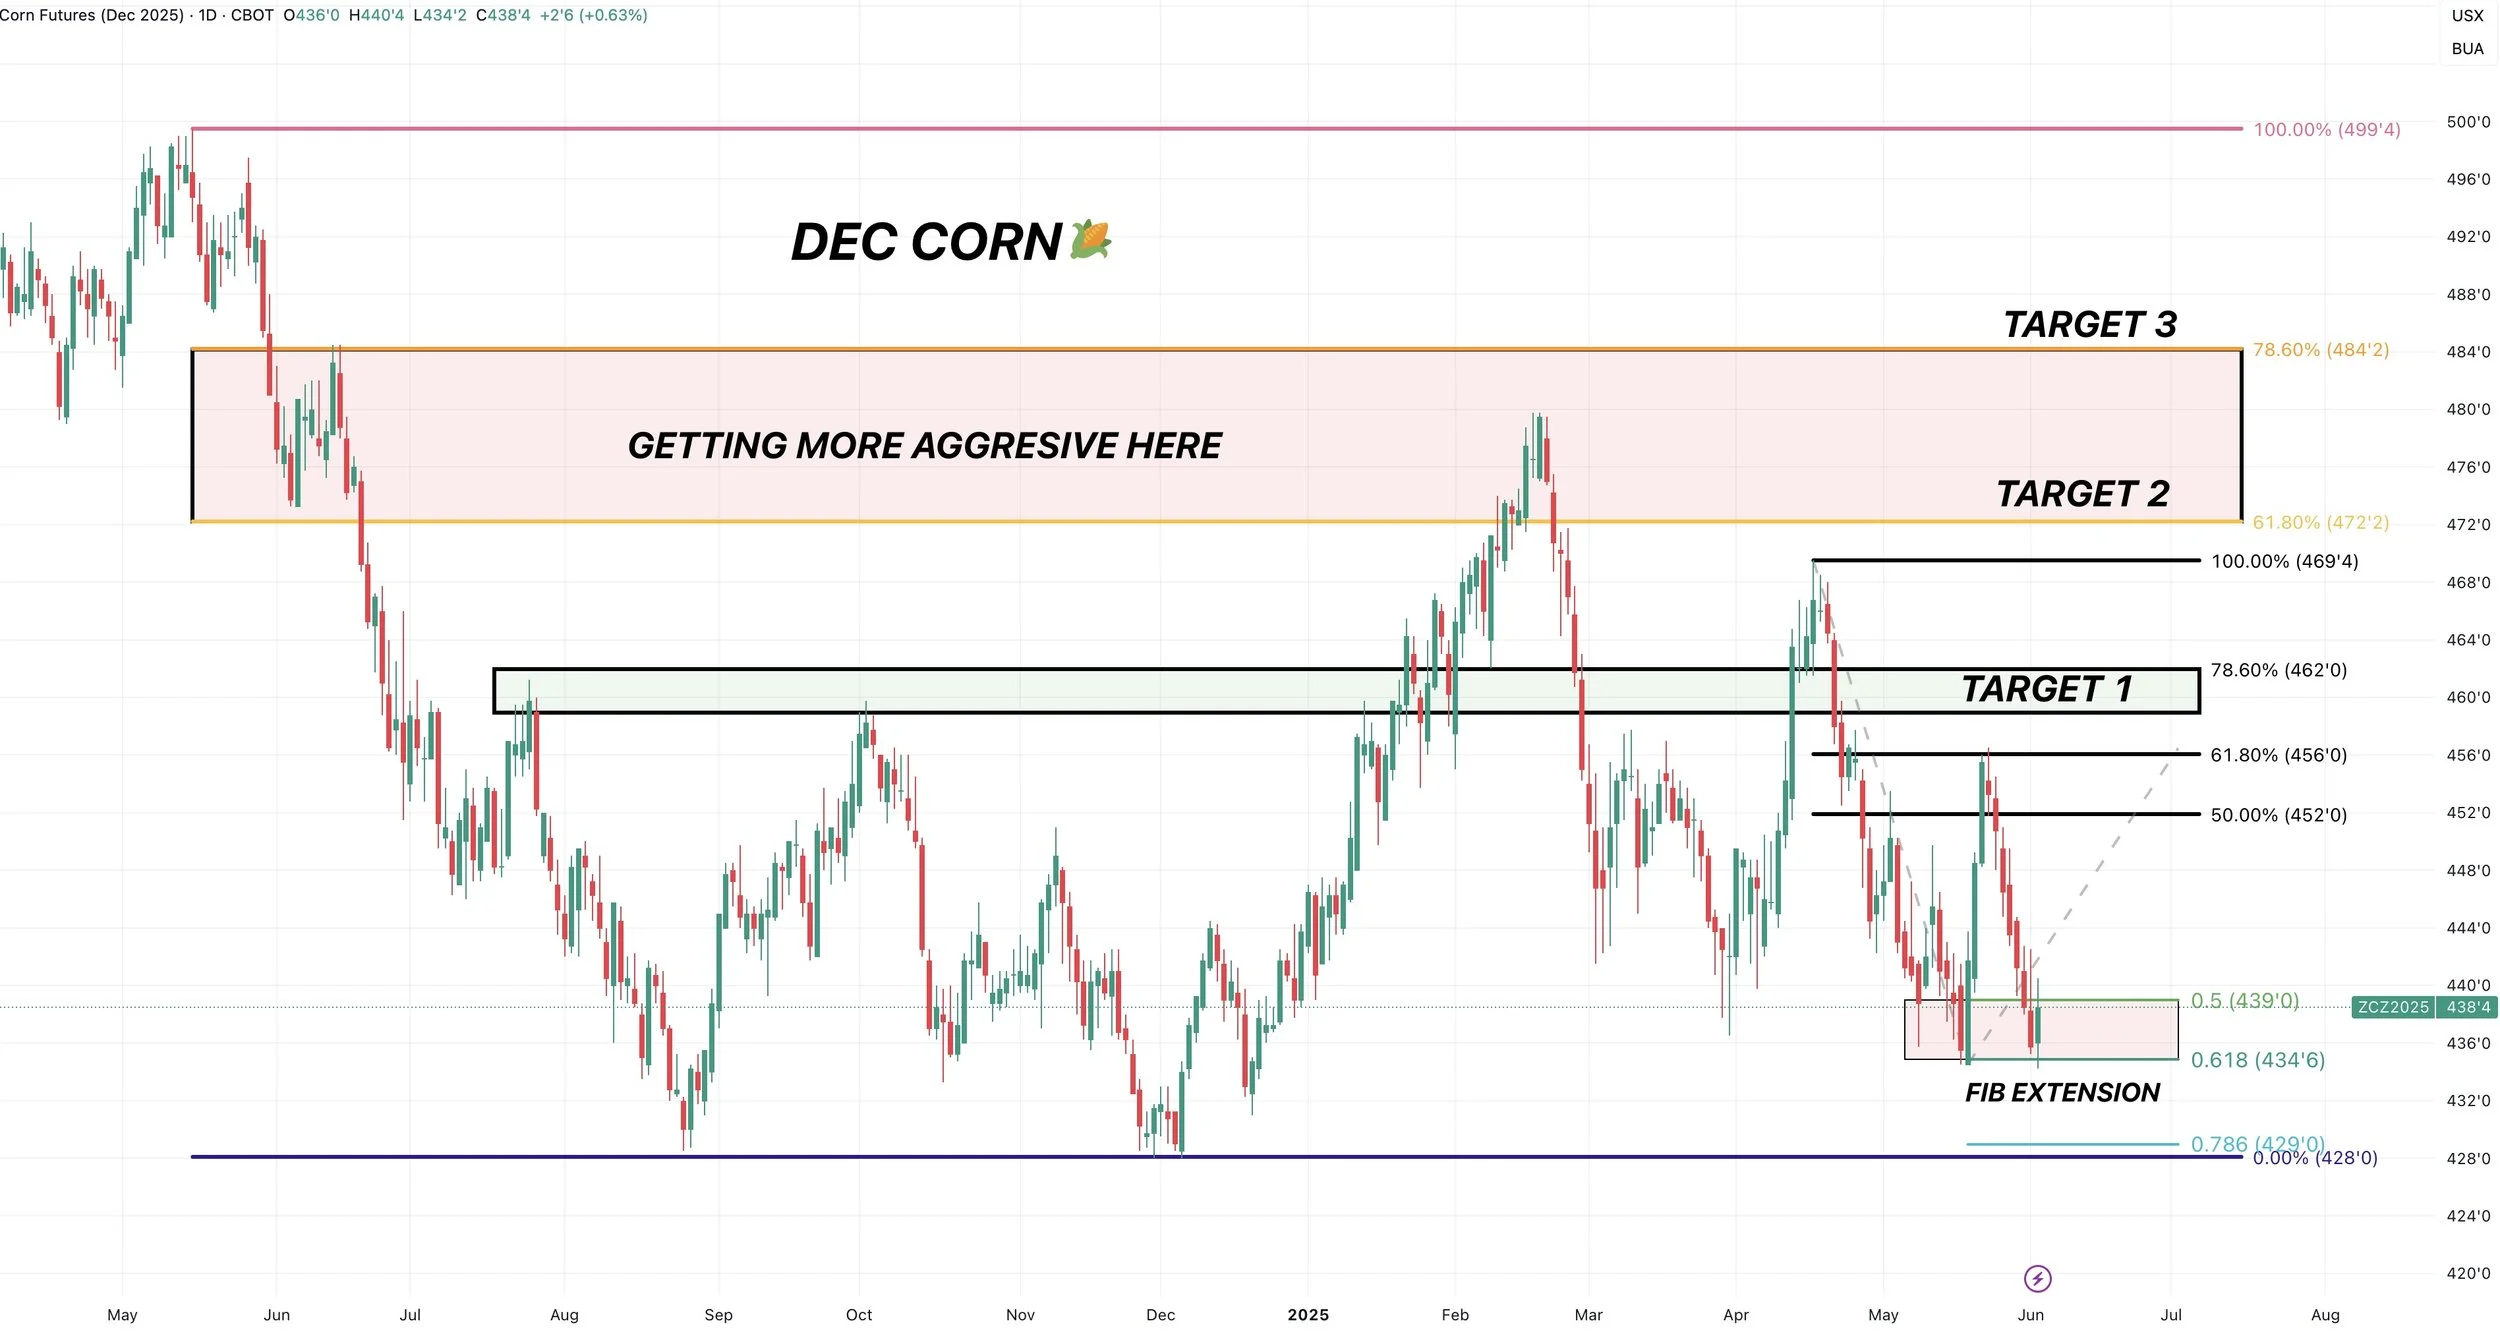
For Dec corn, we are also using a fib extension to find our possible bottom.
The April sell off down to the May lows was 35 cents.
Our recent high was $4.57
50% of 35 cents = 17.5 cents ($4.57 - $0.175 = $4.49)
61.8% of 35 cents = 21.5 cents ($4.57 - $0.215 = $4..35)
We are currently right in this golden extension zone. Bouncing right at the 61.8% level today.
A bounce here would make sense. If not, our next support is the 78.6% level at $4.29 which is right near contract lows.
I am not alerting a buy signal, but this would be an area to consider re-ownership if you made sales higher than we are today.
Another reason why corn could be close to a bottom is the RSI on July corn just posted bullish divergence.
This happens when prices make new lows, but the RSI does not.
Bearish divergence is when prices make new highs, but the RSI does not. Which is exactly what happened back in February and marked our highs.
Basically when the RSI does not follow prices, it signals that momentum is weakening.

Soybeans
Fundamentals:
Fundamentally nothing has changed the past few weeks.
We rallied off very little news 2 weeks ago.
Now we've simply sold off due to weather and no risk premium being built in.
I've went over plenty of times how the US soybean situation is tight and doesn’t have a ton of wiggle room if yield disappoints at all.
Even if we raise a record yield, our carryout is still -15% lower than last year.
Yet.. prices are below where they were last year.
Unless we see some RVO headline or some major conflict with China, I don’t see why soybeans aren’t undervalued here looking long term.
Short term could we struggle if weather remains favorable? Absolutely.
We have an entire growing season ahead of us. Bears argue Brazil has a big crop, which is true but it's priced in. Now the market is pricing in a perfect crop here in the US.
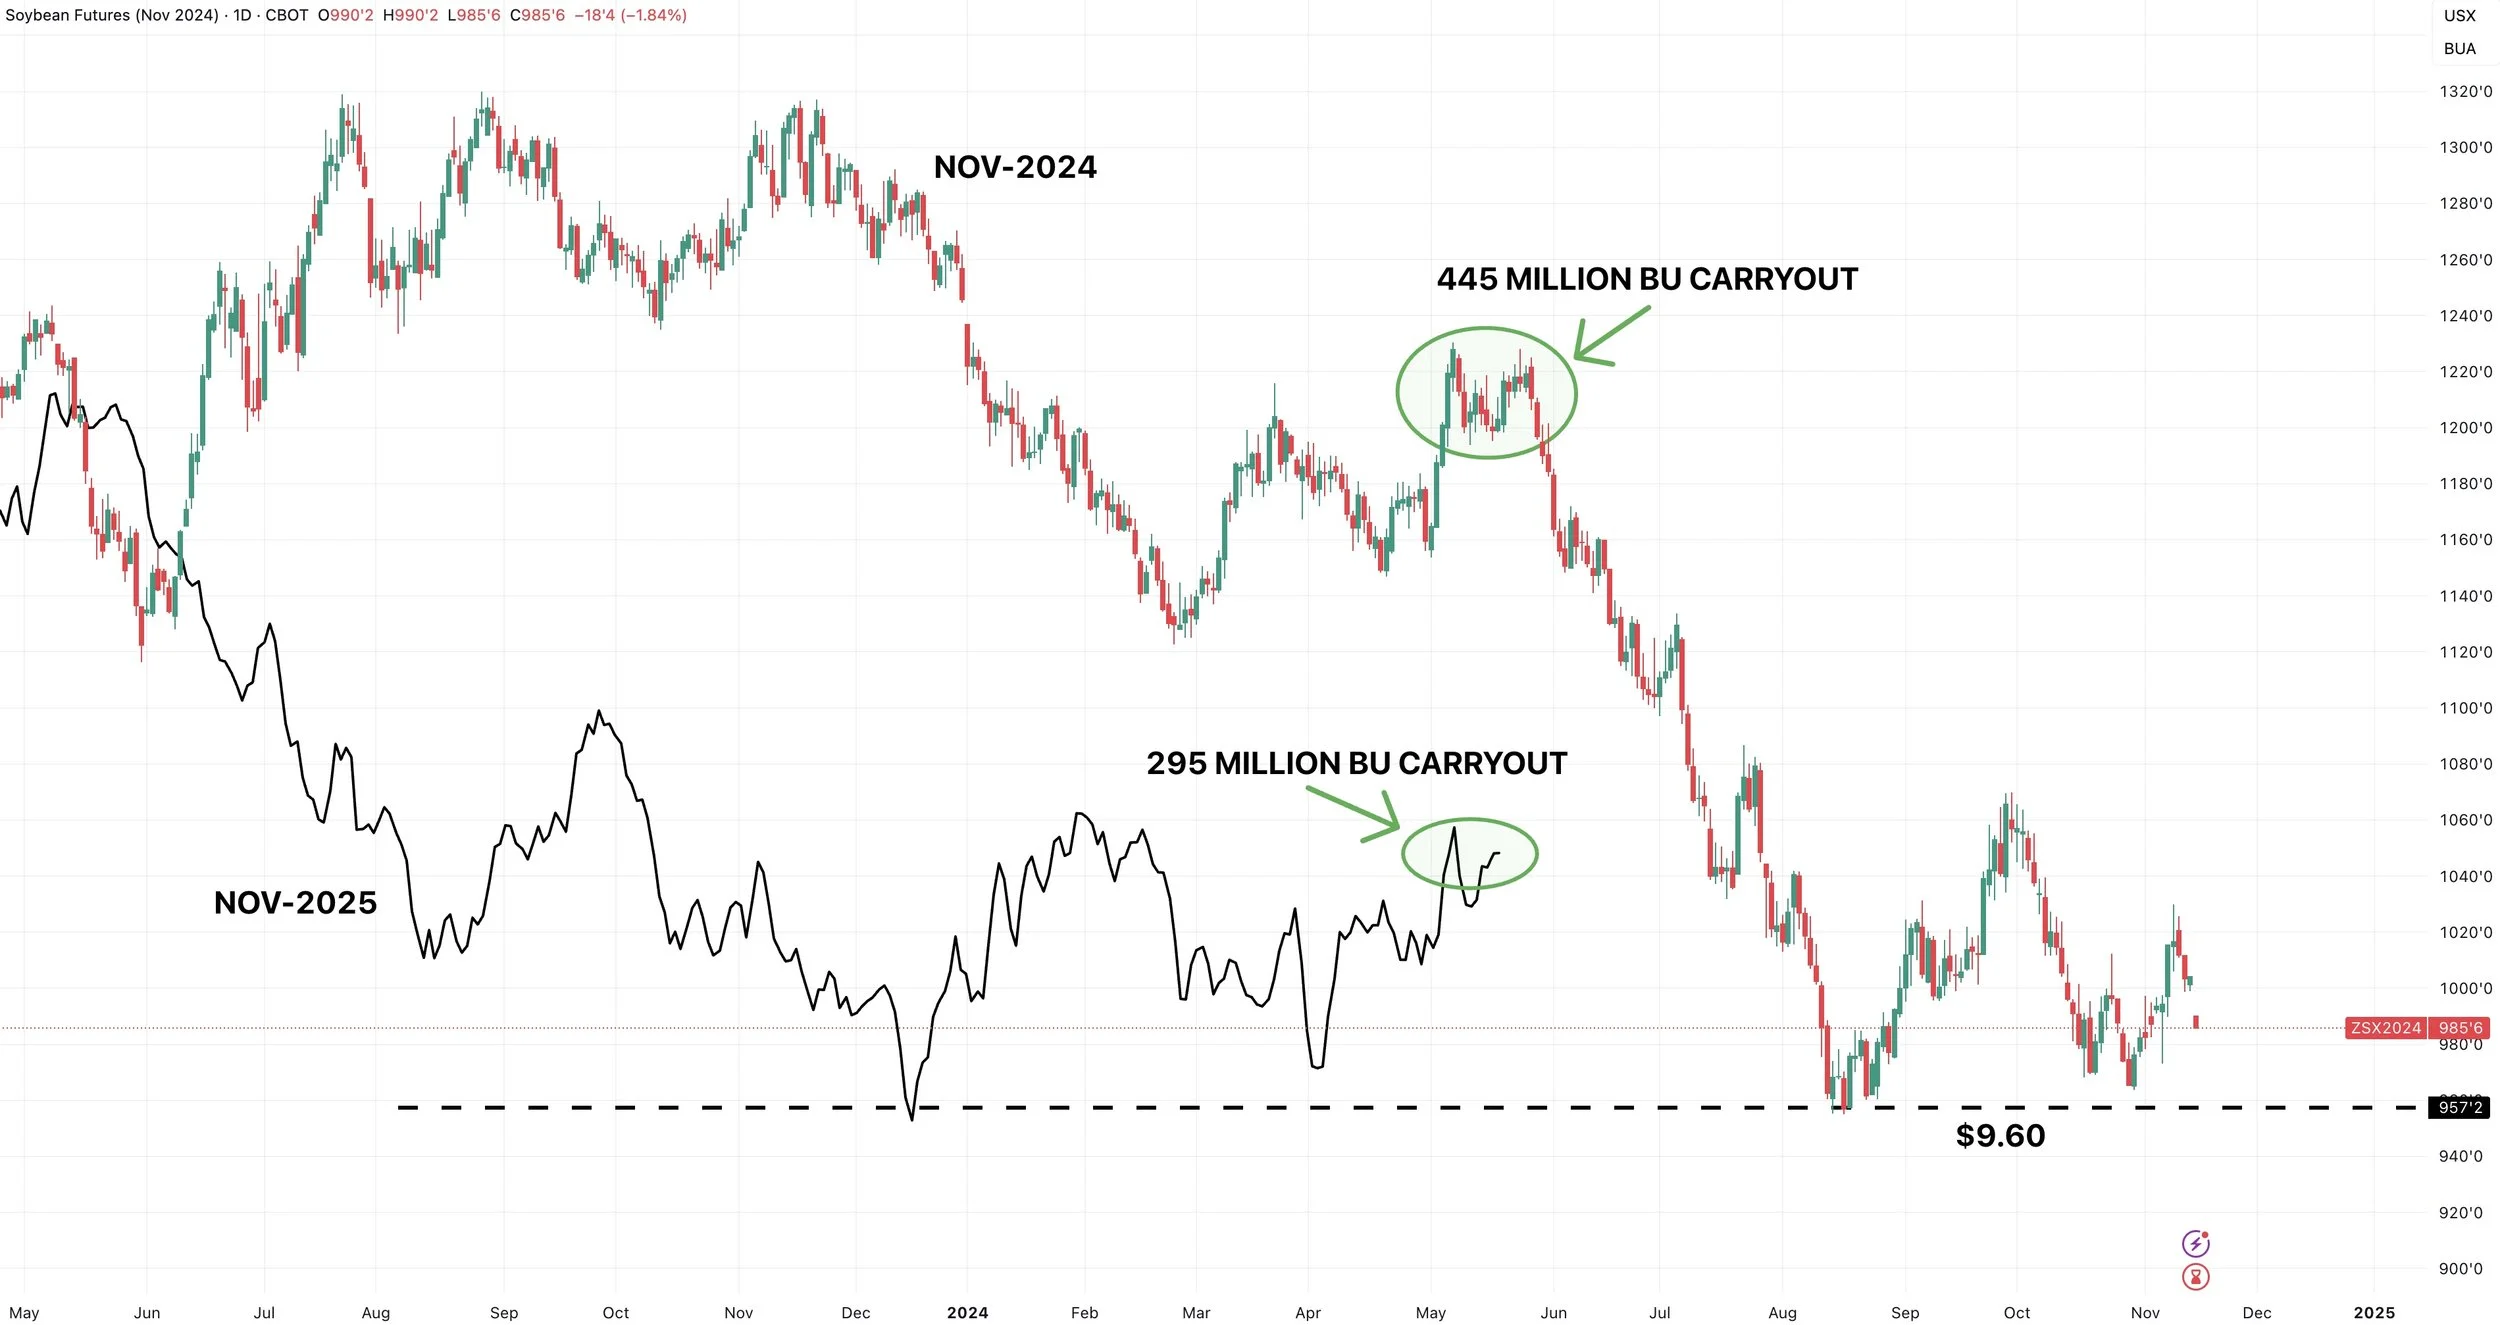
Here is a chart I showed last week, but this gives you a good visual on how soybeans are cheaper than last year despite our situation being tighter in the US.
We were at $12.00 this same time last year, yet US carryout is -35% lower than last May for new crop beans.
Our lows for Nov-2024 beans was $9.60
Our lows for Nov-2025 beans is also $9.60
Yet Nov-2025 beans have a much tighter story than Nov-2024 beans.
Technicals:
I've been talking about how if we broke below the 200-day MA we would visit this green box. Which we did.
The 200-day MA was major resistance in the past.
Since we broke above it, it was seen as new support.
When support gives out, it triggers sharp selling. Which is what we just saw.
We are now right at this golden retracement zone box (Gives back 50.61.8% of the rally from trade fear lows up to recent highs).
That is the most common spot for a correction to end.
This box is also old key support where we bounced several times since harvest.
A bounce in this box makes sense. This is a must hold level for soybeans, as there is very little support beneath here.
Upside target is still $11.04.
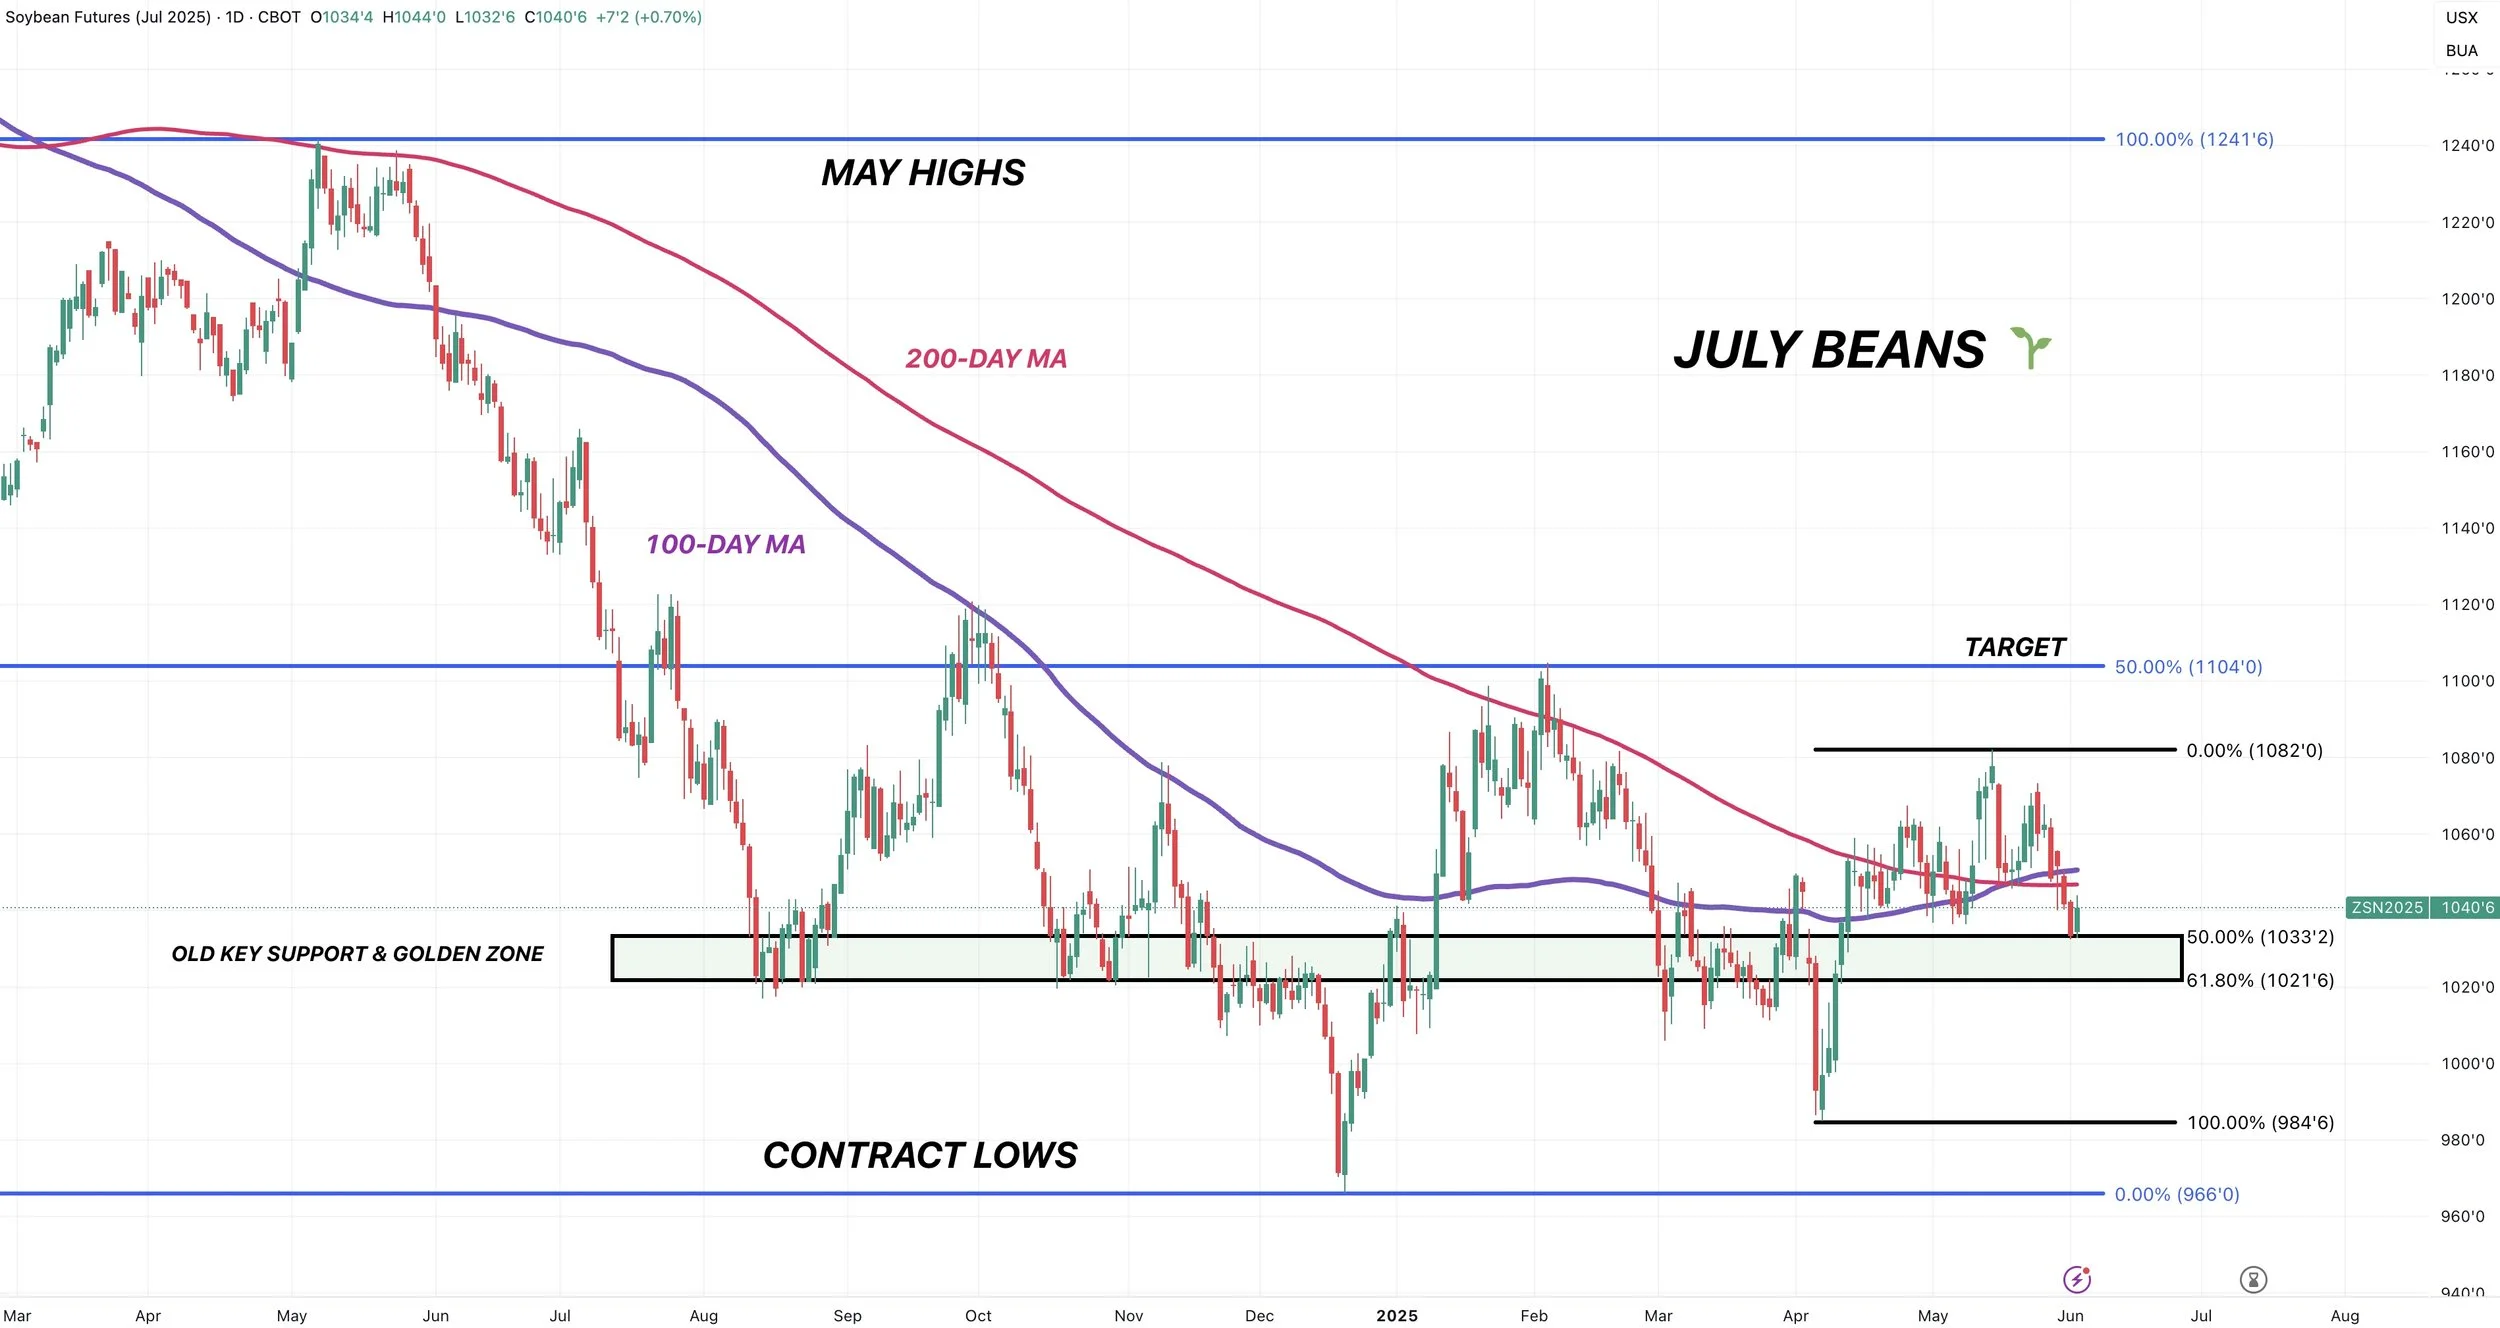
In case you were wondering, July soybeans are still close to posting a golden cross despite the recent sell off.
A golden cross happens when the 50-day MA crosses above the 200-day MA.
It indicates that long term trend is shifting higher.
We haven’t crossed yet, but should see it soon if soybeans can claw back above the 200-day MA.

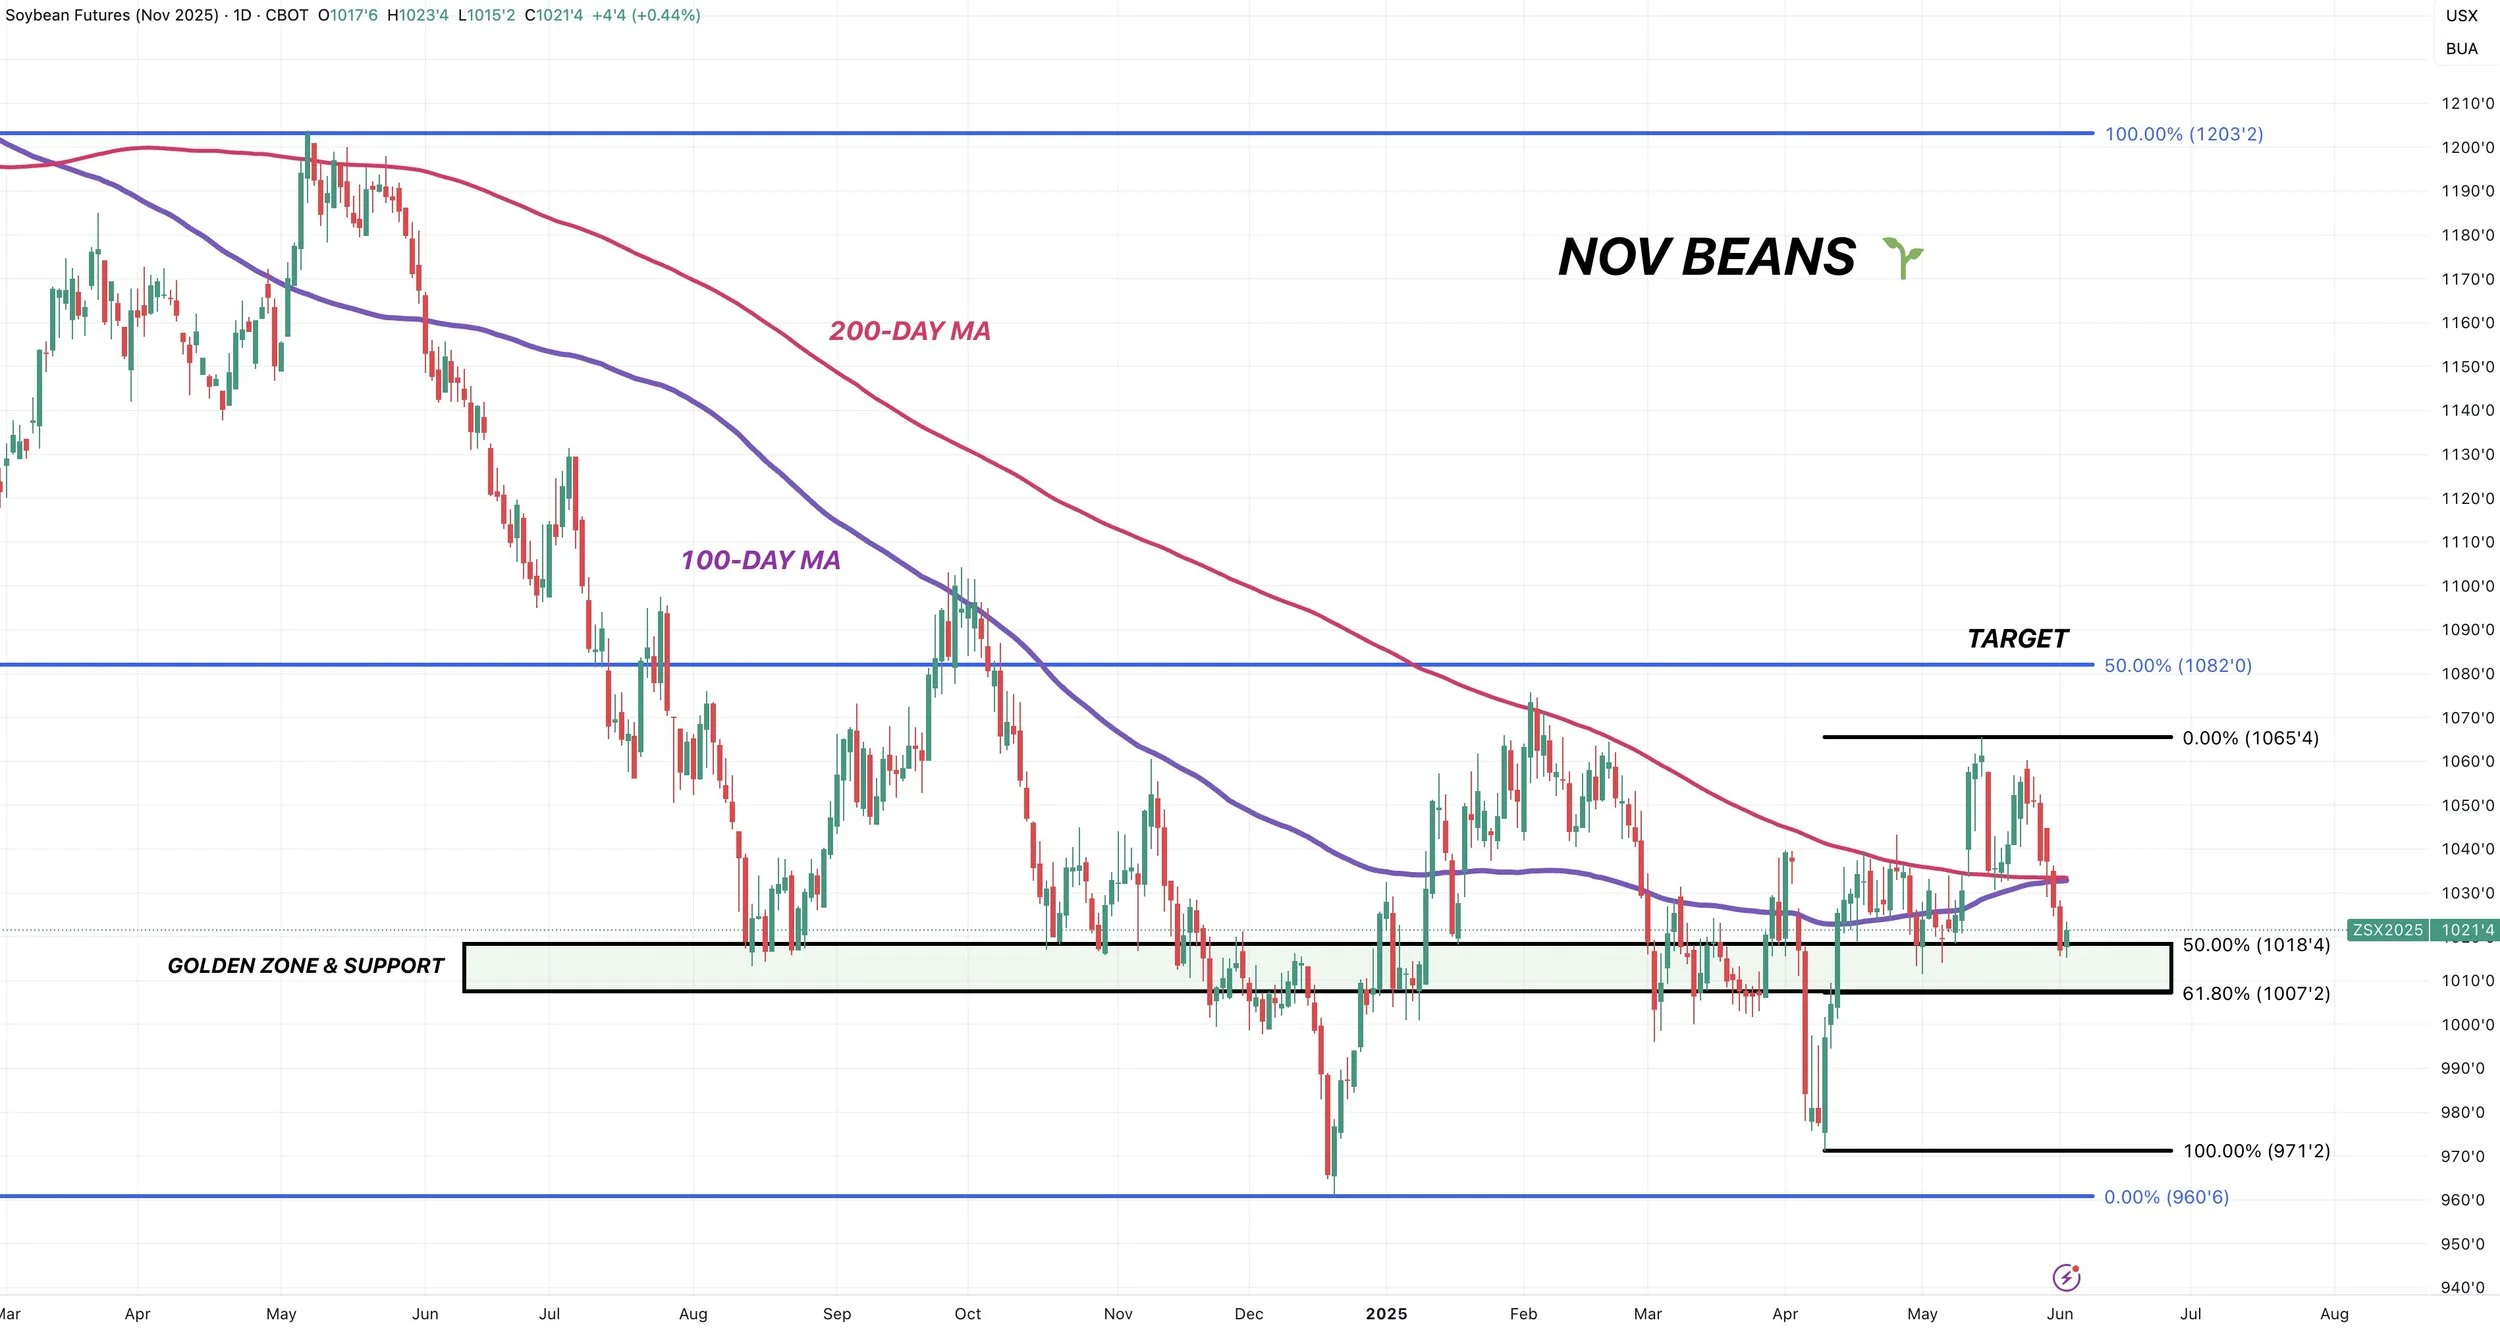
For Nov beans, we have the exact same set up as July beans.
We broke the 200-day MA so we are testing this golden retracement zone like I mentioned we would if we failed to hold the 200-day MA.
Like July, this is a must hold level. But finding a bottom here does make sense.
Upside target is still $10.80 range.
Wheat
Fundamentals:
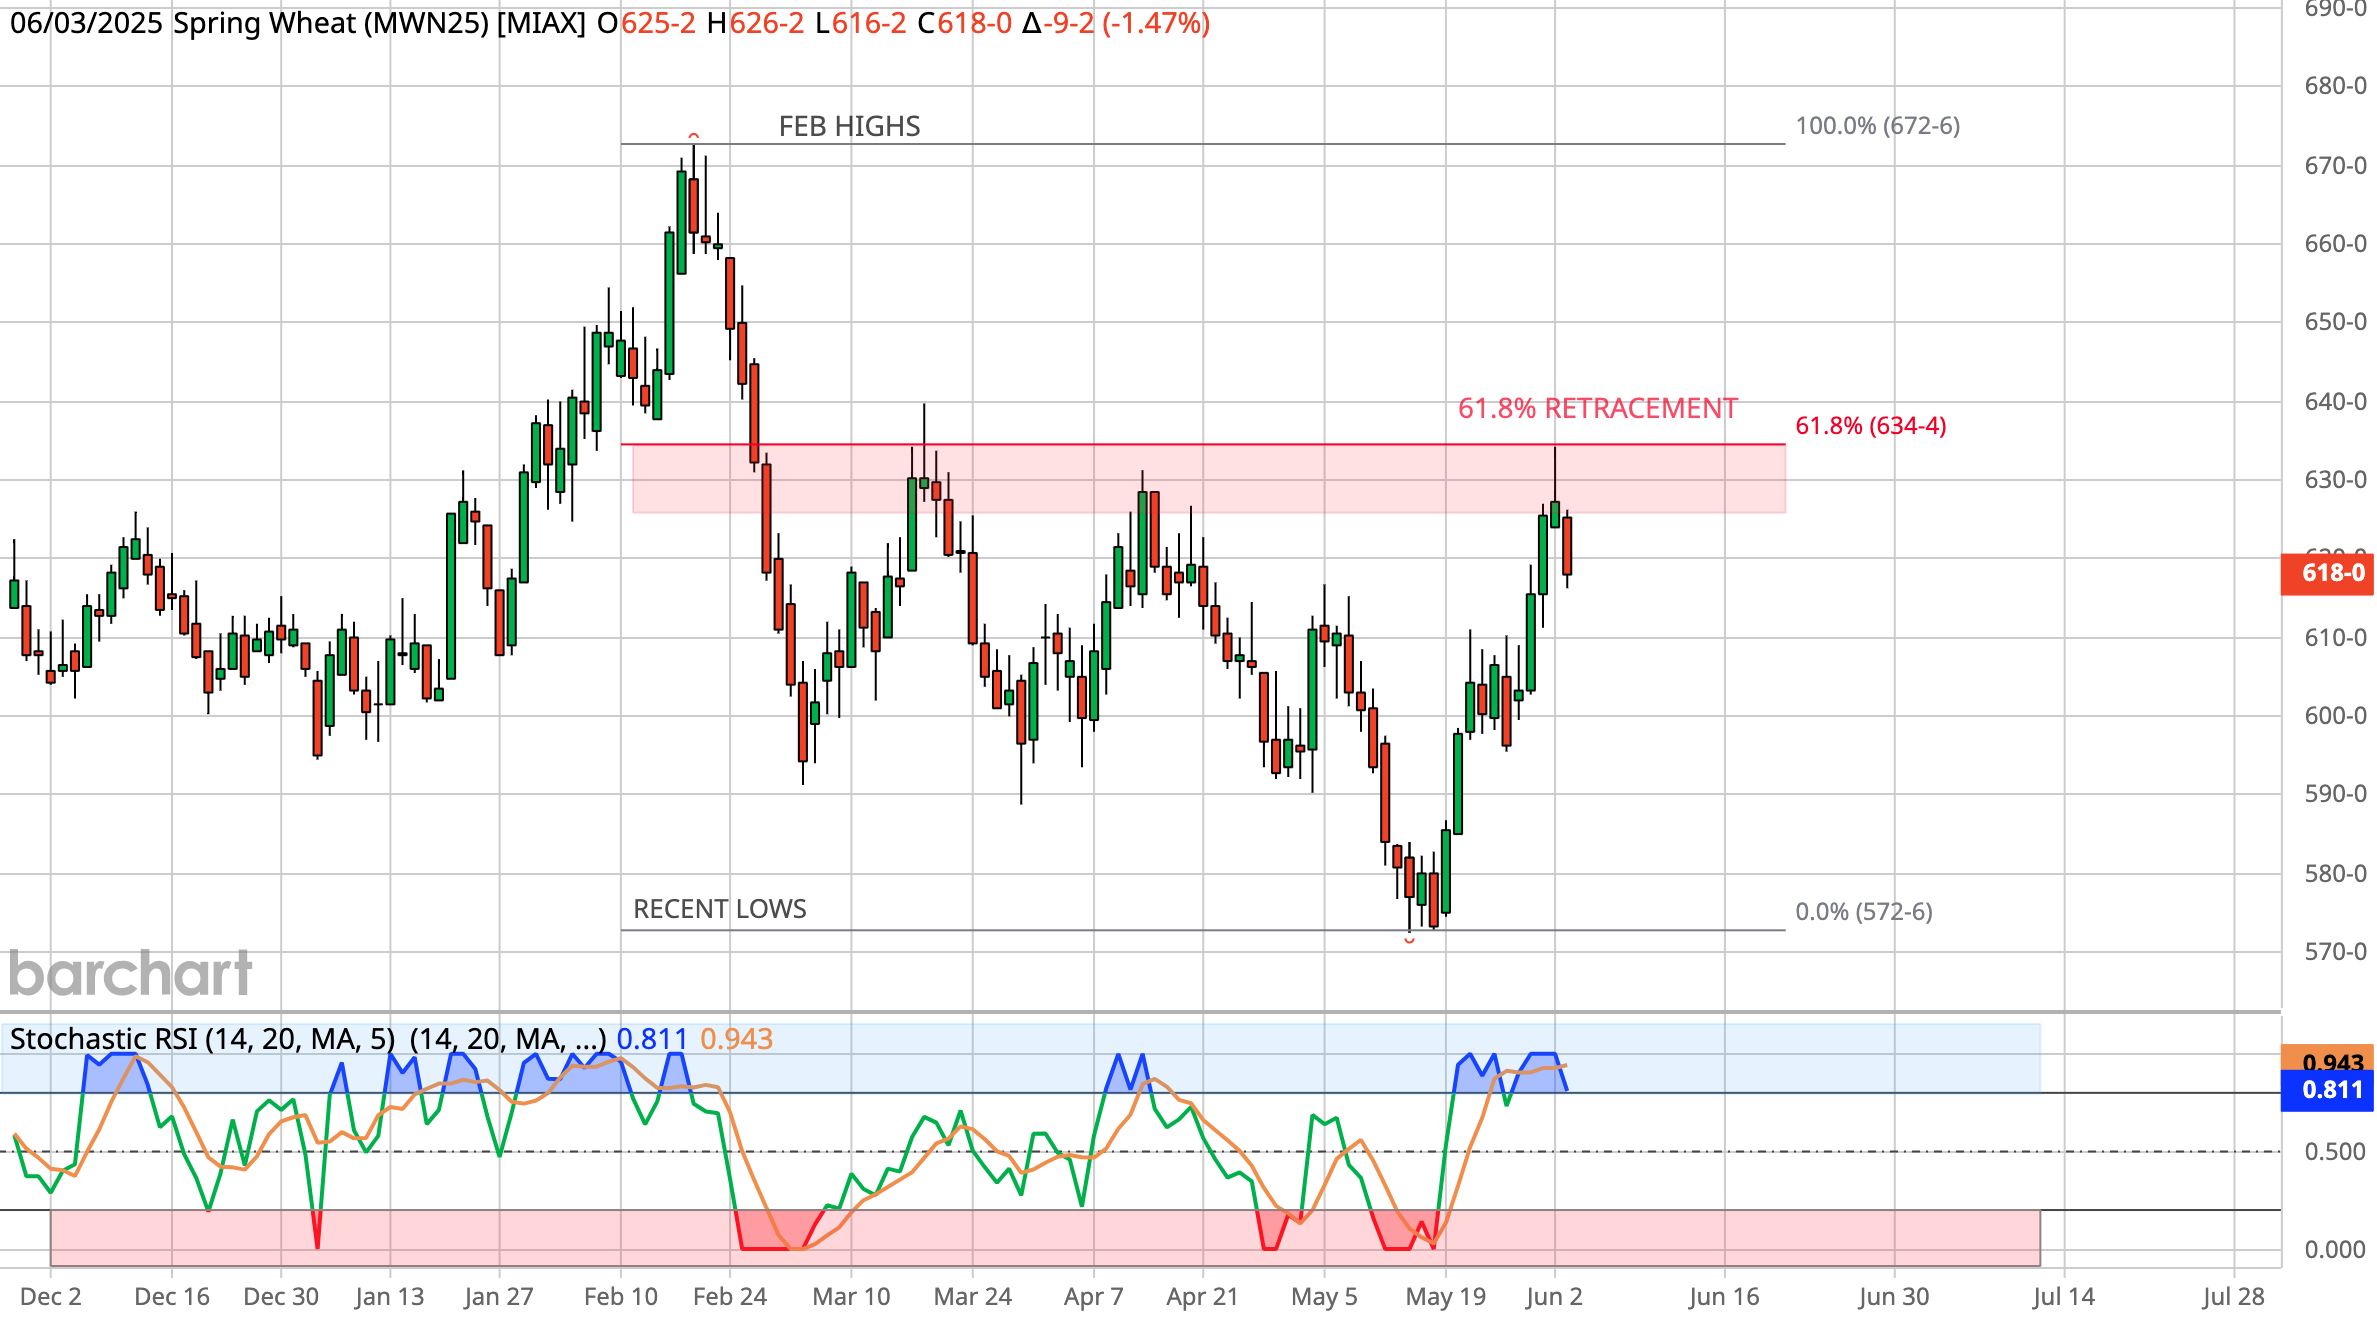
Yesterday we had a sell signal for spring wheat.
Why?
Spring wheat has ran harder than the other wheats, meaning it is overvalued in comparison.
We also hit a key spot on the charts.
We clawed back exactly 61.8% of the February highs. This area also marked our highs in March and April.
The stochastics were also overbought, suggesting this market could be running out of steam.
Here was the signal: CLICK HERE
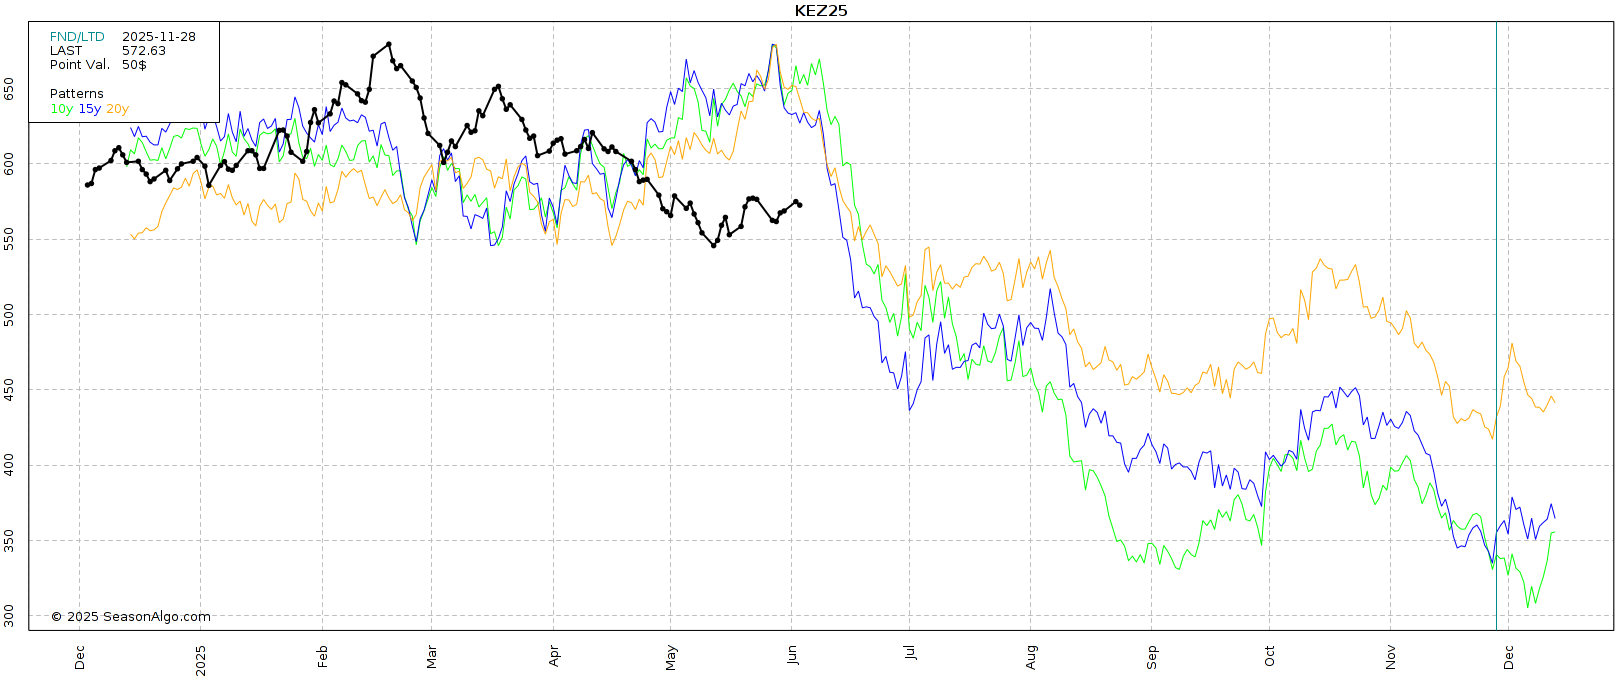
For KC wheat it is usually a hard task to rally into harvest. So I wouldn’t be surprised to see us struggle.
Seasonally we do sell off here pretty soon heading into harvest.
At the same time, the funds are record short this market.
At some point, they will look to cover.
Like I said, rallying into harvest can be hard. But once harvest is out of the way I think we could see some short covering that leads to a rally.
As the funds just won’t have a major reasont to keep pounding the shorts once harvest is out of the way.

Technicals:
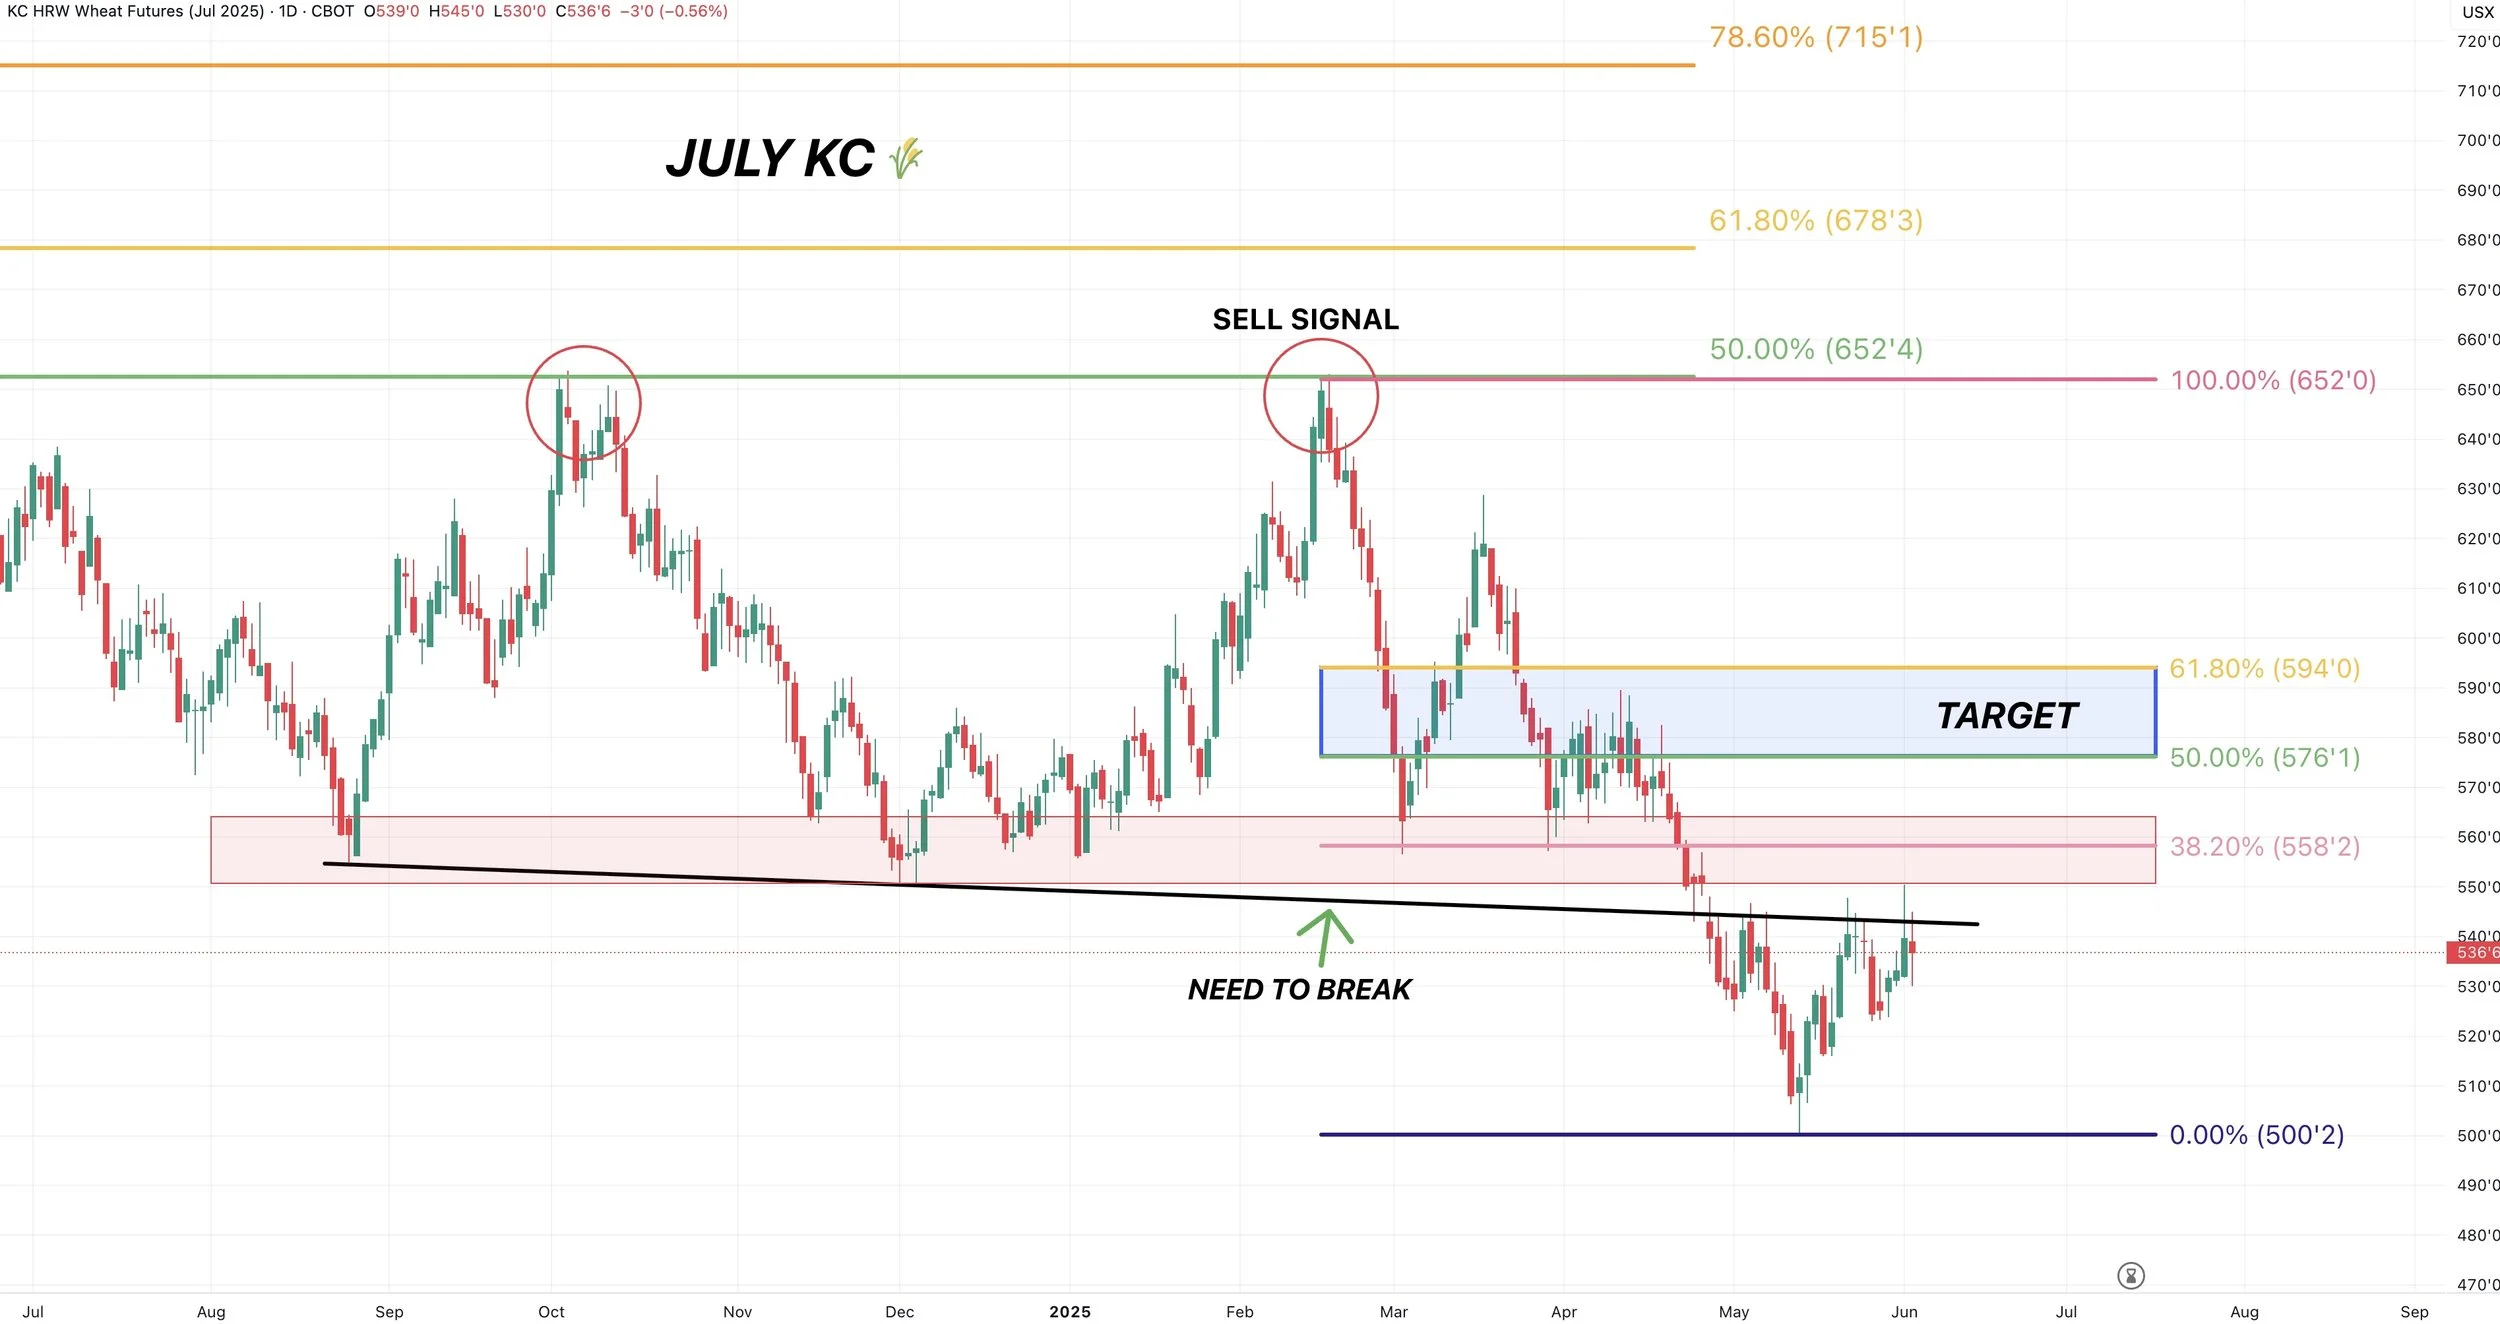
For KC wheat, we do have a potential bullish inverse head & shoulders pattern.
This implied move for this is around $5.95
We need to break above the neckline to get confirmation we are going higher.

KC rejected right off this old support trendline that is now resistance.
(Old support = new resistance).
If we can break above that, I like our chances of moving higher.
Target is still going to be $5.75 to $5.94
$5.94 also happens to be the implied move of that inverse head & shoulders pattern as well.
Next target for July chicago is still $5.70 to $5.85
If we break $5.55 then I think it confirms we go higher. As that is the 38.2% retracment to the Feb highs. Next retracements are then $5.70 and $5.85

Past Sell or Protection Signals
We recently incorporated these. Here are our past signals.
April 10th: 🌽
Old crop corn sell signal.
March 19th: 🐮
Cattle hedge & sell signal.
Feb 18th: 🌽 🌾
Old crop KC wheat & old crop corn signal.
Jan 23rd: 🌽 🌱
Corn & beans old crop sell signal.
CLICK HERE TO VIEW
Jan 15th: 🌽 🌱
Corn & beans hedge alert/sell signal.
Jan 2nd: 🐮
Cattle hedge alert at new all-time highs & target.
Dec 11th: 🌽
Corn sell signal at $4.51 200-day MA
CLICK HERE TO VIEW
Oct 2nd: 🌾
Wheat sell signal at $6.12 target
Sep 30th: 🌽
Corn protection signal at $4.23-26
Sep 27th: 🌱
Soybean sell & protection signal at $10.65
Sep 13th: 🌾
Wheat sell signal at $5.98
May 22nd: 🌾
Wheat sell signal when wheat traded +$7.00
Want to Talk?
Our phones are open 24/7 for you guys if you ever need anything or want to discuss your operation.
Hedge Account
Interested in a hedge account? Use the link below to set up an account or shoot Jeremey a call at (605)295-3100.