
KEY REVERSALS. ALL EYES ON TUESDAY
MARKET UPDATE
You can scroll to read the usual update as well. As the written version is the exact same as the video.
Timestamps for video:
USDA: 0:00min
Corn: 8:20min
Corn Charts: 11:10min
Beans: 13:30min
Bean Charts: 15:35min
Wheat: 17:05min
Cattle: 18:00min
Want to talk?
Office: (806)484-1214
Want to start getting every update & signal?
Futures Prices Close
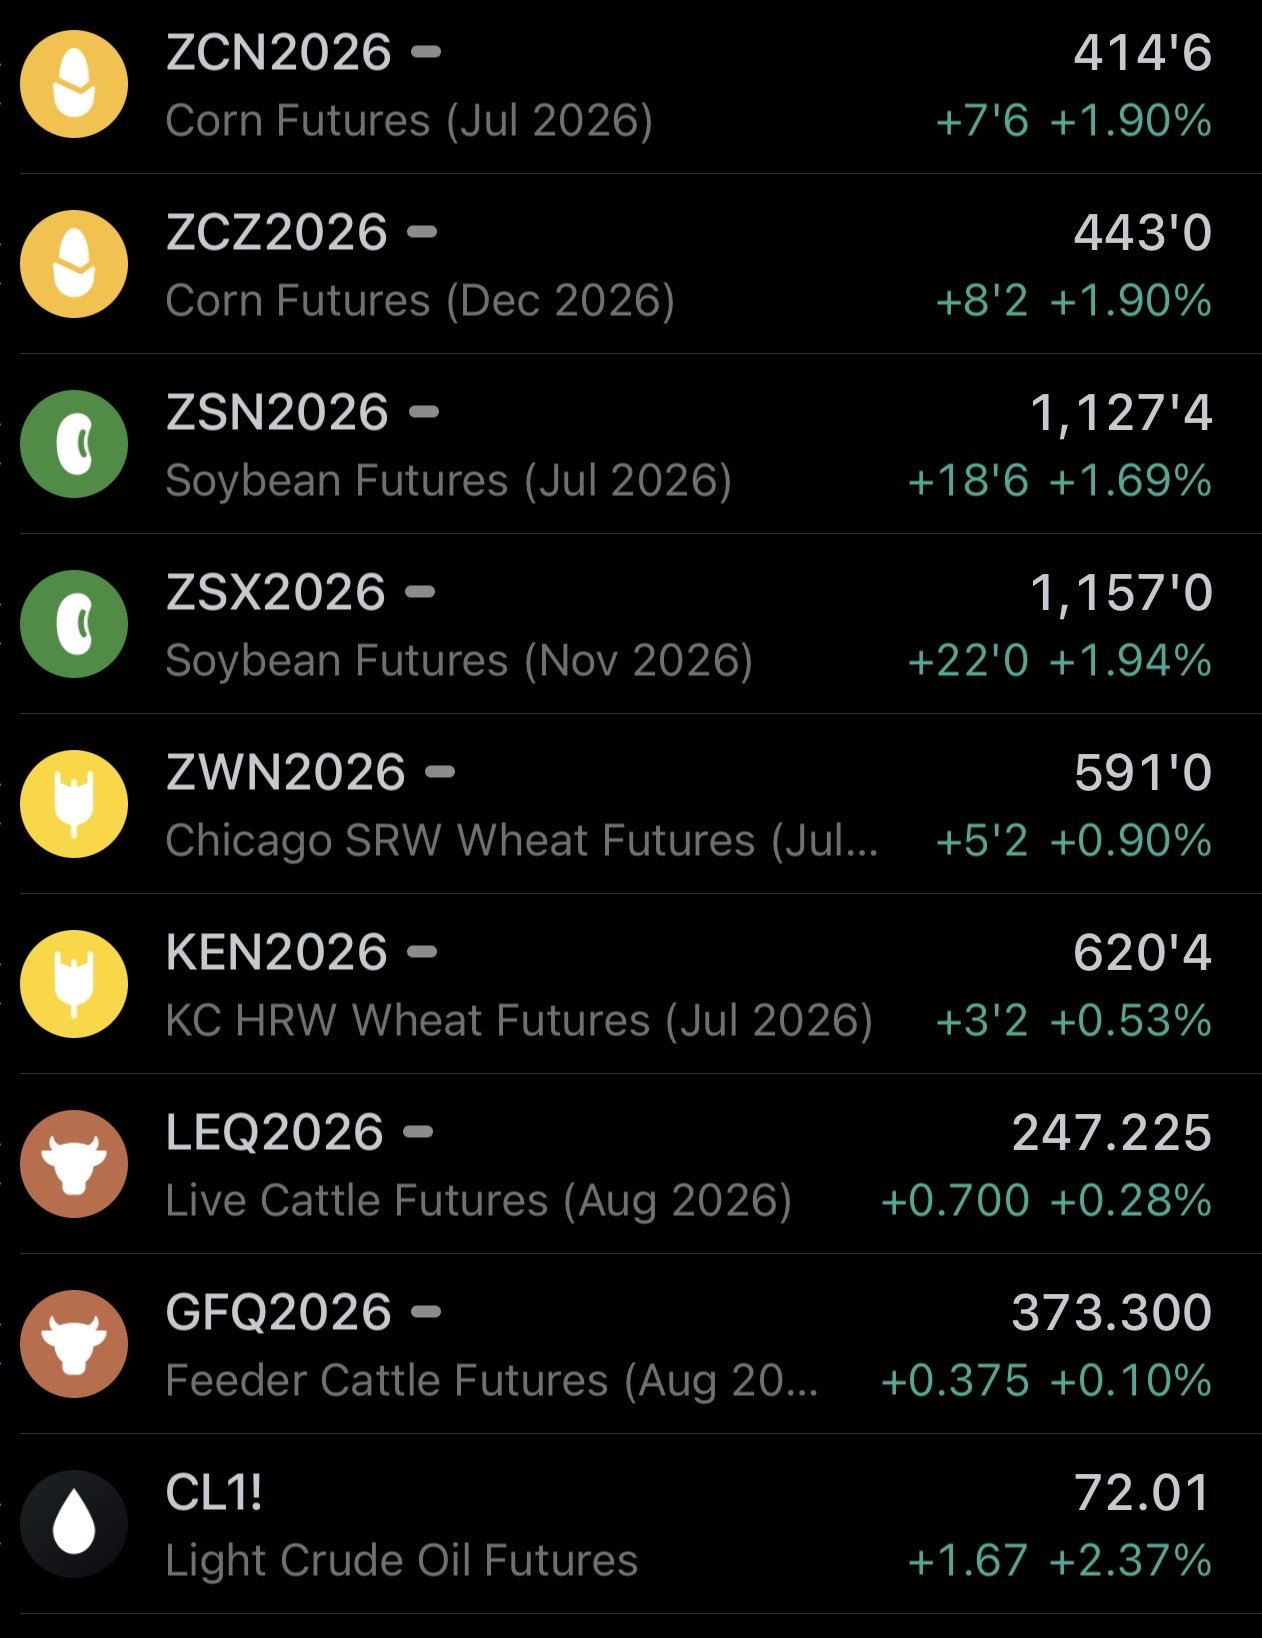
Overview
Grains higher across the board. Corn and wheat both posted new lows overnight, but reversed higher.
We had some solid price action today.
Corn and soybeans both posted their best day since May 18th when we had that intial China news. As corn left some key reversals on the charts which we'll go over later.
All eyes are really going to be on Tuesday's report.
This report has the potential to be one of the biggest of the entire year.
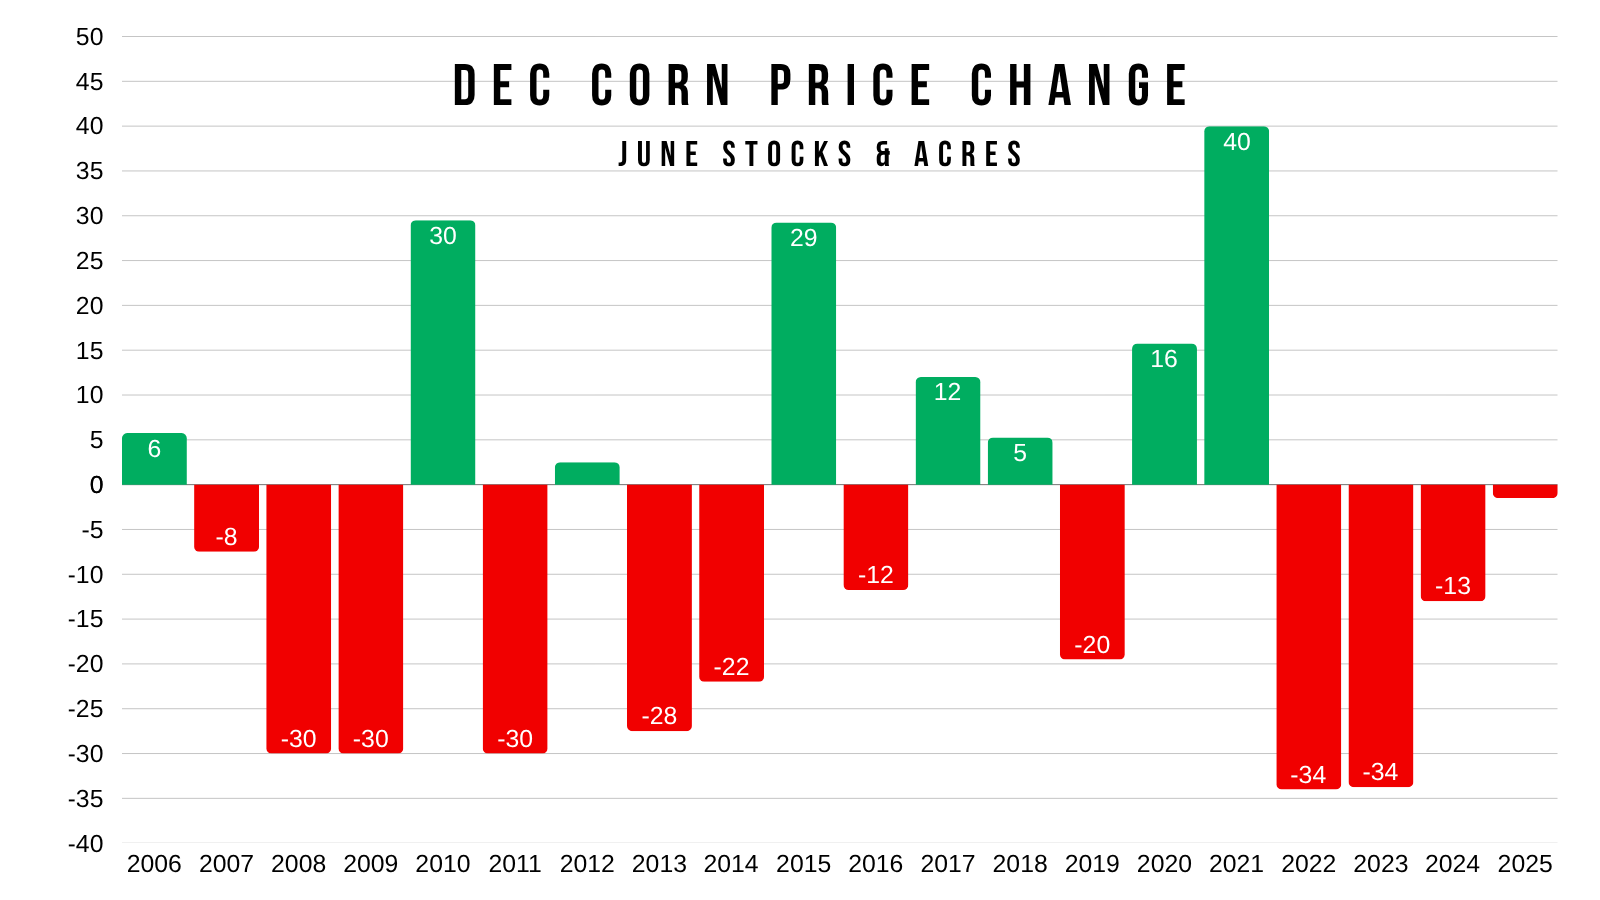
History of June 30th USDA
How big of mover?
Like we talked about earlier this week, this report can be massive.
The last few years have been relatively quiet in comparison, but there are several years where this report led to a limit type of move.
The average move for corn is +/- 20 cents.
Dec corn is $4.40 today. That means on average, the day of the report could take us to $4.60 or $4.20.
Something to note is that 2/3rds of the time this report has been bearish for corn, but this of course hasn’t been your typical year with the fertilizer situation and everything else going on.
We've traded lower 4 years in a row now. The longest streak we've had.
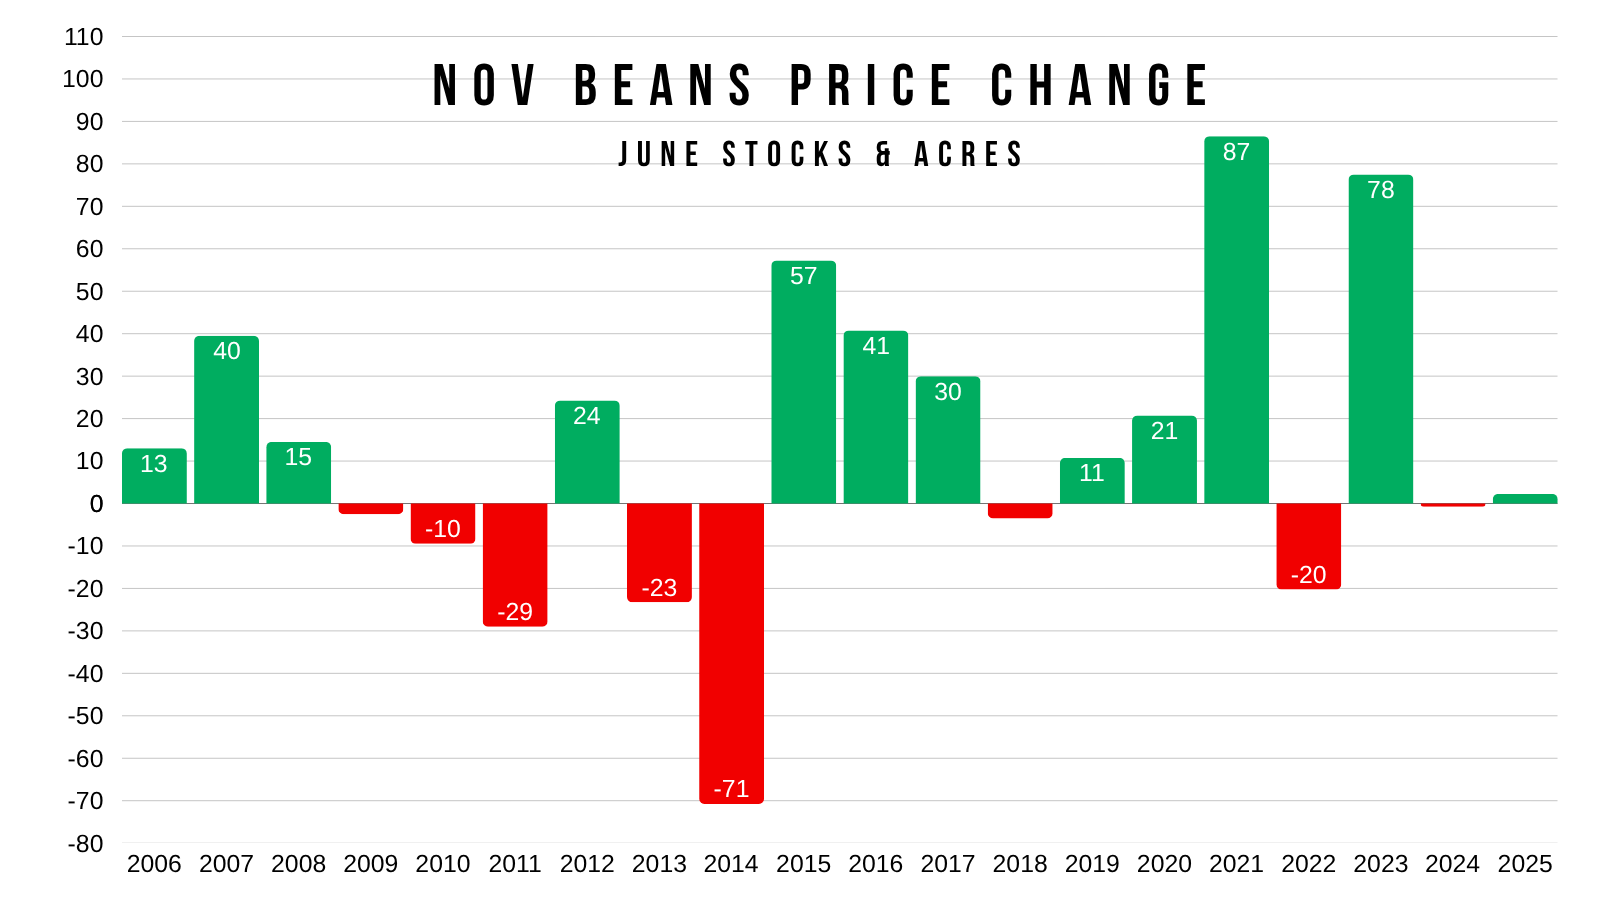
The average move for soybeans is +/- 28 cents.
Opposite of corn, this report has been bullish more than it's been bearish for soybeans.
It's been friendly the last 8 of 11 years.
But again, this isn’t a normal year either.
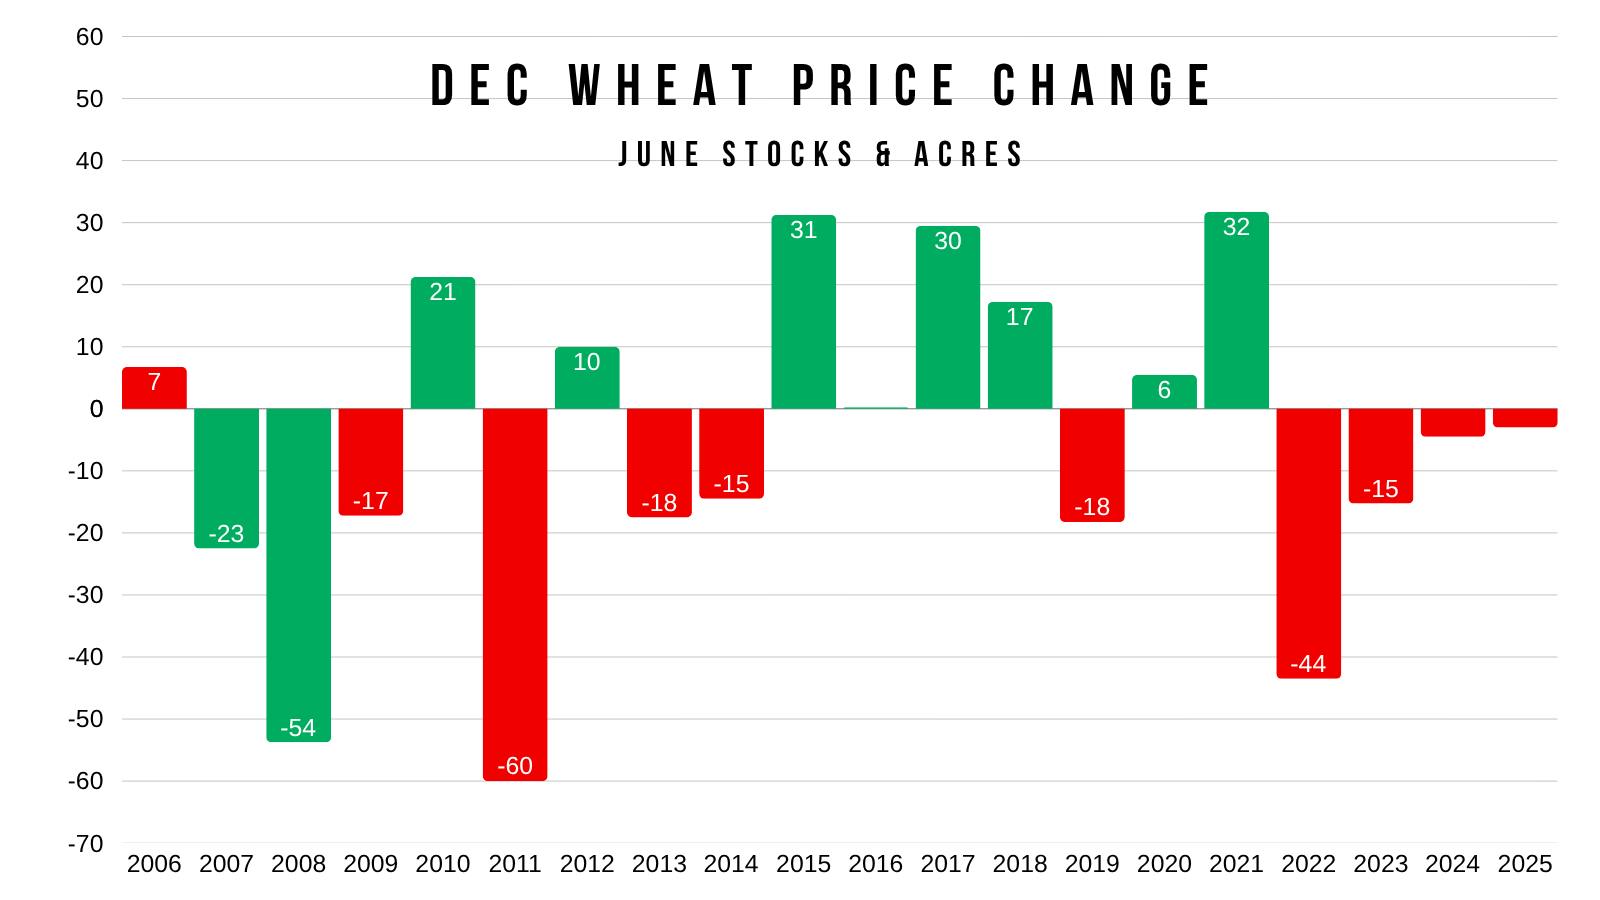
The average move for wheat is +/- 22 cents.
Wheat has been a coin flip over the last 20 years, but we've now traded lower 4 years in a row.
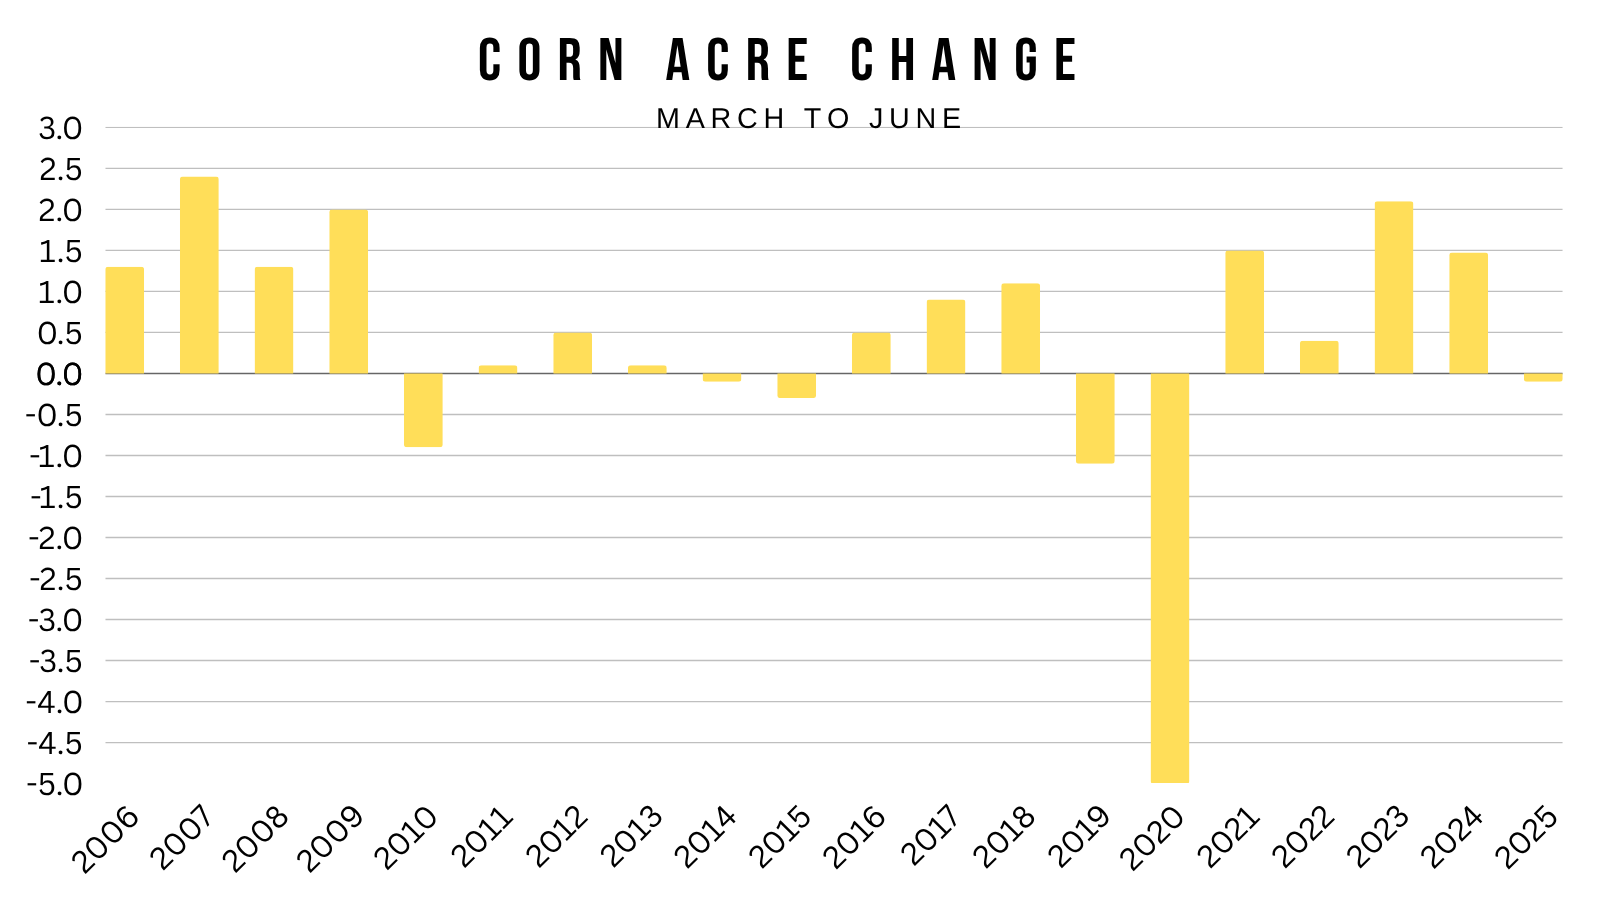
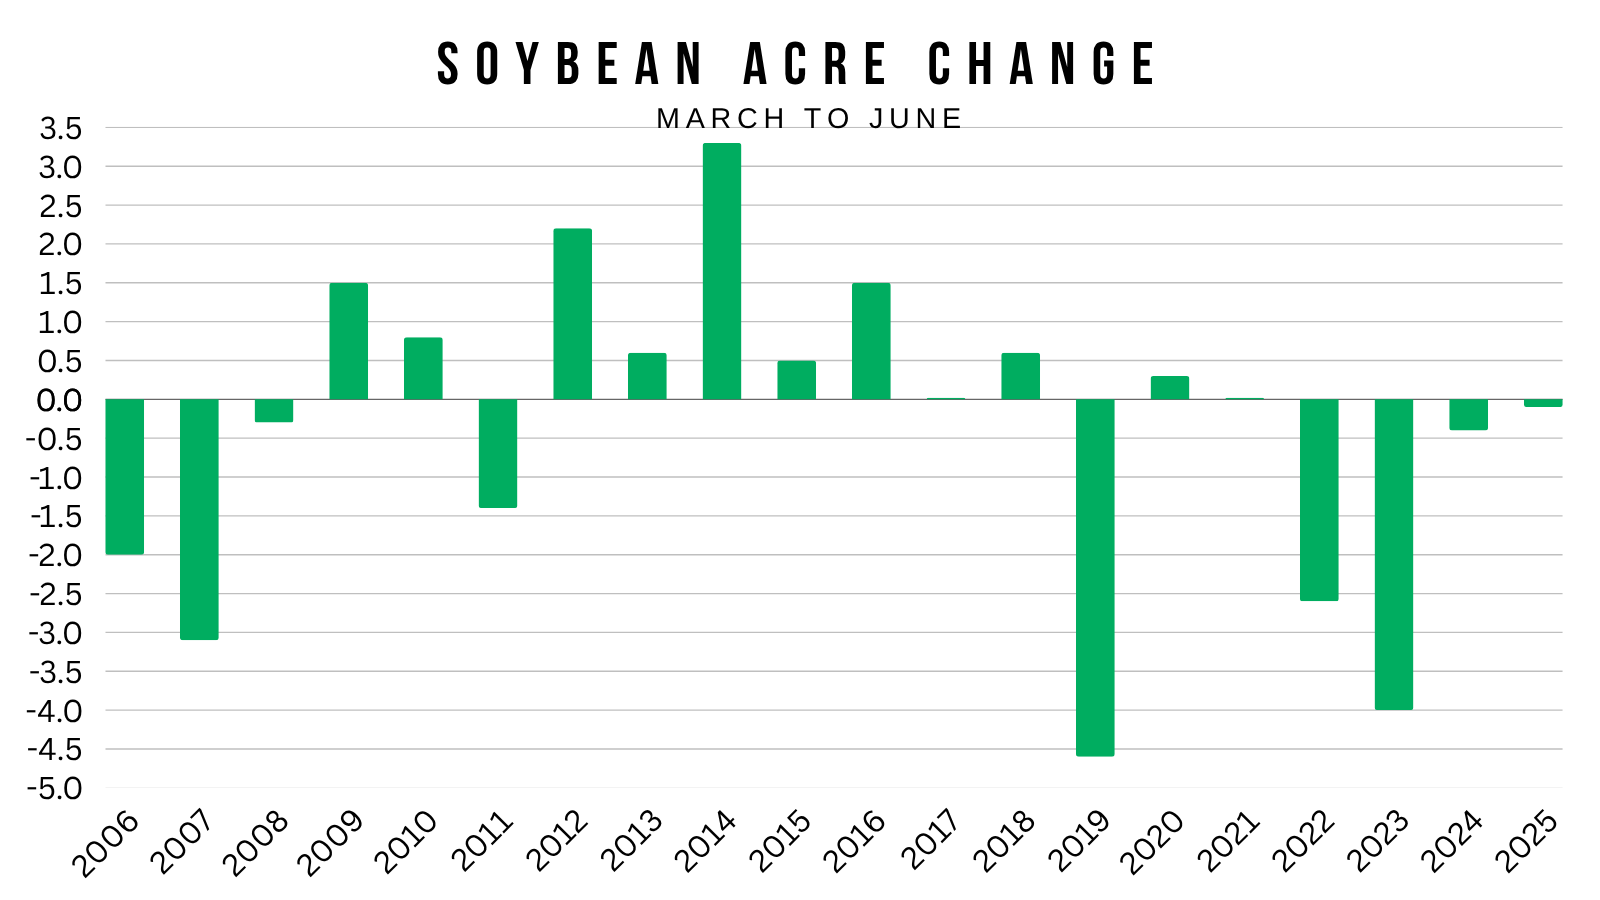
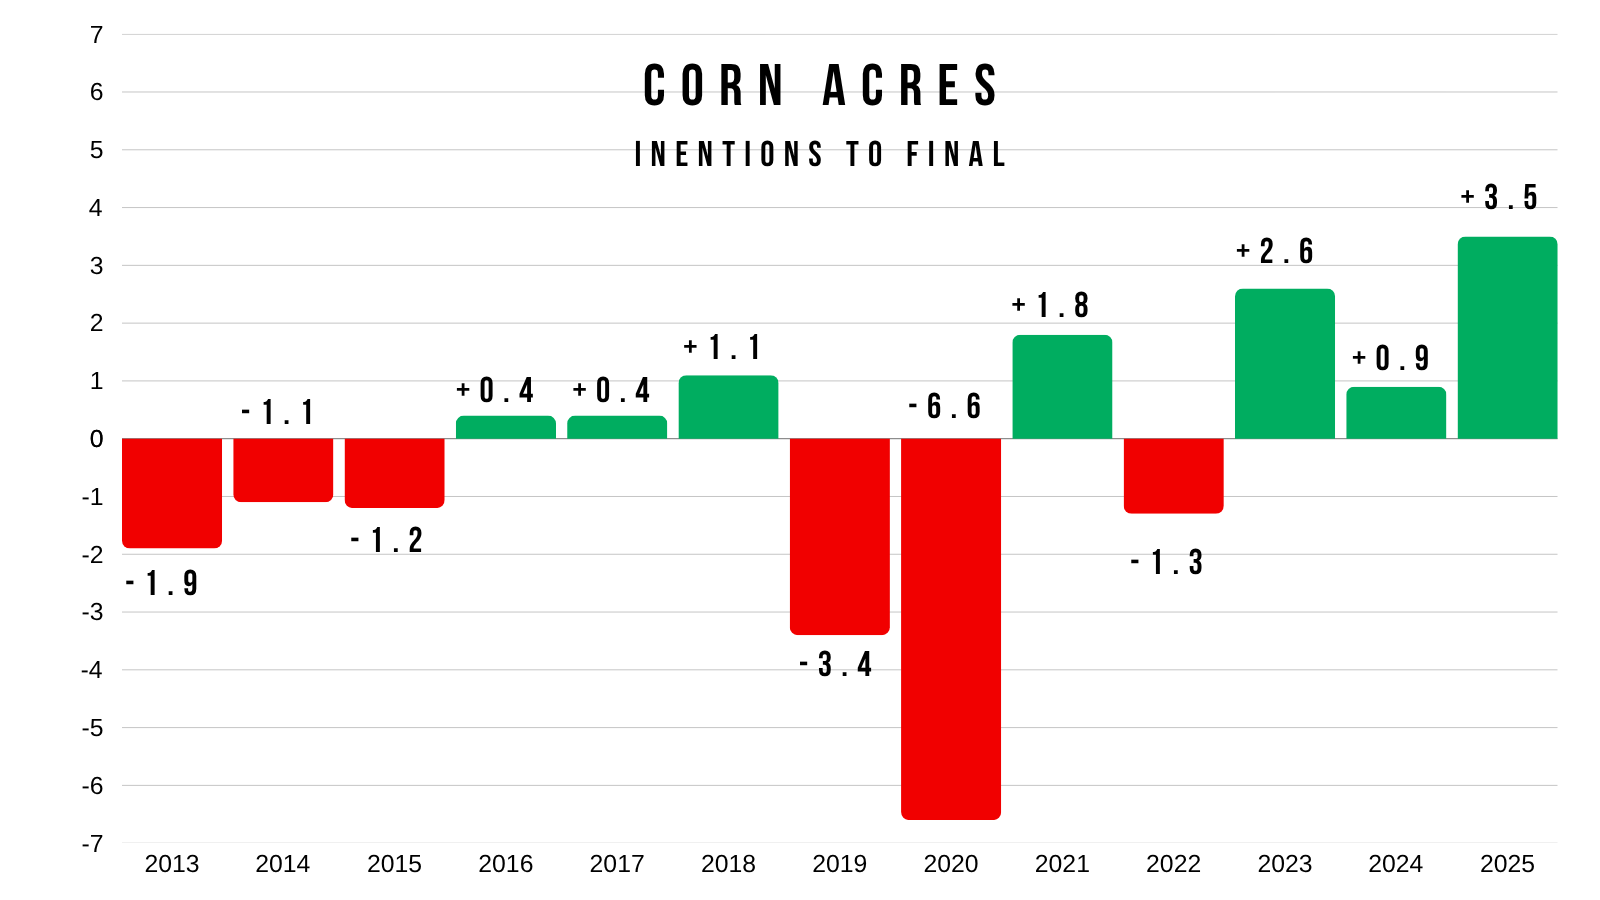
March to June History:
These next charts show our acre changes from March to June.
The USDA rarely lowers corn acres from March to June, and as of recently they have rarely raise bean acres.
In the last 20 years, we've only seen the USDA drop corn acres by more than 1 million twice.
The USDA hasn’t raised bean acres by more than 1 million since 2016.
But again.. none of these had a war in the middle east and fertilizer crisis in March either.
Which is why I ultimately think acres come down for corn and more than likely come up for soybeans whether that happens next week or not.
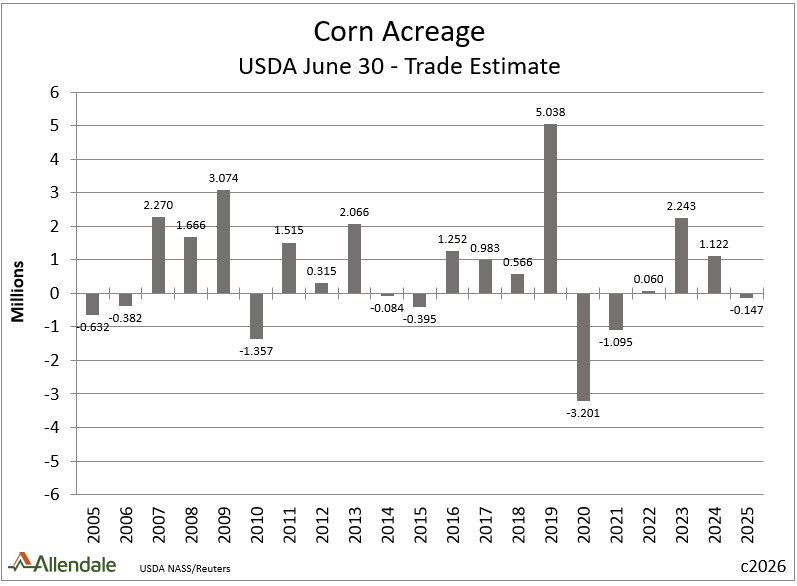
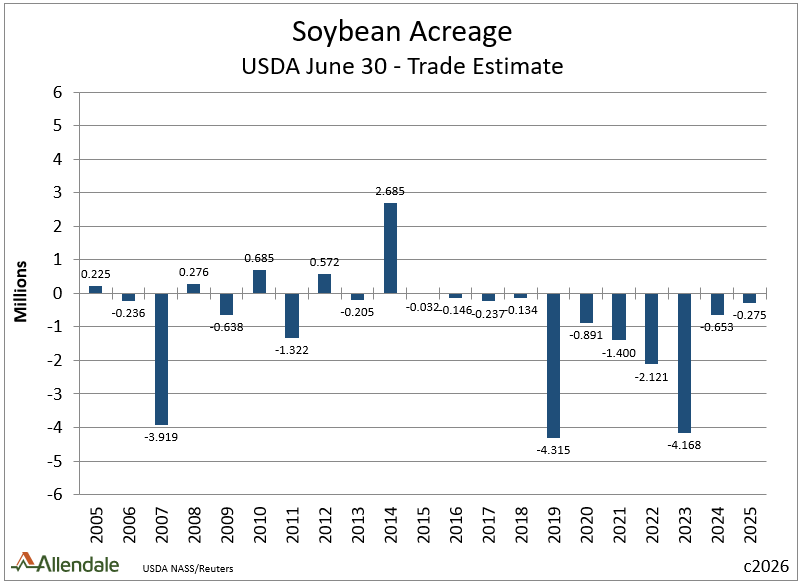
Acres vs Estimates History:
Here are two great charts from Rich Nelson of Allendale I'd thought I'd share as well.
These show where the USDA's acres came in at vs the estimates the last few decades.
The USDA of course has a history of putting corn acres higher than the estimates. With a history of putting soybean acres lower than the estimates.
The USDA's soybean number has came in below the pre-estimates 11 years in a row now.
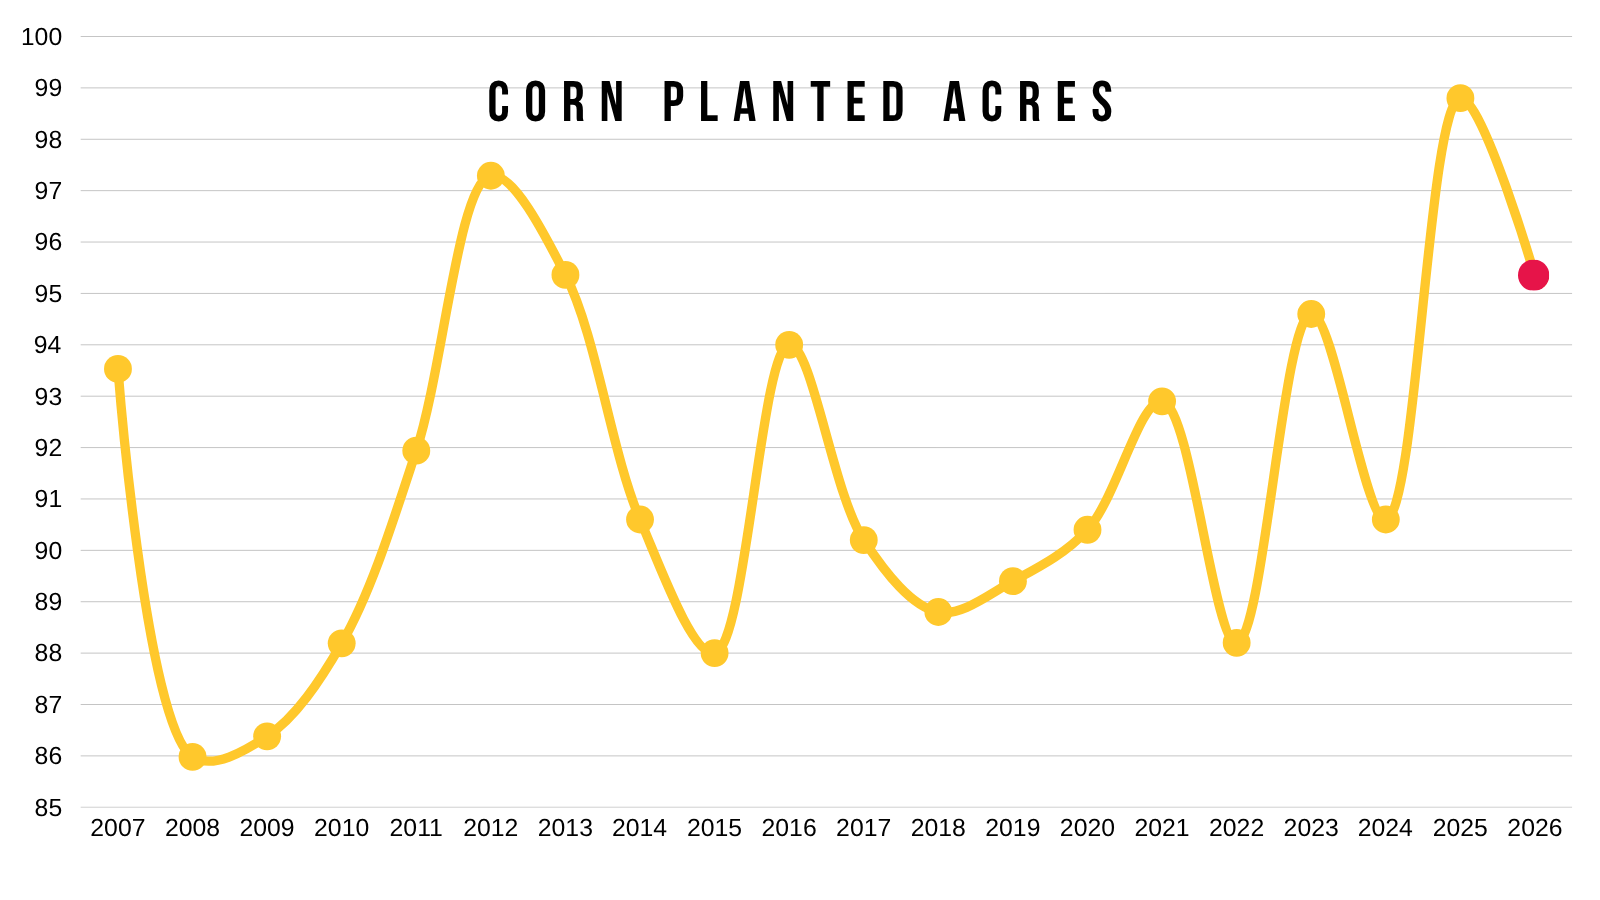
The Acre Estimates:
Corn
Estimate: 95.10 million
March: 95.34 million
Range: 94 to 97
Soybeans
Estimate: 85.20 million
March: 84.70 million
Range: 84 to 86.20

What has happened after the report?
This report is obviously a massive market mover.
But has it ever completely shifted the trend in the markets?
What has happened after this report whether it was bullish or bearish?
Let's do a rapid fire run down through the years.
First for corn. For all of these we will be showing Dec corn.
2025:
The report was a dud. One of the few years we didn’t move at all.
It changed nothing.
We saw a mini pop a few days later going into that 4th of July weekend. But then crashed the Monday after the 4th before ultimately heading lower until early August.

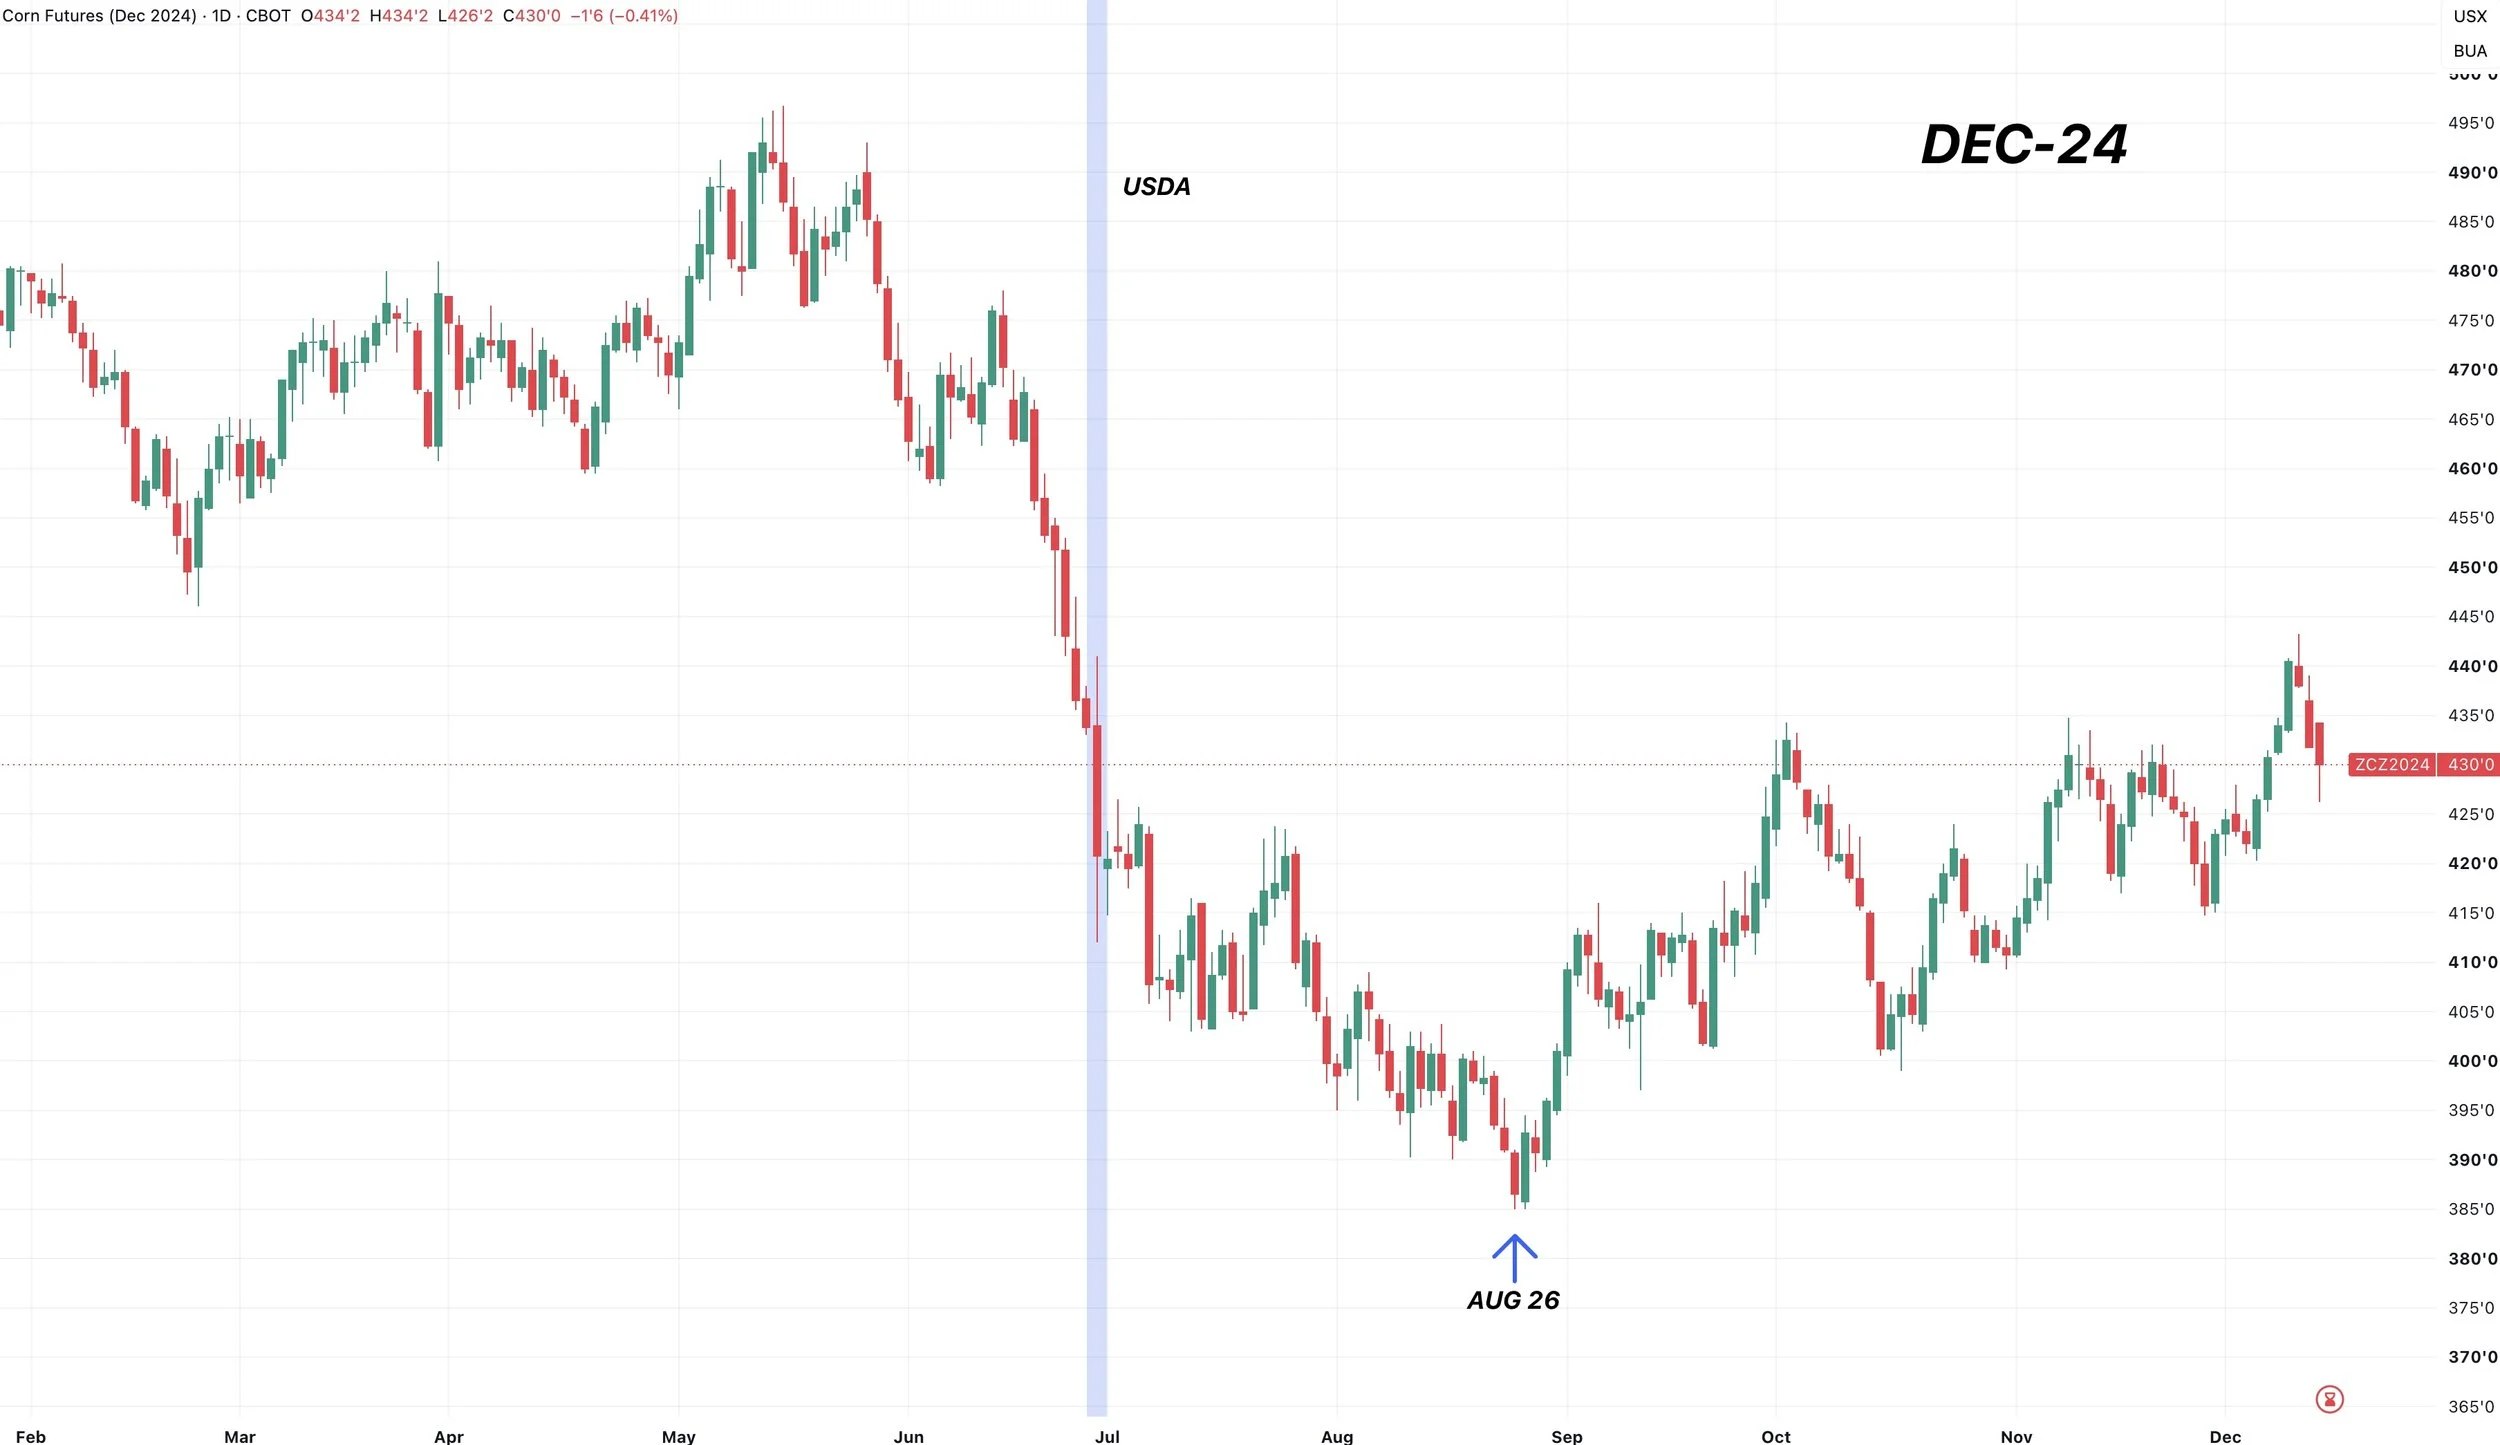
2024:
We sold off going into the report. We also sold off the day of the report.
We then went lower until late August.
Moving on.
2023:
We sold off hard the day of the report, but we were coming off that weather scare in June already on a free fall.
We had a second weather rally in July.
But the report didn’t really change anything.

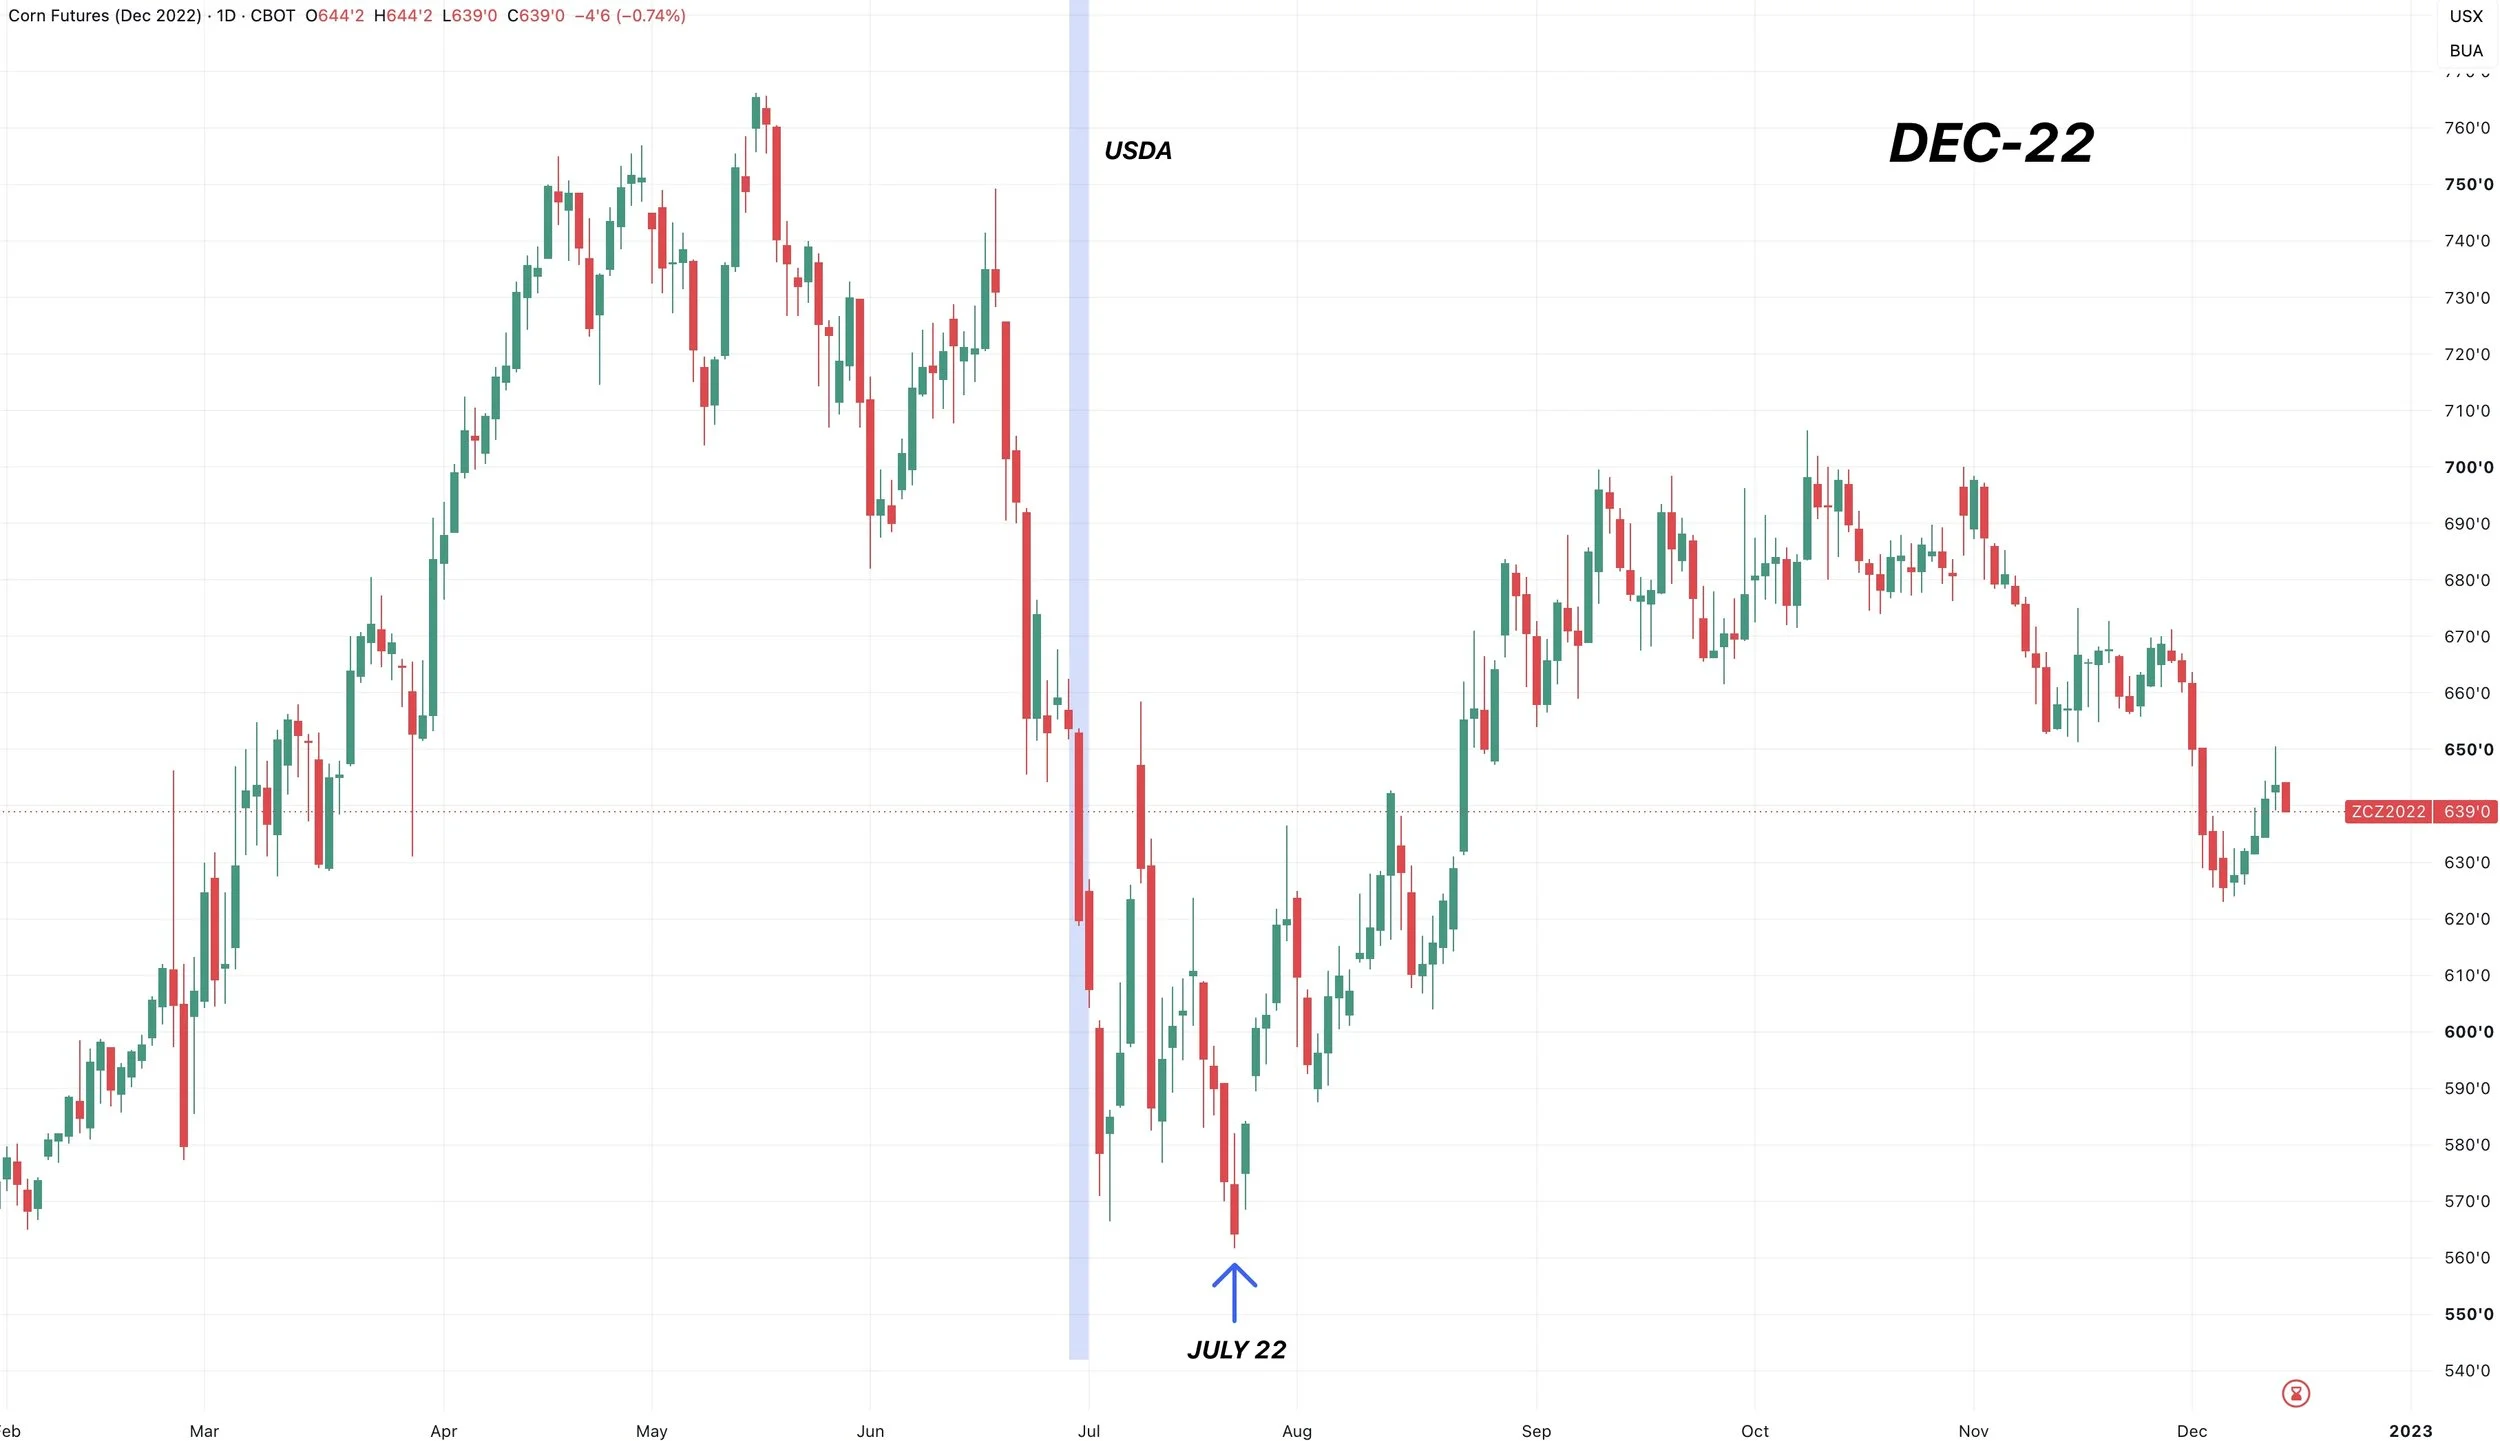
2022:
We were selling off going into the report.
The report then sparked another near $1.00 sell off before bottoming in late July.
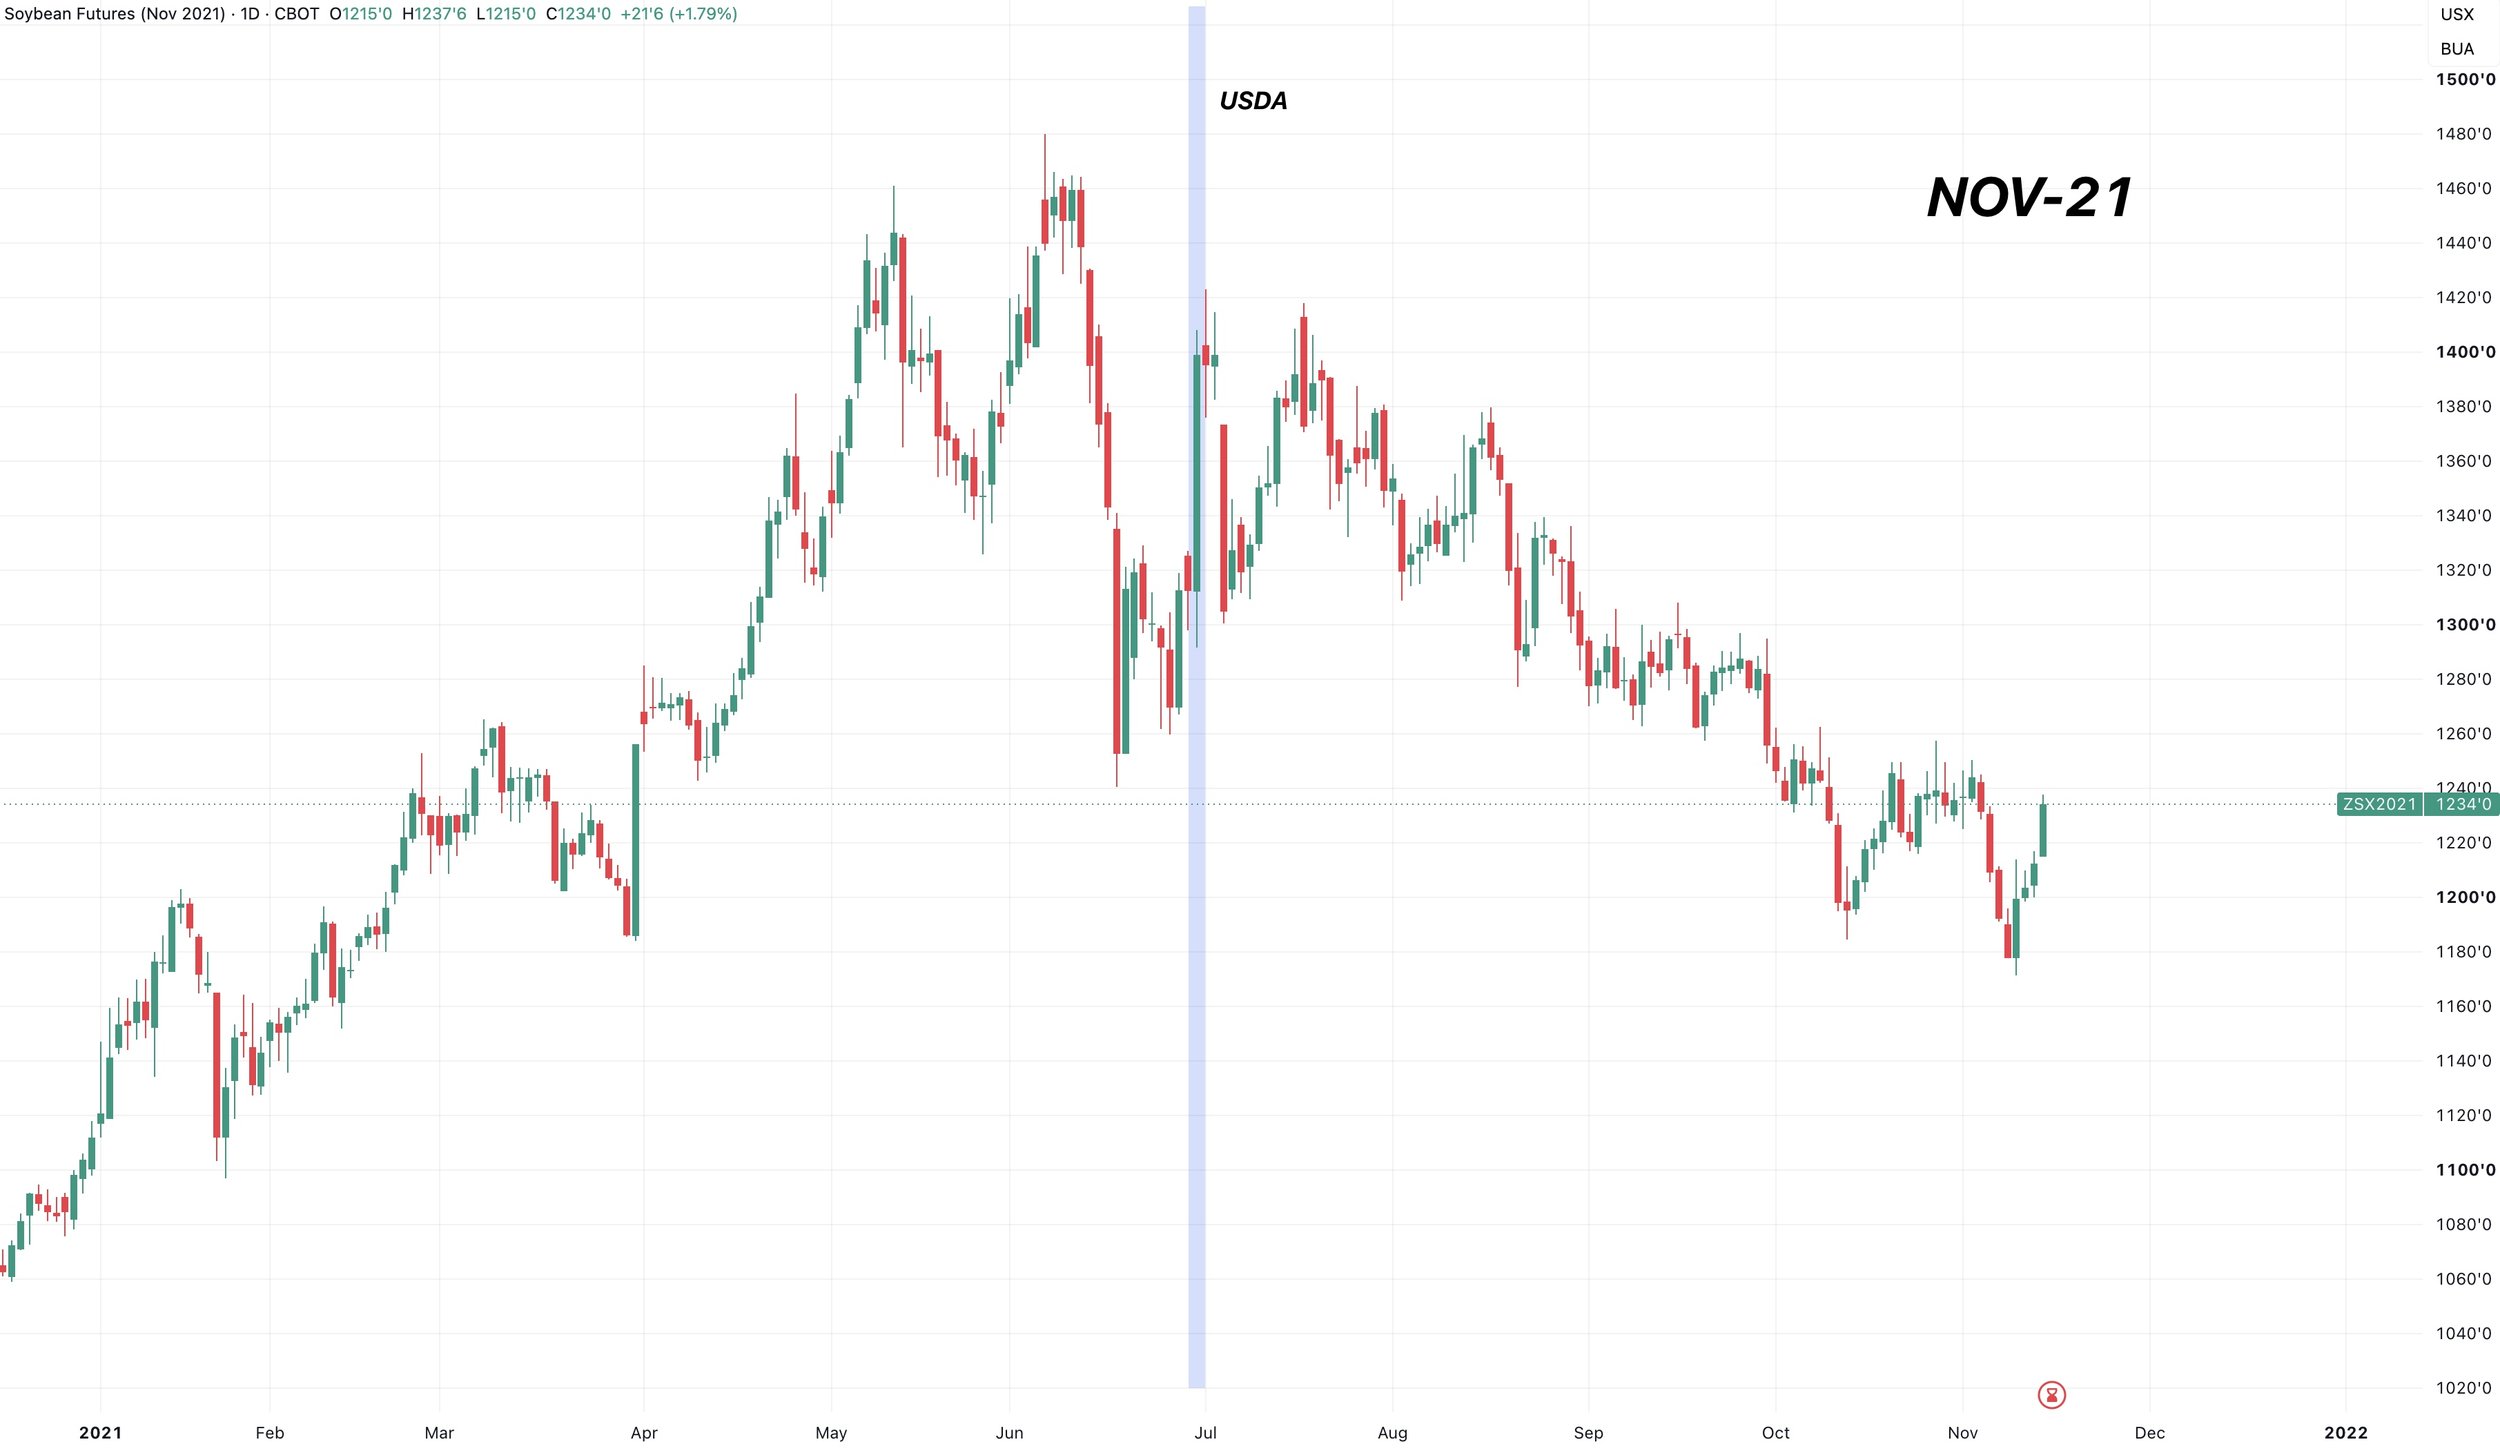
2021:
This was the last time we had a limit day move on this report.
However, it actually wound up marking the highs.
Bullish report, but did not change the trend. It was viewed as an opportunity.

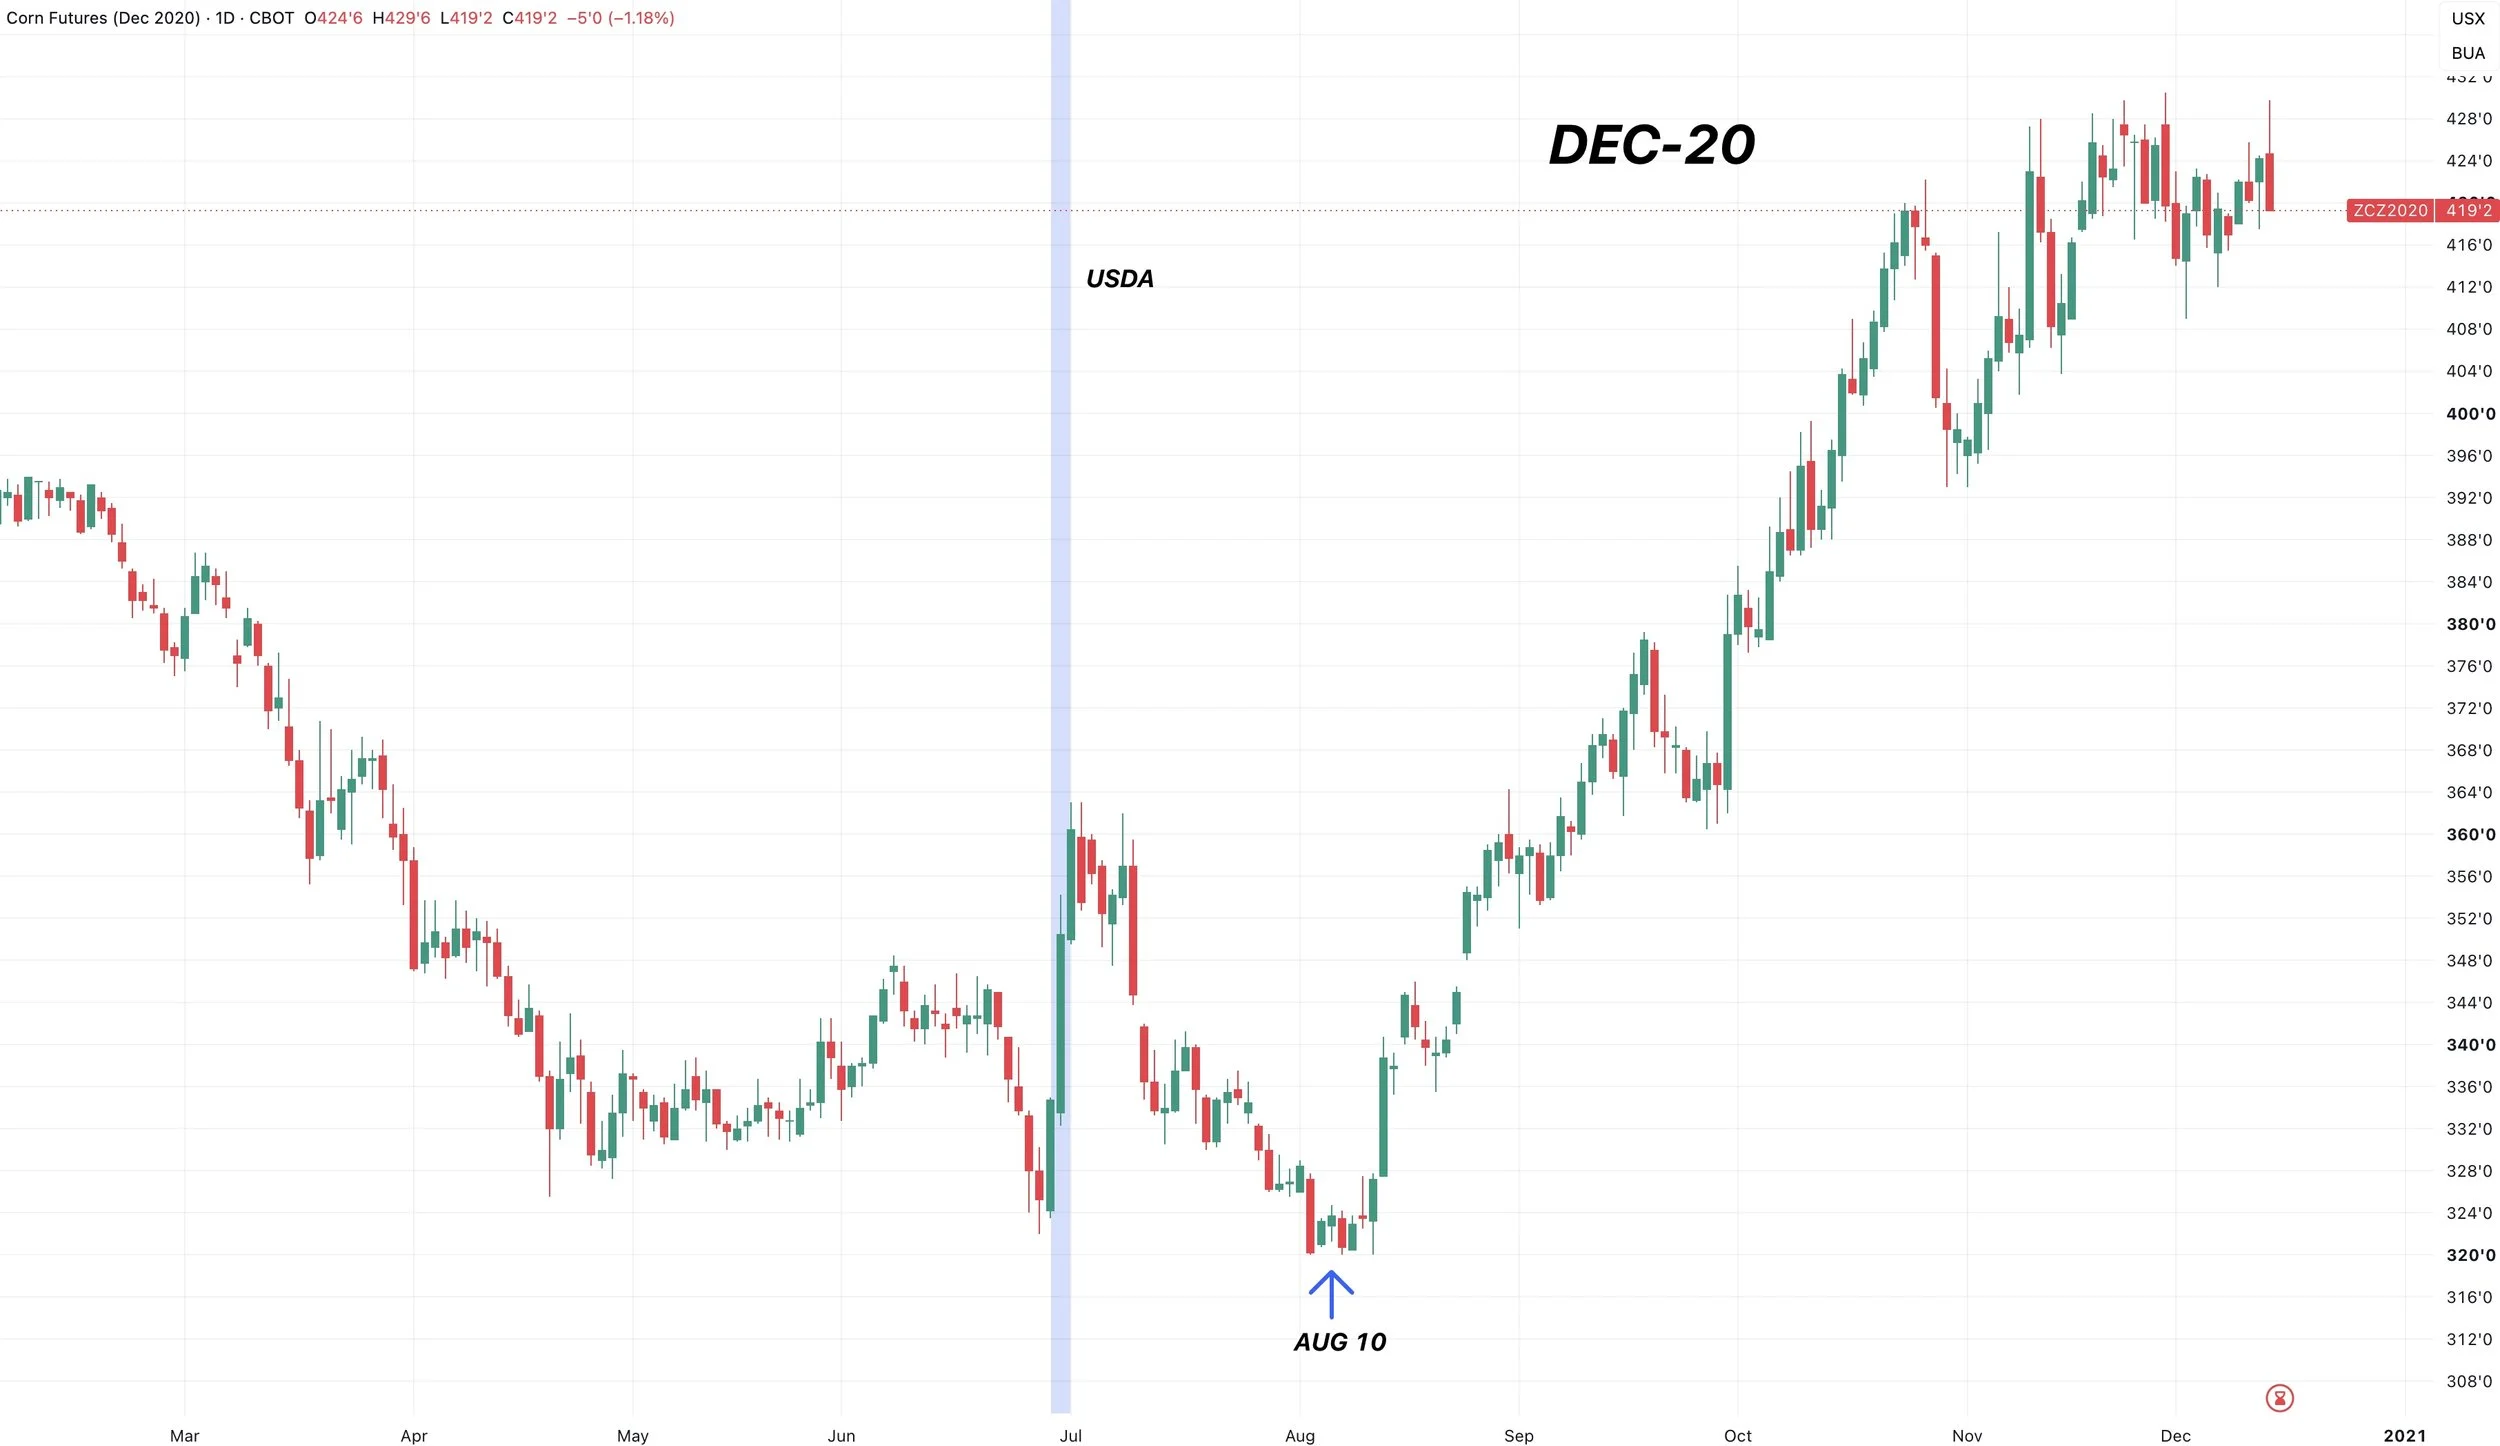
2020:
This report did lead to a nice 40-cent rally.
However, the rally did not last long as we then fell until early August.
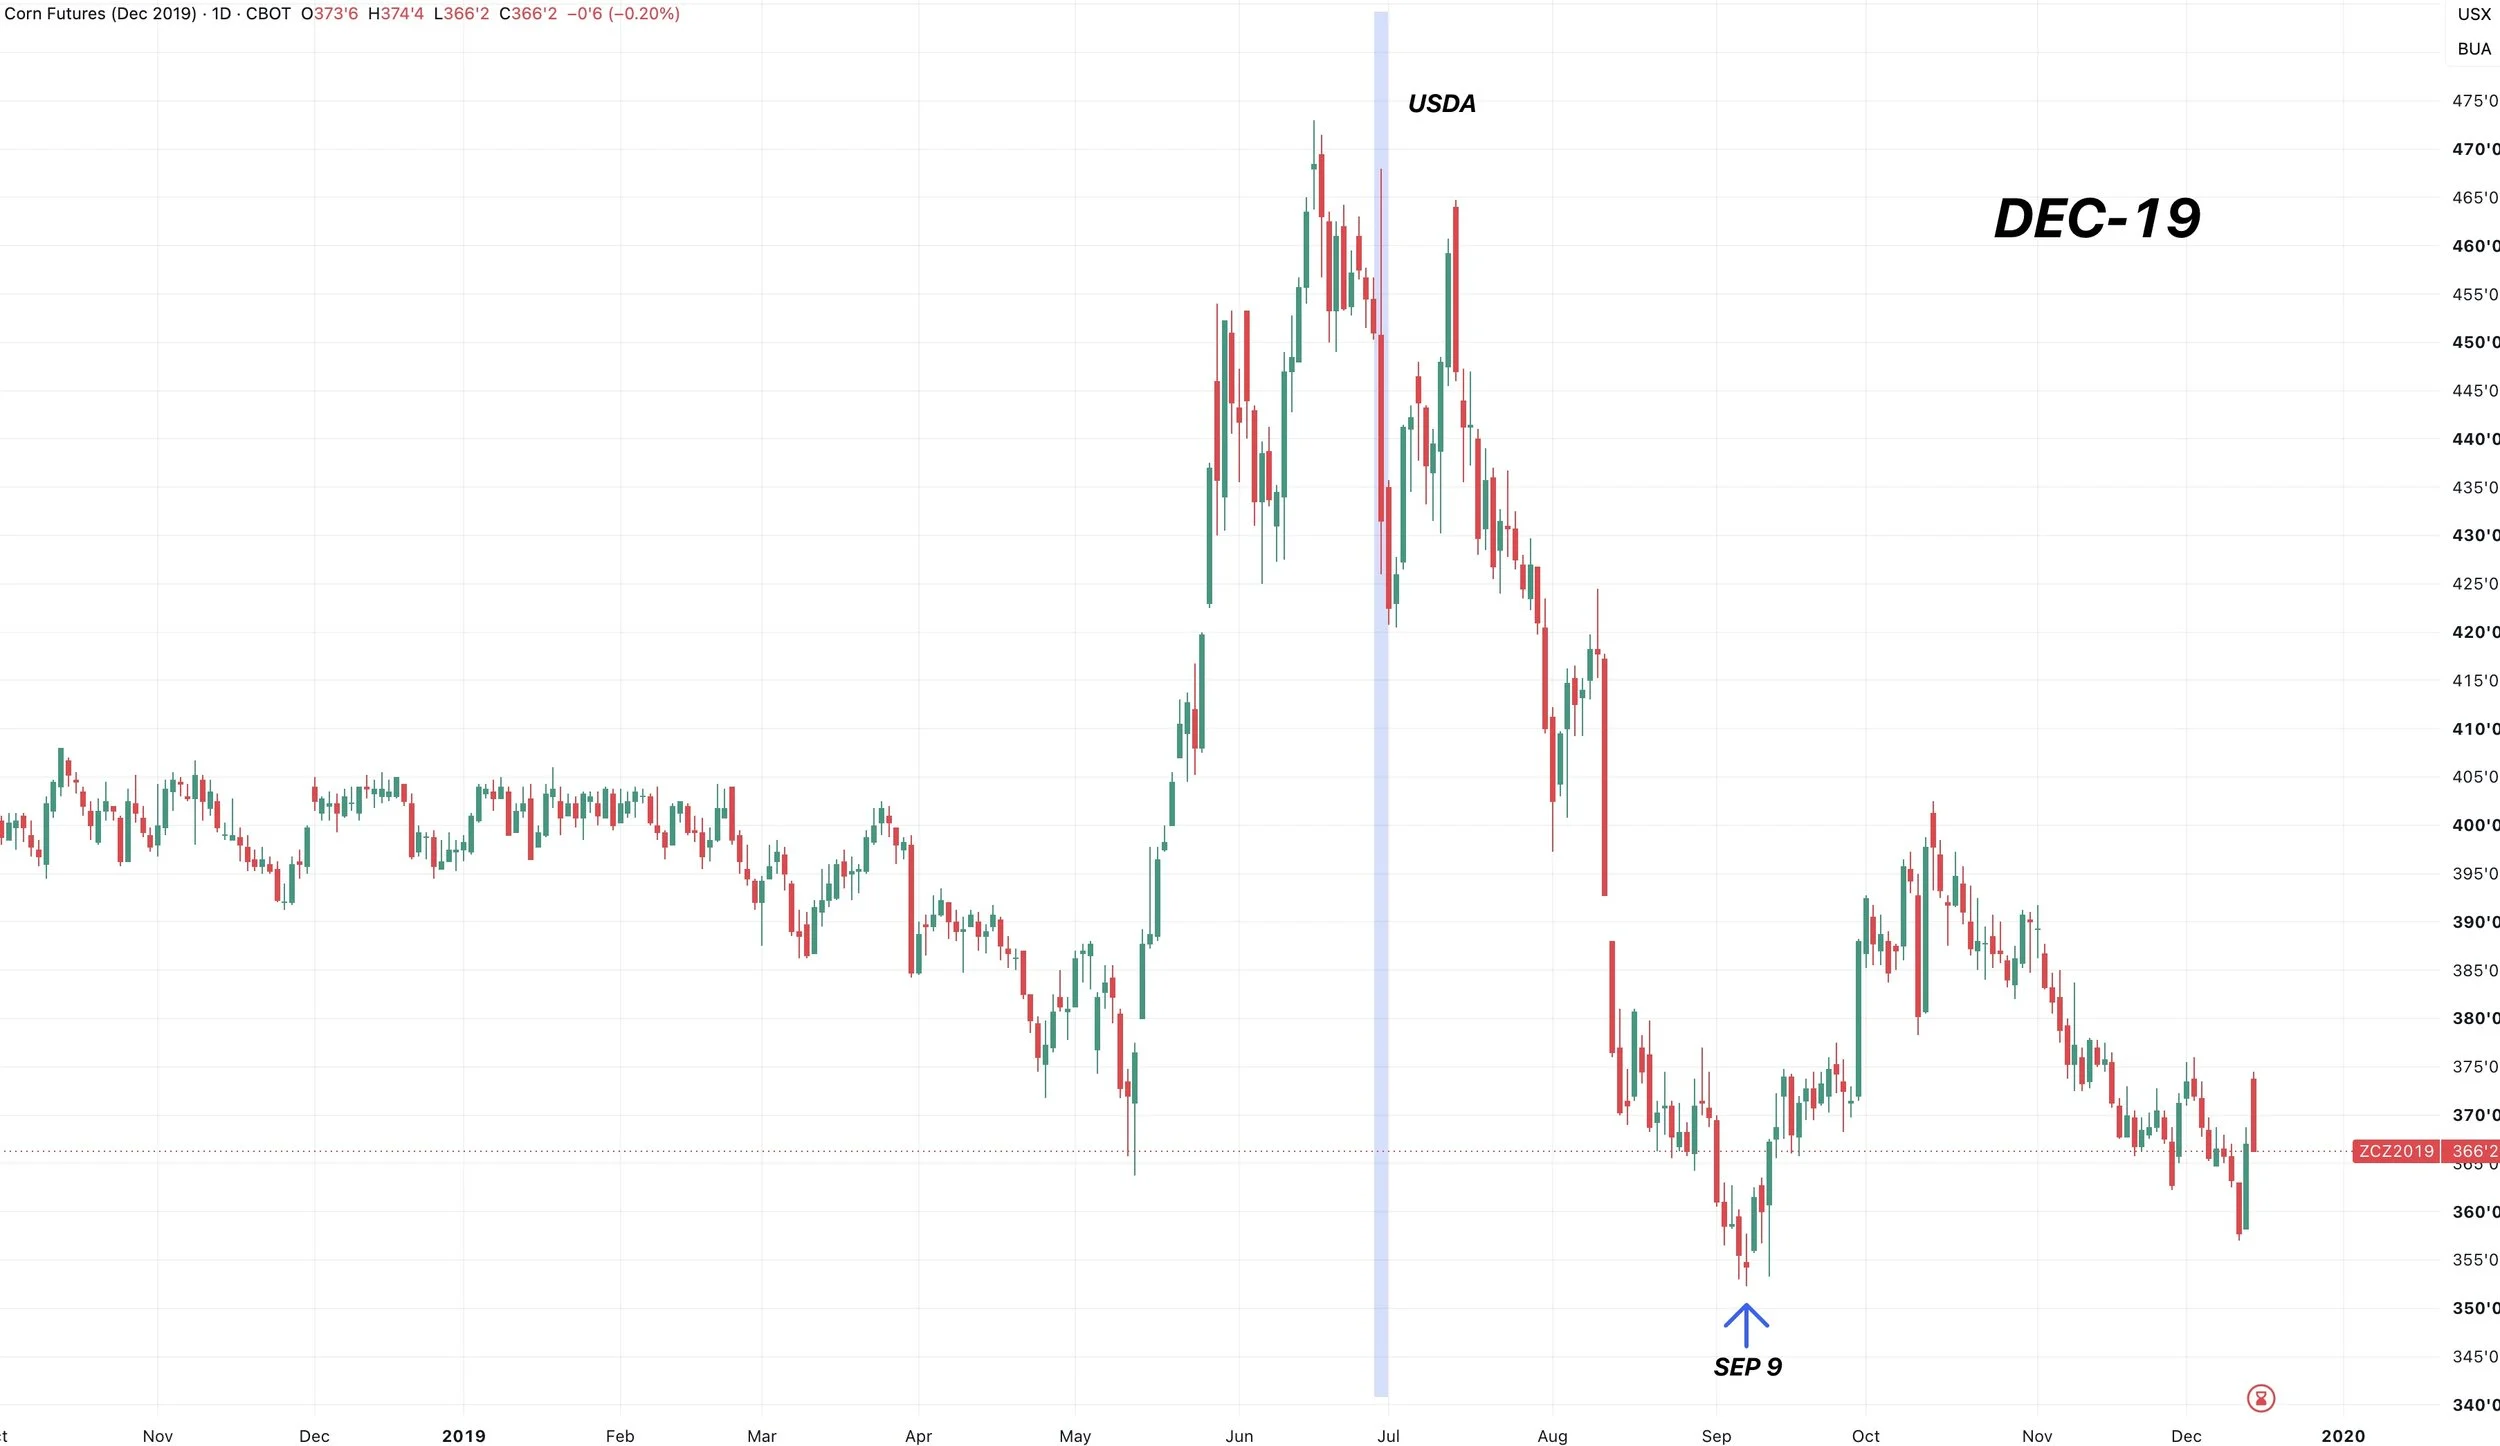
2019:
This report pretty much marked the end of the rally in 2019. It marked the start of the seasonal sell off.
This was a weather scare year, and we saw another rally in July before heading lower until early September.
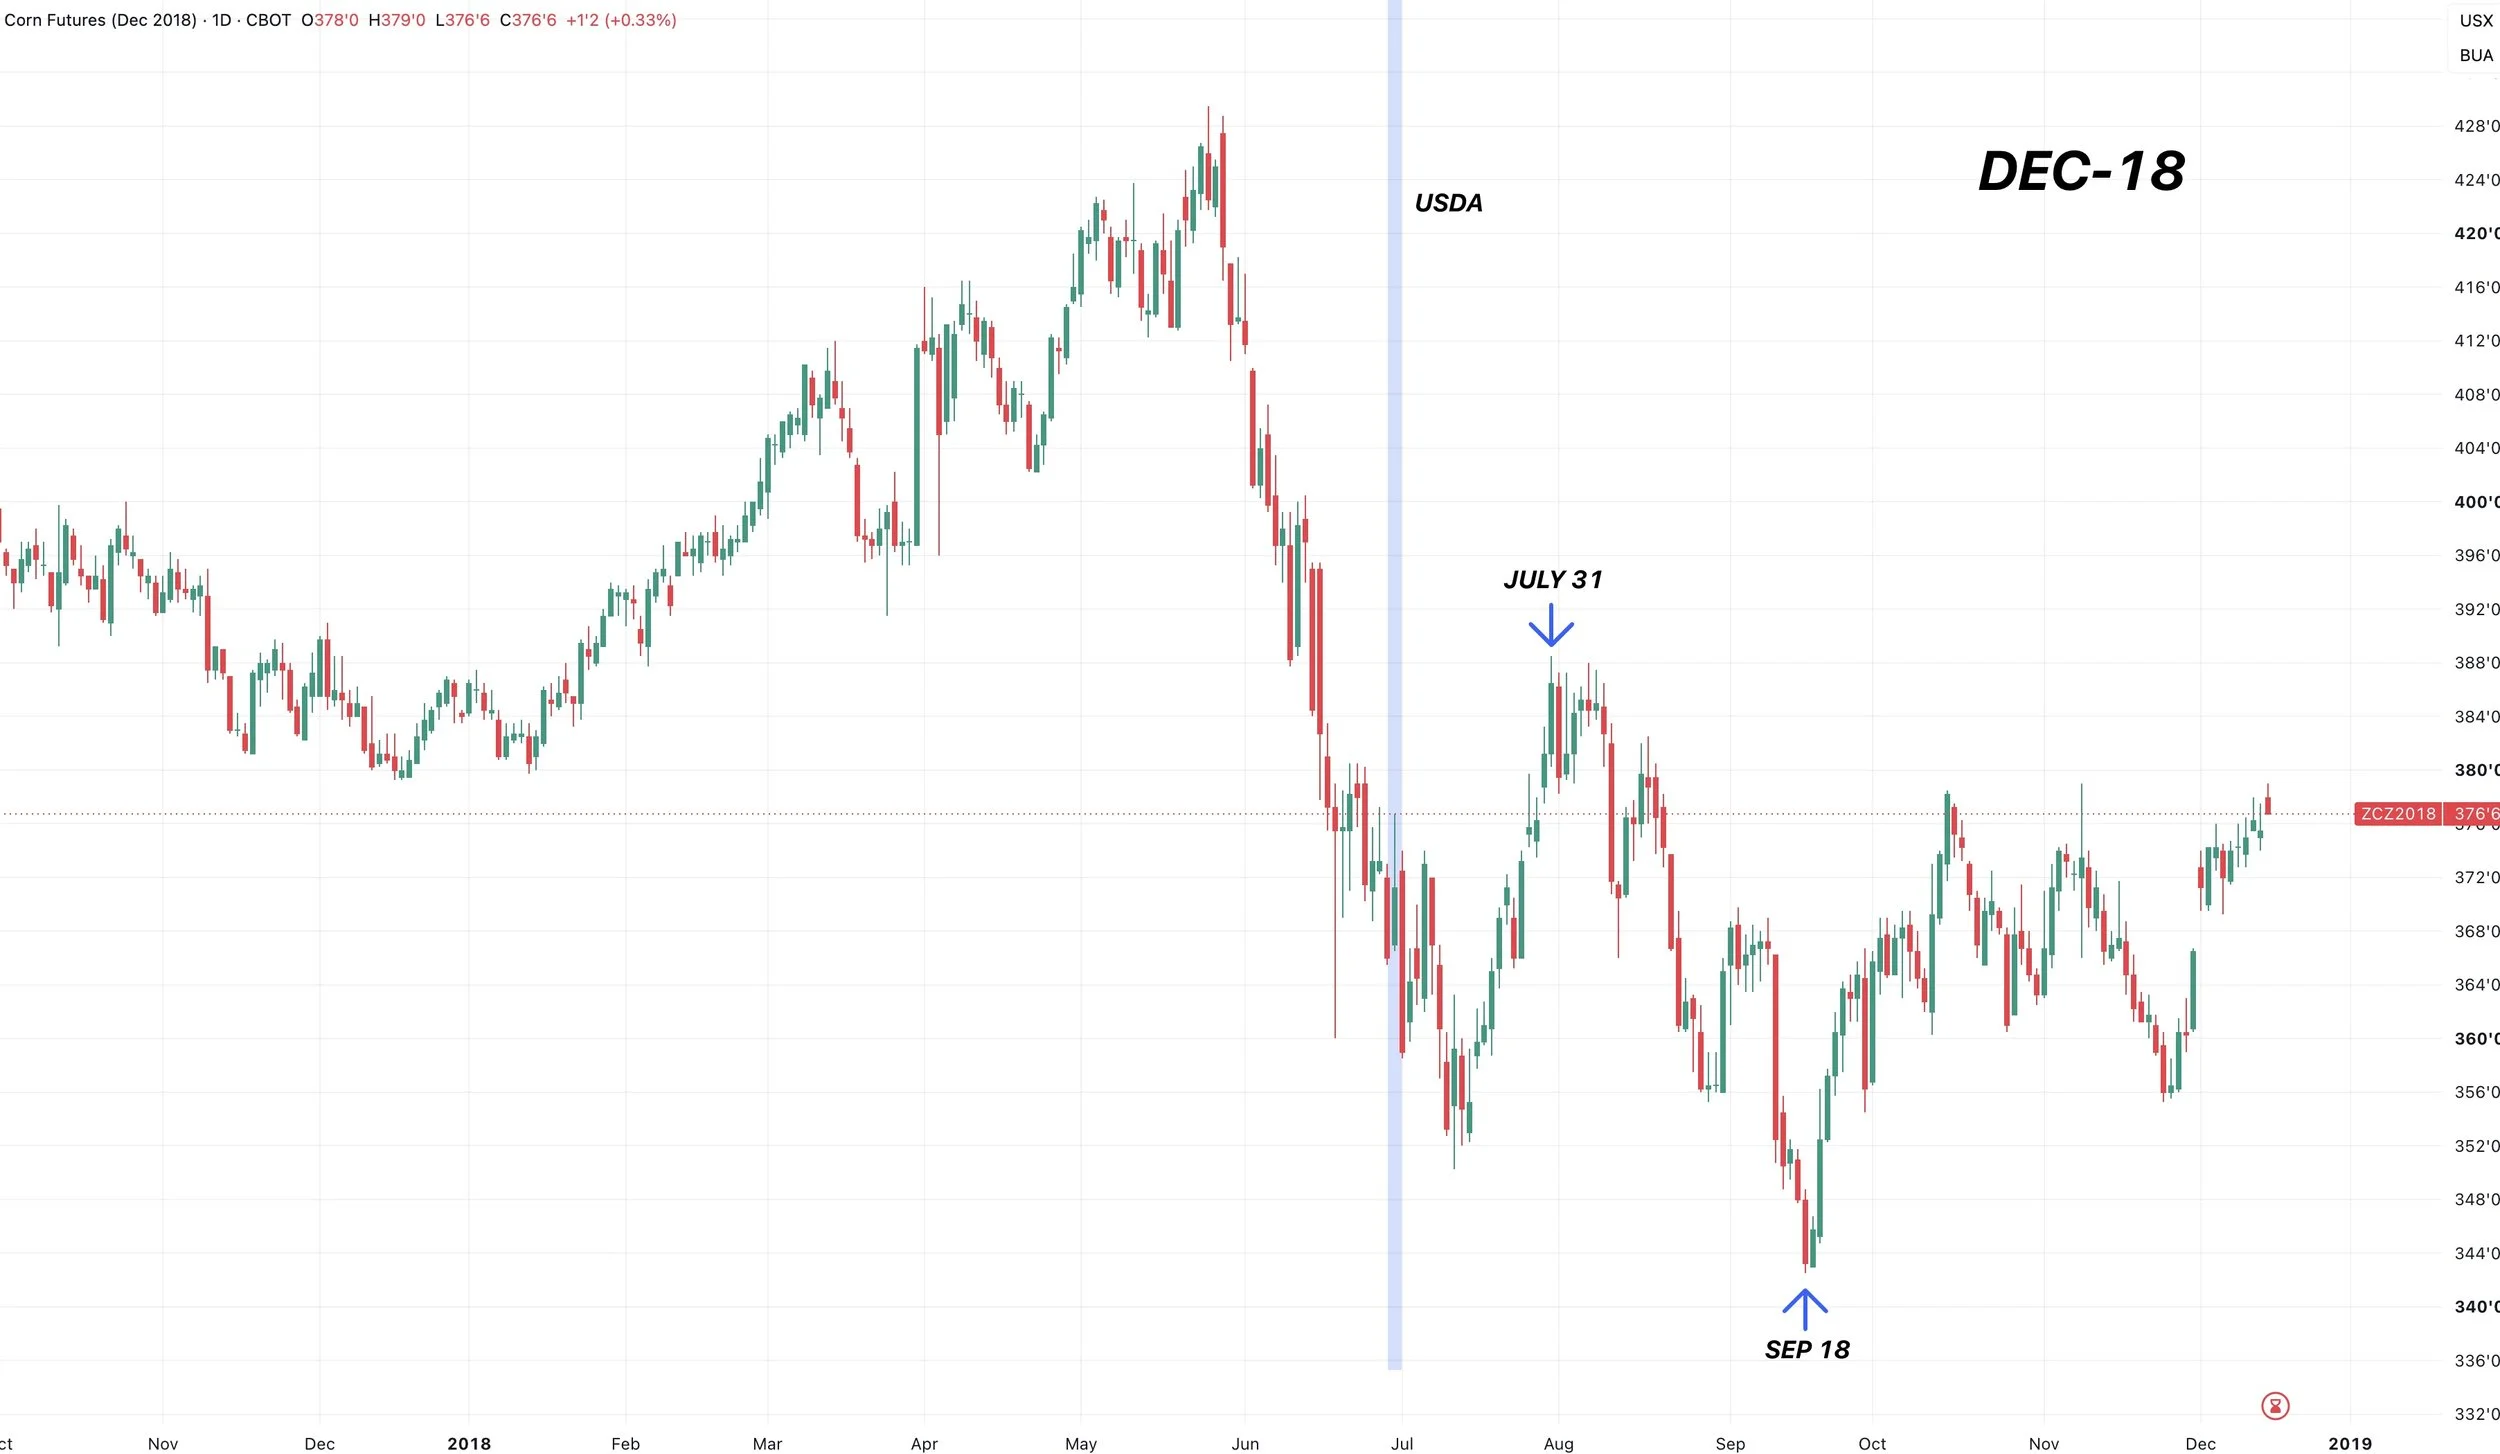
2018:
This was one of those dud reports where we moved just a nickel.
We saw a rally in July, but then went lower into September.
Report didn’t change anything.
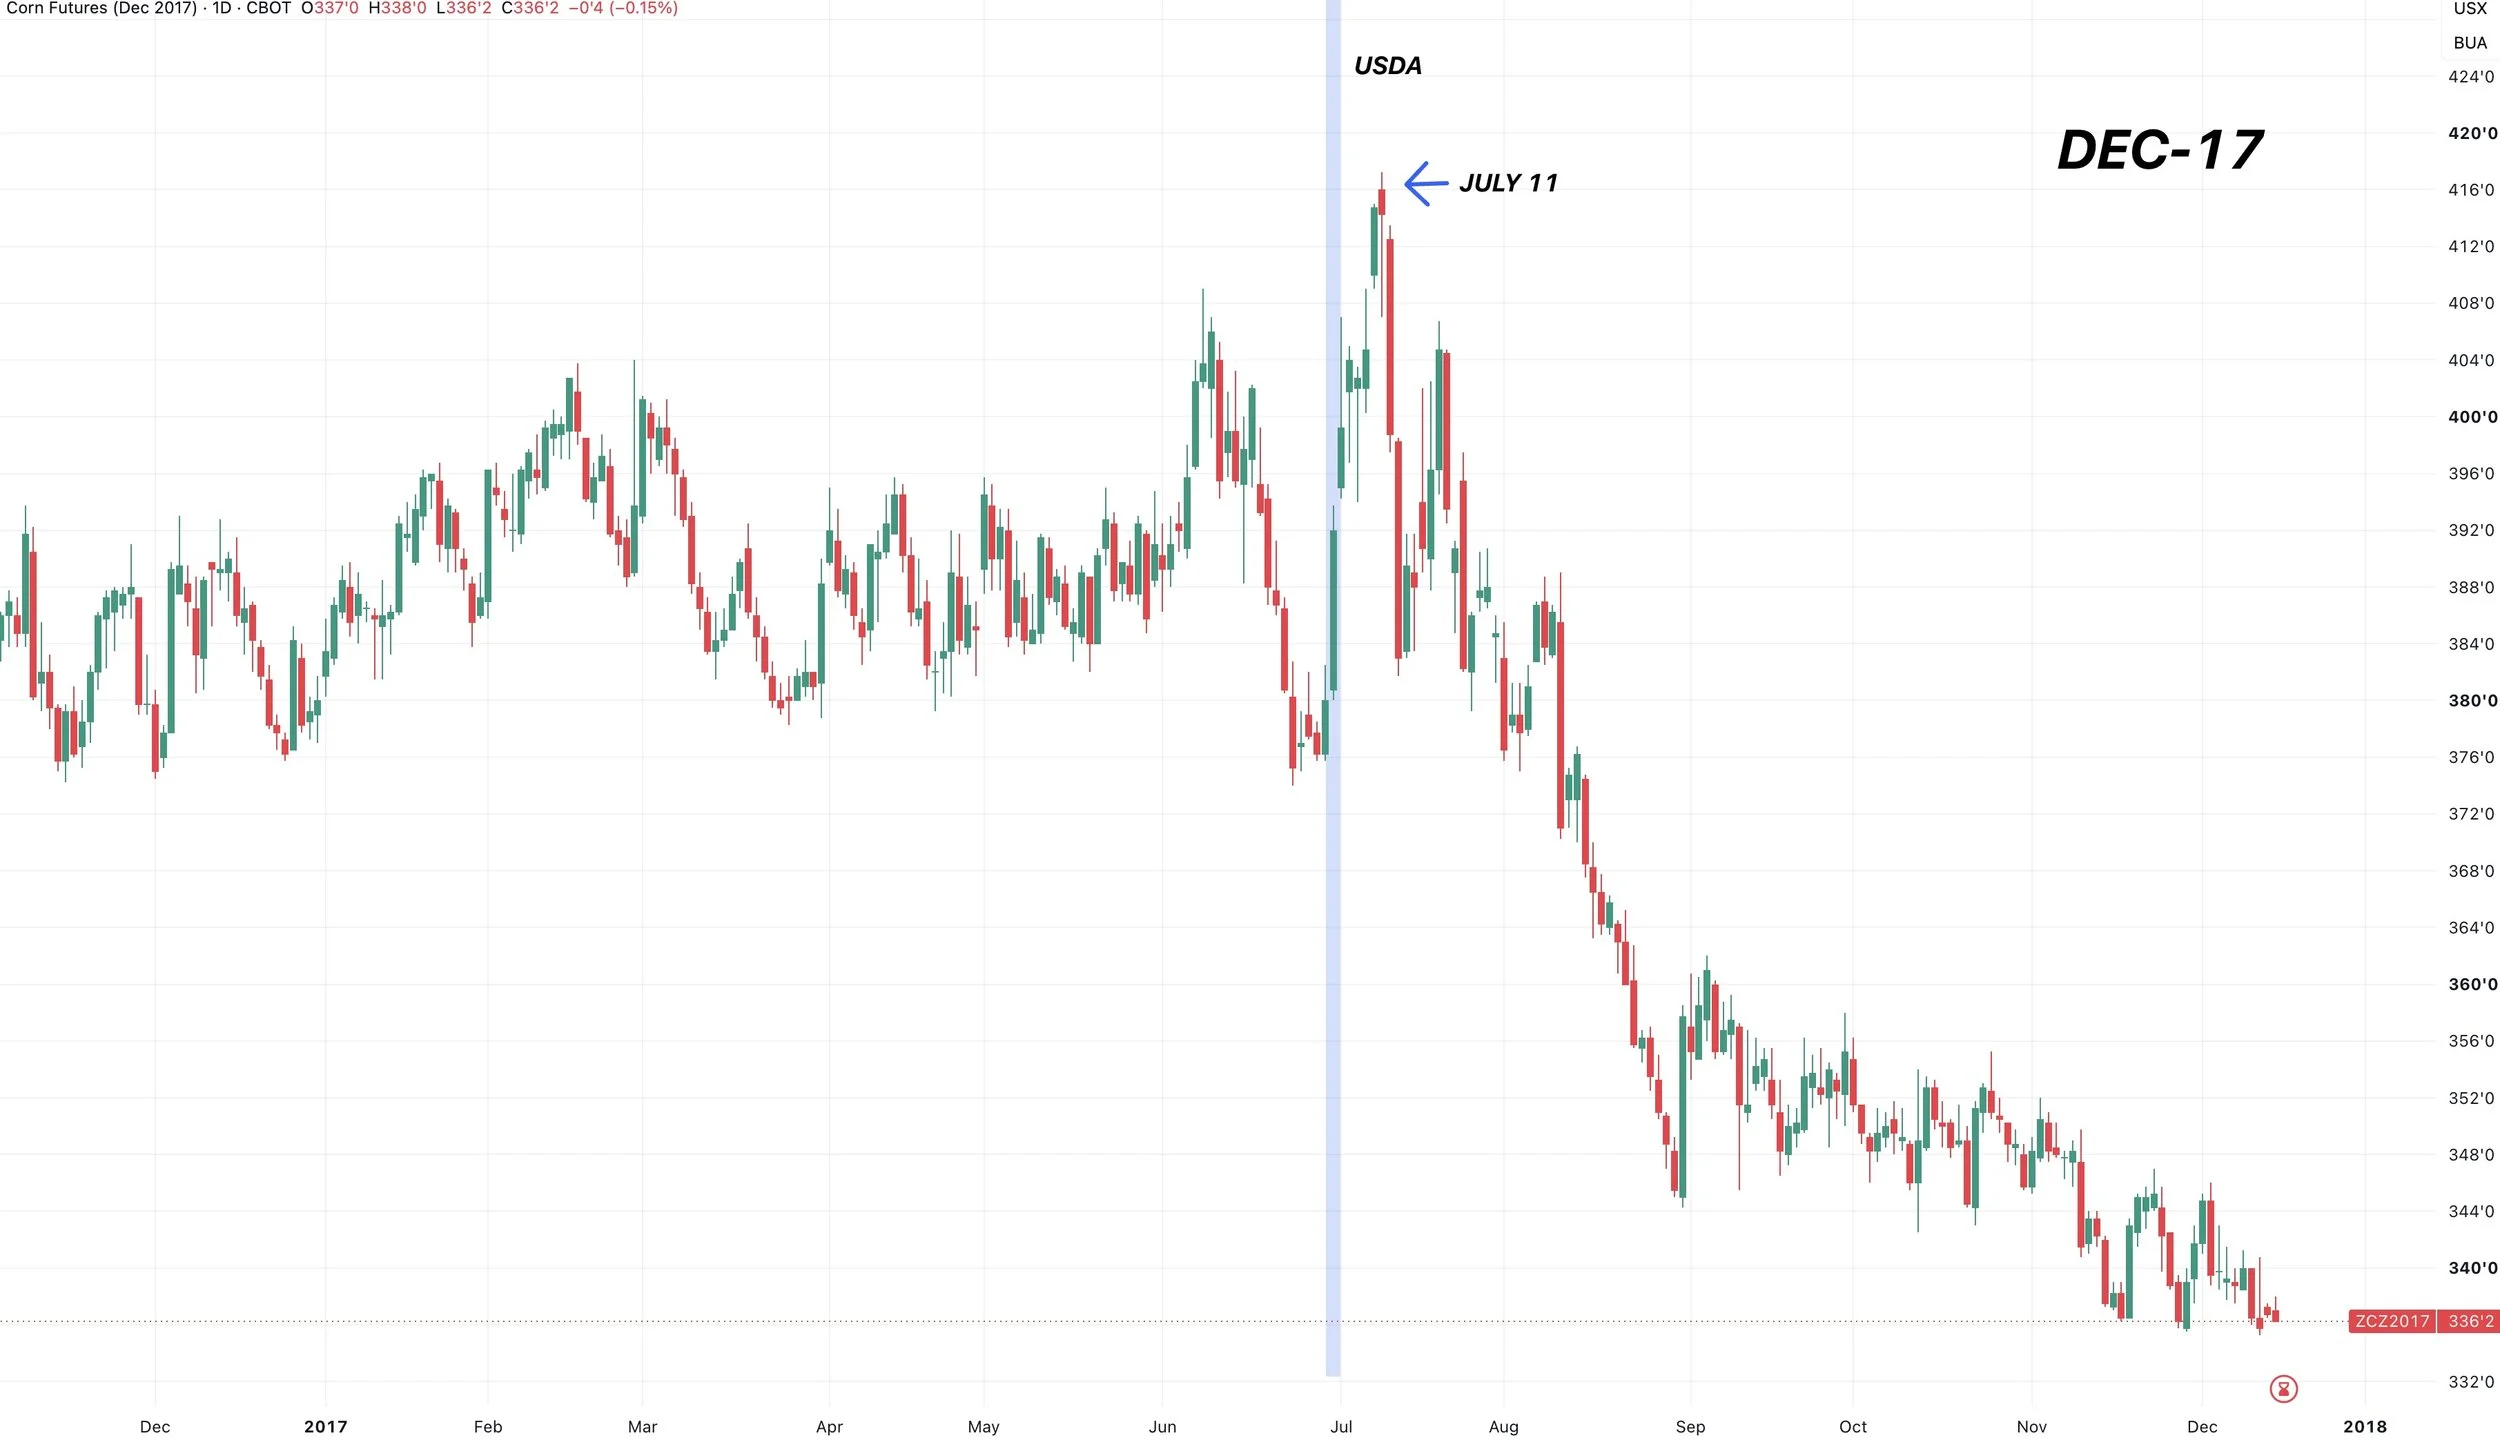
2017:
This report sparked a nice 40-cent rally, but it lasted less than two weeks.
2016:
We sold off going into the report, the report was then bearish.
So we continued to fall until August.

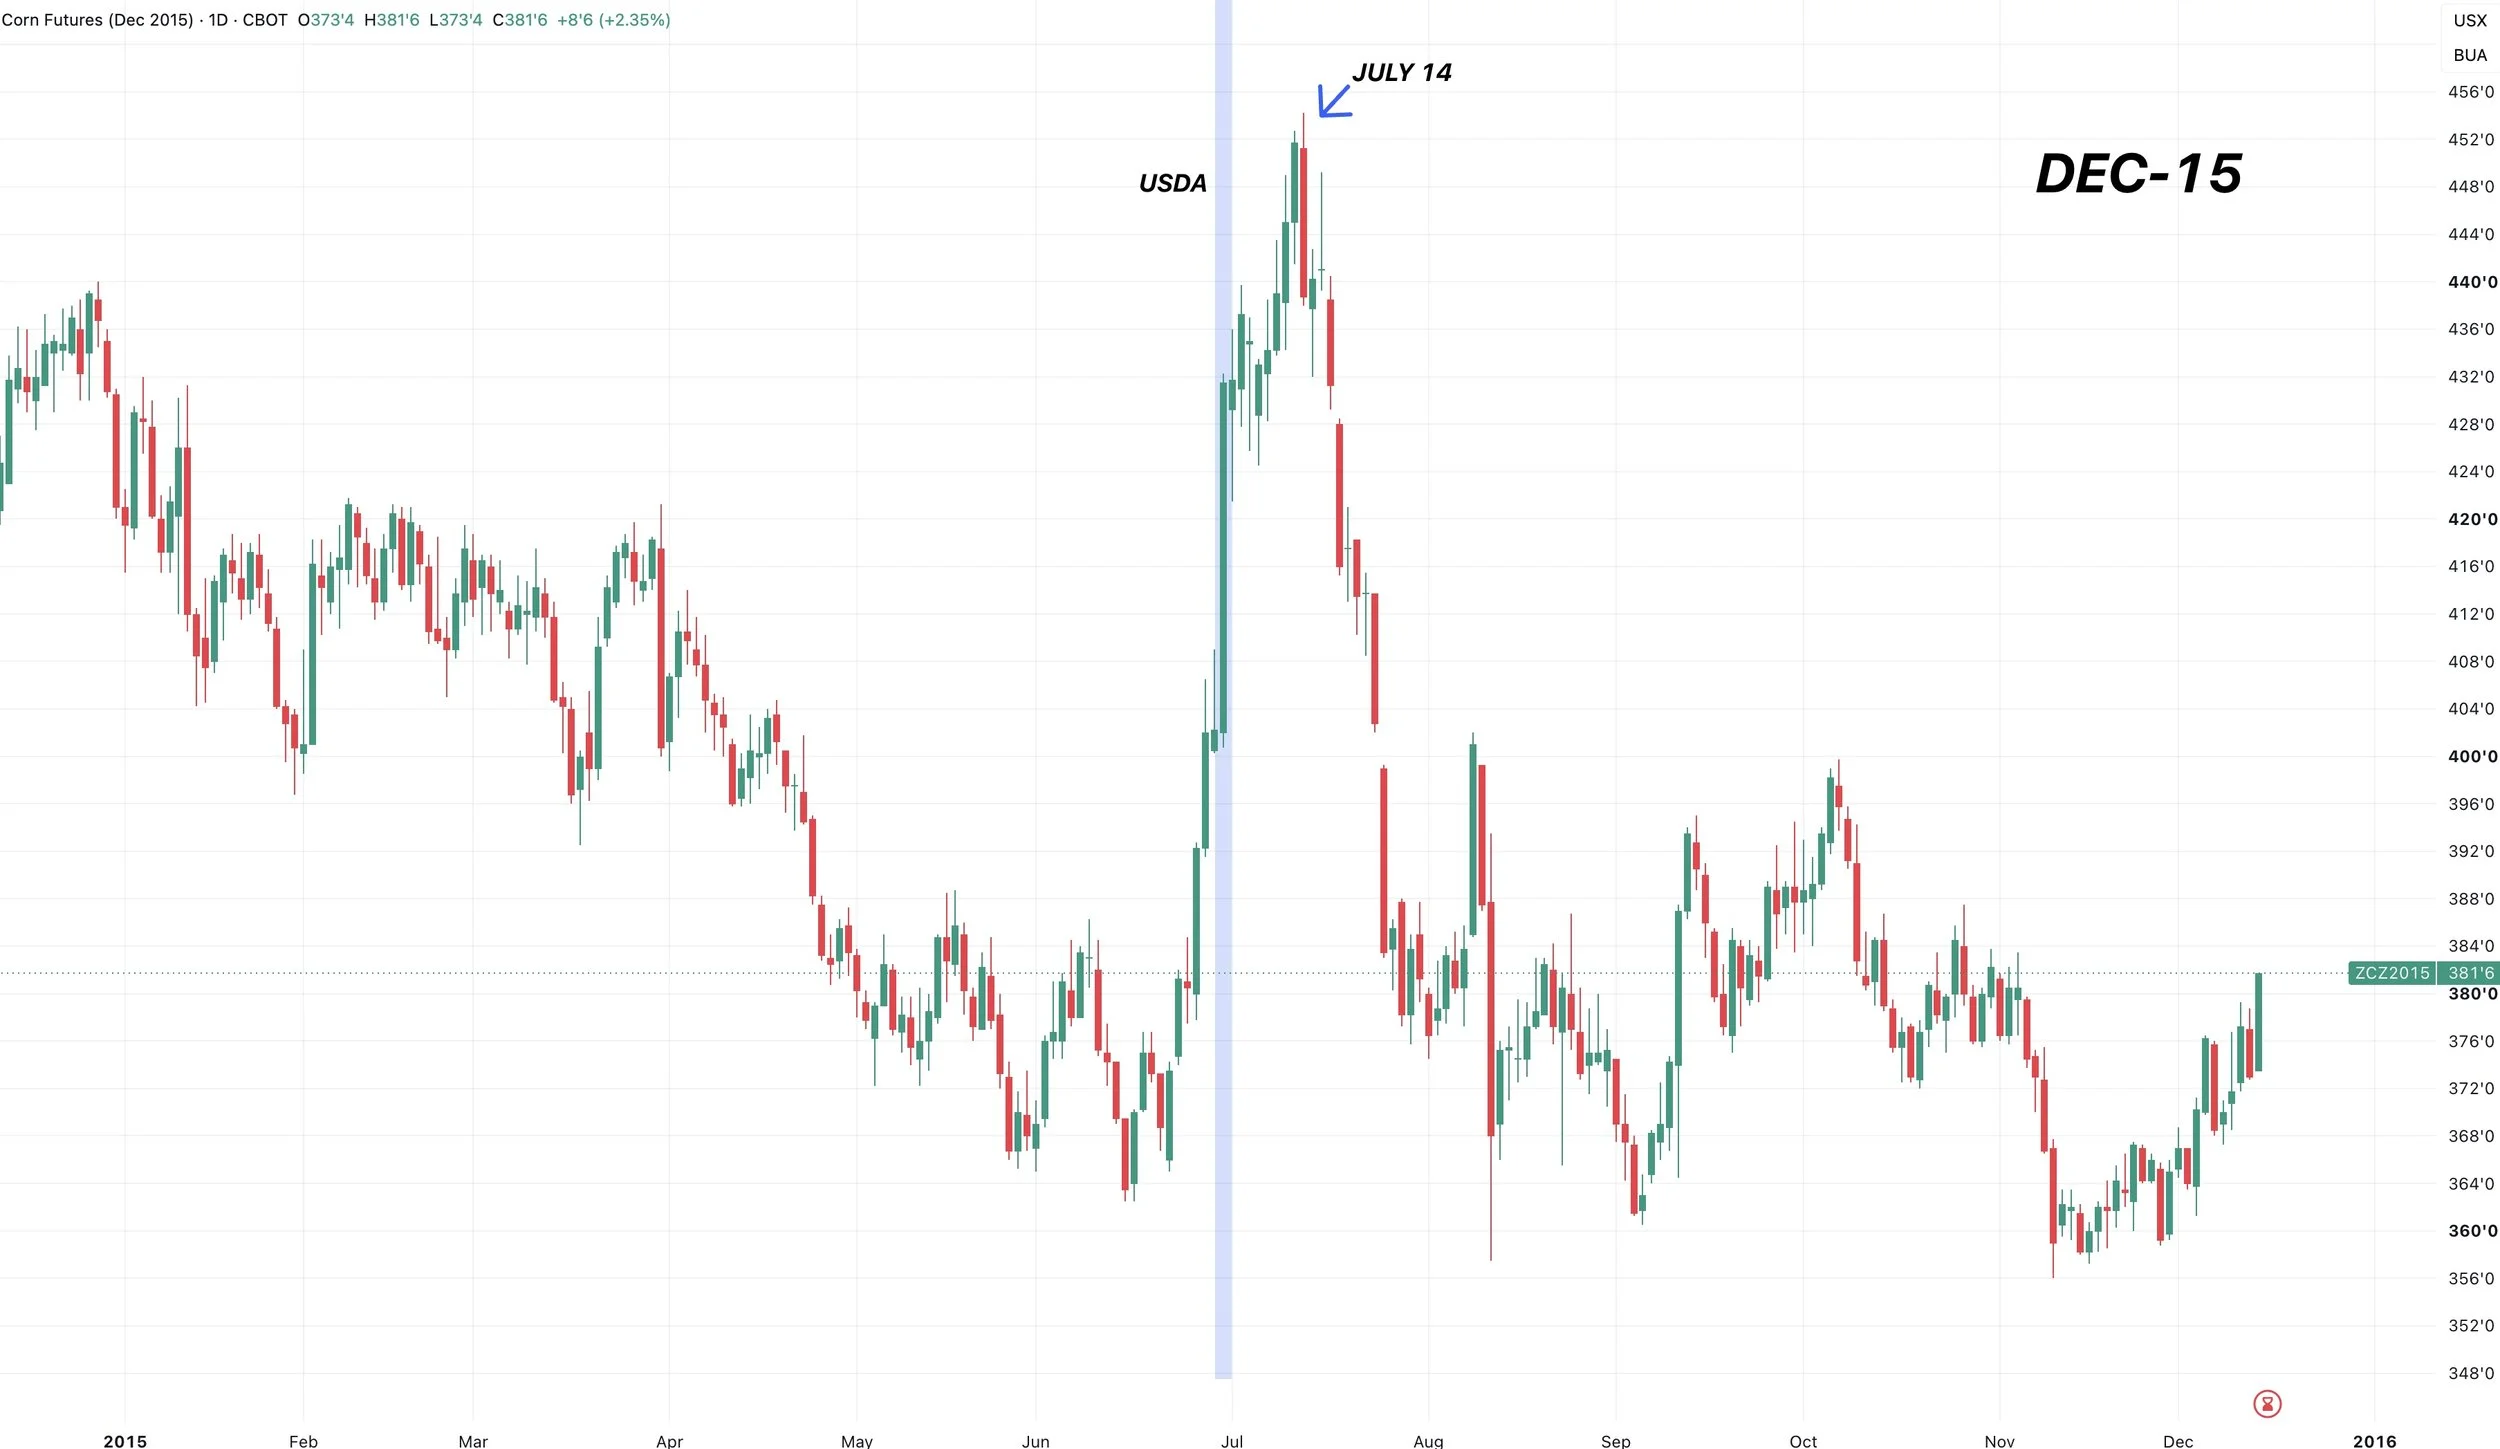
2015:
This day of the report was super bullish, but it was in the middle of a weather scare.
We were already in the middle of a rally.
The rally didn’t last long before falling until August.
2014:
The report was bearish.
It sparked the beginning of a brutal sell-off until September after having already been grinding lower the entire year.
But this report really accelerated the downside.

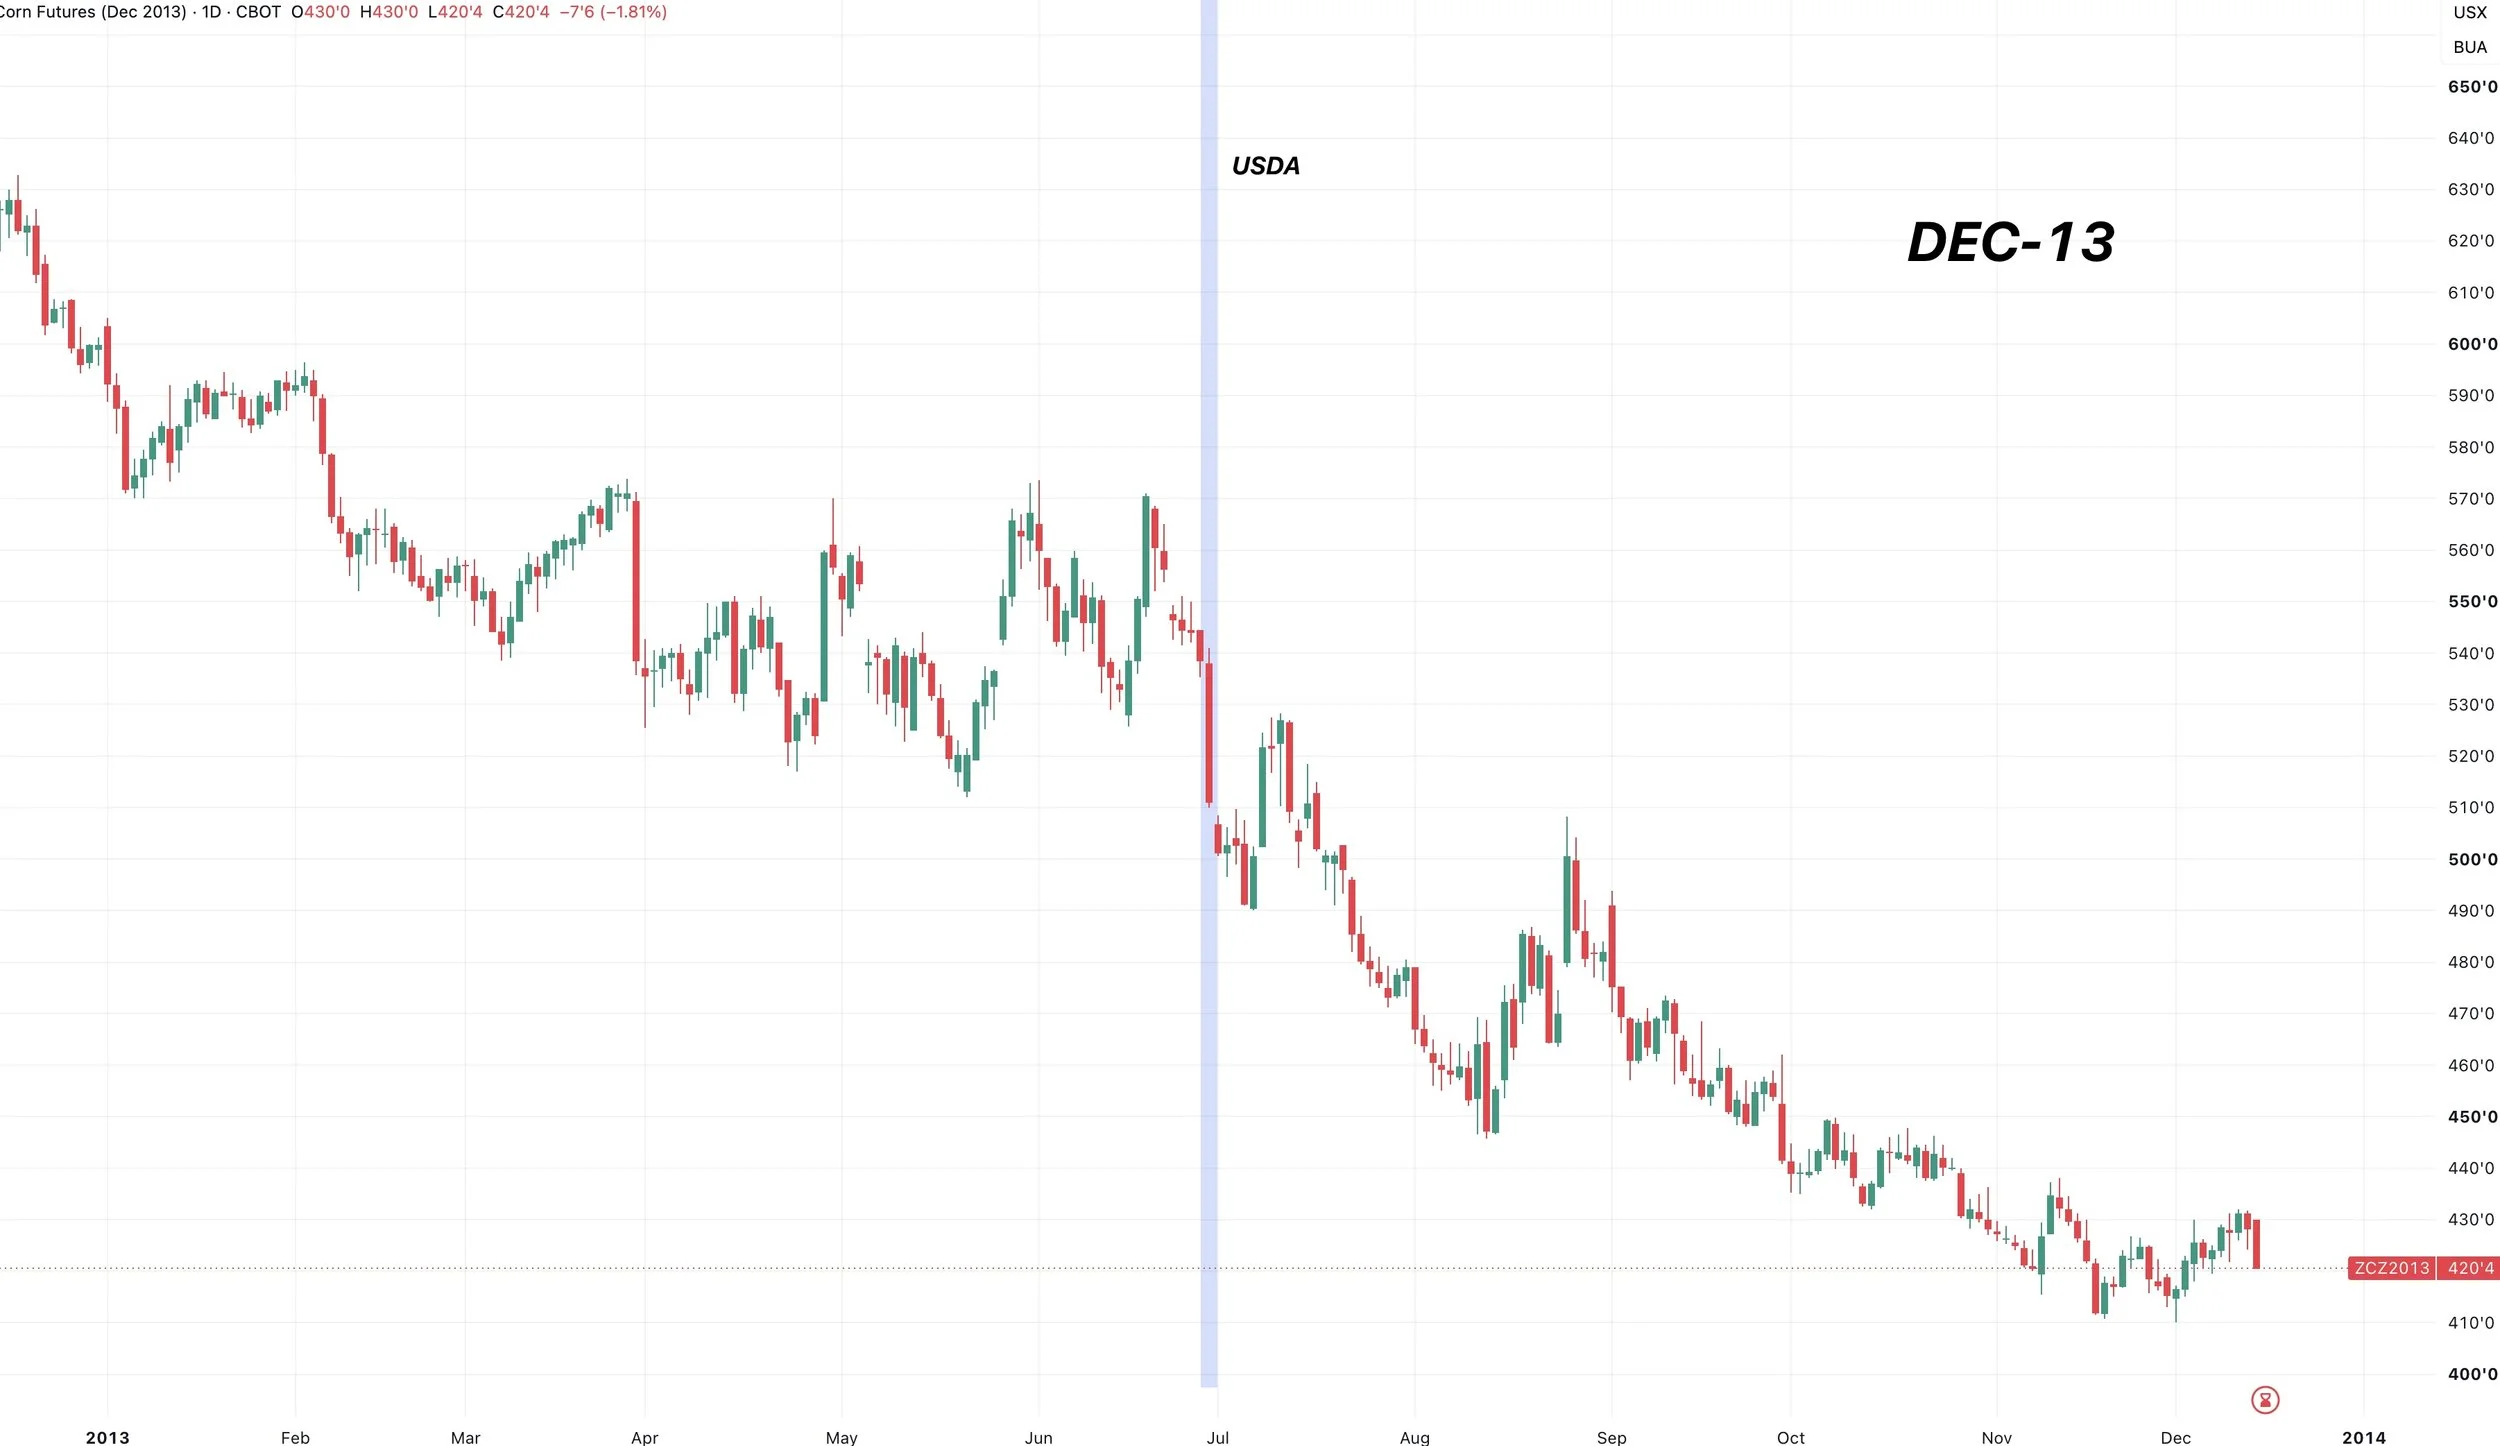
2013:
It was a bearish report, it sparked the start of the seasonal sell off.
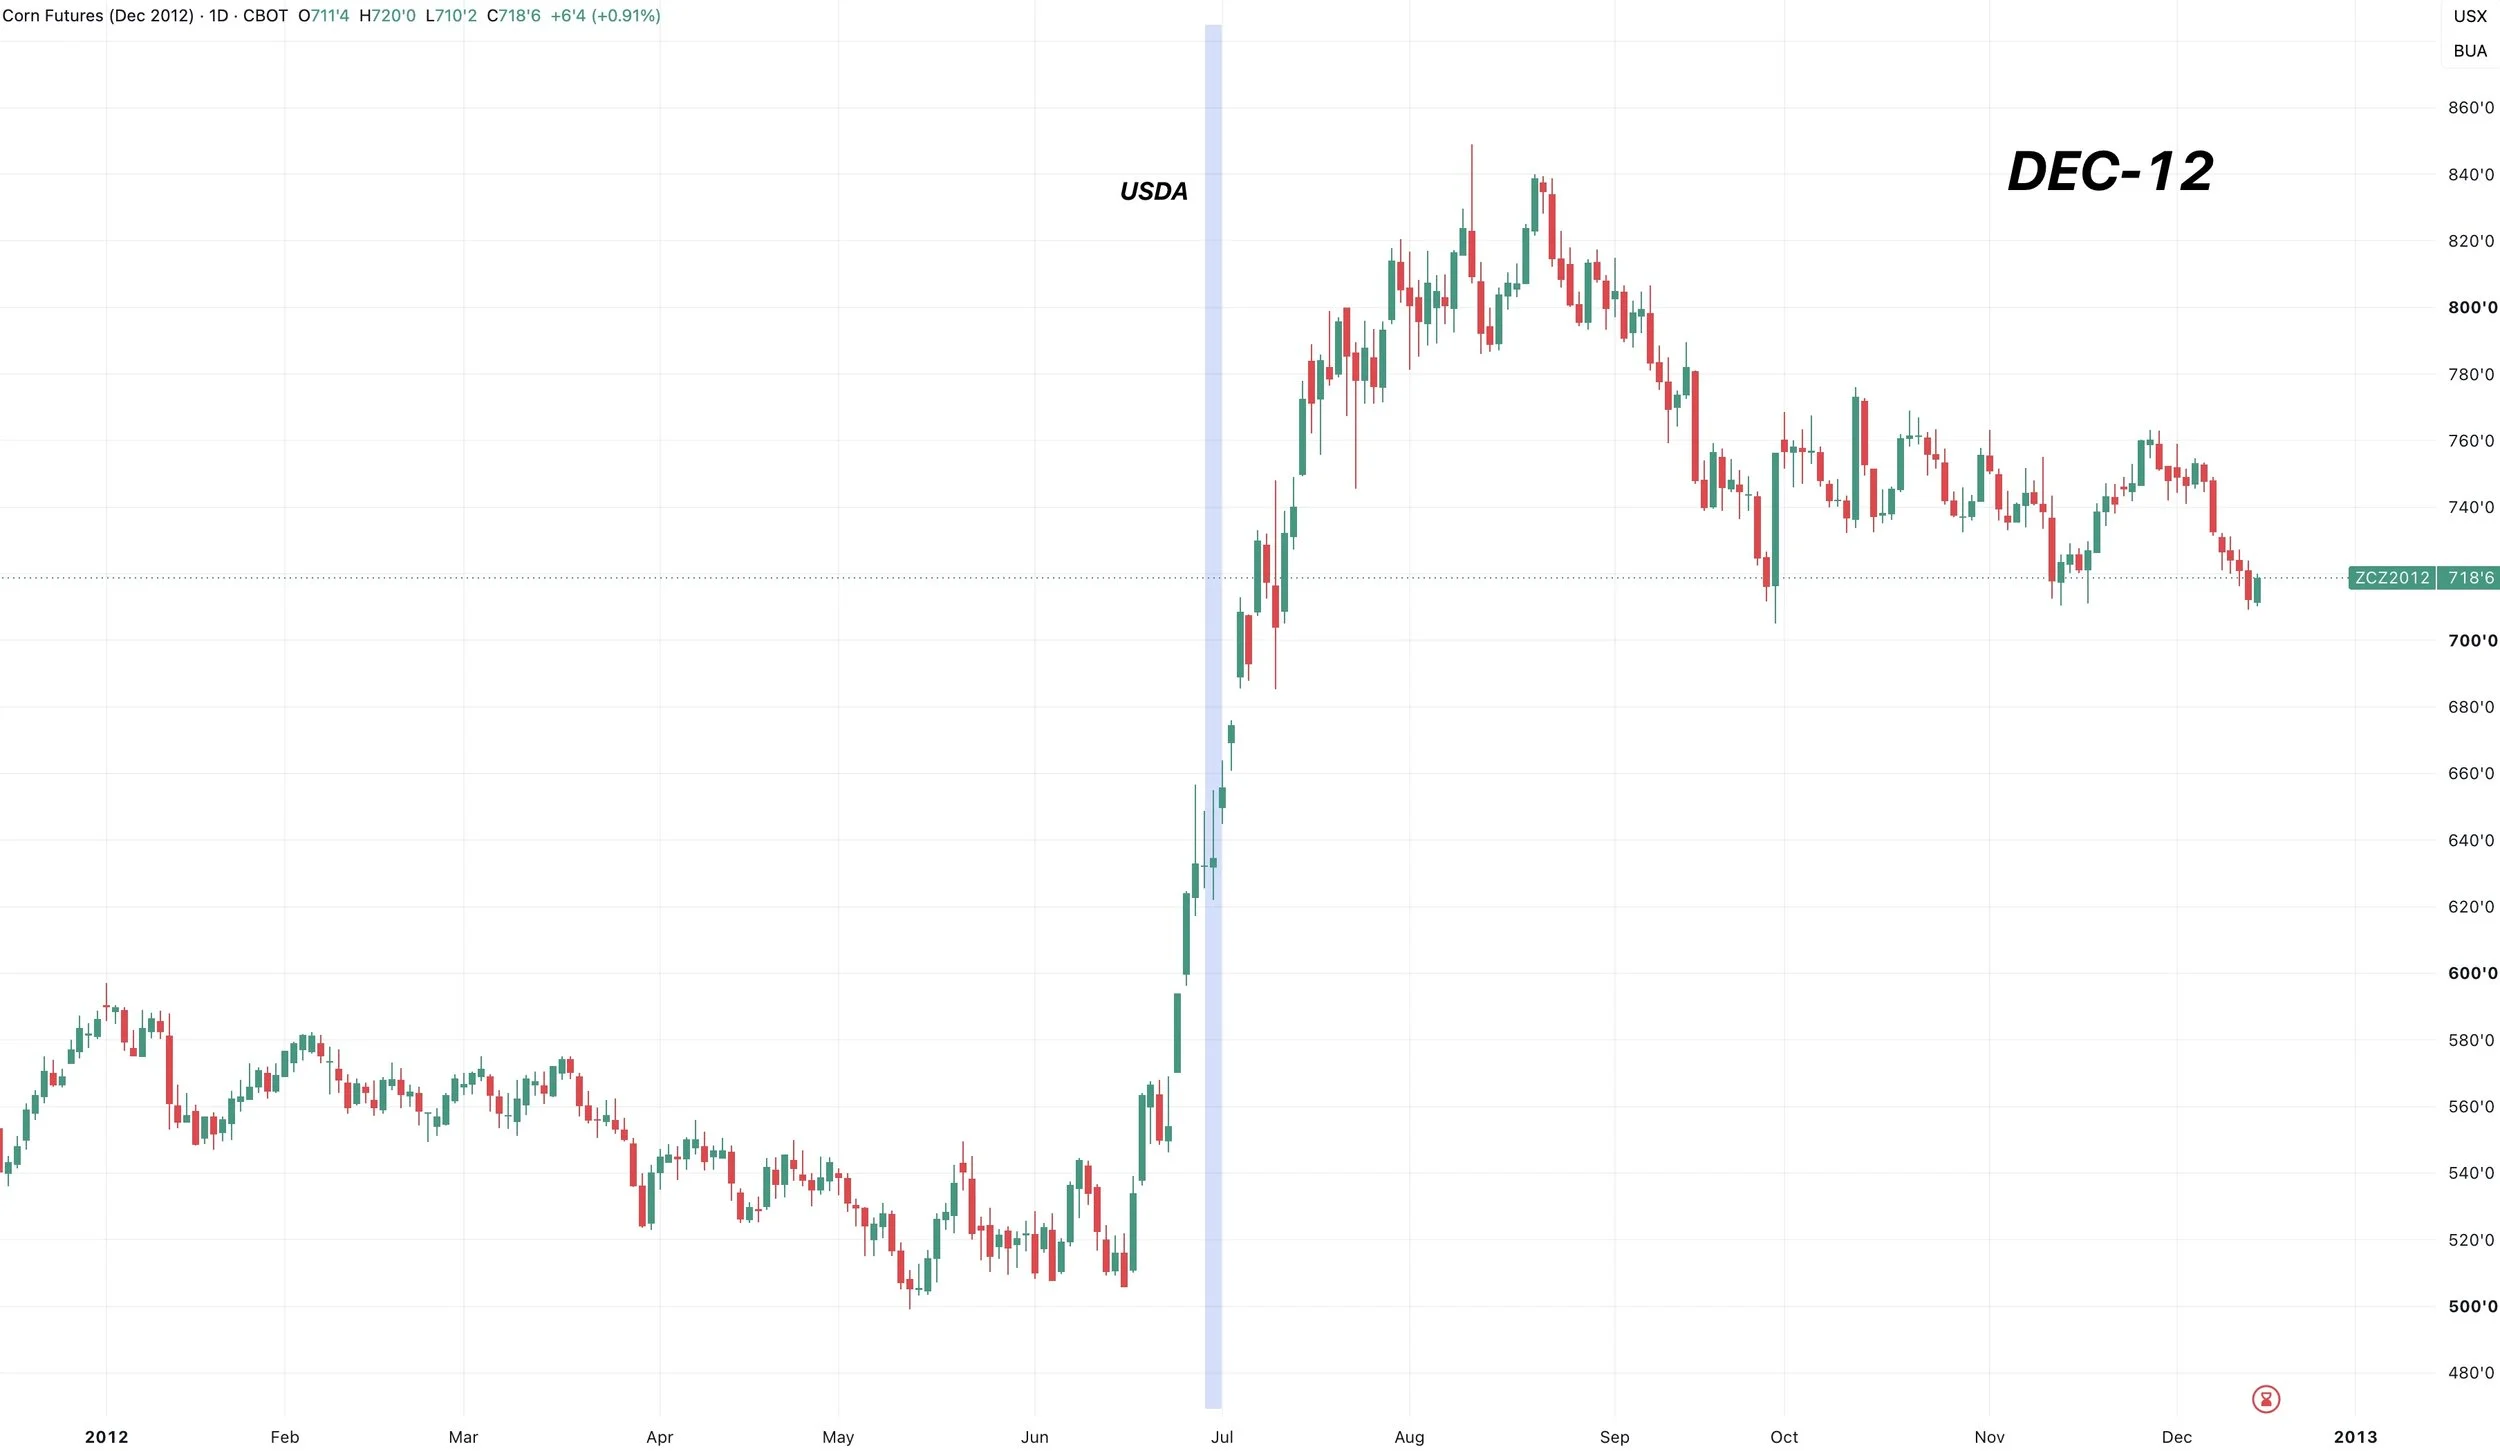
2012:
The report was actually a dud, but we all know what happened in 2012.
The rally obviously wasn’t from this report.
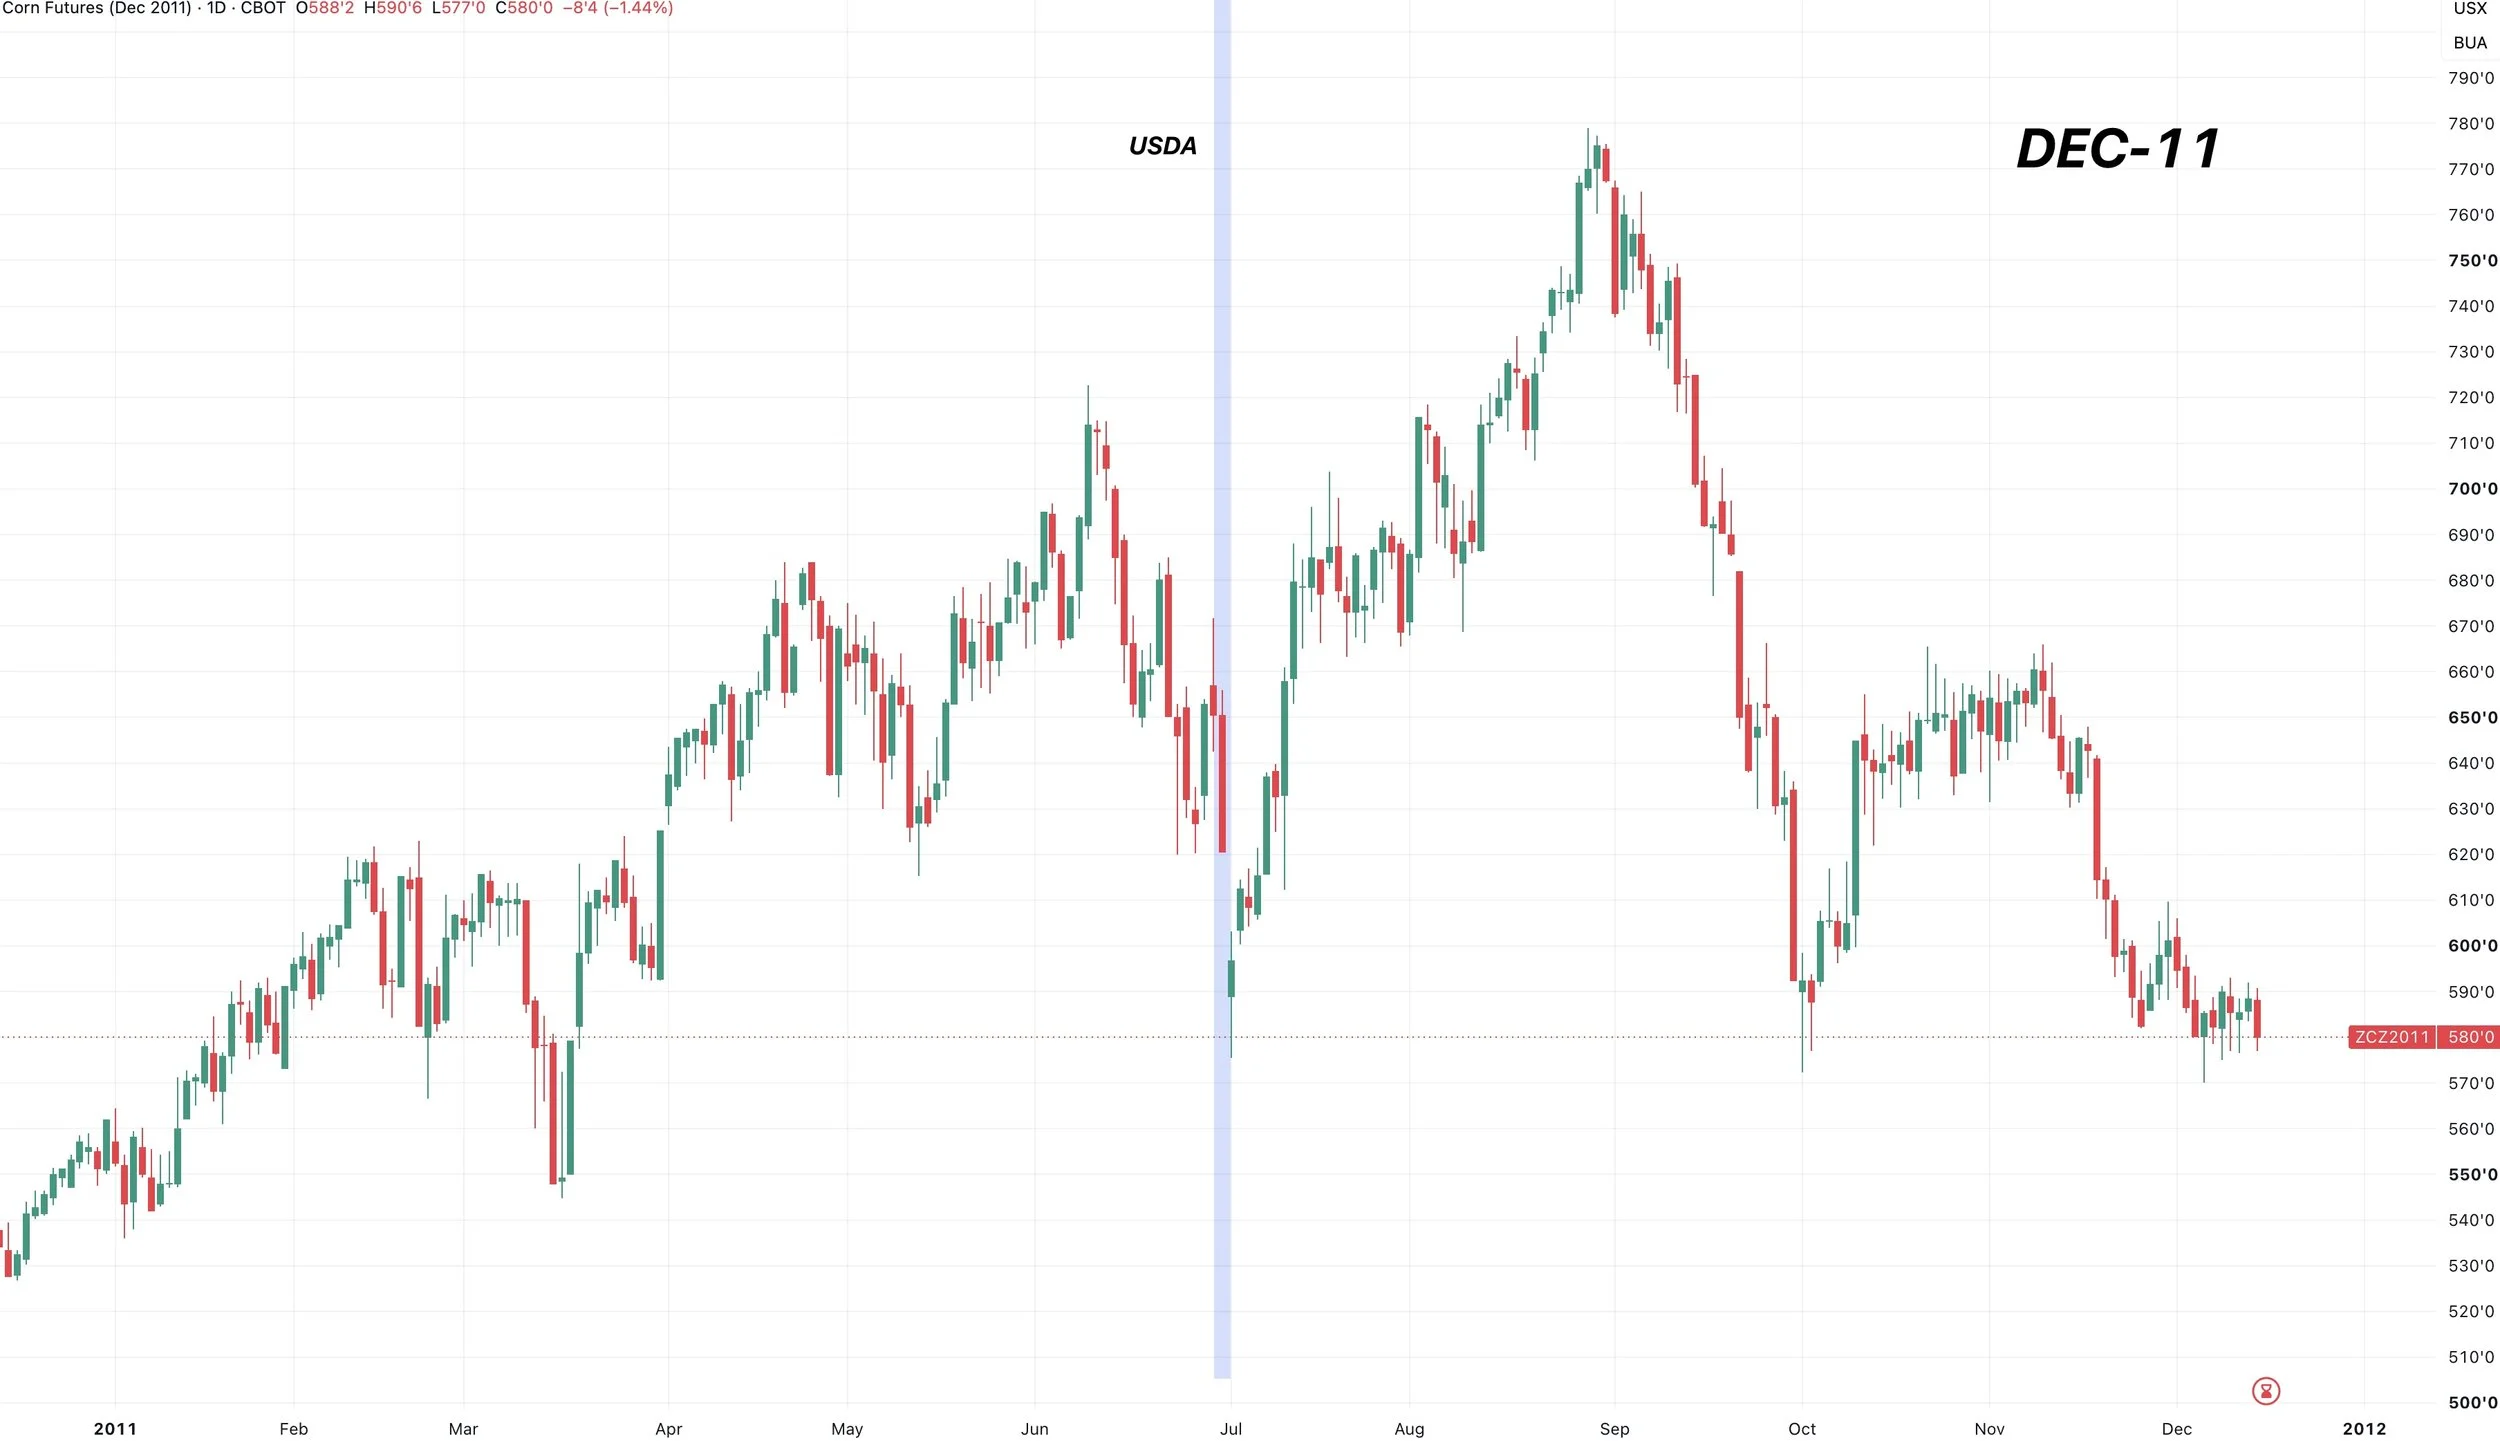
2011:
The report sparked a 50 cent sell off, but we then went on a weather rally until August.
So the report was absolutely bearish, but a weather scare saved the market.
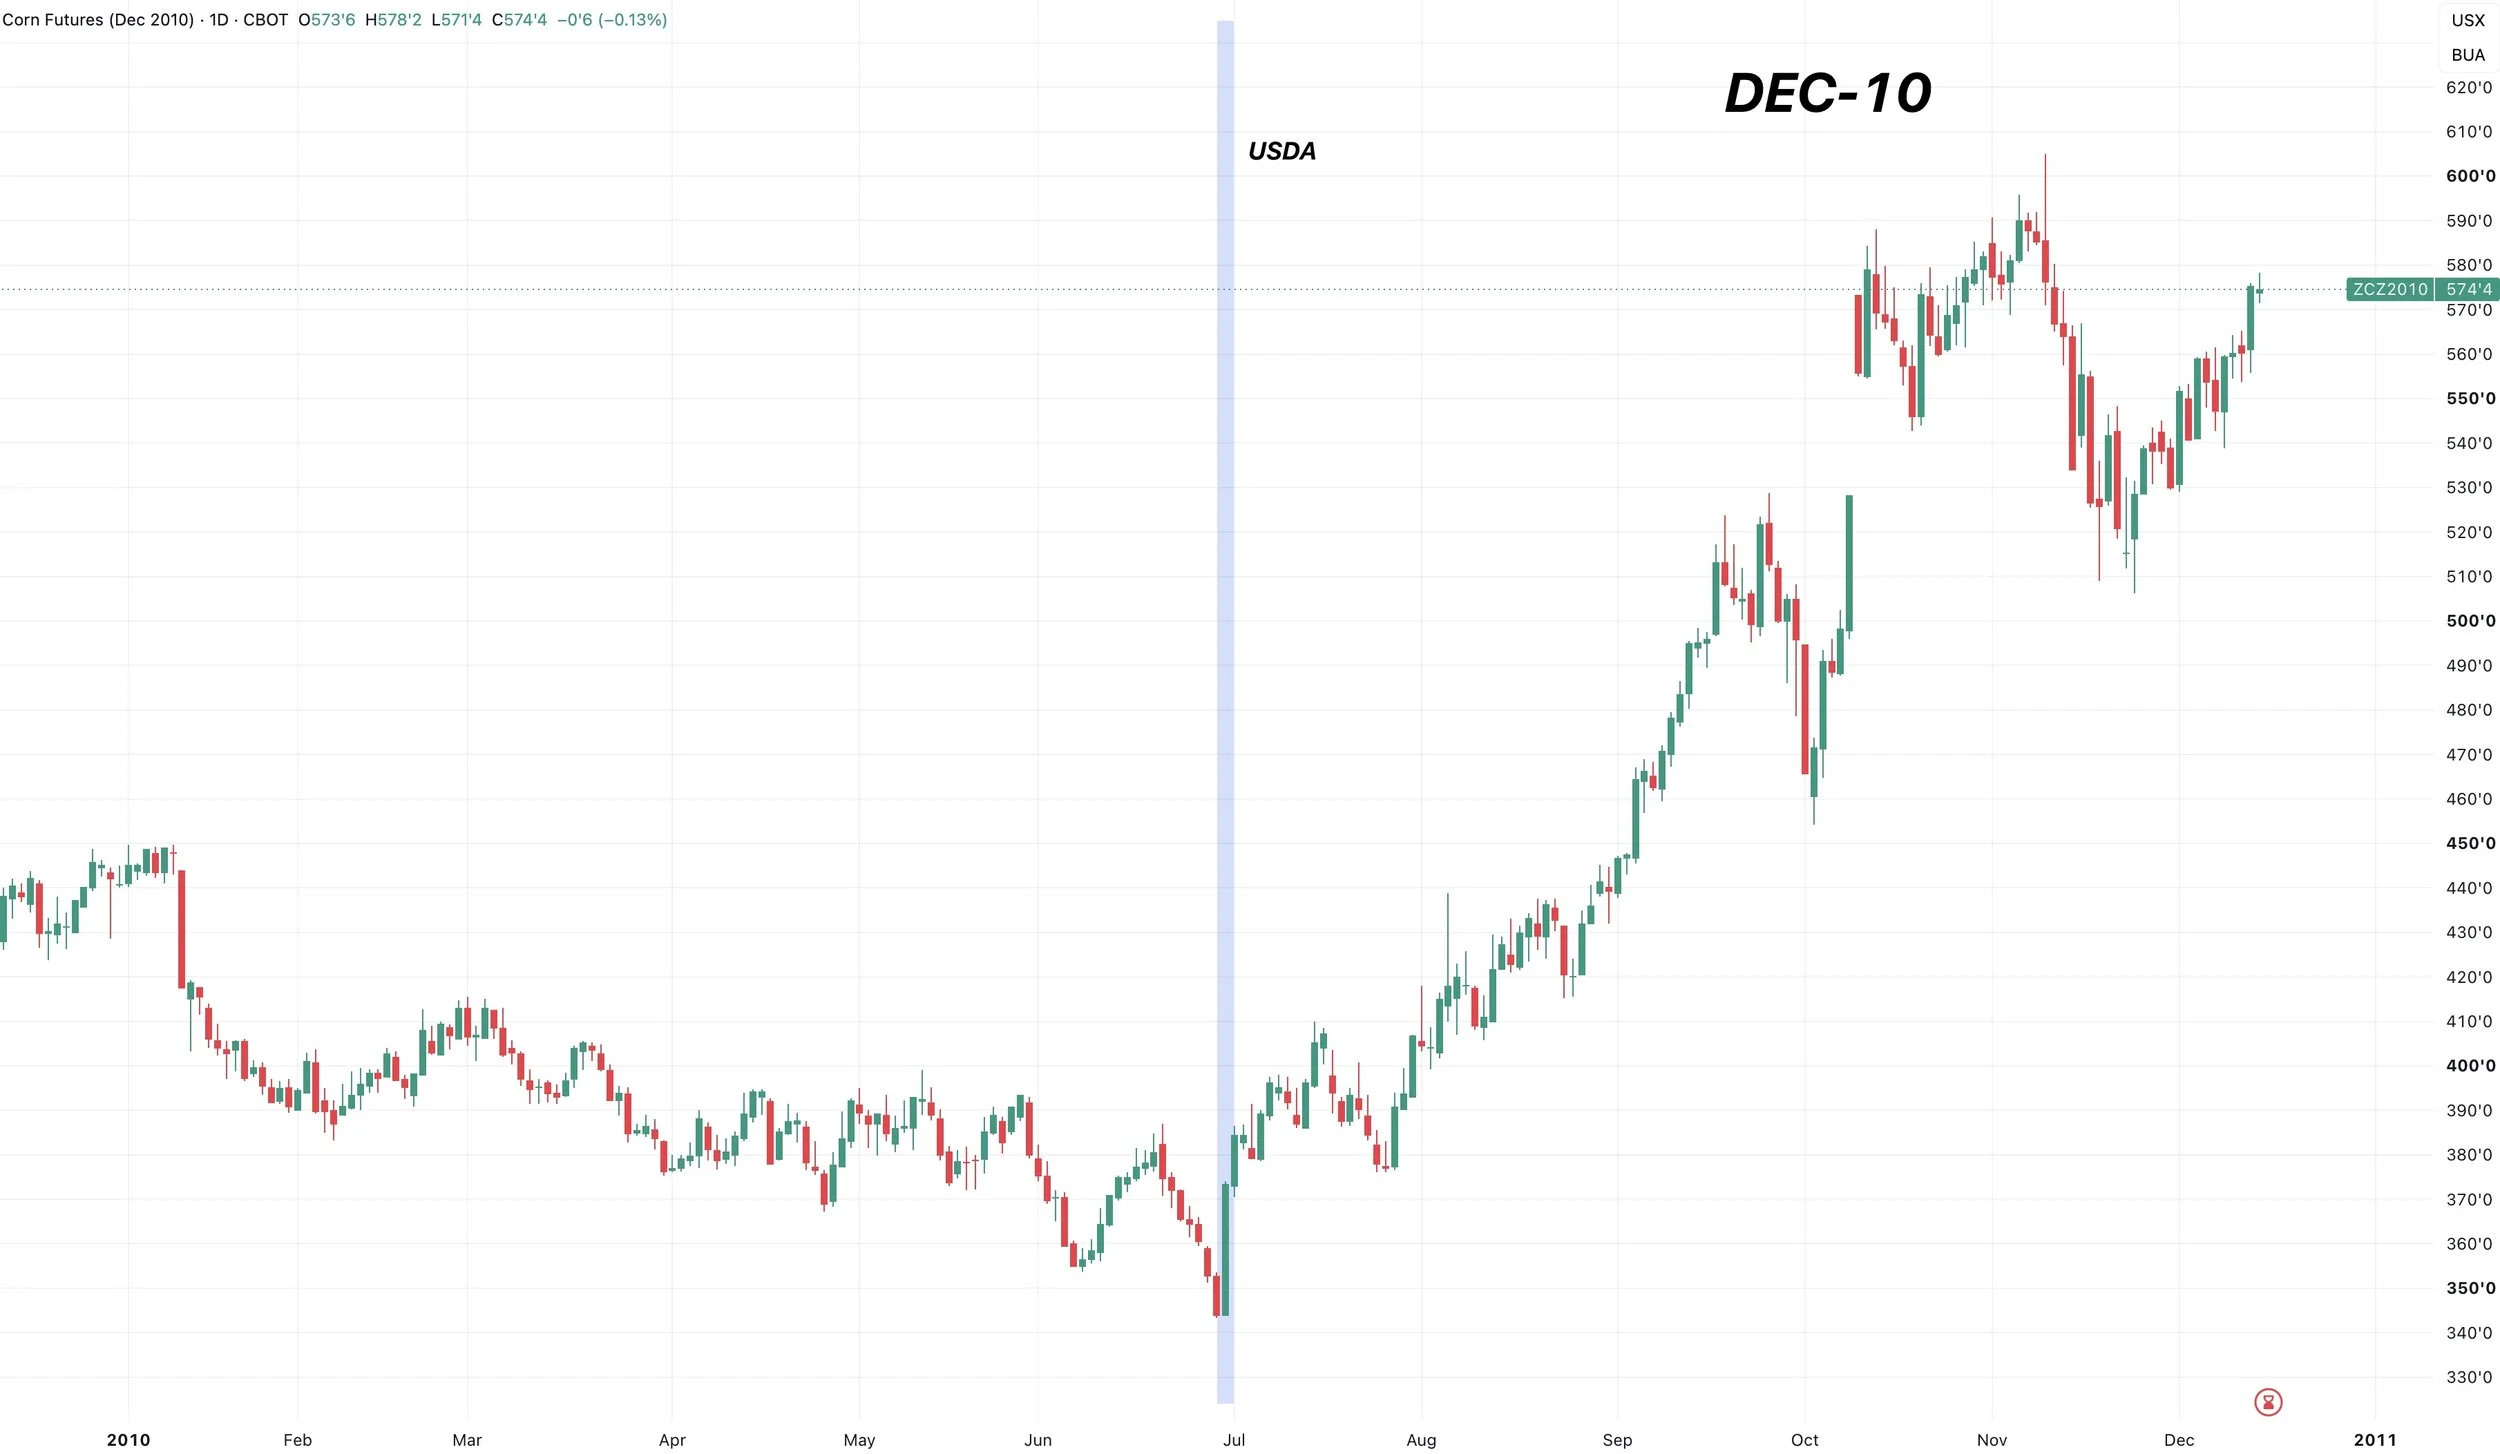
2010:
Now this year is the year where the report actually changed everything.
This report marked the lows for the rest of the year, and for the next several years.
We traded 30 cents higher on the report and ran from $3.50 to $6.00 by October.
After going through the last 15 years of this report, what are some things we can take away?
It obviously can move the market.
A lot of times, this report can spark the last leg of the seasonal sell off if it's bearish. As it has had a history of being bearish.
When the report has been bullish, it has often been viewed as a selling opportunity. As most of the rallies did not last very long. Altough it hasn’t been super bullish very often to begin with.
Unless you of course get a mega bullish report such as 2010. Where it eventually led to a bull market.
Let's look at soybeans now.
I'm not going to run through every year, but let's look at the 4 most bullish years.
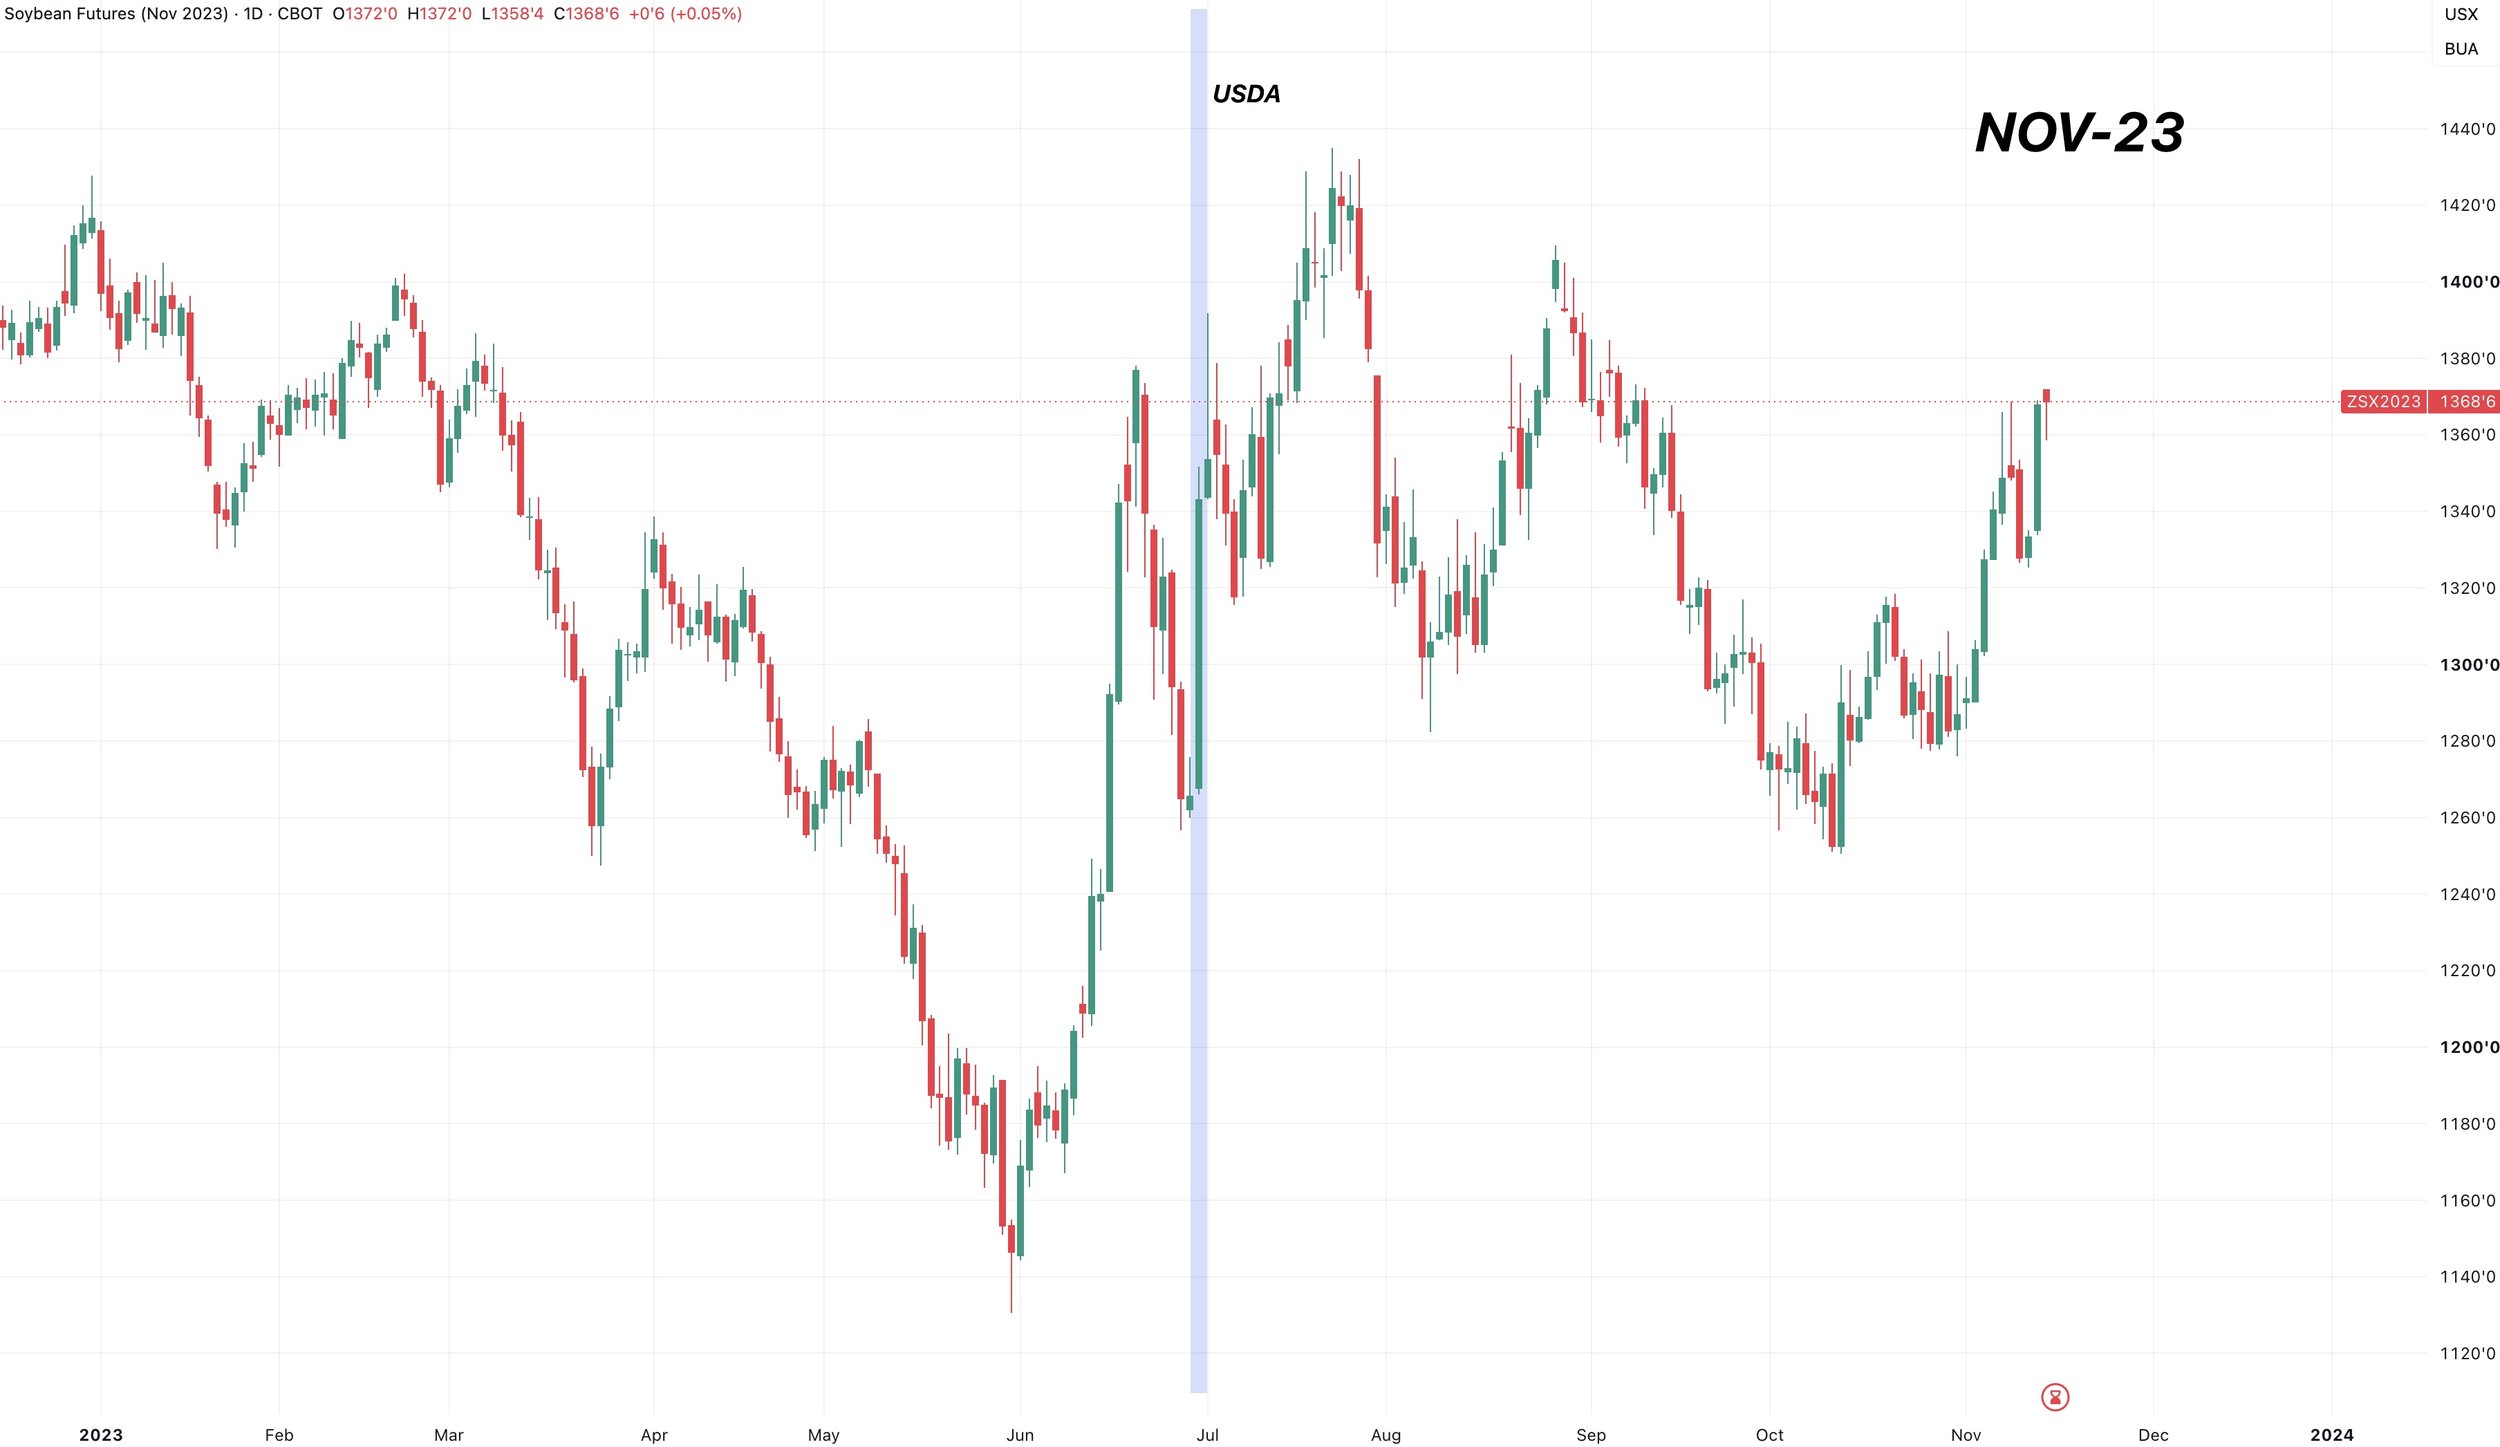
2023:
We rallied nearly 80 cents.
The report sparked some life back into the market, the rally lasted a few weeks but this was also that weather scare year.
2021:
We rallied 87 cents the day of the report.
It ended up marking the highs.
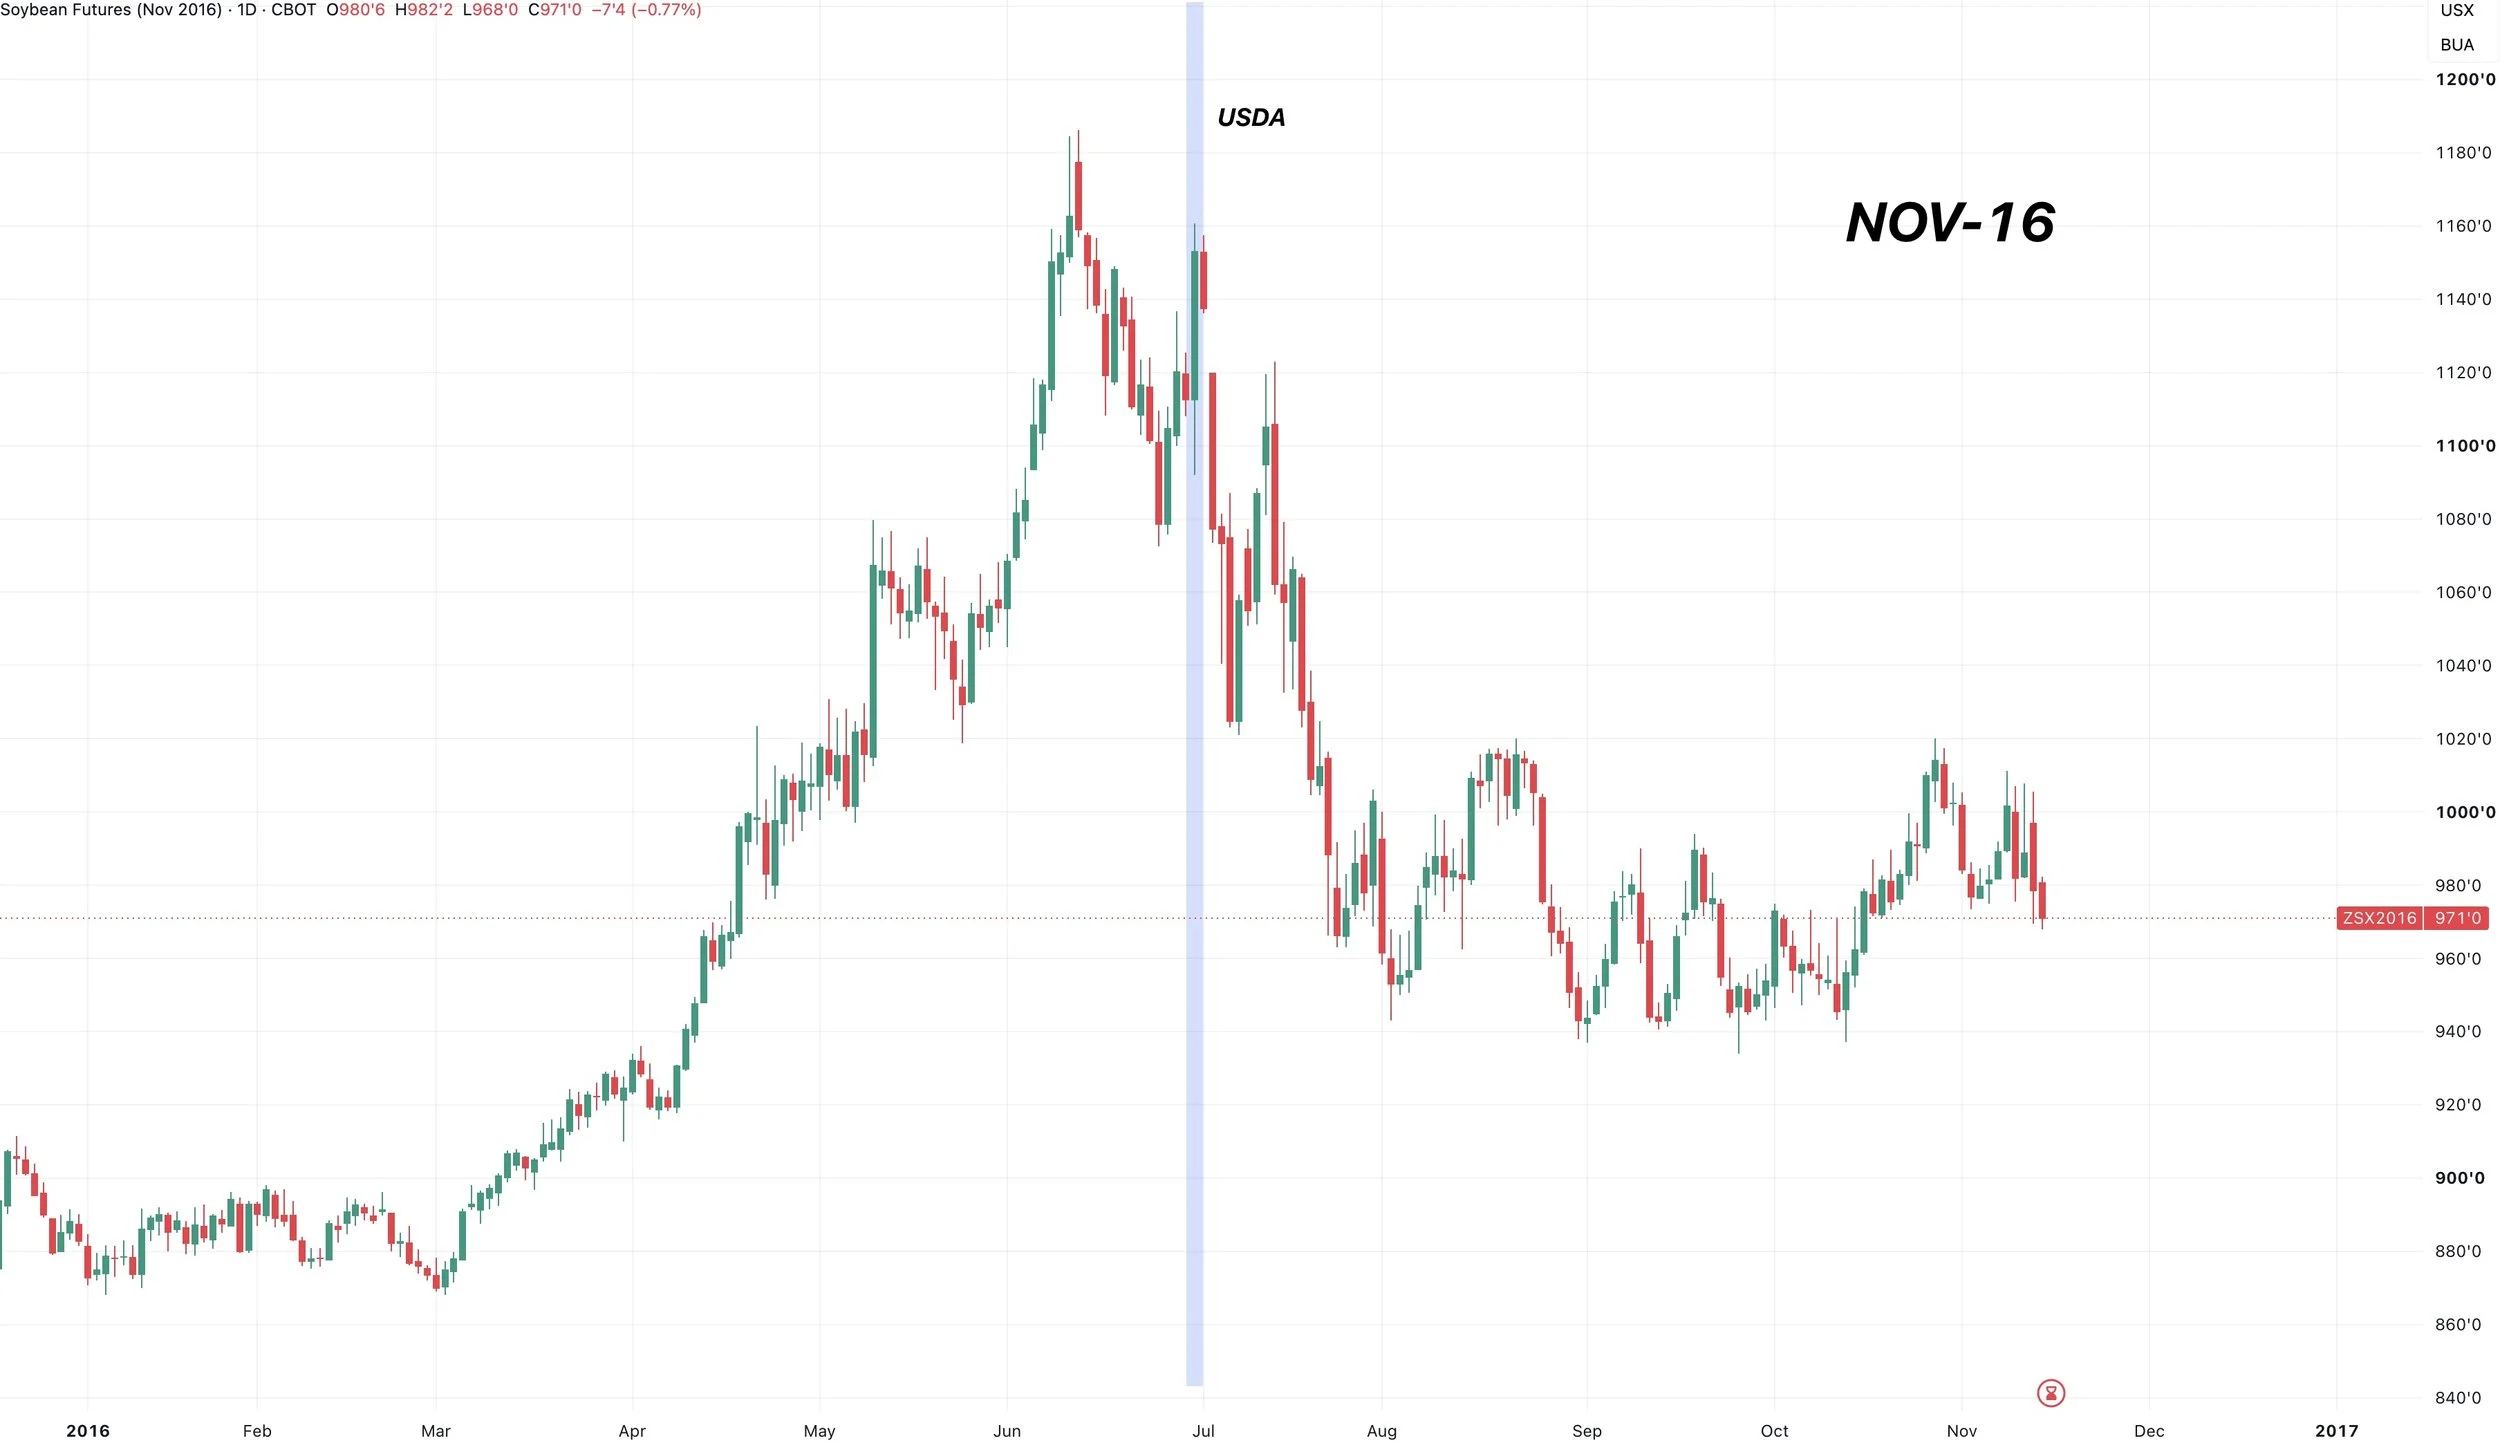
2016:
We were up 40 cents the day of the report.
It ended up marking the highs.
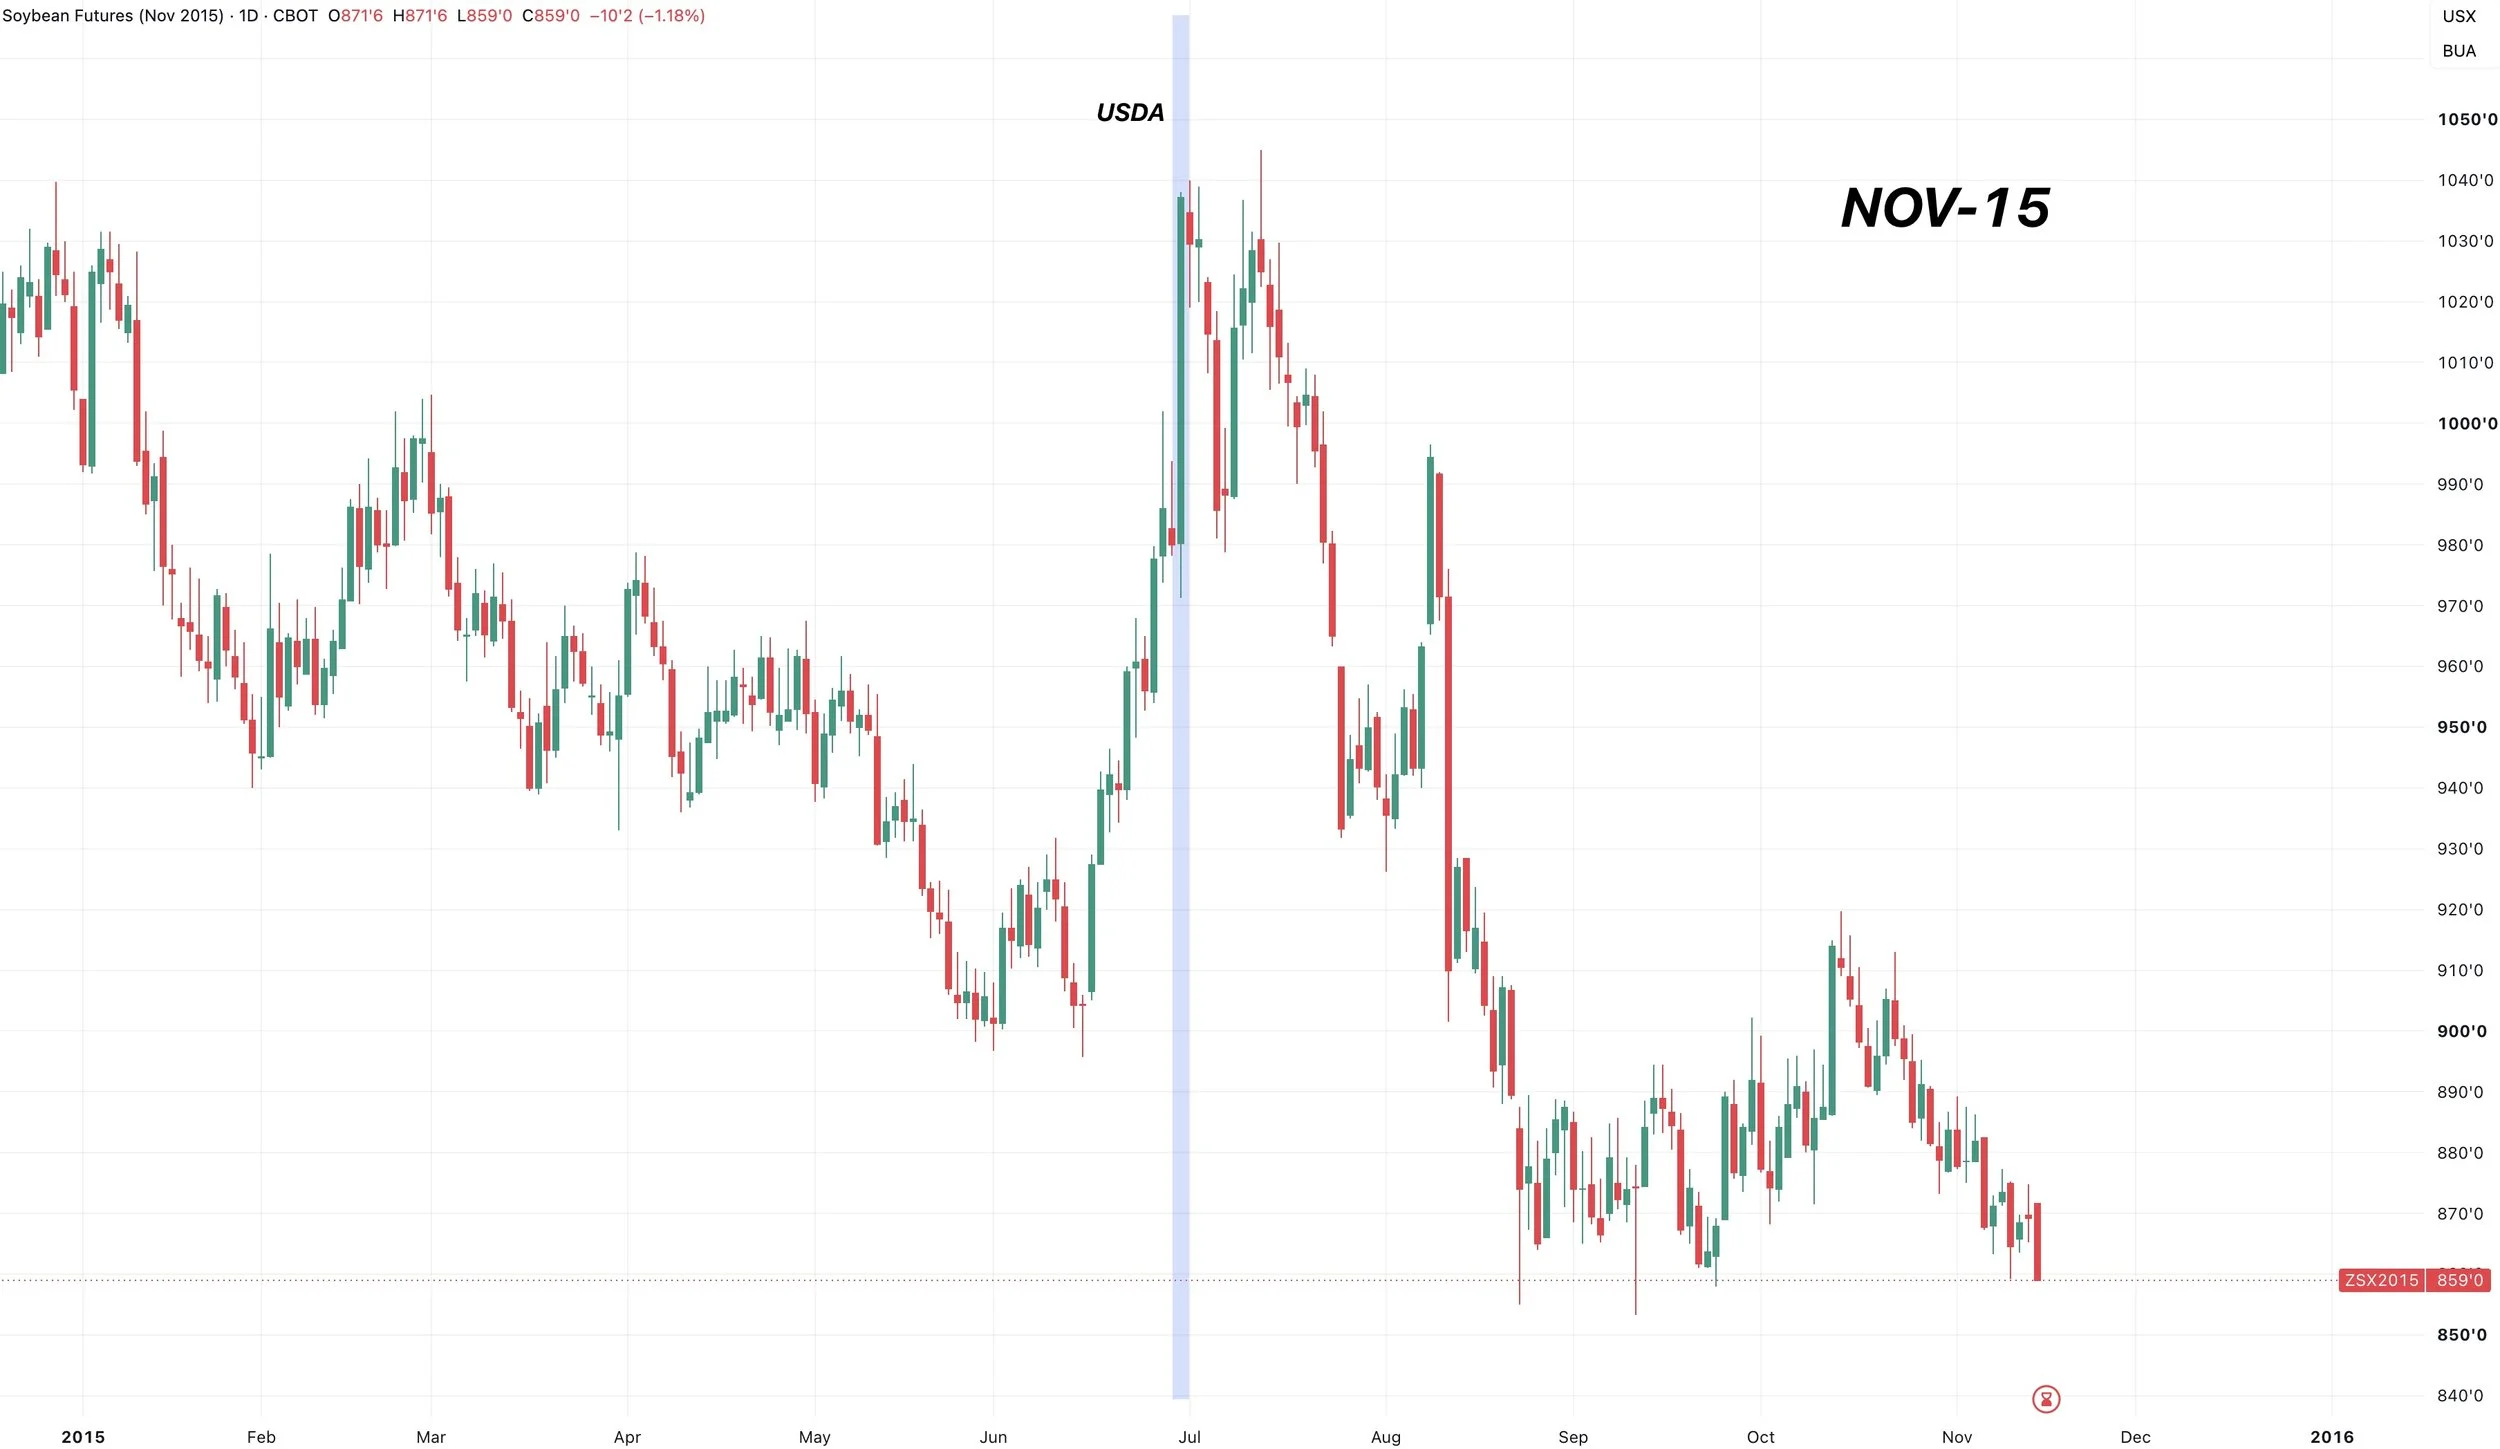
2015:
We were up almost 60 cents the day of the report.
It ended up marking the highs.
So similar to corn, if the report is bullish it is often an opportunity.
There is a difference between a "catch the market off guard" and a real fundamental change.
Catching the market off guard is what we just saw happen to wheat in the USDA report back in May. Limit up, but then that was it.
A real fundamental change is what we saw in 2010.
Remember, this report isn’t just about acres.
We also have the stocks which can be just as important.
None of these past years really matter. If the report is bullish, the key is going to be is this just a catch the market off guard move? Or did the report make a real fundamental change to justify prices going a lot higher?
The same could be said to the downside. Is it just a bearish surprise, or does it fundamentally justify us going a lot lower?
Today's Main Takeaways
Corn
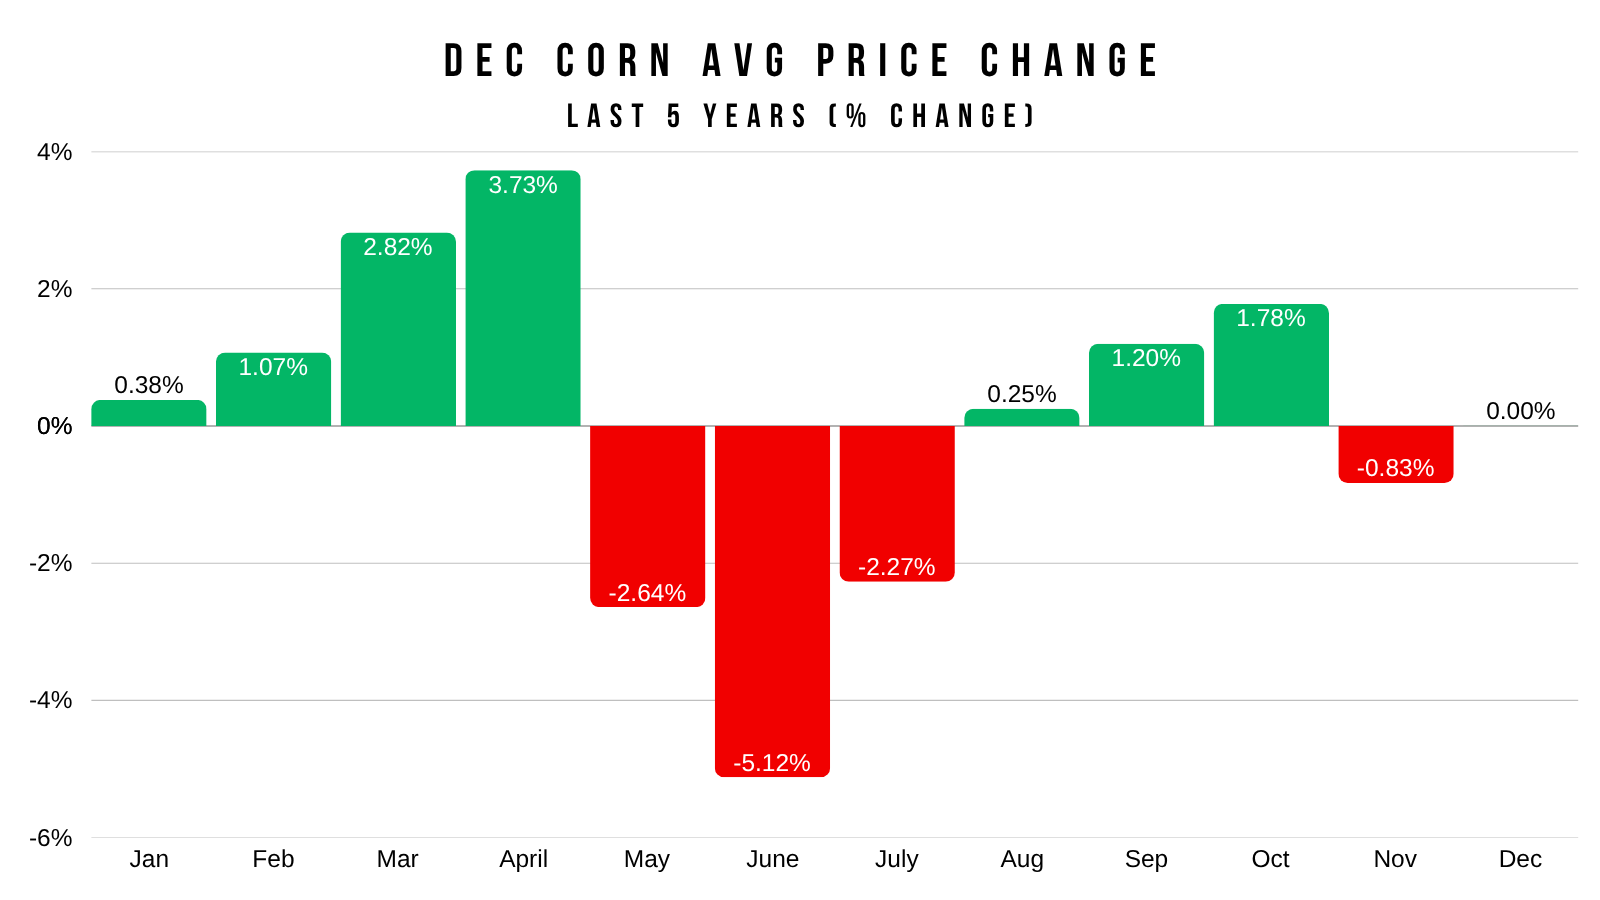
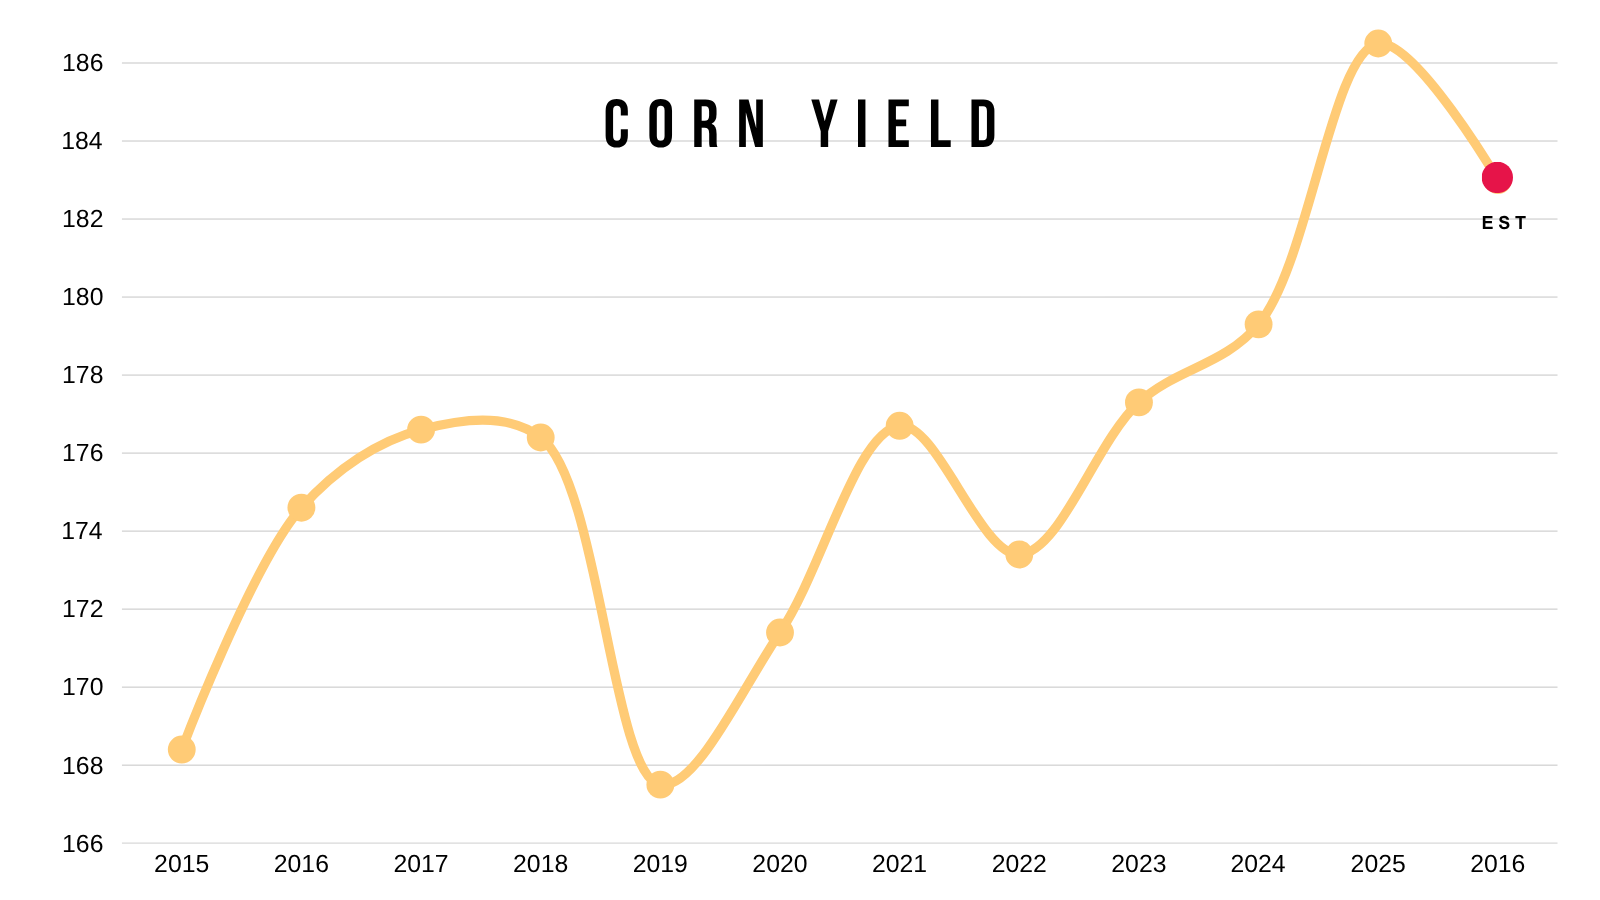
Here is Dec corn's average price changes for every month over the last 5 years.
If you notice, June has dominated the negative seasonality.
July has also been a negative month, but following May and June, this data may suggest that the worst of the sell off is behind us.
The fall has then usually been on the friendly side.
No one knows what the USDA is going to do.
As we've talked about several times..
What we do know is that the March acre survey had the lowest response rate of all-time.
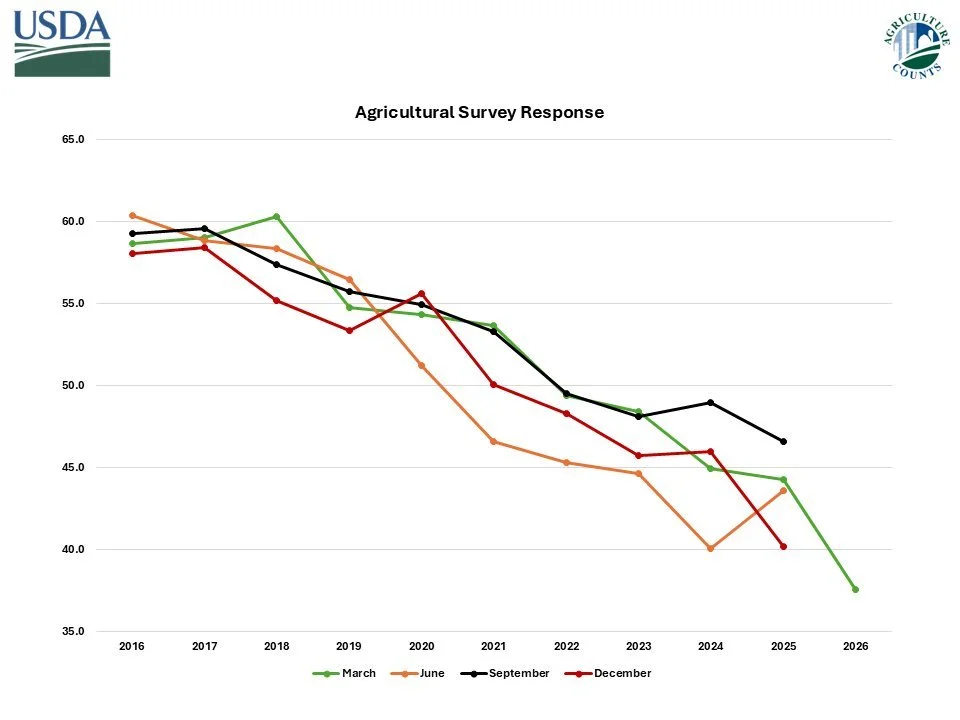
We also know that the USDA's final number has not came within 1 million of their March number in nearly a decade.
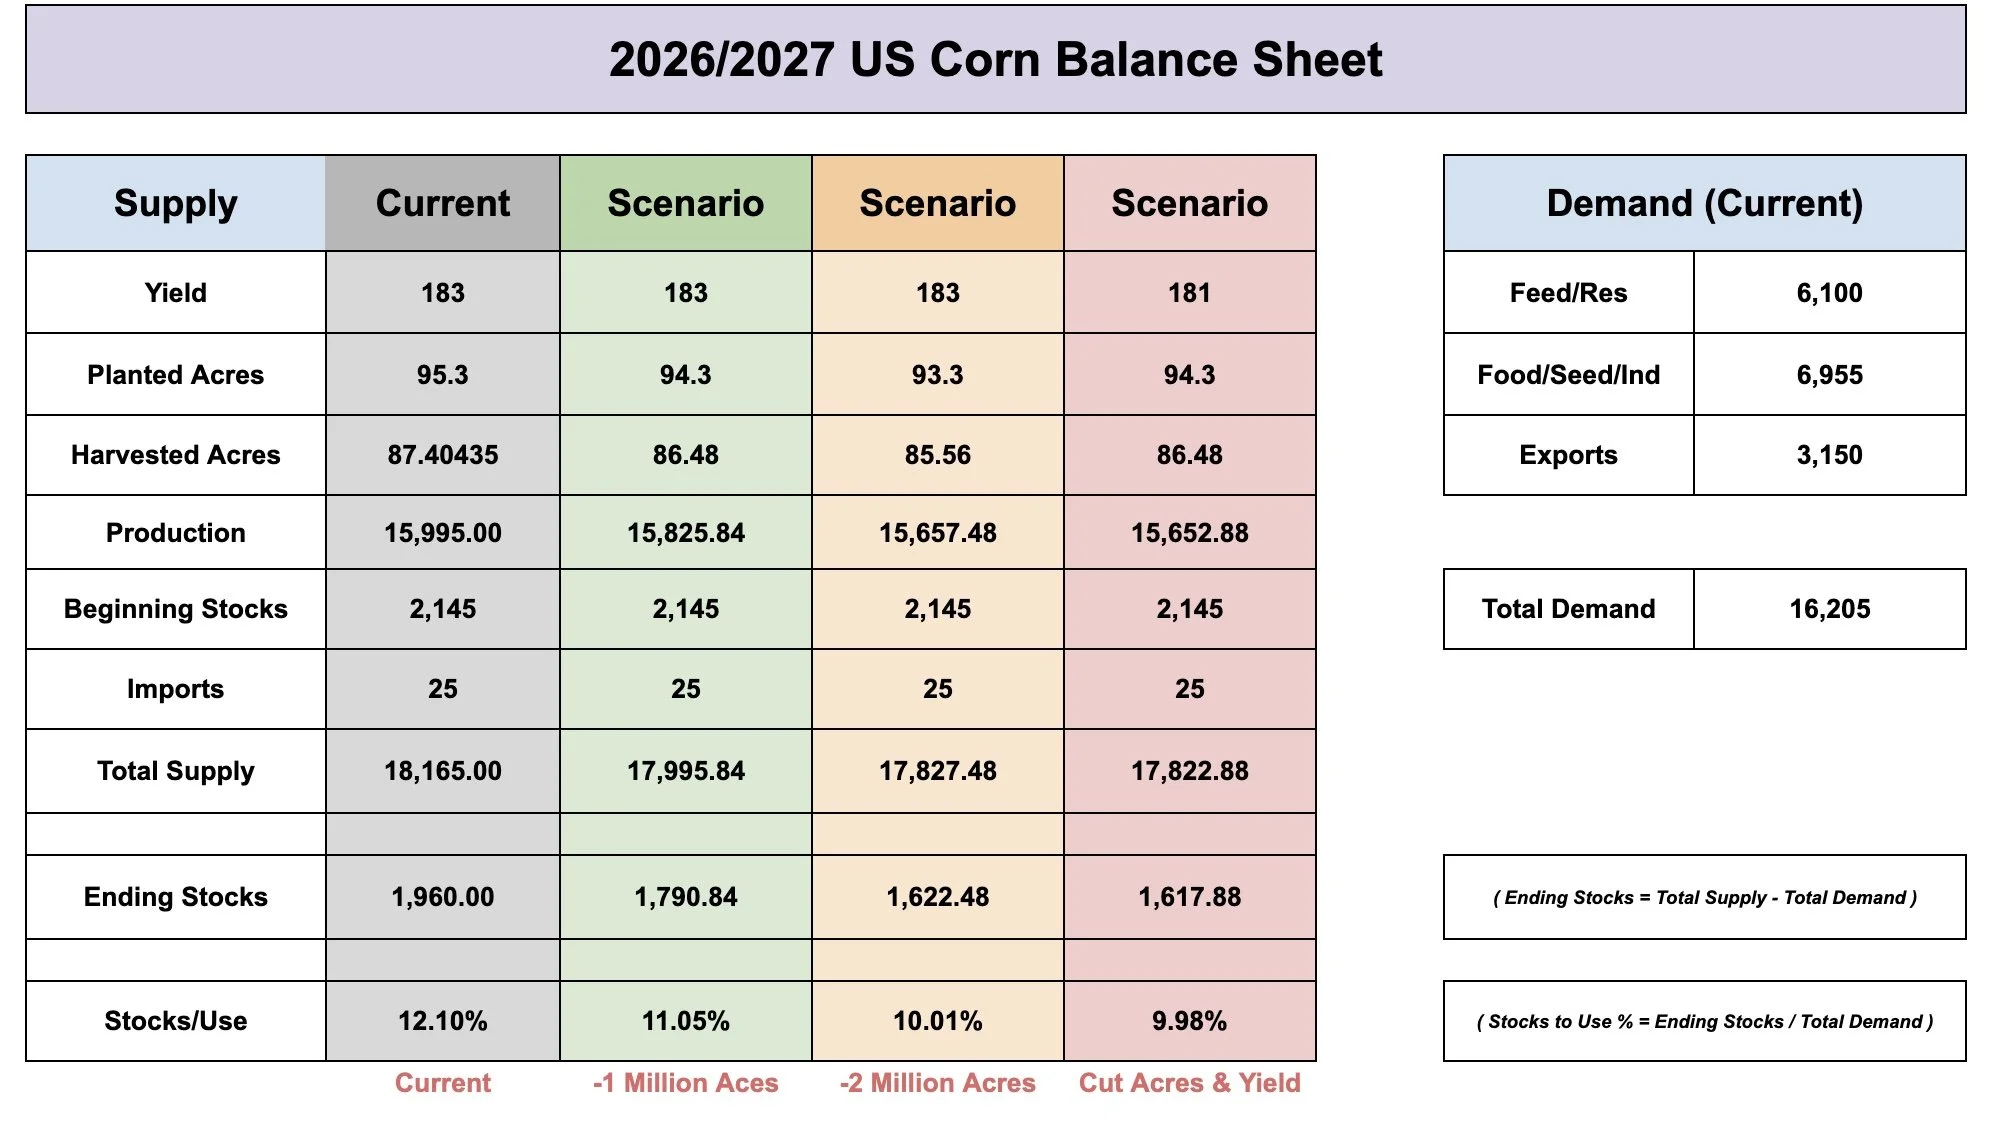
Like we've talked about countless times, the balance sheet can’t necessarily afford to lose too many acres.
If we do lose acres, we will need a big yield to make up for it to prevent the balance sheet from getting relatively tight.
Just dropping acres by 1 million gives you an 11% stocks to use. Which isn’t bull market territory, but that’s with using a 183 yield.
Lose 2 million acres? It completely changes the balance sheet. Even with a 183 yield.
Cut both acres and yield? Well that would of course change things drastically.
There is still a story in new crop, and plenty of potential as we head into next year.
Last year, it took record acres.. and a record yield to get that carryout of 2.1 billion bushels.
So many things had to go right for that to happen.
We won’t be seeing either of those this year, and we are still seeing record demand.
Not to mention the high probability of China buying.
What happens if China starts to buy on top of record demand?
The USDA is actually expecting demand to be worse than last year, as that was their way of "balancing the balance sheet".
You could argue that won’t happen, given that exports are actually ahead of last year's pace.
The world is still the tightest it's been on corn in over a decade.
Doesn’t matter if the US has a big crop, but it does mean that the rest of the world absolutely needs our corn.
Demand isn’t going anywhere.

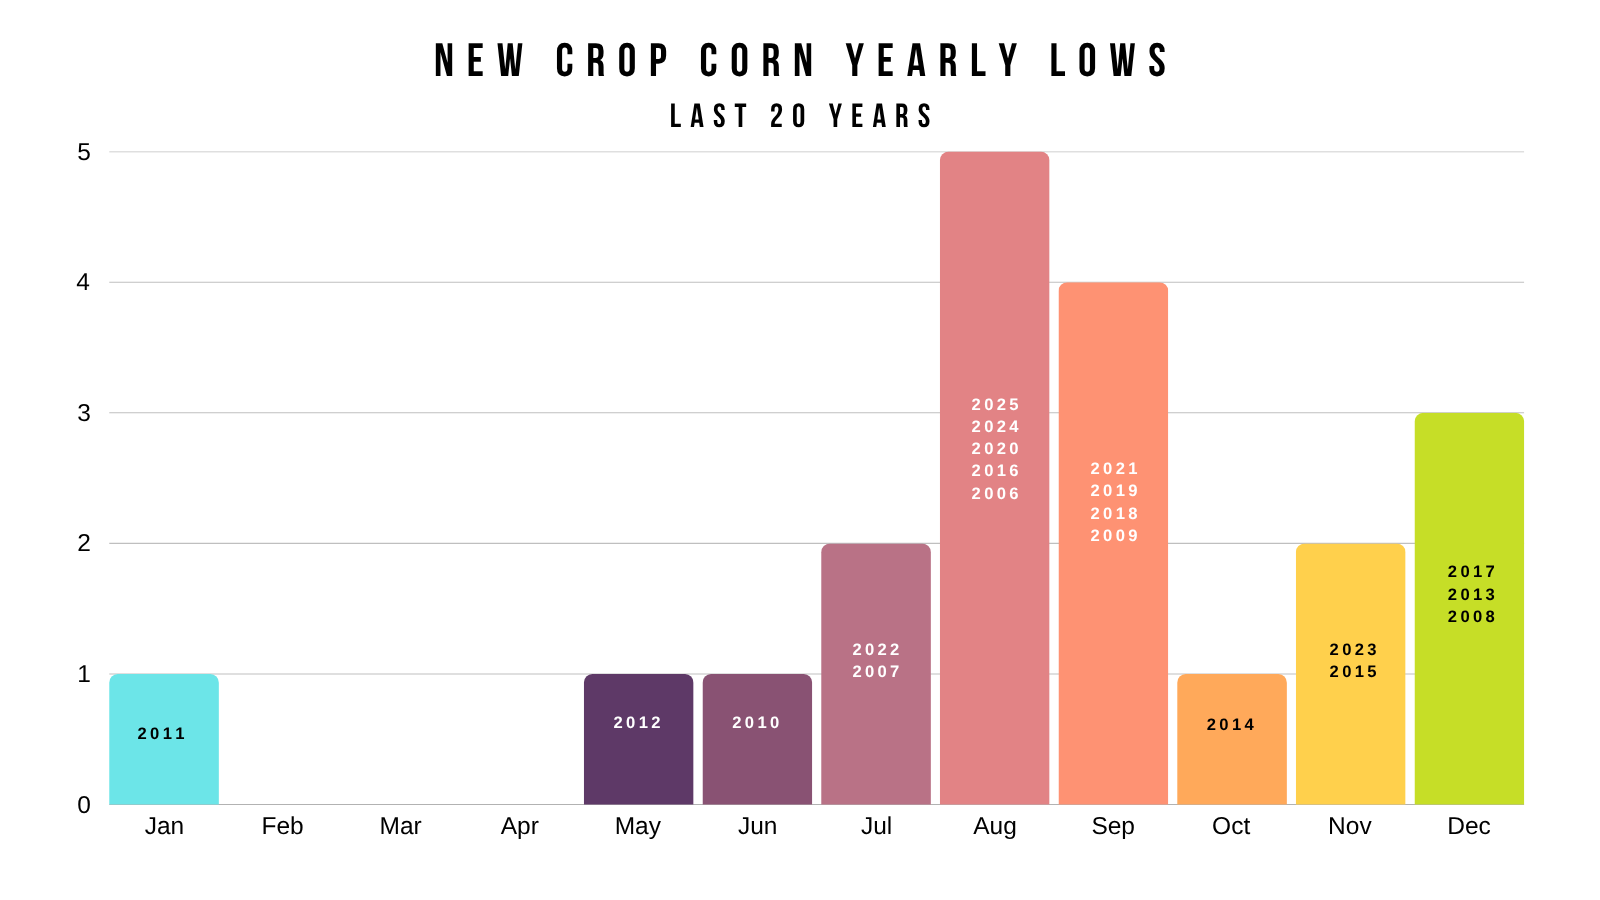
Past Harvest Lows:
I've shown this chart multiple times.
Here is our last several harvest lows.
2025: August
2024: August
2023: August
2022: Late July
2021: Early Sep
2020: August
2019: August
So if we get a bounce, it will probably want to be protected. Given the high probabilities for the lows to be made right around August.
As seasonals are not on our side still.
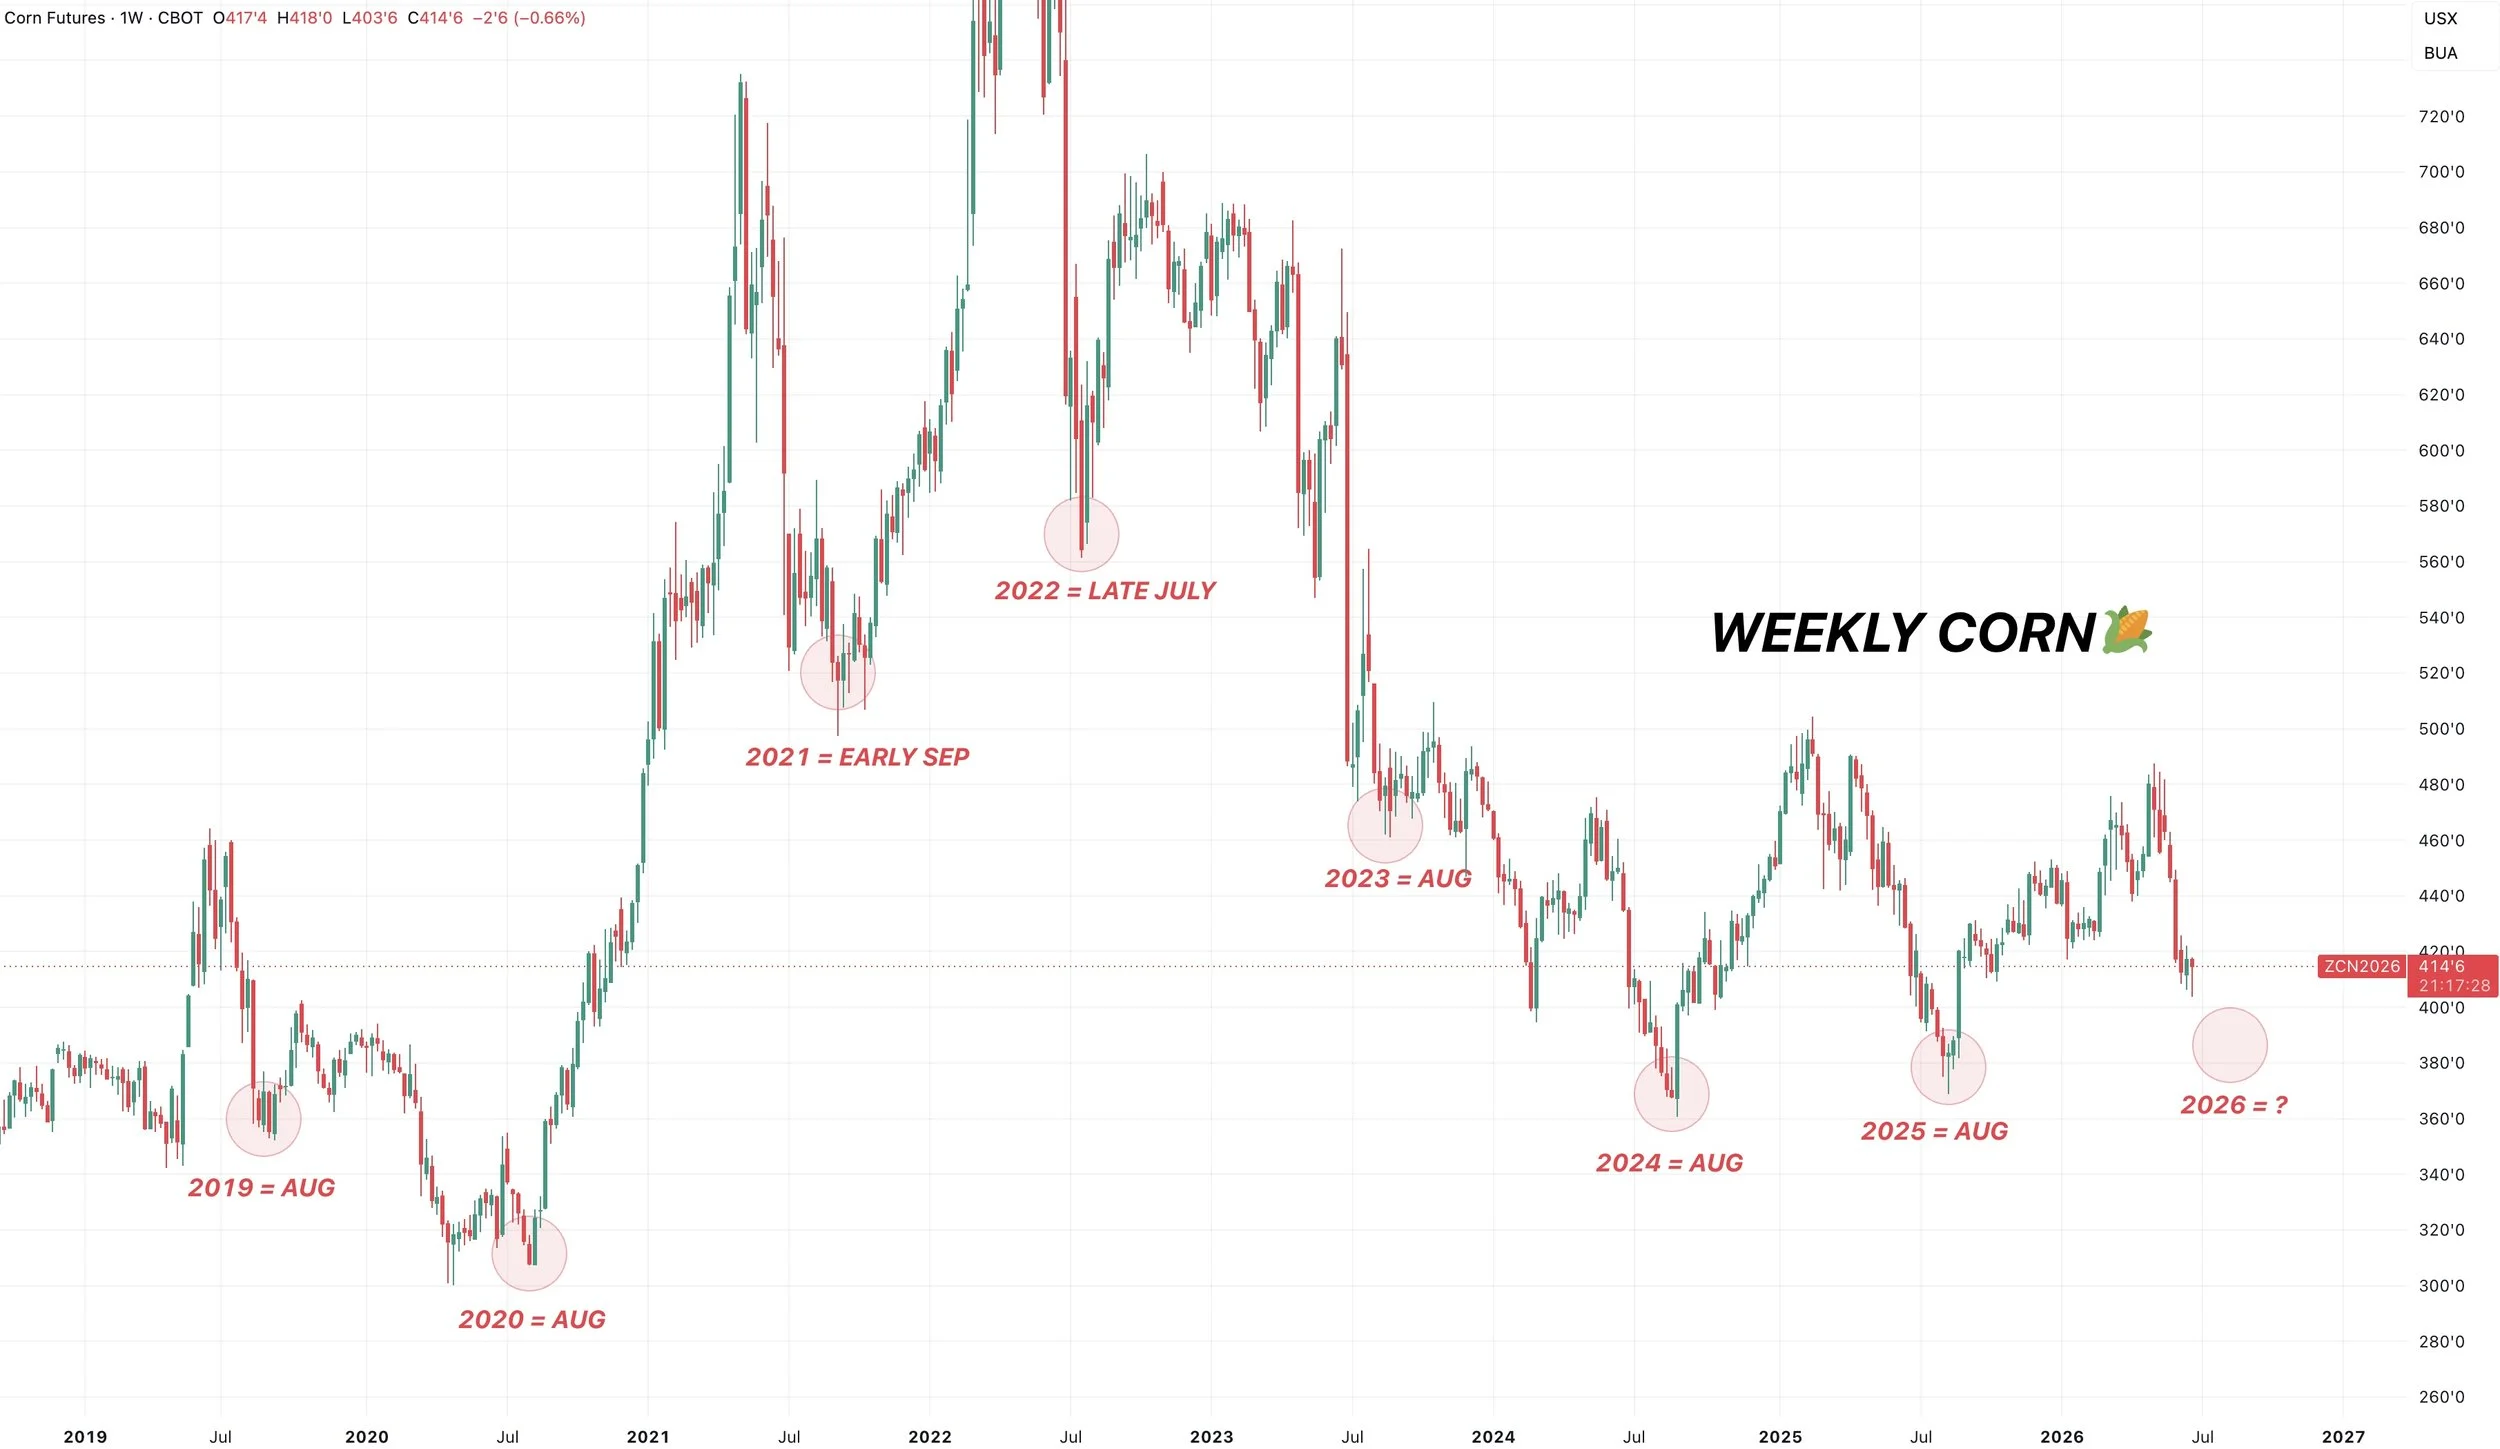
Unless this report makes a big material change, we almost never post our lows in June.
That's just something to be aware of if we get a rally.
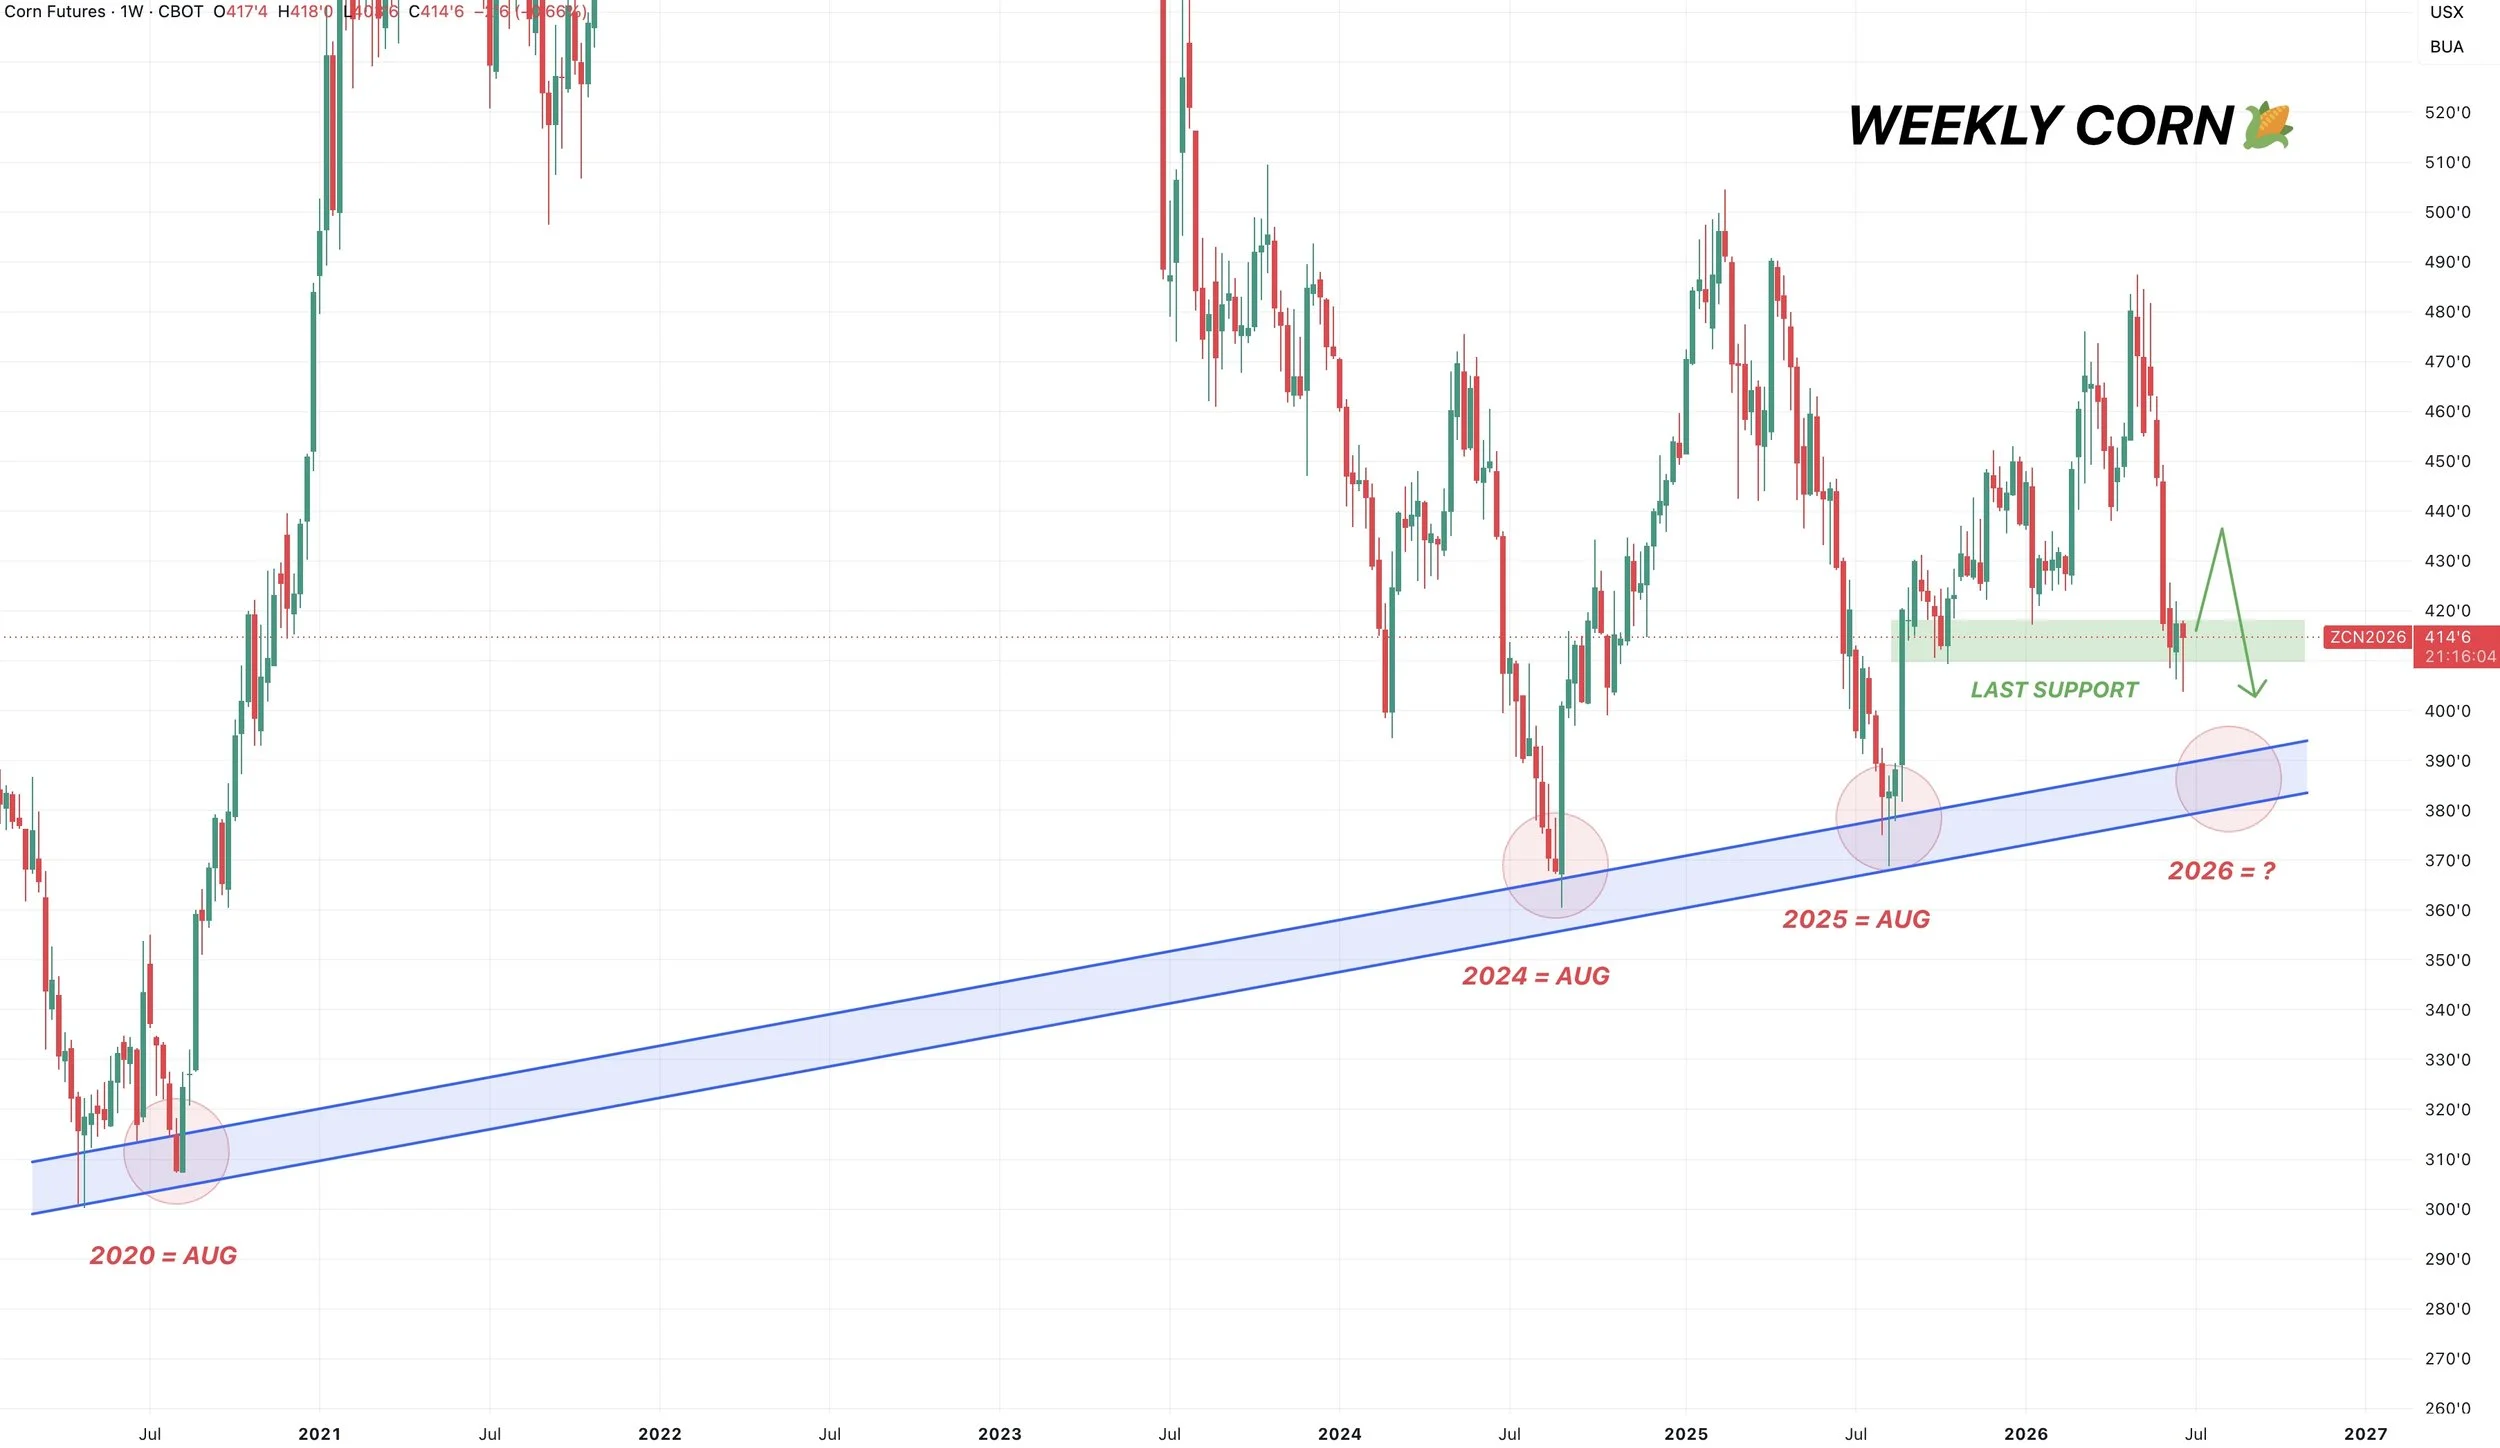
I still think we could very possibly see our harvest lows come in around $3.80 to $3.90
That's trend support that's marked the harvest lows in 2020, 2024, and 2025.
However, if you notice we are currently hanging on to that last line of support. There is zero support below this level.
So if we are going to put together any sort of bounce, you'd like to see it here.
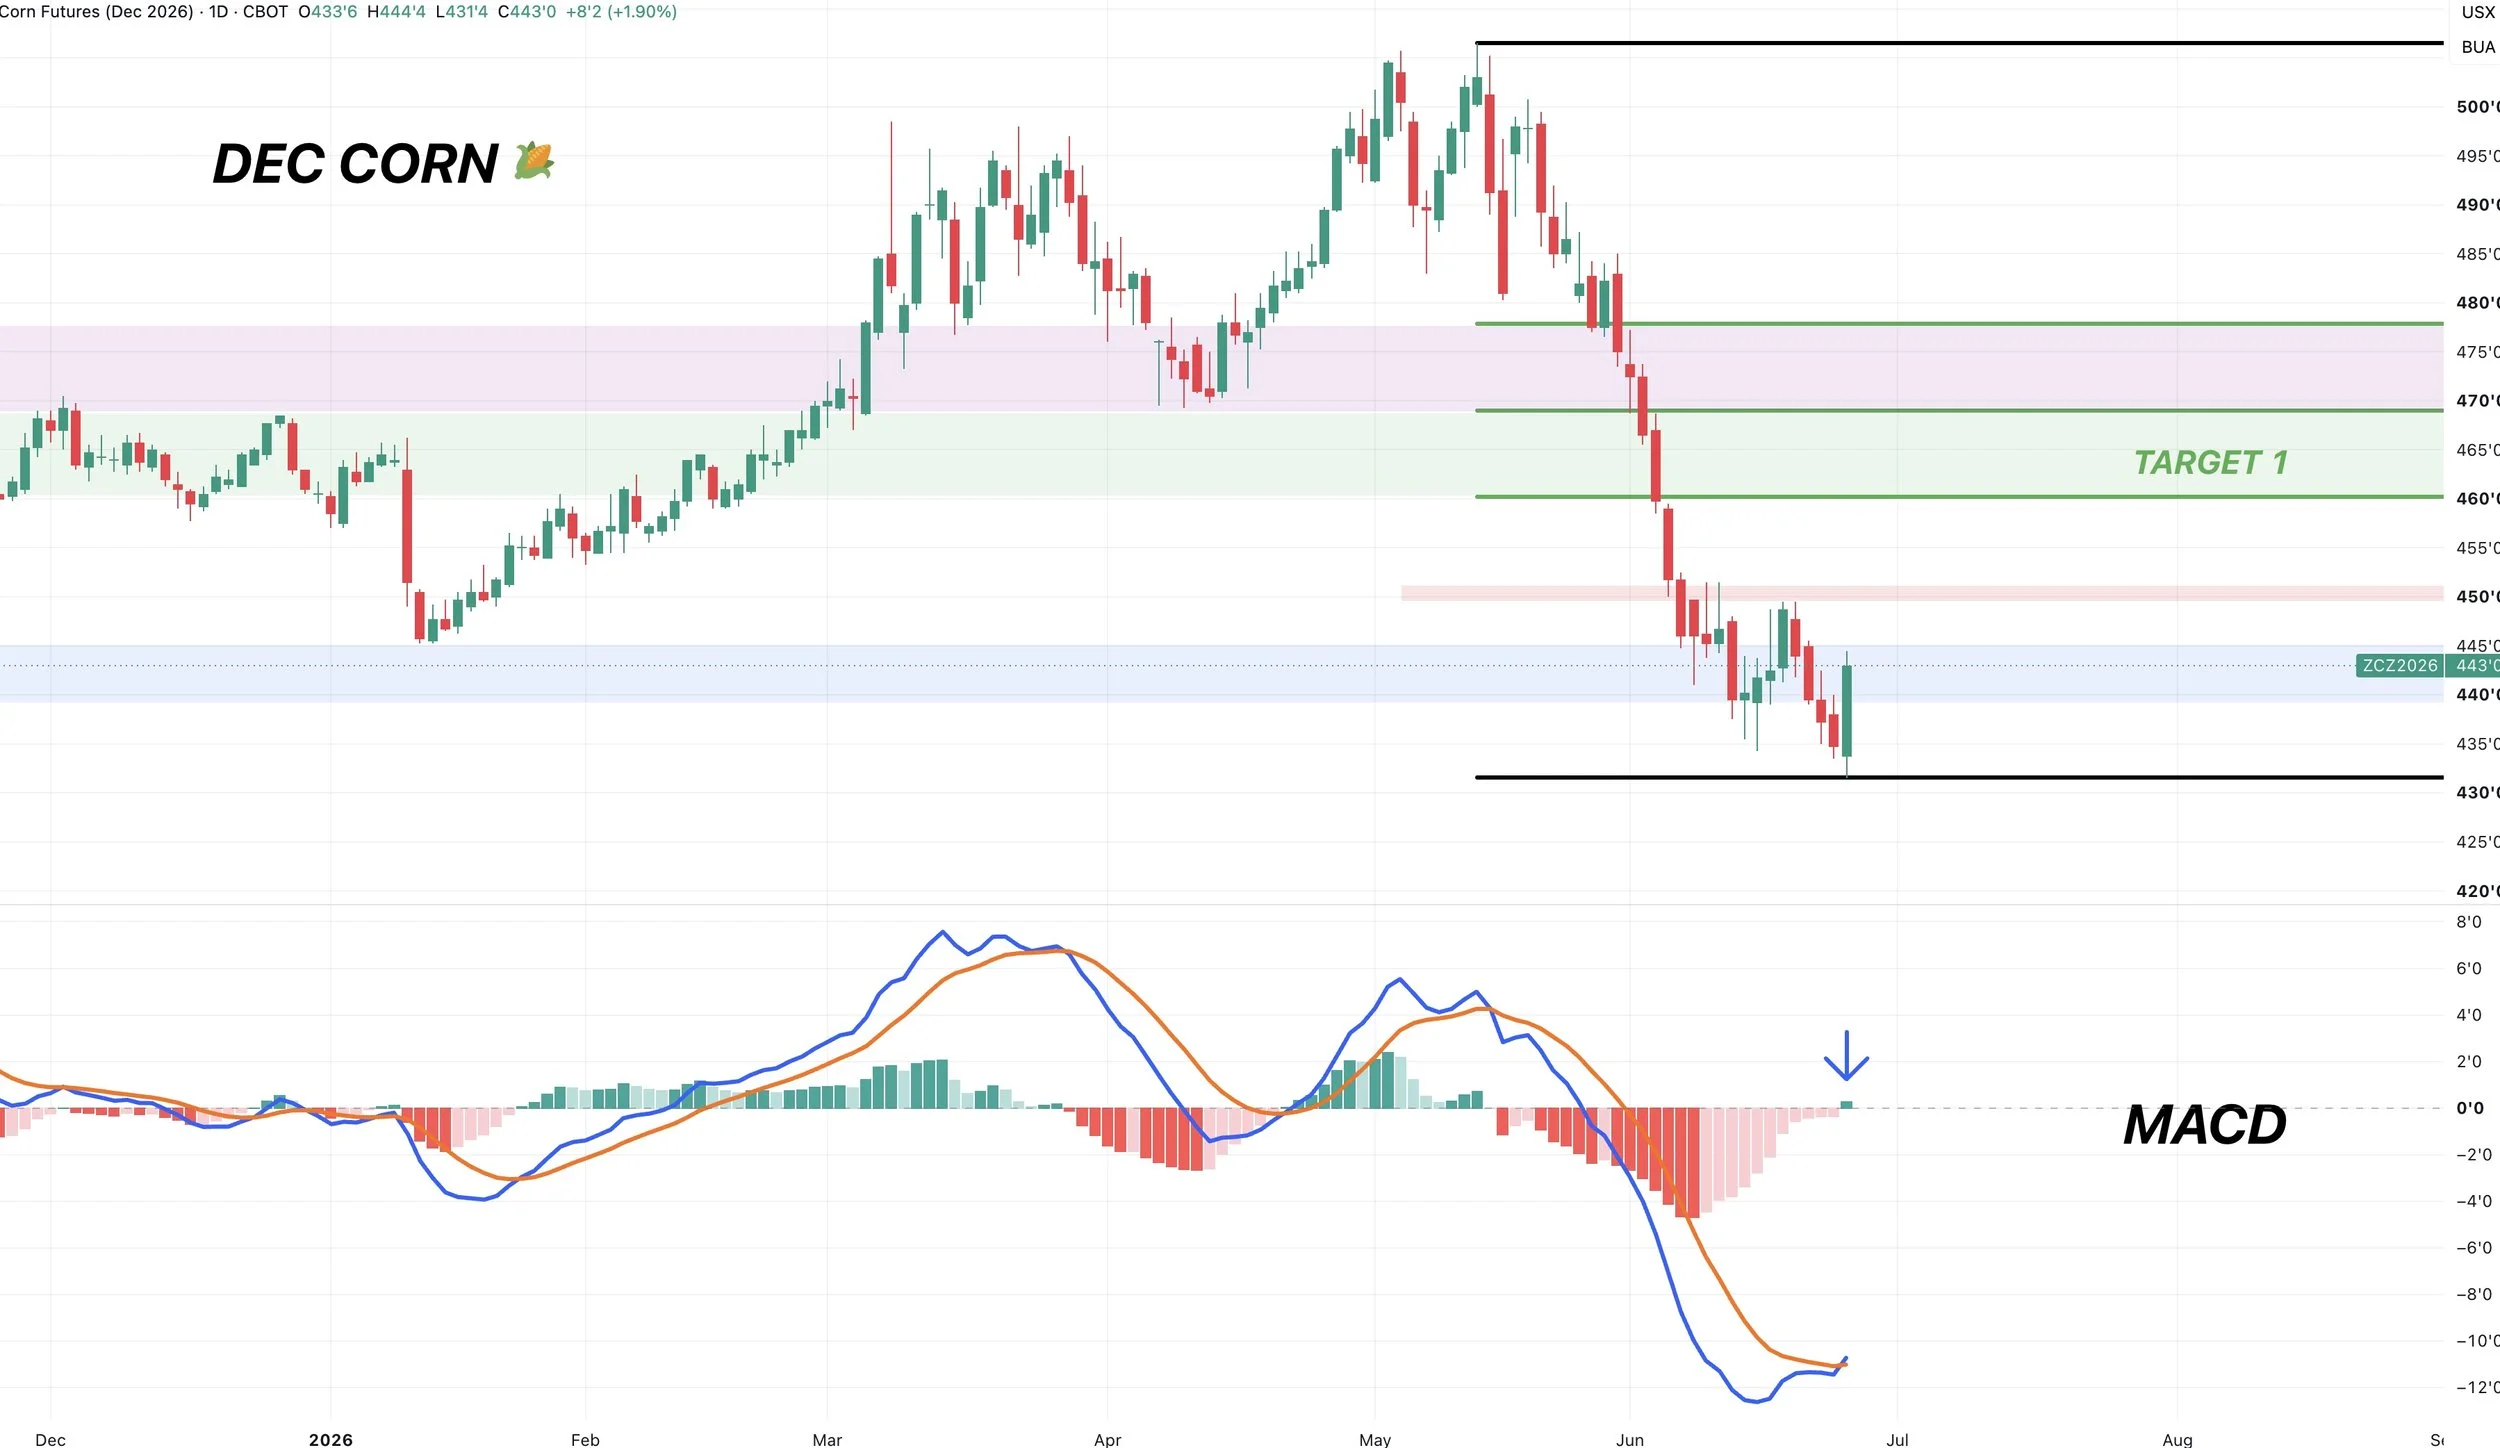
Dec Corn Chart:
Key reversal at contract lows today. Today's price action looks very promising.
We posted new contract lows, we then rallied and closed above yesterday's highs.
That's a key reveral.
If you were looking for a sign of a bottom, this would be one of those signs.
If we can take out the $4.50 level, it would be a sign of a true local bottom.
I am looking to defend a rally towards $4.60 to $4.70 if it comes.
That claws back 38.2% to 50% off the entire sell off.
It's prior support and resistance.
So that's the target for now if we've put in some lows.

The MACD momentum indicator did offically flip bullish today. Which might indicate the momentum has now shifted to the upside.
We also have confirmed bullish divergence on the charts.
Prices made new lower lows.
The RSI made higher highs.
Often a sign of a reversal and indicates the downside momtentum is getting tired.
Bearish divergence marked the highs. We now have bullish divergence.
So there are some positive things with today's price action.
Let's just hope the USDA doesn’t ruin the party.

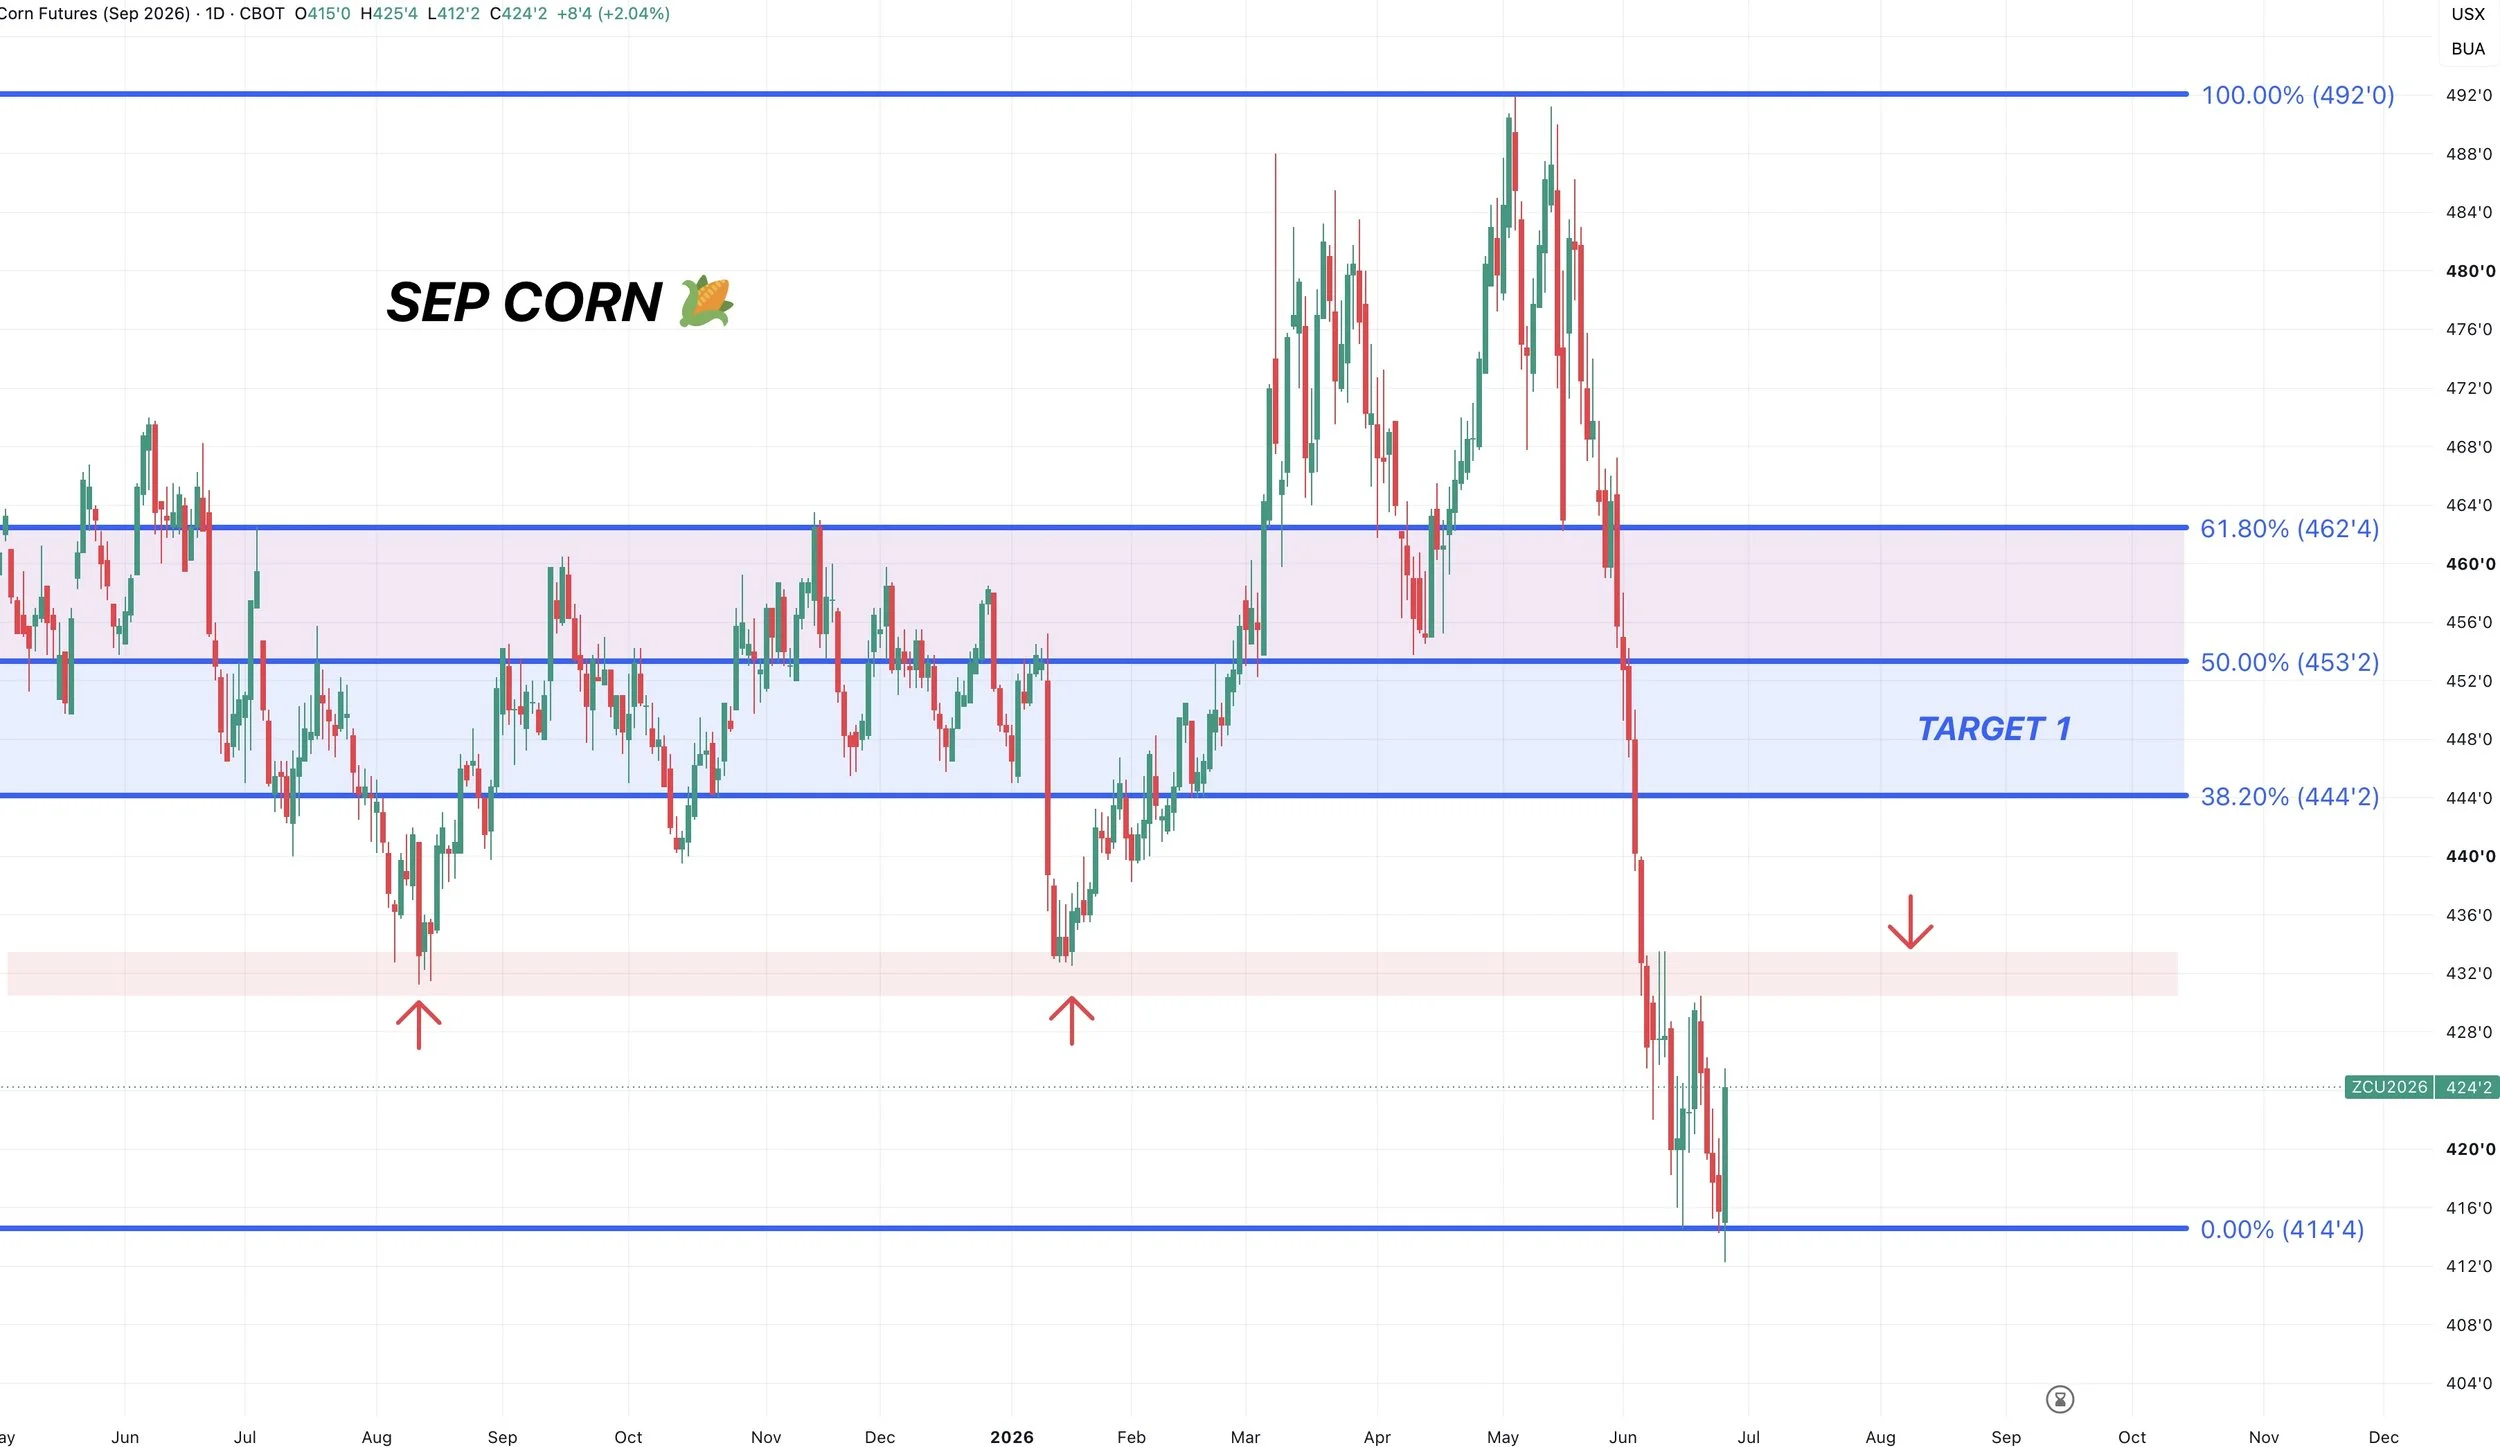
Sep Corn Chart:
We also posted a key reveral in Sep corn.
Again, we we made contract lows up closed above yesterday's highs.
That is a positive sign.
If we can break above the $4.33 range, then I could see us getting a rally into the $4.44 to $4.53 range.
Like in Dec, that claws back 38.2% to 50% of the sell off.
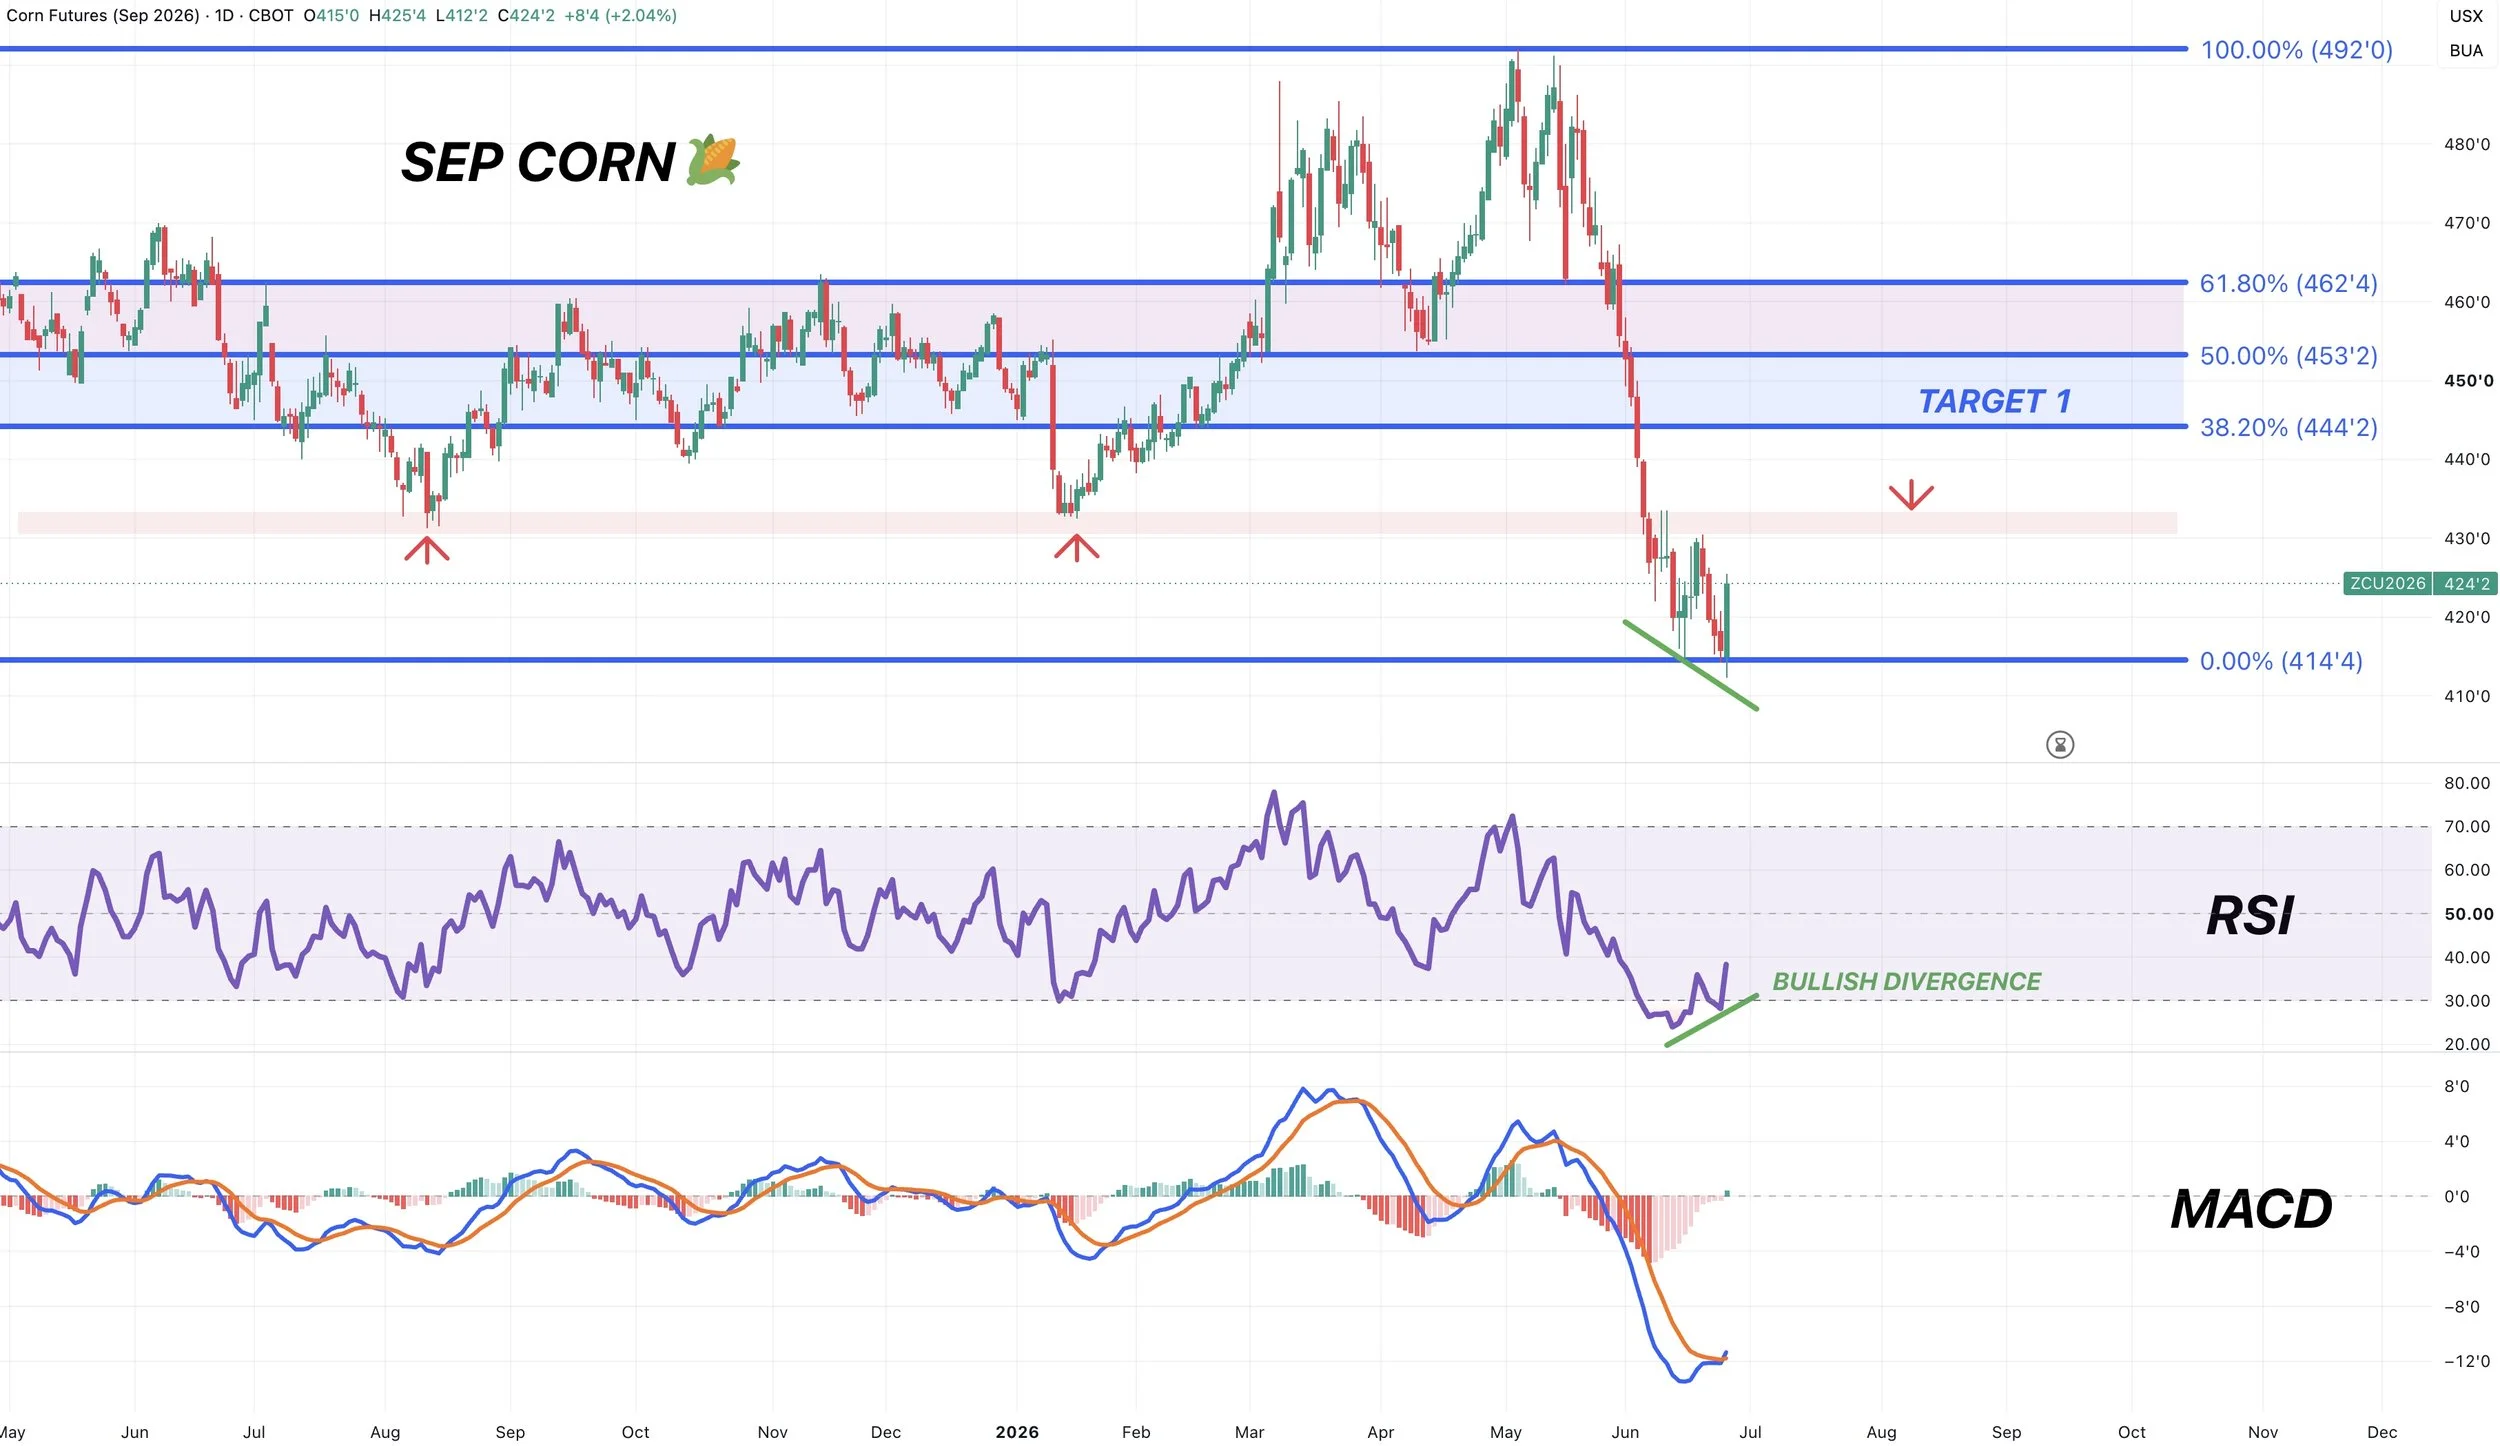
Looking at the indicators, we have the same set up in Sep as in Dec.
The MACD flipped bullish.
We have bullish divergence on the RSI.
That is all positive and a possible sign that we've put in a local bottom, but we now need some follow through.
Soybeans
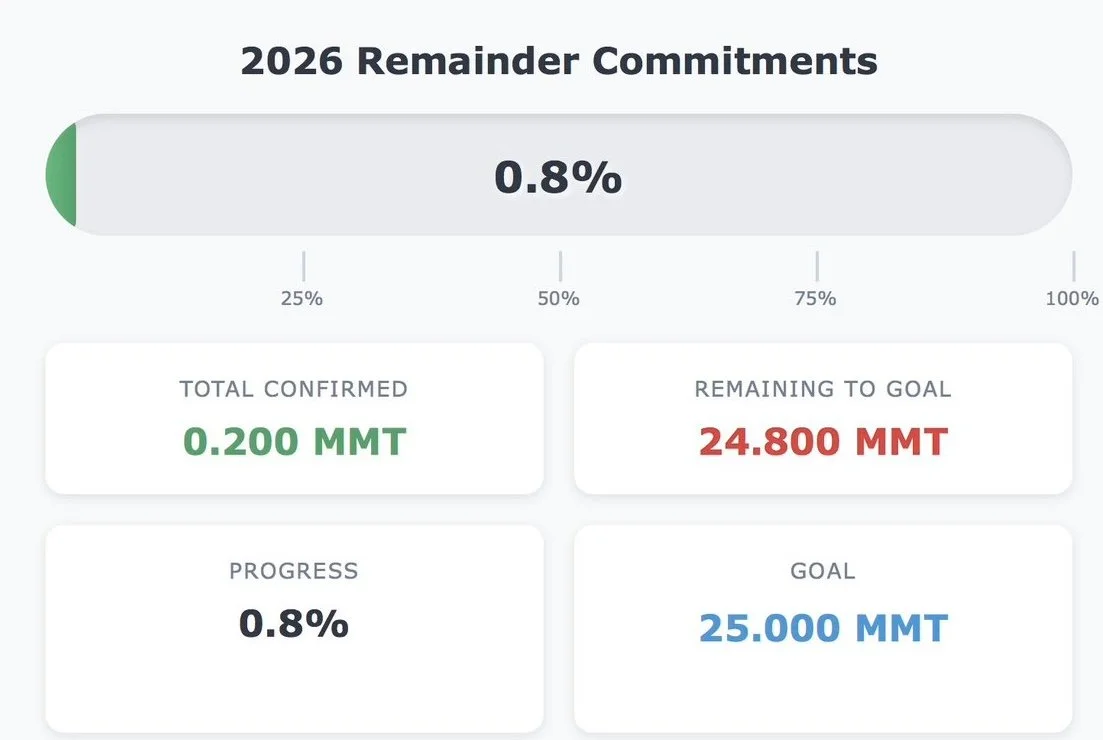
China stepped in and bought more new crop soybeans.
They now have bought 0.8% of their total goal.
Not a massive amount still, but it's great that they are stepping in here.
I still think they'll do exactly what they agreed to.
Tracker from GrainStats (@GrainStats on X)
Lately, we've been talking about how the funds are still long the soybean complex.
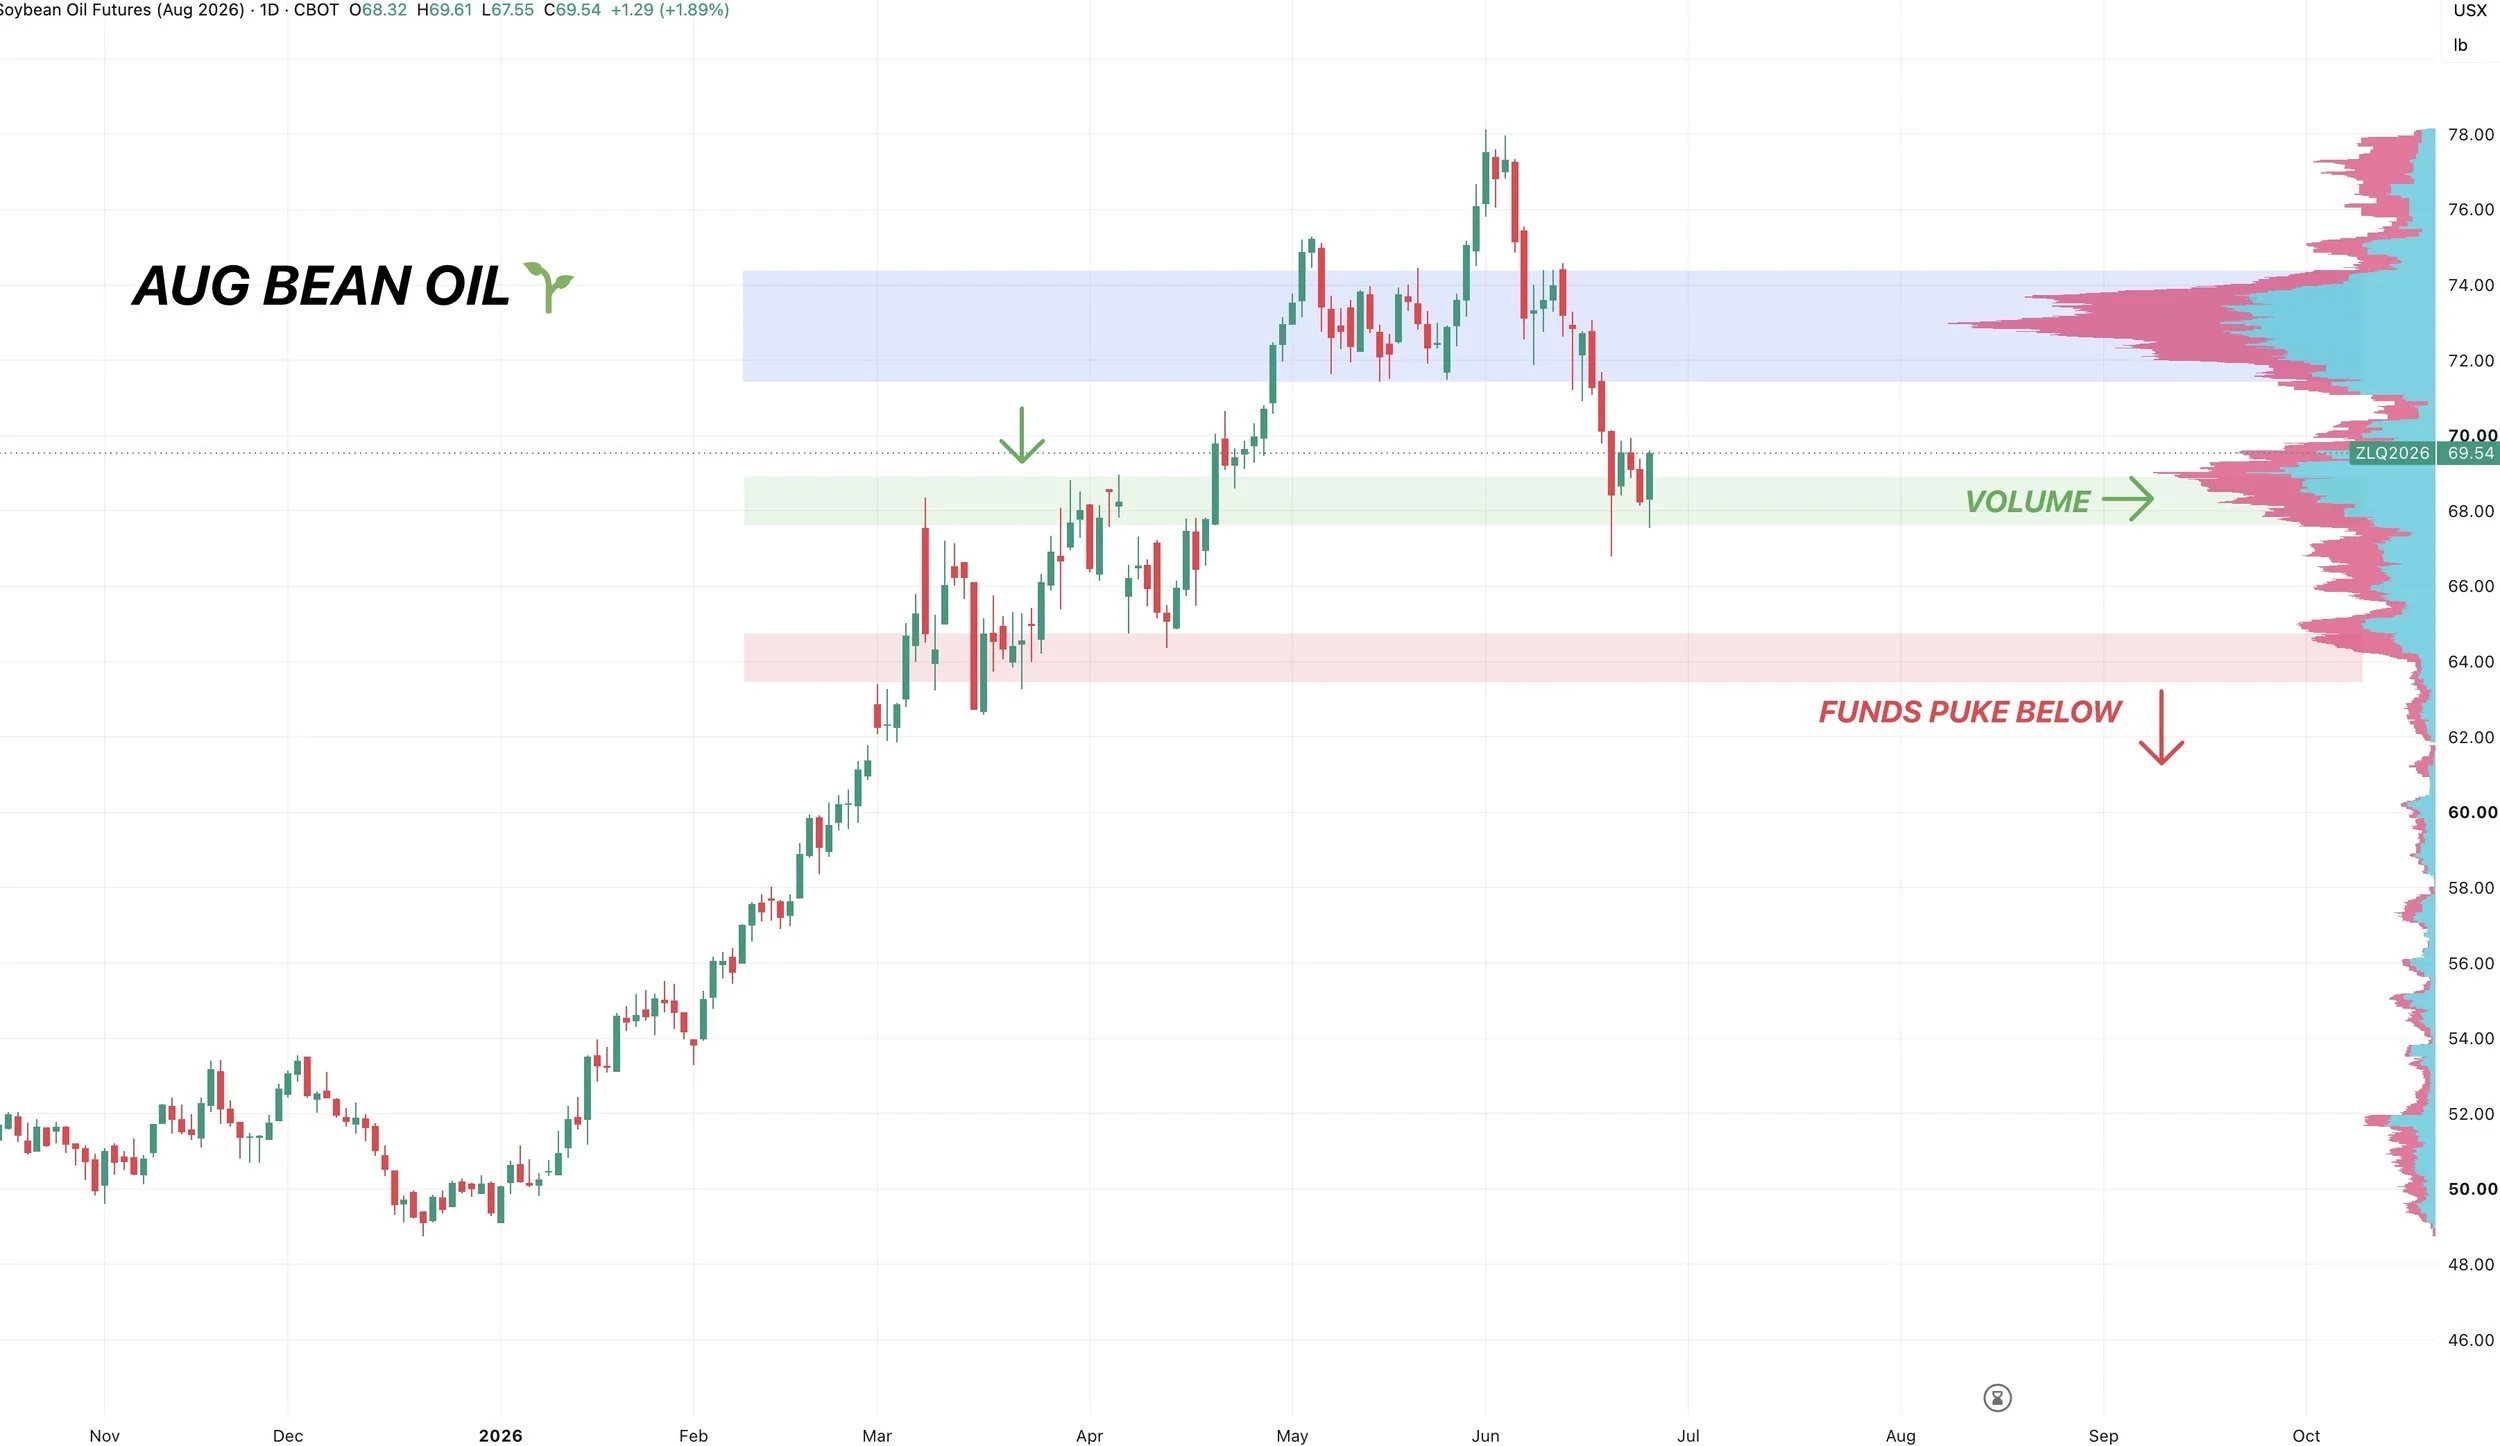
The big reason for this is bean oil.
Until bean oil decides to fall apart, I don’t see why the funds would jump ship in the soy complex.
Currently, bean oil is still hanging on to support where it needs to.
Finding life right at those prior highs from spring.
If we start to fall apart, the funds probably look to exit. As there is air to the downside. But until that happens, I don’t see why they would.
It seems like today's price action had a lot to do with the heat that's coming.
As it's suppose to start getting pretty hot this weekend.
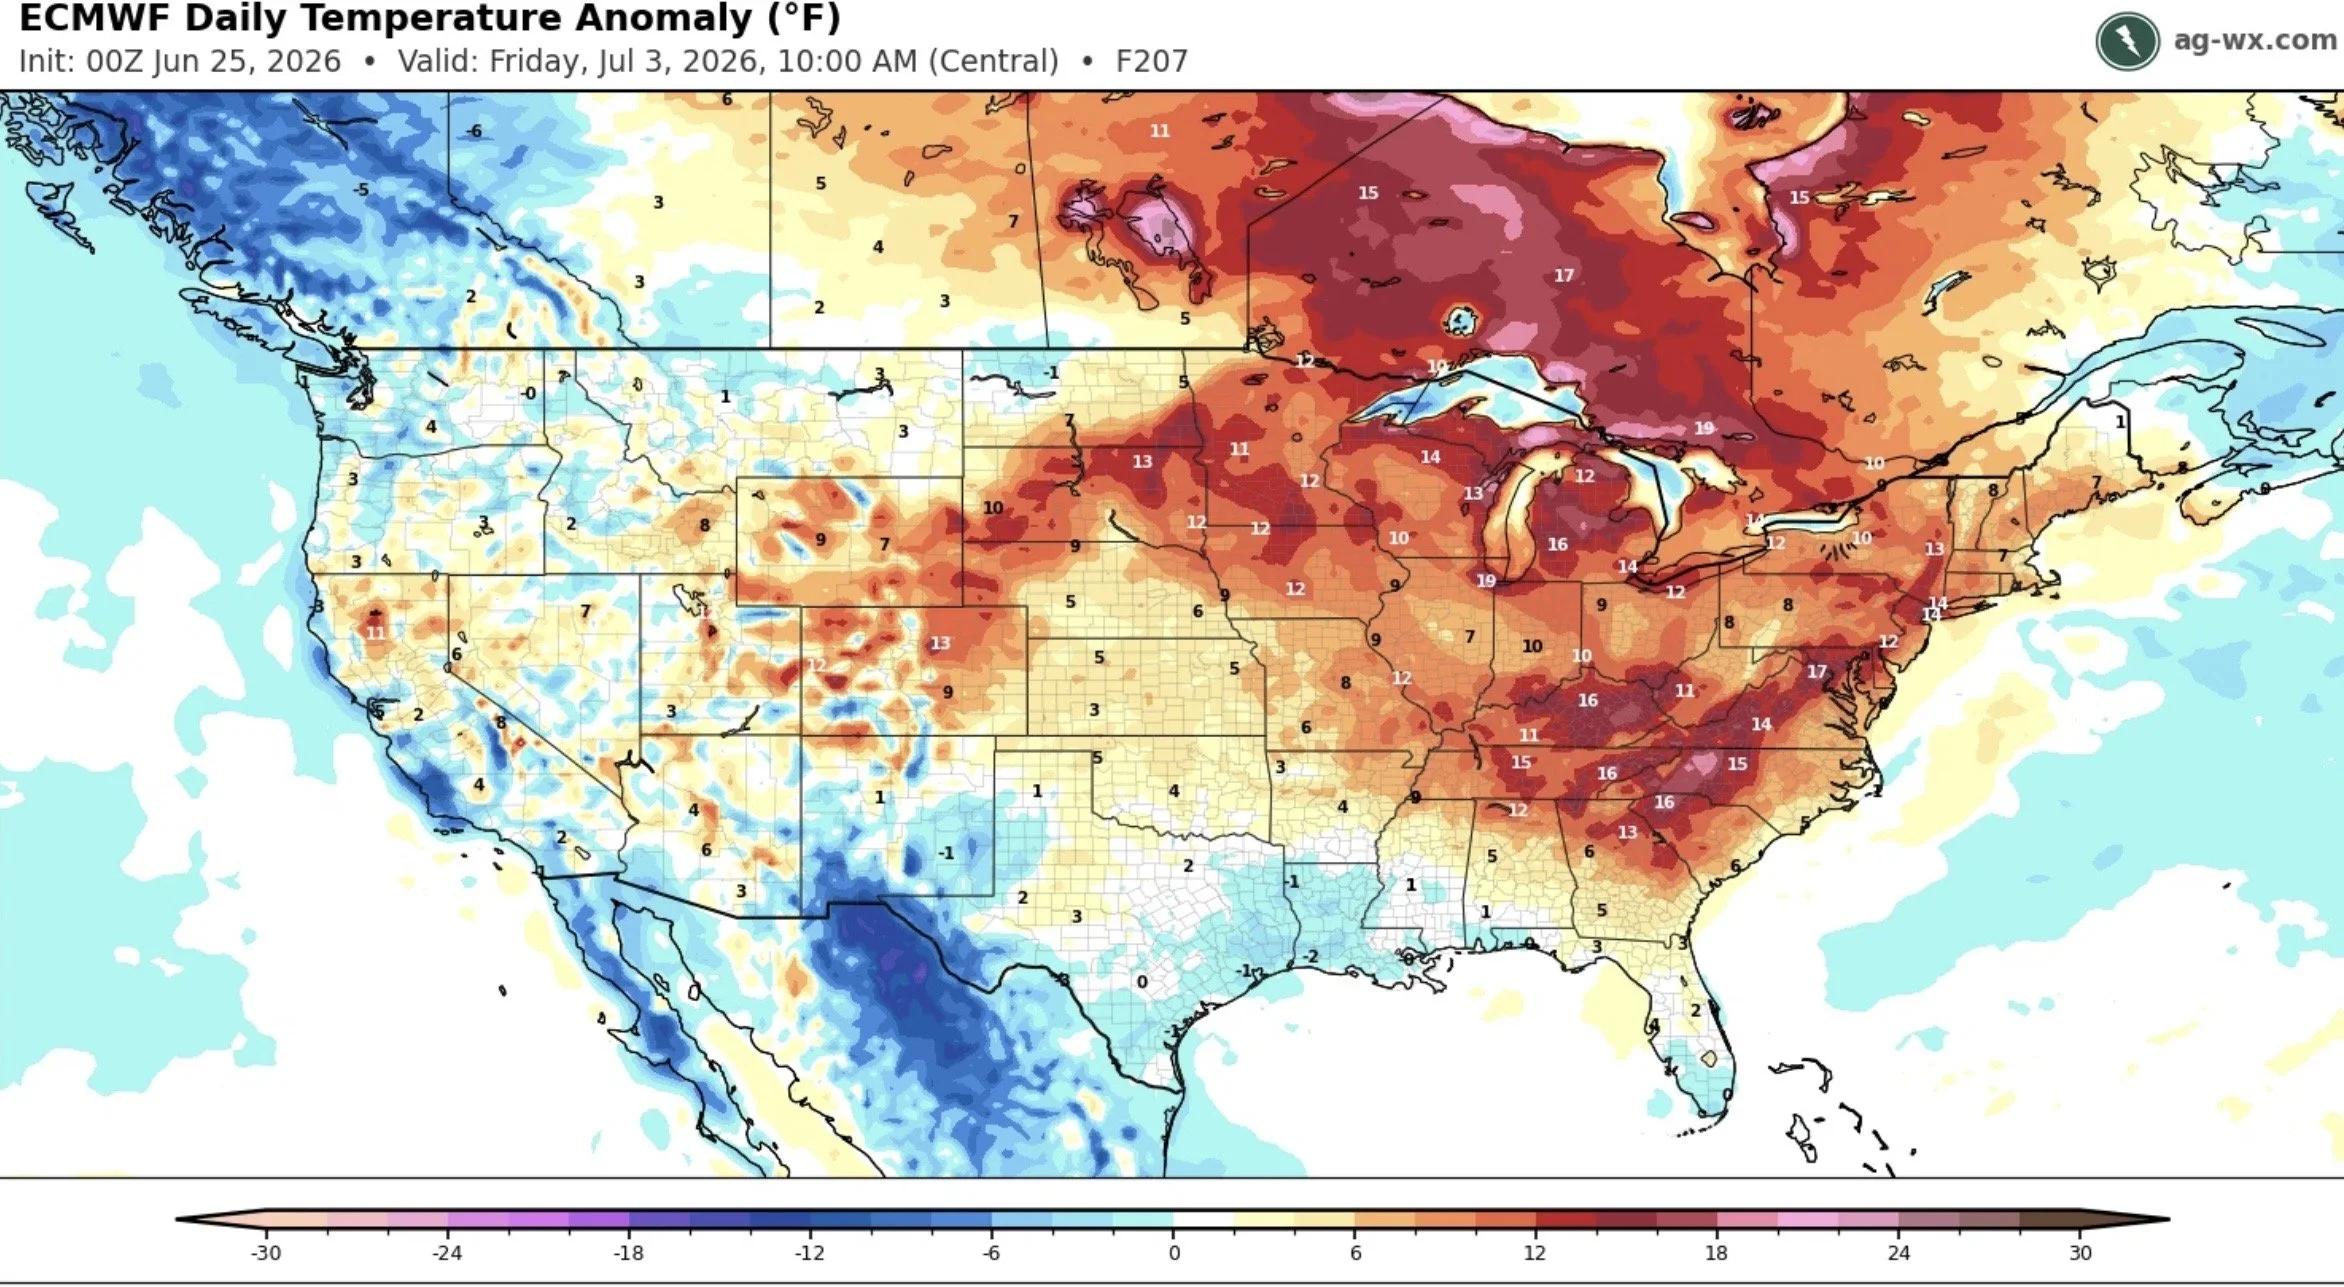
It's also looking like it's going to dry up the first week or July.
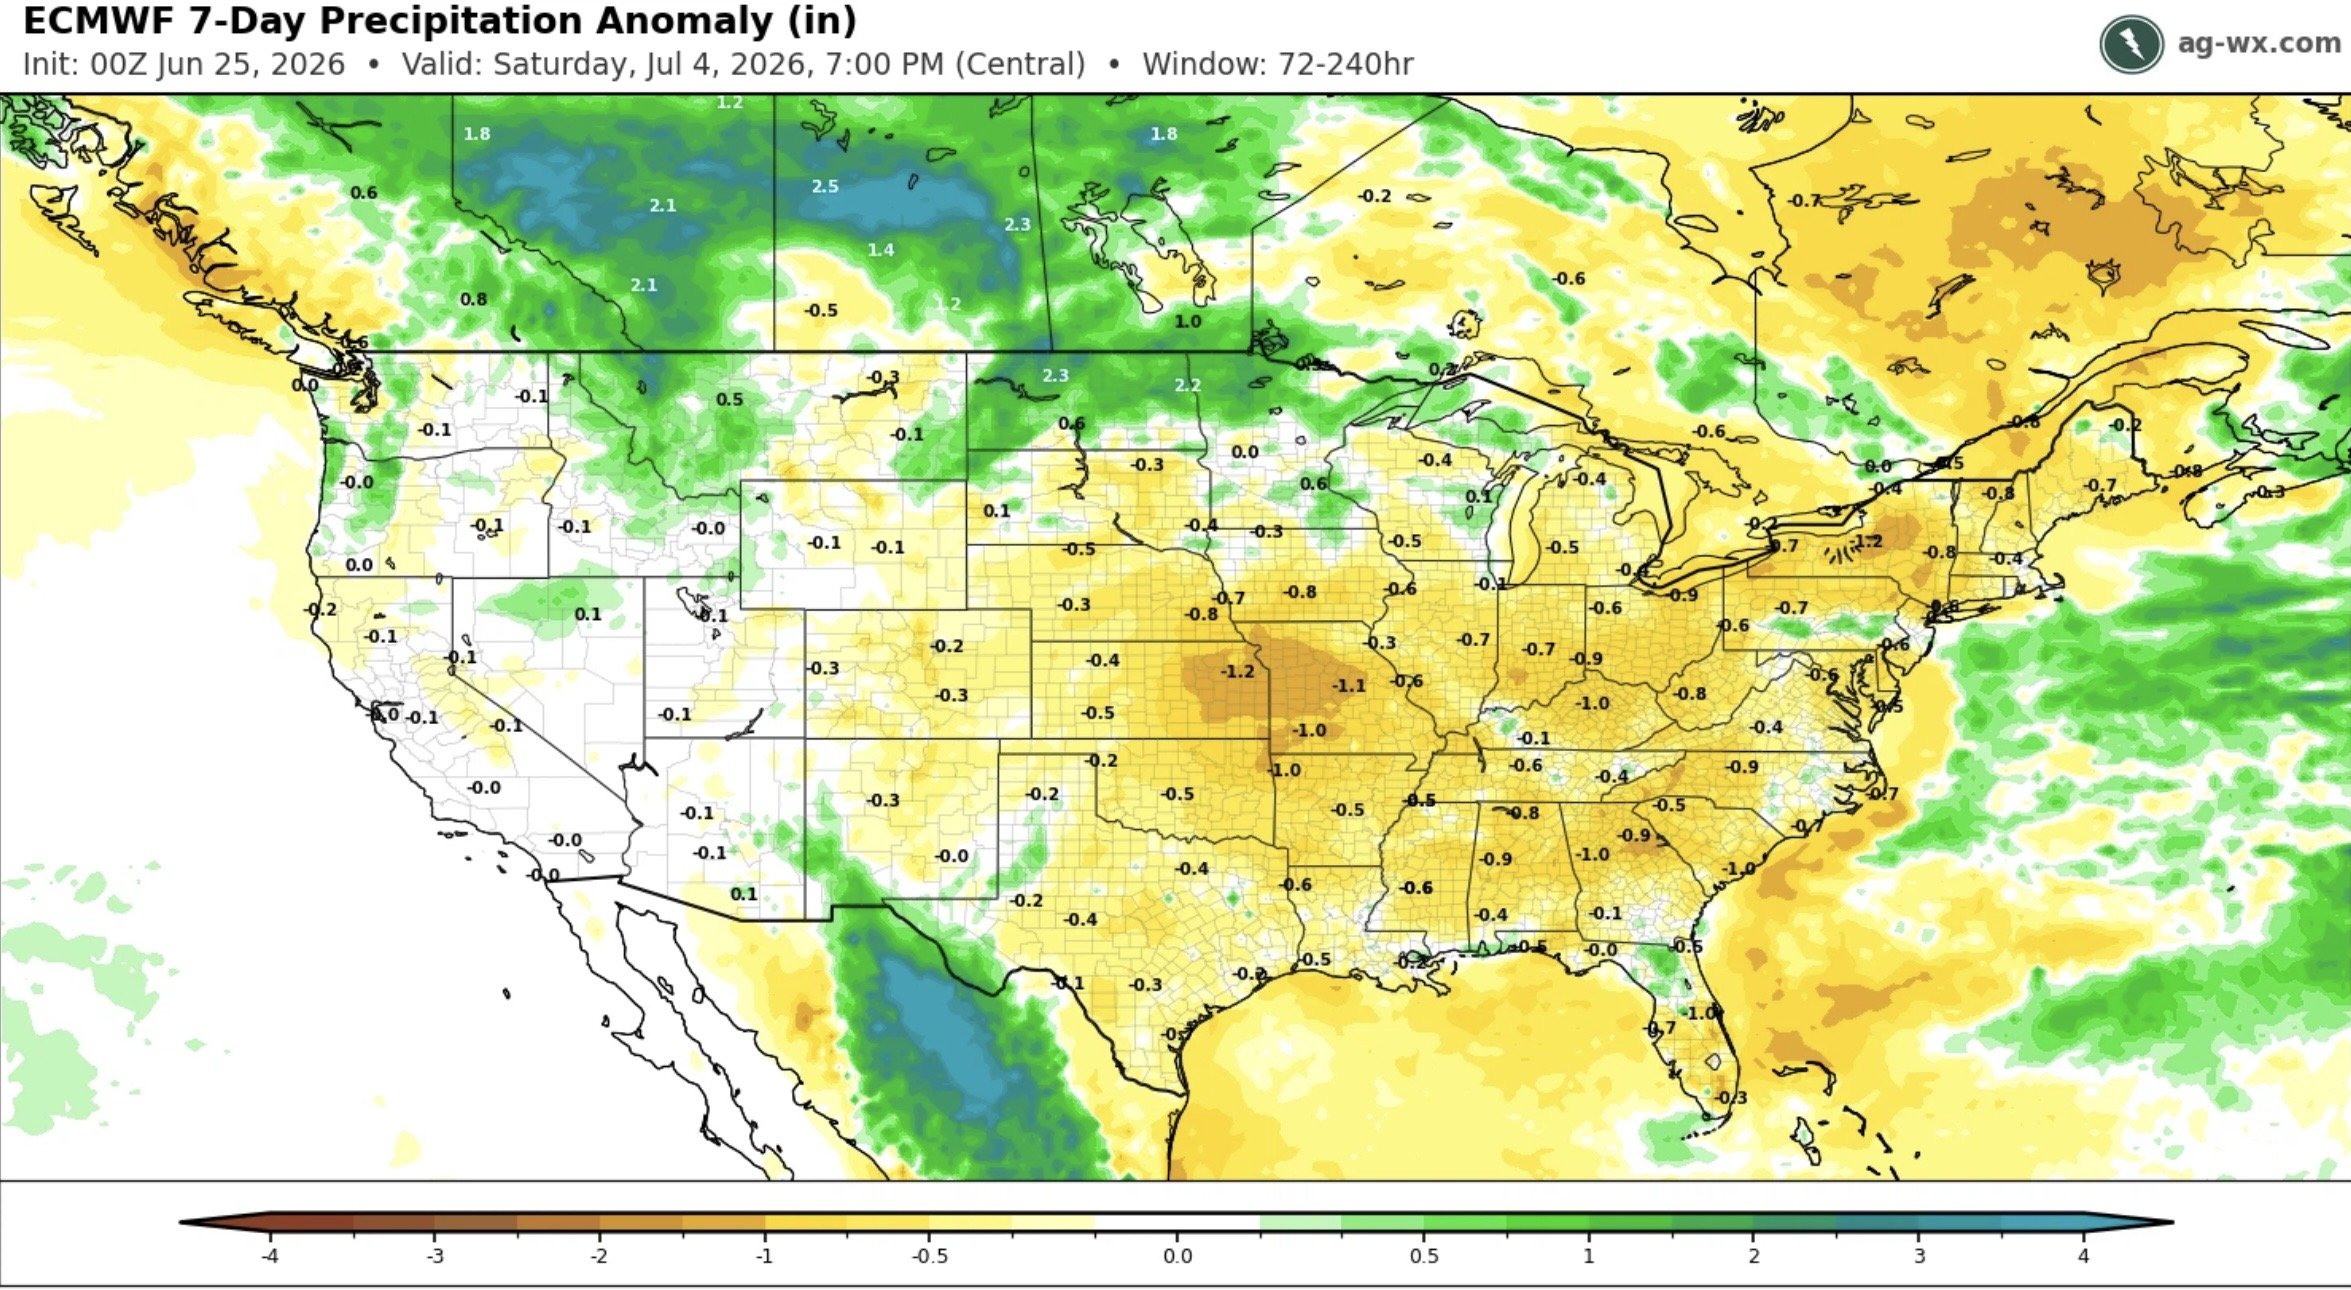
So if this sticks around, we are naturally going to put a little bit of weather premiuim into this market given that we've built in zero thus far.
With June being the wettest June ever for key growing regions.
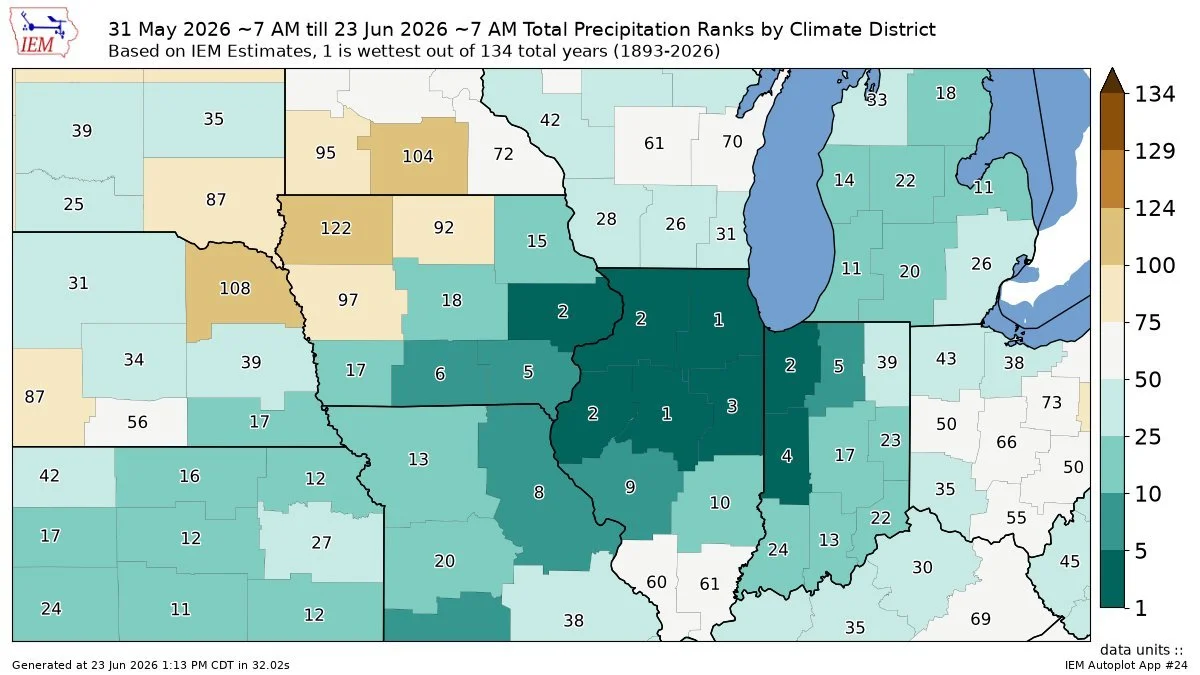
Who knows if either of those will stick around or not.
We still clearly have plenty of growing season left, and the crop is far from being made.
I've seen some calling for a wet July with others calling for a dry July.
I don’t think anyone has any idea what things are going to look like further than 10 days out.
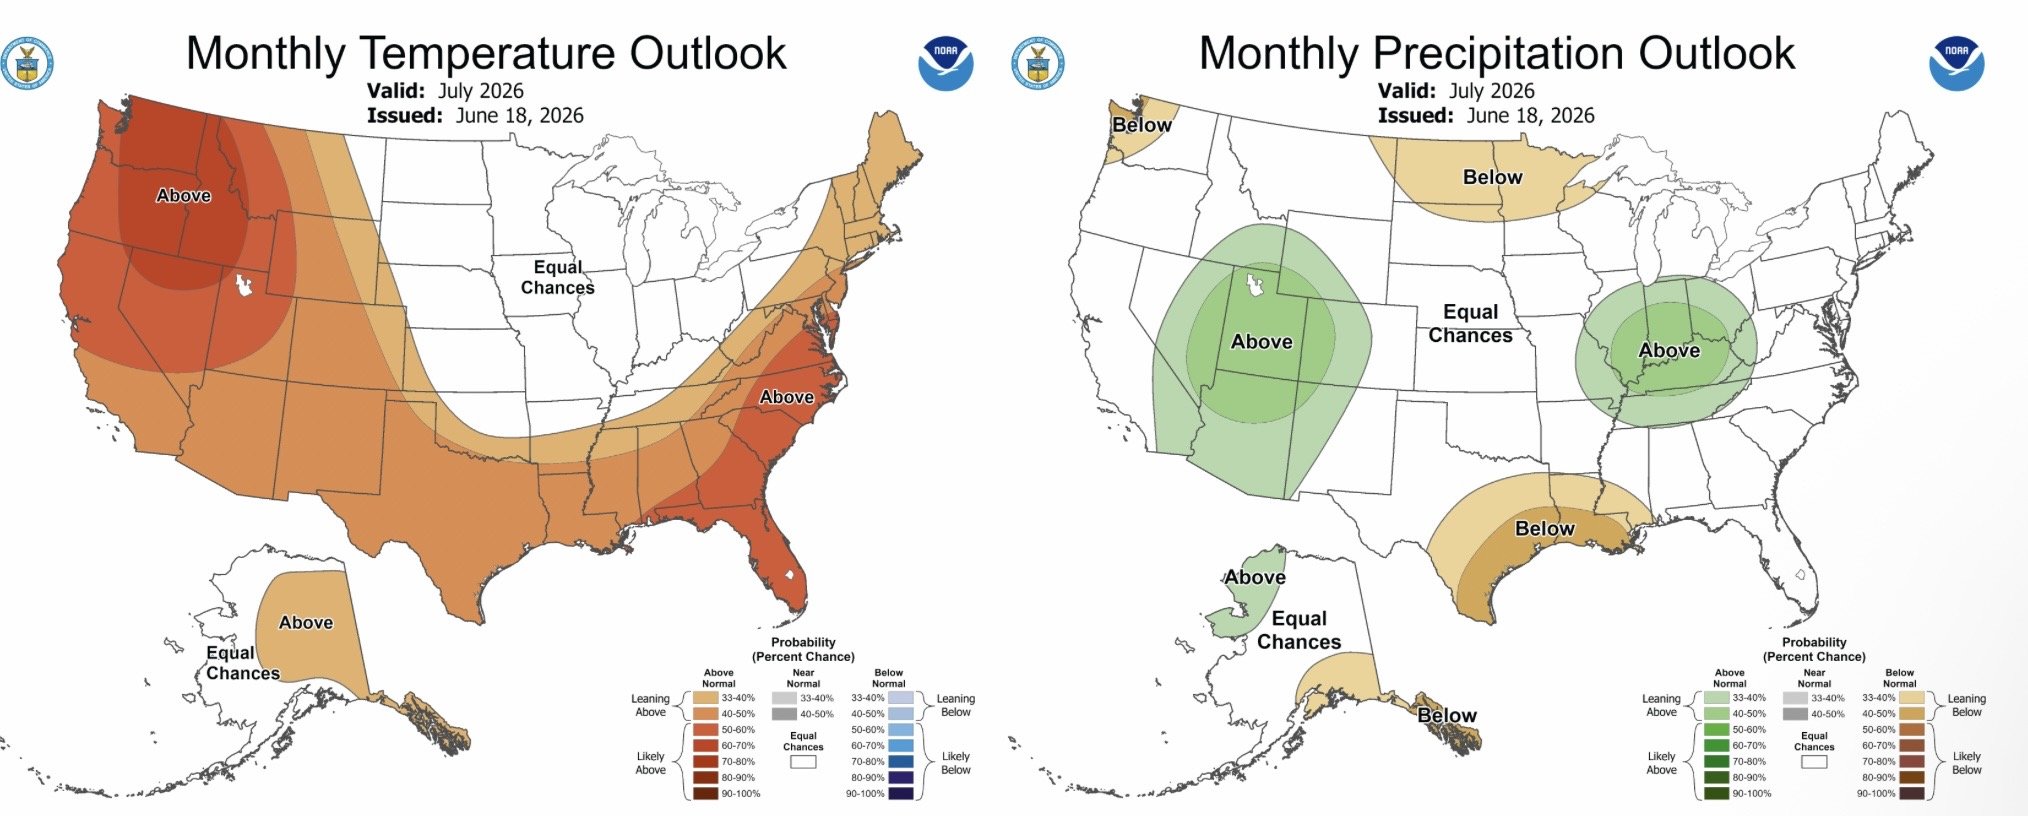
But here is the Climate Prediction Center's Outlook for July.
They've got some rain in the I-states. But again, take long term forecasts with a grain of saly.
No Room for Error:
Our old crop carryout is 340 million.
Even if acres jump by 1 million, it would take yet again another 53 bpa yield to get a carryout of 360 million.
If yield even slips slightly, there is zero room for error on the soybean balance sheet. Even with more acres.

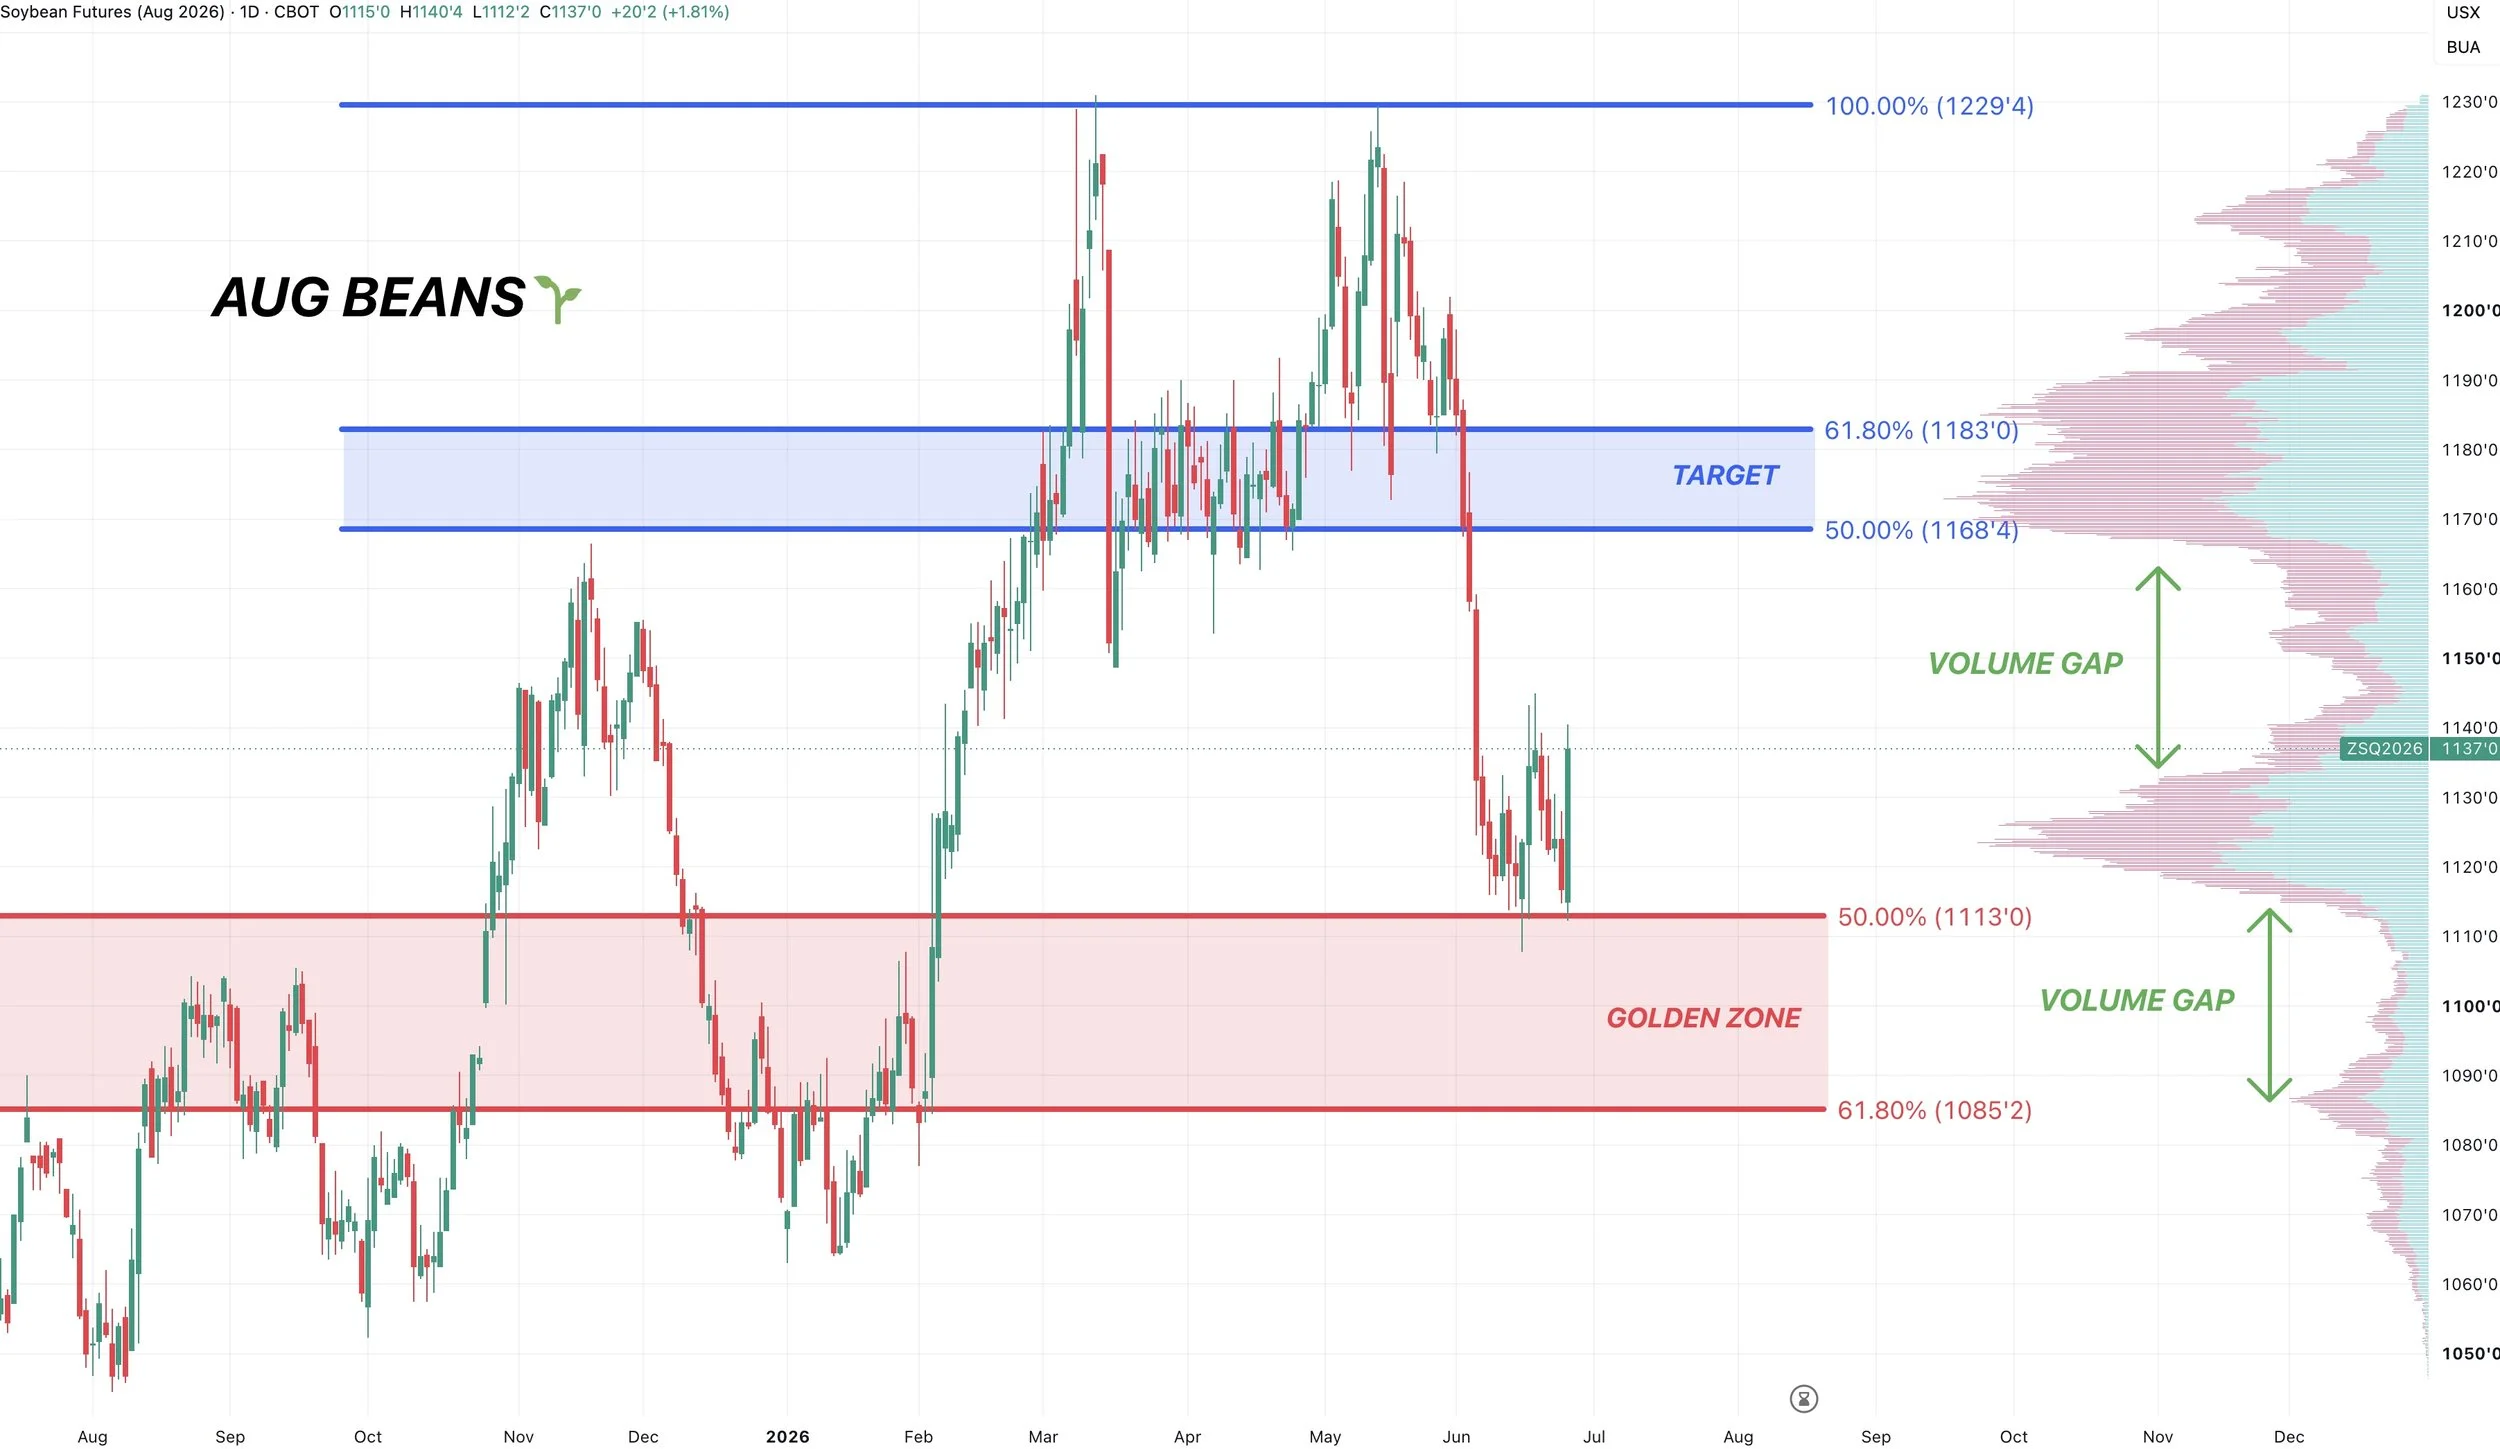
Aug Beans Chart:
We posted an outside up day in soybeans as well.
We didn’t post contract lows then a key reversal like we did in corn, but an outside up day following the recent weakness is a positive sign.
We held those recent lows.
If we cannot hold the recent lows, we probably take a trip towards $10.85 which gives back 61.8% of the entire rally off contract lows.
To the upside, I'd respect a rally towards $11.68 to $11.83
That reclaims 50% to 61.8% of the entire sell off. Which also happens to be that old range we were trapped in.
If you notice, we are currently sitting at an area of high volume. With a gap of air both to the upside and the downside. So things could really move if we take out the recent highs or lows.
As prices can move through volume gaps fast, as there is no support or resistance in there.
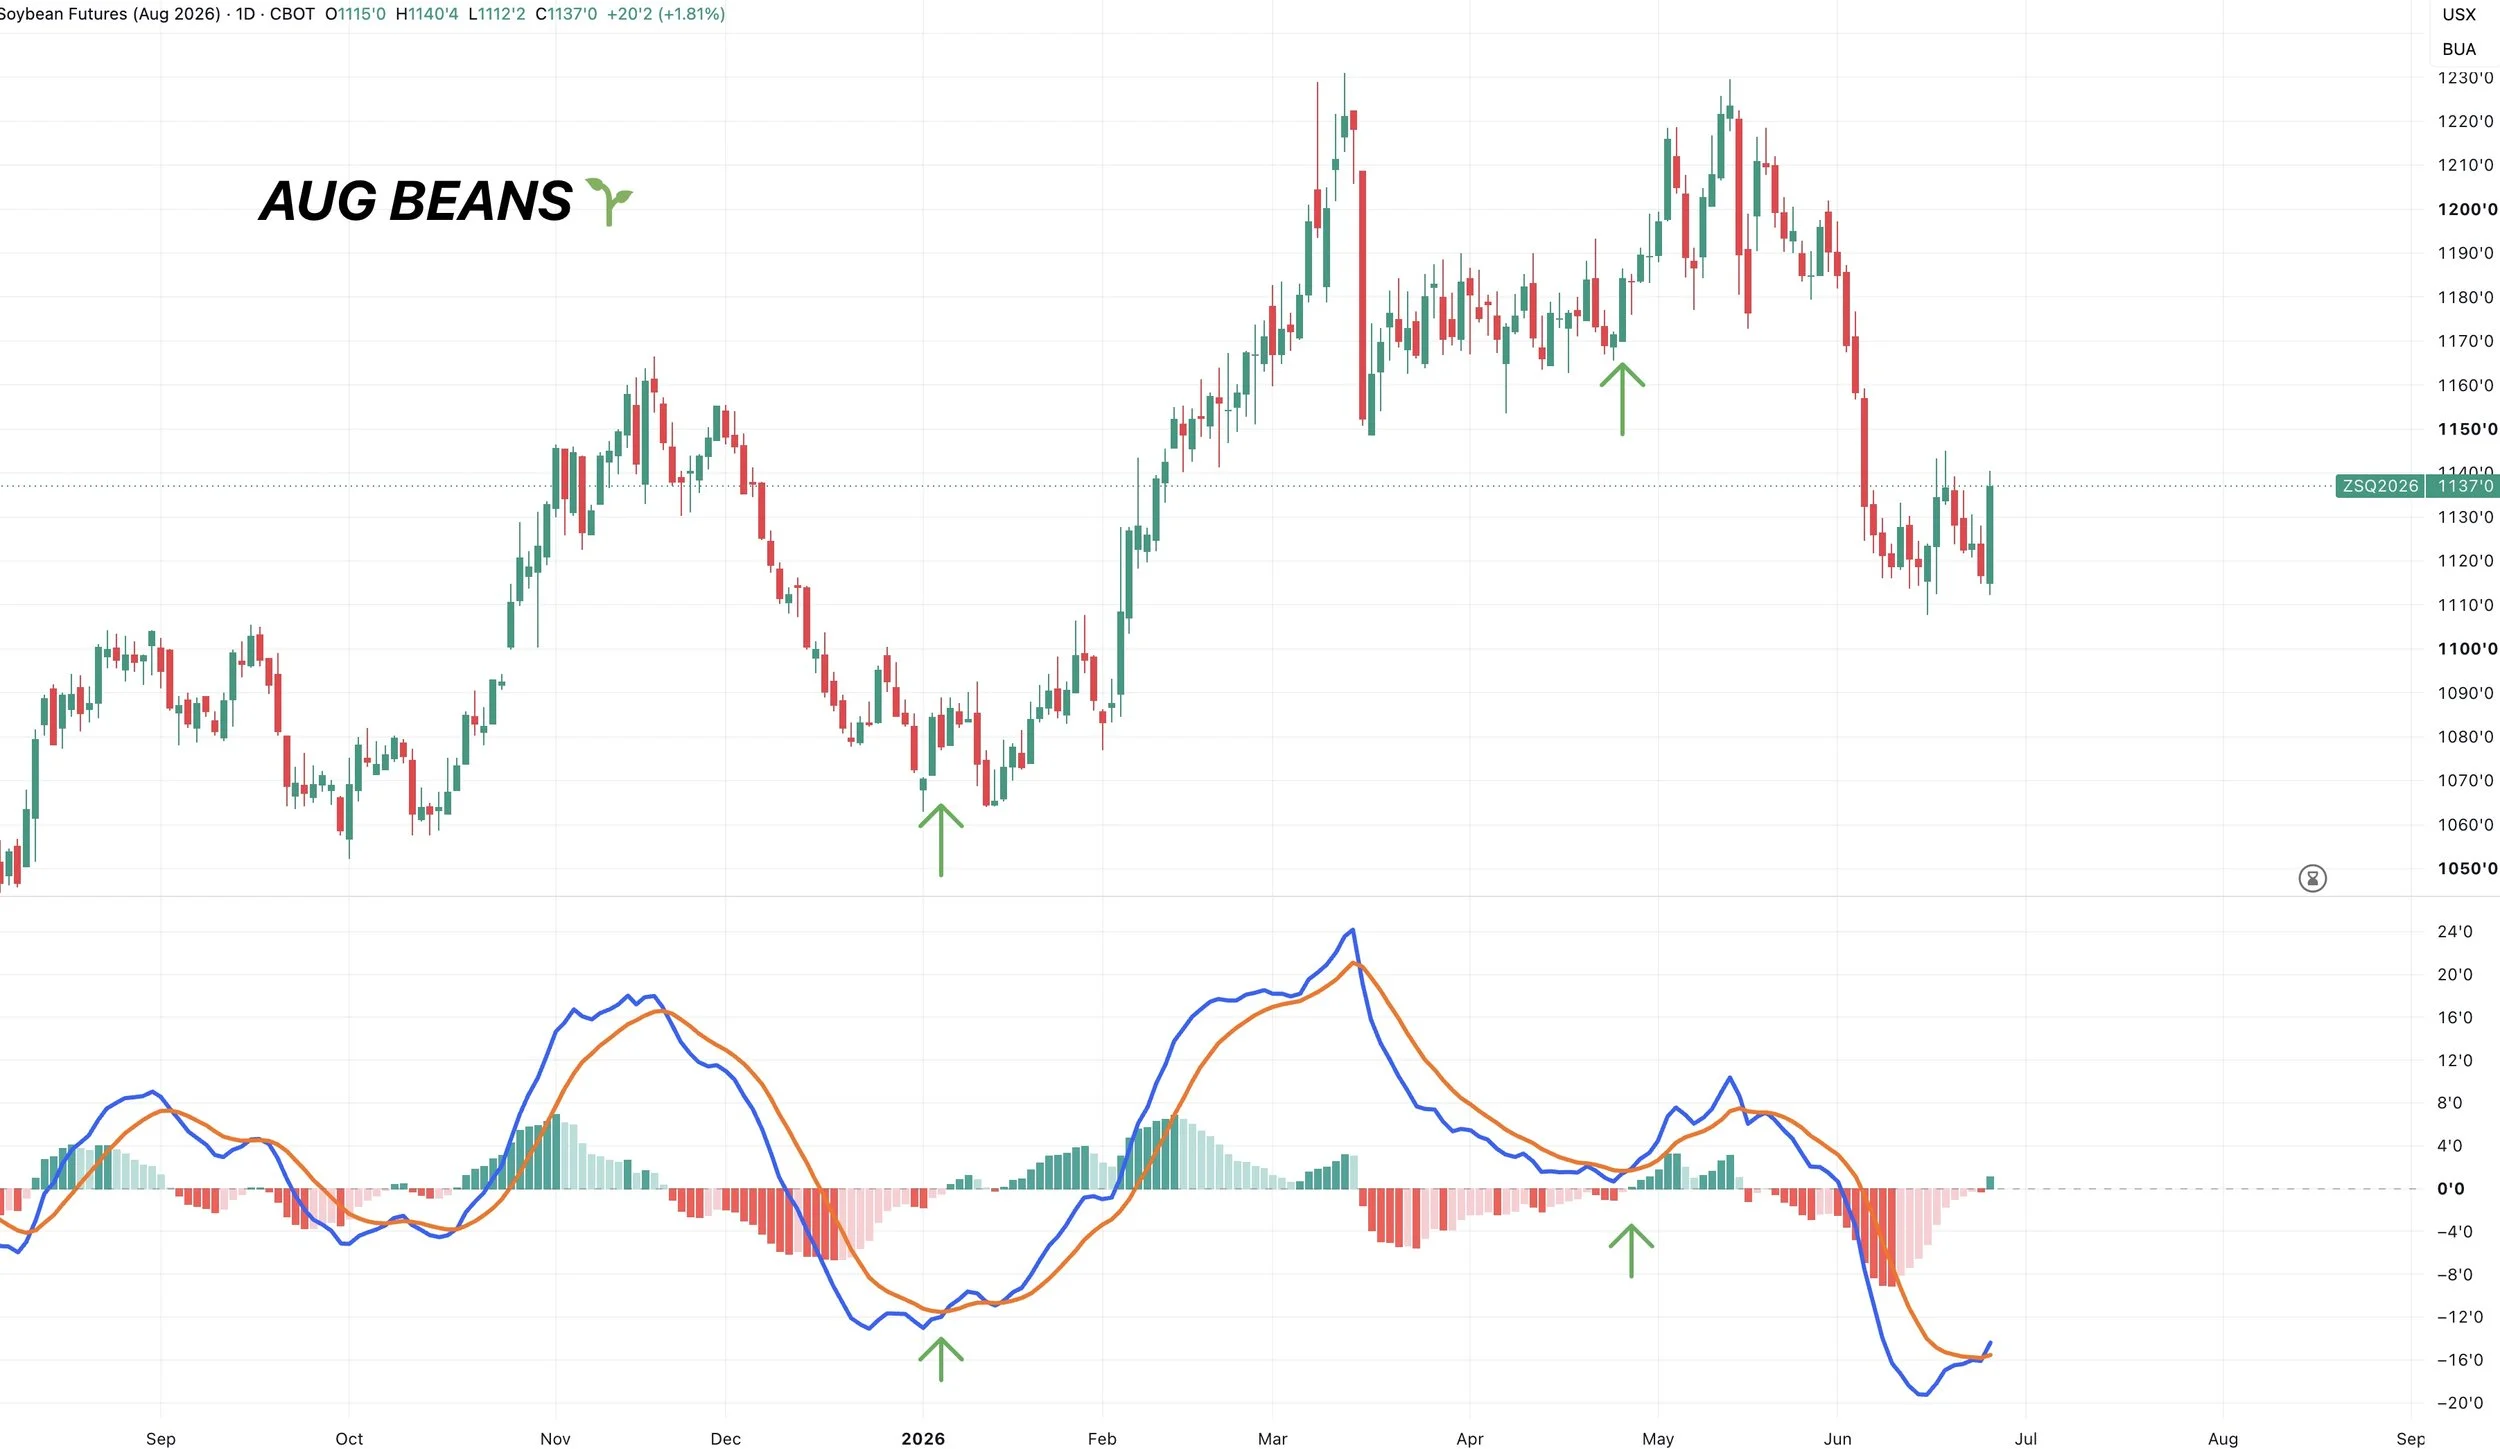
The MACD officially flipped bullish in soybeans as well.
I outlined the last two times it flipped higher.
The first was in January. The second was when we broke out of that range in April.
That doesn’t definitively mean we have to head higher, but it's a nice sign.
Nov Beans Chart:
We bounced right where we needed to.
At those March lows and November highs from last year.
Also posted an outside up day here.
If we can break above those recent highs, we could see a move towards $11.70 to $11.80
That'd be an area to look to defend.
That's the golden zone and a common area for a relief bounce to fail.

Wheat
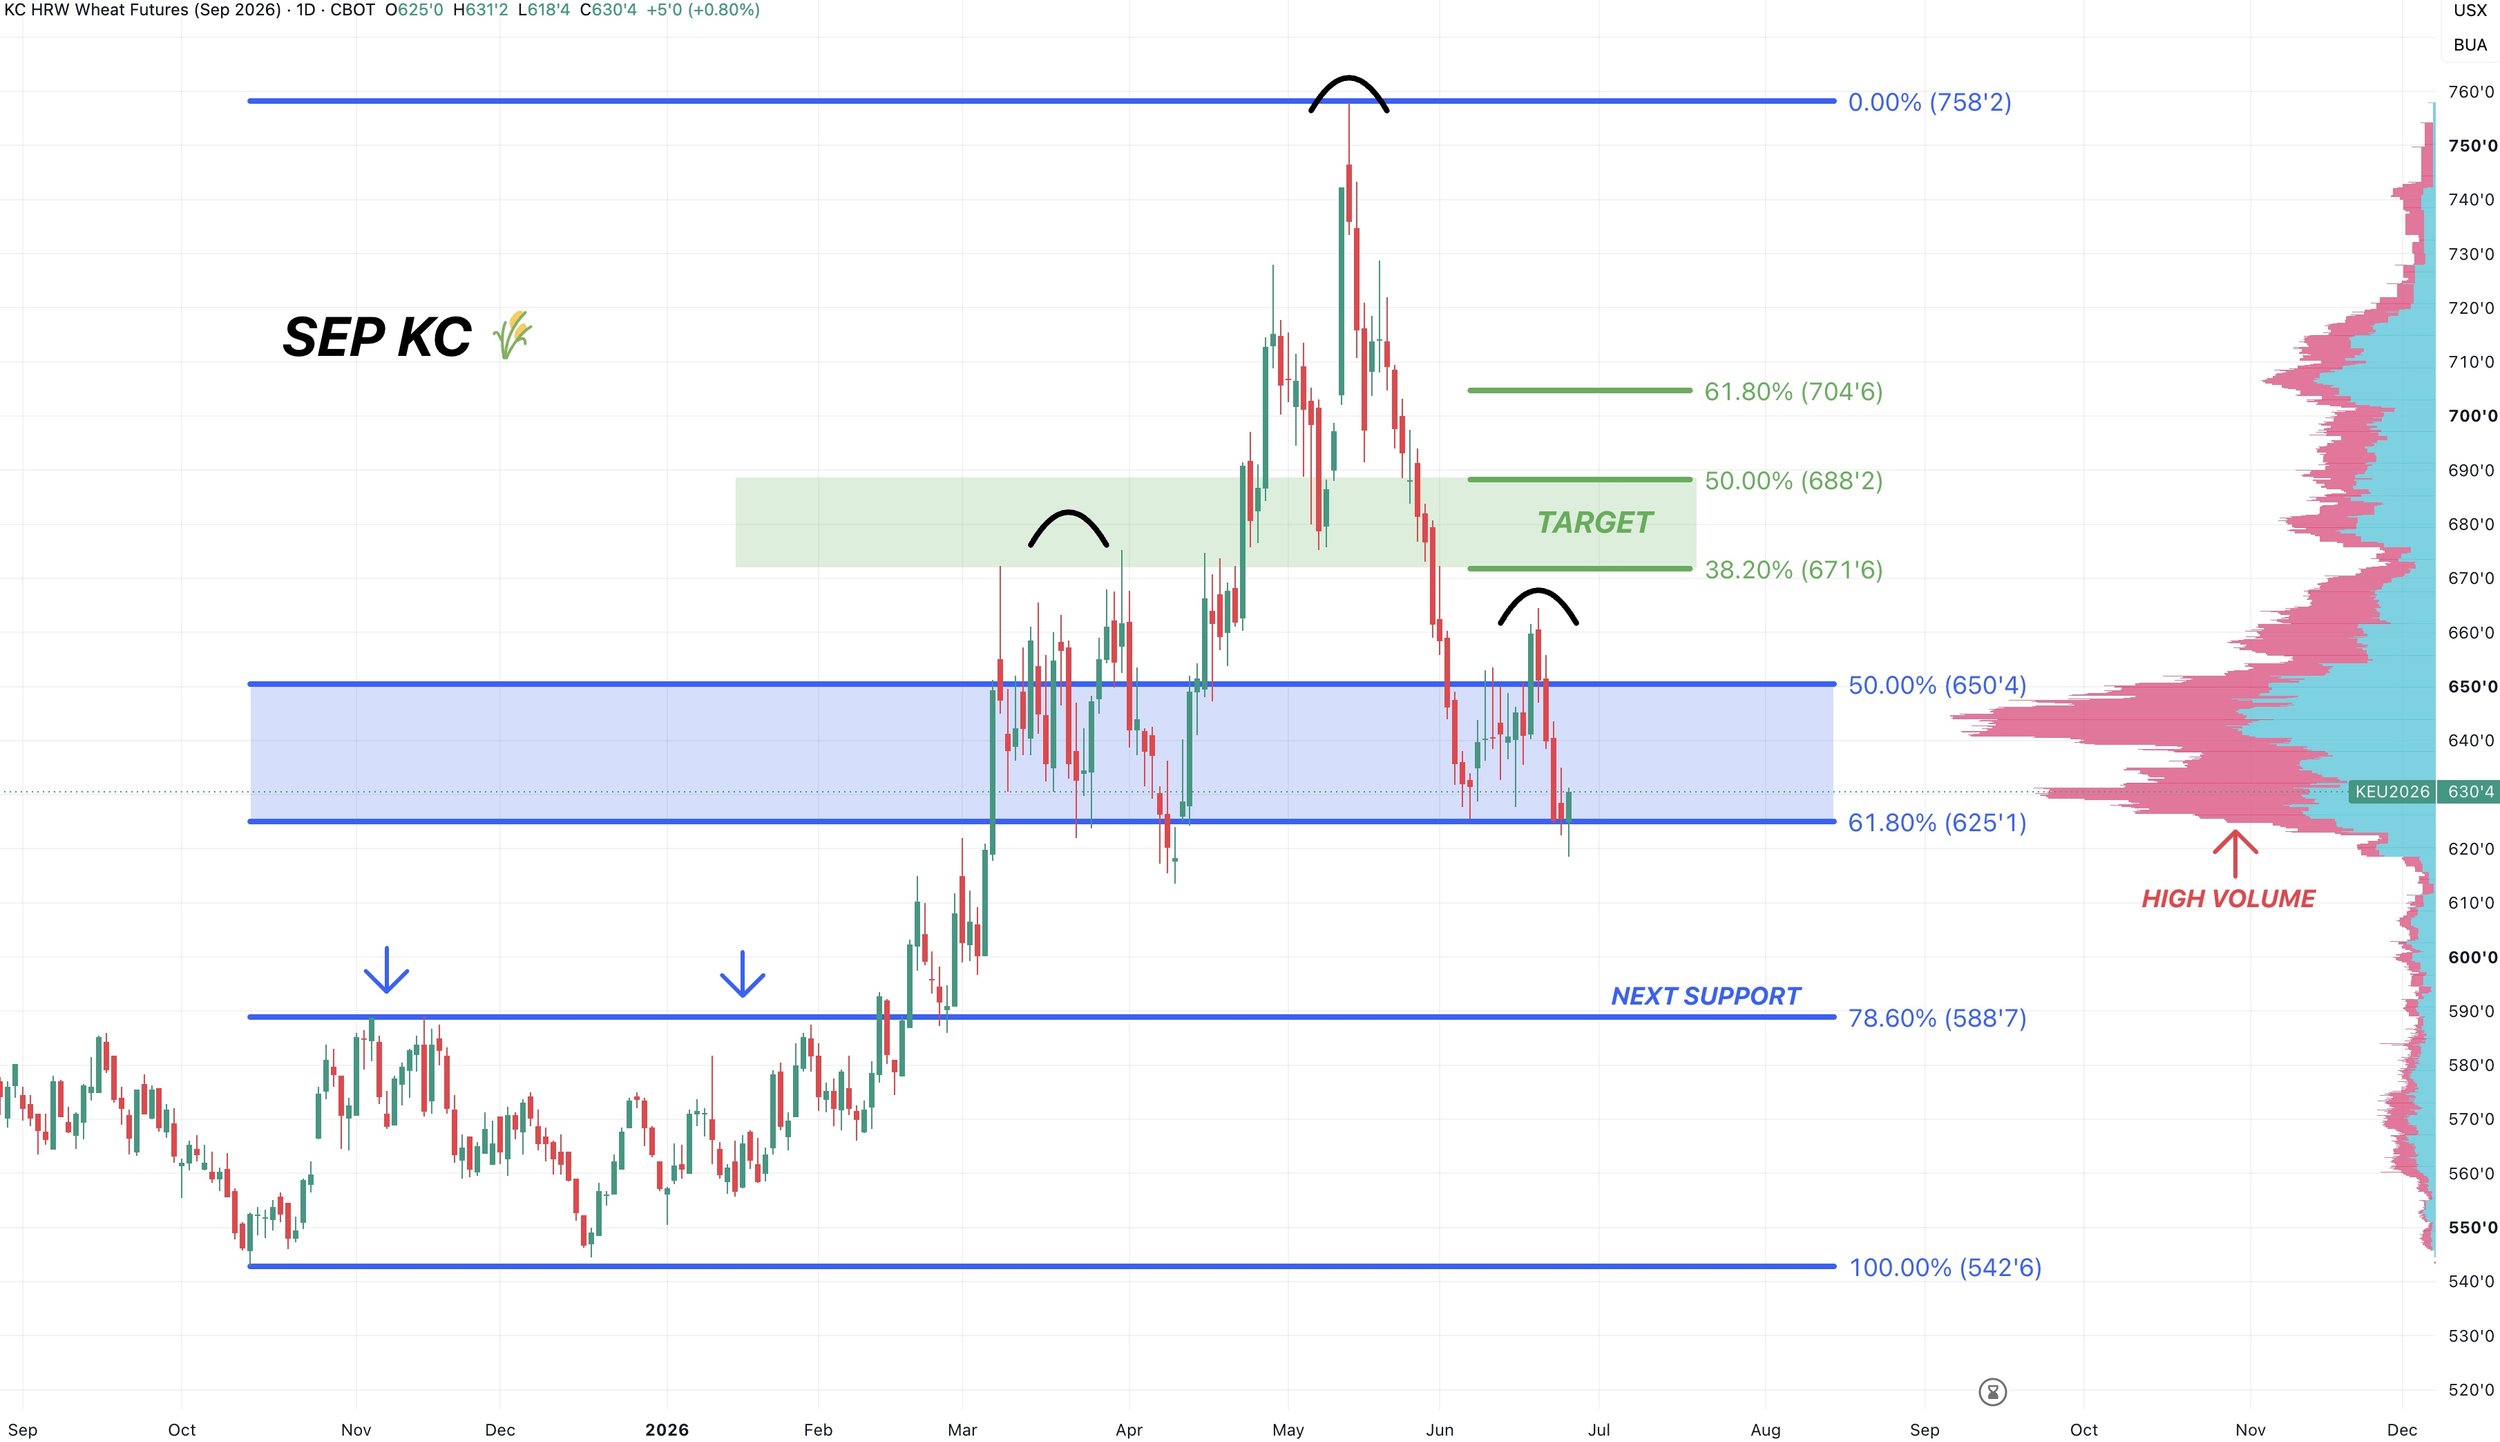
Sep KC Chart:
Not much to add fundamentally to the wheat market today.
The chart is the biggest thing to watch.
We are sitting at some must hold support here. So the main thing to watch is can we hold this level or not?
We've given back 61.8% of contract highs down to contract lows. The most common retracement level.
If we cannot hold this level, we likely drop roughly another 40 cents.
As the next support is the next retracement level of 78.6%.
If you look at the volume profile, we are at a major area of volume. There is zero volume or support below this level.
Still have to be cautious of the potential head and shoulders pattern if we start to break below this support.
We are showing some bullish divergence on the RSI, similar to corn.
So that's a potential good sign, but regardless this is a major spot we need to hold.

Cattle
Bullish July Seasonals:
I showed this earlier this week, July does tend to be a bullish month for cattle, historically speaking.

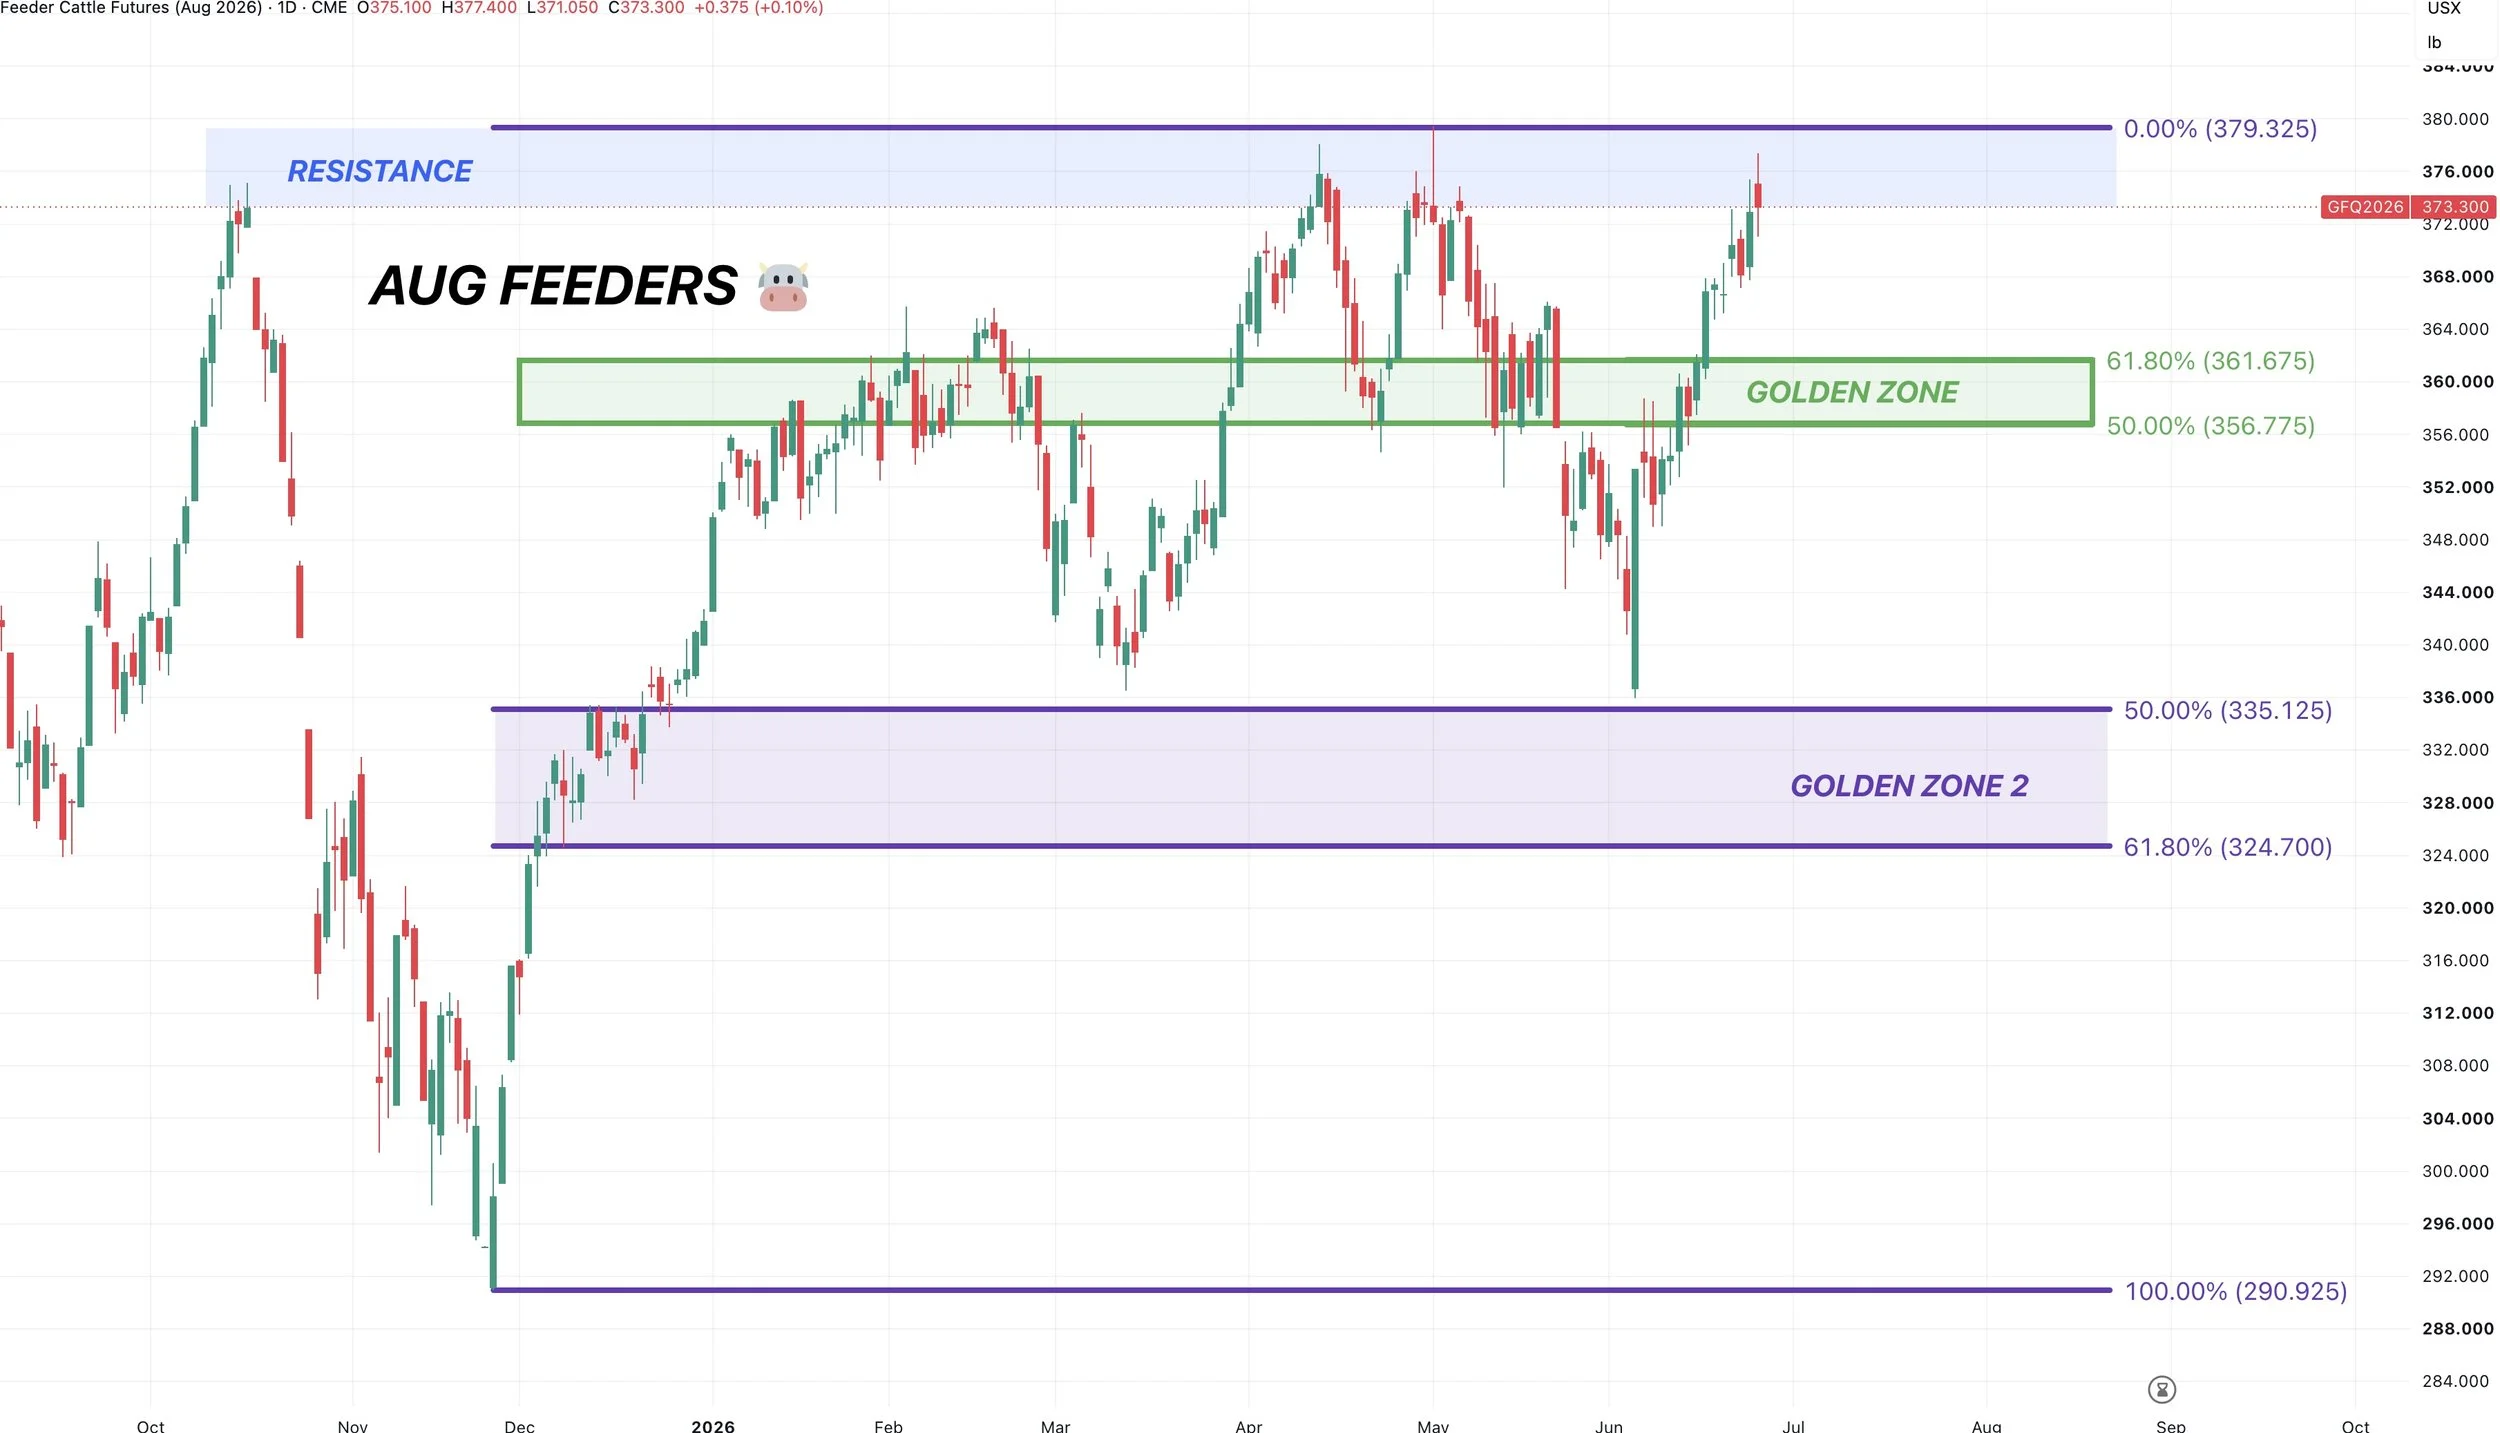
Aug Feeders Chart:
Seasonals suggest higher, but we are right back at the highs. So we like defending these levels.
Overall, just waiting to see if we get the breakout and post new highs, or if we reject this level for the 4th time in a row.
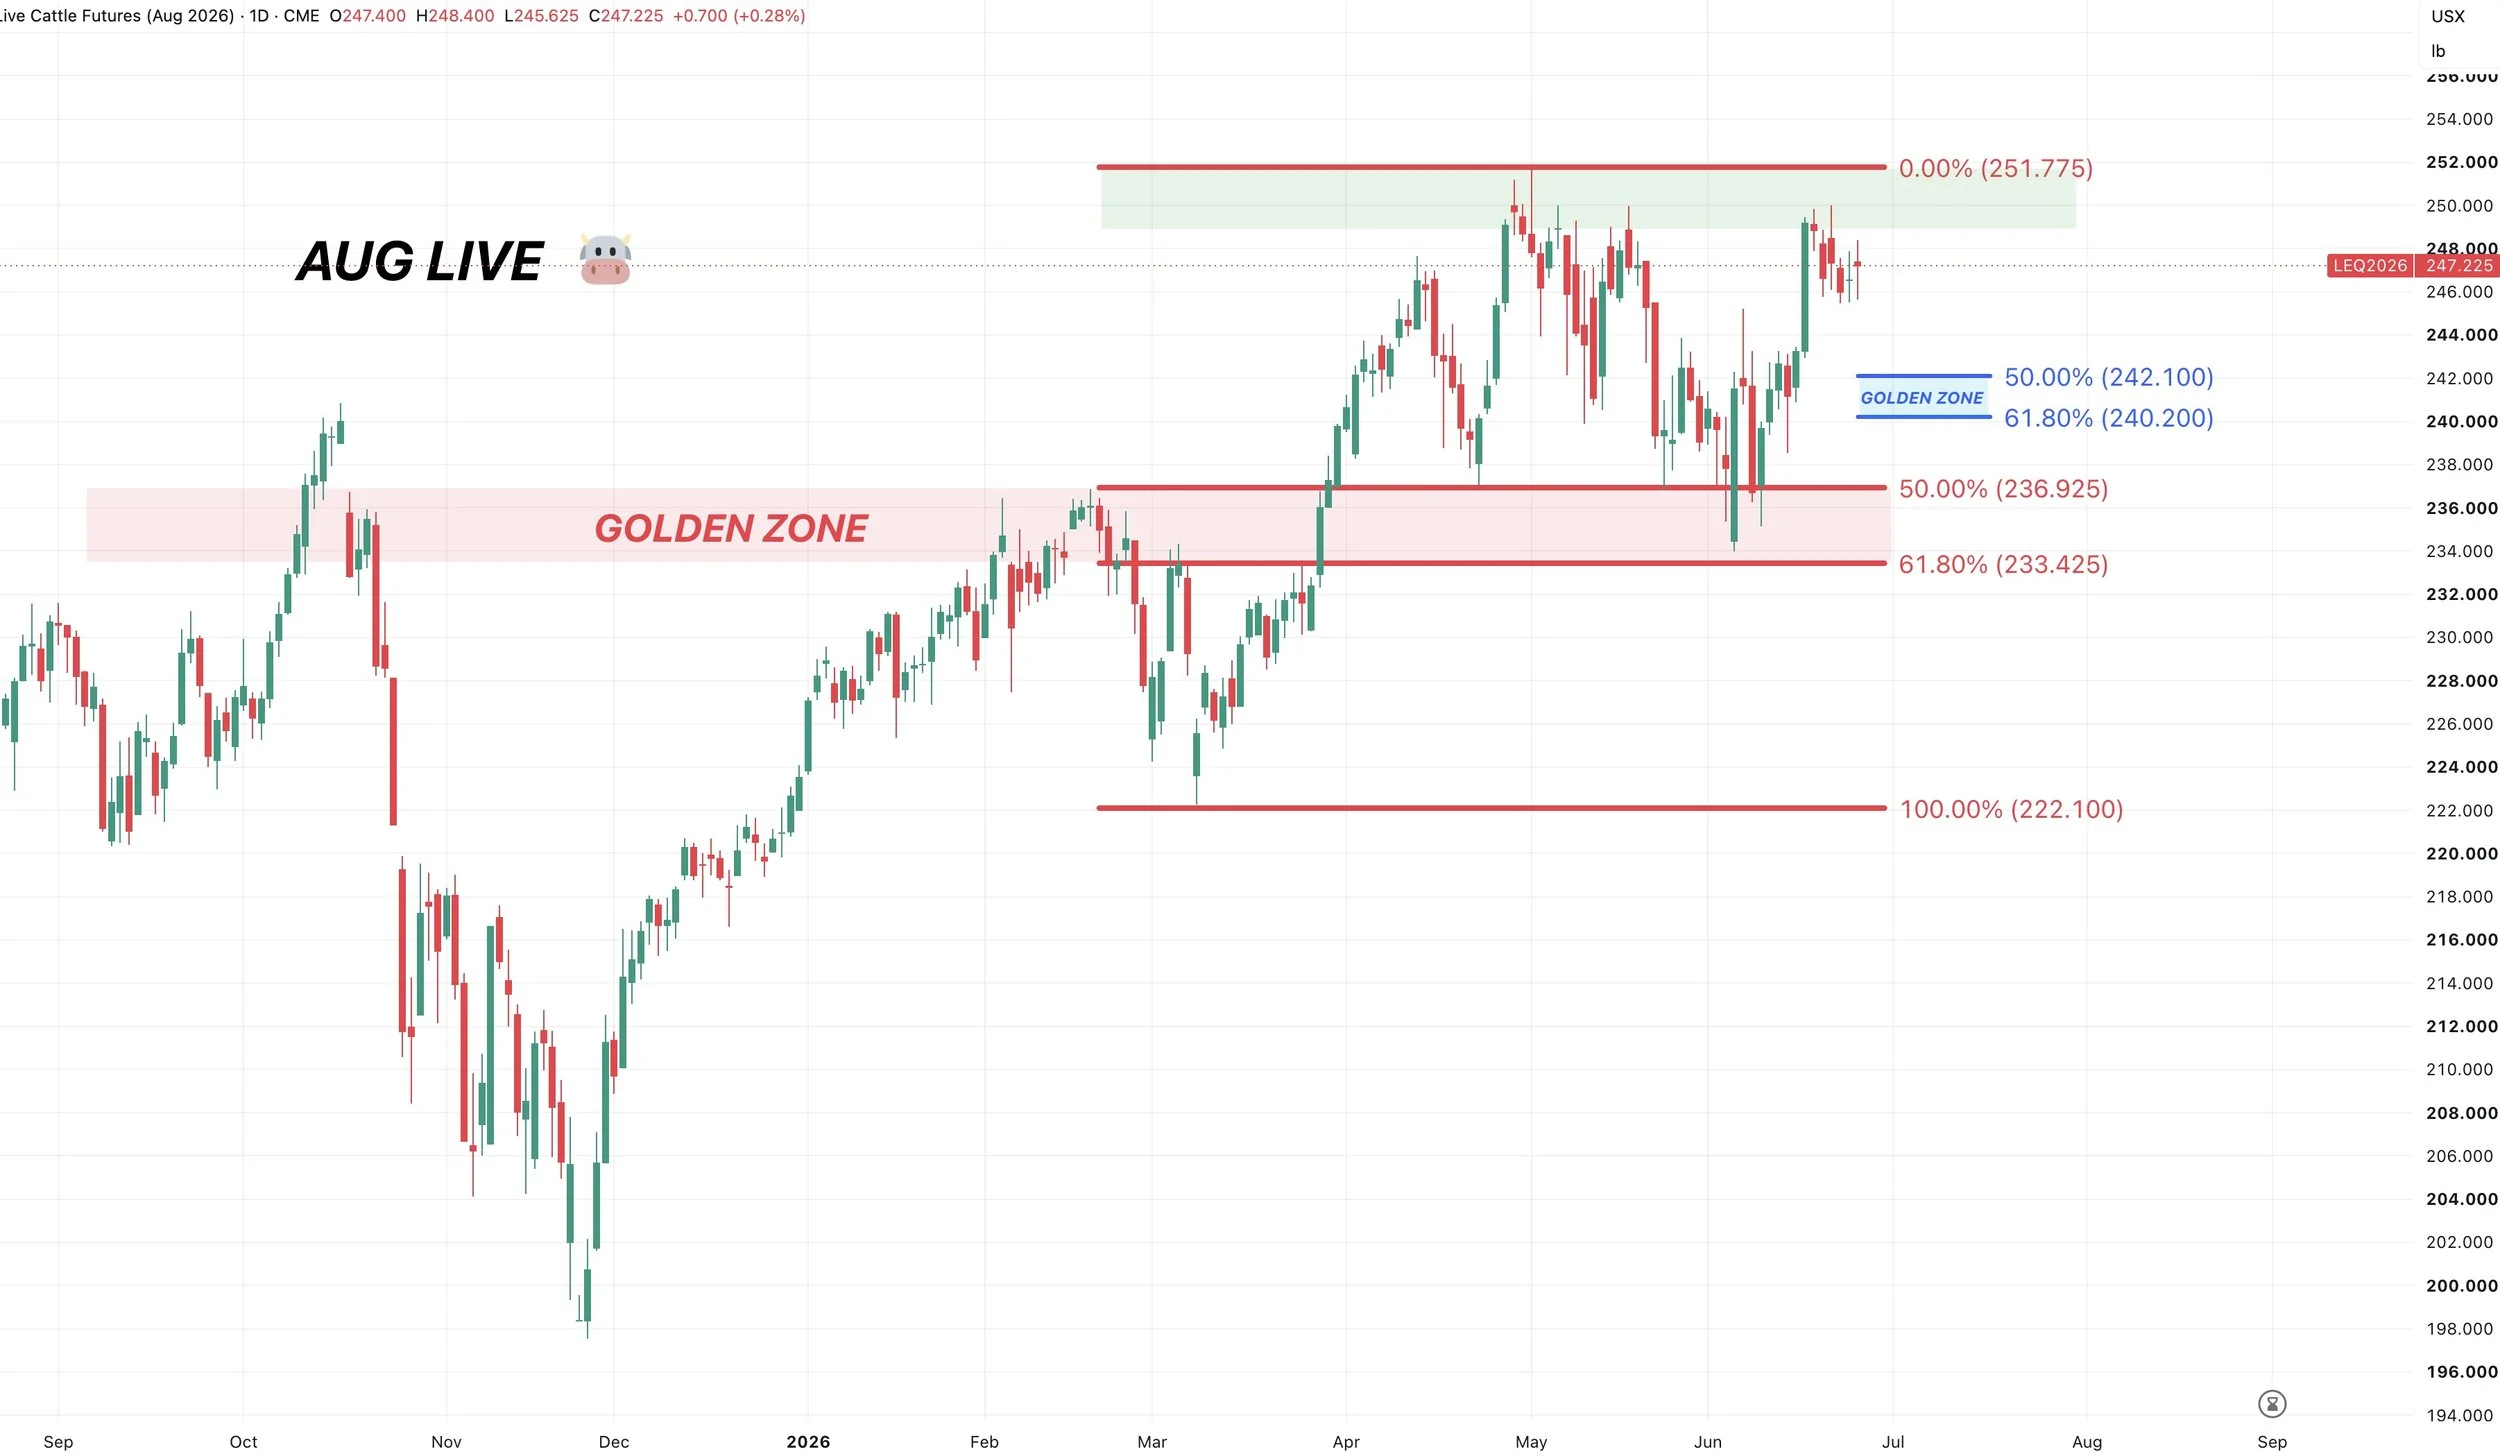
August Live Chart:
Pretty much the same thing in live cattle.
We're at the highs, so it makes sense to defend these levels.
Waiting to see if we get the bust through or if we break down from here.
Want to Talk?
Our phones are open 24/7 for you guys if you ever need anything or want to discuss your operation.
Jeremey & Office: (806)484-1214
Sebastian: (605)280-1186
Email: sfrost@dailymarketminute.com
Hedge Account
Interested in a hedge account? Use the link below to set up an account or give us a call.