
AUDIO COMMENTARY
Not the best close in cattle. Consider risk management
Impressive recovery & reversal in grains
Old crop new crop spread reversed 6 cents which was nice to see
Corn broke support then closed +9 off the lows
Need to see some follow through on the reversal
Spain is buying soybeans
6 days in a row of bean flash sales
Why corn exports are slower than last year. It’s more of a timing factor rather than lost demand
We issued corn & soybean buy alert
What this buy alert could mean for you
Defining your risk when re-owning
Why we’d want to find life down here
Today’s lows can define some risk
Wheat pressured with Russia peace headlines
Last time Spain bought we bottomed. They must think this is a value buy
I think carryout is lower at end of the day
Call options through Jan USDA are cheap
If you are getting forced to do something
Chart breakdowns below audio*
Listen to today’s audio below
Want to talk?
Office: (806)484-1214
Harvest Sale Ends Soon
Don’t miss our next sell alert
Get full access to our updates + alerts
CHART BREAKDOWNS
Dec Corn 🌽
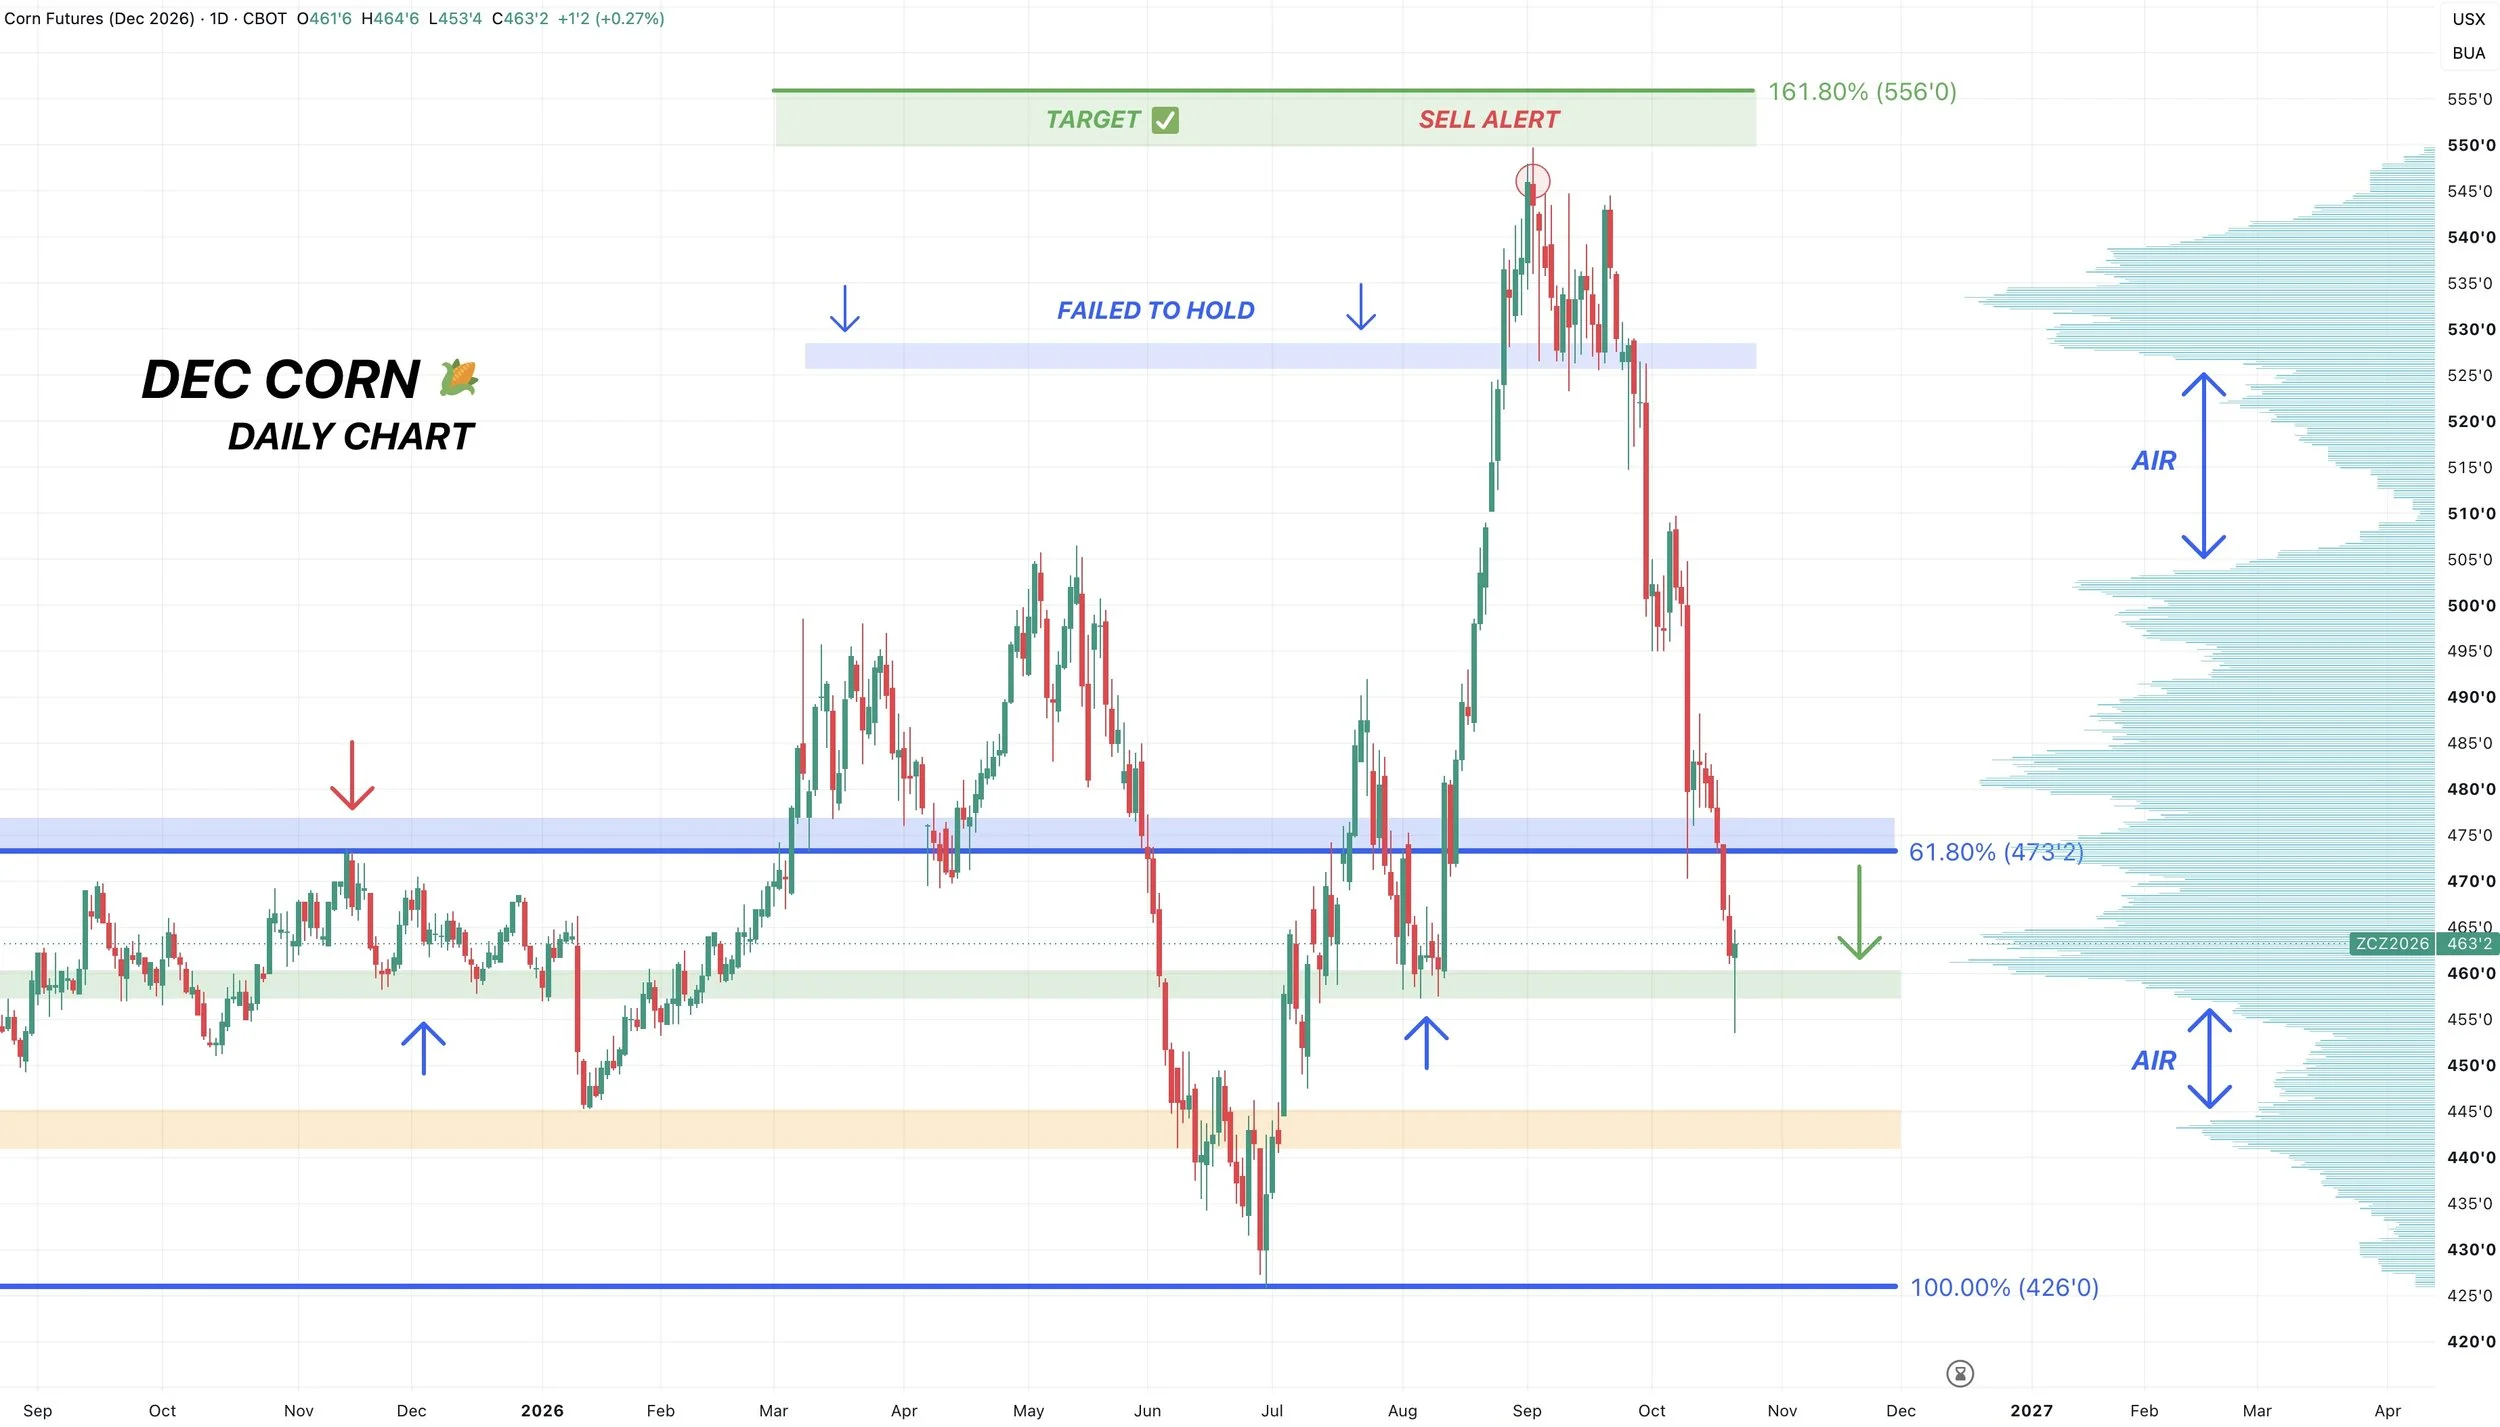
After breaching the key $4.73 support we came down towards the next level of support like we talked a few days ago.
It was a pretty nice reaction off this level today.
We broke below the August lows and were trading down nearly double digits but reversed and closed higher.
We have a massive shelf of volume sitting here which we would like to see act as support. Because below this level there is a large volume gap of air to the downside that we need to be mindful of.
However for now, this is viewed as support.
This is the bottom of the old range we were trapped in last year.
We’d like to see today’s reversal get some follow through. But can’t hate the action at support today as it provides some optimism.
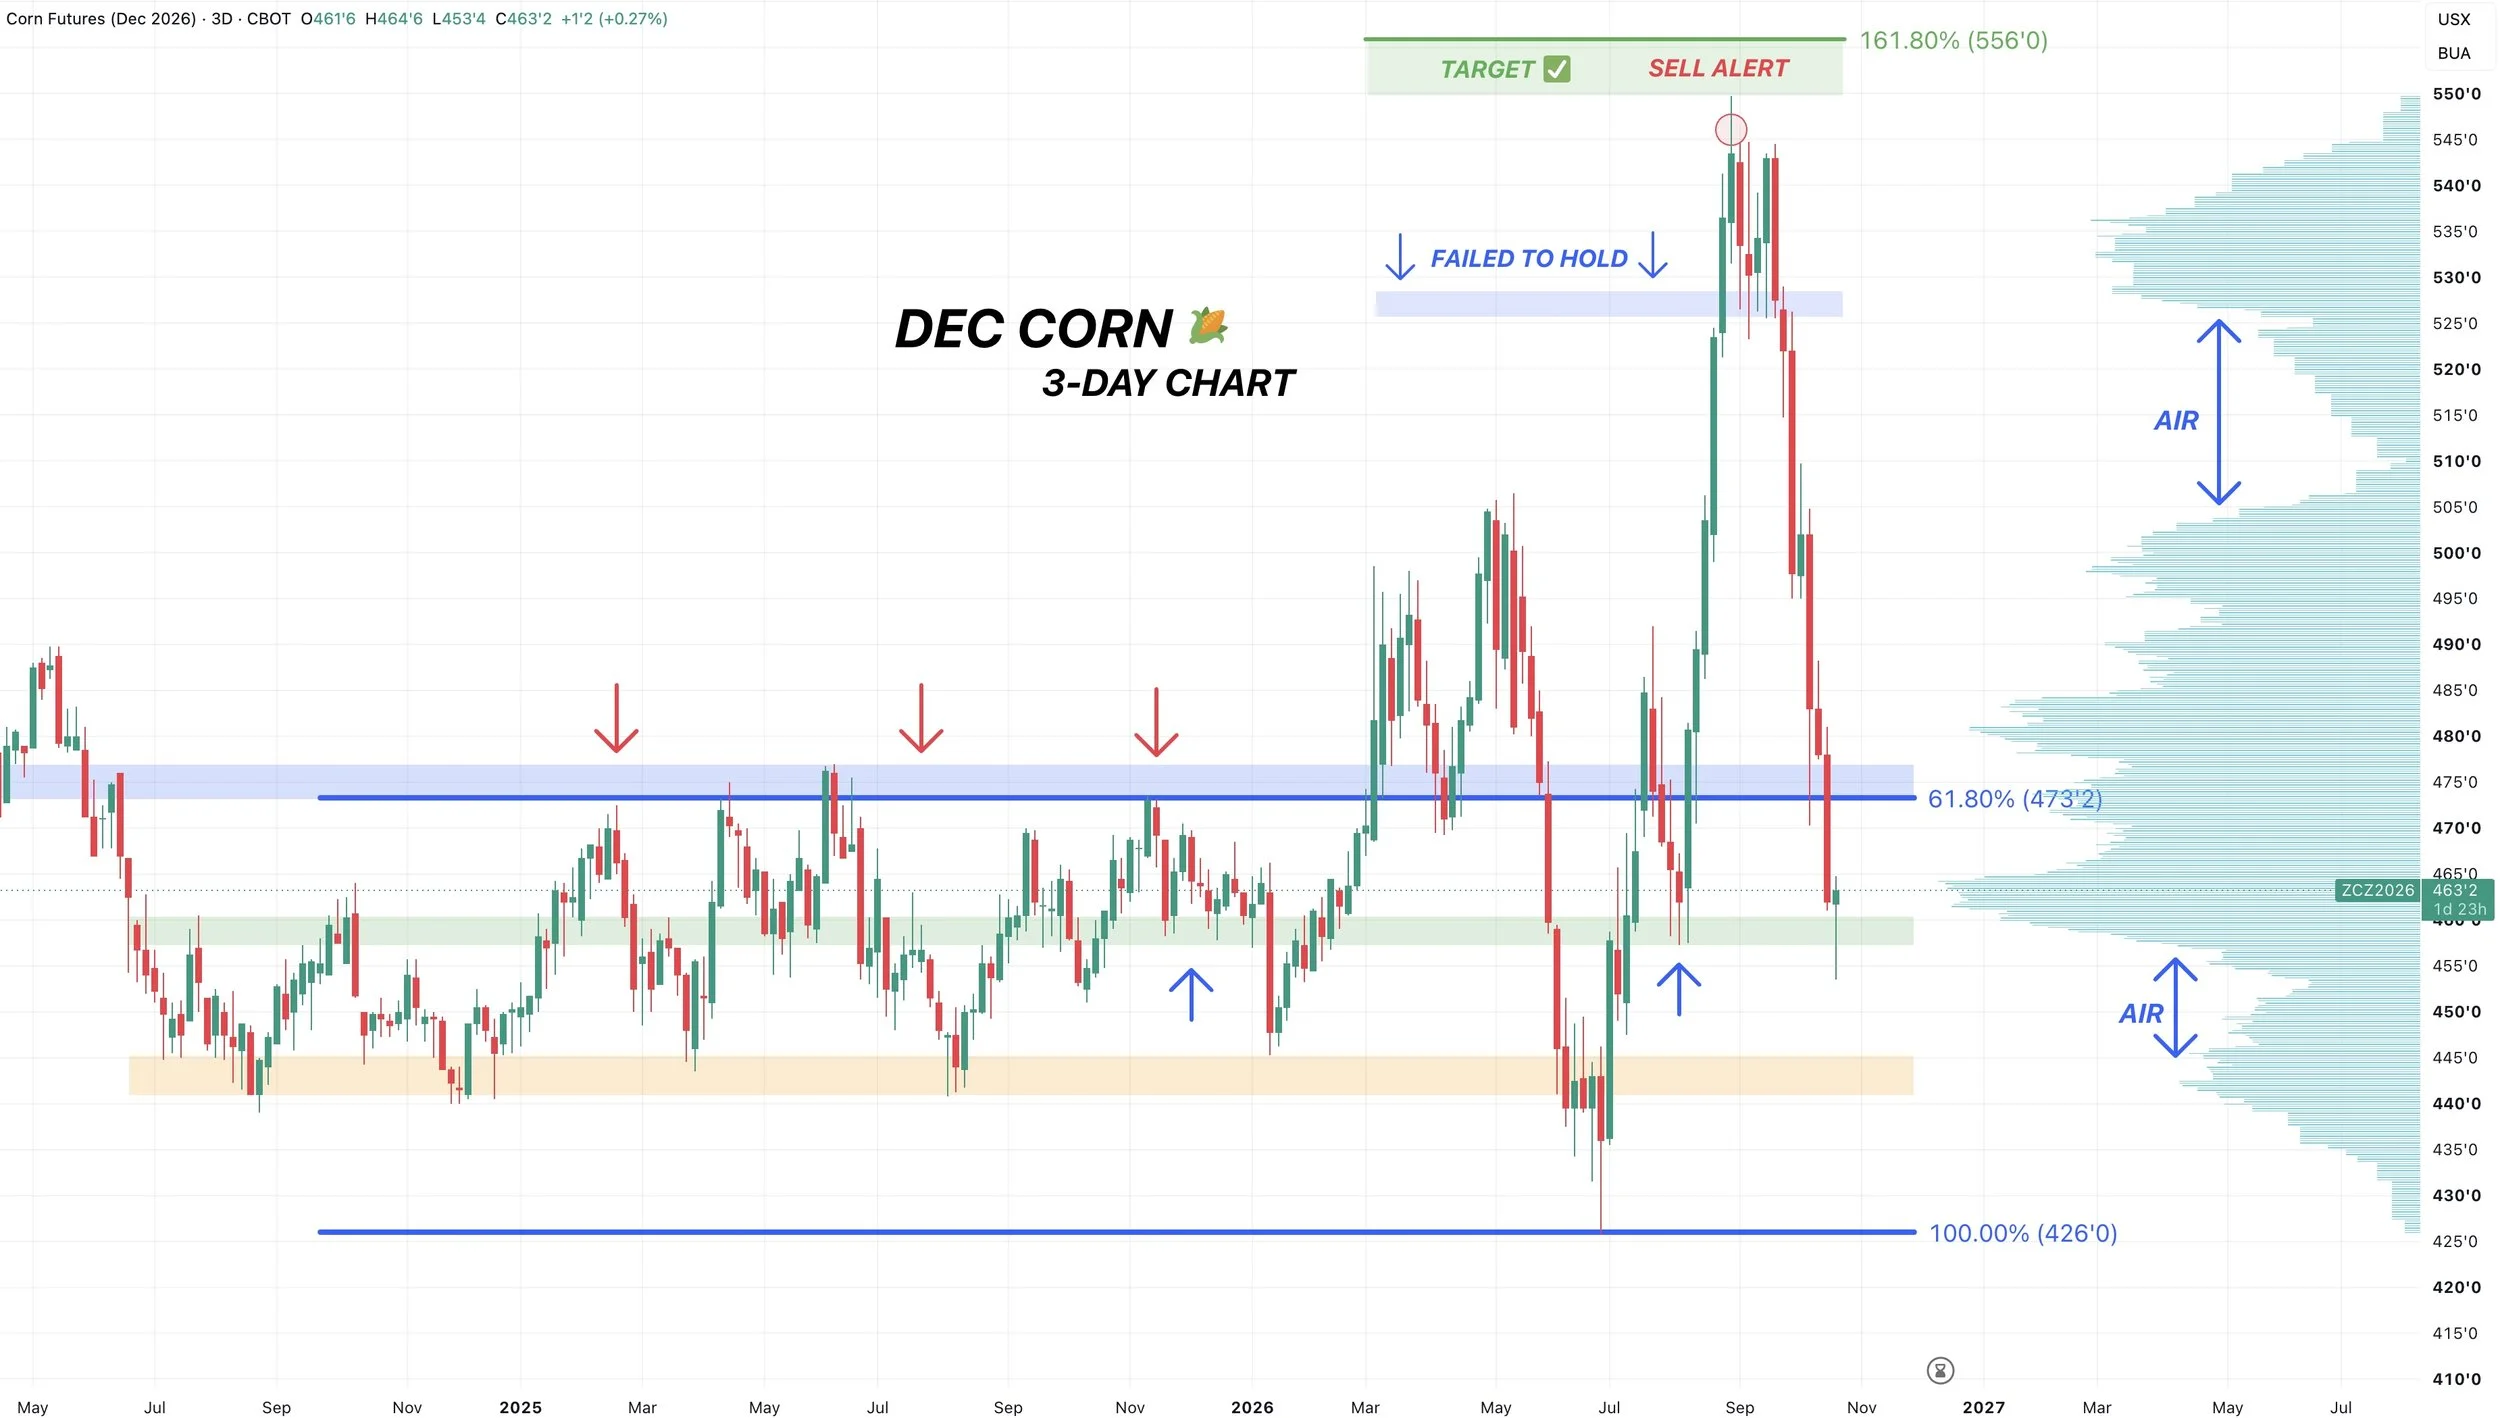
Here is a more simplified look on the 3-day chart.
This chart clearly shows the levels.
We broke below the blue box and the top end of that old range from last year.
As a result we came down to test the bottom of that range.
Once again, we have this huge shelf of volume that we want to see add support. As failure to hold here would result in us dropping towards the orange box. So that’s your risk.
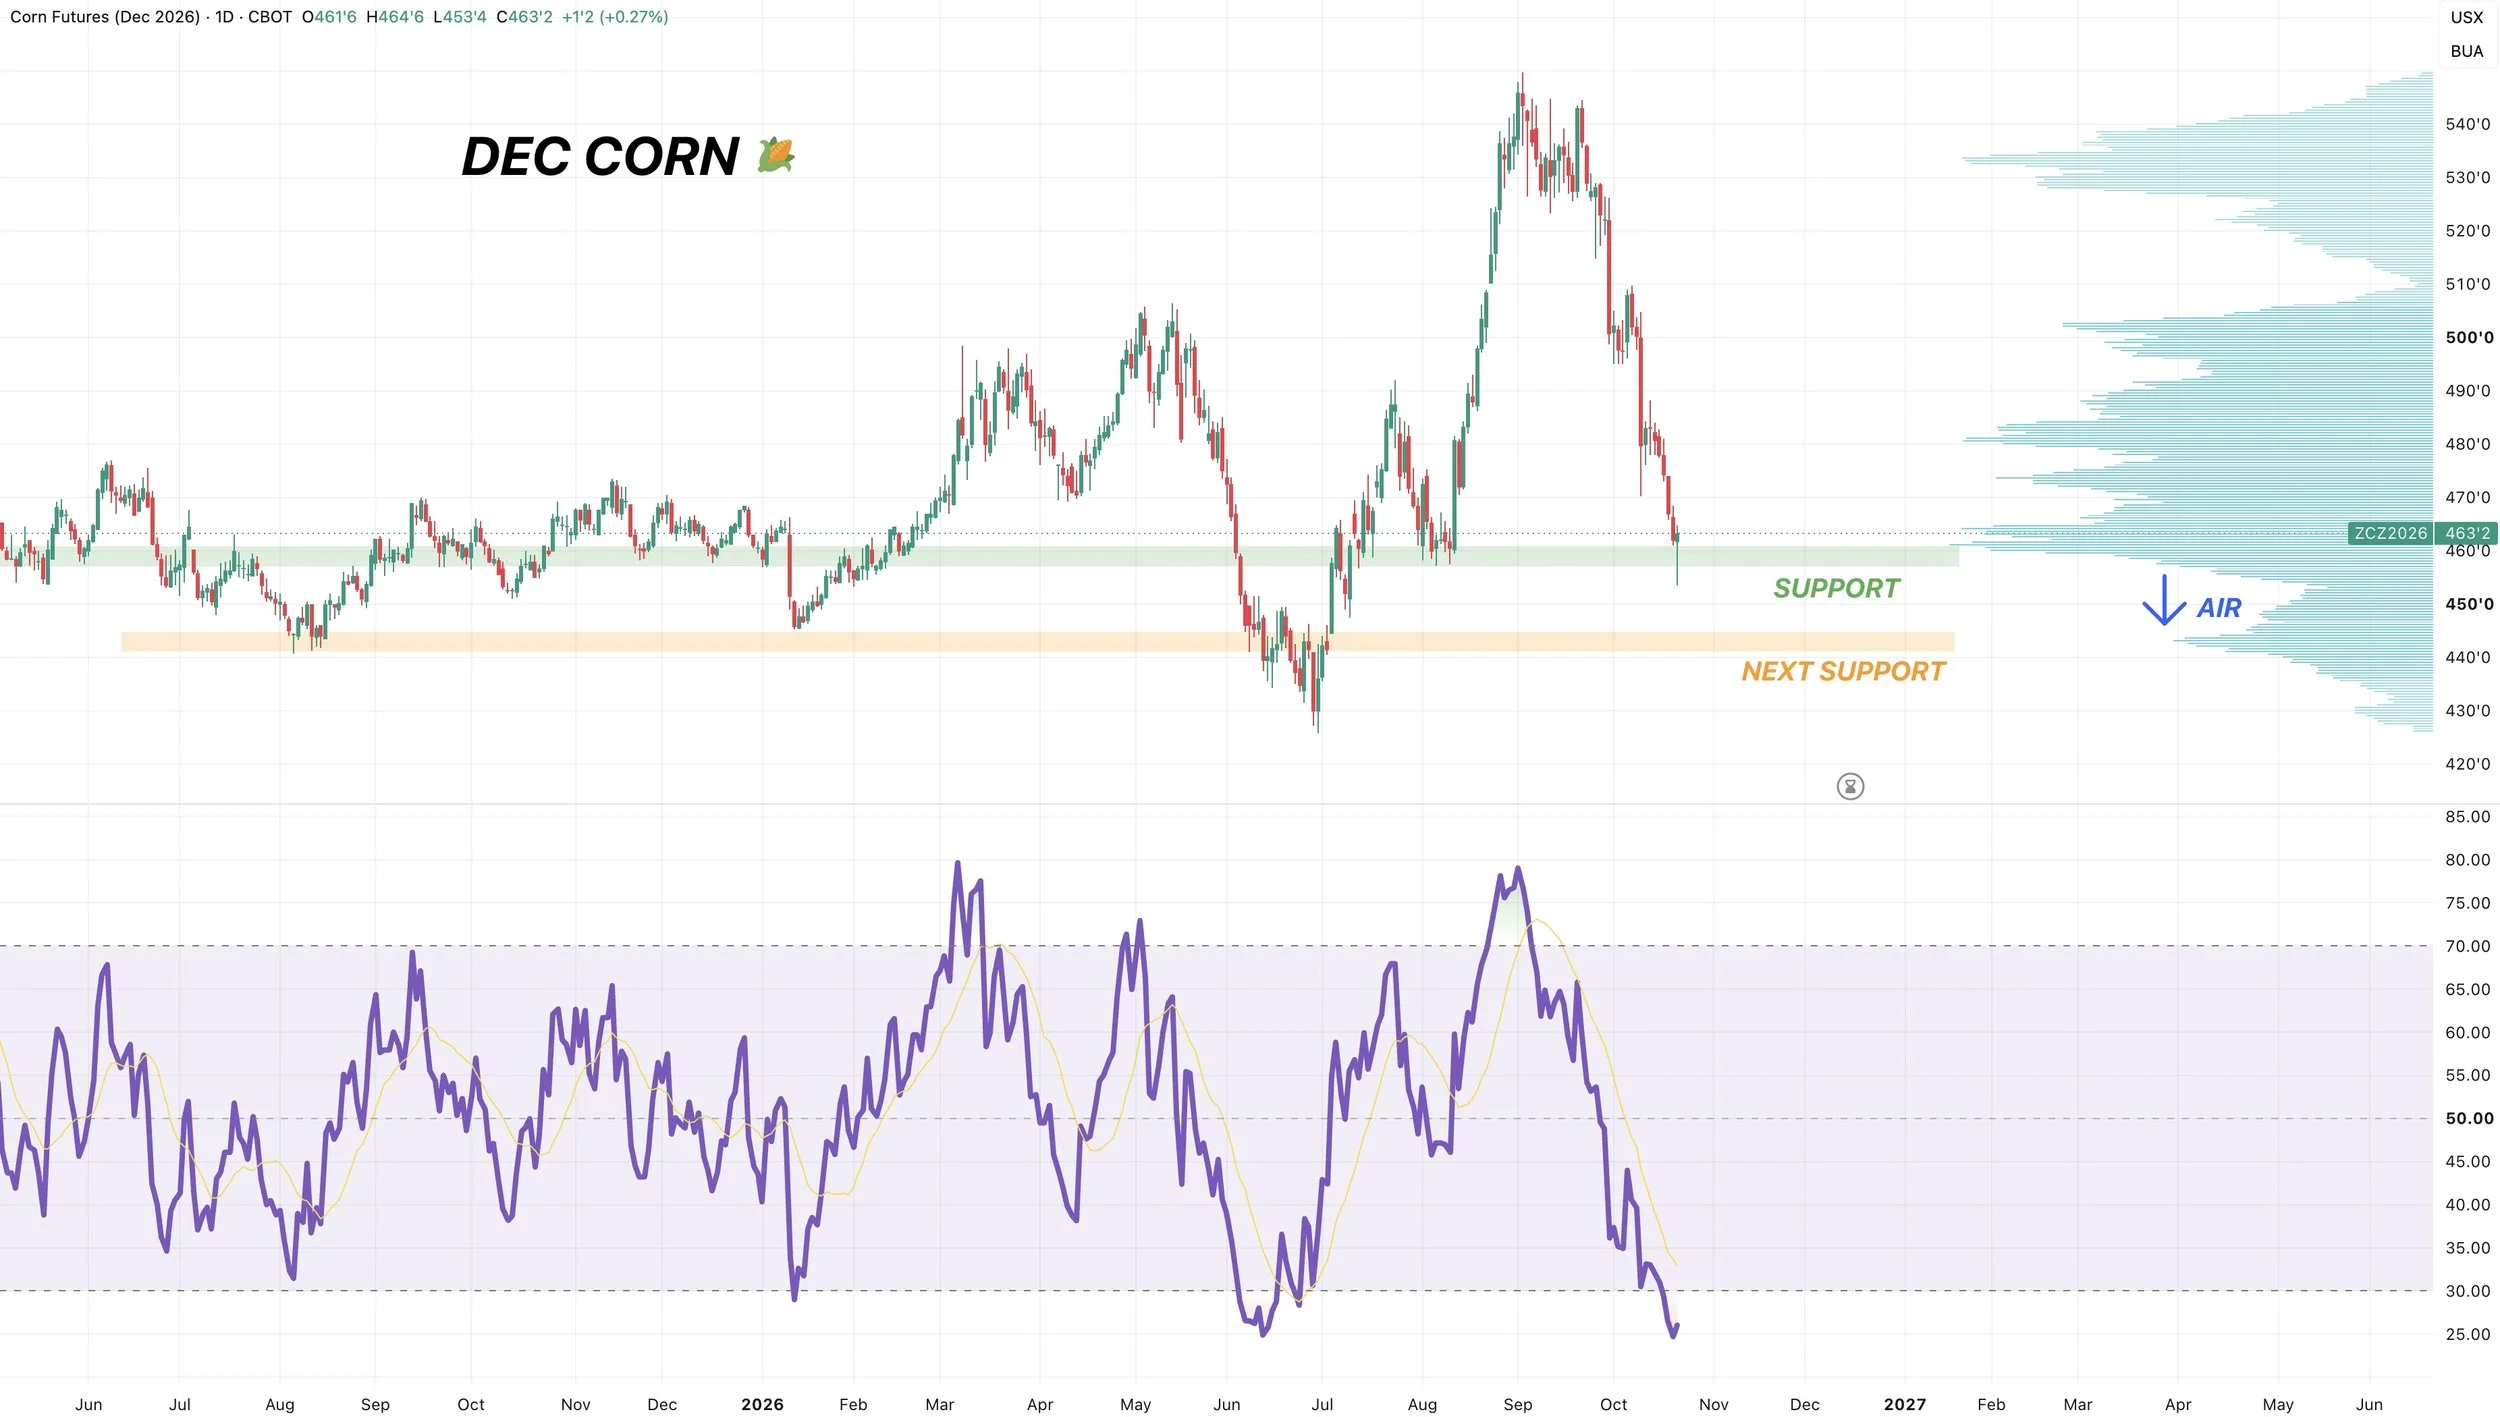
One other thing that’s positive is the RSI.
It is very oversold.
Dec corn is the most oversold it has ever been for this contract.
More oversold than the June lows.
Doesn’t mean you “have” to bottom here, but being this oversold at support adds more confidence.
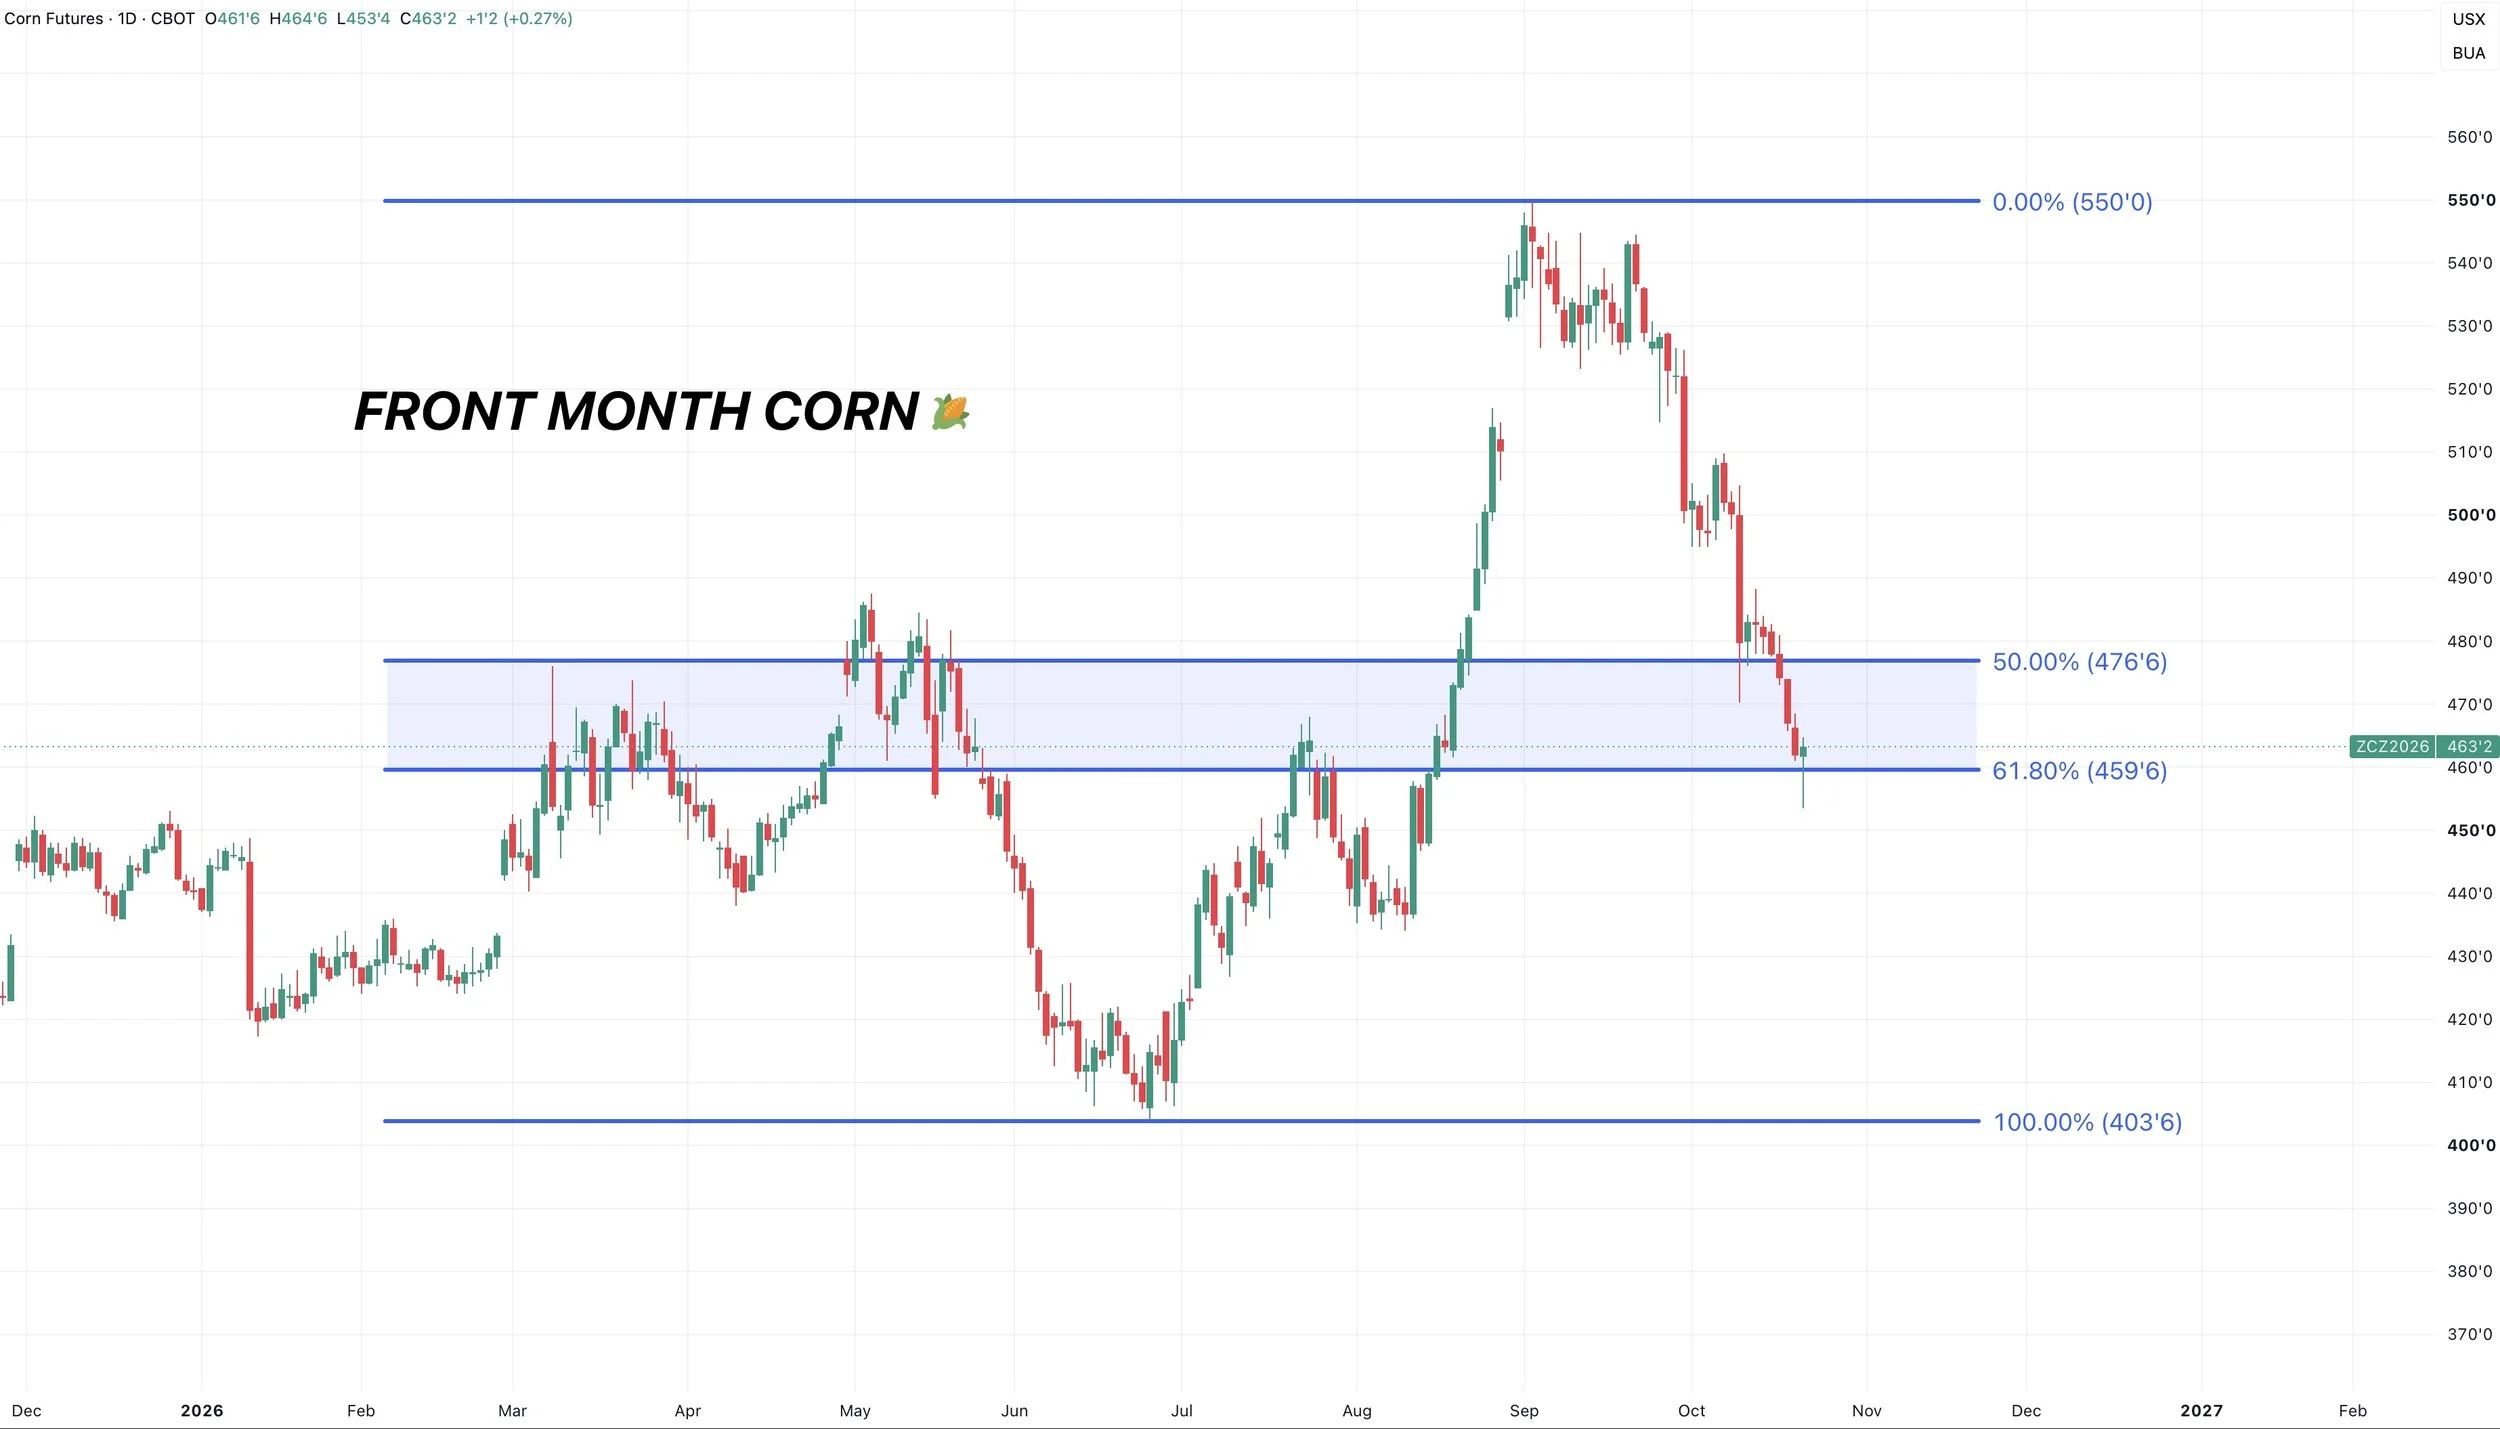
One last reason this area could offer support is the front month chart.
We’ve given back 61.8% of the yearly highs down to the yearly lows.
This same area is re-testing the top end of the yearly range.
Nov Beans 🌱
Solid close in soybeans today as well.
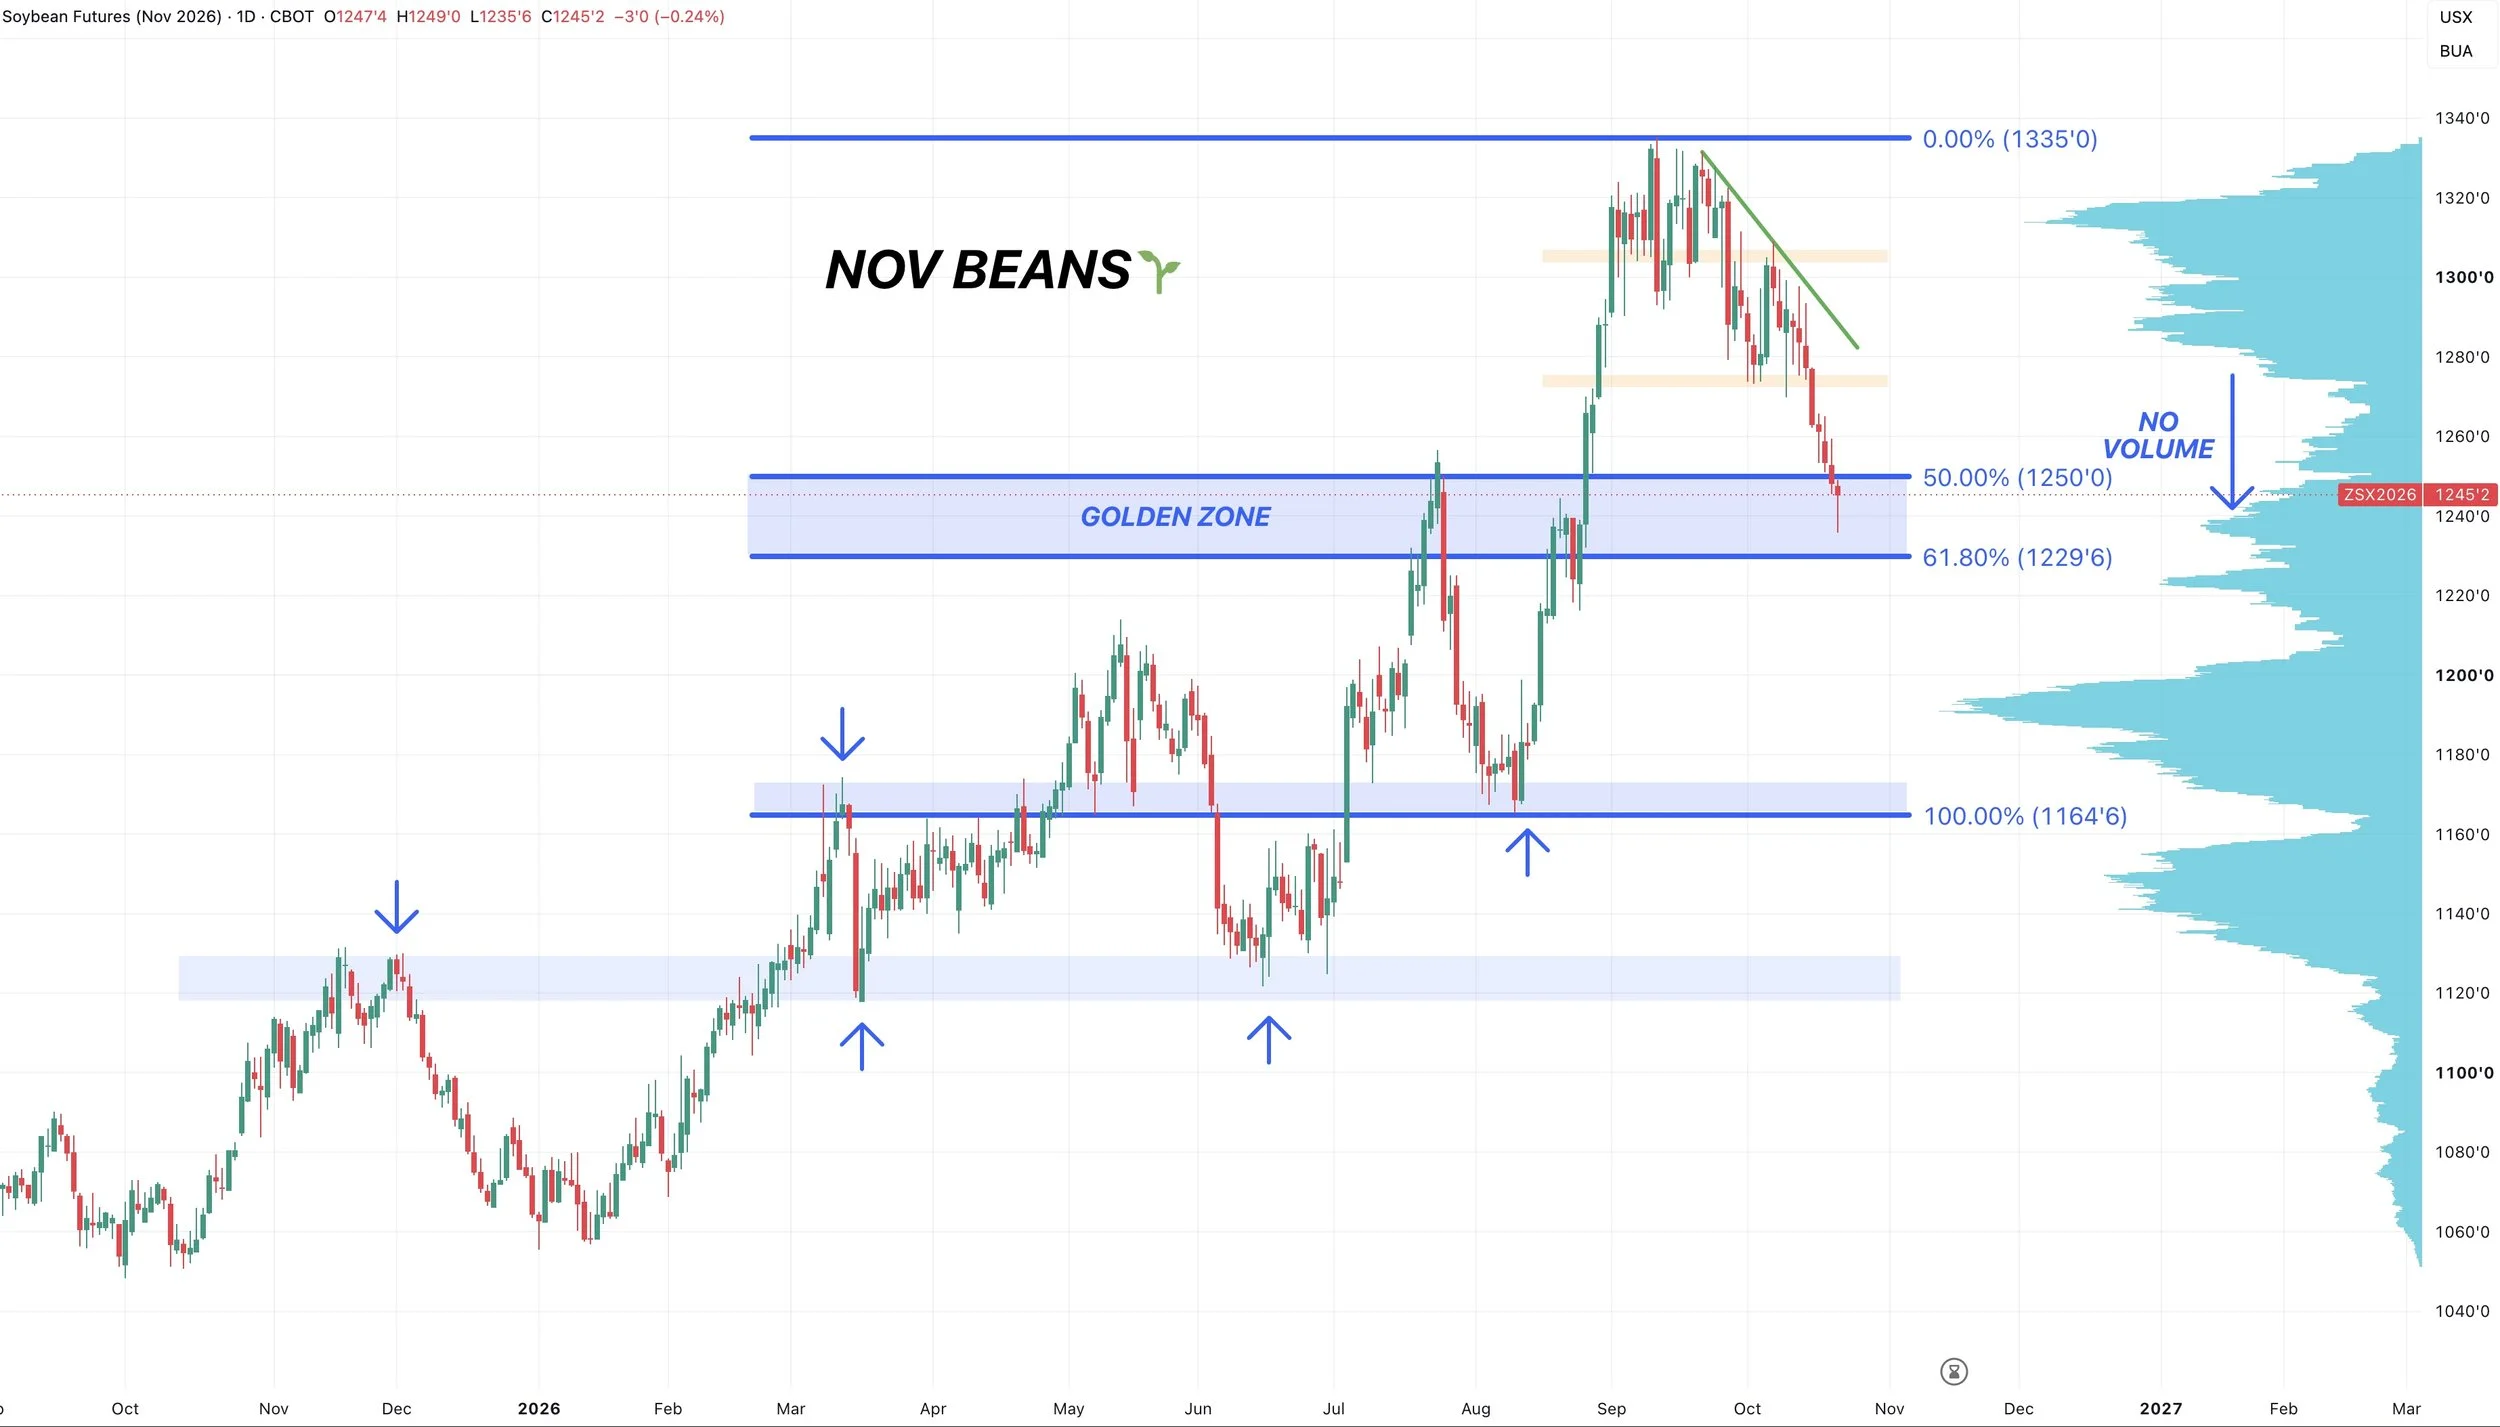
Sitting smack dab inside that golden zone we’ve been talking about for weeks as being the potential downside target for beans.
We’ve given back 50-61.8% of the August rally. A very common spot for corrections to end.
We had that huge volume gap to the downside a few weeks ago. We have now sliced through it and are back at the next area of high volume.
We are also re-testing the highs from July.
Soybeans tend to turn old highs into new lows pretty often.
The August lows came at the March highs. The March and June lows came at the November highs.
So finding a bottom in this zone would make sense, however we ideally want to hold this zone or it offers further potential downside.
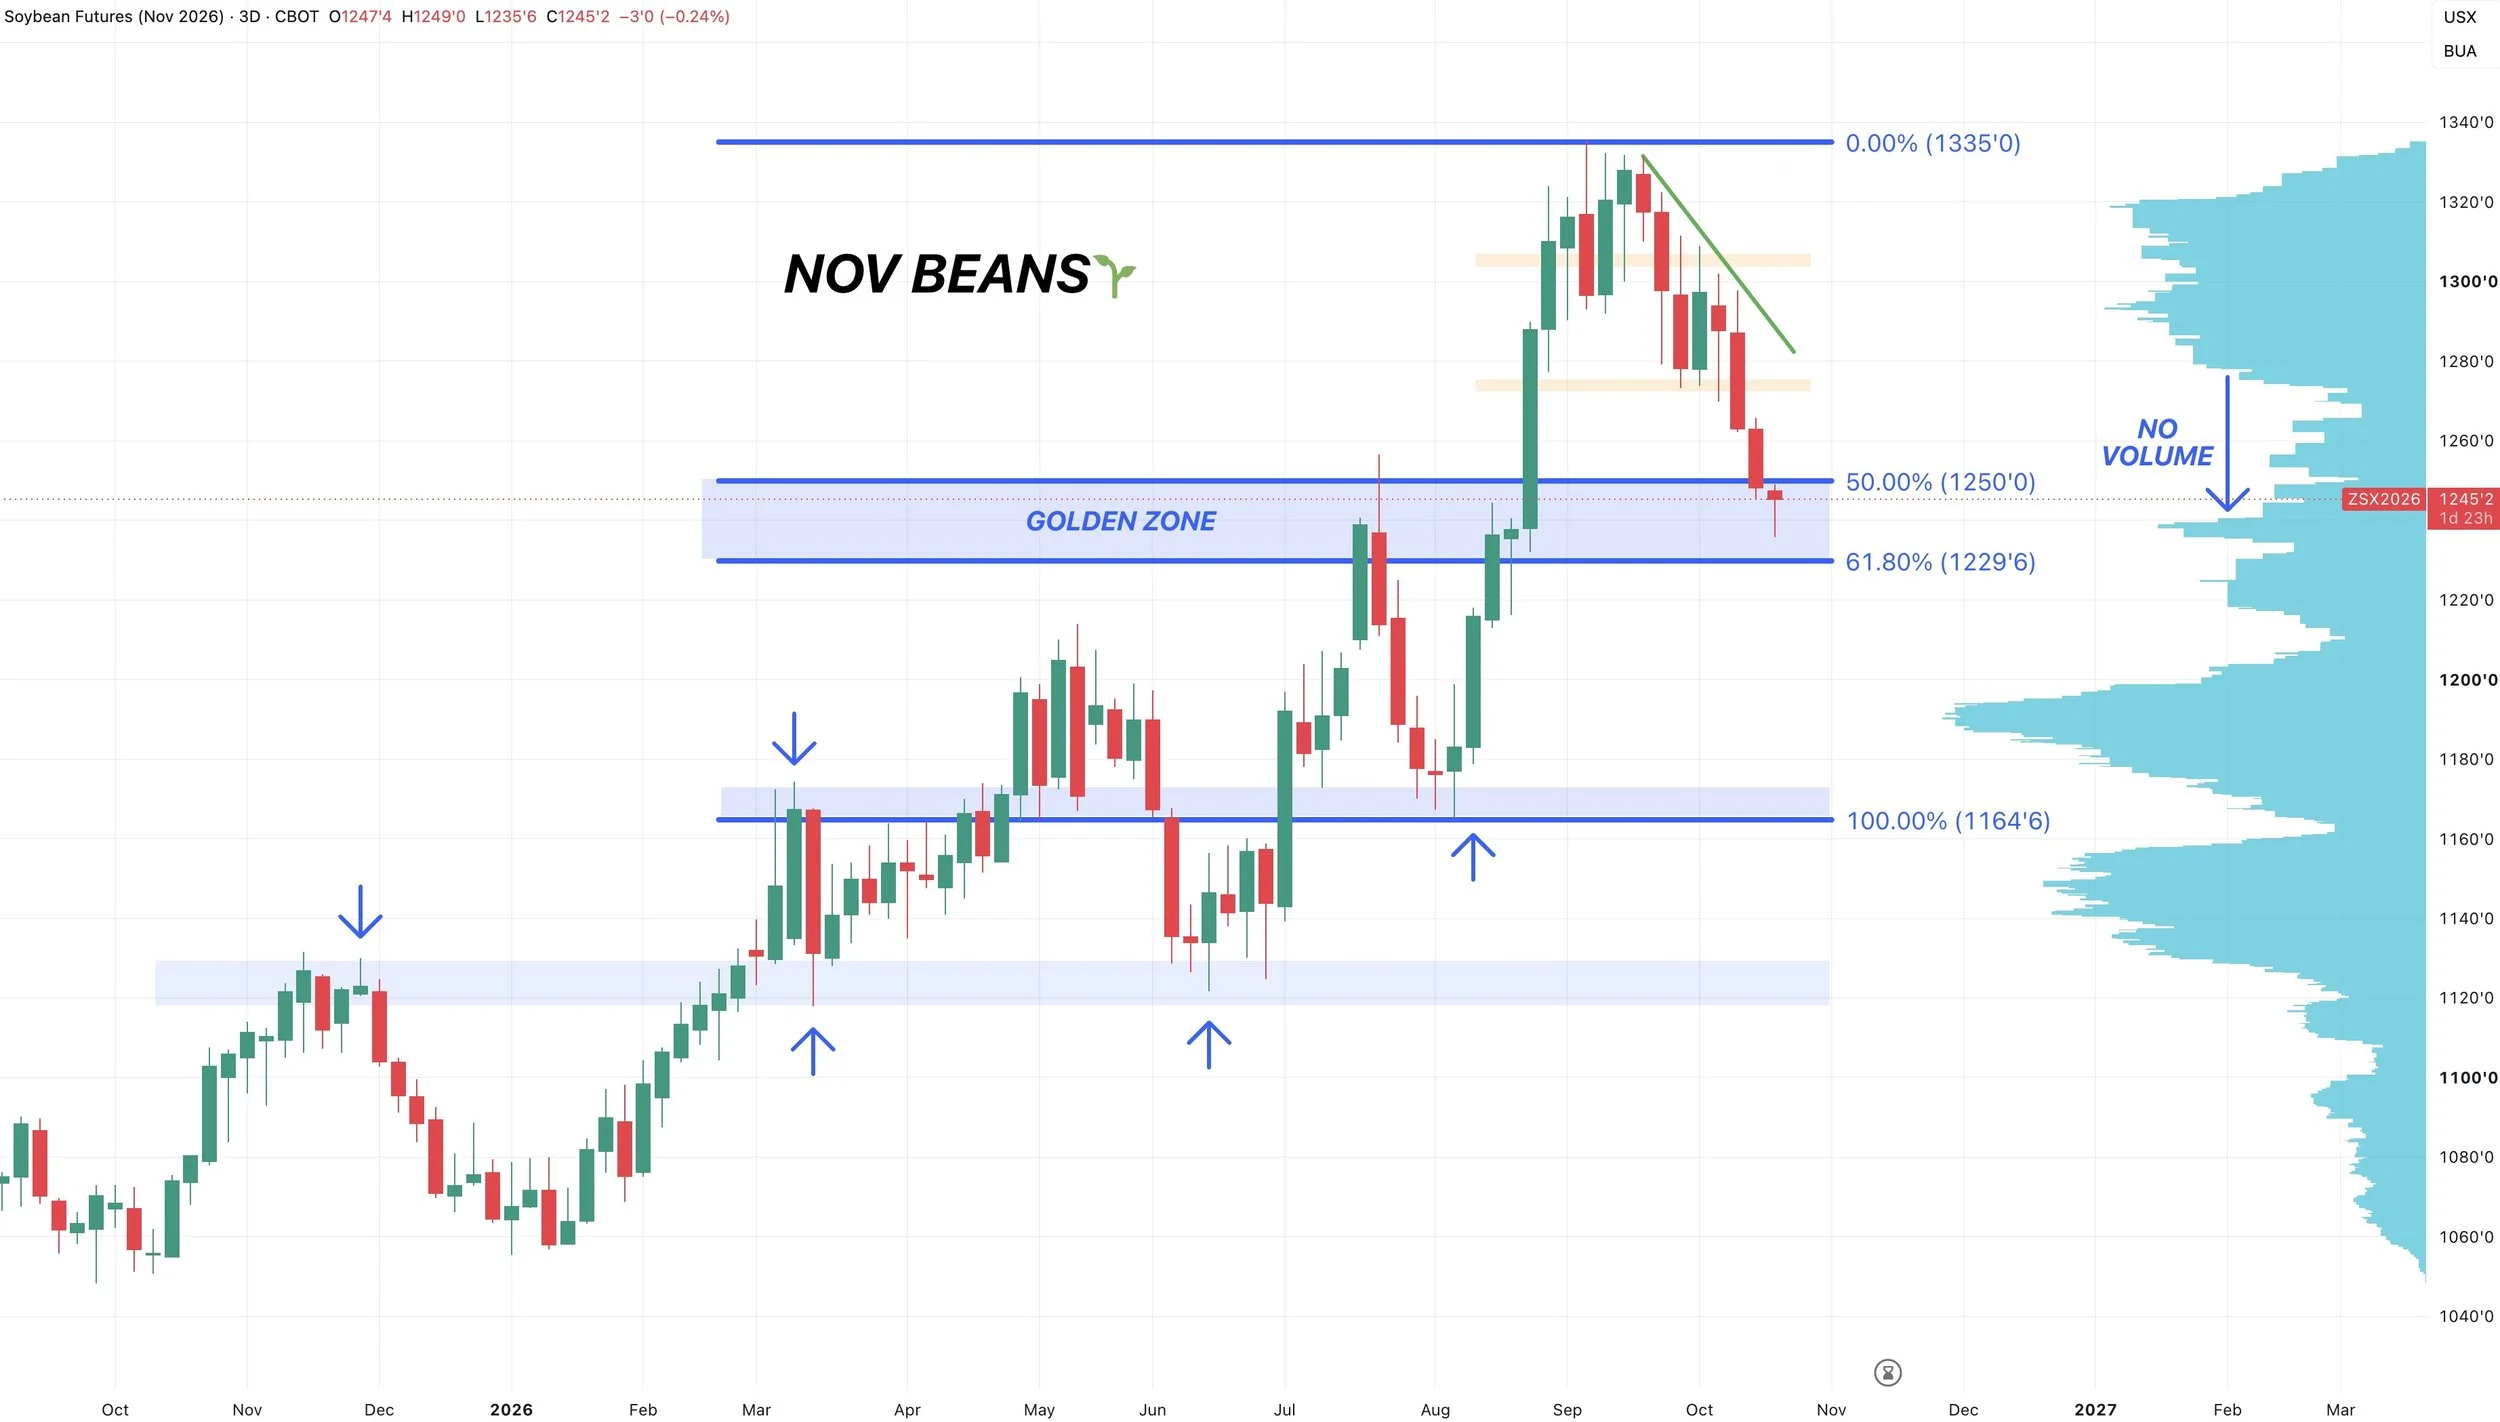
Here is the 3-day chart for another perspective.
Again sitting right in the golden zone.
Re-testing the prior highs like we’ve seen in the past.
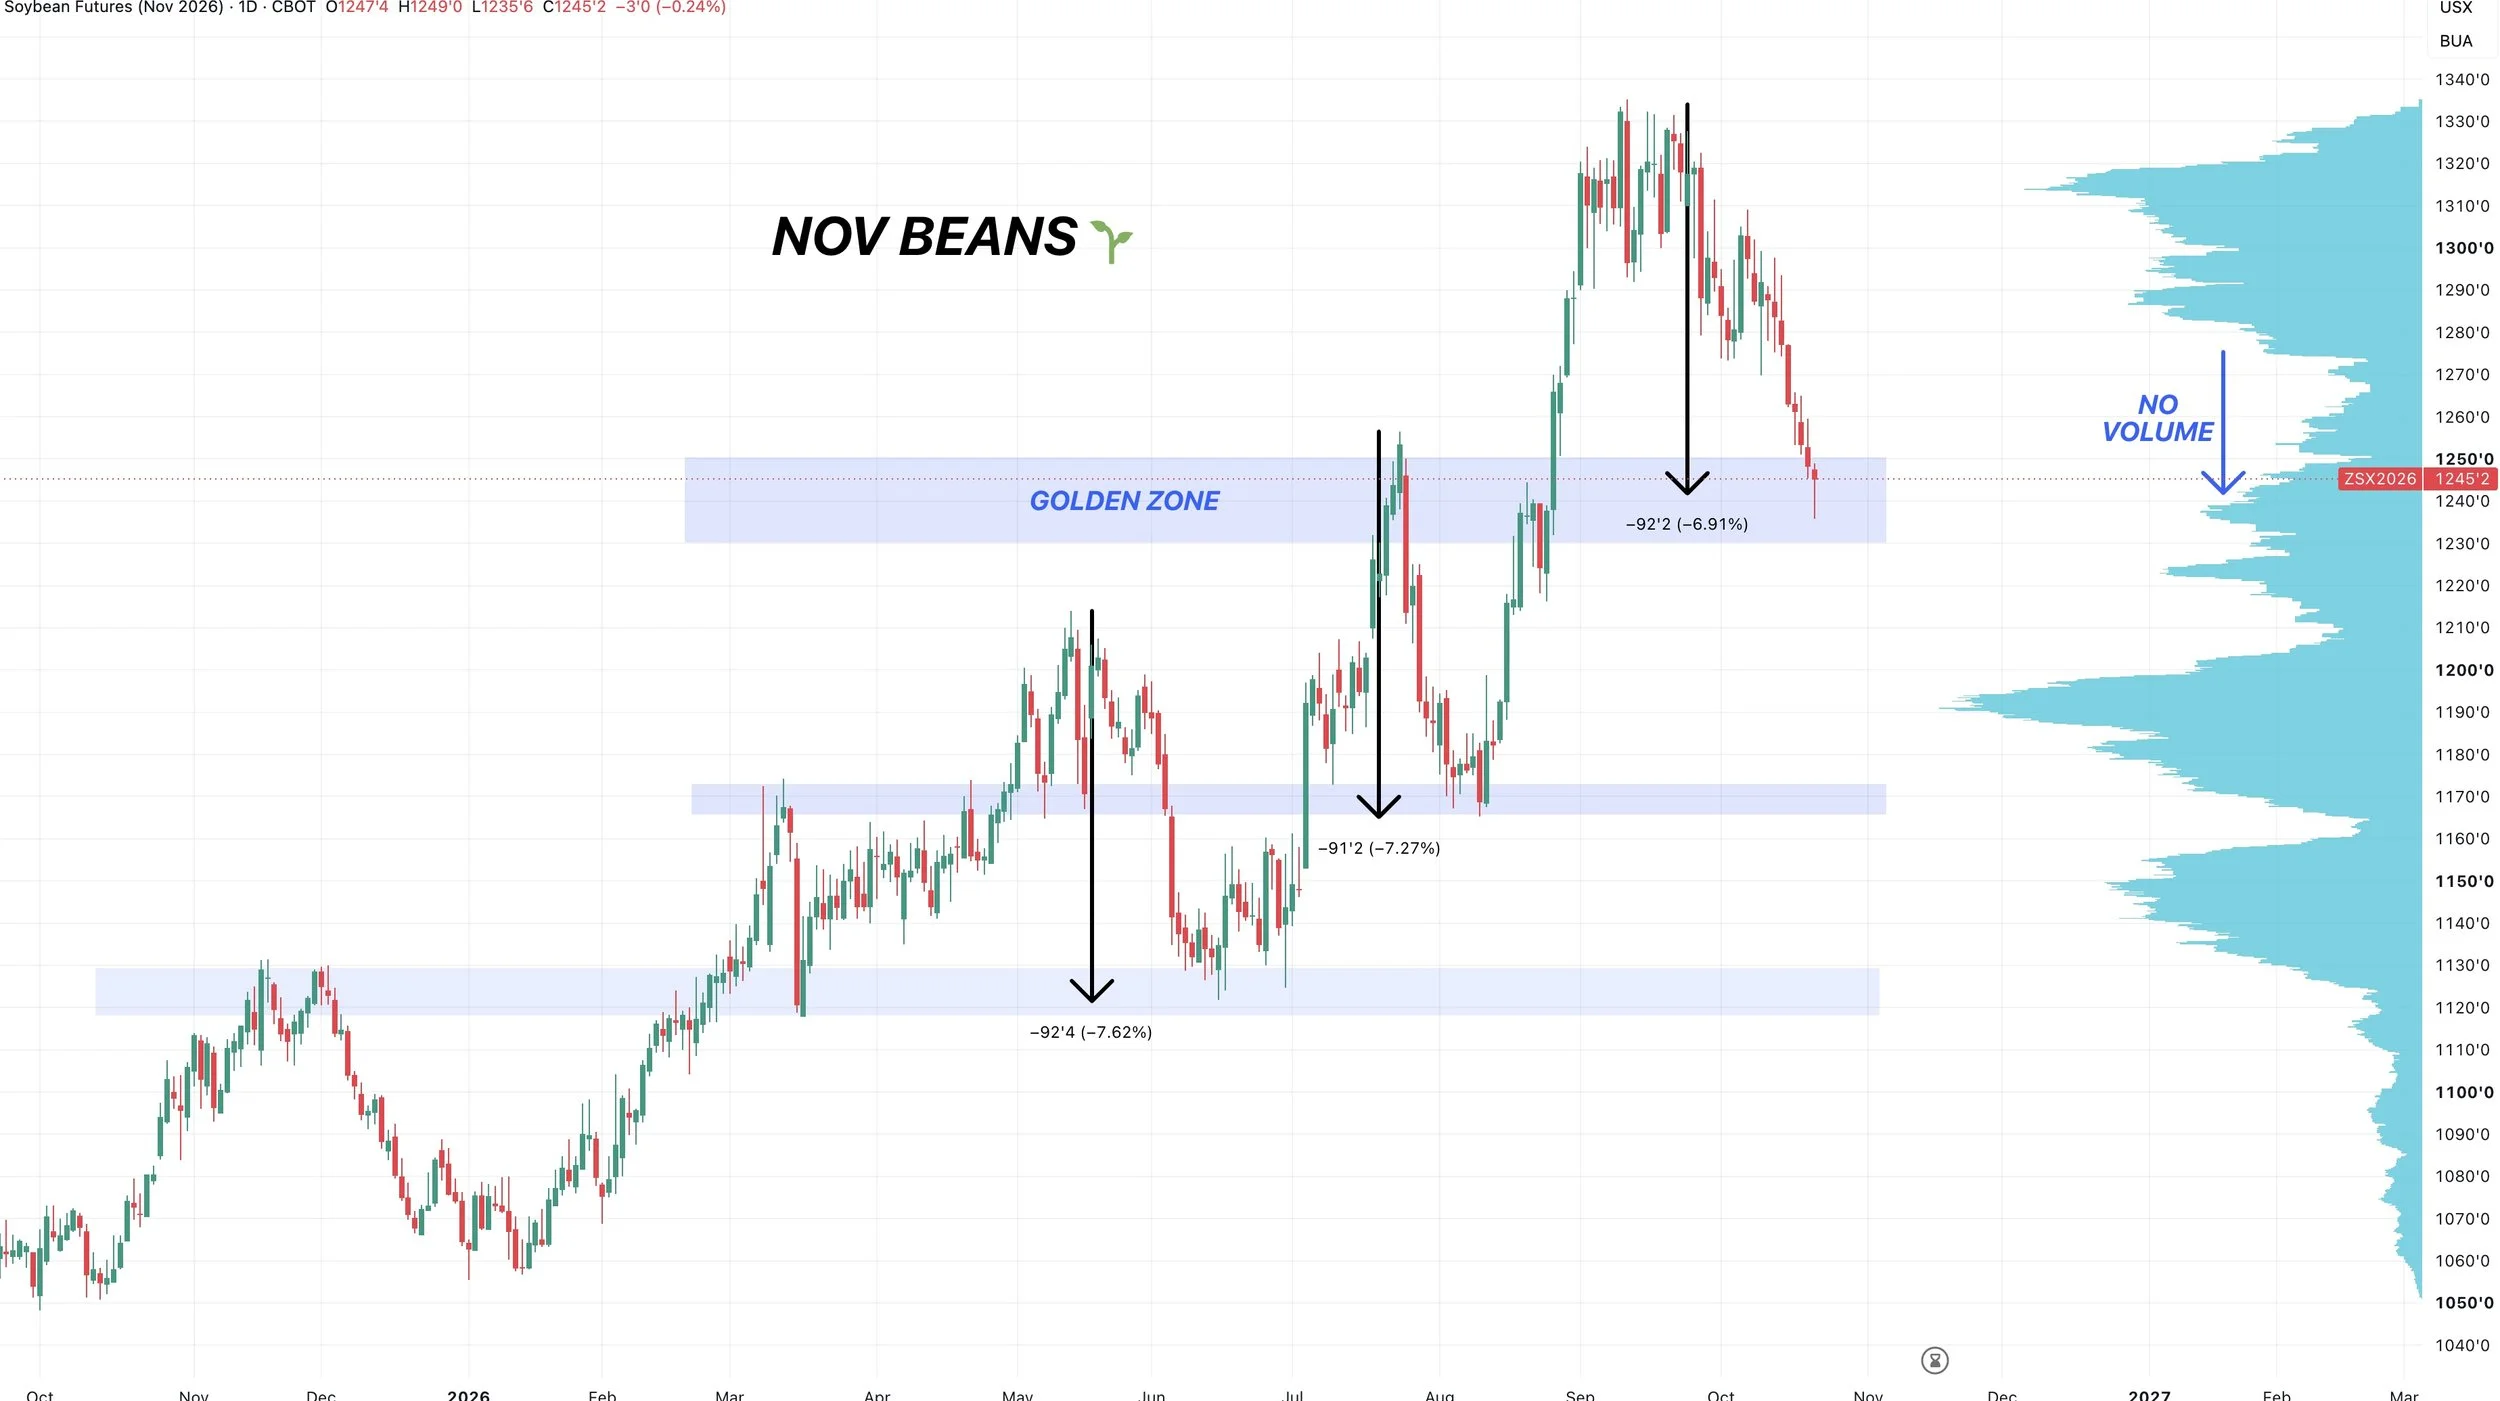
One last thing to note on soybeans is that the past two sell offs were -92 cents.
Currently we are -92 cents off the highs. Which is interesting.
Dec KC Wheat 🌾
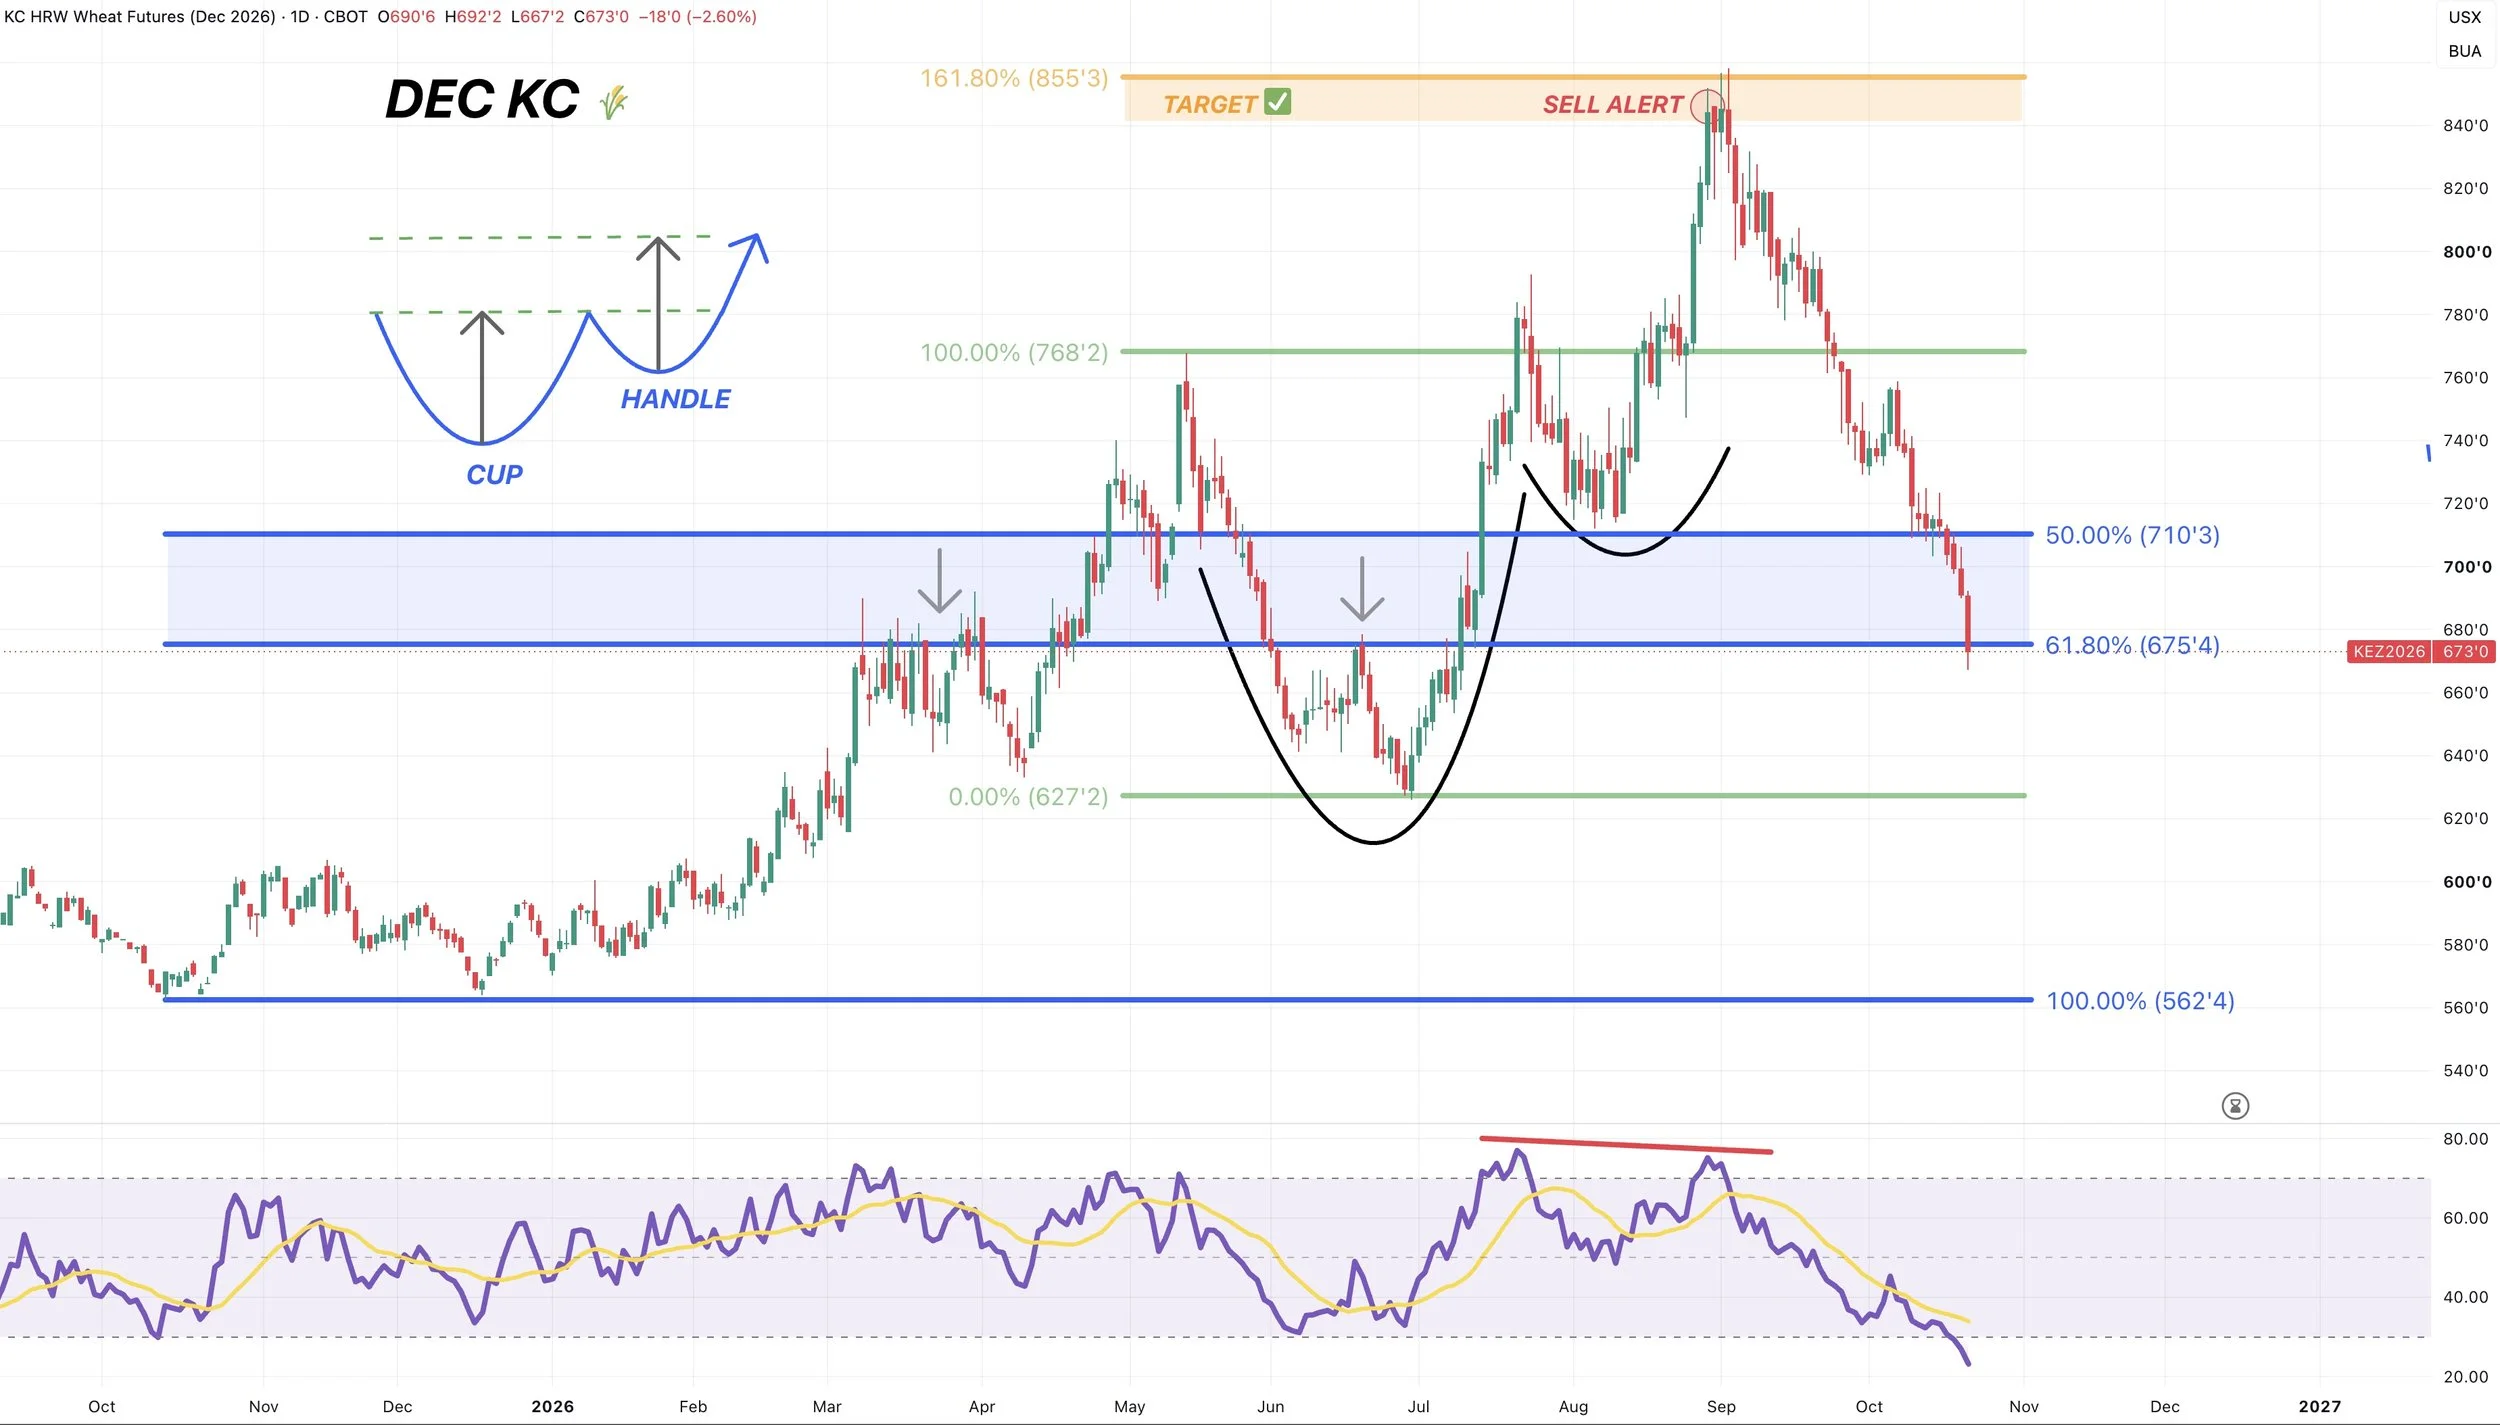
KC obviously does not look great at all as this is a waterfall to the downside.
However, KC is desperately trying to cling on to it’s last support.
The 61.8% level from contract highs down to contract lows.
This same area has provided resistance in the past, bulls want to see it now provide support.
KC wheat is also the most oversold it has ever been on this contract. So you’d like to think we get some sort of relief soon.
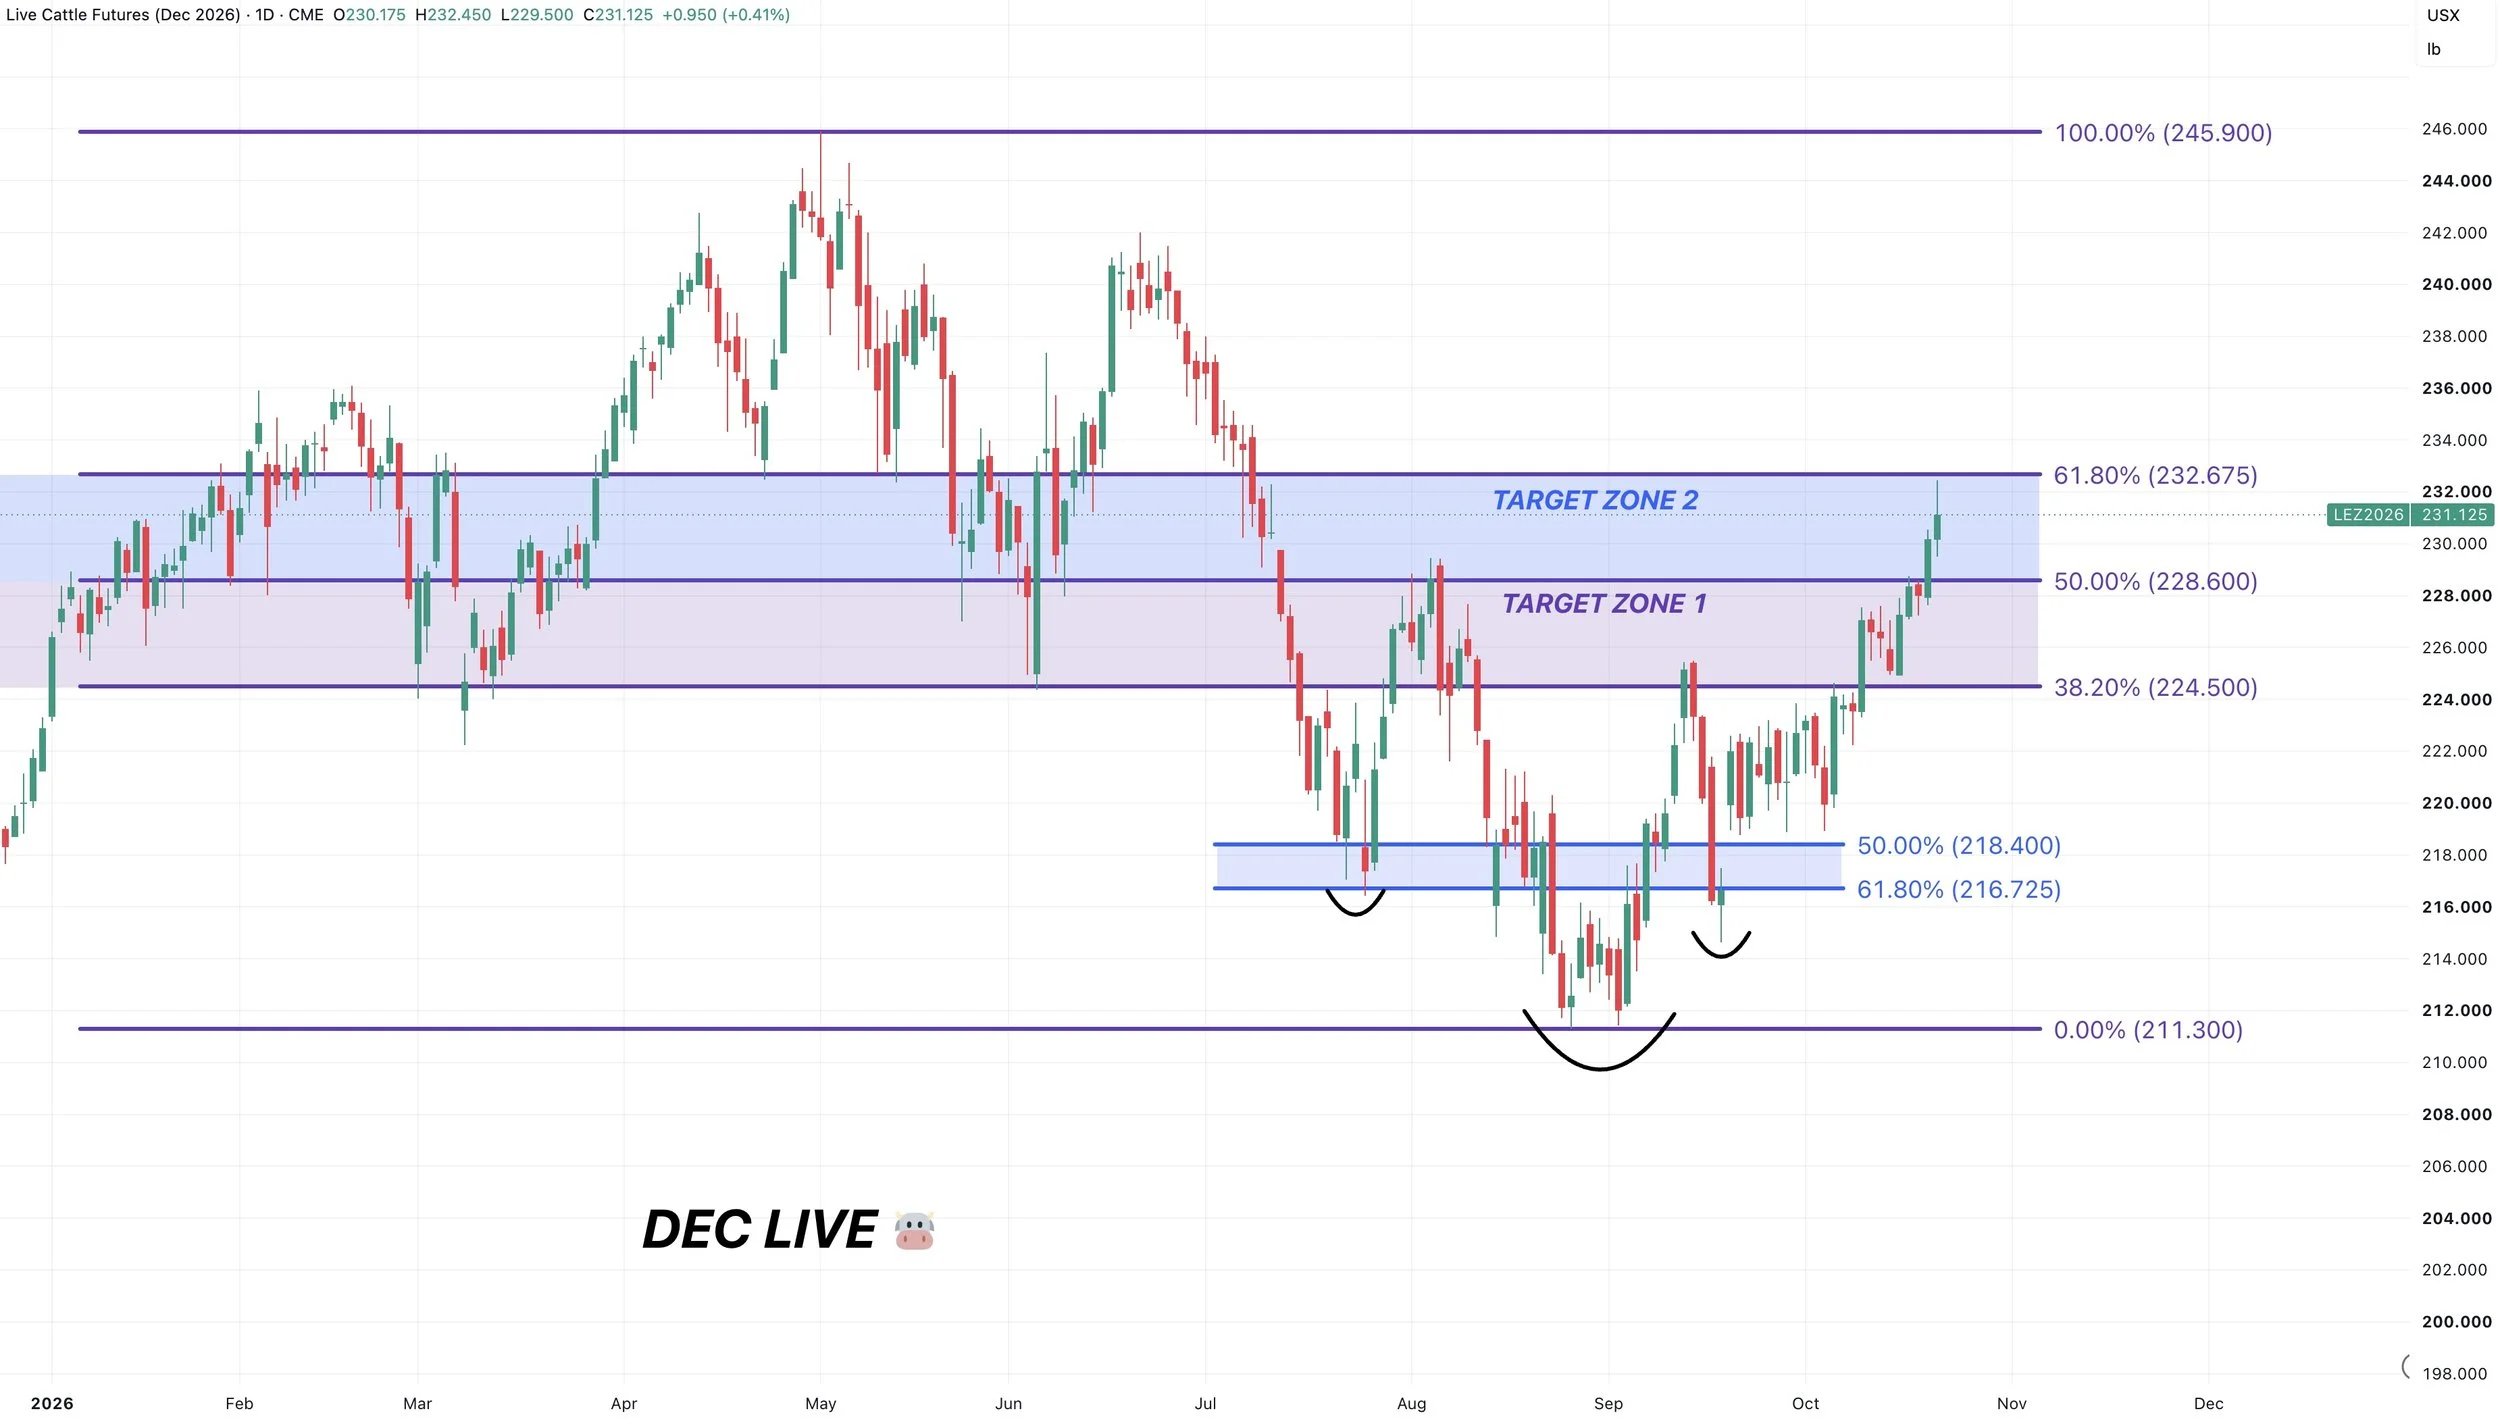
Dec Live 🐮
We hit the 61.8% retracement of the entire sell off today.
The most common retracement. So we do still like managing some risk up at these levels.
We did also leave a questionable candle today.
If you are able to bust above this level it could offer further upside, but for now viewed as possible resistance and an area to de-risk.
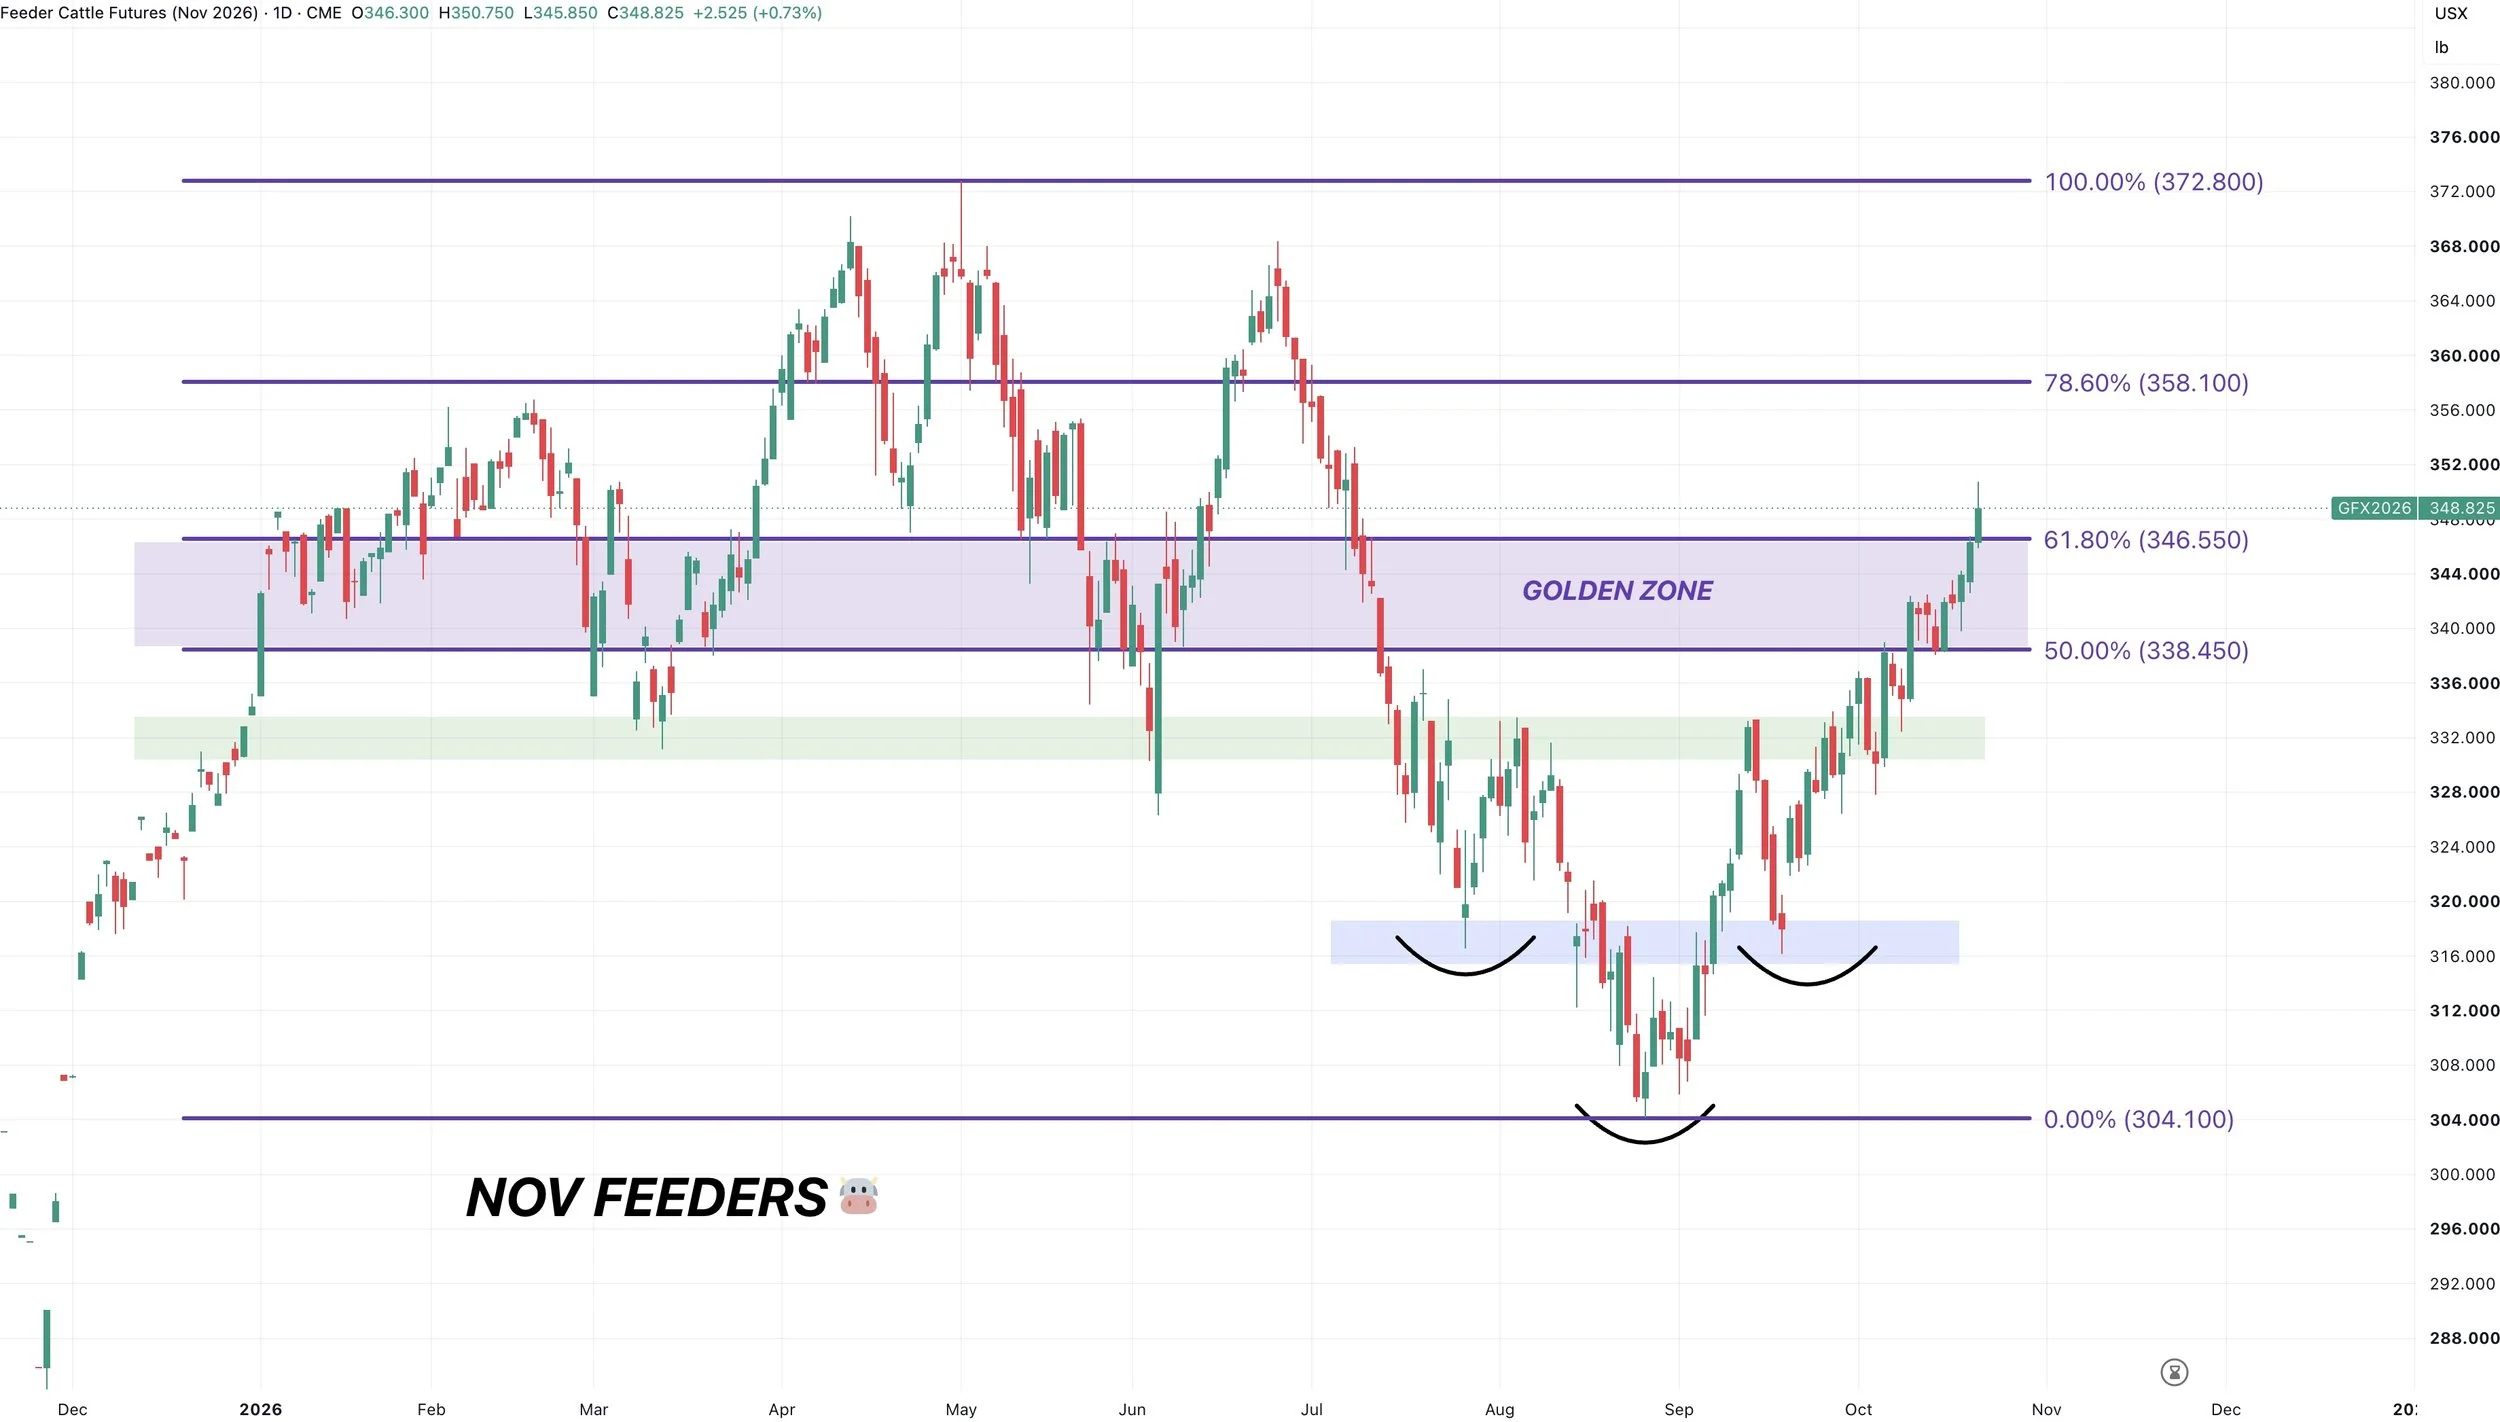
Nov Feeders 🐮
Feeders actually broke above that target box slightly.
However I still view this as a good area to manage some risk.
I have one more chart to show if you scroll.
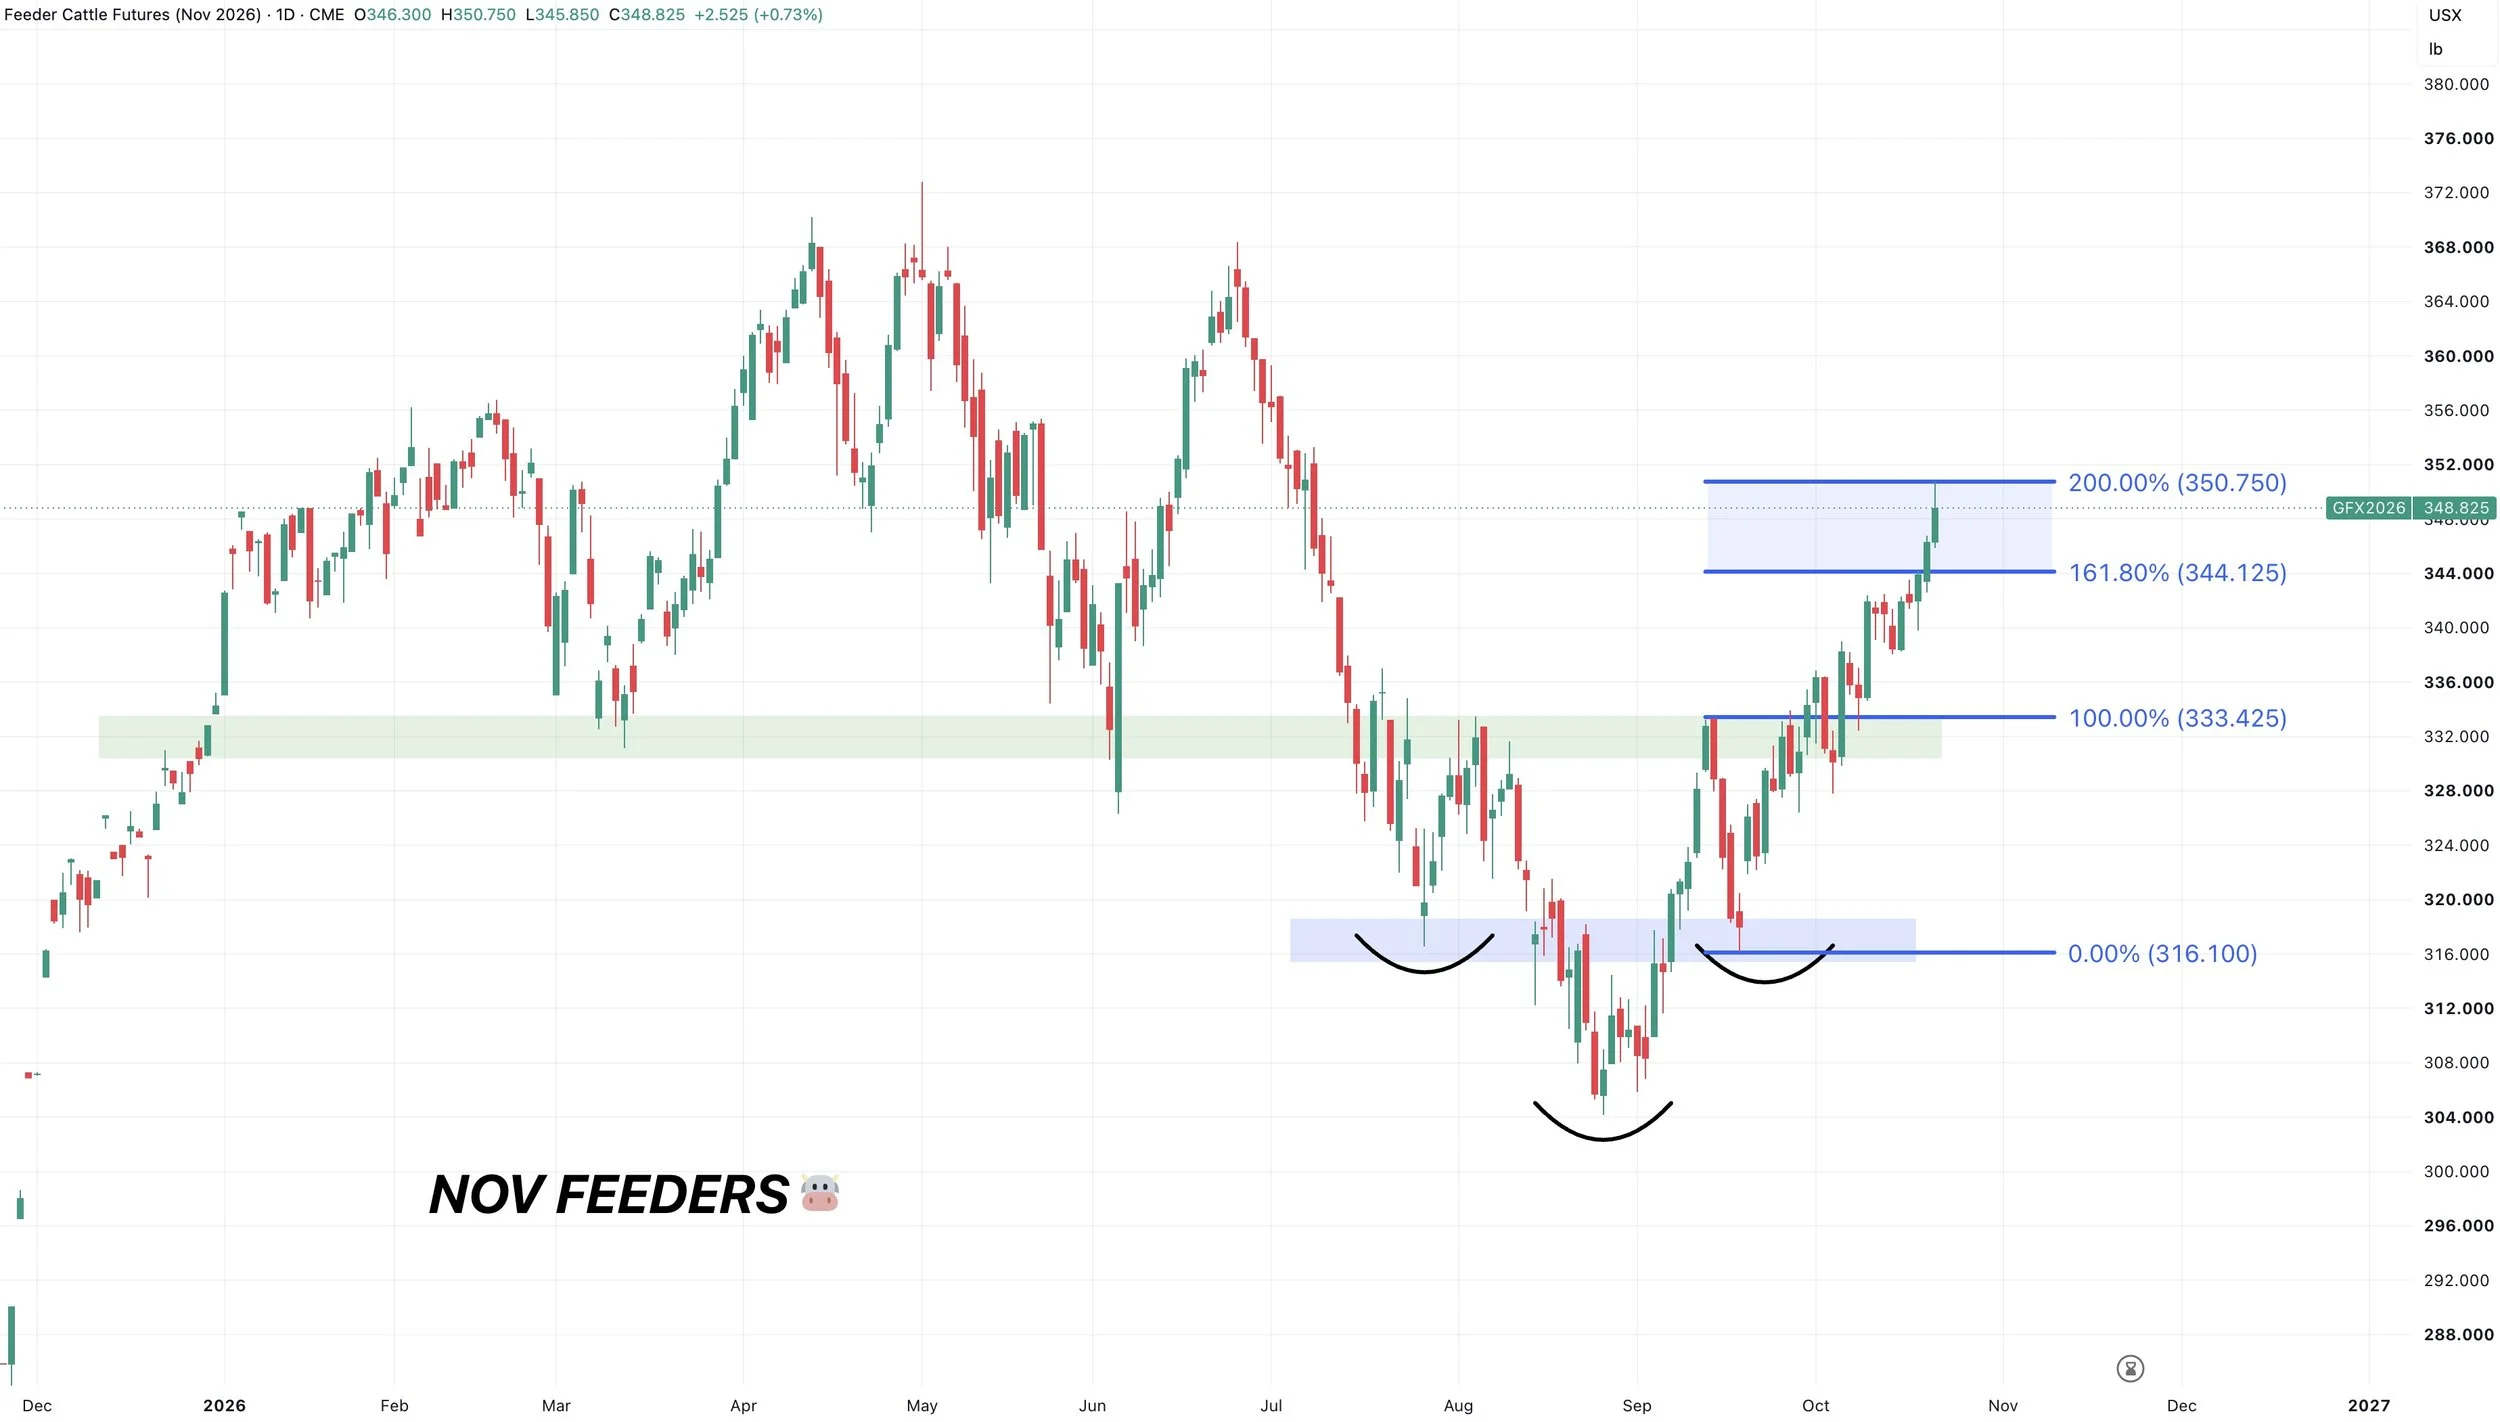
Feeders also hit the 200% fib extension from the first rally off the lows.
The more common level is the 161.8% level, but the 200% level is not uncommon either.
You could certainly blast above this as well.
But just another reason I think we should look to manage a little bit of risk.
Want to Talk?
Our phones are open 24/7 for you guys if you ever need anything or want to discuss your operation.
Jeremey & Office: (806)484-1214
Sebastian: (605)280-1186
Email: sfrost@dailymarketminute.com
Hedge Account
Interested in a hedge account? Use the link below to set up an account or give us a call.